Embed Size (px)
Citation preview
JOURNAL OF RESEARCH of the National Bureau of Standards—A. Physics and ChemistryVol. 66A, No. 1, January-February 1962
Melting Process and the Equilibrium Melting Temperatureof Polychlorotrifluoroethylene
John D. Hoffman and James J. Weeks
(October 2, 1961)
A new method of estimating the equilibrium melting temperature, Tm, of a polymer isdescribed, and applied to polychlorotrifluoroethylene (PCTFE). Experimentally de-termined values of the so-called observed melting point, !F^(obs), are plotted as a functionof the isothermal crystallization temperature, Tx. When freed of secondary effects, such asrecrystallization, the data fit a straight line of positive slope on a Ti (obs) versus Tx plot, Txbeing the abscissa. This line is then extrapolated to its intersection with the line T^ (obs)= Tx. The temperature at this intersection is Tm. This intersection is at 224 °C for PCTFE,and Tm is quoted as 224± 1 °C. (The highest melting point actually attained for a specimenwas 218.2 °C.) The value of Tm estimated using the extrapolation procedure is comparedwith that estimated using the customary method of slow stepwise warming.
A theoretical justification is given for making the type of plot mentioned above. Themost important assumption used in the theory is that one of the dimensions of the growingcrystal retains a value rather close to that of the appropriate growth nucleus during an iso-thermal crystallization, the other two dimensions being large in comparison. Combinationof this with the fact that the relevant dimension of the growth nucleus will vary as the re-ciprocal of the degree of supercooling leads to the prediction of melting points that increaselinearly with crystallization temperature. The assumption that one of the dimensions ofthe crystal retains a value fairly close to that of a growth nucleus can readily be justified onthe basis of polymer crystal growth with chain folds. Its justification in the case of thecustomary bundlelike mode of crystallization is less clear. It is demonstrated experimentallythat even the largest detectible crystals in PCTFE are only about 70 percent thicker than aprimary nucleus, when secondary effects are minimized.
The application of the theory to systems other than PCTFE is discussed briefly, andsome preliminary measurements on polyethylene mentioned. Some points relating to theshape of the melting curves of highly crystalline polymers are also brought out.
1. Introduction
The present investigation was begun largely be-cause of our interest in learning more about thefactors that influence the melting behavior ofpolychlorotrifluoroethylene (PCTFE) specimens thatwere crystallized in bulk. Such factors as the rateof heating used in the melting run, the initial degreeof crystallinity, and the temperature of the originalcrystallization were studied. One basic fact emergedearly in the work: the temperature of the originalcrystallization had an important influence on the ex-perimentally observed melting point. Under ap-propriate experimental conditions, the observedmelting point, T^(obs) increased markedly and near-ly linearly as the crystallization temperature, TXJwas increased. It naturally occurred to us that suchdata might be extrapolated in such a way as to per-mit thje equilibrium melting temperature, Tmi to bedetermined. The concept that T^(obs), Tm, andTx might be simply related to one another wasapparently first mentioned by Lauritzen and Hoff-man [I]1. For a simplified model, they showed thatT^(obs)==(Tro+T*)/2. A somewhat more generalderivation is given in the present paper. The melt-ing point data on PCTFE are extrapolated to ob-tain an estimate of Tm. A number of secondaryeffects, such as the recrystallization that may occuron slow warming, are discussed.
1 Figures in brackets indicate the literature references at the end of this paper.
It is of interest to know the equilibrium meltingtemperature of a polymer for a number of reasons.Among these is the fact that this quantity is requiredin the analysis of crystal growth rate data in order toestablish the degree of supercooling AT=Tm—Tx.The results of our studies on the isothermal growthof spherulitic crystallization in PCTFE at varioustemperatures will be reported shortly [2].
The equilibrium melting temperature of a polymermay be defined as the melting point of an assemblyof crystals, each of which is so large that size (i.e.,surface) effects are negligible, with the provision thateach such large crystal is in equilibrium with thenormal polymer liquid. (Small crystals will tend tomelt well below Tm). A further provision is thatthe crystals at the melting point have the equilibriumdegree of crystal perfection consistent with theminimum of free energy at Tm. The meltingphenomena may take place at too high a temperatureif the liquid polymer is oriented to an appreciableextent.
The above definition of Tm for a polymer is inprinciple similar to that for the true melting pointof a pure compound of the nonpolymeric type, wheth-er it be a molecular, ionic, or metallic crystal. How-ever, the formation within a reasonable period oftime of polymer crystals that are sufficiently largeto meet the requirement that surface effects benegligible presents a most difficult practical problem.Polymers as they are ordinarily crystallized tend tomelt out well below Tm because the crystals are
13
small, and perhaps somewhat too imperfect. Theresult is that an attempt to make a direct measure-ment of Tm for a polymer is not necessarily rewardedby a result that is sufficiently free of crystal sizeeffects.
Before going on to give the theory and the analysisof the data, it is useful to indicate in a preliminaryway the point of view that will be taken concerningthe combination of circumstances that (a) causesthe observed melting point of a linear polymer ofhigh molecular weight to increase with increasingcrystallization temperature and (b) renders it im-probable that the equilibrium melting temperaturecan actually be attained in a real polymer specimenin an experiment of reasonable duration.
From nucleation theory we know that a dimensionx of either a primary or secondary (growth) nucleuswill vary as 1/(AT). If the nucleus grows on all itsfaces, a large crystal that will melt extremely close tothe true melting point will form. This is evidentlywhat occurs with ordinary crystals. On the otherhand, if some restriction on growth exists for onedimension, so that the resultant crystallite continuesto maintain this dimension at a small value close tox while growing to large size in the other two, thecrystal will melt out well below Tm. Thus, if onedimension of a polymer crystal persisted at or nearthe value appropriate to a nucleus during the growthprocess, it is seen that the observed melting pointwould be distinctly higher the greater the tempera-ture of crystallization. As noted earlier, PCTFEexhibits such behavior. (Preliminary work revealsthat similar behavior occurs for polyethylene.) Thefirst systematic study showing an increase of meltingpoint with an increase of crystallization temperaturewas that of Wood and Bekkedahl on natural rubber[3,4].
Even if one dimension of a polymer crystal re-mained at a value x near the primary or secondarynucleus size while growing to large size in the othertwo dimensions, it is readily seen that a large andhigh melting crystal would in theory be formed bycarrying out the crystallization very near to Tmwhere AT is small. However, crystallization of apolymer specimen within a few degrees of Tm, sothat it would be certain to melt within say 1 or 2 °Cof Tm, will generally be prevented by kinetic factors.The growth rate of polymer crystals is nucleationrather than diffusion controlled anywhere near toTm, with the result that the rate of crystallizationbecomes exponentially slower as the crystallizationtemperature is raised. Depending on the polymer,the rate of isothermal crystallization generally be-comes excessively slow somewhere between 5 and20 °C below even the nominal melting point. Onthis basis, one must expect to be frequently con-fronted with the problem of the depression of theobserved melting point well below the true equilib-rium melting temperature because of small crystalsize. In a slow warming run, certain secondarymechanisms, to be discussed in some detail later,may operate in such a manner as to permit a furtherincrease of crystal size. However, these effects(melting out followed by recrystallization; chain
mobility in the crystal) will tend to be increasinglyineffective the higher the temperature. Hence, itis to be expected, that even the slowest of the warm-ing rates useful in practice may not lead to a speci-men which actually melts at Tm, even though thedependence of T'm (obs) on Tx will be more subduedthan with more rapid warming.
A slow stepwise warming technique has beenadvocated by Mandelkern [5,6] as a method ofattaining or closely approaching Tm in a real polymerspecimen. From an operational standpoint, thismethod places emphasis on secondary processes suchas the recrystallization that occurs with very slowwarming as a method of obtaining large crystalsand a high melting point in a specimen, rather thanon initially crystallizing at the highest practicabletemperature to achieve the same end. The questionnaturally arises as to how close the results obtainedwith the slow stepwise warming technique, as it isapplied in practice, are to both the Tm value ob-tained by the extrapolation method, and the actualmelting points of specimens obtained with initialcrystallization at a high temperature. In order toobtain information on these points, a slow stepwisewarming run was carried out on PCTFE. Data onpolyethylene are also discussed in connection withthis problem. Evidence is cited that suggests thatthe slow stepwise warming technique, as it has beenemployed in practice, gives melting points that areat least a few degrees below Tm.
The data on PCTFE analysed in this paper leadfco the definite conclusion that one dimension of thecrystal is small and close to that of a nucleus. (Thepreliminary data on polytheylene lead to a similarconclusion.) A discussion is given concerning theorigin of this phenomenon. One of the modelsdiscussed is that of polymer crystal growth withchain folds, and the other is the familiar bundlelikemodel of polymer crystal growth. It is indicatedthat the retention of one dimension of the growncrystal near that of a growth or primary nucleus canbe defended on theoretical grounds for a foldedcrystal, but that difficulties arise in the case of thebundlelike system. On this; and other grounds, it isconcluded that it is highly probable that the meltingbehavior of PCTFE is to be explained in terms ofthe model with chain folds.
2. Theory2.1. Crystals With Chain Folds
The principal objective of this section is to derivean expression relating the observed melting pointT^ (obs) of a polymer with chain folded crystals tothe crystallization temperature Tx and the equilib-rium melting temperature Tm. The general typeof experiment to which the theory applies is thefollowing. A specimen is crystallized isothermallyat Tx after being cooled from the melt. The meltingpoint 7^(obs) relevant to Tx is determined by warm-ing the specimen at a specified rate by a methodwhich locates the temperature at which the last de-tectible trace of crystallinity disappears. The ex-periment is then repeated for different Tx values.
14
The development given mentions the theoretical justifi-cation for assuming that one dimension of a foldedcrystal retains a value close to that of a primary orgrowth nucleus. Consideration is also given to thesecondary mechanisms, such as recrystallization, thatmay occur in experimental studies and allow someincrease in this restricted dimension. The shape ofthe melting curves is also discussed.
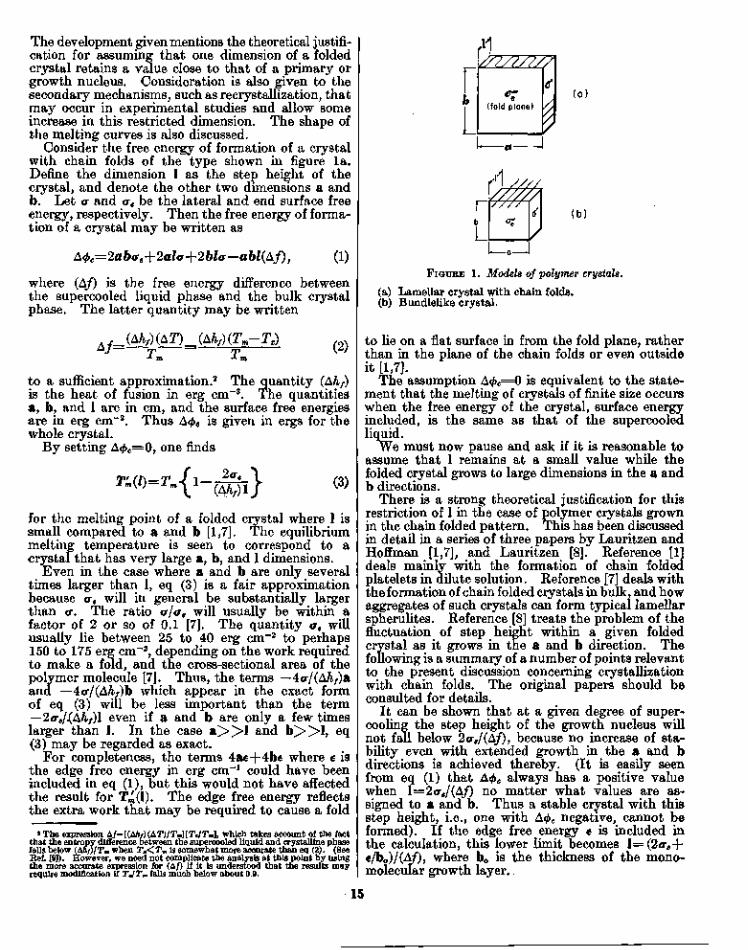
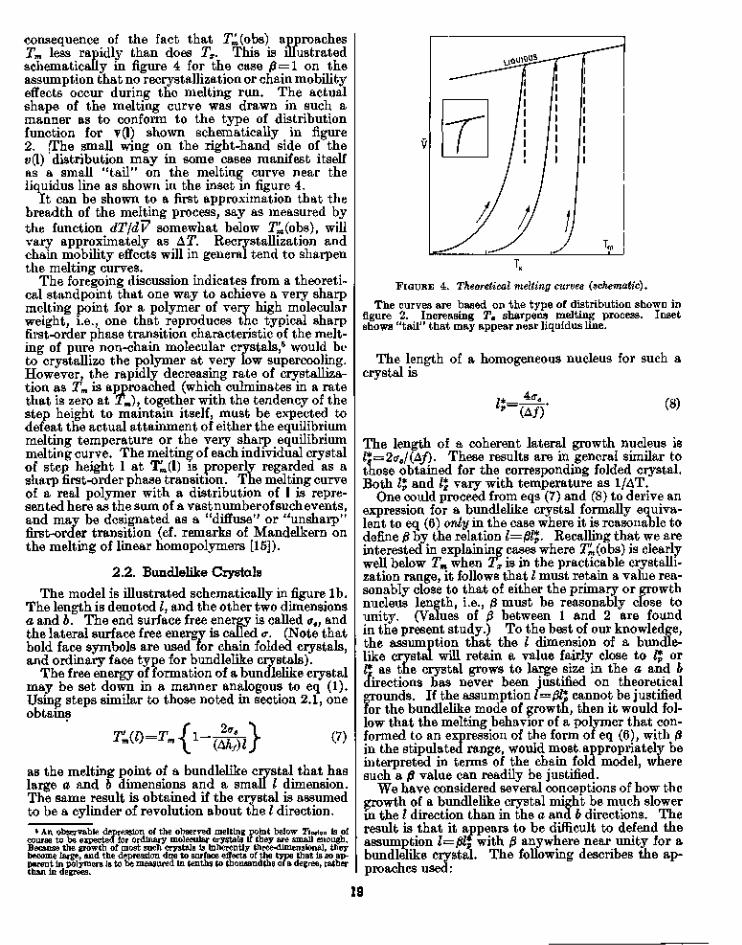
Consider the free energy of formation of a crystalwith chain folds of the type shown in figure la.Define the dimension 1 as the step height of thecrystal, and denote the other two dimensions a andb. Let a and ae be the lateral and end surface freeenergy, respectively. Then the free energy of forma-tion of a crystal may be written as
A<l>c=2ab*e+2ala+2bla—abl(Af), (1)
where (A/) is the free energy difference betweenthe supercooled liquid phase and the bulk crystalphase. The latter quantity may be written
(Ah,) (AT1) _ (Ahf) (Tm-Tx) ,aJ— j> — m \L)
to a sufficient approximation.2 The quantity (Ahr)is the heat of fusion in erg cm"3. The quantitiesa, b, and 1 are in cm, and the surface free energiesare in erg cm"2. Thus A$c is given in ergs for thewhole crystal.
By setting A$c=0, one finds
j(3)
for the melting point of a folded crystal where 1 issmall compared to a and b [1,7]. The equilibriummelting temperature is seen to correspond to acrystal that has very large a, b, and 1 dimensions.
Even in the case where a and b are only severaltimes larger than 1, eq (3) is a fair approximationbecause ae will in general be substantially largerthan a. The ratio a/ae will usually be within afactor of 2 or so of 0.1 [7]. The quantity <re willusually lie between 25 to 40 erg cm~2 to perhaps150 to 175 erg cm"2, depending on the work requiredto make a fold, and the cross-sectional area of thepolymer molecule [7]. Thus, the terms —4o-/(AA/)aand —4a/(Ahf)b which appear in the exact formof eq (3) will be less important than the term—2ae/(Ahf)l even if a and b are only a few timeslarger than 1. In the case a > > l and b > > l , eq(3) may be regarded as exact.
For completeness, the terms 4ae+4be where e isthe edge free energy in erg cm"1 could have beenincluded in eq (1), but this would not have affectedthe result for T^(l). The edge free energy reflectsthe extra work that may be required to cause a fold
2 The expression Af=[(Ahf)(AT)/Tm][TxfTm]f which takes account of the factthat the entropy difference between the supercooled liquid and crystalline phasefalls below (Ahf)/Tm when Tx< Tm is somewhat more accurate than eq (2). (SeeRef. [9]). However, we need not complicate the analysis at this point by usingthe more accurate expression for (A/) if it is understood that the results mayrequire modification if TJTm falls much below about 0.9.
(a)
(b)
L
FIGURE 1. Models of polymer crystals.
(a) Lamellar crystal with chain folds.(b) Bundlelike crystal.
to lie on a flat surface in from the fold plane, ratherthan in the plane of the chain folds or even outsideit [1,7].
The assumption A<£c=0 is equivalent to the state-ment that the melting of crystals of finite size occurswhen the free energy of the crystal, surface energyincluded, is the same as that of the supercooledliquid.
We must now pause and ask if it is reasonable toassume that 1 remains at a small value while thefolded crystal grows to large dimensions in the a andb directions.
There is a strong theoretical justification for thisrestriction of 1 in the case of polymer crystals grownin the chain folded pattern. This has been discussedin detail in a series of three papers by Lauritzen andHoffman [1,7], and Lauritzen [8]. Reference [1]deals mainly with the formation of chain foldedplatelets in dilute solution. Reference [7] deals withthe formation of chain folded crystals in bulk, and howaggregates of such crystals can form typical lamellarspherulites. Reference [8] treats the problem of thefluctuation of step height within a given foldedcrystal as it grows in the a and b direction. Thefollowing is a summary of a number of points relevantto the present discussion concerning crystallizationwith chain folds. The original papers should beconsulted for details.
It can be shown that at a given degree of super-cooling the step height of the growth nucleus willnot fall below 2ae/(Af), because no increase of sta-bility even with extended growth in the a and bdirections is achieved thereby. (It is easily seenfrom eq (1) that A<t>c always has a positive valuewhen l=2cre/(A/) no matter what values are as-signed to a and b. Thus a stable crystal with thisstep height, i.e., one with A<j>c negative, cannot beformed). If the edge free energy e is included inthe calculation, this lower limit becomes l=(2o-e+€/bo)/(A/), where bo is the thickness of the mono-molecular growth layer.
15
The explanation of why the 1 dimension of thegrowth nucleus will not increase markedly as thefolded crystal grows to large size in the a and bdimensions is based on the fact that the maximumsteady-state growth rate in the a and b dimensionsrefers to a certain value of 1. The value of 1 thatleads to the maximum growth rate is [1,7]
(2cre+e/b0)(A/)
JcT(4a)
The quantity kT/boa will generally run from 10 to30A. If 1 for a given crystal becomes temporarilylarger than 1*, the activation barrier becomes high,thus reducing the rate of crystal growth in the a andb directions. For a relatively large value of e, eq(4) will be
^ 1 * , (AK)h} \±UJ
where 1* is the step height of a primary (homo-geneous) nucleus. Crystals with values of 1 inexcess of those given by eqs (4a) and (4b) willoccasionally occur, but these will not grow as rapidlyin the a and b directions as those with a step height1J. Once a chain folded crystal is formed, it will nottend to grow rapidly in the 1 direction because ofthe folds.3 Through fluctuations, a step heightthat is too large will gradually tend toward 1* asgrowth in the a and b directions takes place [8].The tendency of the step height of a folded crystalto maintain itself close to that of the growth nucleusis also predicted by the theoretical studies of Frankand Tosi [10] and Price [11].
At a supercooling of 20° C, eqs (4) predict valuesof 1| in the neighborhood of roughly 50 to 500 A [7].There is no restriction to such a small value implicitin the model for growth in the a and b directions.Thus, there is a theoretical justification for theassumptions a > > l and b > > l used in the deriva-tion of eq (3) for a polymer crystal formed on thechain folded pattern.
The considerations outlined above provide areasonable theoretical justification for the assumptionthat the mean value of the step height 1 of a foldedcrystal will maintain itself at a value close to thatof a primary or growth nucleus, while the other twodimensions become much larger. The variousfactors that can lead to a preponderance of crystalswith chain folds over bundle-like crystals duringcrystallization from the supercooled bulk phase arediscussed in some detail in reference [7].
From an experimental standpoint, there is amplereason to consider polymer crystals with chain foldsfor material crystallized from dilute solution. Keller[12] has clearly demonstrated that the plateletsformed under these conditions are chain folded whenremoved from the solution and dried, and that thestep height increases with decreasing supercoolingas required by eqs (4a) and (4b). The question of
3 In some cases, diffusion mechanisms involving chain mobility in the crystalmay allow a gradual increase of 1 in a grown crystal with the passage of time.This effect is discussed later in the paper.
whether chain folded crystals exist in polymercrystallized from the supercooled bulk phase hasproved to be more difficult to answer. Recentlyhowever, Geil has demonstrated that chain foldsmust exist in polypropylene crystallized from themelt [13]. This work provides strong experimentalconfirmation of the view that the lamellae in spheru-lites consist of chain folded crystals (cf. ref. [7]).Any chain folded structures formed in bulk willdoubtless possess some chains protruding from theplane of the chain folds, and chains of a similarcharacter forming interlamellar links.
We return now to the question of the applicationof eq (3) to melting point data. The melting pointT ( b ) i d f i d i l l h
eq(oq ( ) g p g p
n (obs) is defined operationally as the temperaturewhere the last detectible trace of crystallization dis-appears. For crystals at the melting point definedin this way, the value of 1 that is relevant in eq (3)is not the average value of 1, but rather a somewhatlarger value that represents the thicker and thereforethe higher melting crystals in the system. In thissituation, it is convenient to assume that
where 1$ is given by (4b) and ft is a constant. Thisstates simply that the mean step height of thecrystals that melt out last, i.e., those correspondingto Tm (obs), is j8 times as large as the mean step heightof a primary nucleus, or the mean step height of agrowing crystal with fairly large e.
Some discussion of the expected values of fi andthe implications of this approximation is necessary.
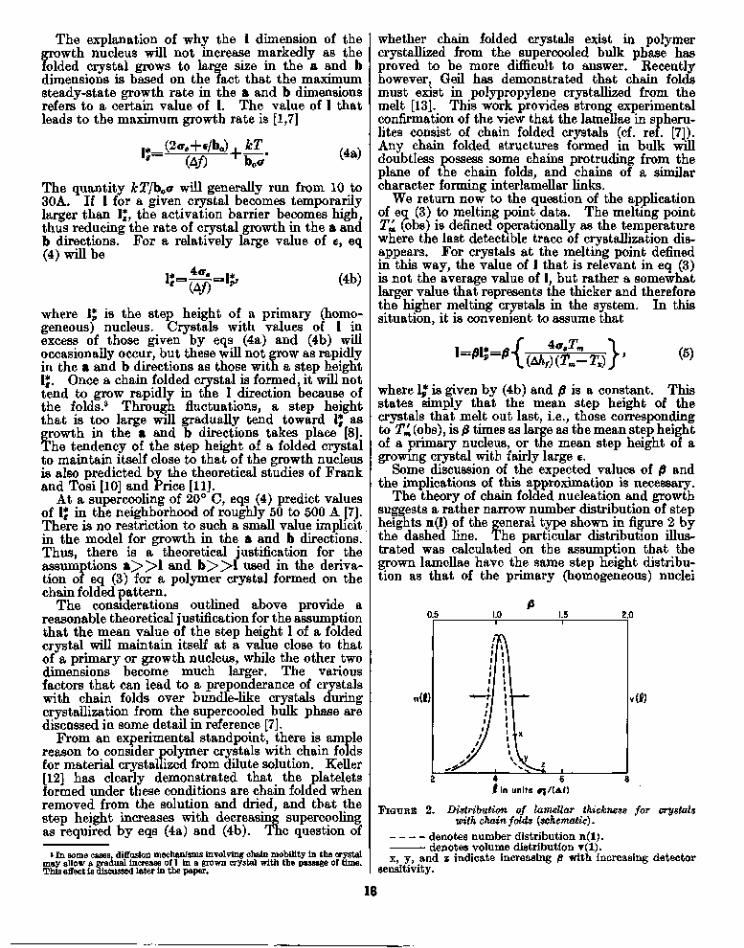
The theory of chain folded nucleation and growthsuggests a rather narrow number distribution of stepheights n(l) of the general type shown in figure 2 bythe dashed line. The particular distribution illus-trated was calculated on the assumption that thegrown lamellae have the same step height distribu-tion as that of the primary (homogeneous) nuclei
0.5
4 6f in units tf?/
FIGURE 2. Distribution of lamellar thickness for crystalswith chain folds {schematic).
denotes number distribution n(l).denotes volume distribution y(l).
x, y, and z indicate increasing 0 with increasing detectorsensitivity.
16
[1, 7]. This corresponds to the case where thegrowth nucleus has a large e. The assumption thatthe step height distribution of the grown lamellae isthe same as that of the primary nuclei is crude.However, a detailed calculation [8] of the distributionof step heights formed in the growth process withina given lamella, and the deviation of the averageheight of each lamella compared with the rest, givesa distribution which for the present purpose hassimilar properties. Hence our general conclusionsconcerning (3 will not rest on the assumption ofhomogeneous initiation.
It is seen in figure 2 that there is a rather sharpmaximum in n(l) at Ij=4ae/(A/). However, somecrystals are thinner than 1J, and a significant numberare thicker. It is the melting of these thickercrystals that will be observed near the melting pointas it has been defined. However, for the purposeof analysing melting points obtained from specificvolume-temperature (V*— T) curves, we must reallyask what the volume of such crystals is, rather thanthe number. We may in general expect the thickercrystals to have a larger volume, thus shifting therighthand side of the volume distribution functionv(l) slightly to the right in the plot shown in figure 2(see solid curve). Thus, for the case where themean step height of the growing crystal is lj=4ae/(A/), we must expect p to be somewhat in excess ofunity. Further, the sensitivity of the detector willhave an influence on the observed value of 0. Thisis shown in figure 2 at points x, y, and z, whichcorrespond to slightly different (3 values. Thus, inthe case of large e, we may expect 0 to be near orslightly greater than unity. In the case where e isnegligible, 0 may be expected to be somewhat belowunity.
Insertion of (5) into (3) gives
(6)
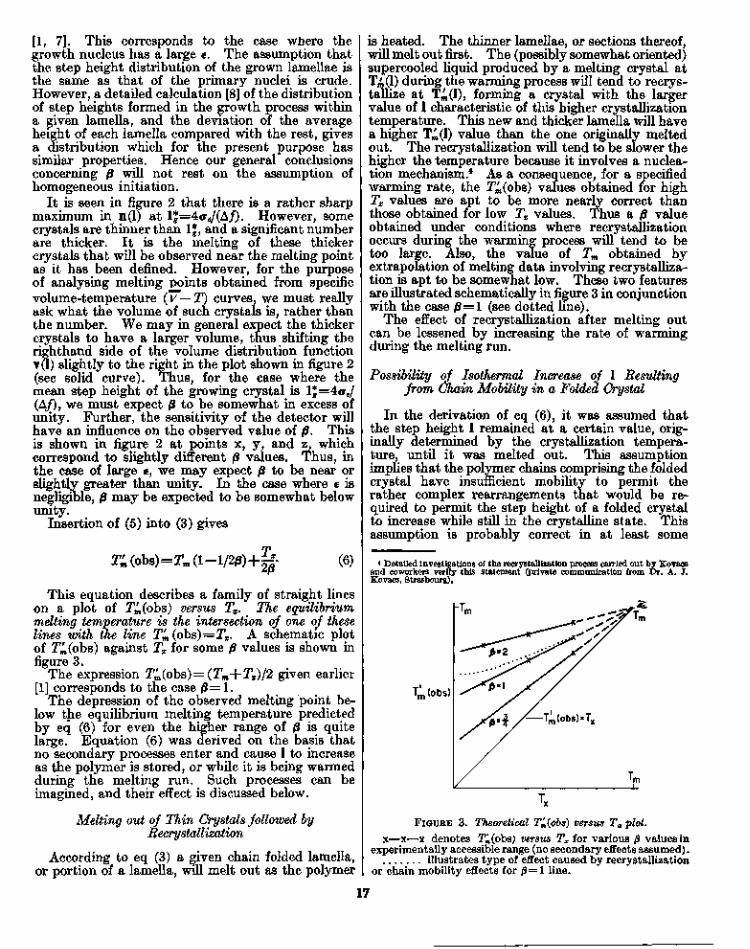
This equation describes a family of straight lineson a plot of T4(obs) versus Tx. The equilibriummelting temperature is the intersection of one of theselines with the line Tm(obs) = Tx. A schematic plotof T4(obs) against Tx for some p values is shown infigure 3.
The expression Tn(obs)=(Tm+Tx)/2 given earlier[1] corresponds to the case 0 = 1 .
The depression of the observed melting point be-low the equilibrium melting temperature predictedby eq (6) for even the higher range of 0 is quitelarge. Equation (6) was derived on the basis thatno secondary processes enter and cause 1 to increaseas the polymer is stored, or while it is being warmedduring the melting run. Such processes can beimagined, and their effect is discussed below.
Melting out of Thin Crystals followed byRecrystallization
According to eq (3) a given chain folded lamella,or portion of a lamella, will melt out as the polymer
is heated. The thinner lamellae, or sections thereof,will melt out first. The (possibly somewhat oriented)supercooled liquid produced by a melting crystal atT^(l) during the warming process will tend to recrys-tallize at T^OO, forming a crystal with the largervalue of 1 characteristic of this higher crystallizationtemperature. This new and thicker lamella will havea higher T^(l) value than the one originally meltedout. The recrystallization will tend to be slower thehigher the temperature because it involves a nuclea-tion mechanism.4 As a consequence, for a specifiedwarming rate, the T4(obs) values obtained for highTx values are apt to be more nearly correct thanthose obtained for low Tx values. Thus a 0 valueobtained under conditions where recrystallizationoccurs during the warming process will tend to betoo large. Also, the value of Tm obtained byextrapolation of melting data involving recrystalliza-tion is apt to be somewhat low. These two featuresare illustrated schematically in figure 3 in conjunctionwith the case P=l (see dotted line).
The effect of recrystallization after melting outcan be lessened by increasing the rate of warmingduring the melting run.
Possibility of Isothermal Increase of 1 Resultingfrom Chain Mobility in a Folded Crystal
In the derivation of eq (6), it was assumed thatthe step height 1 remained at a certain value, orig-inally determined by the crystallization tempera-ture, until it was melted out. This assumptionimplies that the polymer chains comprising the foldedcrystal have insufficient mobility to permit therather complex rearrangements that would be re-quired to permit the step height of a folded crystalto increase while still in the crystalline state. Thisassumption is probably correct in at least some
* Detailed investigations of the recrystallization process carried out by Kovacsand coworkers verify this statement (private communication from Dr. A. J.Kovacs, Strasbourg).
hTr
Tm(obs)
/— Tm(obs)=Ty
FIGURE 3. Theoretical T'm(6bs) versus Tx plot.x—x—x denotes T^(obs) versus Tx for various 0 values in
experimentally accessible range (no secondary effects assumed).illustrates type of effect caused by recrystallization
or chain mobility effects for /3=1 line.
17
cases, but in others the mobility of the chainsmight permit an isothermal increase of the stepheight on prolonged storage. The driving forcefor the increase of the step height will always existbelow T^(l) for a lamellar crystal as it is formedin the kinetic crystal growth process. (It shouldbe recalled that a folded crystal possesses a smalland temperature-dependent mean step height 1*because a crystal of this step height has the maxi-mum rate of growth in the a and b directions, andnot because a crystal with this step height is themost stable at the crystallization temperaturefrom a thermodynamic viewpoint [1,7]). In viewof the fact that a thin chain folded lamellar crystalcould increase its stability (and hence, its meltingpoint) by becoming thicker, through complexchain rearrangements fostered by chain mobilityin a crystal, it seems useful to indicate how thiswould affect the present analysis. Reneker hassuggested some interesting mechanisms involvingdefects such as point dislocations that could leadto a slow increase of 1 for folded crystals [14].
If gradual thickening due to mobility of segmentsin a folded crystal occurred, the melting pointscorresponding to various Tx values would all beraised somewhat, the effect on T^(l) being least atthe higher crystallization temperatures becauseof the greater thickness of the lamellae. In thissense, the effect of mobility would resemble the effectof recrystallization (increased /3, low extrapolatedTm value). There is, however, one importantdifference between the two effects: thickening ofa lamella due to chain mobility in the crystal (if itoccurs at all) could take place anywhere in theinterval Tx to T^(l), whereas thickening of a lamelladue to melting out followed by recrystallizationcould occur only after a lamella had been heatedto T^(l). Thus, if the observed melting point(at a given warming rate) depends markedly onthe residence time at TXJ isothermal thickening ofthe lamellae due to chain mobility should be sus-pected. If the observed melting points are in-sensitive to the residence time at Tx, but are de-pendent on the melting rate, then the existenceof simple melting out followed by recrystallizationis indicated. (This does not preclude some increaseof step height due to chain mobility effects at lowTx values at residence times shorter than thosethat are experimentally practicable.)
From this standpoint, the most reliable meltingpoint data for the determination of Tm and P for apolymer where either or both effects occur to ameasurable extent would be obtained on specimenswhere the initial crystallinity was low (short resi-dence time at Tx), where fairly rapid melting rateswere used, and where the greatest reliance is placedon T^(obs) data obtained for high Tx values.
The effect of orientation of the polymer liquidwill be to increase the T^(obs) values. Such aneffect may occur in samples where orientation isinitially present due to severe stress applied to themelt phase, but this can generally be circumvented.Also, the crystallization process itself may locally
orient the supercooled liquid phase of the polymersomewhat. Where a fast melting run is found tobe necessary to minimize recrystallization and la-mellar thickening resulting from chain mobility,some residual effect of orientation may appear,but this should be minimized by making measure-ments on specimens of low initial crystallinity.
In its simplest interpretation, the process wehave termed "melting out" refers to the conversionof a crystal of a specified step height at a certaintemperature given by equation (3) to a thermo-dynamic state of identical free energy and a molecularstate similar to that of the normal supercooledliquid at the same temperature. While the chainmolecules in the normal supercooled liquid maywell be somewhat alined locally, this interpretationcertainly implies a considerable disorientation ofthe chains during the "melting out" process. (Thisdoes not necessarily imply, however, that anyensuing recrystallization process will lead to a crystalwith a different crystallographic orientation thanthe one originally melted out. For example, thepresence of undestroyed nuclei in the form of un-melted lamellae, or portions of a lamella, couldeasily lead to the same orientation for the newly-formed crystal.) A more complex process thanthis might actually occur when at a certain tem-perature the free energy of a lamella, or portionthereof, becomes equal to that of the normal super-cooled liquid. For example, a very thin (andnearly unstable) crystal might, when heated slightlyfind the route to a larger step height more rapidthrough the chain mobility mechanism than throughthe melting out with disorientation-^recrystalliza-tion mechanism. In this case, the distinction wehave drawn between the melting out—recrystalliza-tion, and the increase of step height through chainmobility, mechanisms would become rather artificial.Nevertheless, for a crystallization conducted fairlyclose to Tm, where the step height is large, one mustexpect the disappearance of the crystals on warmingto correspond to the formation of liquid-like polymerin a state of disorientation at least fairly similar innature to the normal supercooled liquid.
Despite the possibilities for an increase of stepheight after the formation of a folded crystal, itis commonly to be expected that a system of chainfolded crystals will exhibit a marked dependenceof melting point on the original crystallizationtemperature. In the limiting case where secondaryeffects resulting from recrystallization and chainmobility are minimized by appropriate experimentaltechniques, values of /? ranging from somewhatbelow to somewhat above unity should be found,and a reliable value of Tm determined by the extrap-olation method. When these secondary effects en-ter, (3 will be larger than normal, and the extrapolatedTm value will be somewhat low.
Shape of the Melting Curves
The theory indicates that the sharpness of themelting process near Tm will increase as the crystalli-zation temperature is increased. This is a natural
18
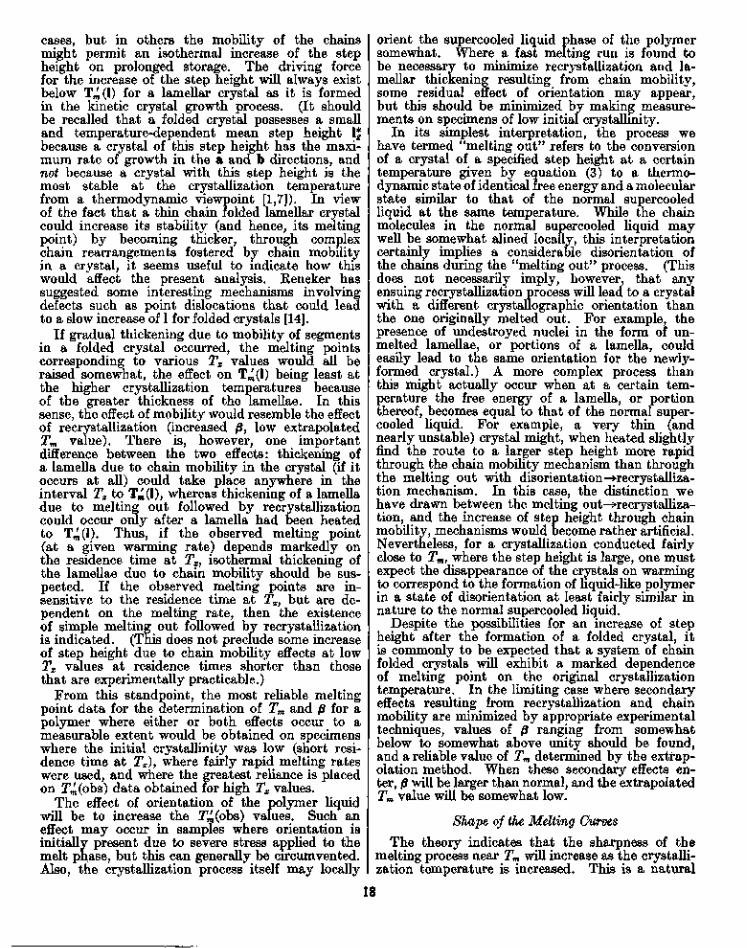
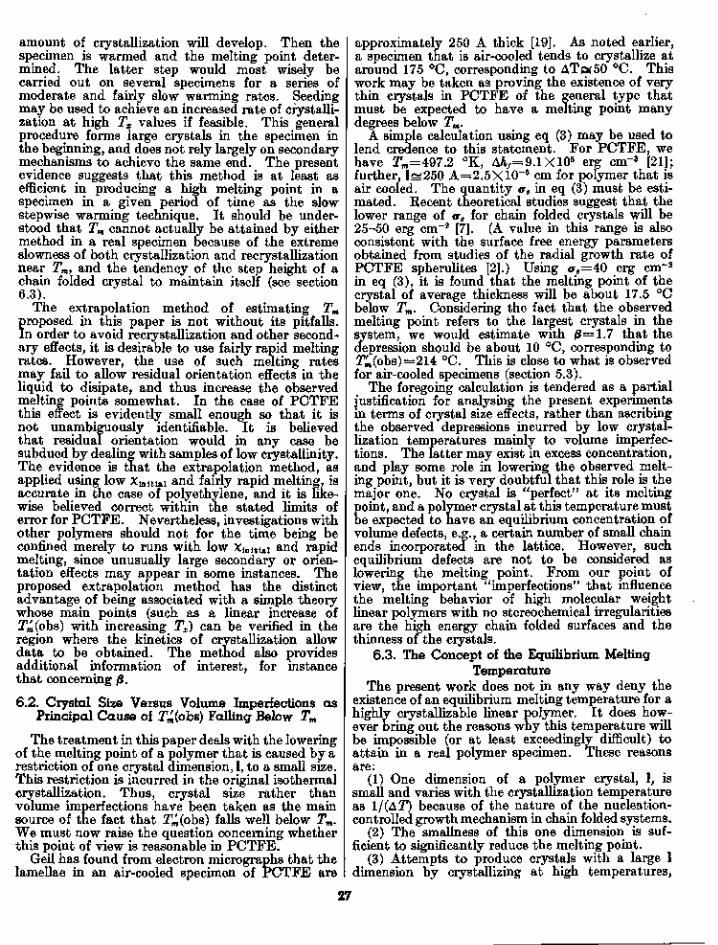
consequence of the fact that T^(obs) approachesTm less rapidly than does Tx. This is illustratedschematically in figure 4 for the case /3=1 on theassumption that no recrystallization or chain mobilityeffects occur during the melting run. The actualshape of the melting curve was drawn in such amanner as to conform to the type of distributionfunction for v(l) shown schematically in figure2. jThe small wing on the right-hand side of thev(l) distribution may in some cases manifest itselfas a small "tail" on the melting curve near theliquidus line as shown in the inset in figure 4.
It can be shown to a first approximation that thebreadth of the melting process, say as measured bythe function dT/dV somewhat below T4(obs), willvary approximately as AT. Recrystallization andchain mobility effects will in general tend to sharpenthe melting curves.
The foregoing discussion indicates from a theoreti-cal standpoint that one way to achieve a very sharpmelting point for a polymer of very high molecularweight, i.e., one that reproduces the typical sharpfirst-order phase transition characteristic of the melt-ing of pure non-chain molecular crystals,5 would beto crystallize the polymer at very low supercooling.However, the rapidly decreasing rate of crystalliza-tion as Tm is approached (which culminates in a ratethat is zero at Tm), together with the tendency of thestep height to maintain itself, must be expected todefeat the actual attainment of either the equilibriummelting temperature or the very sharp equilibriummelting curve. The melting of each individual crystalof step height 1 at T^(l) is properly regarded as asharp first-order phase transition. The melting curveof a real polymer with a distribution of 1 is repre-sented here as the sum of a vast number of such events,and may be designated as a "diffuse" or "unsharp"first-order transition (cf. remarks of Mandelkern onthe melting of linear homopolymers [15]).
2.2. Bundlelike CrystalsThe model is illustrated schematically in figure lb.
The length is denoted Z, and the other two dimensionsa and b. The end surface free energy is called <re, andthe lateral surface free energy is called <r. (Note thatbold face symbols are used for chain folded crystals,and ordinary face type for bundlelike crystals).
The free energy of formation of a bundlelike crystalmay be set down in a manner analogous to eq (1).Using steps similar to those noted in section 2.1, oneobtains
{^} (7)as the melting point of a bundlelike crystal that haslarge a and b dimensions and a small I dimension.The same result is obtained if the crystal is assumedto be a cylinder of revolution about the I direction.
8 An observable depression of the observed melting point below TfU8ion is ofcourse to be expected for ordinary molecular crystals if they are small enough.Because the growth of most such crystals is inherently three-dimensional, theybecome large, and the depression due to surface effects of the type that is so ap-parent in polymers is to be measured in tenths to thousandths of a degree, ratherthan in degrees.
r /! !Inr
FIGURE 4. Theoretical melting curves (schematic).
The curves are based on the type of distribution shown infigure 2. Increasing Tx sharpens melting process. Insetshows "tail" that may appear near liquidus line.
The length of a homogeneous nucleus for such acrystal is
(8)(A/)
The length of a coherent lateral growth nucleus isl%=2<rj (Af). These results are in general similar tothose obtained for the corresponding folded crystal.Both 1% and l*g vary with temperature as I/AT.
One could proceed from eqs (7) and (8) to derive anexpression for a bundlelike crystal formally equiva-lent to eq (6) only in the case where it is reasonable todefine /3 by the relation Z=$*. Recalling that we areinterested in explaining cases where T4(obs) is clearlywell below Tm when Tx is in the practicable crystalli-zation range, it follows that I must retain a value rea-sonably close to that of either the primary or growthnucleus length, i.e., /3 must be reasonably close tounity. (Values of /3 between 1 and 2 are foundin the present study.) To the best of our knowledge,the assumption that the I dimension of a bundle-like crystal will retain a value fairly close to 1% orZ* as the crystal grows to large size in the a and bdirections has never been justified on theoreticalgrounds. If the assumption I=f5l% cannot be justifiedfor the bundlelike mode of growth, then it would fol-low that the melting behavior of a polymer that con-formed to an expression of the form of eq (6), with pin the stipulated range, would most appropriately beinterpreted in terms of the chain fold model, wheresuch a 0 value can readily be justified.
We have considered several conceptions of how thegrowth of a bundlelike crystal might be much slowerin the I direction than in the a and b directions. Theresult is that it appears to be difficult to defend theassumption 1=01% with /3 anywhere near unity for abundlelike crystal. The following describes the ap-proaches used:
19
(1) A calculation of the growth rate in the I direc-tion, and in the a and b directions, was made usingclassical nucleation theory. The effect of entangle-ments was ignored, and it was assumed that no cumu-lative strain existed at the bundle ends. This modelimplies a more rapid growth rate in the I direction [7],since the end surface free energy of a polymer crystalis generally agreed to be much larger than the lateralsurface free energy. This model evidently does notcorrespond to the crystal habit exhibited by most realpolymers, which generally grow most rapidly in thetwo directions tranverse to the chain axes, ratherthan in the chain axis direction.
(2) The assumption that the cumulative strainthat may occur in the diffuse end surface of a bundle-like crystal might abort growth in the I direction wasexamined [7]. In the bundlelike system, polymerchain molecules actually pass through the end sur-faces, and connect the crystalline and supercooledliquid phases together. Since there is a density dif-ference between the two phases, cumulative strainmay exist in the end of the bundle. This model raisesa serious question concerning whether a large bundle-like crystal can be formed at all, and definitely rulesout of existence a strictly bundlelike crystal with aflat end surface where the chains are perpendicular tothis surface. The concept of cumulative strain doesnot imply that the restriction on growth in the I di-rection would be such as to allow I to be even approxi-mately proportional to 1% or 1%. Crystals aborted bycumulative strain would in general tend to melt quiteclose to the crystallization temperature. Rather thangiving a clue as to the melting behavior of bundlelikecrystals, this model suggests one important reasonwhy crystals with chain folds form instead. Crystalswith chain folds effectively evade strain resultingfrom the density difference of the supercooled liquidand crystal phases, since relatively few chains passthrough the end (folded) surfaces.
(3) The concept that chain entanglements causea bundlelike crystal to cease growth in the I directiononce it has reached the nucleus length was examined.This special assumption does not appear to be readilyjustifiable. The same type of entanglements thatone must assume are continually resolved as thecritical-sized nucleus is being built up would have tosuddenly become exceedingly effective just as thelength 1% was attained. Recalling that 1% is stronglydependent on temperature, such a mechanism for thepersistence of the one dimension of a bundlelikecrystal near 1% seems improbable.
On the basis of the above, it is regarded as un-likely that the interpretation of the melting be-havior of a polymer conforming with eq (6) with 0values in the general vicinity of unity is to be basedon a bundlelike model. To derive the analogue ofeq (6) for the bundlelike model, the arbitrary as-sumption l=fft% with /S-—' 1 has to be introduced, andthis apparently has no clear justification.
As noted previously, the typical lamellar struc-tures so often seen in polymers crystallized from theunoriented melt are most readily explained in termsof growth of a substantially chain folded character
[7, 13]. Thus, in cases where it is known that themelting process refers to the disappearance of typi-cal lamellar spherulitic structures on warming, thechain fold model discussed in 2.1 is clearly moreappropriate than the analogous treatment with thebundlelike model.
3. Experimental
3.1. Materials
The specimens of PCTFE, — (CF2CFC1)»—, thatwere used in this work were laboratory samples ofKel-F grade 300 polymer that were kindly suppliedto us by the Minnesota Mining and ManufacturingCompany. The number average molecular weightwas stated to be about 415,000. The polymer wassupplied in the form of molded sheets about 2 mmthick. When crystallized as described below thepolymer is highly spherulitic.
3.2. Melting Runs With High XinitIai and ModeratelySlow Melting
The objective of this part of the study was to de-termine, with moderately slow warming, the meltingpoint of PCTFE specimens that had been isother-mally crystallized to a high degree of crystallinity, x.
A sample weighing from 1 to 3 g was first heatedin an air bath far above any possible value of Tm toa temperature denoted T\ in order to establish areproducible thermal history. (Tx was usually305 °C.) Then it was quickly suspended in a sili-cone oil bath which was operating at the crystal-lization temperature, Tx, and an isothermal crystal-lization carried out to the desired degree of crystal-linity. The temperature of the sample in the bathwas known to better than 0.1 °C.
Melting data were obtained on such specimensby warming them in the silicone oil bath^jand plottingthe specific volume—temperature (V-T) curves.The specific volume data were precise to within0.0002 cm'g"1. This was sufficient to detect amelting point T^(obs) corresponding to the disap-pearance of all but the last four tenths of a percent ofcrystallinity. Details concerning the apparatus usedhave been given elsewhere [16]. The T^(obs) valuescited are accurate to within about 0.2 °C.
In carrying out the melting run, the sample wasfirst warmed rapidly from Tx to about 205 °C in anattempt to minimize recrystallization. The melt-ing point T'm(obs) was then determined with moder-ately slow warming above 205 °C. Counting fromthe time 205 °C was reached, most of the meltingruns were carried out within 4 to 6 hours, but a fewwere carried out over a period of many days inorder to check the effect of the rate of heating. Inall these runs, most of the time above 205 °C wasspent in carefully approaching the melting point.The degree of crystallinity at the beginning of eachwarming run, xinitial, w a s calculated from thespecific volume using the crystallinity scale estab-lished by Hoffman and Weeks [16].
20
Tx values from about 170 to 200 °C were practi-cable with the above procedure. It is difficult tocarry out an isothermal crystallization much below170 °C on a sample of convenient size because ofself-heating attending the rapid crystallization.Above about 200 °C, the rate of crystallization be-comes intolerably slow.
In a few cases, the melting points were determinedby mounting the crystallized specimens on a hotstage on a polarizing microscope, and observing thetemperature at which birefringence disappeared.
For most of the runs, the samples were cooled toroom temperature after crystallizing at Tx% and thenrewarmed and the melting curve obtained. It wasdemonstrated that this did not alter T^(obs), as itrelates to Tx, by carrying out similar runs withoutfirst cooling to room temperature. The hierarchy ofsmall crystals introduced below Tx on cooling toroom temperature simply melt out first when thesample is rewarmed.
The initiation of the crystals in the samples isprincipally by heterogeneous nucleation. The bulkcrystallization isotherms follow the Avrami relation,X=l—exp[—Ztn], where t is time, with n=2 to n=3, for the first 30 to 50 percent of the crystallization.The crystallization becomes much less rapid as thetemperature is increased. Thus the rate constantZ has the strongly negative temperature coefficientcharacteristic of a nucleation controlled growth mech-anism. The n=3 exponent results from three-di-mensional growth, mainly spherulites in the body ofthe specimen born at or near t=0. In thin sampleswith a large amount of surface, a n n = 1 componentdue to surface nucleation causes the overall bulkisotherm to tend toward n=2. Above x=0.4 to 0.5,the crystallization rather abruptly slows down withthe consequence that long periods of time are re-quired to attain high x values.
3.3. Melting Runs With High Xinitiai and Fast Melting
After conducting the investigation described aboveand analysing the data, it became apparent thatrecrystallization and other secondary effects hadalmost certainly increased some of the melting pointssomewhat.
In order to reduce recrystallization and othersecondary effects during the melting process as muchas possible, and thereby obtain jT^(obs) values thatreflected the Tx values more precisely, a rapid melt-ing procedure was adopted.
Specimens were heated to Tx and then crystallizedat Tx as described in section 3.2. Then they wereplaced (without first cooling to room temperature)in a silicone oil bath operating quite close to theanticipated melting point, i.e., 1 or 2 °C below theT^(obs) value obtained with a moderate warmingrate. It was then jletermined, usually by the vol-ume-temperature (V— T) technique, whether or notthe sample had melted out when it came to the tem-perature of the bath. By successive experimentswith baths at closely spaced temperatures, T^(obs)
could be rather closely bracketted. This procedureis equivalent to a melting run of about 20 minutesduration, most of this interval being spent very closetoT;(obs).
3.4. Melting Runs With Low Xinitiai and Fast Melting
These runs were carried out primarily with theaim of determining the effect of storage time on themelting points for a given rate of melting.
The runs were carried out in the same manner asthose described in section 3.3, except that the speci-mens were not allowed to crystallize as long prior tobeing melted out.
As noted in section 3.2, the runs with high xinitiaivalues (x=0.40 to 0.65) and moderate melting rateswere carried out on specimens about 2 mm thickand weighing about 3 g. In these experiments, andin the high xmitiai runs with rapid melting, theV— T method detects the disappearance of all butthe last 0.4 percent of crystals. However, in thislow xinitiai runs (x=0.05 to 0.11) the sensitivity wasless, partly because somewhat smaller samples wereused, but mostly because of the lower crystallinity.The sensitivity in these runs was such that theobserved melting point corresponded to 3 percentcrystallinity in the specimen. After some investi-gation of the slopes of the V— T curves in the meltingrange, it was found that adding 0.6 °C to eachobserved melting point gave a T4(obs) value thatcorresponded to the disappearance of all but thelast 0.4 percent of the crystals. This correction isactually somewhat smaller the higher TXJ but addingthe constant value 0.6 °C gives results accurate toabout ±0.2 °C in the experimental range, which issufficient for the intended purpose.
3.5. Melting Point by the Slow Stepwise WanningMethod
A specimen of PCTFE was initially crystallized at180 °C. (The melting run was carried out with thespecimen suspended in silicone oil so that the specificvolume could be measured.) It was then warmedto a higher temperature and allowed to stand untilthe specific volume appeared to settle down to a"rest" value. Then the temperature was raisedagain, and the process repeated. The total durationof the melting part of the run was 35 days. Theaverage rate of warming was 5 °C per day up to205 °C, 1 °C per day up to 210 °C, and 0.5 °C perday up to the melting point.
3.6. The Melting Point of Specimens Crystallized atHigh Temperatures Using Seeds
The objective of this part of the work was toobtain the highest actual melting temperature for aspecimen of PCTFE using the general concept that ahigh isothermal crystallization temperature will leadto a high melting point.
21
As indicated in section 3.2 the rate of crystalliza-tion becomes so slow around Tx=200 °C in thenormal runs that it is not convenient to carry outisothermal crystallizations at higher temperatures.Therefore seeds from a previous crystallization wereused to accelerate the crystallization process.
The seed crystal run was carried out in the follow-ing manner. First, the specimen was heated to 305°C and then crystallized isothermally at 180 °C to adegree of crystallinity of over 0.5. Then it waswarmed to a Ti value of 215.6 °C. This melted outthe vast majority of the crystals present, and gavea specific volume that was indistinguishable fromthe liquidus. However, numerous seed crystalswere present. (The presence of seed crystals wasindicated by the fact that the subsequent crystal-lization at a specified value of Tx was considerablymore rapid than the crystallization would have beenat the same Tx in a normal run.) The sample wasthen transferred from the Tx bath to another bathoperating at TX} and the crystallization carried to afairly high % value. __Then the melting point wasdetermined from a V— T curve with a moderatewarming rate as described in section 3.2.
4. Results
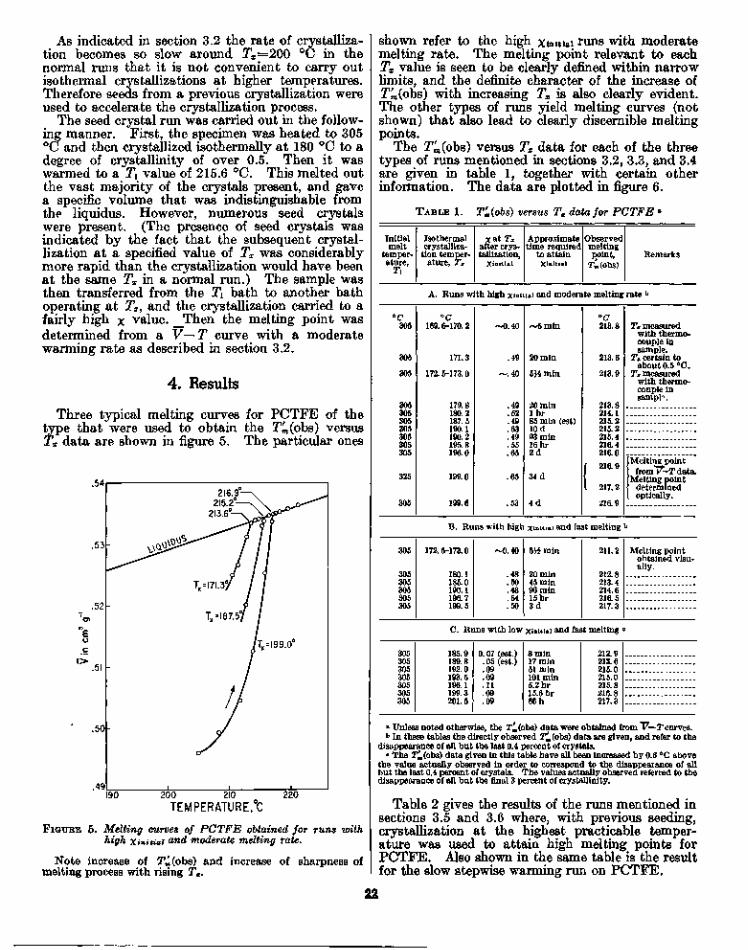
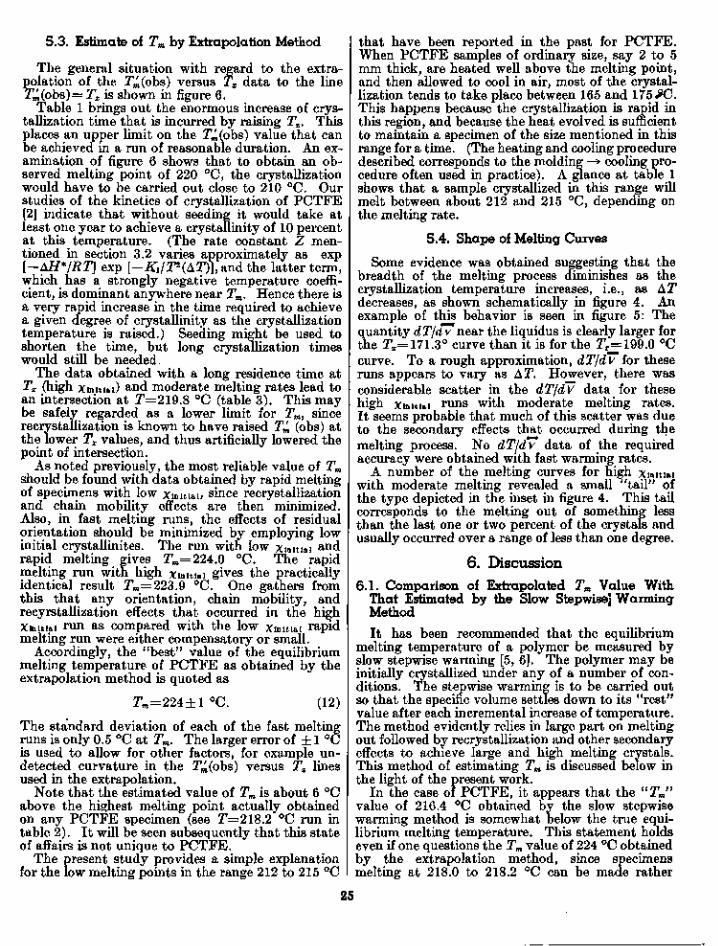
Three typical melting curves for PCTFE of thetype that were used to obtain the T^(obs) versusTx data are shown in figure 5. The particular ones
.49200 210
TEMPERATURE,°C220
FIGUKE 5. Melting curves of PCTFE obtained for runs withhigh Xinitiai and moderate melting rate.
Note increase of TU(obs) and increase of sharpness ofmelting process with rising Tx.
shown refer to the high xinniai runs with moderatemelting rate. The melting point relevant to eachTx value is seen to be clearly defined within narrowlimits, and the definite character of the increase ofT^(obs) with increasing Tx is also clearly evident.The other types of runs yield melting curves (notshown) that also lead to clearly discernible meltingpoints.
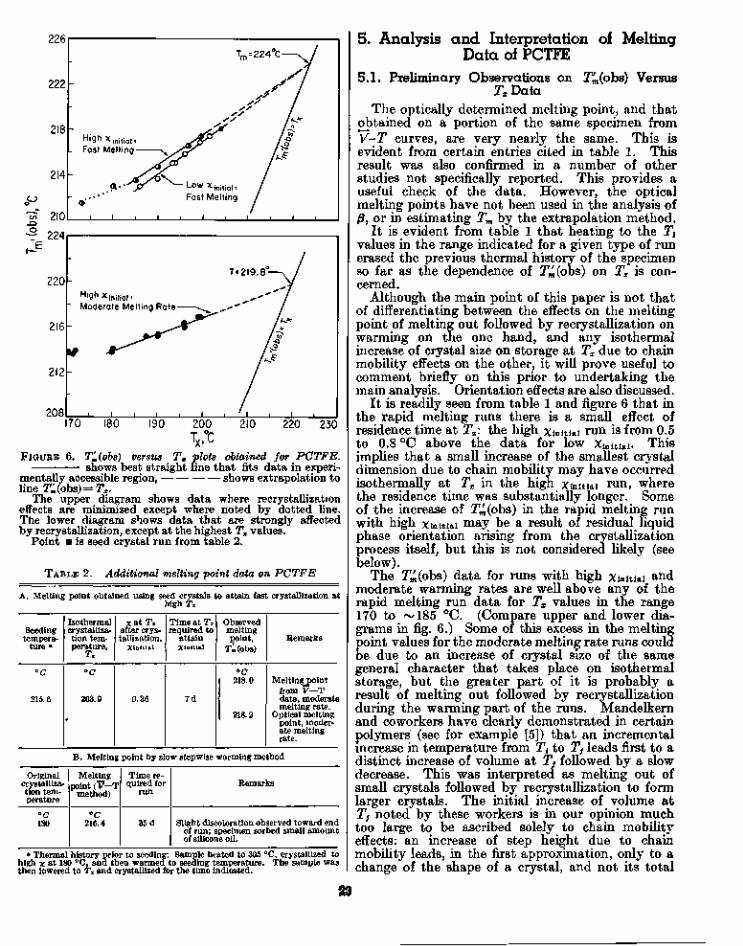
The T^(obs) versus Tx data for each of the threetypes of runs mentioned in sections 3.2, 3.3, and 3.4are given in table 1, together with certain otherinformation. The data are plotted in figure 6.
TABLE 1. T'm(obs) versus Tx data for PCTFE a
Initialmelt
temper-ature,
T
Isothermalcrystalliza-
tion temper-ature, Tx
xat Txafter crys-tallization,
Xinitiai
Approximatetime required
to attainXinitiai
Observedmeltingpoint,
Tm(ohs)Remarks
°c305
305
305
305305305305305305305
325
305
A. Runs with high ximt
°C169. 6-170. 2
171.3
172. 5-173.0
179.8180.2187. 5190.1190.2195.8196.0
199.0
199.6
~0.40
.49
- . 4 0
.49
.52
.49
.63
.49
.55
.65
.65
.53
iai and moderate melting rate b
~5 min
20min
5 ^ min
20 min1 hr85 min (est)10 d93 min16 hr2 d
34 d
4 d
°C213.8
213.6
213.9
213.8214.1215.2215.2215.4216.4216.0
f 9 1 R Q
I 217.2
216.9
Tx measuredwith thermo-couple insample.
Tx certain toabout 0.5 °C.
Tx measuredwith thermo-couple insampK
Melting pointfrom V—Tdata.
Melting pointdeterminedoptically.
B. Runs with high xinitiai and fast melting b
305
305305305305305
172. 5-173.0
180.1185.0190.1196.7199.5
~0.40
.48
.50
.48
.54
.50
bl/2 min
20 min45 min96 min15 hr3 d
211.2
212.8213.4214.6216.5217.3
Melting pointobtained visu-ally.
C. Runs with low xinitiai and fast melting c
305305305305305305305
185.9189.8192.9193.5196.1199.3201.5
0.07 (est.). 05 (est.).09.09.11.09.09
8 min17 min51 min101 min5.2 hr15.6 hr66 h
212.9213.6215.0215.0215.8216.8217.3
a Unless noted otherwise, the T^(obs) data were obtained from V—Tcurves.b In these tables the directly observed T^(obs) data are given, and refer to the
disappearance of all but the last 0.4 percent of crystals.o The T^(obs) data given in this table have all been increased by 0.6 °C above
the value actually observed in order to correspond to the disappearance of allbut the last 0.4 percent of crystals. The values actually observed referred to thedisappearance of all but the final 3 percent of crystallinity.
Table 2 gives the results of the runs mentioned insections 3.5 and 3.6 where, with previous seeding,crystallization at the highest practicable temper-ature was used to attain high melting points forPCTFE. Also shown in the same table is the resultfor the slow step wise warming run on PCTFE.
22
-QO
ceo
222
218
214
?IO
_
-
High_ Fast
xinitial»Melting
i i i
Tm = 22
/?
— Low initial* 1Fast Melting /
/
/
1. i
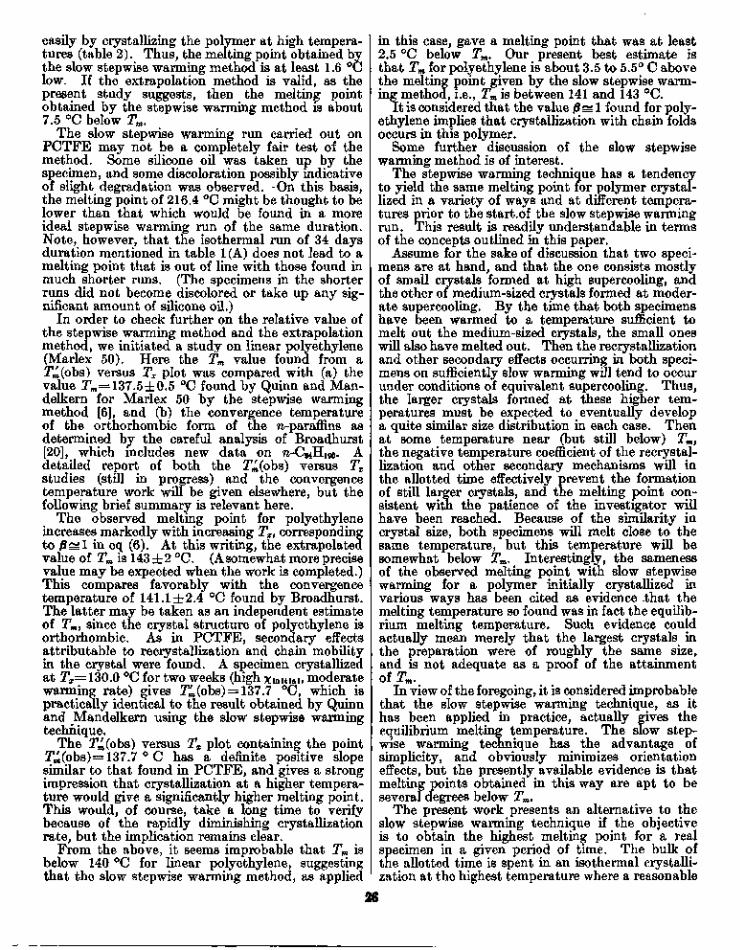
FIGURE 6.
200 210 220 230TX,°C
Ti{obs) versus Tx plots obtained for PCTFE,shows best straight line that fits data in experi-
mentally accessible region, shows extrapolation toline T^(obs) = Tx.
The upper diagram shows data where recrystallizationeffects are minimized except where noted by dotted line.The lower diagram shows data that are strongly affectedby recrystallization, except at the highest Tx values.
Point • is seed crystal run from table 2.
TABLE 2. Additional melting point data on PCTFE
A. Melting point obtained using seed crystals to attain fast crystallization athigh Tx
Seedingtempera-
ture a
°C
215.6
Isothermalcrystalliza-tion tem-perature,
Tx
°c
203.9
*
xat Txafter crys-tallization,
Xinitial
0.36
Time at Txrequired to
attainXinitial
7d
Observedmeltingpoint,
ri(obs)
°C218.0
218.2
Eemarks
Melting pointfrom V—Tdata, moderatemelting rate.
Optical meltingpoint, moder-ate meltingrate.
B. Melting point by slow step wise warming method
Originalcrystalliza-tion tem-perature
°C180
Meltingpoint (V— T
method)
°C216.4
Time re-quired for
run
35 d
Kemarks
Slight discoloration observed toward endof run; specimen sorbed small amountof silicone oil.
a Thermal history prior to seeding: Sample heated to 305 °C, crystallized tohigh x at 180 °C, and then warmed to seeding temperature. The sample wasthen lowered to Tx and crystallized for the time indicated.
5. Analysis and Interpretation of MeltingData of PCTFE
5.1. Preliminary Observations on T^(obs) VersusTx Data
The optically determined melting point, and thatobtained on a portion of the same specimen fromV-T curves, are very nearly the same. This isevident from certain entries cited in table 1. Thisresult was also confirmed in a number of otherstudies not specifically reported. This provides auseful check of the data. However, the opticalmelting points have not been used in the analysis ofj8, or in estimating Tm by the extrapolation method.
It is evident from table 1 that heating to the T\values in the range indicated for a given type of runerased the previous thermal history of the specimenso far as the dependence of T^(obs) on Tx is con-cerned.
Although the main point of this paper is not thatof differentiating between the effects on the meltingpoint of melting out followed by recrystallization onwarming on the one hand, and any isothermalincrease of crystal size on storage at Tx due to chainmobility effects on the other, it will prove useful tocomment briefly on this prior to undertaking themain analysis. Orientation effects are also discussed.
It is readily seen from table 1 and figure 6 that inthe rapid melting runs there is a small effect ofresidence time at Tx: the high xinitial run is from 0.5to 0.8 °C above the data for low Xlnltlal. Thisimplies that a small increase of the smallest crystaldimension due to chain mobility may have occurredisothermally at Tx in the high xinitial run, wherethe residence time was substantially longer. Someof the increase of T^(obs) in the rapid melting runwith high xmitiai Hiay be a result of residual liquidphase orientation arising from the crystallizationprocess itself, but this is not considered likely (seebelow).
The T^(obs) data for runs with high Ximtiai andmoderate warming rates are well above any of therapid melting run data for Tx values in the range170 to ~185 °C. (Compare upper and lower dia-grams in fig. 6.) Some of this excess in the meltingpoint values for the moderate melting rate runs couldbe due to an increase of crystal size of the samegeneral character that takes place on isothermalstorage, but the greater part of it is probably aresult of melting out followed by recrystallizationduring the warming part of the runs. Mandelkernand coworkers have clearly demonstrated in certainpolymers (see for example [5]) that an incrementalincrease in temperature from Tt to Tj leads first to adistinct increase of volume at Tj followed by a slowdecrease. This was interpreted as melting out ofsmall crystals followed by recrystallization to formlarger crystals. The initial increase of volume atTj noted by these workers is in our opinion muchtoo large to be ascribed solely to chain mobilityeffects: an increase of step height due to chainmobility leads, in the first approximation, only to achange of the shape of a crystal, and not its total
volume. Similar volume changes were noted inPCTFE in specimens warmed rapidly from roomtemperature to a fixed temperature fairly near themelting point, showing that melting out of smallcrystals followed by recrystallization can in factoccur in this polymer.
Near and above 7^=198 °C, all three types of rungive very similar melting points, showing a generallack of sensitivity to heating rate and residence time.Even the seed crystal run in table 2 is consistent inthis respect. Our general conclusion from the aboveis that, for Tx values above 198 °C, the T^(obs) dataas obtained are essentially free of significant recrys-tallization and chain mobility effects.
Between a Tx of 185 and 198 °C, each rapid meltingrun is evidently a simple linear continuation of theT^(obs) versus Tx points above 198 °C, where thedata are evidently mostly free of secondary effectsas noted above. Accordingly, we conclude that themelting points obtained with fast melting from7^= 185 °C up to the highest Tx values employedare most representative of the original crystallizationmechanism.
When considered as a whole, the present evidencefor PCTFE indicates that melting out followed byrecrystallization is a substantially more importantcause of an increase of step height (and hence T^(obs))after the lamella is originally formed than the chainmobility effect. In accord with the expectations citedin section 2.1, all the secondary effects are minimizedat high temperatures for a wide range of storagetimes and warming rates. The fact that recrystalli-zation is minimized at lower temperatures by rapidmelting is also in accord with expectation.
Finally, we must concern ourselves with the possi-bility that abnormal liquid orientation effects haveartificially raised the T^(obs) values. First we indi-cate that the specimens exhibited no marked bire-fringence after melting out at 2^(obs). It wasconcluded from this that there was never any seriousdegree of orientation in the specimens on a macro-scopic scale. Any liquid orientation would have tobe on a local scale, presumably induced by the crys-tallization process. From the standpoint of T^(obs)versus Tx data, one would expect orientationof this type to manifest itself in the following way:under equivalent conditions of initial crystallinityand crystallization temperature, a fast melting runshould give a higher T^(obs) than a slow run becauseof the greater opportunity for randomization oforientation in the slow run. Just the reverse occursin PCTFE.
5.2. Determination of (3
The T^(obs) versus Tx plots used to determineft are shown in figure 6.
A least-squares fit of the data in the straight lineregion yields the following equations where thetemperature is in °C:
(9)(180.2 to 199.6 °C for high x
moderate melting rate)
(10)
(185.0 to 199.5 °C for high XimtJai, f a s t melting)
TrJ£(obs) = 157.89° + 0.29522; (11)
(185.9 to 201.5 °C low ximtiai, fast melting).
TABLE 3. Estimates
Run
of Tm byof 0 for
Low xinitiai, fast melting
High xinitiai, fast melting
High xinitiai, moderate melt-ing rate
1.69
1.85
(3.36)
extrapolation method and valuesPCTFE
Temperature at intersection of extra-polated Tm(obs) versus Tx line andline Tm(obs) = T*
°C224.0
223.9
(219.8)
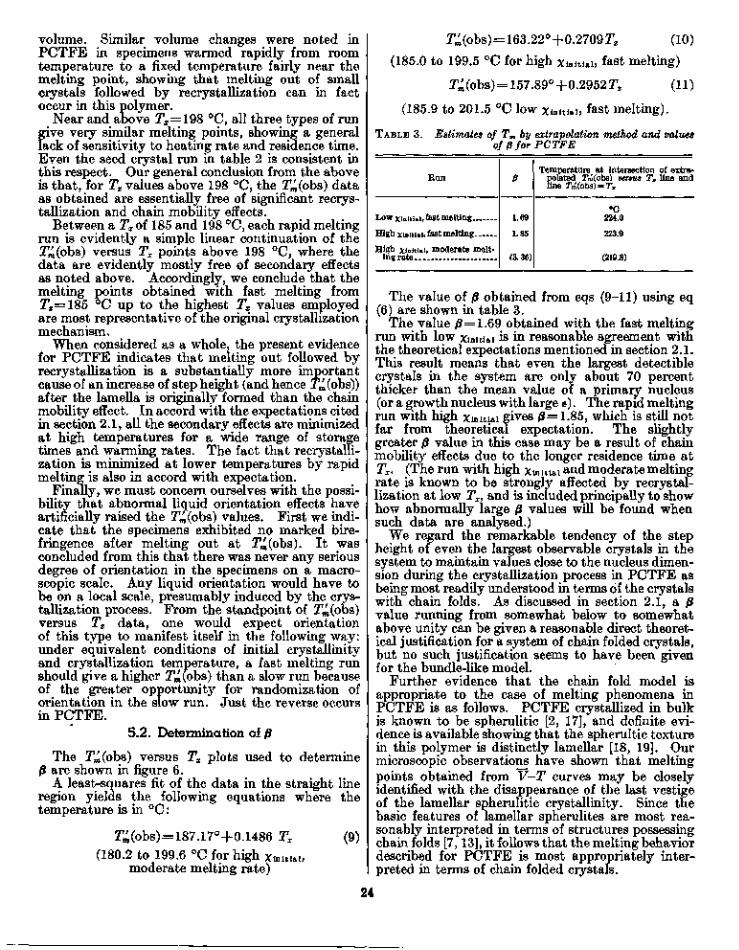
The value of ($ obtained from eqs (9-11) using eq(6) are shown in table 3.
The value 0=1.69 obtained with the fast meltingrun with low Xinitiai is in reasonable agreement withthe theoretical expectations mentioned in section 2.1.This result means that even the largest detectiblecrystals in the system are only about 70 percentthicker than the mean value of a primary nucleus(or a growth nucleus with large e). The rapid meltingrun with high Xinitiai gives 0=1.85, which is still notfar from theoretical expectation. The slightlygreater (3 value in this case may be a result of chainmobility effects due to the longer residence time atTx. (The run with high xmitiai and moderate meltingrate is known to be strongly affected by recrystal-lization at low Tx, and is included principally to showhow abnormally large fi values will be found whensuch data are analysed.)
We regard the remarkable tendency of the stepheight of even the largest observable crystals in thesystem to maintain values close to the nucleus dimen-sion during the crystallization process in PCTFE asbeing most readily understood in terms of the crystalswith chain folds. As discussed in section 2.1, a 0value running from somewhat below to somewhatabove unity can be given a reasonable direct theoret-ical justification for a system of chain folded crystals,but no such justification seems to have been givenfor the bundle-like model.
Further evidence that the chain fold model isappropriate to the case of melting phenomena inPCTFE is as follows. PCTFE crystallized in bulkis known to be spherulitic [2, 17], and definite evi-dence is available showing that the spherultic texturein this polymer is distinctly lamellar [18, 19]. Ourmicroscopic observations have shown that meltingpoints obtained from V-T curves may be closelyidentified with the disappearance of the last vestigeof the lamellar spherulitic crystallinity. Since thebasic features of lamellar spherulites are most rea-sonably interpreted in terms of structures possessingchain folds [7,13], it follows that the melting behaviordescribed for PCTFE is most appropriately inter-preted in terms of chain folded crystals.
24
5.3. Estimate of Tm by Extrapolation Method
The general situation with regard to the extra-polation of the J^(obs) versus Tx data to the lineTn(obs)=Tx is shown in figure 6.
Table 1 brings out the enormous increase of crys-tallization time that is incurred by raising Tx. Thisplaces an upper limit on the T^(obs) value that canbe achieved in a run of reasonable duration. An ex-amination of figure 6 shows that to obtain an ob-served melting point of 220 °C, the crystallizationwould have to be carried out close to 210 °C. Ourstudies of the kinetics of crystallization of PCTFE[2] indicate that without seeding it would take atleast one year to achieve a crystallinity of 10 percentat this temperature. (The rate constant Z men-tioned in section 3.2 varies approximately as exp[—AH*/RT] exp [—KJT^AT)], and the latter term,which has a strongly negative temperature coeffi-cient, is dominant anywhere near Tm. Hence there isa very rapid increase in the time required to achievea given degree of crystallinity as the crystallizationtemperature is raised.) Seeding might be used toshorten the time, but long crystallization timeswould still be needed.
The data obtained with a long residence time atTx (high xmttiai) and moderate melting rates lead toan intersection at T=219.8 °C (table 3). This maybe safely regarded as a lower limit for Tm, sincerecrystallization is known to have raised T^ (obs) atthe lower Tx values, and thus artificially lowered thepoint of intersection.
As noted previously, the most reliable value of Tmshould be found with data obtained by rapid meltingof specimens with low xmitiab since recrystallizationand chain mobility effects are then minimized.Also, in fast melting runs, the effects of residualorientation should be minimized by employing lowinitial crystallinites. The run with low Xmitiai andrapid melting gives rm==224.0 °C. The rapidmelting run with high xinitial gives the practicallyidentical result Tm=223.9 °C. One gathers fromthis that any orientation, chain mobility, andrecyrstallization effects that occurred in the highXmitiai run as compared with the low xmitiai rapidmelting run were either compensatory or small.
Accordingly, the "best" value of the equilibriummelting temperature of PCTFE as obtained by theextrapolation method is quoted as
The standard deviation of each of the fast meltingruns is only 0.5 °C at Tm. The larger error of ± 1 °Cis used to allow for other factors, for example un-detected curvature in the 2^(obs) versus Tx linesused in the extrapolation.
Note that the estimated value of Tm is about 6 °Cabove the highest melting point actually obtainedon any PCTFE specimen (see T=218.2 °C run intable 2). It will be seen subsequently that this stateof affairs is not unique to PCTFE.
The present study provides a simple explanationfor the low melting points in the range 212 to 215 °C
that have been reported in the past for PCTFE.When PCTFE samples of ordinary size, say 2 to 5mm thick, are heated well above the melting point,and then allowed to cool in air, most of the crystal-lization tends to take place between 165 and 175 PC.This happens because the crystallization is rapid inthis region, and because the heat evolved is sufficientto maintain a specimen of the size mentioned in thisrange for a time. (The heating and cooling proceduredescribed corresponds to the molding —> cooling pro-cedure often used in practice). A glance at table 1shows that a sample crystallized in this range willmelt between about 212 and 215 °C, depending onthe melting rate.
5.4. Shape of Melting Curves
Some evidence was obtained suggesting that thebreadth of the melting process diminishes as thecrystallization temperature increases, i.e., as ATdecreases, as shown schematically in figure 4. Anexample of this behavior is seen in figure 5: Thequantity dT/d v near the liquidus is clearly larger forthe Tx= 171.3° curve than it is for the Tx= 199.0 °Ccurve. To a rough approximation, dT/dV for theseruns appears to vary as AT. However, there wasconsiderable scatter in the dT/dV data for thesehigh xmitiai runs with moderate melting rates.It seems probable that much of this scatter was dueto the secondary effects that occurred during themelting process. No dT/dv data of the requiredaccuracy were obtained with fast warming rates.
A number of the melting curves for high xinitialwith moderate melting revealed a small "tail" ofthe type depicted in the inset in figure 4. This tailcorresponds to the melting out of something lessthan the last one or two percent of the crystals andusually occurred over a range of less than one degree.
6. Discussion6.1. Comparison of Extrapolated Tm Value With
That Estimated by the Slow StepwiseJ WarmingMethod
It has been recommended that the equilibriummelting temperature of a polymer be measured byslow stepwise warming [5, 6]. The polymer may beinitially crystallized under any of a number of con-ditions. The stepwise warming is to be carried outso that the specific volume settles down to its "rest"value after each incremental increase of temperature.The method evidently relies in large part on meltingout followed by recrystallization and other secondaryeffects to achieve large and high melting crystals.This method of estimating Tm is discussed below inthe light of the present work.
In the case of PCTFE, it appears that the "TJ'value of 216.4 °C obtained by the slow stepwisewarming method is somewhat below the true equi-librium melting temperature. This statement holdseven if one questions the Tm value of 224 °C obtainedby the extrapolation method, since specimensmelting at 218.0 to 218.2 °C can be made rather
25
easily by crystallizing the polymer at high tempera-tures (table 2). Thus, the melting point obtained bythe slow stepwise warming method is at least 1.6 °Clow. If the extrapolation method is valid, as thepresent study suggests, then the melting pointobtained by the stepwise warming method is about7.5 °C below Tm.
The slow stepwise warming run carried out onPCTFE may not be a completely fair test of themethod. Some silicone oil was taken up by thespecimen, and some discoloration possibly indicativeof slight degradation was observed. -On this basis,the melting point of 216.4 °C might be thought to belower than that which would be found in a moreideal stepwise warming run of the same duration.Note, however, that the isothermal run of 34 daysduration mentioned in table 1 (A) does not lead to amelting point that is out of line with those found inmuch shorter runs. (The specimens in the shorterruns did not become discolored or take up any sig-nificant amount of silicone oil.)
In order to check further on the relative value ofthe stepwise warming method and the extrapolationmethod, we initiated a study on linear polyethylene(Marlex 50). Here the tm value found from al^(obs) versus Tx plot was compared with (a) thevalue Tm=137.5±0.5 °C found by Quinn and Man-delkern for Marlex 50 by the stepwise warmingmethod [6], and (b) the convergence temperatureof the orthorhombic form of the ^-paraffins asdetermined by the careful analysis of Broadhurst[20], which includes new data on n-C9JIm. Adetailed report of both the 2^(obs) versus Txstudies (still in progress) and the convergencetemperature work will be given elsewhere, but thefollowing brief summary is relevant here.
The observed melting point for polyethyleneincreases markedly with increasing Tx, correspondingto fi^l in eq (6). At this writing, the extrapolatedvalue of Tm is 143 ±2 °C. (Asomewhat more precisevalue may be expected when the work is completed.)This compares favorably with the convergencetemperature of 141.1 ±2.4 °C found by Broadhurst.The latter may be taken as an independent estimateof Tm, since the crystal structure of polyethylene isorthorhombic. As in PCTFE, secondary effectsattributable to recrystallization and chain mobilityin the crystal were found. A specimen crystallizedat Tx= 130.0 °C for two weeks (high xmitiai» moderatewarming rate) gives T^(obs) = 137.7 °C, which ispractically identical to the result obtained by Quinnand Mandelkern using the slow stepwise warmingtechnique.
The T^(obs) versus Tx plot containing the pointT^(obs) = 137.7 ° C has a definite positive slopesimilar to that found in PCTFE, and gives a strongimpression that crystallization at a higher tempera-ture would give a significantly higher melting point.This would, of course, take a long time to verifybecause of the rapidly diminishing crystallizationrate, but the implication remains clear.
From the above, it seems improbable that T^ isbelow 140 °C for linear polyethylene, suggestingthat the slow stepwise warming method, as applied
in this case, gave a melting point that was at least2.5 °C below Tm. Our present best estimate isthat Tm for polyethylene is about 3.5 to 5.5° C abovethe melting point given by the slow stepwise warm-ing method, i.e., Tm is between 141 and 143 °C.
It is considered that the value 0 ^ 1 found for poly-ethylene implies that crystallization with chain foldsoccurs in this polymer.
Some further discussion of the slow stepwisewarming method is of interest.
The stepwise warming technique has a tendencyto yield the same melting point for polymer crystal-lized in a variety of ways and at different tempera-tures prior to the start.of the slow stepwise warmingrun. This result is readily understandable in termsof the concepts outlined in this paper.
Assume for the sake of discussion that two speci-mens are at hand, and that the one consists mostlyof small crystals formed at high supercooling, andthe other of medium-sized crystals formed at moder-ate supercooling. By the time that both specimenshave been warmed to a temperature sufficient tomelt out the medium-sized crystals, the small oneswill also have melted out. Then the recrystallizationand other secondary effects occurring in both speci-mens on sufficiently slow warming will tend to occurunder conditions of equivalent supercooling. Thus,the larger crystals formed at these higher tem-peratures must be expected to eventually developa quite similar size distribution in each case. Thenat some temperature near (but still below) Tmjthe negative temperature coefficient of the recrystal-lization and other secondary mechanisms will inthe allotted time effectively prevent the formationof still larger crystals, and the melting point con-sistent with the patience of the investigator willhave been reached. Because of the similarity incrystal size, both specimens will melt close to thesame temperature, but this temperature will besomewhat below Tm. Interestingly, the samenessof the observed melting point with slow stepwisewarming for a polymer initially crystallized invarious ways has been cited as evidence that themelting temperature so found was in fact the equilib-rium melting temperature. Such evidence couldactually mean merely that the largest crystals inthe preparation were of roughly the same size,and is not adequate as a proof of the attainmentoiTm.
In view of the foregoing, it is considered improbablethat the slow stepwise warming technique, as ithas been applied in practice, actually gives theequilibrium melting temperature. The slow step-wise warming technique has the advantage ofsimplicity, and obviously minimizes orientationeffects, but the presently available evidence is thatmelting points obtained in this way are apt to beseveral degrees below Tm.
The present work presents an alternative to theslow stepwise warming technique if the objectiveis to obtain the highest melting point for a realspecimen in a given period of time. The bulk ofthe allotted time is spent in an isothermal crystalli-zation at the highest temperature where a reasonable
26
amount of crystallization will develop. Then thespecimen is warmed and the melting point deter-mined. The latter step would most wisely becarried out on several specimens for a series ofmoderate and fairly slow warming rates. Seedingmay be used to achieve an increased rate of crystalli-zation at high Tx values if feasible. This generalprocedure forms large crystals in the specimen inthe beginning, and does not rely largely on secondarymechanisms to achieve the same end. The presentevidence suggests that this method is at least asefficient in producing a high melting point in aspecimen in a given period of time as the slowstepwise warming technique. It should be under-stood that Tm cannot actually be attained by eithermethod in a real specimen because of the extremeslowness of both crystallization and recrystallizationnear Tm, and the tendency of the step height of achain folded crystal to maintain itself (see section6.3).
The extrapolation method of estimating Tmproposed in this paper is not without its pitfalls.In order to avoid recrystallization and other second-ary effects, it is desirable to use fairly rapid meltingrates. However, the use of such melting ratesmay fail to allow residual orientation effects in theliquid to disipate, and thus increase the observedmelting points somewhat. In the case of PCTFEthis effect is evidently small enough so that it isnot unambiguously identifiable. It is believedthat residual orientation would in any case besubdued by dealing with samples of low crystallinity.The evidence is that the extrapolation method, asapplied using low Xmitiai and fairly rapid melting, isaccurate in the case of polyethylene, and it is like-wise believed correct within the stated limits oferror for PCTFE. Nevertheless, investigations withother polymers should not for the time being beconfined merely to runs with low XlnitIai and rapidmelting, since unusually large secondary or orien-tation effects may appear in some instances. Theproposed extrapolation method has the distinctadvantage of being associated with a simple theorywhose main points (such as a linear increase ofJ^(obs) with increasing Tx) can be verified in theregion where the kinetics of crystallization allowdata to be obtained. The method also providesadditional information of interest, for instancethat concerning /?.
6.2. Crystal Size Versus Volume Imperfections asPrincipal Cause of T^(obs) Falling Below Tm
The treatment in this paper deals with the loweringof the melting point of a polymer that is caused by arestriction of one crystal dimension, 1, to a small size.This restriction is incurred in the original isothermalcrystallization. Thus, crystal size rather thanvolume imperfections have been taken as the mainsource of the fact that T^(obs) falls well below Tm.We must now raise the question concerning whetherthis point of view is reasonable in PCTFE.
Geil has found from electron micrographs that thelamellae in an air-cooled specimen of PCTFE are
approximately 250 A thick [19]. As noted earlier,a specimen that is air-cooled tends to crystallize ataround 175 °C, corresponding to AT^50 °C. Thiswork may be taken as proving the existence of verythin crystals in PCTFE of the general type thatmust be expected to have a melting point manydegrees below Tm.
A simple calculation using eq (3) may be used tolend credence to this statement. For PCTFE, wehave 7^=497.2 °K, A^=9.1X10⁸ erg cm"3 [21];further, 1^250 A=2.5X10~6 cm for polymer that isair cooled. The quantity ae in eq (3) must be esti-mated. Recent theoretical studies suggest that thelower range of ae for chain folded crystals will be25-50 erg cm"2 [7]. (A value in this range is alsoconsistent with the surface free energy parametersobtained from studies of the radial growth rate ofPCTFE spherulites [2].) Using ae=40 erg cm"2
in eq (3), it is found that the melting point of thecrystal of average thickness will be about 17.5 °Cbelow Tm. Considering the fact that the observedmelting point refers to the largest crystals in thesystem, we would estimate with 0=1.7 that thedepression should be about 10 °C, corresponding to2^(obs)=214 °C. This is close to what is observedfor air-cooled specimens (section 5.3).
The foregoing calculation is tendered as a partialjustification for analysing the present experimentsin terms of crystal size effects, rather than ascribingthe observed depressions incurred by low crystal-lization temperatures mainly to volume imperfec-tions. The latter may exist in excess concentration,and play some role in lowering the observed melt-ing point, but it is very doubtful that this role is themajor one. No crystal is "perfect" at its meltingpoint, and a polymer crystal at this temperature mustbe expected to have an equilibrium concentration ofvolume defects, e.g., a certain number of small chainends incorporated in the lattice. However, suchequilibrium defects are not to be considered aslowering the melting point. From our point ofview, the important "imperfections" that influencethe melting behavior of high molecular weightlinear polymers with no stereo chemical irregularitiesare the high energy chain folded surfaces and thethinness of the crystals.
6.3. The Concept of the Equilibrium MeltingTemperature
The present work does not in any way deny theexistence of an equilibrium melting temperature for ahighly crystallizable linear polymer. It does how-ever bring out the reasons why this temperature willbe impossible (or at least exceedingly difficult) toattain in a real polymer specimen. These reasonsare:
(1) One dimension of a polymer crystal, 1, issmall and varies with the crystallization temperatureas 1/(AT) because of the nature of the nucleation-controlled growth mechanism in chain folded systems.
(2) The smallness of this one dimension is suf-ficient to significantly reduce the melting point.
(3) Attempts to produce crystals with a large 1dimension by crystallizing at high temperatures,
27
i.e., small (AT), are rendered difficult and eventuallyimpracticable by the rapidly increasing crystalliza-tion times involved as AT7is diminished. This effectis again due to the nucleation controlled characterof the growth process.
(4) Efforts to increase the 1 dimensions of the chainfolded crystals by recrystallization and other second-ary mechanisms (using either prolonged storage orslow warming) are increasingly inefficient as the melt-ing point is approached. Near the melting point,nucleation effects strongly inhibit recrystallization,and the large lamellar thickness together with theexistence of the folds prevent internal diffusion (chainmobility) from further increasing the step height.
In short, our studies strongly suggest that Tmcould be closely approached (say within 1 or 2 °C)in a real specimen only in an experiment of ex-traordinary duration. In this situation, we haveturned to estimating Tm using a method that essen-tially extrapolates to the temperature appropriate toinfinite 1. Despite its lack of attainability in a realspecimen in an experiment of reasonable duration,Tm is clearly to be regarded as a real property ofthermodynamic significance.
The present work suggests that the true equi-librium melting curve for a linear polymer of veryhigh molecular weight with no stereo chemical irregu-larities would strongly resemble the very sharpfirst-order transition commonly associated withordinary pure molecular crystals. The equilibriummelting curve refers to the melting of an assembly ofcrystals, each haying very large a, b, and 1 dimen-sions. The melting of each such crystal would referto the equilibrium 6- (infinite crystal) = G (liquid)at Tm, where G is the Gibbs free energy. As notedearlier, it is unlikely that such a state will be readilyattained in a real polymer system. However, theincreasing sharpness of the melting process inPCTFE and polyethylene that is observed as higherand higher initial crystallization temperatures areemployed points to the validity of the above con-cept. The melting point of a small polymer crystal
refers to the metastable equilibrium G (small crys-tal) = G (slightly supercooled liquid) at T'm(\),or T4(obs) if the larger crystals in an assembly areconsidered. As long as the time scale is specified, sothat no change of crystal size takes place during themelting experiment, and provided that the slightlysupercooled liquid is in its normal state, jT4(obs) isalso a quantity of thermodynamic significance.There is no fundamental objection to applyingthermodynamics to metastable equilibria.
7. References
[1] J. I. Lauritzen, Jr., and J. D. Hoffman, J. ResearchNBS64A73 (1960).
[2] J. D. Hoffman and J. J. Weeks, manuscript in prepara-tion.
[3] L. A. Wood and N. Bekkedahl, J. Appl. Phys. 17 362(1946).
[4] L. A. Wood and N. Bekkedahl, J. Research NBS 36 489(1946).
[5] D. E. Roberts and L. Mandelkern, J. Am. Chem. Soc.77 781 (1955).
[6] F. A. Quinn, Jr. and L. Mandelkern, J. Am. Chem. Soc.80 3178 (1958).
[7] J. D. Hoffman and J. I. Lauritzen, Jr., J. Research NBS65A 297 (1961).
[8] J. I. Lauritzen, Jr., manuscript in preparation.[9] J. D. Hoffman, J. Chem. Phys. 29 1192 (1958)
[10] F. C. Frank and M. P. Tosi, Proc. Roy. Soc. (London),A263, 323 (1961).
[11] F. P. Price, J. Chem. Phys. 35, 1884 (1961).[12] A. Keller, Phil. Mag. 2 1171 (1957); A. Keller and
A. O'Connor, Discussions, Faraday Soc. 25 114 (1958).13] P. H. Geil, J. Appl. Phys. (in press).14] D. H. Reneker, J. Polymer Sci. (in press).15] L. Mandelkern, Chem'. Revs. 56 903 (1956).16] J. D. Hoffman and J. J. Weeks, J. Research NBS 60 465
(1958).17] F. P. Price, J. Am. Chem. Soc. 74 311 (1952).
..18] E. W. Fischer, Z. Naturforschung, ISA 753 (1957).[19] Private communication, P. H. Geil, Wilmington.[20] M. Broadhurst, National Bureau of Standards, manu-
script in preparation.[21] A. M. Bueche, J. Am. Chem. Soc. 74 65 (1952).
(Paper 66A1-137)
28