Embed Size (px)
Citation preview
Nebraska Care Coordination edication Safety Report - July 2017M
Background Communities across the Great Plains Quality Innovation Network (QIN) region are collaborating to improve care
coordination and medication safety. The Great Plains QIN is the Quality Innovation Network-Quality Improvement
Organization (QIN-QIO) for North Dakota, South Dakota, Nebraska and Kansas. The communities across the Great Plains
QIN are diverse; however, the goals of the communities are the same. The goals are to reduce avoidable hospital
admissions and readmissions, including those caused by high risk medications (HRM) related to adverse drug events
(ADE), improve medication safety and increase the number of nights Medicare beneficiaries stay at home. CIMRO of
Nebraska, as a partner in the Great Plains QIN, is sharing data with the communities in Nebraska.
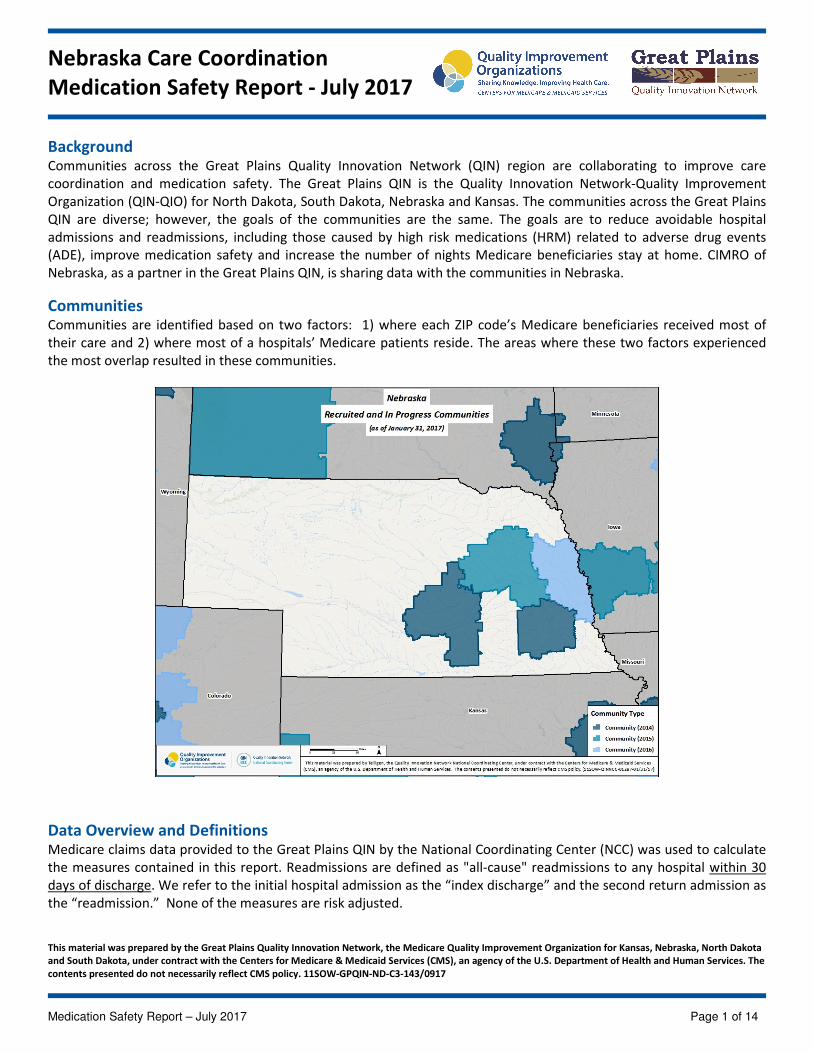
Communities Communities are identified based on two factors: 1) where each ZIP code’s Medicare beneficiaries received most of
their care and 2) where most of a hospitals’ Medicare patients reside. The areas where these two factors experienced
the most overlap resulted in these communities.
Data Overview and Definitions Medicare claims data provided to the Great Plains QIN by the National Coordinating Center (NCC) was used to calculate
the measures contained in this report. Readmissions are defined as "all-cause" readmissions to any hospital within 30
days of discharge. We refer to the initial hospital admission as the “index discharge” and the second return admission as
the “readmission.” None of the measures are risk adjusted.
This material was prepared by the Great Plains Quality Innovation Network, the Medicare Quality Improvement Organization for Kansas, Nebraska, North Dakota
and South Dakota, under contract with the Centers for Medicare & Medicaid Services (CMS), an agency of the U.S. Department of Health and Human Services. The
contents presented do not necessarily reflect CMS policy. 11SOW-GPQIN-ND-C3-143/0917
Medication Safety Report – July 2017 Page 1 of 14
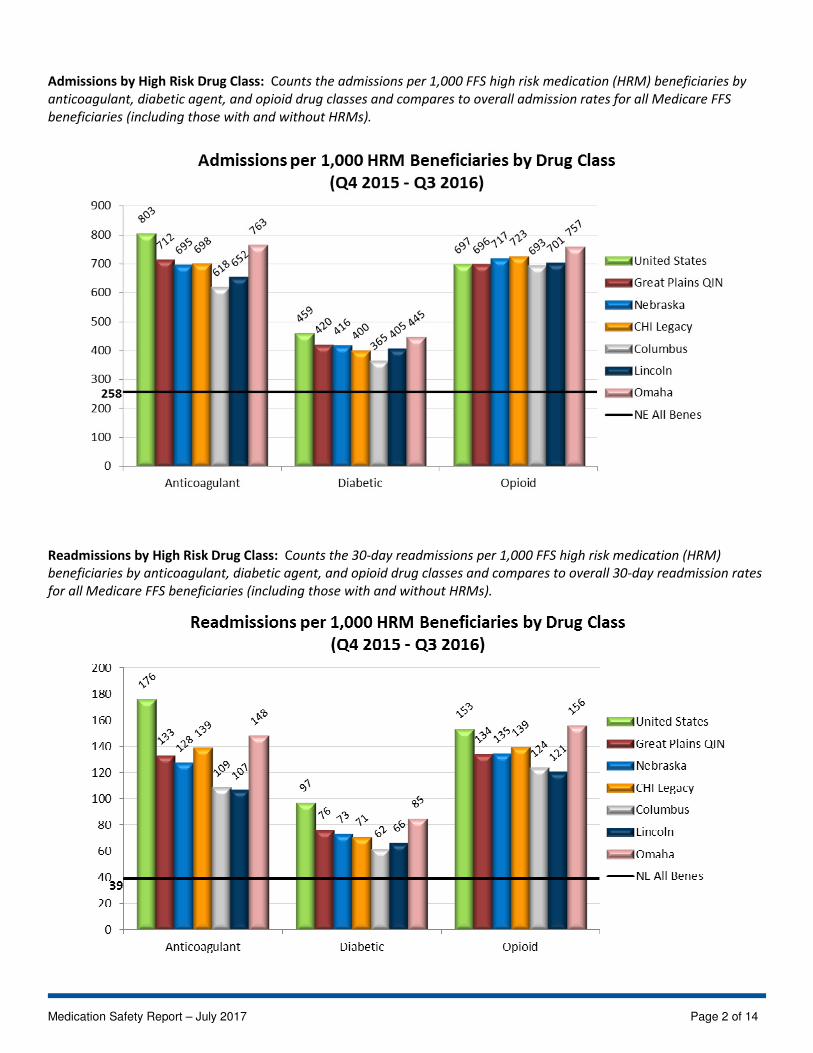
Admissions by High Risk Drug Class: Counts the admissions per 1,000 FFS high risk medication (HRM) beneficiaries by
anticoagulant, diabetic agent, and opioid drug classes and compares to overall admission rates for all Medicare FFS
beneficiaries (including those with and without HRMs).
Readmissions by High Risk Drug Class: Counts the 30-day readmissions per 1,000 FFS high risk medication (HRM)
beneficiaries by anticoagulant, diabetic agent, and opioid drug classes and compares to overall 30-day readmission rates
for all Medicare FFS beneficiaries (including those with and without HRMs).
Medication Safety Report – July 2017 Page 2 of 14
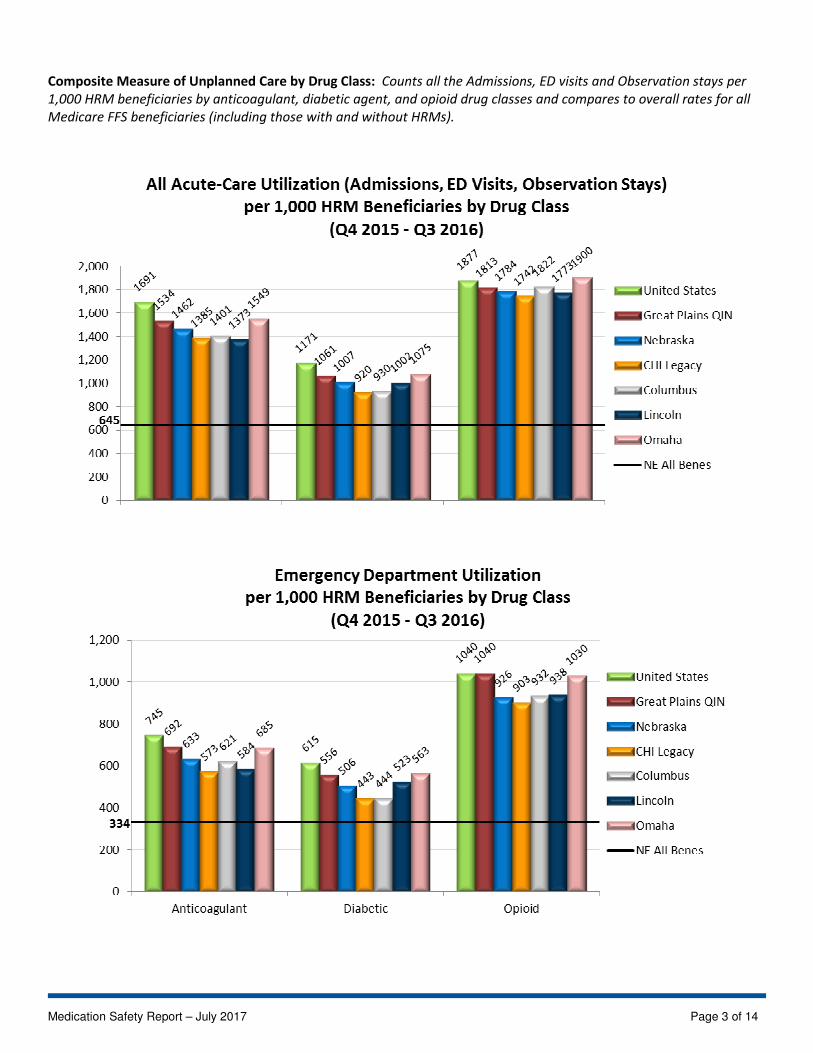
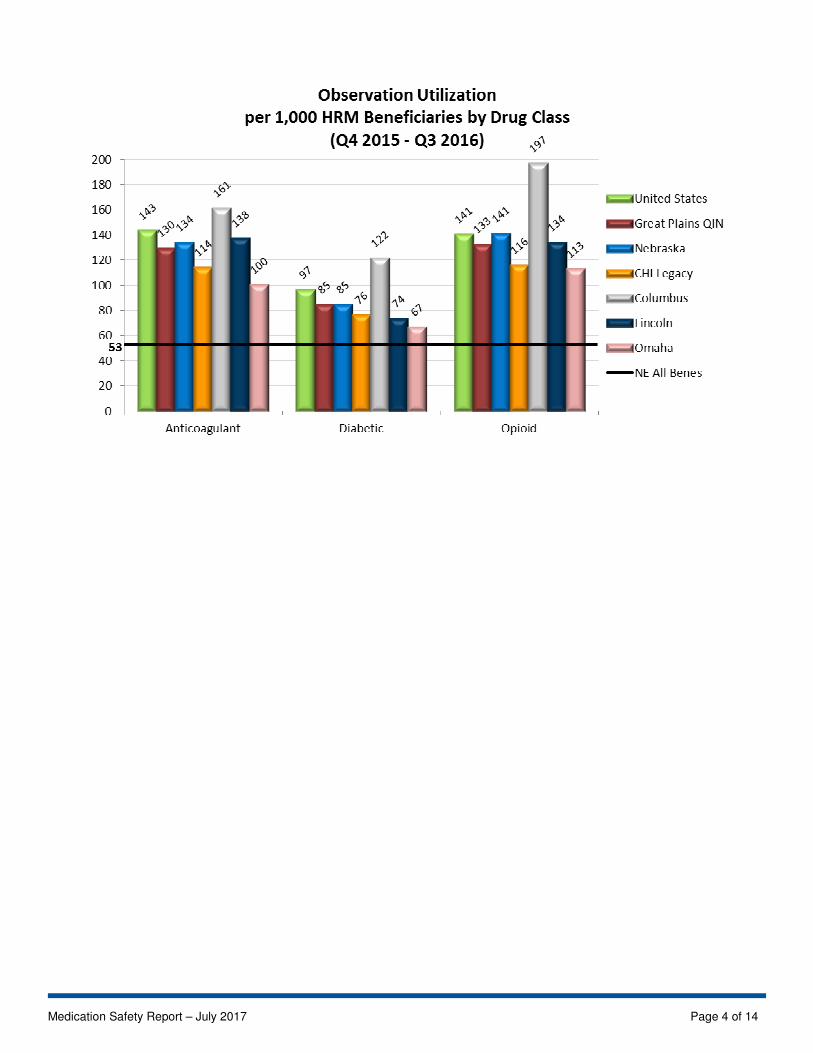
Composite Measure of Unplanned Care by Drug Class: Counts all the Admissions, ED visits and Observation stays per
1,000 HRM beneficiaries by anticoagulant, diabetic agent, and opioid drug classes and compares to overall rates for all
Medicare FFS beneficiaries (including those with and without HRMs).
Medication Safety Report – July 2017 Page 3 of 14
Medication Safety Report – July 2017 Page 4 of 14
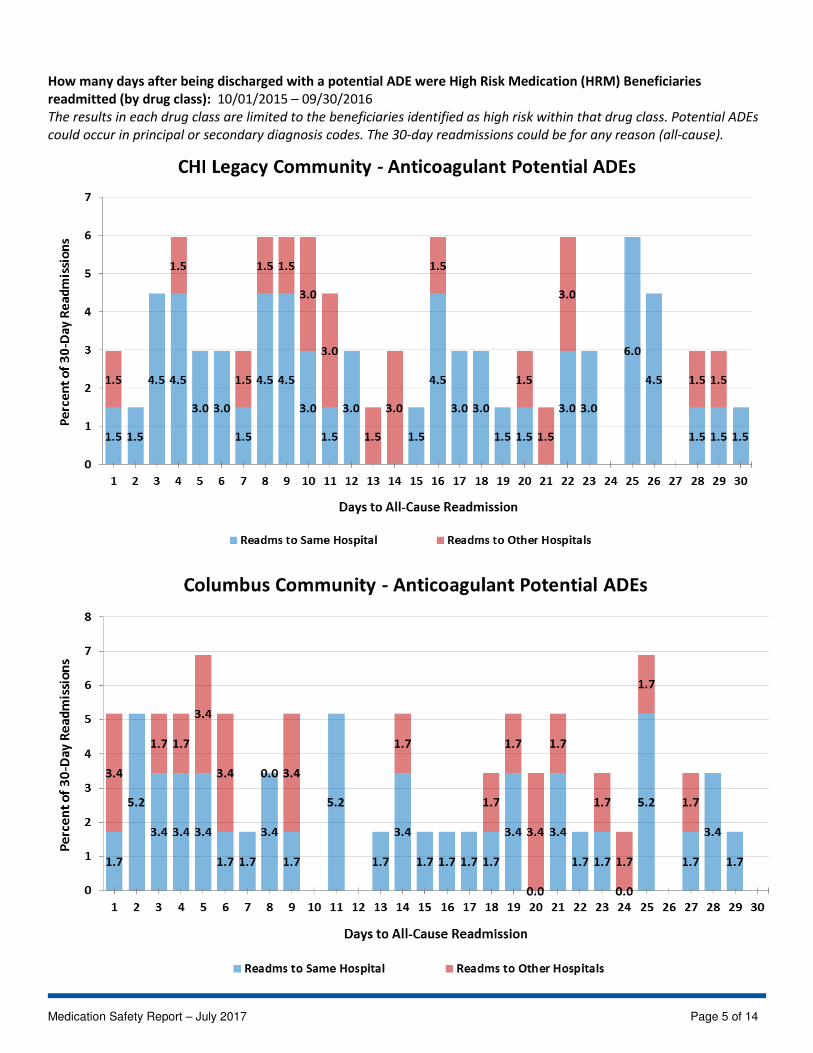
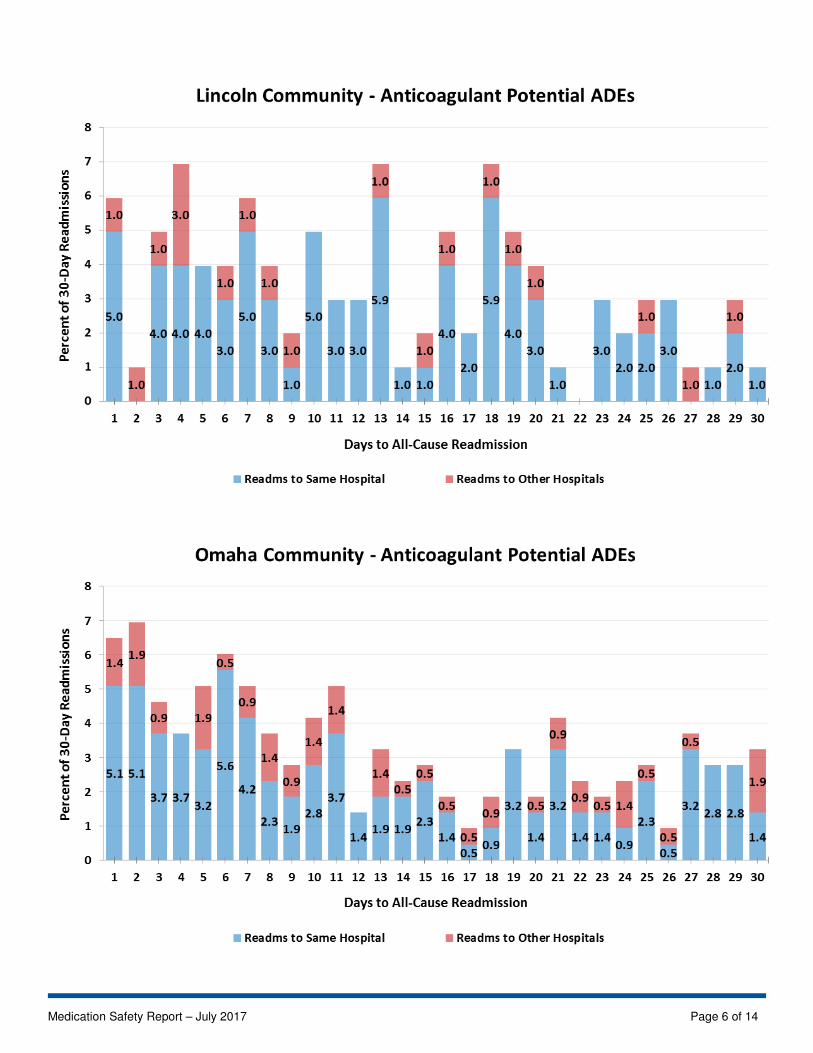
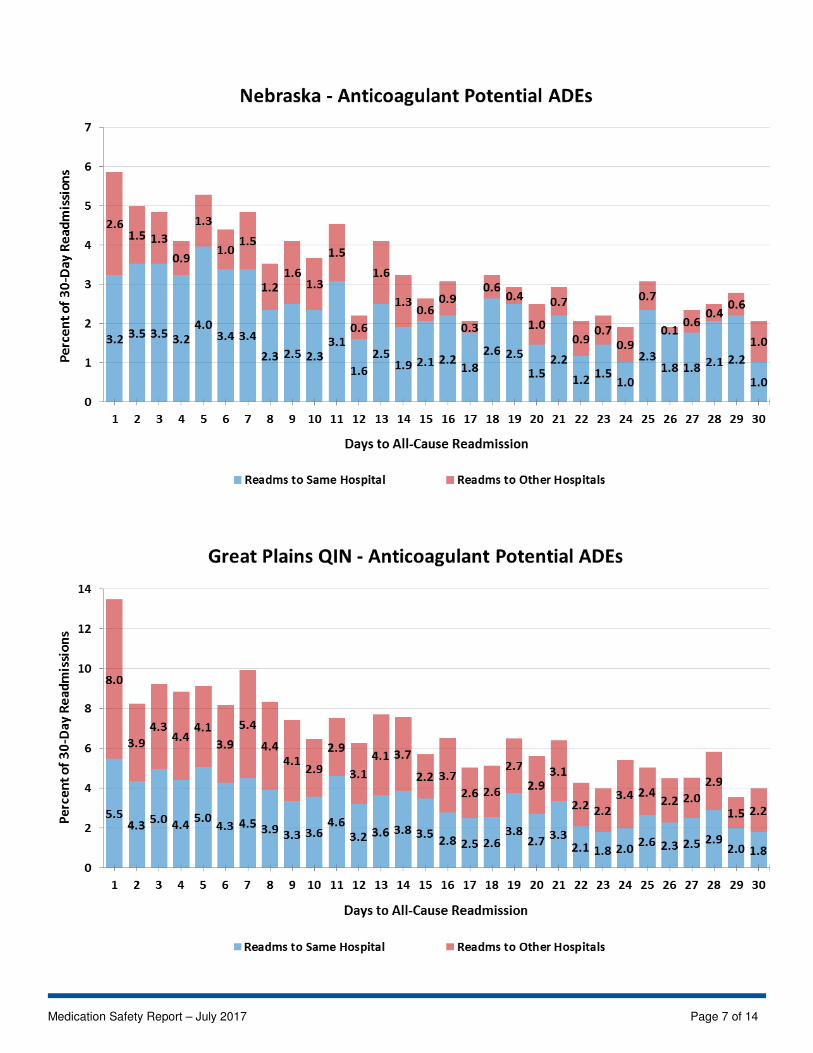
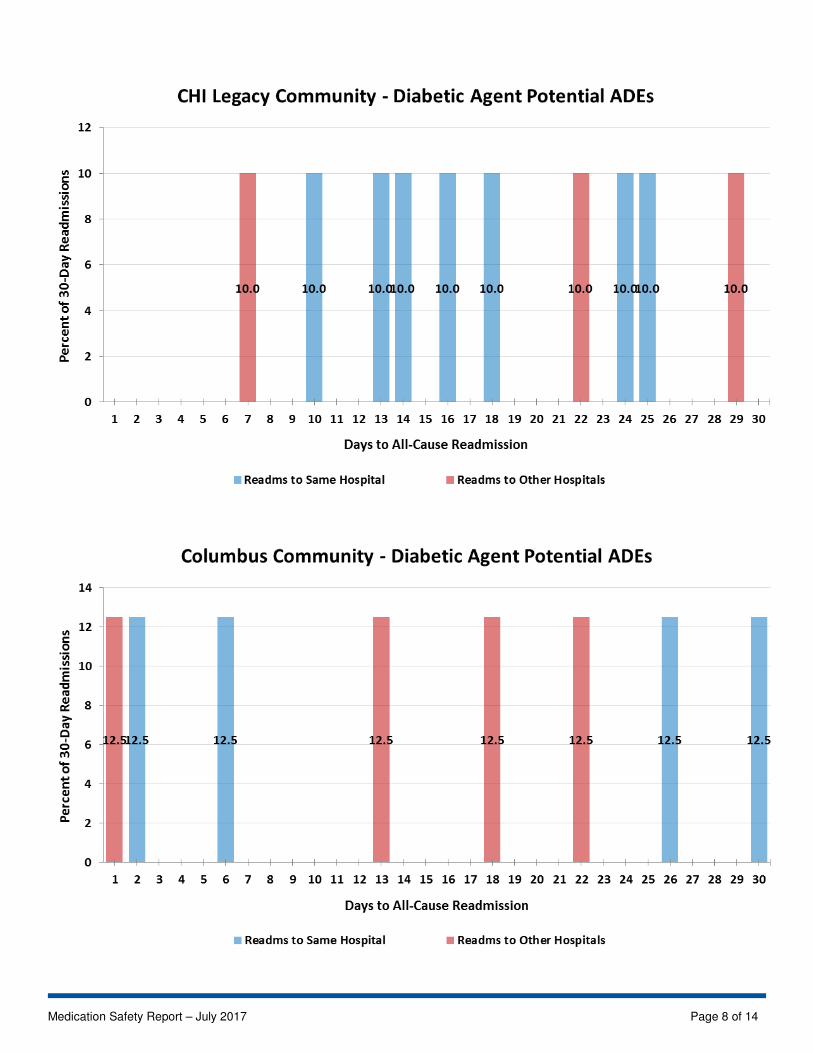
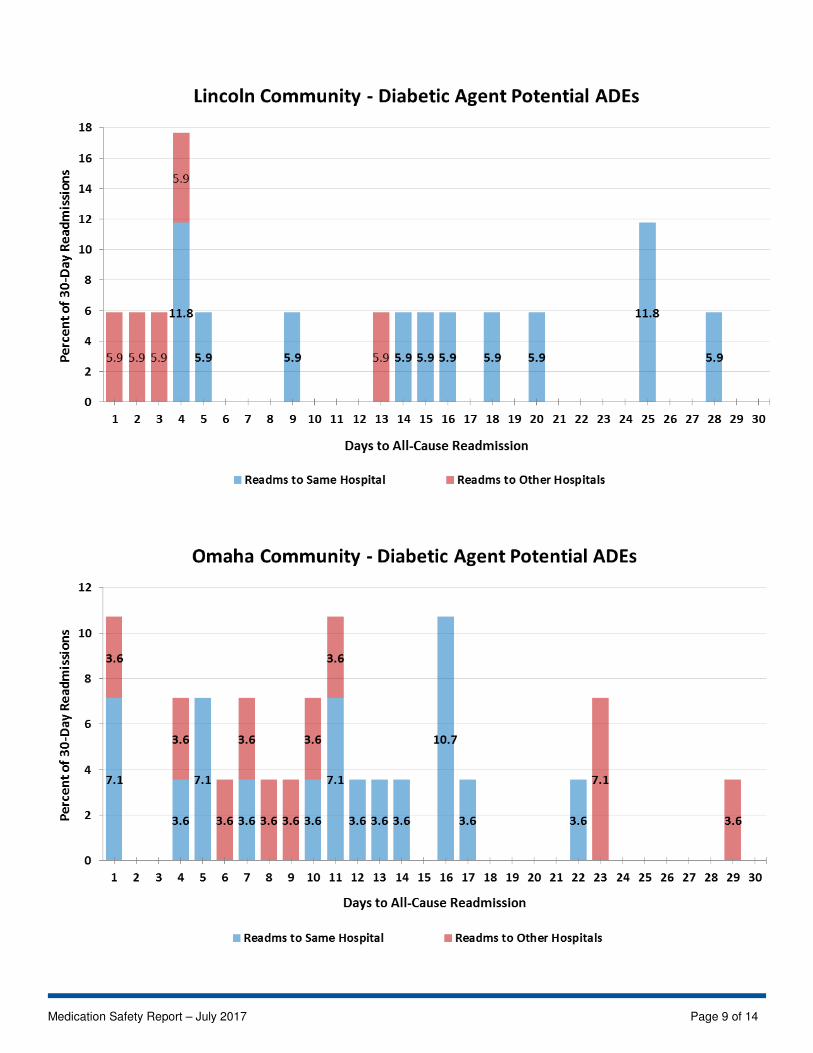
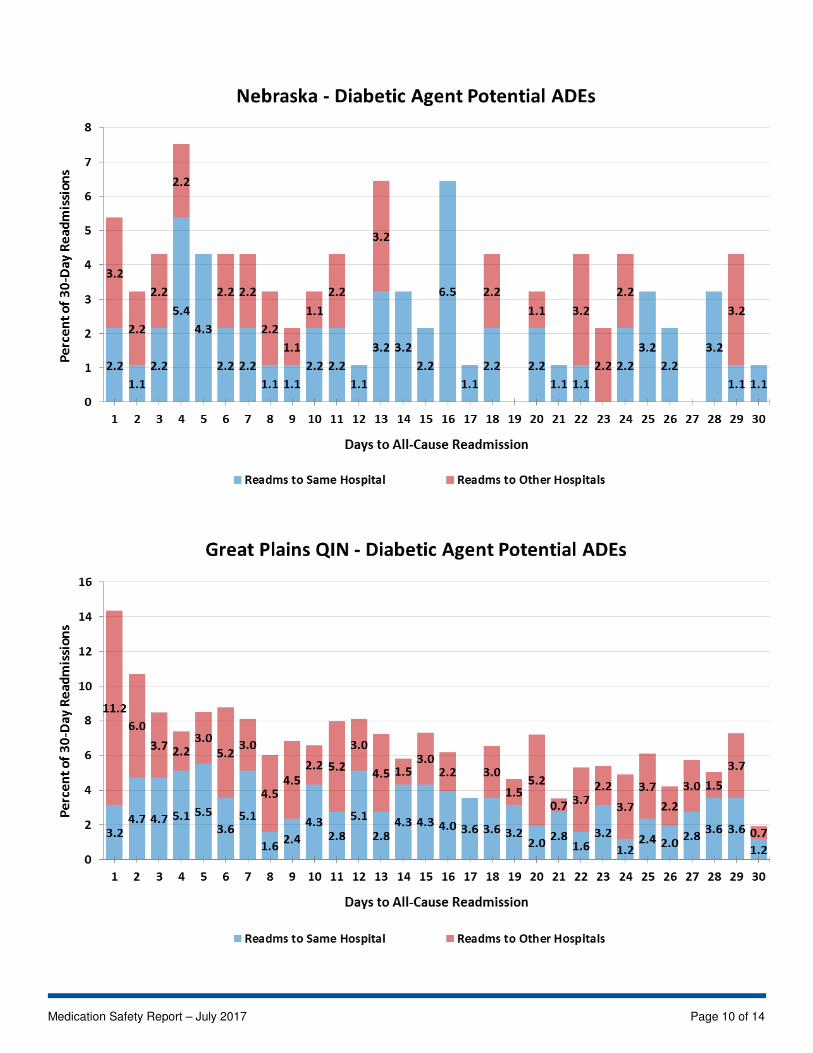
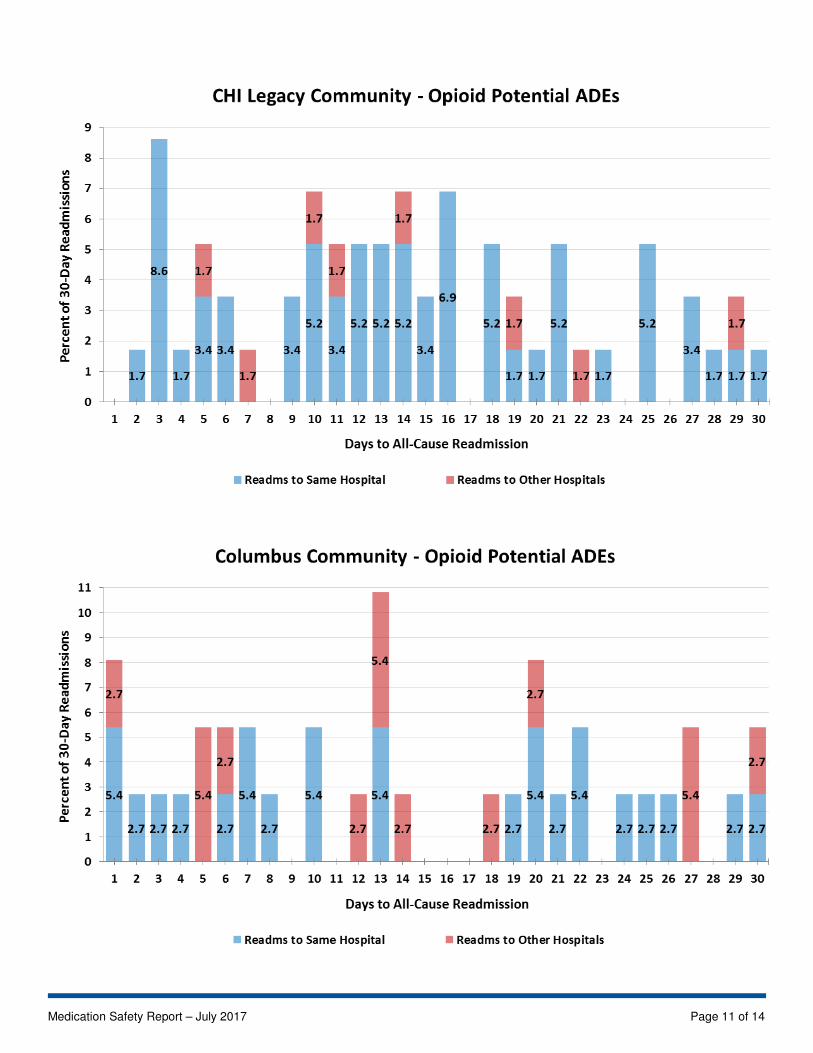
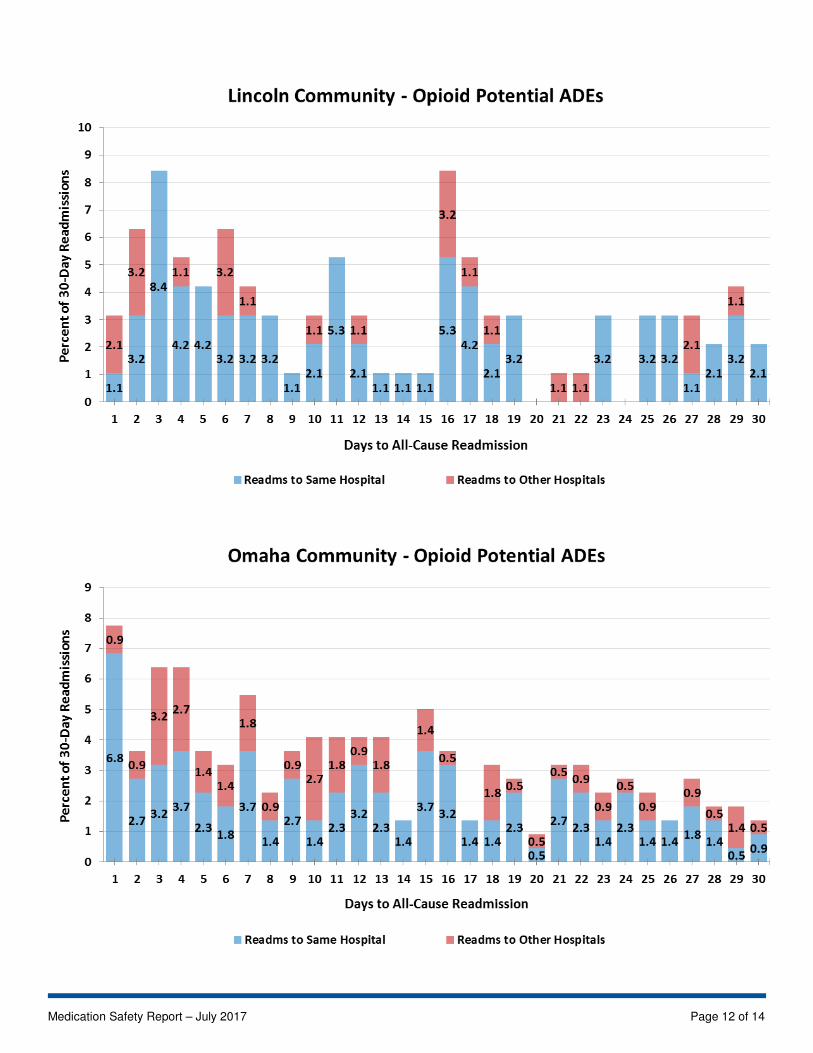
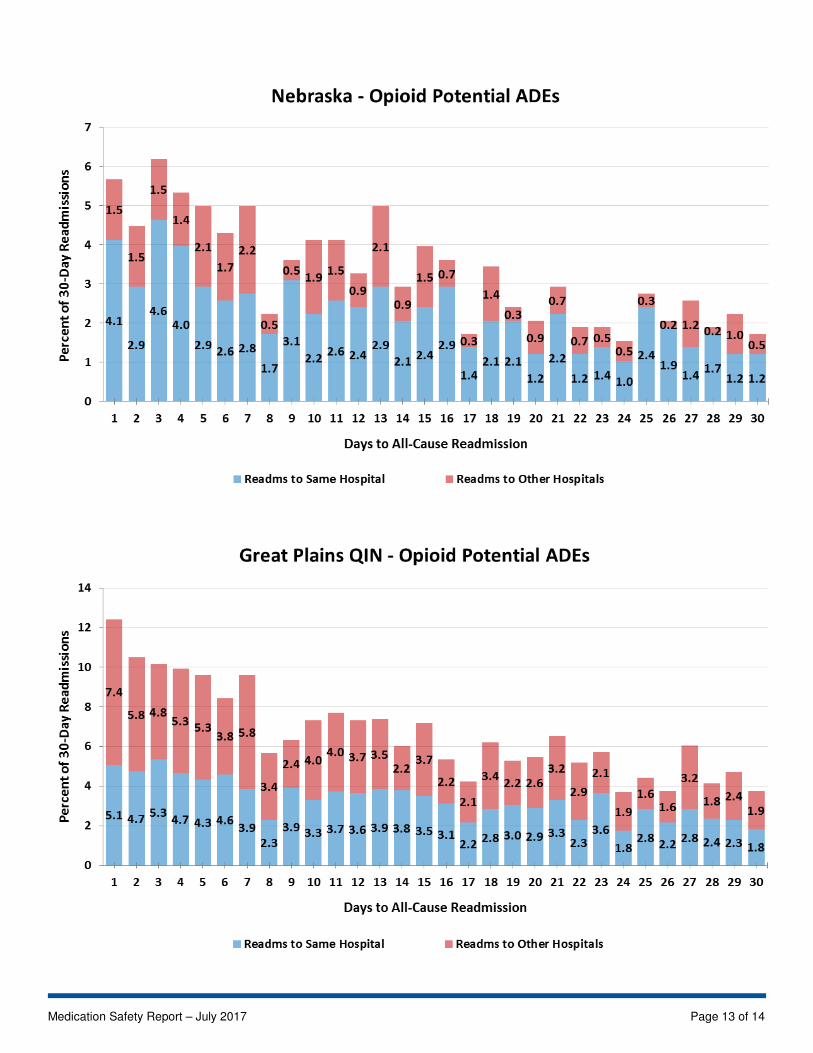
How many days after being discharged with a potential ADE were High Risk Medication (HRM) Beneficiaries
readmitted (by drug class): 10/01/2015 – 09/30/2016
The results in each drug class are limited to the beneficiaries identified as high risk within that drug class. Potential ADEs
could occur in principal or secondary diagnosis codes. The 30-day readmissions could be for any reason (all-cause).
Medication Safety Report – July 2017 Page 5 of 14
Medication Safety Report – July 2017 Page 6 of 14
Medication Safety Report – July 2017 Page 7 of 14
Medication Safety Report – July 2017 Page 8 of 14
Medication Safety Report – July 2017 Page 9 of 14
Medication Safety Report – July 2017 Page 10 of 14
Medication Safety Report – July 2017 Page 11 of 14
Medication Safety Report – July 2017 Page 12 of 14
Medication Safety Report – July 2017 Page 13 of 14
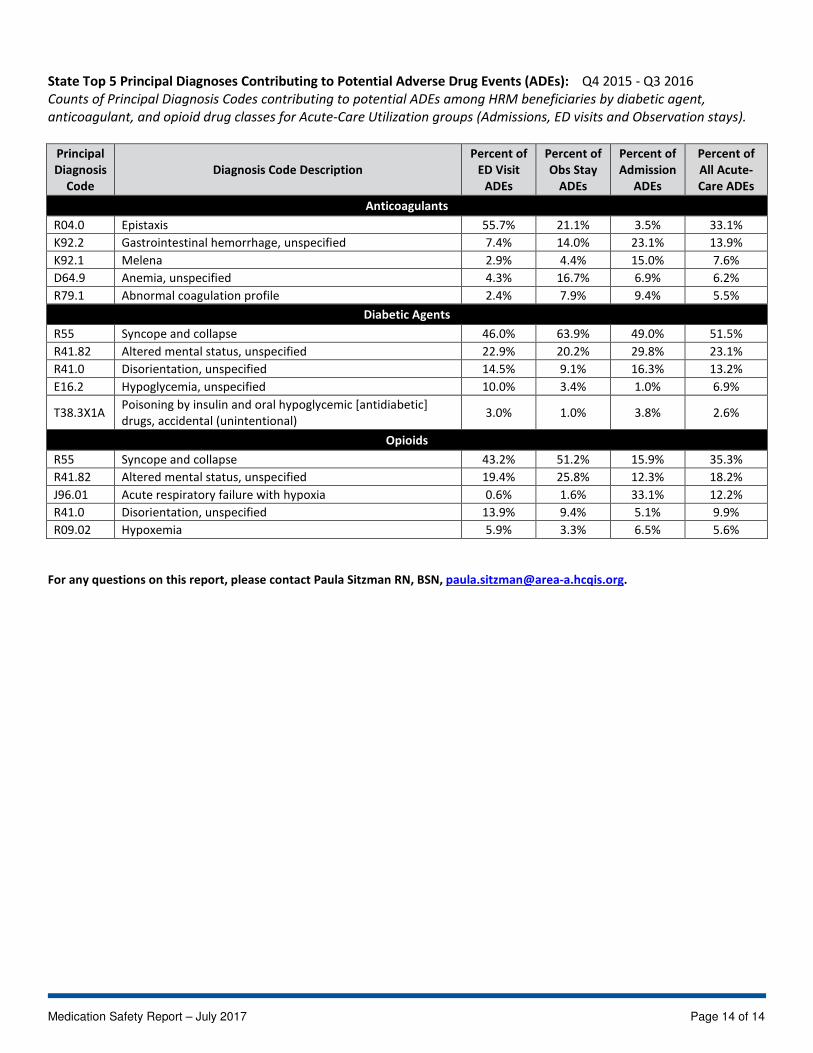
State Top 5 Principal Diagnoses Contributing to Potential Adverse Drug Events (ADEs): Q4 2015 - Q3 2016
Counts of Principal Diagnosis Codes contributing to potential ADEs among HRM beneficiaries by diabetic agent,
anticoagulant, and opioid drug classes for Acute-Care Utilization groups (Admissions, ED visits and Observation stays).
Principal
Diagnosis
Code
Diagnosis Code Description
Percent of
ED Visit
ADEs
Percent of
Obs Stay
ADEs
Percent of
Admission
ADEs
Percent of
All Acute-
Care ADEs
Anticoagulants
R04.0 Epistaxis 55.7% 21.1% 3.5% 33.1%
K92.2 Gastrointestinal hemorrhage, unspecified 7.4% 14.0% 23.1% 13.9%
K92.1 Melena 2.9% 4.4% 15.0% 7.6%
D64.9 Anemia, unspecified 4.3% 16.7% 6.9% 6.2%
R79.1 Abnormal coagulation profile 2.4% 7.9% 9.4% 5.5%
Diabetic Agents
R55 Syncope and collapse 46.0% 63.9% 49.0% 51.5%
R41.82 Altered mental status, unspecified 22.9% 20.2% 29.8% 23.1%
R41.0 Disorientation, unspecified 14.5% 9.1% 16.3% 13.2%
E16.2 Hypoglycemia, unspecified 10.0% 3.4% 1.0% 6.9%
T38.3X1A Poisoning by insulin and oral hypoglycemic [antidiabetic]
drugs, accidental (unintentional) 3.0% 1.0% 3.8% 2.6%
Opioids
R55 Syncope and collapse 43.2% 51.2% 15.9% 35.3%
R41.82 Altered mental status, unspecified 19.4% 25.8% 12.3% 18.2%
J96.01 Acute respiratory failure with hypoxia 0.6% 1.6% 33.1% 12.2%
R41.0 Disorientation, unspecified 13.9% 9.4% 5.1% 9.9%
R09.02 Hypoxemia 5.9% 3.3% 6.5% 5.6%
For any questions on this report, please contact Paula Sitzman RN, BSN, [email protected].
Medication Safety Report – July 2017 Page 14 of 14