Embed Size (px)
Citation preview

Medi-Cal Managed Care External Accountability Set 2007 Table of Contents
Delmarva Foundation
Table of Contents Executive Summary ................................................................................................................................i
I. Introduction......................................................................................................................................... 1
II. HEDIS®* Audit Process and DHCS ................................................................................................. 5
III. How DHCS Uses HEDIS Measures................................................................................................ 6
IV. Report Organization ....................................................................................................................... 8
V. HEDIS 2007 Health Plan Results ................................................................................................10 Child and Adolescent Health
Well-Child Visits in the First 15 Months of Life (6 or More Visits) .............................................................10 Well-Child Visits in the Third, Fourth, Fifth, and Sixth Years of Life .........................................................13 Childhood Immunization Status (Combination #2) ........................................................................................16 Adolescent Well-Care Visits .................................................................................................................................19 Appropriate Treatment for Children with Upper Respiratory Infection......................................................22
Women's Health Prenatal and Postpartum Care—Timeliness of Prenatal Care........................................................................25 Prenatal and Postpartum Care—Postpartum Care...........................................................................................28 Chlamydia Screening in Women..........................................................................................................................31 Cervical Cancer Screening.....................................................................................................................................34 Breast Cancer Screening........................................................................................................................................37
Living with Illness Comprehensive Diabetes Care—Eye Exam (Retinal) Performed .................................................................40 Comprehensive Diabetes Care—HbA1c Testing ............................................................................................43 Comprehensive Diabetes Care—LDL-C Screening .......................................................................................46 Comprehensive Diabetes Care—Monitoring for Diabetic Nephropathy ...................................................49 Use of Appropriate Medications for People with Asthma..............................................................................52 Inappropriate Antibiotic Treatment for Adults with Acute Bronchitis ........................................................55
VI. HEDIS 2007 Health Plan Results by Model Type and Trend Tables.....................................58
Child and Adolescent Health Well-Child Visits in the First 15 Months of Life (6 or More Visits) .............................................................59 Well-Child Visits in the Third, Fourth, Fifth, and Sixth Years of Life .........................................................65 Childhood Immunization Status (Combination #2) ........................................................................................71 Adolescent Well-Care Visits .................................................................................................................................77 Appropriate Treatment for Children with Upper Respiratory Infection .....................................................83
Women's Health Prenatal and Postpartum Care—Timeliness of Prenatal Care........................................................................89 Prenatal and Postpartum Care—Postpartum Care...........................................................................................95 Chlamydia Screening in Women........................................................................................................................101 Cervical Cancer Screening...................................................................................................................................107 Breast Cancer Screening......................................................................................................................................113 *HEDIS is a registered trademark of the National Committee for Quality Assurance (NCQA)

Medi-Cal Managed Care External Accountability Set 2007 Table of Contents
Delmarva Foundation
Living with Illness Comprehensive Diabetes Care—Eye Exam (Retinal) Performed ...............................................................119 Comprehensive Diabetes Care—HbA1c Testing ..........................................................................................125 Comprehensive Diabetes Care—LDL-C Screening .....................................................................................131 Comprehensive Diabetes Care—Monitoring for Diabetic Nephropathy .................................................137 Use of Appropriate Medications for People with Asthma............................................................................143 Inappropriate Antibiotic Treatment for Adults with Acute Bronchitis ......................................................149
VII. Conclusions and Recommendations..................................................................................... 155
A. Information Systems Capability………………………………………………………..155 B. Reporting Methods…………………………………………………………………….156 C. Medical Record Abstraction Tools and Processes……………………………………...157
VIII. Final Thoughts.......................................................................................................................... 159
Appendix 1 Specialty Plan and PHP Results for HEDIS 2007 ................................................. A1-1 Appendix 2 HEDIS Overview .......................................................................................................... A2-1 Appendix 3 HEDIS 2007 Measure Descriptions......................................................................... A3-1 Appendix 4 EAS Measure Changes for HEDIS 2008 ................................................................. A4-1
Medi-Cal Managed Care External Accountability Set 2007 Executive Summary
Delmarva Foundation i
Medi-Cal Managed Care External Accountability Set (EAS) 2007 Executive Summary The Medi-Cal Managed Care Division (MMCD) of the California Department of Health Care Services (DHCS) contracts with networks of health care delivery systems to provide essential primary, preventive, and acute care health services to approximately 3.3 million beneficiaries. In 2006, three models of care in 21 managed care health plans served 22 counties in the provision of these services. The primary goals included providing qualified Medi-Cal children and adults with high quality health care that is accessible and delivered in a cost-effective manner. To assess the quality of care, DHCS selected 12 Healthcare Effectiveness Data and Information Set (HEDIS®1) measures for the External Accountability Set (EAS) each Medi-Cal managed care plan is required to report on annually. HEDIS is a nationally recognized, standardized set of performance indicators developed by the National Committee for Quality Assurance (NCQA). More than 90 percent of all national health plans use HEDIS to measure their performance for established dimensions of both health care and their plan services. The three models of health care used by managed care health plans include: County Organized Health Systems (COHS), Geographic Managed Care (GMC) and the Two-Plan model. In all three models, managed care health plans must have contracted provider networks. To reliably compare and assess the performance of these contracted managed care health plans, DHCS contracted with Delmarva Foundation (Delmarva) as its External Quality Review Organization (EQRO) to validate and report on the rates for the selected EAS measures. The eight domains of HEDIS consist of 71 measures which are specifically defined while collection and validation is standardized across all plans. This methodology makes it possible to compare the performance of health plans to each other and with other benchmarks. Results are used to identify variances in an effort to focus and target improvement interventions for both individual plans and an aggregate population. NCQA’s Committee on Performance Measurement annually evaluates and makes collective decisions about the content of the measures and the entire HEDIS process. The results of these measures are used by states,
1 HEDIS is a registered trademark of the National Committee for Quality Assurance (NCQA)

Medi-Cal Managed Care External Accountability Set 2007 Executive Summary
Delmarva Foundation ii
employer and business groups, payers, and consumers in making decisions about which health plans to use for health care services. The EAS report provides detailed results for each of the 12 selected HEDIS measures with a total of 16 indicator rates. DHCS selected measures to reflect the care provided to the largest segments of the Medi-Cal population in CY 2006. Each measure has been reported with a Medi-Cal weighted average calculated to provide a comparison that accounts for variation in membership across plans. The Medi-Cal Managed Care weighted averages are also compared to national benchmarks, and key findings from this comparison are:
The Medi-Cal Managed Care weighted average for 12 of the 16 indicators are at or above the 2006 national Medicaid average.
The Medi-Cal Managed Care weighted average for Childhood Immunizations-Combo 2 (77.9%) is 7.5 percentage points above the 2006 national Medicaid average (70.4%).
The Medi-Cal Managed Care weighted average for Well-Child 15 months, 6 visits (57.7%) was above the 2006 national Medicaid average of 48.6% by 9.1 percentage points.
The Medi-Cal Managed Care weighted average of 36.9% was 3.7 percentage points below the 2006 national Medicaid mean of 40.6% for Adolescent Well-Care visits, indicating an opportunity for improvement.
The Comprehensive Diabetes Care-LDL-C Screening weighted average (75.9%) was below the national Medicaid average (80.5%). This was the only Comprehensive Diabetes Care indicator below the national Medicaid average and presents an opportunity for improvement.
The report also provides trend analysis for measures where multiple years of data are available. The averages used in the trend analysis are Medi-Cal Managed Care unweighted or simple averages, which unlike weighted averages do not account for variations in membership across health plans. However, a weighted average is taken of the HEDIS rates for all contract counties within each health plan before the simple average of all health plans is calculated for each measure. The two-to-three-year trend rates for the statewide simple averages are displayed in the table below. Annual Trend Rates 2005 – 2007 Statewide Simple Averages*
HEDIS Measures
HEDIS 2005
HEDIS 2006 HEDIS 2007
Well-Child 15 Months-6 Visits or More (W15) 51.9% 52.7% 56.8%
Well-Child 3-6 (W34) 68.7% 69.7% 71.6%
CIS-Combo2 (CIS) 67.7% 76.7% 76.8%
Adolescent Well-Care (AWC) 35.1% 36.3% 37.0%
Appropriate Treatment for Children With Upper -- 85.4% 84.3%

Medi-Cal Managed Care External Accountability Set 2007 Executive Summary
Delmarva Foundation iii
HEDIS Measures
HEDIS 2005
HEDIS 2006 HEDIS 2007
Respiratory Infection (URI)
Breast Cancer Screening (BCS) 56.2% 55.3% 50.7%
Cervical Cancer Screening (CCS**) 65.9% 67.2% 65.9%
Chlamydia Screening (CHL) 48.0% 51.8% 55.9%
Timeliness of Prenatal Care (PPC-Time) 79.6% 80.9% 79.6%
Postpartum Care (PPC-Post) 58.1% 57.5% 58.0%
CDC** Eye Exam 63.3% 54.1% 56.1%
CDC HbA1c Test -- 75.0% 80.6%
CDC LDL-C Screening -- 83.7% 75.7%
CDC Medical Attention for Nephropathy
(CDC- Neph.) -- 58.1% 78.9%
Use of Appropriate Medications for People with
Asthma (ASM) 62.1% 84.7% 87.0%
Inappropriate Antibiotic Treatment for Adults With
Acute Bronchitis (AAB) -- 63.3% 69.3%
*If data for a measure was available it is presented in the trending tables. Measures with 2 years worth of data may not indicate a trend, but they do provide a comparison between the current year and the previous. ** Note that the abbreviation CCS is used in the Medi-Cal managed care program to refer to the California Children’s Services and that the abbreviation CDC also refers to the Centers for Disease Control and Prevention. However, in this report these abbreviations refer to HEDIS measures: CCS refers Cervical Cancer Screening and CDC refers to Comprehensive Diabetes Care.
Key findings related to the Medi-Cal Managed Care simple averages are:
Eleven of the 16 indicators had data for all three measurement years. Of these 11 indicators, six showed an upward trend from 2005 through 2007.
Five of the 16 indicators had rates for 2006 and 2007 only. Of these five indicators, improvement was observed for two indicators.
Inappropriate Treatment for Adults with Acute Bronchitis showed an increase of 6 percentage points in the unweighted Medi-Cal averages from 63.3% in 2006 to 69.3% in 2007. This measure is reported with an inverted rate and a lower rate is better.
The unweighted Medi-Cal Managed Care averages for Prenatal Care and Cervical Cancer Screenings have remained stable over the past three years.
From 2005 to 2007, the unweighted Medi-Cal Managed Care averages for Childhood Immunization-Combo 2 improved by 9.1 percentage points from 67.7% to 76.8%.
The unweighted Medi-Cal averages for Chlamydia Screenings improved by 7.9 percentage points between 2005 and 2007 from 48.0% to 55.9%.

Medi-Cal Managed Care External Accountability Set 2007 Executive Summary
Delmarva Foundation iv
Screening for Breast Cancer trended downward by 5.5 percentage points from 56.2% in 2005 to 50.7% in 2007 for the unweighted Medi-Cal averages.
Medi-Cal Managed Care unweighted averages of indicator results for Comprehensive Diabetes Care were mixed for the trending periods: • Retinal Eye Exam declined from 63.3 % to 56.1% (2005 to 2007), • HbA1c Testing increased from 75.0% to 80.6% (2006 to 2007), • LDL-C Screening declined from 83.75 to 75.7% (2006 to 2007), • Monitoring for Diabetic Nephropathy increased by 20.8 percentage points from 58.1% to 78.9%
(2006 to 2007). Use of Appropriate Medications for People with Asthma increased 24.9 percentage points from 62.1% to
87.0% between 2005 and 2007 for the unweighted Medi-Cal averages. The identification of Minimum Performance Levels (MPLs) and High Performance Levels (HPLs) are based upon the 25th and the 90th percentiles, respectively, of the 2006 national Medicaid averages. This additional comparison can assist DHCS in their program-wide assessment of quality and to identify opportunities for the targeted improvement needs of specific health plans. The HPL rates also help identify plans that exceed national benchmarks. The requirement for MPLs and HPLs was not applied to the following measures due to substantial changes to the technical specifications for HEDIS 2007. The specific changes for each measure are identified in Section III of this report.
Inappropriate Antibiotic Treatment for Adults with Acute Bronchitis (AAB) Breast Cancer Screening (BCS) Cervical Cancer Screenings (CCS2) Comprehensive Diabetes Care - LDL -C Screening (CDC2-L) Comprehensive Diabetes Care - Medical Attention to Nephropathy (CDC-N).
Improvement Plans (IPs) are required of plans not meeting the minimum 25th percentile level of HEDIS 2006 national Medicaid rates and of plans not reporting (NR) on a measure. IPs are Corrective Action Plans (CAPs) and must include a root cause analysis, identification of targeted interventions, the team responsible for implementation, and the proposed timeline. For one HEDIS measure, Comprehensive Diabetes Care: Eye Exam (Retinal), all Medi-Cal managed care plans reported at or above the MPL and no IPs are required. The following list includes the HEDIS measures and the number of plans scoring below the MPL or NR on a measure, requiring submission of an IP:
2 Note that the abbreviation CCS is used in the Medi-Cal managed care program to refer to the California Children’s
Services and that the abbreviation CDC also refers to the Centers for Disease Control and Prevention. However, in this
report the abbreviations CCS and CDC refer to the HEDIS measures under discussion.

Medi-Cal Managed Care External Accountability Set 2007 Executive Summary
Delmarva Foundation v
Adolescent Well-Care Visits (AWC) – MPL: 13 plans, Appropriate Treatment for Children with Upper Respiratory Infection (URI) – MPL: 7 plans, Appropriate Medications for Asthmatics (ASM) – MPL: 5 plans, Prenatal and Postpartum Care; Timeliness of Prenatal Care (PPC-Pre) – MPL: 5 plans; NR: 2 plans, Prenatal and Postpartum Care: Postpartum Care (PPC-Pst) – MPL: 5 plans; NR: 1 plan, Chlamydia Screening in Women (CHL) – MPL: 2 plans, Childhood Immunization Status [Combination 2 (CIS-2)] – MPL: 2 plans; NR: 3 plans, Well-Child visits in the First 15 Months of Life (W15) – MPL: 2 plans; NR: 6 plans, Well-Child Visits in the 3rd, 4th, 5th, and 6th Years of Life (W34) – MPL: 2 plans; NR: 2 plans, Comprehensive Diabetes Care: Hemoglobin A1c Testing (CDC-H) – MPL: 1 plan.
Defining the delivery of health care services to this vulnerable population requires regular measurement of “quality” as a mandatory tool in program management. The trending of HEDIS measures over time is an important and objective tool to evaluate both individual plan performance and the results for the Medi-Cal population. Desired health care services and outcomes as related to quality can encompass several dimensions. These may include:
Services delivered in an efficient and timely manner with reasonable access, Effective care adhering to evidence-based guidelines, including preventive care, Ensuring patient safety, and Care that is patient-centered and culturally competent.
Quality performance measurement, as reflected in HEDIS results, provides a description or observation of a level of activity at a point in time. The results do not describe the specific reasons that may account for differences in plan and comparative levels. Monitoring of trends and variances by DHCS is required to identify opportunities to improve the health services delivered to the State’s Medi-Cal managed care populations. Plans should review individual results and comparative benchmarks to identify the specific characteristics of their patient populations. The review of previous interventions should be scrutinized for effectiveness of improvement efforts. Plans should consider alternative and innovative strategies for those measures that have not achieved benchmark results or improvement in performance results. Incorporating system-wide interventions into overall processes can produce the most sustainable results.

Medi-Cal Managed Care External Accountability Set 2007 Introduction
Delmarva Foundation 1
Results of the 2007 Performance Measures for the California Medi-Cal Managed Care Program I. Introduction In accordance with the Code of Federal Regulations (CFR), Title 42, CFR Section 438.200, Subpart D, Section 438.300, Subpart E, and Section 1932 [42 U.S.C. 1396u–2] of the Social Security Act, the California Department of Health Care Services (DHCS), has contracted with Delmarva Foundation for Medical Care, Inc. (Delmarva) to function as an external quality review organization (EQRO). An essential EQRO task is the validation of performance measures. Validation is a review of the systems and processes used by the plan to create performance measures that are reported to the state. Validation of such performance measures is undertaken to accomplish two main goals: 1) Evaluate the accuracy of the performance measures reported by (or on behalf of) a Managed Care
Organization (MCO). 2) Determine the extent to which the calculation of the performance rates followed the technical
specifications for the measures. In 2006, California’s Medi-Cal Managed Care Program funded healthcare services for approximately 3.3 million Medi-Cal beneficiaries in 22 counties across California. To effectively assess the quality of care provided by contracted health plans during 2006, the DHCS required each Medi-Cal managed care plan to report rates for a series of performance measures. These measures were selected from the Health Plan Employer Data and Information Set (HEDIS®3), now known as the Healthcare Effectiveness Data and Information Set (HEDIS4) measures. DHCS selected 12 HEDIS measures with 16 indicators that assess the care provided to the largest segments of the Medi-Cal population: young women, children, and those with chronic conditions. In accordance with routine NCQA program oversight, each of the HEDIS measures selected by DHCS was audited by NCQA certified auditors.
3 HEDIS is a registered trademark of the National Committee for Quality Assurance (NCQA). 4 The term “HEDIS” is a registered trademark of the National Committee of Quality Assurance (NCQA) and has been
most commonly used to refer to the set of performance measures used in health plan evaluation. In recent years,
NCQA has broadened the scope of their quality measure development activities to include measures for physicians and
Preferred Provider Organizations (PPOs). In order to better reflect the expanded scope and utility of HEDIS, NCQA
has changed the name of HEDIS® to “Healthcare Effectiveness Data and Information Set,” effective July 11, 2007.

Medi-Cal Managed Care External Accountability Set 2007 Introduction
Delmarva Foundation 2
Developed by NCQA, HEDIS is a nationally recognized, standardized set of performance indicators that measure healthcare access, utilization, and quality. Since its introduction in 1993, HEDIS has become the gold standard in managed care performance measurement. Conceived as a way to streamline measurement efforts and promote accountability in managed care, HEDIS measures are now used by approximately 90 percent of all managed care organizations to evaluate performance in areas ranging from preventive care and consumer experience to cardiovascular disease and cancer. All measures have a continuous eligibility requirement defined as the time in months or years that the beneficiary must be enrolled in the Medi-Cal managed care plan before a particular date or event. This set of standardized performance measures is designed to ensure that purchasers and consumers have the information they need to reliably compare the performance of managed health care organizations. For a deeper understanding of how HEDIS works, please refer to Appendix 2. The rates presented reflect select services for a portion of the Medi-Cal managed care population, providing a proximal gauge of plan access, timeliness of services and quality of care. Several factors may influence a plan’s score, including the plan’s ability to capture and report data, the unique characteristics of the member population, and the organization of the provider networks within specific geographic areas. Therefore, this information is best used to develop a composite sketch of the systems of quality employed by the managed care plans in delivering care and services. The Medi-Cal Managed Care Program uses three models of health care delivery to serve the 3.3 million Medi-Cal beneficiaries in 22 counties across California. The three models are the Geographic Managed Care (GMC), the County-Organized Health System (COHS), and the Two-Plan Model, which includes commercial plans (CPs) and Local Initiatives (LIs). For calendar year 2006, DHCS contracted with 21 managed care plans to provide health care services for Medi-Cal-qualified adults and children. A description of each of the three managed care models is found in Table 1. Table 2 provides the abbreviation for each plan, the contract/model type (as described in Table 1), and the counties of operation for each Medi-Cal managed care plan.

Medi-Cal Managed Care External Accountability Set 2007 Introduction
Delmarva Foundation 3
Table 1. Medi-Cal Managed Care Health Plan Models
Model Characteristics
Geographic Managed Care (GMC)
Mandatory enrollment of Temporary Assistance to Needy Families (TANF) population into commercially operated managed care plan, with enrollee choosing between multiple plans in area.
County-Organized Health System (COHS) Mandatory enrollment of nearly all Medi-Cal eligible population into managed care system developed by the county.
Two-Plan Model (includes Commercial Plans [CPs] and Local Initiatives [LIs])
Mandatory enrollment of TANF population into one of two managed care entities. CP is a commercially operated managed care plan, and LI is a community-developed plan designed to meet the specific needs of the community served.
Table 2 lists the 21 plans, the abbreviation for each plan, the contract/model type, and counties of operation.
Table 2. Medi-Cal Managed Care Contracted Health Plans
Plan Name Plan Abbreviation Contract Type County (ies) of Operation
Alameda Alliance for Health AAH LI Alameda Alameda
Contra Costa Fresno
San Francisco San Joaquin
CP
Santa Clara GMC Sacramento GMC San Diego*
LI Stanislaus
Blue Cross of CA (now Anthem Blue Cross) BC of CA
LI Tulare Cal Optima CalOptima COHS Orange
GMC Sacramento** Care1st Care1st
GMC San Diego
Central Coast Alliance for Health CCAH COHS Monterey/Santa Cruz
Community Health Group CHG GMC San Diego Contra Costa Health Plan CCHP LI Contra Costa
Fresno Kern
Health Net Health Net CP
Los Angeles
* Effective January 1, 2008, Blue Cross is no longer a contracted health plan in San Diego County. ** Effective November 1, 2007, Care 1st is no longer a contracted health plan in Sacramento County.

Medi-Cal Managed Care External Accountability Set 2007 Introduction
Delmarva Foundation 4
Plan Name Plan Abbreviation Contract Type County (ies) of Operation
Stanislaus
Tulare
GMC Sacramento GMC San Diego
Health Plan of San Joaquin HPSJ LI San Joaquin Health Plan of San Mateo HPSM COHS San Mateo
Inland Empire Health Plan IEHP LI Riverside/San Bernardino
Kaiser Permanente (N) Kaiser (N) GMC Sacramento Kaiser Permanente (S) Kaiser (S) GMC San Diego
Kern Family Health Care KFHC LI Kern L.A. Care Health Plan LA Care LI Los Angeles
CP Riverside/San Bernardino Sacramento Molina Healthcare Molina
GMC San Diego
Partnership Health Plan of CA PHP of CA COHS Solano, Yolo & Napa San Francisco Health Plan SFHP LI San Francisco Santa Barbara Regional
Health Authority (now CenCalHealth Plan)
SBRHA COHS Santa Barbara
Santa Clara Family Health Plan SCFHP LI Santa Clara
Western Health Advantage WHA GMC Sacramento
AHF Healthcare Centers and Kaiser Prepaid Health Plan were required to submit validated data for the first time in 2007. Their results can be found in Appendix 1. Table 2a. Medi-Cal Managed Care Contracted Specialty Plans
Plan Name Plan Abbreviation Contract Type County (ies) of
Operation
AHF Healthcare Centers AHC Specialty Plan (SP) Los Angeles
Marin Kaiser Prepaid Health Plan Kaiser PHP Prepaid Health Plan
(PHP) Sonoma
This report presents the results of the performance measures for services provided in calendar year 2006, and as reported in June 2007. For a brief description of the measures required by DHCS, refer to Appendix 3.

Medi-Cal Managed Care External Accountability Set 2007 HEDIS Audit Process and DHCS
Delmarva Foundation 5
II. HEDIS Audit Process and DHCS HEDIS audit activities for Medi-Cal managed care plans occur year-round. Initial steps performed by plans include project planning and preparing for the audit teams which occurs between October and December of the measurement year. In January through May of the reporting year, the audit teams review documentation submitted by plans and perform onsite visits to the plans. The audit teams go onsite to investigate any issues identified during the review of plan documentation and to observe the systems used by plans for HEDIS reporting. After the visit, the audit team may identify areas that call for corrective action on the part of the plans. The plans make any needed corrections and submit their final results to NCQA in June. The final audit reports from the audit teams are submitted in July. Aggregate data analysis and reporting at a state level occurs in August and September. Table 3 provides approximate time periods for various tasks. Table 3. HEDIS Audit and Reporting Process
Task Dates
Plan and Audit team preparations for data capture and audits October - December
Plans gather data Audits conducted (2 day on-site at plan)
Corrective actions implemented January - May
Data collection ends and results finalized Submit results to NCQA June
Submit Final Audit Reports to plans July
Aggregate Medi-Cal Managed Care data analysis and report writing August - September

Medi-Cal Managed Care External Accountability Set 2007 How DHCS Uses HEDIS Measures
Delmarva Foundation 6
III. How DHCS Uses HEDIS Measures In the reporting of HEDIS measures, DHCS set the Minimum Performance Levels (MPLs) and High Performance Levels (HPLs) equal to the 25th and the 90th percentiles, respectively, of the 2006 national Medicaid unweighted averages. This additional comparison can assist DHCS in its program-wide assessment of quality and to identify opportunities for targeted improvement needs of specific health plans. The HPL rates also help identify plans that exceed national benchmarks. The requirement for MPLs and HPLs was not applied to the measures listed below due to the identified changes to the technical specifications for HEDIS 2007 or to the Inappropriate Antibiotic Treatment for Adults with Acute Bronchitis (AAB) measure. AAB was a new NCQA measure in HEDIS reporting year (RY) 2006. Since the HEDIS RY 2006 national Medicaid 25th and 90th percentiles are used for the RY 2007 measures’ MPLs and HPLs in this report, there are no corresponding levels for AAB.
Breast Cancer Screening (BCS) – The screening age for BCS was lowered to 40. Cervical Cancer Screenings (CCS) – The lower age limit for CCS was increased from 18 to 20. Comprehensive Diabetes Care - LDL -C Screening (CDC-L) – The required testing for CDC-L must be
in the measurement year. Comprehensive Diabetes Care - Medical Attention to Nephropathy (CDC-N) – The use of Angiotensin-
Converting Enzyme (ACE)/Angiotensin II Receptor Blockers (ARBs) was added to the CDC-N indicator’s numerator compliance requirements.
Improvement Plans (IPs) are required for those plans not meeting the minimum 25th percentile level of HEDIS 2006 national Medicaid rates and for those plans opting not to report (NR) on a measure. IPs are Corrective Action Plans (CAPs) and must include a root cause analysis, identification of targeted interventions, the team responsible for implementation, and the proposed timeline. For one HEDIS measure, Comprehensive Diabetes Care: Eye Exam (Retinal), all Medi-Cal managed care plans reported at or above the MPL and no IPs are required. The following list includes the HEDIS measures and the number of plans scoring below the MPL or not reporting on the measure, either of which requires submission of an IP:
Adolescent Well-Care Visits (AWC) – MPL: 13 plans, Appropriate Treatment for Children with Upper Respiratory Infection (URI) – MPL: 7 plans, Appropriate Medications for Asthmatics (ASM) – MPL: 5 plans, Prenatal and Postpartum Care; Timeliness of Prenatal Care (PPC-Pre) – MPL: 5 plans; NR: 2 plans, Prenatal and Postpartum Care: Postpartum Care (PPC-Pst) – MPL: 5 plans; NR: 1 plan, Chlamydia Screening in Women (CHL) – MPL: 2 plans, Childhood Immunization Status: Combination 2 (CIS-2) – MPL: 2 plans; NR: 3 plans, Well-Child visits in the First 15 Months of Life (W15) – MPL: 2 plans; NR: 6 plans, Well-Child Visits in the 3rd, 4th, 5th, and 6th Years of Life (W34) – MPL: 2 plans; NR: 2 plans, Comprehensive Diabetes Care: Hemoglobin A1c Testing (CDC-H) – MPL: 1 plan.

Medi-Cal Managed Care External Accountability Set 2007 How DHCS Uses HEDIS Measures
Delmarva Foundation 7
DHCS also uses HPLs to acknowledge plans that have shown dedication to quality by exceeding the HEDIS 2006 national Medicaid 90th Percentile. The following list includes the HEDIS measures and the number of plans scoring above the HPL:
Adolescent Well-Care Visits (AWC) – 1 plan, Appropriate Treatment for Children with Upper Respiratory Infection (URI) – 5 plans, Appropriate Medications for Asthmatics (ASM) – 3 plans, Prenatal and Postpartum Care: Postpartum Care (PPC-Pst) – 2 plans, Chlamydia Screening in Women (CHL) – 3 plans, Childhood Immunization Status: Combination 2 (CIS-2) – 7 plans, Well-Child visits in the First 15 Months of Life (W15) – 3 plans, Well-Child Visits in the 3rd, 4th, 5th, and 6th Years of Life (W34) –7 plans, Comprehensive Diabetes Care: Eye Exam (Retinal) Performed – 3 plans, Comprehensive Diabetes Care: Hemoglobin A1c Testing (CDC-H) – 2 plans.
Each year DHCS presents Quality Awards to plans at the annual Medi-Cal Managed Care Quality Conference. Included in these Quality Awards are awards specifically acknowledging outstanding performance in the required HEDIS measures (gold, silver, bronze and honorable mention categories) as well as awards for the greatest degree of improvement in HEDIS scores over the previous two years. In 2005, DHCS began using an auto assignment strategy as an incentive to health plans to improve the quality of care offered to enrollees. This strategy assigns more default enrollments in the geographic managed care (GMC) and two-plan model counties to health plans that have demonstrated high quality performance for selected HEDIS measures and for two measures related to the utilization of safety net providers. (The members subject to default enrollment are Medi-Cal beneficiaries who are required to enroll in a managed care plan but who do not select a health plan within the required timeframe established by DHCS.) The five HEDIS measures used for the first three years of the auto assignment incentive program were:
Childhood immunizations (Combination 2) Well-child visits (3rd-6th years of life) Adolescent well-visits Timeliness of prenatal care Appropriate medications for people with asthma

Medi-Cal Managed Care External Accountability Set 2007 Report Organization
Delmarva Foundation 8
IV. Report Organization This report is organized into sections, reflecting overall health plan HEDIS rates and HEDIS rates by model type. For each measure, a Medi-Cal managed care weighted average has been calculated to provide a comparative statistic. A weighted average, unlike a simple average, accounts for variations in membership across plans. The report also identifies MPLs and HPLs for each measure. Each MPL and HPL is based upon the 25th and 90th percentiles, respectively, of the 2006 national Medicaid averages5. Establishment of MPLs permits health plans and DHCS to detect opportunities for improvement, whereas use of HPLs allows for identification of performance in excess of the national 90th percentile. Used alongside the program-wide weighted averages, these two benchmarks facilitate the assessment of quality and provide the basis for strategic planning among the plans and DHCS. Results
Use of Audited Data Only
The data included in this report have been audited by NCQA-licensed audit organizations, MedStat and MetaStar, through a subcontractor agreement with Delmarva. The Balanced Budget Act (BBA) requires that performance measures be validated in a manner consistent with the EQRO protocol - Validating Performance Measures. Each audit was conducted as prescribed by NCQA’s HEDIS 2007, Volume 5: HEDIS Compliance Audit™6 Standards, Policies, and Procedures and is consistent with the validation methodology required by the EQRO’s protocols. Considerations in Interpreting Results
Although all data included in this report were audited, several factors may influence a plan’s performance on HEDIS measures. It is important to remember that HEDIS rates reflect only select services for a portion of the Medi-Cal population. Although the rates provide a proximal gauge of the degree to which services are provided, this information alone is insufficient to qualify overall performance. When used with other methods of performance assessment, quality measures can help develop a composite of the quality of systems employed by Medi-Cal managed care plans and the quality of care and services provided to enrollees. Readers should keep several points in mind when interpreting Medi-Cal managed care plan performance. Factors that influence measure results include the method used to capture data, the member population characteristics, and the Medi-Cal managed care plan characteristics.
5 Source: 2006 Quality Compass published by the National Committee for Quality Assurance (NCQA). 6 The NCQA HEDIS Compliance Audit™ is a trademark of the National Committee for Quality Assurance (NCQA).

Medi-Cal Managed Care External Accountability Set 2007 Report Organization
Delmarva Foundation 9
Factor 1: Impact of Administrative vs. Hybrid Methodology
The HEDIS methodology offers two ways to calculate a performance rate: the administrative method and the hybrid method. For the administrative method, the plans identify the member population eligible for a measure and searches their administrative databases (claims and encounters systems) for evidence of a service being rendered. For the hybrid methodology, plans supplement the administrative data analysis with data resulting from the manual process of medical record review. Regardless of the methodology used by the Medi-Cal managed care plans, audited measures should be accurate to within five percentage points of the “true” rate. For measures that allow the plans to report both the administrative and hybrid data, reporting administrative-only calculations could make the plan more susceptible to the undercounting of positive numerator events. Factor 2: Impact of Member Population Characteristics
HEDIS measures provide a glimpse of what has happened with regard to care delivery at a Medi-Cal managed care plan, but they do not address why something did or did not occur. HEDIS does not provide or adjust for factors outside of the plan’s control that may influence the member seeking these services. For example, the performance of the plan and its providers (i.e., educational programs, appointment availability, hours of operation, providers meeting with members) are factors that influence performance rates, but they are not the only factors. Member population characteristics might also play a role in impacting the plan’s performance rates since member age, education level, health status at the time of enrollment, and geographic location (urban vs. rural), may influence whether a member even seeks care. HEDIS rates are not adjusted for severity of illness or the general health status of a Medi-Cal managed care plan’s population. Therefore, all such differences in member populations should be considered when comparing managed care plans to one another, to state or national averages, and/or against other benchmarks. Factor 3: Impact of Medi-Cal Managed Care Plan Characteristics
Regardless of a managed care plan’s size, years in business, structure, or contract model, the plan is responsible for providing high-quality health care services to its members. Such plan characteristics may, however, influence the reporting of some HEDIS measures. As an example, smaller managed care plans may not have enough members to provide a sample size that would yield statistically valid results. Plans that have been in existence for only a short time may not have enough data to report on some measures requiring multiple years of data. Plans may also find it costly to produce measures using the hybrid methodology, even though use of the methodology generally results in higher performance rates.

Medi-Cal Managed Care External Accountability Set 2007 HEDIS 2007 Health Plan Results
Delmarva Foundation 10
COHSCPLI GMC-N5
GMC-SWHA - SacramentoBC of CA - Santa Clara
BC of CA - San Francisco BC of CA - Contra Costa
BC of CA - AlamedaAAH - Alameda
Care 1st - San DiegoCare 1st - Sacramento
Kaiser (S) - San Diego Health Net - Los Angeles
Health Net - Kern BC of CA - San Diego
CHG - San Diego
Health Net - San DiegoBC of CA - Stanislaus
LA Care - Los Angeles Molina - SB/R
Health Net - StanislausHealth Net - Tulare
BC of CA - TulareBC of CA - San Joaquin
KFHC - Kern BC of CA - Sacramento
HPSM - San MateoBC of CA - Fresno
HPSJ - San Joaquin
SCFHP - Santa ClaraMolina - Sacramento
Health Net - Fresno IEHP - SB/R2
CCHP - Contra CostaSBRHA - Santa BarbaraHealth Net - Sacramento
Kaiser (N) - SacramentoPHP of CA - Solano/Yolo/Napa
CalOptima - OrangeCCAH - Monterey/Santa Cruz
Molina - San DiegoSFHP - San Francisco
Rates (%)
0 10 20 30 40 50 60 70 80 90 100
NR4 NR NR
54.1
53.0
42.3
NR
50.3
NR
46.1
50.0
68.1
75.2
62.6
44.5
60.9
41.8
39.0
64.1
44.8
49.1
49.1
55.5
54.0
61.3
65.8
35.5
52.1
46.6
59.7
48.1
81.6
67.9
63.1
59.4
82.6
NR
NA3 NA
2007 Weighted Avg. (57.7%)
HPL (68.6%)MPL1 (41.6%)
V. HEDIS 2007 Health Plan Results
Figure 1. HEDIS 2007 Well-Child Visits in the First 15 Months of Life (6 or More Visits)
1 MPL is HEDIS 2006 national Medicaid 25th Percentile and HPL is HEDIS 2006 national Medicaid 90th Percentile. 2 SB/R is San Bernardino/Riverside. 3 NA indicates the denominator for the rate was too small (<30) to calculate a reliable rate. 4 NR is Not Reportable because the rate was materially biased or the plan chose not to report the rate. 5 GMC-N is Sacramento and GMC-S is San Diego.

Medi-Cal Managed Care External Accountability Set 2007 HEDIS 2007 Health Plan Results
Delmarva Foundation 11
Admin MRRWHA - Sacramento
Care 1st - San DiegoCare 1st - SacramentoBC of CA - Santa Clara
BC of CA - San Francisco BC of CA - Contra Costa
BC of CA - AlamedaAAH - Alameda
Kaiser (S) - San Diego Health Net - Los Angeles
Health Net - Kern BC of CA - San Diego
CHG - San DiegoHealth Net - San Diego
BC of CA - Stanislaus LA Care - Los Angeles
Molina - SB/RHealth Net - Stanislaus
Health Net - TulareBC of CA - Tulare
BC of CA - San JoaquinKFHC - Kern
BC of CA - SacramentoHPSM - San MateoBC of CA - Fresno
HPSJ - San JoaquinSCFHP - Santa ClaraMolina - Sacramento
Health Net - Fresno IEHP - SB/R**
CCHP - Contra CostaSBRHA - Santa BarbaraHealth Net - SacramentoKaiser (N) - Sacramento
PHP of CA - Solano/Yolo/NapaCalOptima - Orange
CCAH - Monterey/Santa CruzMolina - San Diego
SFHP - San Francisco
Rates (%)
0 10 20 30 40 50 60 70 80 90 100
NR*** NR NR
10 45 54.1
7 46 53.0
3 39 42.3
NR
13 37 50.3
NR
13 33 46.1
6 44 50.0
47 21 68.134 42 75.2
35 27 62.6
31 14 44.5
30 31 60.9
26 16 41.8
16 23 39.0
35 29 64.1
19 26 44.8
17 32 49.117 32 49.1
26 30 55.5
24 30 54.0
14 47 61.3
65.8
35.5
26 26 52.1
13 34 46.6
25 35 59.7
16 32 48.1
51 30 81.6
44 24 67.9
30 33 63.1
8 52 59.4
56 26 82.6*
NR NA**** NA
Figure 2. HEDIS 2007 Well-Child Visits in the First 15 Months of Life (6 or More Visits)
Rates from Administrative Data and Medical Record Review Data
* Final rates may not equal the sum of the Administrative Rate and the Medical Record Rate due to rounding. ** SB/R is San Bernardino/Riverside. *** NR indicates a rate was not reportable because the rate was materially biased or the plan chose not to report the rate. **** NA indicates the denominator for the rate was too small (<30) to calculate a reliable rate.

Medi-Cal Managed Care External Accountability Set 2007 HEDIS 2007 Health Plan Results
Delmarva Foundation 12
Well-Child Visits in the First 15 Months of Life (W15) measure is part of the Use of Service Domain. The 2007 Medi-Cal Managed Care weighted average for Well-Child Visits in the First 15 Months of Life, 6 or more visits is 57.7 percent. Three plans are above the HPL of 68.6 percent and two plans fell below the MPL of 41.6 percent. Due to an error in data collection by a medical record review vendor, six plans were unable to report a rate for this measure. While most plans use a hybrid method (a combination of administrative and medical records) to report this rate, Kaiser (N) Sacramento and Kaiser (S) San Diego use administrative data only. The Medi-Cal managed care weighted average is above the HEDIS 2006 national Medicaid average of 48.6 percent but below the HEDIS 2006 national Commercial average of 71.0 percent as shown in Table 3. Table 3. Well-Child Visits in the First 15 Months of Life (6 or More Visits) Benchmarks
HEDIS 2007 Medi-Cal
Managed Care Weighted Average
HEDIS 2006 National Medicaid Average†
HEDIS 2006 National Commercial Average‡
Rate 57.7% 48.6% 71.0%
† Rate obtained from NCQA’s Quality Compass (2006). ‡ Rate obtained from NCQA’s website: http://web.ncqa.org/Portals/0/HEDISQM/Programs/CompAud/MPR/HEDIS_2006_Means_Percentiles_Commercial.pdf
Medi-Cal Managed Care External Accountability Set 2007 HEDIS 2007 Health Plan Results
Delmarva Foundation 13
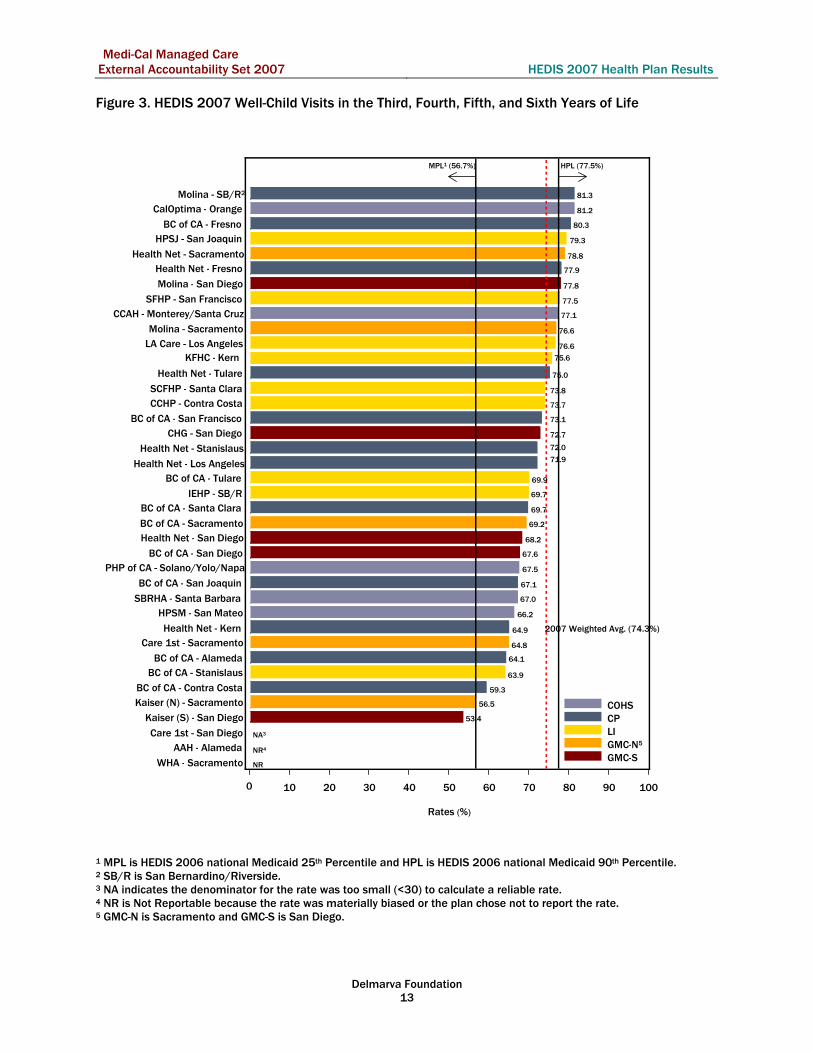
Figure 3. HEDIS 2007 Well-Child Visits in the Third, Fourth, Fifth, and Sixth Years of Life
1 MPL is HEDIS 2006 national Medicaid 25th Percentile and HPL is HEDIS 2006 national Medicaid 90th Percentile. 2 SB/R is San Bernardino/Riverside. 3 NA indicates the denominator for the rate was too small (<30) to calculate a reliable rate. 4 NR is Not Reportable because the rate was materially biased or the plan chose not to report the rate. 5 GMC-N is Sacramento and GMC-S is San Diego.
COHSCPLI GMC-N5
GMC-SWHA - SacramentoAAH - Alameda
Care 1st - San Diego
Kaiser (S) - San DiegoKaiser (N) - SacramentoBC of CA - Contra Costa
BC of CA - Stanislaus BC of CA - Alameda
Care 1st - SacramentoHealth Net - Kern
HPSM - San MateoSBRHA - Santa Barbara
BC of CA - San Joaquin
PHP of CA - Solano/Yolo/NapaBC of CA - San Diego
Health Net - San DiegoBC of CA - Sacramento
BC of CA - Santa Clara IEHP - SB/R
BC of CA - TulareHealth Net - Los Angeles
Health Net - StanislausCHG - San Diego
BC of CA - San Francisco CCHP - Contra CostaSCFHP - Santa Clara
Health Net - Tulare
KFHC - Kern LA Care - Los Angeles Molina - Sacramento
CCAH - Monterey/Santa CruzSFHP - San Francisco
Molina - San Diego
Health Net - Fresno Health Net - Sacramento
HPSJ - San JoaquinBC of CA - Fresno
CalOptima - OrangeMolina - SB/R2
Rates (%)
0 10 20 30 40 50 60 70 80 90 100
NR4
64.1
59.3
80.3
69.2
67.6
73.1
67.1
69.7
63.9
69.9
81.2
77.1
73.7
72.7
77.9
64.9
71.9
78.8
68.2
72.0
75.0
79.3
66.2
69.7
56.5
53.4
75.6
76.6 76.6
81.3
77.8
67.5
67.0
73.8
77.5
NR
64.8
NA3
2007 Weighted Avg. (74.3%)
HPL (77.5%) MPL1 (56.7%)

Medi-Cal Managed Care External Accountability Set 2007 HEDIS 2007 Health Plan Results
Delmarva Foundation 14
Admin MRRWHA - Sacramento
Care 1st - San DiegoAAH - Alameda
Kaiser (S) - San DiegoKaiser (N) - SacramentoBC of CA - Contra Costa
BC of CA - Stanislaus BC of CA - Alameda
Care 1st - SacramentoHealth Net - Kern
HPSM - San MateoSBRHA - Santa BarbaraBC of CA - San Joaquin
PHP of CA - Solano/Yolo/NapaBC of CA - San Diego
Health Net - San DiegoBC of CA - SacramentoBC of CA - Santa Clara
IEHP - SB/RBC of CA - Tulare
Health Net - Los AngelesHealth Net - Stanislaus
CHG - San DiegoBC of CA - San Francisco
CCHP - Contra CostaSCFHP - Santa Clara
Health Net - Tulare
KFHC - Kern LA Care - Los Angeles Molina - Sacramento
CCAH - Monterey/Santa CruzSFHP - San Francisco
Molina - San DiegoHealth Net - Fresno
Health Net - SacramentoHPSJ - San Joaquin
BC of CA - FresnoCalOptima - Orange
Molina - SB/R*
Rates (%)
0 10 20 30 40 50 60 70 80 90 100
NR***
62 2 64.1
56 3 59.3
79 1 80.3
68 1 69.2
62 6 67.6
70 3 73.1
65 2 67.1
63 6 69.7
63 63 63.9
68 2 69.9
75 6 81.2
71 6 77.1
71 3 73.7
56 17 72.7
77 1 77.9
62 3 64.9
64 8 71.9
77 2 78.8
63 6 68.2
69 3 72.0
74 1 75.0
71 8 79.3
51 15 66.2
64 5 69.7
56.5
53.4
72 4 75.6 64 13 76.6 70 6 76.6
69 12 81.3**
62 16 77.8
61 6 67.5
60 7 67.0
64 9 73.8
73 4 77.5
NR
55 10 64.8
NA****
Figure 4. HEDIS 2007 Well-Child Visits in the Third, Fourth, Fifth, and Sixth Years of Life
Rates from Administrative Data and Medical Record Review Data
* SB/R is San Bernardino/Riverside ** Final rates may not equal the sum of the Administrative Rate and the Medical Record Rate due to rounding. *** NR indicates a rate was not reportable because the rate was materially biased or the plan chose not to report the rate. **** NA indicates the denominator for the rate was too small (<30) to calculate a reliable rate.

Medi-Cal Managed Care External Accountability Set 2007 HEDIS 2007 Health Plan Results
Delmarva Foundation 15
Well-Child Visits in the Third, Fourth, Fifth and Sixth Years of Life (W34) measure is part of the Use of Service domain. The Medi-Cal Managed Care weighted average of 74.3 percent is only 3.4 percentage points below the HPL of 77.5 percent. Seven health plan rates are above the HPL. Kaiser (S) San Diego’s rate of 53.4 percent is below the MPL of 56.7 percent. Alameda Alliance for Health and Western Health Advantage did not report rates for this measure. The Medi-Cal Managed Care weighted average of 74.3 percent exceeds the HEDIS 2006 national Medicaid average (63.3 percent), the HEDIS national Commercial average (64.4 percent) and California Healthy Families 2004 average (65.5 percent) as indicated in Table 4. Table 4. Well-Child Visits in the Third, Fourth, Fifth, and Sixth Years of Life Benchmarks
HEDIS 2007 Medi-Cal Managed Care Weighted Average
HEDIS 2006 National Medicaid
Average†
HEDIS 2006 National
Commercial Average‡
CA Healthy Families Average
2004††
Rate 74.3% 63.3% 64.4% 65.5%
† Rate obtained from NCQA’s Quality Compass (2006). ‡ Rate obtained from NCQA’s website: http://web.ncqa.org/Portals/0/HEDISQM/Programs/CompAud/MPR/HEDIS_2006_Means_Percentiles_Commercial.pdf †† Rate obtained from Healthy Families Website: http://www.healthyfamilies.ca.gov/English/Quality/survey_quality.htm

Medi-Cal Managed Care External Accountability Set 2007 HEDIS 2007 Health Plan Results
Delmarva Foundation 16
Figure 5. HEDIS 2007 Childhood Immunization Status (Combination #2)
1 MPL is HEDIS 2006 national Medicaid 25th Percentile and HPL is HEDIS national Medicaid 2006 90th Percentile. 2 SB/R is San Bernardino/Riverside. 3 NA indicates the denominator for the rate was too small (<30) to calculate a reliable rate. 4 NR is Not Reportable because the rate was materially biased or the plan chose not to report the rate. 5 GMC-N is Sacramento and GMC-S is San Diego.
COHSCPLI GMC-N5
GMC-SWHA - SacramentoBC of CA - San Francisco
BC of CA - Alameda
Care 1st - San DiegoCare 1st - Sacramento
BC of CA - Contra CostaAAH - Alameda
Health Net - Kern BC of CA - Santa Clara
Molina - SB/R
BC of CA - Stanislaus Molina - Sacramento
BC of CA - Sacramento
HPSJ - San JoaquinCCHP - Contra Costa
BC of CA - TulareLA Care - Los Angeles
IEHP - SB/R2 BC of CA - San Joaquin
HPSM - San MateoHealth Net - Tulare
Kaiser (N) - Sacramento
KFHC - Kern BC of CA - Fresno
Health Net - SacramentoBC of CA - San Diego
CHG - San DiegoHealth Net - Fresno Molina - San Diego
Health Net - StanislausPHP of CA - Solano/Yolo/Napa
Health Net - San DiegoCalOptima - Orange
Health Net - Los AngelesSCFHP - Santa Clara
SBRHA - Santa BarbaraCCAH - Monterey/Santa Cruz
Kaiser (S) - San Diego SFHP - San Francisco
Rates (%)
0 10 20 30 40 50 60 70 80 90 100
67.2
NR4
57.0
77.1
73.1
79.6
NR
75.7
68.3
70.8
74.8
82.6
85.6
74.2
79.8 79.8
68.1
83.3
77.4
81.9
80.9
76.6
73.5
76.4
75.3
76.6
86.6
76.9
75.2
71.5
70.4
80.6
81.9
84.9 84.7
90.3
NR
41.0
NA3
2007 Weighted Avg.(77.9%)
HPL (82.7%)MPL1 (62.7%)

Medi-Cal Managed Care External Accountability Set 2007 HEDIS 2007 Health Plan Results
Delmarva Foundation 17
Admin MRRWHA - Sacramento
Care 1st - San DiegoBC of CA - San Francisco
BC of CA - AlamedaCare 1st - Sacramento
BC of CA - Contra CostaAAH - Alameda
Health Net - Kern BC of CA - Santa Clara
Molina - SB/RBC of CA - Stanislaus Molina - Sacramento
BC of CA - SacramentoHPSJ - San Joaquin
CCHP - Contra CostaBC of CA - Tulare
LA Care - Los Angeles IEHP - SB/R**
BC of CA - San JoaquinHPSM - San MateoHealth Net - Tulare
Kaiser (N) - Sacramento
KFHC - Kern BC of CA - Fresno
Health Net - Sacramento BC of CA - San Diego
CHG - San DiegoHealth Net - Fresno Molina - San Diego
Health Net - Stanislaus PHP of CA - Solano/Yolo/Napa
Health Net - San DiegoCalOptima - Orange
Health Net - Los AngelesSCFHP - Santa Clara
SBRHA - Santa BarbaraCCAH - Monterey/Santa Cruz
Kaiser (S) - San Diego SFHP - San Francisco
Rates (%)
0 10 20 30 40 50 60 70 80 90 100
49 18 67.2
NR***
57.0
77.1
73 73.1
79 79.6
NR
2 74 75.7
68.3
2 69 70.8
74.8
34 49 82.6
36 50 85.6
58 17 74.2
55 25 79.8 46 34 79.8
46 22 68.1
4 79 83.3
18 59 77.4
58 24 81.9
80.9
47 30 76.6
73.5
8 69 76.4
44 31 75.3
76.6
86.6
25 52 76.9
8 67 75.2
16 56 71.5
10 60 70.4
47 34 80.6 35 47 81.9
57 28 84.9 34 51 84.7
14 76 90.3*
41.0
NA****
NA
Figure 6. HEDIS 2007 Childhood Immunization Status (Combination #2)
Rates from Administrative Data and Medical Record Review Data
* Final rates may not equal the sum of the Administrative Rate and the Medical Record Rate due to rounding. ** SB/R is San Bernardino/Riverside. *** NR indicates a rate was not reportable because the rate was materially biased or the plan chose not to report the rate. **** NA indicates the denominator for the rate was too small (<30) to calculate a reliable rate.

Medi-Cal Managed Care External Accountability Set 2007 HEDIS 2007 Health Plan Results
Delmarva Foundation 18
The Childhood Immunization Status (CIS) measure is part of the Effectiveness of Care domain. Six plans are above the HPL of 82.7 percent for CIS (Combination #2). Two health plans fall below the MPL of 62.7 percent. Due to an error in data collection by a medical record review vendor, six plans were unable to report a rate for this measure. The Medi-Cal Managed Care weighted average exceeds all three comparable benchmarks for this measure as indicated in Table 5. Table 5. Childhood Immunization Status (Combination #2) Benchmarks
HEDIS 2007 Medi-Cal Managed Care Weighted Average
HEDIS 2006 National Medicaid
Average†
HEDIS 2006 National
Commercial Average‡
CA Healthy Families Average 2004††
Rate 77.9% 70.4% 77.8% 75.0%
† Rate obtained from NCQA’s Quality Compass (2006). ‡ Rate obtained from NCQA’s website: http://web.ncqa.org/Portals/0/HEDISQM/Programs/CompAud/MPR/HEDIS_2006_Means_Percentiles_Commercial.pdf. †† Rate obtained from Healthy Families Website: http://www.healthyfamilies.ca.gov/English/Quality/survey_quality.htm.

Medi-Cal Managed Care External Accountability Set 2007 HEDIS 2007 Health Plan Results
Delmarva Foundation 19
Figure 7. HEDIS 2007 Adolescent Well-Care Visits
1 MPL is HEDIS 2006 national Medicaid 25th Percentile and HPL is HEDIS 2006 national Medicaid 90th Percentile. 2 SB/R is San Bernardino/Riverside. 3 NA indicates the denominator for the rate was too small (<30) to calculate a reliable rate. 4 GMC-N is Sacramento and GMC-S is San Diego.
COHSCPLI GMC-N4
GMC-SCare 1st - San DiegoKaiser (S) - San Diego BC of CA - Stanislaus
BC of CA - Contra CostaKaiser (N) - Sacramento
Health Net - Kern Health Net - Stanislaus
BC of CA - Alameda
Health Net - San DiegoBC of CA - San Diego
Health Net - TulareWHA - Sacramento
LA Care - Los Angeles BC of CA - Tulare
SBRHA - Santa Barbara
Health Net - Fresno HPSM - San Mateo
SCFHP - Santa ClaraPHP of CA - Solano/Yolo/Napa
BC of CA - San JoaquinHealth Net - Los Angeles
KFHC - Kern BC of CA - Sacramento
CHG - San DiegoCCHP - Contra Costa
IEHP - SB/R
Health Net - SacramentoBC of CA - San Francisco
HPSJ - San JoaquinAAH - Alameda
BC of CA - FresnoCCAH - Monterey/Santa Cruz
Care 1st - Sacramento
Molina - SB/R2
BC of CA - Santa Clara
SFHP - San Francisco Molina - San Diego
Molina - Sacramento CalOptima - Orange
Rates (%)
0 10 20 30 40 50 60 70 80 90 100
40.6
27.1
24.8
41.0
36.3
29.9
40.0
35.4
44.7
23.8
31.9
57.6
43.6
37.0
36.5
33.8
26.8
35.6
39.0
29.2
26.9
29.9
40.1
33.8
38.1
25.5
19.5
35.8
31.6
50.2
44.2
49.1
35.4
33.1
35.0
46.5
30.9
43.7
NA3
2007 Weighted Avg. (36.9%)
HPL (54.5%)MPL1 (32.9%)

Medi-Cal Managed Care External Accountability Set 2007 HEDIS 2007 Health Plan Results
Delmarva Foundation 20
Admin MRRCare 1st - San Diego
Kaiser (S) - San DiegoBC of CA - Stanislaus
BC of CA - Contra CostaKaiser (N) - Sacramento
Health Net - KernHealth Net - Stanislaus
BC of CA - AlamedaHealth Net - San Diego
BC of CA - San DiegoHealth Net - TulareWHA - Sacramento
LA Care - Los Angeles BC of CA - Tulare
SBRHA - Santa BarbaraHealth Net - Fresno HPSM - San Mateo
SCFHP - Santa ClaraPHP of CA - Solano/Yolo/Napa
BC of CA - San JoaquinHealth Net - Los Angeles
KFHC - Kern BC of CA - Sacramento
CHG - San DiegoCCHP - Contra Costa
IEHP - SB/RHealth Net - SacramentoBC of CA - San Francisco
HPSJ - San JoaquinAAH - Alameda
BC of CA - FresnoCCAH - Monterey/Santa Cruz
Care 1st - SacramentoMolina - SB/R**
BC of CA - Santa Clara SFHP - San Francisco
Molina - San DiegoMolina - Sacramento CalOptima - Orange
Rates (%)
0 10 20 30 40 50 60 70 80 90 100
33 8 40.6
20 7 27.1
18 7 24.8
37 4 41.0
31 5 36.3
22 8 29.9
37 3 40.0
30 6 35.4
36 8 44.7
20 4 23.8
20 12 31.9
46 12 57.6*
32 12 43.6
30 7 37.0
21 15 36.5
31 2 33.8
24 3 26.8
28 7 35.6
36 3 39.0
23 6 29.2
23 4 26.9
24 6 29.9
32 8 40.1
27 7 33.8
30 8 38.1
25.5
19.5
27 9 35.8
22 9 31.6
38 12 50.2
28 16 44.2
25 24 49.1
24 11 35.4
20 13 33.1
27 8 35.0
40 6 46.5
22 9 30.9
28 15 43.7
NA***
Figure 8. HEDIS 2007 Adolescent Well-Care Visits
Rates from Administrative Data and Medical Record Review Data
* Final rates may not equal the sum of the Administrative Rate and the Medical Record Rate due to rounding. ** SB/R is San Bernardino/Riverside. *** NA indicates the denominator for the rate was too small (<30) to calculate a reliable rate.

Medi-Cal Managed Care External Accountability Set 2007 HEDIS 2007 Health Plan Results
Delmarva Foundation 21
Adolescent Well-Care visits (AWC) measure is part of the Use of Service domain. One plan, CalOptima (57.6 percent), exceeds the HPL of 54.5 percent. Thirteen plans fall below the MPL of 32.9 percent. The Medi-Cal Managed Care weighted average (36.9 percent) is below the HEDIS 2006 national Medicaid average (40.6 percent), the HEDIS 2006 national Commercial average (38.7 percent) and the California Healthy Families 2004 average (37.0 percent) as indicated in Table 6. Table 6. Adolescent Well-Care Visits Benchmarks
HEDIS 2007 Medi-Cal Managed Care Weighted Average
HEDIS 2006 National Medicaid
Average†
HEDIS 2006 National
Commercial Average‡
CA Healthy Families Average 2004††
Rate 36.9% 40.6% 38.7% 37.0%
† Rate obtained from NCQA’s Quality Compass (2006). ‡ Rate obtained from NCQA’s website: http://web.ncqa.org/Portals/0/HEDISQM/Programs/CompAud/MPR/HEDIS_2006_Means_Percentiles_Commercial.pdf. †† Rate obtained from Healthy Families Website: http://www.healthyfamilies.ca.gov/English/Quality/survey_quality.htm

Medi-Cal Managed Care External Accountability Set 2007 HEDIS 2007 Health Plan Results
Delmarva Foundation 22
Figure 9. HEDIS 2007 Appropriate Treatment for Children with Upper Respiratory Infection
1 MPL is HEDIS 2006 national Medicaid 25th Percentile and HPL is HEDIS 2006 national Medicaid 90th Percentile. 2 SB/R is San Bernardino/Riverside. 3 NA indicates the denominator for the rate was too small (<30) to calculate a reliable rate. 4 GMC-N is Sacramento and GMC-S is San Diego.
COHSCPLI GMC-N4
GMC-SCare 1st - San DiegoHealth Net - Kern
Molina - SB/R
SBRHA - Santa BarbaraHealth Net - Los Angeles
IEHP - SB/R2 Health Net - Sacramento
BC of CA - Tulare
KFHC - Kern LA Care - Los Angeles
HPSJ - San JoaquinCalOptima - Orange
BC of CA - San Joaquin
CHG - San DiegoBC of CA - Stanislaus
Care 1st - SacramentoHealth Net - Tulare
Health Net - San DiegoBC of CA - Santa Clara
BC of CA - San DiegoHealth Net - Fresno
Health Net - StanislausBC of CA - Fresno
BC of CA - Contra CostaMolina - San Diego
Molina - Sacramento PHP of CA - Solano/Yolo/Napa
SCFHP - Santa Clara
HPSM - San MateoBC of CA - San Francisco
BC of CA - SacramentoCCAH - Monterey/Santa Cruz
CCHP - Contra Costa
Kaiser (S) - San Diego SFHP - San Francisco
WHA - SacramentoBC of CA - Alameda
AAH - Alameda Kaiser (N) - Sacramento
Rates (%)
0 10 20 30 40 50 60 70 80 90 100
93.6 93.3
87.6 87.3
90.7
85.8
90.4
82.4
85.6
82.8
75.1
79.7
91.8 91.8
82.7
86.8
69.0
72.6
73.6
84.6
87.2
84.1
78.4
90.2
73.0
96.4
92.0
76.7 78.3
88.2
70.9
87.9
88.4
71.5
89.8
92.6 92.8
83.7
NA3
2007 Weighted Avg.(78.9%)
HPL (92.1%) MPL1 (76.7%)

Medi-Cal Managed Care External Accountability Set 2007 HEDIS 2007 Health Plan Results
Delmarva Foundation 23
Figure 10. HEDIS 2007 Appropriate Treatment for Children with Upper Respiratory Infection
Rates from Administrative Data and Medical Record Review Data
Admin MRRCare 1s t- San Diego
Health Net - KernMolina - SB/R
SBRHA - Santa BarbaraHealth Net - Los Angeles
IEHP - SB/R**Health Net - Sacramento
BC of CA - TulareKFHC - Kern
LA Care - Los Angeles HPSJ - San JoaquinCalOptima - Orange
BC of CA - San JoaquinCHG - San Diego
BC of CA - Stanislaus Care 1st - Sacramento
Health Net - TulareHealth Net - San DiegoBC of CA - Santa Clara
BC of CA - San DiegoHealth Net - Fresno
Health Net - StanislausBC of CA - Fresno
BC of CA - Contra CostaMolina - San Diego
Molina - Sacramento PHP of CA - Solano/Yolo/Napa
SCFHP - Santa ClaraHPSM - San Mateo
BC of CA - San Francisco BC of CA - Sacramento
CCHP - Contra CostaCCAH - Monterey/Santa Cruz
Kaiser (S) - San DiegoSFHP - San Francisco
WHA - SacramentoBC of CA - Alameda
AAH - AlamedaKaiser (N) - Sacramento
Rates (%)
0 10 20 30 40 50 60 70 80 90 100
94
93
88
87
91
86
90
82
86
83
75
80
92 92
83
87
69
73
74
85
87
84
78
90
73
96*
92
77 78
88
71
88
88
72
90
93 93
84
NA***
* Final rates may not equal the sum of the Administrative Rate and the Medical Record Rate due to rounding. ** SB/R is San Bernardino/Riverside. *** NA indicates the denominator for the rate was too small (<30) to calculate a reliable rate.

Medi-Cal Managed Care External Accountability Set 2007 HEDIS 2007 Health Plan Results
Delmarva Foundation 24
The Appropriate Treatment for Children with Upper Respiratory Infection is part of the Effectiveness of Care domain. This measure is calculated using administrative data only. For HEDIS 2007, 5 health plans exceed the HPL of 92.1 percent for the Appropriate Treatment for Children with Upper Respiratory Infection measure. Seven plans are below the MPL of 76.7 percent. The Medi-Cal Managed Care weighted average of 78.9 percent is below the HEDIS 2006 national Medicaid average of 82.5 percent and the HEDIS 2006 national Commercial average of 82.9 percent as indicated in Table 7. Table 7. Appropriate Treatment for Children with Upper Respiratory Infection Benchmarks
HEDIS 2007 Medi-Cal
Managed Care Weighted Average
HEDIS 2006 National Medicaid Average†
HEDIS 2006 National Commercial Average‡
Rate 78.9% 82.5% 82.9%
† Rate obtained from NCQA’s Quality Compass (2006). ‡ Rate obtained from NCQA’s website: http://web.ncqa.org/Portals/0/HEDISQM/Programs/CompAud/MPR/HEDIS_2006_Means_Percentiles_Commercial.pdf
Women’s Health The Prenatal and Postpartum Care measure has two indicators, Timeliness of Prenatal Care and Postpartum Care and is part of the Access/Availability of Care domain. The results of both indicators are presented separately below.

Medi-Cal Managed Care External Accountability Set 2007 HEDIS 2007 Health Plan Results
Delmarva Foundation 25
COHSCPLI GMC-N5
GMC-S
WHA - SacramentoAAH - Alameda
Care 1st - San Diego
Care 1st - SacramentoHPSM - San Mateo
LA Care - Los Angeles BC of CA - Santa Clara
BC of CA - Contra Costa
BC of CA - AlamedaMolina - Sacramento
BC of CA - San Francisco Kaiser (S) - San Diego
CHG - San Diego
BC of CA - SacramentoHPSJ - San Joaquin
BC of CA - San JoaquinHealth Net - Kern
KFHC - Kern CalOptima - Orange
SCFHP - Santa ClaraBC of CA - Stanislaus
Health Net - Los AngelesBC of CA - Tulare
CCHP - Contra CostaHealth Net - Sacramento
BC of CA - Fresno
Molina - SB/RBC of CA - San Diego
Health Net - San DiegoKaiser (N) - Sacramento
IEHP - SB/R2
SBRHA - Santa BarbaraPHP of CA - Solano/Yolo/Napa
SFHP - San Francisco CCAH - Monterey/Santa Cruz
Health Net - Fresno Health Net - Tulare
Molina - San DiegoHealth Net - Stanislaus
Rates (%)
0 10 20 30 40 50 60 70 80 90 100
79.8
86.4
70.6
84.6
84.5
74.8
73.2
82.4
75.5
78.5
72.6
86.7
79.0
81.1
90.5
88.9
82.6
NR4
80.7
81.4
82.3
78.3
84.2
79.3
72.0
79.9
86.3
77.0
82.4
84.0
75.1
NR
46.7
83.0
75.9
83.6
75.9
89.6
NA3
2007 Weighted Avg. (79.4%)
HPL (91.5%) MPL1 (74.2%)
Figure 11. HEDIS 2007 Prenatal and Postpartum Care—Timeliness of Prenatal Care
1 MPL is HEDIS 2006 national Medicaid 25th Percentile and HPL is HEDIS 2006 national Medicaid 90th Percentile. 2 SB/R is San Bernardino/Riverside. 3 NA indicates the denominator for the rate was too small (<30) to calculate a reliable rate. 4 NR is Not Reportable because the rate was materially biased or the plan chose not to report the rate. 5 GMC-N is Sacramento and GMC-S is San Diego.

Medi-Cal Managed Care External Accountability Set 2007 HEDIS 2007 Health Plan Results
Delmarva Foundation 26
Admin MRRWHA - Sacramento
Care 1st - San DiegoAAH - Alameda
Care 1st - SacramentoHPSM - San Mateo
LA Care - Los Angeles BC of CA - Santa Clara
BC of CA - Contra CostaBC of CA - Alameda
Molina - Sacramento BC of CA - San Francisco
Kaiser (S) - San DiegoCHG - San Diego
BC of CA - SacramentoHPSJ - San Joaquin
BC of CA - San JoaquinHealth Net - Kern
KFHC - Kern CalOptima - Orange
SCFHP - Santa ClaraBC of CA - Stanislaus
Health Net - Los AngelesBC of CA - Tulare
CCHP - Contra CostaHealth Net - Sacramento
BC of CA - FresnoMolina - SB/R
BC of CA - San DiegoHealth Net - San Diego
Kaiser (N) - SacramentoIEHP - SB/R**
SBRHA - Santa BarbaraPHP of CA - Solano/Yolo/Napa
SFHP - San Francisco CCAH - Monterey/Santa Cruz
Health Net - Fresno Health Net - TulareMolina - San Diego
Health Net - Stanislaus
Rates (%)
0 10 20 30 40 50 60 70 80 90 100
63 17 79.8
60 27 86.4
38 32 70.6
50 35 84.6 63 22 84.5
71 3 74.8 70 4 73.2
77 6 82.4
70 6 75.5
74 5 78.5
65 7 72.6
80 6 86.7
54 25 79.0
33 48 81.1
81 10 90.5* 84 4 88.9
55 28 82.6
NR***
75 6 80.7
78 3 81.4 71 11 82.3
15 63 78.3
65 19 84.2
75 4 79.3
49 23 72.0
74 6 79.9
47 39 86.3
72 5 77.0
61 21 82.4
84.0
54 21 75.1
NR
7 40 46.7
74 9 83.0
61 15 75.9
67 17 83.6
75.9
65 25 89.6
NA****
Figure 12. HEDIS 2007 Timeliness of Prenatal Care
Rates from Administrative Data and Medical Record Review Data
* Final rates may not equal the sum of the Administrative Rate and the Medical Record Rate due to rounding. ** SB/R is San Bernardino/Riverside. *** NR indicates a rate was not reportable because the rate was materially biased or the plan chose not to report the rate. **** NA indicates the denominator for the rate was too small (<30) to calculate a reliable rate.

Medi-Cal Managed Care External Accountability Set 2007 HEDIS 2007 Health Plan Results
Delmarva Foundation 27
For the Timeliness of Prenatal care indicator, ten health plans are above the HEDIS 2006 national Medicaid average of 79.1 percent. Health Net – Stanislaus (90.5 percent) is within one percentage point of the HPL of 91.5 percent. Five plans are below the MPL of 74.2 percent. Alameda Alliance for Health and Western Health Advantage did not report a rate for this indicator. As shown in Table 8, the Medi-Cal managed care weighted average of 79.4 percent is in line with the HEDIS 2006 national Medicaid average. Table 8. Timeliness of Prenatal Care Benchmarks
HEDIS 2007 Medi-Cal
Managed Care Weighted Average
HEDIS 2006 National Medicaid Average†
HEDIS 2006 National Commercial Average‡
Rate 79.4% 79.1% 91.9%
† Rate obtained from NCQA’s Quality Compass (2006). ‡ Rate obtained from NCQA’s website: http://web.ncqa.org/Portals/0/HEDISQM/Programs/CompAud/MPR/HEDIS_2006_Means_Percentiles_Commercial.pdf.

Medi-Cal Managed Care External Accountability Set 2007 HEDIS 2007 Health Plan Results
Delmarva Foundation 28
Figure 13. HEDIS 2007 Prenatal and Postpartum Care—Postpartum Care
1 MPL is HEDIS 2006 national Medicaid 25th Percentile and HPL is HEDIS 2006 national Medicaid 90th Percentile. 2 SB/R is San Bernardino/Riverside. 3 NA indicates the denominator for the rate was too small (<30) to calculate a reliable rate. 4 NR is Not Reportable because the rate was materially biased or the plan chose not to report the rate. 5 GMC-N is Sacramento and GMC-S is San Diego.
COHSCPLI GMC-N5
GMC-SWHA - Sacramento
Care 1st - San DiegoBC of CA - Contra Costa
Kaiser (S) - San Diego Molina - Sacramento
BC of CA - San JoaquinCHG - San Diego
BC of CA - Santa ClaraLA Care - Los Angeles
Care 1st - SacramentoBC of CA - San Francisco
Health Net - Stanislaus
BC of CA - AlamedaHealth Net - San Diego
HPSM - San Mateo
SFHP - San Francisco CCHP - Contra Costa
Molina - SB/RMolina - San Diego
Health Net - Los AngelesHPSJ - San Joaquin
BC of CA - Fresno
BC of CA - Stanislaus Health Net - Sacramento
SCFHP - Santa ClaraBC of CA - San Diego
Health Net - Kern BC of CA - Sacramento
CalOptima - OrangeIEHP - SB/R2
AAH - Alameda Health Net - Fresno Health Net - Tulare
BC of CA - Tulare
KFHC - Kern Kaiser (N) - Sacramento
PHP of CA - Solano/Yolo/Napa
CCAH - Monterey/Santa CruzSBRHA - Santa Barbara
Rates (%)
0 10 20 30 40 50 60 70 80 90 100
59.8
72.0
55.0
64.3
73.5
54.2
44.2
57.6
51.9
49.3
50.1
62.7
59.3
56.9
53.6
62.7
56.3
61.9
57.9
63.0
56.3
57.2
60.0
63.8
50.2
58.3
55.9
59.5
58.1
64.3
48.8
NR4
51.1
58.9
49.6
54.5
45.4
56.8
NA3
2007 Weighted Avg. (58.7%)
HPL (71.1%) MPL1 (49.7%)

Medi-Cal Managed Care External Accountability Set 2007 HEDIS 2007 Health Plan Results
Delmarva Foundation 29
Admin MRRWHA - Sacramento
Care 1st - San DiegoBC of CA - Contra Costa
Kaiser (S) - San DiegoMolina - Sacramento
BC of CA - San JoaquinCHG - San Diego
BC of CA - Santa Clara LA Care - Los Angeles
Care 1st - SacramentoBC of CA - San Francisco
Health Net - StanislausBC of CA - Alameda
Health Net - San DiegoHPSM - San Mateo
SFHP - San Francisco CCHP - Contra Costa
Molina - SB/RMolina - San Diego
Health Net - Los AngelesHPSJ - San Joaquin
BC of CA - FresnoBC of CA - Stanislaus
Health Net - SacramentoSCFHP - Santa ClaraBC of CA - San Diego
Health Net - Kern BC of CA - Sacramento
CalOptima - OrangeIEHP - SB/R**
AAH - Alameda Health Net - Fresno Health Net - Tulare
BC of CA - Tulare
KFHC - KernKaiser (N) - Sacramento
PHP of CA - Solano/Yolo/NapaCCAH - Monterey/Santa Cruz
SBRHA - Santa Barbara
Rates (%)
0 10 20 30 40 50 60 70 80 90 100
43 16 59.8
55 17 72.0
43 12 55.0
42 22 64.3
51 23 73.5*
52 2 54.2
41 3 44.2
55 3 57.6
50 2 51.9
36 13 49.3
46 4 50.1
56 7 62.7
51 8 59.3
25 32 56.9
45 8 53.6
59 4 62.7
31 25 56.3
56 6 61.9
54 4 57.9
61 2 63.0
54 2 56.3
40 17 57.2
42 18 60.0
59 5 63.8
32 18 50.2
55 4 58.3
44 12 55.9
54 6 59.5
39 19 58.1
64.3
28 20 48.8
NR****
38 13 51.1
49 10 58.9
32 18 49.6
35 19 54.5
45.4
34 23 56.8
NA***
Figure 14. HEDIS 2007 Postpartum Care
Rates from Administrative Data and Medical Record Review Data
* Final rates may not equal the sum of the Administrative Rate and the Medical Record Rate due to rounding. ** SB/R is San Bernardino/Riverside. *** NA indicates the denominator for the rate was too small (<30) to calculate a reliable rate. **** NR indicates a rate was not reportable because the rate was materially biased or the plan chose not to report the rate.

Medi-Cal Managed Care External Accountability Set 2007 HEDIS 2007 Health Plan Results
Delmarva Foundation 30
Central Coast Alliance for Health (72.0 percent) and Santa Barbara Regional Health Alliance (73.5 percent) exceed the HPL 71.1 percent. Four plans are below the MPL of 49.7 percent. Western Health Advantage did not report this rate. The Medi-Cal managed care weighted average of 58.7 percent is above the HEDIS 2006 national Medicaid average of 57.0 percent as shown in Table 9. Table 9. Postpartum Care Benchmarks
HEDIS 2007 Medi-Cal
Managed Care Weighted Average
HEDIS 2006 National Medicaid Average†
HEDIS 2006 National Commercial Average‡
Rate 58.7% 57.0% 81.5%
† Rate obtained from NCQA’s Quality Compass (2006). ‡ Rate obtained from NCQA’s website: http://web.ncqa.org/Portals/0/HEDISQM/Programs/CompAud/MPR/HEDIS_2006_Means_Percentiles_Commercial.pdf.
Medi-Cal Managed Care External Accountability Set 2007 HEDIS 2007 Health Plan Results
Delmarva Foundation 31
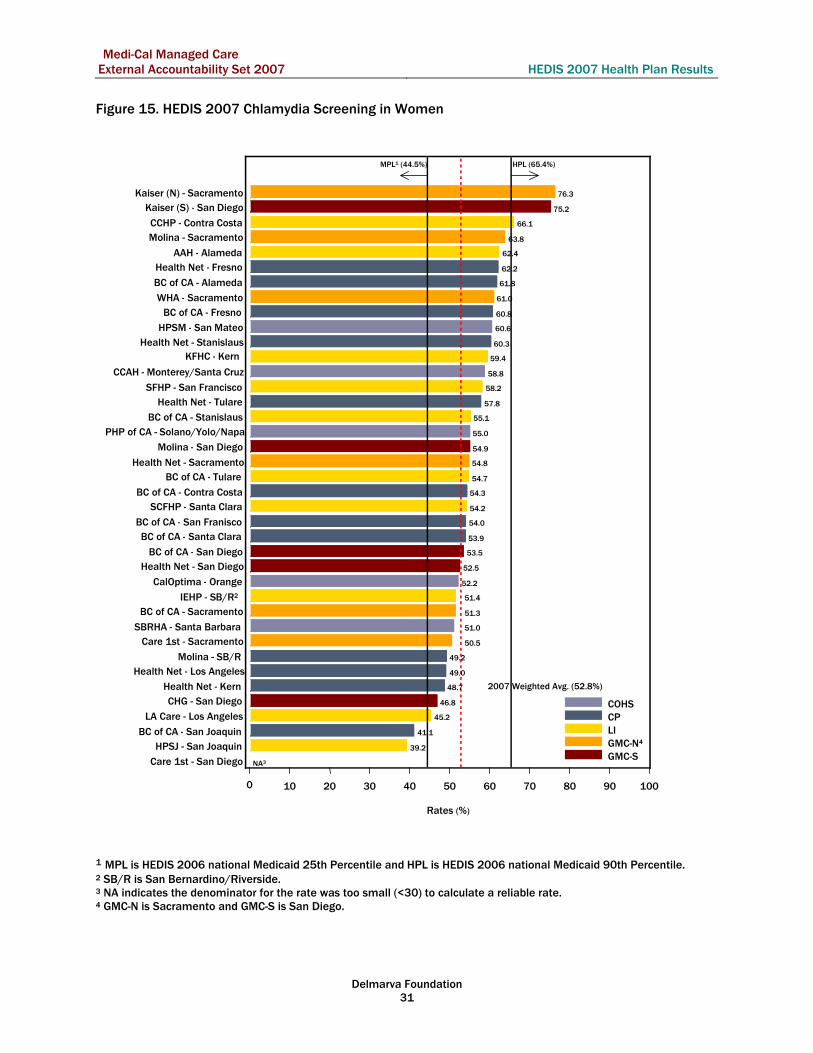
Figure 15. HEDIS 2007 Chlamydia Screening in Women
1 MPL is HEDIS 2006 national Medicaid 25th Percentile and HPL is HEDIS 2006 national Medicaid 90th Percentile. 2 SB/R is San Bernardino/Riverside. 3 NA indicates the denominator for the rate was too small (<30) to calculate a reliable rate. 4 GMC-N is Sacramento and GMC-S is San Diego.
COHSCPLI GMC-N4
GMC-SCare 1st - San DiegoHPSJ - San Joaquin
BC of CA - San Joaquin
LA Care - Los Angeles CHG - San Diego
Health Net - Kern Health Net - Los Angeles
Molina - SB/R
Care 1st - SacramentoSBRHA - Santa Barbara
BC of CA - SacramentoIEHP - SB/R2
CalOptima - Orange
Health Net - San DiegoBC of CA - San Diego
BC of CA - Santa ClaraBC of CA - San Franisco
SCFHP - Santa ClaraBC of CA - Contra Costa
BC of CA - TulareHealth Net - Sacramento
Molina - San DiegoPHP of CA - Solano/Yolo/Napa
BC of CA - Stanislaus Health Net - Tulare
SFHP - San Francisco CCAH - Monterey/Santa Cruz
KFHC - Kern Health Net - Stanislaus
HPSM - San MateoBC of CA - Fresno
WHA - SacramentoBC of CA - Alameda
Health Net - Fresno AAH - Alameda
Molina - Sacramento CCHP - Contra Costa
Kaiser (S) - San Diego Kaiser (N) - Sacramento
Rates (%)
0 10 20 30 40 50 60 70 80 90 100
62.4
61.8
54.3
60.8
51.3
53.5
54.0
41.1
53.9
55.1
54.7
52.2
58.8
66.1
46.8
62.2
48.7
49.0
54.8
52.5
60.3
57.8
39.2
60.6
51.4
76.3 75.2
59.4
45.2
63.8
49.2
54.9
55.0
51.0
54.2
58.2
61.0
50.5
NA3
2007 Weighted Avg. (52.8%)
HPL (65.4%)MPL1 (44.5%)

Medi-Cal Managed Care External Accountability Set 2007 HEDIS 2007 Health Plan Results
Delmarva Foundation 32
Admin MRRCare 1st - San Diego
HPSJ - San JoaquinBC of CA - San Joaquin
LA Care - Los Angeles CHG - San Diego
Health Net - Kern Health Net - Los Angeles
Molina - SB/RCare 1st - Sacramento
SBRHA - Santa BarbaraBC of CA - Sacramento
IEHP - SB/R** CalOptima - Orange
Health Net - San DiegoBC of CA - San Diego
BC of CA - Santa ClaraBC of CA - San Franisco
SCFHP - Santa ClaraBC of CA - Contra Costa
BC of CA - TulareHealth Net - Sacramento
Molina - San DiegoPHP of CA - Solano/Yolo/Napa
BC of CA - Stanislaus Health Net - Tulare
SFHP - San Francisco CCAH - Monterey/Santa Cruz
KFHC - Kern Health Net - Stanislaus
HPSM - San MateoBC of CA - Fresno
WHA - SacramentoBC of CA - AlamedaHealth Net - Fresno
AAH - Alameda Molina - Sacramento CCHP - Contra Costa
Kaiser (S) - San Diego Kaiser (N) - Sacramento
Rates (%)
0 10 20 30 40 50 60 70 80 90 100
62.4
61.8
54.3
60.8
51.3
53.5
54.0
41.1
53.9
55.1
54.7
52.2
58.8
66.1
46.8
62.2
48.7
49.0
54.8
52.5
60.3
57.8
39.2
60.6
51.4
76.3* 75.2
59.4
45.2
63.8
49.2
54.9
55.0
51.0
54.2
58.2
61.0
50.5
NA***
Figure 16 HEDIS 2007 Chlamydia Screening in Women
Rates from Administrative Data
* Final rates may not equal the sum of the Administrative Rate and the Medical Record Rate due to rounding. ** SB/R is San Bernardino/Riverside. *** NA indicates the denominator for the rate was too small (<30) to calculate a reliable rate.

Medi-Cal Managed Care External Accountability Set 2007 HEDIS 2007 Health Plan Results
Delmarva Foundation 33
Chlamydia Screening in Women is part of Effectiveness of Care domain. Three plans have rates above the HPL of 65.4 percent, CCHP-Contra Costa, Kaiser (N) - Sacramento and Kaiser (S) - San Diego. Both Kaiser (N) and Kaiser (S) had rates greater than 75 percent for this indicator. BC of CA – San Joaquin and HPSJ – San Joaquin rates are below the MPL (44.5 percent). The Medi-Cal managed care weighted average for Chlamydia Screening in Women (CHL) is 52.8 percent and 2.2 percentage points above the HEDIS 2006 national Medicaid average of 50.6 percent as shown in Table 10. Table 10. Chlamydia Screening in Women Benchmarks
HEDIS 2007 Medi-Cal
Managed Care Weighted Average
HEDIS 2006 National Medicaid Average†
HEDIS 2006 National Commercial Average‡
Rate 52.8% 50.6% 34.9%
† Rate obtained from NCQA’s Quality Compass (2006). ‡ Rate obtained from NCQA’s website: http://web.ncqa.org/Portals/0/HEDISQM/Programs/CompAud/MPR/HEDIS_2006_Means_Percentiles_Commercial.pdf.

Medi-Cal Managed Care External Accountability Set 2007 HEDIS 2007 Health Plan Results
Delmarva Foundation 34
Figure 17. HEDIS 2007 Cervical Cancer Screening
1 SB/R is San Bernardino/Riverside. 2 NA indicates the denominator for the rate was too small (<30) to calculate a reliable rate. 3 GMC-N is Sacramento and GMC-S is San Diego.
COHSCPLI GMC-N3
GMC-SCare 1st - San Diego
Care 1st - SacramentoHealth Net - Kern
HPSM - San Mateo
BC of CA - Contra CostaBC of CA - San Joaquin
Health Net - SacramentoWHA - Sacramento
Molina - SB/RBC of CA - Stanislaus Molina - Sacramento
Health Net - Stanislaus
BC of CA - SacramentoHealth Net - San Diego
HPSJ - San Joaquin
KFHC - Kern PHP of CA - Solano/Yolo/Napa
BC of CA - AlamedaBC of CA - San Diego
IEHP - SB/R1
Health Net - Los Angeles
Molina - San Diego
CHG - San DiegoCCHP - Contra Costa
Health Net - Fresno BC of CA - Fresno
LA Care - Los Angeles SCFHP - Santa Clara
SBRHA - Santa BarbaraBC of CA - San Francisco
Health Net - TulareBC of CA - Santa Clara
CalOptima - Orange
Kaiser (S) - San Diego BC of CA - Tulare
Kaiser (N) - SacramentoSFHP - San Francisco
CCAH - Monterey/Santa CruzAAH - Alameda
Rates (%)
0 10 20 30 40 50 60 70 80 90 100
77.4
63.9
57.2
69.4
62.2
63.9
70.8
57.3
71.8
58.9
75.6
72.7
77.4
67.4
66.7
68.2
54.4
65.9
57.7
62.6
60.1
70.9
62.6
55.0
65.5
76.8
74.7
63.1
70.4
59.3
58.9
66.0
63.7
70.6
70.4
77.2
58.4
42.2NA2
2007 Weighted Avg. (67.9%)
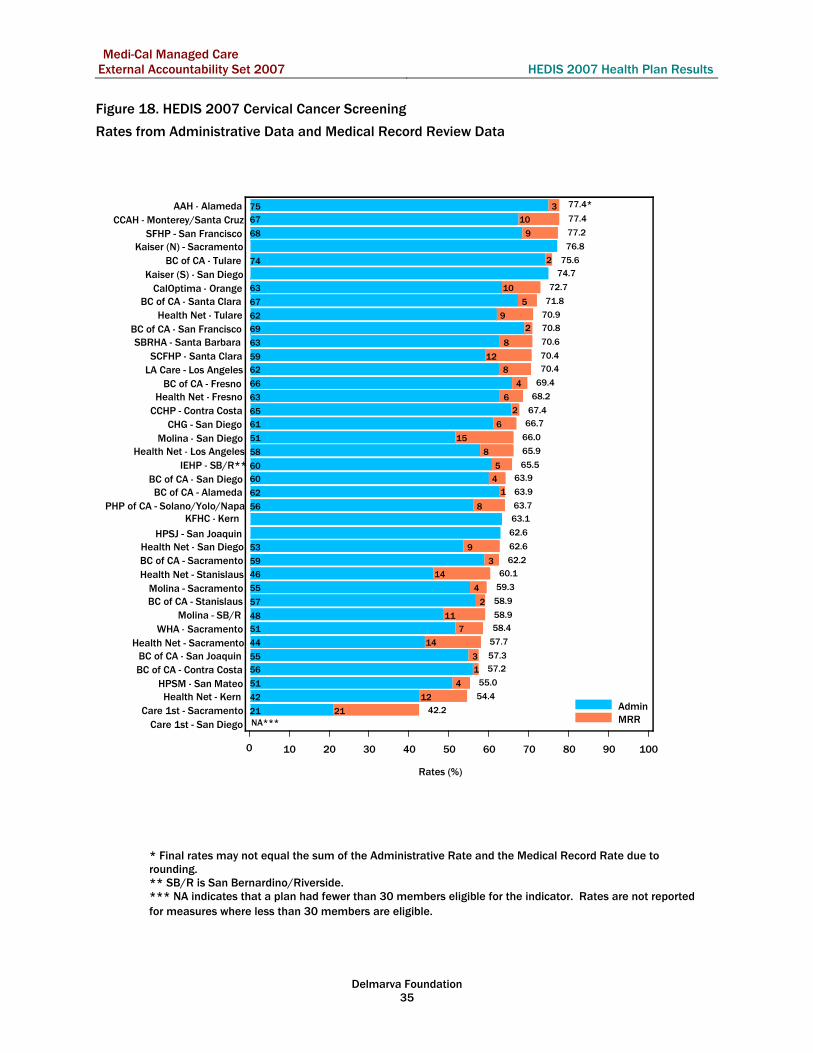
Medi-Cal Managed Care External Accountability Set 2007 HEDIS 2007 Health Plan Results
Delmarva Foundation 35
Admin MRRCare 1st - San Diego
Care 1st - SacramentoHealth Net - Kern
HPSM - San MateoBC of CA - Contra CostaBC of CA - San Joaquin
Health Net - SacramentoWHA - Sacramento
Molina - SB/RBC of CA - Stanislaus Molina - Sacramento
Health Net - StanislausBC of CA - SacramentoHealth Net - San Diego
HPSJ - San Joaquin
KFHC - Kern PHP of CA - Solano/Yolo/Napa
BC of CA - AlamedaBC of CA - San Diego
IEHP - SB/R**Health Net - Los Angeles
Molina - San DiegoCHG - San Diego
CCHP - Contra CostaHealth Net - Fresno
BC of CA - FresnoLA Care - Los Angeles SCFHP - Santa Clara
SBRHA - Santa BarbaraBC of CA - San Francisco
Health Net - TulareBC of CA - Santa Clara
CalOptima - OrangeKaiser (S) - San Diego
BC of CA - TulareKaiser (N) - Sacramento
SFHP - San Francisco CCAH - Monterey/Santa Cruz
AAH - Alameda
Rates (%)
0 10 20 30 40 50 60 70 80 90 100
75 3
77.4*
62 1 63.9
56 1 57.2
66 4 69.4
59 3 62.2
60 4 63.9
69 2 70.8
55 3 57.3
67 5 71.8
57 2 58.9
74 2 75.6
63 10 72.7
67 10 77.4
65 2 67.4
61 6 66.7
63 6 68.2
42 12 54.4
58 8 65.9
44 14 57.7
53 9 62.6
46 14 60.1
62 9 70.9
62.6
51 4 55.0
60 5 65.5
76.8
74.7
63.1
62 8 70.4
55 4 59.3
48 11 58.9
51 15 66.0
56 8 63.7
63 8 70.6
59 12 70.4
68 9 77.2
51 7 58.4
21 21 42.2NA***
Figure 18. HEDIS 2007 Cervical Cancer Screening
Rates from Administrative Data and Medical Record Review Data
* Final rates may not equal the sum of the Administrative Rate and the Medical Record Rate due to rounding. ** SB/R is San Bernardino/Riverside. *** NA indicates that a plan had fewer than 30 members eligible for the indicator. Rates are not reported for measures where less than 30 members are eligible.

Medi-Cal Managed Care External Accountability Set 2007 HEDIS 2007 Health Plan Results
Delmarva Foundation 36
Cervical Cancer Screening is a measure in the Effectiveness of Care domain and is one of four HEDIS 2007 measures with revisions to the technical specifications significant enough to affect the performance of all plans. For this reason, DHCS did not apply MPL and HPL benchmarks to this measure. The change to Cervical Cancer Screening specifications is an increase in the lower age limit from 18 to 21 years. The Medi-Cal managed care weighted average of 67.9 percent is above the HEDIS 2006 national Medicaid average of (65.0 percent) but below the HEDIS 2006 national Commercial average (81.8 percent) as indicated in Table 11. Table 11. Cervical Cancer Screening Benchmarks
HEDIS 2007 Medi-Cal
Managed Care Weighted Average
HEDIS 2006 National Medicaid Average†
HEDIS 2006 National Commercial Average‡
Rate 67.9% 65.0% 81.8%
† Rate obtained from NCQA’s Quality Compass (2006). ‡ Rate obtained from NCQA’s website: http://web.ncqa.org/Portals/0/HEDISQM/Programs/CompAud/MPR/HEDIS_2006_Means_Percentiles_Commercial.pdf.

Medi-Cal Managed Care External Accountability Set 2007 HEDIS 2007 Health Plan Results
Delmarva Foundation 37
Figure 19. HEDIS 2007 Breast Cancer Screening
1 SB/R is San Bernardino/Riverside. 2 NA indicates the denominator for the rate was too small (<30) to calculate a reliable rate. 3 GMC-N is Sacramento and GMC-S is San Diego.
COHSCPGMC-N3
GMC-SLI Molina - San Diego
Health Net - StanislausCare 1st - San Diego
Care 1st - SacramentoHealth Net - Kern
Health Net - Los AngelesHealth Net - San Diego
Health Net - Tulare
Molina - SB/RBC of CA - Alameda
BC of CA - Contra CostaBC of CA - Sacramento
Molina - Sacramento Health Net - Sacramento
BC of CA - Stanislaus BC of CA - San Joaquin
Health Net - Fresno LA Care - Los Angeles
WHA - Sacramento
BC of CA - San DiegoBC of CA - Fresno
CCHP - Contra CostaCHG - San Diego
IEHP - SB/R1 KFHC - Kern
HPSJ - San Joaquin
BC of CA - TulareHPSM - San Mateo
CalOptima - OrangePHP of CA - Solano/Yolo/Napa
AAH - Alameda SBRHA - Santa Barbara
SCFHP - Santa Clara
SFHP - San Francisco CCAH - Monterey/Santa Cruz
BC of CA - San Francisco Kaiser (N) - Sacramento
BC of CA - Santa ClaraKaiser (S) - San Diego
Rates (%)
0 10 20 30 40 50 60 70 80 90 100
55.5
42.7
42.8
46.9
43.7
46.9
58.9
45.4
62.6
44.6
53.0
55.1
58.6
47.5
48.8
45.5
34.6
39.2
44.4
41.0
NA
41.3
52.9
54.1
49.0
62.1
69.3
49.7
45.5
43.8
41.4
NA
55.5
56.1
56.1
57.7
46.6
NA2 NA
2007 Weighted Avg.(48.6%)

Medi-Cal Managed Care External Accountability Set 2007 HEDIS 2007 Health Plan Results
Delmarva Foundation 38
Admin MRRMolina - San Diego
Health Net - StanislausCare 1st - San Diego
Care 1st - SacramentoHealth Net - Kern
Health Net - Los AngelesHealth Net - San Diego
Health Net - TulareMolina - SB/R
BC of CA - AlamedaBC of CA - Contra CostaBC of CA - Sacramento
Molina - Sacramento Health Net - Sacramento
BC of CA - Stanislaus BC of CA - San Joaquin
LA Care - Los Angeles Health Net - Fresno WHA - Sacramento
BC of CA - San Diego BC of CA - Fresno
CCHP - Contra CostaCHG - San Diego IEHP - SB/R**
KFHC - Kern HPSJ - San Joaquin
BC of CA - TulareHPSM - San Mateo
CalOptima - OrangePHP of CA - Solano/Yolo/Napa
AAH - AlamedaSCFHP - Santa Clara
SBRHA - Santa BarbaraSFHP - San Francisco
CCAH - Monterey/Santa CruzBC of CA - San Francisco Kaiser (N) - Sacramento
BC of CA - Santa Clara Kaiser (S) - San Diego
Rates (%)
0 10 20 30 40 50 60 70 80 90 100
55.5
42.7
42.8
46.9
43.7
46.9
58.9
45.4
62.6
44.6
53.0
55.1
58.6
47.5
48.8
45.5
34.639.2
44.4
41.0
NA
41.3
52.9
54.1
49.0
62.1
69.3*
49.7
45.5
43.8
41.4
NA
55.5
56.1
56.1
57.7
46.6
NA*** NA
Figure 20. HEDIS 2007 Breast Cancer Screening
Rates from Administrative Data
* Final rates may not equal the sum of the Administrative Rate and the Medical Record Rate due to rounding. ** SB/R is San Bernardino/Riverside *** NA indicates the denominator for the rate was too small (<30) to calculate a reliable rate.

Medi-Cal Managed Care External Accountability Set 2007 HEDIS 2007 Health Plan Results
Delmarva Foundation 39
The Breast Cancer Screening measure is in the Effectiveness of Care domain and was significantly revised for HEDIS 2007; therefore, the HPL and MPL are not applied. The age for screenings was lowered from 42 to 40 years. As shown in Table 12, the Medi-Cal managed care weighted average is 48.6 percent which is 5.3 percentage points below the national Medicaid Average. Table 12. Breast Cancer Screening Benchmarks
HEDIS 2007 Medi-Cal
Managed Care Weighted Average
HEDIS 2006 National Medicaid Average†
HEDIS 2006 National Commercial Average‡
Rate 48.6% 53.9% 72.0%
† Rate obtained from NCQA’s Quality Compass (2006). ‡ Rate obtained from NCQA’s website: http://web.ncqa.org/Portals/0/HEDISQM/Programs/CompAud/MPR/HEDIS_2006_Means_Percentiles_Commercial.pdf .
Living with Illness The Comprehensive Diabetes Care measure is comprised of nine indicators in the Effectiveness of Care domain. Health plans were required to report on four of the nine indicators including Eye Exam (Retinal) Performed, Hemoglobin A1c (HbA1c) Testing, Low-Density Lipoprotein (LDL) Screening Performed, and Medical Attention for Nephropathy. The results of each indicator follow.

Medi-Cal Managed Care External Accountability Set 2007 HEDIS 2007 Health Plan Results
Delmarva Foundation 40
COHSCPLI GMC-N4
GMC-SCare 1st - San Diego
Care 1st - Sacramento
KFHC - Kern LA Care - Los Angeles BC of CA - Stanislaus
HPSJ - San JoaquinBC of CA - Contra CostaBC of CA - Sacramento
BC of CA - AlamedaBC of CA - Tulare
BC of CA - San JoaquinBC of CA - San Diego
SCFHP - Santa ClaraHealth Net - Kern
WHA - Sacramento
Health Net - StanislausAAH - Alameda
Health Net - Los AngelesHealth Net - Sacramento
CCHP - Contra CostaHPSM - San Mateo
BC of CA - Fresno
CHG - San DiegoHealth Net - San Diego
Health Net - Fresno Molina - San Diego
BC of CA - San Francisco Molina - SB/R
Health Net - TulareIEHP - SB/R2
BC of CA - Santa ClaraSFHP - San Francisco Molina - Sacramento
Kaiser (N) - SacramentoPHP of CA - Solano/Yolo/Napa
Kaiser (S) - San Diego CalOptima - Orange
CCAH - Monterey/Santa CruzSBRHA - Santa Barbara
Rates (%)
0 10 20 30 40 50 60 70 80 90 100
53.3
47.7
45.8
54.9
47.0
50.4
57.9
48.8
63.6
39.4
48.0
68.3
68.6
54.0
55.5
57.6
51.8
53.6
53.6
55.8
53.2
59.1
42.3
54.7
60.9
65.7
67.2
37.7
39.4
64.9
58.9
57.8
67.0
81.6
51.7
64.8
52.3
NA3 NA
2007 Weighted Avg. (54.1%)
HPL (68.1%)MPL1 (35.2%)
Figure 21. HEDIS 2007 Comprehensive Diabetes Care—Eye Exam (Retinal) Performed
1 MPL is HEDIS 2006 national Medicaid 25th Percentile and HPL is HEDIS 2006 national Medicaid 90th Percentile. 2 SB/R is San Bernardino/Riverside. 3 NA indicates the denominator for the rate was too small (<30) to calculate a reliable rate. 4 GMC-N is Sacramento and GMC-S is San Diego.

Medi-Cal Managed Care External Accountability Set 2007 HEDIS 2007 Health Plan Results
Delmarva Foundation 41
Admin MRRCare 1st - San Diego
Care 1st - Sacramento
KFHC - Kern LA Care - Los Angeles BC of CA - Stanislaus
HPSJ - San JoaquinBC of CA - Contra CostaBC of CA - Sacramento
BC of CA - AlamedaBC of CA - Tulare
BC of CA - San JoaquinBC of CA - San DiegoSCFHP - Santa Clara
Health Net - Kern WHA - Sacramento
Health Net - StanislausAAH - Alameda
Health Net - Los AngelesHealth Net - Sacramento
CCHP - Contra CostaHPSM - San MateoBC of CA - FresnoCHG - San Diego
Health Net - San DiegoHealth Net - Fresno Molina - San Diego
BC of CA - San Francisco Molina - SB/R
Health Net - TulareIEHP - SB/R**
BC of CA - Santa ClaraSFHP - San Francisco Molina - Sacramento
Kaiser (N) - SacramentoPHP of CA - Solano/Yolo/Napa
Kaiser (S) - San Diego CalOptima - Orange
CCAH - Monterey/Santa CruzSBRHA - Santa Barbara
Rates (%)
0 10 20 30 40 50 60 70 80 90 100
49 4 53.3
44 3 47.7
43 3 45.8
51 4 54.9
41 6 47.0
45 5 50.4
56 1 57.9
46 2 48.8
55 9 63.6
33 6 39.4
42 6 48.0
46 22 68.352 16 68.6
50 4 54.0
50 6 55.5
51 6 57.6
45 7 51.8
43 11 53.638 15 53.6
49 6 55.8
48 5 53.2
51 9 59.1
25 18 42.3
43 12 54.7
40 21 60.9
65.7
67.2
37.715 25 39.4
54 10 64.9
46 13 58.9
49 8 57.8
56 11 67.0
75 6 81.6*
39 13 51.7
22 43 64.8
42 10 52.3
NA*** NA
Figure 22. HEDIS 2007 Comprehensive Diabetes Care—Eye Exam (Retinal) Performed*
Rates from Administrative Data and Medical Record Review Data
* Final rates may not equal the sum of the Administrative Rate and the Medical Record Rate due to rounding. ** SB/R is San Bernardino/Riverside. *** NA indicates the denominator for the rate was too small (<30) to calculate a reliable rate.

Medi-Cal Managed Care External Accountability Set 2007 HEDIS 2007 Health Plan Results
Delmarva Foundation 42
For the Comprehensive Diabetes Care- Eye Exam (Retinal) Performed, SBRHA – Santa Barbara and CCAH- Monterey and Santa Cruz rates are above the HPL (68.1 percent). SBRHA – Santa Barbara’s rate of 81.6 percent is 13.5 percentage points above the HPL. All plan rates are above the MPL of 35.2 percent. As shown in Table 13, the Medi-Cal managed care weighted average (54.1 percent) exceeded the national Medicaid average of 48.6 percent and was within one percentage point of the HEDIS 2006 national Commercial average of 54.8 percent. Table 13. Comprehensive Diabetes Care—Eye Exam (Retinal) Performed Benchmarks
HEDIS 2007 Medi-Cal
Managed Care Weighted Average
HEDIS 2006 National Medicaid Average†
HEDIS 2006 National Commercial Average‡
Rate 54.1% 48.6% 54.8%
† Rate obtained from NCQA’s Quality Compass (2006). ‡ Rate obtained from NCQA’s website: http://web.ncqa.org/Portals/0/HEDISQM/Programs/CompAud/MPR/HEDIS_2006_Means_Percentiles_Commercial.pdf.

Medi-Cal Managed Care External Accountability Set 2007 HEDIS 2007 Health Plan Results
Delmarva Foundation 43
Figure 23. HEDIS 2007 Comprehensive Diabetes Care — HbA1c Testing
1 MPL is HEDIS 2006 national Medicaid 25th Percentile and HPL is HEDIS 2006 national Medicaid 90th Percentile. 2 SB/R is San Bernardino/Riverside. 3 NA indicates the denominator for the rate was too small (<30) to calculate a reliable rate. 4 GMC-N is Sacramento and GMC-S is San Diego.
COHSCP LI GMC-N4
GMC-SCare 1st - San DiegoCare 1st - SacramentoBC of CA - Sacramento
CHG - San DiegoBC of CA - San JoaquinBC of CA - Contra Costa
BC of CA - Stanislaus BC of CA - Alameda
BC of CA - San Francisco LA Care - Los Angeles
KFHC - Kern Molina - SB/R
HPSJ - San Joaquin
AAH - AlamedaBC of CA - Tulare
Health Net - KernHealth Net - Sacramento
Health Net - Los AngelesMolina - Sacramento
IEHP - SB/R2
CCHP - Contra Costa
Molina - San DiegoWHA - SacramentoHealth Net - Tulare
BC of CA - Santa Clara BC of CA - Fresno
Health Net - Fresno PHP of CA - Solano/Yolo/Napa
CalOptima - OrangeHPSM - San Mateo
CCAH - Monterey/Santa CruzSCFHP - Santa Clara
Kaiser (N) - Sacramento
BC of CA - San Diego SFHP - San Francisco
Health Net - StanislausHealth Net - San Diego
Kaiser (S) - San DiegoSBRHA - Santa Barbara
Rates (%)
0 10 20 30 40 50 60 70 80 90 100
76.2
74.0
73.6
82.8
68.0
85.6
74.3
72.5
82.4
73.8
76.6
83.8
84.2
80.3
72.0
83.3
77.7
78.9 78.7
88.3 86.1
82.1
75.4
84.2
80.0
85.0
89.8
75.2
74.9
79.9
75.2
81.0
83.4
93.2
84.5
86.0
82.0
NA3 NA
2007 Weighted Avg. (79.5%)
HPL (88.8%)MPL1 (71.1%)
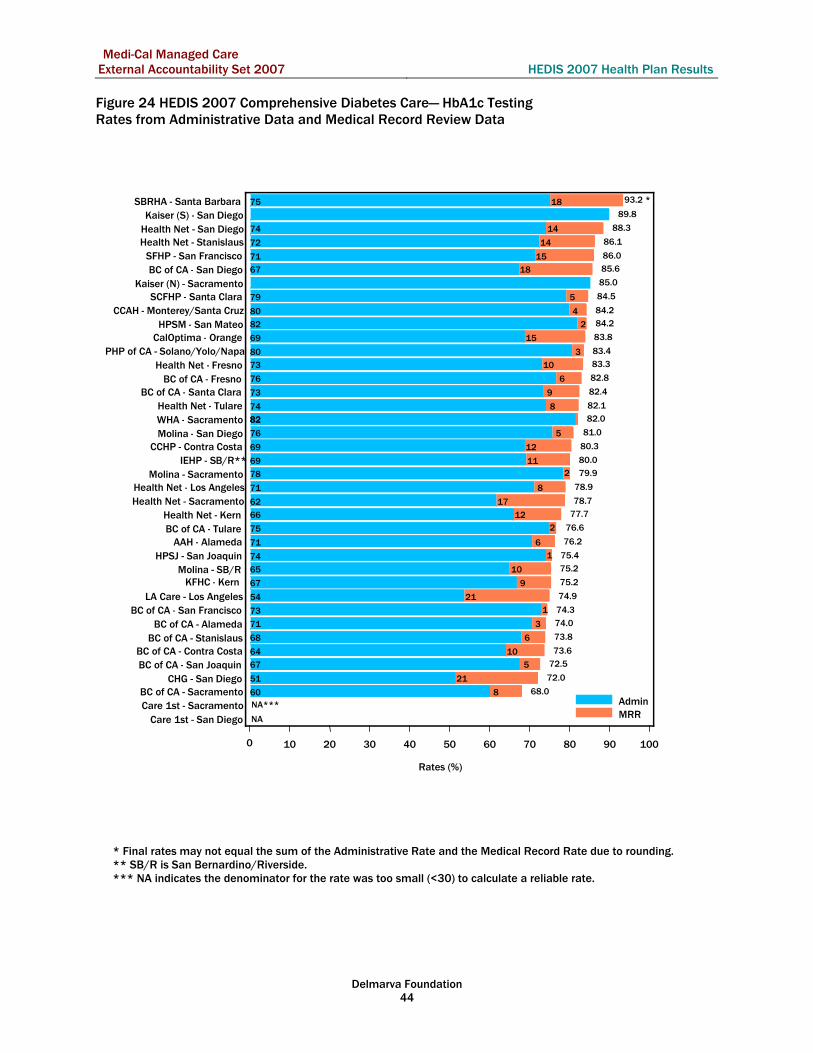
Medi-Cal Managed Care External Accountability Set 2007 HEDIS 2007 Health Plan Results
Delmarva Foundation 44
Admin MRRCare 1st - San Diego
Care 1st - SacramentoBC of CA - Sacramento
CHG - San DiegoBC of CA - San JoaquinBC of CA - Contra Costa
BC of CA - Stanislaus BC of CA - Alameda
BC of CA - San Francisco LA Care - Los Angeles
KFHC - Kern Molina - SB/R
HPSJ - San JoaquinAAH - Alameda
BC of CA - TulareHealth Net - Kern
Health Net - SacramentoHealth Net - Los Angeles
Molina - Sacramento IEHP - SB/R**
CCHP - Contra CostaMolina - San DiegoWHA - SacramentoHealth Net - Tulare
BC of CA - Santa ClaraBC of CA - Fresno
Health Net - Fresno PHP of CA - Solano/Yolo/Napa
CalOptima - OrangeHPSM - San Mateo
CCAH - Monterey/Santa CruzSCFHP - Santa Clara
Kaiser (N) - SacramentoBC of CA - San Diego
SFHP - San Francisco Health Net - StanislausHealth Net - San DiegoKaiser (S) - San Diego
SBRHA - Santa Barbara
Rates (%)
0 10 20 30 40 50 60 70 80 90 100
71 6 76.2
71 3 74.0
64 10 73.6
76 6 82.8
60 8 68.0
67 18 85.6
73 1 74.3
67 5 72.5
73 9 82.4
68 6 73.8
75 2 76.6
69 15 83.8 80 4 84.2
69 12 80.3
51 21 72.0
73 10 83.3
66 12 77.7 71 8 78.9 62 17 78.7
74 14 88.3 72 14 86.1
74 8 82.1
74 1 75.4
82 2 84.2
69 11 80.0
85.0
89.8
67 9 75.2 54 21 74.9
78 2 79.9
65 10 75.2
76 5 81.0
80 3 83.4
75 18 93.2 *
79 5 84.5
71 15 86.0
82 82 82.0
NA*** NA
Figure 24 HEDIS 2007 Comprehensive Diabetes Care— HbA1c Testing Rates from Administrative Data and Medical Record Review Data
* Final rates may not equal the sum of the Administrative Rate and the Medical Record Rate due to rounding. ** SB/R is San Bernardino/Riverside. *** NA indicates the denominator for the rate was too small (<30) to calculate a reliable rate.

Medi-Cal Managed Care External Accountability Set 2007 HEDIS 2007 Health Plan Results
Delmarva Foundation 45
Rates for two plans exceed the HPL (88.8 percent) for Comprehensive Diabetes Care— HbA1c Testing indicator. SBRHA- Santa Barbara is the highest rate with 93.2 percent. BC of CA – Sacramento is the only plan below the MPL of 71.1 percent. The Medi-Cal managed care weighted average of 79.5 percent is 3.3 percentage points above the HEDIS 2006 national Medicaid average (76.2 percent) as shown in Table 14. Table 14. Comprehensive Diabetes Care—HbA1c Testing Benchmarks
HEDIS 2007 Medi-Cal
Managed Care Weighted Average
HEDIS 2006 National Medicaid Average†
HEDIS 2006 National Commercial Average‡
Rate 79.5% 76.2% 87.6%
† Rate obtained from NCQA’s Quality Compass (2006). ‡ Rate obtained from NCQA’s website: http://web.ncqa.org/Portals/0/HEDISQM/Programs/CompAud/MPR/HEDIS_2006_Means_Percentiles_Commercial.pdf.

Medi-Cal Managed Care External Accountability Set 2007 HEDIS 2007 Health Plan Results
Delmarva Foundation 46
Figure 25. HEDIS 2007 Comprehensive Diabetes Care— LDL-C Screening
1 SB/R is San Bernardino/Riverside. 2 NA indicates the denominator for the rate was too small (<30) to calculate a reliable rate. 3 GMC-N is Sacramento and GMC-S is San Diego.
COHSCPLI GMC-N3
GMC-SCare 1st - San Diego
Care 1st - SacramentoBC of CA - Contra Costa
BC of CA - San Francisco BC of CA - Sacramento
BC of CA - AlamedaBC of CA - Stanislaus
Molina - SB/RWHA - Sacramento
KFHC - Kern CCHP - Contra CostaMolina - Sacramento
BC of CA - San JoaquinHealth Net - Kern
AAH - Alameda LA Care - Los Angeles
HPSJ - San Joaquin
Molina - San DiegoBC of CA - Tulare
Health Net - TulareBC of CA - Fresno
CCAH - Monterey/Santa Cruz
Health Net - Los AngelesCHG - San Diego
Health Net - Fresno SCFHP - Santa Clara
Health Net - SacramentoSFHP - San Francisco
PHP of CA - Solano/Yolo/NapaKaiser (N) - Sacramento
HPSM - San MateoIEHP - SB/R1
BC of CA - Santa Clara
Health Net - StanislausBC of CA - San Diego
CalOptima - OrangeHealth Net - San Diego
SBRHA - Santa BarbaraKaiser (S) - San Diego
Rates (%)
0 10 20 30 40 50 60 70 80 90 100
72.7
66.4
61.1
74.8
66.1
80.9
65.8
71.9
80.0
68.8
74.1
81.6
74.9
70.1
75.4
76.2
72.6
75.4
76.8
81.8
80.9
74.5
74.0
79.8 80.0
79.2
88.7
69.6
73.7
71.0
68.9
74.0
79.1
85.0
76.7
77.9
69.6
NA2 NA
2007 Weighted Avg. (75.9%)

Medi-Cal Managed Care External Accountability Set 2007 HEDIS 2007 Health Plan Results
Delmarva Foundation 47
Admin MRRCare 1st - San Diego
Care 1st - SacramentoBC of CA - Contra Costa
BC of CA - San Francisco BC of CA - Sacramento
BC of CA - AlamedaBC of CA - Stanislaus
Molina - SB/RWHA - Sacramento
KFHC - Kern CCHP - Contra CostaMolina - Sacramento
BC of CA - San JoaquinHealth Net - Kern
AAH - AlamedaLA Care - Los Angeles
HPSJ - San JoaquinMolina - San Diego
BC of CA - TulareHealth Net - Tulare
BC of CA - FresnoCCAH - Monterey/Santa Cruz
Health Net - Los AngelesCHG - San Diego
Health Net - Fresno SCFHP - Santa Clara
Health Net - SacramentoSFHP - San Francisco
PHP of CA - Solano/Yolo/NapaKaiser (N) - Sacramento
HPSM - San MateoIEHP - SB/R**
BC of CA - Santa Clara Health Net - Stanislaus
BC of CA - San DiegoCalOptima - Orange
Health Net - San DiegoSBRHA - Santa Barbara
Kaiser (S) - San Diego
Rates (%)
0 10 20 30 40 50 60 70 80 90 100
66 6 72.7
65 1 66.4
56 6 61.1
70 4 74.8
59 7 66.1
68 13 80.9
64 1 65.8
69 3 71.9
73 7 80.0
66 3 68.8
73 1 74.1
65 17 81.6
69 6 74.9
65 5 70.1
54 21 75.4 66 10 76.2
62 11 72.6
65 10 75.4
58 19 76.8
69 12 81.8
76 5 80.9
67 8 74.5
72 2 74.0
75 4 79.8 48 32 80.0
79.2
88.7*
64 6 69.6
56 18 73.7
69 2 71.0
59 10 68.9
68 6 74.0
64 16 79.1
65 20 85.0
60 16 76.7 51 27 77.9
69.6
NA*** NA
Figure 26. HEDIS 2007 Comprehensive Diabetes Care— LDL-C Screening Rates from Administrative Data and Medical Record Review Data
* Final rates may not equal the sum of the Administrative Rate and the Medical Record Rate due to rounding. ** SB/R is San Bernardino/Riverside. *** NA indicates the denominator for the rate was too small (<30) to calculate a reliable rate.

Medi-Cal Managed Care External Accountability Set 2007 HEDIS 2007 Health Plan Results
Delmarva Foundation 48
The HEDIS 2007 specifications were changed for CDC- LDL-C Screening indicator, and therefore the HPL and MPL are not applied. The LDL-C screening and control criteria were restricted to require testing in the measurement year. As shown in Table 15, the Medi-Cal managed care weighted average is 75.9 percent, which is below the HEDIS 2006 national Medicaid average and the HEDIS 2006 national Commercial average. Table 15. Comprehensive Diabetes Care—LDL-C Screening Benchmarks
HEDIS 2007 Medi-Cal
Managed Care Weighted Average
HEDIS 2006 National Medicaid Average†
HEDIS 2006 National Commercial Average‡
Rate 75.9% 80.5% 92.3%
† Rate obtained from NCQA’s Quality Compass (2006). ‡ Rate obtained from NCQA’s website: http://web.ncqa.org/Portals/0/HEDISQM/Programs/CompAud/MPR/HEDIS_2006_Means_Percentiles_Commercial.pdf.

Medi-Cal Managed Care External Accountability Set 2007 HEDIS 2007 Health Plan Results
Delmarva Foundation 49
Figure 27. HEDIS 2007 Comprehensive Diabetes Care — Monitoring for Diabetic Nephropathy
1 SB/R is San Bernardino/Riverside. 2 NA indicates the denominator for the rate was too small (<30) to calculate a reliable rate. 3 NR is Not Reportable because the rate was materially biased or the plan chose not to report the rate. 4 GMC-N is Sacramento and GMC-S is San Diego.
COHSCPLI GMC-N4
GMC-SBC of CA - Santa ClaraCare 1st - San Diego
Care 1st - Sacramento
BC of CA - AlamedaBC of CA - Contra Costa
WHA - Sacramento
BC of CA - StanislausAAH - Alameda
HPSJ - San JoaquinBC of CA - San Francisco
BC of CA - SacramentoHealth Net - Fresno
SCFHP - Santa Clara
KFHC - KernHealth Net - Stanislaus
BC of CA - San JoaquinHealth Net - Los Angeles
SFHP - San FranciscoBC of CA - San Diego
Health Net - KernCHG - San Diego
Molina - San DiegoHealth Net - Sacramento
Health Net - TulareBC of CA - FresnoBC of CA - Tulare
CCAH - Monterey/Santa CruzMolina - Sacramento
Molina - SB/RHPSM - San Mateo
CalOptima - OrangePHP of CA - Solano/Yolo/Napa
Health Net - San Diego
SBRHA - Santa BarbaraCCHP - Contra Costa
LA Care - Los AngelesIEHP - SB/R1
Kaiser (S) - San DiegoKaiser (N) - Sacramento
Rates (%)
0 10 20 30 40 50 60 70 80 90 100
72.0
64.2
68.1
77.5
72.6
75.2
72.3
74.9
NR3
71.2
77.8
80.9
78.1
85.4
76.2
72.6
75.6
74.9
76.6
83.8
74.6
77.4
72.3
79.6
91.3
91.7
91.3
74.0
87.9
79.2
79.4
76.6
81.3
85.2
72.9
74.9
70.6
NA2 NA
2007 Weighted Avg. (81.0%)

Medi-Cal Managed Care External Accountability Set 2007 HEDIS 2007 Health Plan Results
Delmarva Foundation 50
Admin MRRCare 1st - San Diego
Care 1st - SacramentoBC of CA - Santa Clara
BC of CA - AlamedaBC of CA - Contra Costa
WHA - SacramentoBC of CA - Stanislaus
AAH - AlamedaHPSJ - San Joaquin
BC of CA - San Francisco BC of CA - Sacramento
Health Net - Fresno SCFHP - Santa Clara
KFHC - Kern Health Net - StanislausBC of CA - San Joaquin
Health Net - Los AngelesSFHP - San Francisco BC of CA - San Diego
Health Net - KernCHG - San Diego
Molina - San DiegoHealth Net - Sacramento
Health Net - TulareBC of CA - FresnoBC of CA - Tulare
CCAH - Monterey/Santa CruzMolina - Sacramento
Molina - SB/RHPSM - San Mateo
CalOptima - OrangePHP of CA - Solano/Yolo/Napa
Health Net - San DiegoSBRHA - Santa Barbara
CCHP - Contra CostaLA Care - Los Angeles Kaiser (S) - San Diego
IEHP - SB/R**Kaiser (N) - Sacramento
Rates (%)
0 10 20 30 40 50 60 70 80 90 100
66 6 72.0
63 1 64.267 1 68.1
75 3 77.5
71 1 72.6
72 3 75.2
72.3
74 1 74.9
NR***
71.2
74 4 77.8
76 5 80.9
75 3 78.1
84 1 85.4
73 3 76.2
67 6 72.6
68 8 75.6
70 5 74.9
68 9 76.6
78 6 83.8
73 2 74.6
71 7 77.4
70 2 72.3
79 1 79.6
90 1 91.3 91.7*
91.3
63 11 74.0
83 87.9
75 4 79.2 73 7 79.4
72 4 76.6
74 8 81.3
71 14 85.2
71 2 72.9
66 9 74.9
70.6
NA**** NA
Figure 28. HEDIS 2007 Comprehensive Diabetes Care— Monitoring for Diabetic Nephropathy
Rates from Administrative Data and Medical Record Review Data
* Final rates may not equal the sum of the Administrative Rate and the Medical Record Rate due to rounding. ** SB/R is San Bernardino/Riverside. *** NR indicates a rate was not reportable because the rate was materially biased or the plan chose not to report the rate. **** NA indicates the denominator for the rate was too small (<30) to calculate a reliable rate.

Medi-Cal Managed Care External Accountability Set 2007 HEDIS 2007 Health Plan Results
Delmarva Foundation 51
The HEDIS specifications for CDC- Medical Attention for Nephropathy were revised significantly so MPL and HPL levels were not applied for this indicator. Evidence of the use of ACE/ARBs for numerator compliance was added to the specifications. As shown in Table 16, the Medi-Cal managed care weighted average is 81.0 percent which is significantly above the HEDIS 2006 national Medicaid average (48.8 percent) and the HEDIS 2006 national Commercial average. In comparing the rates in the table, one must consider that the HEDIS 2006 rates are rates derived using the prior year’s specifications. Table 16. Comprehensive Diabetes Care—Monitoring for Diabetic Nephropathy Benchmarks
HEDIS 2007 Medi-Cal
Managed Care Weighted Average
HEDIS 2006 National Medicaid Average†
HEDIS 2006 National Commercial Average‡
Rate 81.0% 48.8% 55.1%
† Rate obtained from NCQA’s Quality Compass (2006). ‡ Rate obtained from NCQA’s website: http://web.ncqa.org/Portals/0/HEDISQM/Programs/CompAud/MPR/HEDIS_2006_Means_Percentiles_Commercial.pdf.

Medi-Cal Managed Care External Accountability Set 2007 HEDIS 2007 Health Plan Results
Delmarva Foundation 52
Figure 29. HEDIS 2007 Use of Appropriate Medications for People with Asthma
1 MPL is HEDIS 2006 national Medicaid 25th Percentile and HPL is HEDIS 2006 national Medicaid 90th Percentile. 2 SB/R is San Bernardino/Riverside. 3 NA indicates the denominator for the rate was too small (<30) to calculate a reliable rate. 4 GMC-N is Sacramento and GMC-S is San Diego.
COHS CP LIGMC-N4 GMC-SMolina - San Diego
Health Net - StanislausCare 1st - San Diego
Care 1st - SacramentoBC of CA - San Diego
Molina - SB/RHealth Net - Los Angeles
Kaiser (S) - San Diego
Molina - Sacramento WHA - Sacramento
HPSJ - San JoaquinLA Care - Los Angeles
Health Net - Sacramento
BC of CA - SacramentoCHG - San Diego
KFHC - Kern BC of CA - Alameda
BC of CA - Stanislaus Health Net - Kern
CCAH - Monterey/Santa CruzCCHP - Contra Costa
BC of CA - San Francisco IEHP - SB/R2
CalOptima - OrangePHP of CA - Solano/Yolo/Napa
HPSM - San Mateo
BC of CA - Contra CostaBC of CA - Santa Clara
BC of CA - TulareSBRHA - Santa Barbara
BC of CA - FresnoAAH - Alameda
Health Net - San Diego
BC of CA - San JoaquinKaiser (N) - Sacramento
SFHP - San Francisco Health Net - Fresno Health Net - Tulare
SCFHP - Santa Clara
Rates (%)
0 10 20 30 40 50 60 70 80 90 100
90.3
85.8
89.2
90.1
85.1
77.7
88.2
91.5
89.2
85.8
89.5
88.5
87.9 88.1
85.6
93.0
87.6
82.7
85.1
90.5
NA
95.3
84.6
89.0
88.3
92.0
82.9
85.6
85.0
83.3
81.2
NA
88.9
90.0
95.7
92.1
83.8
NA3 NA
2007 Weighted Avg. (86.8%)
HPL (92.5%)MPL1 (84.0%)

Medi-Cal Managed Care External Accountability Set 2007 HEDIS 2007 Health Plan Results
Delmarva Foundation 53
Admin MRRMolina - San Diego
Health Net - StanislausCare 1st - San Diego
Care 1st - SacramentoBC of CA - San Diego
Molina - SB/RHealth Net - Los Angeles
Kaiser (S) - San DiegoMolina - Sacramento
WHA - SacramentoHPSJ - San Joaquin
LA Care - Los Angeles Health Net - Sacramento
BC of CA - SacramentoKFHC - Kern
CHG - San DiegoBC of CA - Stanislaus
BC of CA - AlamedaHealth Net - Kern
CCAH - Monterey/Santa CruzCCHP - Contra Costa
BC of CA - San Francisco IEHP - SB/R**
CalOptima - OrangePHP of CA - Solano/Yolo/Napa
HPSM - San MateoBC of CA - Santa Clara
BC of CA - Contra CostaBC of CA - Tulare
SBRHA - Santa BarbaraBC of CA - Fresno
AAH - AlamedaHealth Net - San DiegoBC of CA - San Joaquin
Kaiser (N) - SacramentoSFHP - San Francisco
Health Net - Fresno Health Net - Tulare
SCFHP - Santa Clara
Rates (%)
0 10 20 30 40 50 60 70 80 90 100
90.3
85.8
89.2
90.1
85.1
77.7
88.2
91.5
89.2
85.8
89.5
88.5
87.9 88.1
85.6
93.0
87.6
82.7
85.1
90.5
NA
95.3
84.6
89.0
88.3
92.0
82.9
85.6
85.0
83.3
81.2
NA
88.9
90.0
95.7 *
92.1
83.8
NA*** NA
Figure 30. HEDIS 2007 Use of Appropriate Medications for People with Asthma
Rates from Administrative Data
* Final rates may not equal the sum of the Administrative Rate and the Medical Record Rate due to rounding. ** SB/R is San Bernardino/Riverside. *** NA indicates the denominator for the rate was too small (<30) to calculate a reliable rate.

Medi-Cal Managed Care External Accountability Set 2007 HEDIS 2007 Health Plan Results
Delmarva Foundation 54
Use of Appropriate Medications for People with Asthma (ASM) is part of the Effectiveness of Care Domain. Three health plans exceed the HPL (92.5 percent) for ASM. Five plans are below the MPL of 84.0 percent. The Medi-Cal managed care weighted average of 86.8 percent is 1.1 percentage points above the HEDIS 2006 national Medicaid average of 85.7 percent as shown in Table 17. Table 17. Use of Appropriate Medications for People with Asthma Benchmarks
HEDIS 2007 Medi-Cal
Managed Care Weighted Average
HEDIS 2006 National Medicaid Average†
HEDIS 2006 National Commercial Average‡
Rate 86.8% 85.7% 89.9%
† Rate obtained from NCQA’s Quality Compass (2006). ‡ Rate obtained from NCQA’s website: http://web.ncqa.org/Portals/0/HEDISQM/Programs/CompAud/MPR/HEDIS_2006_Means_Percentiles_Commercial.pdf.

Medi-Cal Managed Care External Accountability Set 2007 HEDIS 2007 Health Plan Results
Delmarva Foundation 55
Figure 31. HEDIS 2007 Inappropriate Antibiotic Treatment for Adults with Acute Bronchitis
(Lower rate indicates better performance)
1 SB/R is San Bernardino/Riverside. 2 NA indicates the denominator for the rate was too small (<30) to calculate a reliable rate. 3 GMC-N is Sacramento and GMC-S is San Diego.
COHSCPLI GMC-N3
GMC-SHealth Net - Stanislaus
Care 1st - San DiegoCare 1st - Sacramento
BC of CA - San Joaquin
BC of CA - San Francisco BC of CA - San Diego
BC of CA - Contra CostaBC of CA - Alameda
Kaiser (S) - San Diego SBRHA - Santa Barbara
HPSM - San MateoMolina - San Diego
CCHP - Contra Costa
Molina - Sacramento Health Net - Fresno
LA Care - Los Angeles Molina - SB/R
Health Net - SacramentoCCAH - Monterey/Santa Cruz
SFHP - San Francisco BC of CA - Stanislaus
WHA - Sacramento
AAH - Alameda BC of CA - Fresno
BC of CA - SacramentoHealth Net - Los Angeles
HPSJ - San JoaquinHealth Net - Tulare
CalOptima - OrangeKaiser (N) - Sacramento
Health Net - San Diego
KFHC - Kern PHP of CA - Solano/Yolo/Napa
Health Net - Kern IEHP - SB/R1
BC of CA - Santa ClaraSCFHP - Santa Clara
BC of CA - TulareCHG - San Diego
Rates (%)
0 10 20 30 40 50 60 70 80 90 100
73.1
NA2 NA
73.1
73.7
NA NA NA
80.4
72.0
80.5
75.4
71.6
61.7
81.1
63.6
79.1
74.5
70.8
75.8
NA
75.2
74.8
60.6
79.2
75.5
27.2
76.9
64.6
62.9
67.2
61.2
77.0
49.8
80.5
71.6
72.3
NA NA
2007 Weighted Avg. (71.0%)

Medi-Cal Managed Care External Accountability Set 2007 HEDIS 2007 Health Plan Results
Delmarva Foundation 56
Admin MRRHealth Net - Stanislaus
Care 1st - San DiegoCare 1st - Sacramento
BC of CA - San JoaquinBC of CA - San Francisco
BC of CA - San DiegoBC of CA - Contra Costa
BC of CA - AlamedaKaiser (S) - San Diego
SBRHA - Santa BarbaraHPSM - San MateoMolina - San Diego
CCHP - Contra CostaMolina - Sacramento
Health Net - Fresno LA Care - Los Angeles
Molina - SB/RHealth Net - Sacramento
SFHP - San Francisco CCAH - Monterey/Santa Cruz
BC of CA - Stanislaus WHA - Sacramento
BC of CA - FresnoAAH - Alameda
BC of CA - SacramentoHealth Net - Los Angeles
HPSJ - San JoaquinHealth Net - Tulare
CalOptima - OrangeKaiser (N) - Sacramento
Health Net - San Diego KFHC - Kern
PHP of CA - Solano/Yolo/NapaHealth Net - Kern IEHP - SB/R**
BC of CA - Santa ClaraSCFHP - Santa Clara
BC of CA - TulareCHG - San Diego
Rates (%)
0 10 20 30 40 50 60 70 80 90 100
73.1
NA NA*** NA
73.1
73.7
NA NA NA
80.4
72.0
80.5
75.4
71.6
61.7
81.1*
63.6
79.1
74.5
70.8
75.8
NA
75.274.8
60.6
79.2
75.5
27.2
76.9
64.6
62.9
67.2
61.2
77.0
49.8
80.5
71.6
72.3
NA NA
Figure 32. HEDIS 2007 Inappropriate Antibiotic Treatment for Adults with Acute Bronchitis
Rates from Administrative Data
* Final rates may not equal the sum of the Administrative Rate and the Medical Record Rate due to rounding. ** SB/R is San Bernardino/Riverside. *** NA indicates the denominator for the rate was too small (<30) to calculate a reliable rate.

Medi-Cal Managed Care External Accountability Set 2007 HEDIS 2007 Health Plan Results
Delmarva Foundation 57
The Effectiveness of Care domain includes the Inappropriate Antibiotic Treatment for Adults with Acute Bronchitis (AAB) indicator. This measure is an administrative data only measure per the HEDIS specifications. No data was available at the initial set up of this report to establish an MPL and an HPL for the AAB measure. For this measure the lower the rate, the better the performance. Kaiser(S) – San Diego has the lowest rate with 27.7 percent. The Medi-Cal managed care weighted average is 71.0 percent as shown in Table 18. For HEDIS 2008, the AAB indicator will be inverted so that a higher rate is better. Table 18. Inappropriate Antibiotic Treatment for Adults with Acute Bronchitis Benchmarks
HEDIS 2007 Medi-Cal
Managed Care Weighted Average
HEDIS 2006 National Medicaid Average
HEDIS 2006 National Commercial Average‡
Rate 71.0% 69.4% 66.1%
† Rate obtained from NCQA’s website: http://web.ncqa.org/Portals/0/HEDISQM/Programs/CompAud/MPR/HEDIS_2006_Means_Percentiles_Medicaid.pdf ‡ Rate obtained from NCQA’s website: http://web.ncqa.org/Portals/0/HEDISQM/Programs/CompAud/MPR/HEDIS_2006_Means_Percentiles_Commercial.pdf

Medi-Cal Managed Care External Accountability Set 2007
HEDIS 2007 Health Plan Results by Model Type and Trend Tables
Delmarva Foundation 58
VI. HEDIS 2007 Health Plan Results by Model Type and Trend Tables This section contains graphical analysis and trending tables of the HEDIS 2007 rates by the five model types. Each measure has five graphs, one for each model type (COHS, CP, GMC-N, GMC-S, LI). Each graph displays a model’s plan rates (rounded to the nearest whole percent) in relation to that model’s weighted average. A sixth graph shows the model type weighted averages in relation to the Medi-Cal managed care weighted average. These six graphs are followed by the trending tables of plan rates and the Medi-Cal managed care straight average. The tables also show shaded cells when a plan rate is two standard deviations from the Medi-Cal managed care straight average. Standard deviation is a statistical measure of the distance of a rate from an average. For data sets like these with an approximately normal distribution (i. e. bell-shaped), about 68 percent of the rates are expected to fall within one standard deviation of the average. When a rate is two standard deviations or more away from the Medi-Cal managed care straight average, it can be considered out of the normal range.
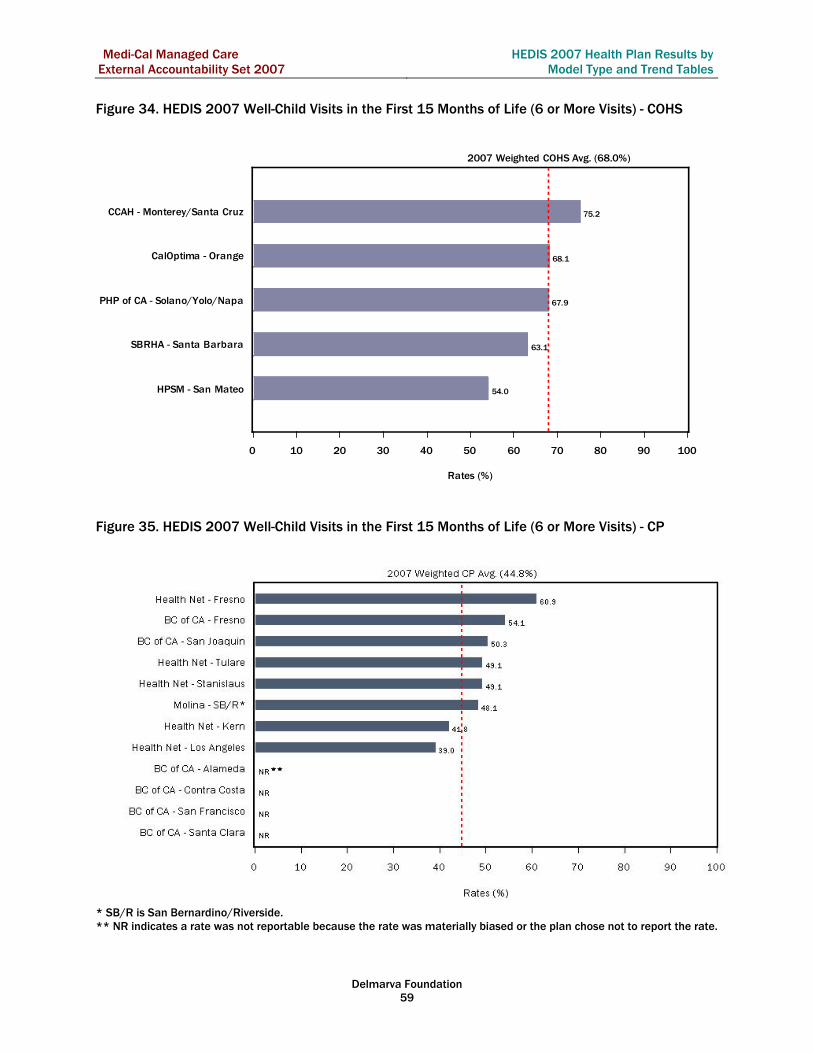
Medi-Cal Managed Care External Accountability Set 2007
HEDIS 2007 Health Plan Results by Model Type and Trend Tables
Delmarva Foundation 59
HPSM - San Mateo
SBRHA - Santa Barbara
PHP of CA - Solano/Yolo/Napa
CalOptima - Orange
CCAH - Monterey/Santa Cruz
Rates (%)
0 10 20 30 40 50 60 70 80 90 100
68.1
75.2
54.0
67.9
63.1
2007 Weighted COHS Avg. (68.0%)
Figure 34. HEDIS 2007 Well-Child Visits in the First 15 Months of Life (6 or More Visits) - COHS
Figure 35. HEDIS 2007 Well-Child Visits in the First 15 Months of Life (6 or More Visits) - CP
* SB/R is San Bernardino/Riverside. ** NR indicates a rate was not reportable because the rate was materially biased or the plan chose not to report the rate.

Medi-Cal Managed Care External Accountability Set 2007
HEDIS 2007 Health Plan Results by Model Type and Trend Tables
Delmarva Foundation 60
Figure 36. HEDIS 2007 Well-Child Visits in the First 15 Months of Life (6 or More Visits) –
GMC – North (N)
Figure 37. HEDIS 2007 Well-Child Visits in the First 15 Months of Life (6 or More Visits) –
GMC – South (S)
* NA indicates the denominator for the rate was too small (<30) to calculate a reliable rate. ** NR indicates a rate was not reportable because the rate was materially biased or the plan chose not to report the rate.

Medi-Cal Managed Care External Accountability Set 2007
HEDIS 2007 Health Plan Results by Model Type and Trend Tables
Delmarva Foundation 61
Figure 38. HEDIS 2007 Well-Child Visits in the First 15 Months of Life (6 or More Visits) - LI
* SB/R is San Bernardino/Riverside. ** NR indicates a rate was not reportable because the rate was materially biased or the plan chose not to report the rate.

Medi-Cal Managed Care External Accountability Set 2007
HEDIS 2007 Health Plan Results by Model Type and Trend Tables
Delmarva Foundation 62
COHSCPLIGMC-NGMC-S
CP
GMC-S
LI
GMC-N
COHS
Rates (%)
0 10 20 30 40 50 60 70 80 90 100
68.0
44.8
53.0
57.2
51.4
2007 Weighted Avg. (57.7%)
Figure 39. HEDIS 2007 Well-Child Visits in the First 15 Months of Life (6 or More Visits) – Model
Type Comparison of Weighted Averages
Table 19 presents the trends for the Well-Child Visits in the First 15 Months of Life for 6 or More Visits. The cell shading represents the rate in relation to the Medi-Cal Managed Care average for that year. The colors are defined as follows (SD = Standard Deviation):
2 or more SDs above the average 2 or more SDs below the average

Medi-Cal Managed Care External Accountability Set 2007
HEDIS 2007 Health Plan Results by Model Type and Trend Tables
Delmarva Foundation 63
Table 19. Trends for the Well-Child Visits in the First 15 Months of Life for 6 or More Visits
Model Type
Medi-Cal Managed Care Plans
HEDIS 2001 Rate
HEDIS 2002 Rate
HEDIS 2004 Rate
HEDIS 2005 Rate
HEDIS 2006 Rate
HEDIS 2007 Rate
CalOptima ----- 43.8 49.8 44.7 60.4 68.1
CCAH 56.7 42.1 53.8 65.7 68.4 75.2
HPSM 47.7 56.3 54.9 56.3 59.2 54.0
PHP of CA 32.6 33.2 35.7 55.5 75.1 67.9
COHS
SBRHA 62.3 62.7 64.0 53.9 60.8 63.1
BC of CA (CP)* 45.8 49.2 54.7 55.6 56.7 53.5
Health Net (CP)* 25.7 26.0 29.8 37.2 36.6 40.4 CP
Molina Healthcare (CP) 9.3 46.9 59.2 55.6 46.1 48.1
BC of CA (GMC-N) 52.4 61.5 59.6 53.4 57.6 53.0
Care1st (GMC-N)** ----- ----- ----- ----- ----- -----
Health Net (GMC-N) 41.4 48.5 55.1 46.7 54.2 64.1
Kaiser (GMC-N) 66.7 72.2 52.9 67.4 65.6 65.8
Molina Healthcare (GMC-N) ----- 27.8 52.4 48.1 44.2 59.7
GMCN
WHA 36.5 21.9 35.6 51.2 49.2 -----
BC of CA (GMC-S) ----- 37.5 44.4 44.4 47.5 42.3
Care1st (GMC-S)** ----- ----- ----- ----- ----- -----
CHG 25.2 44.5 44.5 36.5 31.9 44.5
Health Net (GMC-S) ----- 23.9 23.9 34.2 41.9 44.8
Kaiser (GMC-S) ----- 26.8 40.5 ----- 12.5 35.5
Molina Healthcare (GMC-S)** ----- ----- ----- ----- ----- 81.6
Sharp ----- 41.1 58.5 ----- ----- -----
UCSD ----- 27.2 ----- ----- ----- -----
GMCS
Universal ----- 11.4 41.3 ----- ----- -----
AAH 33.0 32.6 61.1 60.7 56.2 -----
BC of CA (Stanislaus) 45.2 ----- 46.7 45.7 33.9 46.1
BC of CA (Tulare) 10.4 45.3 52.7 47.7 53.9 50.0
CCHP 34.8 23.8 38.4 51.1 54.0 62.6
HPSJ 35.2 24.9 38.9 60.6 53.8 55.5
IEHP 24.1 35.2 63.2 74.3 81.8 61.3
KFHC 38.0 41.5 36.5 46.7 51.1 52.1
L.A. Care 13.7 20.0 40.1 44.0 44.2 46.6
SFHP 64.2 45.3 61.3 56.3 73.9 82.6
LI
SCFHP 27.0 47.6 47.8 56.5 52.8 59.4
Medi-Cal Managed Care Straight Average*** 37.6 38.6 48.2 51.9 52.7 56.8 * Rates for Blue Cross CP and Health Net CP are weighted averages incorporating all the counties served by this plan-model combination. ** The following events preclude reporting a rate: a plan's first year in a county, the first year DHCS requires a HEDIS measure, and the first year of significant changes in a measure's specifications. *** The Medi-Cal Managed Care Average presented in this table is the unweighted average of the HEDIS Rates presented in the table for each year evaluated.
Medi-Cal Managed Care External Accountability Set 2007
HEDIS 2007 Health Plan Results by Model Type and Trend Tables
Delmarva Foundation 64
Well-Visits in the First 15 Months of Life (6 or More Visits)
The weighted averages by model type ranged from 44.8 percent to 68.0 percent. The COHS model type has the highest weighted average at 68 percent. The Medi-Cal managed care straight average increased steadily since 2004 to 2007 from 48.2 percent to 56.8 percent. San Francisco Health Plan (82.6 percent) and Molina GMC-South (81.6 percent) are two standard deviations above the Medi-Cal managed care straight average. Kaiser GMC-South increased by 23 percentage points from 12.5 percent in 2006 to 35.5 percent in 2007. Inland Empire’s rate fell by 20.5 percentage points from 81.8 percent in 2006 to 61.3 percent in 2007.

Medi-Cal Managed Care External Accountability Set 2007
HEDIS 2007 Health Plan Results by Model Type and Trend Tables
Delmarva Foundation 65
Figure 40. HEDIS 2007 Well-Child Visits in the Third, Fourth, Fifth and Sixth Years of Life – COHS
Figure 41. HEDIS 2007 Well-Child Visits in the Third, Fourth, Fifth and Sixth Years of Life – CP * SB/R is San Bernardino/Riverside.

Medi-Cal Managed Care External Accountability Set 2007
HEDIS 2007 Health Plan Results by Model Type and Trend Tables
Delmarva Foundation 66
Figure 42. HEDIS 2007 Well-Child Visits in the Third, Fourth, Fifth and Sixth Years of Life – GMC - N
Figure 43. HEDIS 2007 Well-Child Visits in the Third, Fourth, Fifth and Sixth Years of Life – GMC - S
* NR indicates a rate was not reportable because the rate was materially biased or the plan chose not to report the rate. ** NA indicates the denominator for the rate was too small (<30) to calculate a reliable rate.

Medi-Cal Managed Care External Accountability Set 2007
HEDIS 2007 Health Plan Results by Model Type and Trend Tables
Delmarva Foundation 67
Figure 44. HEDIS 2007 Well-Child Visits in the Third, Fourth, Fifth and Sixth Years of Life - LI * SB/R is San Bernardino/Riverside. ** NR indicates a rate was not reportable because the rate was materially biased or the plan chose not to report the rate.
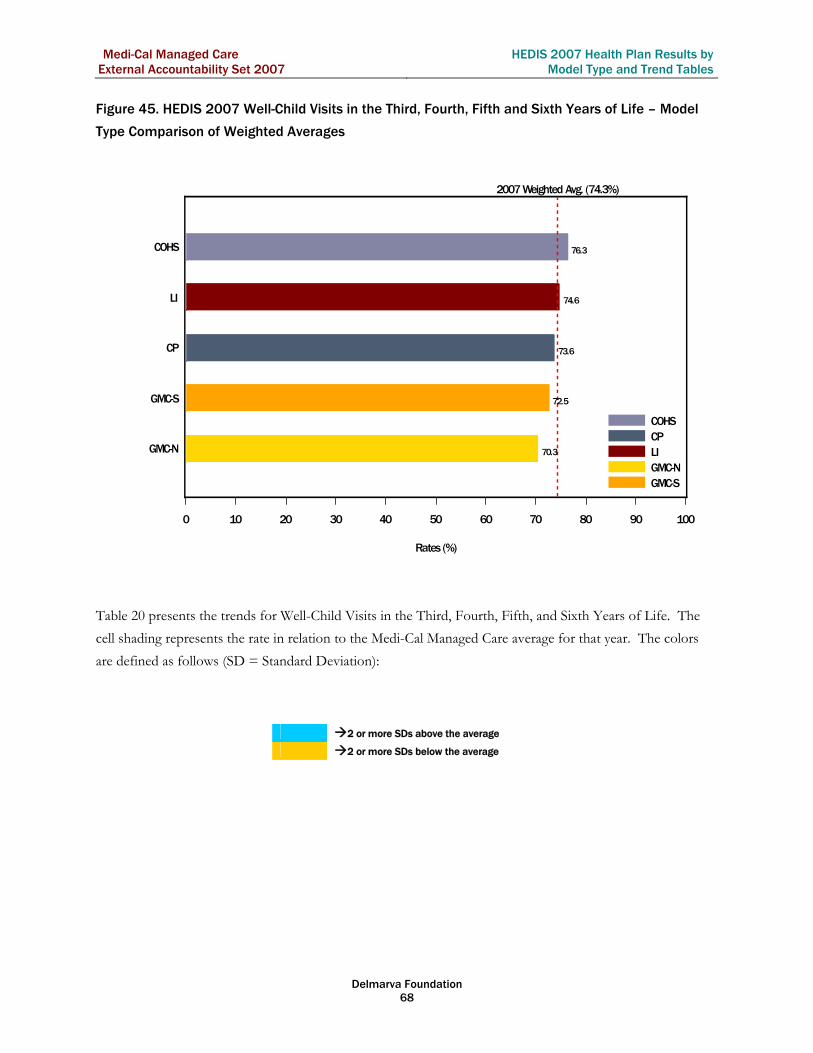
Medi-Cal Managed Care External Accountability Set 2007
HEDIS 2007 Health Plan Results by Model Type and Trend Tables
Delmarva Foundation 68
COHSCPLIGMC-NGMC-S
GMC-N
GMC-S
CP
LI
COHS
Rates (%)
0 10 20 30 40 50 60 70 80 90 100
76.3
73.6
74.6
70.3
72.5
2007 Weighted Avg. (74.3%)
Figure 45. HEDIS 2007 Well-Child Visits in the Third, Fourth, Fifth and Sixth Years of Life – Model
Type Comparison of Weighted Averages
Table 20 presents the trends for Well-Child Visits in the Third, Fourth, Fifth, and Sixth Years of Life. The cell shading represents the rate in relation to the Medi-Cal Managed Care average for that year. The colors are defined as follows (SD = Standard Deviation):
2 or more SDs above the average 2 or more SDs below the average

Medi-Cal Managed Care External Accountability Set 2007
HEDIS 2007 Health Plan Results by Model Type and Trend Tables
Delmarva Foundation 69
Table 20. Trends for Well-Child Visits in the Third, Fourth, Fifth, and Sixth Years of Life
Model Type
Medi-Cal Managed Care Plans
HEDIS 2001 Rate
HEDIS 2002 Rate
HEDIS 2004 Rate
HEDIS 2005 Rate
HEDIS 2006 Rate
HEDIS 2007 Rate
CalOptima ----- ----- ----- ----- 78.9 81.2
CCAH ----- ----- ----- ----- 74.9 77.1
HPSM ----- ----- ----- ----- 66.7 66.2
PHP of CA ----- ----- ----- ----- 70.8 67.5
COHS
SBRHA ----- ----- ----- ----- 67.1 67.0
BC of CA (CP)* 62.5 75.0 70.8 73.8 73.7 75.0
Health Net (CP)* 50.2 55.5 61.7 67.7 69.4 72.0 CP
Molina Healthcare (CP) 60.5 67.5 74.8 77.6 71.8 81.3
BC of CA (GMC-N) 56.3 63.0 65.5 71.3 67.4 69.2
Care1st (GMC-N)** ----- ----- ----- ----- ----- 64.8
Health Net (GMC-N) 59.5 67.4 73.6 73.2 76.5 78.8
Kaiser (GMC-N) 47.1 46.6 54.3 54.0 59.4 56.5
Molina Healthcare (GMC-N) ----- 56.7 63.1 71.8 73.1 76.6
GMCN
WHA 52.5 53.0 60.8 62.3 67.9 -----
BC of CA (GMC-S) 49.9 59.0 67.1 65.2 60.2 67.6
Care1st (GMC-S)** ----- ----- ----- ----- ----- -----
CHG 66.9 67.6 64.7 67.9 65.5 72.7
Health Net (GMC-S) 43.5 54.5 59.1 68.0 64.4 68.2
Kaiser (GMC-S) 48.6 54.9 53.7 54.8 47.4 53.4
Molina Healthcare (GMC-S)** ----- ----- ----- ----- ----- 77.8
Sharp 79.0 58.5 64.7 ----- ----- -----
UCSD 45.9 46.6 ----- ----- ----- -----
GMCS
Universal 51.6 57.7 70.2 ----- ----- -----
AAH 57.6 58.6 69.3 70.8 76.6 -----
BC of CA (Stanislaus) 54.1 54.9 61.6 62.5 65.1 63.9
BC of CA (Tulare) 57.4 65.3 65.0 69.9 75.9 69.9
CCHP 54.5 57.0 63.5 68.0 68.3 73.7
HPSJ 57.4 65.0 67.3 70.8 73.2 79.3
IEHP 61.1 62.0 70.6 77.8 81.8 69.7
KFHC 60.0 66.4 62.3 70.6 70.4 75.6
L.A. Care 47.5 46.6 65.0 67.9 73.0 76.6
SFHP 68.6 63.7 77.0 79.7 74.1 77.5
LI
SCFHP 64.1 67.6 71.8 65.5 69.4 73.8
Medi-Cal Managed Care Straight Average*** 56.5 59.6 65.7 68.7 69.7 71.6 * Rates for Blue Cross CP and Health Net CP are weighted averages incorporating all the counties served by this plan-model combination. ** The following events preclude reporting a rate: a plan's first year in a county, the first year DHCS requires a HEDIS measure, and the first year of significant changes in a measure's specifications. *** The Medi-Cal Managed Care Average presented in this table is the unweighted average of the HEDIS Rates presented in the table for each year evaluated.

Medi-Cal Managed Care External Accountability Set 2007
HEDIS 2007 Health Plan Results by Model Type and Trend Tables
Delmarva Foundation 70
Well-Child Visits in the Third, Fourth, Fifth, and Sixth Years of Life
The weighted averages for the model types range from 70.3 percent to 76.3 percent with COHS having the highest rate. The Medi-Cal managed care straight average has increased each year since 2004 from 65.7 percent to 71.6 percent. CalOptima (81.2 percent) and Molina Healthcare CP (81.3 percent) have the highest rates. Kaiser GMC-South (53.4 percent) and Kaiser GMC-North (56.5 percent) had rates that were two standard deviations below the Medi-Cal managed care straight average for 2007.

Medi-Cal Managed Care External Accountability Set 2007
HEDIS 2007 Health Plan Results by Model Type and Trend Tables
Delmarva Foundation 71
Figure 46. HEDIS 2007 Childhood Immunization Status (Combination #2) – COHS
Figure 47. HEDIS 2007 Childhood Immunization Status (Combination #2) - CP * SB/R is San Bernardino/Riverside. ** NR indicates a rate was not reportable because the rate was materially biased or the plan chose not to report the rate.

Medi-Cal Managed Care External Accountability Set 2007
HEDIS 2007 Health Plan Results by Model Type and Trend Tables
Delmarva Foundation 72
Figure 48. HEDIS 2007 Childhood Immunization Status (Combination #2) – GMC - N
Figure 49. HEDIS 2007 Childhood Immunization Status (Combination #2) – GMC - S
* NR indicates a rate was not reportable because the rate was materially biased or the plan chose not to report the rate. ** NA indicates the denominator for the rate was too small (<30) to calculate a reliable rate.

Medi-Cal Managed Care External Accountability Set 2007
HEDIS 2007 Health Plan Results by Model Type and Trend Tables
Delmarva Foundation 73
Figure 50. HEDIS 2007 Childhood Immunization Status (Combination #2) - LI
* SB/R is San Bernardino/Riverside.

Medi-Cal Managed Care External Accountability Set 2007
HEDIS 2007 Health Plan Results by Model Type and Trend Tables
Delmarva Foundation 74
COHSCPLIGMC-NGMC-S
GMC-N
LI
CP
GMC-S
COHS
Rates (%)
0 10 20 30 40 50 60 70 80 90 100
82.9
79.5
76.0
73.6
80.2
2007 Weighted Avg. (77.9%)
Figure 51. HEDIS 2007 Childhood Immunization Status (Combination #2) - Model Type Comparison
of Weighted Averages
Table 21 presents the trends for Childhood Immunization Status - Combination #2. The cell shading represents the rate in relation to the Medi-Cal Managed Care average for that year. The colors are defined as follows (SD = Standard Deviation):
2 or more SDs above the average 2 or more SDs below the average

Medi-Cal Managed Care External Accountability Set 2007
HEDIS 2007 Health Plan Results by Model Type and Trend Tables
Delmarva Foundation 75
Table 21. Trends for Childhood Immunization Status - Combination #2
Model Type
Medi-Cal Managed Care Plans
HEDIS 2001 Rate
HEDIS 2002 Rate
HEDIS 2004 Rate
HEDIS 2005 Rate
HEDIS 2006 Rate
HEDIS 2007 Rate
CalOptima 60.4 72.2 72.5 74.3 85.9 82.6
CCAH 58.6 57.7 73.5 75.7 86.6 85.6
HPSM 55.7 56.9 61.8 61.7 78.7 76.4
PHP of CA 54.9 56.2 67.6 70.7 78.5 81.9
COHS
SBRHA 65.4 69.2 76.4 79.4 85.0 84.9
BC of CA (CP)* 57.2 62.7 64.5 66.4 76.0 74.5
Health Net (CP)* 43.9 50.7 60.9 60.7 69.7 82.5 CP
Molina Healthcare (CP) 45.7 48.6 60.0 68.5 70.6 70.4
BC of CA (GMC-N) 55.8 56.0 62.5 66.0 71.5 73.1
Care1st (GMC-N)** ----- ----- ----- ----- ----- 41.0
Health Net (GMC-N) 51.9 49.9 63.5 60.3 71.3 77.4
Kaiser (GMC-N) 66.8 67.0 70.1 70.6 77.5 76.6
Molina Healthcare (GMC-N) ----- 36.3 54.5 58.8 69.6 71.5
GMCN
WHA 40.0 43.6 42.4 47.8 64.2 -----
BC of CA (GMC-S) 41.7 62.7 74.3 73.4 77.1 79.6
Care1st (GMC-S)** ----- ----- ----- ----- ----- -----
CHG 57.2 79.3 77.4 70.3 78.8 79.8
Health Net (GMC-S) 46.6 68.2 74.5 73.5 80.9 81.9
Kaiser (GMC-S) 59.8 64.5 71.7 75.7 77.7 86.6
Molina Healthcare (GMC-S)** ----- ----- ----- ----- ----- 80.6
Sharp 40.7 59.6 69.8 ----- ----- -----
UCSD 32.0 60.1 ----- ----- ----- -----
GMCS
Universal 48.5 55.2 72.7 ----- ----- -----
AAH 48.6 53.8 56.9 67.1 75.7 67.2
BC of CA (Stanislaus) 44.9 53.9 60.9 63.9 80.3 70.8
BC of CA (Tulare) 49.1 67.1 70.4 71.1 77.6 74.8
CCHP 65.5 69.2 61.3 60.2 79.0 74.2
HPSJ 43.0 43.6 53.9 67.6 71.8 73.5
IEHP 47.9 63.0 68.1 74.9 77.4 75.3
KFHC 57.2 61.8 55.6 65.1 69.8 76.9
L.A. Care 49.0 51.7 59.5 56.3 77.2 75.2
SFHP 51.4 62.9 74.3 73.4 76.9 90.3
LI
SCFHP 53.6 60.4 65.7 73.2 86.8 84.7
Medi-Cal Managed Care Straight Average*** 51.5 58.8 65.4 67.7 76.7 76.8 * Rates for Blue Cross CP and Health Net CP are weighted averages incorporating all the counties served by this plan-model combination. ** The following events preclude reporting a rate: a plan's first year in a county, the first year DHCS requires a HEDIS measure, and the first year of significant changes in a measure's specifications. *** The Medi-Cal Managed Care Average presented in this table is the unweighted average of the HEDIS Rates presented in the table for each year evaluated.

Medi-Cal Managed Care External Accountability Set 2007
HEDIS 2007 Health Plan Results by Model Type and Trend Tables
Delmarva Foundation 76
Childhood Immunization Status - Combination #2
The weighted averages for the model types range from 73.6 percent to 82.9 percent. The Medi-Cal managed care straight average increased every year from 51.5 percent in 2001 to 76.8 percent in 2007. San Francisco Health Plan has the highest rate of 90.3. Kaiser GMC-South has the second highest rate with 86.6 percent. The 2007 rates for 12 plans are higher than the 2006 rates.

Medi-Cal Managed Care External Accountability Set 2007
HEDIS 2007 Health Plan Results by Model Type and Trend Tables
Delmarva Foundation 77
Figure 52. HEDIS 2007 Adolescent Well-Care Visits – COHS
Figure 53. HEDIS 2007 Adolescent Well-Care Visits - CP * SB/R is San Bernardino/Riverside.
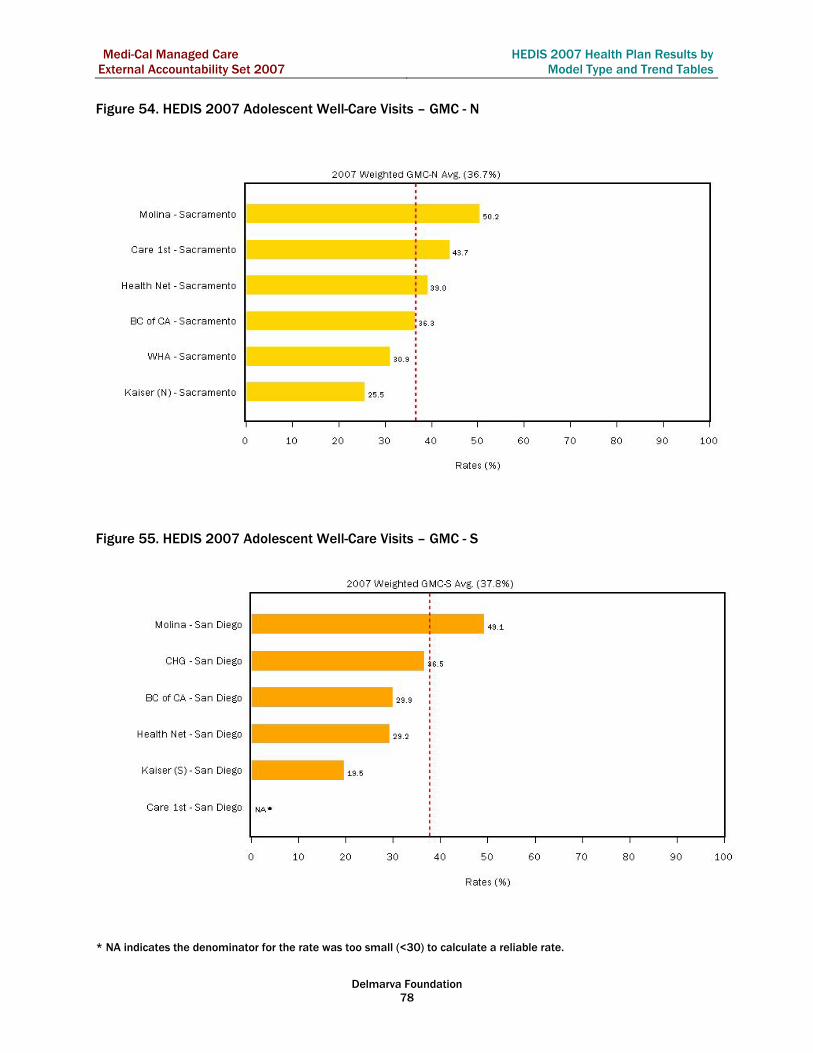
Medi-Cal Managed Care External Accountability Set 2007
HEDIS 2007 Health Plan Results by Model Type and Trend Tables
Delmarva Foundation 78
Figure 54. HEDIS 2007 Adolescent Well-Care Visits – GMC - N
Figure 55. HEDIS 2007 Adolescent Well-Care Visits – GMC - S * NA indicates the denominator for the rate was too small (<30) to calculate a reliable rate.

Medi-Cal Managed Care External Accountability Set 2007
HEDIS 2007 Health Plan Results by Model Type and Trend Tables
Delmarva Foundation 79
Figure 56. HEDIS 2007 Adolescent Well-Care Visits - LI
* SB/R is San Bernardino/Riverside.

Medi-Cal Managed Care External Accountability Set 2007
HEDIS 2007 Health Plan Results by Model Type and Trend Tables
Delmarva Foundation 80
COHSCPLIGMC-NGMC-S
LI
GMC-N
CP
GMC-S
COHS
Rates (%)
0 10 20 30 40 50 60 70 80 90 100
47.8
36.8
34.0
36.7
37.8
2007 Weighted Avg. (36.7%)
Figure 57. HEDIS 2007 Adolescent Well-Care Visits - Model Type Comparison of Weighted Averages
Table 22 presents the trends for Adolescent Well-Care Visits. The cell shading represents the rate in relation to the Medi-Cal Managed Care average for that year. The colors are defined as follows (SD = Standard Deviation):
2 or more SDs above the average 2 or more SDs below the average

Medi-Cal Managed Care External Accountability Set 2007
HEDIS 2007 Health Plan Results by Model Type and Trend Tables
Delmarva Foundation 81
Table 22. Trends for Adolescent Well-Care Visits
Model Type
Medi-Cal Managed Care Plans
HEDIS 2001 Rate
HEDIS 2002 Rate
HEDIS 2004 Rate
HEDIS 2005 Rate
HEDIS 2006 Rate
HEDIS 2007 Rate
CalOptima 40.3 43.3 43.1 40.1 55.1 57.6
CCAH 23.6 26.3 30.2 40.4 41.6 43.6
HPSM 24.5 27.8 30.1 32.2 32.2 33.8
PHP of CA 35.6 30.3 23.8 32.5 43.5 35.4
COHS
SBRHA 22.7 30.8 26.2 32.4 31.7 33.1
BC of CA (CP)* 30.1 36.6 37.2 38.3 39.0 39.1
Health Net (CP)* 25.3 25.1 24.7 31.1 29.1 34.9 CP
Molina Healthcare (CP) 29.4 39.1 45.3 43.1 40.7 44.2
BC of CA (GMC-N) 26.3 27.1 29.6 38.2 30.1 36.3
Care1st (GMC-N)** ----- ----- ----- ----- ----- 43.7
Health Net (GMC-N) 35.9 29.3 31.8 32.1 30.7 39.0
Kaiser (GMC-N) 23.5 23.6 24.4 24.7 24.5 25.5
Molina Healthcare (GMC-N) ----- 34.4 39.5 45.6 46.3 50.2
GMCN
WHA 25.8 21.4 37.2 31.1 38.2 30.9
BC of CA (GMC-S) 18.3 25.5 29.2 26.9 27.1 29.9
Care1st (GMC-S)** ----- ----- ----- ----- ----- -----
CHG 29.4 32.6 31.9 29.7 24.6 36.5
Health Net (GMC-S) 24.5 24.9 24.1 23.8 27.5 29.2
Kaiser (GMC-S) 17.9 25.0 23.6 24.4 24.4 19.5
Molina Healthcare (GMC-S)** ----- ----- ----- ----- ----- 49.1
Sharp 28.0 21.2 30.7 ----- ----- -----
UCSD 21.9 19.2 ----- ----- ----- -----
GMCS
Universal 18.5 17.5 30.8 ----- ----- -----
AAH 32.9 40.0 37.5 45.5 44.8 40.6
BC of CA (Stanislaus) 20.2 21.1 18.1 29.4 29.6 23.8
BC of CA (Tulare) 21.1 25.7 27.8 29.6 34.5 31.9
CCHP 22.6 22.5 31.1 33.8 34.3 37.0
HPSJ 37.3 31.1 38.0 38.4 34.8 40.1
IEHP 31.5 36.3 44.0 52.2 59.3 38.1
KFHC 27.1 26.3 25.5 37.2 35.5 35.8
L.A. Care 16.6 16.1 37.8 36.7 37.0 31.6
SFHP 35.6 29.4 38.4 45.1 49.1 46.5
LI
SCFHP 32.6 33.8 33.6 33.1 35.0 35.0
Medi-Cal Managed Care Straight Average*** 26.9 28.1 31.9 35.1 36.3 37.0 * Rates for Blue Cross CP and Health Net CP are weighted averages incorporating all the counties served by this plan-model combination. ** The following events preclude reporting a rate: a plan's first year in a county, the first year DHCS requires a HEDIS measure, and the first year of significant changes in a measure's specifications. *** The Medi-Cal Managed Care Average presented in this table is the unweighted average of the HEDIS Rates presented in the table for each year evaluated.

Medi-Cal Managed Care External Accountability Set 2007
HEDIS 2007 Health Plan Results by Model Type and Trend Tables
Delmarva Foundation 82
Adolescent Well-Care Visits
COHS Model type weighted average of 47.8 percent is 11.1 percentage points higher than the Medi-Cal managed care weighted average (36.7 percent). LI model type has the lowest weighted average with a rate of 33.9 percent. The Medi-Cal managed care straight average increased from 26.9 percent in 2001 to 37.0 percent in 2007. The rate has been relatively stable since 2005. CalOptima’s rate of 57.6 percent is the highest for 2007 and is two standard deviations above the Medi-Cal managed care straight average of 37 percent. Kaiser GMC-South has the lowest rate of 19.5 percent which is two standard deviations below the Medi-Cal managed care straight average. Molina Healthcare GMC-North has a high rate of 50.2 percent.

Medi-Cal Managed Care External Accountability Set 2007
HEDIS 2007 Health Plan Results by Model Type and Trend Tables
Delmarva Foundation 83
Figure 58. HEDIS 2007 Appropriate Treatment for Children with Upper Respiratory Infection –
COHS
Figure 59. HEDIS 2007 Appropriate Treatment for Children with Upper Respiratory Infection - CP
* SB/R is San Bernardino/Riverside.

Medi-Cal Managed Care External Accountability Set 2007
HEDIS 2007 Health Plan Results by Model Type and Trend Tables
Delmarva Foundation 84
Care 1st - San Diego
CHG - San Diego
Health Net - San Diego
BC of CA - San Diego
Molina - San Diego
Kaiser (S) - San Diego
Rates (%)
0 10 20 30 40 50 60 70 80 90 100
85.8
82.7
84.6
92.0
87.9
NA
2007 Weighted GMC-S Avg. (85.1%)
Figure 60. HEDIS 2007 Appropriate Treatment for Children with Upper Respiratory Infection –
GMC - N
Figure 61. HEDIS 2007 Appropriate Treatment for Children with Upper Respiratory Infection –
GMC - S
* NA indicates the denominator for the rate was too small (<30) to calculate a reliable rate.

Medi-Cal Managed Care External Accountability Set 2007
HEDIS 2007 Health Plan Results by Model Type and Trend Tables
Delmarva Foundation 85
Figure 62. HEDIS 2007 Appropriate Treatment for Children with Upper Respiratory Infection - LI
* SB/R is San Bernardino/Riverside.

Medi-Cal Managed Care External Accountability Set 2007
HEDIS 2007 Health Plan Results by Model Type and Trend Tables
Delmarva Foundation 86
COHSCPLIGMC-NGMC-S
CP
LI
COHS
GMC-N
GMC-S
Rates (%)
0 10 20 30 40 50 60 70 80 90 100
81.3
74.5
79.3
84.8
85.1
2007 Weighted Avg. (78.9%)
Figure 63. HEDIS 2007 Appropriate Treatment for Children with Upper Respiratory Infection - Model
Type Comparison of Weighted Averages
Table 23 presents the trends for Appropriate Treatment for Children with Upper Respiratory Infection. The cell shading represents the rate in relation to the Medi-Cal Managed Care average for that year. The colors are defined as follows (SD = Standard Deviation):
2 or more SDs above the average 2 or more SDs below the average

Medi-Cal Managed Care External Accountability Set 2007
HEDIS 2007 Health Plan Results by Model Type and Trend Tables
Delmarva Foundation 87
Table 23. Trends for Appropriate Treatment for Children with Upper Respiratory Infection*
Model Type Medi-Cal Managed Care Plans HEDIS 2006 Rate HEDIS 2007 Rate
CalOptima 79.4 79.7 CCAH 91.1 91.8 HPSM 91.3 90.2
PHP of CA 89.1 88.4
COHS
SBRHA 75.0 71.5 BC of CA (CP)** 87.6 88.1
Health Net (CP)** 81.5 73.7 CP
Molina Healthcare (CP) 74.1 70.9 BC of CA (GMC-N) 90.9 90.7
Care1st (GMC-N)*** ----- 83.7 Health Net (GMC-N) 86.0 73.6
Kaiser (GMC-N) 96.8 96.4 Molina Healthcare (GMC-N) 86.4 88.2
GMCN
WHA 92.6 92.8 BC of CA (GMC-S) 90.8 85.8
Care1st (GMC-S)*** ----- ----- CHG 84.4 82.7
Health Net (GMC-S) 90.7 84.6 Kaiser (GMC-S) 90.4 92.0
Molina Healthcare (GMC-S)*** ----- 87.9 Sharp ----- ----- UCSD ----- -----
GMCS
Universal ----- ----- AAH 93.8 93.6
BC of CA (Stanislaus) 85.5 82.8 BC of CA (Tulare) 80.2 75.1
CCHP 92.2 91.8 HPSJ 75.8 78.4 IEHP 58.7 73.0 KFHC 79.8 76.7
L.A. Care 76.3 78.3 SFHP 95.5 92.6
LI
SCFHP 89.7 89.8 Medi-Cal Managed Care Straight Average**** 85.4 84.3
*If data for a measure was available it is presented in the trending tables. Measures with 2 years worth of data may not indicate a trend, but they do provide a comparison between the current year and the previous. ** Rates for Blue Cross CP and Health Net CP are weighted averages incorporating all the counties served by this plan-model combination. *** The following events preclude reporting a rate: a plan's first year in a county, the first year DHCS requires a HEDIS measure, and the first year of significant changes in a measure's specifications. **** The Medi-Cal Managed Care Average presented in this table is the unweighted average of the HEDIS Rates presented in the table for each year evaluated.

Medi-Cal Managed Care External Accountability Set 2007
HEDIS 2007 Health Plan Results by Model Type and Trend Tables
Delmarva Foundation 88
Appropriate Treatment for Children with Upper Respiratory Infection (URI)
For the model type weighted averages, GMC-South has the highest rate (85.1 percent) while GMC-North is second with a rate of 84.8 percent. URI rates have been consistent for approximately 53 percent of the plans between 2006 and 2007. The Medi-Cal managed care straight average for 2007 is 84.3 percent.

Medi-Cal Managed Care External Accountability Set 2007
HEDIS 2007 Health Plan Results by Model Type and Trend Tables
Delmarva Foundation 89
HPSM - San Mateo
CalOptima - Orange
SBRHA - Santa Barbara
PHP of CA - Solano/Yolo/Napa
CCAH - Monterey/Santa Cruz
Rates (%)
0 10 20 30 40 50 60 70 80 90 100
79.8
86.4
70.6
84.6
84.5
2007 Weighted COHS Avg. (82.0%)
Figure 64. HEDIS 2007 Prenatal and Postpartum Care—Timeliness of Prenatal Care – COHS
Figure 65. HEDIS 2007 Prenatal and Postpartum Care—Timeliness of Prenatal Care - CP
* SB/R is San Bernardino/Riverside.
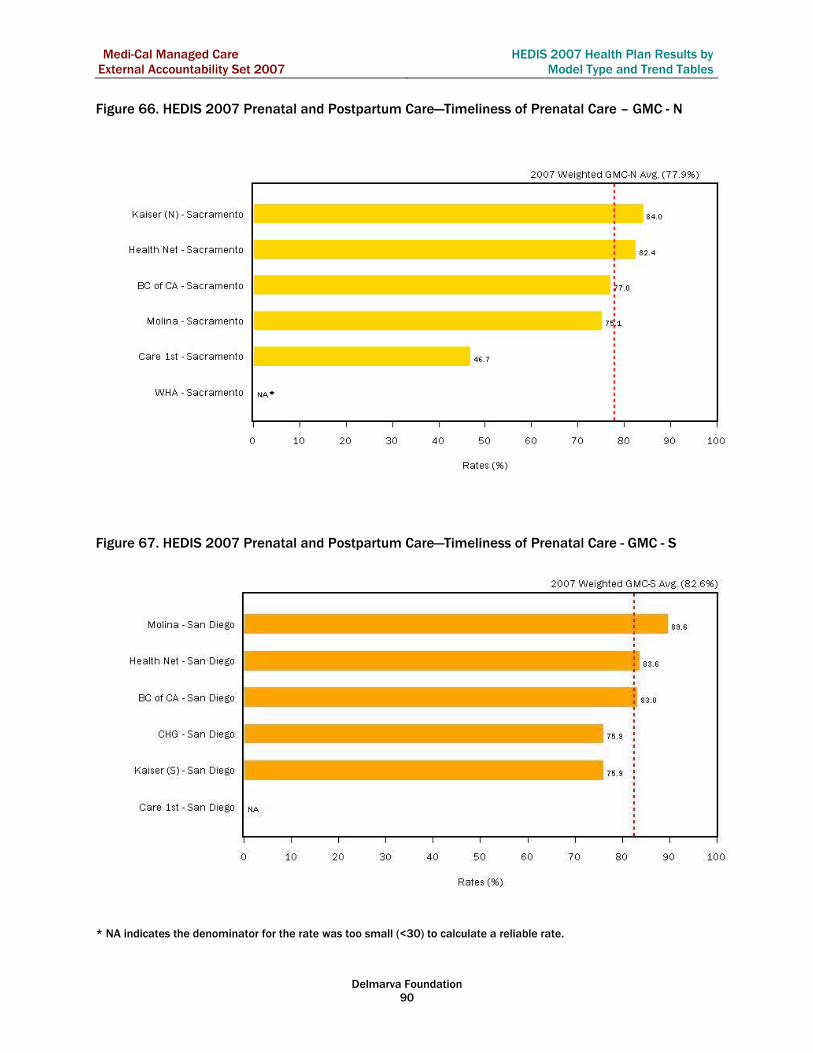
Medi-Cal Managed Care External Accountability Set 2007
HEDIS 2007 Health Plan Results by Model Type and Trend Tables
Delmarva Foundation 90
Figure 66. HEDIS 2007 Prenatal and Postpartum Care—Timeliness of Prenatal Care – GMC - N
Figure 67. HEDIS 2007 Prenatal and Postpartum Care—Timeliness of Prenatal Care - GMC - S
* NA indicates the denominator for the rate was too small (<30) to calculate a reliable rate.

Medi-Cal Managed Care External Accountability Set 2007
HEDIS 2007 Health Plan Results by Model Type and Trend Tables
Delmarva Foundation 91
Figure 68. HEDIS 2007 Prenatal and Postpartum Care—Timeliness of Prenatal Care - LI
* SB/R is San Bernardino/Riverside. ** NA indicates the denominator for the rate was too small (<30) to calculate a reliable rate.

Medi-Cal Managed Care External Accountability Set 2007
HEDIS 2007 Health Plan Results by Model Type and Trend Tables
Delmarva Foundation 92
COHSCPLIGMC-NGMC-S
LI
GMC-N
CP
COHS
GMC-S
Rates (%)
0 10 20 30 40 50 60 70 80 90 100
82.0
81.4
77.5
77.9
82.6
2007 Weighted Avg. (79.4%)
Figure 69. HEDIS 2007 Prenatal and Postpartum Care—Timeliness of Prenatal Care - Model Type
Comparison of Weighted Averages
Table 24 presents the trends for Prenatal and Postpartum Care - Timeliness of Prenatal Care. The cell shading represents the rate in relation to the Medi-Cal Managed Care average for that year. The colors are defined as follows (SD = Standard Deviation):
2 or more SDs above the average 2 or more SDs below the average

Medi-Cal Managed Care External Accountability Set 2007
HEDIS 2007 Health Plan Results by Model Type and Trend Tables
Delmarva Foundation 93
Table 24. Trends for Prenatal and Postpartum Care - Timeliness of Prenatal Care
Model Type
Medi-Cal Managed Care Plans
HEDIS 2001 Rate
HEDIS 2002 Rate
HEDIS 2004 Rate
HEDIS 2005 Rate
HEDIS 2006 Rate
HEDIS 2007 Rate
CalOptima 69.8 81.4 73.1 83.3 85.2 79.8
CCAH 76.4 78.8 88.1 88.1 88.8 86.4
HPSM 78.7 72.4 70.7 71.1 74.7 70.6
PHP of CA 76.6 74.8 81.0 88.7 88.1 84.6
COHS
SBRHA 88.3 88.2 89.8 83.5 83.4 84.5
BC of CA (CP)* 76.8 80.8 83.2 82.6 84.0 79.9
Health Net (CP)* 37.4 55.3 66.5 75.7 78.3 82.1 CP
Molina Healthcare (CP) 65.3 67.5 72.0 75.5 77.4 82.6
BC of CA (GMC-N) 76.3 81.3 76.6 80.9 81.9 77.0
Care1st (GMC-N)** ----- ----- ----- ----- ----- 46.7
Health Net (GMC-N) 34.9 63.9 77.1 77.3 78.5 82.4
Kaiser (GMC-N) 70.8 73.0 76.8 76.7 78.3 84.0
Molina Healthcare (GMC-N) ----- 64.5 71.8 71.5 70.2 75.1
GMCN
WHA 57.9 57.4 61.0 67.7 66.7 -----
BC of CA (GMC-S) 79.8 84.3 81.6 82.1 84.1 83.0
Care1st (GMC-S)** ----- ----- ----- ----- ----- -----
CHG 69.6 67.6 77.6 72.0 77.4 75.9
Health Net (GMC-S) 29.5 47.2 77.0 83.6 85.0 83.6
Kaiser (GMC-S) 80.5 84.3 80.0 85.2 80.7 75.9
Molina Healthcare (GMC-S)** ----- ----- ----- ----- ----- 89.6
Sharp ----- 61.6 78.2 ----- ----- -----
GMCS
UCSD 81.3 74.2 ----- ----- ----- -----
AAH 68.7 72.0 72.0 80.9 82.8 -----
BC of CA (Stanislaus) 78.7 81.7 80.5 82.3 87.0 80.7
BC of CA (Tulare) 65.7 85.2 83.8 79.9 86.3 81.4
CCHP 82.0 83.7 80.3 79.6 78.1 82.3
HPSJ 65.0 75.9 69.0 79.3 79.8 78.3
IEHP 72.7 71.1 81.0 85.9 87.3 84.2
KFHC 75.9 71.5 80.5 77.0 77.4 79.3
L.A. Care 58.7 69.9 73.5 73.9 70.7 72.0
SFHP 74.2 73.0 76.9 84.2 88.6 86.3
LI
SCFHP 81.7 80.8 81.6 80.0 82.4 79.9
Medi-Cal Managed Care Straight Average*** 69.4 73.0 77.3 79.6 80.9 79.6 * Rates for Blue Cross CP and Health Net CP are weighted averages incorporating all the counties served by this plan-model combination. ** The following events preclude reporting a rate: a plan's first year in a county, the first year DHCS requires a HEDIS measure, and the first year of significant changes in a measure's specifications. *** The Medi-Cal Managed Care Average presented in this table is the unweighted average of the HEDIS Rates presented in the table for each year evaluated.

Medi-Cal Managed Care External Accountability Set 2007
HEDIS 2007 Health Plan Results by Model Type and Trend Tables
Delmarva Foundation 94
Prenatal and Postpartum Care—Timeliness of Prenatal Care
In comparing model type weighted averages, GMC-South has the highest rate at 82.6 percent. COHS has the next highest rate at 82.0 percent. The Medi-Cal managed care straight average has been steady for the past three years. While nine plans have higher rates in 2007, 16 plans have lower rates. Molina GMC-South has the highest rate at 89.6 percent.

Medi-Cal Managed Care External Accountability Set 2007
HEDIS 2007 Health Plan Results by Model Type and Trend Tables
Delmarva Foundation 95
Figure 70. HEDIS 2007 Prenatal and Postpartum Care—Postpartum Care – COHS
Figure 71. HEDIS 2007 Prenatal and Postpartum Care—Postpartum Care - CP
* SB/R is San Bernardino/Riverside.

Medi-Cal Managed Care External Accountability Set 2007
HEDIS 2007 Health Plan Results by Model Type and Trend Tables
Delmarva Foundation 96
WHA - Sacramento
Molina - Sacramento
Care 1st - Sacramento
Health Net - Sacramento
BC of CA - Sacramento
Kaiser (N) - Sacramento
Rates (%)
0 10 20 30 40 50 60 70 80 90 100
59.5
58.1
64.3
48.8
NR*
51.1
2007 Weighted GMC-N Avg. (58.5%)
Care 1st - San Diego
Kaiser (S) - San Diego
CHG - San Diego
Health Net - San Diego
Molina - San Diego
BC of CA - San Diego
Rates (%)
0 10 20 30 40 50 60 70 80 90 100
58.9
49.6
54.5
45.4
56.8
NA**
2007 Weighted GMC-S Avg. (53.8%)
Figure 72. HEDIS 2007 Prenatal and Postpartum Care—Postpartum Care - GMC - N
Figure 73. HEDIS 2007 Prenatal and Postpartum Care—Postpartum Care - GMC - S
* NR indicates a rate was not reportable because the rate was materially biased or the plan chose not to report the rate. ** NA indicates the denominator for the rate was too small (<30) to calculate a reliable rate.

Medi-Cal Managed Care External Accountability Set 2007
HEDIS 2007 Health Plan Results by Model Type and Trend Tables
Delmarva Foundation 97
Figure 74. HEDIS 2007 Prenatal and Postpartum Care—Postpartum Care - LI
* SB/R is San Bernardino/Riverside.

Medi-Cal Managed Care External Accountability Set 2007
HEDIS 2007 Health Plan Results by Model Type and Trend Tables
Delmarva Foundation 98
COHSCPLIGMC-NGMC-S
GMC-S
CP
GMC-N
LI
COHS
Rates (%)
0 10 20 30 40 50 60 70 80 90 100
64.3
56.6
58.7
58.5
53.8
2007 Weighted Avg. (58.7%)
Figure 75. HEDIS 2007 Prenatal and Postpartum Care—Postpartum Care - Model Type Comparison
of Weighted Averages
Table 25 presents the trends for Prenatal and Postpartum Care - Postpartum Care. The cell shading represents the rate in relation to the Medi-Cal Managed Care average for that year. The colors are defined as follows (SD = Standard Deviation):
2 or more SDs above the average 2 or more SDs below the average

Medi-Cal Managed Care External Accountability Set 2007
HEDIS 2007 Health Plan Results by Model Type and Trend Tables
Delmarva Foundation 99
Table 25. Trends for Prenatal and Postpartum Care - Postpartum Care
Model Type
Medi-Cal Managed Care Plans
HEDIS 2001 Rate
HEDIS 2002 Rate
HEDIS 2004 Rate
HEDIS 2005 Rate
HEDIS 2006 Rate
HEDIS 2007 Rate
CalOptima 52.7 63.3 63.8 62.3 65.6 59.8
CCAH 55.2 58.4 66.7 69.8 73.2 72.0
HPSM 65.7 64.9 55.7 55.4 54.3 55.0
PHP of CA 56.8 62.2 64.3 69.5 63.5 64.3
COHS
SBRHA 74.9 76.7 78.4 73.9 74.9 73.5
BC of CA (CP)* 53.4 60.0 58.3 59.1 57.2 55.2
Health Net (CP)* 28.2 36.4 50.4 51.0 57.6 57.6 CP
Molina Healthcare (CP) 26.2 34.4 51.9 50.8 48.4 56.3
BC of CA (GMC-N) 55.5 57.9 55.3 56.7 51.6 59.5
Care1st (GMC-N)** ----- ----- ----- ----- ----- 51.1
Health Net (GMC-N) 22.1 47.8 53.8 53.9 51.3 58.1
Kaiser (GMC-N) 56.0 59.3 59.1 55.4 60.6 64.3
Molina Healthcare (GMC-N) ----- 39.2 43.8 47.6 47.9 48.8
GMCN
WHA 42.9 43.4 39.5 44.1 50.0 -----
BC of CA (GMC-S) 48.9 53.3 53.2 53.5 50.2 58.9
Care1st (GMC-S)** ----- ----- ----- ----- ----- -----
CHG 46.7 46.0 50.6 44.3 44.8 49.6
Health Net (GMC-S) 15.2 28.3 52.1 63.8 58.2 54.5
Kaiser (GMC-S) 57.6 57.4 53.9 60.6 52.6 45.4
Molina Healthcare (GMC-S)** ----- ----- ----- ----- ----- 56.8
Sharp 34.2 56.1 58.2 ----- ----- -----
UCSD 66.4 53.0 ----- ----- ----- -----
GMCS
Universal 29.9 41.5 45.4 ----- ----- -----
AAH 40.9 59.3 55.7 61.3 61.9 61.9
BC of CA (Stanislaus) 50.9 50.9 54.1 57.6 51.6 57.9
BC of CA (Tulare) 47.5 63.2 63.7 62.7 64.6 63.0
CCHP 45.7 48.0 50.9 53.0 55.1 56.3
HPSJ 38.3 52.5 60.2 57.2 56.9 57.2
IEHP 50.0 57.8 58.4 65.7 66.0 60.0
KFHC 55.1 56.0 56.8 64.6 61.6 63.8
L.A. Care 45.2 45.8 49.6 52.8 48.7 50.2
SFHP 48.3 56.1 49.9 58.5 64.3 55.9
LI
SCFHP 53.1 56.6 58.4 62.4 59.9 58.3
Medi-Cal Managed Care Straight Average*** 47.0 52.9 55.6 58.1 57.5 58.0 * Rates for Blue Cross CP and Health Net CP are weighted averages incorporating all the counties served by this plan-model combination. ** The following events preclude reporting a rate: a plan's first year in a county, the first year DHCS requires a HEDIS measure, and the first year of significant changes in a measure's specifications. *** The Medi-Cal Managed Care Average presented in this table is the unweighted average of the HEDIS Rates presented in the table for each year evaluated.

Medi-Cal Managed Care External Accountability Set 2007
HEDIS 2007 Health Plan Results by Model Type and Trend Tables
Delmarva Foundation 100
Prenatal and Postpartum Care - Postpartum Care
The range of model type weighted averages range from 53.8 percent to 64.3 percent. The Medi-Cal managed care straight average has been steady for the past three years. Santa Barbara RHA (73.5 percent) and Central Coast Alliance (72.0 percent) are two standard deviations above the Medi-Cal managed care straight average. Kaiser GMC-South (45.4 percent) is two standard deviations below the Medi-Cal managed care straight average.

Medi-Cal Managed Care External Accountability Set 2007
HEDIS 2007 Health Plan Results by Model Type and Trend Tables
Delmarva Foundation 101
Figure 76. HEDIS 2007 Chlamydia Screening in Women – COHS
Figure 77. HEDIS 2007 Chlamydia Screening in Women - CP
* SB/R is San Bernardino/Riverside.

Medi-Cal Managed Care External Accountability Set 2007
HEDIS 2007 Health Plan Results by Model Type and Trend Tables
Delmarva Foundation 102
Figure 78. HEDIS 2007 Chlamydia Screening in Women – GMC - N
Figure 79. HEDIS 2007 Chlamydia Screening in Women – GMC - S
* NA indicates the denominator for the rate was too small (<30) to calculate a reliable rate.

Medi-Cal Managed Care External Accountability Set 2007
HEDIS 2007 Health Plan Results by Model Type and Trend Tables
Delmarva Foundation 103
HPSJ - San Joaquin
LA Care - Los Angeles
IEHP - San Bernardino and River
SCFHP - Santa Clara
BC of CA - Tulare
BC of CA - Stanislaus
SFHP - San Francisco
KFHC - Kern
AAH - Alameda
CCHP - Contra Costa
Rates (%)
0 10 20 30 40 50 60 70 80 90 100
62
55
55
66
39
51
59
45
54
58
2007 Weighted LI Avg. (50.6%)
Figure 80. HEDIS 2007 Chlamydia Screening in Women - LI
* SB/R is San Bernardino/Riverside.

Medi-Cal Managed Care External Accountability Set 2007
HEDIS 2007 Health Plan Results by Model Type and Trend Tables
Delmarva Foundation 104
COHSCPLIGMC-NGMC-S
LI
CP
COHS
GMC-N
GMC-S
Rates (%)
0 10 20 30 40 50 60 70 80 90 100
54.4
52.8
50.5
58.1
59.8
2007 Weighted Avg. (52.8%)
Figure 81. HEDIS 2007 Chlamydia Screening in Women - Model Type Comparison of Weighted
Averages
Table 26 presents the trends for Chlamydia Screening in Women. The cell shading represents the rate in relation to the Medi-Cal Managed Care average for that year. The colors are defined as follows (SD = Standard Deviation):
2 or more SDs above the average 2 or more SDs below the average
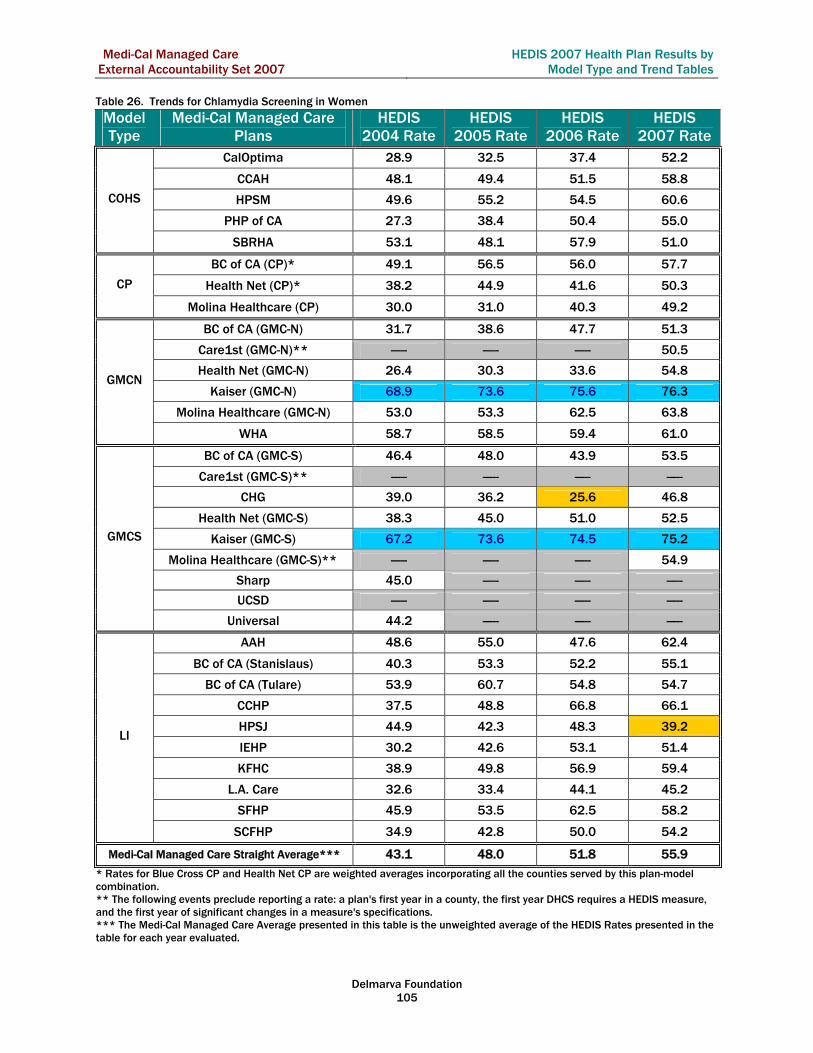
Medi-Cal Managed Care External Accountability Set 2007
HEDIS 2007 Health Plan Results by Model Type and Trend Tables
Delmarva Foundation 105
Table 26. Trends for Chlamydia Screening in Women
Model Type
Medi-Cal Managed Care Plans
HEDIS 2004 Rate
HEDIS 2005 Rate
HEDIS 2006 Rate
HEDIS 2007 Rate
CalOptima 28.9 32.5 37.4 52.2
CCAH 48.1 49.4 51.5 58.8
HPSM 49.6 55.2 54.5 60.6
PHP of CA 27.3 38.4 50.4 55.0
COHS
SBRHA 53.1 48.1 57.9 51.0
BC of CA (CP)* 49.1 56.5 56.0 57.7
Health Net (CP)* 38.2 44.9 41.6 50.3 CP
Molina Healthcare (CP) 30.0 31.0 40.3 49.2
BC of CA (GMC-N) 31.7 38.6 47.7 51.3
Care1st (GMC-N)** ----- ----- ----- 50.5
Health Net (GMC-N) 26.4 30.3 33.6 54.8
Kaiser (GMC-N) 68.9 73.6 75.6 76.3
Molina Healthcare (GMC-N) 53.0 53.3 62.5 63.8
GMCN
WHA 58.7 58.5 59.4 61.0
BC of CA (GMC-S) 46.4 48.0 43.9 53.5
Care1st (GMC-S)** ----- ----- ----- -----
CHG 39.0 36.2 25.6 46.8
Health Net (GMC-S) 38.3 45.0 51.0 52.5
Kaiser (GMC-S) 67.2 73.6 74.5 75.2
Molina Healthcare (GMC-S)** ----- ----- ----- 54.9
Sharp 45.0 ----- ----- -----
UCSD ----- ----- ----- -----
GMCS
Universal 44.2 ----- ----- -----
AAH 48.6 55.0 47.6 62.4
BC of CA (Stanislaus) 40.3 53.3 52.2 55.1
BC of CA (Tulare) 53.9 60.7 54.8 54.7
CCHP 37.5 48.8 66.8 66.1
HPSJ 44.9 42.3 48.3 39.2
IEHP 30.2 42.6 53.1 51.4
KFHC 38.9 49.8 56.9 59.4
L.A. Care 32.6 33.4 44.1 45.2
SFHP 45.9 53.5 62.5 58.2
LI
SCFHP 34.9 42.8 50.0 54.2
Medi-Cal Managed Care Straight Average*** 43.1 48.0 51.8 55.9 * Rates for Blue Cross CP and Health Net CP are weighted averages incorporating all the counties served by this plan-model combination. ** The following events preclude reporting a rate: a plan's first year in a county, the first year DHCS requires a HEDIS measure, and the first year of significant changes in a measure's specifications. *** The Medi-Cal Managed Care Average presented in this table is the unweighted average of the HEDIS Rates presented in the table for each year evaluated.

Medi-Cal Managed Care External Accountability Set 2007
HEDIS 2007 Health Plan Results by Model Type and Trend Tables
Delmarva Foundation 106
Chlamydia Screening in Women - CP
Model type weighted averages range from 50.5 percent to 59.8 percent. GMC-South and GMC-North have the highest and second highest rates. The Medi-Cal managed care straight average increased 4.1 percentage points from 51.8 percent to 55.9 percent for the 2006 to 2007 measurement years. Kaiser GMC-North (76.3 percent) and Kaiser GMC- South (75.2 percent) rates are two standard deviations above the Medi-Cal managed care straight average. Health Plan San Joaquin (39.3 percent) is two standard deviations below the Medi-Cal managed care straight average.

Medi-Cal Managed Care External Accountability Set 2007
HEDIS 2007 Health Plan Results by Model Type and Trend Tables
Delmarva Foundation 107
Figure 82. HEDIS 2007 Cervical Cancer Screening – COHS
Figure 83. HEDIS 2007 Cervical Cancer Screening - CP
* SB/R is San Bernardino/Riverside.

Medi-Cal Managed Care External Accountability Set 2007
HEDIS 2007 Health Plan Results by Model Type and Trend Tables
Delmarva Foundation 108
Figure 84. HEDIS 2007 Cervical Cancer Screening – GMC - N
Figure 85. HEDIS 2007 Cervical Cancer Screening – GMC - S
* NA indicates the denominator for the rate was too small (<30) to calculate a reliable rate.

Medi-Cal Managed Care External Accountability Set 2007
HEDIS 2007 Health Plan Results by Model Type and Trend Tables
Delmarva Foundation 109
Figure 86. HEDIS 2007 Cervical Cancer Screening - LI * SB/R is San Bernardino/Riverside.

Medi-Cal Managed Care External Accountability Set 2007
HEDIS 2007 Health Plan Results by Model Type and Trend Tables
Delmarva Foundation 110
COHSCPLIGMC-NGMC-S
GMC-N
CP
GMC-S
LI
COHS
Rates (%)
0 10 20 30 40 50 60 70 80 90 100
70.1
65.7
69.3
62.9
66.5
2007 Weighted Avg. (68.0%)
Figure 87. HEDIS 2007 Cervical Cancer Screening - Model Type Comparison of Weighted Averages
Table 27 presents the trends for Appropriate Treatment for Cervical Cancer Screening. The cell shading represents the rate in relation to the Medi-Cal Managed Care average for that year. The colors are defined as follows (SD = Standard Deviation):
2 or more SDs above the average 2 or more SDs below the average

Medi-Cal Managed Care External Accountability Set 2007
HEDIS 2007 Health Plan Results by Model Type and Trend Tables
Delmarva Foundation 111
Table 27. Trends for Appropriate Treatment for Cervical Cancer Screening
Model Type
Medi-Cal Managed Care Plans
HEDIS 2004 Rate
HEDIS 2005 Rate
HEDIS 2006 Rate
HEDIS 2007 Rate
CalOptima 59.3 64.1 69.1 72.7
CCAH 65.2 70.6 72.5 77.4
HPSM 45.0 50.4 49.6 55.0
PHP of CA 53.6 68.2 67.8 63.7
COHS
SBRHA 64.6 74.5 74.3 70.6
BC of CA (CP)* 69.5 72.2 69.4 67.6
Health Net (CP)* 51.9 62.7 65.3 65.6 CP
Molina Healthcare (CP) 60.9 62.9 60.1 58.9
BC of CA (GMC-N) 69.0 68.7 69.4 62.2
Care1st (GMC-N)** ----- ----- ----- 42.2
Health Net (GMC-N) 36.1 49.2 51.8 57.7
Kaiser (GMC-N) 74.2 75.8 74.8 76.8
Molina Healthcare (GMC-N) 61.3 66.5 64.7 59.3
GMCN
WHA 58.2 68.1 63.0 58.4
BC of CA (GMC-S) 66.1 66.7 66.1 63.9
Care1st (GMC-S)** ----- ----- ----- -----
CHG 66.4 64.0 63.3 66.7
Health Net (GMC-S) 53.1 60.5 64.7 62.6
Kaiser (GMC-S) 75.5 75.7 74.1 74.7
Molina Healthcare (GMC-S)** ----- ----- ----- 66.0
Sharp 61.6 ----- ----- -----
UCSD ----- ----- ----- -----
GMCS
Universal 56.1 ----- ----- -----
AAH 65.0 69.0 73.7 77.4
BC of CA (Stanislaus) 64.4 60.5 66.9 58.9
BC of CA (Tulare) 76.8 76.6 78.4 75.6
CCHP 68.6 63.9 63.8 67.4
HPSJ 44.9 61.9 62.6 62.6
IEHP 71.1 69.7 74.5 65.5
KFHC 57.3 57.7 60.2 63.1
L.A. Care 60.2 65.6 68.5 70.4
SFHP 61.0 60.3 74.5 77.2
LI
SCFHP 68.4 72.3 69.9 70.4
Medi-Cal Managed Care Straight Average*** 61.6 65.9 67.2 65.9 * Rates for Blue Cross CP and Health Net CP are weighted averages incorporating all the counties served by this plan-model combination. ** The following events preclude reporting a rate: a plan's first year in a county, the first year DHCS requires a HEDIS measure, and the first year of significant changes in a measure's specifications. *** The Medi-Cal Managed Care Average presented in this table is the unweighted average of the HEDIS Rates presented in the table for each year evaluated.

Medi-Cal Managed Care External Accountability Set 2007
HEDIS 2007 Health Plan Results by Model Type and Trend Tables
Delmarva Foundation 112
Cervical Cancer Screening
The model type weighted average (70.1 percent) for COHS is the highest for Cervical Cancer Screening. GMC-North has the lowest model type weighted average at 62.9 percent. Fourteen plans increased rates from 2006 to 2007. The Medi-Cal managed care straight average has been consistent for the past three years.

Medi-Cal Managed Care External Accountability Set 2007
HEDIS 2007 Health Plan Results by Model Type and Trend Tables
Delmarva Foundation 113
Figure 88. HEDIS 2007 Breast Cancer Screening – COHS
Figure 89. HEDIS 2007 Breast Cancer Screening - CP * SB/R is San Bernardino/Riverside. ** NA indicates the denominator for the rate was too small (<30) to calculate a reliable rate.

Medi-Cal Managed Care External Accountability Set 2007
HEDIS 2007 Health Plan Results by Model Type and Trend Tables
Delmarva Foundation 114
Figure 90. HEDIS 2007 Breast Cancer Screening – GMC - N
Figure 91. HEDIS 2007 Breast Cancer Screening – GMC - S
* NA indicates the denominator for the rate was too small (<30) to calculate a reliable rate.

Medi-Cal Managed Care External Accountability Set 2007
HEDIS 2007 Health Plan Results by Model Type and Trend Tables
Delmarva Foundation 115
Figure 92. HEDIS 2007 Breast Cancer Screening - LI
* SB/R is San Bernardino/Riverside.

Medi-Cal Managed Care External Accountability Set 2007
HEDIS 2007 Health Plan Results by Model Type and Trend Tables
Delmarva Foundation 116
COHSCPLIGMC-NGMC-S
CP
GMC-N
LI
GMC-S
COHS
Rates (%)
0 10 20 30 40 50 60 70 80 90 100
55.6
42.8
48.4
47.8
50.6
2007 Weighted Avg. (48.6%)
Figure 93. HEDIS 2007 Breast Cancer Screening - Model Type Comparison of Weighted Averages
Table 28 presents the trends for Breast Cancer Screening. The cell shading represents the rate in relation to the Medi-Cal Managed Care average for that year. The colors are defined as follows (SD = Standard Deviation):
2 or more SDs above the average 2 or more SDs below the average
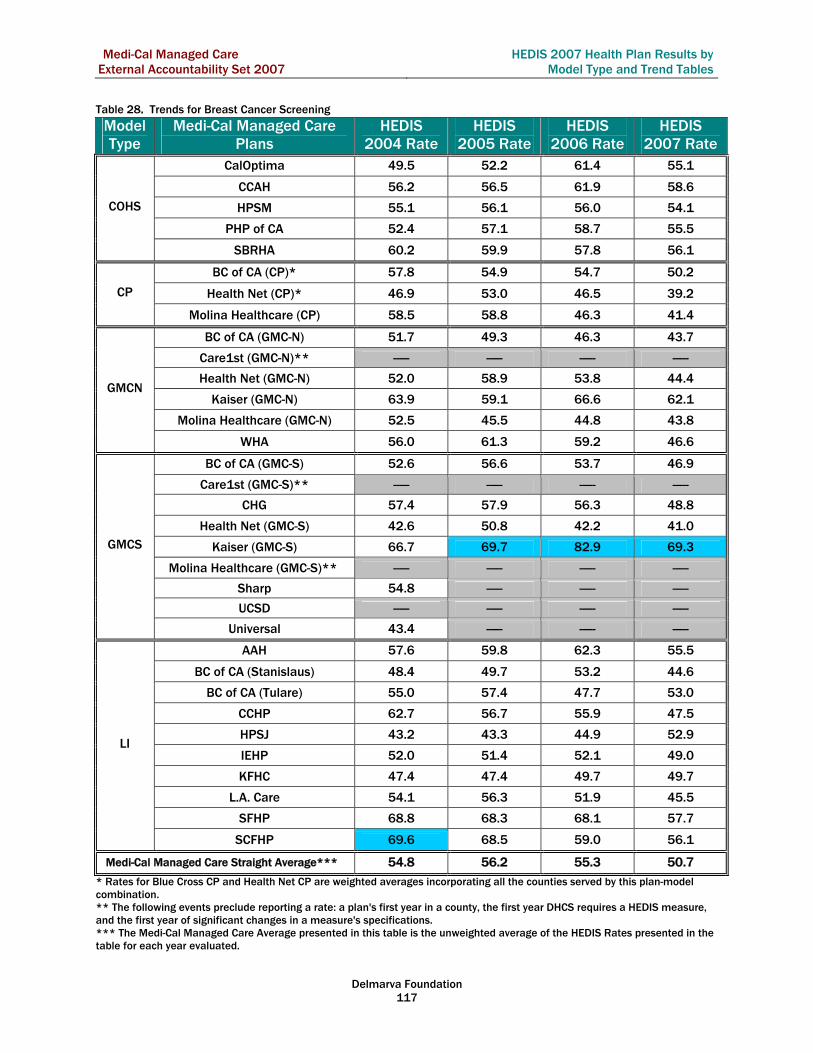
Medi-Cal Managed Care External Accountability Set 2007
HEDIS 2007 Health Plan Results by Model Type and Trend Tables
Delmarva Foundation 117
Table 28. Trends for Breast Cancer Screening
Model Type
Medi-Cal Managed Care Plans
HEDIS 2004 Rate
HEDIS 2005 Rate
HEDIS 2006 Rate
HEDIS 2007 Rate
CalOptima 49.5 52.2 61.4 55.1
CCAH 56.2 56.5 61.9 58.6
HPSM 55.1 56.1 56.0 54.1
PHP of CA 52.4 57.1 58.7 55.5
COHS
SBRHA 60.2 59.9 57.8 56.1
BC of CA (CP)* 57.8 54.9 54.7 50.2
Health Net (CP)* 46.9 53.0 46.5 39.2 CP
Molina Healthcare (CP) 58.5 58.8 46.3 41.4
BC of CA (GMC-N) 51.7 49.3 46.3 43.7
Care1st (GMC-N)** ----- ----- ----- -----
Health Net (GMC-N) 52.0 58.9 53.8 44.4
Kaiser (GMC-N) 63.9 59.1 66.6 62.1
Molina Healthcare (GMC-N) 52.5 45.5 44.8 43.8
GMCN
WHA 56.0 61.3 59.2 46.6
BC of CA (GMC-S) 52.6 56.6 53.7 46.9
Care1st (GMC-S)** ----- ----- ----- -----
CHG 57.4 57.9 56.3 48.8
Health Net (GMC-S) 42.6 50.8 42.2 41.0
Kaiser (GMC-S) 66.7 69.7 82.9 69.3
Molina Healthcare (GMC-S)** ----- ----- ----- -----
Sharp 54.8 ----- ----- -----
UCSD ----- ----- ----- -----
GMCS
Universal 43.4 ----- ----- -----
AAH 57.6 59.8 62.3 55.5
BC of CA (Stanislaus) 48.4 49.7 53.2 44.6
BC of CA (Tulare) 55.0 57.4 47.7 53.0
CCHP 62.7 56.7 55.9 47.5
HPSJ 43.2 43.3 44.9 52.9
IEHP 52.0 51.4 52.1 49.0
KFHC 47.4 47.4 49.7 49.7
L.A. Care 54.1 56.3 51.9 45.5
SFHP 68.8 68.3 68.1 57.7
LI
SCFHP 69.6 68.5 59.0 56.1
Medi-Cal Managed Care Straight Average*** 54.8 56.2 55.3 50.7 * Rates for Blue Cross CP and Health Net CP are weighted averages incorporating all the counties served by this plan-model combination. ** The following events preclude reporting a rate: a plan's first year in a county, the first year DHCS requires a HEDIS measure, and the first year of significant changes in a measure's specifications. *** The Medi-Cal Managed Care Average presented in this table is the unweighted average of the HEDIS Rates presented in the table for each year evaluated.

Medi-Cal Managed Care External Accountability Set 2007
HEDIS 2007 Health Plan Results by Model Type and Trend Tables
Delmarva Foundation 118
Breast Cancer Screening
The model type, COHS, has the highest weighted average for Breast Cancer Screenings at 55.6 percent. Kaiser GMC-South has the highest rate (69.3 percent) which is also two standard deviations above the Medi-Cal managed care straight average of 50.7 percent. The rates for 24 plans went down, two plans had increases in rates, and one plan’s rate (KFHC) remained constant at 49.7 percent. BC of CA Tulare rate went up from 47.7 percent to 53.0 percent. Health Plan San Joaquin’s rate increased from 44.9 percent to 52.9 percent.

Medi-Cal Managed Care External Accountability Set 2007
HEDIS 2007 Health Plan Results by Model Type and Trend Tables
Delmarva Foundation 119
Figure 94. HEDIS 2007 Comprehensive Diabetes Care—Eye Exam (Retinal) Performed – COHS
Figure 95. HEDIS 2007 Comprehensive Diabetes Care—Eye Exam (Retinal) Performed - CP
* SB/R is San Bernardino/Riverside.

Medi-Cal Managed Care External Accountability Set 2007
HEDIS 2007 Health Plan Results by Model Type and Trend Tables
Delmarva Foundation 120
Figure 96. HEDIS 2007 Comprehensive Diabetes Care—Eye Exam (Retinal) Performed – GMC - N
Figure 97. HEDIS 2007 Comprehensive Diabetes Care—Eye Exam (Retinal) Performed – GMC - S
* NA indicates the denominator for the rate was too small (<30) to calculate a reliable rate.

Medi-Cal Managed Care External Accountability Set 2007
HEDIS 2007 Health Plan Results by Model Type and Trend Tables
Delmarva Foundation 121
Figure 98. HEDIS 2007 Comprehensive Diabetes Care—Eye Exam (Retinal) Performed - LI
* SB/R is San Bernardino/Riverside.

Medi-Cal Managed Care External Accountability Set 2007
HEDIS 2007 Health Plan Results by Model Type and Trend Tables
Delmarva Foundation 122
COHSCPLIGMC-NGMC-S
LI
GMC-N
CP
GMC-S
COHS
Rates (%)
0 10 20 30 40 50 60 70 80 90 100
68.7
54.6
45.5
54.2
56.9
2007 Weighted Avg. (54.1%)
Figure 99. HEDIS 2007 Comprehensive Diabetes Care—Eye Exam (Retinal) Performed - Model Type
Comparison of Weighted Averages
Table 29 presents the trends for Comprehensive Diabetes Care – Eye Exam (Retinal) Performed. The cell shading represents the rate in relation to the Medi-Cal Managed Care average for that year. The colors are defined as follows (SD = Standard Deviation):
2 or more SDs above the average 2 or more SDs below the average

Medi-Cal Managed Care External Accountability Set 2007
HEDIS 2007 Health Plan Results by Model Type and Trend Tables
Delmarva Foundation 123
Table 29. Trends for Comprehensive Diabetes Care – Eye Exam (Retinal) Performed
Model Type
Medi-Cal Managed Care Plans
HEDIS 2001 Rate
HEDIS 2002 Rate
HEDIS 2004 Rate
HEDIS 2005 Rate
HEDIS 2006 Rate
HEDIS 2007 Rate
CalOptima 45.7 59.8 53.3 57.0 71.6 68.3
CCAH 54.5 61.1 64.0 66.2 67.2 68.6
HPSM 57.4 52.9 56.0 54.9 66.3 54.7
PHP of CA 58.2 55.0 54.8 60.9 65.8 67.0
COHS
SBRHA 75.4 83.1 75.9 77.6 83.3 81.6
BC of CA (CP)* ----- ----- ----- ----- 48.4 54.9
Health Net (CP)* ----- ----- ----- ----- 47.2 53.9 CP
Molina Healthcare (CP) ----- ----- ----- ----- 61.7 58.9
BC of CA (GMC-N) ----- ----- ----- ----- 49.4 47.0
Care1st (GMC-N)** ----- ----- ----- ----- ----- -----
Health Net (GMC-N) ----- ----- ----- ----- 46.5 53.6
Kaiser (GMC-N) ----- ----- ----- ----- 70.5 65.7
Molina Healthcare (GMC-N) ----- ----- ----- ----- 61.3 64.9
GMCN
WHA ----- ----- ----- ----- 48.2 52.3
BC of CA (GMC-S) ----- ----- ----- ----- 51.7 50.4
Care1st (GMC-S)** ----- ----- ----- ----- ----- -----
CHG ----- ----- ----- ----- 49.9 55.5
Health Net (GMC-S) ----- ----- ----- ----- 44.7 55.8
Kaiser (GMC-S) ----- ----- ----- ----- 71.9 67.2
Molina Healthcare (GMC-S)** ----- ----- ----- ----- ----- 57.8
Sharp ----- ----- ----- ----- ----- -----
UCSD ----- ----- ----- ----- ----- -----
GMCS
Universal ----- ----- ----- ----- ----- -----
AAH ----- ----- ----- ----- 22.2 53.3
BC of CA (Stanislaus) ----- ----- ----- ----- 43.7 39.4
BC of CA (Tulare) ----- ----- ----- ----- 48.7 48.0
CCHP ----- ----- ----- ----- 52.6 54.0
HPSJ ----- ----- ----- ----- 42.3 42.3
IEHP ----- ----- ----- ----- 64.7 60.9
KFHC ----- ----- ----- ----- 41.4 37.7
L.A. Care ----- ----- ----- ----- 32.9 39.4
SFHP ----- ----- ----- ----- 58.9 64.8
LI
SCFHP ----- ----- ----- ----- 49.1 51.7
Medi-Cal Managed Care Straight Average*** 58.2 62.4 60.8 63.3 54.1 56.1 * Rates for Blue Cross CP and Health Net CP are weighted averages incorporating all the counties served by this plan-model combination. ** The following events preclude reporting a rate: a plan's first year in a county, the first year DHCS requires a HEDIS measure, and the first year of significant changes in a measure's specifications. *** The Medi-Cal Managed Care Average presented in this table is the unweighted average of the HEDIS Rates presented in the table for each year evaluated.

Medi-Cal Managed Care External Accountability Set 2007
HEDIS 2007 Health Plan Results by Model Type and Trend Tables
Delmarva Foundation 124
Comprehensive Diabetes Care – Eye Exam (Retinal) Performed
The COHS model type weighted average (68.7 percent) is 14.6 percentage points higher than the Medi-Cal managed care weighted average (54.1 percent). As shown in Table 29, the Medi-Cal managed care straight average increased from 54.1 percent in 2006 to 56.1 percent 2007. Fourteen plans increased their rates between 2006 and 2007. The rate of 81.6 percent for Santa Barbara RHA is the highest for 2007 and is also two standard deviations above the Medi-Cal managed care straight average. Alameda Alliance for Health increased their rate by 31.1 percentage points from 22.2 percent in 2006 to 53.3 percent in 2007.

Medi-Cal Managed Care External Accountability Set 2007
HEDIS 2007 Health Plan Results by Model Type and Trend Tables
Delmarva Foundation 125
Figure 100. HEDIS 2007 Comprehensive Diabetes Care—HbA1c Testing – COHS
Figure 101. HEDIS 2007 Comprehensive Diabetes Care—HbA1c Testing - CP
* SB/R is San Bernardino/Riverside.

Medi-Cal Managed Care External Accountability Set 2007
HEDIS 2007 Health Plan Results by Model Type and Trend Tables
Delmarva Foundation 126
Figure 102. HEDIS 2007 Comprehensive Diabetes Care—HbA1c Testing – GMC - S
Figure 103. HEDIS 2007 Comprehensive Diabetes Care—HbA1c Testing – GMC - S
* NA indicates the denominator for the rate was too small (<30) to calculate a reliable rate.

Medi-Cal Managed Care External Accountability Set 2007
HEDIS 2007 Health Plan Results by Model Type and Trend Tables
Delmarva Foundation 127
Figure 104. HEDIS 2007 Comprehensive Diabetes Care—HbA1c Testing - LI
* SB/R is San Bernardino/Riverside.

Medi-Cal Managed Care External Accountability Set 2007
HEDIS 2007 Health Plan Results by Model Type and Trend Tables
Delmarva Foundation 128
COHSCPLIGMC-NGMC-S
GMC-N
LI
GMC-S
CP
COHS
Rates (%)
0 10 20 30 40 50 60 70 80 90 100
85.4
79.5
76.7
76.1
78.0
2007 Weighted Avg. (79.5%)
Figure 105. HEDIS 2007 Comprehensive Diabetes Care—HbA1c Testing - Model Type Comparison
of Weighted Averages
Table 30 presents the trends for Comprehensive Diabetes Care—HbA1c Testing. The cell shading represents the rate in relation to the Medi-Cal Managed Care average for that year. The colors are defined as follows (SD = Standard Deviation):
2 or more SDs above the average 2 or more SDs below the average

Medi-Cal Managed Care External Accountability Set 2007
HEDIS 2007 Health Plan Results by Model Type and Trend Tables
Delmarva Foundation 129
Table 30. Trends for Comprehensive Diabetes Care—HbA1c Testing*
Model Type
Medi-Cal Managed Care Plans HEDIS 2006 Rate HEDIS 2007 Rate
CalOptima 80.0 83.8 CCAH 81.5 84.2 HPSM 68.9 84.2
PHP of CA 83.2 83.4
COHS
SBRHA 90.6 93.2 BC of CA (CP)** 68.6 80.7
Health Net (CP)** 75.1 79.3 CP
Molina Healthcare (CP) 75.4 75.2 BC of CA (GMC-N) 66.8 68.0
Care1st (GMC-N)*** ----- ----- Health Net (GMC-N) 70.3 78.7
Kaiser (GMC-N) 81.3 85.0 Molina Healthcare (GMC-N) 77.9 79.9
GMCN
WHA 82.5 82.0 BC of CA (GMC-S) 63.9 85.6
Care1st (GMC-S)*** ----- ----- CHG 66.9 72.0
Health Net (GMC-S) 77.7 88.3 Kaiser (GMC-S) 87.7 89.8
Molina Healthcare (GMC-S)*** ----- 81.0 Sharp ----- ----- UCSD ----- -----
GMCS
Universal ----- ----- AAH 75.9 76.2
BC of CA (Stanislaus) 67.3 73.8 BC of CA (Tulare) 70.8 76.6
CCHP 77.5 80.3 HPSJ 70.6 75.4 IEHP 79.1 80.0 KFHC 73.7 75.2
L.A. Care 69.0 74.9 SFHP 71.3 86.0
LI
SCFHP 72.3 84.5 Medi-Cal Managed Care Straight Average**** 75.0 80.6
*If data for a measure was available it is presented in the trending tables. Measures with 2 years worth of data may not indicate a trend, but they do provide a comparison between the current year and the previous. ** Rates for Blue Cross CP and Health Net CP are weighted averages incorporating all the counties served by this plan-model combination. *** The following events preclude reporting a rate: a plan's first year in a county, the first year DHCS requires a HEDIS measure, and the first year of significant changes in a measure's specifications. **** The Medi-Cal Managed Care Average presented in this table is the unweighted average of the HEDIS Rates presented in the table for each year evaluated.

Medi-Cal Managed Care External Accountability Set 2007
HEDIS 2007 Health Plan Results by Model Type and Trend Tables
Delmarva Foundation 130
Comprehensive Diabetes Care—HbA1c Testing
The COHS model type weighted average (85.4 percent) is 5.9 percentage points higher than the Medi-Cal managed care weighted average (79.5 percent). As shown in Table 30, the Medi-Cal managed care straight average increased by 5.6 percentage points from 75.0 percent in 2006 to 80.6 percent in 2007. Santa Barbara RHA has the highest rate in 2007 with 93.2 percent. Santa Barbara RHA can be considered a high performer since their rate (93.2 percent) is two standard deviations above the Medi-Cal managed care straight average of 80.6 percent. In contrast, BC of CA (GMC-North) was a very low performer as their rate (68.0 percent) is two standard deviations below the Medi-Cal managed care straight average (80.6 percent). Of the plans with data for both years, all but two increased their rates between 2006 and 2007.

Medi-Cal Managed Care External Accountability Set 2007
HEDIS 2007 Health Plan Results by Model Type and Trend Tables
Delmarva Foundation 131
Figure 106. HEDIS 2007 Comprehensive Diabetes Care—LDL-C Screening – COHS
Figure 107. HEDIS 2007 Comprehensive Diabetes Care—LDL-C Screening - CP
* SB/R is San Bernardino/Riverside.

Medi-Cal Managed Care External Accountability Set 2007
HEDIS 2007 Health Plan Results by Model Type and Trend Tables
Delmarva Foundation 132
Figure 108. HEDIS 2007 Comprehensive Diabetes Care—LDL-C Screening – GMC - N
Figure 109. HEDIS 2007 Comprehensive Diabetes Care—LDL-C Screening – GMC - S
* NA indicates the denominator for the rate was too small (<30) to calculate a reliable rate.

Medi-Cal Managed Care External Accountability Set 2007
HEDIS 2007 Health Plan Results by Model Type and Trend Tables
Delmarva Foundation 133
Figure 110. HEDIS 2007 Comprehensive Diabetes Care—LDL-C Screening – LI
* SB/R is San Bernardino/Riverside.

Medi-Cal Managed Care External Accountability Set 2007
HEDIS 2007 Health Plan Results by Model Type and Trend Tables
Delmarva Foundation 134
COHSCPLIGMC-NGMC-S
GMC-N
LI
CP
GMC-S
COHS
Rates (%)
0 10 20 30 40 50 60 70 80 90 100
80.7
74.5
74.2
71.4
77.5
2007 Weighted Avg. (75.9%)
Figure 111. HEDIS 2007 Comprehensive Diabetes Care—LDL-C Screening - Model Type Comparison of Weighted Averages
Table 31 presents the trends for Comprehensive Diabetes Care – LDL-C Screening. The cell shading represents the rate in relation to the Medi-Cal Managed Care average for that year. The colors are defined as follows (SD = Standard Deviation):
2 or more SDs above the average 2 or more SDs below the average
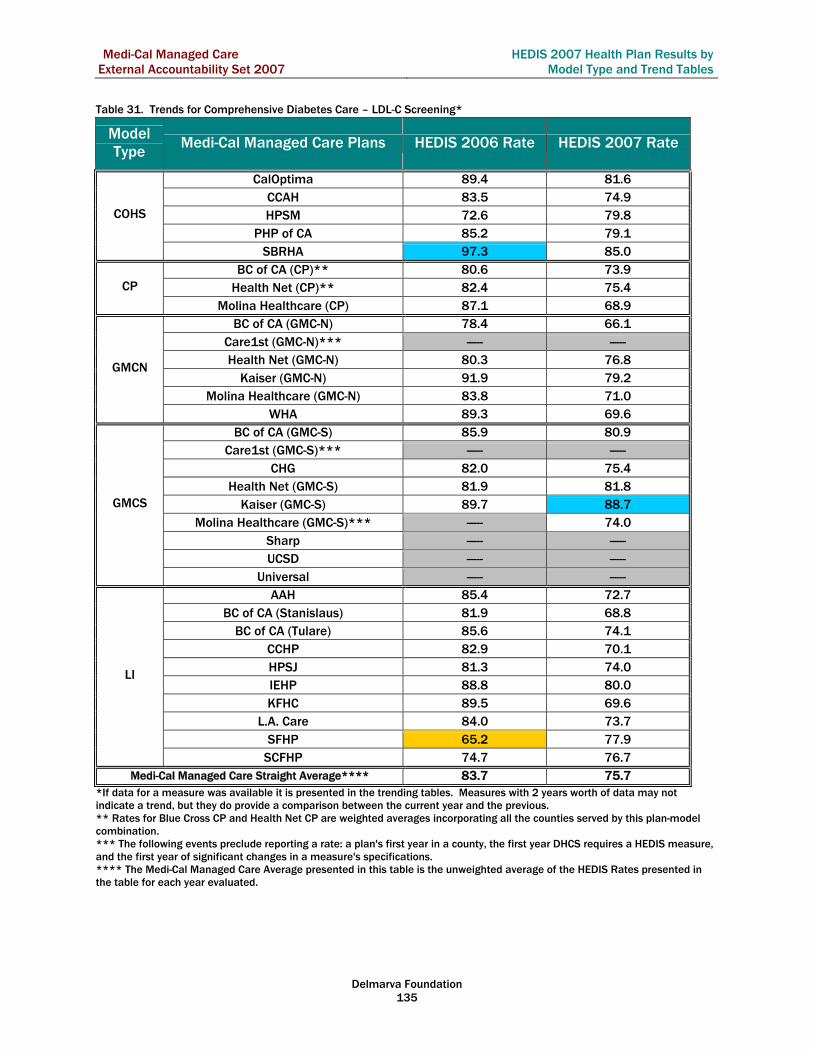
Medi-Cal Managed Care External Accountability Set 2007
HEDIS 2007 Health Plan Results by Model Type and Trend Tables
Delmarva Foundation 135
Table 31. Trends for Comprehensive Diabetes Care – LDL-C Screening*
Model Type Medi-Cal Managed Care Plans HEDIS 2006 Rate HEDIS 2007 Rate
CalOptima 89.4 81.6 CCAH 83.5 74.9 HPSM 72.6 79.8
PHP of CA 85.2 79.1
COHS
SBRHA 97.3 85.0 BC of CA (CP)** 80.6 73.9
Health Net (CP)** 82.4 75.4 CP
Molina Healthcare (CP) 87.1 68.9 BC of CA (GMC-N) 78.4 66.1
Care1st (GMC-N)*** ----- ----- Health Net (GMC-N) 80.3 76.8
Kaiser (GMC-N) 91.9 79.2 Molina Healthcare (GMC-N) 83.8 71.0
GMCN
WHA 89.3 69.6 BC of CA (GMC-S) 85.9 80.9
Care1st (GMC-S)*** ----- ----- CHG 82.0 75.4
Health Net (GMC-S) 81.9 81.8 Kaiser (GMC-S) 89.7 88.7
Molina Healthcare (GMC-S)*** ----- 74.0 Sharp ----- ----- UCSD ----- -----
GMCS
Universal ----- ----- AAH 85.4 72.7
BC of CA (Stanislaus) 81.9 68.8 BC of CA (Tulare) 85.6 74.1
CCHP 82.9 70.1 HPSJ 81.3 74.0 IEHP 88.8 80.0 KFHC 89.5 69.6
L.A. Care 84.0 73.7 SFHP 65.2 77.9
LI
SCFHP 74.7 76.7 Medi-Cal Managed Care Straight Average**** 83.7 75.7
*If data for a measure was available it is presented in the trending tables. Measures with 2 years worth of data may not indicate a trend, but they do provide a comparison between the current year and the previous. ** Rates for Blue Cross CP and Health Net CP are weighted averages incorporating all the counties served by this plan-model combination. *** The following events preclude reporting a rate: a plan's first year in a county, the first year DHCS requires a HEDIS measure, and the first year of significant changes in a measure's specifications. **** The Medi-Cal Managed Care Average presented in this table is the unweighted average of the HEDIS Rates presented in the table for each year evaluated.

Medi-Cal Managed Care External Accountability Set 2007
HEDIS 2007 Health Plan Results by Model Type and Trend Tables
Delmarva Foundation 136
Comprehensive Diabetes Care— LDL-C Screening The model type weighted averages ranged between 71.4 percent and 80.7 percent for the CDC- LDL-C Screening indicator. As shown in Table 31, the Medi-Cal managed care straight average decreased from 83.7 percent to 75.7 percent between 2006 and 2007. The drop in performance can be attributed to the change in HEDIS technical specifications for this indicator between 2006 and 2007. While most of the rates declined between 2006 and 2007, the rate for San Francisco Health Plan increased from 65.2 percent to 77.9 percent. The 2007 Kaiser GMC-South rate of 88.7 percent is two standard deviations above the Medi-Cal managed care straight average.

Medi-Cal Managed Care External Accountability Set 2007
HEDIS 2007 Health Plan Results by Model Type and Trend Tables
Delmarva Foundation 137
Figure 112. HEDIS 2007 Comprehensive Diabetes Care—Monitoring for Diabetic Nephropathy –
COHS
Figure 113. HEDIS 2007 Comprehensive Diabetes Care—Monitoring for Diabetic Nephropathy - CP
* SB/R is San Bernardino/Riverside. ** NR indicates a rate was not reportable because the rate was materially biased or the plan chose not to report the rate.

Medi-Cal Managed Care External Accountability Set 2007
HEDIS 2007 Health Plan Results by Model Type and Trend Tables
Delmarva Foundation 138
Figure 114. HEDIS 2007 Comprehensive Diabetes Care—Monitoring for Diabetic Nephropathy –
GMC - N
Figure 115. HEDIS 2007 Comprehensive Diabetes Care—Monitoring for Diabetic Nephropathy –
GMC - S * NA indicates the denominator for the rate was too small (<30) to calculate a reliable rate.

Medi-Cal Managed Care External Accountability Set 2007
HEDIS 2007 Health Plan Results by Model Type and Trend Tables
Delmarva Foundation 139
Figure 116. HEDIS 2007 Comprehensive Diabetes Care—Monitoring for Diabetic Nephropathy – LI
* SB/R is San Bernardino/Riverside.

Medi-Cal Managed Care External Accountability Set 2007
HEDIS 2007 Health Plan Results by Model Type and Trend Tables
Delmarva Foundation 140
COHSCPLIGMC-NGMC-S
CP
GMC-N
GMC-S
COHS
LI
Rates (%)
0 10 20 30 40 50 60 70 80 90 100
81.2
75.4
83.8
77.7
78.3
2007 Weighted Avg. (81.0%)
Figure 117. HEDIS 2007 Comprehensive Diabetes Care—Monitoring for Diabetic Nephropathy -
Model Type Comparison of Weighted Averages
Table 32 presents the trends for Comprehensive Diabetes Care—Monitoring for Diabetic Nephropathy. The cell shading represents the rate in relation to the Medi-Cal Managed Care average for that year. The colors are defined as follows (SD = Standard Deviation):
2 or more SDs above the average 2 or more SDs below the average

Medi-Cal Managed Care External Accountability Set 2007
HEDIS 2007 Health Plan Results by Model Type and Trend Tables
Delmarva Foundation 141
Table 32. Trends for Comprehensive Diabetes Care—Monitoring for Diabetic Nephropathy*
Model Type
Medi-Cal Managed Care Plans HEDIS 2006 Rate HEDIS 2007 Rate
CalOptima 50.8 80.9 CCAH 55.2 78.1 HPSM 47.3 79.6
PHP of CA 65.6 81.3
COHS
SBRHA 82.5 85.2 BC of CA (CP)** 79.7 75.5
Health Net (CP)** 43.5 74.9 CP
Molina Healthcare (CP) 52.5 79.4 BC of CA (GMC-N) 79.2 72.6
Care1st (GMC-N)*** ----- ----- Health Net (GMC-N) 35.0 76.6
Kaiser (GMC-N) 69.0 91.7 Molina Healthcare (GMC-N) 49.4 79.2
GMCN
WHA 56.0 70.6 BC of CA (GMC-S) 76.1 75.2
Care1st (GMC-S)*** ----- ----- CHG 42.8 76.2
Health Net (GMC-S) 42.6 83.8 Kaiser (GMC-S) 83.2 91.3
Molina Healthcare (GMC-S)*** ----- 76.6 Sharp ----- ----- UCSD ----- -----
GMCS
Universal ----- ----- AAH 44.9 72.0
BC of CA (Stanislaus) 81.4 71.2 BC of CA (Tulare) 83.7 77.8
CCHP 39.9 85.4 HPSJ 42.1 72.3 IEHP 63.5 91.3 KFHC 54.3 74.0
L.A. Care 43.8 87.9 SFHP 52.6 74.9
LI
SCFHP 51.2 72.9 Medi-Cal Managed Care Straight Average**** 58.1 78.9
*If data for a measure was available it is presented in the trending tables. Measures with 2 years worth of data may not indicate a trend, but they do provide a comparison between the current year and the previous. ** Rates for Blue Cross CP and Health Net CP are weighted averages incorporating all the counties served by this plan-model combination. *** The following events preclude reporting a rate: a plan's first year in a county, the first year DHCS requires a HEDIS measure, and the first year of significant changes in a measure's specifications. **** The Medi-Cal Managed Care Average presented in this table is the unweighted average of the HEDIS Rates presented in the table for each year evaluated.

Medi-Cal Managed Care External Accountability Set 2007
HEDIS 2007 Health Plan Results by Model Type and Trend Tables
Delmarva Foundation 142
Comprehensive Diabetes Care— Monitoring for Diabetic Nephropathy The model type weighted averages range from 75.4 percent to 83.8 percent for the CDC-Monitoring for Diabetic Nephropathy indicator. As shown in Table 32, the Medi-Cal managed care straight average increased from 58.1 percent to 78.9 percent between 2006 and 2007. The increase in performance can be attributed to the change in HEDIS technical specifications for this indicator between 2006 and 2007. Kaiser GMC-North (91.7 percent), Kaiser GMC-South (91.3 percent), and Inland Empire Health Plan (91.3 percent) all exceeded the Medi-Cal managed care straight average by two standard deviations.

Medi-Cal Managed Care External Accountability Set 2007
HEDIS 2007 Health Plan Results by Model Type and Trend Tables
Delmarva Foundation 143
Figure 118. HEDIS 2007 Use of Appropriate Medications for People with Asthma – COHS
Figure 119. HEDIS 2007 Use of Appropriate Medications for People with Asthma - CP
* SB/R is San Bernardino/Riverside. ** NA indicates the denominator for the rate was too small (<30) to calculate a reliable rate.

Medi-Cal Managed Care External Accountability Set 2007
HEDIS 2007 Health Plan Results by Model Type and Trend Tables
Delmarva Foundation 144
Figure 120. HEDIS 2007 Use of Appropriate Medications for People with Asthma – GMC - N
Figure 121. HEDIS 2007 Use of Appropriate Medications for People with Asthma – GMC - S
* NA indicates the denominator for the rate was too small (<30) to calculate a reliable rate.

Medi-Cal Managed Care External Accountability Set 2007
HEDIS 2007 Health Plan Results by Model Type and Trend Tables
Delmarva Foundation 145
Figure 122. HEDIS 2007 Use of Appropriate Medications for People with Asthma - LI
* SB/R is San Bernardino/Riverside.

Medi-Cal Managed Care External Accountability Set 2007
HEDIS 2007 Health Plan Results by Model Type and Trend Tables
Delmarva Foundation 146
COHS CP LI GMC-N GMC-S
GMC-S
CP
GMC-N
LI
COHS
Rates (%)
0 10 20 30 40 50 60 70 80 90 100
88.7
85.8
86.9
86.4
84.9
2007 Weighted Avg. (86.8%)
Figure 123. HEDIS 2007 Use of Appropriate Medications for People with Asthma - Model Type
Comparison of Weighted Averages
Table 33 presents the trends for Use of Appropriate Medications for People with Asthma. The cell shading represents the rate in relation to the Medi-Cal Managed Care average for that year. The colors are defined as follows (SD = Standard Deviation):
2 or more SDs above the average 2 or more SDs below the average
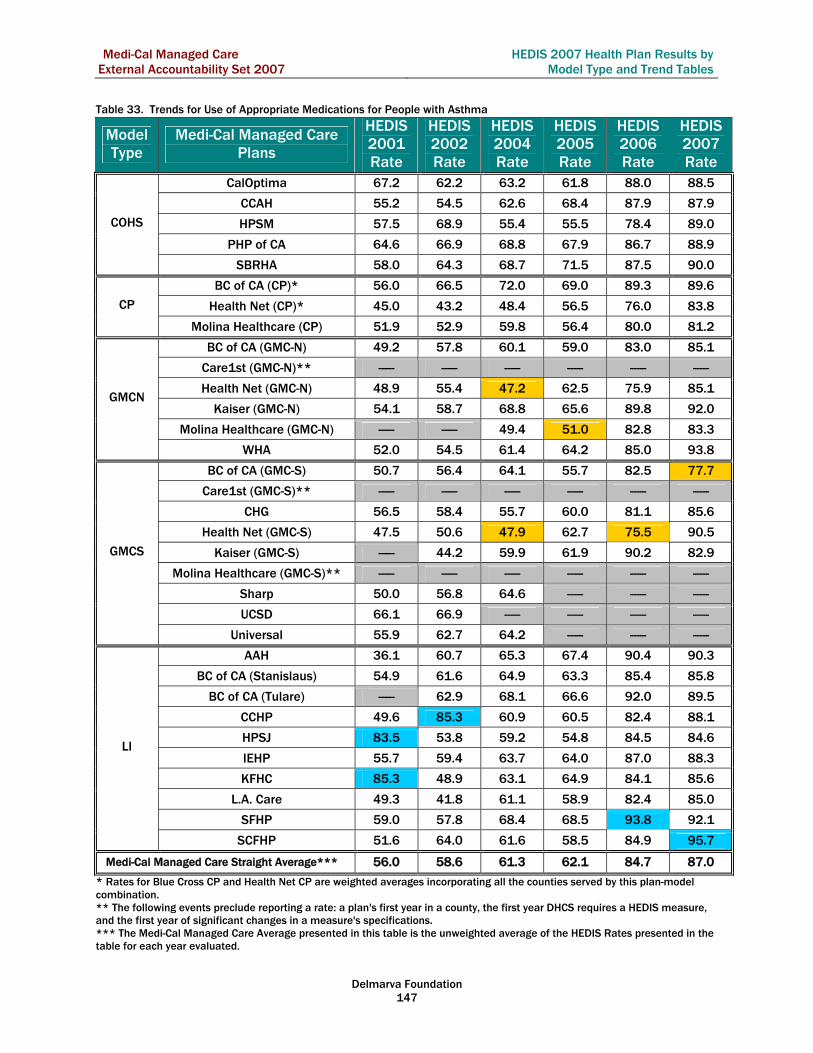
Medi-Cal Managed Care External Accountability Set 2007
HEDIS 2007 Health Plan Results by Model Type and Trend Tables
Delmarva Foundation 147
Table 33. Trends for Use of Appropriate Medications for People with Asthma
Model Type
Medi-Cal Managed Care Plans
HEDIS 2001 Rate
HEDIS 2002 Rate
HEDIS 2004 Rate
HEDIS 2005 Rate
HEDIS 2006 Rate
HEDIS 2007 Rate
CalOptima 67.2 62.2 63.2 61.8 88.0 88.5
CCAH 55.2 54.5 62.6 68.4 87.9 87.9
HPSM 57.5 68.9 55.4 55.5 78.4 89.0
PHP of CA 64.6 66.9 68.8 67.9 86.7 88.9
COHS
SBRHA 58.0 64.3 68.7 71.5 87.5 90.0
BC of CA (CP)* 56.0 66.5 72.0 69.0 89.3 89.6
Health Net (CP)* 45.0 43.2 48.4 56.5 76.0 83.8 CP
Molina Healthcare (CP) 51.9 52.9 59.8 56.4 80.0 81.2
BC of CA (GMC-N) 49.2 57.8 60.1 59.0 83.0 85.1
Care1st (GMC-N)** ----- ----- ----- ----- ----- -----
Health Net (GMC-N) 48.9 55.4 47.2 62.5 75.9 85.1
Kaiser (GMC-N) 54.1 58.7 68.8 65.6 89.8 92.0
Molina Healthcare (GMC-N) ----- ----- 49.4 51.0 82.8 83.3
GMCN
WHA 52.0 54.5 61.4 64.2 85.0 93.8
BC of CA (GMC-S) 50.7 56.4 64.1 55.7 82.5 77.7
Care1st (GMC-S)** ----- ----- ----- ----- ----- -----
CHG 56.5 58.4 55.7 60.0 81.1 85.6
Health Net (GMC-S) 47.5 50.6 47.9 62.7 75.5 90.5
Kaiser (GMC-S) ----- 44.2 59.9 61.9 90.2 82.9
Molina Healthcare (GMC-S)** ----- ----- ----- ----- ----- -----
Sharp 50.0 56.8 64.6 ----- ----- -----
UCSD 66.1 66.9 ----- ----- ----- -----
GMCS
Universal 55.9 62.7 64.2 ----- ----- -----
AAH 36.1 60.7 65.3 67.4 90.4 90.3
BC of CA (Stanislaus) 54.9 61.6 64.9 63.3 85.4 85.8
BC of CA (Tulare) ----- 62.9 68.1 66.6 92.0 89.5
CCHP 49.6 85.3 60.9 60.5 82.4 88.1
HPSJ 83.5 53.8 59.2 54.8 84.5 84.6
IEHP 55.7 59.4 63.7 64.0 87.0 88.3
KFHC 85.3 48.9 63.1 64.9 84.1 85.6
L.A. Care 49.3 41.8 61.1 58.9 82.4 85.0
SFHP 59.0 57.8 68.4 68.5 93.8 92.1
LI
SCFHP 51.6 64.0 61.6 58.5 84.9 95.7
Medi-Cal Managed Care Straight Average*** 56.0 58.6 61.3 62.1 84.7 87.0
* Rates for Blue Cross CP and Health Net CP are weighted averages incorporating all the counties served by this plan-model combination. ** The following events preclude reporting a rate: a plan's first year in a county, the first year DHCS requires a HEDIS measure, and the first year of significant changes in a measure's specifications. *** The Medi-Cal Managed Care Average presented in this table is the unweighted average of the HEDIS Rates presented in the table for each year evaluated.

Medi-Cal Managed Care External Accountability Set 2007
HEDIS 2007 Health Plan Results by Model Type and Trend Tables
Delmarva Foundation 148
Use of Appropriate Medications for People with Asthma The model type weighted averages range from 84.9 percent to 84.9 percent for the Use of Appropriate Medications for People with Asthma. The Medi-Cal managed care straight average increased from 84.7 percent to 87.0 percent between 2006 and 2007. Blue Cross of CA (GMC-South) has the lowest rate for 2007 (77.7 percent) at two standard deviations below the Medi-Cal managed care straight average of 87.0 percent. Santa Clara Family Health Plan has the highest rate for 2007 with 95.7 percent which is two standard deviations above the Medi-Cal managed care straight average of 87.0 percent.
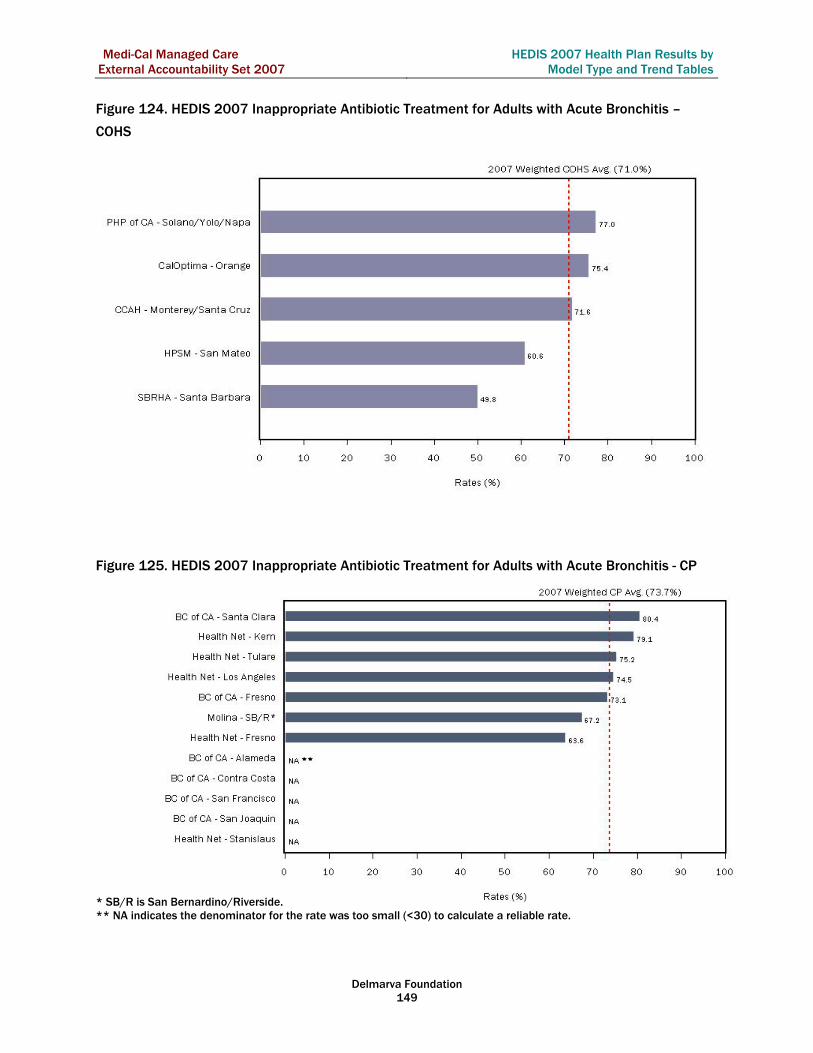
Medi-Cal Managed Care External Accountability Set 2007
HEDIS 2007 Health Plan Results by Model Type and Trend Tables
Delmarva Foundation 149
Figure 124. HEDIS 2007 Inappropriate Antibiotic Treatment for Adults with Acute Bronchitis –
COHS
Figure 125. HEDIS 2007 Inappropriate Antibiotic Treatment for Adults with Acute Bronchitis - CP
* SB/R is San Bernardino/Riverside. ** NA indicates the denominator for the rate was too small (<30) to calculate a reliable rate.

Medi-Cal Managed Care External Accountability Set 2007
HEDIS 2007 Health Plan Results by Model Type and Trend Tables
Delmarva Foundation 150
Figure 126. HEDIS 2007 Inappropriate Antibiotic Treatment for Adults with Acute Bronchitis –
GMC - N
Figure 127. HEDIS 2007 Inappropriate Antibiotic Treatment for Adults with Acute Bronchitis –
GMC - S
* NA indicates the denominator for the rate was too small (<30) to calculate a reliable rate.

Medi-Cal Managed Care External Accountability Set 2007
HEDIS 2007 Health Plan Results by Model Type and Trend Tables
Delmarva Foundation 151
Figure 128. HEDIS 2007 Inappropriate Antibiotic Treatment for Adults with Acute Bronchitis – LI * SB/R is San Bernardino/Riverside.

Medi-Cal Managed Care External Accountability Set 2007
HEDIS 2007 Health Plan Results by Model Type and Trend Tables
Delmarva Foundation 152
COHSCPLIGMC-NGMC-S
GMC-S
LI
COHS
GMC-N
CP
Rates (%)
0 10 20 30 40 50 60 70 80 90 100
71.0
73.7
70.2
71.8
64.6
2007 Weighted Avg. (71.0%)
Figure 129. HEDIS 2007 Inappropriate Antibiotic Treatment for Adults with Acute Bronchitis - Model
Type Comparison of Weighted Averages*
Table 34 presents the trends for Inappropriate Treatment for Adults with Acute Bronchitis. The cell shading represents the rate in relation to the Medi-Cal Managed Care average for that year. The colors are defined as follows (SD = Standard Deviation):
2 or more SDs above the average 2 or more SDs below the average
* For this measure, a lower rate indicates better performance.

Medi-Cal Managed Care External Accountability Set 2007
HEDIS 2007 Health Plan Results by Model Type and Trend Tables
Delmarva Foundation 153
Table 34. Trends for Inappropriate Antibiotic Treatment for Adults with Acute Bronchitis (lower score is better)* Model Type Medi-Cal Managed Care Plans HEDIS 2006 Rate HEDIS 2007 Rate
CalOptima 73.4 75.4 CCAH 64.8 71.6 HPSM 26.9 60.6
PHP of CA 72.9 77.0
COHS
SBRHA 70.2 49.8 BC of CA (CP)** 64.1 61.1
Health Net (CP)** 43.6 73.4 CP
Molina Healthcare (CP) 72.8 67.2 BC of CA (GMC-N) 72.2 73.7
Care1st (GMC-N)*** ----- ----- Health Net (GMC-N) 38.5 70.8
Kaiser (GMC-N) 78.8 75.5 Molina Healthcare (GMC-N) 71.6 62.9
GMCN
WHA 67.3 72.3 BC of CA (GMC-S) ----- -----
Care1st (GMC-S)*** ----- ----- CHG ----- 81.1
Health Net (GMC-S) 42.0 75.8 Kaiser (GMC-S) 52.1 27.2
Molina Healthcare (GMC-S)*** ----- 61.2 Sharp ----- ----- UCSD ----- -----
GMCS
Universal ----- ----- AAH 76.3 73.1
BC of CA (Stanislaus) 76.3 72.0 BC of CA (Tulare) 72.8 80.5
CCHP 68.8 61.7 HPSJ 72.6 74.8 IEHP 35.6 79.2 KFHC 73.6 76.9
L.A. Care 56.7 64.6 SFHP 62.4 71.6
LI
SCFHP 77.5 80.5 Medi-Cal Managed Care Straight Average**** 63.3 69.3
*If data for a measure was available it is presented in the trending tables. Measures with 2 years worth of data may not indicate a trend, but they do provide a comparison between the current year and the previous. ** Rates for Blue Cross CP and Health Net CP are weighted averages incorporating all the counties served by this plan-model combination. *** The following events preclude reporting a rate: a plan's first year in a county, the first year DHCS requires a HEDIS measure, and the first year of significant changes in a measure's specifications. **** The Medi-Cal Managed Care Average presented in this table is the unweighted average of the HEDIS Rates presented in the table for each year evaluated.

Medi-Cal Managed Care External Accountability Set 2007
HEDIS 2007 Health Plan Results by Model Type and Trend Tables
Delmarva Foundation 154
Inappropriate Antibiotic Treatment for Adults with Acute Bronchitis
The model type weighted averages range from 73.7 percent to 64.6 percent. For this measure, a lower rate indicates better performance. Nine plans improved their rates between 2006 and 2007. Kaiser GMC-South has the best rate with 27.2 percent for 2007 which is two standard deviations better than the Medi-Cal managed care straight average of 69.3 percent. For HEDIS 2008, this measure will be inverted so that a higher rate is better and it will be renamed Appropriate Treatment for Adults with Acute Bronchitis.

Medi-Cal Managed Care External Accountability Set 2007 Conclusions and Recommendations
Delmarva Foundation 155
VII. Conclusions and Recommendations The data and analysis presented in this report can assist DHCS-funded managed care plans comply with the Department’s quality and performance measurement requirements and help DHCS plan further studies or interventions relative to quality of care. This section provides insight on the performance of the plans (highlighting successes), identifies opportunities for improvement, and offers suggestions on areas where DHCS may want to focus future quality improvement efforts. A. Information System Capabilities
Strengths
Validation activity findings for the DHCS managed care plans indicate overall minimal impact on measure reporting due to information systems issues. Validation team members identified plan strengths or challenges observed during the on-site portion of the audits. Strengths were related to the following categories:
Data capture, General information systems, Use of registries, Centralized processing of data, Provider data, Data sharing, and Eligibility programming.
Challenges
Plans did experience some challenges related to information systems. Auditors identified plan issues primarily in two areas:
Data completeness or submission, and The increase in use of the administrative methodology versus the hybrid methodology.
Four DHCS managed care plans experienced a major problem with their medical records vendor in 2007, which presented a significant challenge in data reporting for those plans. The medical record vendor experienced numerous systemic problems, including technical issues with the web portal designed to allow access to collected/abstracted records, long delays in abstracting collected information, inaccurate abstraction and entry of data, and untimely progress reporting to plans. In addition, the collection of managed care plan data was impacted by the implementation of electronic medical records (EMR) at contracted medical groups. EMR systems are generally built to support electronic

Medi-Cal Managed Care External Accountability Set 2007 Conclusions and Recommendations
Delmarva Foundation 156
viewing or printing of the information in a patient’s chart. To collect the necessary HEDIS information, the medical records vendor had to print EMR charts and then scan the paper copies, effectively doubling the work required to collect the information. Recommendations
DHCS managed care plans should be encouraged to continue efforts to increase data completeness, particularly to enable the use of the administrative methodology for more measures. If administrative data systems (claims, encounter, electronic registry, disease management, etc.) are more complete, reliance on medical record review will be decreased. This will reduce both the administrative and financial burden on DHCS managed care plans and allow for a smooth transition if/when NCQA changes the data reporting requirements from the hybrid methodology to an administrative-data-only methodology. The management of vendors must be in place to ensure that updates or completion of all necessary work is accomplished early enough in the reporting cycle to allow management decisions regarding methodology (administrative versus hybrid) to be made without impacting the time available for medical record pursuits. With regard to vendor contracting, the plans are strongly encouraged to engage vendors as early in the process as possible in order to maximize the effectiveness of the medical record review process. The plans should also perform a comprehensive evaluation of a vendor’s capability to perform the necessary work, particularly the capability of the information system to be employed by vendors, prior to contracting with a vendor. B. Reporting Methods
Strengths
All DHCS plans are contracting with NCQA-certified HEDIS software vendors to manage and maintain the source code for the measures. As the managed care plans have gained experience in the requirements of measure production and the rigors of a validation process, the processes used to manage and monitor measure production have improved. Factors which influence a plan’s ability to successfully report HEDIS measures include:
Staff experience, Communication, Timelines and work plans, Documentation, and A team approach.

Medi-Cal Managed Care External Accountability Set 2007 Conclusions and Recommendations
Delmarva Foundation 157
Challenges
As noted in the Information Systems Capabilities section above, a subset of DHCS managed care plans experienced a major problem with their medical records vendor, which presented a significant challenge in the reporting of data. The medical record vendor experienced numerous systemic problems including technical issues with the web portal designed to allow access to collected/abstracted records, long delays in abstracting collected information, inaccurate abstraction and entry of data, and untimely progress reporting to plans. In addition, the collection of managed care plan data was impacted by the implementation of electronic medical records (EMR) at contracted medical groups. EMR systems are generally built to support electronic viewing or printing of the information in a patient’s chart. To collect the necessary HEDIS information, the medical records vendor had to print EMR charts and then scan the paper copies, effectively doubling the work required to collect the information. Recommendations
With regard to vendor contracting, the plans are strongly encouraged to engage vendors as early in the process as possible in order to maximize the effectiveness of the medical record review process. The plans should also perform a comprehensive evaluation of a vendor’s capability to perform the necessary work, particularly the capability of the information system to be employed by vendors, prior to contracting with the vendor. C. Medical Record Abstraction Tools and Processes
Strengths
Overall, well-defined processes, tool development, data entry processes, edit checks built into electronic data capture systems, and inter-rater reliability results were identified as strengths for several DHCS managed care plans. Challenges
In addition to completing contracting activities with medical record review vendors in a timelier manner and adequately assessing the capabilities of medical record review vendors addressed above, an opportunity for improvement was identified surrounding the identification of providers that may have medical records of interest. This challenge is not uncommon in medical record review processes. Recommendations
Suggestions to DHCS managed care plans and DHCS regarding this topic are similar to those given in the previous section on reporting methods. The same factors that lead to successful reporting are those that influence successful medical record abstraction process and tools. Developing and encouraging expertise,

Medi-Cal Managed Care External Accountability Set 2007 Conclusions and Recommendations
Delmarva Foundation 158
communication, and teamwork skills may reduce many of the challenges experienced by DHCS managed care plans in this area. Developing methodologies for linking members, providers, and locations of medical records should greatly benefit medical record review activities.

Medi-Cal Managed Care External Accountability Set 2007 Final Thoughts
Delmarva Foundation 159
VIII. Final Thoughts Maintaining forward momentum is important in continuing the successes of the DHCS quality assessment and improvement strategy. Most plans have developed information systems, reporting methodologies, medical record review processes, and measure calculation strategies that have stabilized. But improving care is much more difficult than developing the methodologies for improving data capture. These performance measures provide a picture of care delivered at a point in time, and as a measurement tool, the purpose of the measures is to provide an assessment of managed care plan performance. Plans should review and interpret the results of their performance measure reports and identify how performance compares to other benchmarks. Plans should determine where possible improvement efforts are needed and will have the greatest impact on the members that they serve. Interventions that address issues at the system level are most likely to yield sustainable improvements. Culture plays an important role in the success of quality improvement programs. If a regulatory culture exists, plans may inadvertently determine a level of performance that is acceptable for regulatory purposes and perform to that level rather than striving to achieve the best care possible. Consequently, it is important for plans to develop quality improvement systems in addition to the quality measurement systems that currently exist. Approaching improvement opportunities directly with providers can yield longer lasting results than focusing on improving measures of DHCS managed care plan system performance. Working with the provider community and focusing efforts on the culture and operation of the provider offices may be successful. In summary, the reporting methodologies and systems in place at DHCS managed care plans appear to be sufficient to accurately and reliably supply performance measures. DHCS plans are in a position to maintain the reporting system while improving the delivery and outcomes of care to their members. By focusing on culture, leadership, and a unified approach, a partnership between DHCS, DHCS managed care plans, and providers can result in sustainable system-wide improvements and better outcomes for DHCS members.

Medi-Cal Managed Care External Accountability Set 2007
Specialty Plan and PHP Results for HEDIS 2007 Appendix-1
Delmarva Foundation A1-1
Appendix -1 Specialty Plan and PHP Results for HEDIS 2007 Kaiser PHP Marin/Sonoma and AHF Healthcare Centers reported HEDIS rates for the first time in 2007. Kaiser PHP reported Appropriate Treatment for Children with Upper Respiratory Infection (URI) and Appropriate Testing for Children with Pharyngitis (CWP) rates. Both measures found in the Effectiveness of Care domain. For both rates, Kaiser PHP exceeds the HPL for each measure. Table A-1 contains their reported rates. Table A-1 HEDIS 2007 Rates for Kaiser PHP – Marin/Sonoma
Kaiser PHP – Marin/Sonoma CWP URI
HEDIS 2007 Rate 91.4% 94.9%
HPL1 75.1% 92.1%
MPL2 40.9% 76.7%
AHF Healthcare Centers reported Colorectal Cancer Screening (COL) from the Effectiveness of Care domain and Adults’ Access to Preventive/Ambulatory Health Services (AAP) in the Access/Availability of Care domain. No MPL or HPL was available for COL comparison. The plan exceeded the HPL for all three age groups on the AAP measure. The plan rates are listed in Table A-2. Table A-2 HEDIS 2007 Rates for AHF Healthcare Centers
AHF Healthcare Centers COL AAP (20-44) AAP (45-64) AAP (65+)
HEDIS 2007 Rate 7.6% 95.2% 98.7% 100.0%
HPL NA 87.0% 89.4% 93.0%
MPL NA 72.7% 79.1% 72.1%
1 HPL is HEDIS 2006 national Medicaid 90th Percentile 2MPL is HEDIS 2006 national Medicaid 25th Percentile

Medi-Cal Managed Care External Accountability Set 2007
HEDIS Overview Appendix-2
Delmarva Foundation A2-1
Appendix -2 HEDIS OVERVIEW7 HEDIS is the most widely used set of health care performance measures in the United States. It is developed and maintained by the National Committee for Quality Assurance (NCQA), a not-for-profit organization committed to assessing, reporting on and improving the quality of health care. The Health Plan Employer Data and Information Set and the term “HEDIS” originated in the late 1980s as the product of a group of forward-thinking employers and quality experts and was entrusted to NCQA in the early 1990’s. More recently, NCQA expanded the size and scope of HEDIS to include measures for physicians, Preferred Provider Organizations (PPOs) and other organizations, and changed the name to Healthcare Effectiveness Data and Information Set. NCQA’s Committee on Performance Measurement (CPM), which includes representation from purchasers, consumers, health plans, heath care providers and policy makers, oversees the evolution of the measurement set. Several Measurement Advisory Panels (MAP) provide clinical and technical knowledge required to develop the measures. Additional HEDIS Expert Panels and the Technical Advisory Group (TAG) provide invaluable assistance by identifying methodological issues and providing feedback on new and existing measures. HEDIS includes 70 measures across 8 domains of care.
Effectiveness of Care Access/Availability of Care Satisfaction With the Experience of Care Use of Services Cost of Care Health Plan Descriptive Information Health Plan Stability Informed Health Care Choices
HEDIS COMPLIANCE AUDITS
The HEDIS Compliance Audit allows comparability across health plans and ensures validity and integrity of HEDIS data. The audit is required by many states and employer groups and includes standards for assessing
7 National Committee for Quality Assurance (2006). HEDIS 2007 Volume 2 Technical Specifications. Washington DC

Medi-Cal Managed Care External Accountability Set 2007
HEDIS Overview Appendix-2
Delmarva Foundation A2-2
health plan information system characteristics and capabilities and specification compliance for each HEDIS measure. HEDIS Audit principles
The HEDIS Audit verifies that the health plan’s HEDIS production processes conform to the technical specifications.
The HEDIS Audit measures the health plan’s information system capabilities and evaluates its ability to process medical, member and practitioner information so it can accurately report HEDIS data.
The results of a detailed source code review of a carefully selected and expandable subset of measures (the core set) can be extrapolated to all HEDIS measures.
The goal of the audit is accurate, reliable and publicly reportable data that can be used by purchasers and consumers to compare health plans.
The HEDIS Audit must be conducted by an NCQA Licensed Organization and a Certified HEDIS Compliance Auditor using NCQA’s standard audit methodology, ensuring consistency across audits.
The HEDIS Audit has been in operation since 1997 and has evolved from its initial concept to become an important strategic component of HEDIS. Since 2000, NCQA has used only audited HEDIS data for its information products, including Quality Compass and the State of Health Care Quality Report. NCQA encourages health plans to collect data simultaneously with their audits. A concurrent audit lets the auditor detect errors in a health plan’s data collection process while there is time for the health plan to correct its methods and minimize the possibility that rates may not be reported. NCQA has a licensing program for organizations interested in conducting HEDIS Audits and a certification program for individual auditors. An organization that wants to become licensed to conduct HEDIS audits must have applicable auditing experience and a working knowledge of the managed care industry and HEDIS. Licensed Organizations are held to strict standards of conduct and accountability; violations of the code of conduct can result in revocation of licensure. Organizations must also comply with the Health Insurance Portability and Accountability Act (HIPAA) and must contract with or employ at least two Certified HEDIS Auditors to maintain their licensure. Licensure is effective for one year and is renewed after review of the Licensed Organization’s previous year’s auditing work and payment of a licensure fee. Individuals applying to be Certified HEDIS auditors should have auditing experience and HEDIS knowledge and must submit at least two references that demonstrate exemplary professional skills and ethics. Applicants must pass both an application review and an auditor certification exam as well as enter into a certification agreement with NCQA. The certification is valid for two years if the Certified Auditor meets the following criteria.

Medi-Cal Managed Care External Accountability Set 2007
HEDIS Overview Appendix-2
Delmarva Foundation A2-3
Participates in at least two HEDIS Audits per year under the supervision of a Licensed Organization Attends the Auditors’ Update Conference annually Obtains 12 hours of pre-approved continuing education credits during the 2-year certification period Adheres to the Code of Professional Conduct in Appendix 1: Code of Professional Conduct for Certified HEDIS
Compliance Auditors NCQA posts lists of Licensed Organizations and Certified Auditors on its Web site and administers a monitoring program that gives constructive feedback to Licensed Organizations and Certified Auditors. This program helps improve and evolve the practices of Certified Auditors and Licensed Organizations.
Medi-Cal Managed Care External Accountability Set 2007
HEDIS 2007 Measure Descriptions Appendix-3
Delmarva Foundation A3-1
Appendix -3 HEDIS 2007 Measure Descriptions8
Well-Child Visits in the First 15 Months of Life (6 or more visits)
The percentage of enrolled members who turned 15 months old during the measurement year and who had 0, 1, 2, 3, 4, 5, 6 or more well-child visits with a primary care practitioner during their first 15 months of life. Note: This measure has the same structure as measures in the Effectiveness of Care domain. The MCO should follow NCQA’s Specific Guidelines for Effectiveness of Care Measures when calculating this measure.
Well-Child Visits in the Third, Fourth, Fifth, and Sixth Years of Life
The percentage of members who were three, four, five or six years of age who received one or more well-child visits with a primary care practitioner during the measurement year. Note: This measure has the same structure as measures in the Effectiveness of Care domain. The MCO should follow NCQA’s Specific Guidelines for Effectiveness of Care Measures when calculating this measure. Childhood Immunization Status (Combination 2)
The percentage of enrolled children who received four DTaP/DT, three IPV, one MMR, three H influenza type B, three hepatitis B, and one chicken pox vaccine (VZV) on or before the child’s second birthday. Adolescent Well-Care Visits
The percentage of enrolled members who were 12–21 years of age and who had at least one comprehensive well-care visit with a primary care practitioner or an OB/GYN practitioner during the measurement year. Appropriate Treatment for Children with Upper Respiratory Infection
The percentage of children 3 months–18 years of age who were given a diagnosis of upper respiratory infection (URI) and were not dispensed an antibiotic prescription on or three days after the episode date.
8 National Committee for Quality Assurance (2006). HEDIS 2007 Volume 2 Technical Specifications. Washington DC

Medi-Cal Managed Care External Accountability Set 2007
HEDIS 2007 Measure Descriptions Appendix-3
Delmarva Foundation A3-2
Prenatal and Postpartum Care
The percentage of deliveries of live births between November 6 of the year prior to the measurement year and November 5 of the measurement year. For these women, the measure assesses the following facets of prenatal and postpartum care:
Timeliness of Prenatal Care. The percentage of deliveries that received a prenatal care visit as a member of the MCO in the first trimester or within 42 days of enrollment in the MCO.
Postpartum Care. The percentage of deliveries that had a postpartum visit on or between 21 and 56 days after delivery.
Chlamydia Screening in Women
The percentage of women 16–25 years of age who were identified as sexually active and who had at least one test for chlamydia during the measurement year. Cervical Cancer Screening
The percentage of women 21–64 years of age who received one or more Pap tests to screen for cervical cancer. Breast Cancer Screening
The percentage of women 42–69 years of age who had a mammogram to screen for breast cancer. Comprehensive Diabetes Care
The percentage of members 18–75 years of age with diabetes (type 1 and type 2) who had each of the following:
Eye exam (retinal) performed Hemoglobin A1c (HbA1c) testing HbA1c poor control (>9.0%) HbA1c good control (<7.0%) LDL-C screening performed LDL-C Control (<100 mg/dL) Nephropathy Monitoring
Use of Appropriate Medications for People with Asthma
The percentage of members 5–56 years of age during the measurement year who were identified as having persistent asthma and who were appropriately prescribed medication during the measurement year.

Medi-Cal Managed Care External Accountability Set 2007
HEDIS 2007 Measure Descriptions Appendix-3
Delmarva Foundation A3-3
Inappropriate Antibiotic Treatment for Adults with Acute Bronchitis
The percentage of adults 18–64 years of age with a diagnosis of acute bronchitis who were dispensed an antibiotic prescription on or within three days after the episode date. This misuse measure assesses if antibiotics were inappropriately prescribed for healthy adults with acute bronchitis. A lower rate represents better performance.

Medi-Cal Managed Care External Accountability Set 2007
EAS Measure Changes for HEDIS 2008 Appendix-4
Delmarva Foundation A4-1
Appendix -4 EAS Measure Changes for HEDIS 2008 Table A-4 Measure Changes for HEDIS 2008
HEDIS Measures Add Eliminate Retain
Well-Child Visits in the First 15 Months of Life (6 or More Visits) Well-Child Visits in the 3rd, 4th, 5th, and 6th Years of Life Childhood Immunization Status (Combination #2) Childhood Immunization Status (Combination #3) Adolescent Well-Care Visits Appropriate Treatment for Children with Upper Respiratory Infection
Prenatal and Postpartum Care: Timeliness of Prenatal Care Prenatal and Postpartum Care: Postpartum Care Cervical Cancer Screening Breast Cancer Screening Comprehensive Diabetes Care: Eye Exam (Retinal) Performed Comprehensive Diabetes Care: HbA1c Testing Comprehensive Diabetes Care: LDL-C Screening Comprehensive Diabetes Care: Nephropathy Monitoring (Becomes Medical Attention for Nephropathy)
Comprehensive Diabetes Care: HbA1c Poor Control (>9.0%)
Comprehensive Diabetes Care: HbA1c Good Control (<7.0%)
Comprehensive Diabetes Care: LDL-C Control (<100mg/dL)
Use of Appropriate Medications for People with Asthma Inappropriate Antibiotic Treatment for Adults with Acute Bronchitis (Becomes Avoidance of Inappropriate Antibiotic Treatment for Adults with Acute Bronchitis)
Ambulatory Care: Ambulatory Surgery/Procedures (per 1000)
Ambulatory Care: Emergency Department Visits (per 1000)
Ambulatory Care: Observation Room Stays (per 1000)
Ambulatory Care: Outpatient Visits (per 1000)

Medi-Cal Managed Care External Accountability Set 2007
EAS Measure Changes for HEDIS 2008 Appendix-4
Delmarva Foundation A4-2
The changes specified for HEDIS 2008 in the table above reflect DHCS’s increased Medi-Cal Managed Care Program focus on ensuring quality care for seniors and persons with disabilities. DHCS is targeting its efforts to promote better care to these populations with the goal of improving their health outcomes. The DHCS also wants to expand collection of quality measures related to chronic diseases, such as diabetes, and focus more on outcome rather than process measures. Of the measures required for Reporting Year 2007, five were used by DHCS for the auto assignment default algorithm:
Adolescent Well-Care Visits, Childhood Immunization Status (Combination #2), Prenatal and Postpartum Care – Timeliness of Prenatal Care, Use of Appropriate Medications for People with Asthma, and Well-Child Visits in the 3rd, 4th, 5th, and 6th Years of Life.
The results for these measures are used to determine which DHCS-contracted managed care health plans will receive an increase in default-assigned enrollees each year. The DHCS Auto Assignment Advisory Group recommended the five default measures remain in place for another year. A sixth measure, Cervical Cancer Screening, will be added in Calendar Year 2008.