Embed Size (px)
Citation preview
Mechanical properties and domain wall mobility of LaGaO3 perovskite over a first order phase transition
Claire Jakeways, Richard Harrison and Simon Redfern
University of Cambridge
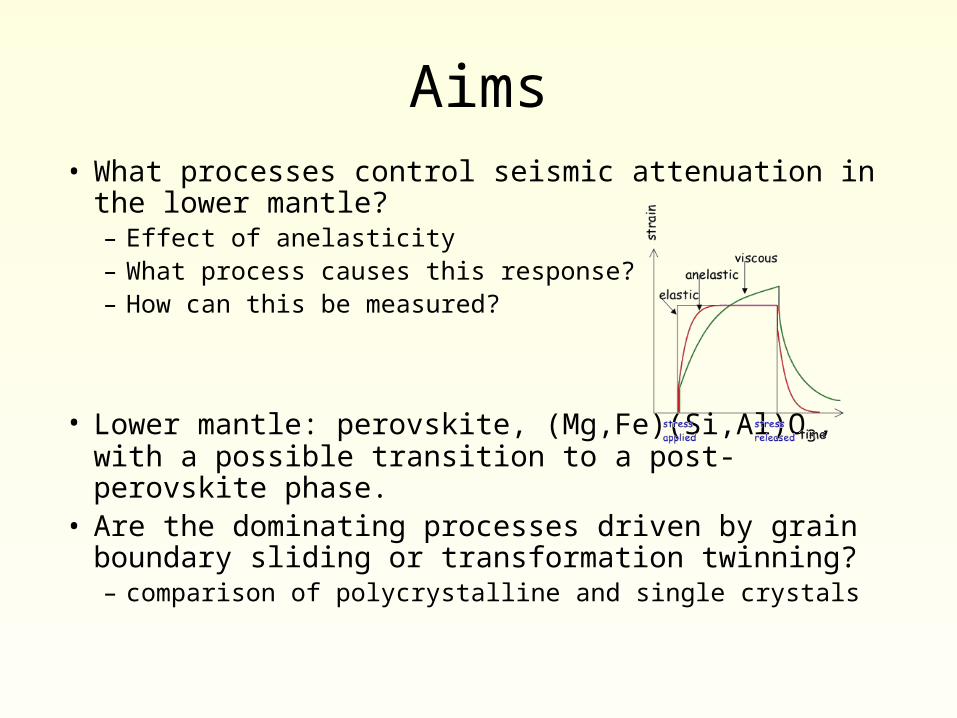
Aims• What processes control seismic attenuation in the lower
mantle?– Effect of anelasticity– What process causes this response?– How can this be measured?
• Lower mantle: perovskite, (Mg,Fe)(Si,Al)O3, with a possible transition to a post-perovskite phase.
• Are the dominating processes driven by grain boundary sliding or transformation twinning?– comparison of polycrystalline and single crystals
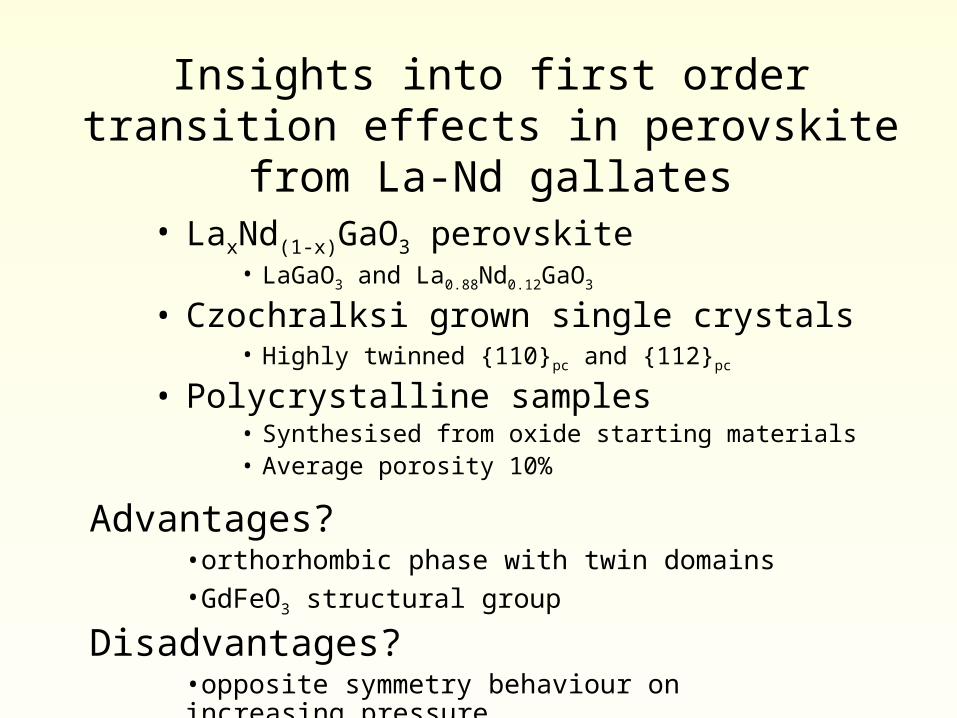
Insights into first order transition effects in perovskite from La-Nd gallates
• LaxNd(1-x)GaO3 perovskite• LaGaO3 and La0.88Nd0.12GaO3
• Czochralksi grown single crystals• Highly twinned {110}pc and {112}pc
• Polycrystalline samples• Synthesised from oxide starting materials• Average porosity 10%
Advantages?•orthorhombic phase with twin domains•GdFeO3 structural group
Disadvantages?•opposite symmetry behaviour on increasing pressure
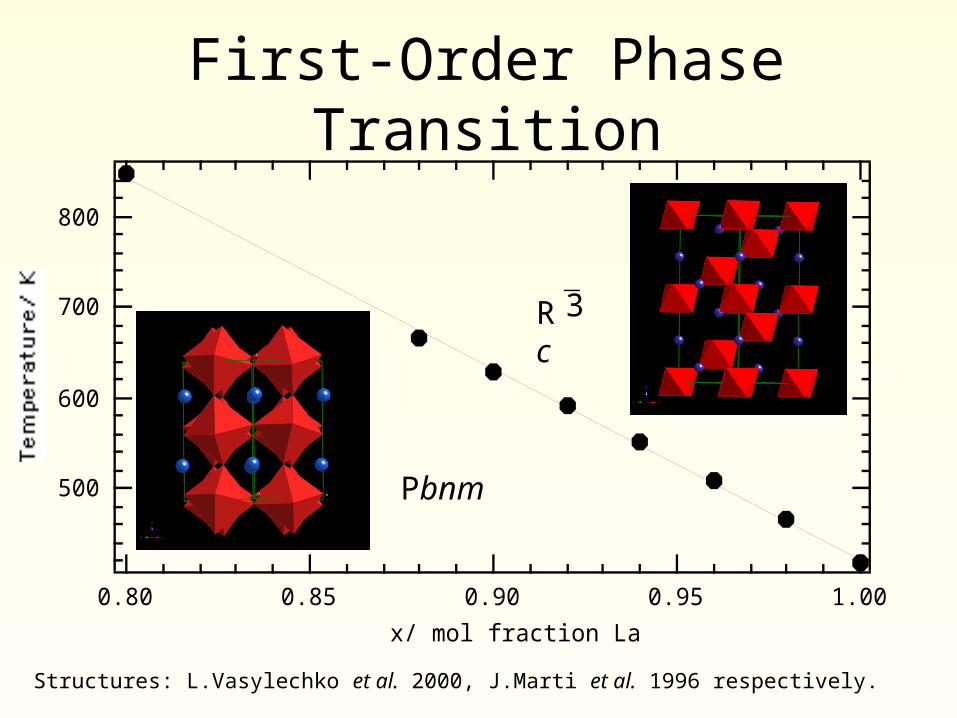
First-Order Phase Transition
€
3
800
700
600
500
Temperature/ K
1.000.950.900.850.80
x/ mol fraction La
Pbnm
R c
Structures: L.Vasylechko et al. 2000, J.Marti et al. 1996 respectively.
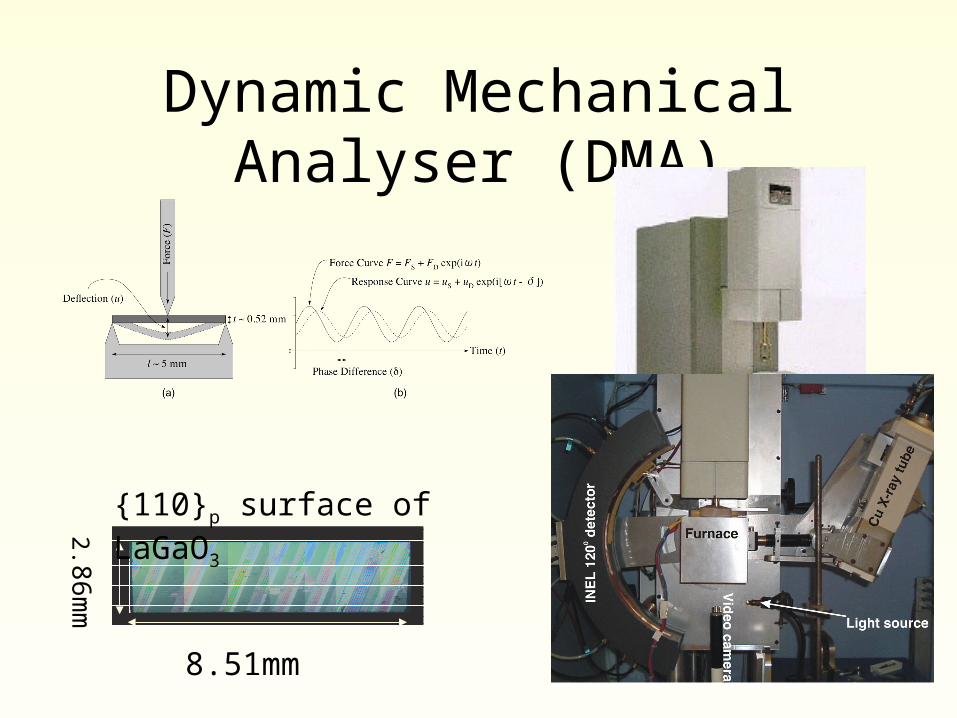
Dynamic Mechanical Analyser (DMA)
8.51mm
2.86mm
{110}p surface of LaGaO3
Motion of the phase interface over a phase transition
La0.88N0.12GaO3 110mN Fs 1Hz whilst heating over transition.
Speed X3.
LaGaO3 110mN Fs 2Hz whilst heating over transition.
Speed X3.
QuickTime™ and aYUV420 codec decompressor
are needed to see this picture.
QuickTime™ and a decompressor
are needed to see this picture.
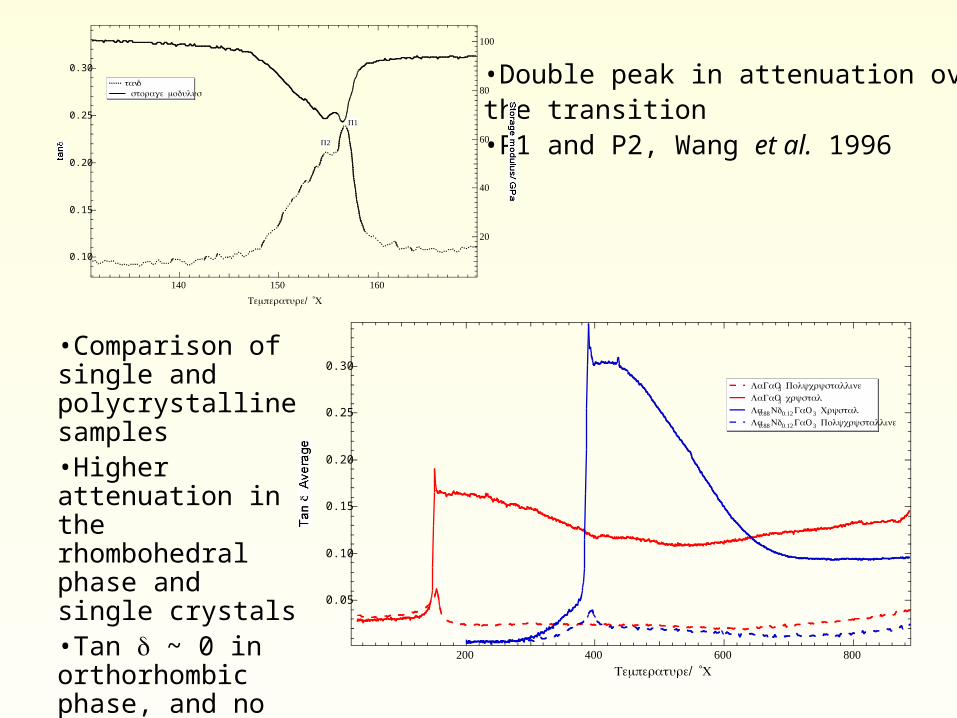
•Double peak in attenuation over the transition•P1 and P2, Wang et al. 1996
•Comparison of single and polycrystalline samples•Higher attenuation in the rhombohedral phase and single crystals •Tan ~ 0 in orthorhombic phase, and no twin motion is evident.
0.30
0.25
0.20
0.15
0.10
0.05
Tan
Average
800600400200/ ˚Temperature C
LaGaO3 Polycrystalline LaGaO3 crystal La0.88Nd0.12GaO3 Crystal La0.88Nd0.12GaO3 Polycrystalline
0.30
0.25
0.20
0.15
0.10
tan
160150140
/ ˚Temperature C
100
80
60
40
20
/ Storage modulus GPa
tan storage modulus
1P
2P
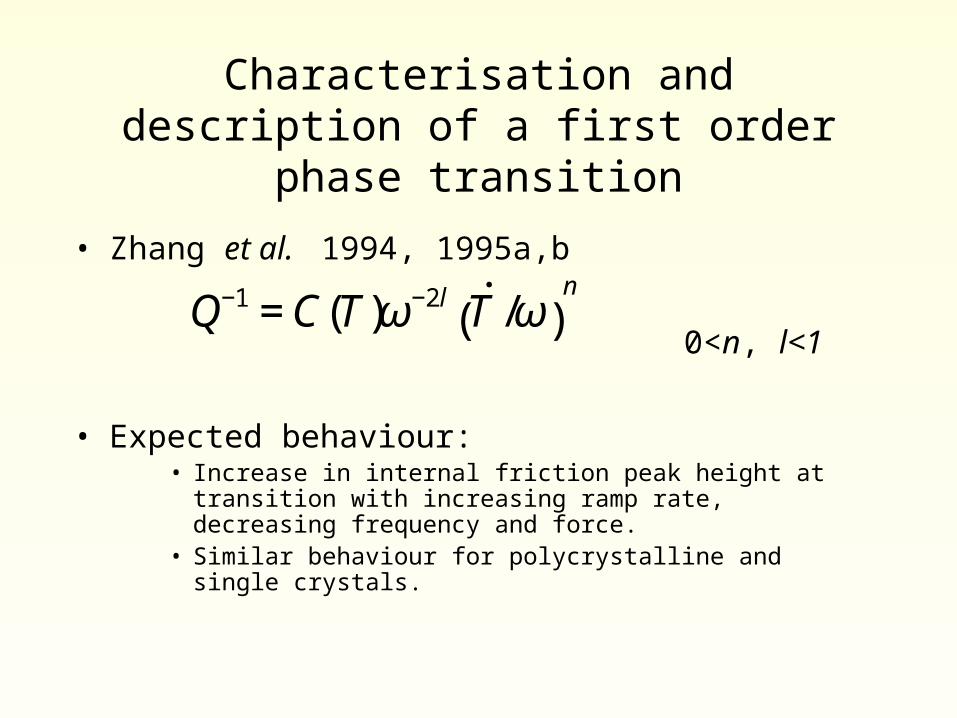
Characterisation and description of a first order phase transition
• Zhang et al. 1994, 1995a,b
0<n, l<1
• Expected behaviour:• Increase in internal friction peak height at transition with increasing
ramp rate, decreasing frequency and force.• Similar behaviour for polycrystalline and single crystals.€
Q−1 = C(T)ω−2l ˙ T /ω( )n
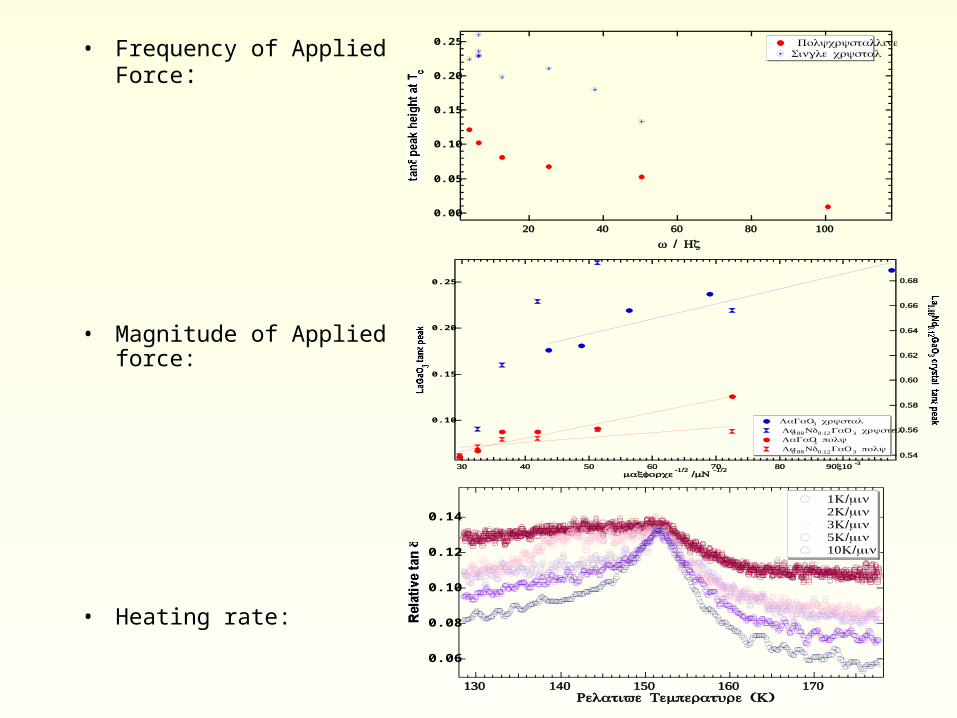
• Frequency of Applied Force:
• Magnitude of Applied force:
• Heating rate:
0.25
0.20
0.15
0.10
0.05
0.00
tan
peak height at T
c
10080604020
ω / Hz
Polycrystalline Single crystal
0.14
0.12
0.10
0.08
0.06
Relative tan
170160150140130 ( )Relative Temperature K
1 /K min 2 /K min 3 /K min 5 /K min 10 /K min
0.25
0.20
0.15
0.10
LaGaO
3
tan
peak
90 10x -3807060504030maxforce
-1/2 /mN
-1/2
0.68
0.66
0.64
0.62
0.60
0.58
0.56
0.54
La0.88
Nd0.12
GaO3
crystal tan
peak LaGaO3 crystal La0.88Nd0.12GaO3 crystal LaGaO3 poly La0.88Nd0.12GaO3 poly
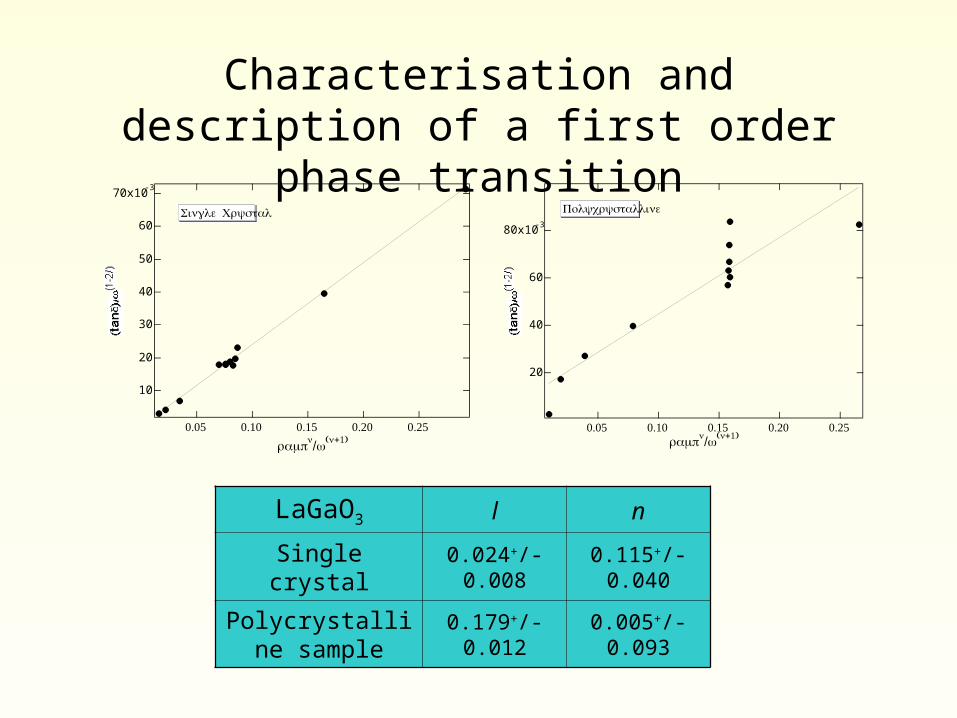
Characterisation and description of a first order phase transition
LaGaO3 l n
Single crystal 0.024+/-0.008 0.115+/-0.040
Polycrystalline sample
0.179+/-0.012 0.005+/-0.093
70x10-3
60
50
40
30
20
10
(tan)/ω
(1-2 l)
0.250.200.150.100.05
rampn/ω( +1)n
Single Crystal80x10
-3
60
40
20
(tan)/ω
(1-2 l)
0.250.200.150.100.05rampn/ω( +1)n
Polycrystalline
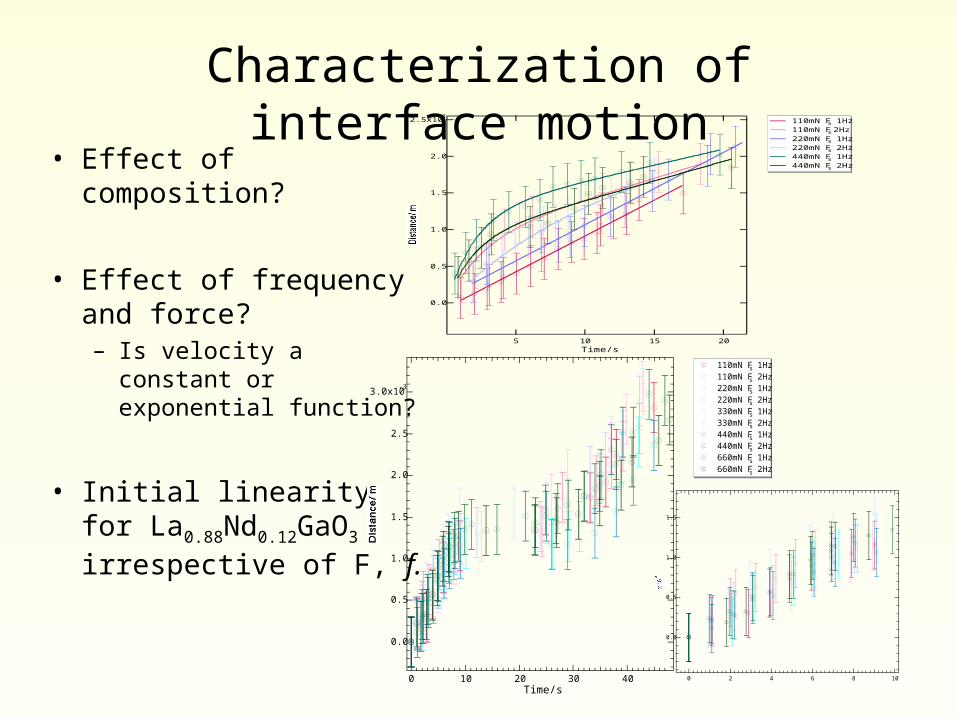
Characterization of interface motion• Effect of composition?
• Effect of frequency and force?– Is velocity a constant or
exponential function?
• Initial linearity for La0.88Nd0.12GaO3
irrespective of F, f. 1.5
1.0
0.5
0.0
x10-3
1086420
3.0x10⁻³
2.5
2.0
1.5
1.0
0.5
0.0
Distance/ m
403020100Time/s
110mN Fs 1Hz 110mN Fs 2Hz 220mN Fs 1Hz 220mN Fs 2Hz 330mN Fs 1Hz 330mN Fs 2Hz 440mN Fs 1Hz 440mN Fs 2Hz 660mN Fs 1Hz 660mN Fs 2Hz
2.5x10⁻³
2.0
1.5
1.0
0.5
0.0
Distance/ m
2015105Time/s
110mN Fs 1Hz 110mN Fs 2Hz 220mN Fs 1Hz 220mN Fs 2Hz 440mN Fs 1Hz 440mN Fs 2Hz
Summary of first order phase transition observations
• Both single crystal and polycrystalline samples show behaviour consistent with previous work on first-order phase transitions.
• The motion of an interface between two phases is greatly influenced by the twin microstructure.
• The velocity of the interface between the two phases can be considered to be a function of temperature, applied force and frequency.
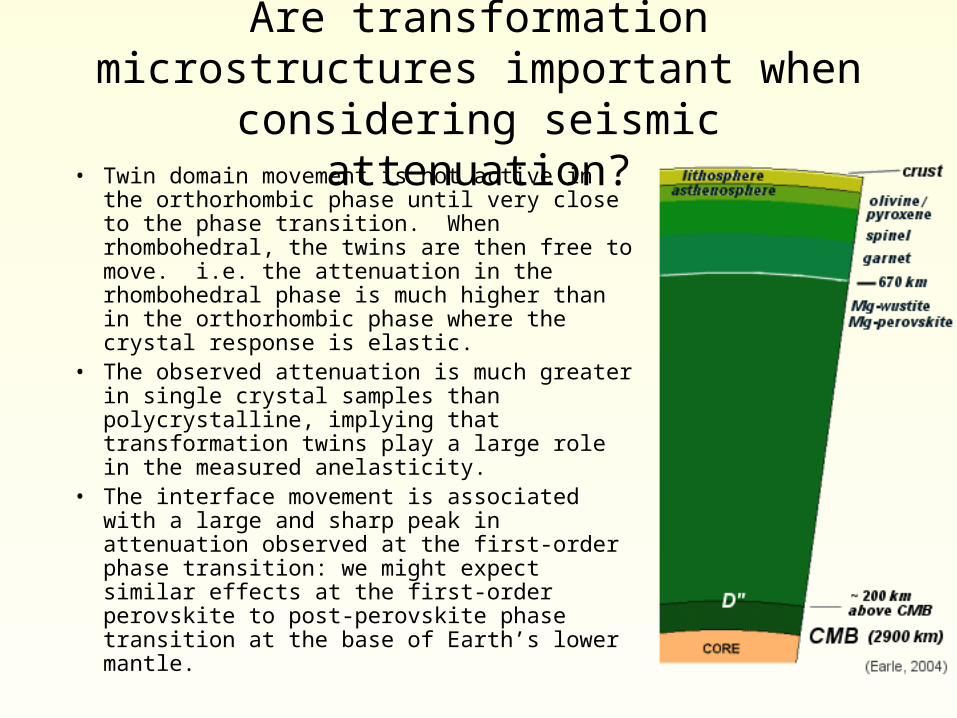
Are transformation microstructures important when considering seismic attenuation?
• Twin domain movement is not active in the orthorhombic phase until very close to the phase transition. When rhombohedral, the twins are then free to move. i.e. the attenuation in the rhombohedral phase is much higher than in the orthorhombic phase where the crystal response is elastic.
• The observed attenuation is much greater in single crystal samples than polycrystalline, implying that transformation twins play a large role in the measured anelasticity.
• The interface movement is associated with a large and sharp peak in attenuation observed at the first-order phase transition: we might expect similar effects at the first-order perovskite to post-perovskite phase transition at the base of Earth’s lower mantle.
Acknowledgements
• EPSRC PhD funding• British Crystallographic Association (BCA),
Institute of Minerals, Mining and Materials(IoM3) and The British Mineralogical Society for providing travel funds to this conference.
• Stuart Hayward (DSC)• Savytskii et al. Lviv Polytechnic, Ukraine.