Embed Size (px)
Citation preview
Mécanisme de salissage et de nettoyage
en surface de matériaux polymères
Par
Xing Chen
Mémoire présenté au department de chimie en vue de l‘obtention
du grade de maître ès science (M.Sc)
FACULTÉ DES SCIENCES
UNIVERSITÉ DE SHERBROOKE
Sherbrooke, Québec, Canada, juin 2016

juin 03, 2016
le jury a accepté le mémoire de monsieur Xing Chen
dans sa version finale
Membres du jury
Professeur Carmel Jolicoeur
Directeur de recherche
Département de chimie
Professeur Michel Huneault
Évaluateur externe
Département génie chimique
Faculté de génie
Professeur Armand Soldera
Président-rapporteur
Département de chimie

i
SUMMARY
The development of industrial polymers provides more choices to the design of flooring
materials. Rubbers, PVC and linoeleum are the most used polymers in the flooring industry.
This project stems from the problem of cleanability (ease of cleaning) of the surface of
rubber tile flooring which is known as a soft, sticky and rough surface.
In the introduction, the current situation of research on the polymer flooring industry,
especially the study on the cleaning problem will be introduced. The relevant theory and
general information on polymers, polymer composites and surface science will be introduced
in CHAPTER 1. In CHAPTER 2 different approaches, protocols and equipment to evaluate
cleanability will be presented.
The initial experiments and results (CHAPTER 3) will involve various fundamental concepts
on surface wettability, roughness and hardness, as these properties can all influence the
surface soiling and cleanability. In single-polymer systems, dozens of polymer materials with
a hydrophobic or hydrophilic surface were investigated to observe their soiling and
cleaning properties. The effect of roughness was also studied by surface printing method
which is used to control the surface topography. Likewise, the influence of surface hardness
on cleanability was also investigated with different polymer materials. From the above results
and observations, a surface soiling/ cleaning model is proposed in attempt to simplify the
―rules‖ which determine the surface cleanability. Finally, peroxide crosslinking was
investigated as a matrix modification method to improve the surface cleanability.
The second part of the experiments and results (CHAPTER 4) extends to investigations of

ii
polymer blends, in attempt to optimize the performance of single-polymer materials. In this
chapter, the surface cleaning model and its relevant rules are examined by the wettability,
roughness and hardness tests discussed in CHAPTER 3. The influence of immiscibility on
cleaning performance will be discussed in polymer blends from the point of view of
thermodynamics (DSC) and morphology (SEM). In order to improve the compatibility in
polymer blends, peroxide crosslinking was performed in EPDM/
(E-ran-MAA(Zn)-ran-BuMA) blends. The dosage of curing (cross-linking) agent and curing
time were investigated to observe the influence of these experimental conditions on
cleanability. Finally, a blend compatibilizer was designed to improve the compatibility of
the EPDM/ (E-ran-MAA(Zn)-ran-BuMA)/HSR blends. The compatibilizer prepared by
partial pre-crosslinking of EPDM (Nordel) and E-ran-MAA(Zn)-ran-BuMA (Surlyn) was
incorporated in polymer composites and its influence on cleanability was studied and
explained on the basis of changes in morphology of the blend polymer matrix..
Key words: polymer, cleanability, wettability, roughness, hardness, blends, crosslinking,
compatibilizer

iii
SOMMAIRE
Le développement de l‘industrie des polymères fourni de plus en plus de choix pour la
formulation de matériaux pour les couvre-planchers. Les caoutchoucs, le PVC et le linoleum
sont les polymères habituellement utilisés dans l‘industrie des couvre-planchers. Ce projet
répond à un problème de facilité de nettoyage des couvre-planchers de caoutchouc qui sont
reconnus pour être mous, collants et ayant une surface rugueuse.
L‘INTRODUCTION couvrira l‘état actuel de la recherche sur les couvre-planchers, surtout
en regard au problème de la «nettoyabilité». La théorie pertinente et les informations
générales sur les polymères, les composites polymériques et la science des surfaces seront
introduites au CHAPITRE 1. Ensuite, le CHAPITRE 2 couvrira la méthode utilisée pour
déterminer la nettoyabilité, l‘évaluation des résultats ainsi que l‘équipement utilise.
Le CHAPITRE 3, discutera des premières expériences sur l‘effet de la mouillabilité, la
rugosité et la dureté sur la facilité de nettoyage des polymères purs. Plusieurs polymères
ayant des surfaces plus ou moins hydrophobes seront investigués afin d‘observer leur effet
sur la nettoyabilité. L‘effet de la rugosité sur la nettoyabilité sera investigué en imprimant
une rugosité définie lors du moulage des échantillons; l‘influence de la dureté sera également
étudiée. Ensuite, un modèle de salissage/nettoyage sera établi à partir de nos résultats et
observations afin de rationaliser les facteurs, ou « règles », qui détrminent la facilité de
nettoyage des surfaces. Finalement, la réticulation au peroxyde sera étudiée comme une
méthode de modification des polymères dans le but d‘améliorer leur nettoyabilité; un
mécanisme découlant des résultats de ces études sera présenté.

iv
Le CHAPITRE 4 étendra cette recherche aux mélanges de polymères; ces derniers servent
habituellement à optimiser la performance des polymères purs. Dans ce chapitre, les mêmes
tests discutés dans le CHAPITRE 3 seront utilisés pour vérifier le modèle de nettoyabilité
établi ci-haut. De plus, l‘influence de la non-miscibilité des mélanges de polymères sera
discutée du point de vue de la thermodynamique (DSC) et de la morphologie (MEB).
L‘utilisation de la réticulation par peroxyde sera étudié dans les mélanges EPDM/
(E-ran-MAA(Zn)-ran-BuMA) afin d‘améliorer la compatibilité de ces polymères. Les effets
du dosage en agent de réticulation et du temps de cuisson seront également examinés.
Finalement, un compatibilisant pré-réticulé a été développé pour les mélanges ternaires
EPDM/ (E-ran-MAA(Zn)-ran-BuMA)/ HSR; son effet sur la nettoyabilité et sur la
morphologie du mélange sera exposé.
Mots clés: polymère, nettoyabilité, mouillabilité, rugosité, dureté, mélanges, réticulation,
compatibilisant

v
ACKNOWLEDGEMENTS
First and foremost, I would like to show my deepest gratitude to my supervisor, Professor
Carmel Jolicoeur, a respectable, responsible and resourceful scholar, who has provided me
with valuable guidance in every stage of the preparation of this mémoire. His keen and
vigorous academic observation enlightens me not only in this mémoire but also in my future
studies.
I shall extend my thanks to Professor Michel Huneault of Chemical Engineering Department
and Dr. Jean-Claude Mercier, R&D vice president of American Biltrite Canada. They
provided me tremendous help on experiment and equipment, and helped me enrich and
broaden my knowledge on polymer science. In addition, I would also like to express my
gratitude to Professor Yue Zhao for his support on characterization instruments.
My sincere appreciation also goes to all the members in the research group: Jeff Sharman,
Thi Cong To, Alexandre Proulx, Stéphane Fitzback, Stephan Freiberg, Mauricio Gonzalez,
Shant Shahbikian, Juan Xuan and all of the trainees.
Finally, I would like to express my thanks to Conseil de Recherche en Sciences Naturelles et
Génie (CRSNG), NanoQuébec (Prima-Québec) and American Biltrite for their financial
support, and my sincere appreciation to the members of the jury: Professors Armand Soldera,
Michel Huneault and Carmel Jolicoeur.

vi
TABLE OF CONTENTS
SUMMARY ............................................................................................................................... i
SOMMAIRE ............................................................................................................................ iii
ACKNOWLEDGEMENTS ...................................................................................................... v
TABLE OF CONTENTS ......................................................................................................... vi
LIST OF TABLES ................................................................................................................... xi
LIST OF FIGURES ................................................................................................................ xii
INTRODUCTION .................................................................................................................... 1
CHAPTER 1. THEORY ........................................................................................................... 6
1.1. Polymers and polymer crosslinking ............................................................................... 6
1.1.1. Polymer materials and polymerization .................................................................... 6
1.1.2. Polymer structure and classification of polymer materials ..................................... 8
1.1.3. Vulcanization in sulfur and non-sulfur system ........................................................ 9
1.1.4. Mechanism of peroxide vulcanization ................................................................... 11
1.2. Polymer composite ....................................................................................................... 12
1.2.1. Composite materials .............................................................................................. 12
1.2.2. Polymer composite ................................................................................................ 13
1.2.3. Introduction of components in polymer composite ............................................... 13
1.3. Polymer blends and miscibility .................................................................................... 15
1.3.1. Polymer blends ...................................................................................................... 16
vii
1.3.2. Miscibility .............................................................................................................. 17
1.3.3. Compatibilisation and compatibilizers .................................................................. 18
1.4. Surface wettability ........................................................................................................ 19
1.4.1. Surface water contact angle ................................................................................... 20
1.4.2. Surface water contact angle (WCA) on rough surfaces ........................................ 20
1.4.3. Lotus effect and superhydrophobic self-cleaning effect ........................................ 22
1.4.4. Limitation and inspiration from superhydrophobic self-cleaning model. ............. 24
1.5. Surface topography ...................................................................................................... 25
1.5.1. Surface roughness and its evaluation ..................................................................... 25
1.5.2. Analysis for selection of parameters ..................................................................... 27
CHAPTER 2. EXPERIMENTAL ........................................................................................... 29
2.1. Polymer materials and products used in the project ..................................................... 29
2.1.1. Polymer .................................................................................................................. 29
2.1.2. Chemical product ................................................................................................... 33
2.2. Sample preparation and related equipment .................................................................. 33
2.2.1. HAAKE Rheomix Lab mixer and mixing process ................................................ 34
2.2.2. Grinder ................................................................................................................... 36
2.2.3. Hydraulic press ...................................................................................................... 36
2.3. Procedure for the cleanability test ................................................................................ 38
2.3.1. Preparation of samples for the cleanability test ..................................................... 38
2.3.2. Protocol for evaluation of soiling and cleaning ..................................................... 39

viii
2.3.3. Evaluation of cleanability ...................................................................................... 39
2.4. Characterisation ............................................................................................................ 41
2.4.1. Test of surface water contact angle ....................................................................... 41
2.4.2. Test of surface topography .................................................................................... 43
2.4.3. Surface hardness .................................................................................................... 44
2.4.4. Differential scanning calorimetry (DSC) .............................................................. 45
2.4.5. Scanning electron microscope (SEM) ................................................................... 48
CHAPTER 3. CLEANABILITY IN SINGLE POLYMER SYSTEMS - ESTABLISHING A
SURFACE CLEANING MODEL .......................................................................................... 50
3.1. Sample preparation and experiment ............................................................................. 51
3.2. Influence of surface wettability .................................................................................... 52
3.3. Influence of surface roughness ..................................................................................... 55
3.4. Combined effect of surface wettability and roughness ................................................ 57
3.5. Hardness ....................................................................................................................... 59
3.6. A surface soiling and cleaning model .......................................................................... 60
3.6.1. Soiling process ....................................................................................................... 61
3.6.2. Cleaning on hard surfaces ...................................................................................... 61
3.6.3. Cleaning a soft surface .......................................................................................... 63
3.7. The influence of polymer crosslinking on cleanability ................................................ 64
3.7.1. Sample preparation and experiment ...................................................................... 65
3.7.2. Results and analysis ............................................................................................... 65

ix
3.8. Conclusion .................................................................................................................... 68
CHAPTER 4. STUDY ON THE INFLUENCE OF POLYMER IMMISCIBILITY ON
CLEANING PERFORMANCE IN POLYMER BLENDS AND THE COMPATIBILITY
MODIFICATION ON EPDM/ E-MAA (ZN)-BUMA/HSR BLENDS. ................................ 70
4.1. Research of multiple surface factors in polymer blends system. ................................. 71
4.1.1. Polymer blends design, preparation and testing .................................................... 71
4.1.2. Results and analysis ............................................................................................... 72
4.2. The influence of miscibility on cleanability in polymer blends. .................................. 75
4.2.1. Influence of polymer immiscibility on cleanability .............................................. 76
4.2.2. Thermal analysis and study on morphology .......................................................... 77
4.3. Effect of crosslinking on polymer compatibility and cleanability in Nordel (EPDM) /
Surlyn (E-ran-MAA(Zn)-ran-BuMA) blends ..................................................................... 80
4.3.1. Sample preparation and experiment ...................................................................... 80
4.3.2. The influence of curing agent dosage .................................................................... 81
4.3.3. The influence of curing time ................................................................................. 82
4.3.4. Study on morphology ............................................................................................ 83
4.4. Study of compatibilizer modification on compatibility and cleanability in
Nordel/Surlyn /HSR blend system ...................................................................................... 84
4.4.1. Preparation of pre-crosslinked compatibilizer (PC) .............................................. 84
4.4.2. Study of cleanability with the presence of pre-crosslinked compatibilizer ........... 86
4.4.3. Study on morphology of 3-polymer blend ............................................................ 87
4.5. Conclusion .................................................................................................................... 88

x
CONCLUSION ....................................................................................................................... 90
REFERENCES ....................................................................................................................... 93

xi
LIST OF TABLES
Table 1. Characteristics of different surface roughness measurement techniques
(R.Kuisma et al.). ..................................................................................................... 26
Table 2. Structure and abbreviation of the more significant materials of this study. ....... 31
Table 3. Cleaning agents with different surface tension. ................................................. 33
Table 4. List and information of the powders used as soil agent ..................................... 38
Table 5. Color intensity code for soiling and cleaning evaluation ................................... 41
Table 6. List of some typical polymers and their thermal properties ............................... 52
Table 7. Cleanability test of roughness controlled surface .............................................. 56
Table 8. Materials used in this section ............................................................................. 65
Table 9. Hardness before and after curing of selected polymers ..................................... 66
Table 10. List of component polymers used in polymer blends ...................................... 72

xii
LIST OF FIGURES
Figure 1. Structure of polyethylene ................................................................................... 7
Figure 2. Reaction of radical polymerization .................................................................... 7
Figure 3. Condensation polymerization ............................................................................. 8
Figure 4. Main types of architecture of polymer chain ...................................................... 8
Figure 5. Natural rubber after vulcanization with elemental sulfur (circled in red) ........ 10
Figure 6. Plywood composite .......................................................................................... 13
Figure 7. Varying of the polymer blends type along with different ratio of components. 17
Figure 8. A-B block polymer works as a compatibilizer to improve interfacial adhesion
................................................................................................................................... 18
Figure 9. Normal polymer blend (a); polymer blend modified by compatibilizer (b) ..... 19
Figure 10. Static contact angle of liquid droplet on smooth solid surface ....................... 20
Figure 11. Static contact angle of water droplet on rough surface: (a) Wenzel‘s model. (b)
Cassie‘s model .......................................................................................................... 21
Figure 12. Lotus effect (left) and a microscopic SEM image of a lotus leaf (right) ........ 23
Figure 13. Slip of a water droplet from an inclined hydrophobic surface (left) and an
inclined superhydrophobic surface (right) ................................................................ 23
Figure 14. Small soil particles can‘t be removed by water on superhydrophobic surfaces
................................................................................................................................... 24
Figure 15. Designed surface with controlled roughness (by R. Kuisma et al.) ............... 27
Figure 16. Cleanability variation with the different surface roughness parameters
(R.Kuisma et al.) ....................................................................................................... 28
Figure 17. Two surfaces with same Ra (Sa) but different structure ................................. 28
Figure 18. The structure of organic peroxide curing agent .............................................. 33

xiii
Figure 19. HAAKE™ Rheomix Lab Mixers ................................................................... 34
Figure 20. The mixing chamber of HAAKE Rheomix Lab Mixers (left); typical
Torque-Temperature graph obtained from mixing process (right) ............................ 35
Figure 21. Allen-Bradley grinder ..................................................................................... 36
Figure 22. Hydraulic press machine ................................................................................ 36
Figure 23. Mold for compression molding (left); filling of the mold with sample particles
(right) ........................................................................................................................ 37
Figure 24. Soiling test (left) and finished sample (right) ................................................. 39
Figure 25. Reference 5-level color intensity codes .......................................................... 40
Figure 26. First Ten Armstrong (FTA200) contact angle analyzer .................................. 41
Figure 27. Image of the hemisphere droplet for contact angle test .................................. 42
Figure 28. Non-contact profilometer (3D optical microscope) Bruker Contour GT ....... 43
Figure 29. Shore A durometer .......................................................................................... 44
Figure 30. Shore hardness measurement (left); Type A and type D indenter (right) ....... 45
Figure 31. DSC experimental setup ................................................................................. 46
Figure 32. Typical DSC curve .......................................................................................... 47
Figure 33. Structure of scanning electron microscope ..................................................... 48
Figure 34. Cleanability of hard polymers classified by CA (Left) and the corresponding
data (right) ................................................................................................................. 53
Figure 35. Cleanability of soft polymers classified by CA .............................................. 54
Figure 36. Cleanability of polymers having different roughness.................................. 55
Figure 37. The SEM of Fe2O3 particles (a); The HSR sample cleaned with 3 types of
detergent (b) .............................................................................................................. 58
Figure 38. Surface cleaned by different clean agents ...................................................... 59
Figure 39. Cleanability of polymer with different hardness ............................................ 60
Figure 40. Surface soiling process ................................................................................... 61

xiv
Figure 41. Dry cleaning (left) and wet cleaning (right) ................................................... 62
Figure 42. Cleaning with the use of a detergent .............................................................. 63
Figure 43. Cleaning a soft surface ................................................................................... 63
Figure 44. Crosslinking in rubber fabrication .................................................................. 64
Figure 45. Effect of crosslinking on the cleanability of typical polymers: (a) Nordel
(EPDM); (b) Engage (E/O); (c) Nucrel (E/MAA); (d) LDPE .................................. 67
Figure 46. Comparison of cleanability before & after crosslinking on Hard (left) and soft
(right) polymers ........................................................................................................ 67
Figure 47. Cleanability of polymer blends classified by CA ........................................... 73
Figure 48. Cleanability of polymer blends with different surface roughness .................. 74
Figure 49. Cleanability of polymer blends with different hardness ................................. 75
Figure 50. Cleanability of polymer blends in function of the weight fraction: (a)
LDPE-Levapren, (b) PMMA-Engage, (c) Bynel-Engage, (d) Celcon-SBR ............. 77
Figure 51. DSC diagram of the different Bynel-Engage blends (cooling curve). ........... 78
Figure 52. SEM images of Bynel/Engage (75/25) (left) and Surlyn/Engage (75/25) (right)
................................................................................................................................... 79
Figure 53. Cleanability of Nordel/ Surlyn blend cured with different dosage of peroxide
................................................................................................................................... 81
Figure 54. Cleanability of Nordel/ Surlyn blend cured with different curing times ........ 82
Figure 55. SEM image of Nordel/ Surlyn blends with (a) 0phr, (b) 2.5phr, (c) 5phr, (d)
12.5phr of peroxide curing agent .............................................................................. 83
Figure 56. (a) Crosslinked polymer network; (b) pre-crosslinked compatibilizer ........... 85
Figure 57. Cleanability of Nordel/Surlyn/HSR blends modified by pre-crosslinked
compatibilizer (PC) (3P: without PC, 3P+1: with PC#1, 3P+2: with PC#2) ............ 86
Figure 58. SEM of (a) Nordel/Surlyn/HSR blend; (b) with PC; (c) with 0.2phr peroxide
................................................................................................................................... 87

1
INTRODUCTION
In the modern world, polymers are one of the most used construction and decoration
materials in many public and home buildings. Pipes, window profiles and cable insulation
made using polymers have been widely used since the end of last century (1).
At the beginning of 21th century, the emergence concern for environmental protection
required people to use more environment friendly materials to replace the traditional ones,
such as wood and marble material. Furthermore, the rapid growth of the number of high-rise
buildings also has the requirement of employing lighter and more durable materials. That is
why polymer materials have been of widespread interest in the construction field. The
characteristics of polymeric materials include: light weight, corrosion resistance, comfort,
superior insulation, and excellent physical properties (2). Until now, benefiting from the
rapid development of production technology, polymers are also widely used as building
flooring, surface coating and water proofing materials.
The first attempts to make polymer floor tiles (thermoplastic and rubber floor) date back as
early as the 13th century, but with little to no success. Modern «vinyl» (thermoplastic) floor
tiles and sheet flooring of those products sold since the early 1980s are composed of
colored polyvinyl chloride (PVC) chips formed into solid sheets of varying thicknesses by
heat and pressure (3).
Rubber flooring cannot be manufactured by normal heat and pressure process. It wasn't until
the 1830s when inventors Charles Goodyear and Nathaniel Hayward learned how to combine

2
gum plastic, sulfur and latex to create the rubber we know and use today. This process
(named "vulcanization") produces a material more durable and more resilient than its rubber
ancestors. Despite technological advances with rubber in the early 19th century, it wasn't
until the 1950‘s that rubber was used as a flooring material.
Rubber flooring was once made from the milky sap of the rubber tree, but most rubber
flooring is now producing from synthetic elastomers. It is hard wearing, colorful, resilient,
low density, flexible and durable, and has excellent resistant to burns and dents; in advanced
materials, built-in self-releasing wax allows some rubber tile flooring to self-heal most
scratches and abrasions. Synthetic rubber flooring thus offered a most valuable alternative, to
other resilient polymer floor coverings like PVC, linoeleum, etc. Firstly, rubber tile flooring
is generally considered a "low-impact," environmentally friendly building material. Virgin
rubber is sustainable as it is derived from trees, and the manufacture of synthetic rubber also
has a low impact on the environment. Secondly, rubber flooring contain less free chemical
products, such as plasticizers, and most rubber tiles flooring has good water and chemical
resistance, a benefit resulting from its vulcanization (crosslinking) (4).
However, because of the nature of rubber materials, rubber flooring is also easily soiled or
stained from exposure to dust, or other common soiling mixtures. This phenomenon is found
more frequently and more significantly in flexible flooring materials which aim at providing
user comfort and noise reduction. . The resistance to soiling and staining and the ease of
cleaning (these properties will be collectively called cleanability in this mémoire) are quite
important to the durability of flooring materials. A flooring material with superior
cleanability will provide various benefits, namely, lasting aearance, easier and less frequent
servicing, and extended service life.

3
Several investigations have been made on the flooring surface soiling and cleaning problem.
In the past 50 years, various factors were shown to affect the surface cleanability. For
instance, in the mid-1960s, it was found using SEM discovered that the surface of lotus leaf,
which appears to be macroscopically smooth, exhibits microscopic roughness on different
length scales (5, 6). From then on, the relationship between the surface cleanability and other
surface properties, such as surface topography and surface tension (energy) have gradually
been revealed in lab experiments (7, 8). Especially, the combined effect of surface tension
and surface topography was extensively studied and the results used in the manufacturing of
self-cleaning surface coating.
However, the preparation of artificial self-cleaning surfaces which are based on
superhydrophilic and superhydrophobic phenomenon are difficult to apply to the
manufacture of commercial rubber flooring because of their cost (9). There are only a few
papers related to the research of cleanability on normal polymer surfaces by using modern
instrument characterizations (Risto Kuisma et al.) and study the theory of surface soiling (E.F.
Cuddihy et al.) (10, 11).
The lack of comprehensive investigations and data base greatly increases the difficulty of
research on the surface cleanability of polymer composites for use in flooring application.
Therefore, it seemed most appropriate to fill the gap of research on polymer surface
cleanability. In order to achieve this goal, our research group included three types of
expertises: the academic researchers in chemistry (Laboratory of Pr. Carmel Jolicoeur),
academic researchers in polymer engineering (Laboratory of Pr. Michel Huneault) and
researchers in industrial processing (American Biltrite Canada). Our research work is mainly
based on the common polymer materials which are wildly applied in flooring production, in

4
order to establish relevant theoretical concepts and find optimization methods that can be
applied in the industrial production.
In the industry, rubber flooring is generally based on polymer composites which include a
single-polymer or a polymer blend matrix, mineral fillers and chemical additives. Polymer
materials are the main component of polymer composites; they offer the flooring tiles their
physical and chemical properties such as flexibility, elasticity and resistance to chemical
degradation. Different polymer matrix compositions, even by simply changing the ratio of
polymers in a blend, can greatly affect the surface properties. For instance, the surface
wettability was shown to be greatly affected by changing the ratio of polymers in blends (12).
Mineral fillers (such as CaCO3, talc, quartz, etc.) are another important component in
polymer flooring composites which are used to provide material hardness and resistance to
indentation, as well as to reduce the cost of the end products. Mineral fillers usually have a
hydrophilic surface which is not easily wetted by molten polymer; this could lead to surface
in homogeneity and, as a result, it may influence the surface cleaning property (13).
Moreover, inspired by a great deal of research on the lotus-effect (superhydrophobic
self-cleaning), the tremendous influence of surface wettability and surface topography on
cleanability are confirmed by several researchers (14). Furthermore, compared with the study
of surface cleanability on metal and ceramic materials, scientists found that a surface that is
more compact (dense) and harder will have a better cleanability (15). Therefore, other
physical or chemical methods which can increase the surface density and hardness, such as
vulcanization (or polymer crosslinking), should be investigated.
In this mémoire, we will firstly introduce the basic concepts of surface wettability, surface
topography, polymer blends and vulcanization (or polymer crosslinking) in CHAPTER 1.

5
Then the experimental methods, the evaluation of cleanability and the equipment used will be
introduced in CHAPTER 2. In CHAPTER 3, we will discuss the influence of different
factors in single-polymer system and try to construct a surface soiling and cleaning model. In
CHAPTER 4, the soiling-cleaning model will be verified in polymer blends. And then, we
will discuss the effect of crosslinking and compatibilizer modification in specific polymer
blends. Finally, the main observations and trends in different factors and the effects of
polymer matrix modification will be summarized in the CONCLUSION.

6
CHAPTER 1. THEORY
In order to appreciate the selection of experimental materials, the formulation approaches and the
discussion to the results in following chapters, it is important to first understand some related concepts.
This project on surface cleanability addresses surface chemistry, surface topography, polymer
miscibility and various material properties; the topic is thus inherently highly complex. Therefore, we
will first introduce some basic concepts of polymers, composites, polymer miscibility, surface
wettability, topography and polymer crosslinking. We will simultaneously introduce some basic laws
which affect the surface cleanability found in the past few decades.
1.1. Polymers and polymer crosslinking
In this section, the basic concept of polymer materials and polymerization will be introduced. The
different structures of polymer chains and the definition of thermoplastic and rubber will also be
introduced. In addition, some basic knowledge of vulcanization which plays an important role in the
rubber molding process will be presented to help the comprehension of CHAPTER 3.
1.1.1. Polymer materials and polymerization
Polymers are molecules that consist of a long, repeating chain of smaller units called monomers which
are connected to each other by covalent bonds. They have the highest molecular weight among any
molecules, and may consist of billions of atoms. They are the largest and most diverse class of known
molecules and even include plastics (16). Figure 1 shows an example of polyethylene.

7
Figure 1. Structure of polyethylene
The synthesis of a polymer is called polymerization. Polymers and their polymerization processes are
so diverse that a variety of different systems exist to classify them. One major reaction named
polymerisation by chain reaction which is an ultra-fast reaction by adding successive monomers on a
chain carrying an active end (free radical). Synonyms: radical polymerization (Figure 2), addition
polymerization
Figure 2. Reaction of radical polymerization
Another major type of polymerization process is named step polymerisation which occurs by
independent steps. In this type of polymerization simultaneous reactions may occur between
monomers, dimers, and oligomers. There are two main reactions: condensation (Figure 3) and
ring-opening reaction (17).

8
Figure 3. Condensation polymerization
1.1.2. Polymer structure and classification of polymer materials
Depending on the monomer type and the conditions of polymerization, the architecture of polymer
chains can vary dramatically. Figure 4 shows the main types of architecture of polymer chains which
can be found in commercial polymer materials:linear, branched and crosslinked (3D).
Figure 4. Main types of architecture of polymer chain
Thermoplastics are generally polymers with a linear or branched chain architecture. Many of the most
commonly used polymer materials, for instance, polyethylene (PE), polypropylene (PP), polystyrene
(PS) and polyvinyl chloride (PVC) belong to the category of thermoplastics.
Thermoplastic materials are wildly used in thermoforming processes such as injection molding, blow
molding and compression molding (18, 19). The reason is that the thermoplastic‘s mechanical

9
properties change considerably on both sides of its transition temperature, either its glass transition
temperature (Tg) or melting temperature (Tm).
Another type of polymer are elastomers, such as rubber, that can form 3D network structures.
Compared to vulcanized (crosslinked) rubber, uncured rubber has similar thermal properties as
thermoplastics, but has relatively few uses due to its low physical properties (20). It is used for
cements; for adhesive, insulating, and friction tapes; and for crepe rubber used in insulating blankets
and footwear. Vulcanized rubber, on the other hand, has numerous applications. Resistance to abrasion
makes softer kinds of rubber valuable for the outer soleof vehicle tires, flooring material and conveyor
belts.
Because of the irreversibility of the vulcanization reaction, the industrial production of rubber flooring
tiles are always molded under heating at first, and then vulcanized, in order to permanently fix the
shape of the pressed material. The cured rubber materials no longer have the same thermo-property as
thermoplastic, they are able to maintain their form under heating because the 3D structure prevents
movement between polymer chains.
1.1.3. Vulcanization in sulfur and non-sulfur system
Vulcanization is a chemical process for converting natural rubber or related polymers into more
durable materials via the addition of sulfur or other equivalent curing or accelerators. These additives
modify the polymer by forming cross-links (bridges) between individual polymer chains (21, 22).
Uncured natural rubber is sticky, deforms easily when warm, and is brittle when cold. In this state, it is
a poor material for applications where a high level of elasticity is required. The reason for inelastic

10
deformation of un-vulcanized rubber can be found in its chemical structure — rubber is composed of
long polymer chains. These chains can move independently relative to each other, which lets the
material change shape. Crosslinking introduced by vulcanization prevents the polymer chains from
moving independently. As a result, when stress is applied the vulcanized rubber deforms, but upon
release of the stress it reverts to its original shape.
In contrast with thermoplastic processes which are reversible, vulcanization of elastomers, or the
curing of other thermosetting polymers, is generally irreversible. The cross-linking is usually achieved
by the addition of sulfur, but other chemicals can perform the same function, including peroxides,
metallic oxides, acetoxysilane, etc. Therefore, in the rubber industry, the "cure", "vulcanization" and
"cross-linking" are synonymous, and curing system is divided into non-sulfur vulcanization system
and sulfur curing system (23). In Figure 5, we schematically represent two strands (blue and green) of
natural rubber after vulcanization with elemental sulfur.
Figure 5. Natural rubber after vulcanization with elemental sulfur (circled in red)
A variety of methods exist for vulcanization. For example, an economically important method (for
example, vulcanization of tires) uses high pressure and temperature after the curing agent has been
added to the rubber. A typical vulcanization temperature for a passenger tire is 10 minutes at 170 °C.
This process employs the technique known as compression molding, where the rubber article is

11
intended to adopt the shape of the mold.
The traditional curing system using sulfur opens the unsaturated carbon-carbon double bond to allow
the formation of intermolecular cross-linking between raw rubber molecules. Thereby the properties of
rubber are greatly improved, for instance high strength, high flexibility, high wear and corrosion
resistance and other excellent properties. However, with the increasing variety of synthetic rubber, in
addition to the mass production of general-purpose synthetic rubber varieties (unsaturated rubber),
there have been created some saturated rubbers such as ethylene propylene rubber (EPR),
ethylene-propylene-diene-monomer rubber (EPDM), acrylic rubber (ACM), chlorohydrin rubber and
the silicone rubber, etc. (24). Because their main chains do not contain carbon-carbon double bonds
that can be vulcanized with sulfur vulcanization system, these polymers can only be crosslinked with a
peroxide, a metal oxide or other similar agents.
Peroxide curing systems can be divided into three categories according to the type of crosslinking
agent: inorganic peroxides, organosilicon peroxides and organic peroxides. The organic peroxide is the
most common among them, primarily for crosslinking saturated rubbers; unsaturated rubbers can also
be cured by using peroxide (25). Compared to sulfur curing, peroxide curing forms C-C bonds which
have a higher bond energy. It provides better chemical stability, excellent resistance to aging and a
very low permanent deformation. In addition, non-sulfur vulcanized rubber has no reversion
degradation problems.
1.1.4. Mechanism of peroxide vulcanization
Peroxides are easy to decompose under heating and generate free radicals, which act as an initiator and
results in a cross-linking reaction between molecular chains. The reaction process can be summarized

12
as the following steps:
(1.1)
(1.2)
(1.3)
Peroxide can also react with C=C by breaking the carbon-carbon double bond and the reaction
mechanism is similar to sulfur curing but replaces S-S bond with a C-C bond (26). Therefore, peroxide
could be applied in both of the saturated and unsaturated rubber materials.
1.2. Polymer composite
This section involves the basic conception of composite material, the composition of polymer
composite. Different components of polymer composites such as mineral fillers and chemical additives
will be introduced in this section.
1.2.1. Composite materials
Composite materials for construction, engineering, and other similar applications are formed by
combining two or more materials in such a way that the constituents are still distinguishable and not
fully blended (Figure 6). The different materials are combined judiciously to achieve a system with

13
more useful structural or functional properties non-attainable by any of the constituents alone (27).
Figure 6. Plywood composite
1.2.2. Polymer composite
Many commercially produced composites use a polymer matrix material (often called a resin solution).
There are several broad categories, each with numerous variations. The most common are known
as polyester, vinyl ester, polyamide, polyethylene, polypropylene, PVC, and others. The reinforcement
materials are often common ground minerals but also fibres and nano-materials.
Generally, polymer composite, especially polymer composite construction materials, including pipe,
window profiles and flooring material have similar compositions. The components can be roughly
divided into three categories: polymer matrix, reinforcement (mineral filler and fibre, etc.) and
chemical additives (additive and curing agent).
1.2.3. Introduction of components in polymer composite
Polymer matrix: the properties of different polymer matrix will determine the application to which it
is appropriate. The chief advantages of polymers as a matrix are low cost, easy-processability, good
chemical resistance, and low specific gravity (28). On the other hand, low strength, low modulus, and
low operating temperatures limit their use (29). Various polymers used for composites are

14
thermoplastic polymers, thermosetting polymers, elastomers, and their blends.
Fibre reinforcement: glass, carbon, Kevlar, boron, and natural source fibres are being used as
reinforcing materials in fibre-reinforced plastics, which have been widely accepted as materials for
structural and non-structural applications (30). Fibre reinforced polymer (FRP) allows the alignment of
the fibres of thermoplastics to suit specific design programs. Specifying the orientation of reinforcing
fibres can increase the strength and resistance to deformation of the polymer matrix. For instance,
glass fibre reinforced polymers are strongest and most resistive to deforming forces when the polymers
fibres are parallel to the force being exerted.
Mineral fillers: fillers are particles added to materials (plastics, polymer composite material and
concrete) to lower the consumption of more expensive binder material or to enhance some properties
of the composite material. The common mineral fillers used in polymer composite are calcium
carbonate, dolomite, talc, quartz and clay (31).
Among the most important fillers, calcium carbonate holds the largest market volume and is mainly
used in the plastics sector. Calcium carbonate is the least expensive and the largest mineral filler used
in thermoplastic as well as in thermoset compounds and rubber materials. Calcium carbonate can be
incorporated at a very high level of more than 70% by weight (32). While polyolefin and other
non-polar polymer compounds use plain calcium carbonate, they usually require surface modified
calcium carbonate. The reason is that, in the mixing process the hydrophobic liquid phase (polymer
phase) does not readily wet the CaCO3 surface, and as a result, the filler phase will spontaneously
separate from the mixture. The common method used to resolve this problem is to treat the filler
particles‘ surface by functionalized polymer such as a maleicanhydride polymer which acts as a
particle-matrix coupling agent.

15
Chemical additives: a chemical additive is a compound used to modify the properties of polymer
resins. Examples include plasticizers, UV stabilizers, antioxidant and flame-retardants. In some certain
polymer systems for example: rubber and elastomer manufacturing, the curing agent can also play the
role of chemical additive in order to modifier some properties (33, 34).
Introduction of some common additives:
Plasticizer: additives that increase the plasticity or fluidity of a material. It is generally
agreed that plasticizers work by embedding themselves between the chains of polymers,
spacing them apart (increasing the "free volume"), and thus significantly lowering the glass
transition temperature of the polymer and making it softer (35).
Antioxidant: Substance that, when added in small quantities to resin, prevents oxidation and
degradation while maintaining the resin‘s properties.
Curing Agent: A catalytic or reactive agent that, when added to a resin, causes vulcanization
(crosslinking). It also called hardener.
UV Stabilizer: Chemical compound which improves resistance to degradation from
ultraviolet radiation (36).
1.3. Polymer blends and miscibility
Most of the polymer matrix used in polymer composite materials are usually composed of mixes of
different polymers: polymer blends. In this section, we will introduce the general concept of polymer
blends, its advantages and a frequently observed problem of immiscibility. Some methods used to
improve polymer compatibility will also be presented, especially the chemical method by using a
compatibilizer (37).

16
1.3.1. Polymer blends
During the 1940s, '50s and '60s, the commercial development of new monomers for production of the
new polymers seemed endless. In this period, it was discovered that the development of the new
techniques for the modification of the already existing polymers, would be economically viable. A
new polymer modification process, based on the simple mechanical mixture of two polymers first
appeared when Thomas Hancock made a mixture of natural rubber with Gutta-percha. This process
generated a new polymer class called «Polymer Blend».
Polymer blends are a class of materials analogous to metal alloys, in which at least two polymers are
blended together to create a new material with different physical properties (38). Polymer blends can
be broadly divided into three categories:
Immiscible polymer blends: This is by far the most populous group. If the blend is
made of two polymers, two glass transition temperatures will be observed.
Compatible polymer blends: Immiscible polymer blend that exhibits macroscopically
uniform physical properties. The macroscopically uniform properties are usually caused
by sufficiently strong interactions between the component polymers.
Miscible polymer blends: Polymer blend that is a single-phase structure. In this case,
one glass transition temperature will be observed (homogeneous down to molecular
level). In thermodynamic terms a miscible blend is one associated with a negative value
of the free energy of mixing:
(1.4)
And a positive value of the second derivative with respect to concentration:
(1.5)

17
(where ΔGm is the free energy of mixing, ΔHm is the heat of mixing and ϕ is the volume
fraction of the matrix polymer)
Figure 7. Varying of the polymer blends type along with different ratio of components.
As shown in Figure 7, the change of components ratio can result in a different types of polymer blends.
In addition various other factors will affect the polymer blends‘ status such as the component‘s
polarity, viscosity, Tg & Tm (affect hardness and viscosity), the degree of crystallinity and external
processing conditions. The complex balance of these various factors leads to the observation that
most of the polymers are immiscible (or thermodynamically immiscible) (39).
1.3.2. Miscibility
Miscibility is a thermodynamic concept, its thermodynamic definition is clear. It is pertinent to the
liquid or glassy state, such as polymer blends can be considered to be a solution (40). However, there
is a significant amount of discussion as to methods of detecting miscibility and the size of
heterogeneity in the phase dispersion of miscible blends. In polymer blends, immiscibility is a rule
while miscibility is a rare and precarious state, determined by a large range of variables: molecular
parameters, polymer chain type, concentration, pressure, temperature, etc. In this case, considerable
research is committed to find modification methods which can improve the miscibility of polymer

18
blends, called compatibilisation.
1.3.3. Compatibilisation and compatibilizers
Compatibilisation is a process of modification of the interfacial properties in immiscible polymer
blends, which result in: 1) reduction of the interfacial tension between different polymer phases or
domains; 2) stabilisation of the desired morphology against the processing stress and 3) improved
interaction between the phases in the solid state. In other words, compatibilisation results in the
formation of a polymer alloy which has a well dispersed, stable appearance (41).
Compatibilisation can be accomplished by physical or chemical means. In the former case the desired
level of dispersion is generated by physical means, then physically stabilised (e.g. by quenching,
irradiation crosslinking or co-crystallisation). However, in this mémoire we will focus on the chemical
compatibilisation process, where the morphology not only depends on the level of mechanical mixing,
but to a great extent, it is controlled by the crosslinking process and use of a compatibilizer (42).
Figure 8. A-B block polymer works as a compatibilizer to improve interfacial adhesion
Compatibilizers in polymer blends are used to promote interfacial adhesion between pairs of polymers
that are otherwise immiscible. They are usually block copolymers, each of the blocks being compatible

19
with one of the phases. These molecules tend to concentrate at the interfaces and stabilize them thus
allowing finer dispersion of mutually incompatible pairs. As shown in Figure 8(a), A-B polymer blend
is immiscible in the micro-scale. In Figure 8 (b), as an A-B block-polymer compatibilizer which is
compatible with both of the phases is used to improve the interaction between phase A and B.
Therefore, the polymer blend becomes more stable and the dimension of the dispersion domain (phase
B) becomes smaller (Figure 9).
Figure 9. Normal polymer blend (a); polymer blend modified by compatibilizer (b)
1.4. Surface wettability
In everyday life, people usually apply some liquids such as water, alcohol or solvents to help in the
cleaning process. The reason is that some liquids have higher affinityto the inorganic particles (water,
alcohol, etc.) or to organic (petrol, etc.) soil particles, than to the solid surface; the strong
liquid-particle interaction thus helps to remove the particles away from the surface,. Therefore, the role
of surface wettability in surface cleaning process should be important and should be examined
thouroughly. In this section, we introduce the external manifestations of surface wettability which is
named surface water contact angle (WCA) and its application in the development of self-cleaning
surfaces.

20
1.4.1. Surface water contact angle
Wettability of solid surfaces has been studied for a very long time. The first fundamental equation that
quantified the static contact angle of a liquid droplet on a flat surface was proposed by Young in 1805.
Figure 10. Static contact angle of liquid droplet on smooth solid surface
In Figure 1, the droplets form a three-phase contact line where solid-liquid, solid-vapor, and
liquid-vapor interfaces meet. Forces created by the surface tensions at each interface are pulling the
droplet along the solid plane and define its shape.
Young‘s equation: (1.6)
According to the Young‘s equation (1.6), the cosine of the WCA in the equilibrium state (θY) is
directly proportional to the difference of the interfacial forces per unit length of solid– vapor (γSV) and
solid–liquid interfaces (γSL), and inversely proportional to the interfacial force of the liquid–vapor (γLV)
interface (43). When the contact angle for liquid is higher than 20 degrees, it can be assumed that
γSV γS and γLV γL (44). The static WCA of a smooth surface produced from the material with the
lowest surface tension (energy) can reach only 119° (45).
1.4.2. Surface water contact angle (WCA) on rough surfaces
Through investigation of the water resistance of textile surfaces, Wenzel found that the roughness of a
surface can significantly change the static WCA on such a surface. Wenzel‘s assumption is also called

21
homogeneous wetting as shown in Figure 11 (a). Based on this assumption, the author derived an
equation that relates surface roughness (r) and Young‘s contact angle (θY) to the actual WCA on a
rough surface (θW) (46).
Wenzel‘s model: (1.7)
The roughness factor (r) is the ratio of the water–solid contact area to the area of geometrical
projection of water–solid interface. As a result, we always have (r)>1 and for hydrophobic surfaces
there is θw > θY > 90°, on the contrary for hydrophilic surfaces, there is θw < θY < 90°.
Figure 11. Static contact angle of water droplet on rough surface: (a) Wenzel‘s model. (b) Cassie‘s
model
On the other hand, Cassie and Baxter proposed another model to explain the effect of roughness on
droplet behavior on a surface. In contrast to Wenzel, they assumed heterogeneous wetting when air is
entrapped by water in surface cavities as shown in Figure 11 (b). In such a case, the contact area
between water and the solid is minimized, and the area between water and air is maximized, thus
forcing water to form spherical droplets. In addition, roughness of wet areas also influences the contact
angle, and in general, Cassie‘s equation can be described as follows:
Cassie‘s model: (1.8)

22
Where (f) is the ratio of the solid–liquid contact area to the area of geometrical projection of water
droplet. It is necessary to note that the wetting regime that yields the lowest contact angle is the more
stable one from a thermodynamic point of view, since the Gibbs energy turns out to be a
monotonically increasing function of the contact angle. In Cassie‘s model, when f decreases due to an
increase in roughness (more air is trapped), the WCA increases. Wenzel‘s and Cassie‘s models give a
fundamental explanation of how a static WCA can be increased with the help of surface roughness.
For further reflection, Cassie‘s model could be regarded as a phase transition in the surface system of
Wenzel‘s model. Generally speaking, in Wenzel‘s model the WCA will increase proportionately with
increasing roughness (47). However, when the surface micro-structure reaches a certain shape (certain
rougness) (48), e.g. the distance between the peak (on surface) or diameter of holes is small enough,
then the water is no longer able to enter into the valleys. Then the system immediately translates into
Cassie‘s model and leads to a change of the WCA.
1.4.3. Lotus effect and superhydrophobic self-cleaning effect
Lotus leaves are one of the most famous examples of naturally occurring superhydrophobic surfaces.
The microstructure of a lotus leaf obtained by Barthlott and Neihuis are shown in Figure 12 (right).
The WCA of a lotus leaf is 161° with WCA hysteresis of 2°. As a result, water droplets roll off the leaf
while collecting the contaminants; this is dubbed as the ‗‗lotus effect‘‘ as shown in Figure 12 (left).

23
Figure 12. Lotus effect (left) and a microscopic SEM image of a lotus leaf (right)
Generally, ―easy to roll‖ property of the water droplet could be interpreted as a minimisation of
the solid-liquid interface due to a reduced interaction between them. For a drop of water rolling
off a lotus leaf, the droplet behaves as an elastic ball, rather than as a fluid (Figure 13).
Figure 13. Slip of a water droplet from an inclined hydrophobic surface (left) and an inclined
superhydrophobic surface (right)
In case of a normal hydrophobic surface, because of the nonslip boundary condition, the water
drop falls across the dirt particles and the dirt particles are mainly displaced to the sides of the
droplet and re-deposited behind the droplet. Especially hydrophobic particles tend to remain on
such surfaces (Figure 13, left). In the case of water repellent rough surfaces, the solid-water
interface is minimized. Water forms a spherical droplet, and collects the particles from the surface
(Figure 13, right). The lotus leaf therefore always exhibits a very low degree of contamination:
this is clearly self-cleaning (49).

24
1.4.4. Limitation and inspiration from superhydrophobic self-cleaning model.
The superhydrophobicity is determined by the surface micro-surface structure. Generally, this
kind of self-cleaning structure is difficult to prepare but easy to destroy. In the world, there are
many kinds of self-cleaning coating for commercial purposes, but most of them have some
shortcomings such as poor wear resistance, short life and they are generally expensive.
Thus some limitations of superhydrophobic self-cleaning technology are summarized as flows:
Self-cleaning surfaces are more suitable for collision-free use (surface structure is
easy to wear under frequent collision), that is why those self-cleaning coatings can
often be applied to glass or painted surfaces.
Self-cleaning surfaces are too expensive to be applied on large area (e.g. floor
surface). The most common silicone resin or fluorocarbon based coating do not
come cheap.
Artificial superhydrophobic structure can‘t be applied to a soft surface. The
deformation of a soft surface will lead to the destruction of the micro-structure.
The soil particle‘s size must be bigger than the smallest gap in the surface structure.
In Cassie‘s model, if the soil particles of small size can enter the gaps in the surface
structure, than they could not be removed by water (Figure 14).
Figure 14. Small soil particles can‘t be removed by water on superhydrophobic surfaces

25
The discussion above illustrates the difficulty and complexity in the application of self-cleaning
technology in our daily life. Normal material surfaces, which are neither superhydrophilic nor
superhydrophobic, can be considered as a complex system which may include both Wenzel and
Cassie‘s model. For this reason, once we discuss the influence of wettability on cleanability, we
have to consider simultaneously the effect of surface topography.
1.5. Surface topography
As mentioned above, surface topography may play an important role in the surface wettability and the
surface cleaning property. In this section, the basic concept of surface topography and surface
roughness will be introduced, and some commonly used characterization methods will also be
presented to guide further insight. Some important parameters which are used to evaluate surface
roughness will be introduced, and their influence to surface cleaning will be summarized from the
literature.
1.5.1. Surface roughness and its evaluation
Surface topography includes roughness (nano- and micro-), waviness (macroroughness), lay and flaws.
The symbol Ra (or Sa) is used both for nano- and microroughness and for waviness (or
macroroughness). This is usually determined by the production method used. On the other hand, there
are unintentional irregularities that do not occur in any consistent pattern and include scratches, dents,
cracks etc. (50). Several techniques have been developed to quantify the topography of surfaces such
as atomic force microscopy (AFM), scanning electron microscopy (SEM) and contact- or
noncontact-profilometry (Table 1).

26
Table 1. Characteristics of different surface roughness measurement techniques (by R.Kuisma et
al.).
The most important factor in the analysis of surface topography is the evaluation of surface roughness.
Various surface roughness parameters can be generated from a surface profile to represent its
geometrical characteristics. The most commonly used surface roughness parameters are defined below.
Ra (or Sa) is the arithmetical average of surface heights (peaks), also known as the centre line average
of surface heights (yi), and can be calculated as
(1.9)
Rq (or Sq) is defined as the root mean square of surface heights, i.e.
(1.10)
Rku is a measure of the spikiness of the statistical distribution.
Rsk provides information about the symmetry of the amplitude function.

27
1.5.2. Analysis for selection of parameters
For the purpose of industrial applications, SEM and AFM instrument were rarely used to evaluate
surface roughness. For SEM method, the interpretation of the images is not necessarily straightforward
and does not readily yield quantitative data about the height or depth of surface features. AFM is
relatively high resolution but is difficult to use to evaluate large surface area. As a result, profilometry,
especially optical profilometry, becomes the more commonly used method. Several parameters can be
determined by measuring surface profile such as Ra, Rq etc. Before they are applied in further
investigation, they need to be evaluated as to their influence on surface cleanability.
R. Kuisma et al. have used a profilometer to investigate the surface cleanability on flooring material.
They chose ten light-coloured commercial plastic floor coverings and some prepared materials with a
designed surface topography (Figure 15). These materials were soiled with different types of soils,
such as particle, oil soil, blood soil, etc., for each of which specific soiling methods were used.
Figure 15. Designed surface with controlled roughness (by R. Kuisma et al.)
The results are shown in Figure 16. The cleanability increases with a decrease of parameter Ra and Rq.
A lower value of Ra and Rq shows that the surface is less rough, meaning there should be less small

28
surface defects such as small cracks and gaps that may contain hard to remove soil. Therefore, it can
be said that the smoother the surface, the easier it is to clean. But we can‘t observe such a tendency
from the variation of Rsk and Rku parameters. As shown in Figure 16 with the thick solid line and the
dashed line, even though the materials‘ Rsk and Rku parameters are unchanging, its cleanability
changed a lot. Therefore, the further research in this mémoire will focus on the Ra parameter.
Figure 16. Cleanability variation with the different surface roughness parameters (R.Kuisma et
al.)
However, there are also some limitations in using roughness parameters to evaluate the surface
cleanability. As mentioned above, the definition of Ra (or Sa) is the arithmetical average of surface
heights (peaks, valleys). As a result, the following two surfaces (Figure 17) have same Ra, but
obviously the cleanability can be expected to be different. However, to date, there isn‘t a better method
to evaluate the surface roughness and the vast majority of surfaces can still be adequately characterized
by profile measurement.
Figure 17. Two surfaces with same Ra (Sa) but different structure
29
CHAPTER 2. EXPERIMENTAL
In this chapter, the materials and chemical products used in the project will be introduced. The main
functions of the equipment and characterization instruments use will be described; sample preparation
and experiment procedure will also be presented. In addition, the method used to evaluate the surface
cleanability, simplified by our group, will be described in detail in this chapter.
2.1. Polymer materials and products used in the project
All the polymer composite samples used in our project are prepared either in the university
laboratories, or in the industrial laboratory. The samples may be composed of the polymer matrix,
different fillers and various chemical additives such as the curing agent. The concentration of each
component in the composite will be expressed in phr (per hundred resin), which means the weight of
product / 100g of total polymer in the mixture.
2.1.1. Polymer
In order to find some general relations between polymer chemistry and polymer surface properties, 43
polymers/co-polymers in the family of thermoplastic (TP), elastomer (E) and thermoplastic-elastomer
(TPE) were chosen to do the soiling-cleaning test. All the following materials are used in CHAPTER 3
to investigate the influence of different factors on surface cleanability in single-polymer systems (the
number in the parentheses represents the number of different polymers tested in this category):
PE (4), PP, PS, PMMA (2), PLA (3), P(E/O) (4), P(P/E), EPDM (3), P(E/MeA) (2), P(E/VAc) (2),
P(E/VOH)), NBR, SBR, HSBR, SEBS, ABS, P(E/MAA), P(E/MAA/BuA), i-(E/MAA) (3),
i-(E/MAA/BuMA), PTE. POM, PA (2), PPS, PBT, TPU, LDPE+Scilicon Rubber.

30
Selected materials were used in CHAPTER 4 to manufacture polymer blends based on the results
obtained in CHAPTER 3 (Table 2).

31
Table 2. Structure and abbreviation of the more significant materials of this study.
Name Structure Abbreviation Source
Polyethylene
PE ExxonMobil
Poly (ethylene-co-octene)
E/O(x/y) Engage®, Dow
Chemical
Poly (ethylene-co- methyl acrylate)
E/MeA(x/y) Elvaloy®, Dupont
Poly (ethylene-co-metal neutralized methacrylic acid)
E/MAA(M+) BuMA/
(x/y/z)
Surlyn®, Dupont
Acrylonitrile-butadiene-styrene copolymer
ABS(x/y/z) CycolacTM
, SABIC
Ethylene-propylene-diene-terpolymer rubber
EPDM Nordel®, Dow
Chemical

32
Name Structure Abbreviation Source
Styrene Butadiene Rubber
SBR Buna®, Dow
Chemical
Poly (ethylene-co- vinyl acetate)
E/Vac
(x/y)
Levapren®,
ARLANXEO
In Table 2, the letter x, y and z represent the weight percentage of each monomer.

33
2.1.2. Chemical product
Chemical products used in this project include two types. One is the curing agent tert-butyl
peroxybenzoate, produced by Akzonobel; its structure is illustrated in Figure 18.
Figure 18. The structure of organic peroxide curing agent
Another type of chemical product is the liquid cleaning agent, such as deionized water, ethanol and
ethylene glycol. These products have different surface tension. The purpose of using such a group of
liquids as cleaning agent is to investigate the influence of wettability on surface cleanability. Their
surface tension is shown in Table 3.
Table 3. Cleaning agents with different surface tension.
Producer Name Surface tesion (mN/m)
n.a Water 72.7
Anachemia Ethylene glycol 48.4
GreenField Ethanol 22.3
2.2. Sample preparation and related equipment
All the samples discussed in the following sections were prepared in the laboratories of Pr. Carmel
Jolicoeur and Pr. Michel Huneault, or at American Biltrite Canada in Sherbrooke. The samples consist
of single-polymers, polymer blends and crosslinked (cured) polymeric materials. In the preparation

34
process, a mixer (HAAKE) is used to mix polymer blends and composite materials, and a hydraulic
press is used for compression molding.
2.2.1. HAAKE Rheomix Lab mixer and mixing process
HAAKE Rheomix Lab Mixers (Figure 19) is a torque rheometer used to test highly viscous substances
such as polymers, elastomers and composites. This mixer is controlled using the HAAKE PolyLab OS
System. All of the blended samples were prepared in this mixer giving ~50 ml samples.
Figure 19. HAAKE™ Rheomix Lab Mixers
As shown in Figure 20, a typical mixing test is run at a constant speed (shear rate) and the material's
response is recorded as torque. The temperature of the mixing chamber is temperature-controlled but
due to melting and to the frictional heat in the mixing chambe, the sample‘s temperature changes over
time. This ―Rheogram‖ (torque, melt temperature vs. time at constant speed) is characteristic for
different materials or blends and can often be used to verify the quality of the material.

35
Figure 20. The mixing chamber of HAAKE Rheomix Lab Mixers (left); typical
Torque-Temperature graph obtained from mixing process (right)
Operation method
1. Turn on the HAAKE Rheomix Lab Mixer
2. Turn on the HAAKE PolyLab OS System in the computer; the software will connect to the
mixer automatically.
3. Set the initial temperature of mixer. Usually it should be above the melting temperature of
each of the polymer components. In most cases, the initial temperature was set to 160℃.
4. Create a new test file and click ―calibration‖ button to return the torque detector to zero.
5. Pour the materials (polymer, fillers, curing agent, etc.) into the chamber and start the test,
close the chamber when the feeding is finished.
6. Wait until the torque data stabilises. As shown in Figure20 (right), torque is almost stable after
the dashed line. The total test time is usually 6minutes.
7. Stop the equipment and remove the mixed sample as soon as possible, if not, when the
temperature decreases to below its Tm, the polymer hardens quickly.

36
2.2.2. Grinder
The polymer blend or composite produced in the HAAKE mixer is a solid block that is hard to use. To
enable further processing and testing, the polymer block is broken into small granular particles with a
size around 3mm diameter with an Allen-Bradley grinder (Figure 21).
Figure 21. Allen-Bradley grinder
2.2.3. Hydraulic press
Figure 22. Hydraulic press machine
Test strips were prepared using a Carver hydraulic press equipped with heated platens (Figure 22).

37
Figure 23 shows the mold which is used to prepare the polymer or composite sample strips. It is made
from stainless steel and its external dimension is 18cm*18cm; internal dimension is 1.5cm*15cm for
each cavity.
Figure 23. Mold for compression molding (left); filling of the mold with sample particles (right)
Operation protocol
Turn on the hydraulic press.
1. Set the temperature to 180℃.
2. Preheat the mold during the heating process.
3. Fill the mold with polymer granules.
4. Put the filled mold into the hydraulic press and set the timer going
5. At 4 minutes, increase the pressure gradually within 1 minute until it reaches 5000 lbs
6. At 5 minutes, turn the pressure valve to release the pressure.
7. At 5 min. 30 sec, gradually increase the pressure to 10,000 lbs within 1min.
8. At 6 min 30 sec, release the pressure again.
9. From7 minutes to 8 minutes, gradually increase the pressure again to 10,000 lbs.
10. Keep the pressure for 2 mins
11. At 10 minutes, while keeping the pressure at 10 000 lbs, turn off the heating system and turn

38
on the cooling water, wait until 17 minutes.
12. After 17 minutes, release the pressure and take out the mold.
13. Remove the sample from the mold and wash.
2.3. Procedure for the cleanability test
This experiment is performed on the sample strips as prepared by the mixing and pressing process
described above. Various soiling agent formulations have been found in literature, but no systematic
data was available for general polymer systems. In order to simplify the soiling/cleaning system under
further study, the research team finally chose two kinds of particle soil agents to represent inorganic
and organic soil (Table 4), they are Red-Iron Oxide (RIO) and Carbon black (CB).
Table 4. List and information of the powders used as soil agent
Particles Chemical name Type Cat# Size Code
Red Iron Oxide Fe2O3 Inorganic
Hydrophilic
Red 403 80~200nm RIO
Carbon black C Organic
Hydrophobic
Black raven
1020
~100nm CB
2.3.1. Preparation of samples for the cleanability test
The reference and samples were prepared as follows:
1. Clean the surface with ethanol and then with water.
2. Dry in the oven at 60℃ for 1h.
3. Store in a box to protect from dust.

39
2.3.2. Protocol for evaluation of soiling and cleaning
Soling:
1. Covering one end of the sample with tape to preserve the original appearance.
2. Dip the applicator (felt tip pencil eraser) in the soiling agent.
3. Rub the surface with light pressure in a circular motion for 50 seconds.
4. Leave to react for 30min
Dry cleaning
1. Take a glass slide to cover and protect the two-thirds of the sample surface.
2. On the unprotected side of the sample strip, scrub the surface gently with a circular motion
with rough paper until no more soiling agent is removed.
Wet cleaning
1. On the opposite end of the sample from Dry cleaning, perform wet cleaning.
2. Clean similarly as dry, using a water water-saturated paper.
3. The middle of the sample strip is untouched and designated as "soiled" (Figure 24).
Figure 24. Soiling test (left) and finished sample (right)
2.3.3. Evaluation of cleanability
Several attempts were reported in the literature to evaluate the extent of soiling and surface
cleanability, usually through visual assessment, or using a colorimeter. The use of a colorimeter for
Original
Wet cleaned
Soiled
Dry cleaned

40
this purpose is interesting in that it can provide quantitative data; however, the accuracy of the results
will be affected by changes in the color of the material (background). In this project we devised a
visual color assessment protocol using fixed reference colored samples.
First, a 5-level color reference was made by the standard soiling process described above. In Figure 25,
we illustrate the reference color materials made with both RIO and BC soiling agents to which
different color intensity codes were assigned on a 1 to 5 scale; code 1 represents the clean surface,
while code 5 represents a maximum soiled surface. Often, the observed sample colors were found to
lie between integer reference codes and could be differentiated: for example if it is between code 3 and
4, then they will be identified by 3.25 (close to 3), 3.5 (in middle) and 3.75 (close to 4). All the
evaluations have been repeated by different operators (usually 4 to 5 times) in order to achieve reliable
results.
Figure 25. Reference 5-level color intensity codes
To facilitate data classification and analysis, we defined a simple color representation
corresponding to different ranges of color intensity observations; This representation is illustrated
in (
Table 5).

41
Table 5. Color intensity code for soiling and cleaning evaluation
Range of color code for soiling part:
Range of color code for cleaning part:
2.4. Characterisation
To investigate the potential relations between surface properties and cleanability, several instruments
have been applied to characterize the general physical and chemical properties of the different
materials. These include contact angle, surface topography (surface profile), surface hardness,
thermo-properties and morphology.
2.4.1. Test of surface water contact angle
The device used for the contact angle test is the First Ten Armstrong, model FTA200 (Figure 26). The
instrument consists of a camera connected to a computer and a syringe pump to apply the drop of
solvent to the surface. The camera captures the image of the droplet on the surface and the software is
used to analyse the drop‘s size and shape in order to determine the contact angle.
Figure 26. First Ten Armstrong (FTA200) contact angle analyzer

42
Operation method for static contact angle test.
1. Fill the pump controlled syringe with deionized water (or selected
solvent).
2. Turn on the device, the software will connect to the camera automatically.
3. Put a sample on the sample stage and modify its height until its surface is
visible in the video screen.
4. Pump out the water slowly until a complete droplet falls onto the surface.
5. Wait for 20 seconds and take a picture of the droplet on the surface.
6. Analyze the contact angle on droplet picture
Analysis
For typical static contact angle picture, the droplet hemisphere usually occupies 2/5-3/5 of the width of
the image. As shown in Figure 27, the water droplet hemisphere located in the middle of the image, its
base-line (blue line); as automatic detection is often faulty, the baseline is selected by taking the two
most distant points of the contact line between liquid and surface.
Figure 27. Image of the hemisphere droplet for contact angle test
In this step, pay attention to distinguish the droplet and its reflection. After selection of the base-line,
select 5 points on each side of the contour of spherical droplets, close to end of base-line, to represent
Contact angle

43
the outline of the droplets (yellow curves). The contact angle (the inside angle between the blue and
red lines) is calculated by the software based on the base-line selection and contour points.
2.4.2. Test of surface topography
A surface, regardless of its manufacturing process, is not perfectly smooth, and its roughness depends
on the preparation method and tools used, but also on the composition of the material; the magnitude
of the surface irregularities (surface defects) is often referred to as roughness. In order to investigate
this parameter, a profilometer (3D optical microscope) was used in this project.
The profilometer produced by Bruker company, model Contour GT (Figure 28) was used to measure
the roughness of the polymer material surface. It is a non-contact profilometer based on visible light
interference technique, so it does not touch the surface and does not scratch the surface as may happen
with a contact profilometer. The profilometer has 5X, 20X, 50X objectives to meet different surface
resolution levels requested; in this project we used the 5X lens to measure surface roughness parameter
Sa (Ra).
Figure 28. Non-contact profilometer (3D optical microscope) Bruker Contour GT

44
2.4.3. Surface hardness
Hardness is a measure of how resistant a sample is to indentation when a compressive force is applied
in a highly localized area of the sample. For polymer composite material (i.e. used as a flooring), the
resistance to indentation, especially permanent indentation, is a key property.
Indentation hardness measures the resistance of a sample to material deformation due to a constant
compression load from a sharp object; they are primarily used in polymer engineering and metallurgy
fields. Common indentation hardness scales are Rockwell, Vickers, Shore, and Brinell. Shore hardness
which are widely used in polymer industry will be investigated in this mémoire.
Shore hardness comes in many scales in order to determine the hardness of various materials. Two
types of durometers were used in this study: type A for softer materials and type D for harder materials.
The method permits measurement of the initial indentation, the indentation after a specified period of
time, or both (51). The indentation hardness is inversely related to the penetration and is dependent on
the modulus of elasticity and the viscoelastic properties of the material. The Shore durometer (Figure
29) consists of an indenter, a graduated scale and a calibrated spring that applies the force to the
indenter.
Figure 29. Shore A durometer

45
The difference between the type A and type D durometer is in the shape of the indenter and the
calibrated spring (Figure 30).
Figure 30. Shore hardness measurement (left); Type A and type D indenter (right)
Operation method
The units of hardness range from 0 for the full extension of 2.50 mm, to 100 for no penetration. The
force is applied as rapidly as possible, without an impact schock, and the hardness reading made
within 1 s of the force application. As some of the samples are too soft and too thin, even using Shore
A; the indenter could go through the sample. In such cases, we need to stack several samples until the
thickness is enough to perform the indentation test.
2.4.4 Differential scanning calorimetry (DSC)
Differential scanning calorimetry or DSC is a thermoanalytical technique used to find phase changes
in a material by measuring the amount of heat required to increase the temperature of a sample. This is
usually compared to a reference sample and is measured as a function of temperature.
In a DSC experiment, the sample and a reference are heated and then cooled down according to a

46
temperature programme. The sample and reference are maintained at the same temperature during the
whole experiment. When a thermal event occurs in the sample, an additional amount of energy has to
be supplied to, or withdrawn from, the sample to maintain zero temperature difference between the
sample and the reference. Therefore, it is important that the reference does not undergo any changes
within the temperature range of the experiment (52). The sample and reference are placed in identical
environments – metal pans on individual bases, each of which contains a platinum resistance (Figure
31).
Figure 31. DSC experimental setup
Any transition occurring in the sample is reflected by a change in specific heat which produces a
variation in the power signal. This signal is then plotted as heat flux versus temperature. There are two
different conventions: exothermic reactions in the sample are shown as either a positive or negative
peak (depending on the kind of technology used in the experiment); the experiments presented in this
mémoire are shown with exothermic up (positive). A typical DSC curve, shown in Figure 32, usually
includes a glass transition (Tg), cristalisation (Tc) and melting (Tm) information.

47
Figure 32. Typical DSC curve
Operation method
In order to measure the Tg of the polymer material, 10-20 mg is the best range for weight of the
sample. The sample will be contained in an aluminum pan and well closed by a press device. An
empty aluminum pan is used as a reference. The test programme is set as follows.
1. Jump to T1 (low)
2. Equilibrate at T1
3. Ramp 10.00℃/min to T2 (high)
4. Isothermal for 1.00min
5. Ramp 10.00℃/min to T1
6. Mark end of cycle 1
7. Equilibrate at T1
8. Ramp 10.00℃/min to T2
9. Isothermal for 1.00min
10. Ramp 10.00℃/min to T1
11. Mark end of cycle 2
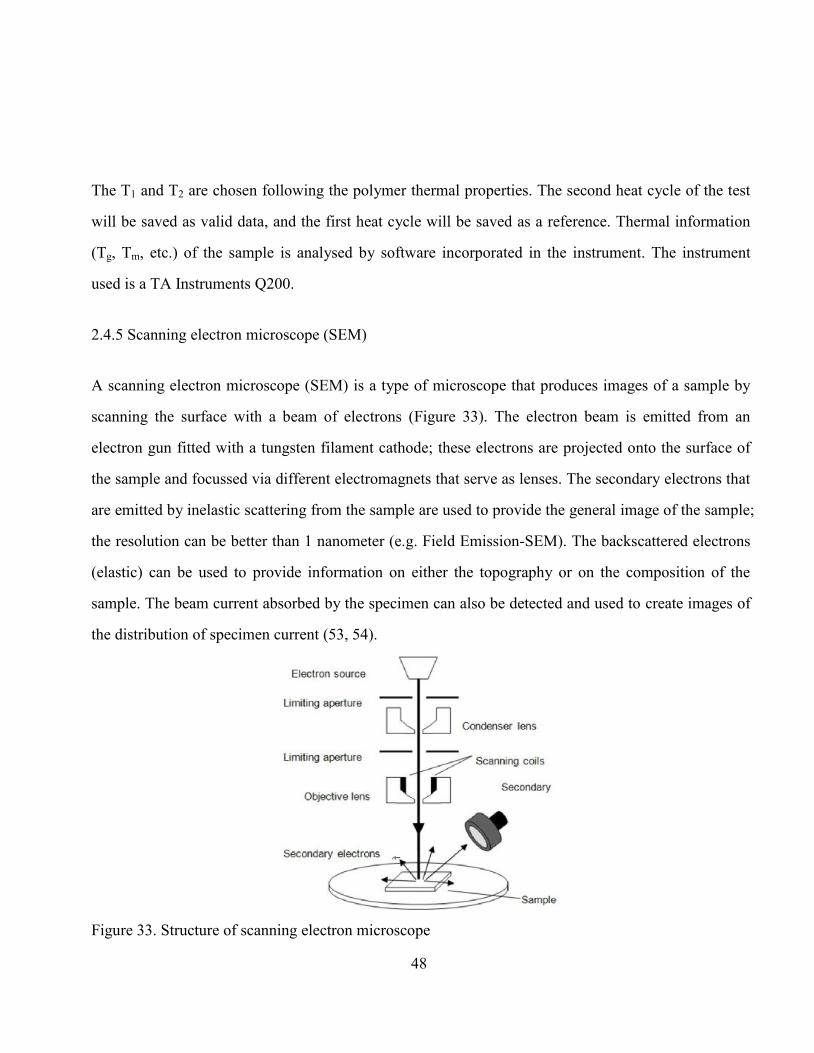
48
The T1 and T2 are chosen following the polymer thermal properties. The second heat cycle of the test
will be saved as valid data, and the first heat cycle will be saved as a reference. Thermal information
(Tg, Tm, etc.) of the sample is analysed by software incorporated in the instrument. The instrument
used is a TA Instruments Q200.
2.4.5 Scanning electron microscope (SEM)
A scanning electron microscope (SEM) is a type of microscope that produces images of a sample by
scanning the surface with a beam of electrons (Figure 33). The electron beam is emitted from an
electron gun fitted with a tungsten filament cathode; these electrons are projected onto the surface of
the sample and focussed via different electromagnets that serve as lenses. The secondary electrons that
are emitted by inelastic scattering from the sample are used to provide the general image of the sample;
the resolution can be better than 1 nanometer (e.g. Field Emission-SEM). The backscattered electrons
(elastic) can be used to provide information on either the topography or on the composition of the
sample. The beam current absorbed by the specimen can also be detected and used to create images of
the distribution of specimen current (53, 54).
Figure 33. Structure of scanning electron microscope

49
For conventional imaging in the SEM, specimens must be electrically conductive, at least on the
surface, and electrically grounded to prevent the accumulation of electrostatic charge at the surface.
Polymer samples are therefore usually coated with an ultrathin coating of electrically conducting
material, deposited on the sample by high-vacuum evaporation. Most used conductive materials for
specimen coating include gold, gold/palladium alloy, platinum, in this project we used platinum.
The SEM used in this study was a Hitachi Model S-3400 variable pressure SEM equipped with an
Energy Dispersive Spectroscopy (EDS) detector, Oxford Inca, for the semi-quantitative analysis of the
composition of the sample.
Operation method:
1. Polymer materials are immersed in liquid nitrogen for several minutes and broke by tweezers.
2. Fix the samples on the sample stage and keep the fracture surface facing up.
3. Coat the surface with platinum with the high-vacuum evaporation method.
4. Place the sample into the observation chamber of the SEM and evacuate the observation
chamber.
5. Find the sample by using a low magnification.
6. Use high magnification to observe the fracture surface.
7. Take photo and save.
50
CHAPTER 3. CLEANABILITY IN SINGLE POLYMER SYSTEMS -
ESTABLISHING A SURFACE CLEANING MODEL
A relatively small number of papers have been published on surface cleanability in polymer/polymer
composite systems. In addition, most of the results reported were focused on Polyvinyl chloride (PVC)
material, because PVC was the most widely used flooring material. With the surprising development
of other polymer flooring material such as thermoplastic and rubber, many new polymer/polymer
composites were developed to replace PVC. This trend was generated by what is considered to be its
poor resistance to heat. In fact, when PVC gets heated it becomes chemically active and may release
chlorine compounds, which are highly toxic. With the emergence of modern high-rise building, fire
resistance becomes a more and more important property for construction materials (55).
Numerous new materials were developed, such as rubber-based flooring materials. Rubber has a
variety of inherent advantages that have made it an extremely popular flooring choice. With a high
resistance to chemical products and low residual chemical additives, this material is finding its way
into residential interior and exterior applications. However, compared to natural material floor (wood,
marble and granite) and PVC-based materials, its problem of surface cleanability is quite obvious.
Most rubber materials are soft, non-wettable and have a high surface friction coefficient, so that, they
are usually difficult to clean through usual cleaning methods.
Various factors discussed in CHAPTER1 have an influence on surface cleanability. Wettability,
topography, hardness etc. all contribute, and these factors are not independent; the cleanability is a
complex property resulting from the interplay of different factors or properties. In order to evaluate
their effect on surface cleanability, each of these properties will be analysed in single-polymer systems.
To this purpose, a large variety of polymers including thermoplastics, elastomers and

51
thermoplastic-elastomers were chosen for this part of the study. The polymers selected include the
most popular polymers in the composite industry (especially flooring materials industry).The
experimental results obtained with this group of polymers should be representative, allow reliable
trends to be identified; the latter should help the material selection for industrial formulations. As the
influence of the different properties was determined, we look forward to establishing a general surface
cleaning model which can explain the mechanism of the soiling/cleaning process.
3.1. Sample preparation and experiment
As indicated above, 43 polymers/co-polymers in the family of thermoplastic (TP), elastomer (E) and
thermoplastic elastomer (TPE) were chosen to perform the soiling-cleaning test in this section with the
two types of soiling agents Fe2O3 (RIO) and Carbon black (CB). Numbers shown in the parentheses
represent the number of different polymers examined in this category. The polymer list is as follows:
PE (4), PP, PS, PMMA (2), PLA (3), P(E/O) (4), P(P/E), EPDM (3), P(E/MeA) (2), P(E/VAc) (2),
P(E/VOH)), NBR, SBR, HSBR, SEBS, ABS, P(E/MAA), P(E/MAA/BuA), i-(E/MAA) (3),
i-(E/MAA/BuMA), PTE. POM, PA (2), PPS, PBT, TPU, LDPE+Scilicon Rubber
All the samples which were used for cleanability, wettability, roughness and hardness tests in this
chapter were molded with hydraulic press. The molding temperature was determined by the melting
point Tm (semi-crystalline material) or Tg (amorphous material). Normally the molding temperature
was 180℃, but for several specific materials such as ABS and PA (Nylon) the molding temperature
was above 250℃, examples shown in Table 6. This temperature selection strategy ensured that the
materials have good fluidity in the mold, and reduced surface defect to the utmost extent. Table 6
shows some typical materials‘ thermal properties.

52
Table 6. List of some typical polymers and their thermal properties
product Name Tg Tm
Nordel EPDM -50℃ 43℃
Surlyn E-ran-MAA(Zn)-ran-BuMA - 81℃
Bynel E/MAA/BuA - 91℃
Engage E/O -32℃ 104℃
Durethan PA6 - 222℃
Plexi PMMA 98.3℃ -
All the samples were pressed between two teflon (Polytetrafluoroethene) sheets to prevent sticking of
the polymers onto the steel surface of the mold. The surface of the polymer samples were cleaned by
ethanol and water, and heated in oven under 60℃ for 1h, then soiled with Fe2O3 or carbon black.
Finally, they were cleaned through the dry and wet cleaning protocols as described in CHAPTER 2.
This experiment was usually repeated three times by different people in the group, and the average of
the cleanability data is reported for Soil (S), Dry clean (DC), Wet clean (WC).
The water contact angle (CA), roughness and surface hardness were measured on the initial surface of
the samples which were cleaned by ethanol and water. Five repeated test points for CA and roughness;
three test points for hardness were taken respectively for these two measurements. The results retained
were the average of the individual data points. The detailed materials and their results on cleanability
(before or after crosslinking), contact angle, roughness and hardness (before or after crosslinking) are
presented in Annex 1.1.
3.2. Influence of surface wettability
As discussed earlier, it is generally acknowledged that surface wettability has a great influence on the

53
cleanability. Superhydrophobic self-cleaning is a good example, but this approach is limited by its
inconvenience on fabrication and maintenance. The surface wettability of common polymer materials
is usually non-superhydrophobic and non-superhydrophilic. In this section, dozens of polymer samples
will be prepared with the compression molding device and conditions mentioned in section 3.1 in
order to obtain a surface with similar topography (roughness).
The results show considerable variation among the different types of polymers and an important
scattering. In order to elucidate some general tendencies between the material properties and surface
cleanability, the polymers were first classified into two major categories: hard polymers (Shore A
hardness higher than 70) and soft polymers (Shore A hardness lower than 70). The polymer samples
were further separated into five types according to their CA data: CA>95°, 95°>CA>90°, 90°>CA>85°,
85°>CA>80° and CA<80°. For comparison purposes, the cleanability data were then averaged over the
subgroups, as relevant (Annex 2.1).
Figure 34. Cleanability of hard polymers classified by CA (Left) and the corresponding data
(right)
Figure 34 left is a trend chart of cleanability vs CA; as shown by the data table to the right, the blue,
red and green columns correspond respectively to wet cleaning, soiling and dry cleaning parts.
According to Figure 34 left, all the peak value of S, DC and WC appeared when CA is between 90°
CA Wet clean Soil Dry Clean
95+ 2.6 4.9 3.3
90-94 3.7 5 3.7
85-89 2.6 4.7 2.7
80-84 2.2 4.2 2.3
80- 1.7 4.4 1.8

54
and 94°; this means that when the surface CA is in this range, the surface has the worst cleanability.
As the contact angle decreases, the surface wet and dry cleaning properties improved significantly.
The main reason is that a low CA represents a surface that is more hydrophilic, this would mean that
the surface has a better wettability, thus more defect points (such as crack and holes) can be wetted and
cleaned by water.
We also found that, when the CA is higher than 95°, the cleanability is improved slightly too. The
possible reason is that there may exist an effect as suggested by Cassie‘s model resulting in less
surface-soil interaction (as the self-clean effect mentioned above). The trends observed within a group
of hard polymers (the simplest system related to polymer composites) strongly indicates that when the
surface is more hydrophilic, it has a better cleanability.
Figure 35. Cleanability of soft polymers classified by CA
In the case of soft polymers, a slight trend is also observed between average cleanability and average
CA values; however, the results are less regular. This is easy to understand as the surface structure of
soft material is easily altered from the application of external forces, such as pressure and frictional

55
force on the surface, during the soiling and cleaning processes. The surface deformation can create
depressions which can trap the soil particles, thus reducing apparent cleanability. Still, overall, as
shown in Figure 35, the surface with lower CA also has a slightly better cleanability.
The results obtained with carbon black soil particles (not reported here) show similar trends to those
observed with the RIO, although les clearly, particularly in the case of wet cleaning. Presumably, this
is because CB is a hydrophobic product which is more difficult to be removed with water.
3.3. Influence of surface roughness
Samples were prepared as in section 3.1, and their surface cleaned by ethanol and water. The surface
roughness of the samples was measured by optical-pofilometer with 5X lens. For each sample, 5 points
were tested and the results noted by averaging. The parameter Sa (Ra) will be used to characterize the
surface roughness. As noted earlier, to help identify significant trends in the results, the polymers were
divided in subgroups according to different ranges of Sa values (Annex 2.2).
Figure 36. Cleanability of polymers having different roughness

56
The data reported in Figure 36, surprisingly shows that the surface roughness does not affect very
much the cleanability, unless the Sa roughness changes by a factor of 4. In order to obtain more
compelling data, we tried to control the surface roughness via the imprinting method. A sample of
P(E/O) (Engage) was imprinted by different glass or papers having known surface roughness; in this
way, we can obtain controlled surface roughness. The cleanability results obtain through this approach
is shown in Table 7.
Table 7. Cleanability test of roughness controlled surface
In Table 7, the first two samples were imprinted by glasses with roughness of 5 and 2μm; the Sa data
shows that their surfaces were well controlled by this printing process, their surface roughness are
4420 and 1950nm respectively. Although there is a difference in Sa of ~2500nm, their surface wet
cleaning results by RIO and CB are very close, and even the surface printed by paper which has a
lower roughness at 1490, gave similar wet cleaning results. The main reason is that the size of soil
particles, around 100nm, is much smaller than the surface roughness. This implies that the surfaces
have many large/deep defects which can trap the soil particles, making them hard to remove by water.
On the contrary, the third sample‘s roughness was controlled to around 100nm, so that there are much
less surface defects present to hide the soil particles. Simultaneously, a small decrease in dry cleaning
data can‘t be ignored. The reason is clear, without the presence of water, there are less places that can
be reached by wipes on a rougher surface. Generally speaking, if the surface is rougher, it should be
Polymer Print model Sa (nm) WC S DC WC S DC
Glass 5µm 4420 3 5 4.7 4 5 4.7
Glass 2µm 1950 2.7 5 4 4 5 4.7
Glass 10nm 100 2 3.7 2 3.3 5 3.3
Paper G10 1490 3 4.3 3.3 4 5 4
RIO BC
P(E/O)

57
more difficult to be cleaned.
The mechanism proposed above relating surface roughness, wettability and surface cleanability is only
infered. In order to get stronger evidence, an experiment was designed as described below.
3.4. Combined effect of surface wettability and roughness
A specific material named high-styrene content SBR (HSR: high Styrene-Butadiene rubber) was
chosen to perform this experiment. It is an amorphous material with hard polymer chain due to its
high-styrene content, making the material rather hard and brittle. As with most other polymer material,
the HSR surface will exhibit some defects, micro-scale holes and crack. According to our experience,
these micro-defects will increase the amount of residual soil particles which cannot be removed by
water. In order to prove the relationship of surface roughness and wettability, three liquids with
different surface tension were used for the cleaning protocol, as identified below.
The surface tension parameters were obtained under ambient temperature and pressure.
Based on the surface cleaning mechanism we proposed, the reason why a more hydrophobic surface is
harder to clean is that the surface micro-defects can protect the soil particles from being washed off
with water. According to the theory of surface wetting, a liquid with a lower surface tension can wet
the smaller sized valleys more effectively than a high surface tension liquid. Ethylene glycol and
ethanol with lower surface tension are used to achieve this goal.
product Surface tension
Water 72.7mN/m
Ethylene glycol 48.4mN/m
Ethanol 22.27mN/m

58
The surface roughness measured by the profilometer was Sa (Ra) = 821nm. Generally, the average
water cleaning code for this roughness region is around 2.75 (Figure 37 a), but for HSR it is around 4
due to the large amount of small defects on the surface. The soiling/cleaning tests were done as
mentioned in section 3.1, but with three kinds of liquid as cleaning agent. The results are shown in
Figure 37 b.
(a) (b)
Figure 37. The SEM of Fe2O3 particles (a); The HSR sample cleaned with 3 types of detergent (b)
According to the SEM image, the diameter of the soil particles (Fe2O3) is around 100nm (Figure 37a).
Several questions can be answered by this result. Firstly, it confirms that the soil particles are able to
enter into the small defects which are widespread on the material surface. Secondly, it can explain why
the cleanability scarcely changed as the roughness decreased from 4500nm to 1000nm but changed a
lot when the surface roughness is reduced to around 100nm (Table 7)
According to Figure 37b, a quite clear tendency could be observed. From the left of the sample to the
right, the sections is increasingly cleaner. Wet cleaning is always better than dry, and the cleaning
agent with the lower surface tension can clean better than that with a higher surface tension. The
corresponding cleanability codes are shown below (Figure 38).

59
Figure 38. Surface cleaned by different clean agents
The cleanability code decreased from 4 (water) to 1.5 (ethanol). This agrees with the interpretation
proposed above: the liquid with lower surface tension can easily enter into the surface defects having a
smaller dimension. On the same basis, for a surface with a given roughness, the more hydrophilic the
polymer material, the easier the surface is to clean, in line with our observations for hard materials.
Hence, for enhanced cleanability, one should aim to make the surface smoother by physical and
chemical means to reduce the occurrence of surface defects. In summary, the surface factors such as
wettability and roughness (even hardness, reinforcement material, etc.) jointly determine their
cleanability, and their combined effects should be considered when attempting to design easily
cleanable polymer composite materials.
3.5. Hardness
The hardness test on the various polymer samples was done using a Shore A durometer. The hardness
data was recorded at 1 second after the durometer had been pressed onto the sample surface. The
cleanability results, averaged over specified hardness domains (Annex 2.3), are shown in Figure 39.

60
Figure 39. Cleanability of polymer with different hardness
As mentioned in section 3.4, the different surface factors influencing cleanability work jointly, and the
specific contribution of each factor is not readily quantified. For the hardness test, it is difficult to
control the other factors and thus avoid their influence. But, a definite trend can still be found in Figure
39; as the hardness decreases the soiling increases and the surface becomes more difficult to clean.
Again, the reason is in its surface structure, which, for soft materials, can be deformed easily. The
surface deformation can prevent the particles from moving by forming ―trap structure‖ (pocket) and
changing their moving direction. These effects will be discussed in section 3.6.
3.6. A surface soiling and cleaning model
In order to simplify discussion of the surface cleaning mechanism introduced above, a schematic
model is proposed for soiling and cleaning, for the case of with the particle-soiling as studied here. The
model can be used to explain the combined effect of wettability, roughness and hardness on
cleanability.

61
3.6.1. Soiling process
The surface of the polymer material is represented by the gray, rough surface illustrated in Figure 40.
The surface has diverse structures such as peaks, plateaus, deep narrow valleys and large shallow
basins. The surface is soiled by particle soiling agents, either by natural deposition, or by being
smearing pressure. The illustration shows that some particles enter into the deep narrow valley
structures, while some are only accumulated on the surface layer. The amount of deeply trapped soil
depends on the average particle size, so that the cleaning strategy should be adapted for different soil
particles, such as normal dust particles or ultrafine carbon particles.
Figure 40. Surface soiling process
3.6.2. Cleaning on hard surfaces
For hard surfaces, the surface structure can resist shear or abrasion forces exerted during the soiling or
cleaning processes, surface deformation can be ignored. As tested, if the Shore A hardness is over 80,
the surface can be considered as a hard surface. On such a surface, the influence of surface wettability
and roughness is readily understood.

62
Figure 41. Dry cleaning (left) and wet cleaning (right)
Generally, the efficiency of dry cleaning is very limited, because of the excessively small contact area
between wipers (cleaning paper or cloth) and the soil particles. The contact area is restricted by the
physical shape of the wipers and of the rough surface; the particles which are situated in deep basins
and narrow valleys will remain largely untouched (Figure 41 left). Certainly, some improvement can
be made by changing the physical shape of the wipers, for instance, a fine brush is able to augment the
contact area by its thin and long bristles, but the effect is still very limited.
In typical floor cleaning operations, water or aqueous solutions will be used. Water is a polar liquid
which can offer a high interfacial energy between the particles and the liquid, especially to polar
(hydrophilic) particles such as Fe2O3 and limestone. With nonpolar (hydrophobic) particles like carbon
black, there are no direct chemical forces such as hydrogen bonds, but water can also offer a good
interaction due to its liquid-solid interfacial area which is larger than the solid-solid interfacial area
between soil and material surface. On the other hand, if the surface is hydrophilic enough, water is
able to penetrate into the small valleys and displace the soil particles (Figure 41 right). Therefore, for
normal surfaces, an improvement in its surface wettability will greatly improve its cleanability;
otherwise, forming a smoother surface with shallow basins and valleys will also lead to significant
cleanability improvement.
In addition, the use of a surfactant will improve the cleaning efficiency. Surfactants are known as

63
compounds that lower the surface tension (or interfacial tension) of a liquid, or the interfacial energy
between two liquids or between a liquid and a solid. Lower surface tension will result in better surface
wettability, and the solution will be able to penetrate into the deepest and most narrow valleys. Thus, it
will exhibit a similar effect as when cleaned by liquid with lower surface tension such as ethylene
glycol and ethanol (Figure 42).
Figure 42. Cleaning with the use of a detergent
3.6.3. Cleaning a soft surface
As noted several times above, surface structure deformation is the main phenomenon limiting the
cleanability of soft materials. As shown in Figure 43, when people try to clean a surface the pressure
applied in the vertical direction is inevitable. The surface deformation occuring under this pressure will
Figure 43. Cleaning a soft surface
make these effects more pronounced further pushing the particles downward into the defects and into
Cleaning direction

64
the surface itself. Furthermore, the surface deformation can also stop the motion of the particles by
forming pockets that entrap them. Based on the results of cleanability test and surface roughness
measurements, we find that the soft materials have a more irregular surface and are harder to clean.
3.7. The influence of polymer crosslinking on cleanability
Cross-linking is used in both synthetic polymer chemistry and is observed in many biological
structures; the term is used to refer to the "linking of polymer chains". When polymer chains are linked
together by cross-links, they lose some of their ability to move as individual polymer chains (Figure
44). Crosslinking is wildly applied in the polymer industry, particularly for the rubber industry, and is
also called ―Vulcanization‖.
Figure 44. Crosslinking in rubber fabrication
Crosslinking forms new chemical bonds between polymer chains; it will definitely affect the material‘s
physical properties. Among these effects, we expect to see an improvement on hardness, surface
density (cohesion) and stickiness. Usually, crosslinking will increase the surface hardness and
cohesion by forming new chemical bonds; this may result in an improvement in cleanability.

65
3.7.1. Sample preparation and experiment
In this section the hard/soft polymers used are shown in Table 8. The crosslinking agent (curing agent)
is tert-butyl peroxybenzoate produced by Akzo-Nobel. Its dosage is usually 5phr, meaning that the
curing agent-resin ratio is 5/100. These two components are mixed in the HAAKE mixer below 100℃
to avoid thermal decomposition of the peroxide which may occur at 120℃. The mixture is then
pressed at a temperature of 190℃ for 10mins with the hydraulic press to induce the crosslinking
reaction. The cleanability of the crosslinked samples and their hardness were determined as described
earlier.
Table 8. Materials used in this section
Product Name Product Name
Nordel EPDM LD LDPE
Bynel E/MAA/BuA Kraton SBS
Engage E/O Nucrel E/MAA
HSR High styrene SBR SBR SBR
Elvaloy E/MeA Surlyn E-ran-MAA(Zn)-ran-BuMA
Levapen E/VAc
3.7.2. Results and analysis
All of the detailed results were presented in Annex 1.2. The results of four typical materials are shown
in Figure 45. In Figure 45 (a), the EPDM resin before curing has a poor cleanability because of its low
hardness, and its sticky and hydrophobic surface. However, after curing, its cleanability shows a huge
improvement with soiling and wet cleaning codes decreasing from 4.75 and 2.5, to 4 and 1.25
respectively. The main reason is the increase in hardness (
Table 9) and surface cohesion (density).

66
Table 9. Hardness before and after curing of selected polymers
Product Hardness
Before curing After curing
Nordel 30 54
Engage 48 51
Nucrel 87 87
LD 88 89
The same phenomenon happens with the other three polymers; the wet cleaning of all of the polymers
is improved by the curing process. From the hardness data, it is possible to separate these four
materials into hard (Nucrel and LD) and soft (Nordel and Engage) materials. The low hardness
materials show scarcely no improvement in dry cleaning; this is because the dry cleaning is hampered
by their low hardness (Figure 45a and b). On the other hand, hard materials such as Nucrel and LD
show little or no increase in hardness, so that the improvements on soiling and wet cleaning are not as
significant as for the soft materials (Figure 45c and d). The dry cleaning of hard materials shows a
substantial improvement; this suggests that they benefited from an improvement in surface cohesion
(reduced surface defects), rather than from an increase in hardness.
(a) (b)

67
(c) (d)
Figure 45. Effect of crosslinking on the cleanability of typical polymers: (a) Nordel (EPDM); (b)
Engage (E/O); (c) Nucrel (E/MAA); (d) LDPE
All the samples were analyzed separately as hard and soft polymers. The cleanability data was made
by averaging their results and a similar tendency as shown above can be found in Figure 46. Therefore,
it was confirmed once again, that crosslinking improves the soiling and wet cleaning properties of soft
materials by increasing their hardness; it can also improve the dry and wet cleaning by reducing the
presence of surface defects (improved surface cohesion).
Figure 46. Comparison of cleanability before & after crosslinking on Hard (left) and soft (right)
polymers

68
3.8. Conclusion
The soling and cleaning behavior (cleanability) of organic polymeric materials was seen to depend on
a variety of factors which are often interdependent. The surface wettability, roughness and hardness of
the polymeric material all play important roles, and generally show a mixed-impact on surface
cleaning properties.
The surface wettability affects the cleaning process in two ways.
Firstly, contact angle measurements showed that if the surface is more hydrophilic (lower contact
angle) it will be easier to clean with water. This observation applies to the large variety of polymer
materials tested.
Secondly, wettability affects cleanability by determining the minimum size of surface micro cavities
that can be wetted by a cleaning agent (i. e. water). Unless the polymer surface is extremely
hydrophobic (superhydrophobic) the surface can be partially wetted by a cleaning liquid. However the
extent to which the micro defects can be wetted depends on the surface tension of the liquid. As shown
by the results of cleaning experiment with different cleaning agents, the micro-scale defects could not
be wetted by water which has high surface tension, but can be cleaned by other agents with lower
surface tension (ethylene glycol and ethanol).
As implied above, surface roughness also plays an important role in surface soiling and cleaning in
conjunction with wettability. The surface roughness resulting from surface nano- micro- and macro-
scale structural features affects the soiling and cleaning (wet or dry) of the polymeric material, mainly
by providing cavities which can physically trap the soil particles. For a given material, in our case
P(E/O), when the surface roughness is varied in a controlled fashion, the cleanablity was also changed.
As the imprinted surface roughness was controlled to around 100nm, a major reduction of

69
micro-defects resulted in a substantial improvement in water cleaning. On the other hand, when the
controlled roughness was decreased from 4500 to 1500, both the soiling and dry cleaning properties
were improved; a rougher surface will be soiled easier, and will be more difficult to clean.
As might be expected, hardness is also found to be an important factor on surface cleanability. Hard
polymer materials are easier to clean than soft materials; the surface deformation of soft materials will
has a negative impact on cleanability, depending on wettability and roughness. Hence, for the purpose
of material designing, engineer should try to increase the hardness of material within the permissible
range.
Polymer crosslinking is one of the methods used to increase the bulk and surface hardness of
polymeric materials. For polymer material, especially soft material such as resins, crosslinking can
increase their surface hardness and molecular cohesion by generating new chemical bonds between
molecular chains. This approach was investigated and the results on soft polymers (EPDM, rubber)
show a significant improvement on soiling and wet cleaning properties. The results obtained on hard
polymers (LPDE, Nucrel) show a significant improvement on dry and wet cleaning properties. This
improvement can be attributed to the surface molecular cohesion which was improved by crosslinking,
and to some micro- / macro-defects which are healed by the crosslinking process.

70
CHAPTER 4. STUDY ON THE INFLUENCE OF POLYMER
IMMISCIBILITY ON CLEANING PERFORMANCE IN POLYMER
BLENDS AND THE COMPATIBILITY MODIFICATION ON EPDM/
E-MAA (ZN)-BUMA/HSR BLENDS.
Polymer blends are wildly used in the polymer industry to produce the matrix for polymer composites.
Polymer blends are a class of materials analogous to metal alloys, in which at least two polymers are
blended together to create a new material with different physical properties. Generally, the components
of polymer blends are polymers with characteristics opposite to each other. For instance, a soft
polymer (with mobile polymer chains or low Tg) can be mixed with a hard polymer to improve its
hardness, resistance to abrasion and resistance to permanent deformation. The invention of polymer
blends allows people to produce an amazing variety of new materials which have remarkable
properties.
However, it is widely acknowledged that polymer mixtures are seldom fully miscible. The vast
majority of polymers are thermodynamically immiscible because of their different macro- / micro-
scale viscosity, crystallinity and polarity. The poor miscibility of polymer blends may result in more
micro-scale defects, I the mass or on the surface of the materials, yielding adverse effects to surface
cleanability. Therefore, it becomes important to verify the state of miscibility of the polymer blends
and its effect on cleanability (56).
Two of the most important methods used to improve the miscibility between different components of a
polymer blend are crosslinking and the use of a compatibilizer. Crosslinking improves the cohesion of
different polymer components by introducing new chemical bonds between the molecular chains. It
71
can be thought of as a coercive means to improve the miscibility of the polymer blends (57). In this
chapter, the effect of crosslinking on the cleanability of polymer blends will be investigated by
studying the morphology of the blend. A pair of polymers, Nordel (EPDM resin) and Surlyn (E-MAA
(Zn)-BuMA), will be used to investigate this effect.
Compatibilizers, as introduced in CHAPTER 1, are usually block copolymers (58-60), each of the
blocks being compatible with one of the polymers. Compatibilizers improve the cohesion of the
different polymer phases by increasing their adhesion through the bridging molecules. In this chapter,
a pre-crosslinked polymer will be applied in the Nordel / Surlyn system as the compatibilizer in order
to improve its miscibility and cleanability.
4.1. Research of multiple surface factors in polymer blends system.
In this section, the same tests used in CHAPTER 3, wettability, roughness and surface hardness, will
be applied to study the polymer blends. These results will be used to corroborate the rules established
in the preceding section.
4.1.1. Polymer blends design, preparation and testing
A series of hard polymers (Shore A hardness>70) and soft polymers (Shore A hardness<70) were
blended together in order to obtain polymer blends with different component ratios and surface
hardness. Each hard polymer was mixed with each soft polymer at two levels: 75/25 (hard/soft) and
25/75 (hard/soft). The polymers selected for this study are shown in Table 10.

72
Table 10. List of component polymers used in polymer blends
Hard polymers Soft polymers
No. Name Polymer No. Name Polymer
1 LDPE LDPE 1 Engage crist P(E/O)
2 Plexi HFI PMMA 2 Nordel EPDM
3 Surlyn E-ran-MAA(Zn)-ran-BuMA 3 Elvaloy P(E/MeA)
4 Cycolac ABS 4 Levapren P(E/Vac)
5 Bynel E/MAA/BuA 5 SBR SBR
6 Celcon POM
All the samples were mixed in HAAKE mixer at 160℃, a temperature sufficiently above their melting
temperature to ensure that they are mechanically well dispersed. The samples were then pressed
between two teflon sheets with the three-step molding process described previously to avoid the
presence of air bubbles. The surface of the samples were cleaned, dried and tested with Fe2O3 or
carbon black. As in CHAPTER 3, the soiling and cleaning protocol was repeated three times with
different operators, and the average result was reported.
4.1.2. Results and analysis
All of the detailed results are shown in Annex 3.1.
Surface wettability:
The surface wettability of polymer blends samples were measured by measuring the contact angle (CA)
of water against the surface. As in CHAPTER 3, the samples were separated into five groups
according to the CA data. The final cleanability data by CA group were calculated by taking average
of the data of all the samples in the same CA category (data shown in Annex 4.1).
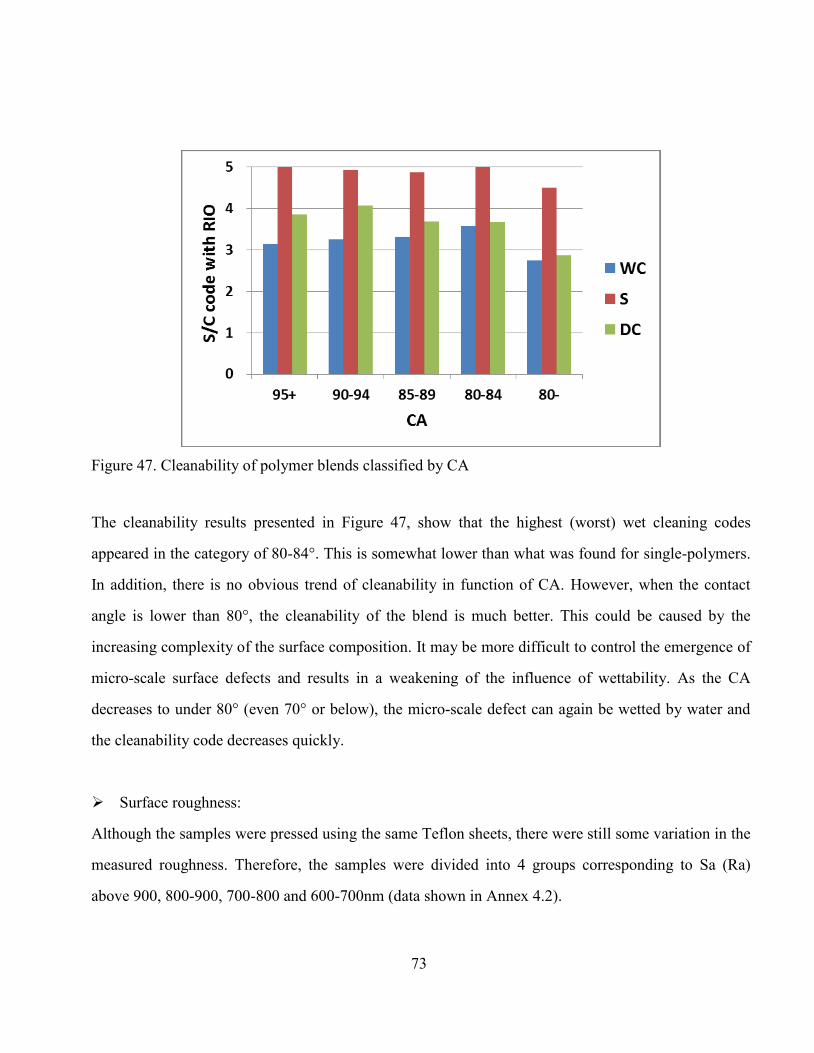
73
Figure 47. Cleanability of polymer blends classified by CA
The cleanability results presented in Figure 47, show that the highest (worst) wet cleaning codes
appeared in the category of 80-84°. This is somewhat lower than what was found for single-polymers.
In addition, there is no obvious trend of cleanability in function of CA. However, when the contact
angle is lower than 80°, the cleanability of the blend is much better. This could be caused by the
increasing complexity of the surface composition. It may be more difficult to control the emergence of
micro-scale surface defects and results in a weakening of the influence of wettability. As the CA
decreases to under 80° (even 70° or below), the micro-scale defect can again be wetted by water and
the cleanability code decreases quickly.
Surface roughness:
Although the samples were pressed using the same Teflon sheets, there were still some variation in the
measured roughness. Therefore, the samples were divided into 4 groups corresponding to Sa (Ra)
above 900, 800-900, 700-800 and 600-700nm (data shown in Annex 4.2).

74
Figure 48. Cleanability of polymer blends with different surface roughness
As shown in Figure 48, as observed from the wettability results, the wet cleaning tendency is not as
clear as with single-polymer systems. The reason is that, the roughness scale shown in this figure
(600-1000nm) does not reflect upon the amount of micro-defects. On the other hand, a significant
improvement on dry cleaning can be seen; this is consistent with the trend obtained in the last chapter
that the dry cleaning property is mainly controlled by the macro-roughness structure, and this structure
does not depend on the miscibility.
Surface hardness:
Surface hardness was determined using a Shore A durometer following the same method as describes
in CHAPTER 3. The results are shown in Figure 49 (data shown in Annex 4.3).
Similarly, the tendency isn‘t as clear as in the single-polymer system, but the results still appear to
follow the same rules. With these polymer mixtures the soiling results have exceeded the measuring
range giving results above 5. The wet and dry cleanability decreases slightly with a decreasing surface

75
hardness. When the hardness falls below 80, the dry cleaning property is suddenly deteriorated, as was
also observed in single-polymer system. In addition, the samples with hardness less than 70 also show
a poorer wet cleaning result which is the same as in the single-polymer system as well. This effect may
be due to an emergence phenomenon caused by the hardness; below a yield value (70 Shore A), the
deformation becomes much more important, decreasing the cleanability.
Figure 49. Cleanability of polymer blends with different hardness
In conclusion, the general relations found between surface factors and cleanability in single-polymer
systems are also valid in the polymer blends, but their effect is attenuated. This may be due to the
increasing complexity of the system which, as discussed below, is caused by the problem of
immiscibility.
4.2. The influence of miscibility on cleanability in polymer blends.
It is widely recognized that most polymer blends are non-miscible, or immiscible. The extent of their

76
miscibility is determined by the chemistry of the polymer (functionality, polarity), their crystallinity,
their viscosity differences, etc. It must be mentioned, that there are two different types or levels of
miscibility known respectively as mechanical miscibility and thermodynamical miscibility.
Mechanical miscibility is defined on the macro-scale (usually several microns); the polymers are
inter-dispersed and the blends have a homogeneous appearance. Most of the modifications of physical
properties of each polymer can be observed on this scale. Thermodynamically miscible means that the
polymer components are miscible on the molecular scale; the polymer blends have the same properties
as a single-polymer, the most obvious characteristic is to have only one Tg.
In order to investigate the influence of immiscibility on cleanability, DSC and SEM were applied to
study the thermal property and morphology of the polymer blends.
4.2.1. Influence of polymer immiscibility on cleanability
Considering the complexity of polymer blends, the data obtained with selected mixed polymer systems
should be simplified by reducing the influencing factors prior to the analysis. One of the more efficient
methods is to draw a single factor graph. The pairs of polymers chosen for this analysis are:
LDPE-Levapren, PMMA-Engage, Bynel-Engage and Celcon-SBR; these pairs do not form miscible
blends under mechanical dispersion. The following mixing ratios have been chosen to test their
cleanability: 100%Polymer A, 75/25 (A/B), 25/75 (A/B) and 100%PolymerB. The wet cleaning results
are shown in Figure 50.
In Figure 50a-d, the solid line represents the variation in cleanability observed, while the dashed line
represents the ideal trend that would be obtained if the polymer pair was thermodynamically miscible.
In such an ideal case, a polymer blend should exhibit a linear variation in the cleanability code as the
fraction of easy-to-clean polymer decreases. Figure 50 shows that all of the polymer blends have a

77
cleanability that is worse than expected; all the cleanability results of the polymer blends tested, lie
above the dashed line, regardless of the polymer ratio. According to these results, the problem of
immiscibility definitely has an important influence on the cleanability of polymer blends.
(a) (b)
(c) (d)
Figure 50. Cleanability of polymer blends in function of the weight fraction: (a) LDPE-Levapren,
(b) PMMA-Engage, (c) Bynel-Engage, (d) Celcon-SBR
4.2.2. Thermal analysis and study on morphology
The thermal properties and morphology of the polymer blends were investigated by DSC and SEM.
The immiscibility will be confirmed by the presence of two Tg, Tc or Tm peaks within the DSC
measurement, or by the appearance of a visible phase separation in the SEM micrographs.
DSC
Differential scanning calorimetry (DSC) is applied to analyse the thermal properties of the polymer

78
blends. All of the polymer pairs mentioned were investigated by DSC, however, due to limitations in
space, only the results for a representative pair of polymers is presented here: Bynel
(E/MAA/BuA)-Engage (E/O). Following the procedure described in CHAPTER 2, T1 is set to -80℃,
T2 to 200℃, with a heating rate of 10℃/min. Four samples were measured: 100%Bynel, 75%Bynel,
25%Bynel and 100%Engage.
Figure 51. DSC diagram of the different Bynel-Engage blends (cooling curve).
The peaks shown on the DSC diagram (Figure 51) are crystallization peaks. The pure Bynel (blue line)
shows a crystallization peak at around 70℃, and a crystallization peak for pure Engage (violet line)
can be found at 100℃. Although the Tg data cannot be obtained from this diagram, a separation of the
crystallization peaks still can be observed on the curve of the blends. On the Bynel 75% curve, two
peaks are found at around 70℃ and 100℃ indicating that there exist two distinct crystallization
processes belong to Bynel and Engage respectively. This indicates that these polymer blends are
thermodynamically immiscible.
Endo up

79
SEM
The morphology of polymer blends may be studied examined a scanning electron microscope. The
samples were hardened in liquid nitrogen for several minutes and broken using tweezers. The fracture
surfaces were coated with platinum via the high-vacuum evaporation method. Finally, the fracture
surface was observed under SEM for the purpose of studying the morphology. The SEM images for
the blends Bynel (E/MAA/BuA)/Engage (E/O) (75/25) and Surlyn
(E-ran-MAA(Zn)-ran-BuMA)/Engage (75/25) are shown in Figure 52.
Figure 52. SEM images of Bynel/Engage (75/25) (left) and Surlyn/Engage (75/25) (right)
The polymer immiscibility, or phase separation, is readily observed in the SEM images. In the
Bynel/Engage blend (Figure 52 left), the Engage appears as a dispersed phase in a ―sea-islands‖ blend
structure; the dimension of the Engage polymer grain is around 4μm. The grain size indicates that this
mixture is mechanically miscible but the phase separation shows that it is thermodynamically
immiscible. As a result, the physical properties may benefit from such a blend but the cleanability
cannot. Similar observations were noted in the Surlyn/Engage blend (Figure 52 right). The main
difference is that the grain size of the dispersed phase is smaller than that observed with Bynel. Surlyn
(E-ran-MAA(Zn)-ran-BuMA) can be pictured as a zinc neutralized Bynel (E/MAA/BuA); the metal
neutralization greatly increases the viscosity of the polymer, resulting in a more powerful dispersion

80
during mixing (higher local shear forces).
In summary, the thermodynamic immiscibility in polymer blends has been demonstrated from two
different characterization methods. Its negative impact on cleanability has been evidenced by the
single factor experimental diagram. Any polymer modification which can improve miscibility should
thus be considered during the designing of new polymer blends, particularly flooring material
application.
4.3. Effect of crosslinking on polymer compatibility and cleanability in Nordel (EPDM) /
Surlyn (E-ran-MAA(Zn)-ran-BuMA) blends
Crosslinking is one of the most efficient means to improve the cohesion between polymer chains. The
formation of chemical bonds linking the different phases together on a molecular scale allows the
blend to develop a more uniform network. Therefore, the immiscible polymer pair is able to form a
more homogeneous blend which may have less micro-scale bulk or surface defects. In addition,
crosslinking can increase the surface hardness and reduce the surface stickiness. These changes should
all contribute to improve surface cleanability.
4.3.1. Sample preparation and experiment
In this section the polymer blend Nordel / Surlyn will be presented to demonstrate the effects of
crosslinking. EPDM, is a soft resin material which is suitable for peroxide crosslinking; Surlyn is a
thermoplastic which is hard and tough at room temperature and can act as a reinforcing component.
The crosslinking agent (curing agent) used in this section is tert-butyl peroxybenzoate produced by
Akzonobel. These three components were mixed in the HAAKE mixer at a temperature just below 100℃
to avoid thermal decomposition of peroxide which may occur at 120℃. The mixture were pressed at

81
190℃ for 10mins with the hydraulic press. The cleanability of the crosslinked samples was measured
using the usual soiling / cleaning protocol.
The following sections will demonstrate the effects of crosslinking agent dosage and curing time on
cleanability, while the influence of crosslinking on polymer compatibility will be evidenced through
examination of blend morphology.
4.3.2. The influence of curing agent dosage
The crosslinking agent dosage varied between 0 and 12.5 phr with a curing time of 10 min. The results
of cleanability obtained following these changes are shown in Figure 53:
Figure 53. Cleanability of Nordel/ Surlyn blend cured with different dosage of peroxide
As shown in Figure 53, all of the soiling and cleaning properties were improved with increasing the
curing agent dosage, especially between 0phr and 5phr. The reason is that the crosslinking process
greatly increased the compatibility of component polymers, resulting in an improvement, of the
surface structure, namely by ―healing‖ micro-scale defects. Moreover, the improvement on hardness
and surface ―density‖ brought by the crosslinking are also beneficial to cleanability. However, the

82
improvement in cleanability becomes limited as the crosslinking points, or bridges, become too closely
spaced; beyond a certain dosage (>7-8 phr), additional cross-links have limited impact. Hence, the
observed cleanability improves only slightly when the dosage of curing agent exceeds 7.5phr.
4.3.3. The influence of curing time
Generally, the degree of crosslinking goes up proportional to the increasing of curing time until its
upper limit. In this case, four (4) curing times were chosen to investigate their influence on the
cleanability: 6min, 9min, 18min and 27min. The results are shown in Figure 53:
Figure 54. Cleanability of Nordel/ Surlyn blend cured with different curing times
Figure 54 shows that, the polymer blend cleanability is improved as the curing time is increased. This
is understood from the increasing degree of crosslinking, which renders the surface progressively more
dense and harder. As with the curing dosages, this cleanability improvement with curing time reaches
its limit at approximately 20 minutes.
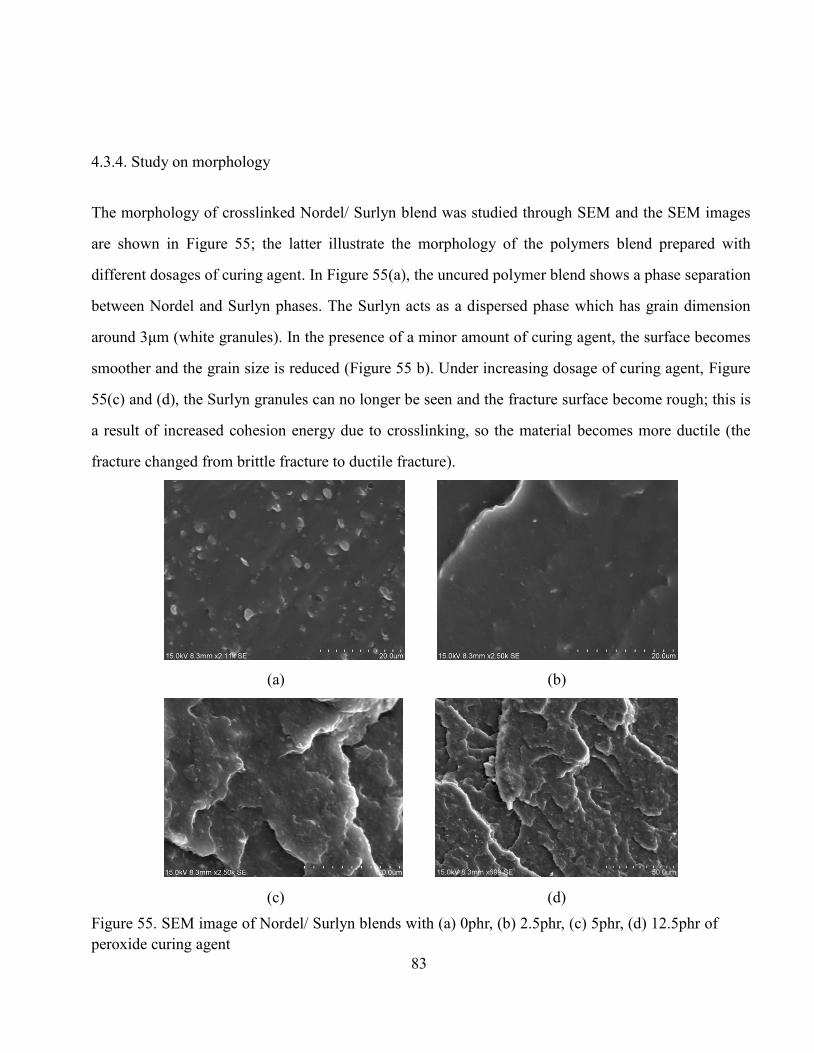
83
4.3.4. Study on morphology
The morphology of crosslinked Nordel/ Surlyn blend was studied through SEM and the SEM images
are shown in Figure 55; the latter illustrate the morphology of the polymers blend prepared with
different dosages of curing agent. In Figure 55(a), the uncured polymer blend shows a phase separation
between Nordel and Surlyn phases. The Surlyn acts as a dispersed phase which has grain dimension
around 3μm (white granules). In the presence of a minor amount of curing agent, the surface becomes
smoother and the grain size is reduced (Figure 55 b). Under increasing dosage of curing agent, Figure
55(c) and (d), the Surlyn granules can no longer be seen and the fracture surface become rough; this is
a result of increased cohesion energy due to crosslinking, so the material becomes more ductile (the
fracture changed from brittle fracture to ductile fracture).
(a) (b)
(c) (d)
Figure 55. SEM image of Nordel/ Surlyn blends with (a) 0phr, (b) 2.5phr, (c) 5phr, (d) 12.5phr of
peroxide curing agent

84
In summary, the compatibility of polymer blends, as determined from their micro- and macroscopic
homogeneity, can be greatly enhanced through crosslinking; the improvement is directly reflected on
the material cleanability.
4.4. Study of compatibilizer modification on compatibility and cleanability in Nordel/Surlyn
/HSR blend system
As presented earlier, compatibilizers, are molecules which are introduced in polymer blends to
promote interfacial adhesion between different polymers phases which are immiscible. Typically,
compatibilizers contain two or more segments (blocks), each being compatible with one of the phases
in the blend. The compatibilizers molecules tend to concentrate at the interfaces (interphases),
lowering their interfacial energy, thus allowing finer dispersion of mutually incompatible polymer
pairs. Reducing the dimension of the dispersed phase generally improves blend homogeneity.
4.4.1. Preparation of pre-crosslinked compatibilizer (PC)
While polymer compatibilizers are usually block co-polymers, their application encounter various
limitations. First, not all of polymer pairs are suitable for compatibilization using block co-polymer.
Additionally, a significant disadvantage of block co-polymers is their cost which is related to the
difficulty of synthesis. In order to obtain a compatibilizer which is best adapted to the blends
investigated and easy-to-produce, we prepared compatibilizers by a «pre-crosslinking» method.
In the pre-crosslinking approach, a mixture of the polymer pair is partially crosslinked with a tiny
amount of curing agent to produce ―linked‖ polymer chains as illustrated in Figure 56. The linking

85
process occurring under mixing shear, promotes the inter-dispersion of the immiscible polymers. The
pre-crosslinked polymers (PC) can then be added as a compatibilizer in the preparation of related
polymer blends.
(a) (b)
Figure 56. (a) Crosslinked polymer network; (b) pre-crosslinked compatibilizer
When applicable, this method is readily used in industrial two-step blending processes. In this section,
the pre-crosslinked method was used to prepare a 3-polymer: Nordel/Surlyn/HSR blend. In this
preparation, only Nordel and Surlyn were pre-crosslinked with peroxide curing agent because the
compatibility between HSR and Nordel is already fairly good. The PC were prepared with the
following polymer ratios and curing agent dosage:
PC No. Nordel Surlyn Peroxide
#1 50phr 50phr 1phr
#2 25phr 75phr 1phr
The mixture were mixed in HAAKE mixer for 15min at 120℃. The pre-crosslinked material was
broken into granules using a laboratory grinder and respectively identified as PC #1 and #2. In the
subsequent preparation of the 3-polymer blend, 10% of the total polymer mass was replaced by the PC.
The polymer-PC blend compositions were as follows:

86
PC No. Nordel Surlyn HSR PC
#1 65phr 10phr 15phr 10phr
#2 67.5phr 7.5phr 15phr 10phr
4.4.2. Study of cleanability with the presence of pre-crosslinked compatibilizer
The cleaning results on the Nordel/Surlyn/HSR blends prepared as above are shown in Figure 57.
Figure 57. Cleanability of Nordel/Surlyn/HSR blends modified by pre-crosslinked compatibilizer
(PC) (3P: without PC, 3P+1: with PC#1, 3P+2: with PC#2)
As seen in Figure 57, the incorporation of PC‘s in the Nordel/Surlyn/HSR system improves
significantly the cleanability, especially the wet cleaning property. This improvement is the result of
the formation of a less porous surface, due to the increased interfacial (interphase) cohesion. Typical
compatibilizers tend to concentrate at the interfaces of different polymer phases, and thus contribute to
healing the micro-defects. However, as shown in previous section, the soiling and dry cleaning are
affected by macro-roughness; hence the compatibilizers are unlikely to improve dry cleaning.

87
4.4.3. Study on morphology of 3-polymer blend
The morphology of 3-polymer blends and the influence of pre-crosslinked compatibilizer were
investigated through SEM. Figure 58a shows a typical immiscible polymer blend: the dispersed Surlyn
phase has a grain size around 3μm. As seen in Figure 58b, with the addition of PC, the compatibility
between Nordel and Surlyn is improved as evidenced by a reduction of the Surlyn grain size, even
though the polymer blends is still immiscible. This effect was not observed in the blend (without PC)
cured with a 0.1phr dosage of curing agent (Figure 58c), although the dimension of Surlyn phase is
slightly reduced.
(a) (b)
(c)
Figure 58. SEM of (a) Nordel/Surlyn/HSR blend; (b) with PC; (c) with 0.2phr peroxide

88
In conclusion, the positive effect of pre-crosslinked compatibilizer on the compatibilisation is readily
observed. The PC is able to improve the cohesion between the different polymer phases, thus healing
the surface micro-scale defects; the favorable influence of PC is also demonstrated from the (wet)
cleanability results.
4.5. Conclusion
The influence of the surface properties of three key factors (wettability, roughness and surface
hardness) on cleanability was investigated, first on single-polymer systems, then on polymer blends.
Generally, the influence of the key factors is similar in both types of polymer systems, although, in the
polymer blends, their impact is weakened due to immiscibility.
The miscibility/immiscibility of the selected polymer blends has been investigated through DSC and
SEM studies, and the observations correlated with cleanability data. The results confirm that the
thermodynamic immiscibility of polymer blends affects the surface cleaning performance; the main
reason underlying this observation is the formation of surface micro-scale defects due to the
interphases between immiscible polymer domains. Increasing the number of micro-scale defects which
cannot be wetted by water, can clearly reduce the cleanability, particularly the wet cleaning property.
Hence, improving the compatibility of components in polymer blends is an important task in the
design of new materials.
One approach to improving polymer compatibility (and inter-dispersion) is through crosslinking.
Following this route, the binary polymer blend: Nordel (EPDM)/ Surlyn (E-ran-MAA(Zn)-ran-BuMA)
was characterize before and after peroxide crosslinking. It was found that, with increasing curing
(cross linking) agent dosage and/or curing time, the cleanability was greatly improved. The

89
crosslinking process yields a large number of inter-molecular (inter-chain) bonds which increases bulk
and surface cohesion, and partially heals the surface micro-scale defects. In other words, crosslinking
reduces the surface micro-roughness without changing the macro-roughness, the later as measured by
optical profilometry.
Following another route, we developped special «compatibilizer» compounds by pre-crosslinking two
immiscible polymers (EPDM, Surlyn), of interest for the blend investigated. The pre-crosslinked
compatibilizer (PC) was then introduced a part (10wt%) of a ternary polymer blend: Nordel (EPDM)/
Surlyn (E-ran-MAA(Zn)-ran-BuMA)/ HSR . Two such PC compounds were tested and found to
impart significant improvements on polymer compatibility and cleanability, particularly the wet
cleanability. The most plausible reason is thatreason is that the PC molecular tends to concentrate at
the interfaces of different phase domains, thus contributing to heal (seal) micro-defects at interphases
in the bulk and on the surface. Interestingly, this approach is easily adapted to industrial production
processes.

90
CONCLUSION
In the study presented above, the factors which affect the performance of surface soiling and cleaning
behavior (cleanability) of organic polymeric materials were investigated in both single polymer and
polymer blend systems. A normalized surface soiling/cleaning method was developed and applied to
characterize a large variety of single polymer materials, as well as selected binary and ternary blends.
Experiments were performed on samples prepared under controlled (or measured) surface roughness,
and the hardness and wettability (water, other liquids) of each polymer system were systematically
determined. The results of this exhaustive test program yielded significant relationships between the
polymer properties (bulk or surface) and their soiling and (wet, dry) cleaning features.
A first important finding is that three key factors of polymer surfaces: hardness, wettability and
roughness, act jointly in controlling the soiling-cleaning behavior. A second key finding supported by
the empirical relationships derived here, is that the micro-scale and macro-scale roughness (structural
surface features) respectively determine the influence on wet cleaning, on one hand and soiling & dry
cleaning, on the other hand.
A qualitative model describing the surface soiling and cleaning processes was developed, based on the
observations of the cross-impact of wettability, roughness and hardness on these processes. The model
provides a simple means for explaining surface soiling-cleaning rules, emphasizing that, in order to
design an easy-to-clean material, the surface wettability, roughness and hardness should be considered
and optimized simultaneously.
A further important observation derived from the combined test results is that polymer immiscibility
reduced the cleanability of polymer blends; this effect was attributed to the formation of micro-defects

91
(bulk and surface) at the interface between immiscible domains of different polymers. Attempts to
improve the soiling-cleaning features of single polymers and polymer blends were pursued through
different routes.
For single polymer or polymer blends, the soiling-cleaning performances can be improved
substantially through cross-linking. The magnitude of the improvement is directly related to the dosage
of the crosslinking agent and to the duration of the crosslinking process, up to some obvious limits.
Crosslinking increases material cohesion and hardness (bulk and surface, thus improving cleanability.
Cross-linking is also believed to «heal» some of the surface micro-defects (cracks, crevices) occurring
between immiscible domains of blended polymers; this effect further contributes to a significant
improvement on cleaning properties.
The extent of polymer immiscibility in binary or ternary blends was determined through DSC and
SEM studies, and its impact on cleanability was investigated in parallel. The wet cleaning results show
that the immiscibility of polymer blends negatively affects the surface cleaning performance. As
inferred above, the reason is the introduction of more surface micro-scale defects. Consequently,,
improving the compatibility of components in polymer blends is a crucial goal for achieving enhanced
cleanability.
To improve compatibility in the ternary polymer blend: Nordel(EPDM) /Surlyn
(E-ran-MAA(Zn)-ran-BuMA)/ HSR a compatibilization approach was developed. A customized
compatibilizer was prepared by partially pre-crosslinking binary mixtures of Nordel (EPDM)/ Surlyn
(E-ran-MAA(Zn)-ran-BuMA). The pre-crosslinked compatibilizer (PC) was then introduced in the
ternary blend to replace 10% of the total polymer mass. In the presence of the PC polymers, the SEM
observations showed a significant improvement in compatibility, evidenced by a decrease in the
average size of the dispersed phase. This variation was accompanied by an improvement in the wet

92
cleaning properties, again attributed to the reduction (sealing) of surface micro-defects.

93
REFERENCES
1. Finnegan, J.A., et al., Building Materials, Plastic, in Kirk-Othmer Encyclopedia of
Chemical Technology. 2000, John Wiley & Sons, Inc.
2. Barbero, E.J., Introduction to composite materials design. 2010: CRC press.
3. Clausi, R.N. and S.A. DiLoreto, Resilient flooring compositions, 2011, Google
Patents.
4. Vijayaram, T.R., A technical review on rubber. Int. J. Design Manufact. Tech, 2009.
3: p. 25.
5. Solga, A., et al., The dream of staying clean: Lotus and biomimetic surfaces.
Bioinspiration & biomimetics, 2007. 2(4): p. S126.
6. Parker, A.R. and C.R. Lawrence, Water capture by a desert beetle. Nature, 2001.
414(6859): p. 33-34.
7. Herminghaus, S., Roughness-induced non-wetting. EPL (Europhysics Letters), 2000.
52(2): p. 165.
8. Ball, P., Engineering shark skin and other solutions. Nature, 1999. 400(6744): p.
507-509.
9. Fürstner, R., et al., Wetting and Self-Cleaning Properties of Artificial
Superhydrophobic Surfaces. Langmuir, 2005. 21(3): p. 956-961.
10. Cuddihy, E. and P.B. Willis, Antisoiling technology: theories of surface soiling and
performance of antisoiling surface coatings. 1984.
11. Kuisma, R., Physical Characterization of plastic surfaces in wearing and cleanability
research. 2006.
12. Kiss, E., I. Bertoti, and E. Vargha-Butler, XPS and wettability characterization of
modified poly (lactic acid) and poly (lactic/glycolic acid) films. Journal of colloid and

94
interface science, 2002. 245(1): p. 91-98.
13. Nunes, R.C.R., J.L.C. Fonseca, and M.R. Pereira, Polymer–filler interactions and
mechanical properties of a polyurethane elastomer. Polymer Testing, 2000. 19(1): p.
93-103.
14. Ma, M. and R.M. Hill, Superhydrophobic surfaces. Current Opinion in Colloid &
Interface Science, 2006. 11(4): p. 193-202.
15. Boulané‐Petermann, L., Processes of bioadhesion on stainless steel surfaces and
cleanability: a review with special reference to the food industry. Biofouling, 1996.
10(4): p. 275-300.
16. Gedde, U., Polymer physics. 2013: Springer Science & Business Media.
17. Ning, X. and H. Ishida, Phenolic materials via ring‐opening polymerization:
Synthesis and characterization of bisphenol‐A based benzoxazines and their
polymers. Journal of Polymer Science Part A: Polymer Chemistry, 1994. 32(6): p.
1121-1129.
18. Bicerano, J., Prediction of polymer properties. 2002: CRC Press.
19. Rosato, D.V. and M.G. Rosato, Injection molding handbook. 2012: Springer Science
& Business Media.
20. Coran, A.Y. and R. Patel, Rubber-thermoplastic compositions. Part I.
EPDM-polypropylene thermoplastic vulcanizates. Rubber Chemistry and Technology,
1980. 53(1): p. 141-150.
21. Akiba, M. and A. Hashim, Vulcanization and crosslinking in elastomers. Progress in
polymer science, 1997. 22(3): p. 475-521.
22. Coran, A. and J. Eirich, 7 Vulcanization. Science and technology of rubber, 1994: p.
339-385.
23. Lorenz, O. and C. Parks, The crosslinking efficiency of some vulcanizing agents in
natural rubber. Journal of Polymer Science, 1961. 50(154): p. 299-312.

95
24. Dunham, M., D. Bailey, and R. Mixer, New curing system for silicone rubber.
Industrial & Engineering Chemistry, 1957. 49(9): p. 1373-1376.
25. Keller, R.C., Peroxide curing of ethylene-propylene elastomers. Rubber chemistry
and technology, 1988. 61(2): p. 238-254.
26. González, L., et al., A new interpretation of the crosslinking mechanism of NR with
dicumyl peroxide. Kautschuk und Gummi, Kunststoffe, 1998. 51(2): p. 83-87.
27. Daniel, I.M., et al., Engineering mechanics of composite materials. Vol. 3. 1994:
Oxford university press New York.
28. Chanda, M. and S.K. Roy, Industrial polymers, specialty polymers, and their
applications. Vol. 74. 2008: CRC press.
29. Huang, H. and R. Talreja, Numerical simulation of matrix micro-cracking in short
fiber reinforced polymer composites: initiation and propagation. Composites science
and technology, 2006. 66(15): p. 2743-2757.
30. Liu, D., et al., Position control of an ionic polymer metal composite actuated rotary
joint using iterative feedback tuning. Mechatronics, 2011. 21(1): p. 315-328.
31. Rothon, R., Mineral fillers in thermoplastics: filler manufacture and characterisation,
in Mineral Fillers in Thermoplastics I. 1999, Springer. p. 67-107.
32. Rothon, R. and C. Paynter, Calcium Carbonate Fillers. 2015.
33. Murphy, J., Additives for plastics handbook. 2001: Elsevier.
34. Pfaendner, R., How will additives shape the future of plastics? Polymer degradation
and stability, 2006. 91(9): p. 2249-2256.
35. Maeda, Y. and D. Paul, Effect of antiplasticization on gas sorption and transport. I.
Polysulfone. Journal of Polymer Science Part B: Polymer Physics, 1987. 25(5): p.
957-980.
36. Rashvand, M., Z. Ranjbar, and S. Rastegar, Nano zinc oxide as a UV-stabilizer for
aromatic polyurethane coatings. Progress in Organic Coatings, 2011. 71(4): p.

96
362-368.
37. Paul, D.R., Polymer blends. Vol. 1. 2012: Elsevier.
38. Utracki, L., On the viscosity‐concentration dependence of immiscible polymer
blends. Journal of Rheology (1978-present), 1991. 35(8): p. 1615-1637.
39. Lee, H.M. and O.O. Park, Rheology and dynamics of immiscible polymer blends.
Journal of Rheology (1978-present), 1994. 38(5): p. 1405-1425.
40. DiPaola-Baranyi, G., Thermodynamic miscibility of various solutes with styrene-butyl
methacrylate polymers and copolymers. Macromolecules, 1981. 14(3): p. 683-687.
41. Utracki, L.A., Compatibilization of polymer blends. The Canadian Journal of
Chemical Engineering, 2002. 80(6): p. 1008-1016.
42. Komalan, C., et al., Dynamic mechanical analysis of binary and ternary polymer
blends based on nylon copolymer/EPDM rubber and EPM grafted maleic anhydride
compatibilizer. Express Polym Lett, 2007. 1(10): p. 641-653.
43. Shirtcliffe, N.J., et al., An introduction to superhydrophobicity. Advances in colloid
and interface science, 2010. 161(1): p. 124-138.
44. Balkenende, A., et al., Evaluation of different approaches to assess the surface
tension of low-energy solids by means of contact angle measurements. Langmuir,
1998. 14(20): p. 5907-5912.
45. Ma, M., R.M. Hill, and G.C. Rutledge, A review of recent results on
superhydrophobic materials based on micro-and nanofibers. Journal of Adhesion
Science and Technology, 2008. 22(15): p. 1799-1817.
46. Quéré, D., Wetting and roughness. Annu. Rev. Mater. Res., 2008. 38: p. 71-99.
47. Marmur, A., Wetting on hydrophobic rough surfaces: to be heterogeneous or not to
be? Langmuir, 2003. 19(20): p. 8343-8348.
48. Nosonovsky, M. and B. Bhushan, Roughness-induced superhydrophobicity: a way to
design non-adhesive surfaces. Journal of Physics: Condensed Matter, 2008. 20(22): p.

97
225009.
49. Sethuraman, A., et al., Effect of surface wettability on the adhesion of proteins.
Langmuir, 2004. 20(18): p. 7779-7788.
50. Tikka, H.K., M. Suvanto, and T.A. Pakkanen, Soiling of pure PVC studied by FTIR,
optical microscopy, and AFM. Journal of Colloid and Interface Science, 2004. 273(2):
p. 388-393.
51. Goiato, M.C., et al., Evaluation of hardness and surface roughness of two
maxillofacial silicones following disinfection. Brazilian oral research, 2009. 23(1): p.
49-53.
52. Freire, E., Differential scanning calorimetry. Protein Stability and Folding: Theory
and Practice, 1995: p. 191-218.
53. Sealy, C.P., M.R. Castell, and P.R. Wilshaw, Mechanism for secondary electron
dopant contrast in the SEM. Journal of electron microscopy, 2000. 49(2): p. 311-321.
54. Todokoro, H. and M. Ezumi, Scanning electron microscope, 1999, Google Patents.
55. Lundgren, B., B. Jonsson, and B. Ek‐Olausson, Materials emission of chemicals–
PVC flooring materials. Indoor Air, 1999. 9(3): p. 202-208.
56. Utracki, L. and B. Favis, Polymer alloys and blends. Vol. 4. 1989: Marcel Dekker:
New York.
57. Uthaman, R.N., A. Pandurangan, and S. Majeed, Mechanical, thermal, and
morphological characteristics of compatibilized and dynamically vulcanized
polyoxymethylene/ethylene propylene diene terpolymer blends. Polymer Engineering
& Science, 2007. 47(6): p. 934-942.
58. Macosko, C., et al., Compatibilizers for melt blending: Premade block copolymers.
Macromolecules, 1996. 29(17): p. 5590-5598.
59. Paul, D., Interfacial agents (“compatibilizers”) for polymer blends. Polymer blends,
1978. 2: p. 35-62.

98
60. Tang, T. and B. Huang, Interfacial behaviour of compatibilizers in polymer blends.
Polymer, 1994. 35(2): p. 281-285.
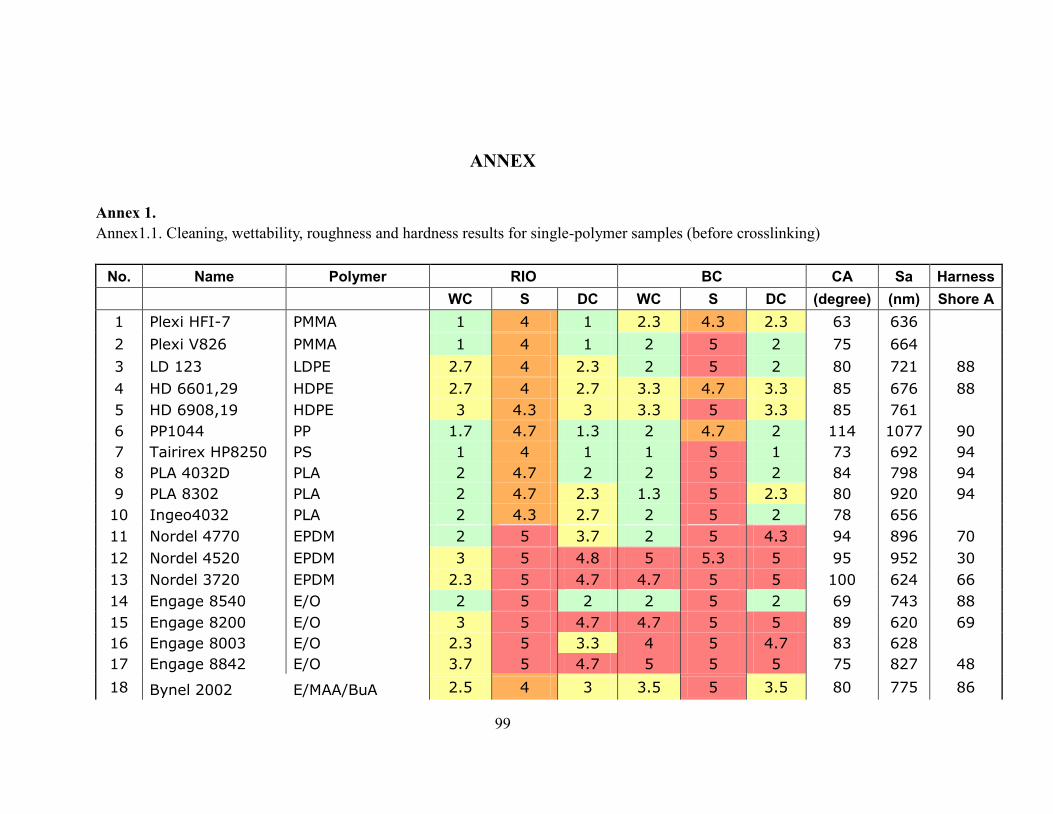
99
ANNEX
Annex 1.
Annex1.1. Cleaning, wettability, roughness and hardness results for single-polymer samples (before crosslinking)
No. Name Polymer RIO BC CA Sa Harness
WC S DC WC S DC (degree) (nm) Shore A
1 Plexi HFI-7 PMMA 1 4 1 2.3 4.3 2.3 63 636
2 Plexi V826 PMMA 1 4 1 2 5 2 75 664
3 LD 123 LDPE 2.7 4 2.3 2 5 2 80 721 88
4 HD 6601,29 HDPE 2.7 4 2.7 3.3 4.7 3.3 85 676 88
5 HD 6908,19 HDPE 3 4.3 3 3.3 5 3.3 85 761
6 PP1044 PP 1.7 4.7 1.3 2 4.7 2 114 1077 90
7 Tairirex HP8250 PS 1 4 1 1 5 1 73 692 94
8 PLA 4032D PLA 2 4.7 2 2 5 2 84 798 94
9 PLA 8302 PLA 2 4.7 2.3 1.3 5 2.3 80 920 94
10 Ingeo4032 PLA 2 4.3 2.7 2 5 2 78 656
11 Nordel 4770 EPDM 2 5 3.7 2 5 4.3 94 896 70
12 Nordel 4520 EPDM 3 5 4.8 5 5.3 5 95 952 30
13 Nordel 3720 EPDM 2.3 5 4.7 4.7 5 5 100 624 66
14 Engage 8540 E/O 2 5 2 2 5 2 69 743 88
15 Engage 8200 E/O 3 5 4.7 4.7 5 5 89 620 69
16 Engage 8003 E/O 2.3 5 3.3 4 5 4.7 83 628
17 Engage 8842 E/O 3.7 5 4.7 5 5 5 75 827 48
18 Bynel 2002 E/MAA/BuA 2.5 4 3 3.5 5 3.5 80 775 86

100
19 Surlyn 9650 E/MAA(Zn) 1.7 5 3.3 3 5 3.7 82 692
20 Surlyn9910 E/MAA(Zn) 2.3 5 3 2 5 4 85 713
21 Surlyn 1601 E/MAA(Na) 3 5 3 2 5 2.7 85 714
22 Surlyn9020 E/MAA(Zn)/BuMA 2 5 3.3 4 5 4.3 83 726 92
23 Nucrel 1214 E/MAA 1 5 1 1 5 1 75 682 87
24 SBR 1502 SBR 2.3 5 4 2 5 4 93 296 23
25 HSR1904 HSBR 4 4.8 4.3 5 5.3 5 103 821 96
26 Kraton FG 1901 SEBS 3 5 4.7 4 5 4 88 869 68
27 Cycolac MG29 ABS 2 5 2 4 5 4 87 841 86
28 Soarnol A4412 E/VOH(44% E) 2 3.7 2 3 5 3 68 681 96
29 Elvaloy 1224 E/MeA 3 5 4.3 4.7 5 4.7 99 625 76
30 Elvaloy 1330 E/MeA 4.7 5 4.7 4.7 5 4.7 106 952 63
31 Versify 4200 P/E 3 5 4 4 5 4 106 861
32 Levapren 400 E/VAc(40% VAc) 3.7 5 4.7 5 5 5 89 1035 55
33 Elvax 220W E/VAc(28% VAc) 4.7 5 5 5 5 5 84 731
34 Riteflex PTE 2.7 5.3 3 3.7 5.3 4 67 772
35 Forton Polyphenylene
Sulfide (PPS) 2.3 5 2 3.3 5 3 79 963
36 Celanex PBT 2.3 5 2.3 2.7 4.7 2.7 86 1044
37 Baymod N-3452P NBR(33%
acrylonitrile) 4.3 5 4.3 4.3 5 4.3 108 3609
38 Celcon POM 2 4 2 2.3 4.7 2.3 80 1368
39 Polybond 3029 PE modified 3.7 5 3.7 3.7 5 4 92 1005 79
40 polyamide 6 polyamide 6 2 3.7 2 2 4.3 2 66 990 97
41 polyamide 66 polyamide 66 3 5 3.3 3.3 5 4 89 1122 94
42 LD-Silicon
Rubber
LDPE+Silicon
Rubber 3.7 5 4 4 5 4 108
43 Elastollan ET870 TPU 1.5 5 3.8 2.3 5 4.3 103 69

101
Annex 1.2. Cleaning and hardness data of single-polymer samples (after crosslinking).
Name Polymer RIO Hardness
WC S DC After
crosslink
Nordel4520 EPDM 1.25 4 3.75 54
Engage8540 E/O 1.25 4 1.75 88
Nordel3720 EPDM 1.25 3.75 3.5 67
Nucrel 1214 E/MAA 1.25 3.75 2 87
Bynel2002 E/MAA/BuA 1.75 4 3.25 86
HSR1904 HSR 2.75 3.75 3.5 96
Elvloy1224 E/MeA 1.25 3.75 3.5 77
Elvloy1330 E/MeA 1.25 4 3.5 66
Engage8842 E/O 1.25 4 3.75 51
SBR1502 SBR 1.5 3.75 3.25 63
Surlyn9020 E/MAA(Zn)/BuMA 1.25 4.25 1.75 91
Levpran400 E/VAc(40% VAc) 1.5 4 3.75 57
LD123 LDPE 1.5 3.25 1.75 89
kraton FG 1901 SBS 1.5 3.75 3.5 71

102
Annex 2.
Annex 2.1. cleaning data for hard polymers in different CA groups
cleaning data for soft polymers in different CA groups
Annex 2.2. cleaning data for polymers in different roughness groups
Annex 2.3. cleaning data for polymers in different hardness groups
Hard polymer No.of samples
CA group WC S DC
95+ 2.6 ± 0.92 4.93 ± 0.15 3.33 ± 1.35 4
90-94 3.7 5 3.7 1
85-89 2.6 ± 0.44 4.66 ± 0.48 2.66 ± 0.52 5
80-84 2.2 ± 0.32 4.23 ± 0.36 2.27 ± 0.39 6
80- 1.7 ± 0.69 4.44 ± 0.57 1.82 ± 0.84 9
Average code
Soft polymer No.of samples
CA group WC S DC
95+ 3.57 ± 0.84 4.96 ± 0.09 4.54 ± 0.24 7
90-94 2.3 ± 0 5 ± 0 4 ± 0 1
85-89 3 ± 0 5 ± 0 4.7 ± 0 2
80-84 2.3 ± 0 5 ± 0 3.3 ± 0 1
80- 2.49 ± 0.82 5 ± 0 3.68 ± 1.19 4
Average code
Roughness No.of samples
group WC S DC
2000+ 3.25 ± 0.99 5 ± 0 3.33 ± 0.97 4
1000-2000 2.73 ± 0.86 4.78 ± 0.4 2.88 ± 1.25 6
800-1000 2.77 ± 0.9 4.76 ± 0.43 3.37 ± 1.22 13
600-800 2.1 ± 0.68 4.59 ± 0.49 2.76 ± 1.26 18
Average code
Roughness No.of samples
group WC S DC
2000+ 3.25 ± 0.99 5 ± 0 3.33 ± 0.97 4
1000-2000 2.73 ± 0.86 4.78 ± 0.4 2.88 ± 1.25 6
800-1000 2.77 ± 0.9 4.76 ± 0.43 3.37 ± 1.22 13
600-800 2.1 ± 0.68 4.59 ± 0.49 2.76 ± 1.26 18
Average code

103
Annex 3.
Annex 3.1. Cleaning, wettability, roughness and hardness results for polymer blends samples
WC S DC WC S DC
1 LDPE Engage 25/75 94 759 92 2.5 4.75 2.5 2.75 4.75 2.75
2 LDPE SBR 75/25 95 839 63 2.5 4 2.75 2.75 4.25 2.75
3 LDPE Nordel 75/25 95 688 89 2.5 4.5 2.75 2.5 4.75 2.75
4 LDPE Nordel 25/75 87 717 83 2.75 5 3 3.5 5 3.75
5 LDPE Engage 75/25 96 759 100 3.75 5 3.75 3.75 5 3.75
6 LDPE Levapren 75/25 94 727 80 4 5 4 4.5 5 4
7 PMMA Engage 25/75 64 841 104 4.7 5 4.7 5 5 5
8 PMMA Nordel 25/75 82 693 82 4 5 4 4 5 4
9 PMMA Elvaloy 25/75 88 773 85 3.75 5 4.75 4.5 5 4.5
10 Bynel Elvaloy 75/25 92 726 86 3.75 5 4 4 5 4
11 Bynel Elvaloy 25/75 89 764 101 3.25 5 4 3.5 5 3.5
12 Bynel Engage 75/25 94 895 93 3.75 5 3.75 4 5 4
13 Bynel Engage 25/75 94 688 102 2.25 5 2.75 2.75 5 2.25
14 Bynel Nordel 75/25 91 819 87 3.25 5 3.25 3.25 5 3.25
15 Bynel Nordel 25/75 84 753 76 3 5 3 3.75 5 3
16 Surlyn Engage 25/75 96 746 104 3.75 5 4.5 4.75 5 5
17 Cycolac Levapren 75/25 97 864 91 3.75 5 5 3.75 5 4
18 Cycolac Levapren 25/75 71 906 78 4 5 5 5 5 5
19 Cycolac Nordel 75/25 90 1024 93 3 5 5 3.5 5 4.7
20 Celcon Engage 25/75 70 1064 96 2.75 5 4.75 5 5.25 5
S/C code with CB
Polymer B Ratio A/BHardness
Shore ASa(nm)
CA
(degree)
S/C code with RIO
No. Polymer A

104
Annex 3.2 wet cleaning results for polymer blends with different ratios of components.
Annex 4
Annex 4.1. cleaning data for polymer blends in different CA groups
Annex 4.2. cleaning data for polymer blends in different roughness groups
PolymerA
100%75% 25%
PolymerB
100%
LDPE Levapren 2.7 3.7 4 3.7
PMMA Engage 1 2.7 4.7 3.7
Bynel Engage 1.3 3.7 4.7 3.7
Celcon SBR 2 2.5 4 2.3
Polymer A Polymer B
WC code with RIO
Polymer blends No.of samples
CA group WC S DC
95+ 3.15 ± 0.65 5 ± 0 3.85 ± 0.72 5
90-94 3.25 ± 0.61 4.94 ± 0.13 4.06 ± 1.2 4
85-89 3.31 ± 0.59 4.88 ± 0.25 3.69 ± 0.88 4
80-84 3.58 ± 0.72 5 ± 0 3.67 ± 0.58 3
80- 2.75 ± 0.35 4.5 ± 0.71 2.88 ± 0.18 2
Average code
Polymer blends No.of samples
Sa group WC S DC
900+ 3.25 ± 0.66 5 ± 0 4.92 ± 0.14 3
800+ 3.59 ± 0.8 4.8 ± 0 3.89 ± 0.95 5
700+ 3.39 ± 0.53 4.97 ± 0.08 3.67 ± 0.7 9
600+ 2.92 ± 0.95 4.83 ± 0.29 3.17 ± 0.72 3
Average code

105
Annex 4.3. cleaning data for polymer blends in different hardness groups
Polymer blends No.of samples
Hardness group WC S DC
95+ 3.13 ± 0.72 4.63 ± 0.48 3.56 ± 1.07 4
90+ 3.28 ± 0.65 4.97 ± 0.09 3.66 ± 0.8 8
80+ 3.35 ± 0.52 5 ± 0 3.75 ± 0.75 5
70+ 3.38 ± 0.88 5 ± 0 4.88 ± 0.18 2
60+ 4.7 ± 0 5 ± 0 4.7 ± 0 1
Average code