Embed Size (px)
Citation preview
MEASURING THE PERFORMANCE OF TRANSIT-ORIENTED DEVELOPMENTS
IN WESTERN AUSTRALIA
Planning and Transport Research Centre
A collaborative program of Curtin University of Technology, Edith Cowan University, Murdoch University and The University of Western Australia supported by the Government of Western Australia
in collaboration with:
Institute for Sustainability and Technology Policy Murdoch University
Written by:
John Luciano Renne, Ph.D., AICP
Assistant Professor of Urban Planning and Transportation Studies Associate Director, University of New Orleans Transportation Center
Department of Planning and Urban Studies School of Urban Planning and Regional Studies
College of Liberal Arts University of New Orleans
with the assistance of Les Chandra, Brendan Tippett, and Sreenivas Kolapalli
Sponsored by the Western Australian Department for Planning and Infrastructure and the Public Transport Authority of Western Australia
November 2007
Measuring the Performance of Transit-Oriented Developments in Western Australia
i
Executive Summary
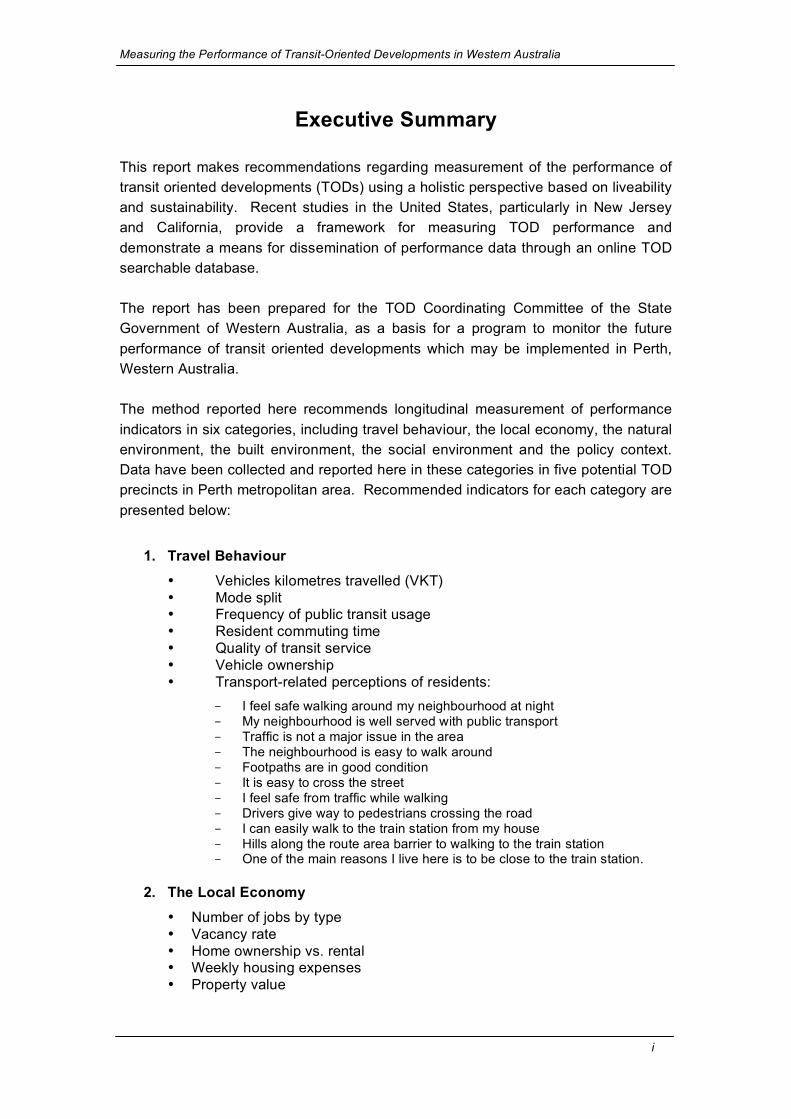
This report makes recommendations regarding measurement of the performance of transit oriented developments (TODs) using a holistic perspective based on liveability and sustainability. Recent studies in the United States, particularly in New Jersey and California, provide a framework for measuring TOD performance and demonstrate a means for dissemination of performance data through an online TOD searchable database. The report has been prepared for the TOD Coordinating Committee of the State Government of Western Australia, as a basis for a program to monitor the future performance of transit oriented developments which may be implemented in Perth, Western Australia. The method reported here recommends longitudinal measurement of performance indicators in six categories, including travel behaviour, the local economy, the natural environment, the built environment, the social environment and the policy context. Data have been collected and reported here in these categories in five potential TOD precincts in Perth metropolitan area. Recommended indicators for each category are presented below:
1. Travel Behaviour • Vehicles kilometres travelled (VKT) • Mode split • Frequency of public transit usage • Resident commuting time • Quality of transit service • Vehicle ownership • Transport-related perceptions of residents:
- I feel safe walking around my neighbourhood at night - My neighbourhood is well served with public transport - Traffic is not a major issue in the area - The neighbourhood is easy to walk around - Footpaths are in good condition - It is easy to cross the street - I feel safe from traffic while walking - Drivers give way to pedestrians crossing the road - I can easily walk to the train station from my house - Hills along the route area barrier to walking to the train station - One of the main reasons I live here is to be close to the train station.
2. The Local Economy
• Number of jobs by type • Vacancy rate • Home ownership vs. rental • Weekly housing expenses • Property value
Measuring the Performance of Transit-Oriented Developments in Western Australia
ii
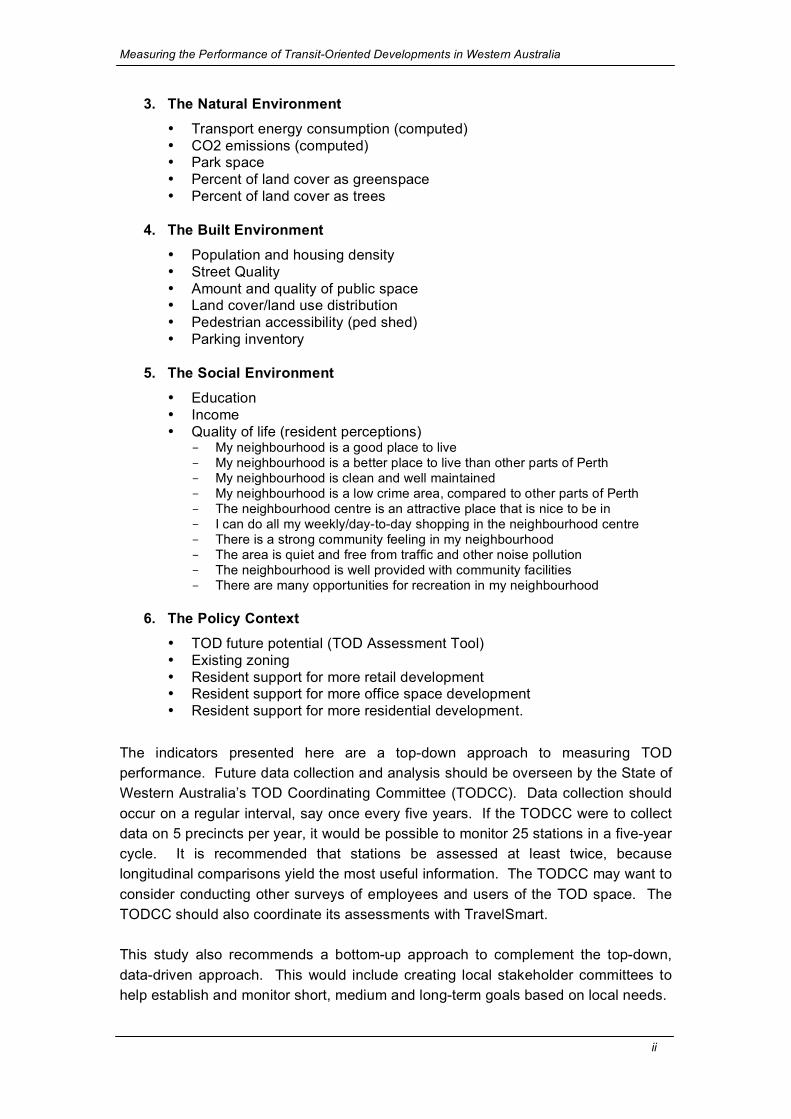
3. The Natural Environment • Transport energy consumption (computed) • CO2 emissions (computed) • Park space • Percent of land cover as greenspace • Percent of land cover as trees
4. The Built Environment
• Population and housing density • Street Quality • Amount and quality of public space • Land cover/land use distribution • Pedestrian accessibility (ped shed) • Parking inventory
5. The Social Environment • Education • Income • Quality of life (resident perceptions)
- My neighbourhood is a good place to live - My neighbourhood is a better place to live than other parts of Perth - My neighbourhood is clean and well maintained - My neighbourhood is a low crime area, compared to other parts of Perth - The neighbourhood centre is an attractive place that is nice to be in - I can do all my weekly/day-to-day shopping in the neighbourhood centre - There is a strong community feeling in my neighbourhood - The area is quiet and free from traffic and other noise pollution - The neighbourhood is well provided with community facilities - There are many opportunities for recreation in my neighbourhood
6. The Policy Context
• TOD future potential (TOD Assessment Tool) • Existing zoning • Resident support for more retail development • Resident support for more office space development • Resident support for more residential development.
The indicators presented here are a top-down approach to measuring TOD performance. Future data collection and analysis should be overseen by the State of Western Australia’s TOD Coordinating Committee (TODCC). Data collection should occur on a regular interval, say once every five years. If the TODCC were to collect data on 5 precincts per year, it would be possible to monitor 25 stations in a five-year cycle. It is recommended that stations be assessed at least twice, because longitudinal comparisons yield the most useful information. The TODCC may want to consider conducting other surveys of employees and users of the TOD space. The TODCC should also coordinate its assessments with TravelSmart. This study also recommends a bottom-up approach to complement the top-down, data-driven approach. This would include creating local stakeholder committees to help establish and monitor short, medium and long-term goals based on local needs.
Measuring the Performance of Transit-Oriented Developments in Western Australia
1
Introduction
Transit-oriented development (TOD) is gaining wide acceptance in Australia as a tool
to achieve sustainable development, particularly in Western Australia (WA). Hope for
the Future: The Western Australian State Sustainability Strategy (2003) discusses
the need to manage growth, revitalise declining centres and suburbs, and integrate
land use with balanced transport to reduce automobile dependence. TOD seeks to
accomplish these goals, creating compact, mixed-use, pedestrian-friendly precincts
around major public transport stations. Network City: Community Planning Strategy
for Perth and Peel (Government of Western Australia, 2004) calls for 60 per cent of
future development to occur as ‘infill’. An important way this can occur, without
generating significant additional traffic congestion across Perth, is in the form on
TOD.
TOD is facilitated in Perth through the State’s TOD Coordinating Committee
(TODCC), a cross-agency partnership including the State’s Department for Planning
and Infrastructure (DPI), Public Transport Authority (TransPerth), Department of
Housing and Works (DHW), Main Roads WA, LandCorp (the WA Land Commission),
the East Perth and Midland Redevelopment Authorities (EPRA and MRA), and the
WA Local Government Association. The TODCC recently finalised a ‘TOD
Assessment Tool’ for the purpose of evaluating and prioritising station precincts for
potential TOD development.
This report sets forth a framework for establishing a set of baseline-data key
performance indicators to measure the success of TODs where they are
implemented across Perth. The aim is to assess the post-implementation
performance of TODs by comparing their outcomes with the baseline data; typically
this longitudinal assessment would be done by means of periodic data collection at
regular intervals over say 5 years after formal implementation.
The study also tests the feasibility of collecting data for a number of indicators across
multiple dimensions, including travel behaviour, the local economy, the natural, built
and social environments, and the policy context. The goals of this study were to
recommend to the TOD Committee in Western Australia a number of key
performance indicators for TOD developments in Perth and to evaluate the feasibility
of collecting relevant data for ongoing TOD monitoring.
Measuring the Performance of Transit-Oriented Developments in Western Australia
2
Background
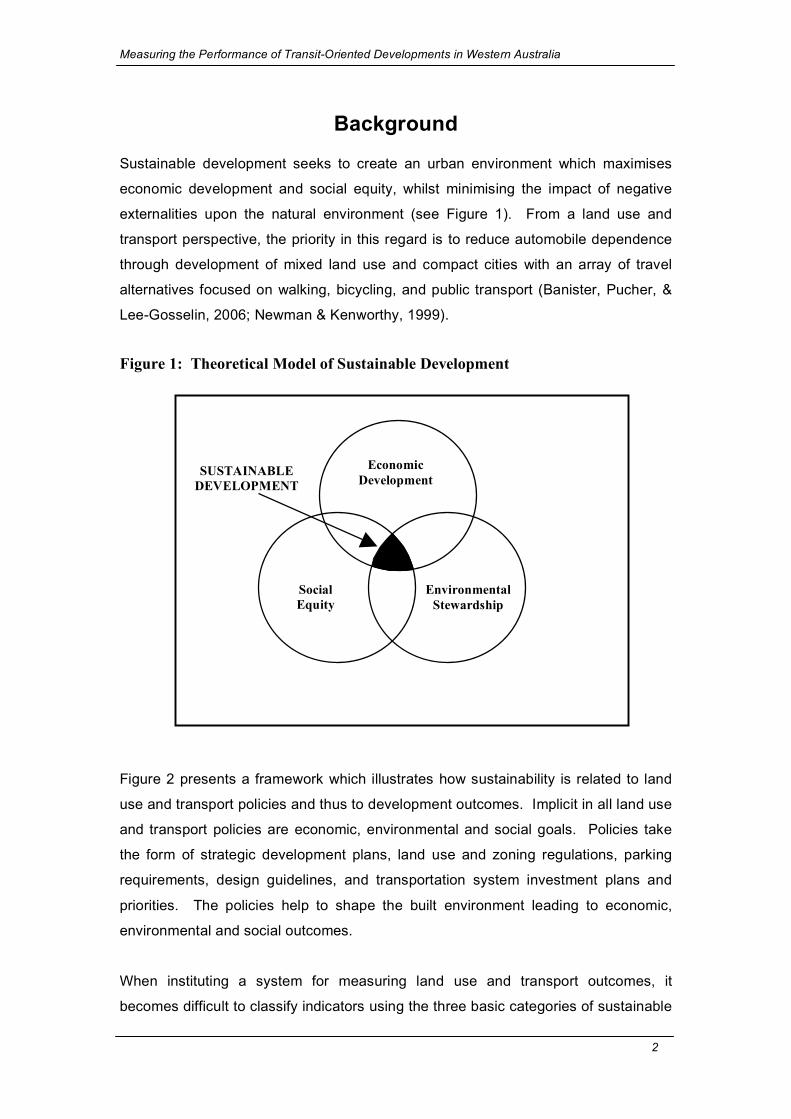
Sustainable development seeks to create an urban environment which maximises
economic development and social equity, whilst minimising the impact of negative
externalities upon the natural environment (see Figure 1). From a land use and
transport perspective, the priority in this regard is to reduce automobile dependence
through development of mixed land use and compact cities with an array of travel
alternatives focused on walking, bicycling, and public transport (Banister, Pucher, &
Lee-Gosselin, 2006; Newman & Kenworthy, 1999).
Figure 1: Theoretical Model of Sustainable Development
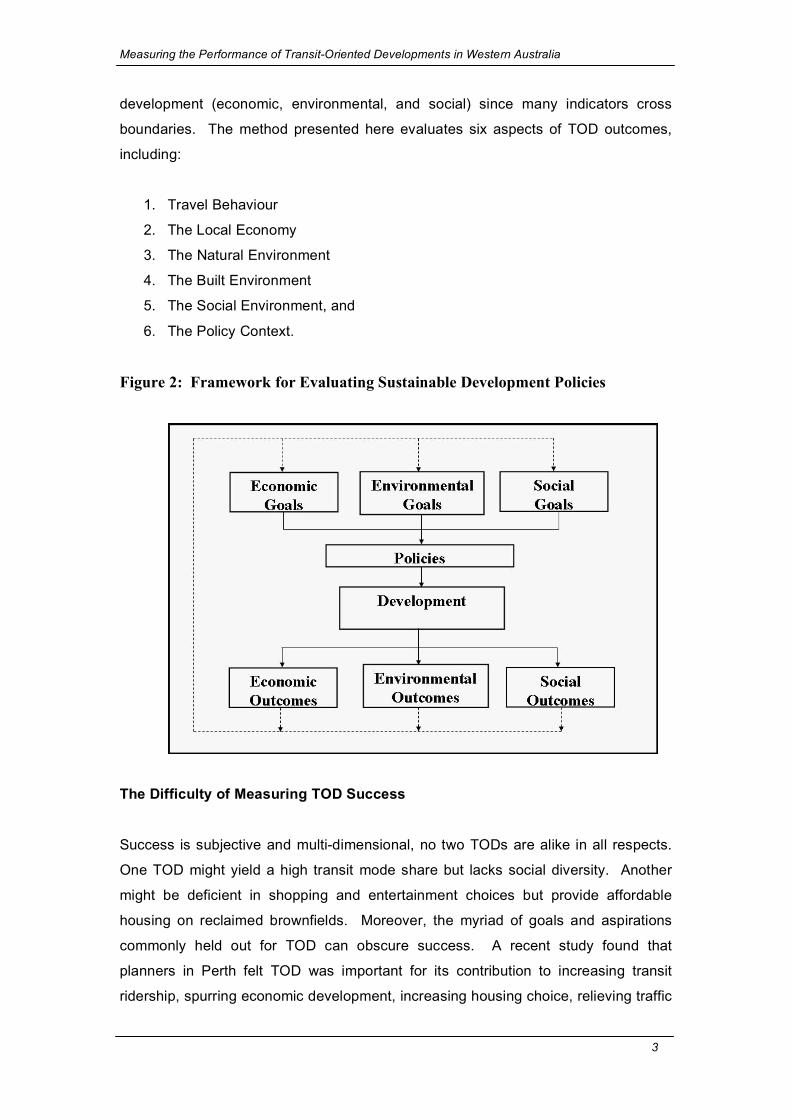
Figure 2 presents a framework which illustrates how sustainability is related to land
use and transport policies and thus to development outcomes. Implicit in all land use
and transport policies are economic, environmental and social goals. Policies take
the form of strategic development plans, land use and zoning regulations, parking
requirements, design guidelines, and transportation system investment plans and
priorities. The policies help to shape the built environment leading to economic,
environmental and social outcomes.
When instituting a system for measuring land use and transport outcomes, it
becomes difficult to classify indicators using the three basic categories of sustainable
Economic Development
Social Equity
Environmental Stewardship
SUSTAINABLE DEVELOPMENT
Measuring the Performance of Transit-Oriented Developments in Western Australia
3
development (economic, environmental, and social) since many indicators cross
boundaries. The method presented here evaluates six aspects of TOD outcomes,
including:
1. Travel Behaviour
2. The Local Economy
3. The Natural Environment
4. The Built Environment
5. The Social Environment, and
6. The Policy Context.
Figure 2: Framework for Evaluating Sustainable Development Policies
The Difficulty of Measuring TOD Success
Success is subjective and multi-dimensional, no two TODs are alike in all respects.
One TOD might yield a high transit mode share but lacks social diversity. Another
might be deficient in shopping and entertainment choices but provide affordable
housing on reclaimed brownfields. Moreover, the myriad of goals and aspirations
commonly held out for TOD can obscure success. A recent study found that
planners in Perth felt TOD was important for its contribution to increasing transit
ridership, spurring economic development, increasing housing choice, relieving traffic
Measuring the Performance of Transit-Oriented Developments in Western Australia
4
congestion, reducing sprawl, creating a diverse community, improving
neighbourhood quality, and increasing political support for transit (Renne, 2005a).
With so many goals for TOD, measuring success becomes a matter of balance and
perspective.
To achieve this balance and perspective, the evaluation of TOD should be both
cross-sectional and longitudinal. Indicators of performance can compare a TOD with
regional and sub-regional averages, since TODs function as part of a larger whole.
This approach is better than a matched-pair analysis, which is sometimes suggested
for comparing TODs to similar developments not built near a transit node. The
problem with matched-pair analysis is that it is often impossible to find two
developments that exhibit similar characteristics for comparison purposes; when a
cross-sectional comparison is made it is therefore usually only one or two-
dimensional. After creating baseline data, future TOD outcomes should also be
compared longitudinally to determine if individual TODs are becoming more
sustainable over time.
A Focus on Travel Behaviour, Vehicle Ownership, Property Values, and Markets
Past studies have focused mainly on only a few aspects of success – travel
behaviour, vehicle ownership, property values and understanding markets for
location in TOD precincts. Several studies have looked at commuting behaviours in
TODs. A 2003 study of TODs across California found that residents were up to five
times more likely to commute via transit compared to non-TOD areas (Lund, Cervero,
& Willson, 2004). In the San Francisco Bay Area, Cervero (1994) found that, “[o]n
average, residents living near stations were five times as likely to commute by rail
transit as the average worker living in the same city, and in some cases as much as
seven times as likely” (Cervero, 1994, p. 177). Another study of 103 TODs across
twelve regions in America found that, on average, residents were 2 – 2.5 times more
likely to commute on transit compared to the average resident of the region (Renne,
2005b).
Studies which investigate non-commute trips in TODs have been less conclusive on
travel behaviour impacts (Boarnet & Crane, 2001), although Chatman (2006) found
that residents and employees near rail stations have a higher non-auto share of
commuting and non-work travel. He attributed the effects mainly to the level of
Measuring the Performance of Transit-Oriented Developments in Western Australia
5
convenience (or inconvenience) in using an automobile. His study also found higher
shares of non-auto use closer to job centres.
TOD households exhibit lower automobile ownership in comparison to regional
averages. One study found that American households near train stations owned 0.9
cars per household compared to 1.6 cars per household across regions (Center for
Transit-Oriented Development, 2004). A study of 103 TODs by Renne (Renne,
2005b) found that 37 percent of TOD households owned two or more cars compared
to 55 percent of regional households.
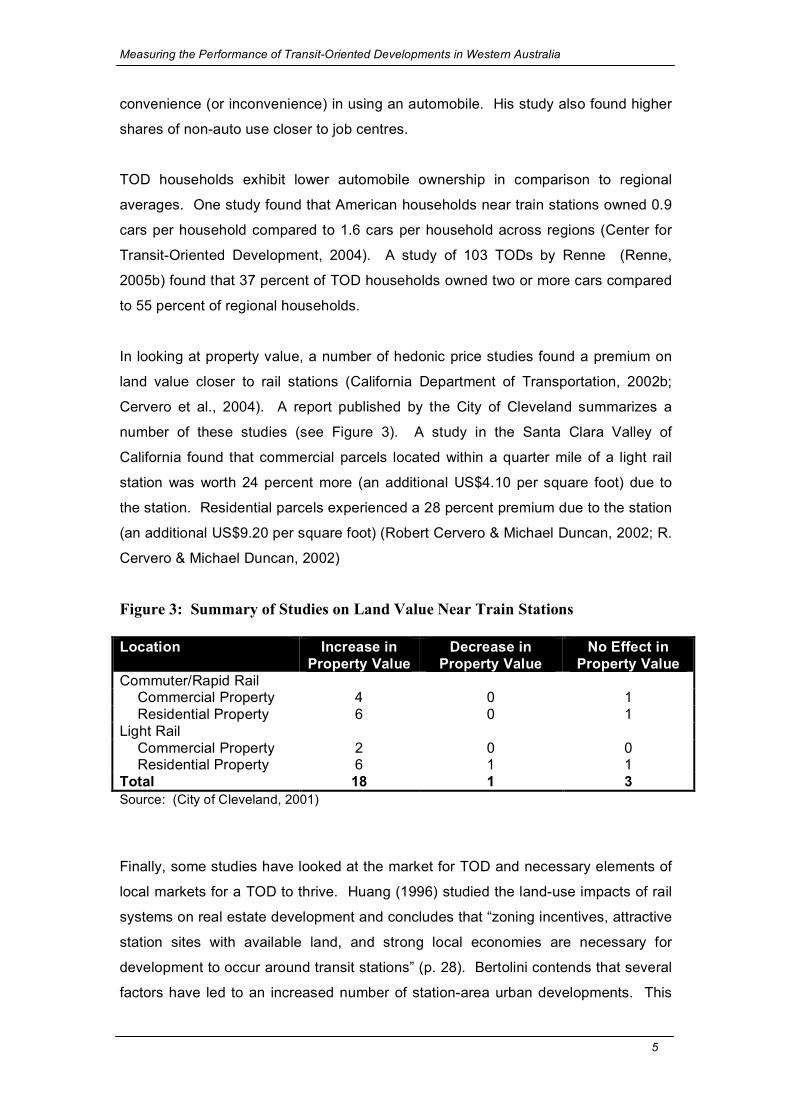
In looking at property value, a number of hedonic price studies found a premium on
land value closer to rail stations (California Department of Transportation, 2002b;
Cervero et al., 2004). A report published by the City of Cleveland summarizes a
number of these studies (see Figure 3). A study in the Santa Clara Valley of
California found that commercial parcels located within a quarter mile of a light rail
station was worth 24 percent more (an additional US$4.10 per square foot) due to
the station. Residential parcels experienced a 28 percent premium due to the station
(an additional US$9.20 per square foot) (Robert Cervero & Michael Duncan, 2002; R.
Cervero & Michael Duncan, 2002)
Figure 3: Summary of Studies on Land Value Near Train Stations Location Increase in
Property Value Decrease in
Property Value No Effect in
Property Value Commuter/Rapid Rail
Commercial Property 4 0 1 Residential Property 6 0 1
Light Rail Commercial Property 2 0 0 Residential Property 6 1 1
Total 18 1 3 Source: (City of Cleveland, 2001)
Finally, some studies have looked at the market for TOD and necessary elements of
local markets for a TOD to thrive. Huang (1996) studied the land-use impacts of rail
systems on real estate development and concludes that “zoning incentives, attractive
station sites with available land, and strong local economies are necessary for
development to occur around transit stations” (p. 28). Bertolini contends that several
factors have led to an increased number of station-area urban developments. This
Measuring the Performance of Transit-Oriented Developments in Western Australia
6
includes the expansion of high-speed rail systems across Europe and Asia and light
rail systems across the United States, an increased process of privatisation of railway
companies, a decreased presence of manufacturing in cities, and attempts to make
urban areas compete more effectively in attracting new residents (Bertolini, 2007).
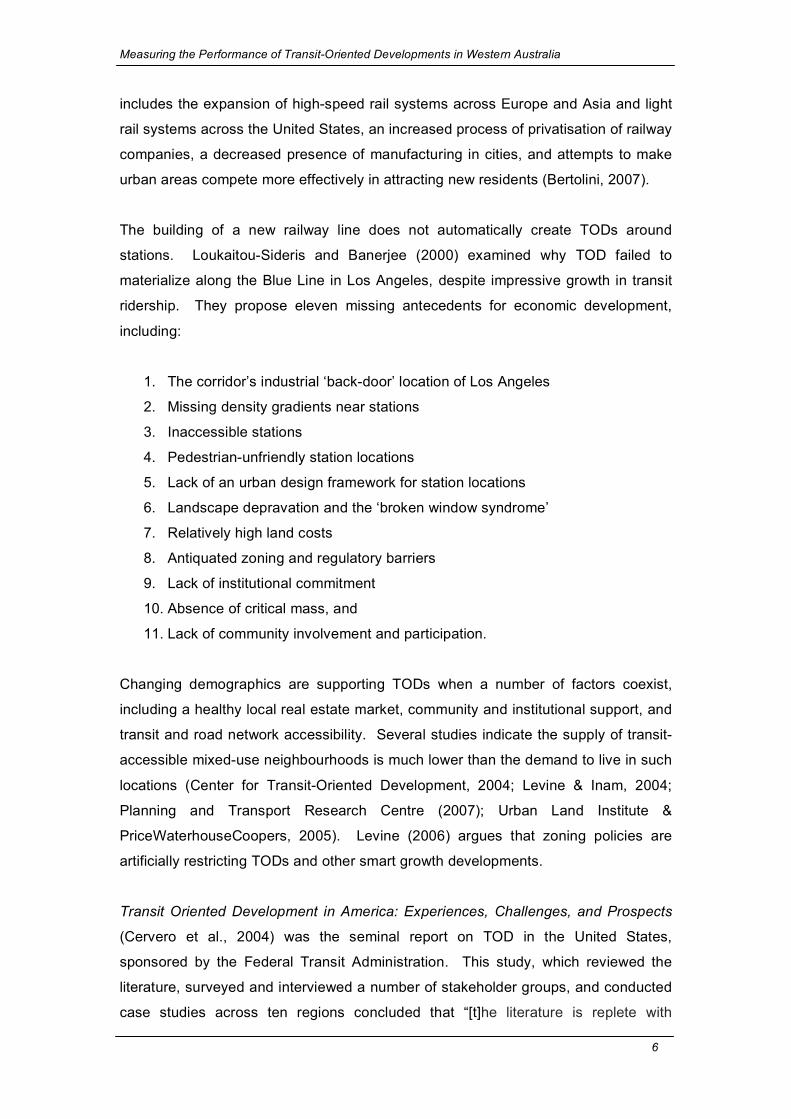
The building of a new railway line does not automatically create TODs around
stations. Loukaitou-Sideris and Banerjee (2000) examined why TOD failed to
materialize along the Blue Line in Los Angeles, despite impressive growth in transit
ridership. They propose eleven missing antecedents for economic development,
including:
1. The corridor’s industrial ‘back-door’ location of Los Angeles
2. Missing density gradients near stations
3. Inaccessible stations
4. Pedestrian-unfriendly station locations
5. Lack of an urban design framework for station locations
6. Landscape depravation and the ‘broken window syndrome’
7. Relatively high land costs
8. Antiquated zoning and regulatory barriers
9. Lack of institutional commitment
10. Absence of critical mass, and
11. Lack of community involvement and participation.
Changing demographics are supporting TODs when a number of factors coexist,
including a healthy local real estate market, community and institutional support, and
transit and road network accessibility. Several studies indicate the supply of transit-
accessible mixed-use neighbourhoods is much lower than the demand to live in such
locations (Center for Transit-Oriented Development, 2004; Levine & Inam, 2004;
Planning and Transport Research Centre (2007); Urban Land Institute &
PriceWaterhouseCoopers, 2005). Levine (2006) argues that zoning policies are
artificially restricting TODs and other smart growth developments.
Transit Oriented Development in America: Experiences, Challenges, and Prospects
(Cervero et al., 2004) was the seminal report on TOD in the United States,
sponsored by the Federal Transit Administration. This study, which reviewed the
literature, surveyed and interviewed a number of stakeholder groups, and conducted
case studies across ten regions concluded that “[t]he literature is replete with
Measuring the Performance of Transit-Oriented Developments in Western Australia
7
platitudes that have been heaped on the TOD concept; however, relatively few
serious studies have been carried out that assign benefits to TOD in any quantitative
or monetary sense. For the most part, anecdotes and story lines are relied on
instead” (p. 119). The study went on to note that transit ridership impacts and land
value gains were the areas with the most amount of quantitative research.
Studies in Holistic Measurement of TOD Success
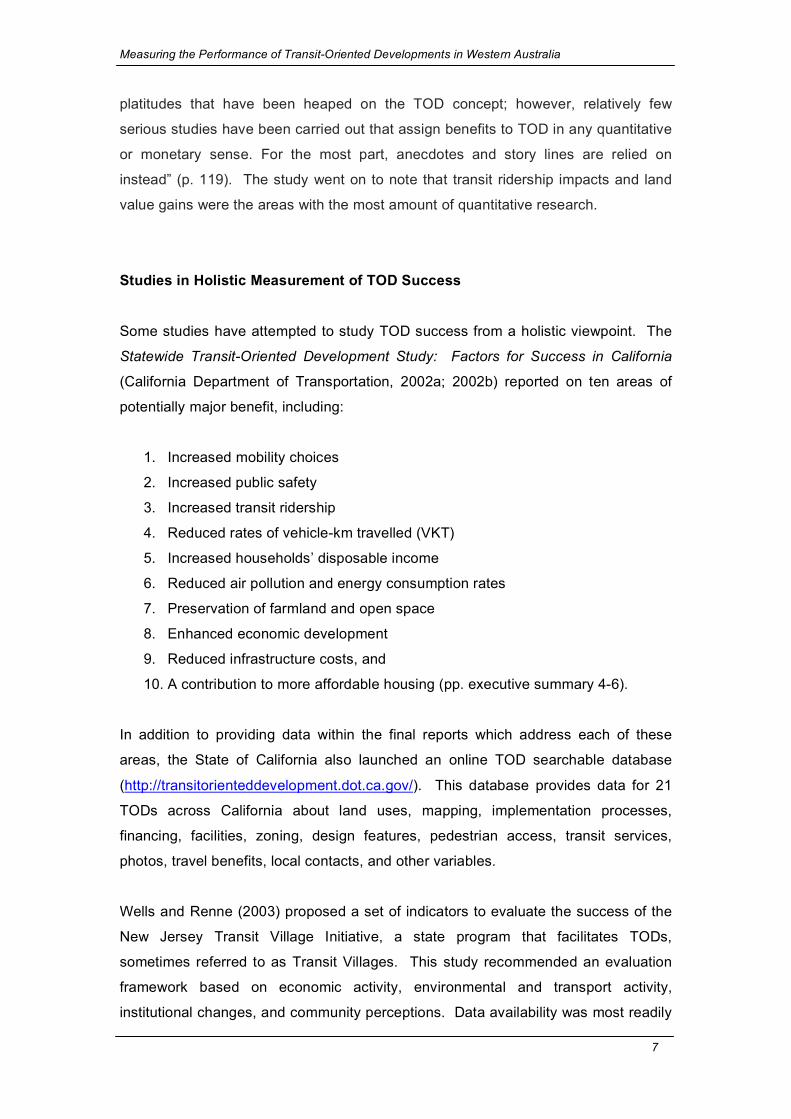
Some studies have attempted to study TOD success from a holistic viewpoint. The
Statewide Transit-Oriented Development Study: Factors for Success in California
(California Department of Transportation, 2002a; 2002b) reported on ten areas of
potentially major benefit, including:
1. Increased mobility choices
2. Increased public safety
3. Increased transit ridership
4. Reduced rates of vehicle-km travelled (VKT)
5. Increased households’ disposable income
6. Reduced air pollution and energy consumption rates
7. Preservation of farmland and open space
8. Enhanced economic development
9. Reduced infrastructure costs, and
10. A contribution to more affordable housing (pp. executive summary 4-6).
In addition to providing data within the final reports which address each of these
areas, the State of California also launched an online TOD searchable database
(http://transitorienteddevelopment.dot.ca.gov/). This database provides data for 21
TODs across California about land uses, mapping, implementation processes,
financing, facilities, zoning, design features, pedestrian access, transit services,
photos, travel benefits, local contacts, and other variables.
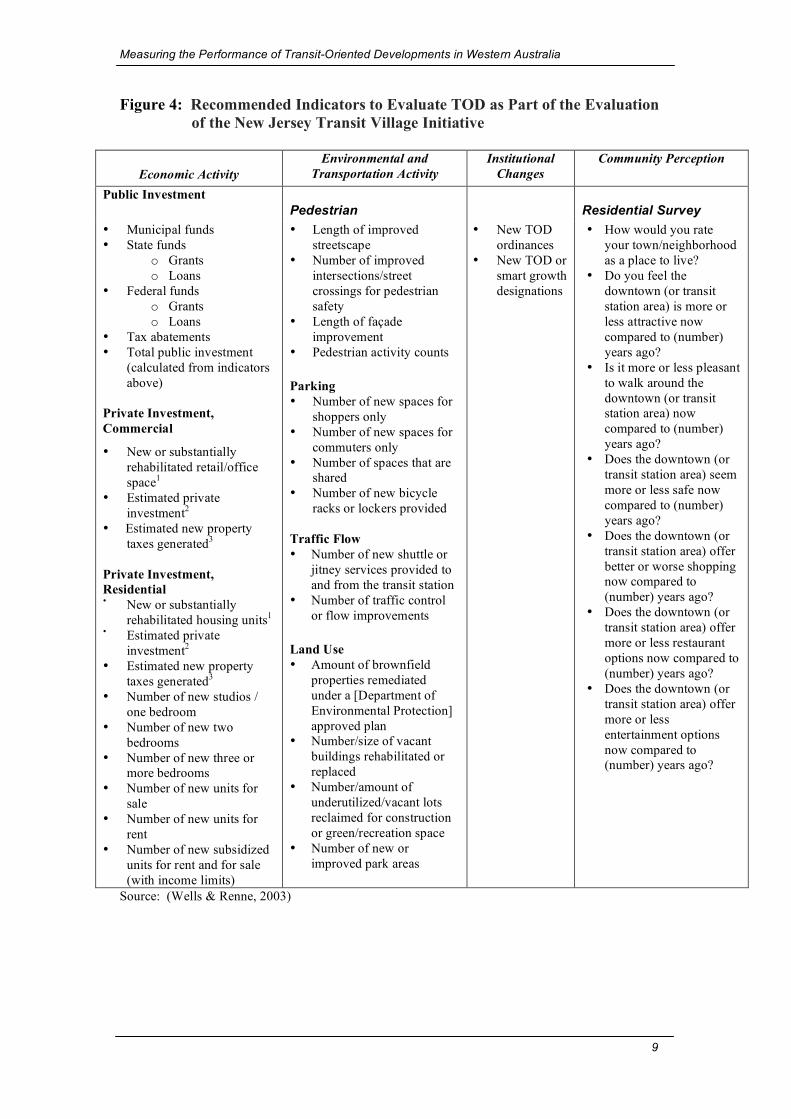
Wells and Renne (2003) proposed a set of indicators to evaluate the success of the
New Jersey Transit Village Initiative, a state program that facilitates TODs,
sometimes referred to as Transit Villages. This study recommended an evaluation
framework based on economic activity, environmental and transport activity,
institutional changes, and community perceptions. Data availability was most readily
Measuring the Performance of Transit-Oriented Developments in Western Australia
8
available for economic activity, travel behaviour, and public perception. Figure 4
illustrates the indicators suggested for each of the categories. In attempting to collect
the data, it was found that significant data were missing and difficult to obtain.
Subsequent efforts to work with local and state governments in New Jersey met with
some difficulty in collecting data, as many of the variables were unavailable or
available only in paper format from municipal libraries. Due to the time consuming
effort required to collect the data, designated Transit Villages were encouraged to
collect and report data to the State for analysis by researchers at Rutgers University.
This led to a series of reports as part of the Transit Village Monitoring Research
program (available at: http://www.policy.rutgers.edu/vtc/tod/tod_projects.html).
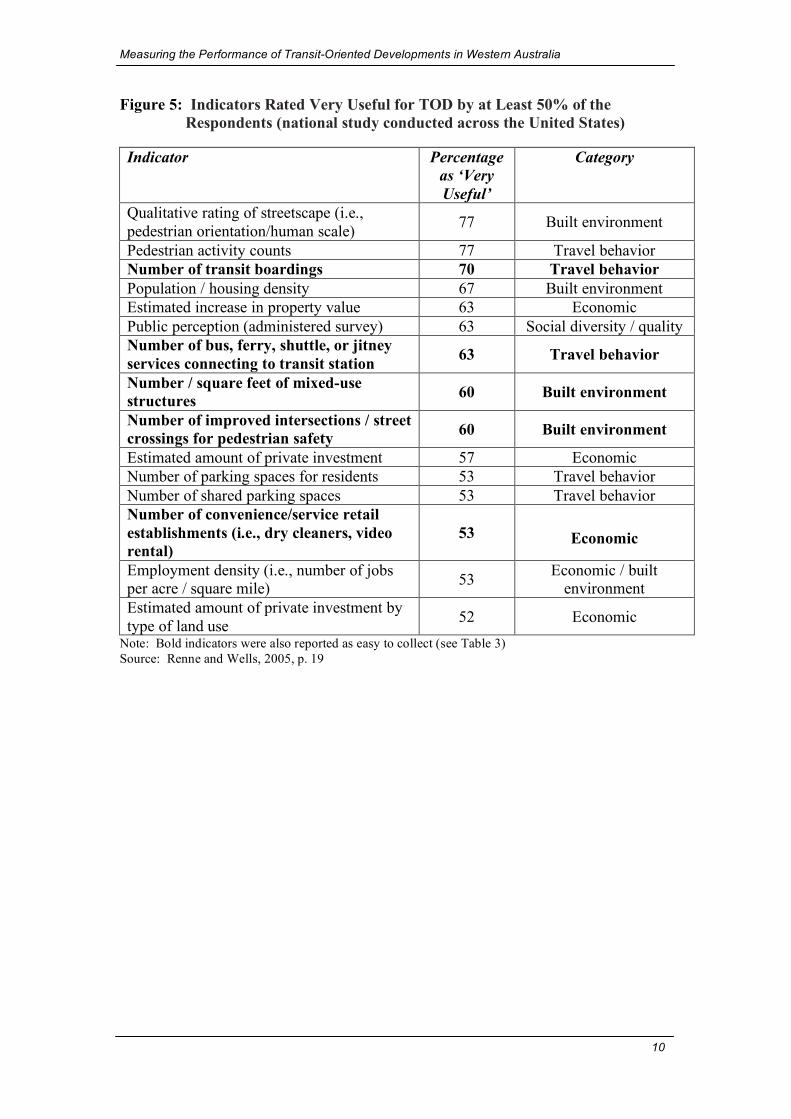
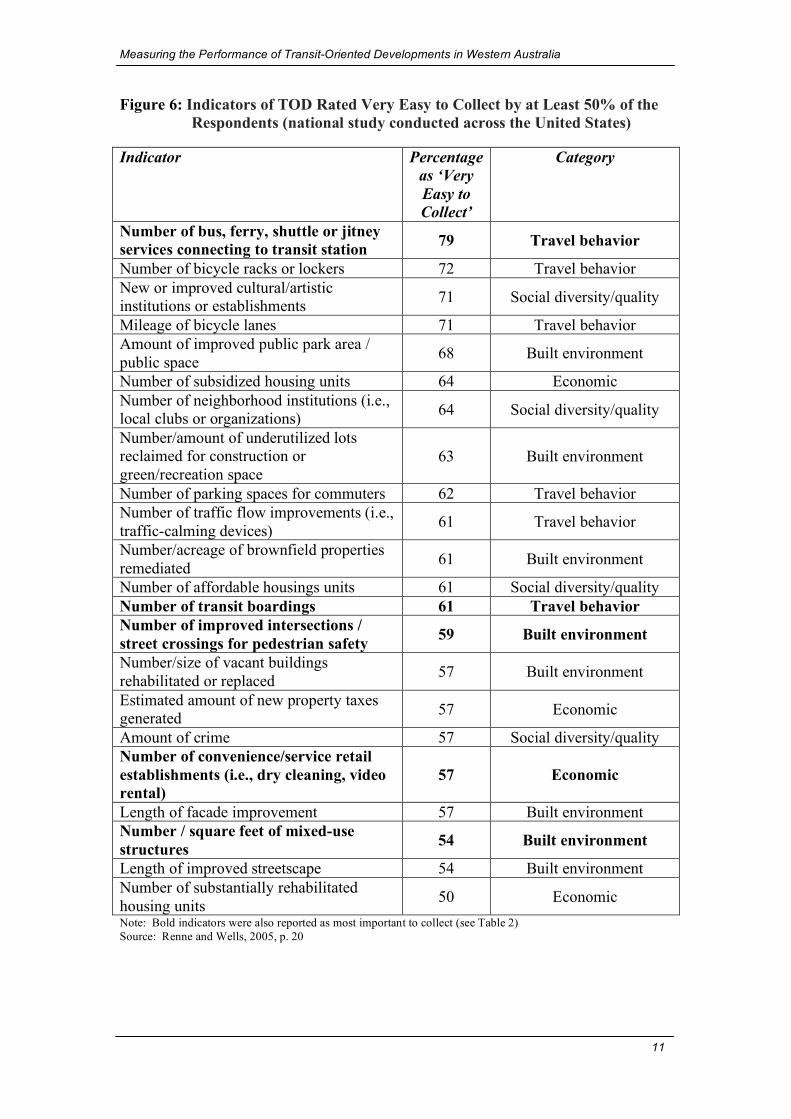
The findings in New Jersey prompted a national study, to determine what benefits
and measures of TOD were reported by local, county, state departments of
transportation and transit agencies across the United States (Transit-Oriented
Development: Developing a Strategy to Measure Success, (2005). This study
revealed 56 indicators, categorized as: travel behaviour, economic performance,
environmental performance, the built environment and social benefits. The findings
from this study revealed that half of the agencies surveyed had access to five or
fewer indicators to measure these criteria. While the study sought to determine
which indicators were most useful and easiest indicators to collect (see Figures 5 and
6) it did not include actual data collection for any of the indicators.
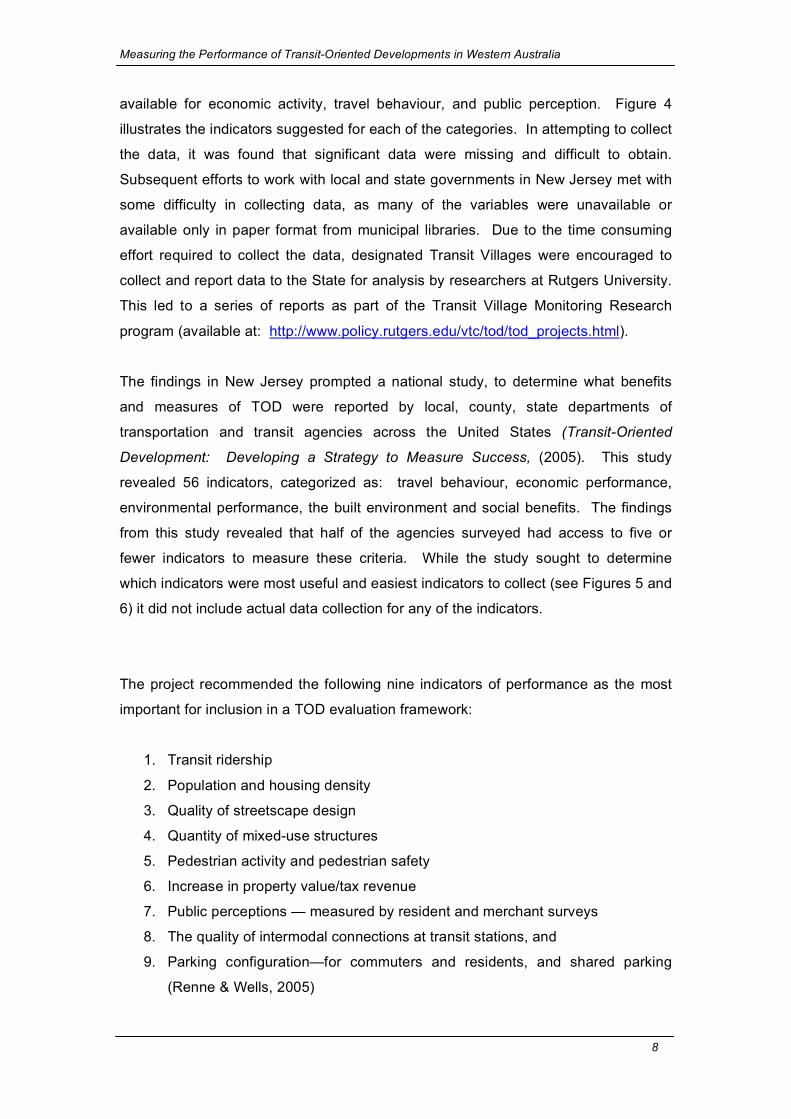
The project recommended the following nine indicators of performance as the most
important for inclusion in a TOD evaluation framework:
1. Transit ridership
2. Population and housing density
3. Quality of streetscape design
4. Quantity of mixed-use structures
5. Pedestrian activity and pedestrian safety
6. Increase in property value/tax revenue
7. Public perceptions — measured by resident and merchant surveys
8. The quality of intermodal connections at transit stations, and
9. Parking configuration—for commuters and residents, and shared parking
(Renne & Wells, 2005)
Measuring the Performance of Transit-Oriented Developments in Western Australia
9
Figure 4: Recommended Indicators to Evaluate TOD as Part of the Evaluation of the New Jersey Transit Village Initiative
Economic Activity Environmental and
Transportation Activity Institutional
Changes Community Perception
Public Investment Pedestrian
Residential Survey
• Municipal funds • State funds
o Grants o Loans
• Federal funds o Grants o Loans
• Tax abatements • Total public investment
(calculated from indicators above)
Private Investment, Commercial
• New or substantially rehabilitated retail/office space1
• Estimated private investment2
• Estimated new property taxes generated3
Private Investment, Residential • New or substantially
rehabilitated housing units1
• Estimated private investment2
• Estimated new property taxes generated3
• Number of new studios / one bedroom
• Number of new two bedrooms
• Number of new three or more bedrooms
• Number of new units for sale
• Number of new units for rent
• Number of new subsidized units for rent and for sale (with income limits)
• Length of improved streetscape
• Number of improved intersections/street crossings for pedestrian safety
• Length of façade improvement
• Pedestrian activity counts Parking • Number of new spaces for
shoppers only • Number of new spaces for
commuters only • Number of spaces that are
shared • Number of new bicycle
racks or lockers provided Traffic Flow • Number of new shuttle or
jitney services provided to and from the transit station
• Number of traffic control or flow improvements
Land Use • Amount of brownfield
properties remediated under a [Department of Environmental Protection] approved plan
• Number/size of vacant buildings rehabilitated or replaced
• Number/amount of underutilized/vacant lots reclaimed for construction or green/recreation space
• Number of new or improved park areas
• New TOD ordinances
• New TOD or smart growth designations
• How would you rate your town/neighborhood as a place to live?
• Do you feel the downtown (or transit station area) is more or less attractive now compared to (number) years ago?
• Is it more or less pleasant to walk around the downtown (or transit station area) now compared to (number) years ago?
• Does the downtown (or transit station area) seem more or less safe now compared to (number) years ago?
• Does the downtown (or transit station area) offer better or worse shopping now compared to (number) years ago?
• Does the downtown (or transit station area) offer more or less restaurant options now compared to (number) years ago?
• Does the downtown (or transit station area) offer more or less entertainment options now compared to (number) years ago?
Source: (Wells & Renne, 2003)
Measuring the Performance of Transit-Oriented Developments in Western Australia
10
Figure 5: Indicators Rated Very Useful for TOD by at Least 50% of the Respondents (national study conducted across the United States)
Indicator Percentage
as ‘Very Useful’
Category
Qualitative rating of streetscape (i.e., pedestrian orientation/human scale) 77 Built environment
Pedestrian activity counts 77 Travel behavior Number of transit boardings 70 Travel behavior Population / housing density 67 Built environment Estimated increase in property value 63 Economic Public perception (administered survey) 63 Social diversity / quality Number of bus, ferry, shuttle, or jitney services connecting to transit station 63 Travel behavior
Number / square feet of mixed-use structures 60 Built environment
Number of improved intersections / street crossings for pedestrian safety 60 Built environment
Estimated amount of private investment 57 Economic Number of parking spaces for residents 53 Travel behavior Number of shared parking spaces 53 Travel behavior Number of convenience/service retail establishments (i.e., dry cleaners, video rental)
53 Economic
Employment density (i.e., number of jobs per acre / square mile) 53 Economic / built
environment Estimated amount of private investment by type of land use 52 Economic
Note: Bold indicators were also reported as easy to collect (see Table 3) Source: Renne and Wells, 2005, p. 19
Measuring the Performance of Transit-Oriented Developments in Western Australia
11
Figure 6: Indicators of TOD Rated Very Easy to Collect by at Least 50% of the Respondents (national study conducted across the United States)
Indicator Percentage
as ‘Very Easy to Collect’
Category
Number of bus, ferry, shuttle or jitney services connecting to transit station 79 Travel behavior
Number of bicycle racks or lockers 72 Travel behavior New or improved cultural/artistic institutions or establishments 71 Social diversity/quality
Mileage of bicycle lanes 71 Travel behavior Amount of improved public park area / public space 68 Built environment
Number of subsidized housing units 64 Economic Number of neighborhood institutions (i.e., local clubs or organizations) 64 Social diversity/quality
Number/amount of underutilized lots reclaimed for construction or green/recreation space
63 Built environment
Number of parking spaces for commuters 62 Travel behavior Number of traffic flow improvements (i.e., traffic-calming devices) 61 Travel behavior
Number/acreage of brownfield properties remediated 61 Built environment
Number of affordable housings units 61 Social diversity/quality Number of transit boardings 61 Travel behavior Number of improved intersections / street crossings for pedestrian safety 59 Built environment
Number/size of vacant buildings rehabilitated or replaced 57 Built environment
Estimated amount of new property taxes generated 57 Economic
Amount of crime 57 Social diversity/quality Number of convenience/service retail establishments (i.e., dry cleaning, video rental)
57 Economic
Length of facade improvement 57 Built environment Number / square feet of mixed-use structures 54 Built environment
Length of improved streetscape 54 Built environment Number of substantially rehabilitated housing units 50 Economic Note: Bold indicators were also reported as most important to collect (see Table 2) Source: Renne and Wells, 2005, p. 20
Measuring the Performance of Transit-Oriented Developments in Western Australia
12
Methodology
This study was commissioned jointly by two agencies in the State of Western
Australia (WA), the Department for Planning and Infrastructure (DPI) and the Public
Transport Authority (PTA), both members of a state TOD Coordinating Committee
(TODCC). Other members of the TODCC include Main Roads WA, the East Perth
and Midland Redevelopment Authorities, the Department of Housing and Works, and
the WA Local Government Association. The TODCC coordinates and prioritizes
TOD initiatives in the metropolitan area of Perth (the State’s capital city) for
encouragement by the State government. The Committee recently developed a
‘TOD Assessment Tool’, to assist in prioritizing stations to receive capital
investments, and works closely with local government in the Perth metropolitan area.
It has ranked all stations on Perth’s commuter rail system with respect to public and
or private partnership potential, strategic significance of location in the urban centres
hierarchy, and potential for maximising transit ridership, development opportunities
and socio-economic benefits.
As the TODCC recommends state resources be directed to encouraging creation of
TODs, they would like a way to track subsequent outcomes from implementation.
This tool was commissioned to be flexible so progress could be measured across a
variety of benefit types. The goal of the study was to develop a method for
measuring the performance of TODs in Perth against selected economic,
environmental, social, and other performance criteria, and to establish the structure
for a database required to undertake on-going periodic performance measurement.
Therefore, while collecting data was an important part of the study, an equally
important part of the project was to test which data were available for collection. This
study has established a baseline against which future analyses can be measured.
The project began by selecting five transit precincts for analysis. This selection was
done by the study researchers and planners from DPI and PTA, who sought to
identify five stations which were representative of the different types of stations
across Perth’s transit system. The five stations selected were:
1. Mosman Park, a relatively compact, mixed-use and mixed-income
established suburb
Measuring the Performance of Transit-Oriented Developments in Western Australia
13
2. Subiaco, an awarding-winning textbook TOD build in the early 2000s, which
has been so successful that property values have priced out most lower-
income residents
3. Maylands, a lower/middle-income suburb close to central Perth with an
underutilized mainstreet and commercial centre
4. Joondalup, an awarding-winning New Urbanist outer-fringe new ‘town’ built in
the early 1990s, which some argue has not taken full advantage of the train
station within the urban fabric, and
5. Glendalough, a station surrounded by car-oriented land uses that is hostile
towards pedestrians.
The next step was to identify appropriate data categories, performance indicators
and data sources. The project team then embarked on collecting the data, working
with local and state governments to collect as much secondary data as possible
before primary data collection. Our primary data collection sought to identify
performance within approximately 800-metre station precincts, but some of the
secondary data sources did not allow for an analysis at such a fine geographic scale.
Primary data collection took the form of site visits and a Household Survey
administered in all of the five selected study areas. The purpose of the primary data
collection, particularly the household survey, was to collect important data to gauge
perceived and actual measures of liveability and sustainability. The entire data
collection (primary and secondary data) effort served two purposes:
1. To test which data were available to collect through primary and secondary
sources
2. To establish a baseline set of data to measure future performance
The site visits sought to collect indicators from field observation, whereas the
Household Survey aimed to collect data from households living within the study
areas. 2,503 households were randomly selected across the five study area.
Because the Joondalup study area had only 364 households within the station
precinct, all of these households were selected. In each of the remaining four study
areas, 535 households were randomly selected and sent surveys (534 households in
Glendalough). A letter was sent by the study team to each selected household
stating that it had been selected to participate in a study and that they would soon be
Measuring the Performance of Transit-Oriented Developments in Western Australia
14
receiving a questionnaire that was important for the future of planning in Perth (see
Appendix A for the cover letter and questionnaire. The first round of questionnaires
were mailed within a week after this initial letter. To generate the highest possible
response rate, each packet contained an introductory letter, an eight page
questionnaire, and a postcard to return separately (to ensure complete anonymity for
subsequent responses). After two weeks, households that did not return postcards
were sent a second round of questionnaires.
In total, 332 surveys were returned as bad addresses resulting in 2,171 surveys sent
to valid households. A total of 848 completed questionnaires were returned, giving a
response rate of 39.1 percent of households with valid addresses. This response
rate is in line with another household TOD mail survey using a similar methodology
(a household mail questionnaire of three TODs in New Jersey recently resulted in a
response rate of 40 percent (Renne & Wells, 2003)).
It is important to note the limitations of the methodology used for this study. Many of
the indicators draw from secondary data sources, so the data may contain biases
inherent in the methodologies used for the original collection of data. As for the
primary data collection, which sought to elicit a range of attitudinal data, the TOD
Household Survey may be biased as a consequence of respondents’ self selection:
those who have the strongest opinions are perhaps more likely to complete and
return the questionnaire. Moreover, since we surveyed only households that live
within 800 metres of a train station, the habits of the population might be skewed
compared to the general population due to locational self-selection. Despite these
limitations, the collection of these data represent one of the first attempts to amass
such a broad set of indicators to assist in measuring the success of TOD based on a
sustainability framework.
Measuring the Performance of Transit-Oriented Developments in Western Australia
15
Travel Behavior
Figure 7 lists the potential measures, indicators, and possible data sources for
measuring travel behaviour of residents living in TODs, while Figure 8 reports
information collected from secondary data sources. Three cells pertaining to vehicle
kilometres travelled (see reverse coloured cells) are identified because the data
seem unreliable, probably due to the small sample sizes in the limited areas chosen
for this study. This data comes from the Perth and Regional Travel Survey (PARTS)
which surveyed 14,651 households across the Perth metropolitan region. The
percent of the sample living within the station area precincts ranged from a high of
0.54 percent (79 households) in Mosman Park to a low of 0.055 percent (8
households) in Joondalup. The Household Survey conducted for this study used a
much larger samples in each of the five station area precincts.
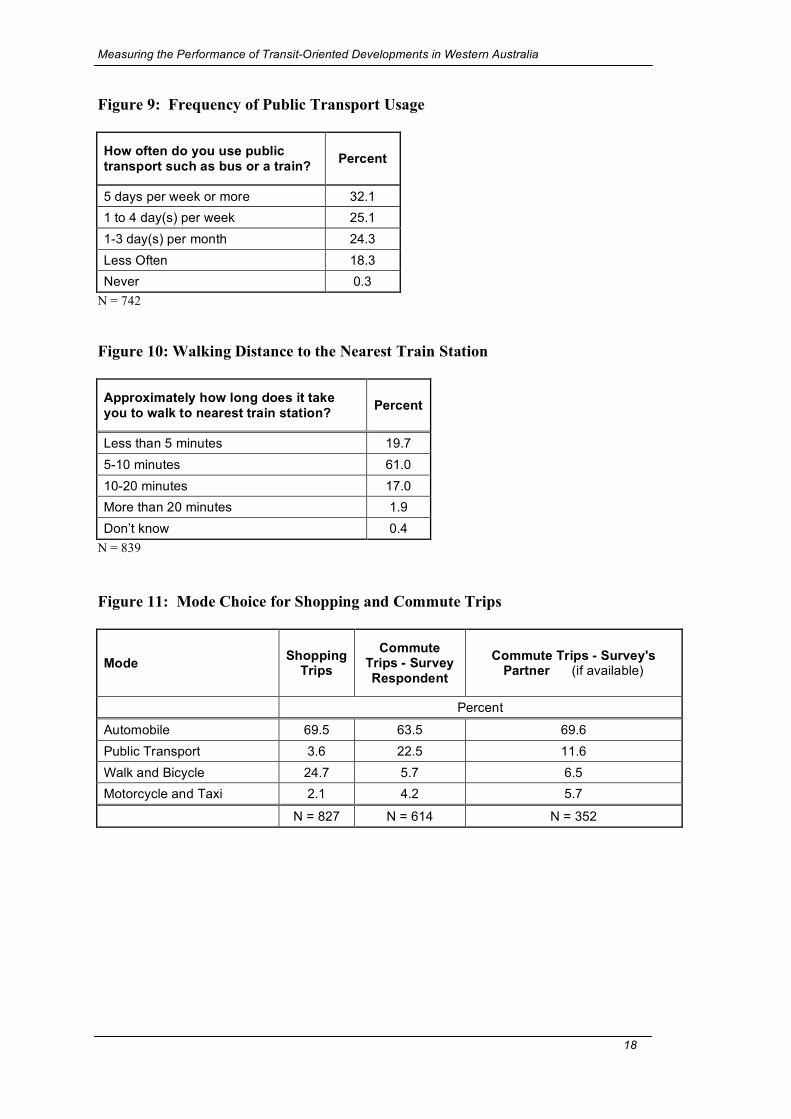
The questionnaire asked residents how they use public transport (see Figure 9), the
time taken to walk to the nearest train station (see Figure 10), and how they travel for
shopping and commute trips (Figure 11). These data reveal that cars are used for
approximately 70 percent of all shopping and commute trips. Of the remaining 30
percent, residents in these five station areas are more likely to use public transport
for commuting and more likely to walk or ride a bike for shopping. The survey also
collected the number of vehicles, bicycles, and licensed drivers within each
household (results not reported here).
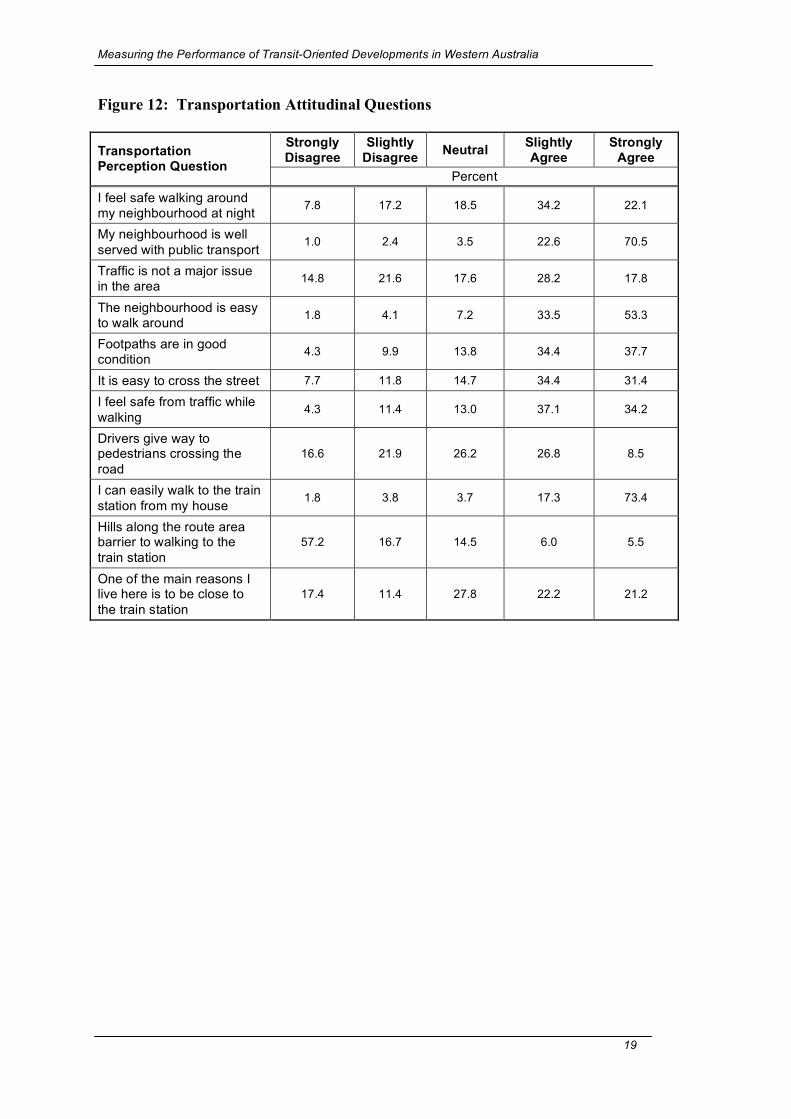
The survey also asked a number of opinion questions related to transportation, as
reported in Figure 12.
Measuring the Performance of Transit-Oriented Developments in Western Australia
16
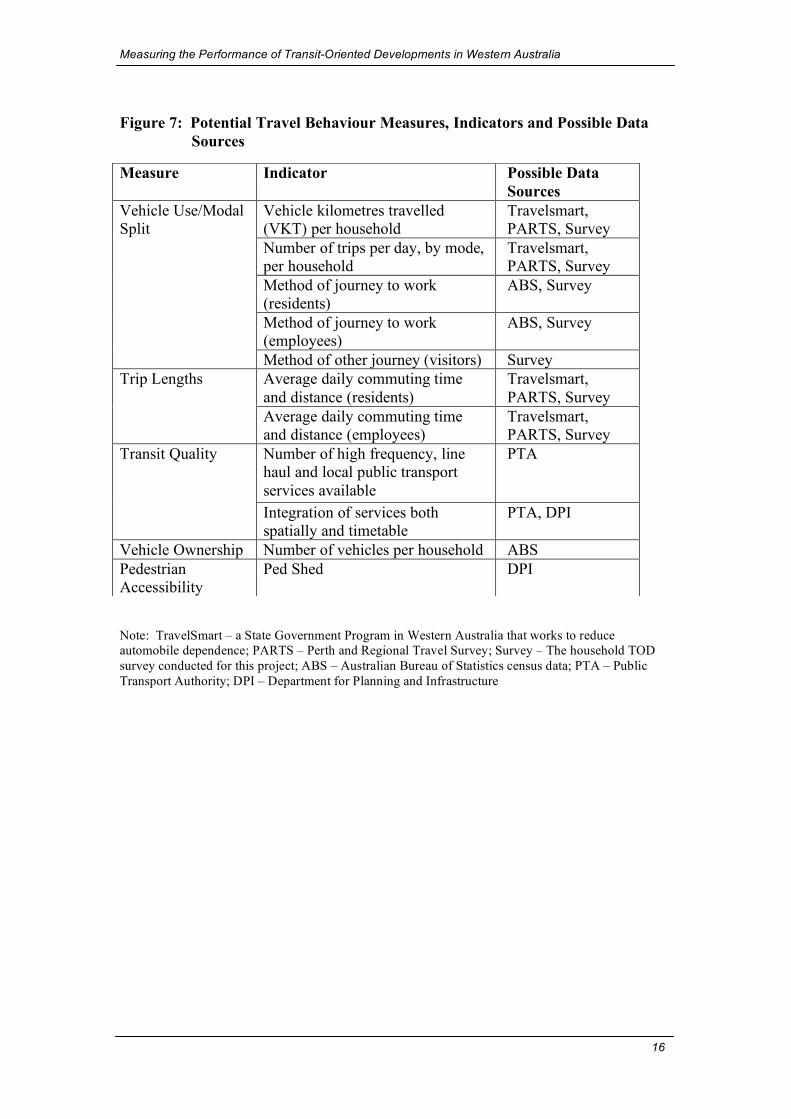
Figure 7: Potential Travel Behaviour Measures, Indicators and Possible Data
Sources
Note: TravelSmart – a State Government Program in Western Australia that works to reduce automobile dependence; PARTS – Perth and Regional Travel Survey; Survey – The household TOD survey conducted for this project; ABS – Australian Bureau of Statistics census data; PTA – Public Transport Authority; DPI – Department for Planning and Infrastructure
Measure Indicator Possible Data Sources
Vehicle kilometres travelled (VKT) per household
Travelsmart, PARTS, Survey
Number of trips per day, by mode, per household
Travelsmart, PARTS, Survey
Method of journey to work (residents)
ABS, Survey
Method of journey to work (employees)
ABS, Survey
Vehicle Use/Modal Split
Method of other journey (visitors) Survey Average daily commuting time and distance (residents)
Travelsmart, PARTS, Survey
Trip Lengths
Average daily commuting time and distance (employees)
Travelsmart, PARTS, Survey
Number of high frequency, line haul and local public transport services available
PTA Transit Quality
Integration of services both spatially and timetable
PTA, DPI
Vehicle Ownership Number of vehicles per household ABS Pedestrian Accessibility
Ped Shed DPI
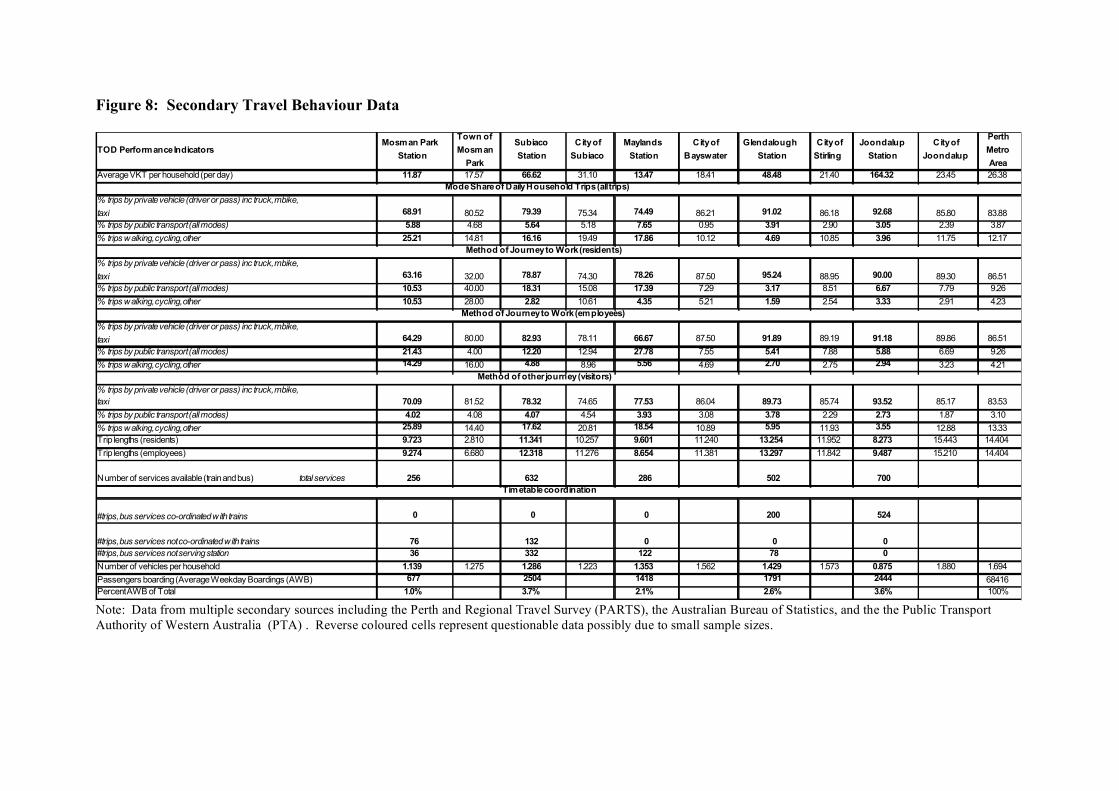
Figure 8: Secondary Travel Behaviour Data TOD Performance Indicators
Mosman Park
Station
Town of
Mosman
Park
Subiaco
Station
City of
Subiaco
Maylands
Station
City of
Bayswater
Glendalough
Station
City of
Stirling
Joondalup
Station
City of
Joondalup
Perth
Metro
Area
Average VKT per household (per day) 11.87 17.57 66.62 31.10 13.47 18.41 48.48 21.40 164.32 23.45 26.38
% trips by private vehicle (driver or pass) inc truck, mbike,
taxi 68.91 80.52 79.39 75.34 74.49 86.21 91.02 86.18 92.68 85.80 83.88
% trips by public transport (all modes) 5.88 4.68 5.64 5.18 7.65 0.95 3.91 2.90 3.05 2.39 3.87
% trips walking, cycling, other 25.21 14.81 16.16 19.49 17.86 10.12 4.69 10.85 3.96 11.75 12.17
% trips by private vehicle (driver or pass) inc truck, mbike,
taxi 63.16 32.00 78.87 74.30 78.26 87.50 95.24 88.95 90.00 89.30 86.51
% trips by public transport (all modes) 10.53 40.00 18.31 15.08 17.39 7.29 3.17 8.51 6.67 7.79 9.26
% trips walking, cycling, other 10.53 28.00 2.82 10.61 4.35 5.21 1.59 2.54 3.33 2.91 4.23
% trips by private vehicle (driver or pass) inc truck, mbike,
taxi 64.29 80.00 82.93 78.11 66.67 87.50 91.89 89.19 91.18 89.86 86.51
% trips by public transport (all modes) 21.43 4.00 12.20 12.94 27.78 7.55 5.41 7.88 5.88 6.69 9.26
% trips walking, cycling, other 14.29 16.00 4.88 8.96 5.56 4.69 2.70 2.75 2.94 3.23 4.21
% trips by private vehicle (driver or pass) inc truck, mbike,
taxi 70.09 81.52 78.32 74.65 77.53 86.04 89.73 85.74 93.52 85.17 83.53
% trips by public transport (all modes) 4.02 4.08 4.07 4.54 3.93 3.08 3.78 2.29 2.73 1.87 3.10
% trips walking, cycling, other 25.89 14.40 17.62 20.81 18.54 10.89 5.95 11.93 3.55 12.88 13.33
Trip lengths (residents) 9.723 2.810 11.341 10.257 9.601 11.240 13.254 11.952 8.273 15.443 14.404
Trip lengths (employees) 9.274 6.680 12.318 11.276 8.654 11.381 13.297 11.842 9.487 15.210 14.404
Number of services available (train and bus) total services 256 632 286 502 700
#trips, bus services co-ordinated with trains 0 0 0 200 524
#trips, bus services not co-ordinated with trains 76 132 0 0 0
#trips, bus services not serving station 36 332 122 78 0
Number of vehicles per household 1.139 1.275 1.286 1.223 1.353 1.562 1.429 1.573 0.875 1.880 1.694
Passengers boarding (Average Weekday Boardings (AWB) 677 2504 1418 1791 2444 68416
Percent AWB of Total 1.0% 3.7% 2.1% 2.6% 3.6% 100%
Timetable coordination
Mode Share of Daily Household Trips (all trips)
Method of Journey to Work (residents)
Method of Journey to Work (employees)
Method of other journey (visitors)
Note: Data from multiple secondary sources including the Perth and Regional Travel Survey (PARTS), the Australian Bureau of Statistics, and the the Public Transport Authority of Western Australia (PTA) . Reverse coloured cells represent questionable data possibly due to small sample sizes.
Measuring the Performance of Transit-Oriented Developments in Western Australia
18
Figure 9: Frequency of Public Transport Usage
How often do you use public transport such as bus or a train? Percent
5 days per week or more 32.1 1 to 4 day(s) per week 25.1 1-3 day(s) per month 24.3 Less Often 18.3 Never 0.3
N = 742 Figure 10: Walking Distance to the Nearest Train Station
Approximately how long does it take you to walk to nearest train station? Percent
Less than 5 minutes 19.7 5-10 minutes 61.0 10-20 minutes 17.0 More than 20 minutes 1.9 Don’t know 0.4
N = 839 Figure 11: Mode Choice for Shopping and Commute Trips
Mode Shopping Trips
Commute Trips - Survey Respondent
Commute Trips - Survey's Partner (if available)
Percent
Automobile 69.5 63.5 69.6 Public Transport 3.6 22.5 11.6 Walk and Bicycle 24.7 5.7 6.5 Motorcycle and Taxi 2.1 4.2 5.7
N = 827 N = 614 N = 352
Measuring the Performance of Transit-Oriented Developments in Western Australia
19
Figure 12: Transportation Attitudinal Questions
Strongly Disagree
Slightly Disagree Neutral Slightly
Agree Strongly
Agree Transportation Perception Question
Percent I feel safe walking around my neighbourhood at night 7.8 17.2 18.5 34.2 22.1
My neighbourhood is well served with public transport 1.0 2.4 3.5 22.6 70.5
Traffic is not a major issue in the area 14.8 21.6 17.6 28.2 17.8
The neighbourhood is easy to walk around 1.8 4.1 7.2 33.5 53.3
Footpaths are in good condition 4.3 9.9 13.8 34.4 37.7
It is easy to cross the street 7.7 11.8 14.7 34.4 31.4
I feel safe from traffic while walking 4.3 11.4 13.0 37.1 34.2
Drivers give way to pedestrians crossing the road
16.6 21.9 26.2 26.8 8.5
I can easily walk to the train station from my house 1.8 3.8 3.7 17.3 73.4
Hills along the route area barrier to walking to the train station
57.2 16.7 14.5 6.0 5.5
One of the main reasons I live here is to be close to the train station
17.4 11.4 27.8 22.2 21.2
Measuring the Performance of Transit-Oriented Developments in Western Australia
20
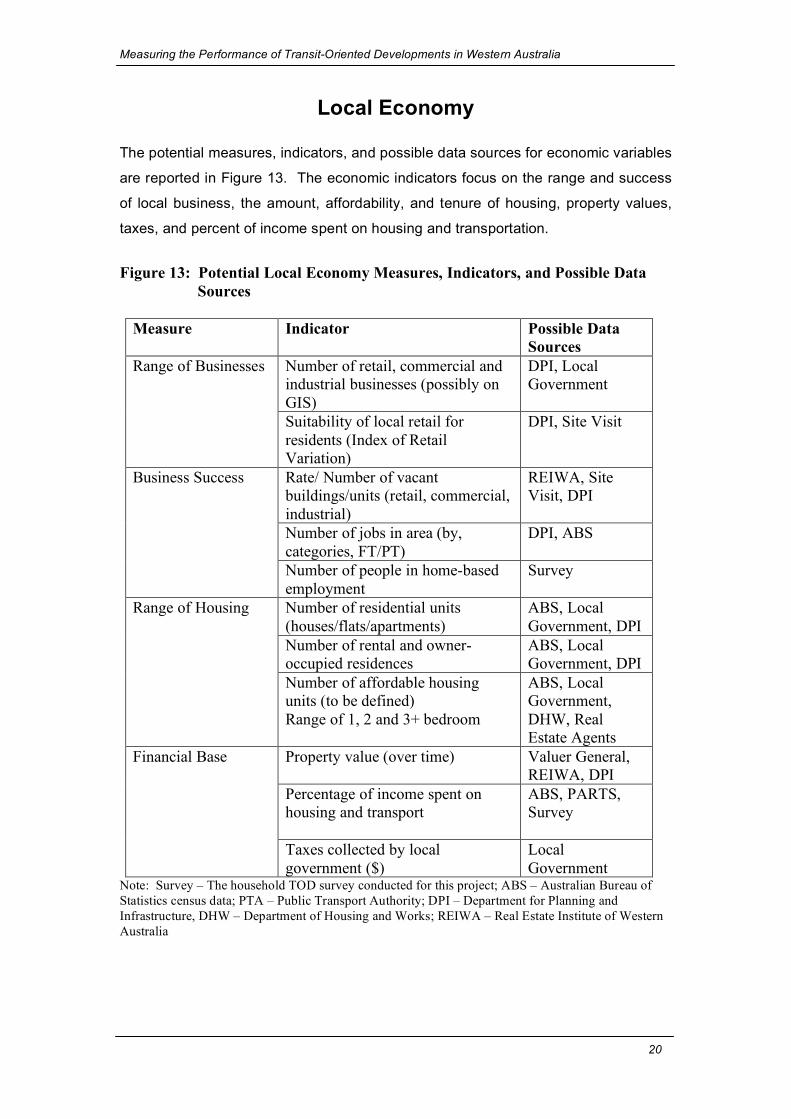
Local Economy
The potential measures, indicators, and possible data sources for economic variables
are reported in Figure 13. The economic indicators focus on the range and success
of local business, the amount, affordability, and tenure of housing, property values,
taxes, and percent of income spent on housing and transportation.
Figure 13: Potential Local Economy Measures, Indicators, and Possible Data
Sources
Measure Indicator Possible Data Sources
Number of retail, commercial and industrial businesses (possibly on GIS)
DPI, Local Government
Range of Businesses
Suitability of local retail for residents (Index of Retail Variation)
DPI, Site Visit
Rate/ Number of vacant buildings/units (retail, commercial, industrial)
REIWA, Site Visit, DPI
Number of jobs in area (by, categories, FT/PT)
DPI, ABS
Business Success
Number of people in home-based employment
Survey
Number of residential units (houses/flats/apartments)
ABS, Local Government, DPI
Number of rental and owner-occupied residences
ABS, Local Government, DPI
Range of Housing
Number of affordable housing units (to be defined) Range of 1, 2 and 3+ bedroom
ABS, Local Government, DHW, Real Estate Agents
Property value (over time) Valuer General, REIWA, DPI
Percentage of income spent on housing and transport
ABS, PARTS, Survey
Financial Base
Taxes collected by local government ($)
Local Government
Note: Survey – The household TOD survey conducted for this project; ABS – Australian Bureau of Statistics census data; PTA – Public Transport Authority; DPI – Department for Planning and Infrastructure, DHW – Department of Housing and Works; REIWA – Real Estate Institute of Western Australia
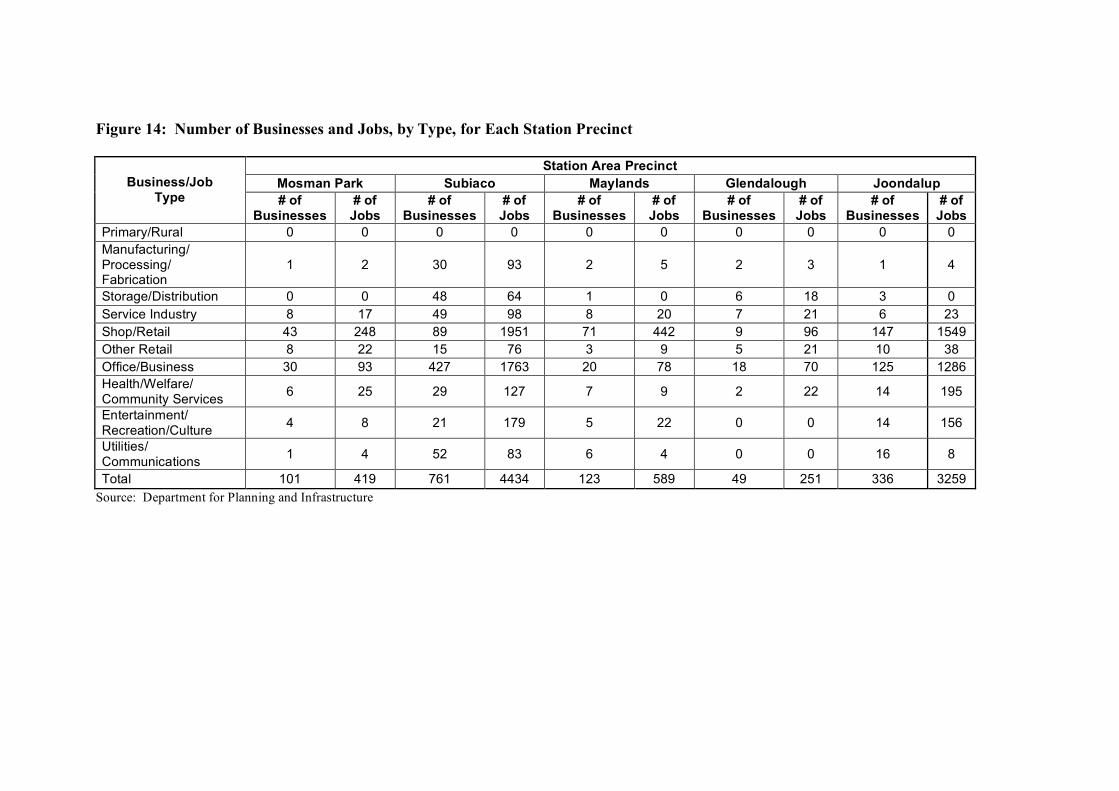
Figure 14: Number of Businesses and Jobs, by Type, for Each Station Precinct
Station Area Precinct Mosman Park Subiaco Maylands Glendalough Joondalup Business/Job
Type # of Businesses
# of Jobs
# of Businesses
# of Jobs
# of Businesses
# of Jobs
# of Businesses
# of Jobs
# of Businesses
# of Jobs
Primary/Rural 0 0 0 0 0 0 0 0 0 0 Manufacturing/ Processing/ Fabrication
1 2 30 93 2 5 2 3 1 4
Storage/Distribution 0 0 48 64 1 0 6 18 3 0 Service Industry 8 17 49 98 8 20 7 21 6 23 Shop/Retail 43 248 89 1951 71 442 9 96 147 1549 Other Retail 8 22 15 76 3 9 5 21 10 38 Office/Business 30 93 427 1763 20 78 18 70 125 1286 Health/Welfare/ Community Services 6 25 29 127 7 9 2 22 14 195
Entertainment/ Recreation/Culture 4 8 21 179 5 22 0 0 14 156
Utilities/ Communications 1 4 52 83 6 4 0 0 16 8
Total 101 419 761 4434 123 589 49 251 336 3259 Source: Department for Planning and Infrastructure

Measuring the Performance of Transit-Oriented Developments in Western Australia
22
The number of jobs, by type, for each station area are presented in Figure 14. The
bulk of the jobs across the areas are in retail, office, services, health care, and
entertainment. These are exactly the type of jobs that are compatible with TOD, as
opposed to heavy industry jobs. Vacancy rates, reported by DPI are shown in Figure
15. DPI also reports the number of vacant buildings, but the data reported here are
based on floorspace to capture buildings that are totally or partially vacant. Figure 15: Vacancy Rate (Vacant Floorspace/Total Floorspace)
0.0%
2.0%
4.0%
6.0%
8.0%
10.0%
12.0%
14.0%
16.0%
18.0%
20.0%
Joondalup Glendalough Subiaco Mosman Park Maylands
Source: Department for Planning and Infrastructure
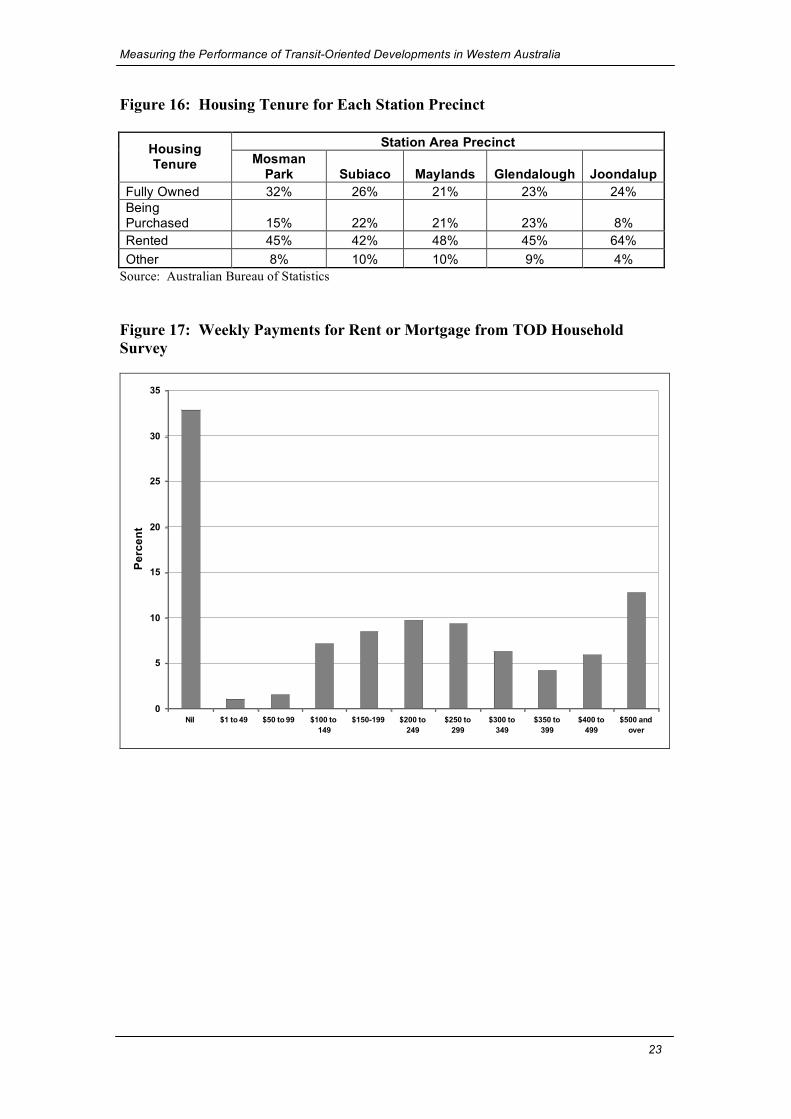
Figure 16 reports housing tenure for each station precinct and Figure 17 presents the
weekly payment towards rent or mortgage. The average amount spend on petrol,
based on the TOD Household Survey, was $46.94 AUD per week, where as the
average spent on parking and public transport was $14.44 AUD and $14.39 AUD,
respectively.
While property values were not collected in this analysis, we did determine that the
information is readily available from both private sources as well as the Valuer
General.
Measuring the Performance of Transit-Oriented Developments in Western Australia
23
Figure 16: Housing Tenure for Each Station Precinct
Station Area Precinct Housing Tenure Mosman
Park Subiaco Maylands Glendalough Joondalup Fully Owned 32% 26% 21% 23% 24% Being Purchased 15% 22% 21% 23% 8% Rented 45% 42% 48% 45% 64% Other 8% 10% 10% 9% 4%
Source: Australian Bureau of Statistics Figure 17: Weekly Payments for Rent or Mortgage from TOD Household Survey
0
5
10
15
20
25
30
35
Nil $1 to 49 $50 to 99 $100 to
149
$150-199 $200 to
249
$250 to
299
$300 to
349
$350 to
399
$400 to
499
$500 and
over
Pe
rce
nt
Measuring the Performance of Transit-Oriented Developments in Western Australia
24
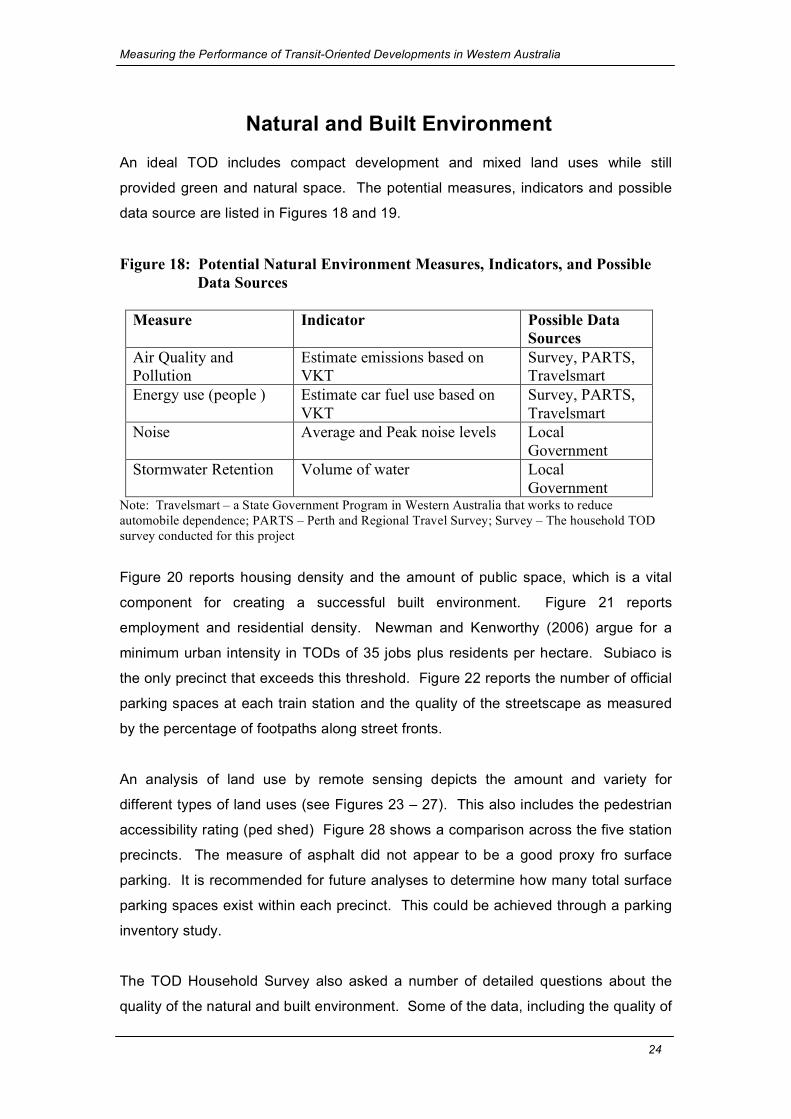
Natural and Built Environment An ideal TOD includes compact development and mixed land uses while still
provided green and natural space. The potential measures, indicators and possible
data source are listed in Figures 18 and 19.
Figure 18: Potential Natural Environment Measures, Indicators, and Possible Data Sources
Measure Indicator Possible Data
Sources Air Quality and Pollution
Estimate emissions based on VKT
Survey, PARTS, Travelsmart
Energy use (people ) Estimate car fuel use based on VKT
Survey, PARTS, Travelsmart
Noise Average and Peak noise levels Local Government
Stormwater Retention Volume of water Local Government
Note: Travelsmart – a State Government Program in Western Australia that works to reduce automobile dependence; PARTS – Perth and Regional Travel Survey; Survey – The household TOD survey conducted for this project
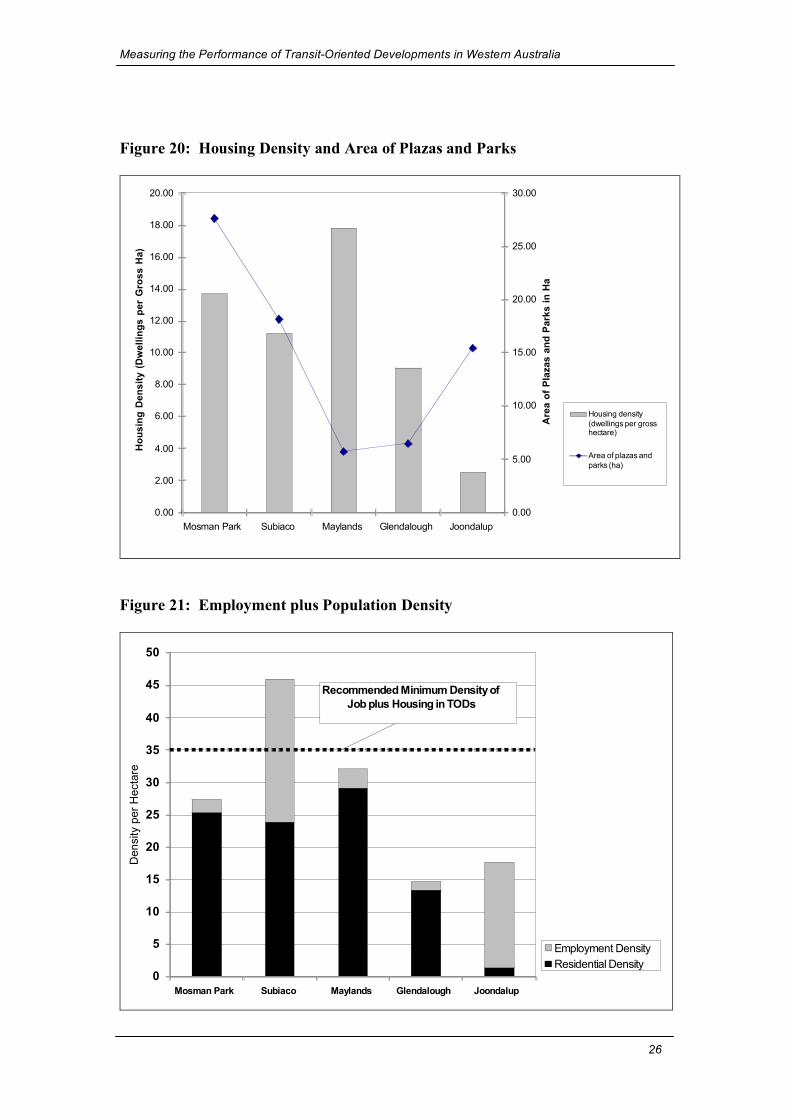
Figure 20 reports housing density and the amount of public space, which is a vital
component for creating a successful built environment. Figure 21 reports
employment and residential density. Newman and Kenworthy (2006) argue for a
minimum urban intensity in TODs of 35 jobs plus residents per hectare. Subiaco is
the only precinct that exceeds this threshold. Figure 22 reports the number of official
parking spaces at each train station and the quality of the streetscape as measured
by the percentage of footpaths along street fronts.
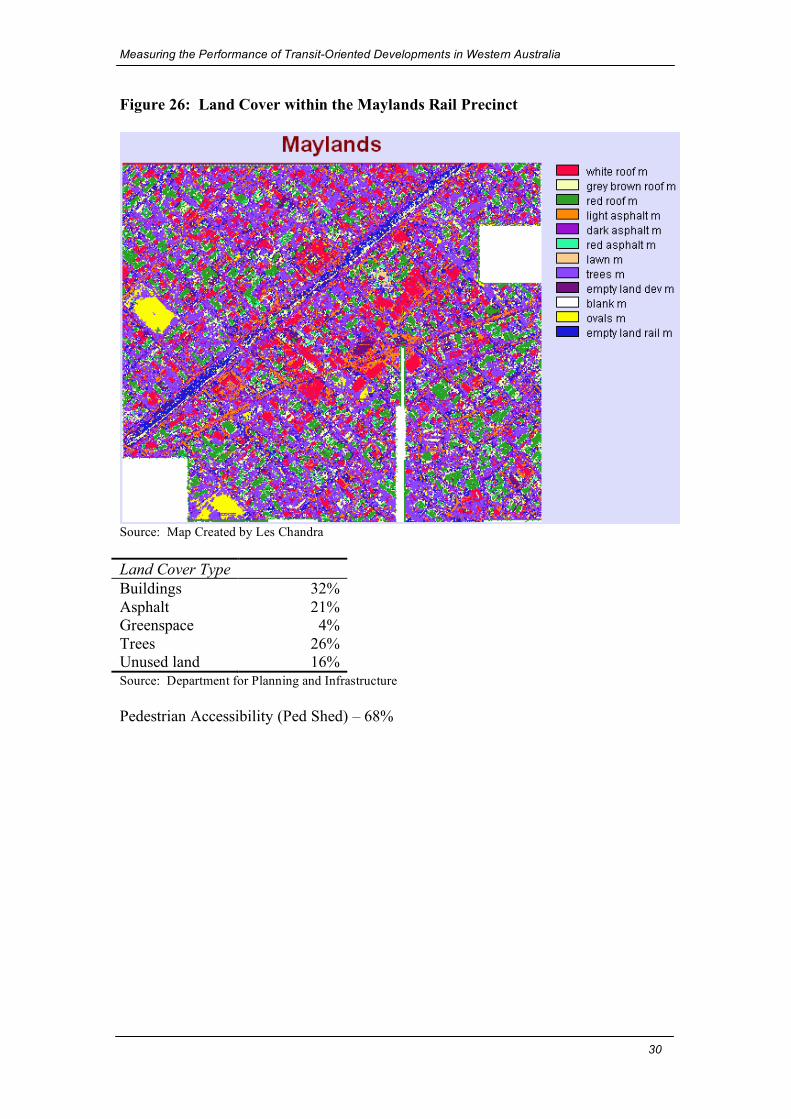
An analysis of land use by remote sensing depicts the amount and variety for
different types of land uses (see Figures 23 – 27). This also includes the pedestrian
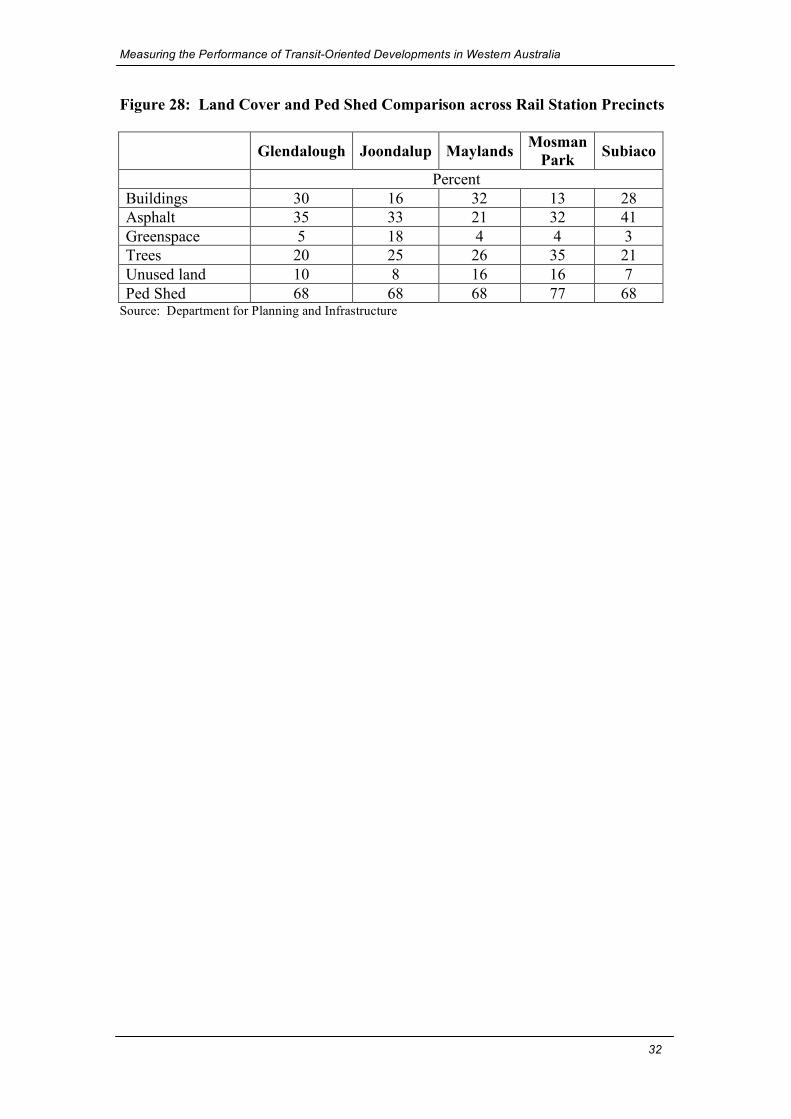
accessibility rating (ped shed) Figure 28 shows a comparison across the five station
precincts. The measure of asphalt did not appear to be a good proxy fro surface
parking. It is recommended for future analyses to determine how many total surface
parking spaces exist within each precinct. This could be achieved through a parking
inventory study.
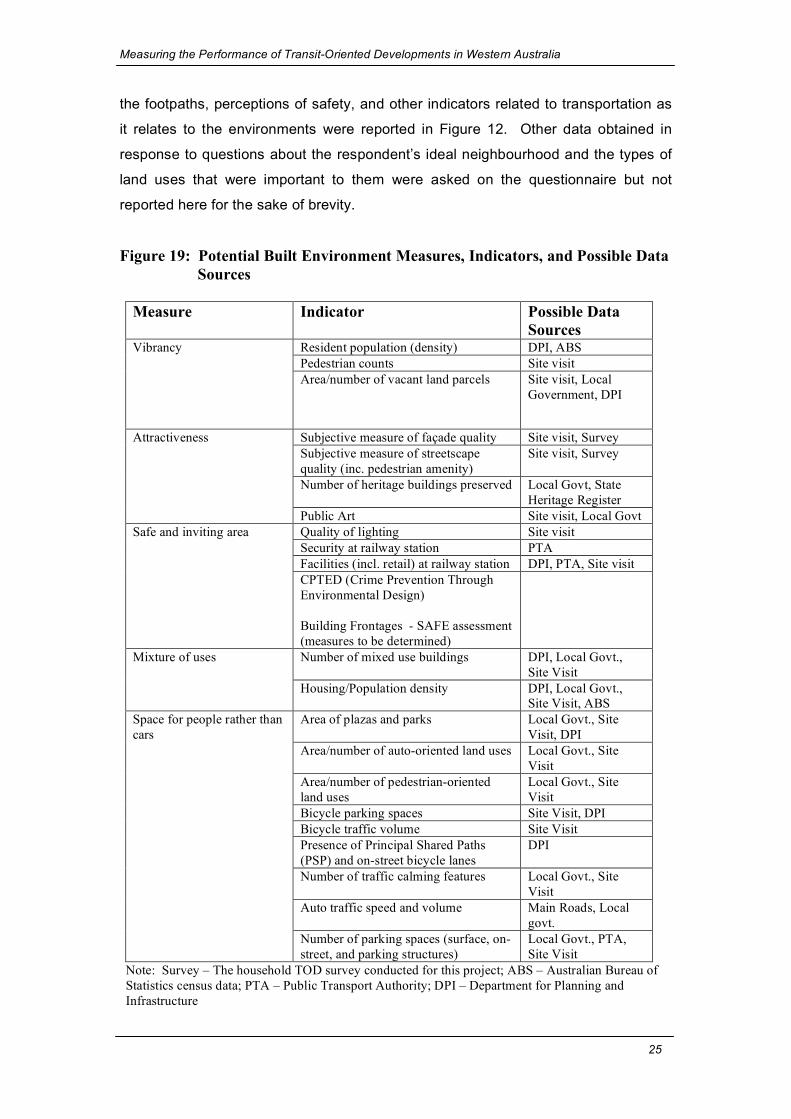
The TOD Household Survey also asked a number of detailed questions about the
quality of the natural and built environment. Some of the data, including the quality of
Measuring the Performance of Transit-Oriented Developments in Western Australia
25
the footpaths, perceptions of safety, and other indicators related to transportation as
it relates to the environments were reported in Figure 12. Other data obtained in
response to questions about the respondent’s ideal neighbourhood and the types of
land uses that were important to them were asked on the questionnaire but not
reported here for the sake of brevity.
Figure 19: Potential Built Environment Measures, Indicators, and Possible Data Sources
Measure Indicator Possible Data
Sources Resident population (density) DPI, ABS Pedestrian counts Site visit
Vibrancy
Area/number of vacant land parcels Site visit, Local Government, DPI
Subjective measure of façade quality Site visit, Survey Subjective measure of streetscape quality (inc. pedestrian amenity)
Site visit, Survey
Number of heritage buildings preserved Local Govt, State Heritage Register
Attractiveness
Public Art Site visit, Local Govt Quality of lighting Site visit Security at railway station PTA Facilities (incl. retail) at railway station DPI, PTA, Site visit
Safe and inviting area
CPTED (Crime Prevention Through Environmental Design) Building Frontages - SAFE assessment (measures to be determined)
Number of mixed use buildings DPI, Local Govt., Site Visit
Mixture of uses
Housing/Population density DPI, Local Govt., Site Visit, ABS
Area of plazas and parks Local Govt., Site Visit, DPI
Area/number of auto-oriented land uses Local Govt., Site Visit
Area/number of pedestrian-oriented land uses
Local Govt., Site Visit
Bicycle parking spaces Site Visit, DPI Bicycle traffic volume Site Visit Presence of Principal Shared Paths (PSP) and on-street bicycle lanes
DPI
Number of traffic calming features Local Govt., Site Visit
Auto traffic speed and volume Main Roads, Local govt.
Space for people rather than cars
Number of parking spaces (surface, on-street, and parking structures)
Local Govt., PTA, Site Visit
Note: Survey – The household TOD survey conducted for this project; ABS – Australian Bureau of Statistics census data; PTA – Public Transport Authority; DPI – Department for Planning and Infrastructure
Measuring the Performance of Transit-Oriented Developments in Western Australia
26
Figure 20: Housing Density and Area of Plazas and Parks
0.00
2.00
4.00
6.00
8.00
10.00
12.00
14.00
16.00
18.00
20.00
Mosman Park Subiaco Maylands Glendalough Joondalup
Ho
us
ing
De
ns
ity
(D
we
llin
gs
pe
r G
ros
s H
a)
0.00
5.00
10.00
15.00
20.00
25.00
30.00
Are
a o
f P
laza
s a
nd
Pa
rks
in
Ha
Housing density
(dwellings per grosshectare)
Area of plazas and
parks (ha)
Figure 21: Employment plus Population Density
0
5
10
15
20
25
30
35
40
45
50
Mosman Park Subiaco Maylands Glendalough Joondalup
De
nsity p
er
He
cta
re
Employment Density
Residential Density
Recommended Minimum Density of
Job plus Housing in TODs
Measuring the Performance of Transit-Oriented Developments in Western Australia
27
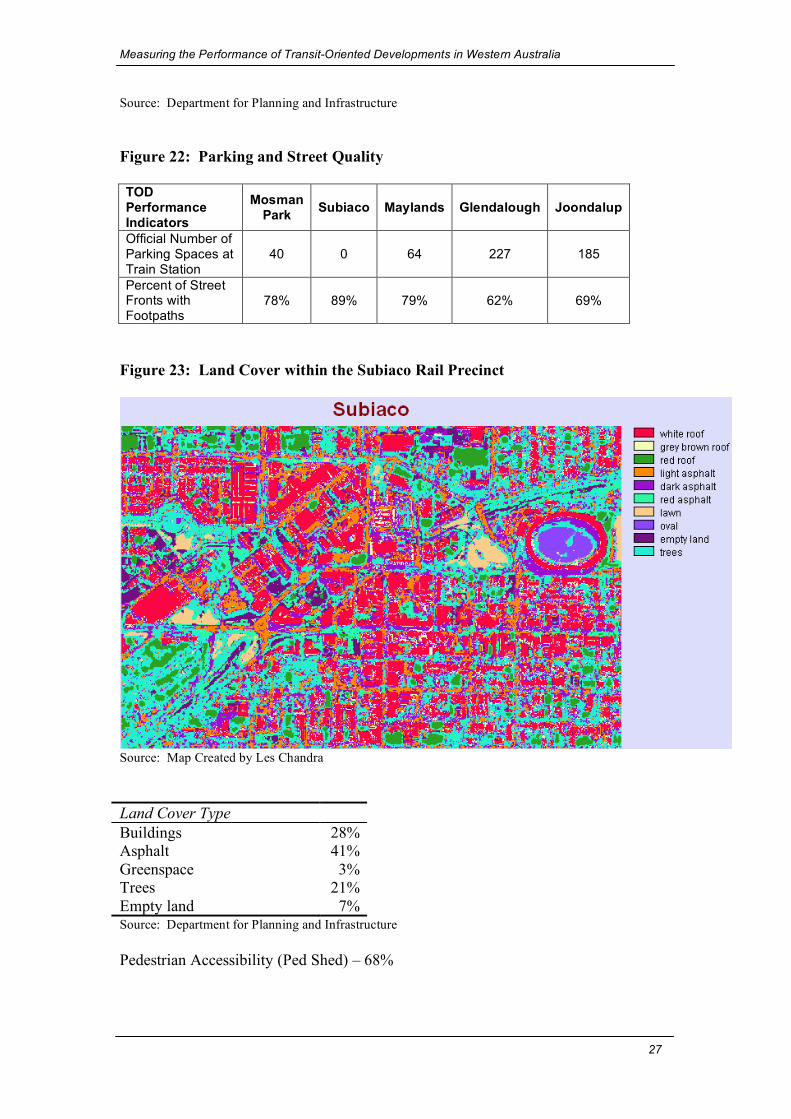
Source: Department for Planning and Infrastructure Figure 22: Parking and Street Quality TOD Performance Indicators
Mosman Park Subiaco Maylands Glendalough Joondalup
Official Number of Parking Spaces at Train Station
40 0 64 227 185
Percent of Street Fronts with Footpaths
78% 89% 79% 62% 69%
Figure 23: Land Cover within the Subiaco Rail Precinct
Source: Map Created by Les Chandra Land Cover Type Buildings 28% Asphalt 41% Greenspace 3% Trees 21% Empty land 7% Source: Department for Planning and Infrastructure Pedestrian Accessibility (Ped Shed) – 68%
Measuring the Performance of Transit-Oriented Developments in Western Australia
28
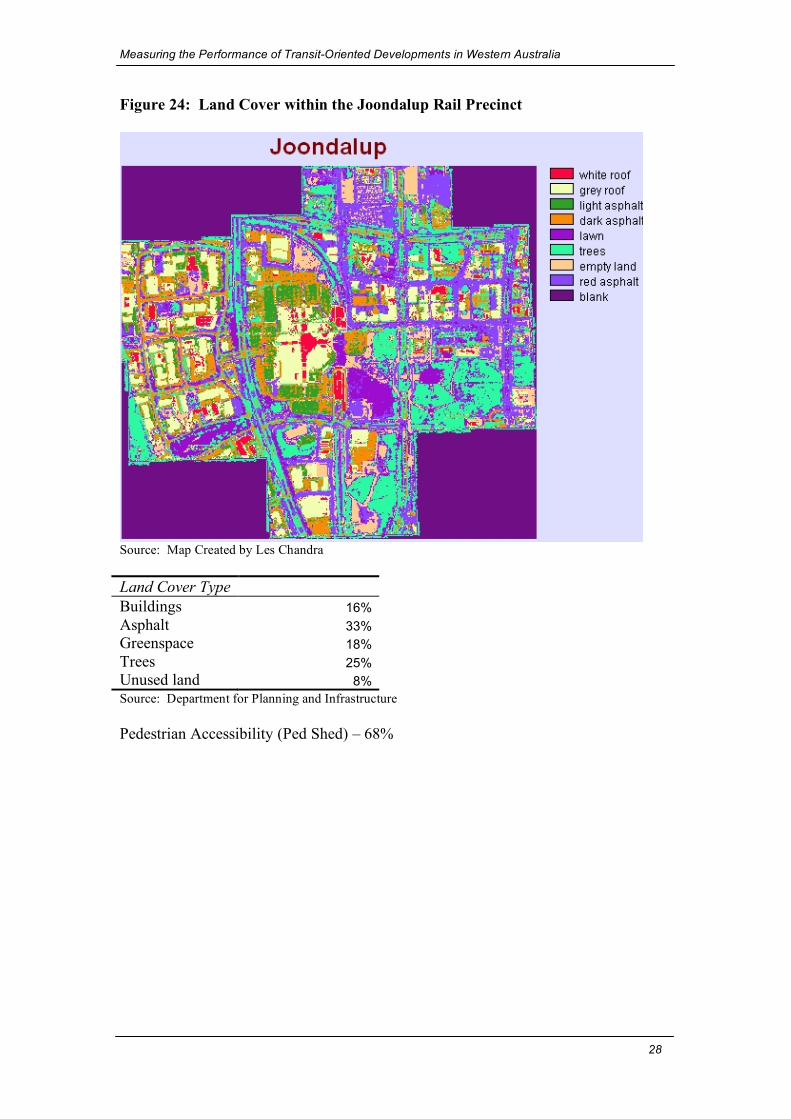
Figure 24: Land Cover within the Joondalup Rail Precinct
Source: Map Created by Les Chandra Land Cover Type Buildings 16% Asphalt 33% Greenspace 18% Trees 25% Unused land 8% Source: Department for Planning and Infrastructure Pedestrian Accessibility (Ped Shed) – 68%
Measuring the Performance of Transit-Oriented Developments in Western Australia
29
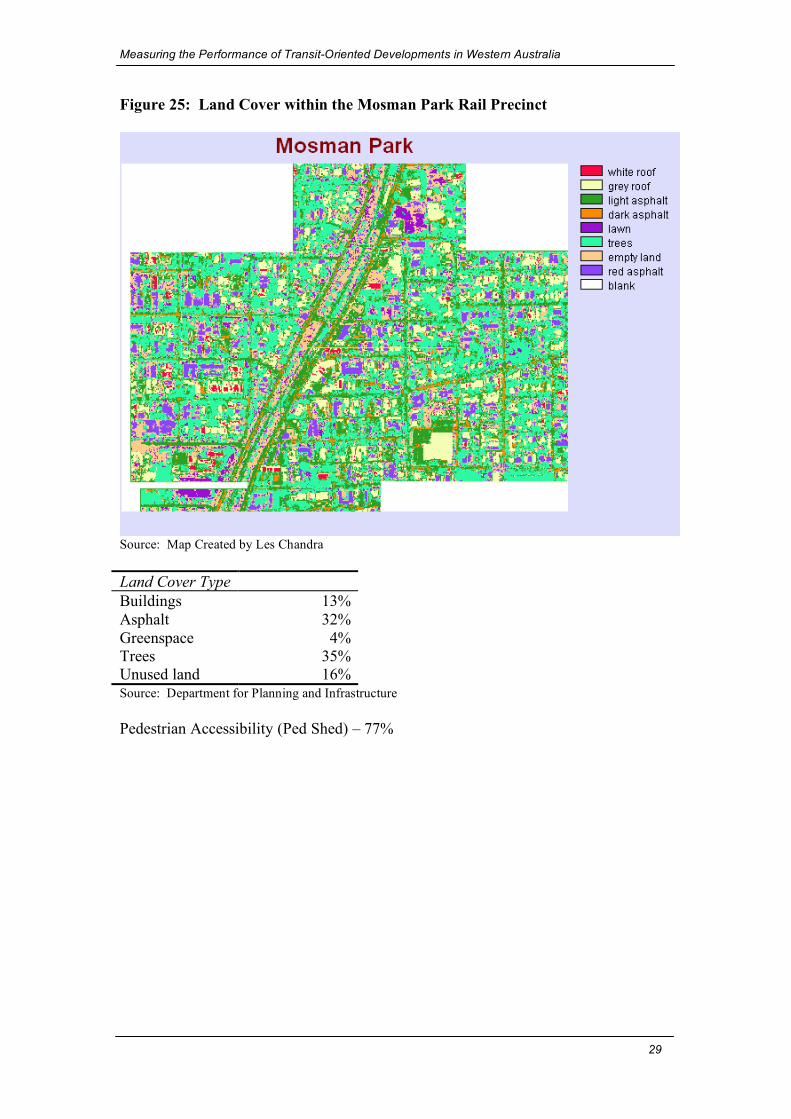
Figure 25: Land Cover within the Mosman Park Rail Precinct
Source: Map Created by Les Chandra Land Cover Type Buildings 13% Asphalt 32% Greenspace 4% Trees 35% Unused land 16% Source: Department for Planning and Infrastructure Pedestrian Accessibility (Ped Shed) – 77%
Measuring the Performance of Transit-Oriented Developments in Western Australia
30
Figure 26: Land Cover within the Maylands Rail Precinct
Source: Map Created by Les Chandra Land Cover Type Buildings 32% Asphalt 21% Greenspace 4% Trees 26% Unused land 16% Source: Department for Planning and Infrastructure Pedestrian Accessibility (Ped Shed) – 68%

Measuring the Performance of Transit-Oriented Developments in Western Australia
31
Figure 27: Land Cover within the Glendalough Rail Precinct
Source: Map Created by Les Chandra
Land Cover Type Buildings 30% Asphalt 35% Greenspace 5% Trees 20% Unused land 10%
Source: Department for Planning and Infrastructure Pedestrian Accessibility (Ped Shed) – 68%
Measuring the Performance of Transit-Oriented Developments in Western Australia
32
Figure 28: Land Cover and Ped Shed Comparison across Rail Station Precincts
Glendalough Joondalup Maylands Mosman Park Subiaco
Percent Buildings 30 16 32 13 28 Asphalt 35 33 21 32 41 Greenspace 5 18 4 4 3 Trees 20 25 26 35 21 Unused land 10 8 16 16 7 Ped Shed 68 68 68 77 68
Source: Department for Planning and Infrastructure
Measuring the Performance of Transit-Oriented Developments in Western Australia
33
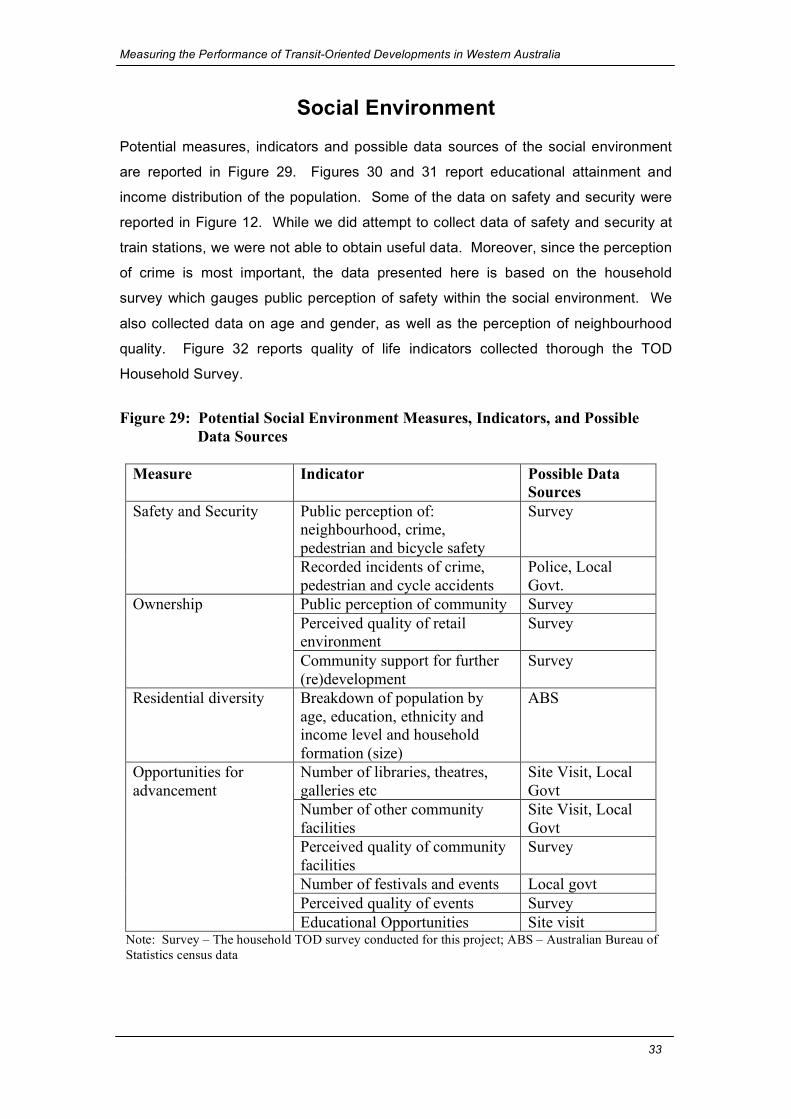
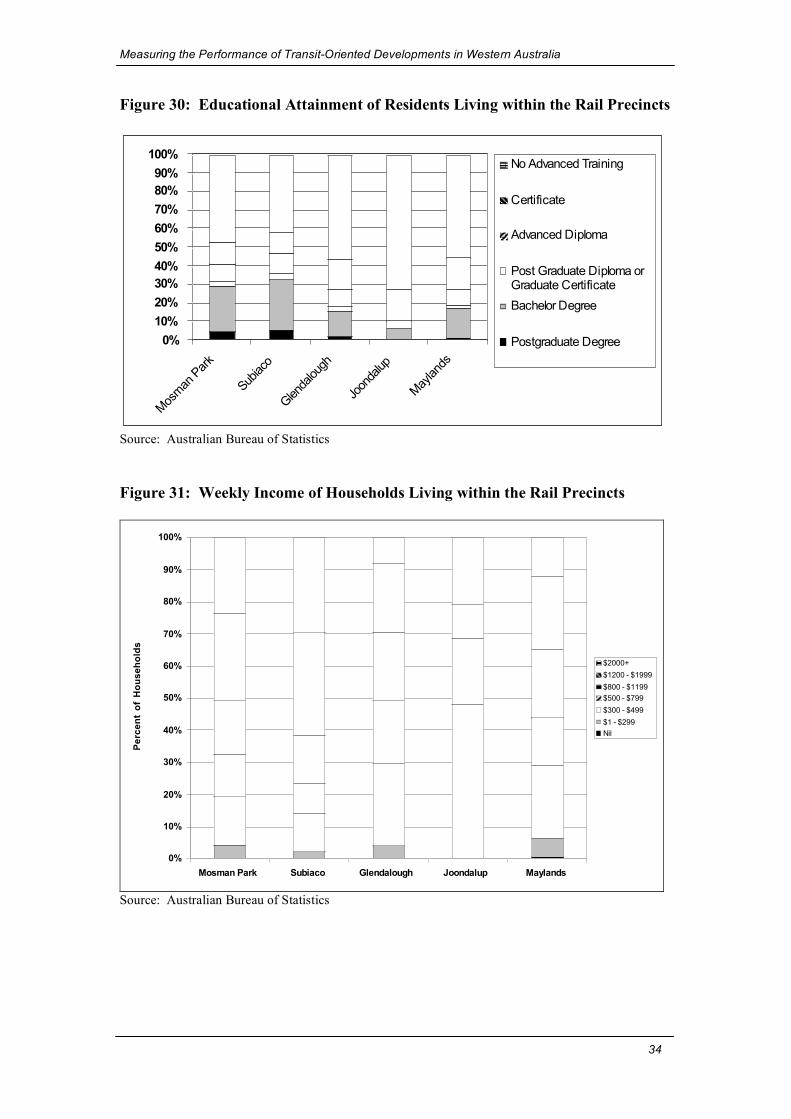
Social Environment Potential measures, indicators and possible data sources of the social environment
are reported in Figure 29. Figures 30 and 31 report educational attainment and
income distribution of the population. Some of the data on safety and security were
reported in Figure 12. While we did attempt to collect data of safety and security at
train stations, we were not able to obtain useful data. Moreover, since the perception
of crime is most important, the data presented here is based on the household
survey which gauges public perception of safety within the social environment. We
also collected data on age and gender, as well as the perception of neighbourhood
quality. Figure 32 reports quality of life indicators collected thorough the TOD
Household Survey.
Figure 29: Potential Social Environment Measures, Indicators, and Possible
Data Sources
Measure Indicator Possible Data Sources
Public perception of: neighbourhood, crime, pedestrian and bicycle safety
Survey Safety and Security
Recorded incidents of crime, pedestrian and cycle accidents
Police, Local Govt.
Public perception of community Survey Perceived quality of retail environment
Survey Ownership
Community support for further (re)development
Survey
Residential diversity Breakdown of population by age, education, ethnicity and income level and household formation (size)
ABS
Number of libraries, theatres, galleries etc
Site Visit, Local Govt
Number of other community facilities
Site Visit, Local Govt
Perceived quality of community facilities
Survey
Number of festivals and events Local govt Perceived quality of events Survey
Opportunities for advancement
Educational Opportunities Site visit Note: Survey – The household TOD survey conducted for this project; ABS – Australian Bureau of Statistics census data
Measuring the Performance of Transit-Oriented Developments in Western Australia
34
Figure 30: Educational Attainment of Residents Living within the Rail Precincts
0%
10%
20%
30%
40%
50%
60%
70%
80%
90%
100%
Mos
man
Par
k
Subiaco
Glend
alou
gh
Joon
dalup
May
land
s
No Advanced Training
Certificate
Advanced Diploma
Post Graduate Diploma orGraduate Certificate
Bachelor Degree
Postgraduate Degree
Source: Australian Bureau of Statistics Figure 31: Weekly Income of Households Living within the Rail Precincts
0%
10%
20%
30%
40%
50%
60%
70%
80%
90%
100%
Mosman Park Subiaco Glendalough Joondalup Maylands
Pe
rce
nt
of
Ho
us
eh
old
s
$2000+
$1200 - $1999
$800 - $1199
$500 - $799
$300 - $499
$1 - $299
Nil
Source: Australian Bureau of Statistics
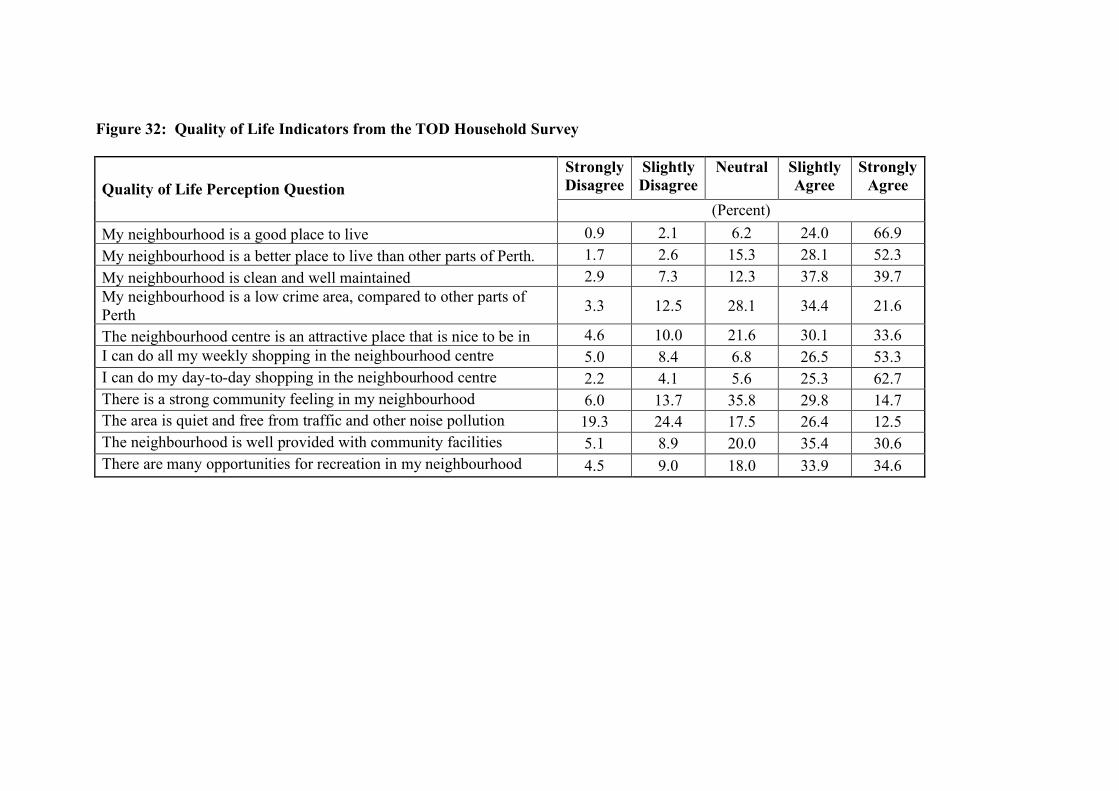
Figure 32: Quality of Life Indicators from the TOD Household Survey
Strongly Disagree
Slightly Disagree
Neutral Slightly Agree
Strongly Agree Quality of Life Perception Question
(Percent) My neighbourhood is a good place to live 0.9 2.1 6.2 24.0 66.9 My neighbourhood is a better place to live than other parts of Perth. 1.7 2.6 15.3 28.1 52.3 My neighbourhood is clean and well maintained 2.9 7.3 12.3 37.8 39.7 My neighbourhood is a low crime area, compared to other parts of Perth 3.3 12.5 28.1 34.4 21.6
The neighbourhood centre is an attractive place that is nice to be in 4.6 10.0 21.6 30.1 33.6 I can do all my weekly shopping in the neighbourhood centre 5.0 8.4 6.8 26.5 53.3 I can do my day-to-day shopping in the neighbourhood centre 2.2 4.1 5.6 25.3 62.7 There is a strong community feeling in my neighbourhood 6.0 13.7 35.8 29.8 14.7 The area is quiet and free from traffic and other noise pollution 19.3 24.4 17.5 26.4 12.5 The neighbourhood is well provided with community facilities 5.1 8.9 20.0 35.4 30.6 There are many opportunities for recreation in my neighbourhood 4.5 9.0 18.0 33.9 34.6
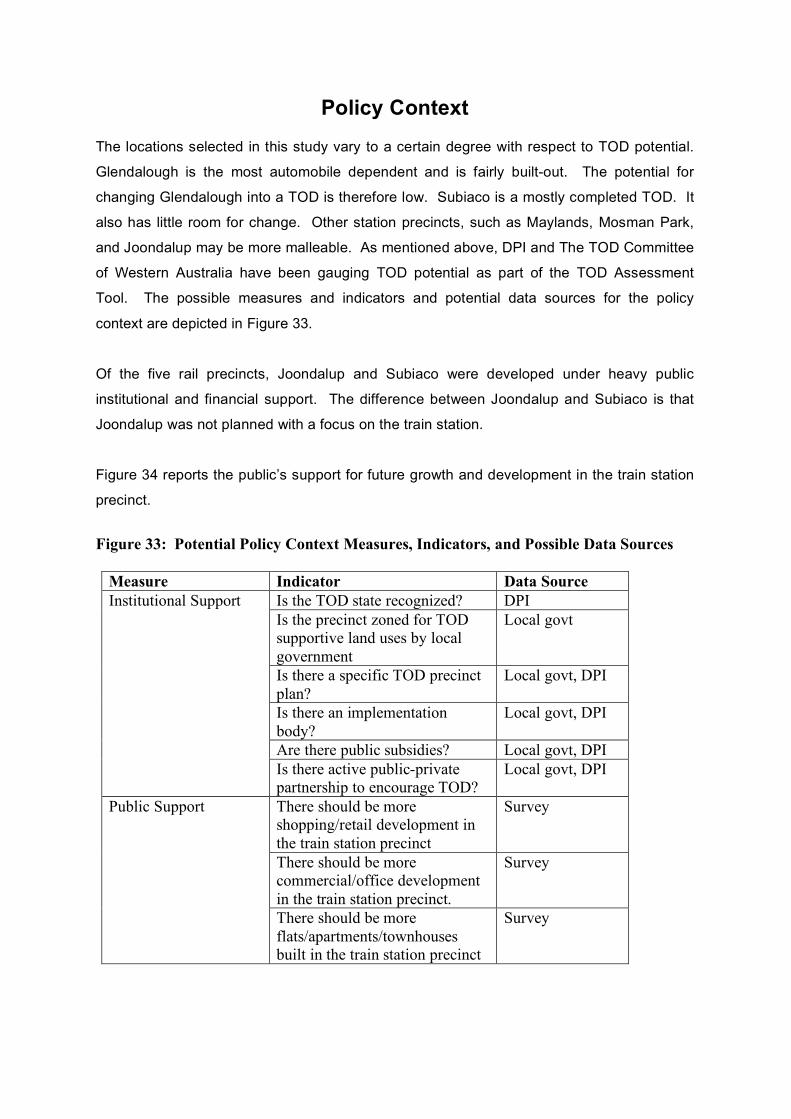
Policy Context The locations selected in this study vary to a certain degree with respect to TOD potential.
Glendalough is the most automobile dependent and is fairly built-out. The potential for
changing Glendalough into a TOD is therefore low. Subiaco is a mostly completed TOD. It
also has little room for change. Other station precincts, such as Maylands, Mosman Park,
and Joondalup may be more malleable. As mentioned above, DPI and The TOD Committee
of Western Australia have been gauging TOD potential as part of the TOD Assessment
Tool. The possible measures and indicators and potential data sources for the policy
context are depicted in Figure 33.
Of the five rail precincts, Joondalup and Subiaco were developed under heavy public
institutional and financial support. The difference between Joondalup and Subiaco is that
Joondalup was not planned with a focus on the train station.
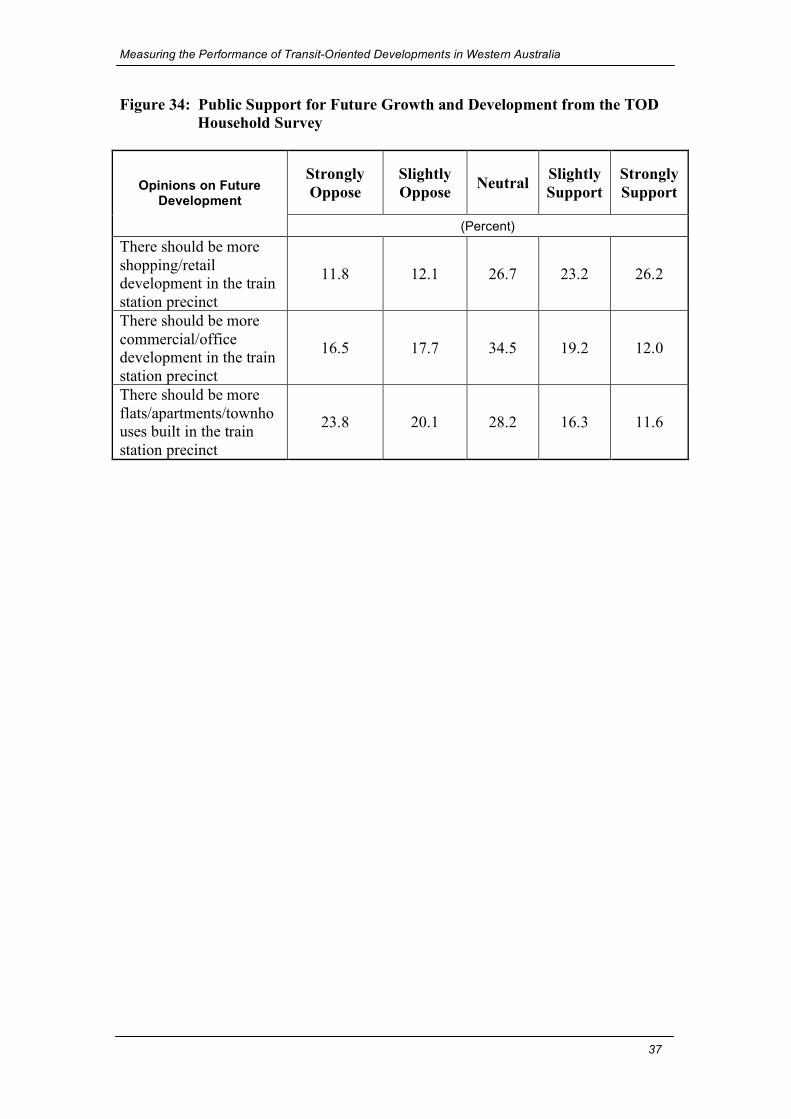
Figure 34 reports the public’s support for future growth and development in the train station
precinct.
Figure 33: Potential Policy Context Measures, Indicators, and Possible Data Sources
Measure Indicator Data Source Is the TOD state recognized? DPI Is the precinct zoned for TOD supportive land uses by local government
Local govt
Is there a specific TOD precinct plan?
Local govt, DPI
Is there an implementation body?
Local govt, DPI
Are there public subsidies? Local govt, DPI
Institutional Support
Is there active public-private partnership to encourage TOD?
Local govt, DPI
There should be more shopping/retail development in the train station precinct
Survey
There should be more commercial/office development in the train station precinct.
Survey
Public Support
There should be more flats/apartments/townhouses built in the train station precinct
Survey
Measuring the Performance of Transit-Oriented Developments in Western Australia
37
Figure 34: Public Support for Future Growth and Development from the TOD Household Survey
Strongly Oppose
Slightly Oppose Neutral Slightly
Support Strongly Support Opinions on Future
Development
(Percent) There should be more shopping/retail development in the train station precinct
11.8 12.1 26.7 23.2 26.2
There should be more commercial/office development in the train station precinct
16.5 17.7 34.5 19.2 12.0
There should be more flats/apartments/townhouses built in the train station precinct
23.8 20.1 28.2 16.3 11.6
Measuring the Performance of Transit-Oriented Developments in Western Australia
38
Framework for Measuring TOD Performance
Measuring TOD performance across multiple dimensions is necessary to evaluate
TODs within a liveability and sustainability paradigm. Most previous studies of TOD
success narrowly focused upon specific attributes, such as travel behaviour or local
economy impacts (measured by land value premiums). A study referenced above
recommended nine indicators of performance for inclusion in a holistic TOD
evaluation framework. Again, these are:
1. Transit ridership
2. Population and housing density
3. Quality of streetscape design
4. Quantity of mixed-use structures
5. Pedestrian activity and pedestrian safety
6. Increase in property value/tax revenue
7. Public perception — measured by resident and merchant surveys
8. The quality of intermodal connections at transit stations, and
9. Parking configuration—for commuters, for residents, and shared parking
A tension in establishing a framework for measuring TOD performance is the desire
to compare TODs across the region with measuring performance based upon local
goals and objectives for a neighbourhood over a period of time. This tension is at the
core of sustainability – a top-down versus bottom-up approach. The next sections
present a framework for measuring TOD performance based on both a top-down and
a bottom-up approach. Both methods are important and necessary for monitoring
TODs, thus the final section recommends a methodology for monitoring TODs in
Western Australia.
A Top-Down TOD Monitoring Approach
The TOD Coordinating Committee (TODCC) facilitates TOD implementation mainly
through a top-down approach. This includes regular meetings of state agencies to
decide how to allocate resources. This is based upon a rational process of ranking
and ordering priorities. When looking at TODs from this perspective, questions about
performance often compare:
1. TODs versus other TODs
Measuring the Performance of Transit-Oriented Developments in Western Australia
39
2. TODs versus non-TOD neighbourhoods
3. TODs versus regional averages
It is recommended that the TODCC collect data on TODs once every 5 years. This
study found that while some of the data are available from secondary data sources,
there are two problems with relying on such data. First, some data sources (ie.
PARTS) do not provide adequate coverage of the precincts. Second, there is no
control by the TODCC when secondary data are collected. Even the Census, which
occurs every five years is subject to change. For example, the US Census recently
changed data collection frequency, which no longer occurs every ten years as it had
been for over a century. Despite this, secondary data are useful because they are
usually easy to access and analyse.
The household survey conducted as part of this study was necessary for measuring
TOD performance. The methodology for this questionnaire was based on a similar
project in New Jersey in 2003, which achieved a similar response rate (39 percent in
Western Australia compared to 40 percent in New Jersey). The questions on the
Perth survey were modified slightly to take account of specific local and regional
characteristics.
It is recommended that the TODCC monitor as many rail precincts in Perth as it
considers necessary, but at a minimum it should include any area of strategic
importance and stations with recent or active precinct-area development. For
example, if the TODCC collects data on 6 precincts per year, based on a 5-year
cycle, the TODCC could monitor 30 TODs. This number could be expanded or
reduced on a needs basis, but the TODCC should commit to collecting data from
the same station for at least two points in time for longitudinal analysis.
Template for Top-Down TOD Monitoring
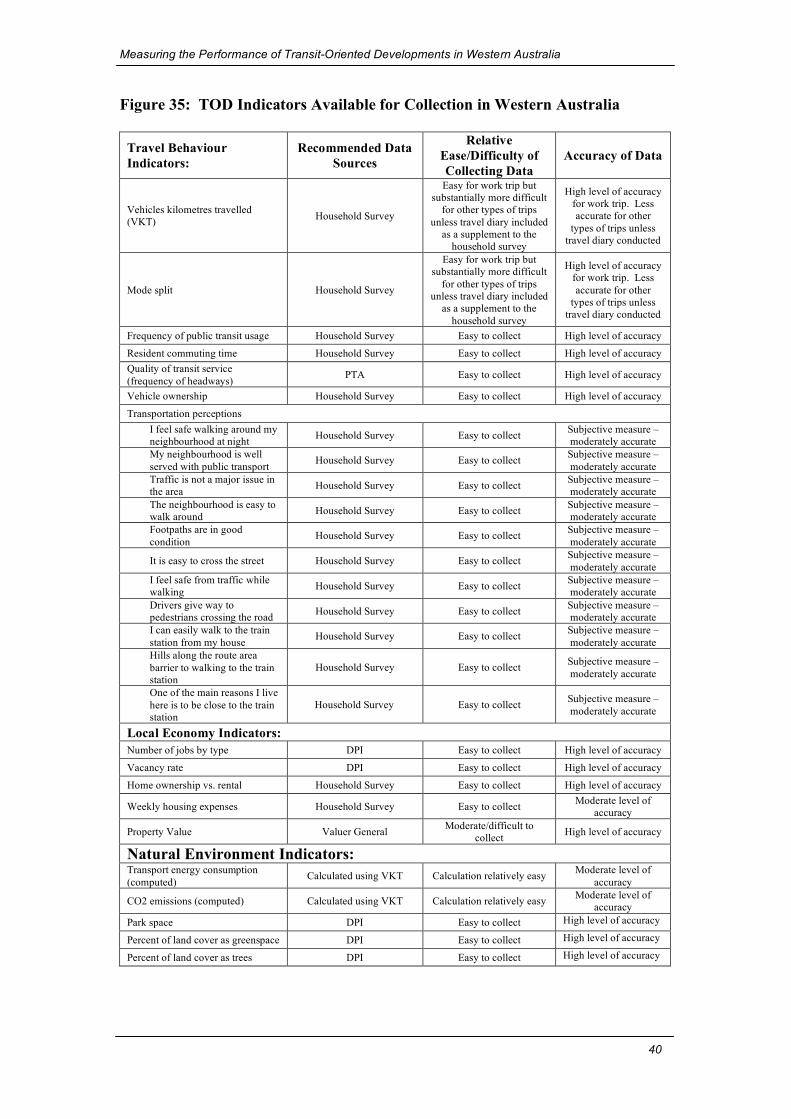
1. Based on this study, we found that the most useful data came from the
household survey, although other data obtained from secondary sources
were also valuable. Figure 35 reports the indicators that can be collected
through primary research (a TOD household questionnaire), secondary
sources (such as DPI, Census, or other sources) or both. For each indicator,
this figure depicts the data source, the relative ease or difficulty of collecting
the data, and the accuracy of each indicator.
Measuring the Performance of Transit-Oriented Developments in Western Australia
40
Figure 35: TOD Indicators Available for Collection in Western Australia
Travel Behaviour Indicators:
Recommended Data Sources
Relative Ease/Difficulty of Collecting Data
Accuracy of Data
Vehicles kilometres travelled (VKT) Household Survey
Easy for work trip but substantially more difficult
for other types of trips unless travel diary included
as a supplement to the household survey
High level of accuracy for work trip. Less accurate for other
types of trips unless travel diary conducted
Mode split Household Survey
Easy for work trip but substantially more difficult
for other types of trips unless travel diary included
as a supplement to the household survey
High level of accuracy for work trip. Less accurate for other
types of trips unless travel diary conducted
Frequency of public transit usage Household Survey Easy to collect High level of accuracy
Resident commuting time Household Survey Easy to collect High level of accuracy Quality of transit service (frequency of headways) PTA Easy to collect High level of accuracy
Vehicle ownership Household Survey Easy to collect High level of accuracy
Transportation perceptions I feel safe walking around my neighbourhood at night Household Survey Easy to collect Subjective measure –
moderately accurate My neighbourhood is well served with public transport Household Survey Easy to collect Subjective measure –
moderately accurate Traffic is not a major issue in the area Household Survey Easy to collect Subjective measure –
moderately accurate The neighbourhood is easy to walk around Household Survey Easy to collect Subjective measure –
moderately accurate Footpaths are in good condition Household Survey Easy to collect Subjective measure –
moderately accurate
It is easy to cross the street Household Survey Easy to collect Subjective measure – moderately accurate
I feel safe from traffic while walking Household Survey Easy to collect Subjective measure –
moderately accurate Drivers give way to pedestrians crossing the road Household Survey Easy to collect Subjective measure –
moderately accurate I can easily walk to the train station from my house Household Survey Easy to collect Subjective measure –
moderately accurate Hills along the route area barrier to walking to the train station
Household Survey Easy to collect Subjective measure – moderately accurate
One of the main reasons I live here is to be close to the train station
Household Survey Easy to collect Subjective measure – moderately accurate
Local Economy Indicators: Number of jobs by type DPI Easy to collect High level of accuracy
Vacancy rate DPI Easy to collect High level of accuracy
Home ownership vs. rental Household Survey Easy to collect High level of accuracy
Weekly housing expenses Household Survey Easy to collect Moderate level of accuracy
Property Value Valuer General Moderate/difficult to collect High level of accuracy
Natural Environment Indicators: Transport energy consumption (computed) Calculated using VKT Calculation relatively easy Moderate level of
accuracy
CO2 emissions (computed) Calculated using VKT Calculation relatively easy Moderate level of accuracy
Park space DPI Easy to collect High level of accuracy Percent of land cover as greenspace DPI Easy to collect High level of accuracy Percent of land cover as trees DPI Easy to collect High level of accuracy
Measuring the Performance of Transit-Oriented Developments in Western Australia
41
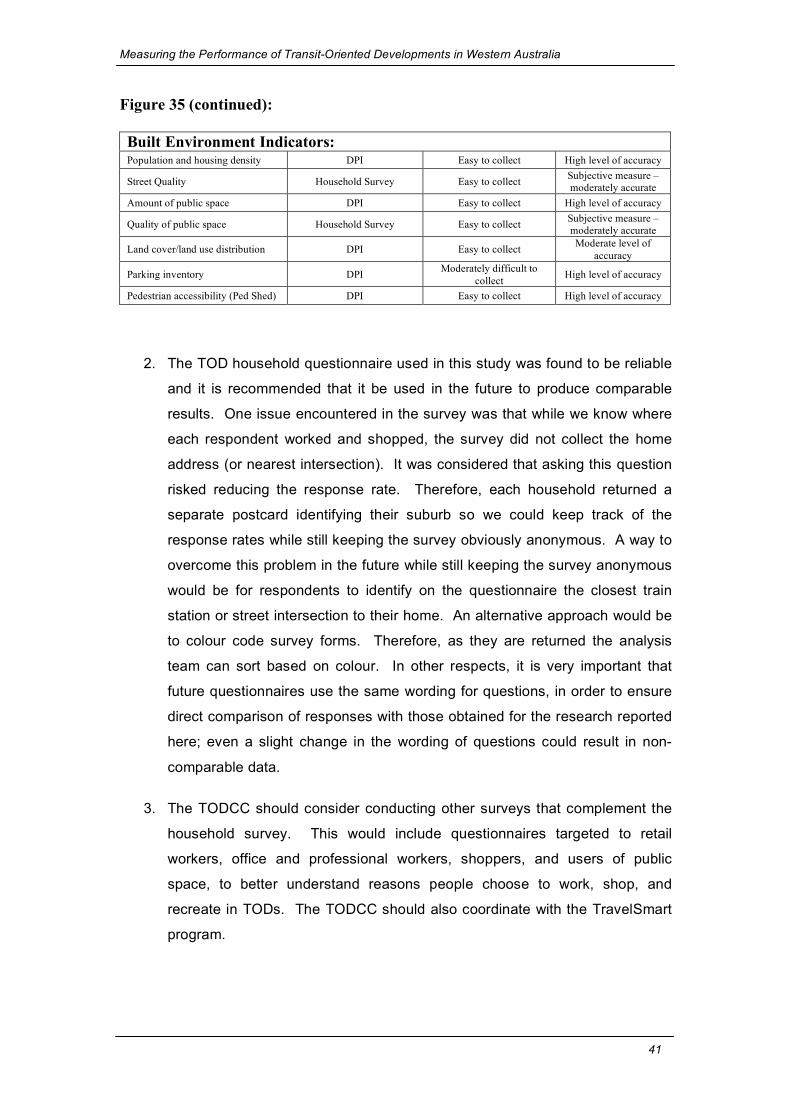
Figure 35 (continued): Built Environment Indicators: Population and housing density DPI Easy to collect High level of accuracy
Street Quality Household Survey Easy to collect Subjective measure – moderately accurate
Amount of public space DPI Easy to collect High level of accuracy
Quality of public space Household Survey Easy to collect Subjective measure – moderately accurate
Land cover/land use distribution DPI Easy to collect Moderate level of accuracy
Parking inventory DPI Moderately difficult to collect High level of accuracy
Pedestrian accessibility (Ped Shed) DPI Easy to collect High level of accuracy
2. The TOD household questionnaire used in this study was found to be reliable
and it is recommended that it be used in the future to produce comparable
results. One issue encountered in the survey was that while we know where
each respondent worked and shopped, the survey did not collect the home
address (or nearest intersection). It was considered that asking this question
risked reducing the response rate. Therefore, each household returned a
separate postcard identifying their suburb so we could keep track of the
response rates while still keeping the survey obviously anonymous. A way to
overcome this problem in the future while still keeping the survey anonymous
would be for respondents to identify on the questionnaire the closest train
station or street intersection to their home. An alternative approach would be
to colour code survey forms. Therefore, as they are returned the analysis
team can sort based on colour. In other respects, it is very important that
future questionnaires use the same wording for questions, in order to ensure
direct comparison of responses with those obtained for the research reported
here; even a slight change in the wording of questions could result in non-
comparable data.
3. The TODCC should consider conducting other surveys that complement the
household survey. This would include questionnaires targeted to retail
workers, office and professional workers, shoppers, and users of public
space, to better understand reasons people choose to work, shop, and
recreate in TODs. The TODCC should also coordinate with the TravelSmart
program.
Measuring the Performance of Transit-Oriented Developments in Western Australia
42
4. The TODCC should consider establishing a website similar to the California
Transit-Oriented Development Searchable Database1. An online database
provides transparency and value to local residents, town planners, community
organisations, and prospective developers. Data collected to monitor TODs
in Western Australia may prove valuable for more than just the needs of the
TODCC. Private sector developers could use the data to better evaluate
where to invest. An online database serves as a marketing and outreach tool
to educate the public about TOD.
A Bottom-Up TOD Measurement Approach
In coordination with the top-down TOD measurement approach, the TODCC should
consider setting up community-stakeholder meetings with local residents, shop
owners, community advocates, government officials and others. These meetings
should establish short-, medium- and long-term goals for each TOD. Long-term
success should be assessed on the combination of these goals and top-down goals
established by the TODCC.
The bottom-up approach provides an opportunity for the TODCC to provide
education about the benefits of TOD for liveability and sustainability. It should also
make the TODCC more receptive to the needs of local communities than would be
achieved by a ‘one-size fits all’ approach to TOD.
Recommendations for Monitoring TODs in Western Australia
An important goal of this study was to determine a methodology for monitoring TODs.
As discussed above, data to monitor TODs in this study came from both primary and
secondary sources. In order to collect the necessary data for monitoring TODs in
Western Australia it is necessary to establish a systematic data collection effort. This
section recommends three steps to establish a TOD monitoring program in Western
Australia.
Step 1: Ranking of Indicator Importance
The author recommends that each member of the TODCC rank the importance of
each indicator using the worksheet in Figure 36 and then list the ten most important
indicators using the worksheet in Figure 37. After each member completes these
worksheets, DPI should tally the responses of all members to establish a raking of all
1 http://transitorienteddevelopment.dot.ca.gov/
Measuring the Performance of Transit-Oriented Developments in Western Australia
43
indicators from most to least important. DPI should then present this list to the group
to discuss the possibility of narrowing the data collection effort if resources to collect
data pose a major challenge. The author does not recommend narrowing the data
collection effort because it is necessary to conduct a household survey to collect
most of the indicators. The cost of a household survey is mainly fixed; therefore,
reducing the number of collected indicators would not save much money.
Step 2: Establish a Monitoring Cycle
The TODCC should decide how many TODs to monitor and begin collecting data for
each TOD on a regular basis. It might be cost effective to monitor one or more TODs
each year within a five-year cycle. For example, if the TODCC wants to monitor 30
TODs, data should be collected on six TODs each year for five years. The cycle
would repeat itself starting in year 6. The reason the five-year cycle is important is
that the Australian Bureau of Statistics conducts a Census every five years. It is not
essential that the Census data and the household survey be conducted in the same
year, but creating a similar cycle of data collection is encouraged.
Step 3: Analyze Data and Public Outreach
The TODCC should provide resources to conduct a quantitative and qualitative
analysis of the data. After the indicators are collected and analyzed a report
summarizing the results of each TOD should be written and distributed to local
stakeholders. The TODCC and/or DPI should conduct a local workshop to discuss
the results and request local input. This input should be incorporated into a final
report, which outlines plans and policies to be incorporated into ongoing planning
efforts.
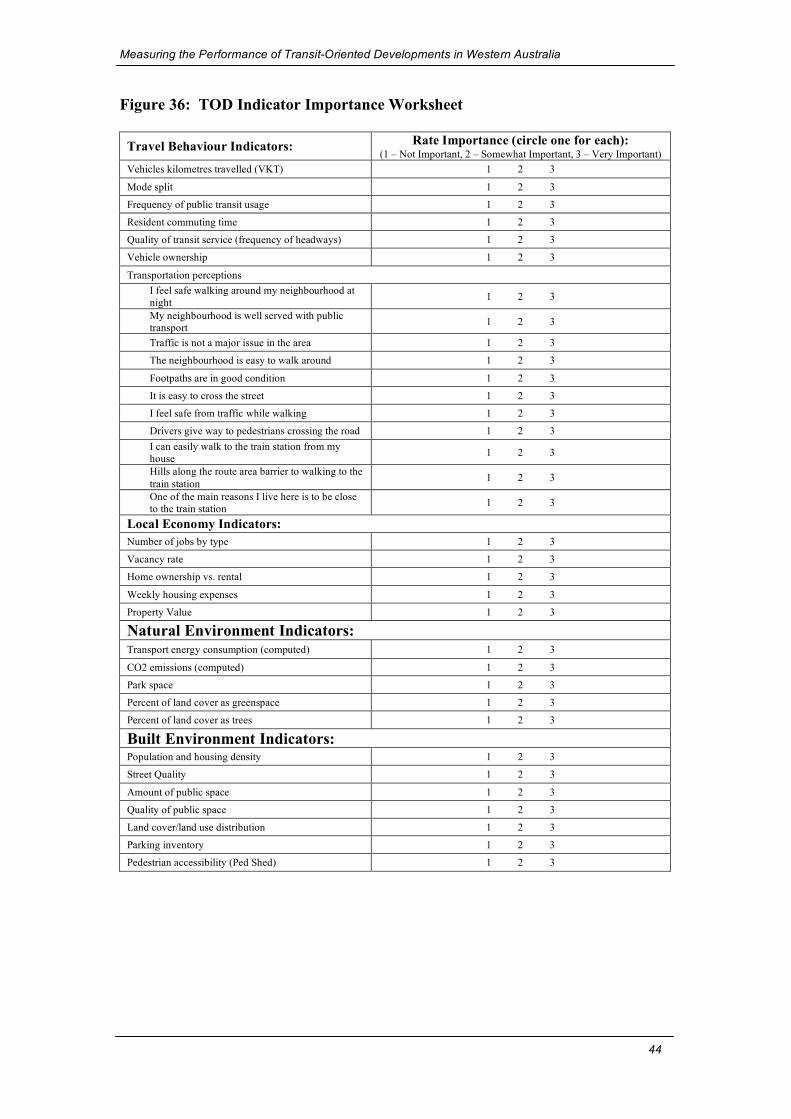
Measuring the Performance of Transit-Oriented Developments in Western Australia
44
Figure 36: TOD Indicator Importance Worksheet
Travel Behaviour Indicators: Rate Importance (circle one for each): (1 – Not Important, 2 – Somewhat Important, 3 – Very Important)
Vehicles kilometres travelled (VKT) 1 2 3
Mode split 1 2 3 Frequency of public transit usage 1 2 3 Resident commuting time 1 2 3 Quality of transit service (frequency of headways) 1 2 3 Vehicle ownership 1 2 3 Transportation perceptions
I feel safe walking around my neighbourhood at night 1 2 3 My neighbourhood is well served with public transport 1 2 3 Traffic is not a major issue in the area 1 2 3 The neighbourhood is easy to walk around 1 2 3 Footpaths are in good condition 1 2 3 It is easy to cross the street 1 2 3 I feel safe from traffic while walking 1 2 3 Drivers give way to pedestrians crossing the road 1 2 3 I can easily walk to the train station from my house 1 2 3 Hills along the route area barrier to walking to the train station 1 2 3 One of the main reasons I live here is to be close to the train station 1 2 3
Local Economy Indicators: Number of jobs by type 1 2 3 Vacancy rate 1 2 3 Home ownership vs. rental 1 2 3 Weekly housing expenses 1 2 3 Property Value 1 2 3 Natural Environment Indicators: Transport energy consumption (computed) 1 2 3 CO2 emissions (computed) 1 2 3 Park space 1 2 3 Percent of land cover as greenspace 1 2 3 Percent of land cover as trees 1 2 3 Built Environment Indicators: Population and housing density 1 2 3 Street Quality 1 2 3 Amount of public space 1 2 3 Quality of public space 1 2 3 Land cover/land use distribution 1 2 3 Parking inventory 1 2 3 Pedestrian accessibility (Ped Shed) 1 2 3
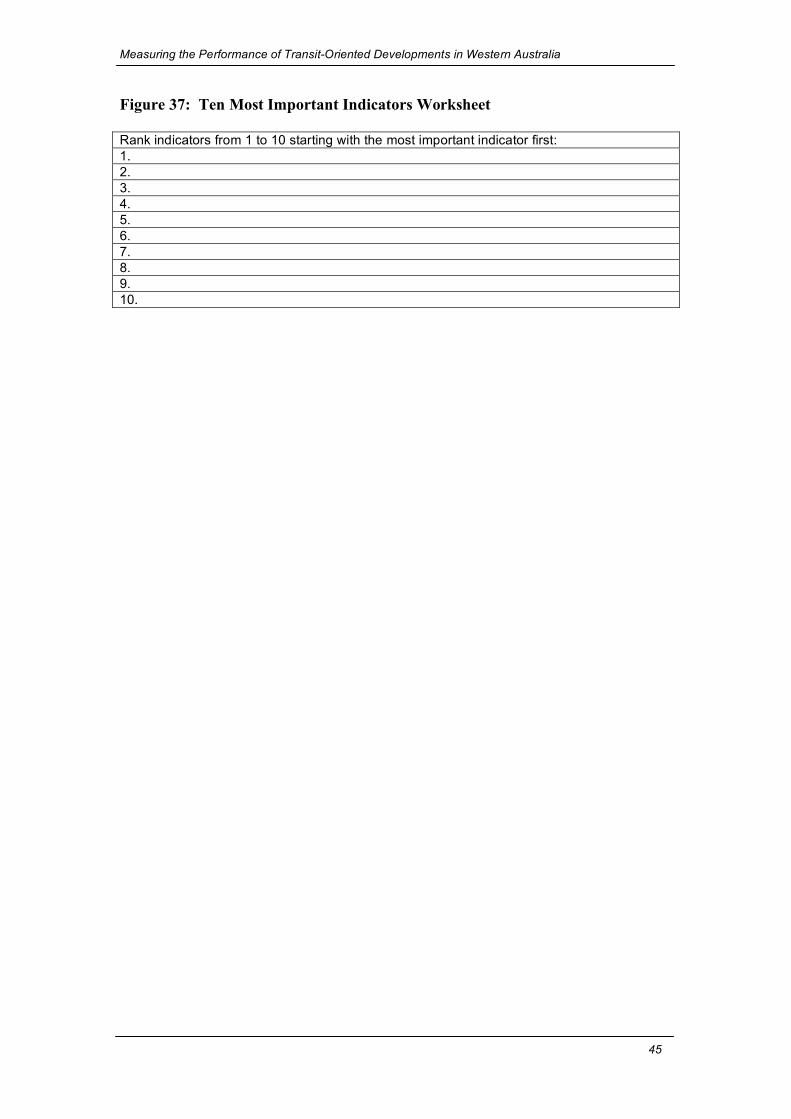
Measuring the Performance of Transit-Oriented Developments in Western Australia
45
Figure 37: Ten Most Important Indicators Worksheet Rank indicators from 1 to 10 starting with the most important indicator first: 1. 2. 3. 4. 5. 6. 7. 8. 9. 10.
Measuring the Performance of Transit-Oriented Developments in Western Australia
46
Works Cited
Banister, D., Pucher, J., & Lee-Gosselin, M. (2006). Making Sustainable Transport
Politically and Publicaly Acceptable. In P. Rietveld (Ed.), Institutions and Sustainable Transport: Regulatory Reform in Advanced Economies. London: Edward Elgar.
Bertolini, L. (2007). Stations as nodes in urban networks: emerging development strategies. In F. Bruinsma, E. Pels, P. Priemus, P. Rietveld & B. Van Wee (Eds.), Railway development: impacts on urban dynamics.
Boarnet, M. G., & Crane, R. (2001). Travel by Design : The Influence of Urban Form on Travel. Oxford ; New York: Oxford University Press.
California Department of Transportation. (2002a). Statewide Transit-Oriented Development Study: Factors for Success in California. Sacramento, California: California Department of Transportation.
California Department of Transportation. (2002b). Statewide Transit-Oriented Development Study: Factors for Success in California, Technical Appendix. Sacramento, California: California Department of Transportation.
Center for Transit-Oriented Development. (2004). Hidden in Plain Sight: Capturing the Demand for Housing Near Transit. Las Vegas, NM: Reconnecting America.
Cervero, R. (1994). Transit-Based Housing in California: Evidence on Ridership Impacts. Transport Policy, 1(3), 174-183.
Cervero, R., Arrington, G. B., Smith-Heimer, J., Dunphy, R., Murphy, S., Ferrell, C., et al. (2004). Transit Oriented Development in America: Experiences, Challenges, and Prospects, TCRP Report 102. Washington, D.C.: National Academy Press.
Cervero, R., & Duncan, M. (2002). Benefits of Proximity to Rail on Housing Markets. Journal of Public Transportation, 5(1), 1-18.
Cervero, R., & Duncan, M. (2002). Transit's Value-Added Effects: Light and Commuter Rail Services and Commercial Land Values. Transportation Research Record, 1805, 8-15.
Chatman, D. G. (2006). Transit-Oriented Development and Household Travel: A Study of California Cities (DRAFT). Los Angeles: Institute of the Environment, Institute of Transportation Studies, Department of Urban Planning, School of Public Affairs.
City of Cleveland. (2001). The Effect of Rail Transit on Property Values: A Summary of Studies (Draft). Cleveland, Ohio: Prepared by Parsons Brinkerhoff.
Government of Western Australia. (2003). Hope for the Future: The Western Australian State Sustainability Strategy. Perth: Department of the Premier and Cabinet.
Government of Western Australia. (2004). Network City: Community Planning Strategy for Perth and Peel. Perth, Western Australia: Western Australian Planning Commission.
Huang, H. (1996). The Land-Use Impacts of Urban Rail Transit Systems. Journal of Planning Literature, 11(1), 17-30.
Levine, J. (2006). Zoned out : regulation, markets, and choices in transportation and metropolitan land-use. Washington, DC: Resources for the Future.
Measuring the Performance of Transit-Oriented Developments in Western Australia
47
Levine, J., & Inam, A. (2004). The Market for Transportation-Land Use Integration: Do Developers Want Smarter Growth than Regulations Allow? Transportation, 31(4), 409-427.
Loukaitou-Sideris, A., & Banerjee, T. (2000). The Blue Line Blues: Why the Vision of Transit Village May Not Materialize Despite Impressive Growth in Transit Ridership. Journal of Urban Design, 5(2), 101-125.
Lund, H., Cervero, R., & Willson, R. (2004). Travel Characteristics of Transit-Oriented Development in California. Pomona: Cal Poly Pomona.
Newman, P., & Kenworthy, J. (2006). Urban Design to Reduce Automobile Dependence. Opolis, 2(1), 35-52.
Newman, P., & Kenworthy, J. R. (1999). Sustainability and cities : overcoming automobile dependence. Washington, D.C.: Island Press.
Renne, J. (2005a). Transit-Oriented Development in Western Australia: Attitudes, Obstacles, and Opportunities. Perth, Western Australia: Planning and Transport Research Centre.
Renne, J. (2005b). Transit-Oriented Development: Measuring Benefits, Analyzing Trends, and Evaluating Policy. Rutgers University, New Brunswick, New Jersey.
Renne, J., & Wells, J. S. (2003). Transit Villages in New Jersey: Public Opinion and Attitudes. New Brunswick, New Jersey: Voorhees Transportation Center, Rutgers University.
Renne, J., & Wells, J. S. (2005). Transit-Oriented Development: Developing a Strategy to Measure Success (Vol. Research Results Digest 294). Washington, D.C.: Transportation Research Board of the National Academies, National Cooperative Highway Research Program.
Urban Land Institute, & PriceWaterhouseCoopers. (2005). Emerging Trends in Real Estate. Washington, D.C.: Urban Land Institute.
Wells, J. S., & Renne, J. (2003). Transit Villages in New Jersey: Recommendations for Assessment and Accountability. New Brunswick, New Jersey: Alan M. Voorhees Transportation Center, Rutgers University.

Appendix A
TOD Household Cover Letter and Questionnaire
Perth “Transit-Oriented Development” Study
About this survey: As a resident of a train-served suburb of Perth you have been selected to participate in a Murdoch University survey about your local area. Your household has been chosen completely at random based only on the suburb where you live. The information that you provide will help guide planning for the future development of Perth.
So that we can get a full range of community opinions it is important that you are able to complete this questionnaire. There are no right or wrong answers to the survey. We just want to know what you think about life in your suburb and some issues related to transportation. It will only take a few minutes to complete this short questionnaire.
If you have any questions or require any assistance while you are completing the questionnaire please see the enclosed letter for further information and contact details.
Confidentiality: To make sure all of your responses are anonymous, this questionnaire does not have any way of identifying you. A separate card, which is mailed back to Murdoch University at the same time as your questionnaire, will help us keep track of who participated, but this cannot be linked to your answers on this form.
Instructions: 1. WHO SHOULD FILL OUT THE QUESTIONNAIRE? Either the male or female
head of the household should complete the survey.
2. HOW DO I FILL IT OUT? For most questions, just circle the number or tick the box that best fits your opinion. Unless otherwise noted, please choose only one response. For a few questions you will be asked to write in your own answer.
3. WHAT DO I DO WHEN I FINISH FILLING IT OUT? We ask you to please mail this questionnaire back to us in the large reply-paid envelope provided. Please also complete the blue confirmation slip and return it in the small envelope.
PLEASE TAKE A FEW MINUTES RIGHT NOW TO FILL IN YOUR RESPONSES AND MAIL BACK THE QUESTIONNAIRE
PLEASE RETURN THE QUESTIONNAIRE WITHIN 7 DAYS!
Institute for Sustainability and Technology Policy Murdoch University MURDOCH WA 6150
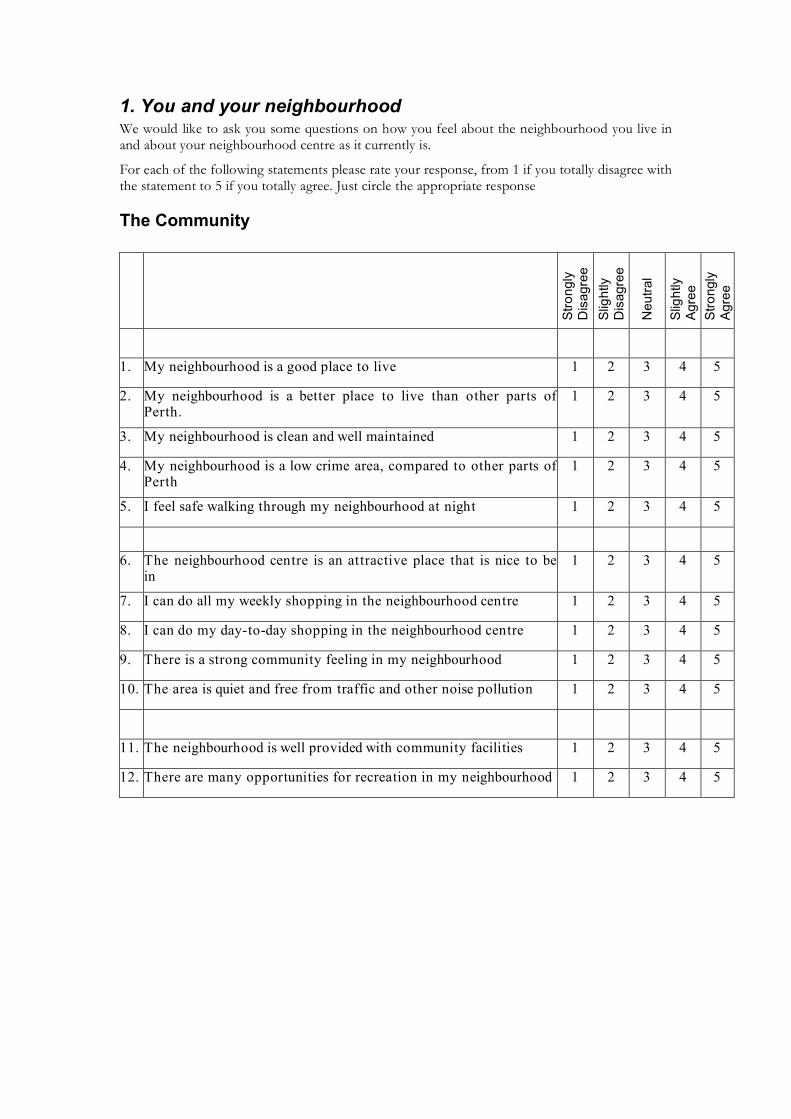
1. You and your neighbourhood We would like to ask you some questions on how you feel about the neighbourhood you live in and about your neighbourhood centre as it currently is.
For each of the following statements please rate your response, from 1 if you totally disagree with the statement to 5 if you totally agree. Just circle the appropriate response
The Community
Stro
ngly
D
isag
ree
Slig
htly
D
isag
ree
Neu
tral
Slig
htly
Ag
ree
Stro
ngly
Ag
ree
1. My neighbourhood is a good place to live 1 2 3 4 5
2. My neighbourhood is a better place to live than other parts of Perth.
1 2 3 4 5
3. My neighbourhood is clean and well maintained 1 2 3 4 5
4. My neighbourhood is a low crime area, compared to other parts of Perth
1 2 3 4 5
5. I feel safe walking through my neighbourhood at night 1 2 3 4 5
6. The neighbourhood centre is an attractive place that is nice to be in
1 2 3 4 5
7. I can do all my weekly shopping in the neighbourhood centre 1 2 3 4 5
8. I can do my day-to-day shopping in the neighbourhood centre 1 2 3 4 5
9. There is a strong community feeling in my neighbourhood 1 2 3 4 5
10. The area is quiet and free from traffic and other noise pollution 1 2 3 4 5
11. The neighbourhood is well provided with community facilities 1 2 3 4 5
12. There are many opportunities for recreation in my neighbourhood 1 2 3 4 5
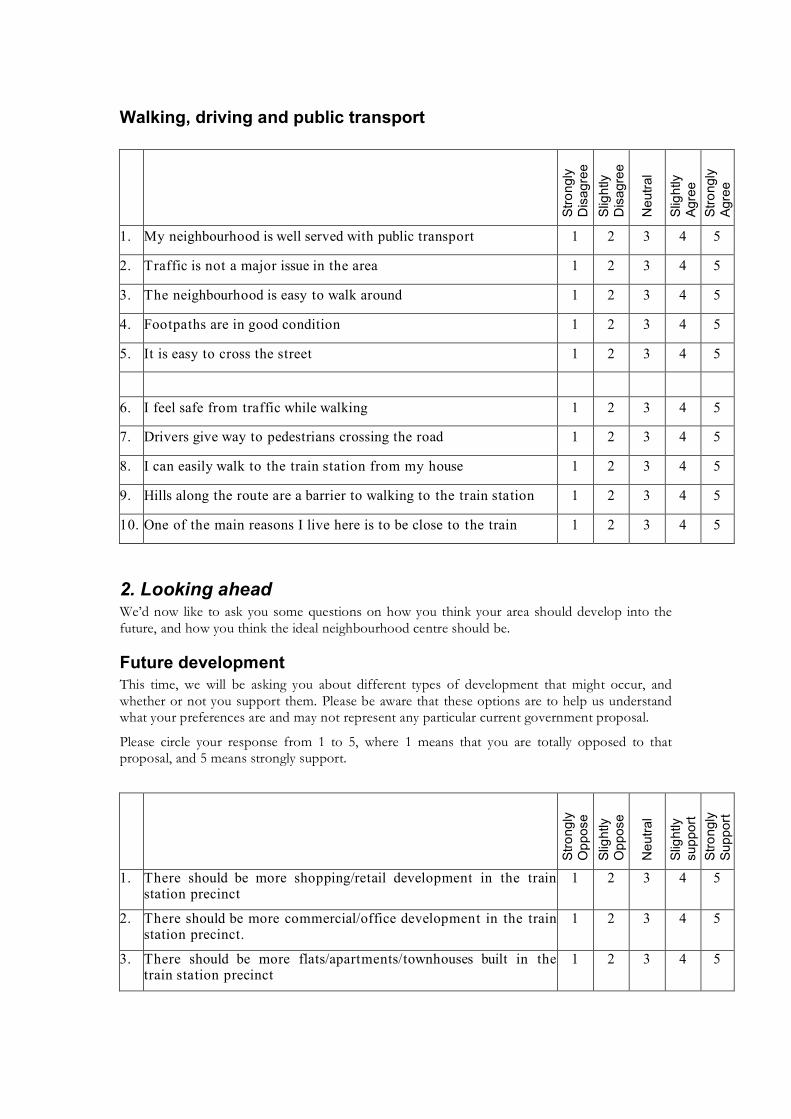
Walking, driving and public transport
Stro
ngly
D
isag
ree
Slig
htly
D
isag
ree
Neu
tral
Slig
htly
Ag
ree
Stro
ngly
Ag
ree
1. My neighbourhood is well served with public transport 1 2 3 4 5
2. Traffic is not a major issue in the area 1 2 3 4 5
3. The neighbourhood is easy to walk around 1 2 3 4 5
4. Footpaths are in good condition 1 2 3 4 5
5. It is easy to cross the street 1 2 3 4 5
6. I feel safe from traffic while walking 1 2 3 4 5
7. Drivers give way to pedestrians crossing the road 1 2 3 4 5
8. I can easily walk to the train station from my house 1 2 3 4 5
9. Hills along the route are a barrier to walking to the train station 1 2 3 4 5
10. One of the main reasons I live here is to be close to the train 1 2 3 4 5
2. Looking ahead We’d now like to ask you some questions on how you think your area should develop into the future, and how you think the ideal neighbourhood centre should be.
Future development This time, we will be asking you about different types of development that might occur, and whether or not you support them. Please be aware that these options are to help us understand what your preferences are and may not represent any particular current government proposal.
Please circle your response from 1 to 5, where 1 means that you are totally opposed to that proposal, and 5 means strongly support.
Stro
ngly
O
ppos
e Sl
ight
ly
Opp
ose
Neu
tral
Slig
htly
su
ppor
t St
rong
ly
Supp
ort
1. There should be more shopping/retail development in the train station precinct
1 2 3 4 5
2. There should be more commercial/office development in the train station precinct.
1 2 3 4 5
3. There should be more flats/apartments/townhouses built in the train station precinct
1 2 3 4 5
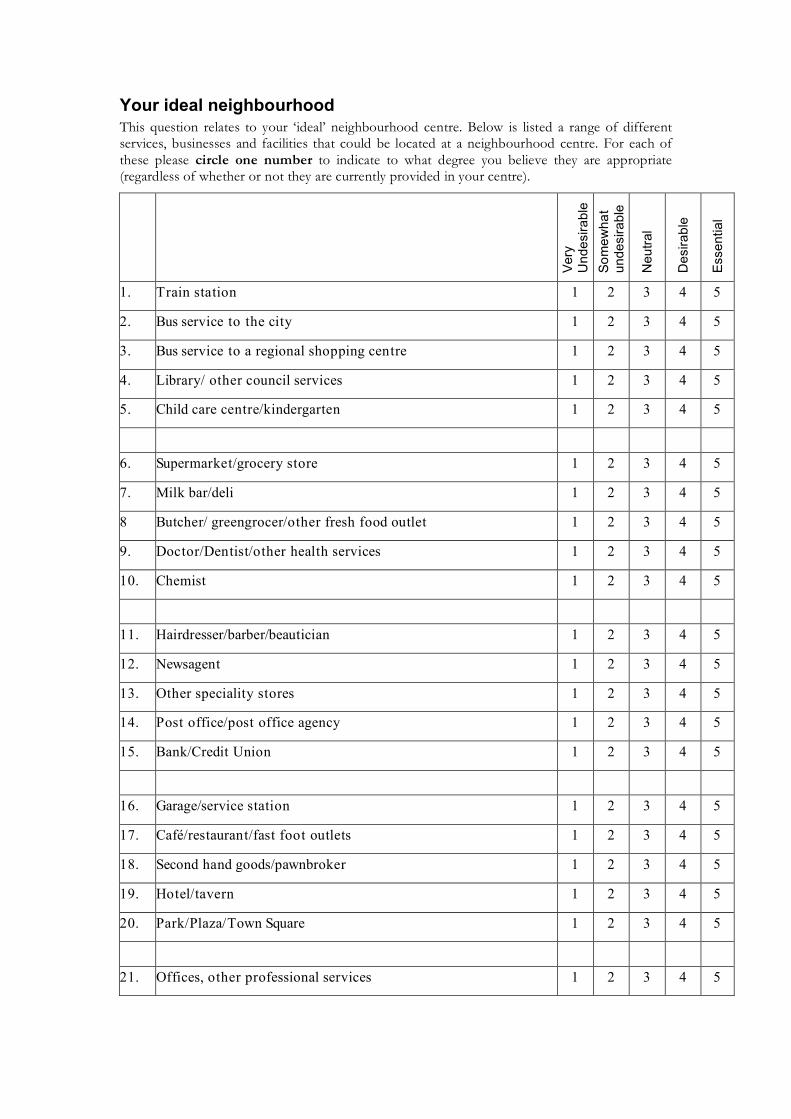
Your ideal neighbourhood This question relates to your ‘ideal’ neighbourhood centre. Below is listed a range of different services, businesses and facilities that could be located at a neighbourhood centre. For each of these please circle one number to indicate to what degree you believe they are appropriate (regardless of whether or not they are currently provided in your centre).
Very
U
ndes
irabl
e So
mew
hat
unde
sira
ble
Neu
tral
Des
irabl
e
Esse
ntia
l
1. Train station 1 2 3 4 5
2. Bus service to the city 1 2 3 4 5
3. Bus service to a regional shopping centre 1 2 3 4 5
4. Library/ other council services 1 2 3 4 5
5. Child care centre/kindergarten 1 2 3 4 5
6. Supermarket/grocery store 1 2 3 4 5
7. Milk bar/deli 1 2 3 4 5
8 Butcher/ greengrocer/other fresh food outlet 1 2 3 4 5
9. Doctor/Dentist/other health services 1 2 3 4 5
10. Chemist 1 2 3 4 5
11. Hairdresser/barber/beautician 1 2 3 4 5
12. Newsagent 1 2 3 4 5
13. Other speciality stores 1 2 3 4 5
14. Post office/post office agency 1 2 3 4 5
15. Bank/Credit Union 1 2 3 4 5
16. Garage/service station 1 2 3 4 5
17. Café/restaurant/fast foot outlets 1 2 3 4 5
18. Second hand goods/pawnbroker 1 2 3 4 5
19. Hotel/tavern 1 2 3 4 5
20. Park/Plaza/Town Square 1 2 3 4 5
21. Offices, other professional services 1 2 3 4 5
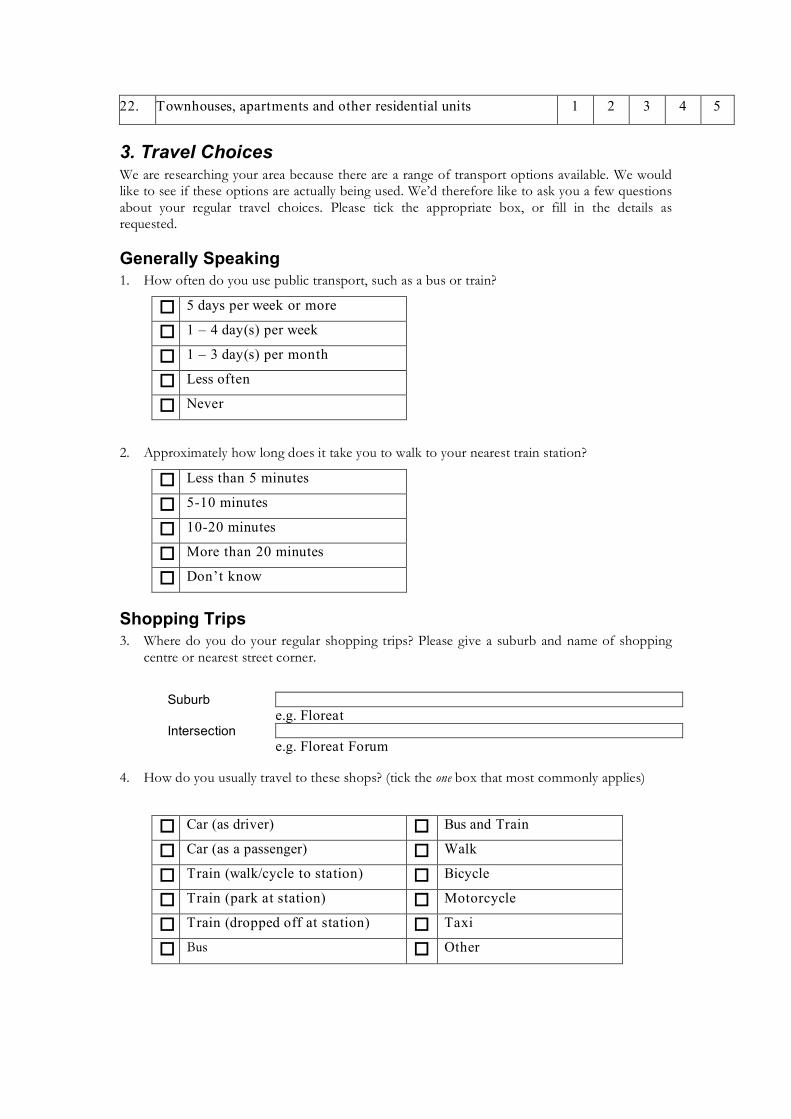
22. Townhouses, apartments and other residential units 1 2 3 4 5
3. Travel Choices We are researching your area because there are a range of transport options available. We would like to see if these options are actually being used. We’d therefore like to ask you a few questions about your regular travel choices. Please tick the appropriate box, or fill in the details as requested.
Generally Speaking 1. How often do you use public transport, such as a bus or train?
5 days per week or more
1 – 4 day(s) per week
1 – 3 day(s) per month
Less often
Never
2. Approximately how long does it take you to walk to your nearest train station?
Less than 5 minutes
5-10 minutes
10-20 minutes
More than 20 minutes
Don’t know
Shopping Trips 3. Where do you do your regular shopping trips? Please give a suburb and name of shopping
centre or nearest street corner.
Suburb e.g. Floreat Intersection e.g. Floreat Forum
4. How do you usually travel to these shops? (tick the one box that most commonly applies)
Car (as driver) Bus and Train
Car (as a passenger) Walk
Train (walk/cycle to station) Bicycle
Train (park at station) Motorcycle
Train (dropped off at station) Taxi
Bus Other
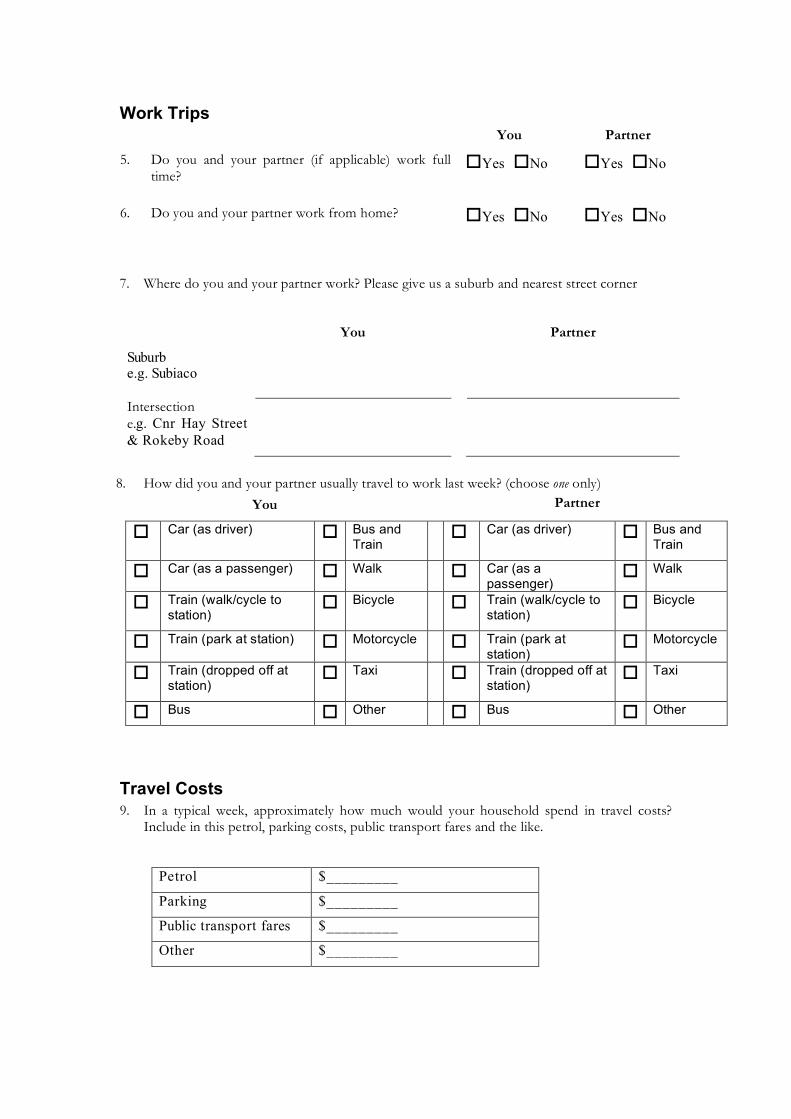
Work Trips You Partner
5. Do you and your partner (if applicable) work full time?
Yes No
Yes No
6. Do you and your partner work from home? Yes No Yes No
7. Where do you and your partner work? Please give us a suburb and nearest street corner
You Partner
Suburb e.g. Subiaco
Intersection e.g. Cnr Hay Street & Rokeby Road
8. How did you and your partner usually travel to work last week? (choose one only)
Car (as driver) Bus and
Train Car (as driver) Bus and
Train
Car (as a passenger) Walk Car (as a passenger)
Walk
Train (walk/cycle to station)
Bicycle Train (walk/cycle to station)
Bicycle
Train (park at station) Motorcycle Train (park at station)
Motorcycle
Train (dropped off at station)
Taxi Train (dropped off at station)
Taxi
Bus Other Bus Other
Travel Costs 9. In a typical week, approximately how much would your household spend in travel costs?
Include in this petrol, parking costs, public transport fares and the like.
Petrol $_________
Parking $_________
Public transport fares $_________
Other $_________
You Partner
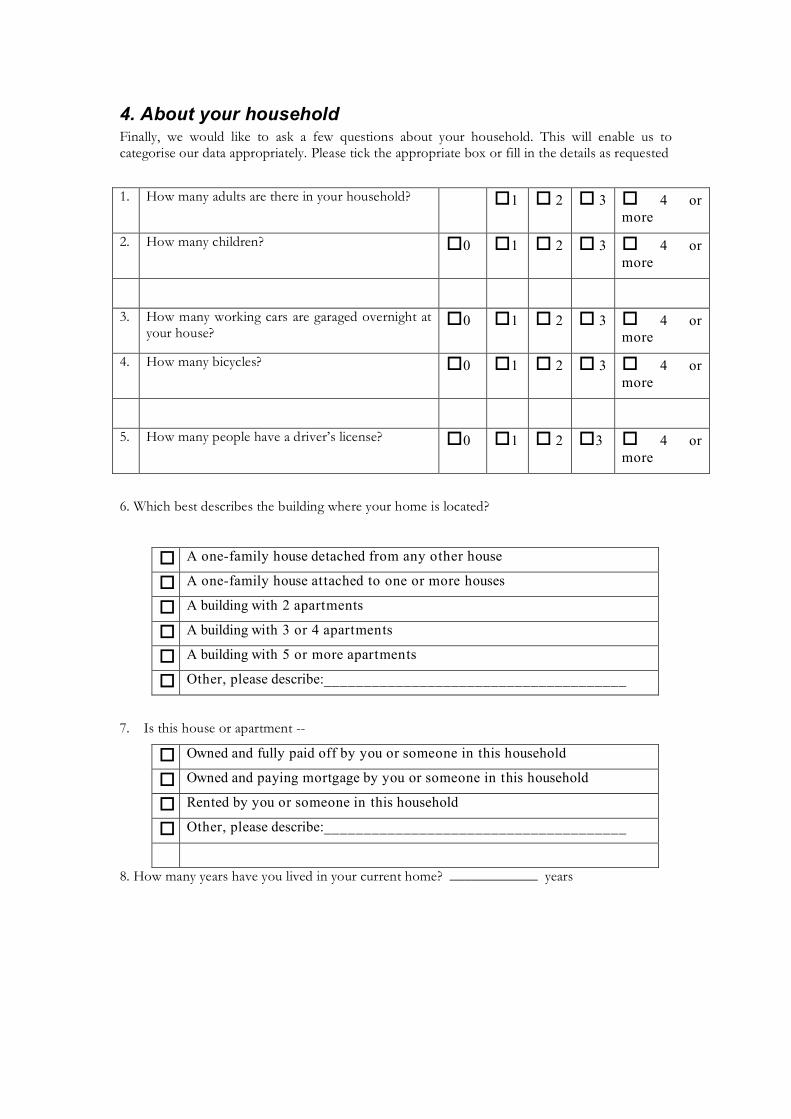
4. About your household Finally, we would like to ask a few questions about your household. This will enable us to categorise our data appropriately. Please tick the appropriate box or fill in the details as requested
1. How many adults are there in your household? 1 2 3 4 or
more
2. How many children? 0 1 2 3 4 or more
3. How many working cars are garaged overnight at
your house? 0 1 2 3 4 or
more
4. How many bicycles? 0 1 2 3 4 or more
5. How many people have a driver’s license? 0 1 2 3 4 or
more
6. Which best describes the building where your home is located?
A one-family house detached from any other house
A one-family house attached to one or more houses
A building with 2 apartments
A building with 3 or 4 apartments
A building with 5 or more apartments
Other, please describe:______________________________________
7. Is this house or apartment --
Owned and fully paid off by you or someone in this household
Owned and paying mortgage by you or someone in this household
Rented by you or someone in this household
Other, please describe:______________________________________
8. How many years have you lived in your current home? ____________ years
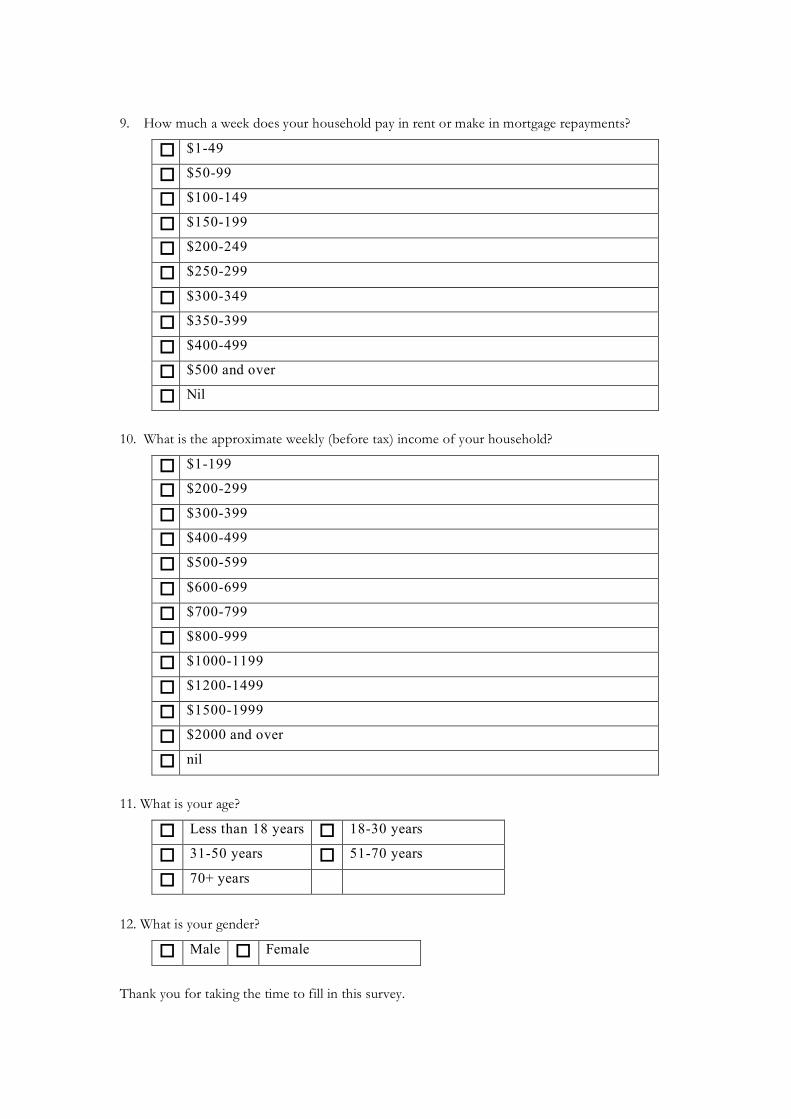
9. How much a week does your household pay in rent or make in mortgage repayments?
$1-49
$50-99
$100-149
$150-199
$200-249
$250-299
$300-349
$350-399
$400-499
$500 and over
Nil
10. What is the approximate weekly (before tax) income of your household?
$1-199
$200-299
$300-399
$400-499
$500-599
$600-699
$700-799
$800-999
$1000-1199
$1200-1499
$1500-1999
$2000 and over
nil
11. What is your age?
Less than 18 years 18-30 years
31-50 years 51-70 years
70+ years
12. What is your gender?
Male Female
Thank you for taking the time to fill in this survey.

Please now return this questionnaire to us in the return post envelope provided.