Embed Size (px)
Citation preview

Measuring poverty in South Africa: Methodological report on the development of the poverty
lines for statistical reporting
Technical report D0300
Statistics South Africa
November 2008
2
Foreword
This report presents the work of Statistics South Africa on piloting a monetary
poverty measure in the form of poverty lines. The approach followed is that of
absolute poverty measurement. In view of the multi-dimensionality of poverty,
statistical agencies make deliberate choices to use one or other method. Generally,
statistical agencies that attempt to measure poverty predominantly use money-metric
measures because of their well-developed methodologies.
This work represents another step in creating an informed society. The development
of these poverty lines will enable stakeholders and policy partners to focus on the
dynamics of the poverty profile and to guide discussion and debates informed by a
standard poverty measure. The poverty lines presented here, will be piloted in the
period leading to 2014, when another review will be undertaken. During this period,
Statistics South Africa will continue to engage with stakeholders on broader poverty
measurement in various fora. Although, this is a technical report, it has been written
with a lay audience in mind to ensure better accessibility. Further reports in the series
“Measuring Poverty in South Africa” will present additional details on the subject-
matter. We welcome comments and suggestions on this discussions on our website at
www.statssa.gov.za.
We want to thank all participants in the various fora where preliminary reports were
presented, including NEDLAC partners.
P J LehohlaStatistician General
3
1. Introduction
Poverty alleviation and the elimination of inequalities created during apartheid lie at
the centre of development policy in post-apartheid South Africa. This commitment is
reflected in the various anti-poverty policies and programs developed, and
implemented to meet the objectives of the Reconstruction and Development Program
(RDP) of 1994. Under the RDP umbrella, poverty alleviation was addressed from a
multi-dimensional perspective. This is in keeping with the understanding that poverty
is multi-dimensional and, that those living in poverty are vulnerable to deprivation in
several dimensions.
Since 2004, government has indicated its intention to establish a poverty line as the
basis for presenting indicators of poverty in monetary dimensions (Government
Programme of Action 2004, Budget Speeches 2005–2008). This technical report
presents the methodology followed to develop a set of three pilot poverty to be used
by Statistics South Africa (Stats SA) in reporting monetary poverty statistics. A
poverty line is a monetary cut-off point below which a person is deemed to be poor.
These pilot poverty lines are designed to assist the reporting of statistical information
on poverty levels and poverty profiles for analytical work in a pilot phase leading up
to 2014. As South Africa moves towards an integrated anti-poverty strategy, such
statistics are required to understand the poverty situation and to assess progress in
addressing monetary poverty.
In support of anti-poverty strategies, a poverty line measure provides statistical
standards and a systematic approach to reporting monetary poverty indicators. These
include indicators of poverty levels (e.g., the headcount index, poverty depth) and
inequality indicators (e.g., decile shares, the Gini coefficient). When combined with
non-monetary information on households and individuals (e.g., access to basic
services, educational attainment), it is possible to obtain statistical profiles of non-
monetary indicators for various poverty groups – the poverty matrix is one such
example.
4
The pilot poverty lines (PPL) presented in this report are designed for use alongside
existing administrative poverty measures implemented by government departments
and other public sector agencies. These include social grants, means-tested financial
assistance, and access to no-fee government services. It is also important to emphasise
that the PPL do not replace or affect existing criteria for other poverty alleviation
programmes, nor can they be used to determine wages or remuneration of any kind.
The primary purpose of the PPL is to report statistics on poverty levels and profiles.
This purpose is dictated by the methodology followed in their construction, and by the
limitations imposed by the household expenditure they are based on.
Structure of the report
The report consists of 5 sections. The Section 2 presents the context for the poverty
line approach. Data sources and a methods overview are discussed in Section 3, and
the detailed process for constructing the PPL is presented in Section 4. Section 5
concludes.
5
2. Overview of the poverty line approach
2.1 Background
Poverty is an important, universal human problem. This is evident from its position on
the world development agenda (for instance, the Millennium Development Goals). To
ensure credible, effective action in addressing in poverty and inequality, information
on the poverty situation is required on a regular basis. Information of this type is key
to the policy development cycle when evidence -based decision-making is practised in
setting poverty reduction strategies (see Box 1).
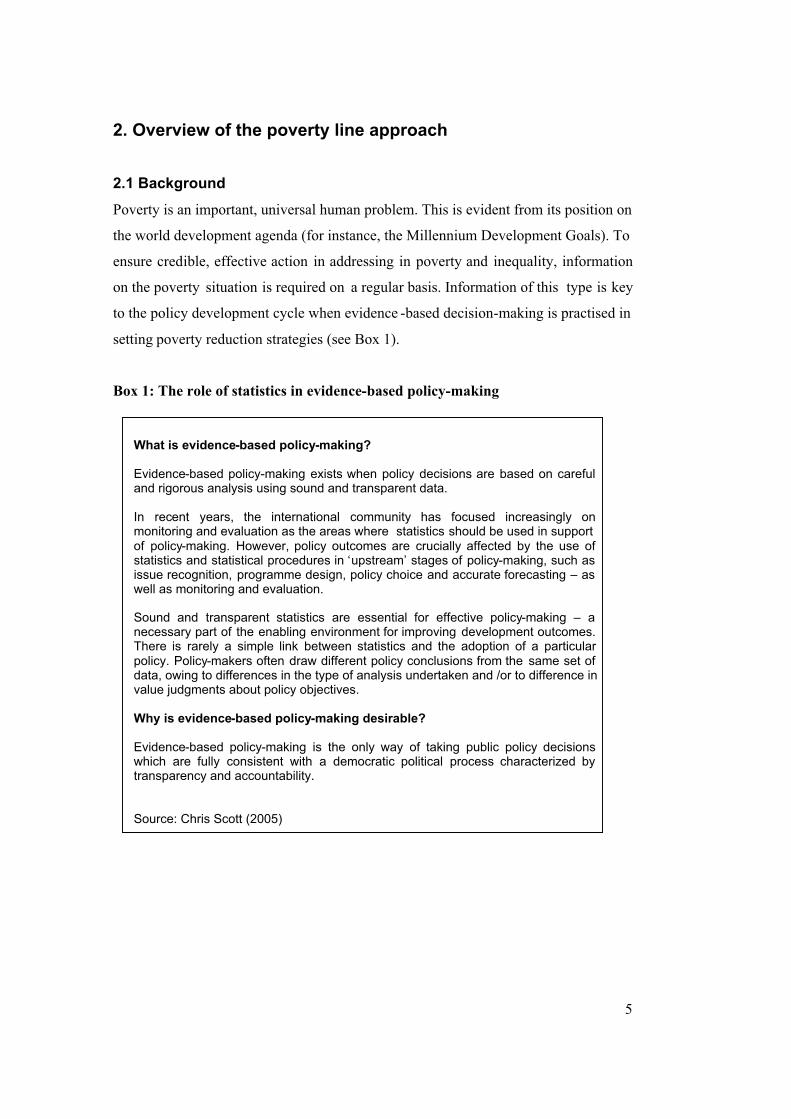
Box 1: The role of statistics in evidence-based policy-making
What is evidence-based policy-making?
Evidence-based policy-making exists when policy decisions are based on careful and rigorous analysis using sound and transparent data.
In recent years, the international community has focused increasingly on monitoring and evaluation as the areas where statistics should be used in support of policy-making. However, policy outcomes are crucially affected by the use of statistics and statistical procedures in ‘upstream’ stages of policy-making, such as issue recognition, programme design, policy choice and accurate forecasting – as well as monitoring and evaluation.
Sound and transparent statistics are essential for effective policy-making – a necessary part of the enabling environment for improving development outcomes. There is rarely a simple link between statistics and the adoption of a particular policy. Policy-makers often draw different policy conclusions from the same set of data, owing to differences in the type of analysis undertaken and /or to difference in value judgments about policy objectives.
Why is evidence-based policy-making desirable?
Evidence-based policy-making is the only way of taking public policy decisions which are fully consistent with a democratic political process characterized by transparency and accountability.
Source: Chris Scott (2005)
6
2.2 Determining poverty status
In a typical evidence-based policy planning cycle, various types of information are
used to support all phases: diagnostics; design and development of interventions;
implementation and monitoring of policies and programmes; and evaluation
processes. Therefore, to monitor and evaluate the collective impact of all poverty and
inequality reduction programmes, it is necessary to capture changes in the
circumstances of potential beneficiaries – both the general population and groups that
known to be deprived. This can be achieved by monitoring the poverty status of
individuals, vulnerable groups, communities and society as a whole.
Central to determining poverty status is the identification question. Ravallion (1994:
3) illustrates the point:
How do we assess ‘economic well-being’? At what point do we say that a
person is not poor? And: How do we aggregate this information into a
measure of poverty? The first two questions are sometimes referred to as the
‘identification problem’ (which individuals are poor, and how poor are they?)
while the third is called the ‘aggregation problem’ (how much poverty is
there?).
The identification question is the basis for numerous debates. This is not surprising,
given the multiplicity of poverty dimensions. For instance, how do we identify the
poor: is it by of lack of resources; or by lack of capabilities; or by hunger; or by the
absence of basic services; or by deprivation of human rights; or by individual
perception of poverty status? The wide range of possible answers to this question
translates into different approaches to poverty measurement. The diffe rent approaches
to poverty concepts and definitions are well established in the literature and their
discussion is beyond the scope of this report. Suffice to say that with so many
approaches to poverty measurement, the identification of the poor tends to differ by
approach, because different approaches capture different aspects of poverty. There are
numerous contestations around what dimensions of poverty to measure and equally
(potentially) polarizing debate regarding measurement techniques, ranging from
objective to subjective considerations and their application to quantitative or
qualitative approaches (Ravallion, 2001). As various researchers have noted: all
7
approaches are equally useful, but depending on the research situation, some may
work better than others (Babbie, 2008; Bausch, 1996; Shaffer, 1996).
For evidence-based decisions in public policy, this kind of imprecision (in
establishing poverty status) is useful for some scenarios but not in others. There are
clear advantages to obtaining definitions that identify different kinds of poverty status
when planning service delivery and targeted interventions. A broad range of
definitions ensures a comprehensive diagnosis of the poverty situation. However, to
assess overall progress in achieving the goal of poverty reduction (in, say, a particular
dimension), explicit poverty status is required.
A further consideration for pro-poor planning is that regardless of the approach
followed, reactions will vary depending on the impact on interest groups –
implementing agencies, potential beneficiaries and lobby groups. Therefore, to ensure
accountability and transparency, decisions on poverty measurement must be anchored
in the relevancy of approaches to the purpose of measurement. As argued by Woolard
and Leibbrandt (2006: 18): “A poverty line will always be an imperfect construct, but
for purposes of analysis one frequently has to draw the line somewhere in order to go
forward in understanding the nature of poverty”. And following Greeley (1994:11): “
An absolute and objective poverty line is a form of information that empowers the
poverty reduction agenda and encourages appropriate resources allocation”. The
development of the PPL is in response to the need for standardised statistical
information on poverty indicators.
2.3 The poverty line approach
The Statistics Division of the United Nations (UNSD) tasked a number of expert
groups (called city groups) to research good practice on a series of statistical topics
common to UN members. The United Nations Expert Group on Poverty Statistics was
convened as the Rio Group and in 2006 produced a compendium of best practices in
poverty measurement. According to the Rio Group (2006: 25), three basic approaches
to the establishment of the poverty line can be identified:
• The absolute poverty line
8
• The relative poverty line
• The subjective poverty line
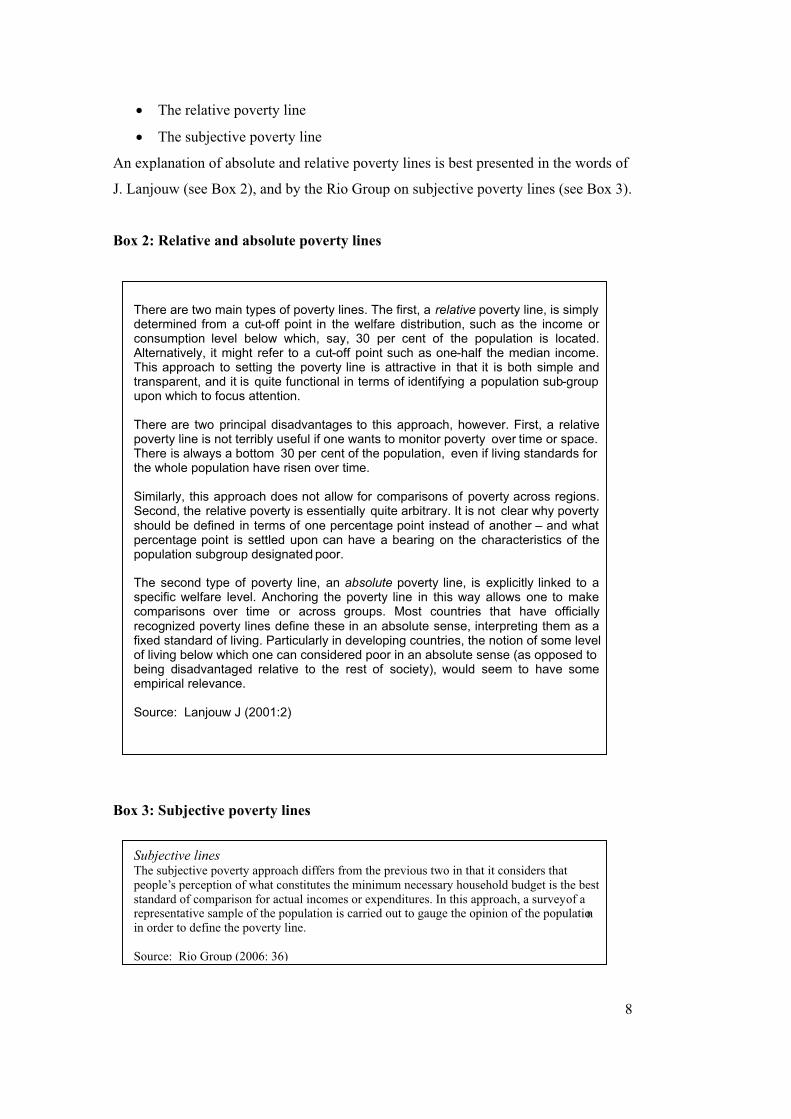
An explanation of absolute and relative poverty lines is best presented in the words of
J. Lanjouw (see Box 2), and by the Rio Group on subjective poverty lines (see Box 3).
Box 2: Relative and absolute poverty lines
Box 3: Subjective poverty lines
There are two main types of poverty lines. The first, a relative poverty line, is simply determined from a cut-off point in the welfare distribution, such as the income or consumption level below which, say, 30 per cent of the population is located. Alternatively, it might refer to a cut-off point such as one-half the median income. This approach to setting the poverty line is attractive in that it is both simple and transparent, and it is quite functional in terms of identifying a population sub-groupupon which to focus attention.
There are two principal disadvantages to this approach, however. First, a relative poverty line is not terribly useful if one wants to monitor poverty over time or space. There is always a bottom 30 per cent of the population, even if living standards for the whole population have risen over time.
Similarly, this approach does not allow for comparisons of poverty across regions. Second, the relative poverty is essentially quite arbitrary. It is not clear why poverty should be defined in terms of one percentage point instead of another – and what percentage point is settled upon can have a bearing on the characteristics of the population subgroup designated poor.
The second type of poverty line, an absolute poverty line, is explicitly linked to a specific welfare level. Anchoring the poverty line in this way allows one to make comparisons over time or across groups. Most countries that have officially recognized poverty lines define these in an absolute sense, interpreting them as a fixed standard of living. Particularly in developing countries, the notion of some level of living below which one can considered poor in an absolute sense (as opposed to being disadvantaged relative to the rest of society), would seem to have some empirical relevance.
Source: Lanjouw J (2001:2)
Subjective lines The subjective poverty approach differs from the previous two in that it considers that people’s perception of what constitutes the minimum necessary household budget is the best standard of comparison for actual incomes or expenditures. In this approach, a survey of a representative sample of the population is carried out to gauge the opinion of the populationin order to define the poverty line.
Source: Rio Group (2006: 36)
9
In brief, absolute poverty lines define the poor on the basis of an absolute standard
applied to income or expenditure, whereas relative poverty lines define poverty
according to the prevailing relative situation in society. On the other hand, subjective
poverty lines depend on individual perceptions of poverty status. In light of these
conceptual differences, the choice of the poverty line approach has to be considered in
relation to the purpose of measurement and sustainable use.
In current practice, the absolute poverty line approach is the most common approach
in situations where absolute poverty is a key problem. This is typical of low-income
countries (e.g., in Sub-Saharan Africa), and middle-income countries where inequality
is high (e.g., South Africa and some Latin America economies). With regard to
relative and subjective poverty lines, Greeley(1994:11) argues that: “…whilst the
ethical basis for policy prescription based on analysis of absolute poverty lines is
reasonably clear, this is not so for either subjective or relative poverty lines. Whilst
subjective and relative assessments have uses, it is absolute and objective poverty
lines that provide relevant information for poverty reduction policy.”
Furthermore, absolute poverty lines are well suited for long-term statistical use
because they are easy to maintain in the absence of annual consumption expenditure
data. This is possible because base period values can be projected retrospectively or
prospectively depending on analytical purpose. Such projections are performed using
customized inflation factors derived from Consumer Price Index series. In contrast,
relative and subjective poverty lines are exclusively dependent on survey data for
updates, and present difficulties for regional comparisons.
Greeley (1994:1) notes that the absolute poverty line approach “attracts criticism on
the basis that it fails to capture important dimensions of poverty and does not reflect
subjective perceptions of well-being.” Similar sentiments were echoed by local
stakeholders during consultation discussions. In response, Greeley offers this
explanation (ibid: 11): “… the notion of an ‘objective’ poverty line is sometimes
challenged on the grounds that it is epistemologically invalid because it implies a
single ‘reality’ and is merely an attempt to imply scientific rigour about something
10
which is only somebody’s value judgment. In fact, no great claims are actually being
made when the term ‘ objective’ is used; the purpose is to establish that the line is not
locally determined on a subjective basis but reflects a set of needs that are universal.
This implies detachment from any specific individual’s assessment; it also implies
quantifiable measurement, reproducibility, systematic comparison and validation
(Patton, 1990)”.
Finally, given our understanding that poverty is multi-dimensional, it follows that
information on all dimensions is equally important for understanding and responding
to the poverty problem. Therefore, in keeping with Stats SA’ s mandate for objective,
quantitative measurement, the responsibility for providing information on additional
dimensions is shared with other government partners. Government departments that
are responsible for policy development and implementation are better placed to
provide information on other dimensions of poverty, using methods appropriate to
their mandates.
11
3. Data and Methods
3.1 Data sources
The data used to aggregate expenditure on goods and services – the consumption
aggregate1 – on which the poverty lines are based, come from two Stats SA surveys
conducted in 2000. The first is the Income and Expenditure Survey of 2000 (2000
IES) and the other is the second round of the bi-annual Labour Force Survey
September 2000 (Sept 2000 LFS). Each survey is nationally representative with a
design sample of approximately 30 000 households.
Until 2005, the IES was conducted every five years among participants of a
concurrent household survey such as the October Household Survey2 or, as happened
in 2000, the Labour Force Survey. During 2005/06 a new IES with an explicit focus
on obtaining data for the design of the Consumer Price Index was introduced. Two
other major changes were implemented in the 2005/06 IES:
(1) introduction of the diary data collection method for frequent purchases in
conjunction with the recall method for less frequent purchases – in the past,
the IES used recall methods to report all types of household expenditure; and
(2) introduction of a year-long data collection process to capture seasonal trends
in income and expenditure patterns.
Ideally, the 2005/06 IES would have been used to construct a new poverty line.
However, the change in survey methodology represents a potential break in the
comparability of the data series. At the time of writing it was too early to ascertain the
factors driving drastic changes in expenditure on some goods and services, for
instance: the share of food expenditure in total household expenditure. Until the
impact of the new methodology on expenditure patterns is understood, the PPL will
be based on the 2000 IES data3, and updated using inflation data. Although there are
1 The components of the consumption aggregate are listed in Appendix B. 2 The October Household Survey was discontinued after 1999.3 Many of the problems associated with the early releases of the 2000 IES data (e.g. sampling weights,
sloppy post-processing edits etc.) have been addressed in later versions. While some issues remain, they do not affect the design of the poverty line.
12
some similarities between the 2000 IES and 2005 IES data, additional time series data
and further research are needed to understand the differences4.
The data used to obtain the cost of the food basket and to adjust the poverty line for
inflation are derived from the monthly price surveys conducted by Stats SA. The
Consumer Price Survey collects information for the production of the monthly
Consumer Price Index (CPI) using a reference set of goods and services called the
CPI basket. The CPI reflects changes in the price levels of consumer goods and
services. The basket and weights are re-designed every five years based on the
Income and Expenditure Survey. From January 1997, the coverage of the CPI was
increased to 14 metropolitan areas and 39 other urban areas throughout all nine
provinces of South Africa5. This (Metropolitan and Urban) CPI is used to adjust the
poverty line for inflation during the period 2000 – 2002. Coverage of shopping
centres close to predominantly rural areas was implemented in 2002 to provide a
more geographically varied CPI for the entire country. This CPI series is called the
CPI Total Country and was used to adjust inflation for the period 2003–2008.
3.2 Methods Overview
In the literature on poverty measurement, three basic steps are identified for poverty
analysis. The first step is to determine the relevant dimension and indicator of well-
being; the second is the construction of a poverty threshold to distinguish the poor and
non-poor, whilst the third is the production of aggregate poverty measures. The scope
of this report is limited to the second step: developing poverty thresholds in the form
of pilot poverty lines. The first step of determining the welfare indicator and the
constructing the consumption aggregate are covered in previous6 reports. Forthcoming
reports in the Stats SA series “Measuring Poverty in South Africa” will provide
details on poverty aggregation measures and statistics on poverty trends.
In the absolute poverty line approach, welfare is associated with consumption of
goods and services (Lanjouw, 2001). Those with sufficient resources to purchase a
minimum basket of goods and services implied by the value of the poverty line are
4 For further details on the 2005/06 IES see the statistical releases at www.statssa.gov.za.5 Previously the CPI covered (historically) Metropolitan areas only.6 See Appendix B; Hoogeven and Ozler (2005)
13
regarded as non-poor, and those with insufficient resources are counted as poor. In the
simplest terms, an absolute poverty line consists of two components – food and non-
food – combined in various ways. This report follows the ‘cost-of-basic-needs’
approach presented by Ravallion (1998). This approach consists of two key steps: the
setting of the food poverty line, and the addition of non-food expenditure to obtain
two additional poverty lines– a lower poverty line and an upper poverty line
(sometimes called total poverty lines to distinguish them from the food poverty line).
In this report, both food and nonfood components are derived from data on South
African households obtained through official, nationally representative Stats SA
surveys. These are 2000 IES and the Sept 2000 LFS ( as described above).
The process followed in deriving a food poverty line, a lower poverty line and an
upper poverty line was designed to create statistical thresholds for poverty status, in
rand per capita, per month. However, in the 2000 IES, expenditure is reported on a
household basis, and since households differ in size and composition, a per capita (per
person) measure is required in order to compare households. The per capita measure
used in this case refers to total household expenditure divided by the number of
people in the household. The assumption is that household resources are equally
shared among household members. In reality, division of household resources may
differ by age, gender or by spousal status (e.g. in some polygamous settings). But in
the absence of specific or authoritative information on such intra-household
allocation, the per capita measure is the easiest to adopt. If the poverty lines presented
in this report are used for any purpose other than the statistical or analytical purposes
they are designed for, then a number of additional computations must be considered –
adult equivalence scales, household economies of scale, reference family or
household structure and so forth 7. For the statistical purposes outlined above, the per
capita approach was considered the simplest and most transparent form of the
absolute poverty line.
The cost of the food component alone is usually referred to as the food poverty line.
For statistical purposes, those falling below this line are regarded as extremely8 poor
since they cannot afford the minimum food-energy intake on which the food line is
7 For a detailed discussion in a South African setting, see Woolard and Leibbrandt (2006).8 Sometimes the food poverty line is also used to determine indigence.

14
based. The main poverty line can be either of two lines: the lower bound or the upper
bound poverty line. Following Ravallion (1998), the lower and upper poverty lines
obtained in this way are regarded as upper and lower bounds for a range of possible
poverty lines. This report presents all three poverty lines for use during the pilot
phase.
3.3 Comparison with previous discussion documents
Research on constructing poverty lines started in 2002 as part of an internal Stats SA
exploratory research project with technical assistance from the World Bank. The
initial research was undertaken to explore how Stats SA data could be used to
establish an information base in support of pro-poor policy research. Stats SA
distributed a discussion document drawing on this research in February 2007 to
support the stakeholder consultation process initiated by National Treasury during that
year.
The Stats SA discussion document presented in February 2007 was a working
document designed to initiate discussion and debate. Following discussions with a
wide range of stakeholders, Stats SA undertook a review of the initial research to
revise and adapt the design of the PPL for long-term statistical use. This was achieved
by considering alternative techniques and newly available data on historical food
prices. The revised design produced a basic food basket representing foods common
to all expenditure-ranked household groups, and a price structure for a national
poverty line that is amenable to CPI inflation-based updates. This technical report and
the PPL presented here replace all previous discussions documents.
15
4. Constructing the poverty lines: the process
4.1 The Food Poverty Line
Consideration of adequate nutrition is a key factor in the design of the food poverty
line as noted by the The Rio Group (2006: 54) : “Adequate nutrition is one of the
most basic human needs, and it is therefore a central element in the construction of
absolute poverty lines”. Hence, the first component of a cost-of-basic-needs poverty
line is based on the cost of a food basket that fulfills at least one nutritional standard.
There are several nutritional requirements, usually published as recommended dietary
requirements for various age and gender combinations, and sometimes for
occupational groups. But, despite the centrality of food in poverty line construction,
the purpose of food component should not be confused with nutritional status as
cautioned by Ravallion (1998: 20):
“One should be clear about the role of data on nutritional or other capabilities
in (these) various versions of the cost-of-basic-needs methods. That role is
essentially to provide an anchor for setting the reference utility level.
Nutritional status is not itself the welfare indicator. Thus there is nothing to
guarantee that someone who can afford the resulting poverty line at every
place or date will actually reach the nutritional requirement.”
There are several ways to set the food component. Lanjouw (2001:5) identifies two
typical approaches – least-cost and expenditure-based – and notes that most methods
integrate elements of both approaches. A key characteristic of the least-cost approach
is the selection of a food basket from a range of baskets in order to fulfil the minimum
energy requirement at the least cost. However, the least cost criteria rarely reflects
actual consumption patterns, and when the process entails the use of complex, linear
programming, the process becomes ‘non-transparent’ (ibid:6).
In the expenditure-based approach, the food basket is designed to reflect actual
consumption patterns as represented by expenditure data. In consideration of local
conditions, and the history9 of setting poverty lines in this country, this report follows
9 See Studies in Poverty and Inequality (2007); Budlender (1985)
16
the expenditure-based approach. This approach is preferred because it allows the
design of a food basket that is informed by people’ s preferences, and can be anchored
in broadly representative consumption patterns.
The minimum food-energy requirement
In constructing poverty lines, the convention is to use food-energy intake
requirements for the food component. This standard refers to the minimum food-
energy intake required to maintain a human body at rest (Ravallion 1998: 17). Energy
requirements are usually presented in kilojoules (kj) or kilocalories (kcal). The food-
energy requirements used in this report are based on the dietary requirements cited by
Rose, Bourne and Bradshaw (2002) in a South African Medical Research Council
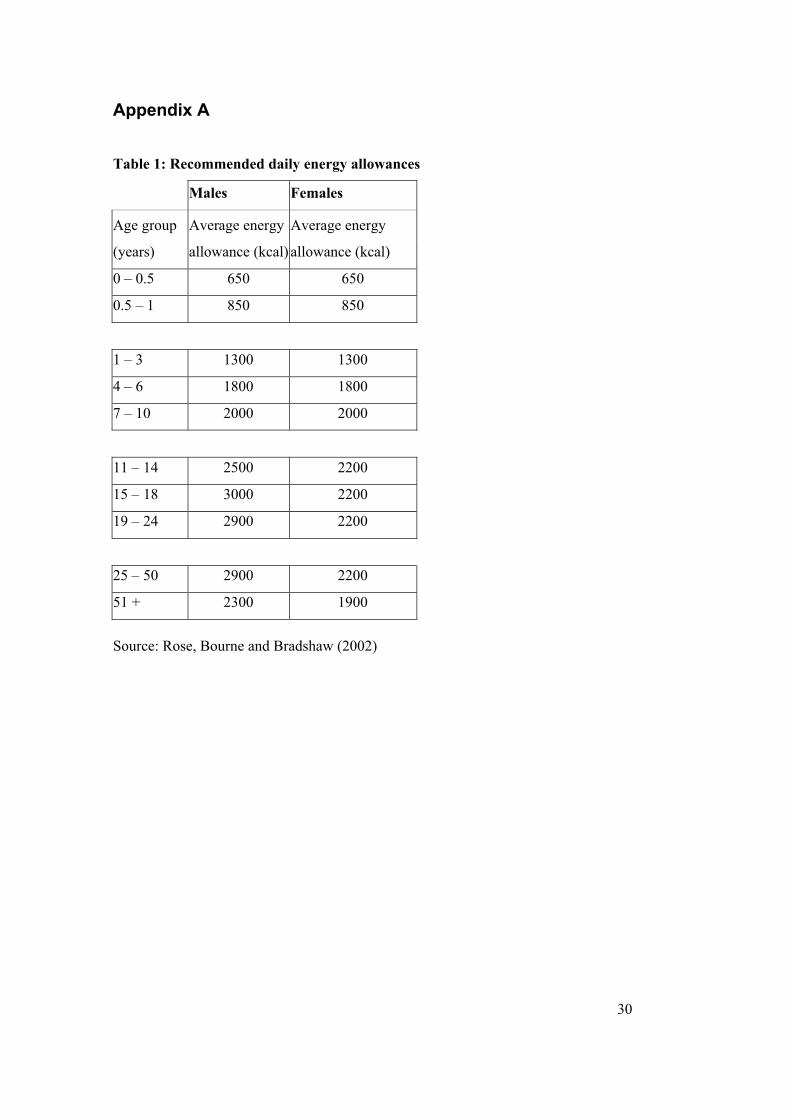
(MRC) report study on nutrient availability (see appendix A). To obtain a nationa l per
capita energy requirement, the relevant age and gender food-energy requirements
were applied to Census 2001 household data, taking into account age and gender
composition. Total household energy was then divided by the number of people in the
household to obtain a per capita10 caloric requirement. The average national energy
requirement came to 2261 kcal per capita, per day.
The reference food basket
After obtaining the energy-intake requirement, the next major data item required to
determine the monetary value of the food poverty line was a reference ‘cost-per-
kilocalorie’ (for easy reference: cost-per-cal). In order to derive the reference cost-
per-cal a reference food basket was required. The need for a reference food basket
arose due to the numerous possible combinations of foods consumed by diverse South
African households. Although food is a universal human need, food varieties may
differ by climatic or economic region and, a number of other factors such as culture,
religion and income may affect personal preferences and tastes. The food basket was
constructed in two stages to ensure that contents were representative of broad
consumption patterns and anchored in representative consumption levels. In the first
stage, the most common foods at nationa l household level were identified, and at the
second stage, the level and pattern of consumption (of stage 1 foods) by a reference
10 All expenditure computation in this report is on a per capita basis.
17
group of households were the basis for determining the final reference basket and its
cost.
To obtain nationally representative food items, a combined criteria11 of item food-
expenditure-share and the number of households reporting item expenditure12 were
applied. The threshold for food-expenditure share per item was 0.6%, and the
minimum number of households was set at 10%. At the end of the first stage, 39 food
items13 were selected out of 133 IES food items.
At the second stage, the main objective was to determine a reference set of
households for consumption patterns and levels. For this purpose, households were
differentiated on the basis of expenditure levels and ten groups obtained. These were
national deciles of households ranked by per capita (total) household expenditure.
Households with the lowest expenditure were grouped under decile 1, and those with
the highest expenditure fell under decile 10. Ranking by expenditure was a proxy for
income level, which is recognised as key determinant of food preferences. This
expenditure-based ranking created household groupings with a clear progression of
key characteristics related to food preferences and cost-per-cal .
In particular, food consumption among high-income households (or in this case, high-
expenditure households) tends to reflect what are known as ‘expensive calories’.
Rose, Bourne and Bradshaw (2002:8) explain this very well: “Households with higher
incomes typically spend more on food to purchase the same kilocalories than those
with lower incomes. Their rands go to purchasing other characteristics besides
calories, such as taste, convenience, or simply high-end brand names.” Conversely, an
examination of the lowest (2000 IES) decile reveals a relatively small food basket,
dominated by high consumption levels of foods that fit the description of ‘survival-
foods’14 – an extreme example of ‘cheap calories’.
11 These criteria are broadly comparable to the criteria for selecting the CPI food basket.12 In strict terms, IES reports expenditure on purchases, however, for this report, we assume that all purchases represent consumption.13 For data collection purposes, the 2000 IES listed some foods as single items, while others were grouped.14 See Ravallion (1998) on ‘survival-food-needs’.
18
For purposes of the ‘ cost-of-basic-needs’ poverty line the range for a reference group
of households is usually in the lower to middle distribution of the welfare indicator
(consumption expenditure in this case). Reference households in this case refer to
households whose expenditure levels are expected to reflect fairly typical, average
consumption levels at common prices. This ensures that the cost of the reference food
basket is not distorted by expenditure on expensive, luxury items or dominated by
extreme consumption levels of ‘survival-foods’. Hence, the choice of households in
deciles 2 to 4 (inclusive) as the reference for the food basket.
After determining reference households for the food component, item food-
expenditure-shares15 for the 39 food items were averaged in deciles 2 to 4, and only
foods with at least 0.6% share were retained. This left 33 food items as the reference
food basket – shown in Table 1. The second stage criteria ensured plausible
expenditure levels for the reference basket.
Although it is possible to base the food basket on all food items as covered by the
survey, this was considered unsuitable for two reasons. First, is the observation by the
Rio Group (2006: 56) that: “this would result in an enormous variance in the basket
structure”. And second, no household reported consumption of all 133 IES food
items. Therefore, selecting a basket common to all households was considered a better
reflection of typical consumption patterns.
The reference basket has another dimension of representivity. It contains food items
from a broad range of foods that are usually recommended for a balanced diet. These
include cereals, meat, fish, poultry, dairy, fruit and vegetables. Although the criteria
for costing the basket are based on a single nutritional standard (food-energy), this
variety of food items shows how the basket represents other essential nutrients. That
is said, it is important to emphasise that the basket is not presented for use as a
recommended food plan in practical terms, but as a tool for analysis. To obtain
nutritionally balanced diets, the relevant health authorities have to be consulted.
15 That is, food item shares in total (all) food expenditure at household level.
19
Deriving cost-per-cal and the food poverty line
After constructing the reference food basket, the next step was to determine its cost-
per-cal based on the consumption levels of reference households. For this purpose,
median16 quantities of the reference food basket as purchased by reference households
were derived from household-level food expenditure using CPI food data of
September 2000. These quantities were then multiplied by food energy values with
adjustments for edible portions were necessary17. Taking the average of various
caloric inputs, the total energy content of the reference food basket was 54199 kcal,
at a total cost of 11848 cents. Based on these two data items, the reference cost-per-
cal came to 0.2186 cents per kcal.
To obtain the value of the food poverty line, the reference cost-per-cal was multiplied
with the monthly (30 days) equivalent of the daily per capita energy requirement. The
result was a monetary value of 14828 cents, representing the cost of purchasing a food
basket that fulfils the minimum food-energy requirement described earlier. Therefore,
the pilot food poverty line in Sept 2000 prices becomes R148 per capita, per month.
16 Based on statistical characteristics of quantity distributions.17Food energy content and edible portion factors were obtained from various sources including MRC, USDA and FAO.
20
Table 1: The Reference Food Basket
Group
Food item
Instant coffeeCeylon teaRooibos & herbal teas
Beverages
Aerated cool drinksFresh milkMilk powder & whitenersButtermilk, maas/sour milk
Dairy products and Eggs
EggsMargarineFats and OilsCooking oilsBeefMuttonChickenBoerewors
Fish, Meat, Poultry and their products
Canned fishWhite breadBrown breadCake flourBread flourRiceMealie-meal
Grain products
SampApplesBananasOrangesOnionsTomatoesCabbage
Fruits and Vegetables
Fresh potatoesWhite sugarBrown sugarSalt
Miscellaneous
Soup powders
21
4.2 Deriving Upper and Lower Poverty Lines
To obtain upper and lower bounds to a range of possible (total) poverty lines, a
common variation of Ravallion’s cost-of-basic-needs approach (1998) was followed.
In this method, two different sets of non-food expenditure are obtained from two
separate reference households and added to the food poverty line to yield two sets of
poverty lines: an upper line and a lower line. These two lines are regarded as the
lower and an upper bound to a range of possible ‘total’ poverty lines.
Unlike food consumption, there are no universal standards for consumption of non-
food good and services (such as shelter, clothing, transportation and so forth).
Although it is possible to determine a specific bundle of non -food goods and services,
Ravallion (1998:17) questions “whether it would gain wide acceptance or maintain
material relevance over time”.
In fact, in the South African context, some normative standards of this nature were
used in the past to establish lower living standards for some population groups18.
Internationally, Canada is one example where a comprehensive set of normative
standards for non-food items has been established (Rio Group, 2006) but not for
poverty measurement. Given the diversity of markets for goods and services in South
Africa, as well as major differences in family and household structures, it was not
practical or desirable to specify a basket of non-food goods. The cost-of-basic-needs
approach solves this problem by anchoring the non-food component of a total poverty
line on reported consumption expenditure (Ravallion, 1998; Lanjouw, 2001).
A key assumption behind the cost-of-basic-needs approach is that in cases where food
expenditure is equivalent to the food line, households are considered able to meet
basic foods and basic non-food needs. Therefore by adding the non-food expenditure
of such households to the food poverty line an upper bound poverty line is obtained.
Hence, the reference households for the upper poverty line were households with food
expenditure equal or close to R148 (per capita, per month). Average non-food
expenditure of these households was R175 (per capita, per month). This value was
18 See Budlender (1985)
22
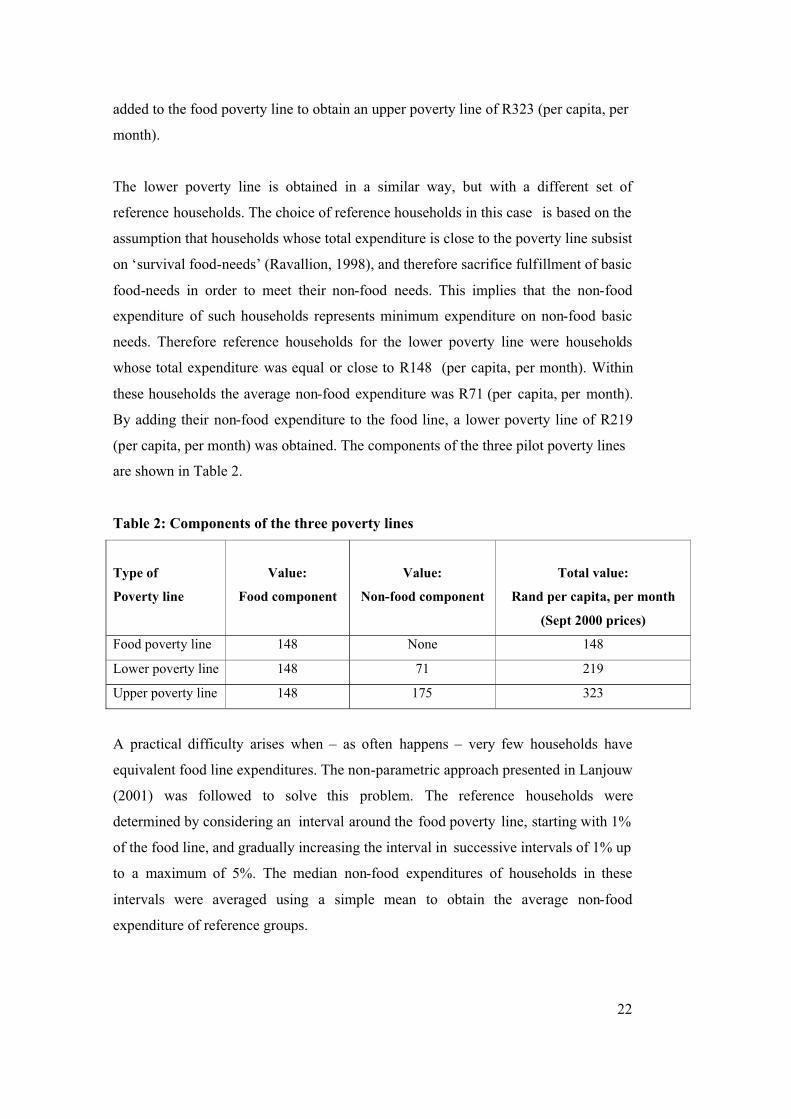
added to the food poverty line to obtain an upper poverty line of R323 (per capita, per
month).
The lower poverty line is obtained in a similar way, but with a different set of
reference households. The choice of reference households in this case is based on the
assumption that households whose total expenditure is close to the poverty line subsist
on ‘survival food-needs’ (Ravallion, 1998), and therefore sacrifice fulfillment of basic
food-needs in order to meet their non-food needs. This implies that the non-food
expenditure of such households represents minimum expenditure on non-food basic
needs. Therefore reference households for the lower poverty line were households
whose total expenditure was equal or close to R148 (per capita, per month). Within
these households the average non-food expenditure was R71 (per capita, per month).
By adding their non-food expenditure to the food line, a lower poverty line of R219
(per capita, per month) was obtained. The components of the three pilot poverty lines
are shown in Table 2.
Table 2: Components of the three poverty lines
Type of
Poverty line
Value:
Food component
Value:
Non-food component
Total value:
Rand per capita, per month
(Sept 2000 prices)
Food poverty line 148 None 148
Lower poverty line 148 71 219
Upper poverty line 148 175 323
A practical difficulty arises when – as often happens – very few households have
equivalent food line expenditures. The non-parametric approach presented in Lanjouw
(2001) was followed to solve this problem. The reference households were
determined by considering an interval around the food poverty line, starting with 1%
of the food line, and gradually increasing the interval in successive intervals of 1% up
to a maximum of 5%. The median non-food expenditures of households in these
intervals were averaged using a simple mean to obtain the average non-food
expenditure of reference groups.
23
4.3 Updating absolute poverty lines
The methodology followed in the construction of the poverty lines presented in this
report produces period-specific poverty lines. To maintain relevance in long-term
statistical use, regular updates are required.
The cost of goods and services and their consumption patterns are key drivers in the
design of an absolute poverty line. Both are expected to change over time, although in
different ways, and at different rates. The cost of food, goods and services tends to
change more rapidly than consumption patterns19. As time goes on, changes in the
cost of living affect the purchasing power or value implied by the poverty lines. To
maintain the integrity of absolute poverty lines, two types of updates are practiced:
adjustment by means of an inflation index or construction of new poverty lines
(Ravallion, 1998).
When an inflation index is used to update an absolute poverty line, the changes in the
cost of living are usually based on a Consumer Price Index (CPI) series. Such updates
are usually performed on an annual basis. Stats SA publishes a comprehensive CPI,
thus making it possible to follow this approach in updating the poverty lines in
periods when new consumption data are not available.
On a monthly basis, Stats SA publishes an overall CPI, a CPI for food and a CPI
excluding food (non-food). The food and non-food CPI are combined in various ways
to obtain a range of CPI instruments20 – such as the CPIX, the Core CPI and many
others. An inflation instrument for the poverty line can be derived in a similar way.
After testing various scenarios, it was decided to inflate each portion of the poverty
line by the relevant CPI component. Since food and non-food prices hardly move in
tandem (that is: in the same direction, with the same magnitude), this approach
ensures that price movements in each component are adequately captured. The
poverty lines presented in this report will be updated in this manner, on an annual
basis, with January as the reference month.
19 Changes in consumer patterns in response to changes in the cost of living, are usually gradual, unless they are accompanied by significant changes brought about by social, economic, political or environmental factors. 20 For the full range of CPI instruments visit www.statssa.gov.za
24
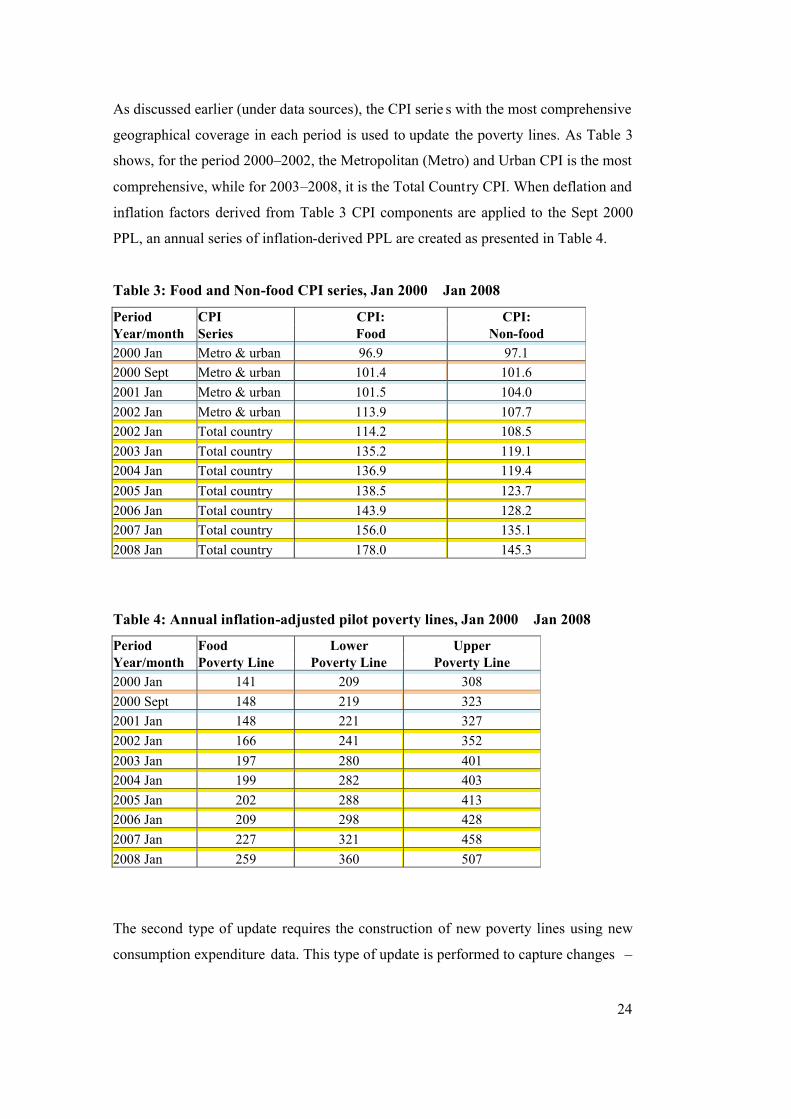
As discussed earlier (under data sources), the CPI serie s with the most comprehensive
geographical coverage in each period is used to update the poverty lines. As Table 3
shows, for the period 2000–2002, the Metropolitan (Metro) and Urban CPI is the most
comprehensive, while for 2003–2008, it is the Total Country CPI. When deflation and
inflation factors derived from Table 3 CPI components are applied to the Sept 2000
PPL, an annual series of inflation-derived PPL are created as presented in Table 4.
Table 3: Food and Non-food CPI series, Jan 2000 – Jan 2008
Period CPI CPI: CPI: Year/month Series Food Non-food 2000 Jan Metro & urban 96.9 97.12000 Sept Metro & urban 101.4 101.62001 Jan Metro & urban 101.5 104.02002 Jan Metro & urban 113.9 107.72002 Jan Total country 114.2 108.52003 Jan Total country 135.2 119.12004 Jan Total country 136.9 119.42005 Jan Total country 138.5 123.72006 Jan Total country 143.9 128.22007 Jan Total country 156.0 135.12008 Jan Total country 178.0 145.3
Table 4: Annual inflation-adjusted pilot poverty lines, Jan 2000 – Jan 2008
Period Food Lower Upper Year/month Poverty Line Poverty Line Poverty Line 2000 Jan 141 209 3082000 Sept 148 219 3232001 Jan 148 221 3272002 Jan 166 241 3522003 Jan 197 280 4012004 Jan 199 282 4032005 Jan 202 288 4132006 Jan 209 298 4282007 Jan 227 321 4582008 Jan 259 360 507
The second type of update requires the construction of new poverty lines using new
consumption expenditure data. This type of update is performed to capture changes –

25
if any – in the underlying structure of the poverty line. As this report demonstrates,
this type of update requires detailed data on household income and expenditure which
are rarely available on an annual basis. Therefore, this type of update is usually
undertaken at intervals ranging from 1, 3 or 5 years, depending on the survey program
of the implementing institution, and the dynamics of the local economy. In South
Africa, the equivalent survey series is the Stats SA Income and Expenditure Survey
series on which the CPI basket is based. Construction of the CPI basket has some
similarities to the derivation of the poverty line, in that CPI food items are selected to
represent commonly consumed foods, and CPI prices are used to cost the basket.
Since the update of the CPI basket is undertaken every five years, it would be
reasonable to review the structure of the poverty line at the same time. However, a
number of factors can affect such a decision, most notably data adequacy.
The adequacy of consumption expenditure data for pover ty line construction becomes
an important consideration when survey methods change. If changes are introduced
abruptly, this may lead to a break in the time series data when consumption patterns
appear inconsistent with past trends. In this such cases, it may be better to wait for a
new survey series to establish trends before they are used as the sole design base for a
poverty line. This is the current situation regarding the 2005/06 IES data, and so the
current poverty lines will be updated for inflation only until the next review period,
when more data is expected to be available.
26
5. Concluding Remarks
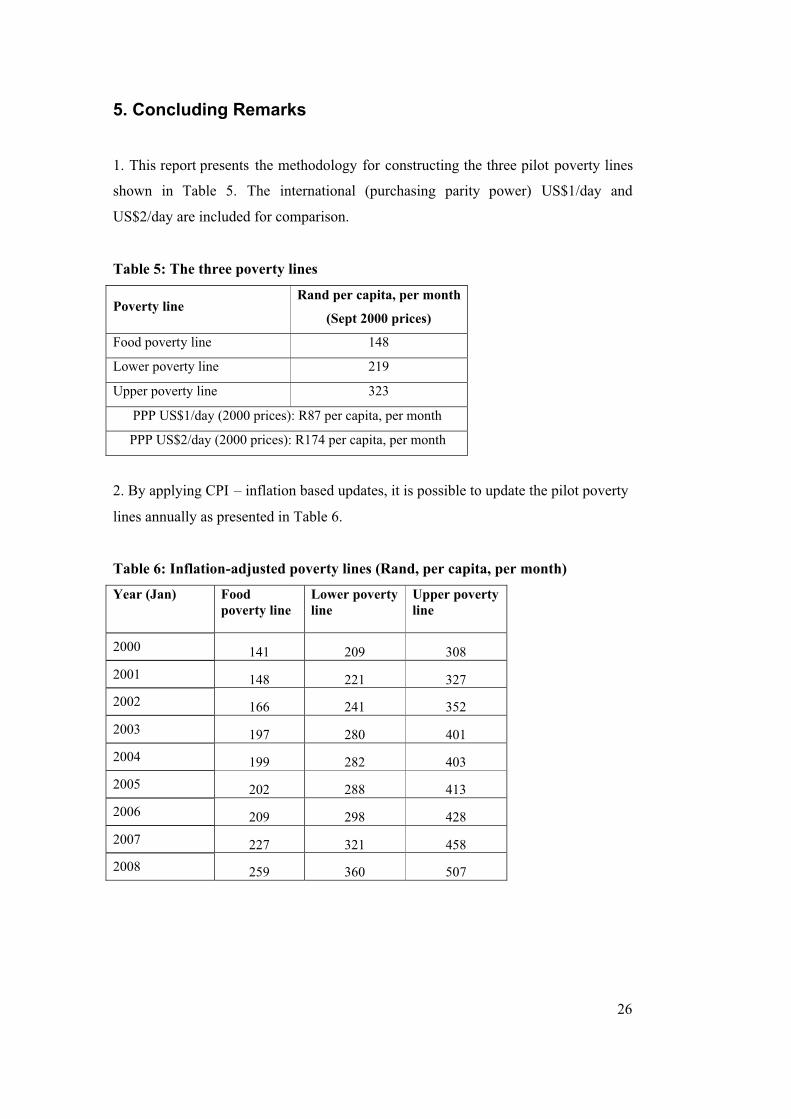
1. This report presents the methodology for constructing the three pilot poverty lines
shown in Table 5. The international (purchasing parity power) US$1/day and
US$2/day are included for comparison.
Table 5: The three poverty lines
Poverty line Rand per capita, per month
(Sept 2000 prices)
Food poverty line 148
Lower poverty line 219
Upper poverty line 323
PPP US$1/day (2000 prices): R87 per capita, per month
PPP US$2/day (2000 prices): R174 per capita, per month
2. By applying CPI – inflation based updates, it is possible to update the pilot poverty
lines annually as presented in Table 6.
Table 6: Inflation-adjusted poverty lines (Rand, per capita, per month)
Year (Jan) Food poverty line
Lower poverty line
Upper poverty line
2000 141 209 3082001 148 221 3272002 166 241 3522003 197 280 4012004 199 282 4032005 202 288 4132006 209 298 4282007 227 321 4582008 259 360 507
27
3. These pilot poverty lines are experimental in nature and will be piloted in the
period leading to 2014, when a review is planned to coincide with the Millennium
Development Goals review period. The three poverty lines are presented for use in
statistical reporting of monetary poverty only, and are designed for use alongside
existing administrative poverty measures. The international poverty lines of US$1 per
day and US$2 per day in purchasing power parity (PPP) terms are internationally
determined and will be estimated whenever poverty statistics are presented.
4. This report marks the conclusion of the technical process undertaken by Stats SA as
mandated by government. However, it also represents a key contribution to the
dialogue between government and policy stakeholders on broader poverty
measurement and poverty reduction strategies. Appendix C presents a note by the
Statistician General on possible considerations beyond the presentation of the poverty
lines.
5. Stats SA conducts regular reviews of information products and undertakes annual
stakeholder consultations. These processes enable Stats SA to monitor the utilisation
of official statistics and to get critical feedback from users of information products
across all spheres of government, the private sector, civil society and the general
public. Through this process, Stats SA will continue to engage with stakeholders on
the pilot poverty lines leading to the review in 2014 when more data is expected to be
available.
28
References
Babbie, Earl (2008). The Basics of Social Research. 4th ed. California: Thomson Wadsworth.
Babita M, B Ozler, N Shabalala and H Thema (2003). Changes in Poverty and Inequality in South Africa: 1995 – 2000. Unpublished manuscript.
Baulch, Bob (1996). Neglected Trade-offs in Poverty Measurement. Poverty, Policy, and Aid, IDS Bulletin, Vol. 27, No. 1, Sussex: IDS.
Budlender, D (1985) A Critique of Poverty Datum Lines. SALDRU Working Paper No. 63. Cape Town: UCT
Deaton, Angus (1997). The Analysis of Household Surveys. A Microeconometric Approach to Development Policy. Baltimore: Johns Hopkins University Press.
Deaton, Angus, and Salman Zaidi (2002). Guidelines for Constructing Consumption Aggregates for Welfare Analysis. LSMS Working Paper 135, World Bank.
Food and Nutrition Board, National Research Council (1989). Recommended Dietary Allowances, 10th ed. Washington DC: National Academy Press.
Greeley, M (1994) Measurement of Poverty and Poverty of Measurement. IDS Bulletin, Vol 25, No. 2.
Government of South Africa (1994). The Reconstruction and Development Programmr. A policy Framework. Pretoria.
Hentschel J and P Lanjouw (1995). Constructing and Indicator of Consumption for the Analysis of Poverty: Principles and Illustrations from Ecuador. LSMS WorkingPaper No. 124. Washington DC: World Bank.
Hoogeveen, J and B Ozler (2005). Not Separate, Not Equal: Poverty and Inequality in Post-apartheid South Africa. William Davidson Institute Working Paper No. 739.
Lanjouw, Jean Olson (2001). Demystifying Poverty Lines. UNDP
Lanjouw J O and P Lanjouw (2001). How to Compare Apples and Oranges: Poverty Measurement based on Different Definitions of Consumption. Review of Income and Wealth 47(1) pp 25-42
May, J. and B. Roberts (2005) Poverty Diagnostics Using Poor Data: Strengthening the Evidence Base for Pro-Poor Policy Making in Lesotho, Social Indicators Research 74, pp. 477–510.
Medical Research Council (1991). South African Food Composition Database Version 1.2. Tygerberg: Medical Research Council.
29
Rose, Donald, Lesley Bourne and Debbie Bradshaw (2002). Food and Nutrient Availability in South African Households. Development of a Nationally Representative Database. Tygerberg: Medical Research Council.
Ravallion Martin (1994). Poverty Comparisons. Chur, Switzerland: Harwood Academic Publishers.
Ravallion Martin. (1998). Poverty Lines in Theory and Practice. LSMS Working Paper 133. Washington DC: World Bank.
Ravallion Martin (2001). Poverty Lines: Economic Foundations of Current Practices .World Bank. Unpublished manuscript.
Shaffer, Paul (1996). Beneath the Poverty Debate: Some Issues. Poverty, Policy and Aid. IDS Bulletin, Vol. 27, No.1, Sussex: IDS.
Studies in Poverty and Inequality Institute (2007). The Measurement of Poverty in South Africa Project: Key Issues. Johannesburg: SPII
UN Expert Group on Poverty Statistics, Rio Group. (2006). Compendium of Best Practices in Poverty Measurement. Rio de Janeiro: Rio Group
US Department of Agriculture, Agricultural Research Service (1999). USDA Nutrient Database for Standard Reference, Release 13.
Woolard, I. and M. Leibbrandt. (2006). Towards a Poverty Line for South Africa: Background Note. SALDRU. Cape Town: UCT
30
Appendix A
Table 1: Recommended daily energy allowances
Males Females
Age group Average energy Average energy
(years) allowance (kcal) allowance (kcal)
0 – 0.5 650 650
0.5 – 1 850 850
1 – 3 1300 1300
4 – 6 1800 1800
7 – 10 2000 2000
11 – 14 2500 2200
15 – 18 3000 2200
19 – 24 2900 2200
25 – 50 2900 2200
51 + 2300 1900
Source: Rose, Bourne and Bradshaw (2002)
31
Appendix B
Constructing the consumption aggregate
The approach followed in building a consumption aggregate for welfare analysis was
based on guidelines by Deaton and Zaidi (2002), Ravallion (2001), Hentschel and
Lanjouw (1996), and Lanjouw et al (1996). The original21 consumption aggregate
consists of the following expenditure categories:
• food and beverages (excluding home production, cigarettes and alcohol);
• housing (imputed rental value of residence) and utilities;
• compensation for domestic workers;
• personal care, household services, and other household consumer goods;
• fuel;
• clothing and footwear;
• transport (excluding cost of purchased vehicles);
• communication;
• education;
• reading matter, licences and other rental charges; and
• insurance.
During stakeholder discussions, concerns were raised about obtaining a consumption
aggregate that reflects comprehensive consumption, and designing a national poverty
line amenable to inflation updating. To address these two issues, additional
expenditure components were added to the consumption aggregate (listed below), and
the regional (provincial) numeraire approach was dropped when new data on 2000
food prices was made available.
• Water expenses (when stated separately from other utilities)
• Firewood
• Medical aid contributions
21 Based on Babita, Ozler, Shabalala and Thema (2003), and other discussion documents on the early versions of 2000 IES data.

32
33
Appendix C
Poverty: On the Line and Beyond the Line
PJ Lehohla22
October 2008
Poverty as a social concern has been deliberated over a number of centuries.
However, its definition and characterization as a multi-dimensional phenomenon at
the center of development of policy, only gained currency in the past few decades.
The advent of internationally agreed programs such as the Millennium Development
Goals (MDG) and the Poverty Reduction Strategies for Highly Indebted Countries
have driven a new generation of poverty measurement techniques and reportage.
Requirements for these processes have increased pressure on countries to report on
poverty, and to roll -out poverty reduction programs within a framework of integrated
poverty reduction strategies. This has seized policy makers.
Measurement choices
In order to know whether there is progress or not, measurement has become an
integral part of implementing poverty reduction strategies, and as a consequence,
countries have coupled these strategies with tools for measurement. Policy debates
accentuate the desirability of not only the significance of poverty but also an
increasing need for thoroughness in measurement, and by extension, choice of
methods.
The aim of determining a poverty line is to meet a specific objective. A common
objective is to determine the level and extent of poverty using the poverty line
approach. In measuring absolute poverty, the poverty line is anchored to basic food
and non-food needs. In other instances, it is about measuring comparative levels of
well-being, such as is done for relative poverty or indeed looking at measures that
22 PJ Lehohla is the Statistician – General, Statistics South Africa.
34
relate to association and participation. In this case we would be looking at social
inclusion or exclusion.
Poverty on the Line
While the importance of a poverty line is undisputed, simply having a poverty line
neither makes the poor poorer nor richer. What is important is for the relevant bodies,
namely policy groups, to take steps to address poverty based on the knowledge
presented through poverty statistics. So for policy, the question is about what is being
done about poverty, while for those measuring, the issue is to maintain accurate,
relevant and timely measurement.
Usually governments employ a battery of instrument to address poverty, including:
social security measures and social relief; employment creation; free basic services
such as water; subsidized or free housing; and free education as means of assisting
those trapped in poverty. The presence of a poverty line assists in providing an
aggregate result around a plethora of poverty reduction instruments. In the absence of
such a line, individual outputs presented as the results of policy interventions are
produced in an environment that is potentially rife with competition and may mask
the aggregate value of all interventions. With a poverty line, a single aggregate result
can be consistently measured across time and space.
Poverty on the Line: Beyond the Line
What policy does about poverty is part of a discussion we had with Prof Banerjee23
(Poverty Action Lab). The main issue arising out of our discussion was that inherent
in poverty measurement is a level of inertia and static representation of phenomena
that is dynamic and requires dynamic solutions. Poverty prognosis and “prescriptions”
demand moving from the solely static concept of the line, to a more dynamic process
of what we do about it. The Poverty line should not necessarily be the point that
seizes the imagination of society, but what is being done about it more important.
Once again, the observation that knowing about a poverty line does not make one
poorer or richer is applicable.
23 Personal discussion, May 2008
35
Statistics are crucial information products for creating an understanding of
phenomena, such as poverty. This is a key function of statistical offices, and the
presentation of a poverty line is in fulfillment of that role. What policy does with
knowledge is a subject for deliberation between policy partners and other public
stakeholders.