Embed Size (px)
Citation preview

Measuring mining safety with injury statistics: Lost workdays as indicators of risk ☆
Patrick J. Coleman , John C. Kerkering
National Institute for Occupational Safety and Health, Spokane Research Laboratory
Abstract
Problem: Mining in the United States remains one of the most hazardous industries, despite significant reductions in fatal injury rates over the last century. Coal mine fatality rates, for example, have dropped almost a thousand fold since their peak in 1908. While incidence rates are very important indicators, lost worktime measures offer an alternative metric for evaluating job safety and health performance. The first objective of this study examined the distributions and summary statistics of all injuries reported to the Mine Safety and Health Administration from 1983 through 2004. Over the period studied (1983 2004), there were 31,515,368 lost workdays associated with mining injuries, for an equivalent of 5,700 person years lost annually. The second objective addressed the problem of comparing safety program performance in mines for situations where denominator data were lacking. By examining the consequences of injuries, comparisons can be made between disparate operations without the need for denominators. Total risk in the form of lost workday sums can help to distinguish between lower and higher risk operations or time periods. Method: Our method was to use a beta distribution to model the losses and to compare underground coal mining to underground metal/nonmetal mining from 2000 to 2004. Results: Our results showed the probability of an injury having 10 or more lost workdays was 0.52 for coal mine cases versus 0.35 for metal/nonmetal mine cases. In addition, a comparison of injuries involving continuous mining machines over 2001 2002 versus 2003 2004 showed that the ratio of average losses in the later period to those in the earlier period was approximately 1.08, suggesting increasing risks for such operations. Discussion: This denominator free safety measure will help the mining industry more effectively identify higher risk operations and more realistically evaluate their safety improvement programs. Impact on Industry: Attention to a variety of metrics concerning the performance of a job safety and health program will enhance industry's ability to manage these programs and reduce risk.
Keywords: Mining injuries; Mining safety and health; Incidence rates; Denominator-free methods; Lost time measures; Trends; Statutory days lost; Job safety and health metrics
1. Problem
Researchers in occupational safety and health fields who use surveillance data rely on a small number of risk mea-surement methods for evaluating the performance of preventive programs. The raw numbers of reported injuries and
☆ The findings and conclusions in this report are those of the author(s) and do not necessarily represent the views of the Centers for Disease Control and Prevention/the National Institute for Occupational Safety and Health.
illnesses plotted over time provide the first indications of higher-than-average risk problems, or lower-than-average risk success stories. Calculating incidence rates when denominator data (i.e., number of workers exposed) are available is a more standardized measure, particularly if employment is changing over time or if differently-sized sectors or risk groups need to be compared. The severity of injuries and illnesses (i.e., statistics based on number of lost workdays, statutory days, and restricted workdays per case of injury or illness charged to an individual accident) is a less-used measure that may be undervalued. This study examined the use of lost workdays per case as a metric separate from the traditional ones of case counts and incidence rates.

In the mining sector, data on reported injuries from the Mine Safety and Health Administration (MSHA) allow researchers to develop mine-specific and subunit-specific incidence rates for a variety of injury types. Several reasons for using lost workdays as an alternative metric include the fact that denominator data are generally collected only for the broadest and most general categories. MSHA provides hours worked by miners at each mine location and for each subunit that a mine operates. But hours worked are not categorized by years of experience or the amount of training a miner has, making it difficult to assess risk among new and less-trained workers. Hours worked are also not categorized by other variables of interest such as machine type, activity, occupation, or gender.
However, MSHA also provides three different lost workday indices: the number of workdays an injured miner takes before returning to work, the number of days of restricted work activity after returning to work, and the number of statutory days lost. The latter has assigned values or “scheduled charges” for fatalities and permanent partial or total disabilities resulting from loss of a member.
2. Literature review
The use of statistics in job safety and health has a long history, and in particular, MSHA's use of so-called statutory days has its origin in a 1920 Bureau of Labor Statistics Bulletin No. 276, Standardization of Industrial Accident Statistics (U.S. Bureau of Labor Statistics, 1920). The authors felt there was a need for a uniform system for assigning lost work time to disabling injuries and deaths. The results included, for example, a statutory charge of 6,000 lost workdays for a fatal injury and for certain non-fatal but permanently disabling injuries such as loss of both eyes. Other impairments were assigned statutory days lost based on a percentage of permanent total disabilities. The Z16 Committee was formed in 1926 to revise the standard, and adopted the Bulletin's table and chart referring to scheduled charges or statutory days lost for specific bodily impairments. The Bulletin also details the rationale for assigning the values found in the table. Later revisions of the American National Standards Institute (ANSI) Z16 standards through Z16.1-1967 maintained the same table and chart (United States of America Standards Institute, 1968), which are now used by the U.S. Department of Labor Mine Safety and Health Administration (MSHA, 1986).
Researchers in mining safety and health have examined lost workdays in a variety of studies in mining. Coal miners with impaired respiratory health were hypothesized to experience greater numbers of disability days due to job injury, but the analysis did not support the hypothesis (Ames & Trent, 1985). Five mines in northeast England were studied for days lost due to skin disorders over a 6-year period. Summary measures (means, medians, and incidence rates) were reported, showing that foot dermatitis in coal mines accounted for some of the longest lost day mea
sures (Puttick, 1990). Small mines with high incidence rates of transport injuries have a greater share of fatal and permanently disabling injuries, while larger mines have a greater share of injuries involving no lost time (Hunting & Weeks, 1993). Lost workdays have also been used to develop risk indices for specific mining tasks. Using detailed microanalysis of task components, injuries incurred, injury severity, and time spent per component, risk analysis can pinpoint the specific task component with the highest risk of injury and the highest risk of loss of worktime (Grayson, Layne, Althouse, & Klishis, 1992). Grayson et al. later updated and expanded their microanalysis approach to produce an index number for ranking job titles by priority of intervention (Grayson, Althouse, Winn & Klishis, 1998), which relies on MSHA's lost workday statistics.
Research in other high-risk industries has also studied lost workdays, primarily as severity indices. Construction injuries that occurred during the construction of the Denver International Airport in Denver, Colorado, between 1990 and 1994 were analyzed and data presented on lost-work-time claims, their incidence and median days lost. Specific types of work were tabulated by median number of days lost, among other measures. The authors concluded that lost workday estimates reported by BLS are likely to underestimate those derived from workers' compensation insurance data (Lowery et al., 2000). Construction industry injuries in the Australian state of Victoria during 1996–1998 were analyzed to determine occupations, tasks, and activities in terms of priorities for intervention and prevention. A four-part injury severity index, including indicators for days compensated, hospital days and costs, maiming (compensation for temporary or permanent impairment), and a fracture or amputation indicator, was developed for this purpose (Larsson & Field, 2002). These authors also point out that a summary measure, ‘harm,’ which is the number of claims multiplied by the injury severity, has been used in the transportation safety field.
Lost-worktime distributions were summarized in Mital, Pennathur, and Kansal (1999) using Bureau of Labor Statistics reports on OSHA-reportable cases by type of accident, source of injury, and part of body injured. These results demonstrate the utility of comparing selected groups of injuries by amount of time lost and enable identification of the type and nature of the accident and the parts of the body injured that account for the largest percentages of cases in which 21 or more days of work were lost. Unfortunately, cases with no lost workdays are not included in the table, making it difficult to understand the complete form of the distributions.
3. Methods
The following background on MSHA reporting requirements and practices are important for understanding this study. Underground and surface mining are part of the
extraction industries in the United States. The general categories of commodities mined are coal, metal, nonmetal, stone, and sand and gravel. The accident data for this study were collected by MSHA, part of the Department of Labor. MSHA has collected mine accident data for many years, providing public access to data from 1983 forward on its website. The mine must report an incident to MSHA if there is a work stoppage of 30 minutes or more or if there is an injury or fatality connected with the incident.
More severe injuries, including fatalities, are investigated by MSHA. The accident information is coded into a database for that particular calendar year at MSHA's office in Denver. There are 48 variables recorded in the accident-injury-illness database for each incident. MSHA also has other databases that include mine employment and address information, and narrative descriptions of each incident. Mine employers are classified according to whether they mine coal (anthracite or bituminous), metal, nonmetal, stone, or sand and gravel. The term “metal/nonmetal” is sometimes used to designate all non-coal mining (i.e., metal, nonmetal, stone, sand and gravel). Mines are further subdivided into surface and underground mining.
Lost time due to accidents is recorded in three categories: actual lost days from work, statutory days charged, and restricted activity workdays. The lost workday variable can have a value of zero if no time away from work occurred due to the accident, such as when a roof-fall stops work for 30 minutes or more but no injuries occur. It can also be zero if an injury occurs without death, days away, or restricted activity. In these cases, if the injured miner loses less than 1 day of work, the case is coded as having zero lost workdays. The lost time data attributed to an accident are not considered final until the injured worker returns to work or is permanently transferred or terminated. The employer updates each open case by submitting a final form with total days lost to MSHA. MSHA issues a closed or completed database for a particular year after May 15 of the following year, to record the final disposition of cases still open.
While days lost from work and days with restricted work activity depend on healing times, the nature of the work being done, and other factors, the statutory days charged are more a reflection of attempts to quantify the “future loss of productive time brought about by an employee's permanent loss of a body member or permanent impairment of function” (MSHA, 1986). MSHA publishes the tables and charts used to determine statutory days lost on their website. The origin of the estimates in these tables and charts is the 1920 bulletin mentioned above (BLS, 1920), and they may also be found in the ANSI Method of Recording and Measuring Work Injury Experience Z16.1 (ANSI, 1967). The decision to include this measure along with the other two was guided by a desire for a measure that reflected the full range of injury outcomes from minor injuries to fatalities.
For this study, the reported measures for each case were summed to arrive at a total time-lost measure.
To find the distributions of the days lost by sector, standard distributions, such as the beta, gamma, Weibull, lognormal, exponential, and Pareto, were examined (Hogg & Klugman, 1983). Because the distribution of lost workdays by case has a large proportion with zero days lost on the low end and a significant proportion of cases with 6,000 days lost corresponding to fatal injuries on the high end, the beta distribution was selected because of its flexibility in modeling the U-shape of the histogram. The beta distribution is also defined on a closed interval, which matches the MSHA data in having lost workday outcomes of 0 to 6,000 days. Least-squares techniques were used to develop the fitted distributions, and to test goodness-of-fit, the Kolmogorov-Smirnov D-statistic test (K-S D-statistic) was used (Conover, 1980).
Statistical and related programs used for this study included Excel (Microsoft Office Excel 2003, Redmond, WA), SPSS Ver. 11.5 (SPSS Inc., Chicago, IL), Mathematica Ver. 5.1 (Wolfram Research, Inc., Chicago, IL), and The SAS System for Windows, Ver. 9.00 (SAS Institute, Cary, NC).
4. Results
4.1. Summary of lost workday trends
For the period 1983 through 2004, MSHA received 321,011 case reports of nonfatal injuries with lost workdays. A total of 2,215 fatal injuries was also reported in this period. The sum of lost workdays, statutory days lost, and days of restricted work activity for all of these cases was 31,515,368 over 22 years, or the equivalent of more than 5,700 person-years lost annually.
For consistency with MSHA's convention, and for comparison with its published data, the overall loss data were separated into four groups: coal mine operators, coal mine contractors, metal/nonmetal mine operators, and metal/ nonmetal contractors. From 1989 to the present, coal mine and metal/nonmetal mine operators, and metal/nonmetal contractors, have reduced the incidence rates of lost workday cases (Fig. 1), some more than others. Coal mine contractors reported increases about as often as decreases from year to year, reaching their lowest rates in 2003–2004. The ratio of incidence rates for lost workday cases for coal mine operators to the average incidence rates for the other three sectors was consistently 1.5 to 2.0 during the period and was at its highest from 1987 through 1998. While three of the four groups demonstrated long-term reductions in lost workday case incidence rates it should be noted that the large increase in incidence rates for coal mine operators in 1986 through 1988 may be a reporting artifact resulting from an MSHA initiative. In December of 1986, MSHA released a program circular titled “Report on 30 CFR Part 50” to clarify and increase enforcement of the reporting regulations (MSHA, 1986; Fig. 1). The remaining groups demonstrate less dramatic increases during or after the same period, in apparent response to the initiative.

Fig. 1. U.S. Mining Nonfatal Lost Workday Case, Incidence Rates, 1983 - 2004.
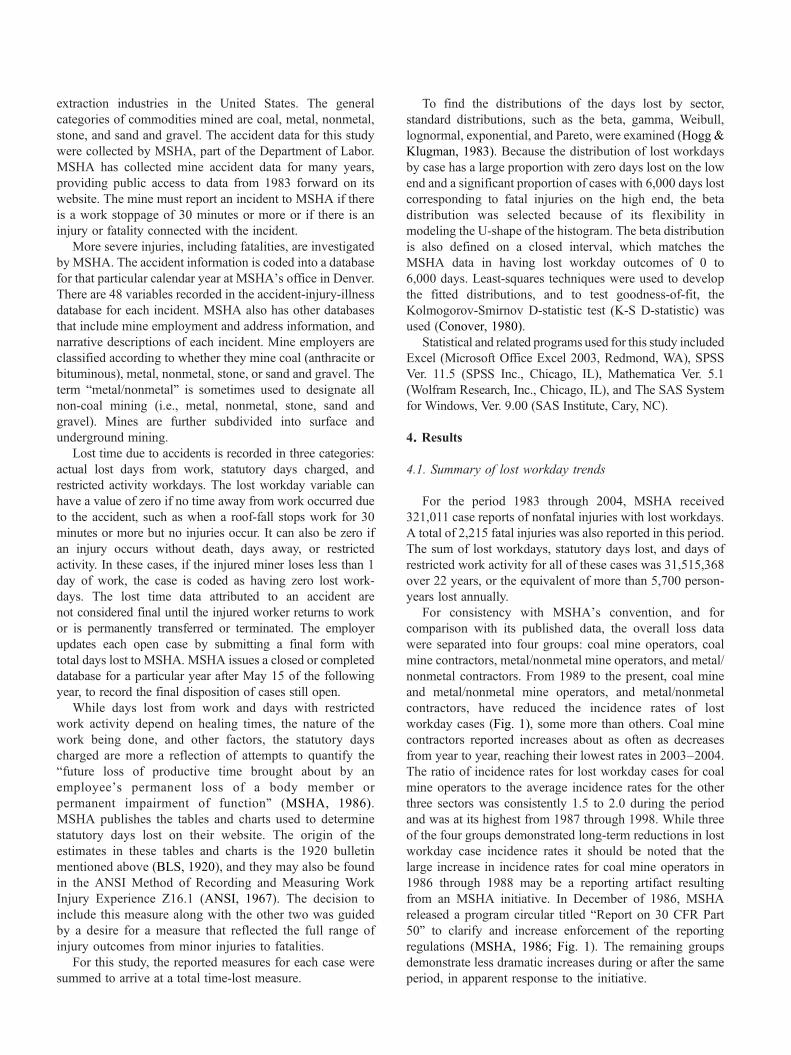
Figs. 2–5 (see Appendix A for actual data) illustrate the trends in lost workdays associated with each of the four groups. For coal mine operators, the total number of lost days steadily decreased until the last 2 years, when the number increased slightly (Fig. 2). The figures for coal mine contractors show greater variability, but overall the pattern has been relatively steady (Fig. 3). Metal/nonmetal operators showed a modest reduction in total days lost over the period, while metal/ nonmetal contractors showed a long-term trend toward a higher number of total days lost, also with increasing variability.
Fig. 2. Lost Workdays for Nonfatal I
For both coal groups, the use of restrictions on work activity for those recovering from injury appears to be low, that is, the number of days spent on restricted work activities averages 1% to 2% of total lost days over the period. By contrast, more metal/nonmetal mine operators assigned recovering workers to restricted work activity; restricted-activity days averaged 2% to 8% of total lost workdays. As a percentage of total days lost, restricted-activity days increased for the metal/nonmetal mining trades (trends significant at p b 0.0001).
njuries - Coal Mine Operators.
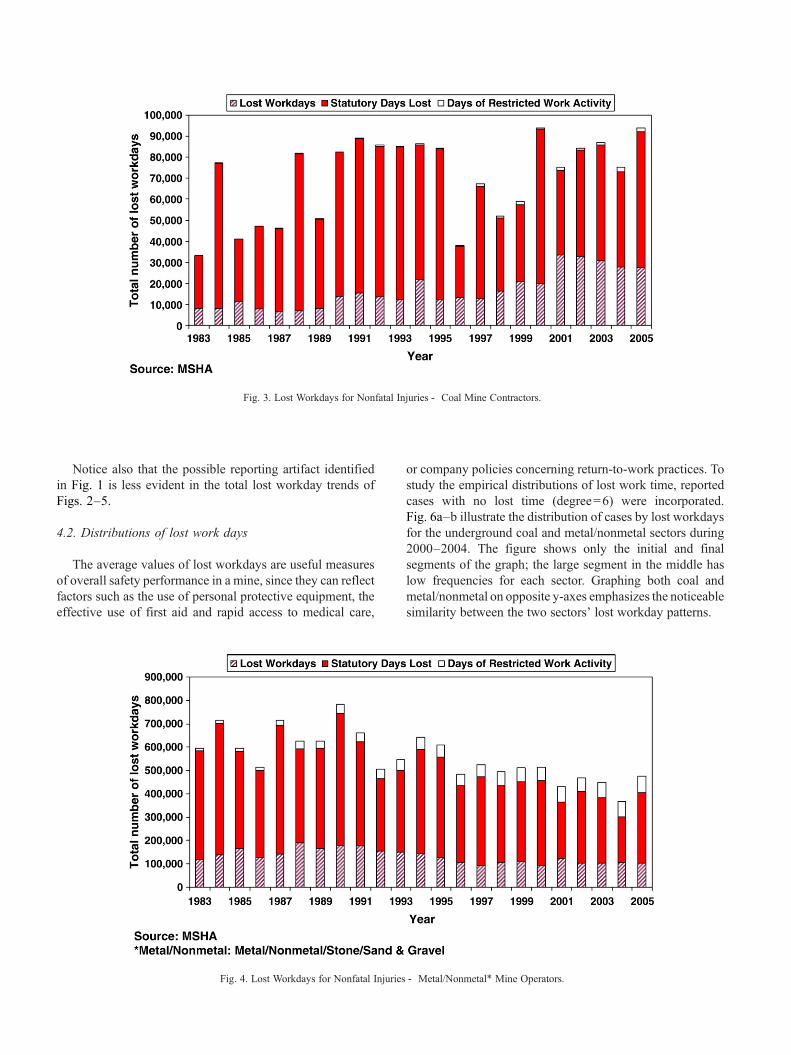
Fig. 3. Lost Workdays for Nonfatal Injuries - Coal Mine Contractors.
Notice also that the possible reporting artifact identified in Fig. 1 is less evident in the total lost workday trends of Figs. 2–5.
4.2. Distributions of lost work days
The average values of lost workdays are useful measures of overall safety performance in a mine, since they can reflect factors such as the use of personal protective equipment, the effective use of first aid and rapid access to medical care,
Fig. 4. Lost Workdays for Nonfatal Injuries
or company policies concerning return-to-work practices. To study the empirical distributions of lost work time, reported cases with no lost time (degree =6) were incorporated. Fig. 6a–b illustrate the distribution of cases by lost workdays for the underground coal and metal/nonmetal sectors during 2000–2004. The figure shows only the initial and final segments of the graph; the large segment in the middle has low frequencies for each sector. Graphing both coal and metal/nonmetal on opposite y-axes emphasizes the noticeable similarity between the two sectors' lost workday patterns.
- Metal/Nonmetal⁎ Mine Operators.

Fig. 5. Lost Workdays for Nonfatal Injuries - Metal/Nonmetal⁎ Mine Contractors.
For coal, 24.3% of the cases reported no days lost, while decreasing percentages make up the heavy tail. While the 97 severe cases (94 fatalities, 3 permanent total disabilities) in this period constituted 5% of the cases, the losses for the severe cases accounted for 41% of the total lost workdays.
The metal/nonmetal sector had a larger percentage of zero lost workday cases (36%). The 22 fatal cases with assigned statutory days lost accounted for 0.8% of the total case count and 65% of the total lost workdays.
The beta distribution has the probability density function
C aþ bÞð a - 1 b - 1f x; a; bÞ ¼ x ð1 � xÞð C að ÞC bð Þ
where alpha and beta are shape parameters. The beta was fitted to both the underground metal/nonmetal and underground coal sectors. To facilitate the fitting, values on the lost workday axis were divided by 6,000, resulting in a range of 0 to 1 for the transformed values. Table 1 shows the estimated parameter values for each group of injuries.
Graphically the fitted beta curves are close to the observed data, but the K-S D-statistic for the underground coal data suggests a possibly poor fit, while the metal/nonmetal fitting can be considered acceptable (Table 1). The discussion section below includes comments on this.
To assess the risk values associated with each sector and estimate the difference in risk, the cumulative form of the fitted curve F(x, α, β) was first calculated. For convenience in representing the probability of a loss exceeding a given value, the form 1-F(x, α, β) was used for plotting (Fig. 7). For each curve, the value plotted for a given magnitude of loss represents the probability of a case having more lost
workdays than the given magnitude. For example, for the metal/nonmetal sector for the period studied, the probability of a case exceeding 10 lost workdays is 0.35, while for the underground coal sector, the probability is 0.52.
As a summary measure, which we termed “normalized risk,” the integral of the function 1-F(x, α, β) over the interval (0,1) was calculated. For any cumulative distribution function defined on the interval (0,1), the value of this integral lies between 0 and 1. The area under this function is analogous to average risk for the group of cases modeled. Fig. 7 demonstrates clearly that the metal/nonmetal sector experience corresponds to the safer sector, since for each loss on the horizontal axis, the probability of a greater loss is higher for coal than for metal/nonmetal. The normalized risks, obtained for each sector by integrating the corresponding function, show that “smaller” area corresponds to a “safer” sector, condition, or population. Confidence intervals for the normalized risks were obtained by integrating “confidence curves” banding the observed and fitted curves using the associated Kolmogorov-Smirnov tabled value (Massey, 1951).
Table 2 compares the traditional measures of safety for the underground coal and underground metal/nonmetal sectors.
As Table 2 demonstrates, the sectors are disparate in size, number of cases, and lost workday totals. The twomeasures using denominators – fatal and nonfatal case incidence rates – show that coal has slightly higher rates. The lost workday distribution comparisons, however, suggest graphically and without denominators that the risks associated with coal mining exceed those for the metal/nonmetal sector across a significant portion of the lost workday range (Fig. 7).

Fig. 6. a. U.S. underground coal and metal/nonmetal injury lost workday distributions, 2000 - 2004, b. U.S. underground coal and metal/nonmetal injury lost workday distributions, 2000 - 2004.
A final example compares the lost time of miners killed and injured in accidents associated with the operation of continuous mining machines, which are used primarily in
Table 1 Beta distribution curve parameters for lost workdays, underground mines, 2000 - 2004
Shape parameter Coal Metal/nonmetal
Α 0.307419 0.2162522 Β 40.00770373 54.96983 N 19,236 2,864 Goodness-of-fit (K-S D-statistic) 0.049 0.029 Critical value for p 0.05 0.009 0.024
underground coal operations. Note that machine-specific incidence rates cannot be computed, since hours worked are not specific to time spent working with or near a particular mining machine. The total losses of cases associated with continuous miners in 2001–2002 were compared to those reported in 2003–2004. After fitting beta curves (Table 3) to the loss distributions of these cases for the two periods, the assessment showed that cases occurring in 2003–2004 had a larger total loss. In this example, the Kolmogorov–Smirnov test statistics show good fits for each period.
Table 4 summarizes the available traditional measures as well as the distribution-based measures. The ratio of average

Fig. 7. Lost Workday Fitted Distributions for Underground Coal and Underground Metal/Nonmetal Mining, 2000 - 2004.
losses for 2001–2002 to those of 2003–2004 was 0.925, suggesting that recent continuous miner operations are less safe than earlier ones (Fig. 8). Because the confidence intervals for normalized risk overlap, the difference is not statistically significant, however.
Table 2 Safety measures comparing two underground mining industry sectors, 2000 2004
Measure Coal Metal/nonmetal
Average number of employees per year 46,011 13,167 Number of employee hours 379,939,113 93,462,088 Number of injuries (degrees 1 6) 19,236 2,864 Number of fatalities (degree 1) 94 22 Number of permanent disabilities 187 24
(degree 2) Actual days lost from work 764,330 43,296 Days of restricted work activity 31,770 21,023 Statutory days lost 646,940 138,660 Total days lost 1,443,040 202,979 Fatal case incidence rate 49.48 47.08
(no./100,000/year) Nonfatal case incidence rate 10.08 6.08
(no./100/year)
Table 3 Beta distribution curve parameters for lost workdays, continuous mining machines, 2001 2002, 2003 2004
Shape parameter 2001 - 2002 2003 - 2004
Α 0.26221 0.300873 Β 22.2116 23.5436 N 429 337 Goodness-of-fit (K-S D statistic) 0.028 0.059 Critical value for p 0.05 0.066 0.074
5. Discussion
It's well known that surveillance data of occupational injuries and illnesses for U.S. industries in general have significant limitations. Researchers are frequently faced with drawing conclusions from data that has been collected primarily for purposes other than research, including regulatory, administrative, and legal requirements. Public health practitioners are constantly faced with decisions that require prioritizing activities and interventions in the face of incomplete and less-than-ideal information, and the collection of surveillance data is no exception.
Mining in the United States has an advantage over other industries in that the long-term development of safety and health regulations, including injury and illness reporting
Table 4 Safety measures comparing continuous mining machine injuries in two periods, 2001 2002 and 2003 2004
Measure 2001 - 2002 2003 - 2004
Number of fatalities (degree 1) 12 7 Number of permanent disabilities 2 6
(degree 2) Number of non-fatal injuries 415 324
(degrees 3 6) Total days lost 99,146 63,363 Actual days lost from work 20,001 18,373 Days of restricted work activity 995 654 Statutory days lost 78,150 44,535 Percentage of total losses for 61% 39%
the two periods Comparison of distributions 0.012 0.013
(normalized risk) 95% confidence intervals (0.007, 0.018) (0.008, 0.019)
for normalized risks
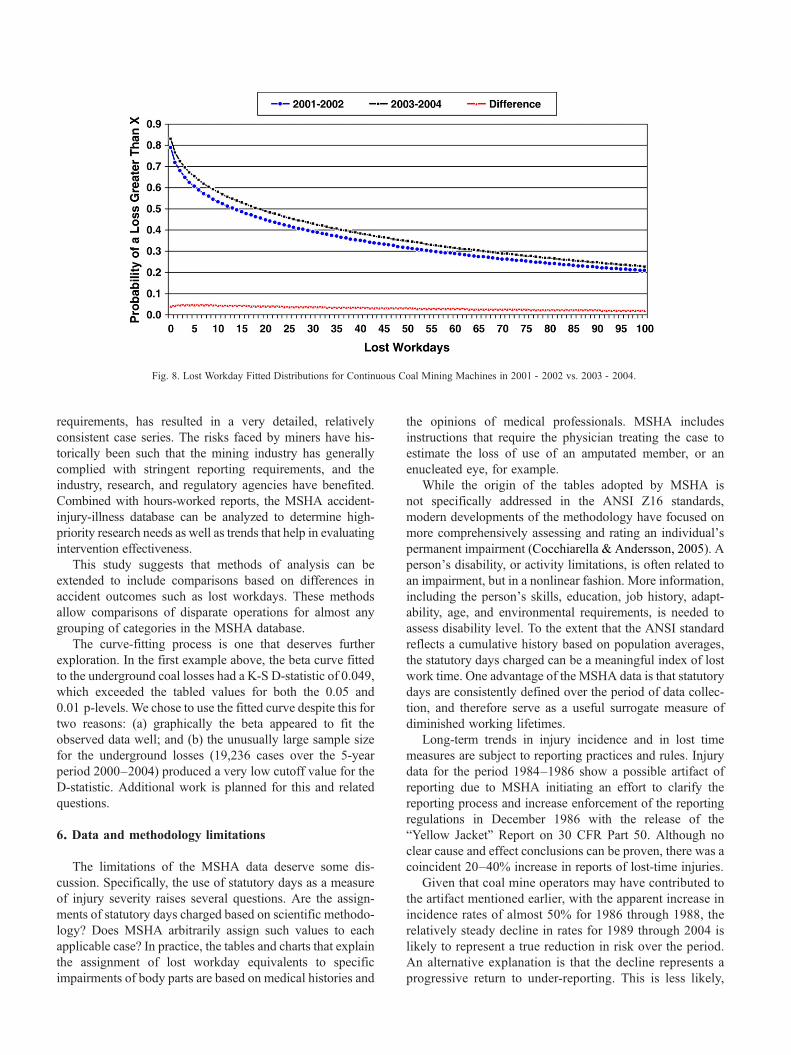
Fig. 8. Lost Workday Fitted Distributions for Continuous Coal Mining Machines in 2001 - 2002 vs. 2003 - 2004.
requirements, has resulted in a very detailed, relatively consistent case series. The risks faced by miners have historically been such that the mining industry has generally complied with stringent reporting requirements, and the industry, research, and regulatory agencies have benefited. Combined with hours-worked reports, the MSHA accidentinjury-illness database can be analyzed to determine high-priority research needs as well as trends that help in evaluating intervention effectiveness.
This study suggests that methods of analysis can be extended to include comparisons based on differences in accident outcomes such as lost workdays. These methods allow comparisons of disparate operations for almost any grouping of categories in the MSHA database.
The curve-fitting process is one that deserves further exploration. In the first example above, the beta curve fitted to the underground coal losses had a K-S D-statistic of 0.049, which exceeded the tabled values for both the 0.05 and 0.01 p-levels. We chose to use the fitted curve despite this for two reasons: (a) graphically the beta appeared to fit the observed data well; and (b) the unusually large sample size for the underground losses (19,236 cases over the 5-year period 2000–2004) produced a very low cutoff value for the D-statistic. Additional work is planned for this and related questions.
6. Data and methodology limitations
The limitations of the MSHA data deserve some discussion. Specifically, the use of statutory days as a measure of injury severity raises several questions. Are the assignments of statutory days charged based on scientific methodology? Does MSHA arbitrarily assign such values to each applicable case? In practice, the tables and charts that explain the assignment of lost workday equivalents to specific impairments of body parts are based on medical histories and
the opinions of medical professionals. MSHA includes instructions that require the physician treating the case to estimate the loss of use of an amputated member, or an enucleated eye, for example.
While the origin of the tables adopted by MSHA is not specifically addressed in the ANSI Z16 standards, modern developments of the methodology have focused on more comprehensively assessing and rating an individual's permanent impairment (Cocchiarella & Andersson, 2005). A person's disability, or activity limitations, is often related to an impairment, but in a nonlinear fashion. More information, including the person's skills, education, job history, adaptability, age, and environmental requirements, is needed to assess disability level. To the extent that the ANSI standard reflects a cumulative history based on population averages, the statutory days charged can be a meaningful index of lost work time. One advantage of the MSHA data is that statutory days are consistently defined over the period of data collection, and therefore serve as a useful surrogate measure of diminished working lifetimes.
Long-term trends in injury incidence and in lost time measures are subject to reporting practices and rules. Injury data for the period 1984–1986 show a possible artifact of reporting due to MSHA initiating an effort to clarify the reporting process and increase enforcement of the reporting regulations in December 1986 with the release of the “Yellow Jacket” Report on 30 CFR Part 50. Although no clear cause and effect conclusions can be proven, there was a coincident 20–40% increase in reports of lost-time injuries.
Given that coal mine operators may have contributed to the artifact mentioned earlier, with the apparent increase in incidence rates of almost 50% for 1986 through 1988, the relatively steady decline in rates for 1989 through 2004 is likely to represent a true reduction in risk over the period. An alternative explanation is that the decline represents a progressive return to under-reporting. This is less likely,

since the fatal incidence rate for coal mine operators has also trended downward quite dramatically over the period 1966 through 2004.
While the downward trends are encouraging, this study did not explore the factors responsible for the downtrends. We can assume with some confidence that improvements in evolving mining technology have played major roles. Based on the assessments of an expert consultant, the following factors were identified:
• An ongoing increase in the level of mining mechanization • An increase in health and safety emphasis by mining companies
• Work once done by contractors is increasingly done by salaried workers
• Consolidation of mines by bigger companies – smaller, more hazardous operations are fewer in number
• Improvements in mining systems and designs
Improvements in underground mining technology specifically include a shift from jackleg drills to drill jumbos, coupled with improvements in roof control mechanizations. Ore removal (mucking) operations done with load-haul-dump vehicles are replacing older, more hazardous techniques (using slushers, overshot muckers), especially in small operations (personal communication, William Hustrulid, Ph D., April 6, 2007).
7. Summary
This study was motivated by the search for a wider set of indicators for the effectiveness of safety program performance in mines. MSHA maintains a very thorough and detailed database of job injuries and illnesses reported by mining companies and contractors. However, denominators in the form of hours worked are not sufficiently detailed by category to allow traditional estimates of risk to be calculated for a variety of variables. Without denominators and the incidence rate calculations they allow, it is difficult to state with any certainty that machine A is safer to work with than machine B, or that one period of years for a given group of mines was safer than another period.
The lost workday outcomes from mining injuries are valuable indicators of a number of aspects of job safety programs. While traditional measures of preventive program performance are still needed, including total case counts and incidence rates, lost time measures offer the possibility of comparing important aspects of safety program performance among various sectors and time periods without relying on denominators. In particular, the distribution of lost workdays can be modeled statistically and the models can be used to quantify losses for more effective tracking of what works and what doesn't.
8. Impact on Industry
As in the use of balanced score cards in business management (Kaplan & Norton, 1996), a wider variety of measures
can help to ensure that programs are performing as intended. In mining, as well as in other industries, job injuries are not only lagging indicators, but are often too infrequent to be used as day-to-day indices of program performance. While lost time measures do not provide more frequent indications, they can help the mining industry improve important aspects of their safety programming, including attention to personal protective equipment, timeliness of rescue efforts, and in general, management of the post-injury phase (Haddon, 1968).
References
American National Standards Institute [ANSI]. (1967). Method of recording and measuring work injury experience. New York: Author.
Ames, R. G., & Trent, R. B. (1985). Respiratory predictors of disability days: a five year prospective study of U.S. coal miners. American Journal of Industrial Medicine, 7, 337−342.
Cocchiarella, L., & Andersson, G. (2005). Guides to the evaluation of permanent impairment (5th ed.). Chicago, IL: American Medical Association Press.
Conover, W. J. (1980). Practical nonparametric statistics (2nd ed.). New York: John Wiley & Sons.
Grayson, R. L., Althouse, R. C., Winn, G. L., & Klishis, M. J. (1998). A new injury analysis methodology for developing prioritized workplace intervention strategies. Applied Occupational and Environmental Hygiene, 13(1), 41−52.
Grayson, R. L., Layne, L. A., Althouse, R. C., & Klishis, M. J. (1992, February). Risk indices for roof bolter injuries using microanalysis. Mining Engineering, 164−166.
Haddon, W., Jr. (1968). The changing approach to the epidemiology, prevention, and amelioration of trauma: The transition to approaches etiologically rather than descriptively based. American Journal of Public Health, 58, 1431−1438.
Hogg, R., & Klugman, S. (1983). On the estimation of long-tailed skewed distributions with actuarial applications. Journal of Econometrics, 23, 91−102.
Hunting, K. L., & Weeks, J. L. (1993). Transport injuries in small coal mines: an exploratory analysis. American Journal of Industrial Medicine, 23, 391−406.
Kaplan, R. S., & Norton, D. P. (1996). The balanced scorecard. Boston: Harvard Business School Press.
Larsson, T. J., & Field, B. (2002). The distribution of occupational injury risks in the Victorian construction industry. Safety Science, 40, 439−456.
Lowery, J., Glazner, J., Borgerding, J., Bondy, J., Lezotte, D. C., & Kreiss, K. (2000). Analysis of construction injury burden by type of work. American Journal of Industrial Medicine, 37(4), 390−399.
Massey, F. J. (1951). The Kolmogorov-Smirnov test for goodness of fit. Journal of the American Statistical Association, 46, 68−78.
Mital, A., Pennathur, A., & Kansal, A. (1999). Nonfatal occupational injuries in the United States. Part I overall trends and data summaries. International Journal of Industrial Ergonomics, 25, 109−129.
Puttick, L. (1990). Sickness absence due to skin disorders in the coal mining industry. Journal of the Society of Occupational Medicine, 40, 23−28.
United States of America Standards Institute [USAS]. (1968). Method of recording and measuring work injury experience. New York: Author.
U.S. Department of Labor Bureau of Labor Statisticas [BLS]. (1920). Standardization of Industrial Accident Statistics, Bulletin No. 276. Washington, DC: Government Printing Office.
U.S. Department of Labor Mine Safety and Health Administration [MSHA]. (1986). Report on 30 CFR Part 50, retrieved 4/20/2007 from http://www. msha.gov/stats/part50/rptonpart50.pdf

Appendix
A
Lost
time
data
for
Figs.
2–5
1983
1984
1985
1986
1987
1988
1989
1990
1991
1992
1993
1994
1995
1996
1997
1998
1999
2000
2001
2002
2003
2004
20
05
Coal
Mine
Operators
Lost
Workdays
314679
359,184
353,287
303,175
375,635
374,043
342,491
438,779
446,454
334,097
277,432
318,667
264,028
195,722
190,952
195,897
189,019
158,516
200,954
206,001
211,800
192,179
173,425
Statutory
Days
Lost
603,719
947,140
640,798
782,131
567,284
437,855
519,457
592,880
476,196
336,412
297,102
316,164
317,498
317,502
252,713
240,878
225,996
237,340
347,171
189,975
200,491
238,401
172,603
Days
of
Restricted
Work
Activity
3,819
4,202
5,172
5,793
9,076
9,055
8,149
10,877
14,516
10,816
11,383
13,038
15,334
13,149
16,441
15,248
12,440
9,576
12,554
9,458
9,941
11,111
10,339
Coal
Mine
Contractors
Lost
Workdays
8,284
8,107
11,487
8,001
6,638
6,856
8,198
13,862
15,389
13,587
12,396
21,822
12,307
13,374
12,573
16,230
20,765
19,832
33,436
32,830
30,684
27,653
27,643
Statutory
Days
Lost
24,800
69,050
29,560
38,985
39,425
74,695
42,345
68,560
73,385
71,695
72,495
64,000
71,690
24,310
53,680
34,850
36,685
73,575
40,315
50,620
55,160
45,445
64,505
Days
of
Restricted
Work
Activity
83
318
51
105
74
193
197
149
228
542
436
609
355
498
970
940
1,330
518
1,353
936
1,152
2,021
1,844
Metal/Nonmetal
Mine
Operators
Lost
Workdays
119,283
138,299
165,104
127,043
141,957
190,468
166,915
180,405
176,664
153,650
148,921
145,380
126,579
105,824
93,640
107,050
111,737
93,650
122,080
102,608
104,450
104,719
102,619
Statutory
Days
Lost
465,338
563,984
416,715
374,556
551,959
401,920
428,179
565,101
444,888
310,893
351,374
445,523
432,135
330,045
380,173
328,760
339,230
364,265
242,120
307,635
279,250
197,410
302,080
Days
of
Restricted
Work
Activity
10,975
13,083
14,305
12,407
19,840
31,646
28,956
38,920
39,336
41,504
46,051
50,605
51,282
48,414
51,704
58,079
59,016
56,451
69,452
57,130
63,969
64,533
70,553
Metal/Nonmetal
Mine
Contractors
Lost
Workdays
6,513
6,916
8,853
5,296
9,835
16,364
10,863
11,932
12,152
8,417
7,412
16,895
11,392
14,205
10,583
9,088
12,961
10,753
12,320
7,957
11,322
13,153
14,985
Statutory
Days
Lost
66,110
66,630
67,995
53,036
74,580
89,450
95,220
100,850
71,761
66,610
82,040
48,960
108,085
80,495
146,790
98,180
127,875
86,365
97,475
40,220
31,225
73,365
31,140
Days
of
Restricted
Work
Activity
542
222
467
277
209
857
1,917
1,227
2,562
1,324
1,819
4,262
3,631
3,346
2,213
3,048
3,305
3,831
2,936
4,034
2,728
4,639
5,176