Embed Size (px)
Citation preview
Measuring Activity and Participation in Outcomes Researchin Outcomes Research
Frances Harris Stephen Sprigle SharonFrances Harris, Stephen Sprigle, Sharon Sonenblum
Center for Assistive Technology & i AEnvironmental Access
Georgia Institute of Technology
Workshop goalsWe will:We will:• Critically review 3 self-report measures of
participation.
• Introduce activity-monitoring technologies used to measure wheelchair use.measure wheelchair use.
• Discuss methodology that combines self-reports and i i i i h l iactivity-monitoring technologies to measure
participation.
The Significance of ParticipationThe Significance of Participation
Increased participation for people with disabilities p p p pis a goal of the Americans with Disabilities Act (ADA) and the New Freedom Initiative.
Recently revised International Classification of Functioning and Disability (ICF) recognizesFunctioning and Disability (ICF) recognizes participation and activity as one of its four key components.
The Problem of Participation for Wh l h i UWheelchair Users
90% of all wheelchair users report activity limitations. (H i S N ti l O i ti f Di bilit W h DC 2000)(Harris Survey, National Organization of Disability, Wash., DC, 2000)
Only 14.7% of wheelchair users can complete their activities of daily living (ADL) mobility tasks. (HS Kaye, T Kang, MP LaPlante, Disability Statistics Report: Mobility device use in the United States, NIDRR, 2000)
Wheelchair use has doubled in the last 10 years and is growing rapidly making participation a more urgentgrowing rapidly making participation a more urgent concern. (HG LaPlante, AJ Moss, Assistive technology devices and home accessibility: prevalence, payment, need, and trends” Adv Data, pp1-11 1992)11, 1992)

Some Factors Impacting Participation and Activity among
Wheelchair UsersWheelchair Users• Health Conditions
• Environmental Barriers in society (e.g., lack of curb cuts, or reliable and accessible transportation orcuts, or reliable and accessible transportation or assistive technologies, social attitudes)
• Personal Factors (e.g., gender, lifestyle, or emotional factors within the individual)

Defining Participation and Activityg p y
Participation and Activity are closely linked.p y y
• Activity is defined as the “execution of a task or ctivity s de ed as t e e ecut o o a tas oaction by an individual.”
• Participation is defined as “involvement in a life situation.”
Handicap vs. Participation
• Recent 2002 ICF replaced older term “handicap” with “participation.”p p p
Handicap = participation-restrictionHandicap participation restriction
Participation = involvement in life situationParticipation involvement in life situation
Capacity and PerformanceCapacity and Performance
Two qualifiers are used to describe how activity q yand participation are measured:
• Capacity is the individual’s ability to execute a task or action in standardized environment (e.g., a clinical
t f h)measurement of reach).
P f i h t i di id l d i hi /h• Performance is what an individual does in his/her current environment.
Current Measures of Participation Rely on Self-Report Instruments
They examine:
activities of daily livingy gwork/educationsocial roles & relationshipsleisureleisurefinancial responsibilities
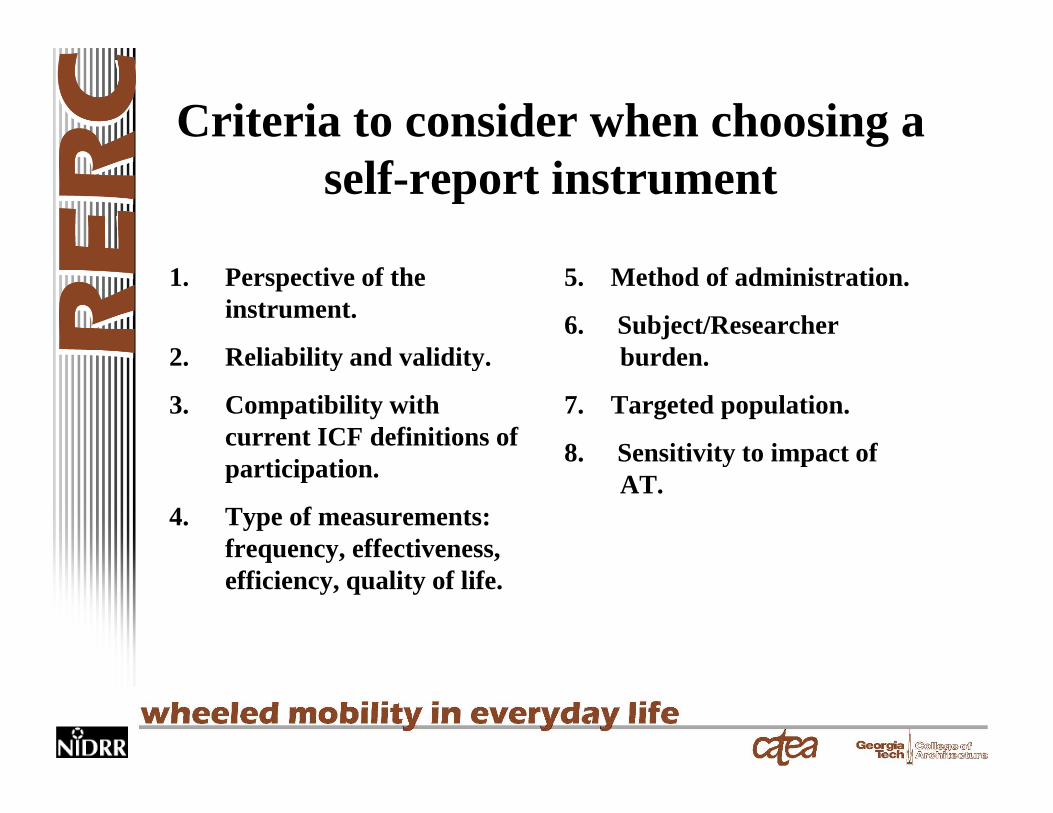
Criteria to consider when choosing a self-report instrument
1. Perspective of the instrument.
2 Reliability and validity
5. Method of administration.
6. Subject/Researcher burden2. Reliability and validity.
3. Compatibility with current ICF definitions of
burden.
7. Targeted population.
8. Sensitivity to impact ofparticipation.
4. Type of measurements: frequency, effectiveness,
8. Sensitivity to impact of AT.
q y, ,efficiency, quality of life.
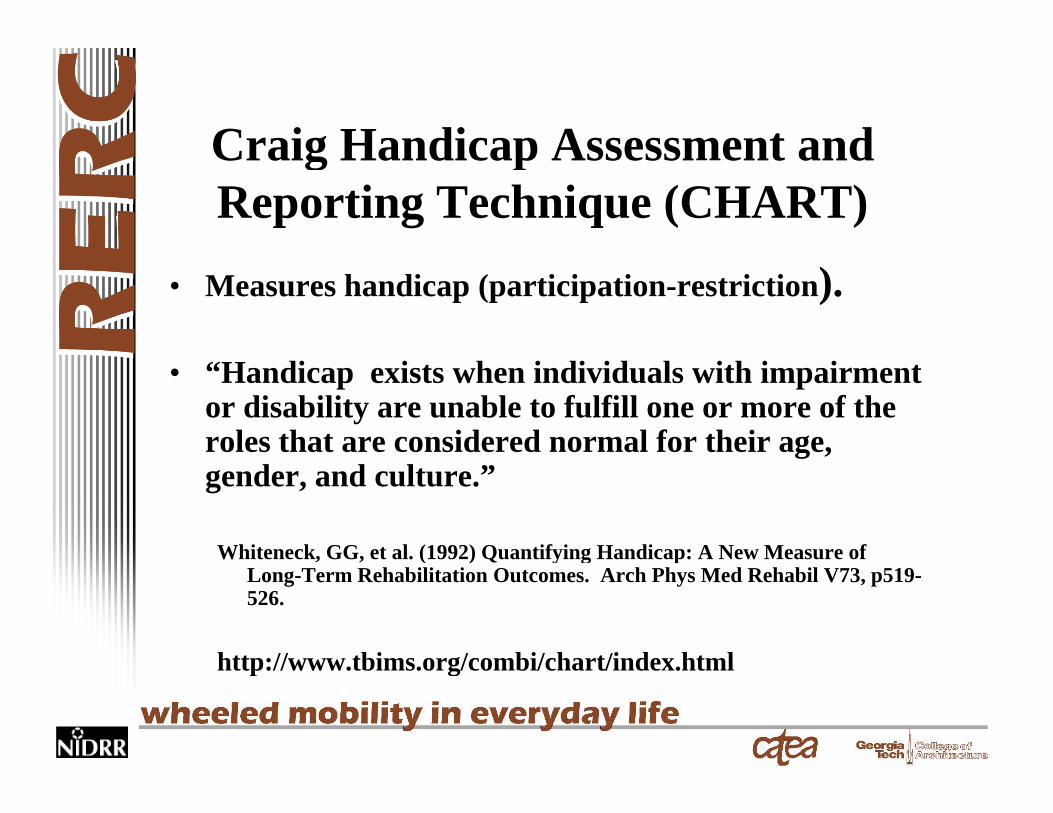
Craig Handicap Assessment andCraig Handicap Assessment and Reporting Technique (CHART)
• Measures handicap (participation-restriction).
• “Handicap exists when individuals with impairment or disability are unable to fulfill one or more of the roles that are considered normal for their age, ggender, and culture.”
Whiteneck, GG, et al. (1992) Quantifying Handicap: A New Measure of , , ( ) Q y g pLong-Term Rehabilitation Outcomes. Arch Phys Med Rehabil V73, p519-526.
http://www tbims org/combi/chart/index htmlhttp://www.tbims.org/combi/chart/index.html
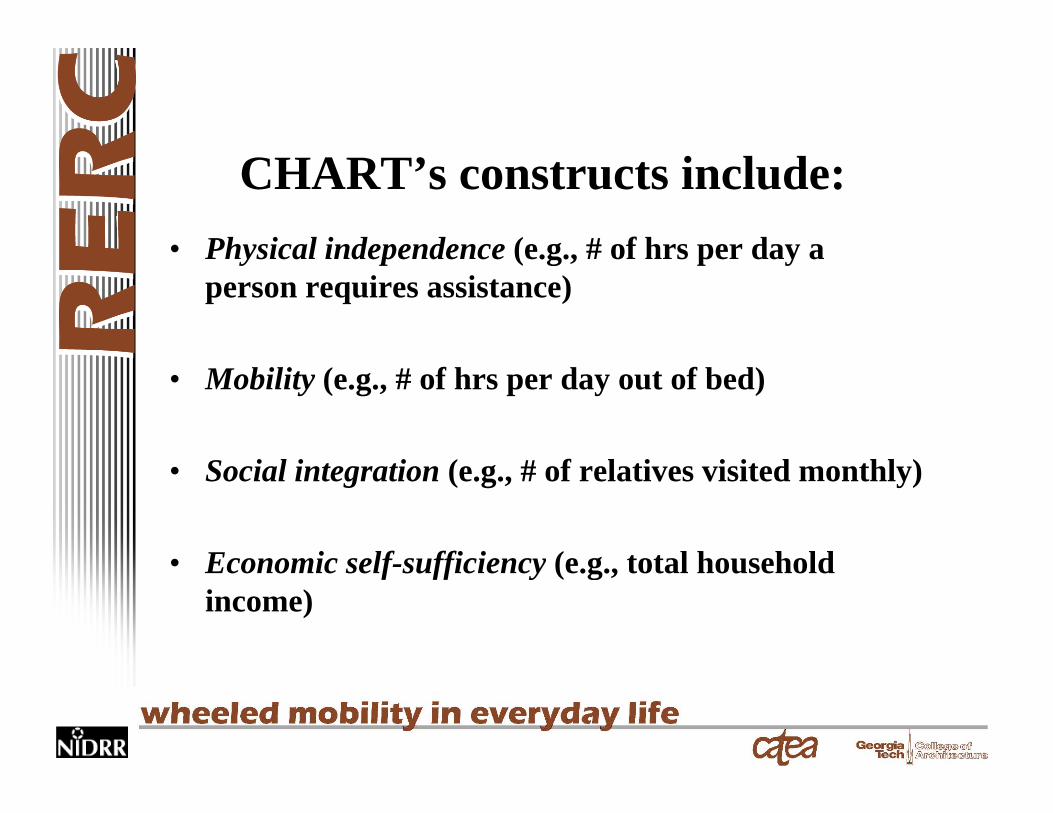
CHART’s constructs include:• Physical independence (e g # of hrs per day aPhysical independence (e.g., # of hrs per day a
person requires assistance)
• Mobility (e.g., # of hrs per day out of bed)
• Social integration (e.g., # of relatives visited monthly)
• Economic self sufficiency (e g total household• Economic self-sufficiency (e.g., total household income)
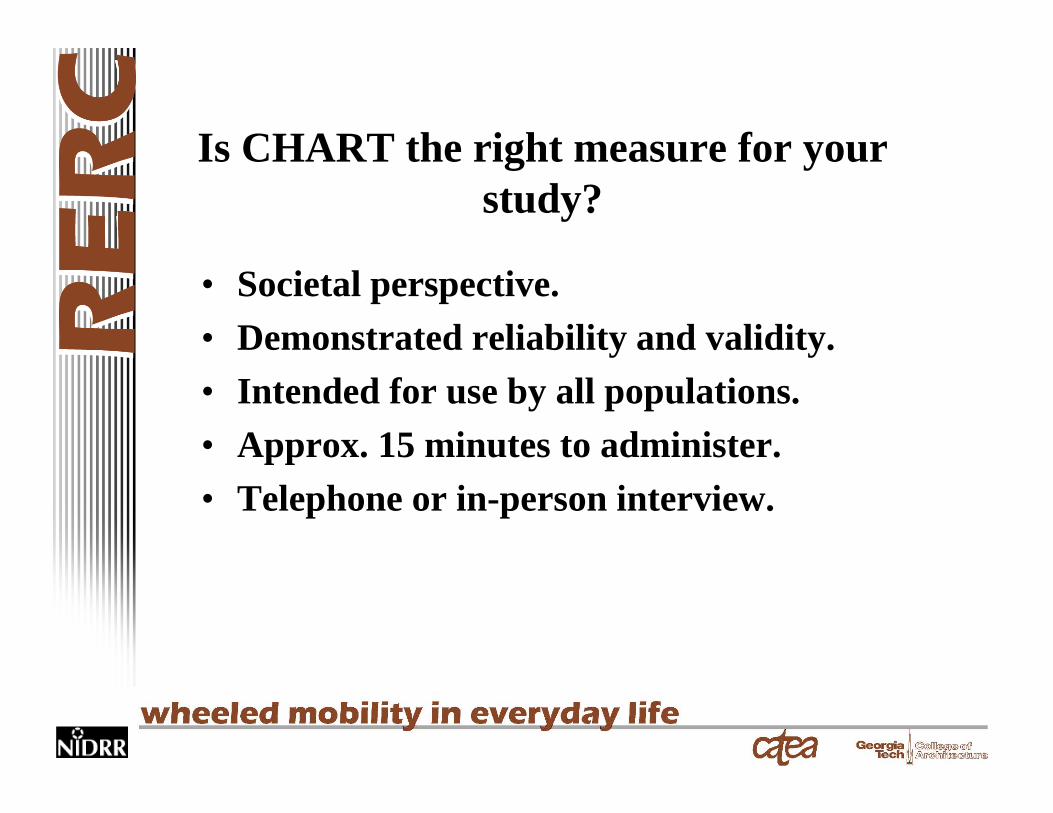
Is CHART the right measure for yourIs CHART the right measure for your study?
• Societal perspective.• Demonstrated reliability and validity. y y• Intended for use by all populations.• Approx. 15 minutes to administer. pp• Telephone or in-person interview.
Impact on Participation &Impact on Participation & Autonomy (IPA)
Also, measures participation-restriction. “participation refers more to autonomy and the
l f lfill f l h h lpersonal fulfillment of roles rather than a normalrole fulfillment . . .”
• Cardol, M. et al. (2001) Psychometric Properties of the Impact on Participation & Autonomy Questionnaire. Arch Phys Med RehabilV82, p210-216.
http://www.nivel.nl/OC2/page.asp?PageID=5309
Autonomy
• Autonomy refers to self-government or self-determination.
• The IPA asks “can you do what you• The IPA asks “can you do what you want when you want?”
IPA Constructs Include:• Autonomy indoors (e g ) indoor mobility & ADLS• Autonomy indoors (e.g., ) indoor mobility & ADLS
• Family rolesFamily roles
• Autonomy outdoors (e.g., outdoor leisure activities)
• Social life and relationships (e.g., communication)
• Work and education (e.g., paid or voluntary work)
CHART & IPA
CHART asks:How many hours per week do you spend y p y p
working in a job for which you get paid?
IPA asks:My chances of doing my paid or voluntary y g y p y
work the way I want are: very good, good, fair, poor, very poor.
Is the IPA the right measure for yourIs the IPA the right measure for your study?
• Person-perceived perspective• Initial reliability and validity• Intended for use by all populations.• Approx. 15 minutes to administer. • Self-administered (mail in survey)( y)
Community Participation and Perceived Receptivity Survey (CPPRS)*
Designed to capture activity and participation data from l i h bili di bili ipeople with mobility disabilities
Examines:• Locations visited in past month and year• Environmental and social barriers experienced at destinations• Rates participation experience in terms of satisfaction, choice, and
importanceimportance
For information contact: David B. Gray, Ph.D.,Washington University School of Medicine Program in Occupational Therapy 4444 Forest ParkSchool of Medicine, Program in Occupational Therapy, 4444 Forest Park Blvd., Campus Box 8505, St. Louis , MO 63108voice: (314) 286-1658, email: [email protected]
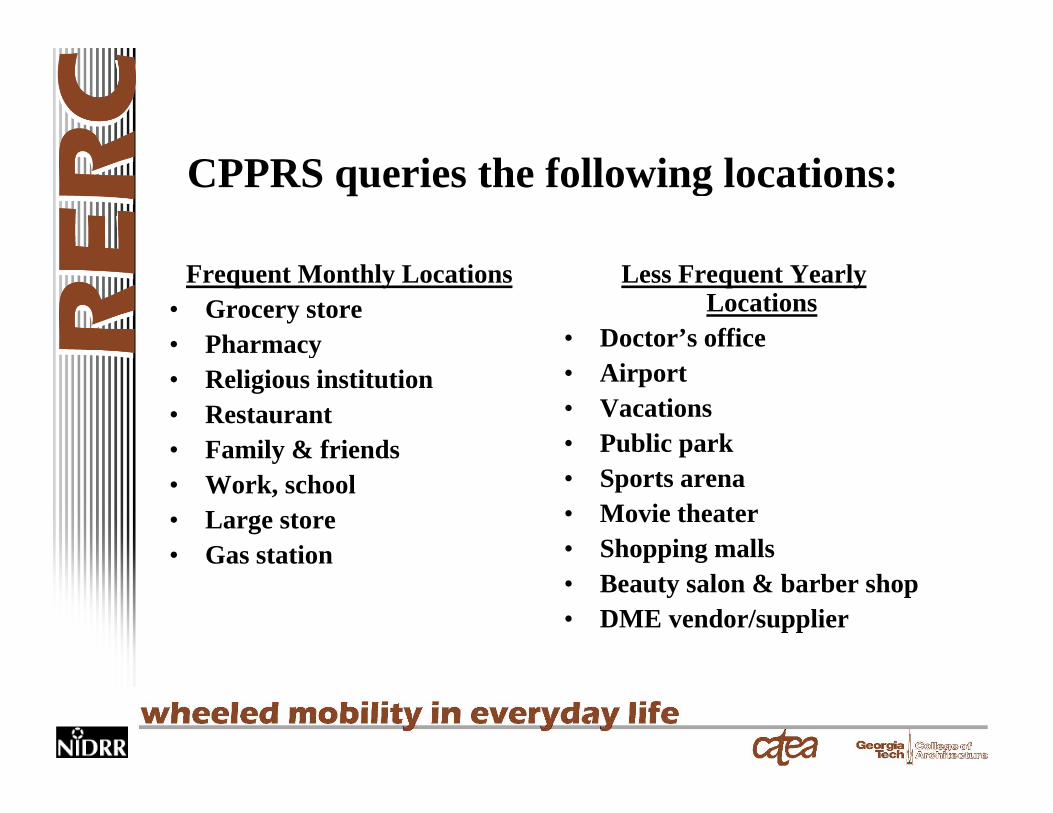
CPPRS queries the following locations:
Frequent Monthly Locations• Grocery store• Pharmacy
Less Frequent Yearly Locations
• Doctor’s officey• Religious institution• Restaurant• Family & friends
• Airport• Vacations• Public parkFamily & friends
• Work, school• Large store• Gas station
• Sports arena• Movie theater• Shopping mallsGas station pp g• Beauty salon & barber shop• DME vendor/supplier

For each location the following isFor each location the following is asked:
• Frequency• Paid and Unpaid
• Pain & fatigue• Overall accessibilityp
Assistance• Primary mobility
y• Environmental
facilitatorsdevice
• Importance• Transportation• Peoples’ attitudes
• Choice • Satisfaction
p
Examples of environmental facilitatorExamples of environmental facilitator questions:
Fl t id lk f•Flat sidewalk surfaces •Level entranceFl f•Floor surfaces
•Placement of merchandise in stores •Social attitudes•Social attitudes•Accessible bathrooms•Accessible parking•Accessible parking•Curb cuts, ramps, automatic doors
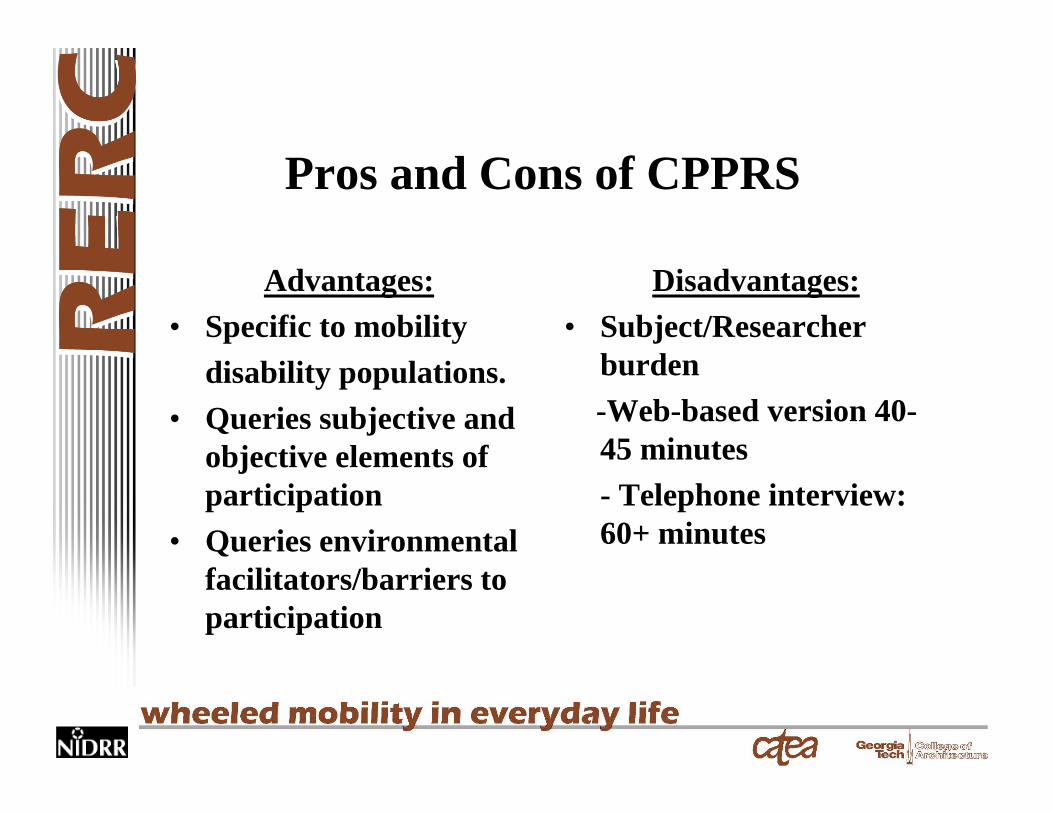
Pros and Cons of CPPRS
Advantages:• Specific to mobility
Disadvantages:• Subject/Researcher
b ddisability populations.• Queries subjective and
objective elements of
burden -Web-based version 40-45 minutesobjective elements of
participation• Queries environmental
45 minutes- Telephone interview: 60+ minutes
facilitators/barriers to participation
Current Study Using CPPRS
Goal: to measure health, activity and participation of people who use tilt-in-space
wheelchairs.

CPPRS Results1 Will summarize number and qualities of1. Will summarize number and qualities of
monthly and yearly destinations.
2 Will provide scores that evaluate:2. Will provide scores that evaluate:
- difficulty in going to location with and without primary mobility device.without primary mobility device.
- quality of participation at each location.
helpful environmental features at each- helpful environmental features at each location.
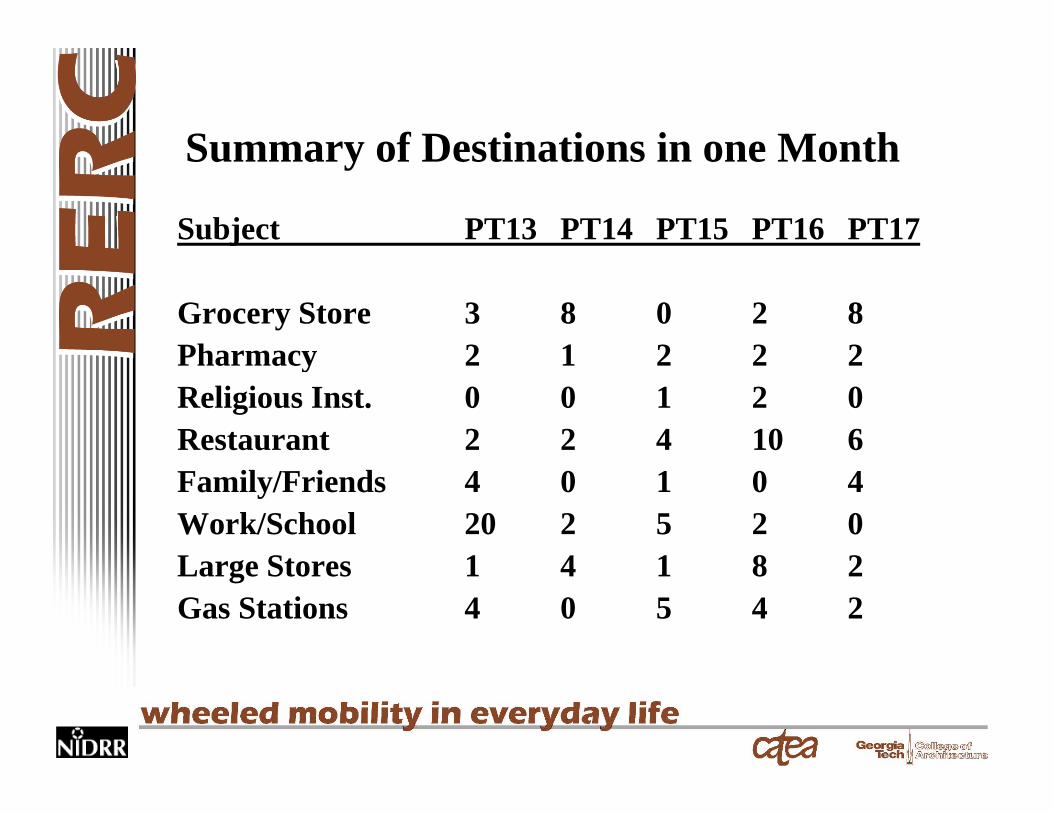
Summary of Destinations in one MonthSummary of Destinations in one Month
Subject PT13 PT14 PT15 PT16 PT17
Grocery Store 3 8 0 2 8Pharmacy 2 1 2 2 2Pharmacy 2 1 2 2 2Religious Inst. 0 0 1 2 0Restaurant 2 2 4 10 6Family/Friends 4 0 1 0 4Work/School 20 2 5 2 0L St 1 4 1 8 2Large Stores 1 4 1 8 2Gas Stations 4 0 5 4 2
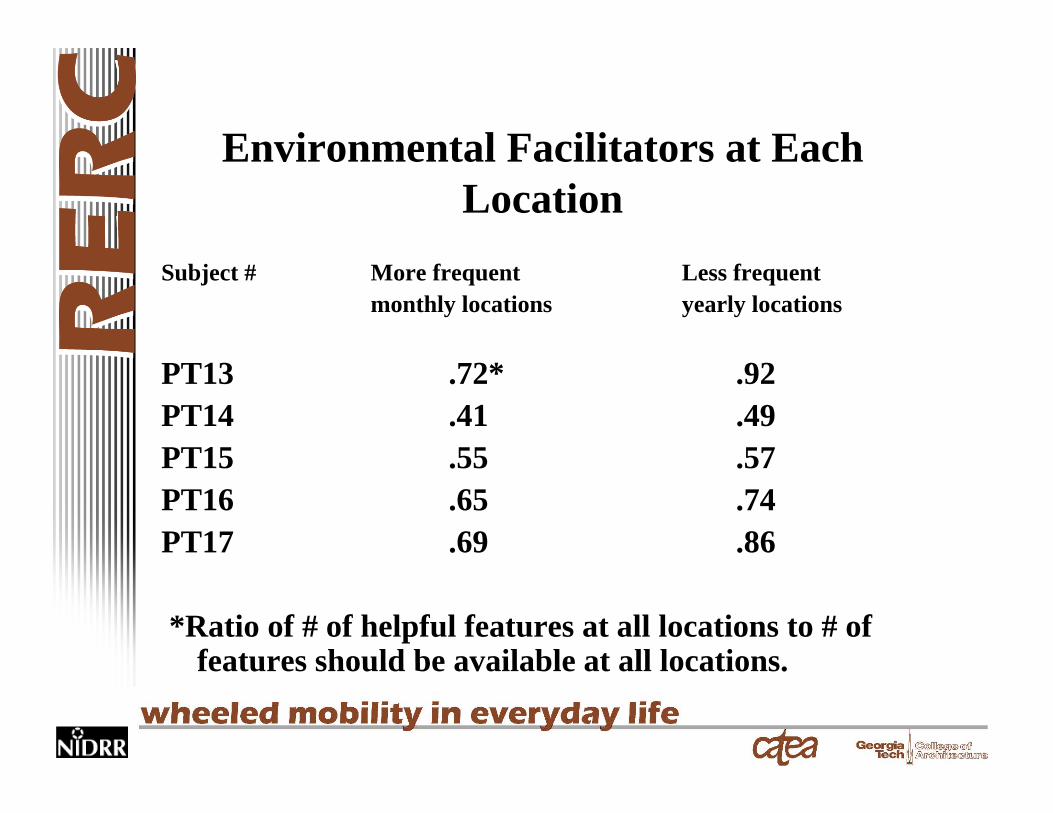
Environmental Facilitators at EachEnvironmental Facilitators at Each Location
Subject # More frequent Less frequentmonthly locations yearly locations
PT13 .72* .92PT14 .41 .49PT15 55 57PT15 .55 .57PT16 .65 .74PT17 .69 .86
*Ratio of # of helpful features at all locations to # of features should be available at all locationsfeatures should be available at all locations.
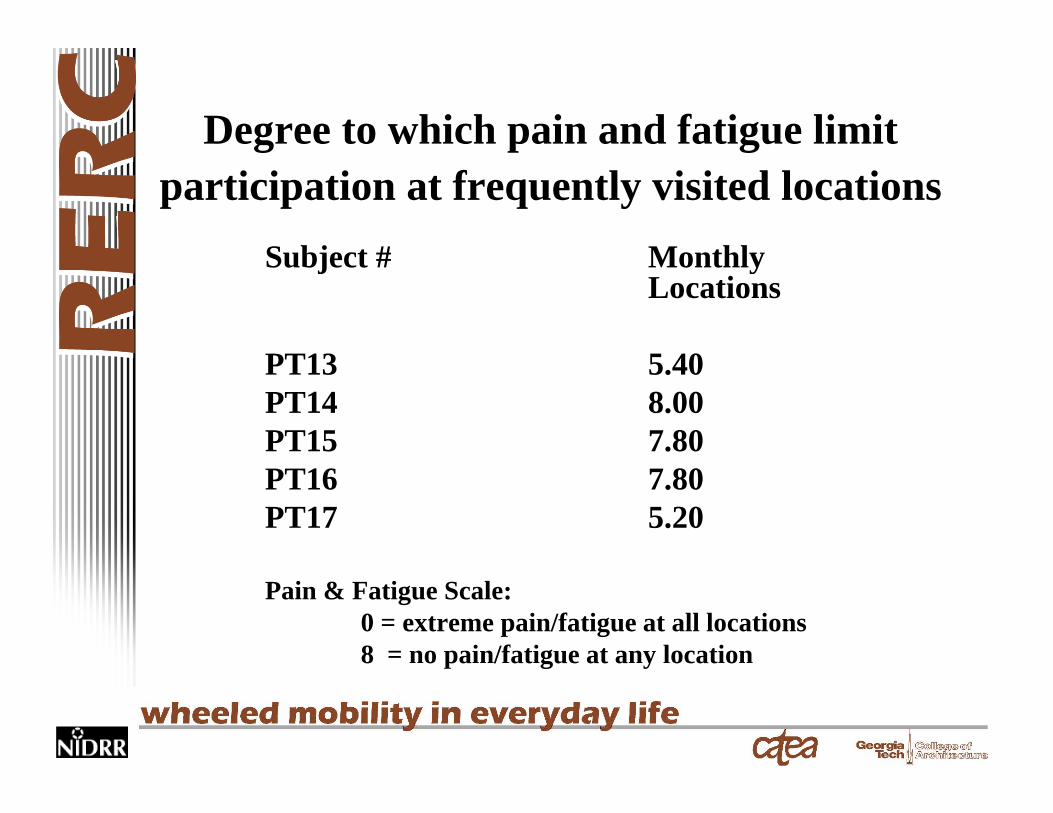
Degree to which pain and fatigue limit g p gparticipation at frequently visited locations
Subject # MonthlySubject # Monthly Locations
PT13 5 40PT13 5.40PT14 8.00PT15 7.80PT16 7.80PT17 5.20
Pain & Fatigue Scale: 0 = extreme pain/fatigue at all locations8 = no pain/fatigue at any location8 o pa / at gue at a y ocat o
General Limitations of Self ReportGeneral Limitations of Self Report Measures of Participation
1. They do not capture the “performance” of participation and activity as it occurs.
- They capture what people say they do, not what they in fact dothey in fact do.
General Limitations of Self ReportGeneral Limitations of Self Report Measures of Participation
2. Self reports are vulnerable to issues that affect data quality. q y
– Question format, wording, context can result in inconsistent responses. p
– Frequency and rating scales in particular invite inconsistent responses across subjects.
Wheelchair Activity MonitoringWheelchair Activity Monitoring Instrument (WhAMI)
A new methodology to measure activity and participation among wheelchair users. It combines activity monitoring i t t ( h itinstruments (such as occupancy monitor, wheel revolution counter, seat position sensor GPS) with self-report measuressensor, GPS) with self-report measures.
WhAMI is a flexible and versatile research tool.
1 Combines objective measurement1. Combines objective measurement with self report instruments.
2. Describes activity and participatory behavior in a real world environment.
Research question determines choice f t h lof technology
Consider which measurements are needed to answer your question(s)? Examples:question(s)? Examples:
- How much was the wheelchair used (expressed as distance traveled)?
- How many activities were performed outside the home?- How often were special features on the wheelchair used?- When and how often did the person get in and out of
their wheelchair?
Different questions may require different technology or different applications of the same technology
– What was the average use (daily distance) of the g ( y )wheelchair?
– What was the average use (daily distance) of the wheelchair inside the home?
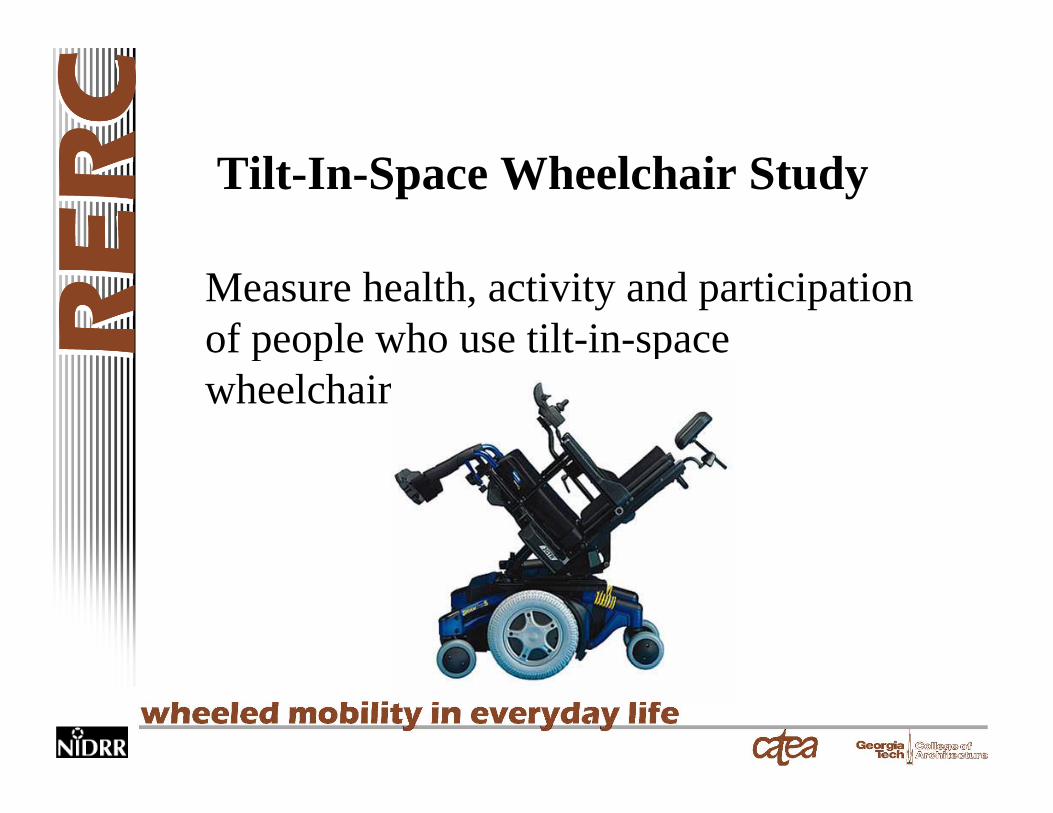
Tilt-In-Space Wheelchair Study
Measure health, activity and participation of people who use tilt-in-space p p pwheelchairs.
Tilt-In-Space Wheelchair Study• How did the subject use his/her wheelchair?
– How much time did they spend in their wheelchair? – How many bouts of movement did they have per day?– How much time did they spend wheeling?y p g– What percent of the time seated in their wheelchair were
they mobile? – What was the overall distance traveled in wheelchair daily?What was the overall distance traveled in wheelchair daily?
• How was the Tilt-In-Space feature used?H ti did th bj t tilt?– How many times did the subject tilt?
– How much time did they spend tilted?

Tilt-In-Space Wheelchair Study
• What was the nature of the trips taken outside the home?– How many trips per day did they take?– How many unique destinations did they
visit?– What is the average number of hours per
day spent at destinations?
Specific Technology
• Data logger• Occupancy monitorOccupancy monitor• Wheel revolution counter
S i i• Seat position sensor• GPS
Criteria to consider when choosingCriteria to consider when choosing activity monitoring instrumentation• Subject Burden
– Size, comfort, wearability, visibility– Frequency of charging– # of researcher interactions
• Researcher Burden – Time to deploy– Time to retrieve– Amount of monitoring needed throughout project– Required data processing
• Accuracy and reliability• Cost• Applicability to future populationspp y p p
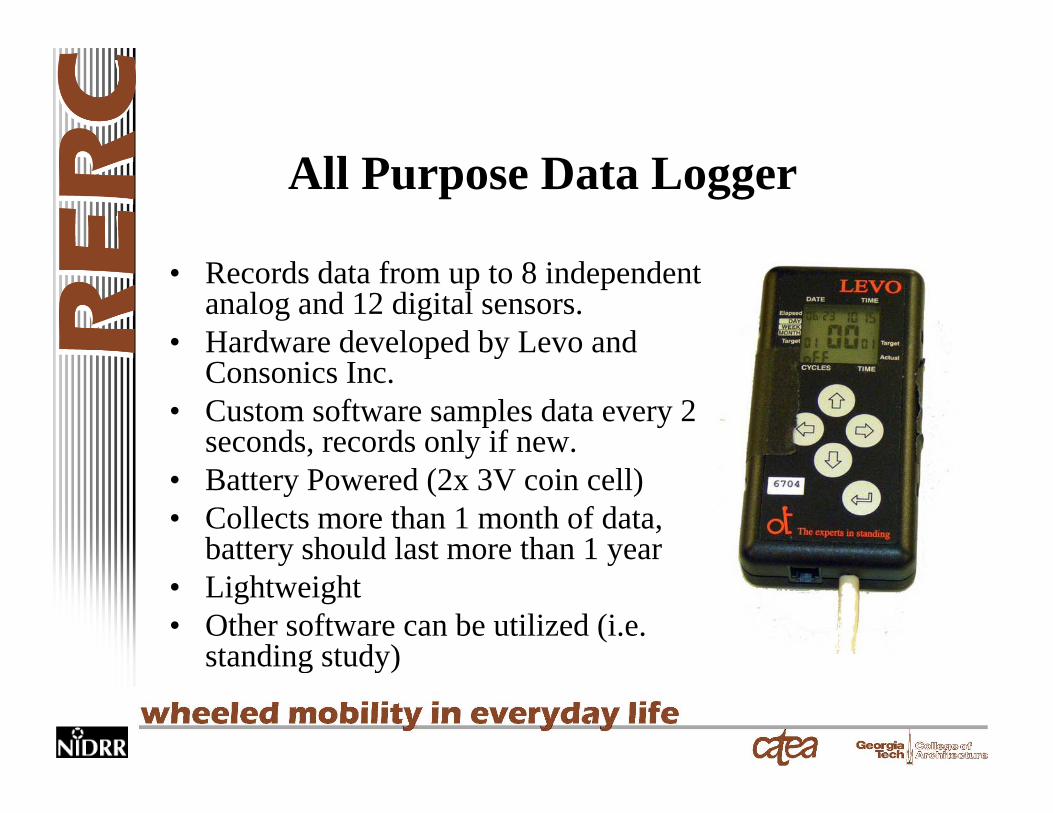
All Purpose Data Logger
• Records data from up to 8 independent analog and 12 digital sensors.
• Hardware developed by Levo and p yConsonics Inc.
• Custom software samples data every 2 seconds, records only if new. y
• Battery Powered (2x 3V coin cell)• Collects more than 1 month of data,
battery should last more than 1 yeary y• Lightweight• Other software can be utilized (i.e.
standing study)standing study)
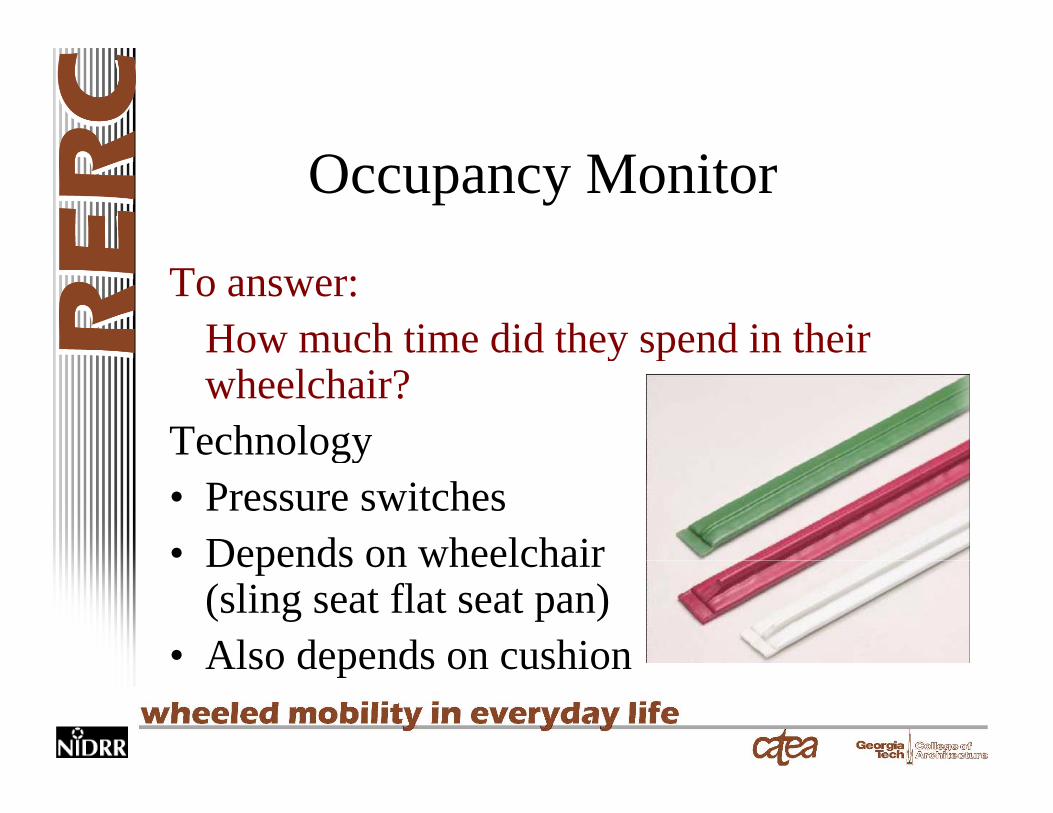
Occupancy Monitor
To answer:How much time did they spend in their y pwheelchair?
Technologygy• Pressure switches• Depends on wheelchairDepends on wheelchair
(sling seat flat seat pan)• Also depends on cushionAlso depends on cushion
Occupancy Monitor
Measurements (used with data logger)
• State of occupancy every two seconds• With processing:
– Total time spent in wheelchair– Number of transfers– Max duration of occupancy
• Integration with other data:– (with GPS) Use of wheelchair specifically inside
the homethe home
Occupancy Monitor• Researcher Burden
– Data is easily interpreted– Monitor must be customized per wheelchair and
cushion, requires validation testing • Accuracy and reliabilityy y
– > 95% for most subjects– Unusual seating configurations or subjects who
are light-weight may be problematicg g y p• Future Applicability
– wheeled mobilitypartial ambulators– partial ambulators
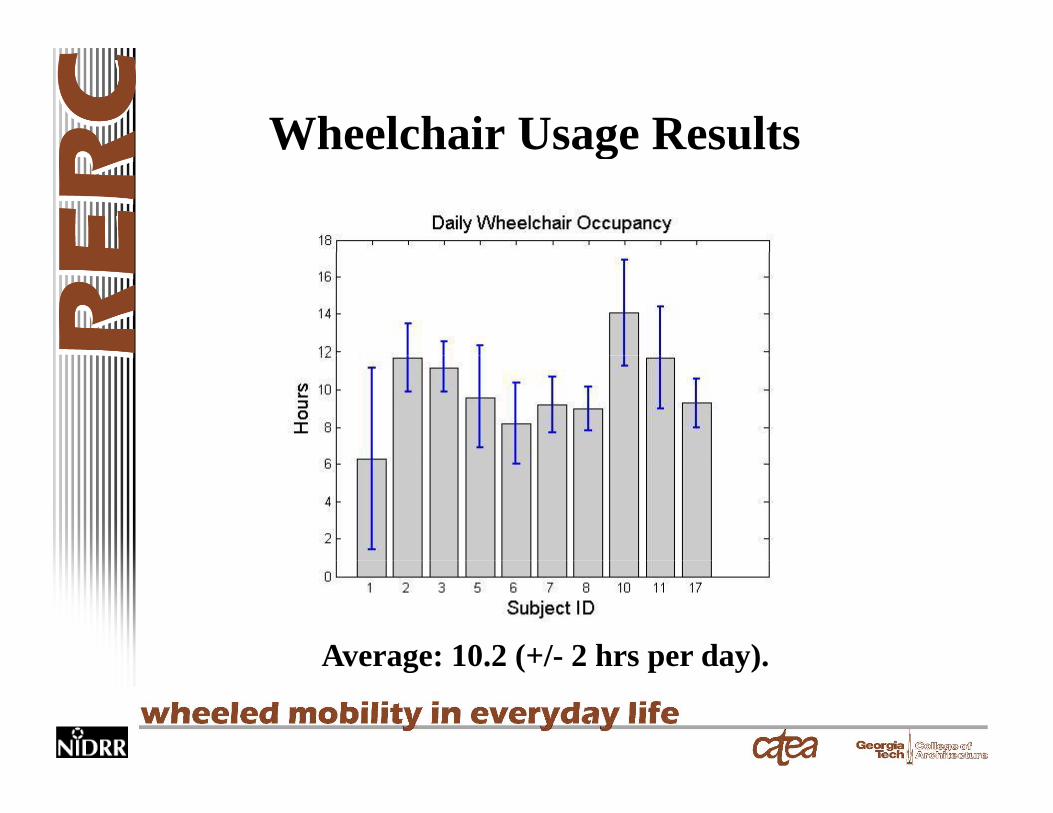
Wheelchair Usage Resultsg
Average: 10.2 (+/- 2 hrs per day).Average: 10.2 (+/ 2 hrs per day).
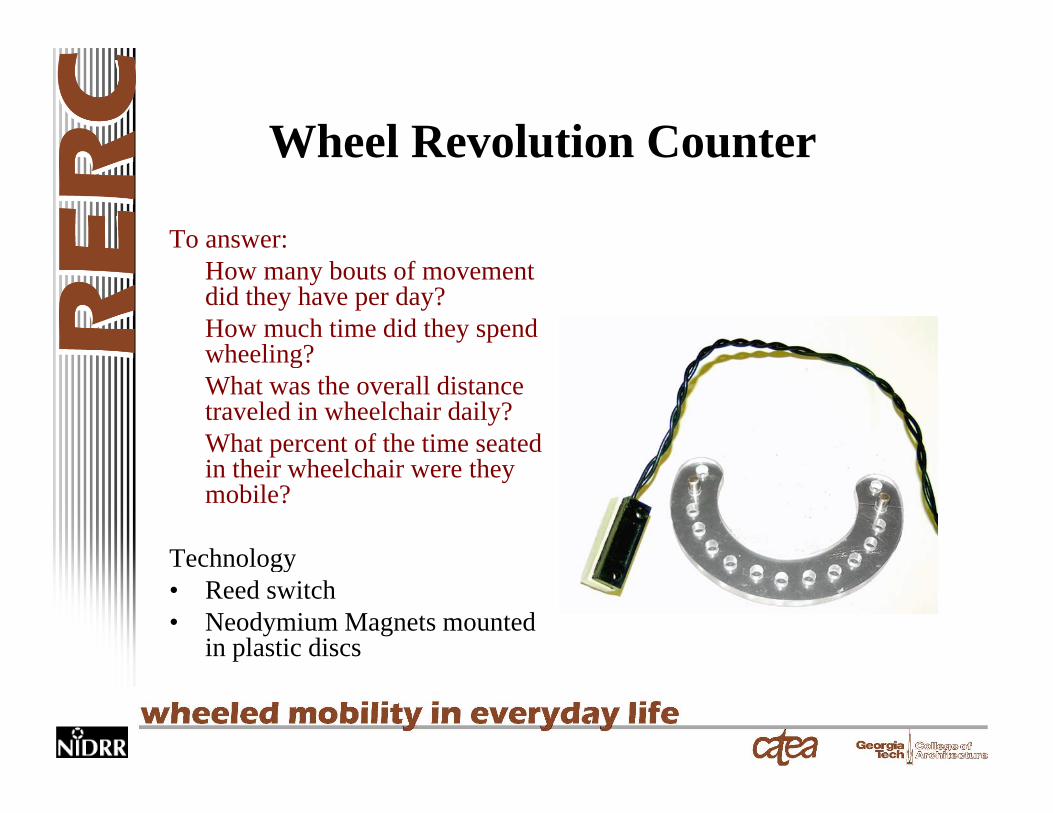
Wheel Revolution CounterWheel Revolution Counter
To answer:How many bouts of movement did they have per day?How much time did they spend wheeling?wheeling?What was the overall distance traveled in wheelchair daily?What percent of the time seated in their wheelchair were they mobile?
TechnologyTechnology• Reed switch• Neodymium Magnets mounted
in plastic discs
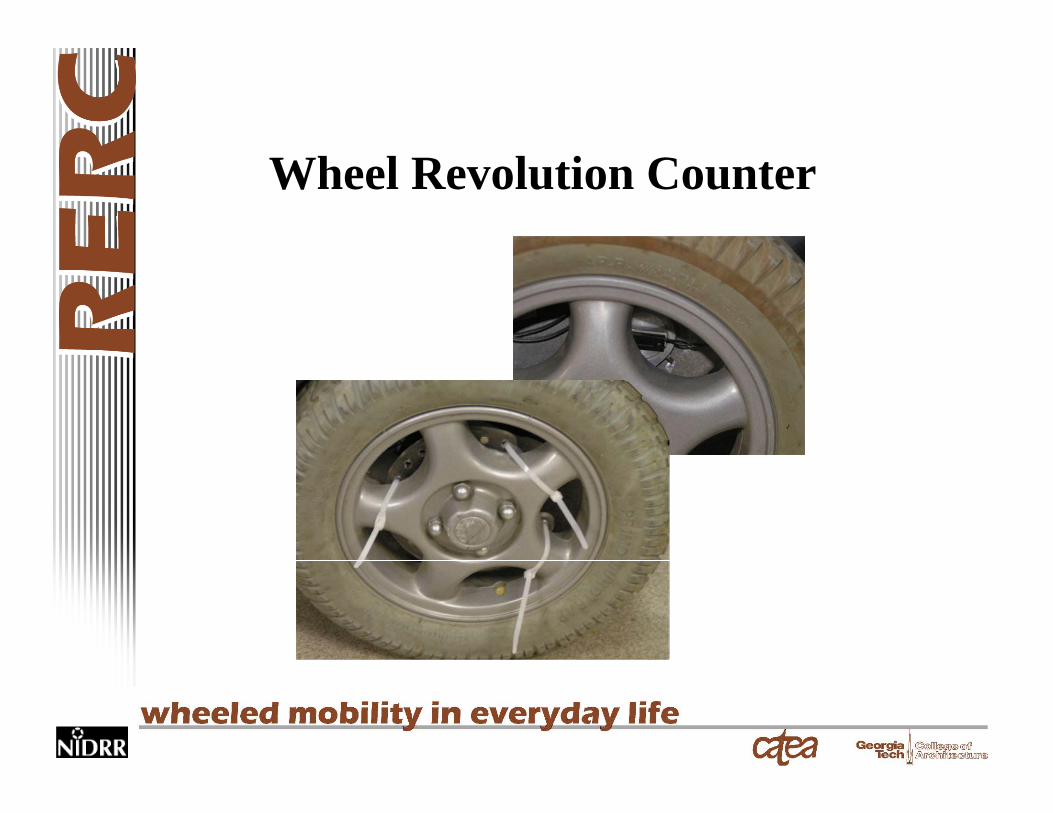
Wheel Revolution Counter
Wheel Revolution CounterMeasurements (used with data logger)• Total wheel counts every 2 seconds• Total wheel counts every 2 seconds• Can calculate
– Total distance traveled– Approximate speed of travelApproximate speed of travel– Number of bouts of mobility– Duration of movement bouts– Patterns of mobilityy
• Integrate with other data – GPS and Prompted Recall
• mobility at each destination• Amount of indoor mobility versus outdoor mobility
– Occupancy• % of time in wheelchair used for mobility versus seating
Wheel Revolution CounterA mobility bout is defined as a bout of movements initiatedA mobility bout is defined as a bout of movements initiated when a subject travels a minimum of 2 feet within 4 seconds and continues until the subjects travels less than 2.5 feet over 14 seconds.over 14 seconds.
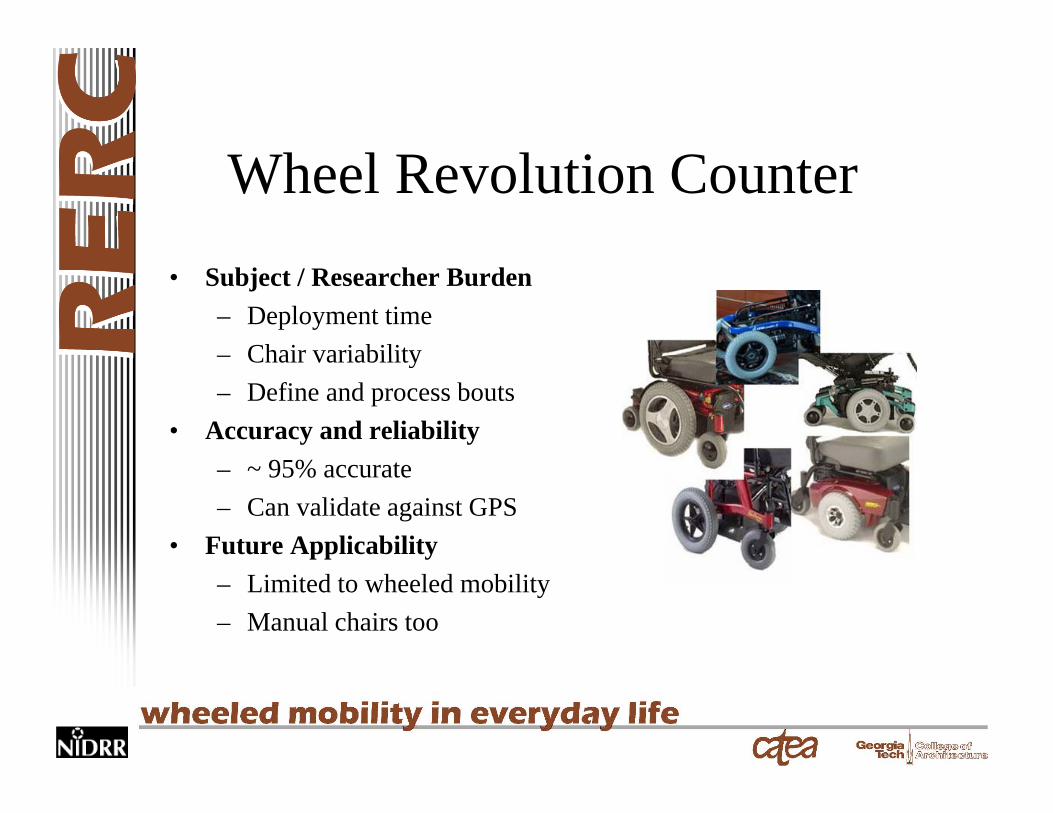
Wheel Revolution Counter• Subject / Researcher Burden
– Deployment timeChair variability– Chair variability
– Define and process bouts• Accuracy and reliability
– ~ 95% accurate– Can validate against GPS
• Future Applicability– Limited to wheeled mobility– Manual chairs too
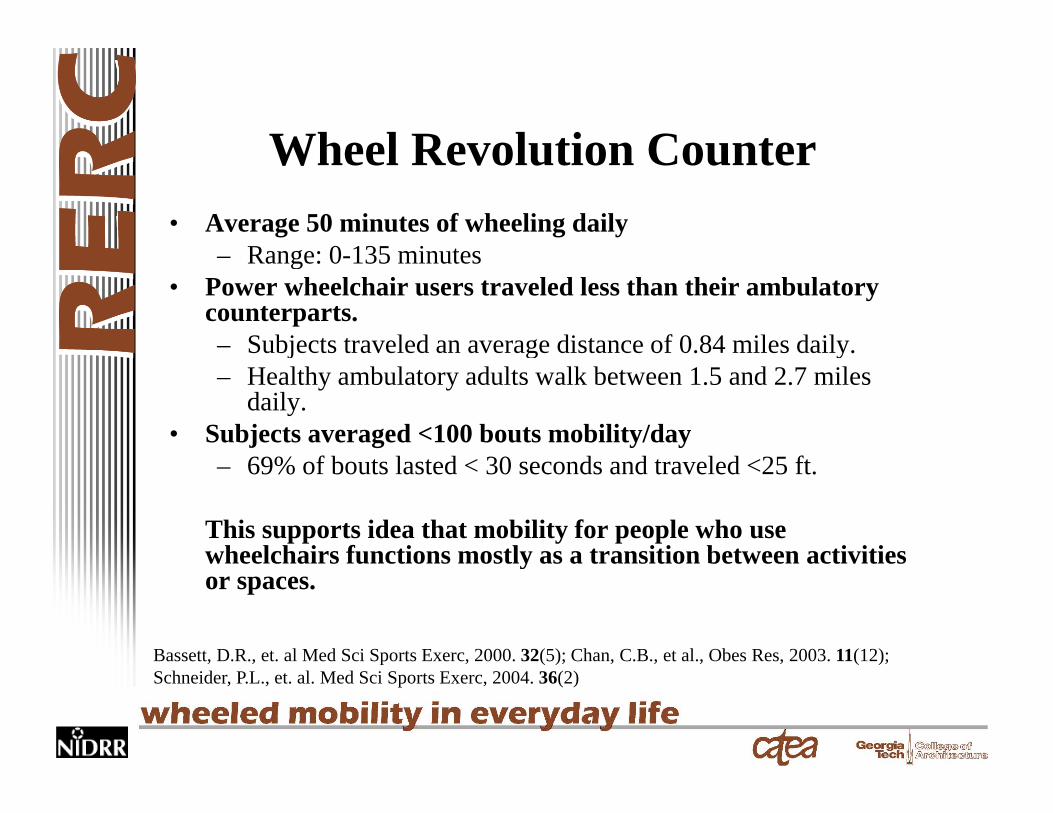
Wheel Revolution CounterWheel Revolution Counter• Average 50 minutes of wheeling daily
Range: 0 135 minutes– Range: 0-135 minutes • Power wheelchair users traveled less than their ambulatory
counterparts.– Subjects traveled an average distance of 0.84 miles daily. j g y– Healthy ambulatory adults walk between 1.5 and 2.7 miles
daily. • Subjects averaged <100 bouts mobility/day
69% f b l d 30 d d l d 25 f– 69% of bouts lasted < 30 seconds and traveled <25 ft.
This supports idea that mobility for people who use wheelchairs functions mostly as a transition between activitieswheelchairs functions mostly as a transition between activities or spaces.
Bassett, D.R., et. al Med Sci Sports Exerc, 2000. 32(5); Chan, C.B., et al., Obes Res, 2003. 11(12); , , p , ( ); , , , , ( );Schneider, P.L., et. al. Med Sci Sports Exerc, 2004. 36(2)
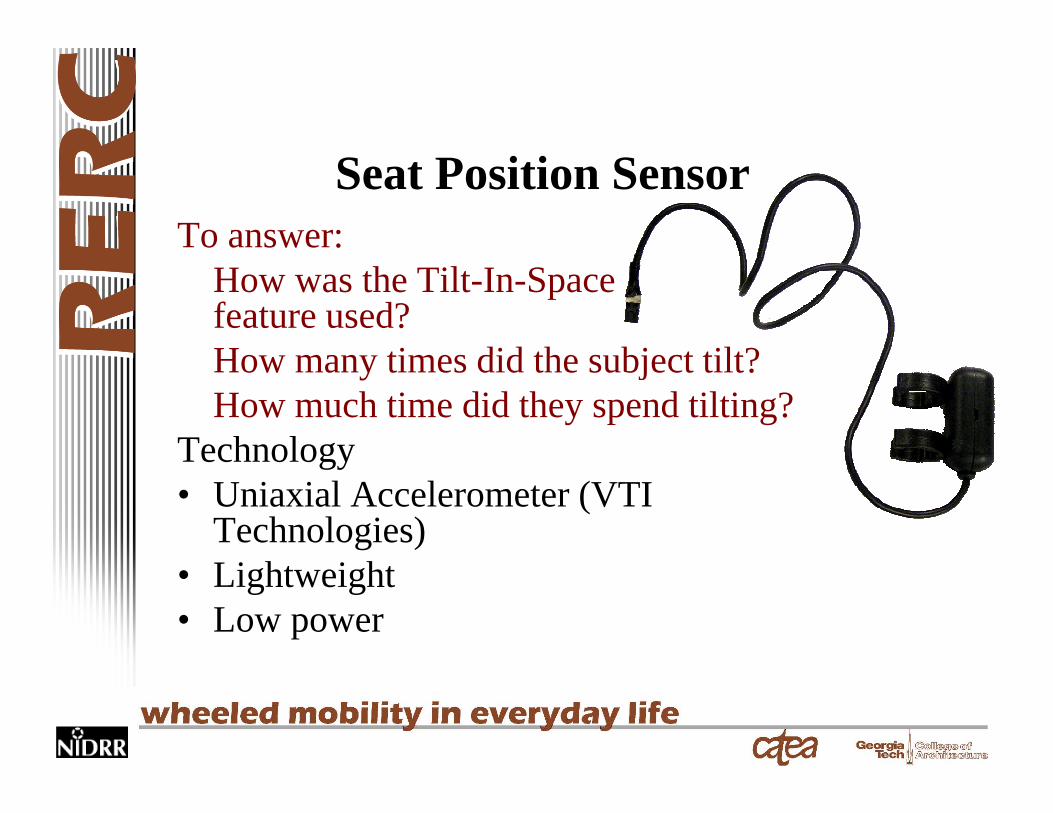
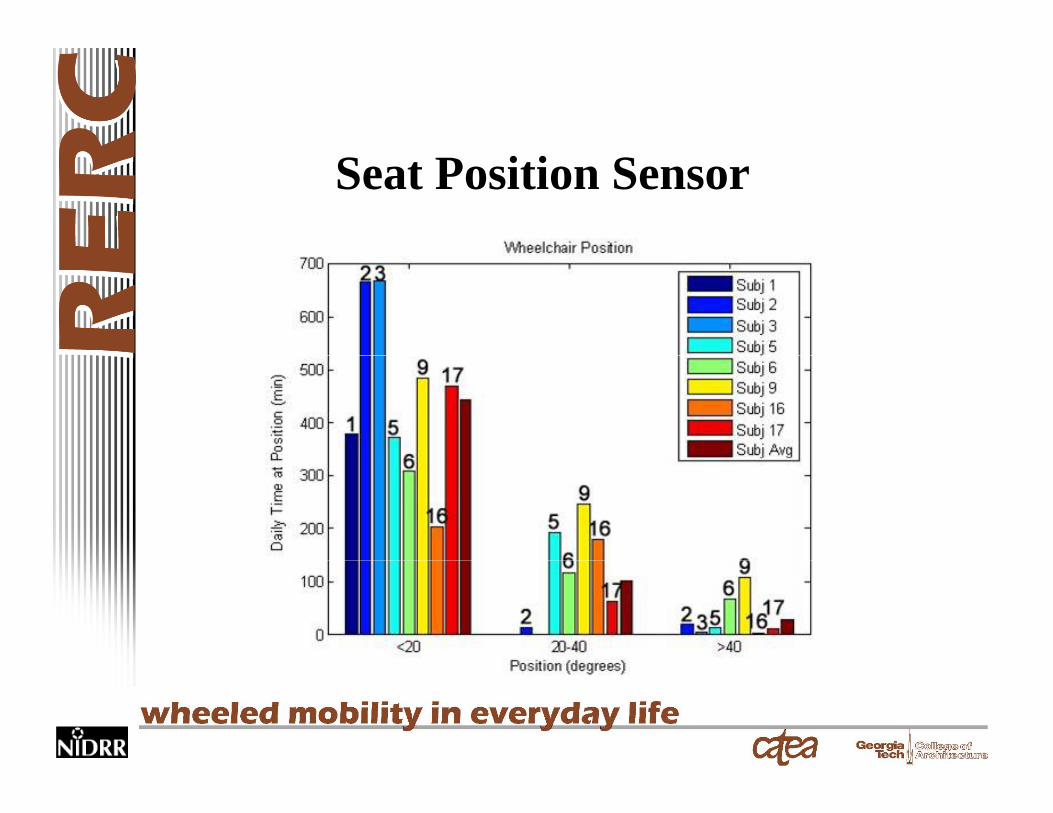
Seat Position SensorTo answer:
How was the Tilt-In-Space feature used?Ho man times did the s bject tilt?How many times did the subject tilt?How much time did they spend tilting?
TechnologyTechnology• Uniaxial Accelerometer (VTI
Technologies)• Lightweight• Low power
Seat Position SensorSeat Position Sensor
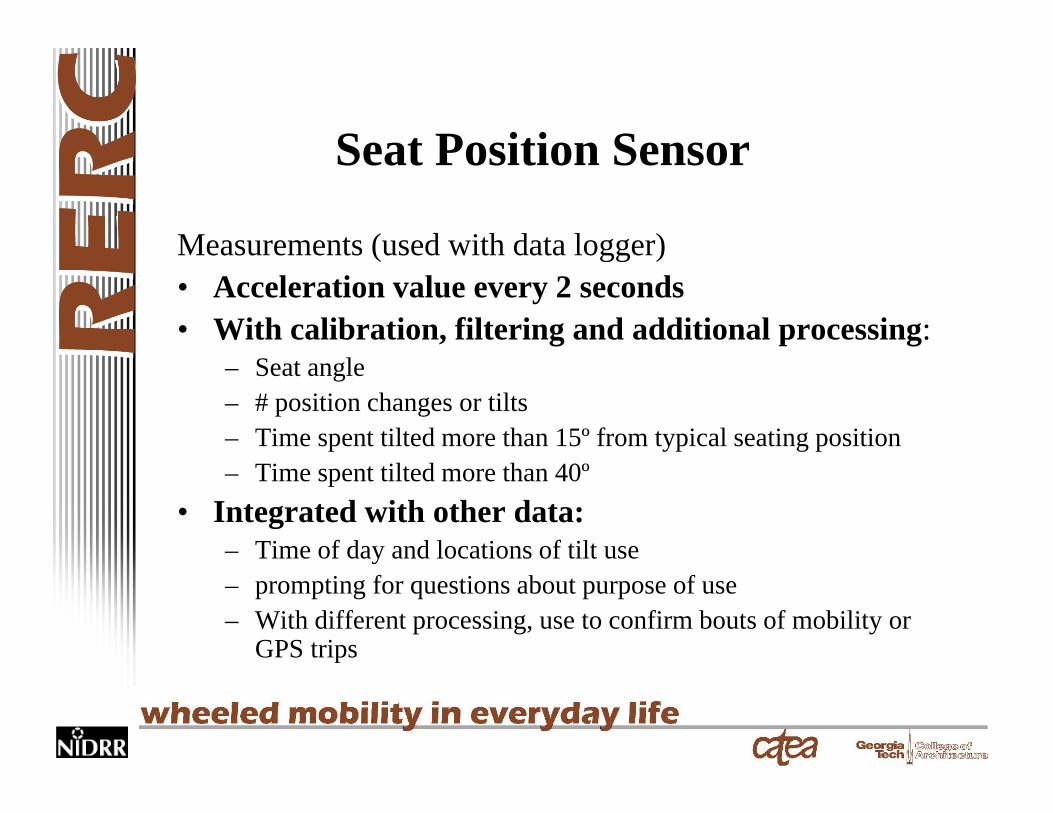
Measurements (used with data logger)Measurements (used with data logger)• Acceleration value every 2 seconds• With calibration, filtering and additional processing:
– Seat angle– # position changes or tilts– Time spent tilted more than 15º from typical seating position– Time spent tilted more than 40º
• Integrated with other data:– Time of day and locations of tilt usey– prompting for questions about purpose of use– With different processing, use to confirm bouts of mobility or
GPS trips

Seat Position Sensor
• Subject / Researcher Burden– Deployment is simple– Define appropriate filters, process data– Define “Tilt” or position change
• Accuracy and reliability– ±2º
• Future Applicability– Tilt-in-space, recline, standing wheelchairs– Other benefits to measuring acceleration
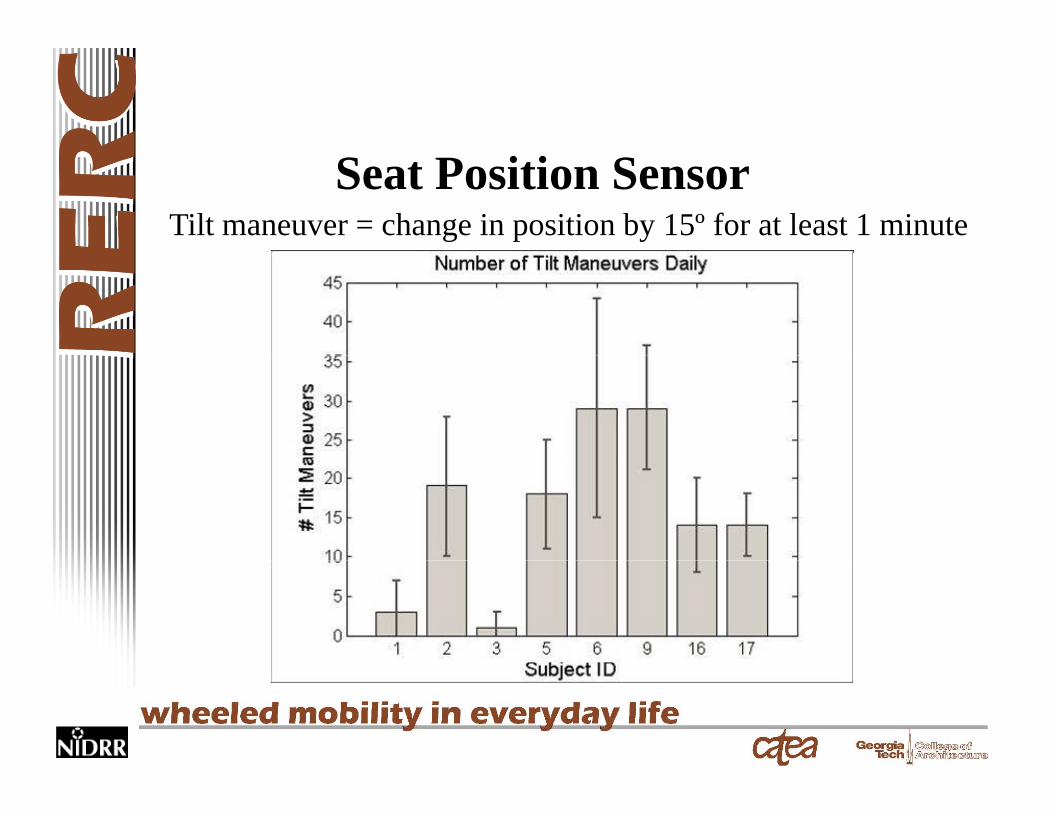
Seat Position SensorTilt maneuver = change in position by 15º for at least 1 minute
Seat Position Sensor
Global Positioning System (GPS)
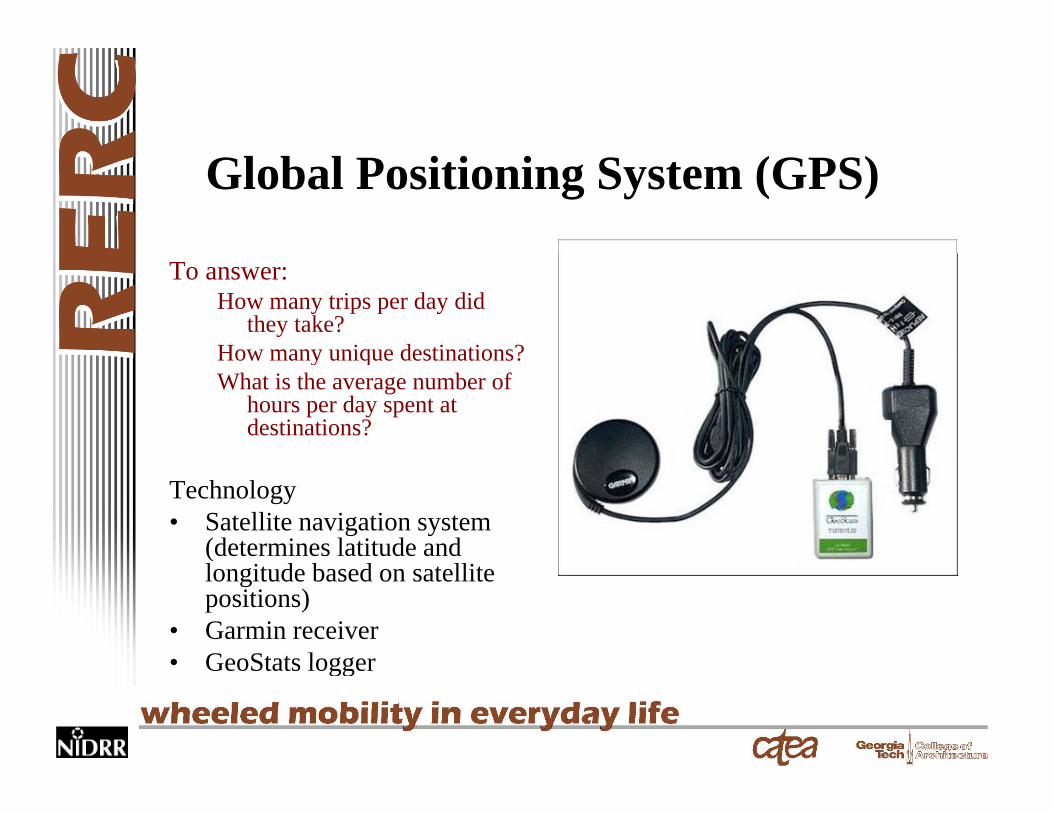
To answer:How many trips per day did
they take?How many unique destinations?How many unique destinations?What is the average number of
hours per day spent at destinations?
Technology• Satellite navigation system
(determines latitude and (longitude based on satellite positions)
• Garmin receiver • GeoStats logger• GeoStats logger
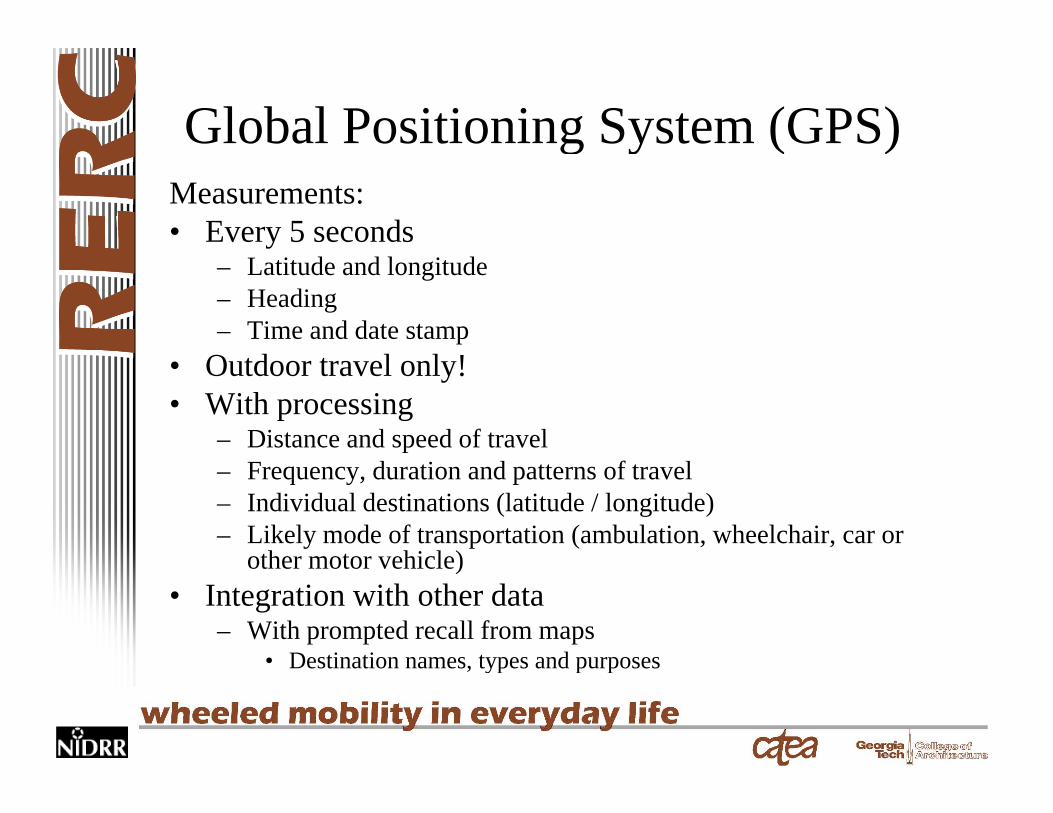
Global Positioning System (GPS)g y ( )Measurements: • Every 5 seconds
– Latitude and longitude– Heading– Time and date stamp
O d l l !• Outdoor travel only!• With processing
– Distance and speed of travel– Frequency, duration and patterns of travel– Individual destinations (latitude / longitude)– Likely mode of transportation (ambulation, wheelchair, car or
other motor vehicle)other motor vehicle)• Integration with other data
– With prompted recall from maps• Destination names types and purposes• Destination names, types and purposes
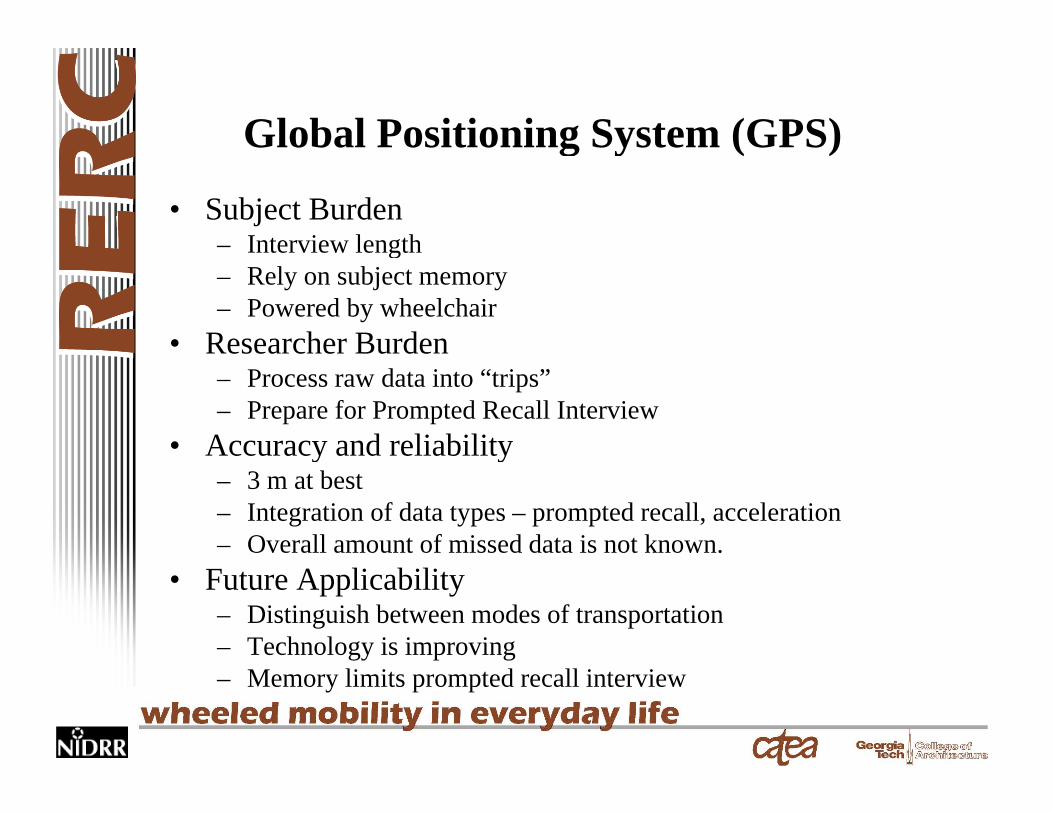
Global Positioning System (GPS)g y ( )
• Subject Burden – Interview length e v ew e g– Rely on subject memory– Powered by wheelchair
• Researcher Burden – Process raw data into “trips”– Prepare for Prompted Recall Interview
• Accuracy and reliabilityy y– 3 m at best– Integration of data types – prompted recall, acceleration– Overall amount of missed data is not known.
• Future Applicability– Distinguish between modes of transportation– Technology is improving– Memory limits prompted recall interview
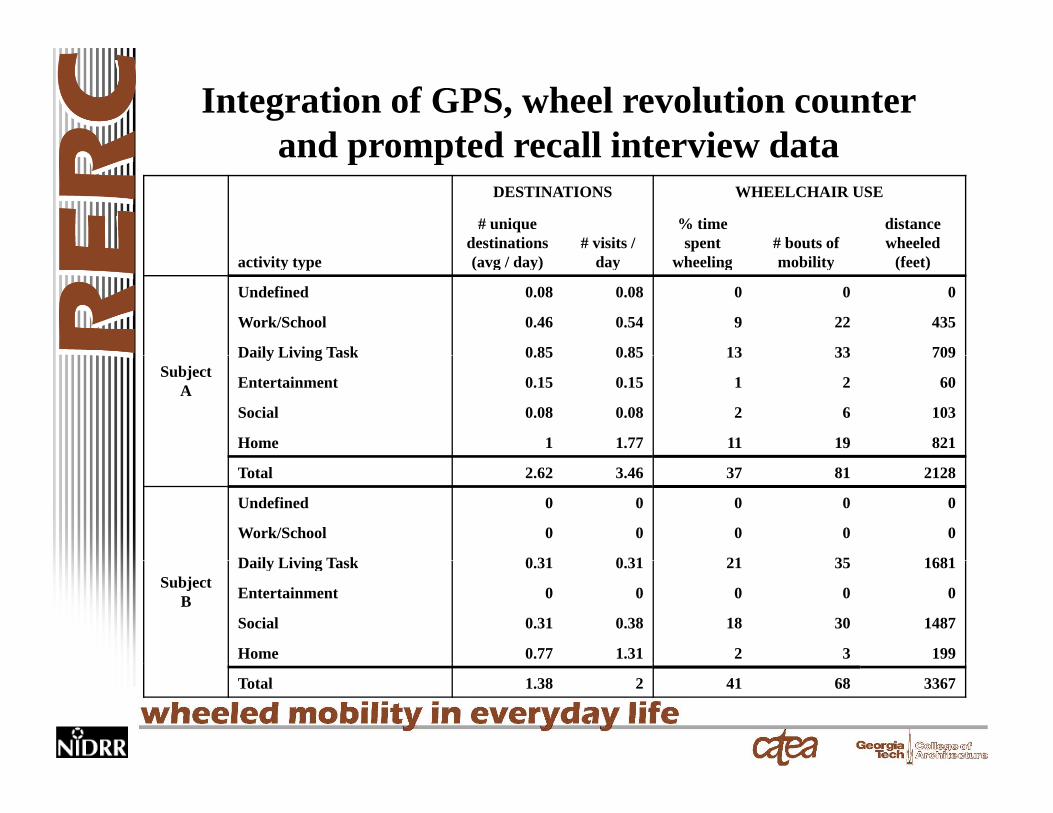
Integration of GPS, wheel revolution counter and prompted recall interview dataand prompted recall interview data
DESTINATIONS WHEELCHAIR USE
# unique destinations # visits /
% time spent # bouts of
distance wheeled
activity type (avg / day) day wheeling mobility (feet)
Undefined 0.08 0.08 0 0 0
Work/School 0.46 0.54 9 22 435
Daily Living Task 0.85 0.85 13 33 709Subject
A
Daily Living Task 0.85 0.85 13 33 709
Entertainment 0.15 0.15 1 2 60
Social 0.08 0.08 2 6 103
Home 1 1.77 11 19 821
Total 2.62 3.46 37 81 2128
Undefined 0 0 0 0 0
Work/School 0 0 0 0 0
D il Li i T k 0 31 0 31 21 35 1681Subject
B
Daily Living Task 0.31 0.31 21 35 1681
Entertainment 0 0 0 0 0
Social 0.31 0.38 18 30 1487
Home 0.77 1.31 2 3 199
Total 1.38 2 41 68 3367
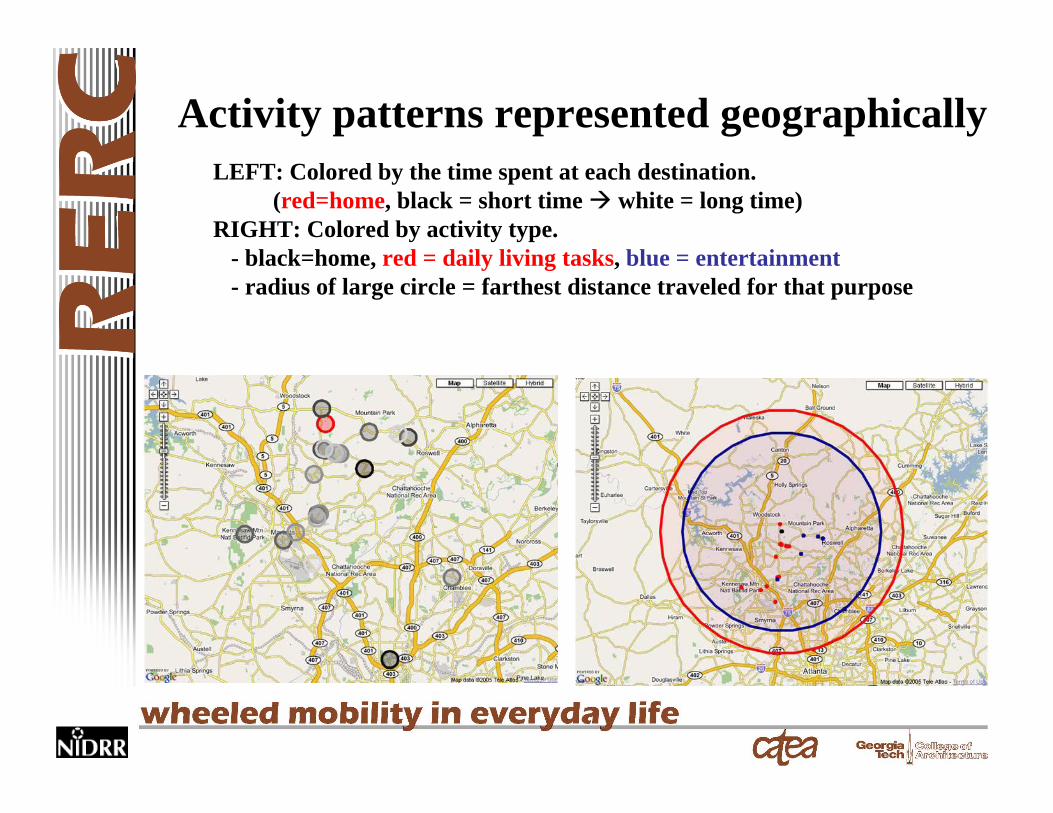
Activity patterns represented geographicallyLEFT: Colored by the time spent at each destination.
(red=home, black = short time white = long time) RIGHT: Colored by activity type.
bl k h d d il li i t k bl t t i t- black=home, red = daily living tasks, blue = entertainment- radius of large circle = farthest distance traveled for that purpose

Why we studied powerWhy we studied power wheelchair users first?
Available powerAvailable carrying structureAvailable carrying structure
In other words: easier
To fully study A&P of wheelchairTo fully study A&P of wheelchair users, must …
• Be able to study manual users– No power; light & robust instrumentationNo power; light & robust instrumentation
• manual chairs get tossed about more than power chairs
• Be able to study partial ambulatorsy p– Subject becomes carrying structure– Added burden of multiple mobility devicesAdded burden of multiple mobility devices
Design criteria
• Subject burden• Researcher burdenResearcher burden• Accuracy & reliability
C• Cost
Let’s look at indoor locationLet s look at indoor location tracking
• GPS does not work• Need to decide:Need to decide:
– Do we want to know where people hang out in the home?in the home?
– Do we want to track movements within the home?o e?
– Do we need room level or sub-room level?
Most popular technologies• RFID (radio frequency identification tags)
– Tags are no problem; receivers are the problem• Infrared• Infrared
– Have a noise problem and hates the sun• If other living beings can be considered ‘noise’
Ult i• Ultrasonic– Same noise problem
• GSM (Global Systems for Mobile Communication)GSM (Global Systems for Mobile Communication)
• Wi-Fi• Bluetooth
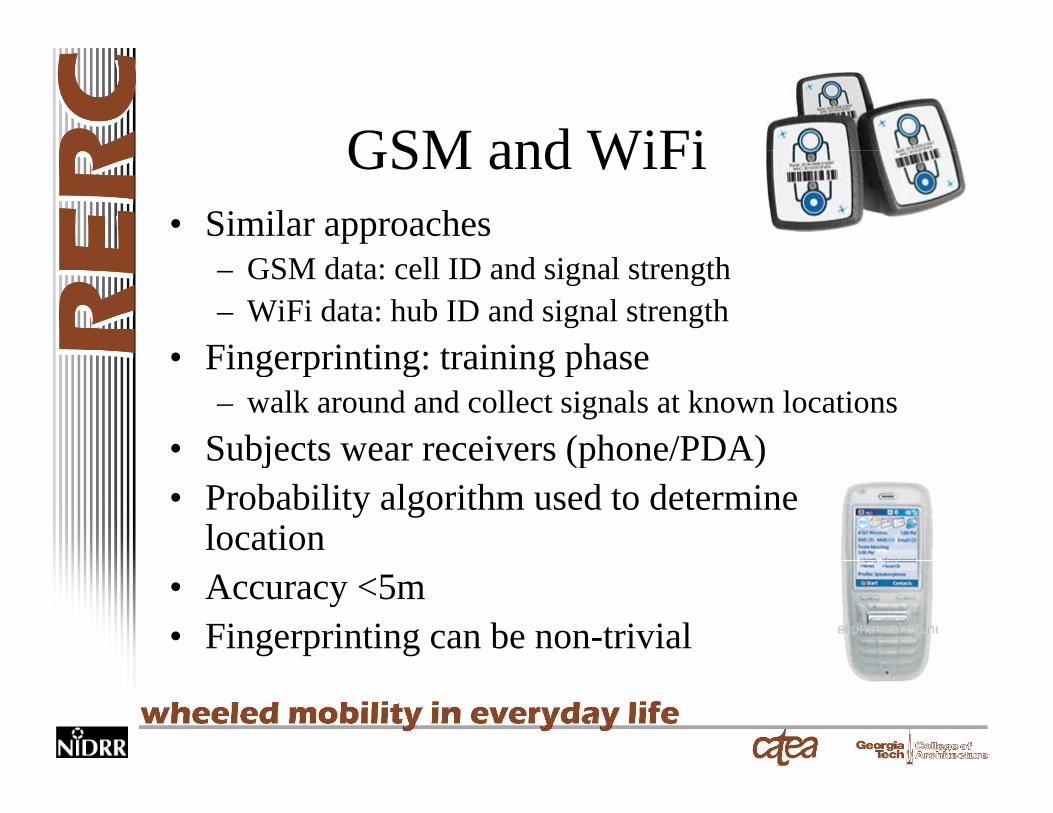
GSM and WiFiGSM and WiFi• Similar approaches
– GSM data: cell ID and signal strength– WiFi data: hub ID and signal strength
• Fingerprinting: training phase• Fingerprinting: training phase– walk around and collect signals at known locations
• Subjects wear receivers (phone/PDA)Subjects wear receivers (phone/PDA)• Probability algorithm used to determine
location• Accuracy <5m• Fingerprinting can be non-trivial
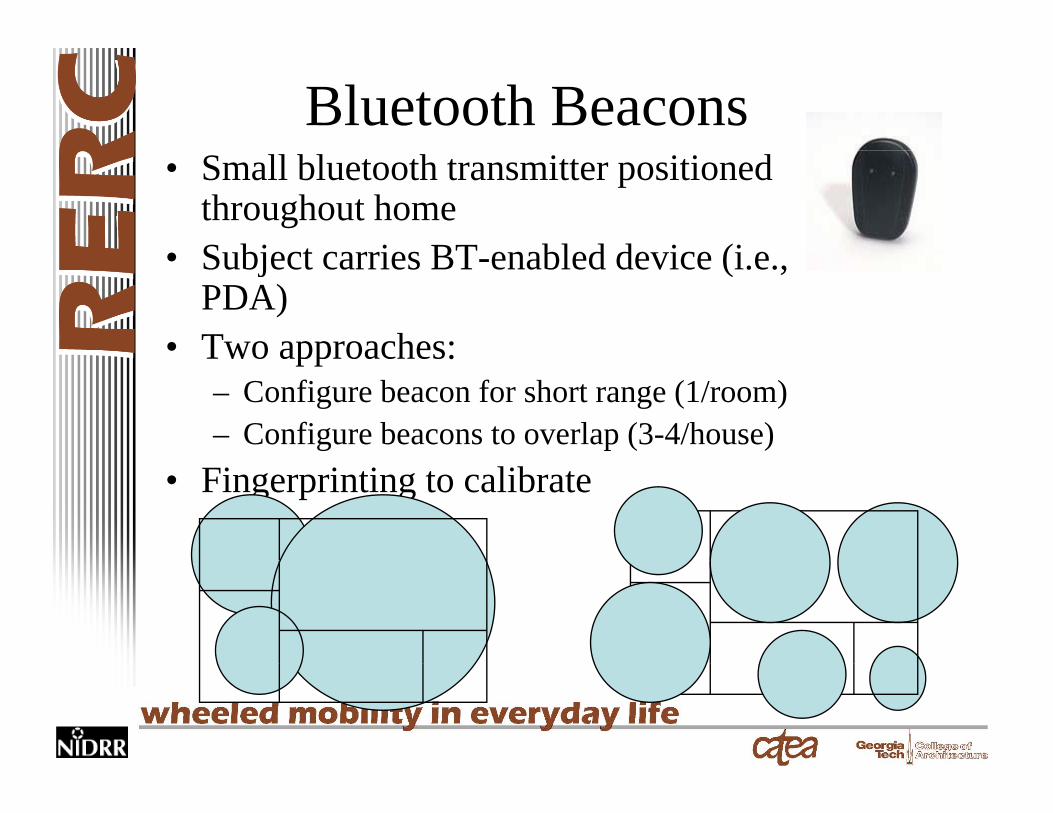
Bluetooth Beacons• Small bluetooth transmitter positioned
throughout home• Subject carries BT enabled device (i e• Subject carries BT-enabled device (i.e.,
PDA) • Two approaches:Two approaches:
– Configure beacon for short range (1/room)– Configure beacons to overlap (3-4/house)
• Fingerprinting to calibrate
Subject and Researcher BurdenSubject and Researcher Burden
• Subject/wheelchair carries ‘data logger’– Small form factor will necessitate re-chargingg g
• Deployment– GSM uses existing infrastructureg– WiFi and BT plug into wall– Fingerprinting can be laborious – All require access to subjects’ homes for a few hours

Accuracy and costAccuracy and cost• Room level accuracy availableRoom level accuracy available
– Sub-room possible• Fingerprinting rigor improves accuracy• Fingerprinting rigor improves accuracy• Real time tracking of movement will be
diffi ltdifficult• Cost/instrumentation
– GSM: phone and service; <$500– BT and WiFi: $1000-$1500
Summary
• Indoor location tracking is available• Many different applications driving theMany different applications driving the
innovation• Decisions based upon research questions• Decisions based upon research questions
and the other factors discussedG l l l b• Great place to start: placelab.org
Potential Applications of MAP
• To define activity & participation categories more rigorously
• To examine mobility patterns and activities among people who use mobility aids.
• Where “performance” or real-world environment can help assess clinical need or f ti l t f i t tifunctional outcome of an intervention.