Embed Size (px)
Citation preview

Measurement of Influenza Vaccination Coverage among Healthcare Personnel in US Hospitals • Author(s): Megan C. Lindley, MPH; Juliet Yonek, MPH; Faruque Ahmed, PhD; Joseph F. Perz,DrPH; Gretchen Williams Torres, MPPSource: Infection Control and Hospital Epidemiology, Vol. 30, No. 12 (December 2009), pp.1150-1157Published by: The University of Chicago Press on behalf of The Society for Healthcare Epidemiologyof AmericaStable URL: http://www.jstor.org/stable/10.1086/648086 .
Accessed: 13/05/2014 15:36
Your use of the JSTOR archive indicates your acceptance of the Terms & Conditions of Use, available at .http://www.jstor.org/page/info/about/policies/terms.jsp
.JSTOR is a not-for-profit service that helps scholars, researchers, and students discover, use, and build upon a wide range ofcontent in a trusted digital archive. We use information technology and tools to increase productivity and facilitate new formsof scholarship. For more information about JSTOR, please contact [email protected].
.
The University of Chicago Press and The Society for Healthcare Epidemiology of America are collaboratingwith JSTOR to digitize, preserve and extend access to Infection Control and Hospital Epidemiology.
http://www.jstor.org
This content downloaded from 193.104.110.129 on Tue, 13 May 2014 15:36:44 PMAll use subject to JSTOR Terms and Conditions
infection control and hospital epidemiology december 2009, vol. 30, no. 12
o r i g i n a l a r t i c l e
Measurement of Influenza Vaccination Coverage among HealthcarePersonnel in US Hospitals
Megan C. Lindley, MPH; Juliet Yonek, MPH; Faruque Ahmed, PhD; Joseph F. Perz, DrPH;Gretchen Williams Torres, MPP
objective. To characterize practices related to measuring influenza vaccination rates among healthcare personnel in US hospitals.
design. Descriptive survey.
setting. Nonfederal, short-stay hospitals that provide general medical and surgical services, identified by use of the 2004 AmericanHospital Association Annual Survey Database.
participants. Healthcare personnel from 996 randomly sampled US hospitals stratified by region and bed size.
methods. A self-administered questionnaire was distributed in 2006 to infection control coordinators to gather data on policies andpractices related to the provision of the influenza vaccine and on the measurement and reporting of influenza vaccination rates. Descriptivestatistics and associations were calculated, and logistic regression was conducted.
results. The response rate was 56% (ie, 555 of 996 US hospitals responded to the questionnaire). Weighting accounted for samplingdesign and nonresponse. Most hospitals provided the influenza vaccine to employees (100%), credentialed medical staff (ie, independentpractitioners; 94%), volunteers (86%), and contract staff (83%); provision for students and residents was less frequent (58%). Only 69%of hospitals measured vaccination rates (mean coverage rate, 55%). Most hospitals that measured coverage included employees (98%) inthe vaccination rates, whereas contract staff (53%), credentialed medical staff (56%), volunteers (56%), and students and residents (30%)were less commonly included. Among hospitals measuring coverage, 44% included persons for which vaccine was contraindicated, and51% included persons who refused vaccination. After adjustment for region and size, hospitals with vaccination plans written into policy(odds ratio, 2.0 [95% confidence interval, 1.22–7.67]) or that addressed internally reporting coverage (odds ratio, 4.8 [95% confidenceinterval, 2.97–7.66]) were more likely to measure coverage than were hospitals without such plans.
conclusions. Hospitals vary in terms of the groups of individuals included in influenza vaccination coverage measurements. Stan-dardized measures may improve comparability of hospital-reported vaccination rates. Measuring coverage in a manner that facilitatesidentification of occupational groups with low vaccination rates may inform development of targeted interventions.
Infect Control Hosp Epidemiol 2009; 30:1150-1157
From the National Center for Immunization and Respiratory Diseases (M.C.L., F.A.) and the National Center for Preparedness, Detection, and Controlof Infectious Diseases (J.F.P.), Centers for Disease Control and Prevention, Atlanta, Georgia; the Health Research and Educational Trust, American HospitalAssociation (J.Y., G.W.T.), and the Harris School of Public Policy Studies, University of Chicago (G.W.T.), Chicago, Illinois.
Received May 14, 2009; accepted July 13, 2009; electronically published October 23, 2009.� 2009 by The Society for Healthcare Epidemiology of America. All rights reserved. 0899-823X/2009/3012-0004$15.00. DOI: 10.1086/648086
The substantial burden of seasonal influenza, measured interms of morbidity,1 mortality,2 and lost productivity,3 is welldocumented. Healthcare personnel (HCP) can serve as vec-tors for influenza transmission because they are at risk forboth acquiring influenza from patients and transmitting it topatients.4,5 Nosocomial influenza outbreaks in healthcare fa-cilities result in longer stays and greater mortality for pa-tients6-8 and missed work for HCP.8,9 A high rate of influenzavaccination coverage among HCP is associated with reduc-tions in nosocomial influenza among hospitalized patients.10
Despite the proven benefits of vaccination for patients4,11,12
and HCP,7,10,13,14 national influenza coverage rates among HCPhave remained consistently at approximately 40%.15
The Advisory Committee on Immunization Practices(ACIP) and the Healthcare Infection Control Practices Ad-visory Committee (HICPAC) of the Centers for Disease Con-trol and Prevention (CDC) recommend that all HCP receiveinfluenza vaccine annually.16 HCP are defined as all paid orunpaid persons working in a healthcare setting with potentialexposure to infectious materials, a definition that includesvolunteers, contract staff, and students or trainees as well asphysicians and nurses employed by the healthcare facility. TheACIP and HICPAC also recommend that healthcare facili-ties regularly monitor vaccination coverage and provide feed-back on unit-specific or occupation-specific rates to staff andadministration.
This content downloaded from 193.104.110.129 on Tue, 13 May 2014 15:36:44 PMAll use subject to JSTOR Terms and Conditions
influenza vaccination coverage among hcp 1151
In addition to increasing adverse outcomes for patients,influenza outbreaks have significant negative consequencesfor hospitals. Nosocomial influenza outbreaks are costly anddisruptive, resulting in the additional use of diagnostic testsand hospital supplies as well as the suspension of admissions.6,8
A substantial proportion of HCP in hospital units that areaffected by a nosocomial outbreak may require sick leave orfurlough,8,9 reducing available labor and increasing hospitalpersonnel costs. Up to one-quarter of HCP may be infect-ed with influenza during influenza season.7,11 Studies suggestthat HCP frequently work during episodes of respiratory ill-ness,7,17 increasing the likelihood that they will expose vul-nerable patients to influenza. Thus, practices that facilitatethe identification and targeting of HCP groups with low in-fluenza vaccination rates can be expected to have a varietyof beneficial consequences for healthcare facilities and theirstaff and patients.
Process measures such as influenza vaccination coverageamong HCP are increasingly being incorporated into health-care quality reporting initiatives.18 Effective July 1, 2007, theJoint Commission implemented a new accreditation standardthat requires healthcare facilities to measure influenza vac-cination coverage among staff and independent practition-ers.19 The National Quality Forum (NQF), a voluntary con-sensus standards setting organization, has developed recom-mendations to harmonize performance measures on influenzaand pneumococcal vaccinations that will allow vaccination cov-erage measurements to be compared and understood amonghealthcare providers and across healthcare settings.20 A CDC-sponsored measure for influenza vaccination coverage amongHCP applies the ACIP/HICPAC definition of HCP and rec-ommends computing separate rates for HCP who were assessedand vaccinated against influenza, HCP who were assessed butdeclined vaccination, or HCP who were assessed and weredetermined to have contraindications to vaccination.20 Thismeasure received a time-limited endorsement from the NQF(K. Pace, written communication, January 2009).
Our study reports the results of a survey of hospital prac-tices for measuring staff influenza vaccination coverage (here-after referred to as measurement practices) in the year priorto the Joint Commission requirements. Factors associatedwith the measurement of coverage are described, and themeasurement practices are compared to the recommendedpractices and standards described above. This analysis canserve as a baseline for assessing changes in US hospitals’measurement practices after the implementation of the JointCommission requirement.
methods
Setting and Sample Selection
In 2006, the Health Research and Educational Trust of theAmerican Hospital Association conducted a CDC-sponsoredsurvey to collect information on hospital-based influenza pre-vention activities in US hospitals, including processes for
measuring vaccination rates. There were 4,621 nonfederal,short-stay hospitals providing general medical and surgicalservices and general children’s services that were eligible forthis survey. They were identified using the 2004 AmericanHospital Association Annual Survey Database, which containsdata on all US hospitals. Hospitals were stratified into 1 of12 categories based on size (less than 100 beds, 100–300 beds,or more than 300 beds) and census region, and they wererandomly selected from each stratum with equal probabilityand without replacement. The final sample consisted of 996hospitals.
Measures
Survey questionnaires were mailed to each hospital’s chiefexecutive, who was instructed to direct the questionnaire tothe hospital’s infection control coordinator for completion.Respondents had the option of completing a paper ques-tionnaire and returning it by prepaid business reply envelopeor completing the questionnaire online via a password-pro-tected Web site. The project was deemed to be research thatwas exempt from review by the CDC’s institutional reviewboard.
The questionnaire was designed to assess hospital policiesand practices with respect to the provision of the influenzavaccine, the tracking and reporting of the vaccinations given,and the measurement of vaccination coverage among HCPduring the 2005–2006 influenza season. The variables relatedto the provision of the vaccine included (1) what proportionof hospitals provided free, on-site vaccination; (2) which staffgroups were vaccinated on site; (3) what proportion of hos-pitals had plans for annual influenza vaccination; (4) whatproportion of these plans were formalized into hospital pol-icy; and (5) what activities were included in annual vacci-nation plans. The variables related to tracking and reportingincluded the current practices for tracking vaccinations given,which include the types of data collected from staff who werenot vaccinated on site and the reporting of vaccinations tointernal stakeholders.
Our primary outcome of interest was the proportion ofhospitals measuring influenza vaccination coverage amongstaff. Differences in the measurement of vaccination coverageby type of hospital were assessed using the following hospitalcharacteristics: (1) census region (northeast, midwest, south,or Pacific), (2) hospital size (categorized as 0–99 beds vs 100or more beds), (3) teaching status (ie, membership in theCouncil of Teaching Hospitals of the American Medical As-sociation or the Council for Graduate Medical Education),(4) hospital ownership (public, for profit, or not for profit),and (5) urban or rural status (ie, location in a metropolitanstatistical area). Specific methods of measuring coverage (ie,which staff groups were included or excluded from measuredrates) were also assessed.
The questionnaire referred to hospital staff in the mostgeneral sense, regardless of their position, contact with pa-
This content downloaded from 193.104.110.129 on Tue, 13 May 2014 15:36:44 PMAll use subject to JSTOR Terms and Conditions

1152 infection control and hospital epidemiology december 2009, vol. 30, no. 12
table 1. Characteristics of Responding Hospitals
CharacteristicNo. (%) of
responding hospitals
RegionNortheast 88 (13)Midwest 193 (30)South 189 (39)Pacific 85 (19)
Location in a metropolitan statistical areaa
Rural 247 (44)Urban 308 (56)
Bed size0–99 beds 257 (47)x100 beds 298 (53)
Teaching hospitalYes 88 (15)No 467 (85)
OwnershipNot for profit 364 (62)Private, for profit 62 (15)Public 129 (24)
note. Overall, there were 555 hospitals that responded. Counts are un-weighted. Percentages are weighted using sampling and nonresponse weights(see Methods). Percentages may not add to 100 because of rounding.a Defined using the metro/micro Indicator Code from the 2005 Area Re-source File. “Rural” includes codes for Not Metro and Micro areas; “urban”includes codes for Metro areas.
tients, or status with the hospital (such as direct employees,clinical staff, support staff, or volunteers). Staff groups weredefined as follows: (1) direct employees include any staffdirectly employed by the hospital or on hospital payroll whohas at least limited contact with patients, patient-care areas,or patient-care items; (2) contract staff include any staff con-tracted to work in the hospital individually or through anagency or other organization (ie, not on the hospital payroll);and (3) credentialed medical staff include attending or ad-mitting physicians and independent licensed practitionerswho are credentialed by the hospital and/or health system’smedical staff policy and who are not on the hospital payroll.The questionnaire also asked about vaccination of studentsor other trainees, medical residents, and volunteers.
Data Analysis
Associations between the primary outcome of interest, hos-pital characteristics, and the variables related to the provisionof the vaccine and the tracking and reporting of vaccinationwere assessed using the Pearson x2 test for independence.Logistic regression models were fitted to identify factors as-sociated with measuring vaccination coverage rates. Adjustedmodels controlled for size and census region and assessed theinteraction between size and region. Statistical significancewas evaluated using the Wald x2 P value for each variable.Variables with a P value of greater than .05 were removedfrom the model by use of backward elimination, in order ofdecreasing significance, until the model contained only thosevariables significantly related to the outcome. Risk statisticswere estimated by use of the adjusted odds ratio (OR) and95% confidence interval (CI).
Statistical analyses were performed using SAS, version 9.1(SAS). Sampling and nonsampling weights were used in allanalyses to account for the stratified sampling design and non-response. To incorporate weights and obtain correct varianceestimates, SAS procedures SURVEYFREQ and SURVEYLO-GISTIC were used.
results
Of the 996 hospitals surveyed, 555 (56%) responded. Allanalyses were restricted to 544 hospitals that provided thevaccine on site. Of these, 541 provided the influenza vaccinefree of charge, and 23 provided the vaccine for a fee (responsesnot exclusive).
Characteristics of Hospitals That Responded
The hospitals that responded and those that did not respondvaried significantly by region and hospital ownership (P !
; data not shown). The hospitals that did not respond to.001the survey were more likely to be in the southern or Pacificregions or to be for-profit hospitals. After weighting for sam-pling and nonresponse, the hospitals that responded to thesurvey (Table 1) were not significantly different from the
4,621 hospitals eligible for the survey, regardless of whetherthey were sampled.
Provision of Vaccine and Vaccination Planning, Tracking,and Reporting
Because different numbers of responding hospitals providedresponses that were useful for analysis (ie, “yes or no,” asopposed to “don’t know”), the total number of respondinghospitals changes for each question. During the 2005–2006influenza season, all responding hospitals provided vaccina-tions to their direct employees (all 530 responding hospitals[100%]), and most provided vaccines to credentialed medicalstaff (487 [94%] of 520 responding hospitals), contract staff(419 [83%] of responding 506 hospitals), and volunteers (424[86%] of 500 responding hospitals) (Table 2). Provision ofvaccine to students and medical residents was less common(232 [58%] of 394 responding hospitals). Nearly all hospitalshad a vaccination plan for providing annual influenza vac-cinations to staff; the majority of these reported that this planhad been in place for over 5 years (374 [77%] of 479 re-sponding hospitals) and was written into hospital policy (333[73%] of 465 responding hospitals). For 285 (60%) of 466responding hospitals, the plan addressed measuring vacci-nation rates among staff.
Most hospitals (484 [92%] of 528 responding hospitals)tracked the number of vaccines given; approximately one-half of these tracked vaccinations by unit or by type of staff.Fewer than 20% of hospitals collected documentation from
This content downloaded from 193.104.110.129 on Tue, 13 May 2014 15:36:44 PMAll use subject to JSTOR Terms and Conditions

table 2. Vaccination Policies and Practices of Hospitals Offering the Influ-enza Vaccine on Site
CharacteristicProportion (%) of
responding hospitals
Plan for providing vaccine to staff 509/531 (95)Addresses collecting vaccination dataa 272/467 (58)Addresses measuring staff vaccinationa 285/466 (60)Addresses internally reporting vaccinationa 305/464 (65)Written into hospital policya 333/465 (73)
Hospital policy for staff vaccinationRequire or strongly encourage 291/518 (56)Recommend 133/518 (26)Does not specify 94/518 (18)
Type of HCP offered influenza vaccineDirect employees 530/530 (100)Contract staff 419/506 (83)Credentialed medical staff 487/520 (94)Students or trainees and medical residents 232/394 (58)Volunteers 424/500 (86)
Hospital tracks vaccinations given on site 484/528 (92)On-site influenza vaccinations tracked
For staff overall 451/467 (96)By type of staff 192/393 (48)By department or unit 213/396 (54)
Hospital measures staff vaccination 368/529 (69)Vaccination rate(s) measuredb
Single rate for hospitalc 321/361 (88)Separate rates, by type of staffc 71/361 (20)
Unvaccinated staff included in ratesb
Staff with contraindications to vaccination 142/326 (44)Staff refusing vaccine 167/331 (51)
Staff types included in measurement of ratesb
Direct employees 321/327 (98)Contract staff 146/276 (53)Credentialed medical staff 163/287 (56)Students or trainees and medical residents 67/220 (30)Volunteers 156/286 (56)
Collected data for staff not vaccinated on siteMedical contraindication forms 91/493 (19)Signed declination forms 78/501 (16)Vaccine Information Statements for vaccinations given off site 90/479 (19)
Internal vaccination reports developed 360/512 (70)Groups receiving vaccination reports
Senior management 373/468 (79)Board of trustees 161/358 (45)Unit or department supervisors 266/442 (60)Unit or department staff 174/400 (44)Infection control committee 484/515 (94)Patient safety committee 292/448 (65)
note. Because different numbers of responding hospitals provided responses that wereuseful for analysis (ie, “yes or no,” as opposed to “don’t know”), the total number ofresponding hospitals changes for each question. Counts are unweighted; percentages areweighted using sampling and nonresponse weights (see Methods). Staff groups are definedin Methods. In brief, direct employees are staff on hospital payroll; contract staff are staffcontracted to work in the hospital individually or through an agency; and credentialedmedical staff are attending or admitting physicians and independent practitioners.a Only hospitals responding that they had a plan for providing influenza vaccine to staffwere asked this question.b Only hospitals responding that they measured staff influenza vaccination coverage wereasked this question.c Excluded 7 hospitals that measure vaccination rates but do not know whether theymeasure a single rate or separate rates by type of staff.
This content downloaded from 193.104.110.129 on Tue, 13 May 2014 15:36:44 PMAll use subject to JSTOR Terms and Conditions

1154 infection control and hospital epidemiology december 2009, vol. 30, no. 12
table 3. Measurement of Staff Influenza Vaccination Coverageby Hospital Characteristics
Characteristic
No. (%)of hospitals
measuring coverage P
Ownership .018Public 75 (59)Not for profit 257 (73)Private, for profit 36 (66)
Location in a metropolitan statistical area .781Rural 162 (68)Urban 206 (69)
Bed size .0180–99 beds 154 (64)x100 beds 214 (73)
Teaching hospital .381No 304 (68)Yes 64 (72)
Region .006Northeast 65 (75)Midwest 141 (75)South 106 (61)Pacific 56 (69)
note. Overall, there were 368 hospitals that reported measuring staffinfluenza vaccination. Counts are unweighted. Percentages are weightedusing sampling and nonresponse weights (see Methods).
staff members who were not vaccinated on site; documen-tation included medical forms from staff with contraindi-cations (91 [19%] of 493 responding hospitals), signed dec-lination forms from staff who refused vaccine (78 [16%] of501 responding hospitals), or Vaccine Information Statementsfrom staff vaccinated off site (90 [19%] of 479 respondinghospitals) (Table 2).
Although most hospitals tracked vaccinations, only 368(69%) of 529 responding hospitals measured influenza vac-cination coverage. The mean coverage rate reported was 55%.Nearly all hospitals measuring coverage (321 [98%] of 327responding hospitals) included direct employees in their cov-erage rates. Hospitals less commonly included credentialedmedical staff, contract staff, volunteers, or students and res-idents in coverage rates. Only 71 (20%) of 361 hospitals mea-suring coverage measured separate rates for different typesof staff. Among hospitals measuring coverage, 142 (44%) of326 hospitals included persons with contraindications for vac-cination, and 167 (51%) of 331 hospitals included personswho refused vaccination in their coverage rates.
There were 360 (70%) of 512 responding hospitals thatdeveloped vaccination coverage reports for internal review;for these hospitals, the infection control committee was theusual recipient. Other groups that commonly received reportsincluded senior management, patient safety committees, andunit supervisors. Less than half of the hospitals reported thattheir board of trustees or staff received vaccination reports.
Variability in Measuring Vaccination Coverage
We examined the relationships between measuring vaccina-tion rates, hospital demographic characteristics, and the var-iables presented in Table 2. The ownership, bed size, andgeographic region of a hospital were significantly associatedwith measuring vaccination rates (Table 3). A lower propor-tion of public hospitals reported measuring vaccination rates,compared with not-for-profit and for-profit hospitals (P !
). There were fewer small hospitals (ie, those with less than.05100 beds) than large hospitals that reported measuring vac-cination rates ( ), and hospitals in the south were lessP ! .05likely than hospitals located elsewhere to report measuringvaccination rates ( ).P ! .01
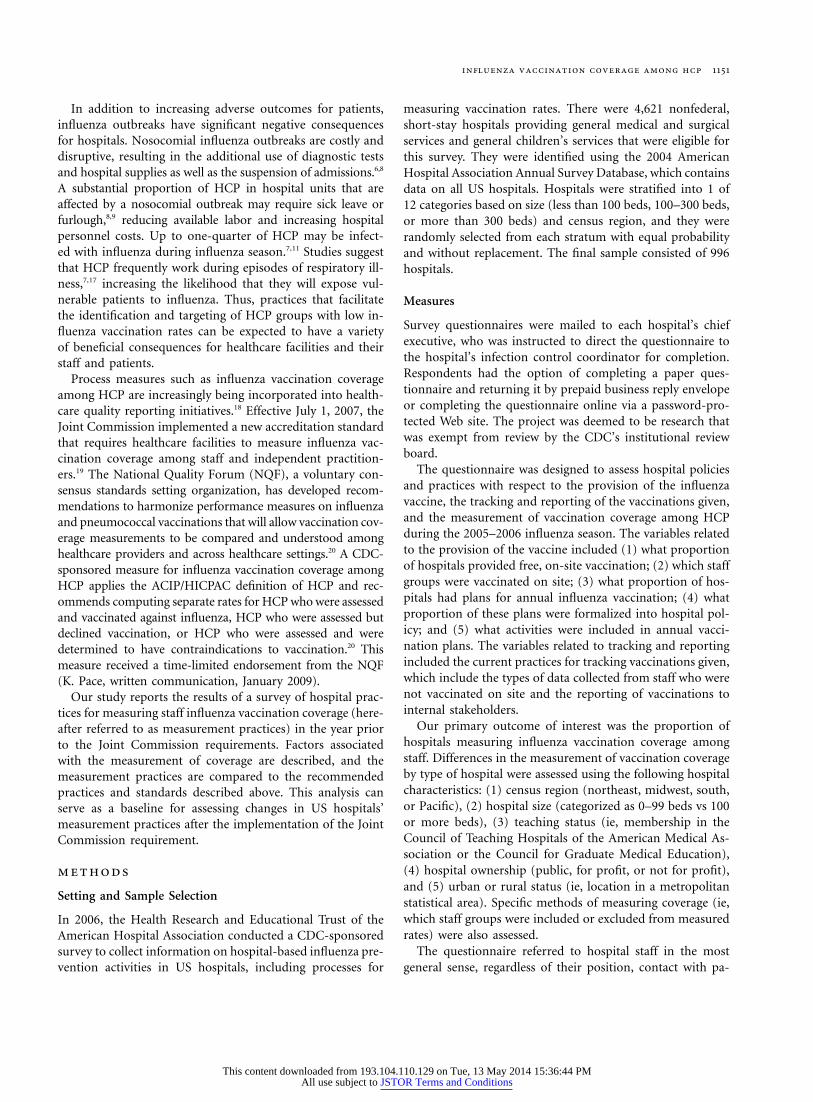
Certain features of each hospital’s vaccination plan andpolicy were also significantly associated with measuring vac-cination rates (Table 4). Hospitals with vaccination plans thataddressed collecting data on staff vaccination status weremore likely to measure vaccination rates ( ) as wereP ! .001hospitals with policies that explicitly recommended vacci-nation for all staff ( ).P ! .05
On the basis of the results of x2 analyses, 4 “policy” variableswere eligible for logistic regression analysis: (1) whether thevaccination plan was written into hospital policy, (2) whetherthe vaccination plan addressed collecting data on staff vacci-nation status, (3) whether the vaccination plan addressed in-ternal reporting of vaccination rates, and (4) the strength of
the recommendation for vaccinating all staff in the hospital’spolicy. All variables were assessed for collinearity. Althoughpolicy variables were somewhat correlated, regression diag-nostics (tolerance and variance inflation) did not indicate thatinclusion of correlated variables biased our model. After con-trolling for size and region, hospitals that had written theirvaccination plans into hospital policy were more likely to mea-sure rates than were hospitals that had not (OR, 2.0 [95% CI,1.22–7.67]). In addition, hospitals having plans that addressinternally reporting vaccination coverage rates were more likelyto measure coverage rates than were hospitals that did not havesuch plans (OR, 4.8 [95% CI, 2.97–7.66]). Hospital ownership,strength of recommendation for vaccinating all staff, and col-lection of data on staff vaccination status were not significantlyassociated with measurement of vaccination coverage rates inmultivariable analysis.
discussion
Although all hospitals in our study provided influenza vaccineto their staff, nearly one-third of surveyed hospitals did notmeasure staff vaccination coverage in 2006. Hospitals withstaff vaccination plans that were written into hospital policyand hospitals with plans that addressed internal reporting ofstaff influenza vaccination rates were most likely to measurecoverage. Even among hospitals that did measure influenzavaccination coverage, few hospitals calculated separate cov-erage rates for different types of staff. Because measuring staffinfluenza vaccination coverage is now included in the JointCommission accreditation standards,19 this analysis can serveas a baseline for assessing the speed and extent of changes
This content downloaded from 193.104.110.129 on Tue, 13 May 2014 15:36:44 PMAll use subject to JSTOR Terms and Conditions
influenza vaccination coverage among hcp 1155
table 4. Measurement of Staff Influenza Vaccination Coverage by Hospital Vac-cination Plan and Policy Features
Plan or policy
Proportion (%)of hospitals
measuring coverage P
Plan addresses collecting vaccination data !.001Yes 208/328 (77)No 120/328 (61)
Plan addresses reporting vaccination internally !.001Yes 253/333 (83)No 80/333 (51)
Plan written into hospital policy !.001Yes 244/326 (74)No 82/326 (58)
Policy for vaccination of staff .011Required, strongly encouraged, or recommended 297/351 (70)Does not specify 54/351 (58)
note. Because different numbers of responding hospitals provided responses that wereuseful for analysis (ie, “yes or no,” as opposed to “don’t know”), the total number of respondinghospitals changes for each question. Counts are unweighted; percentages are weighted usingsampling and nonresponse weights (see Methods).
in US hospitals’ measurement practices after implementationof the Joint Commission requirement.
It is often said, in public health as in other areas, that whatgets measured, gets done. The Joint Commission, the Na-tional Foundation for Infectious Diseases, the Society forHealthcare Epidemiology of America, and the HICPAC allrecommend measurement of vaccination rates as an impor-tant component of healthcare facility influenza vaccinationprograms.16,19,21,22 Of equal importance to the fact of mea-surement itself are the methods used for measurement (ie,the measurement practices). Over one-third of hospitals inour study did not include contract staff, attending physicians,volunteers, or students and residents in their influenza vac-cination coverage measurements, although all of these groupsare likely to come into contact with patients, and all areincluded in the ACIP/HICPAC definition of HCP. Vaccinationcoverage has been documented to vary dramatically by spe-cialty,17 so coverage should be measured by occupation or byhospital unit to effectively target interventions for groups withsuboptimal coverage.5 In addition, Joint Commission stan-dards specifically include influenza vaccination of licensed in-dependent practitioners; therefore, such practitioners shouldalso be included in coverage measurements to evaluate thesuccess of a facility’s vaccination program.
Standardized measurements of staff influenza vaccinationcoverage can facilitate comparisons between different typesof healthcare facilities, as well as allow for gathering moredetailed information about measurement practices in indi-vidual facilities. The NQF-endorsed CDC performance mea-sure on HCP influenza vaccination coverage specifies thatinformation be collected on influenza vaccination received atthe facility and elsewhere for paid and unpaid persons work-ing in healthcare settings, and that vaccine declination and
contraindications to vaccination be measured and reportedseparately. However, a substantial proportion of hospitals inour study did not include contract employees, trainees, orvolunteers in their coverage measurements. In addition, ap-proximately one-half of the hospitals that measured coverageindicated they did not include in their coverage rates em-ployees with contraindications for vaccination or who refusedvaccination. Only 90 (19%) of 479 studied hospitals reportedgathering Vaccine Information Statements from persons whowere not vaccinated on site, to track HCP who received thevaccine at other locations. The use of declination forms,which can also be used to provide information on whethervaccination was received elsewhere, was not often reported.Not all hospital staff who receive the influenza vaccine arevaccinated by staff from occupational health services23; there-fore, data from multiple sources must be gathered to accu-rately estimate coverage and ensure that HCP caring for high-risk patients are vaccinated.22 Our findings indicate that asubstantial proportion of hospitals will need to develop rel-evant policies and procedures in order to report influenzavaccination coverage in a standardized manner.
The Healthy People 2010 objective for HCP influenza vac-cination (ie, objective 14-29g) is 60% coverage nationally24;this goal is unlikely to be attained given current HCP vac-cination rates. The mean self-reported coverage rate for hos-pitals in our study was 55%, which is similar to the 2007national average of 56% among hospital-based HCP; how-ever, the coverage rate among HCP in all settings is 46%nationally (National Health Interview Survey 2007, unpub-lished data). Only one-half of the hospitals in our study (ap-proximately three-quarters of those who measured coverage)actually reported their coverage rate. The methods for mea-suring coverage among the hospitals in our study differed
This content downloaded from 193.104.110.129 on Tue, 13 May 2014 15:36:44 PMAll use subject to JSTOR Terms and Conditions
1156 infection control and hospital epidemiology december 2009, vol. 30, no. 12
from the survey method that is used to assess HCP influenzavaccination nationally, so the similarity in coverage rates isnotable. However, it is difficult to interpret the coverage ratesreported in our study because of the substantial variation inwhether responding hospitals included certain staff groups orunvaccinated persons in their coverage measurements.
Another factor that may impact the extent to which health-care facilities measure influenza vaccination coverage is thepresence of state laws related to HCP influenza vaccination.As of May 2009, there were 3 states that required hospitalemployees to be vaccinated against influenza, and there wereanother 3 states that required hospitals to offer the influenzavaccine to employees.25 Of these 6 states, at least 4 also re-quired hospitals to make reports of employee immuniza-tion status to the state health department. The effect of thesestate laws on changes in measurement practices needs to beassessed.
The results of the present study are subject to certain lim-itations. First, the 56% of hospitals responding to our surveymay not be representative of all eligible hospitals. We usedweights to adjust for survey nonresponse, which reduces butdoes not eliminate bias. Second, we did not assess the valid-ity of self-reported information from survey respondents.Third, because our survey represents cross-sectional infor-mation, we are unable to say whether the factors associat-ed with measuring influenza vaccination coverage rates arecausal in nature.
Substantial variation in measurement practices highlightsthe need for standardized measures to ensure comparabilityof reported vaccination rates. The NQF’s time-limited en-dorsement of one such measure provides a rationale for eval-uating the feasibility and utility of this measure in both hos-pitals and other healthcare settings nationwide. The resultsof these evaluations could help identify revisions to the mea-sure that need to be made as a condition of longer-term en-dorsement. Research is also needed on the impact of the JointCommission requirement19 on measurement practices relatedto vaccination coverage in healthcare facilities. Although therequirement does not specify methods for measurement ofcoverage, it may lead to greater uniformity in measurementpractices as healthcare facilities look to existing national guide-lines to inform institutional policies for the measurement ofcoverage.
Use of recently developed computer-based26 or Web-basedtools, like the CDC’s National Healthcare Safety Network,27
to measure influenza vaccination rates among hospital staffmay facilitate the calculation of comparable vaccination ratesamong diverse healthcare facilities. Ultimately, successfulmethods for measuring influenza vaccination coverage willbe those that allow hospitals and other healthcare facilitiesto identify undervaccinated HCP and target appropriate in-terventions to increase coverage among these individuals,protecting their workforces and their most vulnerable pa-tients from influenza.
acknowledgements
Financial support. This project was made possible by a cooperative agree-ment (award TS-0990) between the CDC and the Association for PreventionTeaching and Research.
Potential conflicts of interest. All authors report no conflicts of interestrelevant to this article.
Address reprint requests to Megan C. Lindley, MPH, National Center forImmunization and Respiratory Diseases, CDC, 1600 Clifton Road, NE, Mail-stop E-52, Atlanta, GA 30333 ([email protected]).
Presented in part: 19th Annual Scientific Meeting of the Society for Health-care Epidemiology of America; San Diego, California; March 19–22, 2009(Abstract 269).
The findings and conclusions in this report are those of the authors anddo not necessarily represent the official position of the CDC, the Associationfor Prevention Teaching and Research, or the American Hospital Association.
references
1. Thompson WW, Shay DK, Weintraub E, et al. Influenza-associated hos-pitalizations in the United States. JAMA 2004; 292:1333–1340.
2. Thompson WW, Shay DK, Weintraub E, et al. Mortality associated withinfluenza and respiratory syncytial virus in the United States. JAMA2003; 289:179–186.
3. Molinari NM, Ortega-Sanchez IR, Messonnier ML, et al. The annualimpact of seasonal influenza in the US: measuring disease burden andcosts. Vaccine 2007; 25:5086–5096.
4. Carman WF, Elder AG, Wallace LA, et al. Effects of influenza vaccinationof health-care workers on mortality of elderly people in long-term care:a randomised controlled trial. Lancet 2000; 355:93–97.
5. Association for Professionals in Infection Control and Epidemiology(APIC). APIC position paper: influenza immunization of healthcarepersonnel. 2008. Available at: http://www.apic.org/AM/Template.cfm?SectionpHome1&TEMPLATEp/CM/ContentDisplay.cfm&CONTENTFILEIDp11049. Accessed December 15, 2008.
6. Bridges CB, Kuehnert MJ, Hall CB. Transmission of influenza: im-plications for control in health care settings. Clin Infect Dis 2003; 37:1094–1101.
7. Wilde JA, McMillan JA, Serwint J, et al. Effectiveness of influenza vac-cine in healthcare professionals: a randomized trial. JAMA 1999; 281:908–913.
8. Sartor C, Zandotti C, Romain F, et al. Disruption of services in an internalmedicine unit due to a nosocomial influenza outbreak. Infect ControlHosp Epidemiol 2002; 23:615–619.
9. Horcajada JP, Pumarola T, Martinez JA, et al. A nosocomial outbreakof influenza during a period without influenza epidemic activity. EurRespir J 2003; 21:303–307.
10. Salgado CD, Giannetta ET, Hayden FG, Farr BM. Preventing nosocomialinfluenza by improving the vaccine acceptance rate of clinicians. InfectControl Hosp Epidemiol 2004; 25:923–928.
11. Potter J, Stott DJ, Roberts MA, et al. Influenza vaccination of healthcareworkers in long-term-care hospitals reduces the mortality of elderly pa-tients. J Infect Dis 1997; 175:1–6.
12. Hayward AC, Harling R, Wetten S, et al. Effectiveness of an influenzavaccine programme for care home staff to prevent death, morbidity, andhealth service use among residents: cluster randomised controlled trial.BMJ 2006; 333:1241–1246.
13. Saxen H, Virtanen M. Randomized, placebo-controlled double blindstudy on the efficacy of influenza immunization on absenteeism ofhealthcare workers. Pediatr Infect Dis J 1999; 18:779–783.
14. Nichol K, Lind A, Margolis K, et al. The effectiveness of vaccinationagainst influenza in healthy working adults. N Engl J Med 1995; 333:889–893.
This content downloaded from 193.104.110.129 on Tue, 13 May 2014 15:36:44 PMAll use subject to JSTOR Terms and Conditions
influenza vaccination coverage among hcp 1157
15. Walker FJ, Singleton JA, Lu P, Wooten KG, Strikas RA. Influenza vac-cination of healthcare workers in the United States, 1989–2002. InfectControl Hosp Epidemiol 2006; 27:257–265.
16. Pearson ML, Bridges CB, Harper SA; Healthcare Infection Control Prac-tices Advisory Committee (HICPAC); Advisory Committee on Immu-nization Practices (ACIP). Influenza vaccination of health-care person-nel: recommendations of the Healthcare Infection Control PracticesAdvisory Committee (HICPAC) and the Advisory Committee on Im-munization Practices (ACIP) (published correction appears in MMWRRecomm Rep 2006; 55:252). MMWR Recomm Rep 2006; 55(RR-2):1–16.
17. Lester RT, McGeer A, Tomlinson G, Detsky AS. Use of, effectiveness of,and attitudes regarding influenza vaccine among house staff. Infect Con-trol Hosp Epidemiol 2003; 24:839–844.
18. McKibben L, Horan T, Tokars JI, et al. Guidance on public reporting ofhealthcare-associated infections: recommendations of the Healthcare In-fection Control Practices Advisory Committee. Am J Infect Control 2005;33:217–226.
19. New infection control requirement for offering influenza vaccination tostaff and licensed independent practitioners. Jt Comm Perspect 2006; 26:10–11.
20. National Quality Forum (NQF). National voluntary consensus standardsfor influenza and pneumococcal immunizations. A consensus report.Executive summary. Available at: http://www.qualityforum.org/Publications/2008/12/Executive_Summary_for_Immunizations_Report.aspx. Accessed October 9, 2009.
21. National Foundation for Infectious Diseases. Improving influenza vac-
cination rates in health care workers: strategies to increase protectionfor workers and patients. Bethesda, MD. 2004. Available at: http://www.nfid.org/pdf/publications/hcwmonograph.pdf. Accessed February2, 2009.
22. Talbot TR, Bradley SF, Cosgrove SE, Ruef C, Siegel JD, Weber DJ. In-fluenza vaccination of healthcare workers and vaccine allocation forhealthcare workers during vaccine shortages. Infect Control Hosp Epi-demiol 2005; 26:882–890.
23. Bearman G, Fuentes L, Vorenkamp JVL, Drusin LM. Vaccination with-out documentation: influenza immunization among medical residentsat a tertiary-care medical center. Infect Control Hosp Epidemiol 2003; 24:626–628.
24. US Department of Health and Human Services. Healthy people 2010.Available at http://www.health.gov/healthypeople. Accessed February 3,2009.
25. Centers for Disease Control and Prevention. State immunization lawsfor healthcare workers and patients. Last updated May 28, 2009. Availa-ble at: http://www2a.cdc.gov/nip/StateVaccApp/statevaccsApp/default.asp.Accessed July 8, 2009.
26. Melia M, O’Neill S, Calderon S, et al. Development of a flexible, com-puterized database to prioritize, record, and report influenza vaccinationrates for healthcare personnel. Infect Control Hosp Epidemiol 2009; 30:361–369.
27. Centers for Disease Control and Prevention. National Healthcare SafetyNetwork (NHSN). About NHSN. Last updated April 7, 2009. Availableat: http://www.cdc.gov/nhsn/about.html. Accessed July 8, 2009.
This content downloaded from 193.104.110.129 on Tue, 13 May 2014 15:36:44 PMAll use subject to JSTOR Terms and Conditions