Embed Size (px)
Citation preview
Measure Strain Distribution Using Digital Image Correlation (DIC) for Tensile Tests
Final Report
By
Dr. Lianxiang Yang (PI)
Dr. Lorenzo Smith (Co-PI)
Mr. Abhishek Gothekar (Graduate Student of Dr. Yang)
Mr. Xu Chen (Graduate Student of Dr. Yang)
Dept. of Mechanical Engineering
Oakland University
2200 N. Squirrel Road, Rochester, MI 48309
Tel: 248 370 2283
Submitted to:
The Advanced High Strength Steel Stamping Team of the Auto/Steel Partnership (A/SP)
2000 Town Center, Suite 320, Southfield, MI 48075-1123
January 30, 2010
Table of Content
1. Introduction 3
2. Measurement List and Appendix List 4
3. Basic Theory of Digital Image Correlation 5
4. Measuring Setup Using DIC and Extensometer 9
5. Measuring Result Using Extensometer 10
6. Measuring Result Using DIC 12
7. Effect of Gauge Length 14
8. Comparison of Different Materials 18
8.1. Comparison of all Materials tested 18 8.2. Comparison of DP600 and HSLA350 19 8.3. Comparison of DP780 DP780HY and TRIP780 20 8.4. Comparison of DP600 DP780 and DP980 21 8.5. Comparison of DP780-R and DP780-T 22 8.6. Comparison of DP780-R Higher Strain Rate (10 Inch per Minute)
and Static (1 Inch per Minute) 23 8.7. Comparison of TRIP780-R Higher Strain Rate (10 Inch per Minute)
and Static (1 Inch per Minute) 23
9. Conclusion 24
10. References 24
2
1. Introduction The automobile industry has an increasing demand for lightweight components, improved product performance, efficiency and increased safety. To optimize the design and manufacturing of these components, detailed measurement of critical material properties such as strain limit, strength coefficients, anisotropy coefficients et al. are required. The most commonly used method for finding the material properties is tensile test with extensometer. But this system only provides an average strain over the specimen gauge length and is not applicable to post diffuse necking. The Digital Image Correlation (DIC) is a state of art technique that can be used for accurate strain measurement. Because of its capability for fast data acquisition, this technique is well suited for the characterization of material properties both in the elastic and plastic ranges. It also has advantages of full field, non-contact, and considerately high accuracy for displacement and strain measurements. The modern manufacturing industry requires higher strength materials for more economical and light weight products. These new materials have to be tested to find the material properties required for production. Tensile test data such as stress-strain relation is critical for material processing, such as stretching, stamping, bending and so on. Most often, the traditional extensometer technique is used to measure the tensile strain between two points which provides average strain over an area. It is practically difficult to find the strain information at position of necking using the tensile test machine with extensometer. The measured strain is over the whole measured area between the extensometer probes. DIC system measures the full-range strain distribution during the tensile test. This report will investigate the whole field lagrangian strain measurement with DIC in tensile test and compare the measurement result of DIC with the traditional method. Advanced High-Strength Steel (AHSS) materials including HLSA 350, DP600, DP780, DP780HY, TRIP780, and DP980 were tested. In this report, measurement of DP980 is used as an example to demonstrate the test process. The results for other materials are shown in the appendices.
3
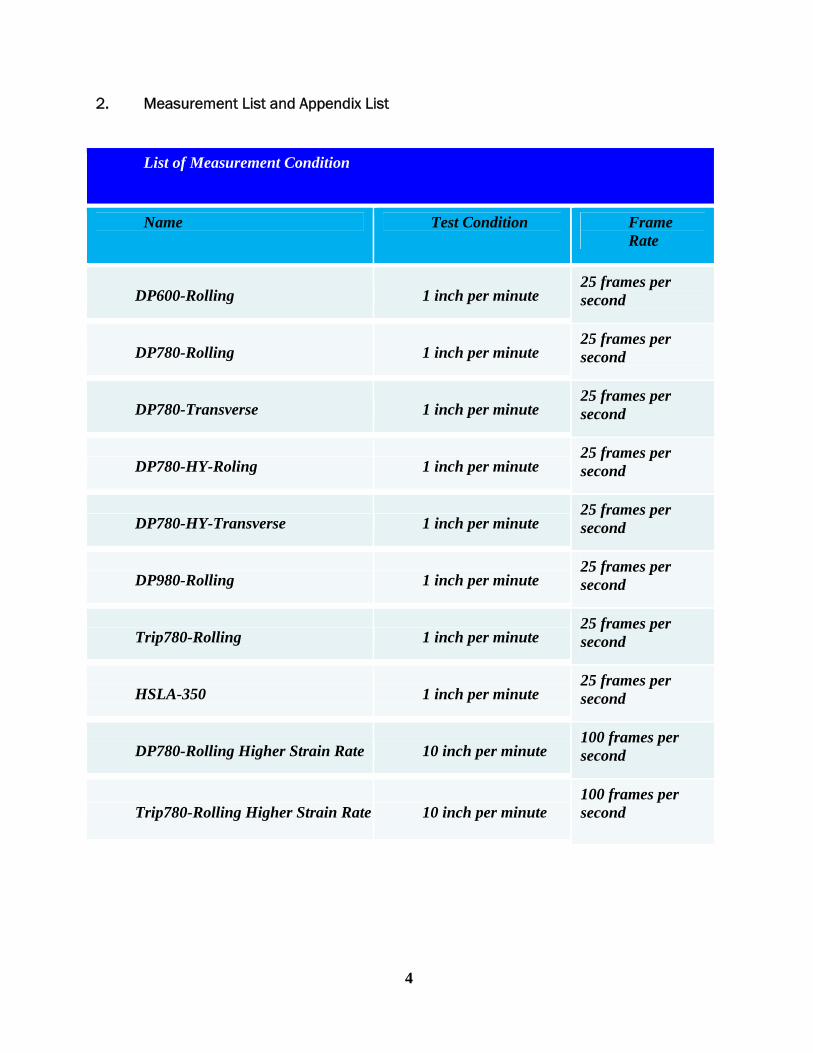
2. Measurement List and Appendix List
List of Measurement Condition
Name Test Condition Frame Rate
DP600-Rolling 1 inch per minute 25 frames per second
DP780-Rolling 1 inch per minute 25 frames per second
DP780-Transverse 1 inch per minute 25 frames per second
DP780-HY-Roling 1 inch per minute 25 frames per second
DP780-HY-Transverse 1 inch per minute 25 frames per second
DP980-Rolling 1 inch per minute 25 frames per second
Trip780-Rolling 1 inch per minute 25 frames per second
HSLA-350 1 inch per minute 25 frames per second
DP780-Rolling Higher Strain Rate 10 inch per minute 100 frames per second
Trip780-Rolling Higher Strain Rate 10 inch per minute 100 frames per second
4
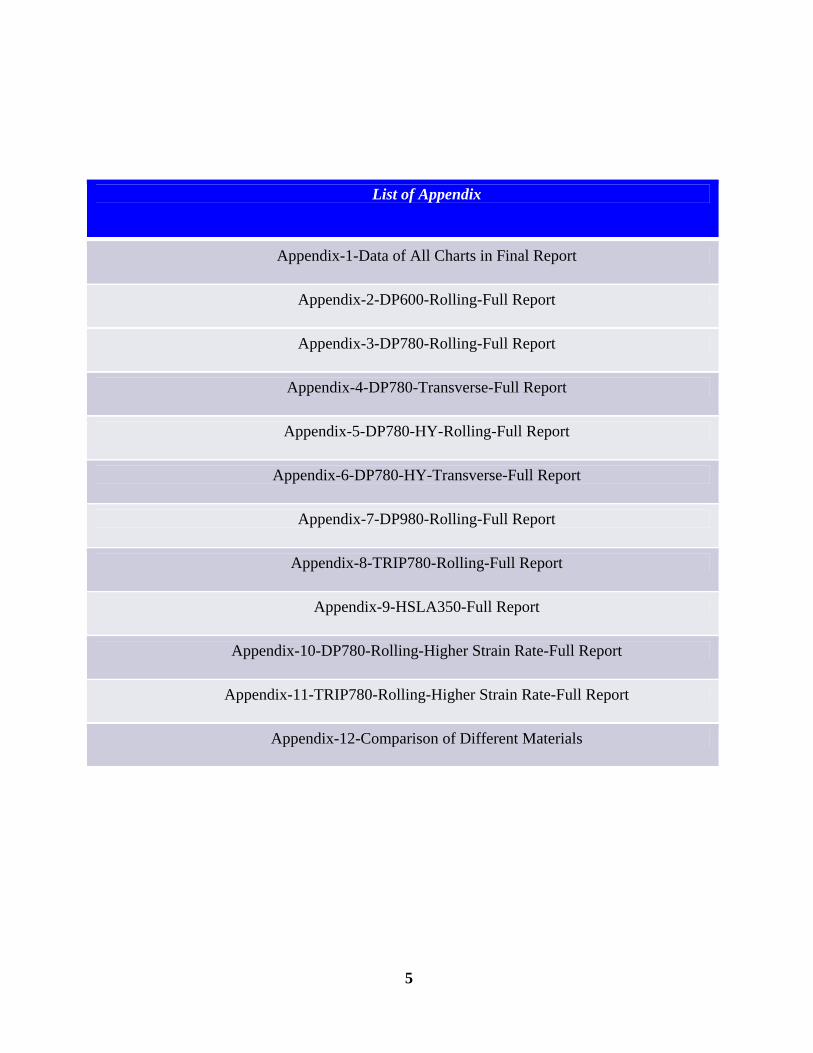
List of Appendix
Appendix-1-Data of All Charts in Final Report
Appendix-2-DP600-Rolling-Full Report
Appendix-3-DP780-Rolling-Full Report
Appendix-4-DP780-Transverse-Full Report
Appendix-5-DP780-HY-Rolling-Full Report
Appendix-6-DP780-HY-Transverse-Full Report
Appendix-7-DP980-Rolling-Full Report
Appendix-8-TRIP780-Rolling-Full Report
Appendix-9-HSLA350-Full Report
Appendix-10-DP780-Rolling-Higher Strain Rate-Full Report
Appendix-11-TRIP780-Rolling-Higher Strain Rate-Full Report
Appendix-12-Comparison of Different Materials
5
3. Basic Theory of Digital Image Correlation
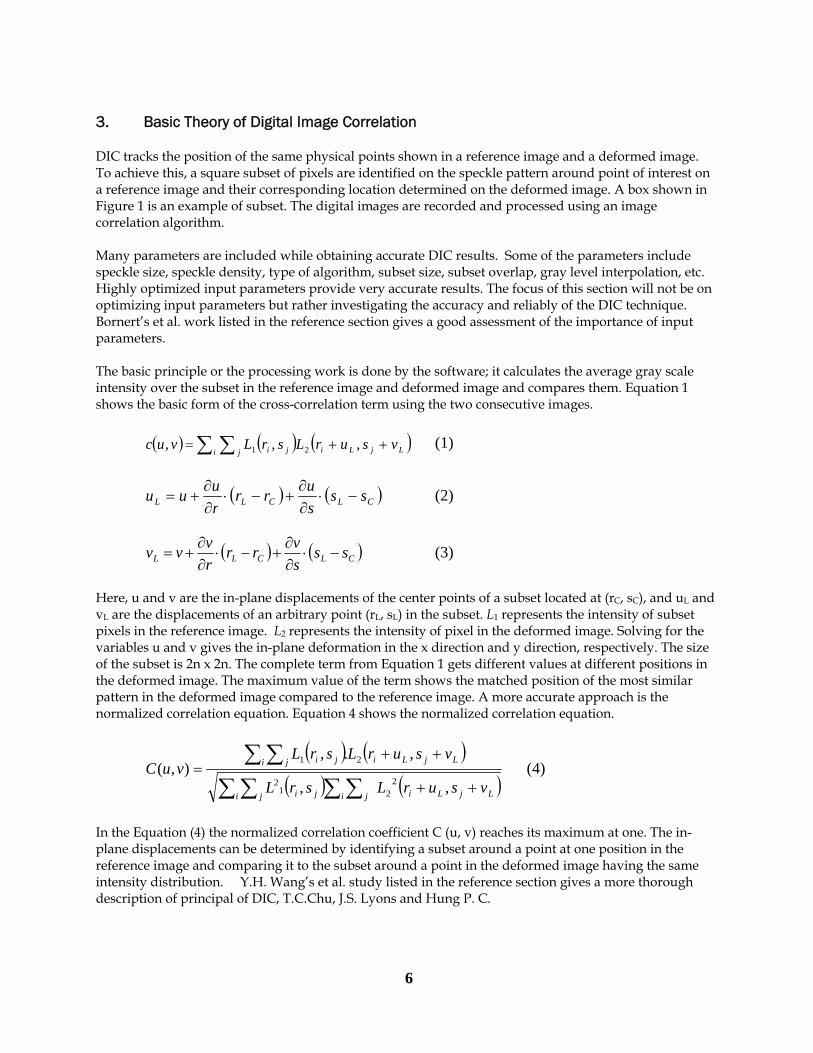
DIC tracks the position of the same physical points shown in a reference image and a deformed image. To achieve this, a square subset of pixels are identified on the speckle pattern around point of interest on a reference image and their corresponding location determined on the deformed image. A box shown in Figure 1 is an example of subset. The digital images are recorded and processed using an image correlation algorithm. Many parameters are included while obtaining accurate DIC results. Some of the parameters include speckle size, speckle density, type of algorithm, subset size, subset overlap, gray level interpolation, etc. Highly optimized input parameters provide very accurate results. The focus of this section will not be on optimizing input parameters but rather investigating the accuracy and reliably of the DIC technique. Bornert’s et al. work listed in the reference section gives a good assessment of the importance of input parameters. The basic principle or the processing work is done by the software; it calculates the average gray scale intensity over the subset in the reference image and deformed image and compares them. Equation 1 shows the basic form of the cross-correlation term using the two consecutive images. ( ) ( ) ( )∑ ∑ ++=
i j LjLiji vsurLsrLvuc ,,, 21 (1)
( ) ( CLCLL sssurr )
ruuu −⋅
∂∂
+−⋅∂∂
+= (2)
( ) ( )CLCLL sssvrr
rvvv −⋅
∂∂
+−⋅∂∂
+= (3)
Here, u and v are the in-plane displacements of the center points of a subset located at (rC, sC), and uL and vL are the displacements of an arbitrary point (rL, sL) in the subset. L1 represents the intensity of subset pixels in the reference image. L2 represents the intensity of pixel in the deformed image. Solving for the variables u and v gives the in-plane deformation in the x direction and y direction, respectively. The size of the subset is 2n x 2n. The complete term from Equation 1 gets different values at different positions in the deformed image. The maximum value of the term shows the matched position of the most similar pattern in the deformed image compared to the reference image. A more accurate approach is the normalized correlation equation. Equation 4 shows the normalized correlation equation.
( ) ( )
( ) ( )∑ ∑ ∑ ∑∑ ∑
+
++=
i j Lii jji
i j jLiji
urLsrL
surLsrLvuC
,
,.,),(
221
2
21
+ Lj
L
vs
v
, (4)
In the Equation (4) the normalized correlation coefficient C (u, v) reaches its maximum at one. The in-plane displacements can be determined by identifying a subset around a point at one position in the reference image and comparing it to the subset around a point in the deformed image having the same intensity distribution. Y.H. Wang’s et al. study listed in the reference section gives a more thorough description of principal of DIC, T.C.Chu, J.S. Lyons and Hung P. C.
6
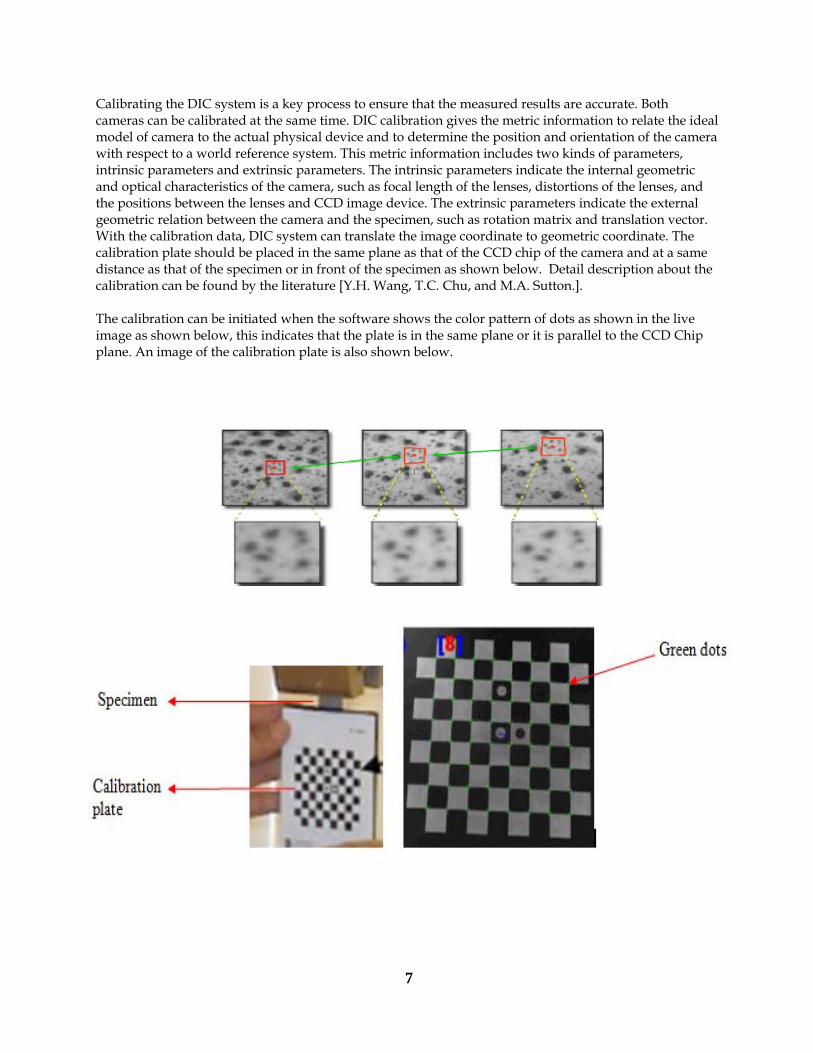
Calibrating the DIC system is a key process to ensure that the measured results are accurate. Both cameras can be calibrated at the same time. DIC calibration gives the metric information to relate the ideal model of camera to the actual physical device and to determine the position and orientation of the camera with respect to a world reference system. This metric information includes two kinds of parameters, intrinsic parameters and extrinsic parameters. The intrinsic parameters indicate the internal geometric and optical characteristics of the camera, such as focal length of the lenses, distortions of the lenses, and the positions between the lenses and CCD image device. The extrinsic parameters indicate the external geometric relation between the camera and the specimen, such as rotation matrix and translation vector. With the calibration data, DIC system can translate the image coordinate to geometric coordinate. The calibration plate should be placed in the same plane as that of the CCD chip of the camera and at a same distance as that of the specimen or in front of the specimen as shown below. Detail description about the calibration can be found by the literature [Y.H. Wang, T.C. Chu, and M.A. Sutton.]. The calibration can be initiated when the software shows the color pattern of dots as shown in the live image as shown below, this indicates that the plate is in the same plane or it is parallel to the CCD Chip plane. An image of the calibration plate is also shown below.
7
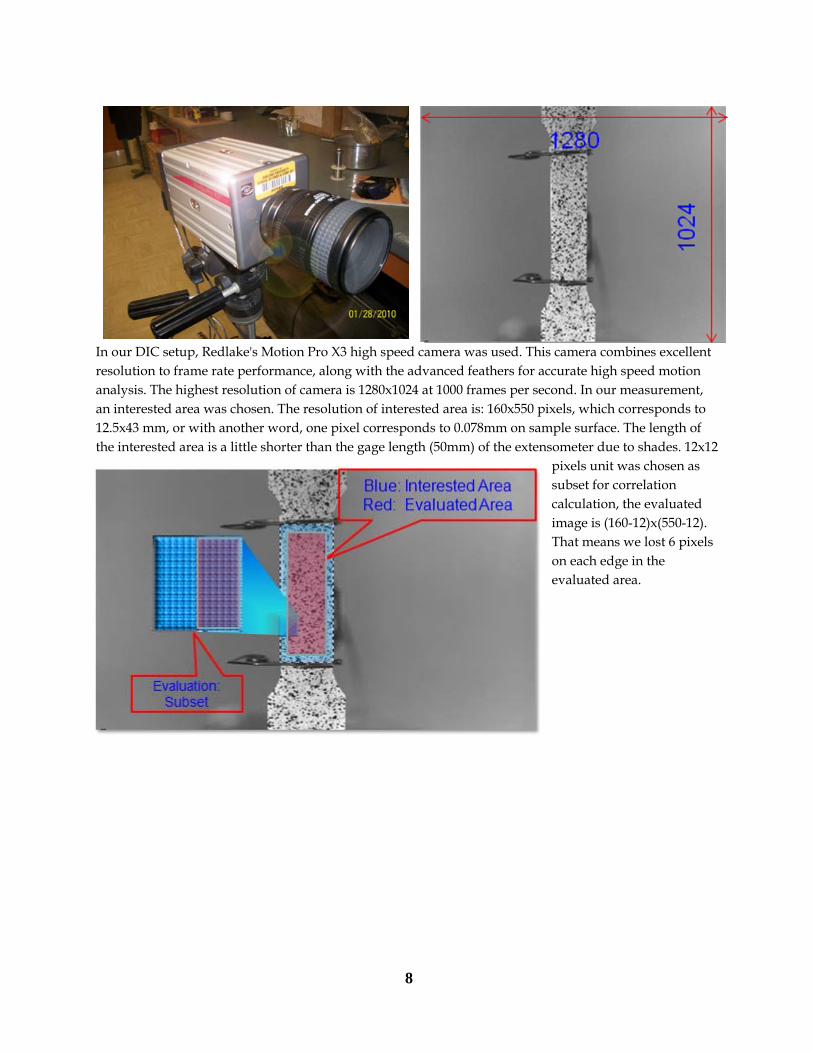
In our DIC setup, Redlake's Motion Pro X3 high speed camera was used. This camera combines excellent resolution to frame rate performance, along with the advanced feathers for accurate high speed motion analysis. The highest resolution of camera is 1280x1024 at 1000 frames per second. In our measurement, an interested area was chosen. The resolution of interested area is: 160x550 pixels, which corresponds to 12.5x43 mm, or with another word, one pixel corresponds to 0.078mm on sample surface. The length of the interested area is a little shorter than the gage length (50mm) of the extensometer due to shades. 12x12
pixels unit was chosen as subset for correlation calculation, the evaluated image is (160-12)x(550-12). That means we lost 6 pixels on each edge in the evaluated area.
8
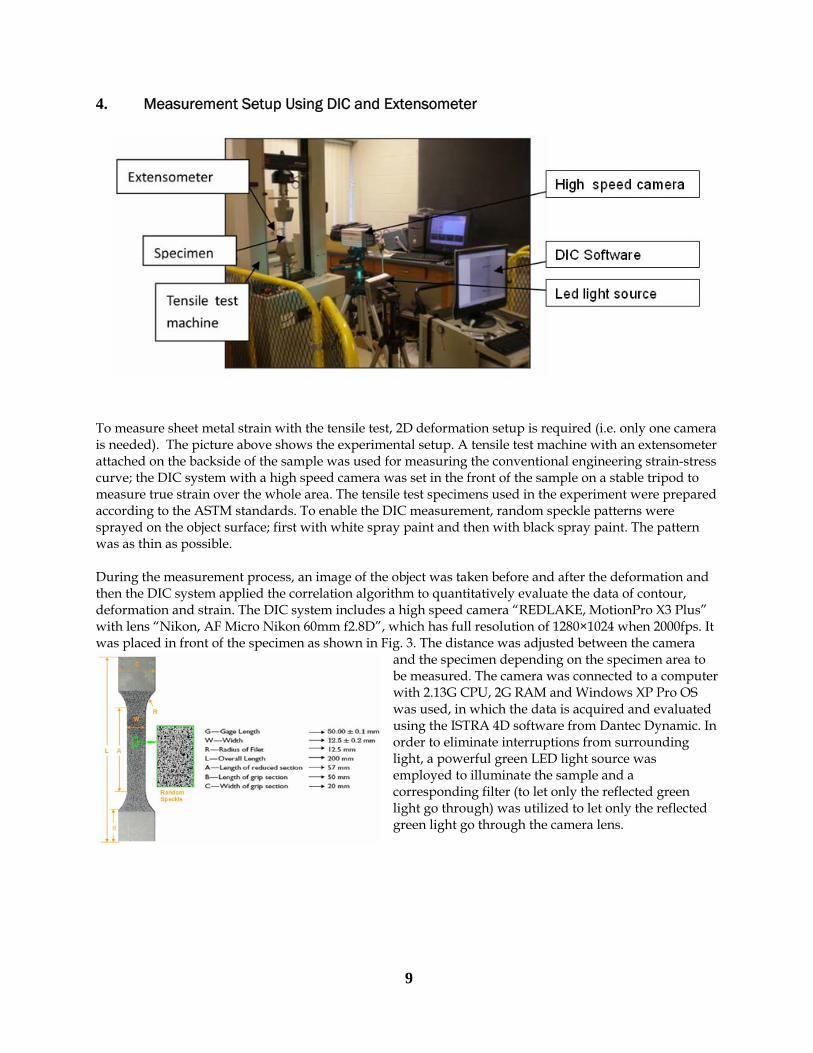
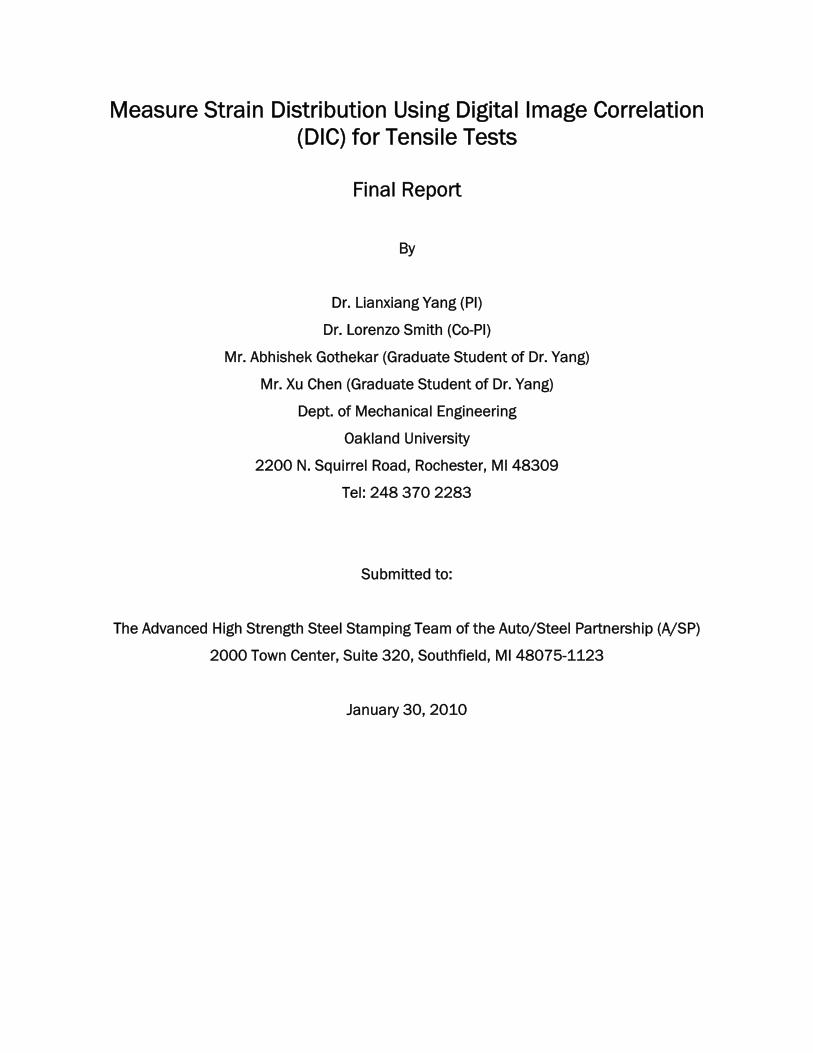
4. Measurement Setup Using DIC and Extensometer
To measure sheet metal strain with the tensile test, 2D deformation setup is required (i.e. only one camera is needed). The picture above shows the experimental setup. A tensile test machine with an extensometer attached on the backside of the sample was used for measuring the conventional engineering strain-stress curve; the DIC system with a high speed camera was set in the front of the sample on a stable tripod to measure true strain over the whole area. The tensile test specimens used in the experiment were prepared according to the ASTM standards. To enable the DIC measurement, random speckle patterns were sprayed on the object surface; first with white spray paint and then with black spray paint. The pattern was as thin as possible. During the measurement process, an image of the object was taken before and after the deformation and then the DIC system applied the correlation algorithm to quantitatively evaluate the data of contour, deformation and strain. The DIC system includes a high speed camera “REDLAKE, MotionPro X3 Plus” with lens “Nikon, AF Micro Nikon 60mm f2.8D”, which has full resolution of 1280×1024 when 2000fps. It was placed in front of the specimen as shown in Fig. 3. The distance was adjusted between the camera
and the specimen depending on the specimen area to be measured. The camera was connected to a computer with 2.13G CPU, 2G RAM and Windows XP Pro OS was used, in which the data is acquired and evaluated using the ISTRA 4D software from Dantec Dynamic. In order to eliminate interruptions from surrounding light, a powerful green LED light source was employed to illuminate the sample and a corresponding filter (to let only the reflected green light go through) was utilized to let only the reflected green light go through the camera lens.
9
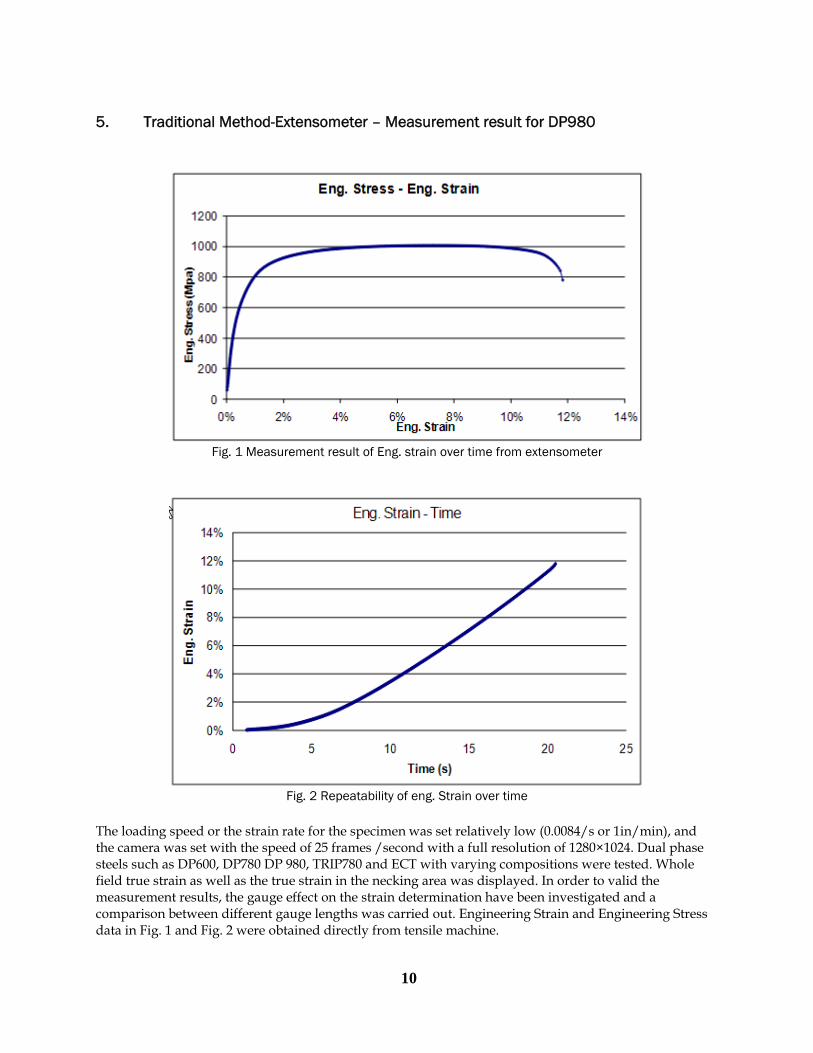
5. Traditional Method-Extensometer – Measurement result for DP980
Fig. 1 Measurement result of Eng. strain over time from extensometer
Fig. 2 Repeatability of eng. Strain over time
The loading speed or the strain rate for the specimen was set relatively low (0.0084/s or 1in/min), and the camera was set with the speed of 25 frames /second with a full resolution of 1280×1024. Dual phase steels such as DP600, DP780 DP 980, TRIP780 and ECT with varying compositions were tested. Whole field true strain as well as the true strain in the necking area was displayed. In order to valid the measurement results, the gauge effect on the strain determination have been investigated and a comparison between different gauge lengths was carried out. Engineering Strain and Engineering Stress data in Fig. 1 and Fig. 2 were obtained directly from tensile machine.
10
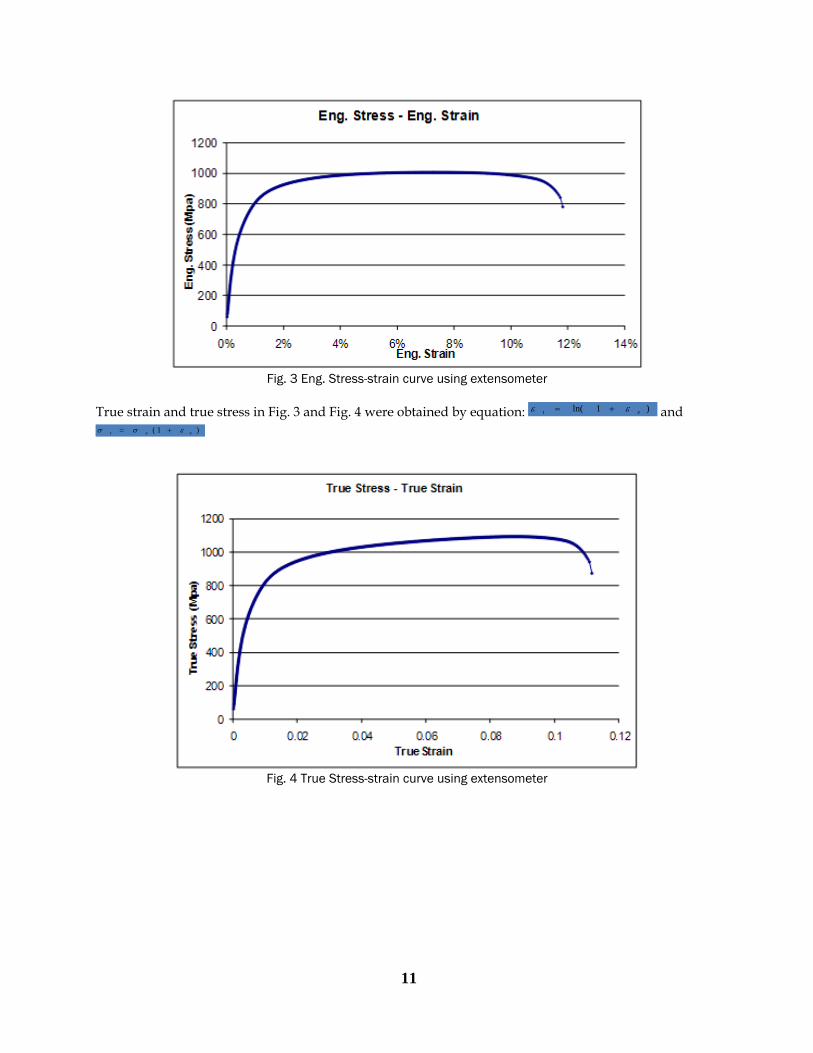
Fig. 3 Eng. Stress-strain curve using extensometer
True strain and true stress in Fig. 3 and Fig. 4 were obtained by equation: )1ln( et εε += and
)1( eet εσσ +=
Fig. 4 True Stress-strain curve using extensometer
11
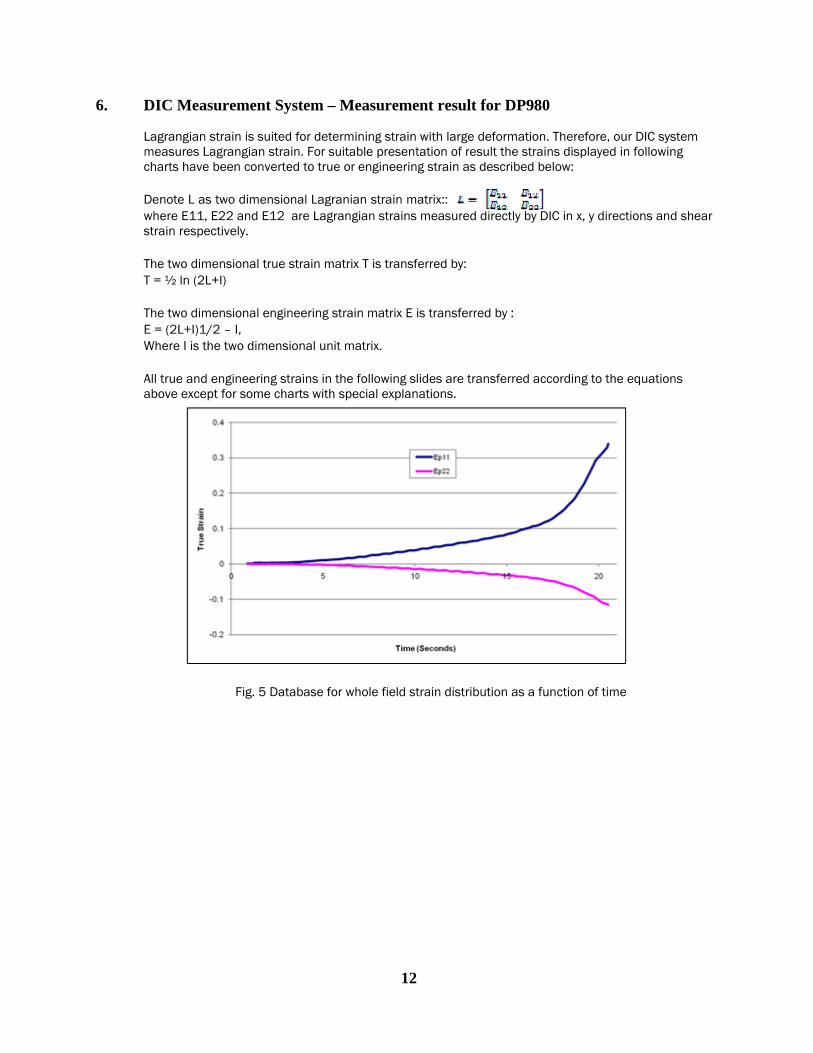
6. DIC Measurement System – Measurement result for DP980
Lagrangian strain is suited for determining strain with large deformation. Therefore, our DIC system measures Lagrangian strain. For suitable presentation of result the strains displayed in following charts have been converted to true or engineering strain as described below: Denote L as two dimensional Lagranian strain matrix:: where E11, E22 and E12 are Lagrangian strains measured directly by DIC in x, y directions and shear strain respectively. The two dimensional true strain matrix T is transferred by: T = ½ ln (2L+I) The two dimensional engineering strain matrix E is transferred by : E = (2L+I)1/2 – I, Where I is the two dimensional unit matrix. All true and engineering strains in the following slides are transferred according to the equations above except for some charts with special explanations.
Fig. 5 Database for whole field strain distribution as a function of time
12
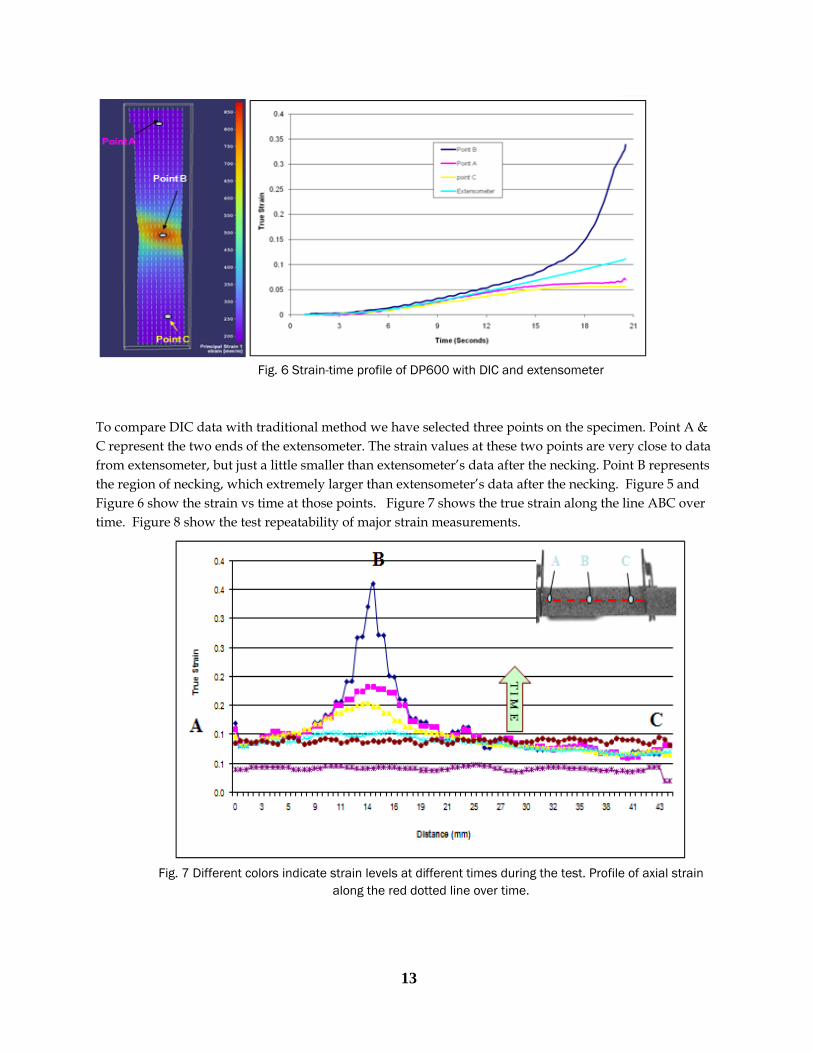
Fig. 6 Strain-time profile of DP600 with DIC and extensometer
To compare DIC data with traditional method we have selected three points on the specimen. Point A & C represent the two ends of the extensometer. The strain values at these two points are very close to data from extensometer, but just a little smaller than extensometer’s data after the necking. Point B represents the region of necking, which extremely larger than extensometer’s data after the necking. Figure 5 and Figure 6 show the strain vs time at those points. Figure 7 shows the true strain along the line ABC over time. Figure 8 show the test repeatability of major strain measurements.
Fig. 7 Different colors indicate strain levels at different times during the test. Profile of axial strain
along the red dotted line over time.
13
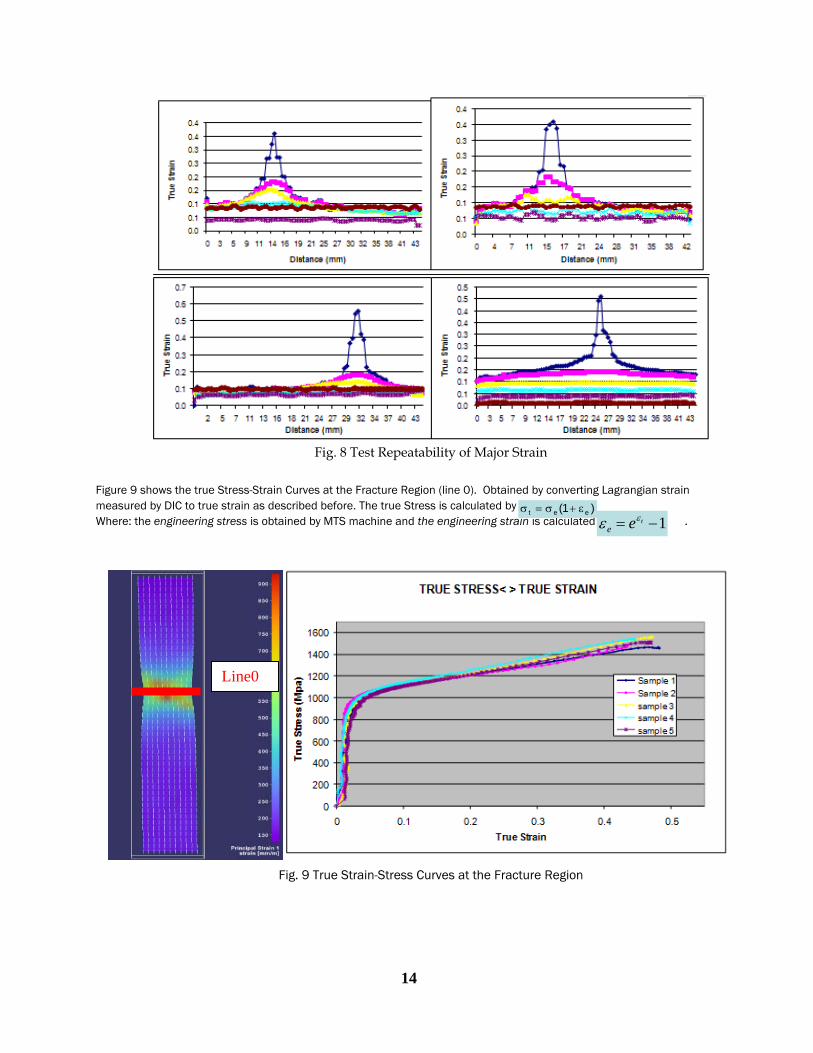
Fig. 8 Test Repeatability of Major Strain
Figure 9 shows the true Stress-Strain Curves at the Fracture Region (line 0). Obtained by converting Lagrangian strain measured by DIC to true strain as described before. The true Stress is calculated by the equation: Where: the engineering stress is obtained by MTS machine and the engineering strain is calculated by .
)et ε1(e +σ=σ1t
eεε −= e
Line0
Fig. 9 True Strain-Stress Curves at the Fracture Region
14
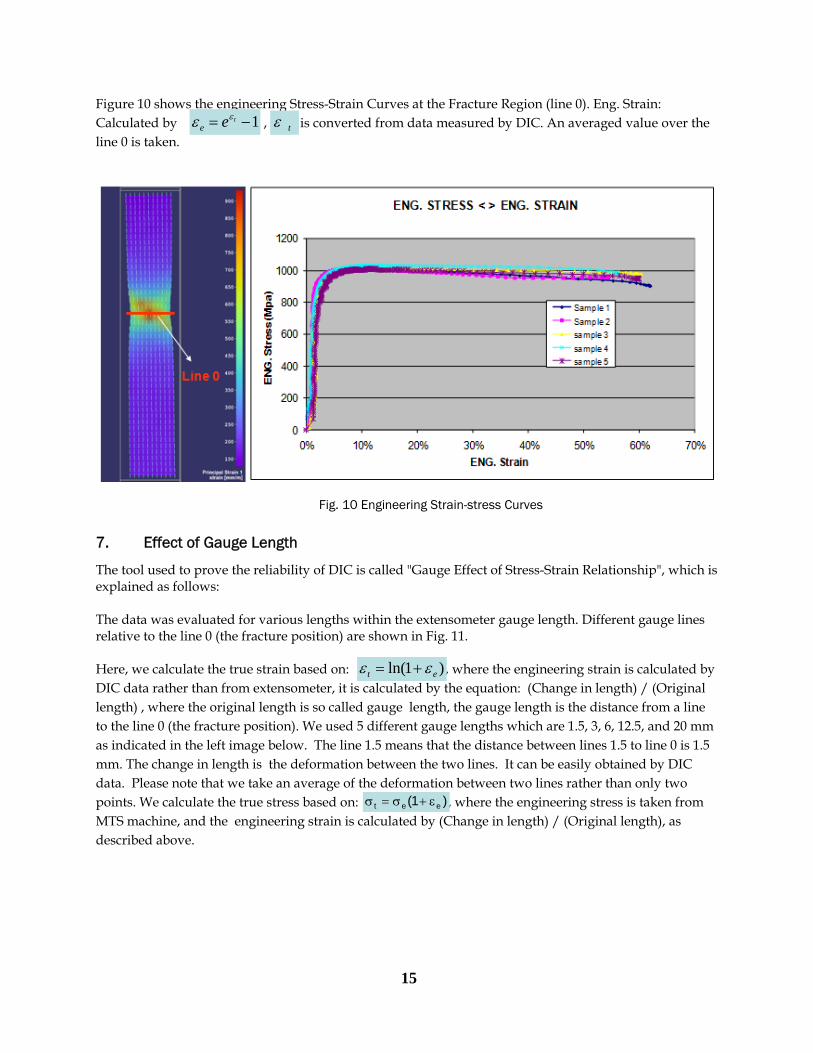
Figure 10 shows the engineering Stress-Strain Curves at the Fracture Region (line 0). Eng. Strain: Calculated by , is converted from data measured by DIC. An averaged value over the line 0 is taken.
Fig. 10 Engineering Strain-stress Curves 7. Effect of Gauge Length
The tool used to prove the reliability of DIC is called "Gauge Effect of Stress-Strain Relationship", which is explained as follows: The data was evaluated for various lengths within the extensometer gauge length. Different gauge lines relative to the line 0 (the fracture position) are shown in Fig. 11. Here, we calculate the true strain based on: , where the engineering strain is calculated by DIC data rather than from extensometer, it is calculated by the equation: (Change in length) / (Original length) , where the original length is so called gauge length, the gauge length is the distance from a line to the line 0 (the fracture position). We used 5 different gauge lengths which are 1.5, 3, 6, 12.5, and 20 mm as indicated in the left image below. The line 1.5 means that the distance between lines 1.5 to line 0 is 1.5 mm. The change in length is the deformation between the two lines. It can be easily obtained by DIC data. Please note that we take an average of the deformation between two lines rather than only two points. We calculate the true stress based on: , where the engineering stress is taken from MTS machine, and the engineering strain is calculated by (Change in length) / (Original length), as described above.
)et 1(e ε+σ=σ
)et 1ln( εε +=
1te
εε −= e tε
15
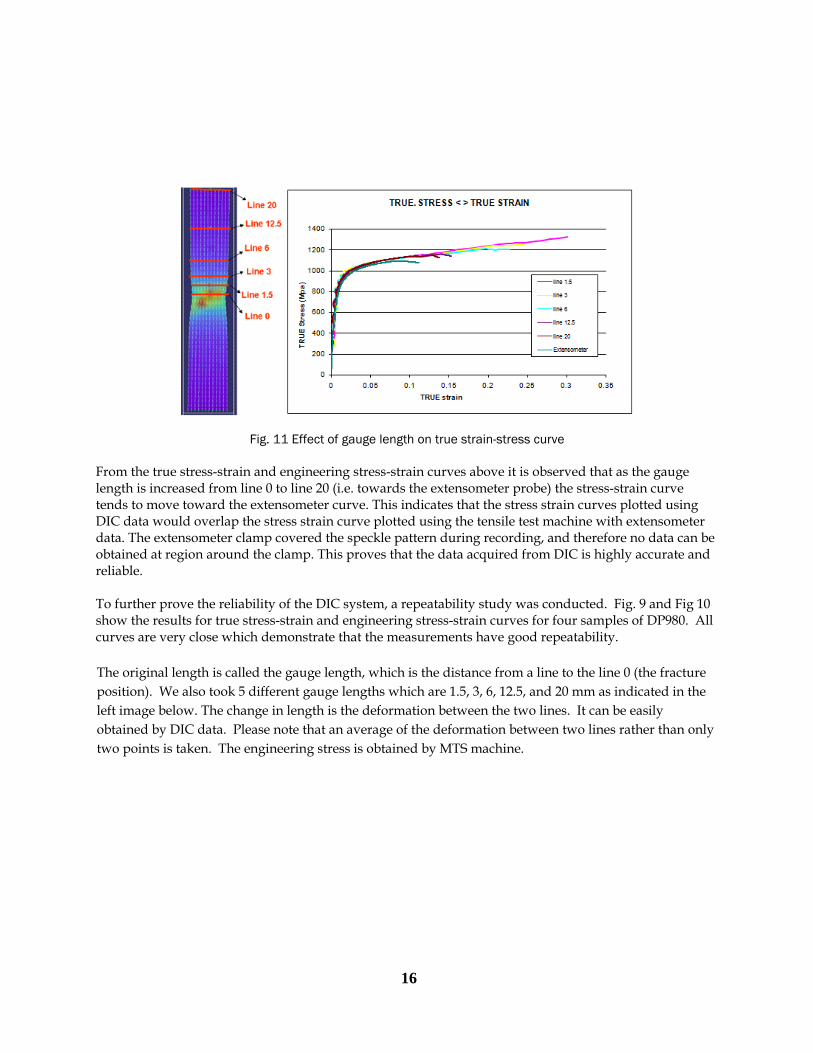
Fig. 11 Effect of gauge length on true strain-stress curve
From the true stress-strain and engineering stress-strain curves above it is observed that as the gauge length is increased from line 0 to line 20 (i.e. towards the extensometer probe) the stress-strain curve tends to move toward the extensometer curve. This indicates that the stress strain curves plotted using DIC data would overlap the stress strain curve plotted using the tensile test machine with extensometer data. The extensometer clamp covered the speckle pattern during recording, and therefore no data can be obtained at region around the clamp. This proves that the data acquired from DIC is highly accurate and reliable. To further prove the reliability of the DIC system, a repeatability study was conducted. Fig. 9 and Fig 10 show the results for true stress-strain and engineering stress-strain curves for four samples of DP980. All curves are very close which demonstrate that the measurements have good repeatability. The original length is called the gauge length, which is the distance from a line to the line 0 (the fracture position). We also took 5 different gauge lengths which are 1.5, 3, 6, 12.5, and 20 mm as indicated in the left image below. The change in length is the deformation between the two lines. It can be easily obtained by DIC data. Please note that an average of the deformation between two lines rather than only two points is taken. The engineering stress is obtained by MTS machine.
16
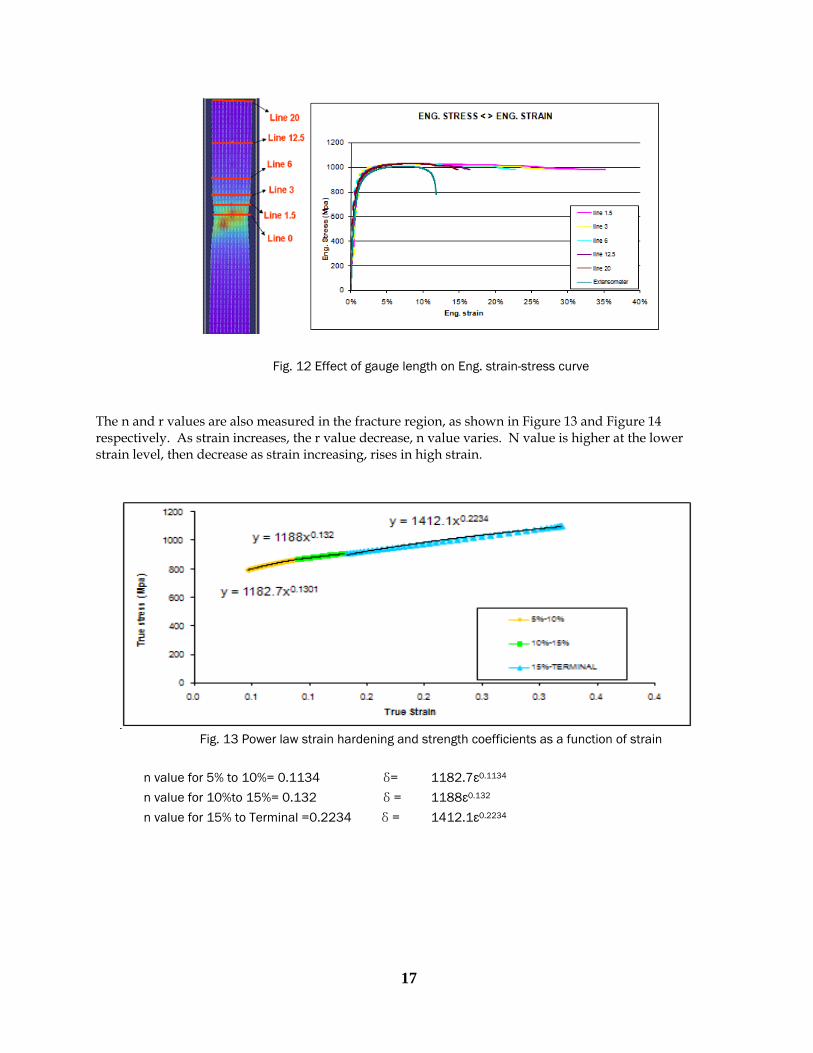
Fig. 12 Effect of gauge length on Eng. strain-stress curve
The n and r values are also measured in the fracture region, as shown in Figure 13 and Figure 14 respectively. As strain increases, the r value decrease, n value varies. N value is higher at the lower strain level, then decrease as strain increasing, rises in high strain.
Fig. 13 Power law strain hardening and strength coefficients as a function of strain
n value for 5% to 10%= 0.1134 δ= 1182.7ε0.1134
n value for 10%to 15%= 0.132 δ = 1188ε0.132
n value for 15% to Terminal =0.2234 δ = 1412.1ε0.2234
17
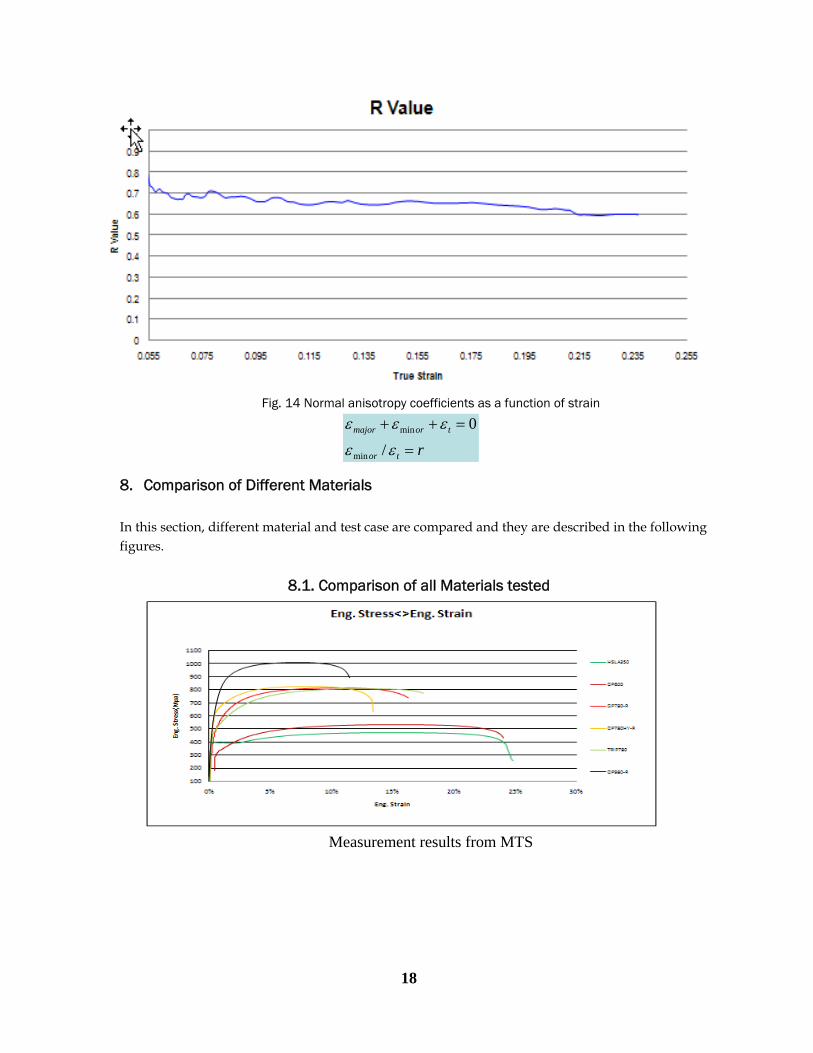
Fig. 14 Normal anisotropy coefficients as a function of strain
rtor
tormajor
=
=++
εε
εεε
/
0
min
min
8. Comparison of Different Materials In this section, different material and test case are compared and they are described in the following figures.
8.1. Comparison of all Materials tested
Measurement results from MTS
18
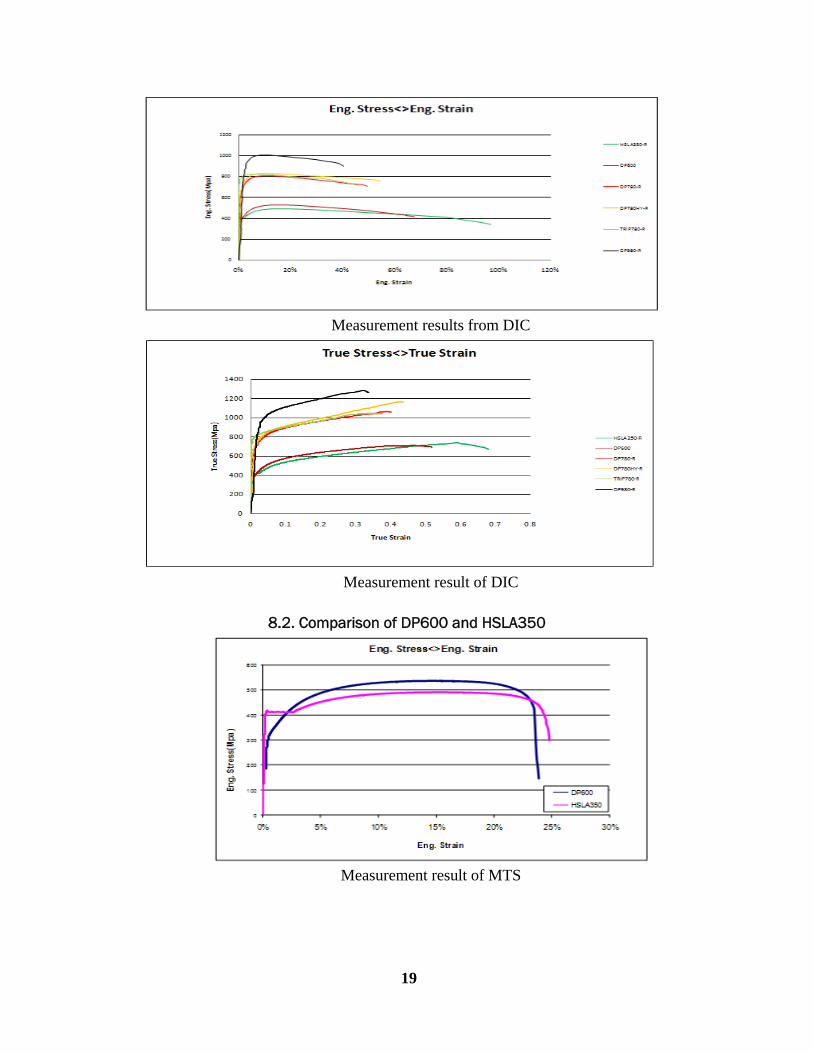
Measurement results from DIC
Measurement result of DIC
8.2. Comparison of DP600 and HSLA350
Measurement result of MTS
19
Measurement result of DIC
Measurement result of DIC
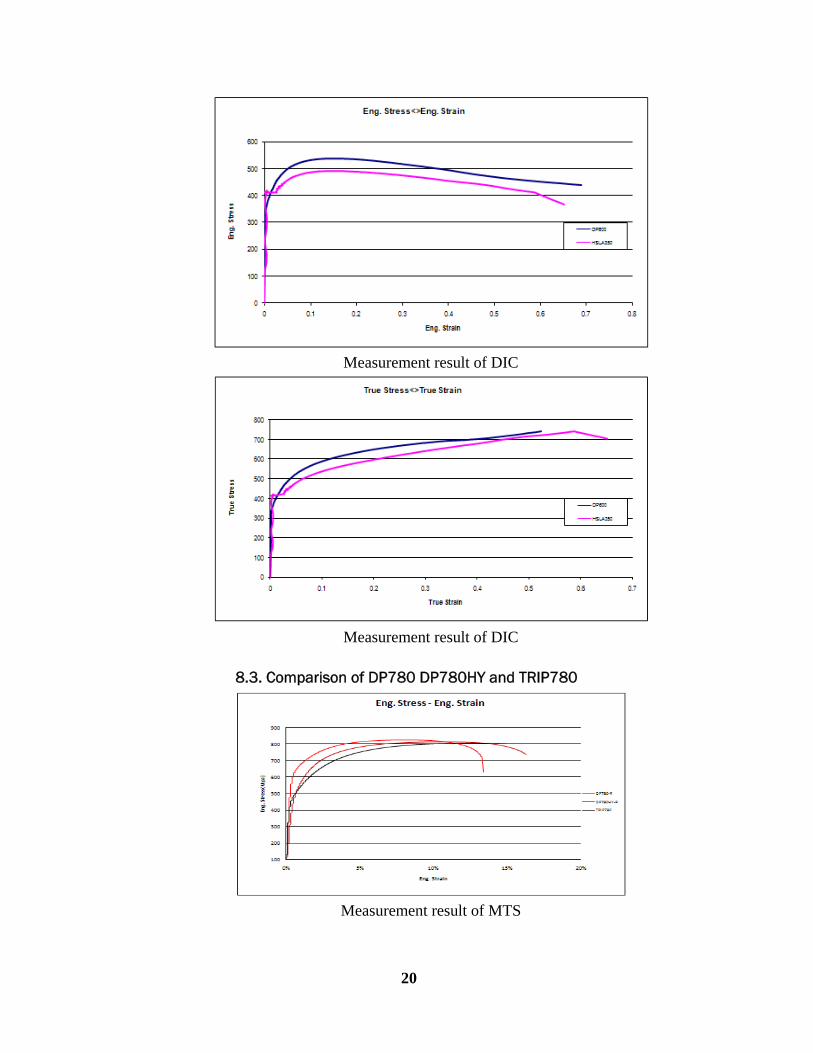
8.3. Comparison of DP780 DP780HY and TRIP780
Measurement result of MTS
20
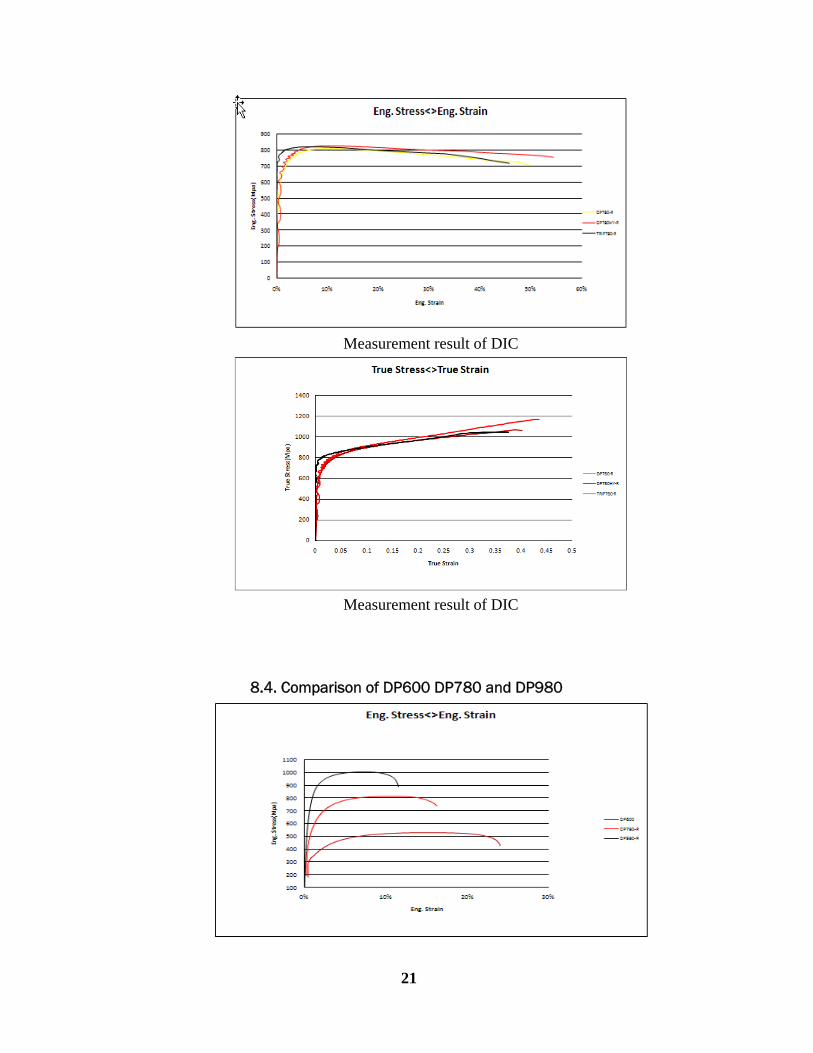
Measurement result of DIC
Measurement result of DIC
8.4. Comparison of DP600 DP780 and DP980
21
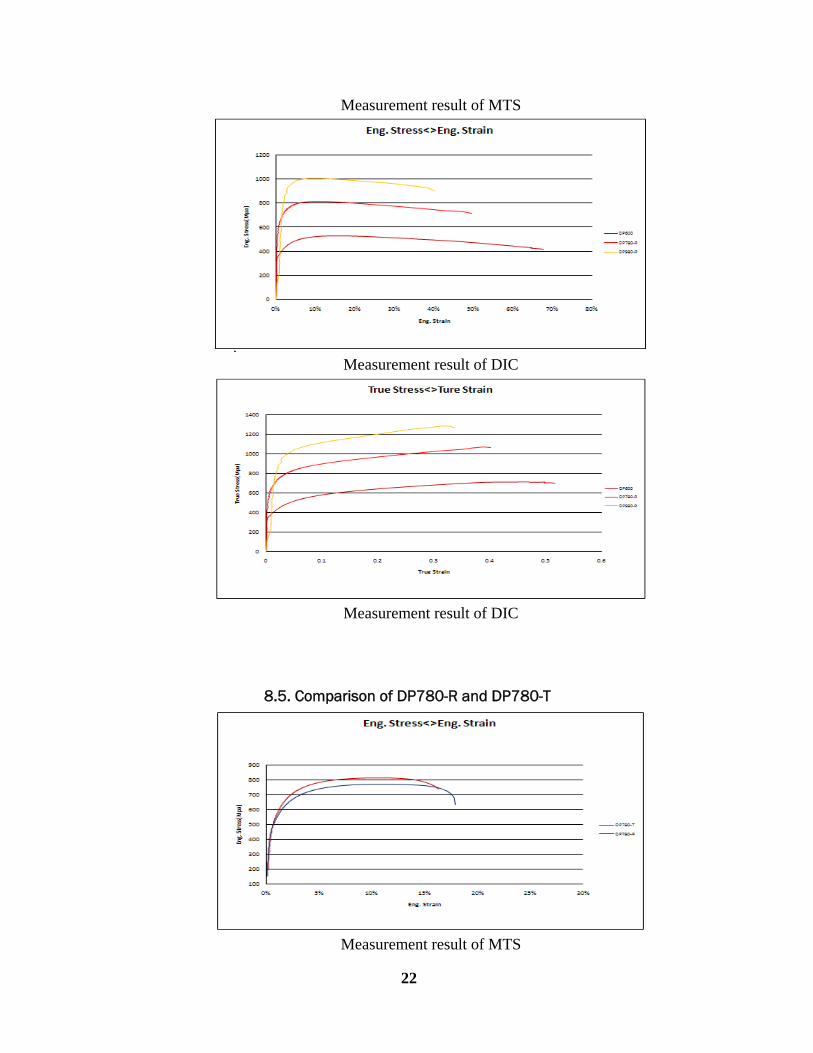
Measurement result of MTS
Measurement result of DIC
Measurement result of DIC
8.5. Comparison of DP780-R and DP780-T
Measurement result of MTS
22
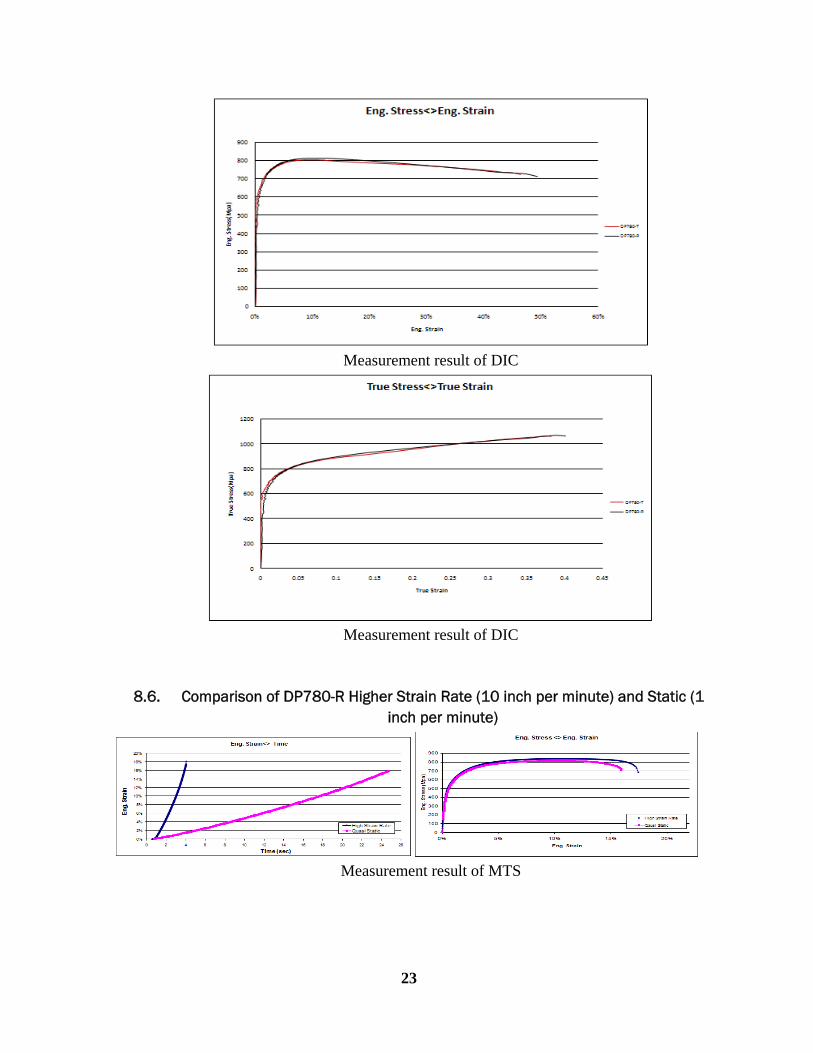
Measurement result of DIC
Measurement result of DIC
8.6. Comparison of DP780-R Higher Strain Rate (10 inch per minute) and Static (1 inch per minute)
Measurement result of MTS
23
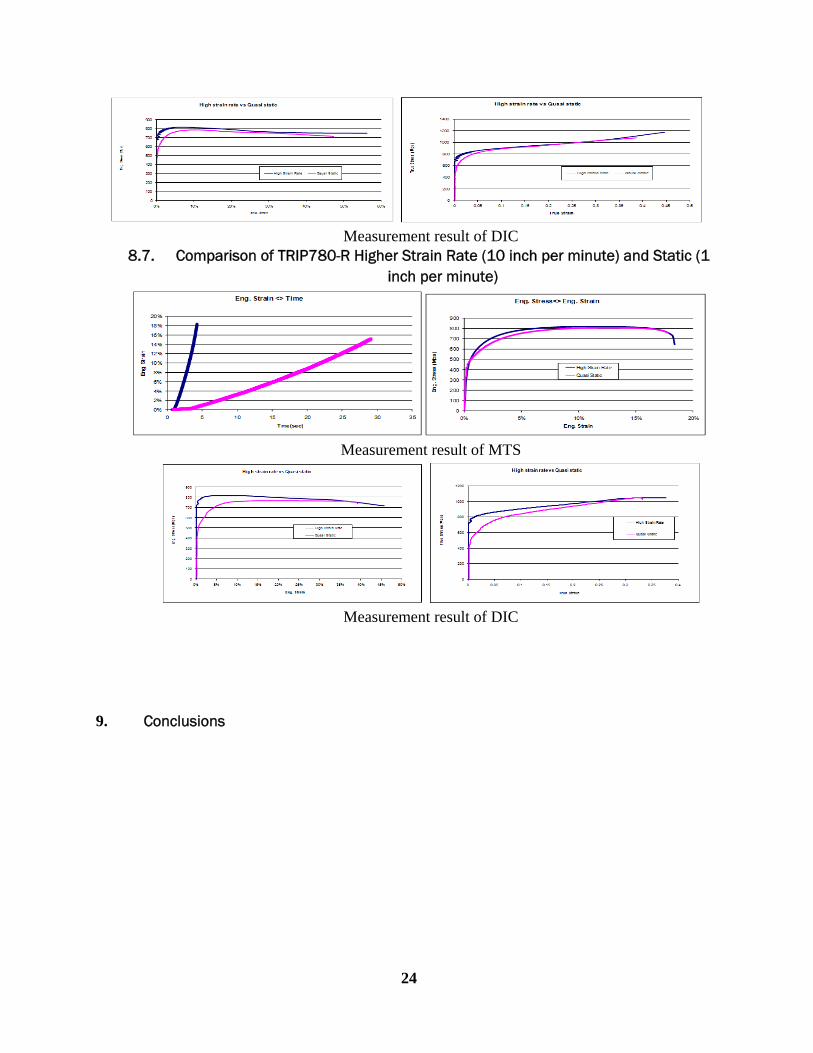
Measurement result of DIC
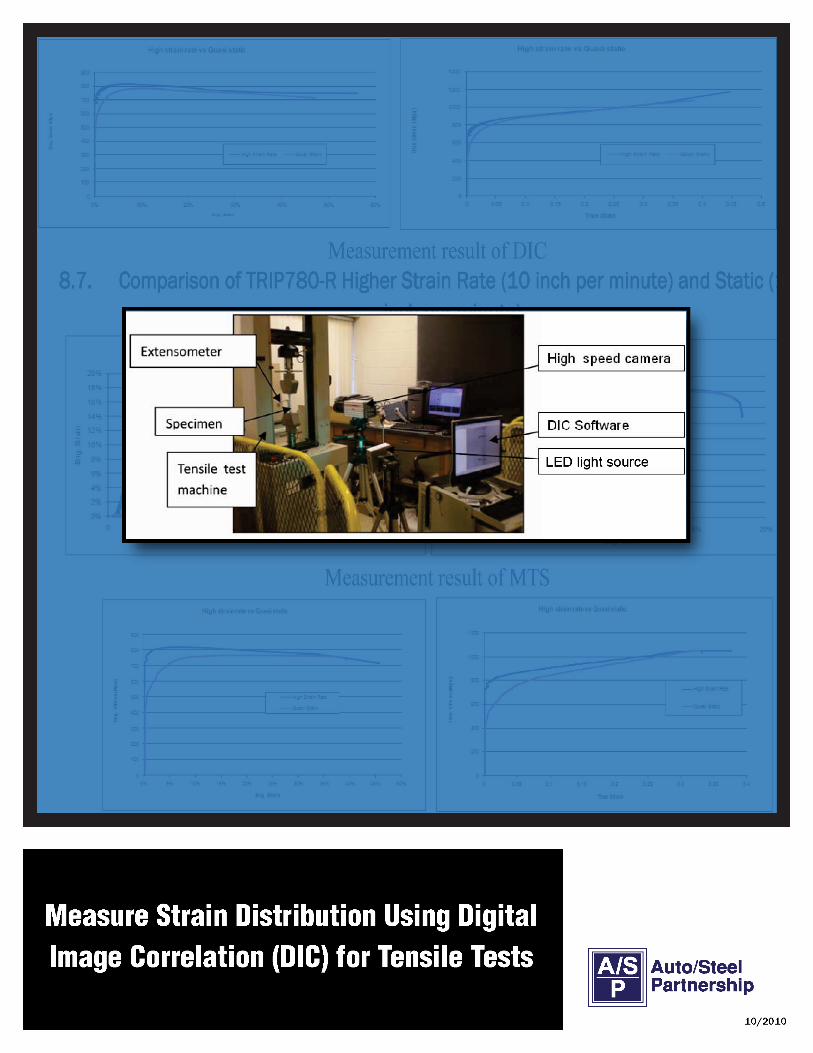
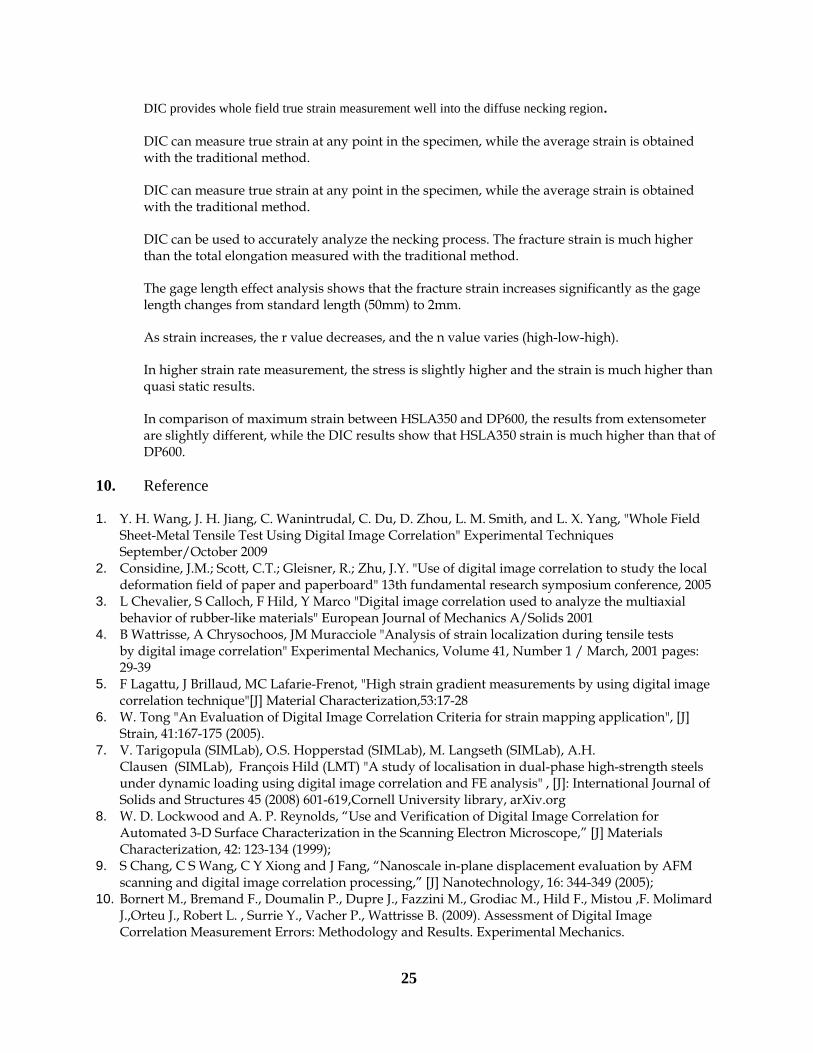
8.7. Comparison of TRIP780-R Higher Strain Rate (10 inch per minute) and Static (1 inch per minute)
Measurement result of MTS
Measurement result of DIC
9. Conclusions
24
DIC provides whole field true strain measurement well into the diffuse necking region.
DIC can measure true strain at any point in the specimen, while the average strain is obtained with the traditional method.
DIC can measure true strain at any point in the specimen, while the average strain is obtained with the traditional method.
DIC can be used to accurately analyze the necking process. The fracture strain is much higher than the total elongation measured with the traditional method.
The gage length effect analysis shows that the fracture strain increases significantly as the gage length changes from standard length (50mm) to 2mm.
As strain increases, the r value decreases, and the n value varies (high-low-high).
In higher strain rate measurement, the stress is slightly higher and the strain is much higher than quasi static results.
In comparison of maximum strain between HSLA350 and DP600, the results from extensometer are slightly different, while the DIC results show that HSLA350 strain is much higher than that of DP600.
10. Reference
1. Y. H. Wang, J. H. Jiang, C. Wanintrudal, C. Du, D. Zhou, L. M. Smith, and L. X. Yang, "Whole Field Sheet-Metal Tensile Test Using Digital Image Correlation" Experimental Techniques September/October 2009
2. Considine, J.M.; Scott, C.T.; Gleisner, R.; Zhu, J.Y. "Use of digital image correlation to study the local deformation field of paper and paperboard" 13th fundamental research symposium conference, 2005
3. L Chevalier, S Calloch, F Hild, Y Marco "Digital image correlation used to analyze the multiaxial behavior of rubber-like materials" European Journal of Mechanics A/Solids 2001
4. B Wattrisse, A Chrysochoos, JM Muracciole "Analysis of strain localization during tensile tests by digital image correlation" Experimental Mechanics, Volume 41, Number 1 / March, 2001 pages: 29-39
5. F Lagattu, J Brillaud, MC Lafarie-Frenot, "High strain gradient measurements by using digital image correlation technique"[J] Material Characterization,53:17-28
6. W. Tong "An Evaluation of Digital Image Correlation Criteria for strain mapping application", [J] Strain, 41:167-175 (2005).
7. V. Tarigopula (SIMLab), O.S. Hopperstad (SIMLab), M. Langseth (SIMLab), A.H. Clausen (SIMLab), François Hild (LMT) "A study of localisation in dual-phase high-strength steels under dynamic loading using digital image correlation and FE analysis" , [J]: International Journal of Solids and Structures 45 (2008) 601-619,Cornell University library, arXiv.org
8. W. D. Lockwood and A. P. Reynolds, “Use and Verification of Digital Image Correlation for Automated 3-D Surface Characterization in the Scanning Electron Microscope,” [J] Materials Characterization, 42: 123-134 (1999);
9. S Chang, C S Wang, C Y Xiong and J Fang, “Nanoscale in-plane displacement evaluation by AFM scanning and digital image correlation processing,” [J] Nanotechnology, 16: 344-349 (2005);
10. Bornert M., Bremand F., Doumalin P., Dupre J., Fazzini M., Grodiac M., Hild F., Mistou ,F. Molimard J.,Orteu J., Robert L. , Surrie Y., Vacher P., Wattrisse B. (2009). Assessment of Digital Image Correlation Measurement Errors: Methodology and Results. Experimental Mechanics.
25
11. T.C. Chu, W.F. Ranson, MA Sutton, "Applications of digital-image-correlation techniques to experimental mechanics" Experimental Mechanics September 1985 page 232-235
12. J.S .Lyons, J. Liu, M.A. Sutton "High-temperature deformation measurements using digital-image correlation"- Experimental mechanics, 1996 r page 64
13. Hung P.-C., and Voloshin A. S., ‘‘In-plane Strain Measurement by Digital Image Correlation,’’ Journal of the Brazilian Society of Mechanical Sciences and Engineering XXV(3):215–221 (2003).
14. Sutton, M.A., Wolters, W.J., Peters, W.H., Ranson, W.F., and McNeill, S.R., ‘‘Determination of Displacement Using an Improved Digital Correlation Method,’’ Computer Vision 1(3):133–139 (1983).
15. Beer, F.P., Johnston, E.R. Jr, Dewolf, J.T., Mazurek, D.F., Mechanics of Materials, McGraw-Hill Companies, (2006).
16. Dongsheng Zhang, Charles D. Eggleton and Dwayne D. Arola, “Evaluating the Mechanical Behavior of Arterial Tissue using Digital Image Correlation,” [J] Experimental Mechanics, 42(4): 409-416 (2002).
26