Embed Size (px)
Citation preview
1
MDS: Disease, Diagnosis and Treatment
Hetty Carraway, MD, MBATaussig Cancer InstituteCleveland ClinicJuly 26, 2014
Overview:
Definition of MDS
Definition of “Low Risk” and High Risk” MDS
Treatment Options for MDS
What is MDS?
• MDS is the name of a group of conditions that occur when the blood forming cells in the bone marrow are damaged
• This damage leads to low numbers of one or more type of blood cells
– Low WBC: neutropenia (causes infection)
– Low RBC: anemia (causes fatigue, SOB)
– Low platelets: thrombocytopenia (causes bruises/bleeds)

2
Normal Bone Marrow
• Bone marrow is where the cells that make our blood forming cells live
• A small fraction of the blood forming cells are called Stem cells
• A Stem cell will divide and make 2 cells, one that stays a stem cell and another that makes a blood cell
• There are 3 blood cells: WBC, RBC, platelets
Normal Pathway
Myelo-dysplastic Syndrome
• Myelo = marrow (greek)
• Dysplastic = abnormal appearance of cells
– Funny-looking
– Differences in shapes, sizes, granules
– Can be caused by many medical conditions, not only MDS
• Syndrome = collection of signs and symptoms associated together
6
3
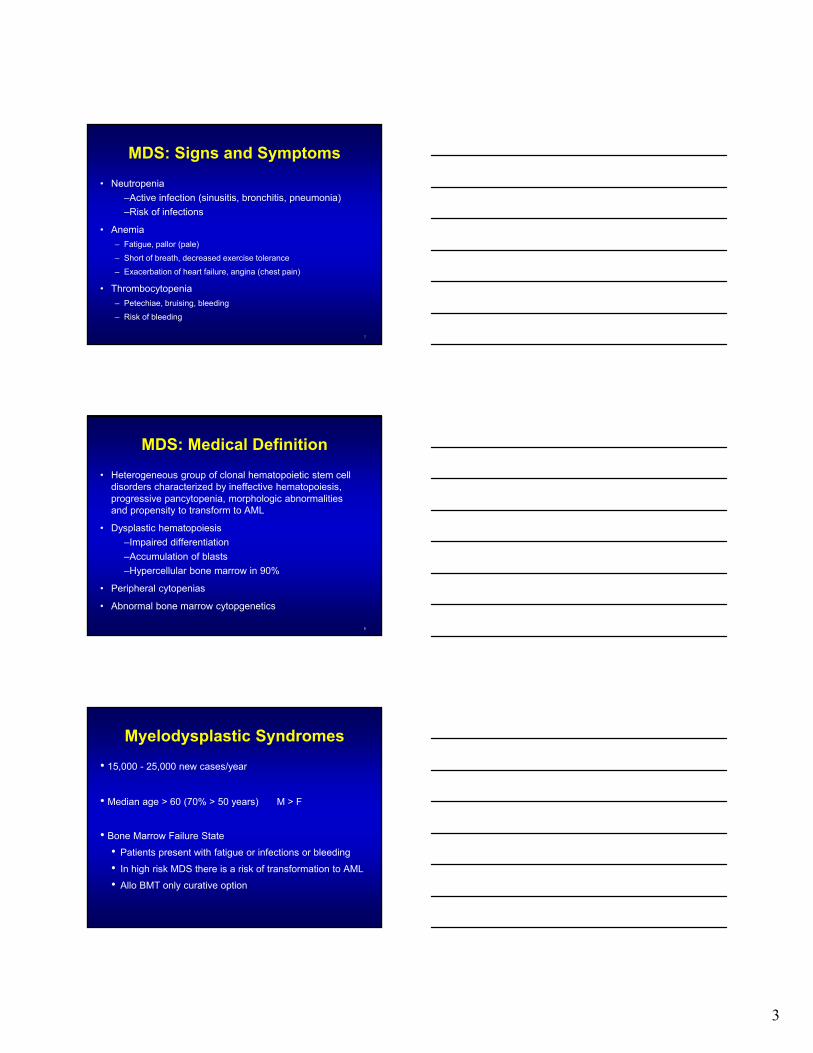
MDS: Signs and Symptoms
• Neutropenia
–Active infection (sinusitis, bronchitis, pneumonia)
–Risk of infections
• Anemia
– Fatigue, pallor (pale)
– Short of breath, decreased exercise tolerance
– Exacerbation of heart failure, angina (chest pain)
• Thrombocytopenia
– Petechiae, bruising, bleeding
– Risk of bleeding
7
MDS: Medical Definition
• Heterogeneous group of clonal hematopoietic stem cell disorders characterized by ineffective hematopoiesis, progressive pancytopenia, morphologic abnormalities and propensity to transform to AML
• Dysplastic hematopoiesis
–Impaired differentiation
–Accumulation of blasts
–Hypercellular bone marrow in 90%
• Peripheral cytopenias
• Abnormal bone marrow cytopgenetics
8
Myelodysplastic Syndromes
• 15,000 - 25,000 new cases/year
• Median age > 60 (70% > 50 years) M > F
• Bone Marrow Failure State
• Patients present with fatigue or infections or bleeding
• In high risk MDS there is a risk of transformation to AML
• Allo BMT only curative option
4
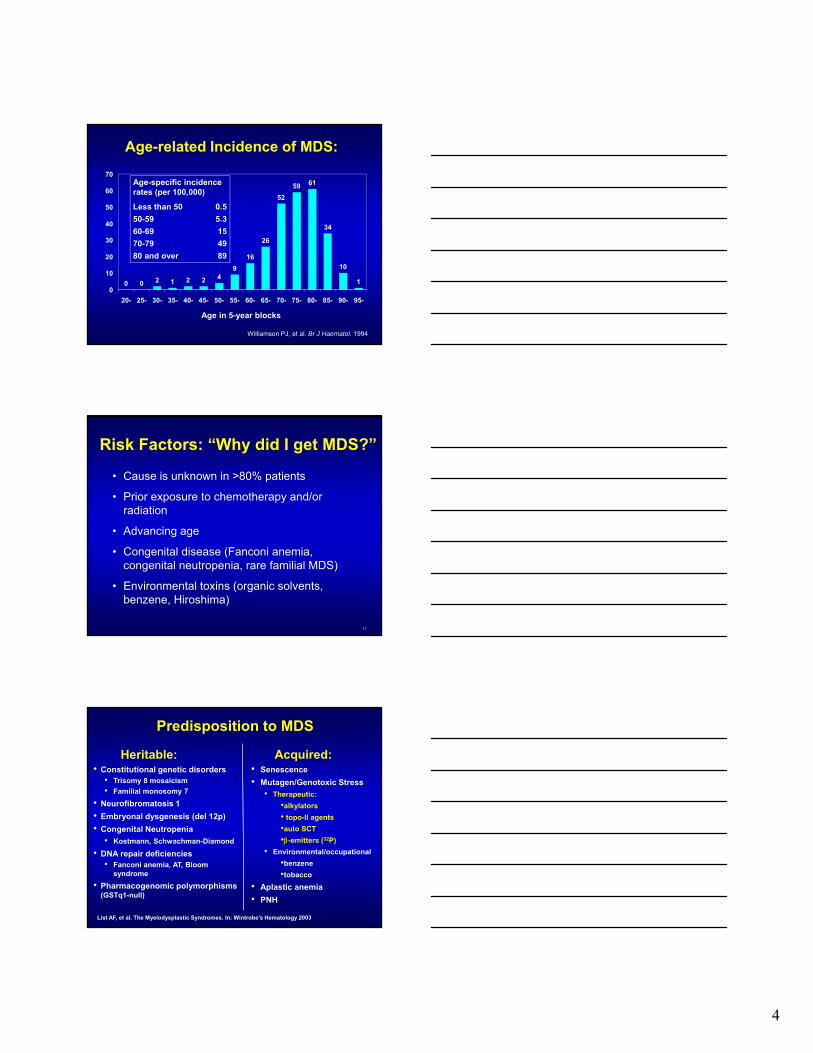
Age-related Incidence of MDS:
Williamson PJ, et al. Br J Haematol. 1994
Age in 5-year blocks
Age-specific incidence rates (per 100,000)
Less than 50 0.5
50-59 5.3
60-69 15
70-79 49
80 and over 89
0 0 2 1 2 2 49
16
26
52
59 61
34
10
10
10
20
30
40
50
60
70
20- 25- 30- 35- 40- 45- 50- 55- 60- 65- 70- 75- 80- 85- 90- 95-
Risk Factors: “Why did I get MDS?”
• Cause is unknown in >80% patients
• Prior exposure to chemotherapy and/or radiation
• Advancing age
• Congenital disease (Fanconi anemia, congenital neutropenia, rare familial MDS)
• Environmental toxins (organic solvents, benzene, Hiroshima)
11
Predisposition to MDS
Acquired:• Senescence
• Mutagen/Genotoxic Stress
• Therapeutic:
•alkylators
• topo-II agents
•auto SCT
•-emitters (32P)
• Environmental/occupational
•benzene
•tobacco
• Aplastic anemia
• PNH
List AF, et al. The Myelodysplastic Syndromes. In: Wintrobe’s Hematology 2003
Heritable:• Constitutional genetic disorders
• Trisomy 8 mosaicism
• Familial monosomy 7
• Neurofibromatosis 1
• Embryonal dysgenesis (del 12p)
• Congenital Neutropenia
• Kostmann, Schwachman-Diamond
• DNA repair deficiencies• Fanconi anemia, AT, Bloom
syndrome
• Pharmacogenomic polymorphisms (GSTq1-null)
5
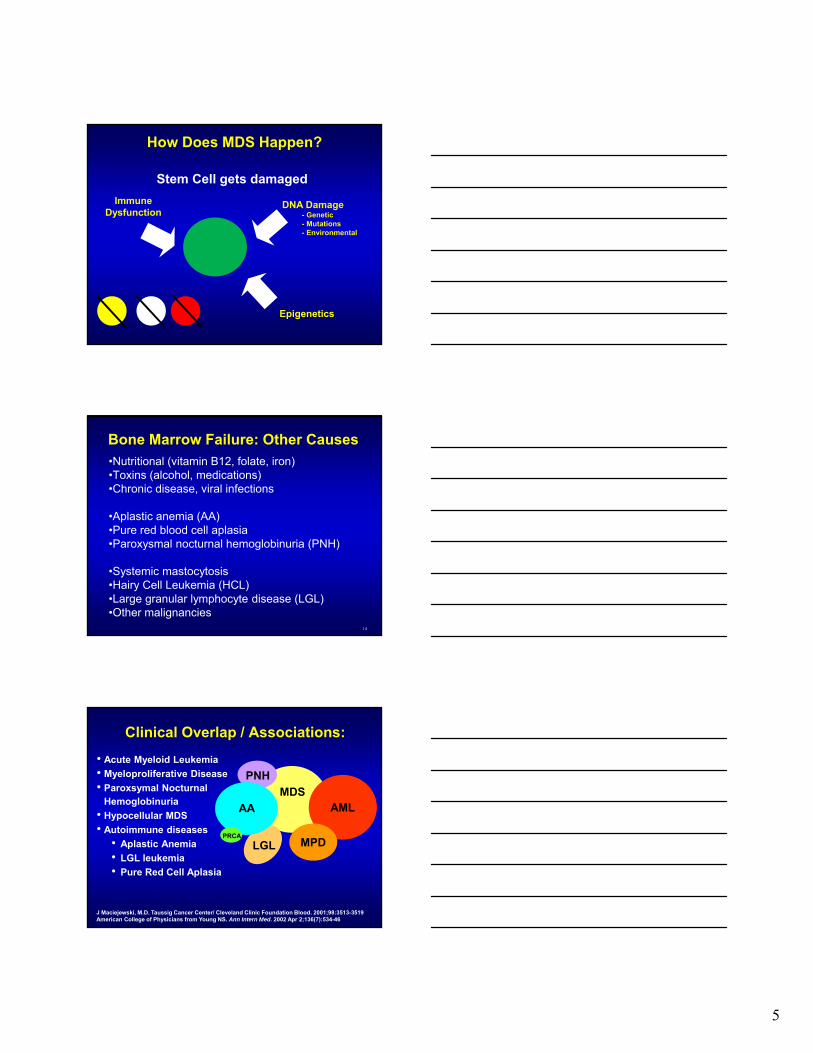
Stem Cell gets damaged
ImmuneDysfunction
Epigenetics
DNA Damage- Genetic- Mutations - Environmental
How Does MDS Happen?
Bone Marrow Failure: Other Causes
•Nutritional (vitamin B12, folate, iron)•Toxins (alcohol, medications)•Chronic disease, viral infections
•Aplastic anemia (AA)•Pure red blood cell aplasia•Paroxysmal nocturnal hemoglobinuria (PNH)
•Systemic mastocytosis•Hairy Cell Leukemia (HCL)•Large granular lymphocyte disease (LGL)•Other malignancies
14
Clinical Overlap / Associations:
• Acute Myeloid Leukemia
• Myeloproliferative Disease
• Paroxsymal Nocturnal Hemoglobinuria
• Hypocellular MDS
• Autoimmune diseases
• Aplastic Anemia
• LGL leukemia
• Pure Red Cell Aplasia
AML
PRCA
PNH
MDS
AA
LGL MPD
J Maciejewski, M.D. Taussig Cancer Center/ Cleveland Clinic Foundation Blood. 2001;98:3513-3519American College of Physicians from Young NS. Ann Intern Med. 2002 Apr 2;136(7):534-46
6
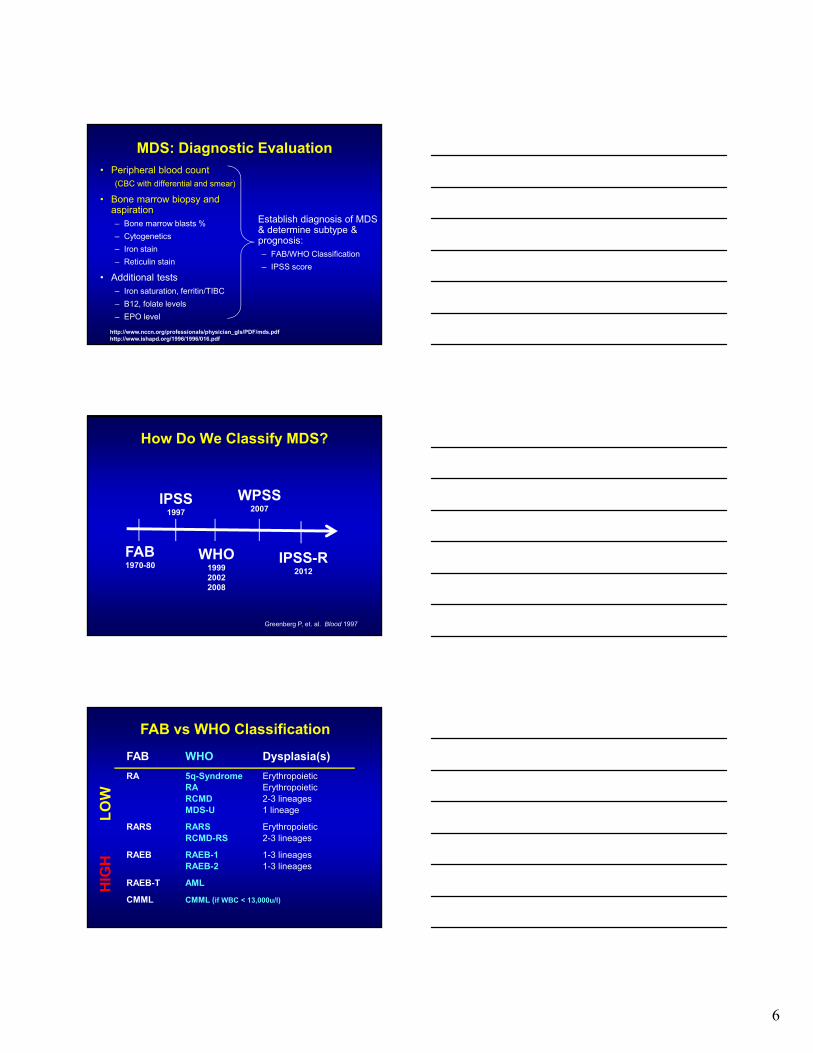
MDS: Diagnostic Evaluation• Peripheral blood count
(CBC with differential and smear)
• Bone marrow biopsy and aspiration– Bone marrow blasts %
– Cytogenetics
– Iron stain
– Reticulin stain
• Additional tests– Iron saturation, ferritin/TIBC
– B12, folate levels
– EPO level
Establish diagnosis of MDS & determine subtype & prognosis:– FAB/WHO Classification
– IPSS score
http://www.nccn.org/professionals/physician_gls/PDF/mds.pdfhttp://www.ishapd.org/1996/1996/016.pdf
How Do We Classify MDS?
Greenberg P, et. al. Blood 1997
FAB1970-80
IPSS1997
WHO199920022008
WPSS2007
IPSS-R2012
FAB vs WHO Classification
FAB WHO Dysplasia(s)
RA 5q-Syndrome ErythropoieticRA ErythropoieticRCMD 2-3 lineagesMDS-U 1 lineage
RARS RARS ErythropoieticRCMD-RS 2-3 lineages
RAEB RAEB-1 1-3 lineagesRAEB-2 1-3 lineages
RAEB-T AML
CMML CMML (if WBC < 13,000u/l)
LO
WH
IGH
7
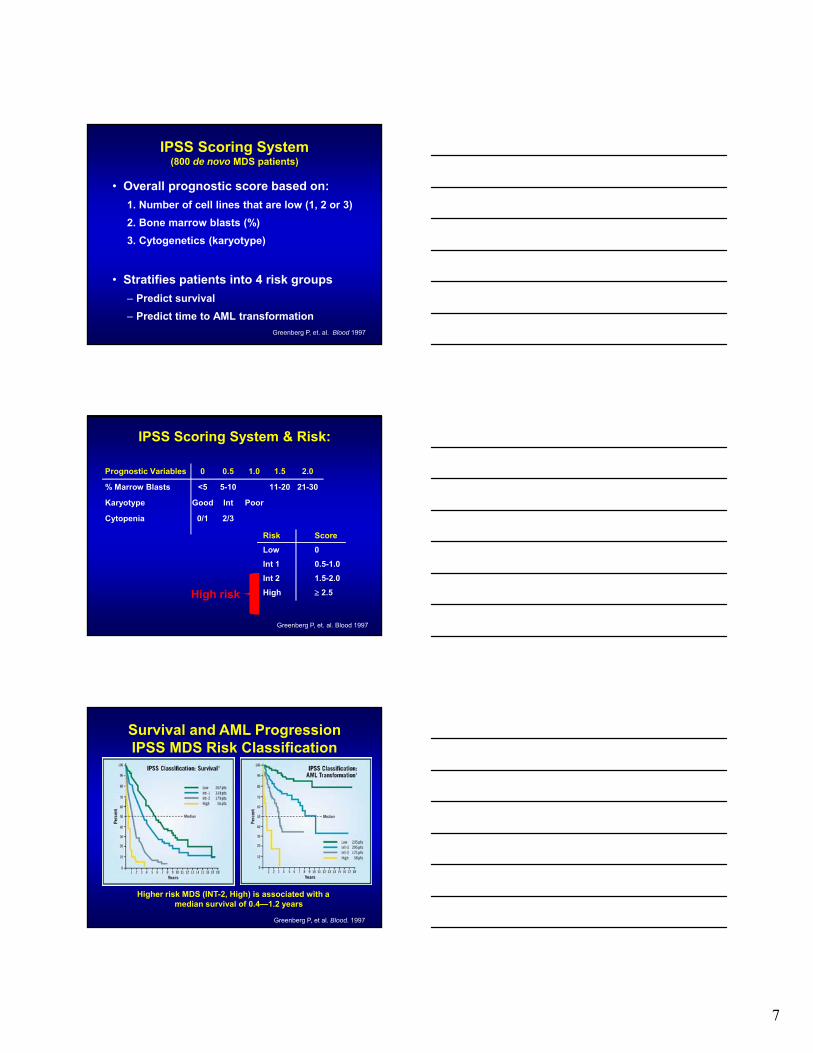
IPSS Scoring System (800 de novo MDS patients)
• Overall prognostic score based on:
1. Number of cell lines that are low (1, 2 or 3)
2. Bone marrow blasts (%)
3. Cytogenetics (karyotype)
• Stratifies patients into 4 risk groups
– Predict survival
– Predict time to AML transformation
Greenberg P, et. al. Blood 1997
IPSS Scoring System & Risk:
Prognostic Variables 0 0.5 1.0 1.5 2.0
% Marrow Blasts <5 5-10 11-20 21-30
Karyotype Good Int Poor
Cytopenia 0/1 2/3
Risk Score
Low 0
Int 1 0.5-1.0
Int 2 1.5-2.0
High 2.5
Greenberg P, et. al. Blood 1997
High risk
Survival and AML Progression IPSS MDS Risk Classification
Higher risk MDS (INT-2, High) is associated with a median survival of 0.4—1.2 years
Greenberg P, et al. Blood. 1997
8
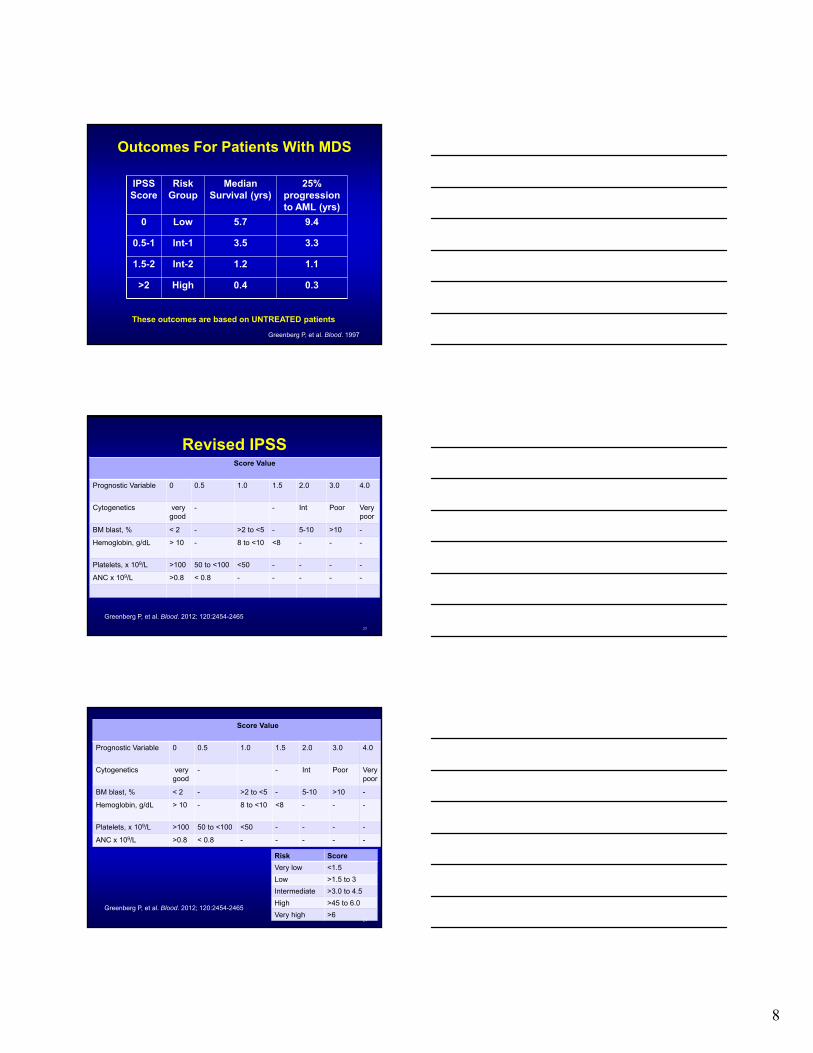
Outcomes For Patients With MDS
Greenberg P, et al. Blood. 1997
IPSS Score
Risk Group
Median Survival (yrs)
25% progression to AML (yrs)
0 Low 5.7 9.4
0.5-1 Int-1 3.5 3.3
1.5-2 Int-2 1.2 1.1
>2 High 0.4 0.3
These outcomes are based on UNTREATED patients
Revised IPSSScore Value
Prognostic Variable 0 0.5 1.0 1.5 2.0 3.0 4.0
Cytogenetics very good
- - Int Poor Very poor
BM blast, % < 2 - >2 to <5 - 5-10 >10 -
Hemoglobin, g/dL > 10 - 8 to <10 <8 - - -
Platelets, x 109/L >100 50 to <100 <50 - - - -
ANC x 109/L >0.8 < 0.8 - - - - -
23
Greenberg P, et al. Blood. 2012; 120:2454-2465
Risk Score
Very low <1.5
Low >1.5 to 3
Intermediate >3.0 to 4.5
High >45 to 6.0
Very high >624
Score Value
Prognostic Variable 0 0.5 1.0 1.5 2.0 3.0 4.0
Cytogenetics very good
- - Int Poor Very poor
BM blast, % < 2 - >2 to <5 - 5-10 >10 -
Hemoglobin, g/dL > 10 - 8 to <10 <8 - - -
Platelets, x 109/L >100 50 to <100 <50 - - - -
ANC x 109/L >0.8 < 0.8 - - - - -
Greenberg P, et al. Blood. 2012; 120:2454-2465
9
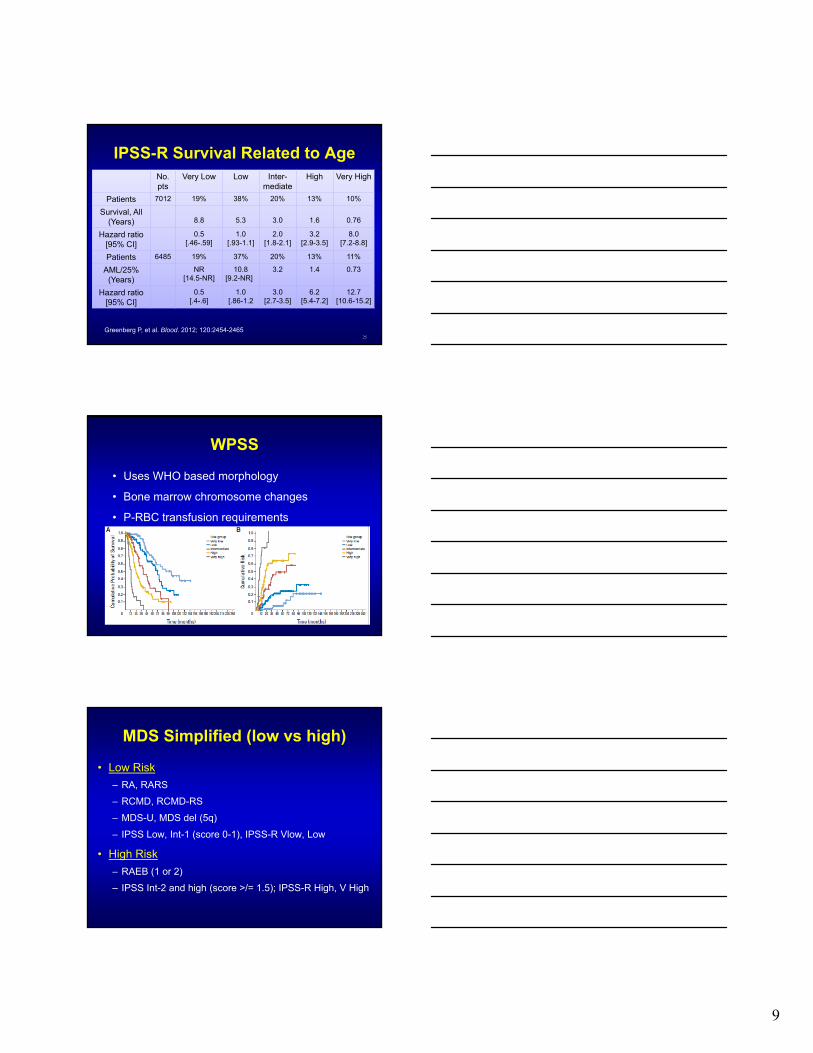
IPSS-R Survival Related to Age
25
Greenberg P, et al. Blood. 2012; 120:2454-2465
No. pts
Very Low Low Inter-mediate
High Very High
Patients 7012 19% 38% 20% 13% 10%
Survival, All(Years) 8.8 5.3 3.0 1.6 0.76
Hazard ratio[95% CI]
0.5[.46-.59]
1.0[.93-1.1]
2.0[1.8-2.1]
3.2[2.9-3.5]
8.0[7.2-8.8]
Patients 6485 19% 37% 20% 13% 11%
AML/25%(Years)
NR[14.5-NR]
10.8[9.2-NR]
3.2 1.4 0.73
Hazard ratio[95% CI]
0.5[.4-.6]
1.0[.86-1.2
3.0[2.7-3.5]
6.2[5.4-7.2]
12.7[10.6-15.2]
WPSS
• Uses WHO based morphology
• Bone marrow chromosome changes
• P-RBC transfusion requirements
MDS Simplified (low vs high)
• Low Risk
– RA, RARS
– RCMD, RCMD-RS
– MDS-U, MDS del (5q)
– IPSS Low, Int-1 (score 0-1), IPSS-R Vlow, Low
• High Risk
– RAEB (1 or 2)
– IPSS Int-2 and high (score >/= 1.5); IPSS-R High, V High
10
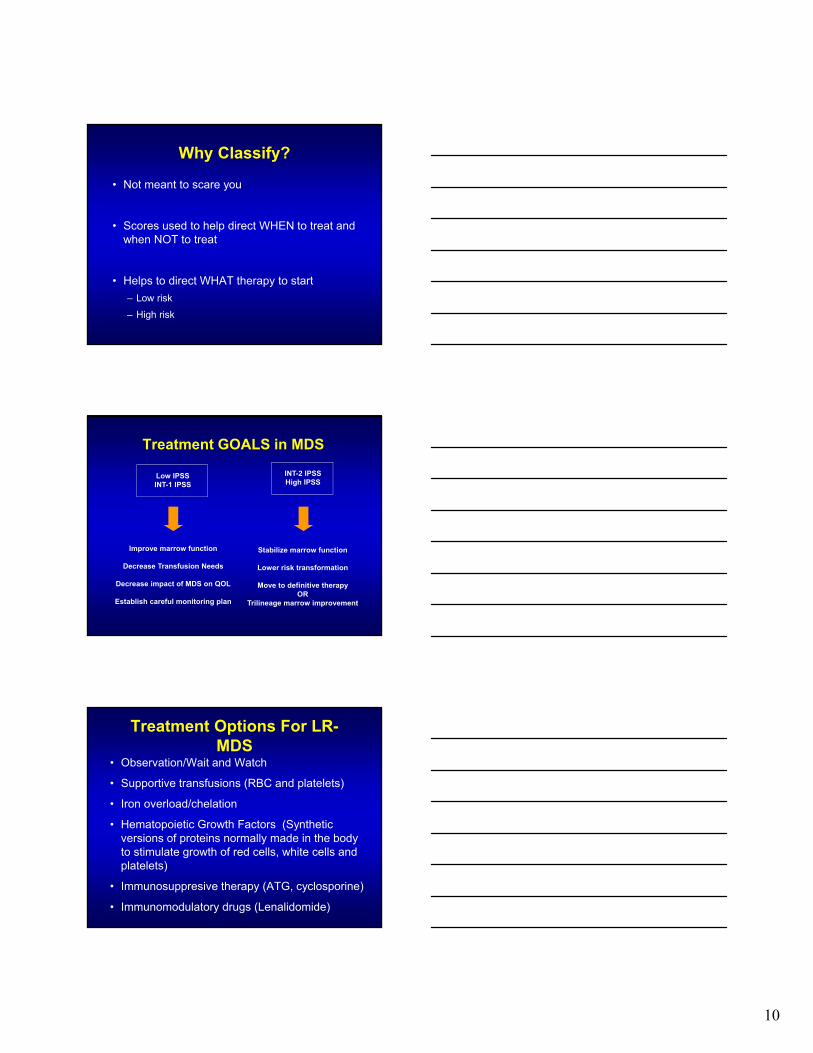
Why Classify?
• Not meant to scare you
• Scores used to help direct WHEN to treat and when NOT to treat
• Helps to direct WHAT therapy to start
– Low risk
– High risk
Treatment GOALS in MDS
Low IPSSINT-1 IPSS
INT-2 IPSSHigh IPSS
Improve marrow function
Decrease Transfusion Needs
Decrease impact of MDS on QOL
Establish careful monitoring plan
Stabilize marrow function
Lower risk transformation
Move to definitive therapyOR
Trilineage marrow improvement
Treatment Options For LR-MDS
• Observation/Wait and Watch
• Supportive transfusions (RBC and platelets)
• Iron overload/chelation
• Hematopoietic Growth Factors (Synthetic versions of proteins normally made in the body to stimulate growth of red cells, white cells and platelets)
• Immunosuppresive therapy (ATG, cyclosporine)
• Immunomodulatory drugs (Lenalidomide)
11
Supportive Care• Anti-microbial care if neutropenic
– Acyclovir, fluconazole
– Neutropenic precautions (sushi, raw oysters)
• Red Blood Cell Transfusions
– 2units/mo (moderate)
– 4units/mo (high) (100 units over 2 years)
– 100 units ~=~ 20 grams iron
• Iron chelation
– Deferoxamine can improve survival and decrease liver/endocrine complications (kids/thalassemia)
31
Iron Overload
• Serum ferritin concentration (>1000microg/L)
• Evidence of organ related damage (liver, heart)
• Liver biopsy
– Standard for kids,not feasible in MDS pts
• MRI
– Investigational, potential for broad access
• Magnetic susceptometry (SQUID)
– Investigational, very limited access
32
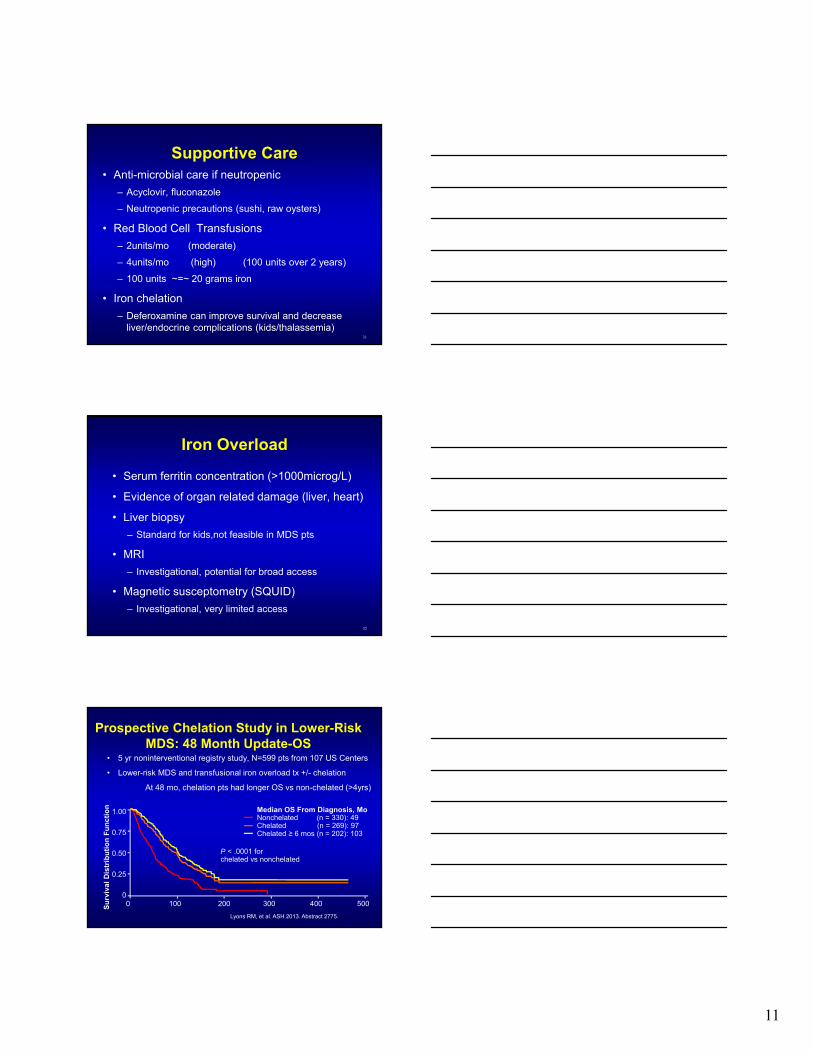
Prospective Chelation Study in Lower-Risk MDS: 48 Month Update-OS
• 5 yr noninterventional registry study, N=599 pts from 107 US Centers
• Lower-risk MDS and transfusional iron overload tx +/- chelation
At 48 mo, chelation pts had longer OS vs non-chelated (>4yrs)
Lyons RM, et al. ASH 2013. Abstract 2775. .
P < .0001 for chelated vs nonchelated
0 100 200 300 400 500
1.00
0.75
0.50
0.25
0
Su
rviv
al D
istr
ibu
tio
n F
un
ctio
n Median OS From Diagnosis, MoNonchelated (n = 330): 49Chelated (n = 269): 97Chelated ≥ 6 mos (n = 202): 103
12
Prospective Chelation Study in Lower-Risk MDS: 48 Mo Update-AML Transformation
• At 48 months, chelated pts had significantly longer time to AML transformation versus no chelation (>2 yrs)
– Non-chelated (n=330) = 45.6 mo
– Chelated (n=269) = 67.6 mo
– Chelated > 6mo (n=202) = 77.0 mo
• Percentages of pts who progressed to AML similar in both groups (7% vs 10%)
Lyons RM, et al. ASH 2013. Abstract 2775. .
Deferoxamine (Desferal)
• Challenges of therapy
• Subcutaneous or IV administration
• Continuous 12 hour infusion 5-7 days/ wk
• Infusion site reactions and pain
• Eye and ear side effects, need periodic exams
• Infectious complications (fungal)
• Oral version (EXJADE)….nausea and $$$
35
Growth Factors• Granulocyte Colony Stimulating Factor
(GCSF, Neupogen R)
• Granulocyte –macrophage Colony Stimulating Factor (GM-CSF, Leukine R)
• Peg-filgrastim (Neulasta R)
• Erythropoietin (EPO, Procrit R, Epogen R)
• Darbepoietin (Aranesp R)
• Thrombopoietin (TPO, romiplstim, Nplate R)
• Note, these are not FDA approved for MDS36
13
Erythropoietin Stimulating Agents (ESAs) in MDS
• Anemia is present in >80% of MDS pts
• Transfusions help but many issues
– Iron overload, fluid overload, antibody production
• Recombinant EPO is FDA approved for treating anemia associated with kidney failure
• Has been used since about 1990 in MDS
• Response rates in about 15-30% of patients
• Many studies done in >1000 pts
• Part of the NCCN MDS treatment guidelines
37
Erythopoietin (ESAs) in MDS
• Often high endogenous epo levels
• Many different doses and schedules
• Higher response rates with epo + G-CSF if epo<500mU/mL and transfusions <2U/month
• Poor probability of response if epo >500 mU/ML and transfusions >2 U/month
38
Casadevall N, et al, Blood 2004; 104: 321-327. Hellstrom-Lindberg E. Br J Haematol. 1995; 89:67-71. Hellstrom-Lindberg E. Br J Haematol. 1997; 99:344-349. Ludwig H. Semin Oncol 2002; 29: 45-54.
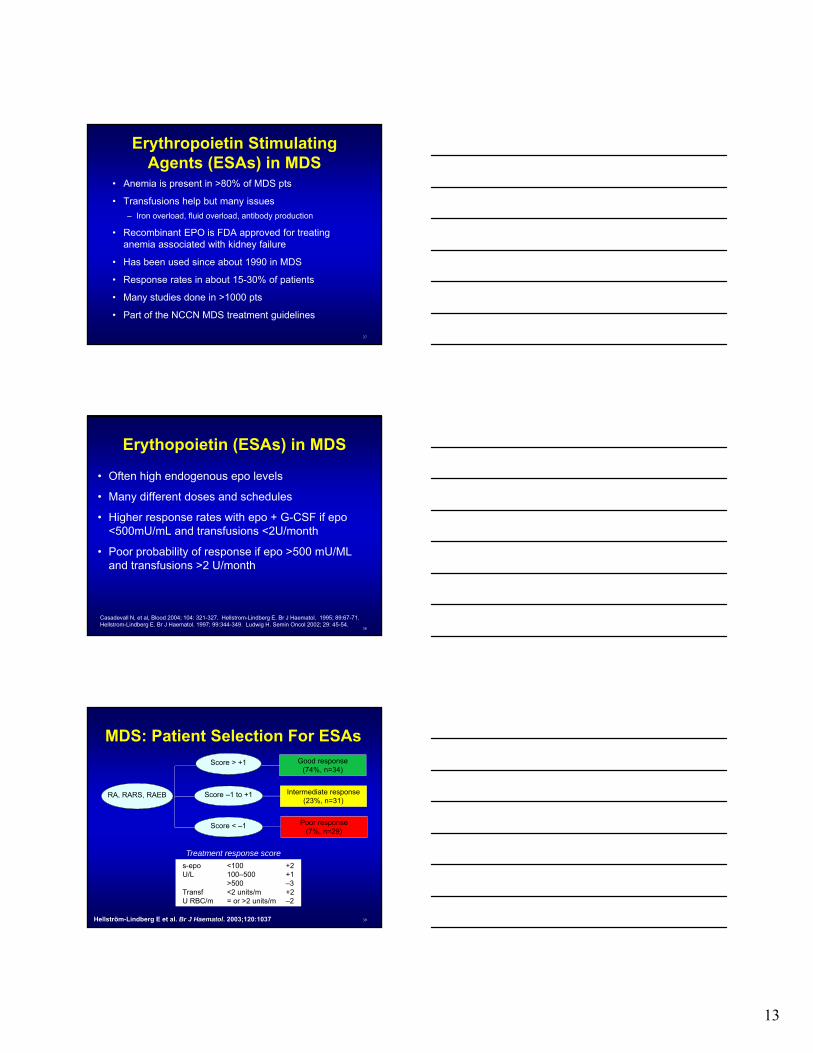
MDS: Patient Selection For ESAs
39
Good response(74%, n=34)
Intermediate response(23%, n=31)
Poor response(7%, n=29)
RA, RARS, RAEB
Score > +1
Score –1 to +1
Score < –1
s-epo <100 +2U/L 100–500 +1
>500 –3Transf <2 units/m +2U RBC/m = or >2 units/m –2
Treatment response score
Hellström-Lindberg E et al. Br J Haematol. 2003;120:1037
14
ESAs in MDS
• Varying response criteria in clinical trials ~40%
• Usually complete response is an increase in HgB to at least 11.5 without transfusions, partial response is an increase of HgB by at least 1.5 g/dl or reduction in transfusion requirements
• Responses usually in 12-16 weeks
• Generally well tolerated
• Side effects: hypertension, fever, headache, nausea, chest pain
40
ESA’s: Side Effect Issue
• Studies of EPO in solid tumor patients showed increased heart attacks, stroke, heart failure, blood clots, increased tumor growth, death, especially when HgB >12
• Has resulted in concern for MDS patients but NO DATA yet showing these effects in MDS pts.
• Has had major effects on insurance coverage
41
ESA’s
• EPO and G-CSF treatment associated with improved survival in MDS
• Mostly low risk patients
• Erythroid response 39% med duration 23 months
• Improved survival in pts requiring fewer than 2u per month
• No increase in AML
42Jadersten et al, JCO, vol 26, July 2008

15
ESA’s: Summary
• Not likely able to get this therapy unless HgB <10 (insurance company will deny coverage)
• Don’t stay on it if it is not working (Stop after 12-16 weeks if not improved)
• Can alter your bone marrow biopsy results
• In patients with RARS, use it in combination with G-CSF
43
Stimulating WBC With G
• Not routine
• Active infections, recurrent/resistant infections, neutropenic fever
• Can be combined with ESA’s to improve responses in some patients (i.e. RARS)
• Side effects: fever, bone pain, injection site reactions
• Does stimulating white cells cause leukemia?
44
Rombiplostim
• In patients receiving 5AC, Romiplostim vs placebo
– Increased PLT count over time and increases PLT count nadir during tx cycles
– Reduced incidence of clinically significant thromocytopenic events (bleeds)
– Reduced incidence of PLT transfusions
• Romiplostim plus 5AC well tolerated
45
Giagounidis, A. et al, Tx with Rombiplostim in thrombocytopenic pts with Low or Int-1 Risk MDS: Results of a Randomized DB Placebo Study. ASH 2011
16
Lenalidomide in MDS With Del 5q
• Improvement in MDS
– Duration of transfusion independence (>2.2 years)
– HgB increased (median 3.2 g/dL)
– Time to initial response (4.5 wk)
• Practical issues with Lenalidomide
– CBC weekly for at least first 8 weeks, significant neutropenia and thrombocytopenia
– Dose adjustments needed
46List A, NEJM 2006; 355: 1456-65
Epigenetic Therapies
• Azacitidine (Vidaza)
• Decitabine (Dacogen)
47
Epigenetics
• Inheritable changes in gene expression patterns that are not due to DNA sequence
• Changes mediated by covalent attachment of chemical groups (i.e. acetyl, methyl) to DNA and associated proteins (chromatin, histones)
• Key in modifying differential expression of genes and defining cellular identity
• Key in transforming normal to malignant cells
48
17
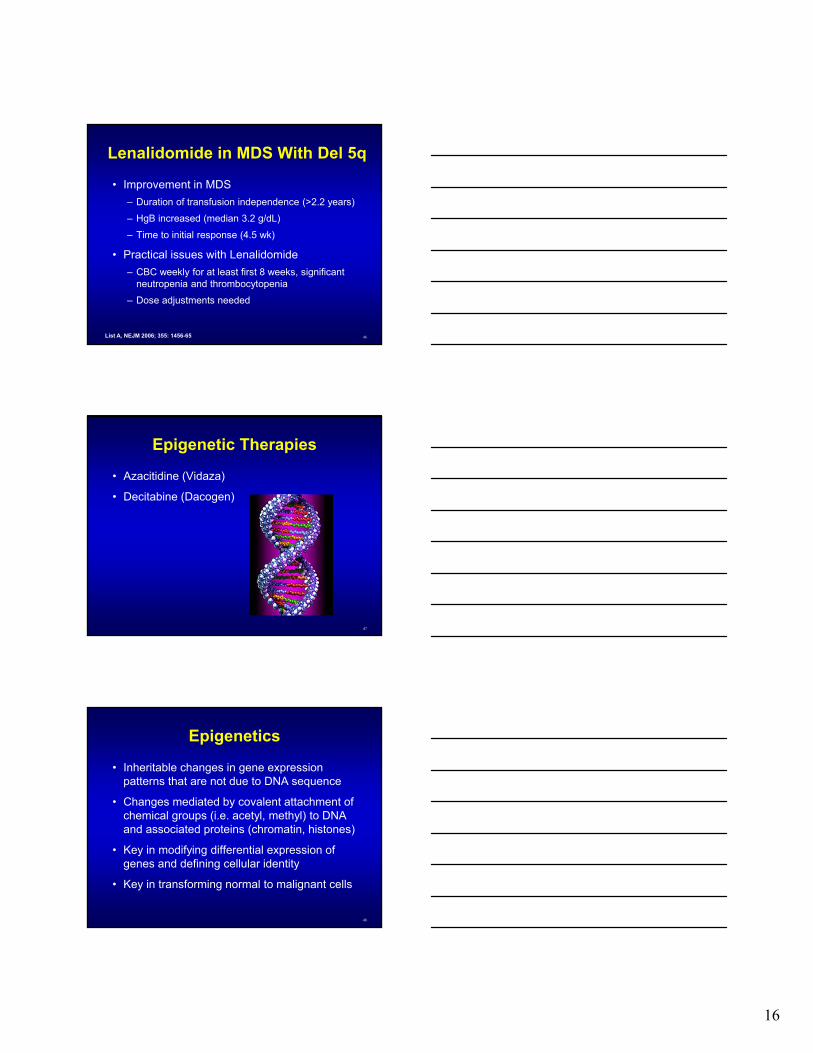
DNMT- 3
DNMT- 1
Herman and Baylin NEJM 2003
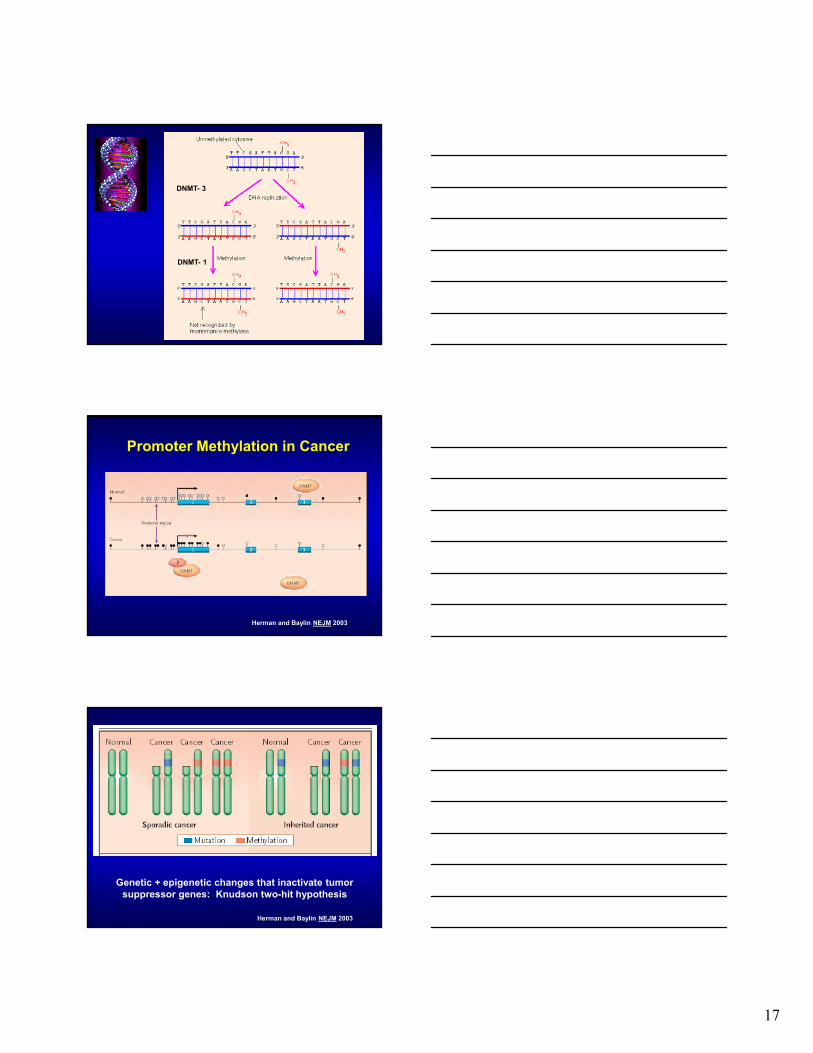
Promoter Methylation in Cancer
Genetic + epigenetic changes that inactivate tumor suppressor genes: Knudson two-hit hypothesis
Herman and Baylin NEJM 2003
18
What to Expect:Azacitidine/Decitabine
• Given every 28 days (once a month)
– AZA 75mg/m2 SC or IV x 7days every month
– DAC 20mg/m2 IV x 5days every month
• Need to give at least 4-6 cycles
– Side effects: nausea, vomiting, decreased counts (WBC, RBC, plats), fatigue, fevers, infections
– Side effects are manageable: antibiotics, anti-emetics and transfusions
52List A, NEJM 2006; 355: 1456-65
53
54
Questions??
19
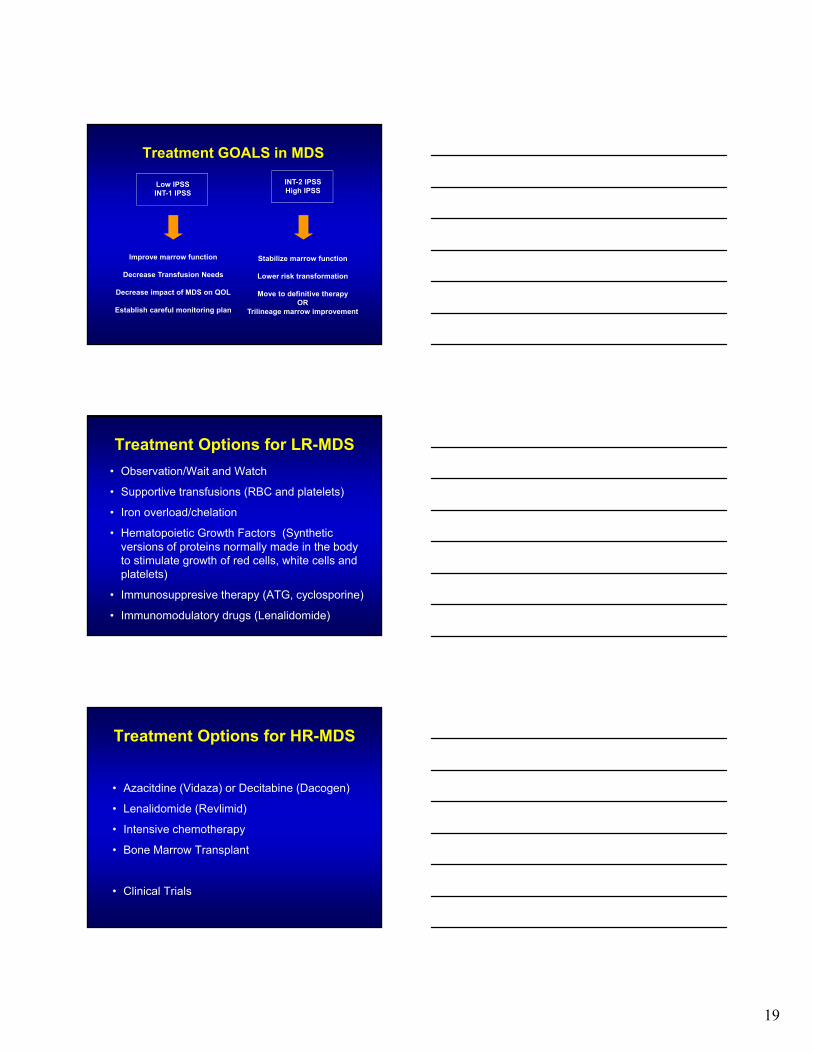
Treatment GOALS in MDS
Low IPSSINT-1 IPSS
INT-2 IPSSHigh IPSS
Improve marrow function
Decrease Transfusion Needs
Decrease impact of MDS on QOL
Establish careful monitoring plan
Stabilize marrow function
Lower risk transformation
Move to definitive therapyOR
Trilineage marrow improvement
Treatment Options for LR-MDS
• Observation/Wait and Watch
• Supportive transfusions (RBC and platelets)
• Iron overload/chelation
• Hematopoietic Growth Factors (Synthetic versions of proteins normally made in the body to stimulate growth of red cells, white cells and platelets)
• Immunosuppresive therapy (ATG, cyclosporine)
• Immunomodulatory drugs (Lenalidomide)
Treatment Options for HR-MDS
• Azacitdine (Vidaza) or Decitabine (Dacogen)
• Lenalidomide (Revlimid)
• Intensive chemotherapy
• Bone Marrow Transplant
• Clinical Trials
20
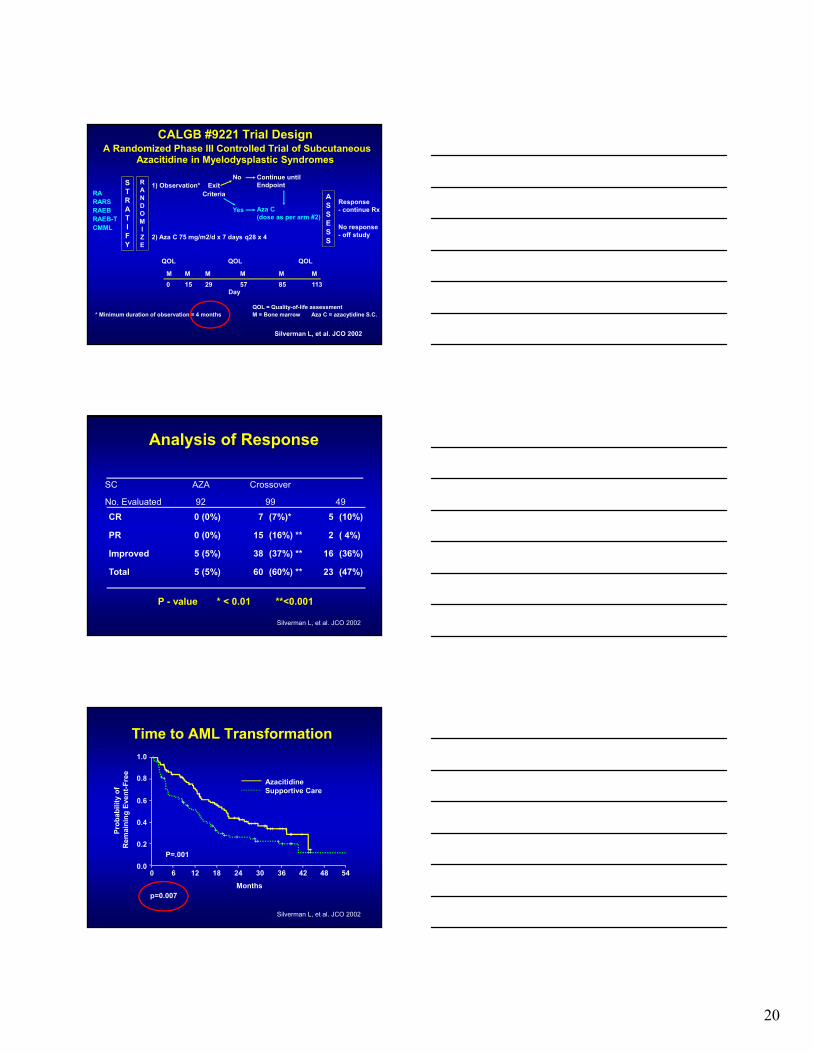
Silverman L, et al. JCO 2002
CALGB #9221 Trial DesignA Randomized Phase III Controlled Trial of Subcutaneous
Azacitidine in Myelodysplastic Syndromes
RARARSRAEBRAEB-TCMML
STRATIFY
RANDOMIZE
1) Observation*
2) Aza C 75 mg/m2/d x 7 days q28 x 4
ExitCriteria
No
Yes
Continue untilEndpoint
Aza C(dose as per arm #2)
ASSESS
Response- continue Rx
No response- off study
M M M M M M
0 15 29 57 85 113
QOL QOL QOL
Day
* Minimum duration of observation = 4 monthsQOL = Quality-of-life assessmentM = Bone marrow Aza C = azacytidine S.C.
Analysis of Response
CR 0 (0%) 7 (7%)* 5 (10%)
PR 0 (0%) 15 (16%) ** 2 ( 4%)
Improved 5 (5%) 38 (37%) ** 16 (36%)
Total 5 (5%) 60 (60%) ** 23 (47%)
P - value * < 0.01 **<0.001
Silverman L, et al. JCO 2002
SC AZA Crossover
No. Evaluated 92 99 49
Time to AML Transformation
P=.001
Pro
bab
ilit
y o
f R
emai
nin
gE
ven
t-F
ree
0.0
0.2
0.4
0.6
0.8
1.0
0 6 12 18 24 30 36 42 48 54
AzacitidineSupportive Care
Months
++++
+
++
+++ ++ ++
+++
++
++++++
+
++ +++ +++++++
++
+++++
++++
+++
p=0.007
Silverman L, et al. JCO 2002
21
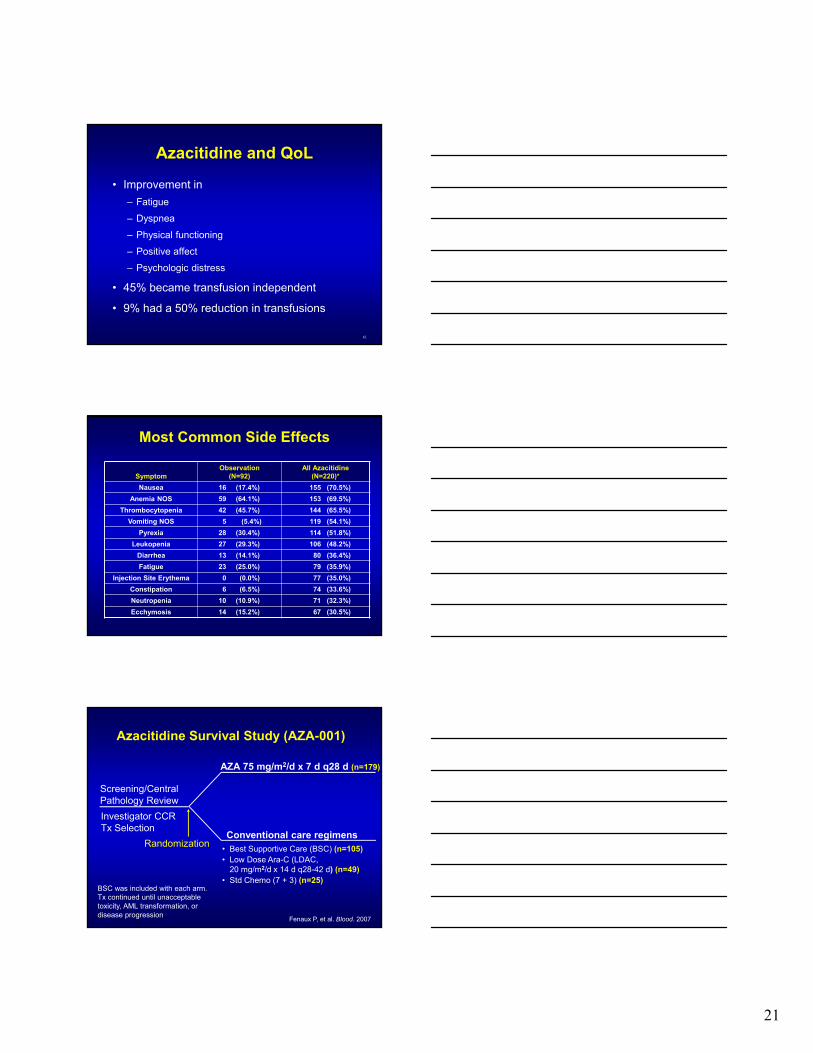
Azacitidine and QoL
• Improvement in
– Fatigue
– Dyspnea
– Physical functioning
– Positive affect
– Psychologic distress
• 45% became transfusion independent
• 9% had a 50% reduction in transfusions
61
Most Common Side Effects
Symptom Observation
(N=92)All Azacitidine
(N=220)*
Nausea 16 (17.4%) 155 (70.5%)
Anemia NOS 59 (64.1%) 153 (69.5%)
Thrombocytopenia 42 (45.7%) 144 (65.5%)
Vomiting NOS 5 (5.4%) 119 (54.1%)
Pyrexia 28 (30.4%) 114 (51.8%)
Leukopenia 27 (29.3%) 106 (48.2%)
Diarrhea 13 (14.1%) 80 (36.4%)
Fatigue 23 (25.0%) 79 (35.9%)
Injection Site Erythema 0 (0.0%) 77 (35.0%)
Constipation 6 (6.5%) 74 (33.6%)
Neutropenia 10 (10.9%) 71 (32.3%)
Ecchymosis 14 (15.2%) 67 (30.5%)
Azacitidine Survival Study (AZA-001)
Screening/CentralPathology Review
Investigator CCRTx Selection
Randomization
AZA 75 mg/m2/d x 7 d q28 d (n=179)
Conventional care regimens• Best Supportive Care (BSC) (n=105)• Low Dose Ara-C (LDAC,
20 mg/m2/d x 14 d q28-42 d) (n=49)• Std Chemo (7 + 3) (n=25)
BSC was included with each arm.Tx continued until unacceptable toxicity, AML transformation, or disease progression
Fenaux P, et al. Blood. 2007

22
Overall Survival: Azacitidine vs CCR
0 5 10 15 20 25 30 35 40
Time (months) from Randomization
0.0
0.1
0.2
0.3
0.4
0.5
0.6
0.7
0.8
0.9
1.0
Pro
po
rtio
n S
urv
ivin
g
CCRAZA
Difference: 9.4 months
24.4 months
15 months
50.8%
26.2%
Log-Rank p=0.0001HR = 0.58 [95% CI: 0.43, 0.77]Deaths: AZA = 82, CCR = 113
Fenaux, et. al., Blood. 2007
Decitabine (DAC) Phase III MDSTrial Study Design
Decitabine + Supportive Care15mg/m2/ over 3 hours q8h x 3days q6wks
(N=89)
Supportive CareABX, GFs and/or Transfusions
(N=81)
Stratification
- IPSS-Type of MDS(primary orsecondary)
EligiblePatients(n=170)
RANDOMIZED
Kantarjian H, et al. Cancer. 2006
Response assessed after 2nd cycle, with 2 more cycles given if CR
Decitabine Phase III MDS TrialMost Common Grade 3/4 Adverse Events (≥10%)
Kantarjian H, et al. Cancer. 2006
Decitabine(n=83)*
Supportive Care(n=81)
Grade 3 Grade 4 Grade 3 Grade 4
Neutropenia 10% 77% 25% 25%
Thrombocytopenia 22% 63% 27% 16%
Anemia 11% 1% 14% 1%
Febrile neutropenia 17% 6% 4% 0%
Leukopenia 8% 14% 5% 2%
Pneumonia 13% 2% 7% 2%
* Those patients exposed to decitabine
Of the 83 DAC treated pts, 8 stopped therapy for adverse events
23
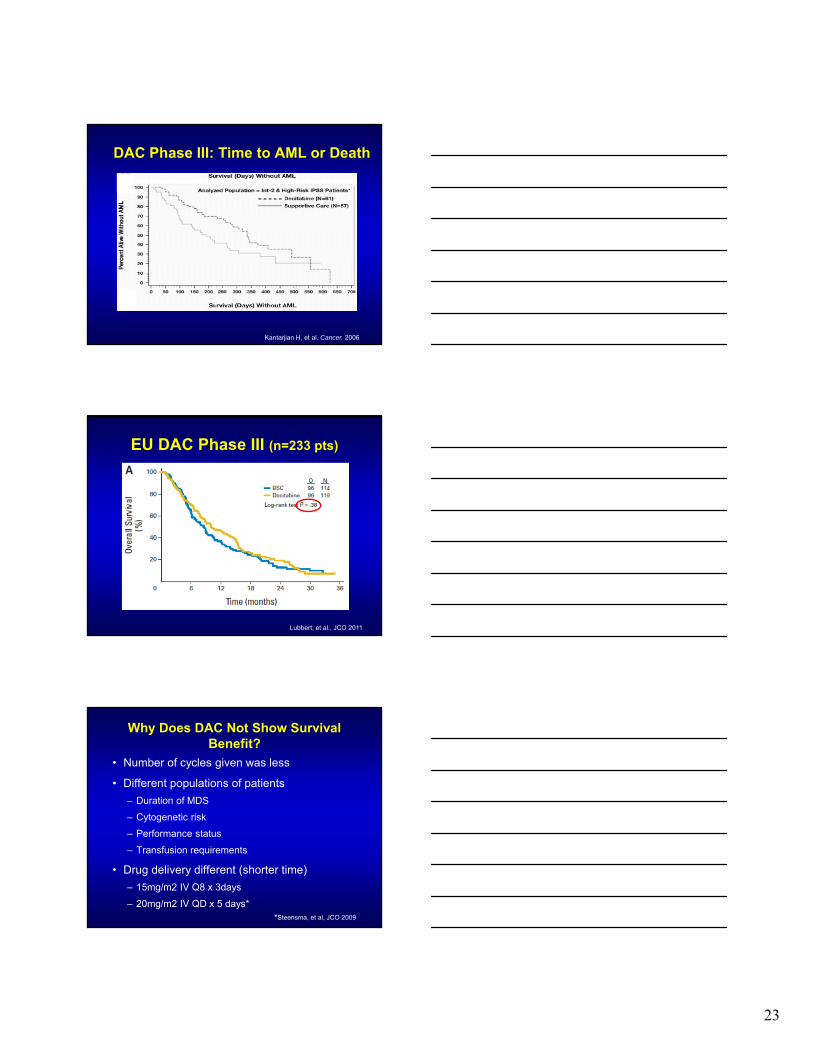
DAC Phase III: Time to AML or Death
Kantarjian H, et al. Cancer. 2006
EU DAC Phase III (n=233 pts)
Lubbert, et al., JCO 2011
Why Does DAC Not Show Survival Benefit?
• Number of cycles given was less
• Different populations of patients
– Duration of MDS
– Cytogenetic risk
– Performance status
– Transfusion requirements
• Drug delivery different (shorter time)
– 15mg/m2 IV Q8 x 3days
– 20mg/m2 IV QD x 5 days**Steensma, et al, JCO 2009

24
General HMA Recommendations
• EARLY declaration of failure may be a mistake as responses can be seen after cycle 6
• Continuous dosing is recommended as long as pts are responding/stable (i.e., DON’T STOP!)
• Drug holidays are NOT recommended as pts who progress are less likely to respond when re-challenged with drug
• Dose reductions are favored for pts on long-term treatment who develop cytopenias (vs. prolonged dosing intervals)
• Bone marrow evaluation suggested for every 4-6 cycles in responding pts
Therapy for HR-MDS
• Azacitidine or Decitabine– Clinical responses 35-50%
– Improves QoL (i.e. decreased transfusions)
– Decrease risk of progression to AML
– Improve survival (AZA only)
– Need 4 to 6 cycles of therapy to assess response
– If respond, then continue as long as side effects tolerable
– Not a cure
• Bone Marrow Transplant
– cure
BMT: How To Decide
• Is the patient strong/fit enough for BMT?
• Is there a donor?
• Risks: infection risk, organ damage and graft versus host disease (new immune system attacks patient normal cells not just the MDS), death from procedure (15-30%).
• Need to balance the risk of disease progression to risk of treatment.

25
Stem Cell Transplant: Approximate Life Expectancy (yrs)
Immediate BMT
Transplant in2 yrs
Transplant at progression
Low 6.51 6.86 7.21
Int-1 4.61 4.74 5.16
Int-2 4.93 3.21 2.84
High 3.20 2.75 2.75
Cutler C, et al. Blood 2004
RIC vs High Dose Conditioning BMT
Scott et al., Leukemia 2006
BMT: What To Expect• Standard full ablation for pts <65 years old
• Check for a full match from siblings or national registry (blood test takes about 2-4 weeks for results)
• Full BMT: Inpatient stay 3-6 weeks for chemotherapy, transplant infusion, and monitor counts (transfusion dependent) and manage infections
• Alternative transplants from half match /cord
– can use siblings, parents, children in pts >65 y.old
26
Conclusion: High Risk MDS
• Hypomethylating agents
– AZA
– DAC
• Bone marrow transplant
– Full myeloablative
– Non-myeloablative
• Clinical trials
New Treatments for MDS: What’s on the Horizon?
Hetty Carraway, MD, MBATaussig Cancer InstituteCleveland ClinicJuly 26, 2014
Outline
1. Biology (via mutation annotation)
2. Treatment MDS
3. Novel Agents in MDS
27
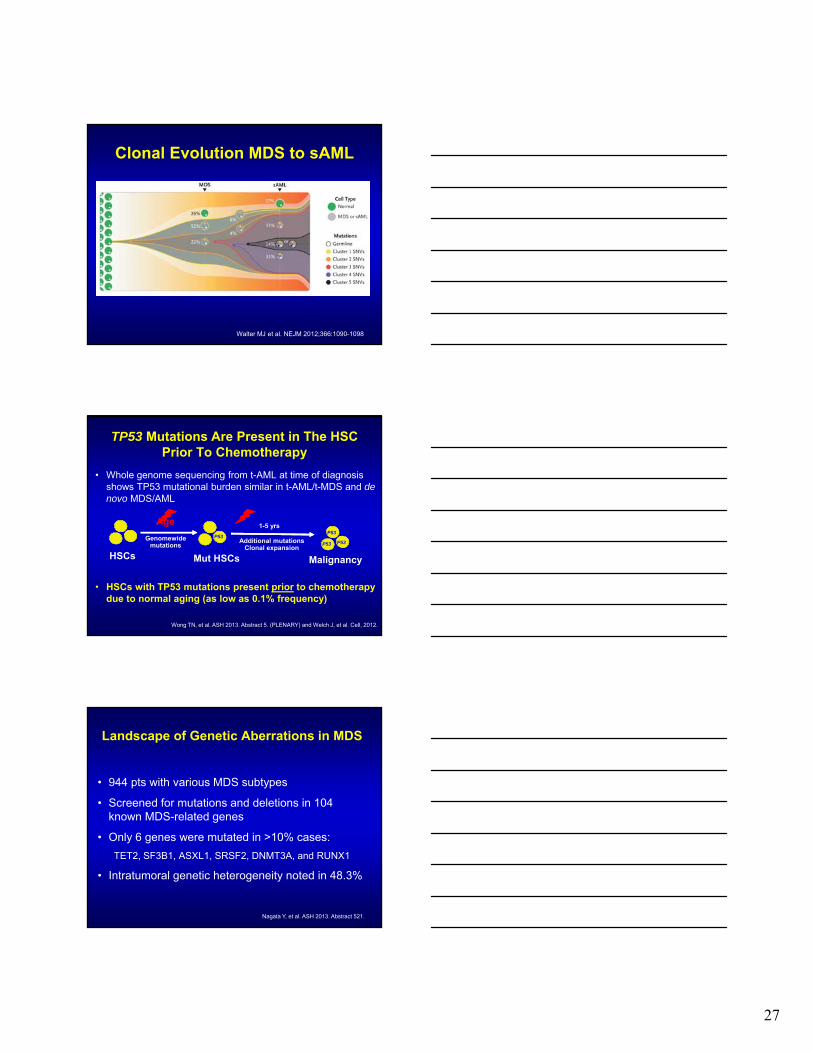
Clonal Evolution MDS to sAML
Walter MJ et al. NEJM 2012;366:1090-1098
TP53 Mutations Are Present in The HSC Prior To Chemotherapy
• Whole genome sequencing from t-AML at time of diagnosis shows TP53 mutational burden similar in t-AML/t-MDS and de novo MDS/AML
• HSCs with TP53 mutations present prior to chemotherapy due to normal aging (as low as 0.1% frequency)
Wong TN, et al. ASH 2013. Abstract 5. (PLENARY) and Welch J, et al. Cell, 2012. .
P53P53
P53 P53Additional mutationsClonal expansion
1-5 yrs
Genomewidemutations
HSCs Mut HSCs Malignancy
Age
Landscape of Genetic Aberrations in MDS
• 944 pts with various MDS subtypes
• Screened for mutations and deletions in 104 known MDS-related genes
• Only 6 genes were mutated in >10% cases:
TET2, SF3B1, ASXL1, SRSF2, DNMT3A, and RUNX1
• Intratumoral genetic heterogeneity noted in 48.3%
Nagata Y, et al. ASH 2013. Abstract 521. .
28
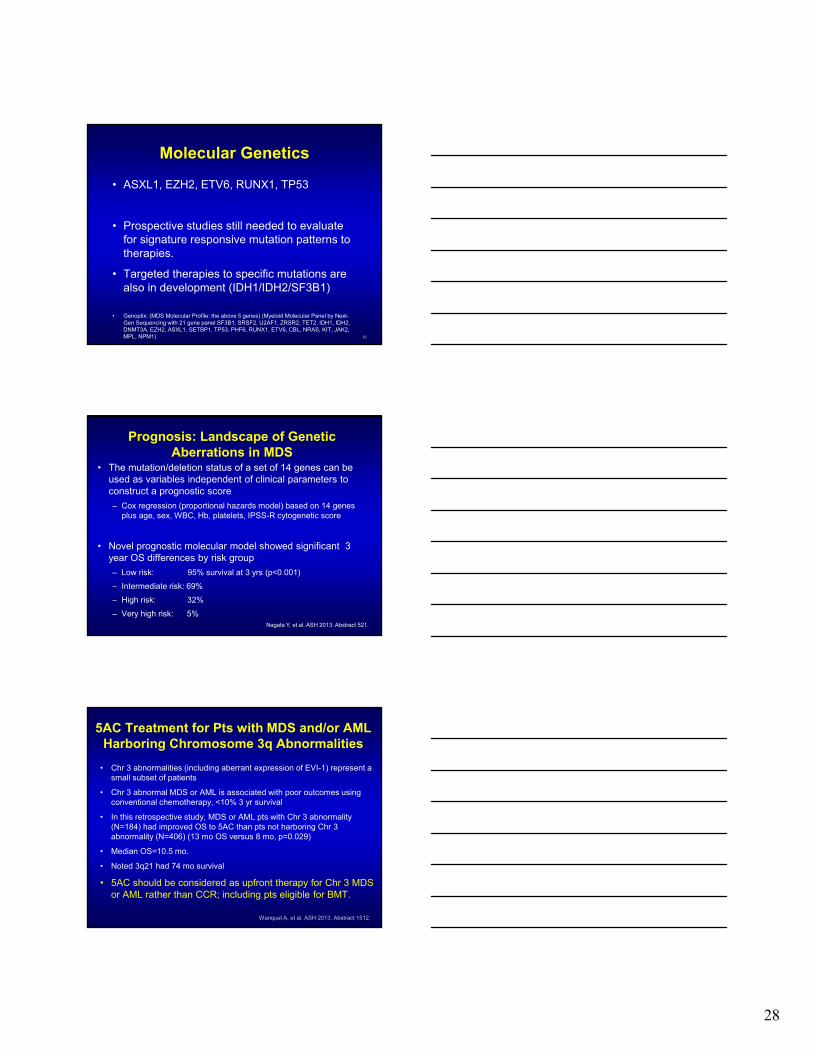
Molecular Genetics
• ASXL1, EZH2, ETV6, RUNX1, TP53
• Prospective studies still needed to evaluate for signature responsive mutation patterns to therapies.
• Targeted therapies to specific mutations are also in development (IDH1/IDH2/SF3B1)
• Genoptix: (MDS Molecular Profile: the above 5 genes) (Myeloid Molecular Panel by Next-Gen Sequencing with 21 gene panel SF3B1, SRSF2, U2AF1, ZRSR2, TET2, IDH1, IDH2, DNMT3A, EZH2, ASXL1, SETBP1, TP53, PHF6, RUNX1, ETV6, CBL, NRAS, KIT, JAK2, MPL, NPM1) 82
Prognosis: Landscape of Genetic Aberrations in MDS
• The mutation/deletion status of a set of 14 genes can be used as variables independent of clinical parameters to construct a prognostic score
– Cox regression (proportional hazards model) based on 14 genes plus age, sex, WBC, Hb, platelets, IPSS-R cytogenetic score
• Novel prognostic molecular model showed significant 3 year OS differences by risk group
– Low risk: 95% survival at 3 yrs (p<0.001)
– Intermediate risk: 69%
– High risk: 32%
– Very high risk: 5%Nagata Y, et al. ASH 2013. Abstract 521. .
5AC Treatment for Pts with MDS and/or AML Harboring Chromosome 3q Abnormalities
• Chr 3 abnormalities (including aberrant expression of EVI-1) represent a small subset of patients
• Chr 3 abnormal MDS or AML is associated with poor outcomes using conventional chemotherapy, <10% 3 yr survival
• In this retrospective study, MDS or AML pts with Chr 3 abnormality (N=184) had improved OS to 5AC than pts not harboring Chr 3 abnormality (N=406) (13 mo OS versus 8 mo, p=0.029)
• Median OS=10.5 mo.
• Noted 3q21 had 74 mo survival
• 5AC should be considered as upfront therapy for Chr 3 MDS or AML rather than CCR; including pts eligible for BMT.
Wanquet A, et al. ASH 2013. Abstract 1512.
29
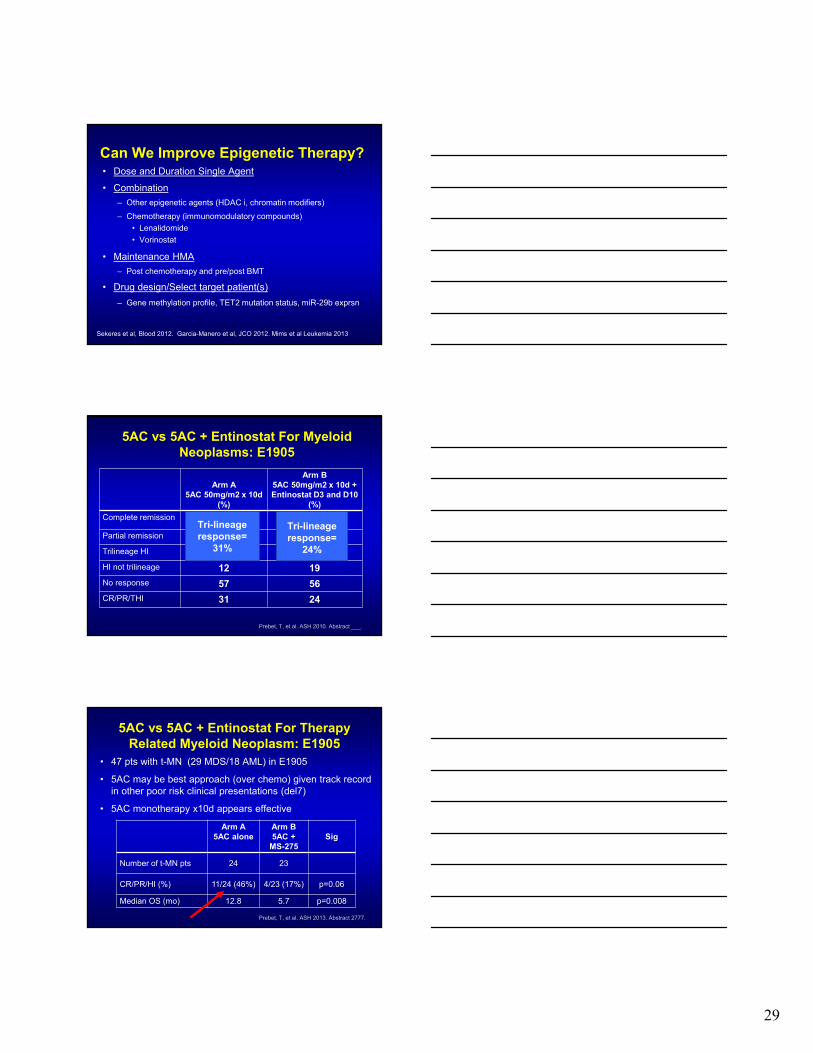
Can We Improve Epigenetic Therapy?• Dose and Duration Single Agent
• Combination
– Other epigenetic agents (HDAC i, chromatin modifiers)
– Chemotherapy (immunomodulatory compounds)
• Lenalidomide
• Vorinostat
• Maintenance HMA
– Post chemotherapy and pre/post BMT
• Drug design/Select target patient(s)
– Gene methylation profile, TET2 mutation status, miR-29b exprsn
Sekeres et al, Blood 2012. Garcia-Manero et al, JCO 2012. Mims et al Leukemia 2013
5AC vs 5AC + Entinostat For Myeloid Neoplasms: E1905
Arm A5AC 50mg/m2 x 10d
(%)
Arm B5AC 50mg/m2 x 10d +Entinostat D3 and D10
(%)
Complete remission 12 7
Partial remission 9 7
Trilineage HI 10 10
HI not trilineage 12 19
No response 57 56
CR/PR/THI 31 24
Prebet, T, et al. ASH 2010. Abstract ___.
Tri-lineage response=
31%
Tri-lineage response=
24%
5AC vs 5AC + Entinostat For Therapy Related Myeloid Neoplasm: E1905
• 47 pts with t-MN (29 MDS/18 AML) in E1905
• 5AC may be best approach (over chemo) given track record in other poor risk clinical presentations (del7)
• 5AC monotherapy x10d appears effective
Arm A5AC alone
Arm B5AC +
MS-275Sig
Number of t-MN pts 24 23
CR/PR/HI (%) 11/24 (46%) 4/23 (17%) p=0.06
Median OS (mo) 12.8 5.7 p=0.008
Prebet, T, et al. ASH 2013. Abstract 2777.

30
Experience With Combination EpigeneticAgents in MDS/AML
88
Study N Agents CR(%)
ORR (%)
Gore 36 5AC/PB 14 38
Gore 27 5AC/MS275 7 44
Soriano 53 5AC/VPA/ATRA 22 42
Garcia-Manero 37 5AC/MGCD0103 11 52
Silverman 23 5AC/Vorinostat 45 83
Garcia-Manero 54 DAC/VPA 19 22
Blum 25 DAC/VPA 16 44
Issa 31 DAC/Vorinostat 3 17
Yee 27 DAC/Vorinostat 4 16
A Phase II Trial of Epigenetic Modulators Vorinostat in Combination with 5AC in Pts with MDS: Initial Results
Silverman L, et al. ASH 2013. Abstract 386.
Cohort 1 2 3
N 13 13 14
5AC mg/m2 (SC) 55 75 55
Days (5AC) 1-7 1-7 1-7
V mg PO QD 400 600 400
Days (V) 3-16 3-9 3-9
Int-1 3 3 2
Int-2 3 4 5
High Risk 5 4 3
Unclassified 2 2 3
Response rate 70% 73% 67%
• Combination is safe• Deliver multiple cycles • Suggestive that combination
therapy is better than monotherapy
• Cohort 2 +3 associated with longer duration of response (V for 7d)
• Intergroup Study SWOG 1117 ongoing (uses cohort 2)
North American Intergroup Randomized Phase 2 MDS Study: S1117
Sekeres M, et al. Personal Correspondence.
Groups: SWOG, ECOG,CALGB, NCIC
Total Sample Size: 240
Primary Objective: 20%improvement of RR based on 2006 IWG Criteria
Secondary Objectives: OS,RFS, LFS
Power 81%, alpha 0.05 for each combo arm vs. AZA
Anticipated time: 2.5 years
AZAN=80
AZA + LENN=80
AZA + VORINN=80
Higher-risk MDS
(IPSS >1.5)
31
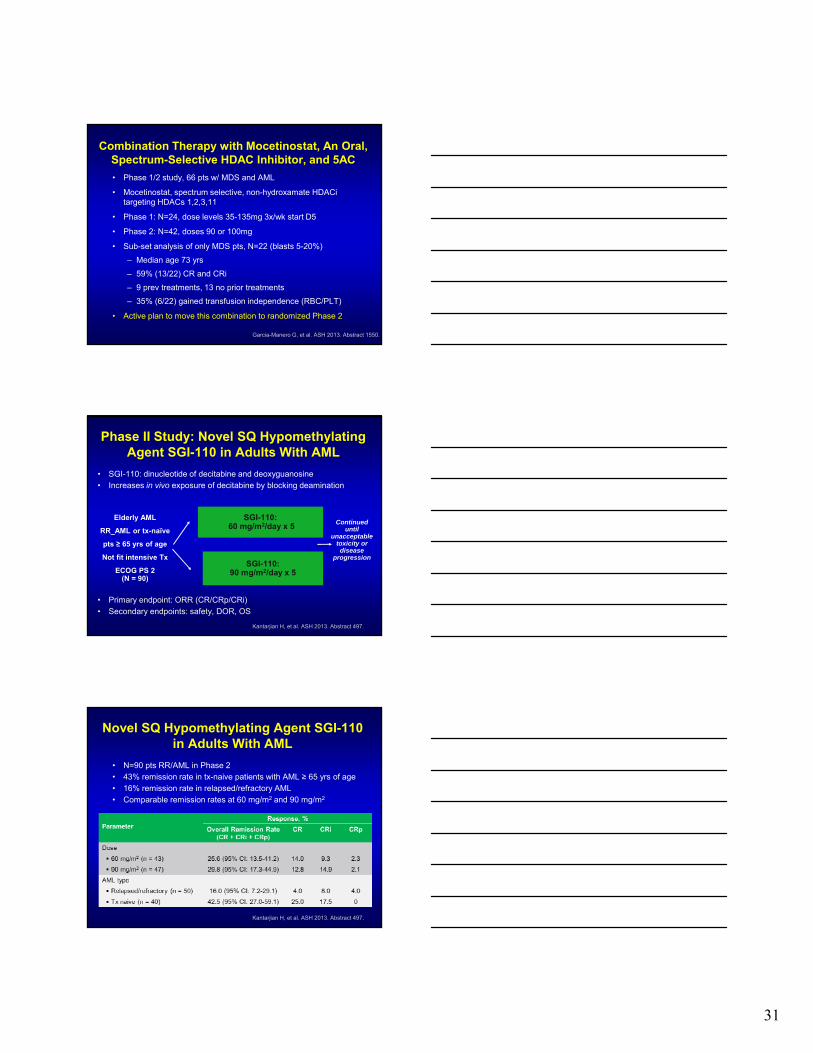
Combination Therapy with Mocetinostat, An Oral, Spectrum-Selective HDAC Inhibitor, and 5AC
• Phase 1/2 study, 66 pts w/ MDS and AML
• Mocetinostat, spectrum selective, non-hydroxamate HDACitargeting HDACs 1,2,3,11
• Phase 1: N=24, dose levels 35-135mg 3x/wk start D5
• Phase 2: N=42, doses 90 or 100mg
• Sub-set analysis of only MDS pts, N=22 (blasts 5-20%)
– Median age 73 yrs
– 59% (13/22) CR and CRi
– 9 prev treatments, 13 no prior treatments
– 35% (6/22) gained transfusion independence (RBC/PLT)
• Active plan to move this combination to randomized Phase 2
Garcia-Manero G, et al. ASH 2013. Abstract 1550.
Phase II Study: Novel SQ HypomethylatingAgent SGI-110 in Adults With AML
• SGI-110: dinucleotide of decitabine and deoxyguanosine• Increases in vivo exposure of decitabine by blocking deamination
• Primary endpoint: ORR (CR/CRp/CRi)
• Secondary endpoints: safety, DOR, OS
Kantarjian H, et al. ASH 2013. Abstract 497.
SGI-110:60 mg/m2/day x 5
Elderly AML
RR_AML or tx-naïve
pts ≥ 65 yrs of age
Not fit intensive Tx
ECOG PS 2(N = 90)
Continued until
unacceptable toxicity or disease
progressionSGI-110:
90 mg/m2/day x 5
Novel SQ Hypomethylating Agent SGI-110 in Adults With AML
• N=90 pts RR/AML in Phase 2• 43% remission rate in tx-naive patients with AML ≥ 65 yrs of age
• 16% remission rate in relapsed/refractory AML• Comparable remission rates at 60 mg/m2 and 90 mg/m2
Kantarjian H, et al. ASH 2013. Abstract 497.
32
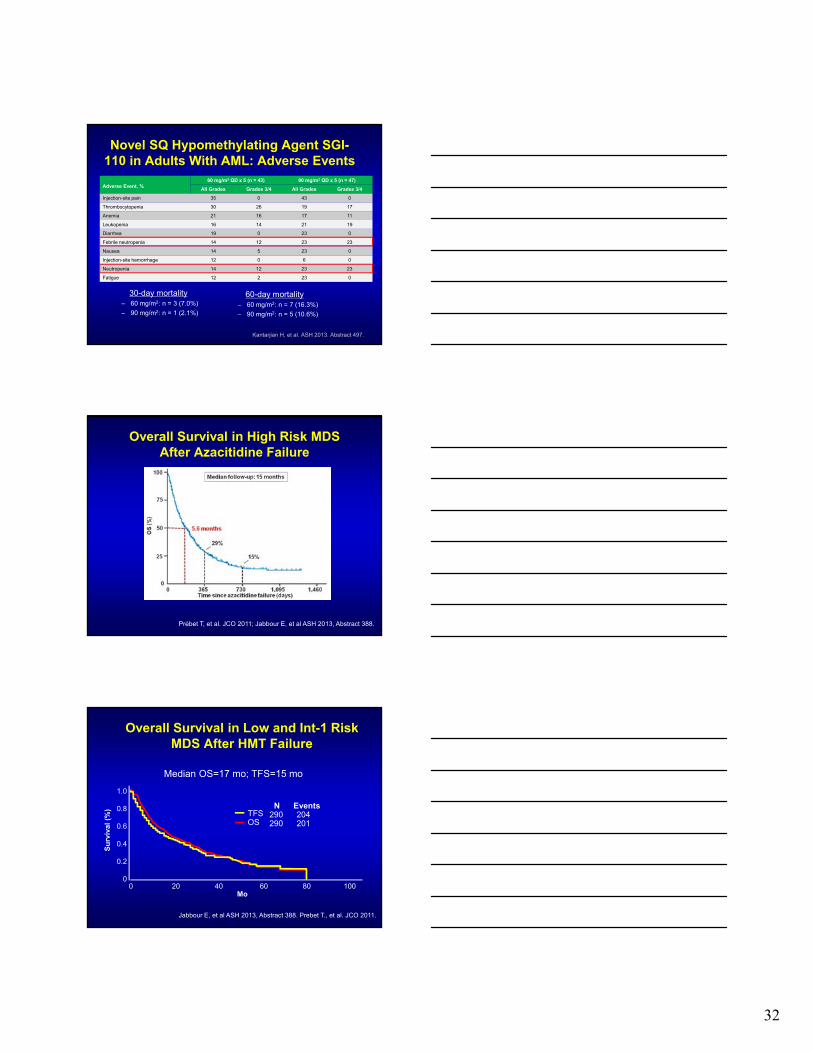
Novel SQ Hypomethylating Agent SGI-110 in Adults With AML: Adverse Events
Kantarjian H, et al. ASH 2013. Abstract 497.
Adverse Event, %60 mg/m2 QD x 5 (n = 43) 90 mg/m2 QD x 5 (n = 47)
All Grades Grades 3/4 All Grades Grades 3/4
Injection-site pain 35 0 43 0
Thrombocytopenia 30 26 19 17
Anemia 21 16 17 11
Leukopenia 16 14 21 19
Diarrhea 19 0 23 0
Febrile neutropenia 14 12 23 23
Nausea 14 5 23 0
Injection-site hemorrhage 12 0 6 0
Neutropenia 14 12 23 23
Fatigue 12 2 23 0
30-day mortality– 60 mg/m2: n = 3 (7.0%)
– 90 mg/m2: n = 1 (2.1%)
60-day mortality– 60 mg/m2: n = 7 (16.3%)
– 90 mg/m2: n = 5 (10.6%)
Overall Survival in High Risk MDS After Azacitidine Failure
Prébet T, et al. JCO 2011; Jabbour E, et al ASH 2013, Abstract 388.
Overall Survival in Low and Int-1 Risk MDS After HMT Failure
Jabbour E, et al ASH 2013, Abstract 388. Prebet T., et al. JCO 2011.
0 20 40 60 80 100Mo
1.0
0.8
0.6
0.4
0.2
0
Su
rviv
al (
%) TFS
OS
N Events 290 204 290 201
Median OS=17 mo; TFS=15 mo
33
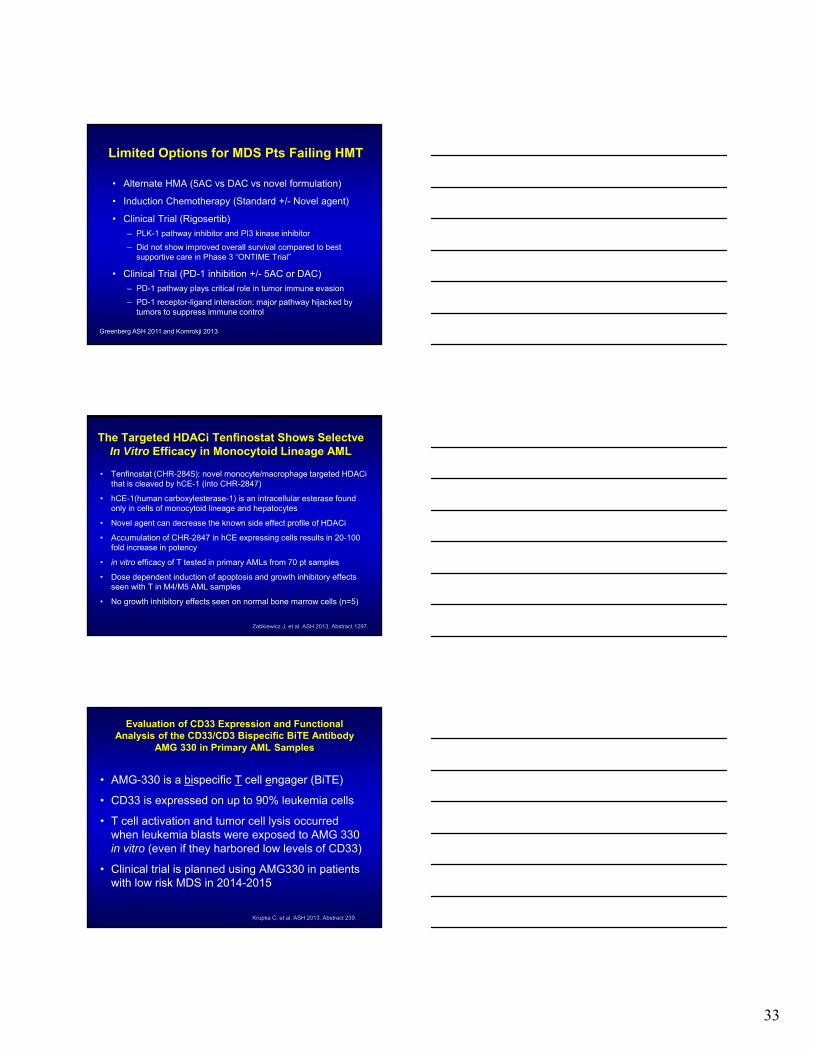
Limited Options for MDS Pts Failing HMT
• Alternate HMA (5AC vs DAC vs novel formulation)
• Induction Chemotherapy (Standard +/- Novel agent)
• Clinical Trial (Rigosertib)
– PLK-1 pathway inhibitor and PI3 kinase inhibitor
– Did not show improved overall survival compared to best supportive care in Phase 3 “ONTIME Trial”
• Clinical Trial (PD-1 inhibition +/- 5AC or DAC)
– PD-1 pathway plays critical role in tumor immune evasion
– PD-1 receptor-ligand interaction: major pathway hijacked by tumors to suppress immune control
Greenberg ASH 2011 and Komrokji 2013
The Targeted HDACi Tenfinostat Shows SelectveIn Vitro Efficacy in Monocytoid Lineage AML
• Tenfinostat (CHR-2845): novel monocyte/macrophage targeted HDACithat is cleaved by hCE-1 (into CHR-2847)
• hCE-1(human carboxylesterase-1) is an intracellular esterase found only in cells of monocytoid lineage and hepatocytes
• Novel agent can decrease the known side effect profile of HDACi
• Accumulation of CHR-2847 in hCE expressing cells results in 20-100 fold increase in potency
• in vitro efficacy of T tested in primary AMLs from 70 pt samples
• Dose dependent induction of apoptosis and growth inhibitory effects seen with T in M4/M5 AML samples
• No growth inhibitory effects seen on normal bone marrow cells (n=5)
Zabkiewicz J, et al. ASH 2013. Abstract 1297.
Evaluation of CD33 Expression and Functional Analysis of the CD33/CD3 Bispecific BiTE Antibody
AMG 330 in Primary AML Samples
• AMG-330 is a bispecific T cell engager (BiTE)
• CD33 is expressed on up to 90% leukemia cells
• T cell activation and tumor cell lysis occurred when leukemia blasts were exposed to AMG 330 in vitro (even if they harbored low levels of CD33)
• Clinical trial is planned using AMG330 in patients with low risk MDS in 2014-2015
Krupka C, et al. ASH 2013. Abstract 239.
34
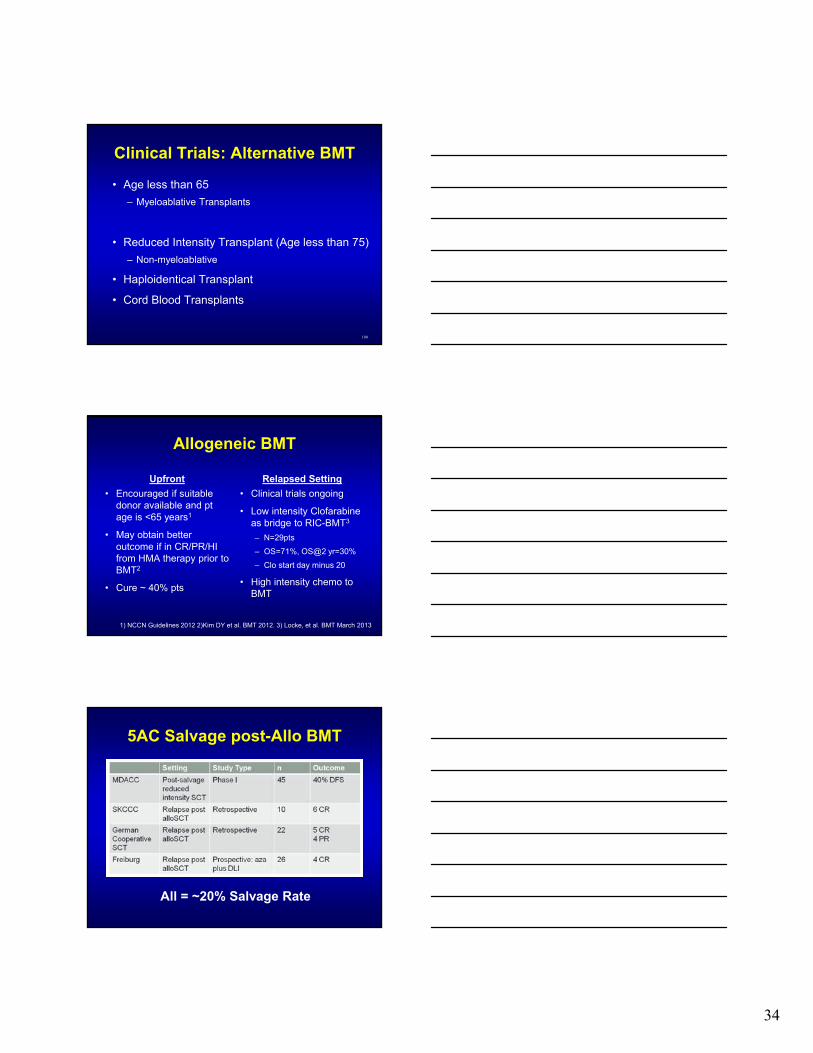
Clinical Trials: Alternative BMT
• Age less than 65
– Myeloablative Transplants
• Reduced Intensity Transplant (Age less than 75)
– Non-myeloablative
• Haploidentical Transplant
• Cord Blood Transplants
100
Allogeneic BMT
Upfront
• Encouraged if suitable donor available and ptage is <65 years1
• May obtain better outcome if in CR/PR/HI from HMA therapy prior to BMT2
• Cure ~ 40% pts
Relapsed Setting
• Clinical trials ongoing
• Low intensity Clofarabineas bridge to RIC-BMT3
– N=29pts
– OS=71%, OS@2 yr=30%
– Clo start day minus 20
• High intensity chemo to BMT
1) NCCN Guidelines 2012 2)Kim DY et al. BMT 2012. 3) Locke, et al. BMT March 2013
5AC Salvage post-Allo BMT
All = ~20% Salvage Rate
35
Conclusions: MDS
• Mutational analyses are helping to understand biology of MDS and can have valuable applications if tested prospectively.
• Combination epigenetic therapies appear safe/tolerable and seem to have promising responses: awaiting results of randomized studies.
• No new agents exist (yet) that offer improved survival for pts with MDS above results with azacitidine.
• Novel agents are needed
– watch for results of IDH1/IDH2 inhibitors
Thank you
• Thank you for your questions and for being here today to learn/teach others about MDS.
• Thank you to Cleveland Clinic for allowing me to care for patients with MDS/AML.
• Thank you to my colleagues and the foundations that continue to fight to find better answers for our patients with these diseases.
104