Embed Size (px)
Citation preview
MCS Program
ESA Program Briefing Book 2014 MCS Program
PAGE
Medical Care Services (MCS) Program Highlights ............................................................................ 1 Selected MCS Characteristics, SFY 2014 (July-December 2013) ...................................................... 2 MCS Clients by Month, SFY 2014 ..................................................................................................... 3 MCS Clients Moving to Other Programs, SFY 2014 .......................................................................... 4 MCS Clients by CSO of Issuance (DSHS Region, CSO, CSCC, and HCS Office), December 2013 Snapshot ................................................................................................................ 5 MCS Clients by CSO of Residence (DSHS Region and CSO), December 2013 Snapshot .................. 8 MCS Clients by County of Residence, December 2013 Snapshot .................................................. 10 MCS Client Demographics, December 2013 Snapshot .................................................................. 11
MCS Program
ESA Program Briefing Book 2014 MCS Program - Page 1
Medical Care Services (MCS)
Medical Care Services (MCS)1 is a state-funded program that provides limited medical assistance for low-income adults who are unable to work for at least 90 days due to a physical or mental incapacity, and are found eligible for Aged, Blind, or Disabled(ABD) cash assistance or the Housing and Essential Needs (HEN ) Referral Program. Highlights:
The MCS program served a monthly average of 9,631 recipients in SFY 2014 (from July 2013 through December 2013), a slight increase from a monthly average of 9,583 in SFY 2013.
In December 2013, the majority of MCS recipients were
male (60.4%), white (67.0%), and never married (56.8%). The average age of MCS recipients was 40.8 years.
1 During the 2013 legislative session, the Legislature passed Substitute
House Bill 2069, which narrows MCS eligibility to include only ABD and HEN recipients who are ineligible for Medicaid expansion. This change will maintain MCS coverage for aged, blind, disabled or incapacitated persons who are lawfully present in the U.S. and not eligible for federally funded medical assistance because of immigration status. The effective date for these MCS eligibility changes is January 1, 2014. MCS data from January 2014 - June 2014 can be found in the medical assistance section of this Briefing Book under State Funded Medical Care Services.
MCS Program
ESA Program Briefing Book 2014 MCS Program - Page 2
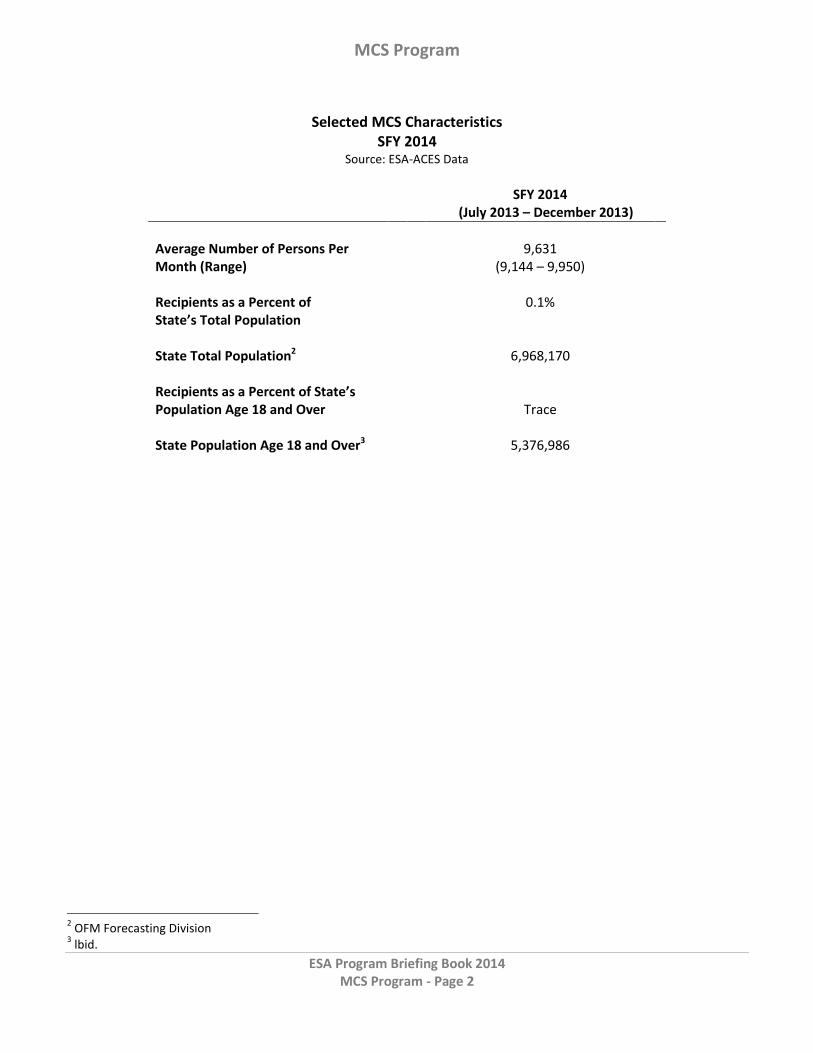
Selected MCS Characteristics SFY 2014
Source: ESA-ACES Data
SFY 2014 (July 2013 – December 2013)
Average Number of Persons Per Month (Range)
9,631 (9,144 – 9,950)
Recipients as a Percent of 0.1% State’s Total Population State Total Population2 6,968,170 Recipients as a Percent of State’s Population Age 18 and Over Trace State Population Age 18 and Over3 5,376,986
2 OFM Forecasting Division
3 lbid.
MCS Program
ESA Program Briefing Book 2014 MCS Program - Page 3
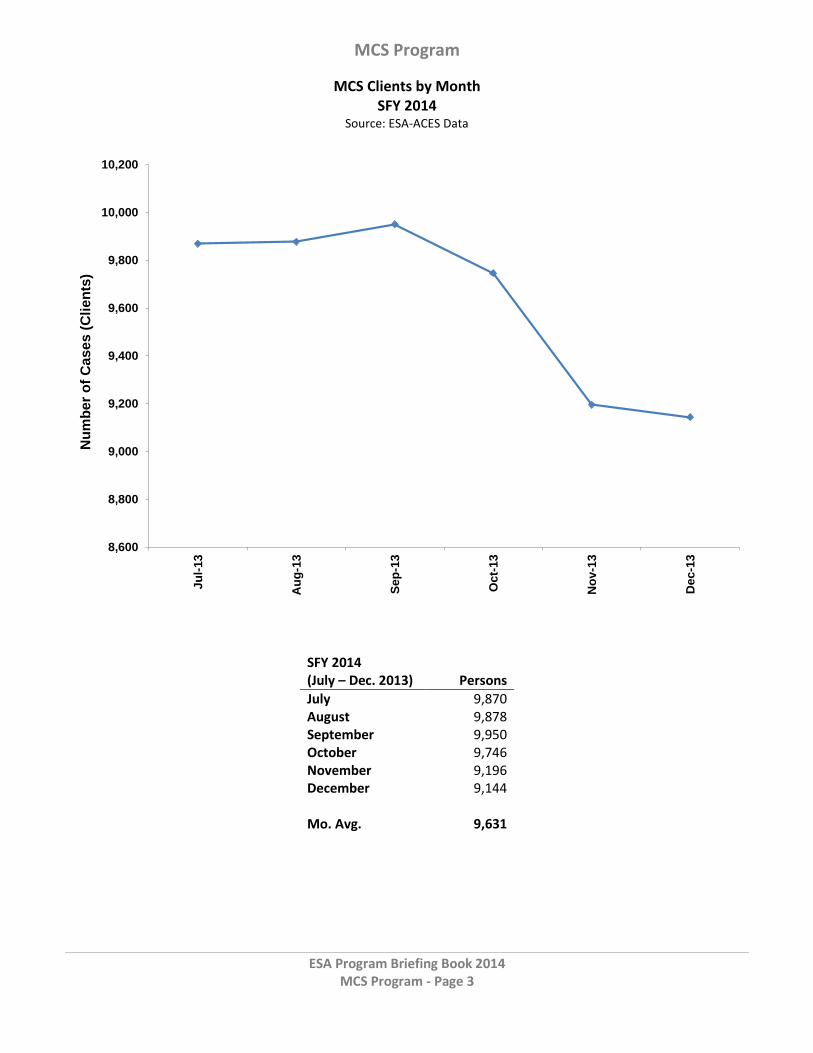
MCS Clients by Month SFY 2014
Source: ESA-ACES Data
8,600
8,800
9,000
9,200
9,400
9,600
9,800
10,000
10,200
Ju
l-13
Au
g-1
3
Sep
-13
Oct-
13
No
v-1
3
De
c-1
3
Nu
mb
er
of
Ca
se
s (
Cli
en
ts)
SFY 2014 (July – Dec. 2013) Persons
July 9,870 August 9,878 September 9,950 October 9,746 November 9,196 December 9,144
Mo. Avg. 9,631
MCS Program
ESA Program Briefing Book 2014 MCS Program - Page 4
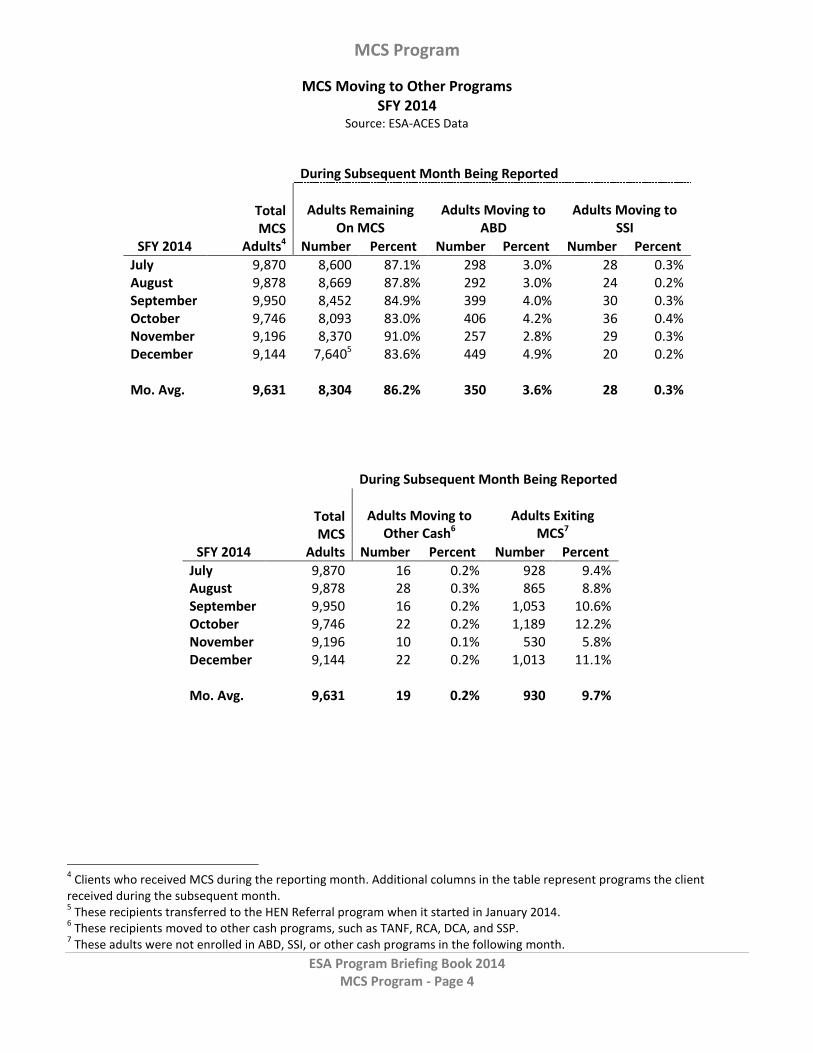
MCS Moving to Other Programs SFY 2014
Source: ESA-ACES Data
During Subsequent Month Being Reported
SFY 2014
Total MCS
Adults4
Adults Remaining
On MCS
Adults Moving to
ABD Adults Moving to
SSI
Number Percent Number Percent Number Percent
July 9,870 8,600 87.1% 298 3.0% 28 0.3% August 9,878 8,669 87.8% 292 3.0% 24 0.2% September 9,950 8,452 84.9% 399 4.0% 30 0.3% October 9,746 8,093 83.0% 406 4.2% 36 0.4% November 9,196 8,370 91.0% 257 2.8% 29 0.3% December 9,144 7,6405 83.6% 449 4.9% 20 0.2% Mo. Avg. 9,631 8,304 86.2% 350 3.6% 28 0.3%
During Subsequent Month Being Reported
SFY 2014
Total MCS
Adults
Adults Moving to
Other Cash6
Adults Exiting
MCS7
Number Percent Number Percent
July 9,870 16 0.2% 928 9.4% August 9,878 28 0.3% 865 8.8% September 9,950 16 0.2% 1,053 10.6% October 9,746 22 0.2% 1,189 12.2% November 9,196 10 0.1% 530 5.8% December 9,144 22 0.2% 1,013 11.1% Mo. Avg. 9,631 19 0.2% 930 9.7%
4 Clients who received MCS during the reporting month. Additional columns in the table represent programs the client
received during the subsequent month. 5 These recipients transferred to the HEN Referral program when it started in January 2014.
6 These recipients moved to other cash programs, such as TANF, RCA, DCA, and SSP.
7 These adults were not enrolled in ABD, SSI, or other cash programs in the following month.
MCS Program
ESA Program Briefing Book 2014 MCS Program - Page 5
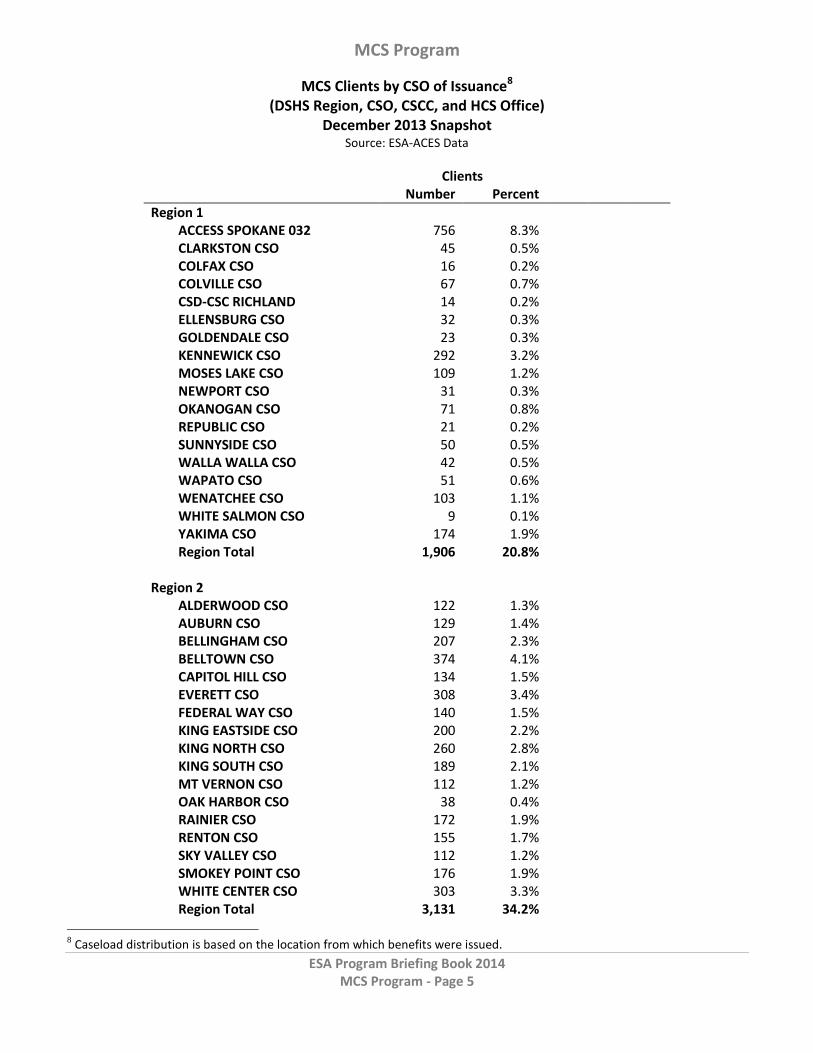
MCS Clients by CSO of Issuance8 (DSHS Region, CSO, CSCC, and HCS Office)
December 2013 Snapshot Source: ESA-ACES Data
Clients Number Percent
Region 1
ACCESS SPOKANE 032 756 8.3% CLARKSTON CSO 45 0.5% COLFAX CSO 16 0.2% COLVILLE CSO 67 0.7% CSD-CSC RICHLAND 14 0.2% ELLENSBURG CSO 32 0.3% GOLDENDALE CSO 23 0.3% KENNEWICK CSO 292 3.2% MOSES LAKE CSO 109 1.2% NEWPORT CSO 31 0.3% OKANOGAN CSO 71 0.8% REPUBLIC CSO 21 0.2% SUNNYSIDE CSO 50 0.5% WALLA WALLA CSO 42 0.5% WAPATO CSO 51 0.6% WENATCHEE CSO 103 1.1% WHITE SALMON CSO 9 0.1% YAKIMA CSO 174 1.9% Region Total 1,906 20.8%
Region 2
ALDERWOOD CSO 122 1.3% AUBURN CSO 129 1.4% BELLINGHAM CSO 207 2.3% BELLTOWN CSO 374 4.1% CAPITOL HILL CSO 134 1.5% EVERETT CSO 308 3.4% FEDERAL WAY CSO 140 1.5% KING EASTSIDE CSO 200 2.2% KING NORTH CSO 260 2.8% KING SOUTH CSO 189 2.1% MT VERNON CSO 112 1.2% OAK HARBOR CSO 38 0.4% RAINIER CSO 172 1.9% RENTON CSO 155 1.7% SKY VALLEY CSO 112 1.2% SMOKEY POINT CSO 176 1.9% WHITE CENTER CSO 303 3.3% Region Total 3,131 34.2%
8 Caseload distribution is based on the location from which benefits were issued.
MCS Program
ESA Program Briefing Book 2014 MCS Program - Page 6
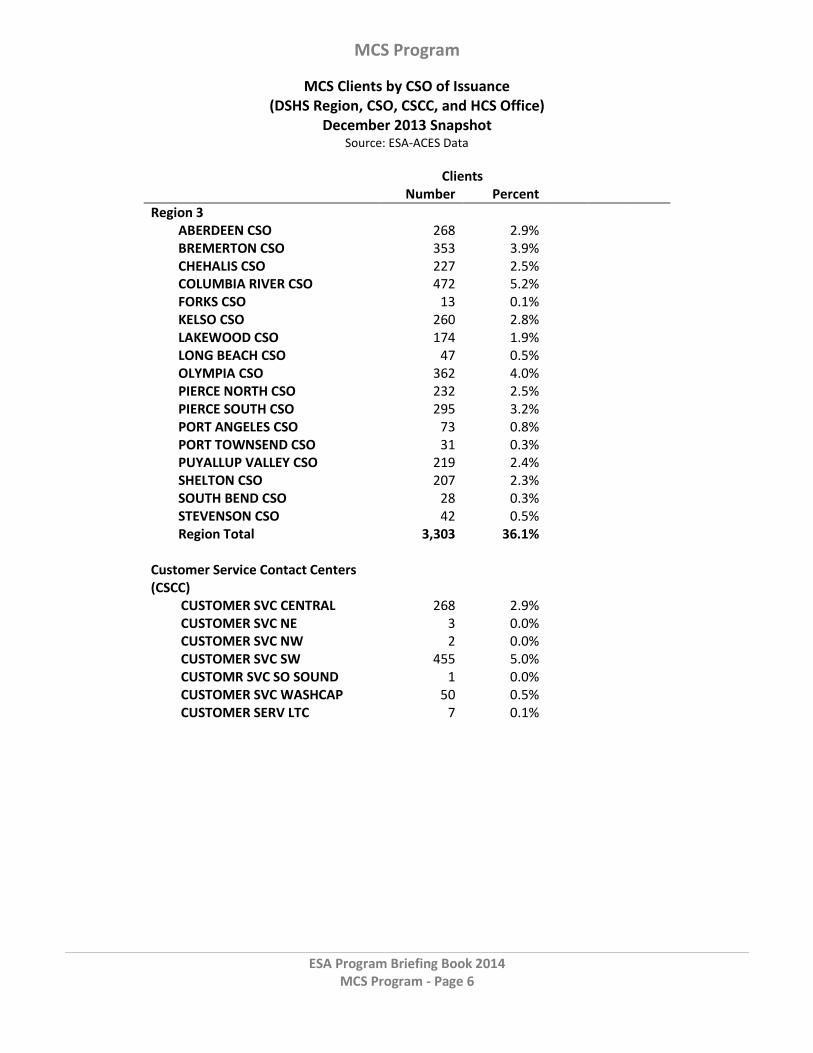
MCS Clients by CSO of Issuance (DSHS Region, CSO, CSCC, and HCS Office)
December 2013 Snapshot Source: ESA-ACES Data
Clients Number Percent
Region 3
ABERDEEN CSO 268 2.9% BREMERTON CSO 353 3.9% CHEHALIS CSO 227 2.5% COLUMBIA RIVER CSO 472 5.2% FORKS CSO 13 0.1% KELSO CSO 260 2.8% LAKEWOOD CSO 174 1.9% LONG BEACH CSO 47 0.5% OLYMPIA CSO 362 4.0% PIERCE NORTH CSO 232 2.5% PIERCE SOUTH CSO 295 3.2% PORT ANGELES CSO 73 0.8% PORT TOWNSEND CSO 31 0.3% PUYALLUP VALLEY CSO 219 2.4% SHELTON CSO 207 2.3% SOUTH BEND CSO 28 0.3% STEVENSON CSO 42 0.5% Region Total 3,303 36.1%
Customer Service Contact Centers (CSCC)
CUSTOMER SVC CENTRAL 268 2.9% CUSTOMER SVC NE 3 0.0% CUSTOMER SVC NW 2 0.0% CUSTOMER SVC SW 455 5.0% CUSTOMR SVC SO SOUND 1 0.0% CUSTOMER SVC WASHCAP 50 0.5% CUSTOMER SERV LTC 7 0.1%
MCS Program
ESA Program Briefing Book 2014 MCS Program - Page 7
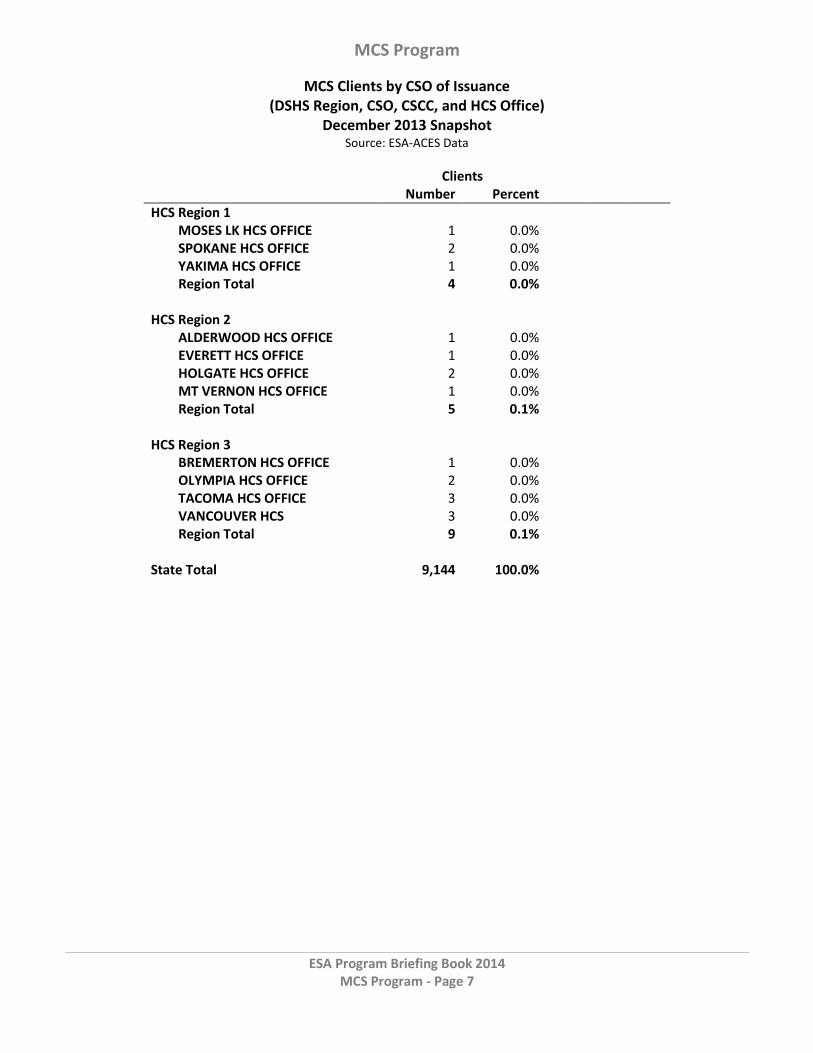
MCS Clients by CSO of Issuance (DSHS Region, CSO, CSCC, and HCS Office)
December 2013 Snapshot Source: ESA-ACES Data
Clients Number Percent
HCS Region 1
MOSES LK HCS OFFICE 1 0.0% SPOKANE HCS OFFICE 2 0.0% YAKIMA HCS OFFICE 1 0.0% Region Total 4 0.0% HCS Region 2
ALDERWOOD HCS OFFICE 1 0.0% EVERETT HCS OFFICE 1 0.0% HOLGATE HCS OFFICE 2 0.0% MT VERNON HCS OFFICE 1 0.0% Region Total 5 0.1%
HCS Region 3
BREMERTON HCS OFFICE 1 0.0% OLYMPIA HCS OFFICE 2 0.0% TACOMA HCS OFFICE 3 0.0% VANCOUVER HCS 3 0.0% Region Total 9 0.1% State Total 9,144 100.0%
MCS Program
ESA Program Briefing Book 2014 MCS Program - Page 8
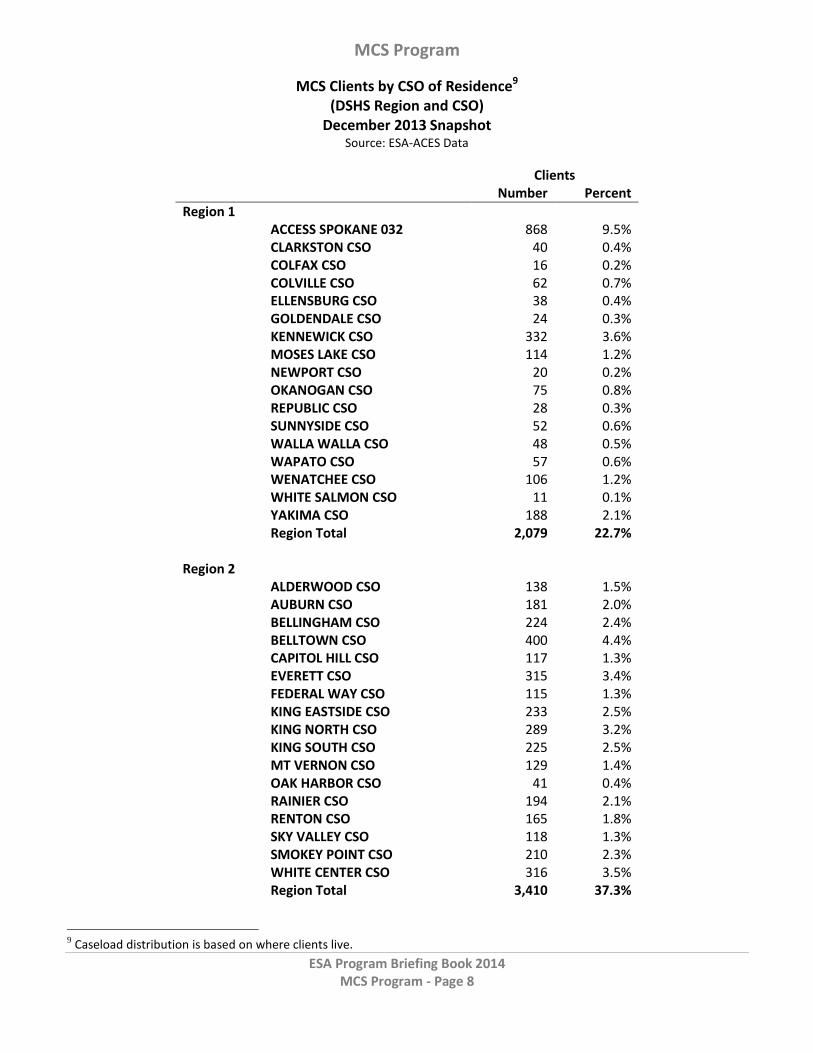
MCS Clients by CSO of Residence9 (DSHS Region and CSO)
December 2013 Snapshot Source: ESA-ACES Data
Clients Number Percent
Region 1 ACCESS SPOKANE 032 868 9.5%
CLARKSTON CSO 40 0.4% COLFAX CSO 16 0.2% COLVILLE CSO 62 0.7% ELLENSBURG CSO 38 0.4% GOLDENDALE CSO 24 0.3% KENNEWICK CSO 332 3.6% MOSES LAKE CSO 114 1.2% NEWPORT CSO 20 0.2% OKANOGAN CSO 75 0.8% REPUBLIC CSO 28 0.3% SUNNYSIDE CSO 52 0.6% WALLA WALLA CSO 48 0.5% WAPATO CSO 57 0.6% WENATCHEE CSO 106 1.2% WHITE SALMON CSO 11 0.1% YAKIMA CSO 188 2.1% Region Total 2,079 22.7%
Region 2 ALDERWOOD CSO 138 1.5%
AUBURN CSO 181 2.0% BELLINGHAM CSO 224 2.4% BELLTOWN CSO 400 4.4% CAPITOL HILL CSO 117 1.3% EVERETT CSO 315 3.4% FEDERAL WAY CSO 115 1.3% KING EASTSIDE CSO 233 2.5% KING NORTH CSO 289 3.2% KING SOUTH CSO 225 2.5% MT VERNON CSO 129 1.4% OAK HARBOR CSO 41 0.4% RAINIER CSO 194 2.1% RENTON CSO 165 1.8% SKY VALLEY CSO 118 1.3% SMOKEY POINT CSO 210 2.3% WHITE CENTER CSO 316 3.5% Region Total 3,410 37.3%
9 Caseload distribution is based on where clients live.
MCS Program
ESA Program Briefing Book 2014 MCS Program - Page 9
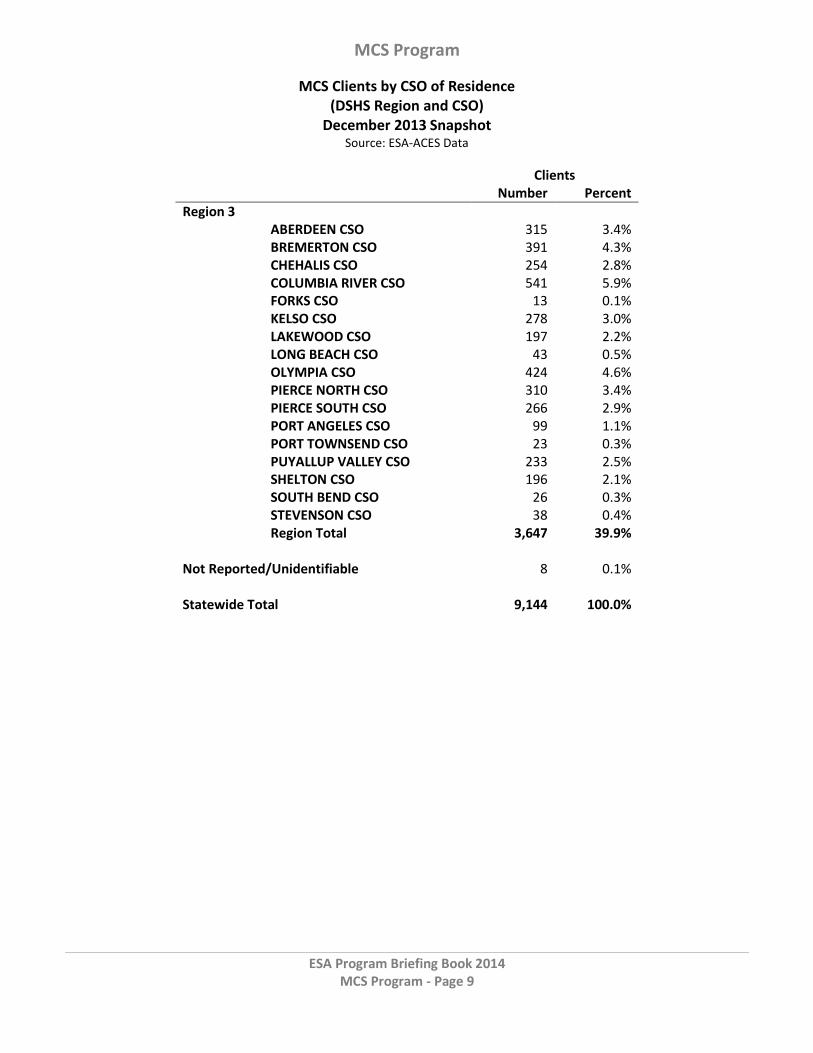
MCS Clients by CSO of Residence (DSHS Region and CSO)
December 2013 Snapshot Source: ESA-ACES Data
Clients Number Percent
Region 3 ABERDEEN CSO 315 3.4%
BREMERTON CSO 391 4.3% CHEHALIS CSO 254 2.8% COLUMBIA RIVER CSO 541 5.9% FORKS CSO 13 0.1% KELSO CSO 278 3.0% LAKEWOOD CSO 197 2.2% LONG BEACH CSO 43 0.5% OLYMPIA CSO 424 4.6% PIERCE NORTH CSO 310 3.4% PIERCE SOUTH CSO 266 2.9% PORT ANGELES CSO 99 1.1% PORT TOWNSEND CSO 23 0.3% PUYALLUP VALLEY CSO 233 2.5% SHELTON CSO 196 2.1% SOUTH BEND CSO 26 0.3% STEVENSON CSO 38 0.4% Region Total 3,647 39.9%
Not Reported/Unidentifiable 8 0.1% Statewide Total 9,144 100.0%

MCS Program
ESA Program Briefing Book 2014 MCS Program - Page 10
MCS Clients by County of Residence December 2013 Snapshot
Source: ESA-ACES Data
Clients County Number Percent
Adams 13 0.1% Asotin 39 0.4% Benton 248 2.7% Chelan 85 0.9% Clallam 111 1.2% Clark 529 5.8% Columbia 2 0.0% Cowlitz 283 3.1% Douglas 20 0.2% Ferry 13 0.1% Franklin 85 0.9% Garfield 0 0.0% Grant 109 1.2% Grays Harbor 319 3.5% Island 47 0.5% Jefferson 23 0.3% King 2,249 24.6% Kitsap 393 4.3% Kittitas 39 0.4% Klickitat 32 0.3% Lewis 242 2.6% Lincoln 12 0.1% Mason 200 2.2% Okanogan 69 0.8% Pacific 74 0.8% Pend Oreille 19 0.2% Pierce 994 10.9% San Juan 6 0.1% Skagit 108 1.2% Skamania 38 0.4% Snohomish 779 8.5% Spokane 846 9.3% Stevens 76 0.8% Thurston 430 4.7% Wahkiakum 3 0.0% Walla Walla 50 0.5% Whatcom 230 2.5% Whitman 17 0.2% Yakima 275 3.0% Not Reported/Unidentifiable 37 0.4% State Total 9,144 100.0%
MCS Program
ESA Program Briefing Book 2014 MCS Program - Page 11
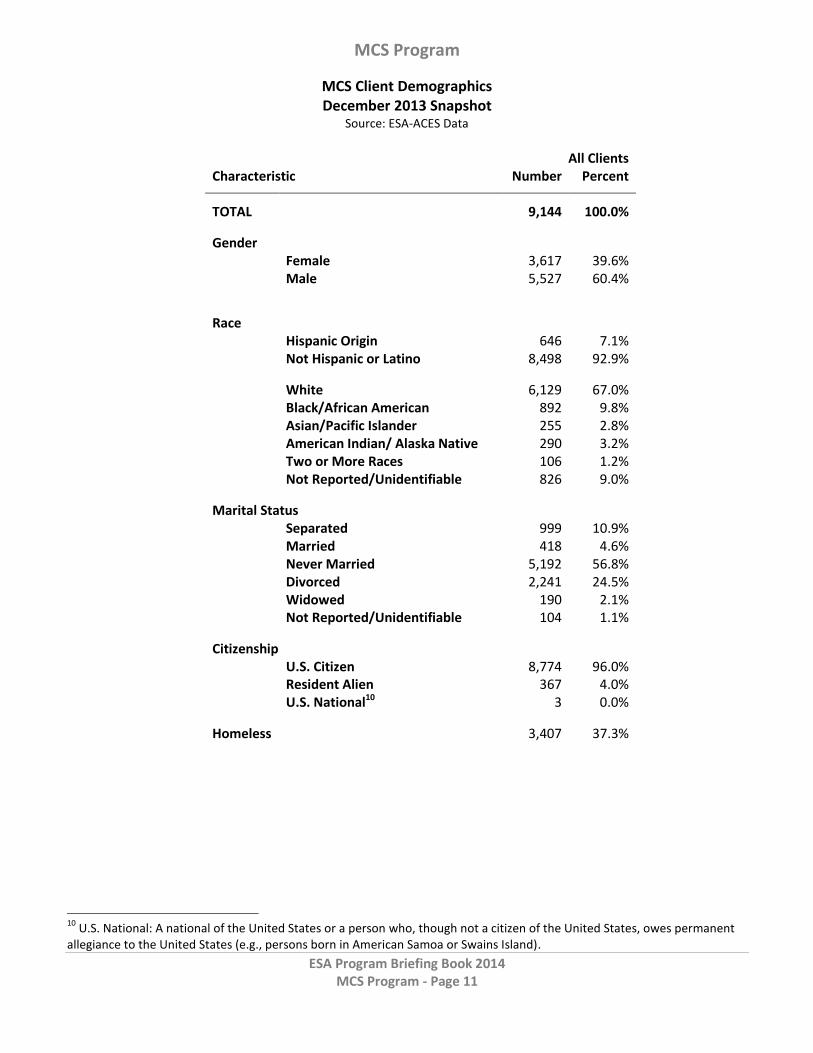
MCS Client Demographics December 2013 Snapshot
Source: ESA-ACES Data
10
U.S. National: A national of the United States or a person who, though not a citizen of the United States, owes permanent allegiance to the United States (e.g., persons born in American Samoa or Swains Island).
All Clients
Characteristic Number Percent
TOTAL 9,144 100.0%
Gender Female 3,617 39.6% Male 5,527 60.4%
Race Hispanic Origin 646 7.1% Not Hispanic or Latino 8,498 92.9%
White 6,129 67.0% Black/African American 892 9.8% Asian/Pacific Islander 255 2.8% American Indian/ Alaska Native 290 3.2% Two or More Races 106 1.2% Not Reported/Unidentifiable 826 9.0%
Marital Status Separated 999 10.9% Married 418 4.6% Never Married 5,192 56.8% Divorced 2,241 24.5% Widowed 190 2.1% Not Reported/Unidentifiable 104 1.1% Citizenship U.S. Citizen 8,774 96.0% Resident Alien 367 4.0% U.S. National10 3 0.0% Homeless 3,407 37.3%
MCS Program
ESA Program Briefing Book 2014 MCS Program - Page 12
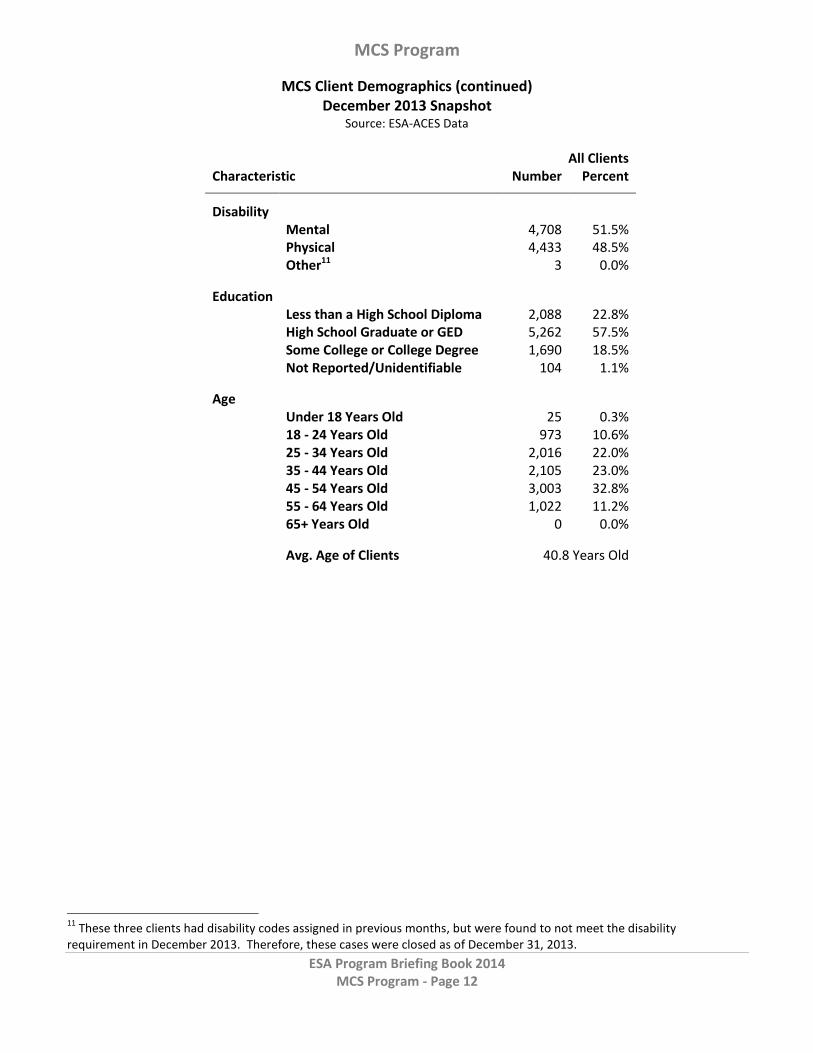
MCS Client Demographics (continued) December 2013 Snapshot
Source: ESA-ACES Data
11
These three clients had disability codes assigned in previous months, but were found to not meet the disability requirement in December 2013. Therefore, these cases were closed as of December 31, 2013.
All Clients
Characteristic Number Percent
Disability
Mental 4,708 51.5% Physical 4,433 48.5% Other11 3 0.0%
Education Less than a High School Diploma 2,088 22.8% High School Graduate or GED 5,262 57.5% Some College or College Degree 1,690 18.5% Not Reported/Unidentifiable 104 1.1%
Age Under 18 Years Old 25 0.3%
18 - 24 Years Old 973 10.6% 25 - 34 Years Old 2,016 22.0% 35 - 44 Years Old 2,105 23.0% 45 - 54 Years Old 3,003 32.8% 55 - 64 Years Old 1,022 11.2% 65+ Years Old 0 0.0% Avg. Age of Clients 40.8 Years Old


![CHKSUM Merrill Corp - Ameriprise Financial [MCS] SCTPP ... · Merrill Corp - Ameriprise Financial [MCS] SCTPP Tuition Prepatment Program Annual Report [Funds] 06-30-2014 ED ... Overview](https://img.dokumen.tips/doc/110x75/5f7fd1f3a8fd99529e42cc2f/chksum-merrill-corp-ameriprise-financial-mcs-sctpp-merrill-corp-ameriprise.jpg)

![CHKSUM Content: Merrill Corp - Ameriprise Financial [MCS ... · Merrill Corp - Ameriprise Financial [MCS] SCTPP Tuition Prepatment Program Annual Report [Funds] 06-30-2014 ED](https://img.dokumen.tips/doc/110x75/5f7fd34463dc0418df707253/chksum-content-merrill-corp-ameriprise-financial-mcs-merrill-corp-ameriprise.jpg)