Embed Size (px)
DESCRIPTION
A review book for the AP Micreconomics/Macroeconomics exam.
Citation preview

5 STEPS TO A 5
AP Microeconomics/ Macroeconomics
2010–2011
00 (i-xviiiB) front matter 10/7/09 1:02 PM Page i
New York Chicago San Francisco Lisbon London Madrid Mexico CityMilan New Delhi San Juan Seoul Singapore Sydney Toronto
55 STEPS TO A
AP Microeconomics/ Macroeconomics
2010–2011
Eric R. Dodge
00 (i-xviiiB) front matter 10/7/09 1:02 PM Page iii

� vii
CONTENTS
Preface, ixAcknowledgments, xiIntroduction: The Five-Step Program, xiii
STEP 1 Set Up Your Study Program
1 What You Need to Know About the AP Economics Exams, 32 How to Plan Your Time, 12
STEP 2 Determine Your Test Readiness
3 Take Diagnostic Exams, 19Diagnostic Exam: AP Microeconomics, 23Diagnostic Exam: AP Macroeconomics, 28
STEP 3 Develop Strategies for Success
4 How to Approach Each Question Type, 41Multiple-Choice Questions, 41Free-Response Questions, 44
STEP 4 Review the Knowledge You Need to Score High
5 Fundamentals of Economic Analysis, 49Scarce Resources, 50Production Possibilities, 53Functions of Economic Systems, 59
6 Demand, Supply, Market Equilibrium, and Welfare Analysis, 63Demand, 63Supply, 69Market Equilibrium, 72Welfare Analysis, 77
7 Elasticity, Microeconomic Policy, and Consumer Theory, 82Elasticity, 83Microeconomic Policy and Applications of Elasticity, 91Consumer Choice, 98
8 The Firm, Profit, and the Costs of Production, 107Firms, Opportunity Costs, and Profits, 108Production and Cost, 109
9 Market Structures, Perfect Competition, Monopoly, and Things Between, 121
Perfect Competition, 122Monopoly, 132Monopolistic Competition, 137Oligopoly, 139
00 (i-xviiiB) front matter 10/7/09 1:02 PM Page vii
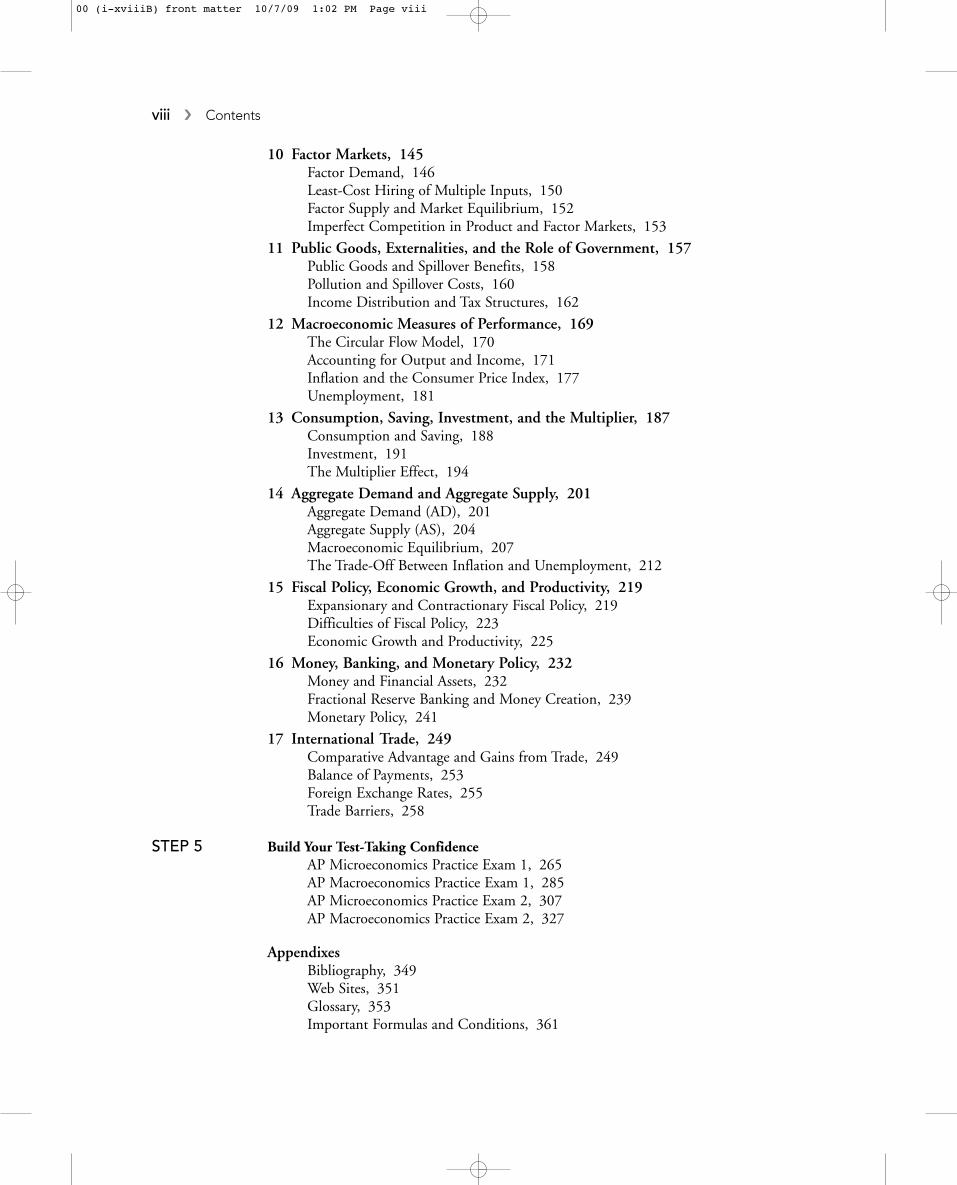
10 Factor Markets, 145Factor Demand, 146Least-Cost Hiring of Multiple Inputs, 150Factor Supply and Market Equilibrium, 152Imperfect Competition in Product and Factor Markets, 153
11 Public Goods, Externalities, and the Role of Government, 157Public Goods and Spillover Benefits, 158Pollution and Spillover Costs, 160Income Distribution and Tax Structures, 162
12 Macroeconomic Measures of Performance, 169The Circular Flow Model, 170Accounting for Output and Income, 171Inflation and the Consumer Price Index, 177Unemployment, 181
13 Consumption, Saving, Investment, and the Multiplier, 187Consumption and Saving, 188Investment, 191The Multiplier Effect, 194
14 Aggregate Demand and Aggregate Supply, 201Aggregate Demand (AD), 201Aggregate Supply (AS), 204Macroeconomic Equilibrium, 207The Trade-Off Between Inflation and Unemployment, 212
15 Fiscal Policy, Economic Growth, and Productivity, 219Expansionary and Contractionary Fiscal Policy, 219Difficulties of Fiscal Policy, 223Economic Growth and Productivity, 225
16 Money, Banking, and Monetary Policy, 232Money and Financial Assets, 232Fractional Reserve Banking and Money Creation, 239Monetary Policy, 241
17 International Trade, 249Comparative Advantage and Gains from Trade, 249Balance of Payments, 253Foreign Exchange Rates, 255Trade Barriers, 258
STEP 5 Build Your Test-Taking ConfidenceAP Microeconomics Practice Exam 1, 265AP Macroeconomics Practice Exam 1, 285AP Microeconomics Practice Exam 2, 307AP Macroeconomics Practice Exam 2, 327
AppendixesBibliography, 349Web Sites, 351Glossary, 353Important Formulas and Conditions, 361
viii � Contents
00 (i-xviiiB) front matter 10/7/09 1:02 PM Page viii
5 STEPS TO A 5
AP Microeconomics/ Macroeconomics
2010–2011
00 (i-xviiiB) front matter 10/7/09 1:02 PM Page xvii
� 121
Market Structures, Perfect Competition,Monopoly, and Things Between
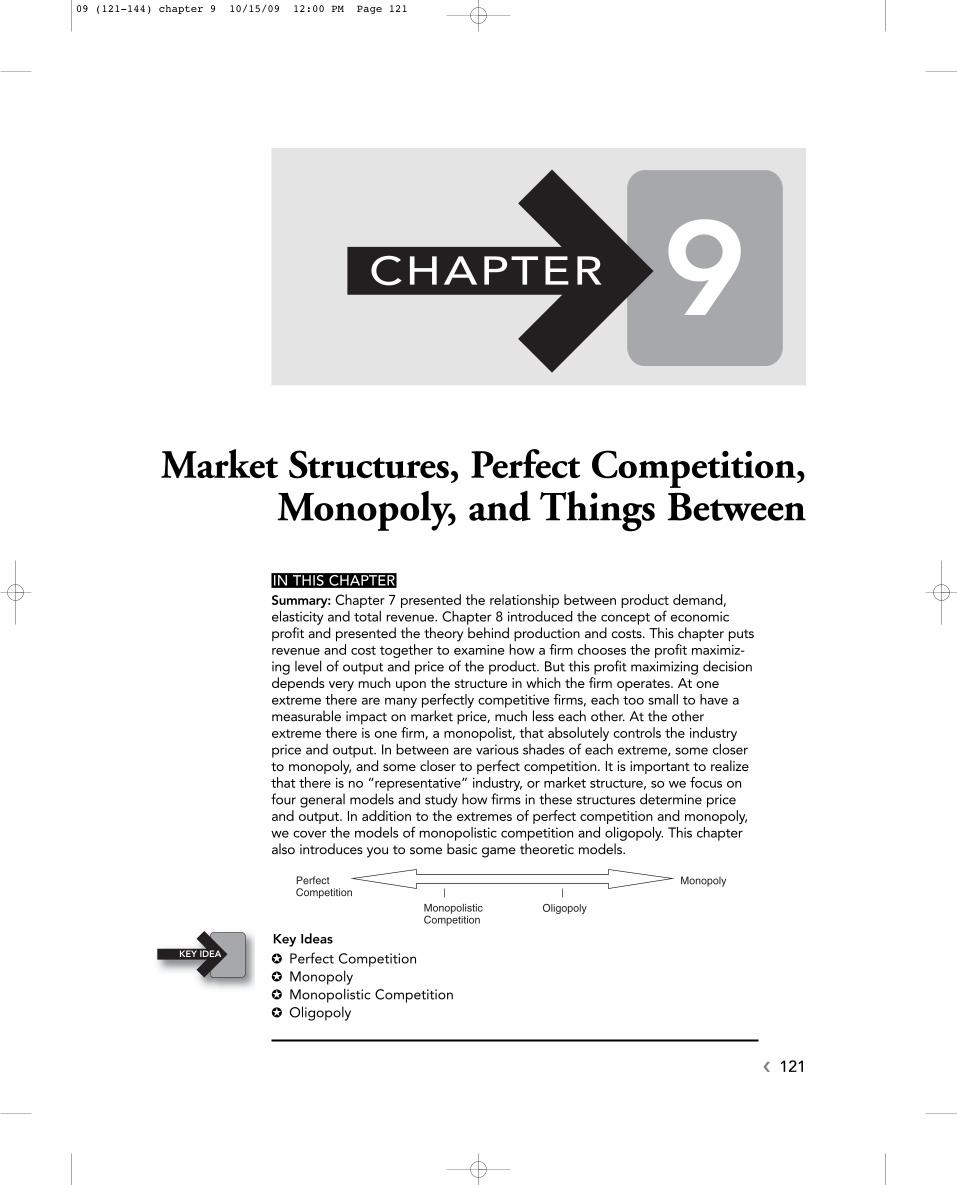
IN THIS CHAPTERSummary: Chapter 7 presented the relationship between product demand,elasticity and total revenue. Chapter 8 introduced the concept of economicprofit and presented the theory behind production and costs. This chapter putsrevenue and cost together to examine how a firm chooses the profit maximiz-ing level of output and price of the product. But this profit maximizing decisiondepends very much upon the structure in which the firm operates. At oneextreme there are many perfectly competitive firms, each too small to have ameasurable impact on market price, much less each other. At the otherextreme there is one firm, a monopolist, that absolutely controls the industryprice and output. In between are various shades of each extreme, some closerto monopoly, and some closer to perfect competition. It is important to realizethat there is no “representative” industry, or market structure, so we focus onfour general models and study how firms in these structures determine priceand output. In addition to the extremes of perfect competition and monopoly,we cover the models of monopolistic competition and oligopoly. This chapteralso introduces you to some basic game theoretic models.
KEY IDEA
CHAPTER 9
Monopoly
OligopolyMonopolisticCompetition
PerfectCompetition
Key Ideas
� Perfect Competition� Monopoly� Monopolistic Competition� Oligopoly
09 (121-144) chapter 9 10/15/09 12:00 PM Page 121
9.1 Perfect CompetitionMain Topics: Structural Characteristics, Demand, Profit Maximization, Short-Run Profits,Decision to Shut Down, Long-Run Adjustment
Structural Characteristics of Perfect CompetitionEach market structure is defined by structural characteristics. These characteristics deter-mine, among other things, how the profit maximizing price and quantity are set in theshort run, as well as how profits might be maintained in the long run. Perfect competitionis typically described by four characteristics:
• Many small independent producers and consumers. Not small like Mini-Me small, but smalllike each firm is too small to have an impact on market price. No one firm can drive up theprice by restricting supply, or drive down the price by flooding the market with output. Noone consumer can, by changing the amount of the good that he consumes, impact the price.
• Firms produce a standardized product. There exist no real differences between one firm’soutput and the next.
• No barriers to entry or exit. There exist no significant obstacles to the entry of new firmsinto, or the exit of existing firms out of this industry. Profitability or lack thereof deter-mines whether the industry is expanding or contracting.
• Firms are “price takers.” This characteristic is actually a result of the first three. Becauseall firms are too small to affect the price, they must accept the market price and produceas much as they wish at that price. Even if they could change the price, they would notdo so. To see this, suppose that the market determined competitive price of barley is $5.If farmer Katie increased the price to $5.01, she would now be the high price supplier ofbarley with thousands of competitors producing an identical product at a lower price;Katie is likely to lose all of her customers. If she lowers her price to $4.99, she wouldseemingly clean up her competition. But remember, the price-taking characteristic tellsus that Katie can sell all she wants at the market price of $5. If you can sell all you wantat $5, why would Katie sell even one unit at $4.99?
All four of the characteristics of perfect competition are rarely found in today’s industries,but agricultural commodities are usually regarded as approximately perfectly competitive.
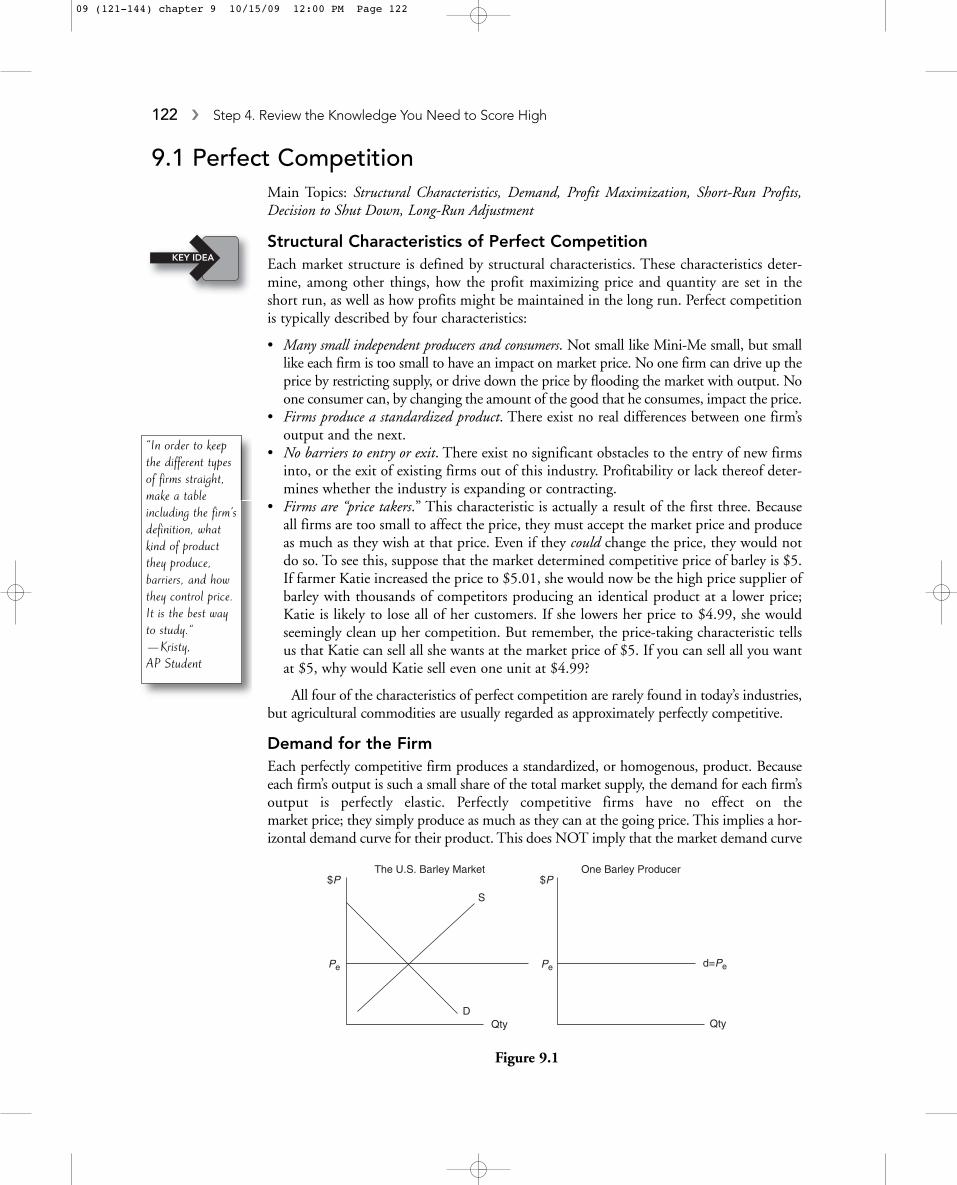
Demand for the FirmEach perfectly competitive firm produces a standardized, or homogenous, product. Becauseeach firm’s output is such a small share of the total market supply, the demand for each firm’soutput is perfectly elastic. Perfectly competitive firms have no effect on the market price; they simply produce as much as they can at the going price. This implies a hor-izontal demand curve for their product. This does NOT imply that the market demand curve
122 � Step 4. Review the Knowledge You Need to Score High
“In order to keepthe different typesof firms straight,make a tableincluding the firm’sdefinition, whatkind of productthey produce, barriers, and howthey control price.It is the best wayto study.“—Kristy, AP Student
KEY IDEA
Figure 9.1
S
DQty
d=Pe
The U.S. Barley Market One Barley Producer
Qty
$P$P
PePe
09 (121-144) chapter 9 10/15/09 12:00 PM Page 122
is horizontal. If the market price of barley falls, quantity demanded rises. Figure 9.1 illustratesthe difference between market demand (D) and the demand for one firm’s product (d).
Profit MaximizationLet’s get one thing straight. When we say firms maximize economic profit, this means they arenot going to settle for anything less than the highest possible difference between total revenueand total economic cost. If an additional dollar of profit is to be earned, they take that oppor-tunity. If the maximum profit possible is actually zero, or even negative dollars, they acceptthis short-run outcome. There are two equivalent ways to maximize economic profit.
The Method of ‘’Totals’’The perfectly competitive firm cannot change the price; it can only adjust output. To max-imize profit the firm selects the output to maximize:
Economic Profit (p) = Total Revenue - Total Economic Cost
An example should help to illustrate how a firm goes about maximizing profit.
Example:A carrot farmer operates in a perfectly competitive market. The going price for a
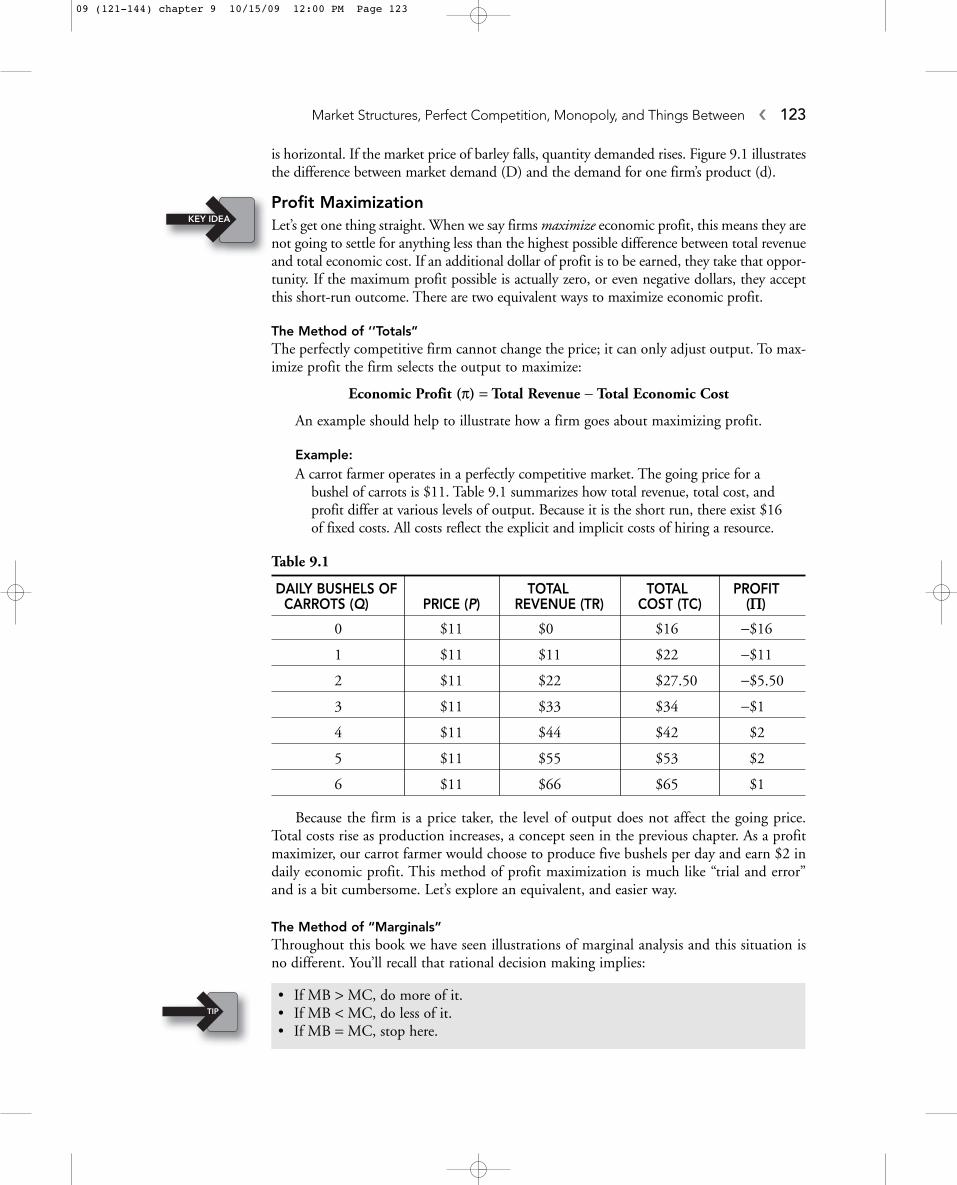
bushel of carrots is $11. Table 9.1 summarizes how total revenue, total cost, andprofit differ at various levels of output. Because it is the short run, there exist $16of fixed costs. All costs reflect the explicit and implicit costs of hiring a resource.
Table 9.1
DAILY BUSHELS OF TOTAL TOTAL PROFIT CARROTS (Q) PRICE (P) REVENUE (TR) COST (TC) (P)
0 $11 $0 $16 -$16
1 $11 $11 $22 -$11
2 $11 $22 $27.50 -$5.50
3 $11 $33 $34 -$1
4 $11 $44 $42 $2
5 $11 $55 $53 $2
6 $11 $66 $65 $1
Because the firm is a price taker, the level of output does not affect the going price.Total costs rise as production increases, a concept seen in the previous chapter. As a profitmaximizer, our carrot farmer would choose to produce five bushels per day and earn $2 indaily economic profit. This method of profit maximization is much like “trial and error”and is a bit cumbersome. Let’s explore an equivalent, and easier way.
The Method of “Marginals”Throughout this book we have seen illustrations of marginal analysis and this situation isno different. You’ll recall that rational decision making implies:
• If MB > MC, do more of it.• If MB < MC, do less of it.• If MB = MC, stop here.
Market Structures, Perfect Competition, Monopoly, and Things Between � 123
KEY IDEA
TIP
09 (121-144) chapter 9 10/15/09 12:00 PM Page 123
Since the only decision to be made by the perfectly competitive firm is to choose theoptimal level of output, the firm’s rule is:
• Choose the level of output where MR = MC.
Table 9.2 can be modified to show the marginal revenue and marginal cost of sellingadditional bushels of carrots.
Table 9.2
TOTAL TOTAL MARGINAL MARGINALDAILY BUSHELS PRICE REVENUE COST PROFIT REVENUE COST OF CARROTS (Q) (P) (TR) (TC) (P) (MR) (MC)
0 $11 $0 $16 -$16
1 $11 $11 $22 -$11 $11 $6
2 $11 $22 $27.50 -$5.50 $11 $5.50
3 $11 $33 $34 -$1 $11 $6.50
4 $11 $44 $42 $2 $11 $8
5 $11 $55 $53 $2 $11 $11
6 $11 $66 $65 $1 $11 $12
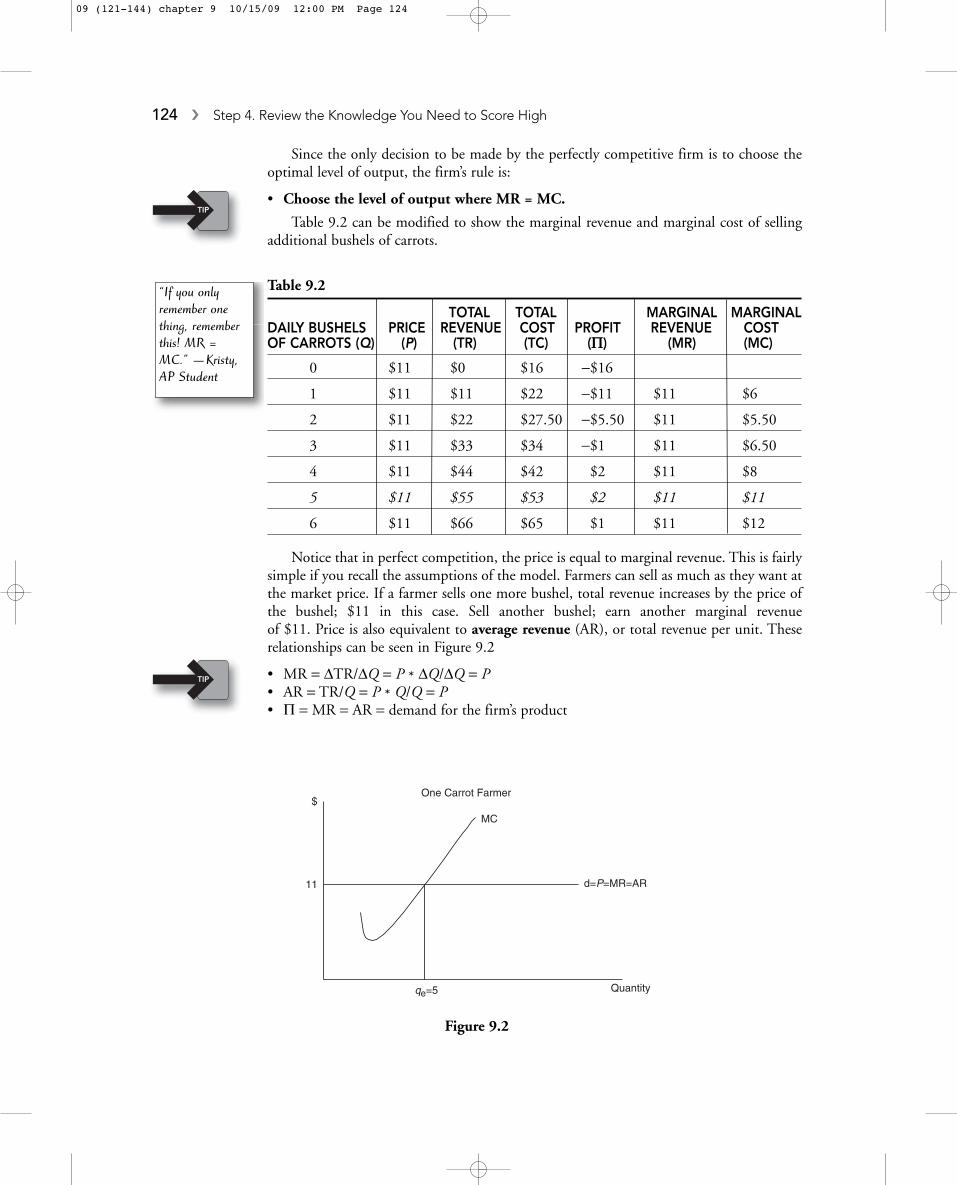
Notice that in perfect competition, the price is equal to marginal revenue. This is fairlysimple if you recall the assumptions of the model. Farmers can sell as much as they want atthe market price. If a farmer sells one more bushel, total revenue increases by the price ofthe bushel; $11 in this case. Sell another bushel; earn another marginal revenue of $11. Price is also equivalent to average revenue (AR), or total revenue per unit. Theserelationships can be seen in Figure 9.2
• MR = DTR/DQ = P * DQ/DQ = P• AR = TR/Q = P * Q/Q = P• P = MR = AR = demand for the firm’s product
124 � Step 4. Review the Knowledge You Need to Score High
“If you onlyremember onething, rememberthis! MR =MC.” —Kristy, AP Student
MC
$
11 d=P=MR=AR
qe=5
One Carrot Farmer
Quantity
Figure 9.2
TIP
TIP
09 (121-144) chapter 9 10/15/09 12:00 PM Page 124
Short-Run Profit and LossTo maximize profit, the firm must choose the level of output (qe) where MR = MC. Buthow can we use Figure 9.2 to identify these profits? A little algebra goes a long way.
P = TR - TC = P * qe - TC. If you divide both terms by quantity and remember that TC/q = Average Total Cost, you have:
P = qe * (P - ATC)
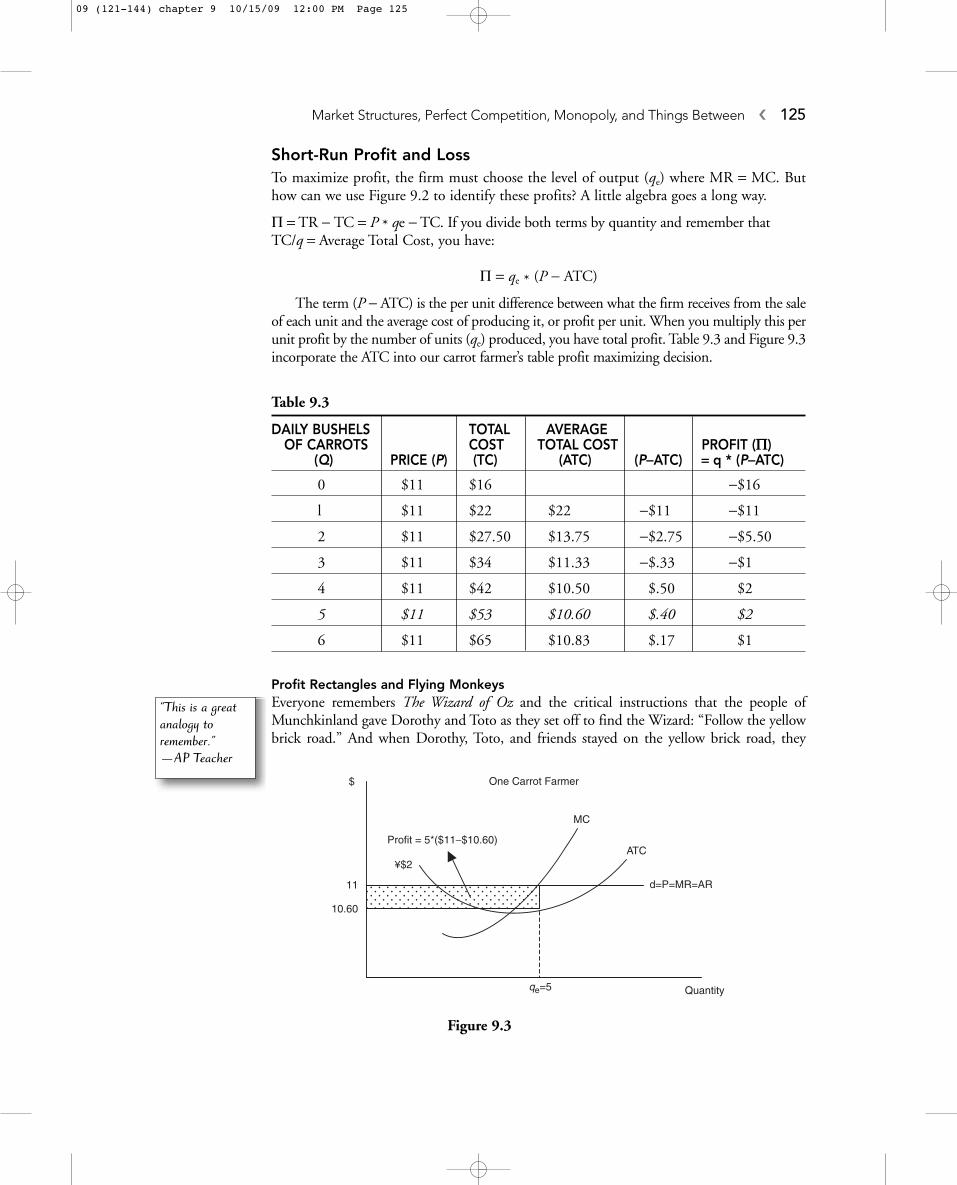
The term (P - ATC) is the per unit difference between what the firm receives from the saleof each unit and the average cost of producing it, or profit per unit. When you multiply this perunit profit by the number of units (qe) produced, you have total profit. Table 9.3 and Figure 9.3incorporate the ATC into our carrot farmer’s table profit maximizing decision.
Table 9.3
DAILY BUSHELS TOTAL AVERAGE OF CARROTS COST TOTAL COST PROFIT (P)
(Q) PRICE (P) (TC) (ATC) (P-ATC) = q * (P-ATC)
0 $11 $16 -$16
l $11 $22 $22 -$11 -$11
2 $11 $27.50 $13.75 -$2.75 -$5.50
3 $11 $34 $11.33 -$.33 -$1
4 $11 $42 $10.50 $.50 $2
5 $11 $53 $10.60 $.40 $2
6 $11 $65 $10.83 $.17 $1
Profit Rectangles and Flying MonkeysEveryone remembers The Wizard of Oz and the critical instructions that the people ofMunchkinland gave Dorothy and Toto as they set off to find the Wizard: “Follow the yellowbrick road.” And when Dorothy, Toto, and friends stayed on the yellow brick road, they
Market Structures, Perfect Competition, Monopoly, and Things Between � 125
Quantity
d=P=MR=AR
ATC
MC
qe=5
10.60
11
Profit = 5*($11−$10.60)
¥$2
$ One Carrot Farmer
Figure 9.3
“This is a greatanalogy toremember.” —AP Teacher
09 (121-144) chapter 9 10/15/09 12:00 PM Page 125
were fine. Whenever they ignored these cautionary words and left the yellow brick road, badthings happened—the scariest being the arrival of the flying monkeys. The flying monkeystore the Scarecrow limb from limb and set the Scarecrow’s straw innards on fire. Talk about aRolaids moment! Very bad things happen when you leave the yellow brick road.
When you find the profit maximizing level of production, qe, you are locating the yellowbrick road for this firm. Never leave this level of output, or bad things happen. Finding qe isthe first step in calculating profit with a “profit rectangle.” The area of the shaded rectangleis 5 bushels wide, multiplied by 40 cents high. In our case, the price $11 is in Figure 9.3above the average total cost $10.60 so we have positive economic profits of $2. This does notalways occur in the short run. Another look at our per unit equation tells us:
Short-Run LossesWhile firms would love to maintain the above scenario where P > ATC and positive eco-nomic profits are made, it might not always turn out that way. Due to a failure of the BugsBunny diet fad, the market for carrots suffers a dramatic decrease in demand. Plummetingdemand decreases the market price to $6.50 per bushel and firms must readjust their profitmaximizing output decision.
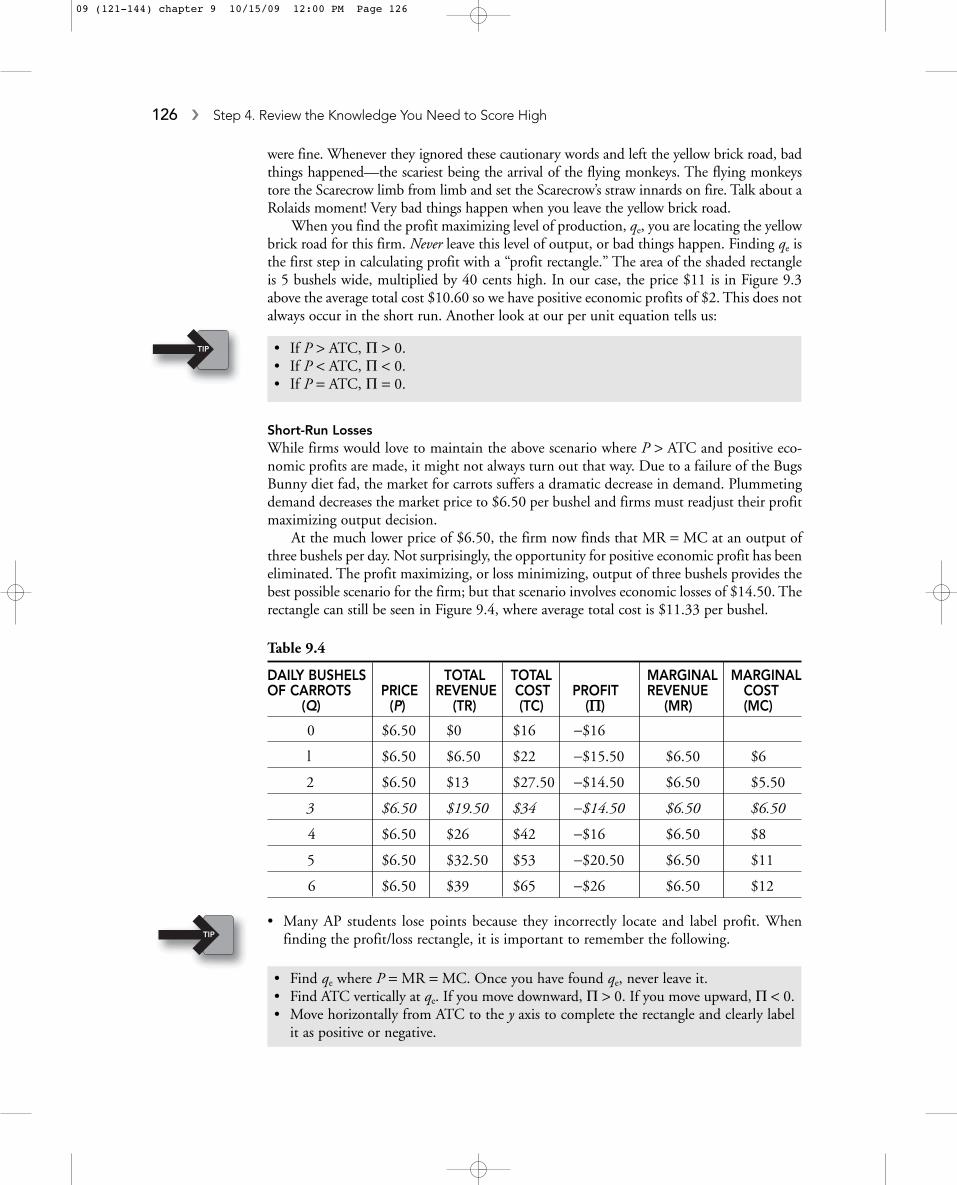
At the much lower price of $6.50, the firm now finds that MR = MC at an output ofthree bushels per day. Not surprisingly, the opportunity for positive economic profit has beeneliminated. The profit maximizing, or loss minimizing, output of three bushels provides thebest possible scenario for the firm; but that scenario involves economic losses of $14.50. Therectangle can still be seen in Figure 9.4, where average total cost is $11.33 per bushel.
Table 9.4
DAILY BUSHELS TOTAL TOTAL MARGINAL MARGINALOF CARROTS PRICE REVENUE COST PROFIT REVENUE COST
(Q) (P) (TR) (TC) (P) (MR) (MC)
0 $6.50 $0 $16 -$16
l $6.50 $6.50 $22 -$15.50 $6.50 $6
2 $6.50 $13 $27.50 -$14.50 $6.50 $5.50
3 $6.50 $19.50 $34 -$14.50 $6.50 $6.50
4 $6.50 $26 $42 -$16 $6.50 $8
5 $6.50 $32.50 $53 -$20.50 $6.50 $11
6 $6.50 $39 $65 -$26 $6.50 $12
• Many AP students lose points because they incorrectly locate and label profit. Whenfinding the profit/loss rectangle, it is important to remember the following.
• Find qe where P = MR = MC. Once you have found qe, never leave it.• Find ATC vertically at qe. If you move downward, P > 0. If you move upward, P < 0.• Move horizontally from ATC to the y axis to complete the rectangle and clearly label
it as positive or negative.
• If P > ATC, P > 0.• If P < ATC, P < 0.• If P = ATC, P = 0.
126 � Step 4. Review the Knowledge You Need to Score High
TIP
TIP
09 (121-144) chapter 9 10/15/09 12:00 PM Page 126
Decision to Shut DownFirms obviously do not enjoy producing at a loss and desperately hope that the market priceimproves so that profits are possible. However, if firms are incurring losses, they mustdecide whether it is economically rational to operate at all. The decision to shut down, orproduce zero, in the short run is sometimes the optimal strategy. To see why, consider whathappens when a firm begins to produce. When a perfectly competitive firm decides to produce any level of output greater than zero, two things happen.
a. It collects total revenue (TR) = P * qe, and
b. It incurs variable costs (TVC). Of course the firm also incurs total fixed costs, but itincurs those costs anyway, regardless of the level of output.
If the firm, by producing in the short run, can collect total revenues that at least exceed thetotal variable costs, then it continues to produce, even at a loss. However, if producingoutput incurs more variable cost than revenue collected, why bother? Shut down, hope forbetter times, and suffer losses equal to TFC. This comparison provides us a decision rulefor shutting down in the short run.
• If TR ≥ TVC, the firm produces qe where MR = MC.• If TR < TVC, the firm shuts down and q = 0.
The Shutdown PointWe can see the shutdown point in Figure 9.5 by converting the above decision rule into aper unit comparison. Dividing total revenue and total variable cost by q tells us to shutdown if P < AVC. This is the identical decision rule; it is just a per unit comparison of rev-enue and variable cost.
• If P ≥ AVC, the firm produces qe where MR = MC.• If P < AVC, the firm shuts down and q = 0.
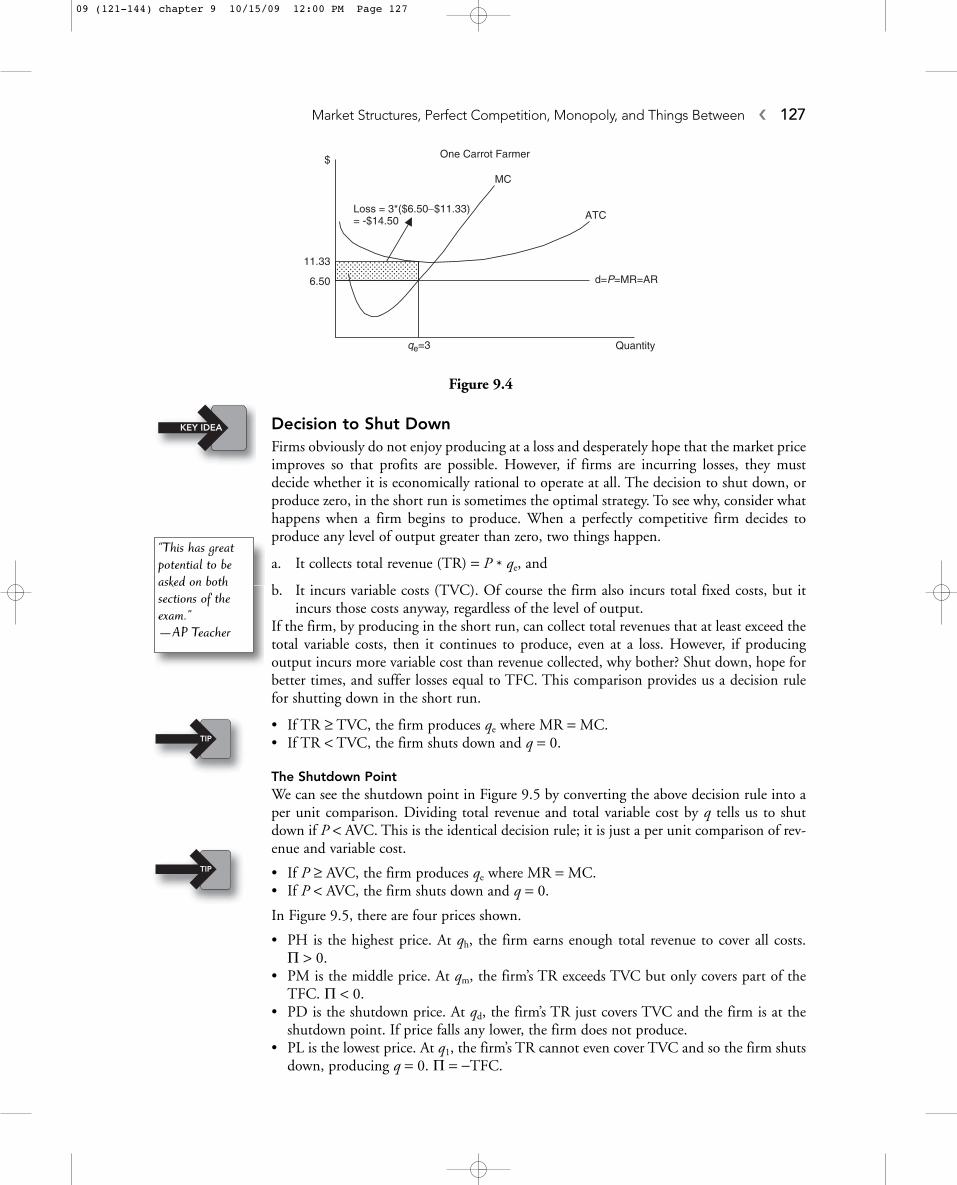
In Figure 9.5, there are four prices shown.
• PH is the highest price. At qh, the firm earns enough total revenue to cover all costs. P > 0.
• PM is the middle price. At qm, the firm’s TR exceeds TVC but only covers part of theTFC. P < 0.
• PD is the shutdown price. At qd, the firm’s TR just covers TVC and the firm is at theshutdown point. If price falls any lower, the firm does not produce.
• PL is the lowest price. At q1, the firm’s TR cannot even cover TVC and so the firm shutsdown, producing q = 0. P = -TFC.
Market Structures, Perfect Competition, Monopoly, and Things Between � 127
MC
$
6.50 d=P=MR=AR
qe=3
One Carrot Farmer
ATCLoss = 3*($6.50−$11.33) = -$14.50
11.33
Quantity
Figure 9.4
“This has greatpotential to beasked on bothsections of theexam.”—AP Teacher
KEY IDEA
TIP
TIP
09 (121-144) chapter 9 10/15/09 12:00 PM Page 127
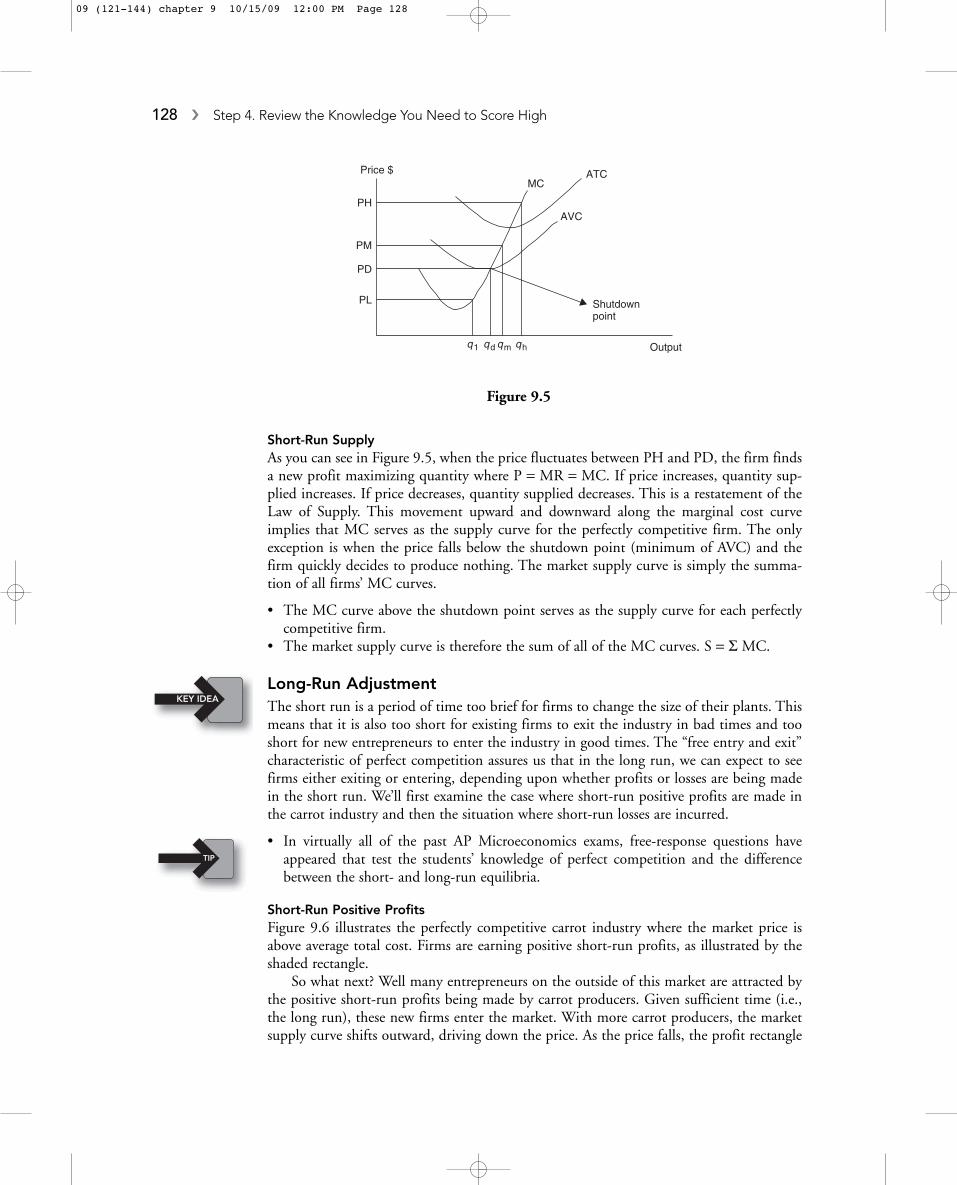
Short-Run SupplyAs you can see in Figure 9.5, when the price fluctuates between PH and PD, the firm findsa new profit maximizing quantity where P = MR = MC. If price increases, quantity sup-plied increases. If price decreases, quantity supplied decreases. This is a restatement of theLaw of Supply. This movement upward and downward along the marginal cost curveimplies that MC serves as the supply curve for the perfectly competitive firm. The onlyexception is when the price falls below the shutdown point (minimum of AVC) and thefirm quickly decides to produce nothing. The market supply curve is simply the summa-tion of all firms’ MC curves.
• The MC curve above the shutdown point serves as the supply curve for each perfectlycompetitive firm.
• The market supply curve is therefore the sum of all of the MC curves. S = S MC.
Long-Run AdjustmentThe short run is a period of time too brief for firms to change the size of their plants. Thismeans that it is also too short for existing firms to exit the industry in bad times and tooshort for new entrepreneurs to enter the industry in good times. The “free entry and exit”characteristic of perfect competition assures us that in the long run, we can expect to seefirms either exiting or entering, depending upon whether profits or losses are being madein the short run. We’ll first examine the case where short-run positive profits are made inthe carrot industry and then the situation where short-run losses are incurred.
• In virtually all of the past AP Microeconomics exams, free-response questions haveappeared that test the students’ knowledge of perfect competition and the differencebetween the short- and long-run equilibria.
Short-Run Positive ProfitsFigure 9.6 illustrates the perfectly competitive carrot industry where the market price isabove average total cost. Firms are earning positive short-run profits, as illustrated by theshaded rectangle.
So what next? Well many entrepreneurs on the outside of this market are attracted bythe positive short-run profits being made by carrot producers. Given sufficient time (i.e.,the long run), these new firms enter the market. With more carrot producers, the marketsupply curve shifts outward, driving down the price. As the price falls, the profit rectangle
128 � Step 4. Review the Knowledge You Need to Score High
Output
Price $
AVC
MCATC
PL
PD
PM
PH
qhqmqdq1
Shutdownpoint
Figure 9.5
KEY IDEA
TIP
09 (121-144) chapter 9 10/15/09 12:00 PM Page 128
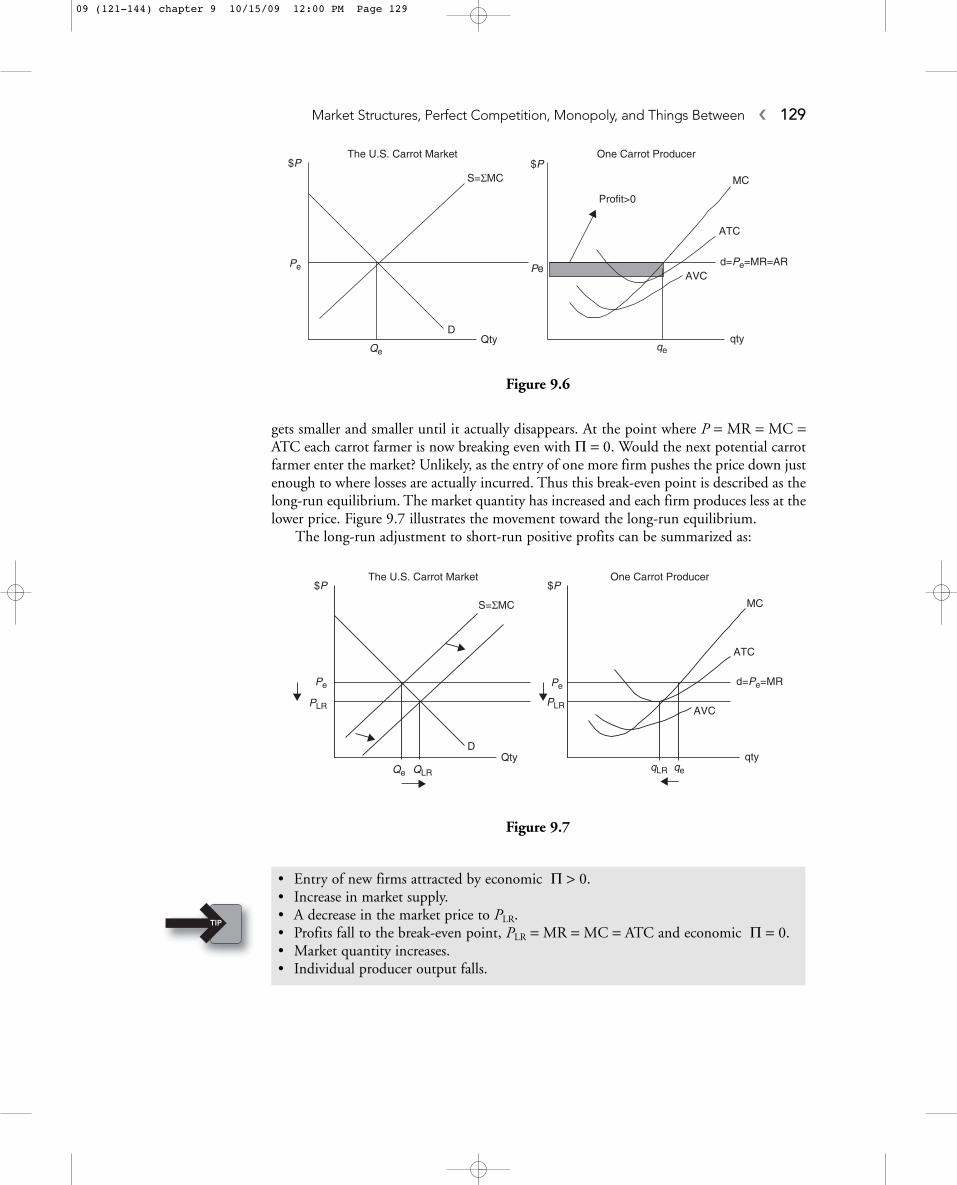
gets smaller and smaller until it actually disappears. At the point where P = MR = MC =ATC each carrot farmer is now breaking even with P = 0. Would the next potential carrotfarmer enter the market? Unlikely, as the entry of one more firm pushes the price down justenough to where losses are actually incurred. Thus this break-even point is described as thelong-run equilibrium. The market quantity has increased and each firm produces less at thelower price. Figure 9.7 illustrates the movement toward the long-run equilibrium.
The long-run adjustment to short-run positive profits can be summarized as:
• Entry of new firms attracted by economic P > 0.• Increase in market supply.• A decrease in the market price to PLR.• Profits fall to the break-even point, PLR = MR = MC = ATC and economic P = 0.• Market quantity increases.• Individual producer output falls.
Market Structures, Perfect Competition, Monopoly, and Things Between � 129
AVC
S=ΣMC
DQty qty
Pe Pe d=Pe=MR=AR
$P $PThe U.S. Carrot Market One Carrot Producer
Qe qe
MC
ATC
Profit>0
Figure 9.6
PLR AVC
S=ΣMC
D Qty qty
Pe Pe d=Pe=MR
$P $PThe U.S. Carrot Market One Carrot Producer
Qe qeqLR
MC
ATC
PLR
QLR
Figure 9.7
TIP
09 (121-144) chapter 9 10/15/09 12:00 PM Page 129
What’s So Great About Breaking Even?Remember there is a distinction between accounting profit and economic profit. Economicprofit subtracts the next best opportunity costs of your resources from total revenue. If youare still breaking even after subtracting what you might have earned in all of those otheropportunities, you can’t feel cheated. In other words, you are making a fair rate of returnon your invested resources and you have no incentive to take them elsewhere. Sure, youwould like to earn more than zero economic profit (a.k.a. “normal profit”) but the char-acteristics of perfect competition rule this out.
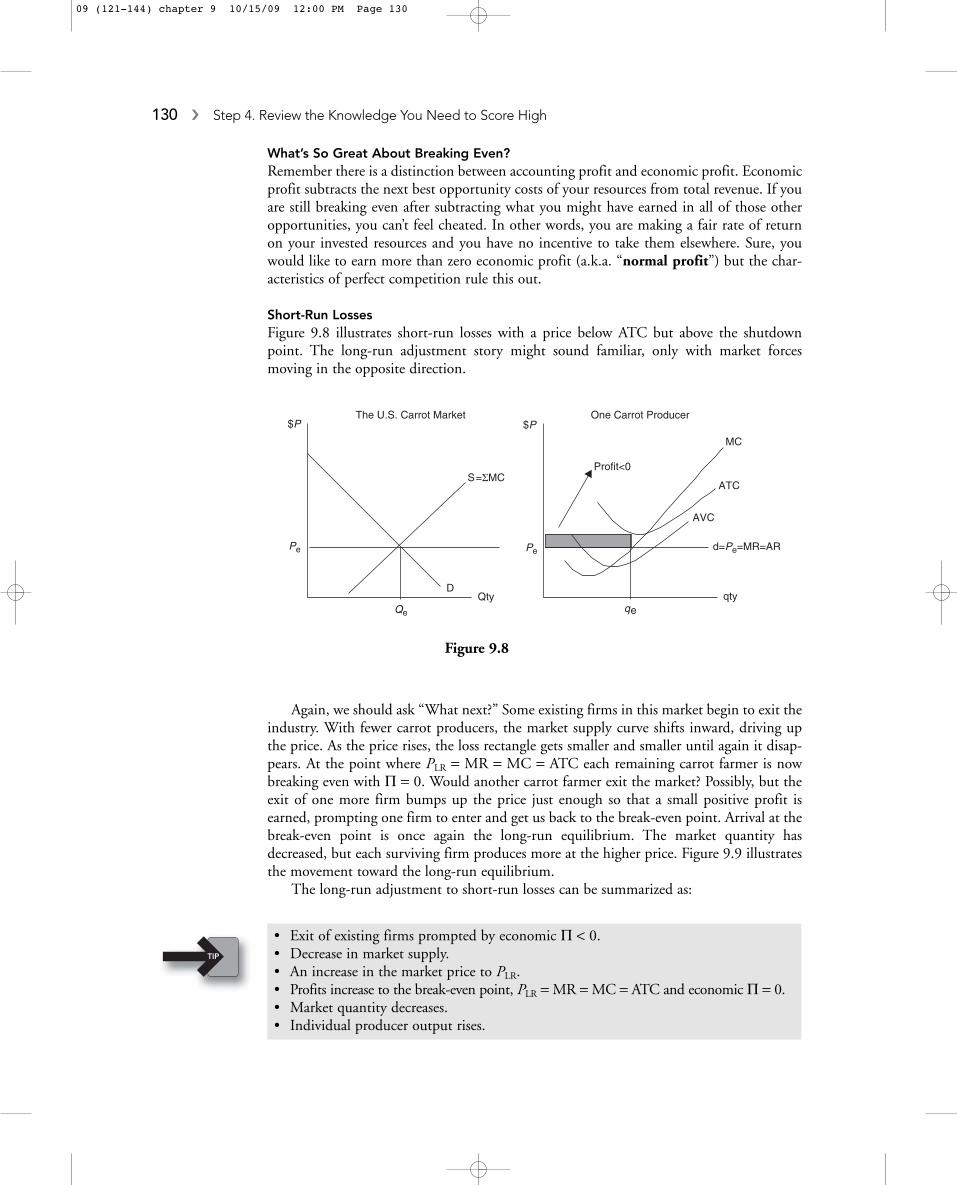
Short-Run LossesFigure 9.8 illustrates short-run losses with a price below ATC but above the shutdownpoint. The long-run adjustment story might sound familiar, only with market forcesmoving in the opposite direction.
Again, we should ask “What next?” Some existing firms in this market begin to exit theindustry. With fewer carrot producers, the market supply curve shifts inward, driving upthe price. As the price rises, the loss rectangle gets smaller and smaller until again it disap-pears. At the point where PLR = MR = MC = ATC each remaining carrot farmer is nowbreaking even with P = 0. Would another carrot farmer exit the market? Possibly, but theexit of one more firm bumps up the price just enough so that a small positive profit isearned, prompting one firm to enter and get us back to the break-even point. Arrival at thebreak-even point is once again the long-run equilibrium. The market quantity hasdecreased, but each surviving firm produces more at the higher price. Figure 9.9 illustratesthe movement toward the long-run equilibrium.
The long-run adjustment to short-run losses can be summarized as:
• Exit of existing firms prompted by economic P < 0.• Decrease in market supply.• An increase in the market price to PLR.• Profits increase to the break-even point, PLR = MR = MC = ATC and economic P = 0.• Market quantity decreases.• Individual producer output rises.
130 � Step 4. Review the Knowledge You Need to Score High
AVC
S=ΣMC
DQty qty
Pe Pe d=Pe=MR=AR
$P $PThe U.S. Carrot Market One Carrot Producer
Qe qe
MC
ATC
Profit<0
Figure 9.8
TIP
09 (121-144) chapter 9 10/15/09 12:00 PM Page 130
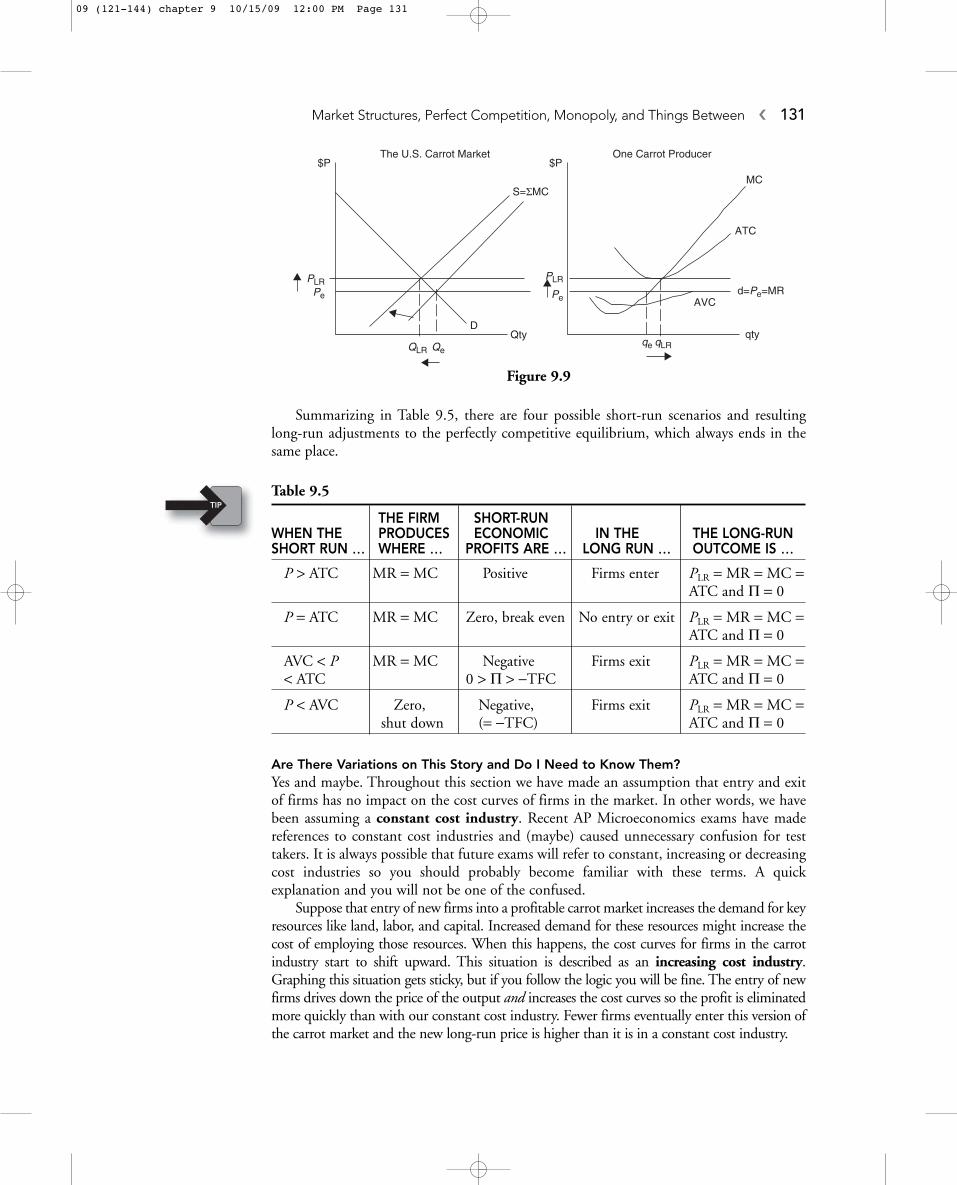
Summarizing in Table 9.5, there are four possible short-run scenarios and resultinglong-run adjustments to the perfectly competitive equilibrium, which always ends in thesame place.
Table 9.5
THE FIRM SHORT-RUN WHEN THE PRODUCES ECONOMIC IN THE THE LONG-RUNSHORT RUN º WHERE º PROFITS ARE º LONG RUN º OUTCOME IS º
P > ATC MR = MC Positive Firms enter PLR = MR = MC =ATC and P = 0
P = ATC MR = MC Zero, break even No entry or exit PLR = MR = MC = ATC and P = 0
AVC < P MR = MC Negative Firms exit PLR = MR = MC =< ATC 0 > P > -TFC ATC and P = 0
P < AVC Zero, Negative, Firms exit PLR = MR = MC =shut down (= -TFC) ATC and P = 0
Are There Variations on This Story and Do I Need to Know Them?Yes and maybe. Throughout this section we have made an assumption that entry and exitof firms has no impact on the cost curves of firms in the market. In other words, we havebeen assuming a constant cost industry. Recent AP Microeconomics exams have made references to constant cost industries and (maybe) caused unnecessary confusion for testtakers. It is always possible that future exams will refer to constant, increasing or decreasingcost industries so you should probably become familiar with these terms. A quick explanation and you will not be one of the confused.
Suppose that entry of new firms into a profitable carrot market increases the demand for keyresources like land, labor, and capital. Increased demand for these resources might increase thecost of employing those resources. When this happens, the cost curves for firms in the carrotindustry start to shift upward. This situation is described as an increasing cost industry.Graphing this situation gets sticky, but if you follow the logic you will be fine. The entry of newfirms drives down the price of the output and increases the cost curves so the profit is eliminatedmore quickly than with our constant cost industry. Fewer firms eventually enter this version ofthe carrot market and the new long-run price is higher than it is in a constant cost industry.
Market Structures, Perfect Competition, Monopoly, and Things Between � 131
PLR
AVC
S=ΣMC
DQty qty
Pe
PLR d=Pe=MR
$P $P The U.S. Carrot Market One Carrot Producer
Qeqe
MC
ATC
qLR
Pe
QLR
Figure 9.9
TIP
09 (121-144) chapter 9 10/15/09 12:00 PM Page 131
A decreasing cost industry is one in which the entry of new firms actually decreasesthe price of key inputs and causes the cost curves to shift downward. This might occurbecause producers of the key inputs expand production and experience economies of scaleand lower per-unit costs. Since the entry of new firms lowers the price of the output anddecreases the cost curves, it takes longer for the profit to be eliminated than in our constantcost industry. More firms can eventually enter this market and the new long-run price islower than it would be in a constant cost industry.
9.2 MonopolyMain Topics: Structural Characteristics, Monopoly Demand, Profit Maximization, EfficiencyAnalysis, Price Discrimination
Structural Characteristics of MonopolySince monopoly is the very opposite of perfect competition in the range of market struc-tures, we can expect that the structural characteristics are also quite different.
• A single producer. This is pretty self-explanatory, but a strict definition of monopolyrequires that there are no other firms in the industry.
• No close substitutes. Consumers cannot find a similar product in other markets.• Barriers to entry. Perhaps the most important characteristic of monopoly is that there
exists something that prevents rival firms from entering the market to provide competi-tion to the monopolist and choice to consumers.
• Market power. This is the result of the first three characteristics. With no competitionand barriers to entry, the unregulated monopolist has market power, or monopolyprice-setting ability.
Again, it is rare to find a firm that satisfies all of the characteristics of monopoly, butthe DeBeers firm holds a near monopoly on global diamond production. The only gas sta-tion or bank in a small town might also act as a local monopolist.
Barriers to EntryIf there were no barrier to entry, a monopolist earning positive economic profits would behistory and this chapter would be done. So before moving on to the behavior of monopoly,let’s talk a little more about this necessary condition for the existence of monopoly.
• Legal barriers. In your local television market only one firm is given the right to broad-cast on a specific frequency. There might be only one firm given the right to sell liquorin a small community. There are patents, trademarks, and copyright laws to protectinventions and intellectual property. In a move popular with 14-year-old boys every-where, Carmen Electra was recently given the sole right to the Internet address bearingher name. These legal protections do not provide for absolute monopoly for there areoften viable substitutes available to consumers.
• Economies of scale. In Chapter 8 this concept was introduced. As a firm grows larger inthe long run, average total costs fall, providing the larger firm a cost advantage oversmaller firms. If extensive economies of scale exist, an industry could evolve into onewith only one enormous producer. A natural monopoly is a case where economies ofscale are so extensive that it is less costly for one firm to supply the entire range ofdemand. Power plants are a good example of natural monopoly within a local area.
• Control of key resources. If a firm controlled most of the available resources in the productionof a good, it would be very difficult for a competitor to enter the market. For example,
132 � Step 4. Review the Knowledge You Need to Score High
KEY IDEA
09 (121-144) chapter 9 10/15/09 12:00 PM Page 132
if a producer of granulated sugar wanted to monopolize the market, the firm might wish tocontrol all of the sugarcane plantations.
Monopoly DemandThe perfectly competitive firm is a price taker and faces perfectly elastic demand for theproduct. The firm sells all it wants at the going market price; this decision does not affectthe market price. The monopolist is the only provider of that good, making the demandfor the product the market demand for that product. The monopolist must pay attentionto the Law of Demand, which means that if it wishes to sell more, the monopolist mustdecrease the price.
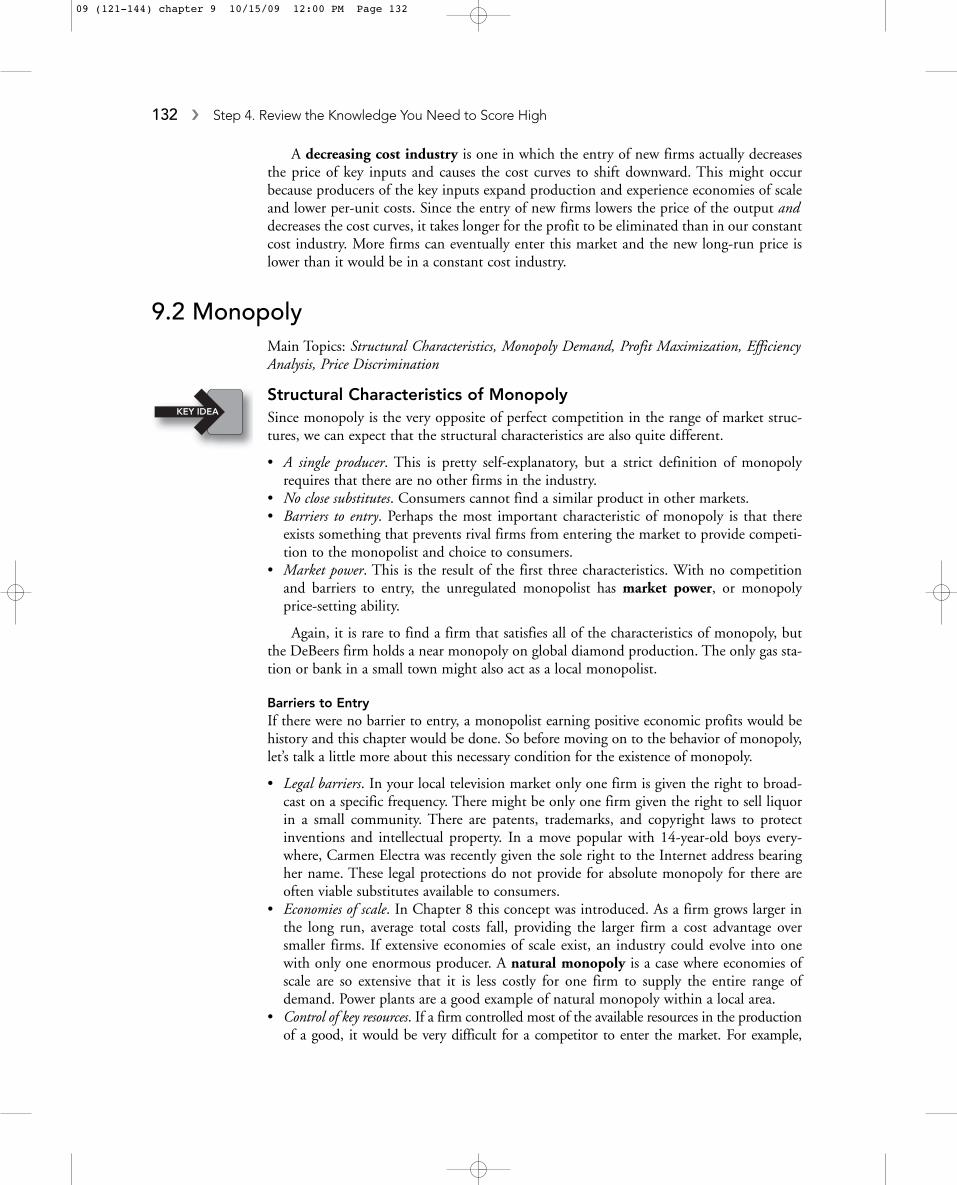
Demand, Price, and Marginal RevenuePrice exceeds marginal revenue because the monopolist must lower price to boost sales. Theadded revenue from selling one more unit is the price of the last unit less the sum of theprice cuts that must be taken on all prior units of output. For example, the demand curvefor the monopolist’s product is: P = 7 - Qd.
The monopolist begins at a price of $6 and sells one unit of the good (see Table 9.6).A price cut to $5 results in one more unit sold, so total revenue increases by $5 on thissecond unit. However, the first unit previously sold at $6, must also now be sold at $5,which costs the firm $1 in total revenue. With $5 gained (P) from the second and $1 lostin total revenue from the first unit, the net or marginal increase (MR) in total revenue is $4for the second unit. Graphically we can see the revenue effect of selling the second unit inFigure 9.10
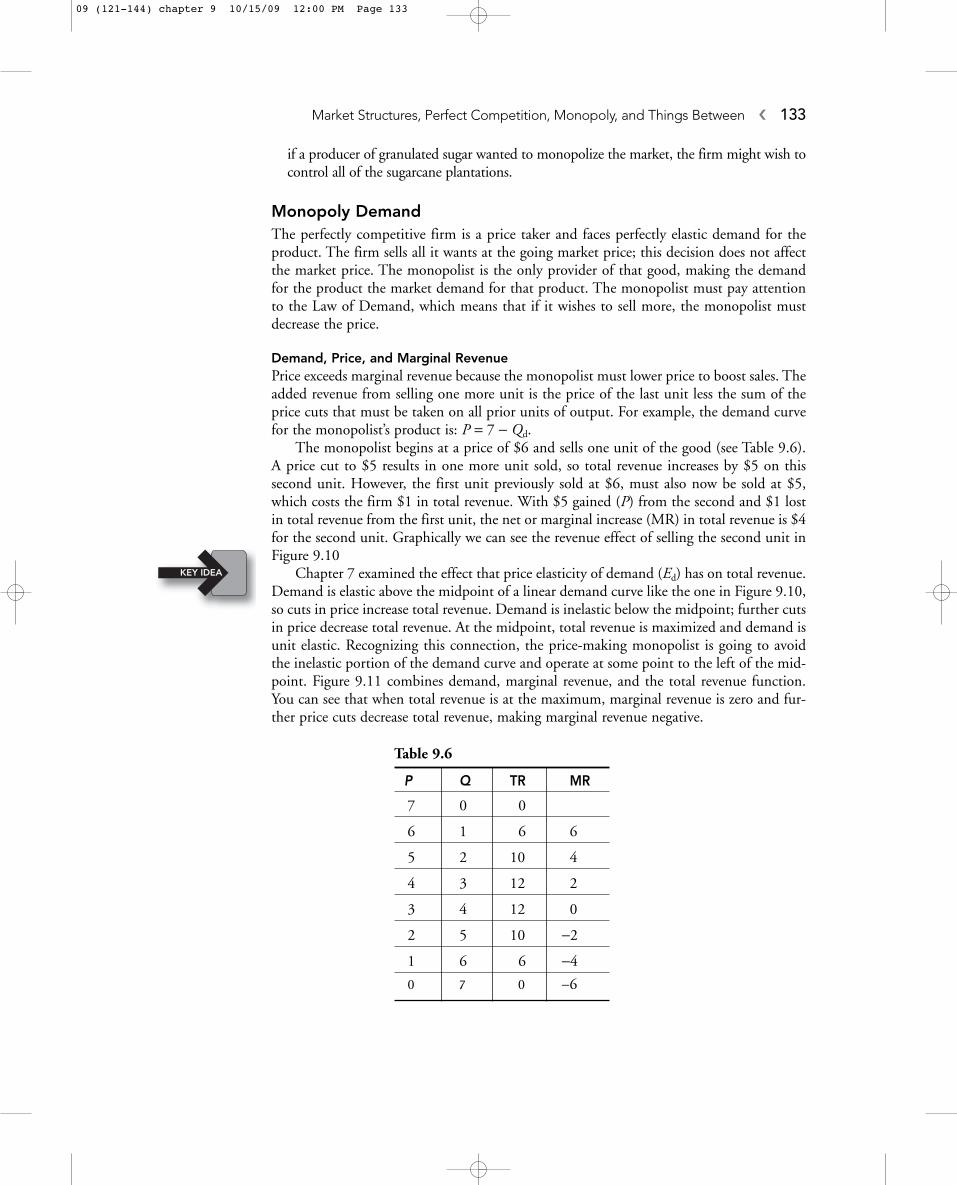
Chapter 7 examined the effect that price elasticity of demand (Ed) has on total revenue.Demand is elastic above the midpoint of a linear demand curve like the one in Figure 9.10,so cuts in price increase total revenue. Demand is inelastic below the midpoint; further cutsin price decrease total revenue. At the midpoint, total revenue is maximized and demand isunit elastic. Recognizing this connection, the price-making monopolist is going to avoidthe inelastic portion of the demand curve and operate at some point to the left of the mid-point. Figure 9.11 combines demand, marginal revenue, and the total revenue function.You can see that when total revenue is at the maximum, marginal revenue is zero and fur-ther price cuts decrease total revenue, making marginal revenue negative.
Market Structures, Perfect Competition, Monopoly, and Things Between � 133
Table 9.6
P Q TR MR
7 0 0
6 1 6 6
5 2 10 4
4 3 12 2
3 4 12 0
2 5 10 -2
1 6 6 -4
0 7 0 -6
KEY IDEA
09 (121-144) chapter 9 10/15/09 12:00 PM Page 133
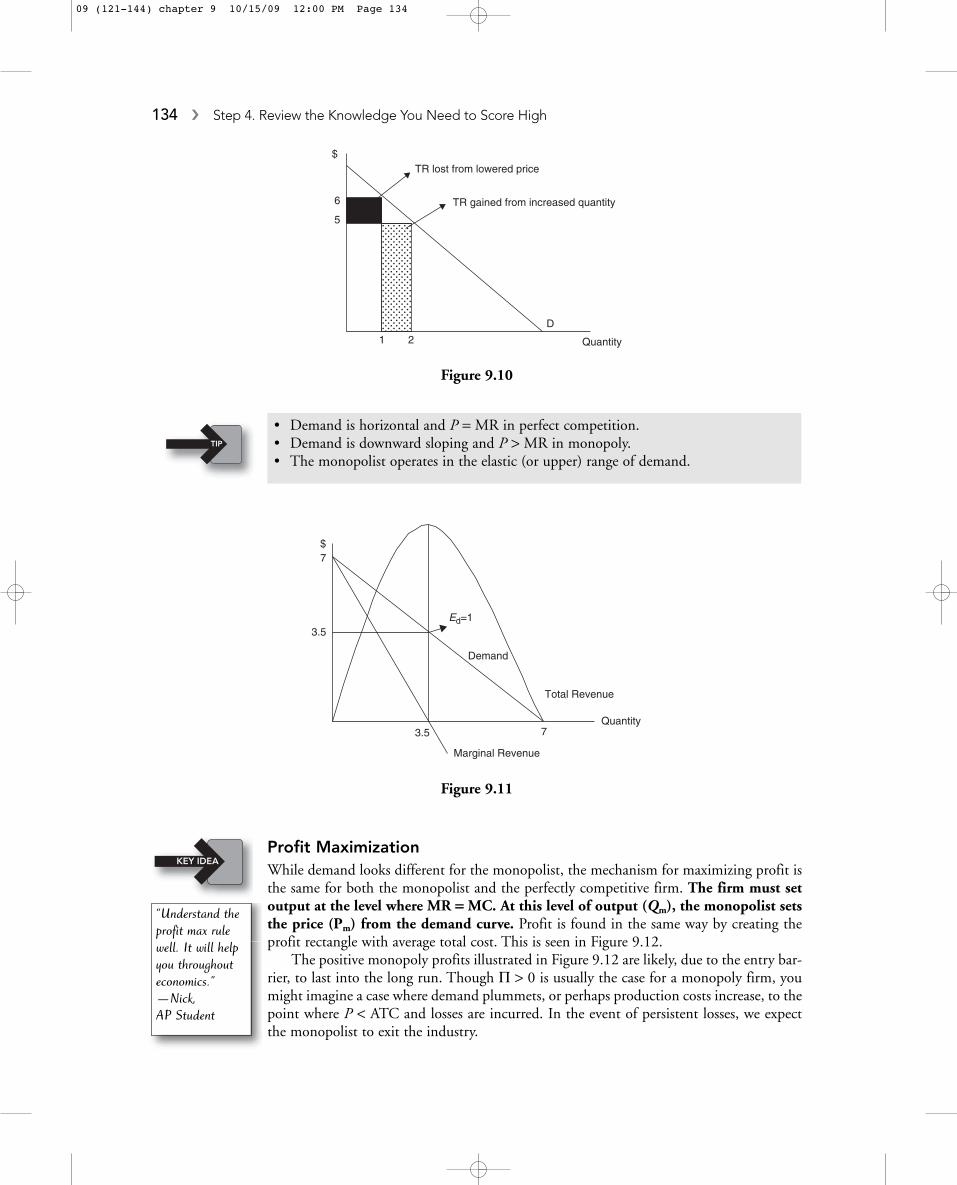
Profit MaximizationWhile demand looks different for the monopolist, the mechanism for maximizing profit isthe same for both the monopolist and the perfectly competitive firm. The firm must setoutput at the level where MR = MC. At this level of output (Qm), the monopolist setsthe price (Pm) from the demand curve. Profit is found in the same way by creating theprofit rectangle with average total cost. This is seen in Figure 9.12.
The positive monopoly profits illustrated in Figure 9.12 are likely, due to the entry bar-rier, to last into the long run. Though P > 0 is usually the case for a monopoly firm, youmight imagine a case where demand plummets, or perhaps production costs increase, to thepoint where P < ATC and losses are incurred. In the event of persistent losses, we expectthe monopolist to exit the industry.
• Demand is horizontal and P = MR in perfect competition.• Demand is downward sloping and P > MR in monopoly.• The monopolist operates in the elastic (or upper) range of demand.
134 � Step 4. Review the Knowledge You Need to Score High
D
Quantity
$
1 2
6
5
TR lost from lowered price
TR gained from increased quantity
Figure 9.10
Demand
Quantity
$
3.5
Marginal Revenue
Total Revenue
3.5
7
7
Ed=1
Figure 9.11
“Understand theprofit max rulewell. It will helpyou throughouteconomics.”—Nick, AP Student
KEY IDEA
TIP
09 (121-144) chapter 9 10/15/09 12:00 PM Page 134
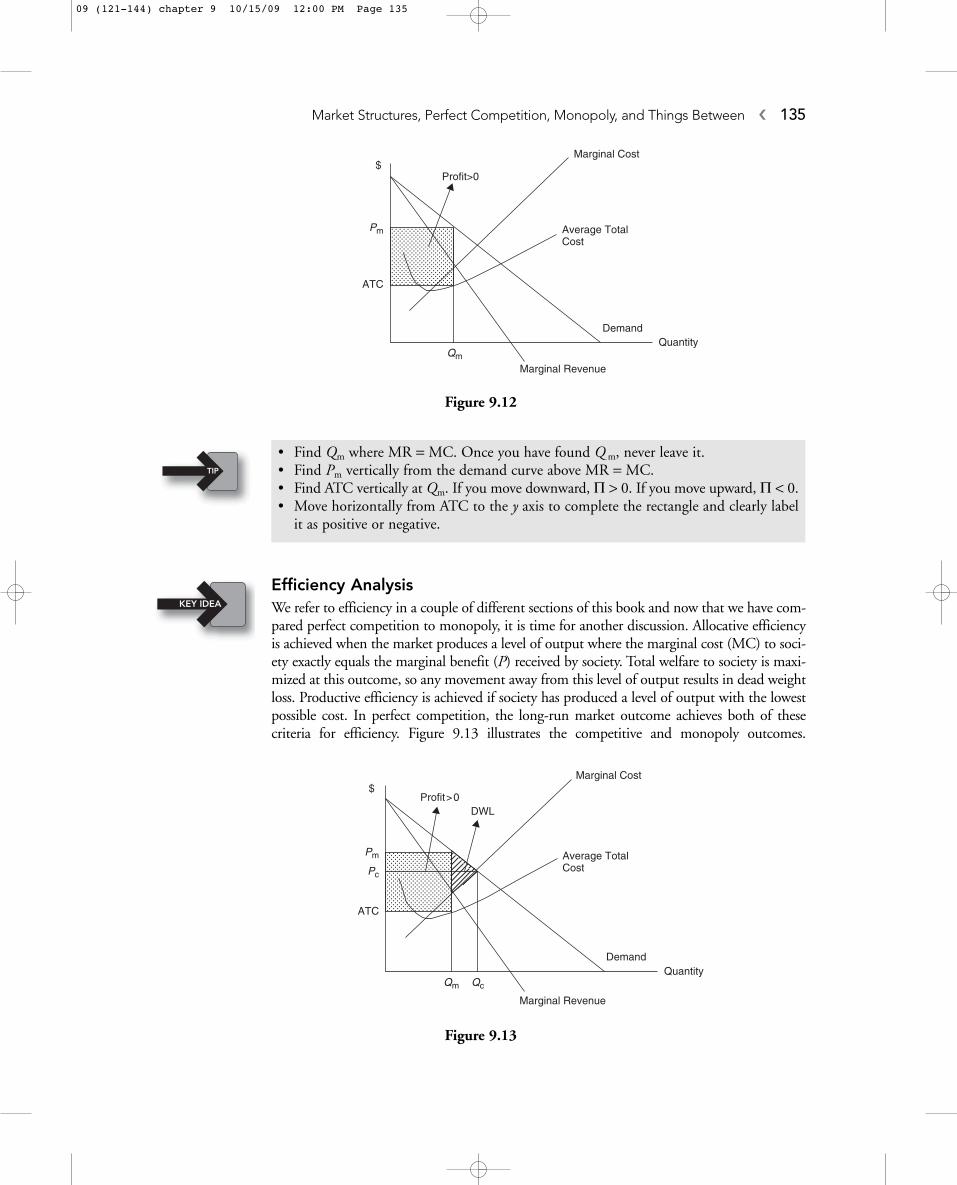
Efficiency AnalysisWe refer to efficiency in a couple of different sections of this book and now that we have com-pared perfect competition to monopoly, it is time for another discussion. Allocative efficiencyis achieved when the market produces a level of output where the marginal cost (MC) to soci-ety exactly equals the marginal benefit (P) received by society. Total welfare to society is maxi-mized at this outcome, so any movement away from this level of output results in dead weightloss. Productive efficiency is achieved if society has produced a level of output with the lowestpossible cost. In perfect competition, the long-run market outcome achieves both of these criteria for efficiency. Figure 9.13 illustrates the competitive and monopoly outcomes.
• Find Qm where MR = MC. Once you have found Q m, never leave it.• Find Pm vertically from the demand curve above MR = MC.• Find ATC vertically at Qm. If you move downward, P > 0. If you move upward, P < 0.• Move horizontally from ATC to the y axis to complete the rectangle and clearly label
it as positive or negative.
Market Structures, Perfect Competition, Monopoly, and Things Between � 135
DemandQuantity
$
Marginal Revenue
Marginal Cost
Qm
Pm
ATC
Average TotalCost
Profit>0
Figure 9.12
DemandQuantity
$
Marginal Revenue
Marginal Cost
Qm
Pm
ATC
Average TotalCost
Profit>0
Qc
Pc
DWL
Figure 9.13
TIP
KEY IDEA
09 (121-144) chapter 9 10/15/09 12:00 PM Page 135
Allocative efficiency exists because Pc = MR = MC at Qc and productive efficiency existsbecause firms produce at minimum ATC.
On the other hand, the monopolist produces at a quantity Qm where Pm > MR = MC.This result tells us that consumers would like to consume more of the product; but themonopolist does not produce as much as consumers want. Failing to achieve allocative effi-ciency creates the dead weight loss (DWL) shown in Figure 9.13. The monopoly output isnot at the point where ATC is minimized; thus the monopolist is not productively efficient.A profit earned by the monopolist is a transfer of consumer surplus from consumers to thefirm.
Price DiscriminationThough it carries a nasty stereotype, price discrimination is the selling of the same goodat different prices to different consumers. Successful price discrimination is possible if threeconditions exist:
1. The firm must have monopoly pricing power.
2. The firm must be able to identify and separate groups of consumers.
3. The firm must be able to prevent resale between consumers.
Common examples of price discrimination include:
• Child and senior discounts at the movie theatre or restaurants• Airline tickets that are bought three weeks in advance compared to tickets bought one
hour in advance• Long distance calling plans that offer a lower per minute rate at night than during the
working day• Coupons that separate price-sensitive consumers (those who use the coupon) from those
who are less price sensitive• A lower per unit price paid by consumers who buy items in large quantities (like a case
of soda) than those paid by consumers who buy in lesser quantities (like a six-pack ofsoda, or one can from a vending machine).
The airline industry is clearly not perfectly competitive so there must be a degree of monopolypricing power. The firm creates groupings based upon when consumers purchase tickets. Thephoto identification requirement for all passengers is an important security measure, but it alsoprevents the resale of a low-priced ticket to a consumer who is willing to pay a higher price. Ifresale were possible, the pricing system might break down. It should not surprise you that pricediscrimination allows firms to earn more profit than if they charged a single price.
• Qm < Qc
• Pm > Pc
• Pm > MC so monopoly is not allocatively efficient.• Dead weight loss exists with monopoly.• Pm > minimum ATC so monopoly is not productively efficient.• Pm > 0 is a transfer of lost consumer surplus from consumers to the firm.
136 � Step 4. Review the Knowledge You Need to Score High
TIP
09 (121-144) chapter 9 10/15/09 12:00 PM Page 136
9.3 Monopolistic CompetitionMain Topics: Structural Characteristics, Short-Run Profit Maximization, Long-Run Outcome
Structural CharacteristicsSharing some of the characteristics of both perfect competition and monopoly, the marketstructure of monopolistic competition provides a description of many modern industries.
• Relatively large number of firms. Rather than the thousands of perfectly competitive firms,in monopolistic competition there are perhaps dozens, each with a fairly small share ofthe total market.
• Differentiated products. This characteristic makes monopolistic competition stand out asdifferent from the perfectly competitive market structure and gives firms their ability toset the price above the competitive level.
• Easy entry and exit. There are very few barriers to entry in monopolistic competition, per-haps the largest being the need to provide sufficient marketing to differentiate a newfirm’s product from that of the existing rivals.
The market for shoes closely fits the description of monopolistic competition. Whileall shoes serve the same basic purpose, to cover and protect the feet, a running shoe, ahiking boot, and a flip-flop are very different and are made by many firms in the globalmarket. The book publishing market is also described as monopolistically competitive.
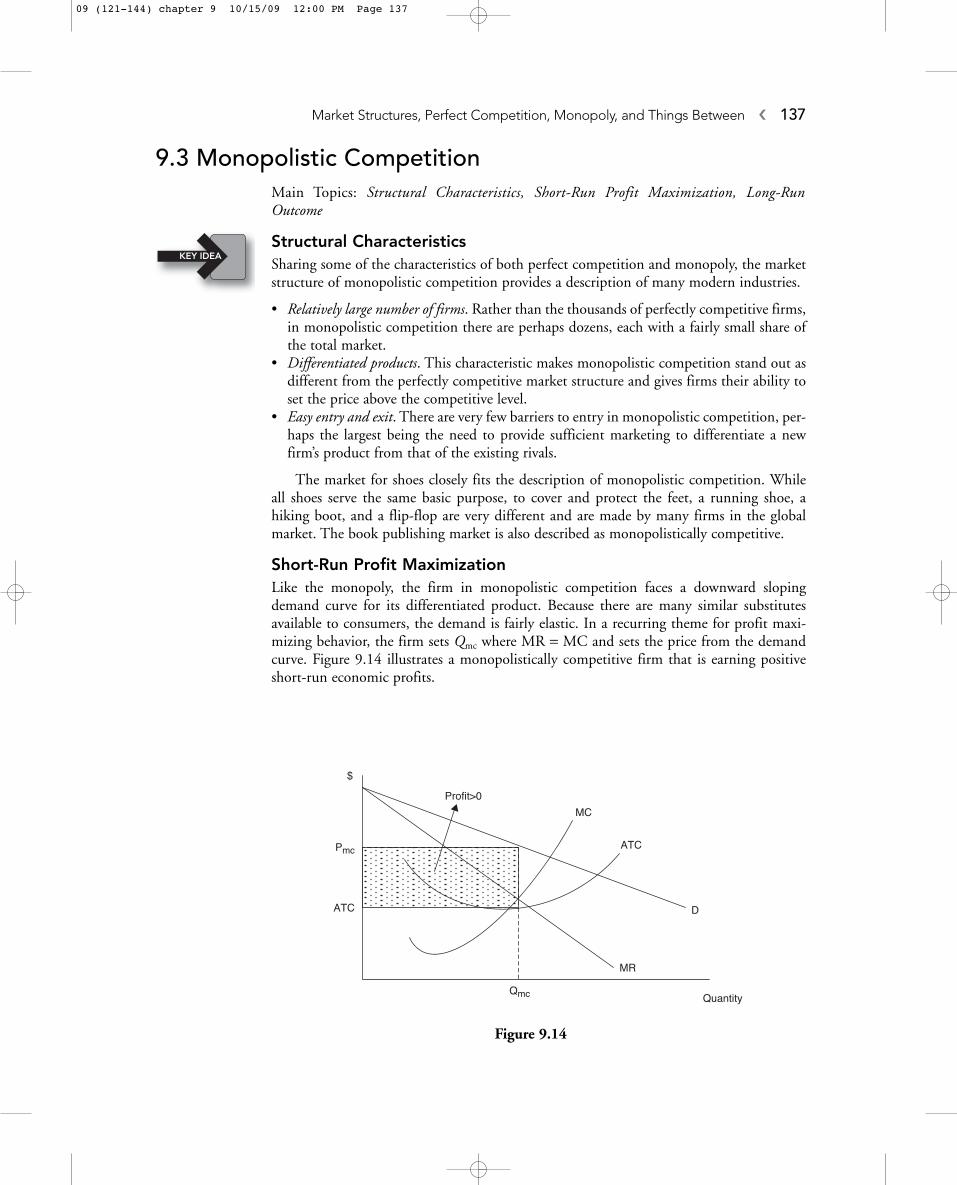
Short-Run Profit MaximizationLike the monopoly, the firm in monopolistic competition faces a downward slopingdemand curve for its differentiated product. Because there are many similar substitutesavailable to consumers, the demand is fairly elastic. In a recurring theme for profit maxi-mizing behavior, the firm sets Qmc where MR = MC and sets the price from the demandcurve. Figure 9.14 illustrates a monopolistically competitive firm that is earning positiveshort-run economic profits.
Market Structures, Perfect Competition, Monopoly, and Things Between � 137
Quantity
D
ATC
MC
Qmc
$
MR
Pmc
ATC
Profit>0
Figure 9.14
KEY IDEA
09 (121-144) chapter 9 10/15/09 12:00 PM Page 137

Long-Run AdjustmentWith easy entry and exit into the monopolistically competitive industry, short-run positiveprofits like those in Figure 9.14 are not going to last for long. As new firms enter this indus-try, the market share of all existing firms begins to fall. Graphically we see this as a leftwardshift in the demand curve. As the price begins to fall, the profit rectangle begins to shrink.Entry stops when profits are zero and P = ATC, or when the demand curve is just tangentto ATC. This adjustment is seen in Figure 9.15
“What About Advertising to Maintain Profits?”Because easy entry of competitors drives profits down to break-even levels, monopolisticallycompetitive firms typically engage in extensive amounts of advertising to slow down, andeven reverse, declining market share. This advertising is realistically only a short-run “fix”as there is no reason to believe that barriers to entry suddenly emerge to prevent the even-tual return to break-even profit levels.
Efficiency and Excess CapacityIn long-run monopolistic competition, the firm earns P = 0, a characteristic shared by theperfectly competitive firm. But because of the differentiated products, P > MR = MC;allocative efficiency is not achieved. The dead weight loss is the shaded area in Figure 9.15.Though the firms are breaking even, they are not operating at the minimum of ATC; pro-ductive efficiency is also not achieved. The difference between the monopolistic competi-tion output Qmc and the output at minimum ATC is referred to as excess capacity. Excesscapacity is underused plant and equipment that is the result of producing at an output lessthan that which minimizes ATC. The market is over-populated with firms, each producingenough to break even in the long run, but so many firms means that each produces belowfull capacity.
• Qmc < Qc
• Pmc > Pc
• Pmc > MC so monopolistic competition is not allocatively efficient.• Dead weight loss exists, but not as much as with monopoly.• Pm > minimum ATC so monopolistic competition is not productively efficient.• Pmc = 0 in the long run.• Excess capacity is Qatc - Qmc.
138 � Step 4. Review the Knowledge You Need to Score High
Quantity
D
ATC
MC
Qmc
$
MR
Pmc=ATC
Qatc
Excess capacity
Dead Weight Loss
Figure 9.15
TIP
09 (121-144) chapter 9 10/15/09 12:00 PM Page 138
9.4 OligopolyMain Topics: Structural Characteristics, Industry Concentration, Prisoners’ Dilemma, CollusionOligopoly markets are typically farther from perfect competition than the monopolisticmarket structure, although there is no one model of oligopoly. A couple of oligopolymodels are presented; but keep in mind that if one little assumption is relaxed, the predic-tions of the model can be radically different. For the AP exam you will likely face only thesebasics.
Structural CharacteristicsYou can see from these characteristics that oligopoly shares more common ground withmonopoly, but these are flexible enough to describe many different and diverse industries.
• A few large producers. Can it get more vague than this? Think of the American autoindustry, with the “Big 3” producers, or the tobacco industry, also dominated by threehuge firms. If the distribution of market share in an industry is top heavy with a few largefirms, the industry is described as oligopolistic.
• Differentiated or standardized product. Oligopoly industries can come in both flavors.Crude oil is a fairly standard product, but it is very much an oligopoly of large produc-ers. Automobiles, beer, and soft drinks are also oligopoly markets, but with more differ-entiated products.
• Entry barriers. If these industries were fairly easy to enter, we would not see them dominated by a few huge producers.
• Mutual interdependence. Because a few large producers control these industries, the actionof one firm (price setting or advertising) is likely to affect the others and prompt a response.A good example of this is your local gasoline market. This is very much an oligopoly; whenone gas station lowers prices by one cent per gallon, the others usually quickly follow.
Industry ConcentrationHow does an industry become classified as an oligopoly? Economists have tried to get morespecific than a “few large producers” by developing ways to measure how much marketshare is held by, or concentrated in, the largest of the firms. One way to gauge how power-ful the largest of firms might be is to sum up the market share of the top four, or eight or12 firms and create a concentration ratio. If the top four firms in the breakfast cerealindustry have a combined market share of 85 percent we say that the four-firm concentra-tion ratio is 85. Some economists use a four-firm concentration ratio of 40 percent as arough guideline for identifying an oligopolistic industry. We predict that as this concentra-tion ratio increases, the degree of monopoly price-setting power increases.
Game Theory and the Prisoners’ DilemmaImagine a case where a two-firm oligopoly (a duopoly) engages in a daily pricing decision.Each firm knows that if it sets a price higher than the rival’s, it loses sales. Likewise, if it setsa price below the rival’s, it steals sales. This non-collusive model of pricing, called the pris-oners’ dilemma, emerges from the following scenario that any fan of Law and Orderquickly recognizes.
Example:A college professor suspects two students (Jack and Diane) of cheating on a take-
home final exam, but cannot prove guilt with enough certainty to fail both stu-dents in the course, or expel them from the school. Without a confession, shewill give each student a D in the course. With a confession from one student
Market Structures, Perfect Competition, Monopoly, and Things Between � 139
KEY IDEA
KEY IDEA
09 (121-144) chapter 9 10/15/09 12:00 PM Page 139

but not the other, she can reward the confessor with a B. The professor bringsboth students, one at a time, into her office and gives each the following deal:
• If you remain silent and do not confess, and your classmate implicates you, I will expelyou from school and give your friend a B.
• If you confess to cheating and implicate your silent classmate, I will pass you with a Band expel your friend from school.
These options can be depicted in the following matrix.
Diane doesn’t know what Jack is going to do when he is in the professor’s office. Butwhatever Jack’s decision, Diane should confess. She might be thinking that Jack is going toconfess. If so, she confesses because staying silent will get her expelled from school. Maybeshe thinks that Jack is going to stay silent. If true, the choice is between a B and a D in thecourse. Diane would be wise to confess. For Diane, confessing is a dominant strategybecause no matter what Jack does, confession is always better than staying silent. Likewisefor Jack, the dominant strategy is to confess.
This is certainly a dilemma, because if Jack and Diane could only agree to give the pro-fessor the silent treatment, they would both walk away with a D, which is much better thanfailing the course or expulsion from school. Without such a binding agreement, cheatingon the pact would be quite tempting, maybe even fairly predictable.
Example:The owners of two gas stations operate on opposite corners of a busy intersection.
Each morning each owner goes out to the sign and sets the price of gasoline,either high or low. Consumers are concerned only about the lowest price of gas.The matrix below summarizes the daily revenues for each station.
Can you see the dilemma? Both stations would love to set a high price of gas so that they could earn $2000 in daily revenue. But if the rival were to set the low price, thehigh price station would be stuck with $500 while the other station cleans up with $3000.
STATION X
Price High Price Low
Price High X: $2000 X: $3000STATION Y Y: $2000 Y: $500
Price Low X: $500 X: $1000Y: $3000 Y: $1000
JACK’S CHOICES
Confess Stay Silent
Confess D: Fail the course D: Gets a BDIANE’S J: Fail the course J: Expelled fromCHOICES school
Stay Silent D: Expelled from school D: Gets a DJ: Gets a B J: Gets a D
140 � Step 4. Review the Knowledge You Need to Score High
09 (121-144) chapter 9 10/15/09 12:00 PM Page 140
Since both firms recognize that pricing low is the dominant strategy, both earn only $1000every day. A collusive agreement might emerge.
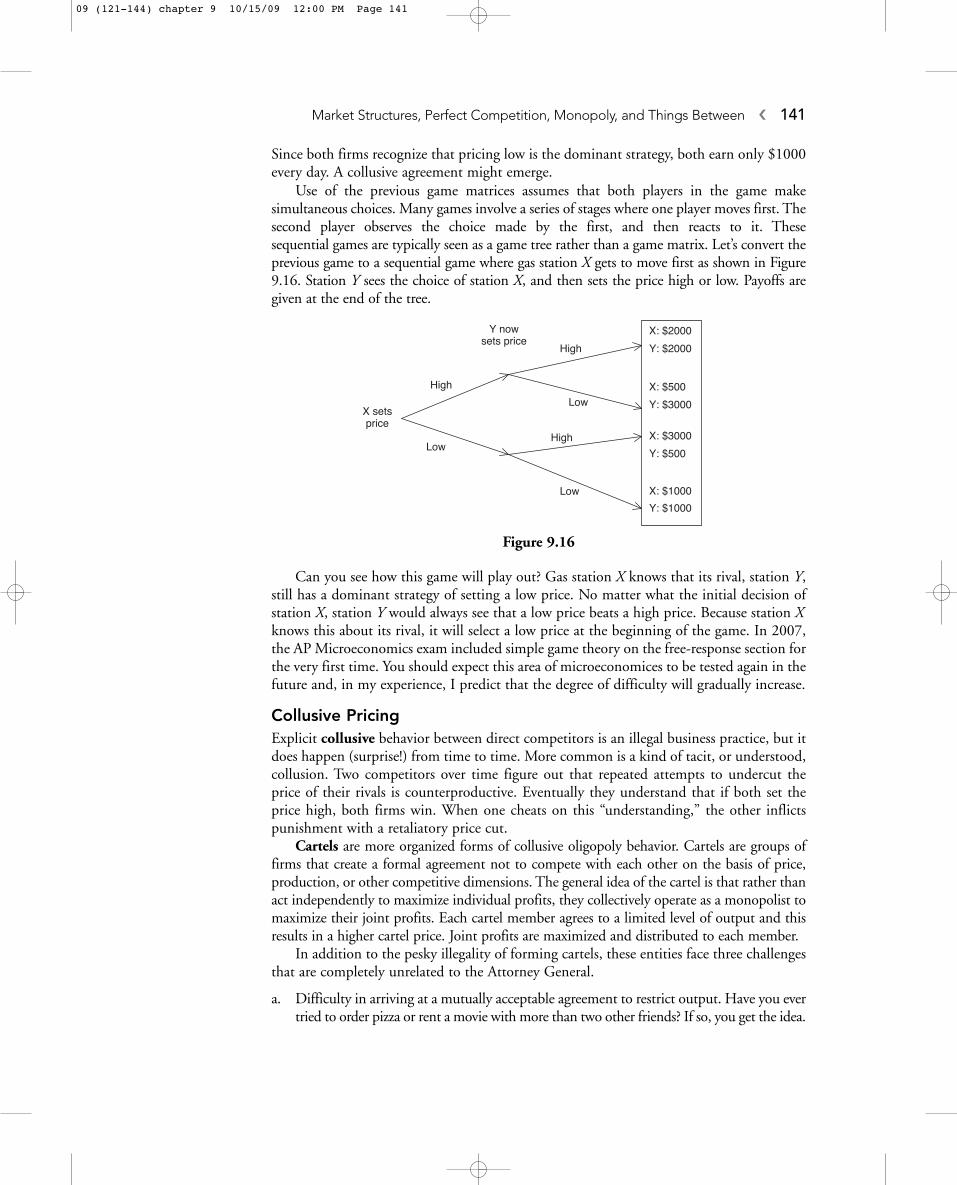
Use of the previous game matrices assumes that both players in the game make simultaneous choices. Many games involve a series of stages where one player moves first. Thesecond player observes the choice made by the first, and then reacts to it. These sequential games are typically seen as a game tree rather than a game matrix. Let’s convert theprevious game to a sequential game where gas station X gets to move first as shown in Figure9.16. Station Y sees the choice of station X, and then sets the price high or low. Payoffs aregiven at the end of the tree.
Can you see how this game will play out? Gas station X knows that its rival, station Y,still has a dominant strategy of setting a low price. No matter what the initial decision ofstation X, station Y would always see that a low price beats a high price. Because station Xknows this about its rival, it will select a low price at the beginning of the game. In 2007,the AP Microeconomics exam included simple game theory on the free-response section forthe very first time. You should expect this area of microeconomices to be tested again in thefuture and, in my experience, I predict that the degree of difficulty will gradually increase.
Collusive PricingExplicit collusive behavior between direct competitors is an illegal business practice, but itdoes happen (surprise!) from time to time. More common is a kind of tacit, or understood,collusion. Two competitors over time figure out that repeated attempts to undercut theprice of their rivals is counterproductive. Eventually they understand that if both set theprice high, both firms win. When one cheats on this “understanding,” the other inflictspunishment with a retaliatory price cut.
Cartels are more organized forms of collusive oligopoly behavior. Cartels are groups offirms that create a formal agreement not to compete with each other on the basis of price,production, or other competitive dimensions. The general idea of the cartel is that rather thanact independently to maximize individual profits, they collectively operate as a monopolist tomaximize their joint profits. Each cartel member agrees to a limited level of output and thisresults in a higher cartel price. Joint profits are maximized and distributed to each member.
In addition to the pesky illegality of forming cartels, these entities face three challengesthat are completely unrelated to the Attorney General.
a. Difficulty in arriving at a mutually acceptable agreement to restrict output. Have you evertried to order pizza or rent a movie with more than two other friends? If so, you get the idea.
Market Structures, Perfect Competition, Monopoly, and Things Between � 141
X setsprice
High
Low
Y nowsets price
High
Low
Low
High
X: $2000
Y: $2000
X: $500
Y: $3000
X: $3000
Y: $500
X: $1000
Y: $1000
Figure 9.16
09 (121-144) chapter 9 10/15/09 12:00 PM Page 141
b. Punishment mechanism. If the cartel can restrict output and increase the price abovethe current competitive level, cartel members have an incentive to cheat by producingmore than their allotment. There must be some kind of deterrent to cheating.
c. Entry of new firms. If the cartel members are successful in creating monopoly profits,they are faced with new firms eager to enter. If entry occurs, the cartel loses monopolypower and profit.
� Review Questions
142 � Step 4. Review the Knowledge You Need to Score High
1. For a competitive firm, what is the most impor-tant thing to consider in deciding whether toshut down in the short run?(A) Compare AVC to MR.(B) Compare TR to TC.(C) Do not produce if the TFC is not covered by
revenue.(D) Produce the highest quantity demanded
regardless of price.(E) Compare P to ATC.
2. Which characteristic is likely a part of a monopolymarket but not of monopolistic competition?(A) Differentiated products(B) Patents and copyrights(C) Possibility of profit in the short run(D) Dead weight loss exists(E) None of the above
3. If the perfectly competitive price is currentlyabove minimum ATC, we can expect which ofthe following events in the long run?(A) Price rises as firms enter the industry.(B) Market equilibrium quantity rises as firms
exit the industry.(C) Nothing, the industry is currently in long-
run equilibrium.(D) Profits fall as the market price rises.(E) Price falls as firms enter the industry.
4. Which of these situations is not an example ofprice discrimination?(A) Brent works nights so he chooses to buy
bread at 7 a.m. rather than at 7 p.m.(B) Bob and Nancy each receive a “$1 off ”
coupon in the mail, but Bob redeems it whileNancy does not.
(C) Katie buys 12 Cokes for $3 and Josh buysone Coke at a time for $1.
(D) Velma likes to go to the movies at the lowerafternoon matinee price and Rosemarywould rather pay more for the evening show.
(E) Jason and Jen go to a popular nightclub.Because it is “Ladies Night” Jen pays no covercharge, but Jason must pay to enter the club.
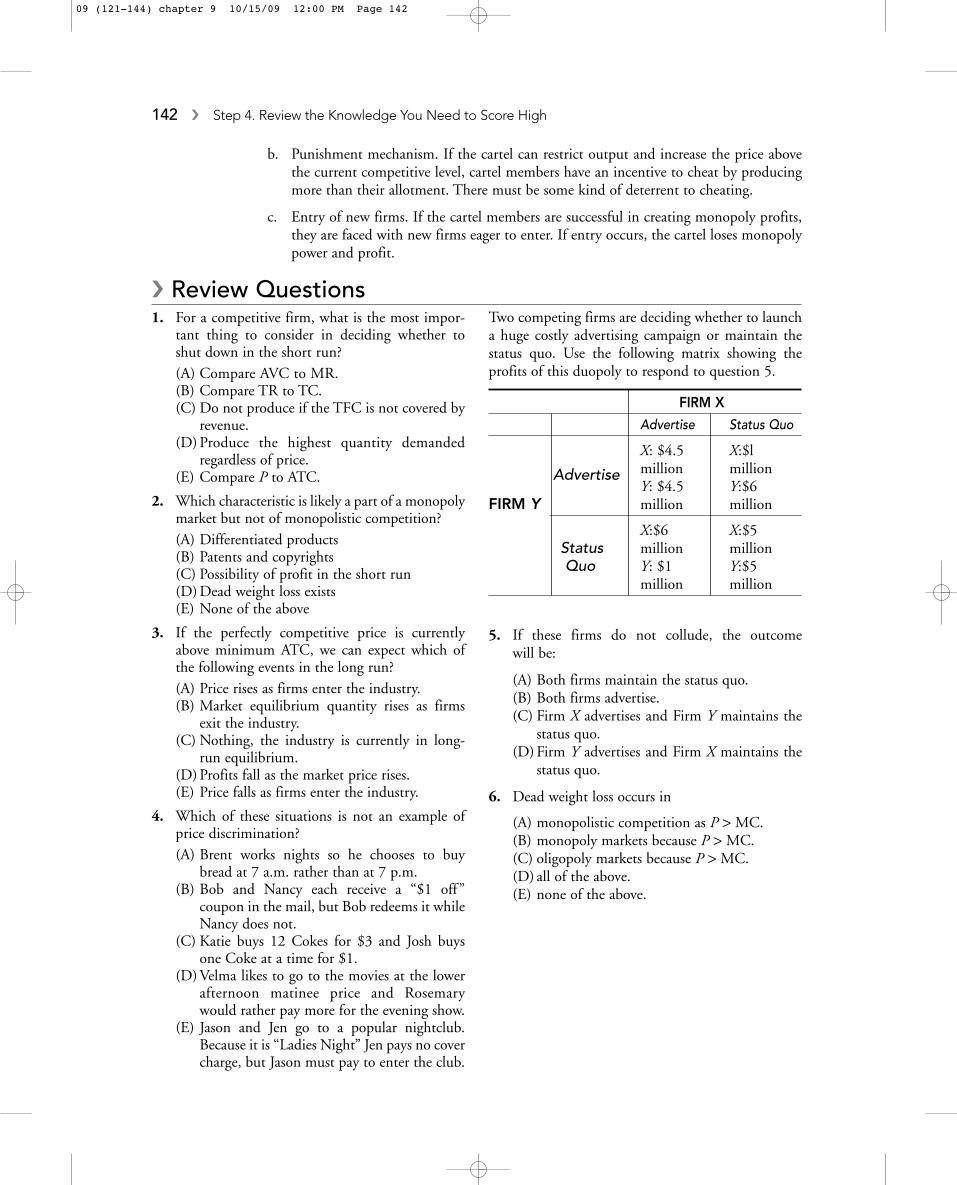
Two competing firms are deciding whether to launcha huge costly advertising campaign or maintain thestatus quo. Use the following matrix showing theprofits of this duopoly to respond to question 5.
FIRM X
Advertise Status Quo
X: $4.5 X:$l
Advertise million millionY: $4.5 Y:$6
FIRM Y million million
X:$6 X:$5 Status million millionQuo Y: $1 Y:$5
million million
5. If these firms do not collude, the outcome will be:
(A) Both firms maintain the status quo.(B) Both firms advertise.(C) Firm X advertises and Firm Y maintains the
status quo.(D) Firm Y advertises and Firm X maintains the
status quo.
6. Dead weight loss occurs in
(A) monopolistic competition as P > MC.(B) monopoly markets because P > MC.(C) oligopoly markets because P > MC.(D) all of the above.(E) none of the above.
09 (121-144) chapter 9 10/15/09 12:00 PM Page 142
� Rapid ReviewPerfect competition: the most competitive market structure is characterized by many smallprice-taking firms producing a standardized product in an industry in which there are nobarriers to entry or exit.
Profit Maximizing Rule: all firms maximize profit by producing where MR = MC.
Break-even point: the output where ATC is minimized and economic profit is zero.
Shutdown point: the output where AVC is minimized. If the price falls below this point,the firm chooses to shut down or produce zero units in the short run.
Perfectly competitive long-run equilibrium: occurs when there is no more incentive forfirms to enter or exit. P = MR = MC = ATC and P = 0.
Normal profit: another way of saying that firms are earning zero economic profits or a fairrate of return on invested resources.
Constant cost industry: Entry (or exit) of firms does not shift the cost curves of firms inthe industry.
Increasing cost industry: Entry of new firms shifts the cost curves for all firms upward.
Decreasing cost industry: Entry of new firms shifts the cost curves for all firms downward.
Monopoly: the least competitive market structure; it is characterized by a single producer,with no close substitutes, barriers to entry, and price making power.
Market power: the ability to set the price above the perfectly competitive level.
Market Structures, Perfect Competition, Monopoly, and Things Between � 143
1. A—The firm only operates if the total revenue isat least as great as total variable cost. On a per unitbasis, the firm must receive a P = MR that is atleast as great as AVC. Since firms pay TFC regard-less of production, they are not a factor inwhether you should shut down. Choices B, C,and E are wrong because TC and ATC include thefixed costs. Choice D is incorrect because it mightnot be the profitable strategy, but is irrelevant tothe shutdown decision.
2. B—Monopoly has barriers to entry (i.e., patents)and the monopolistic competitive firm does not.Choices A, C, and D are true of monopolisticcompetition and monopoly.
3. E—With P > ATC, you should recognize thatpositive economic profits exist. Firms enter andprice falls toward the break-even point so anymention of exit or rising prices can be eliminated.Entry also increases the market quantity of thegood produced.
4. A—If Brent chooses to buy his bread early in themorning rather than in the evening, this is notprice discrimination. The other choices describebuying in bulk, redeeming a coupon, or paying alower price because of the time in which one con-sumes the good. The nightclub example is pricediscrimination based upon gender.
5. B—For each firm, choosing the costly advertisingcampaign is the dominant strategy. This is anexample of the prisoners’ dilemma.
6. D—Allocative inefficiency and dead weight lossin any market structure is when P > MC.
� Answers and Explanations
09 (121-144) chapter 9 10/15/09 12:00 PM Page 143
Natural monopoly: the case where economies of scale are so extensive that it is less costlyfor one firm to supply the entire range of demand.
Monopoly long-run equilibrium: Pm > MR = MC, which is not allocatively efficient anddead weight loss exists. Pm > ATC, which is not productively efficient. Pm > 0 so consumersurplus is transferred to the monopolist as profit.
Price discrimination: the practice of selling essentially the same good to different groupsof consumers at different prices.
Monopolistic competition: a market structure characterized by a few small firms produc-ing a differentiated product with easy entry into the market.
Monopolistic competition long-run equilibrium: Pmc > MR = MC and Pmc > minimumATC so the outcome is not efficient, but Pmc = 0.
Excess capacity: the difference between the monopolistic competition output Qmc and theoutput at minimum ATC. Excess capacity is underused plant and equipment.
Oligopoly: a very diverse market structure characterized by a small number of interdepend-ent large firms, producing a standardized or differentiated product in a market with a bar-rier to entry.
Four-firm concentration ratio: a measure of industry market power. Sum the market shareof the four largest firms and a ratio above 40 percent is a good indicator of oligopoly.
Non-collusive oligopoly: models where firms are competitive rivals seeking to gain at theexpense of their rivals.
Prisoners’ dilemma: a game where the two rivals achieve a less desirable outcome becausethey are unable to coordinate their strategies.
Dominant strategy: a strategy that is always the best strategy to pursue, regardless of whata rival is doing.
Collusive oligopoly: models where firms agree to mutually improve their situation.
Cartel: a group of firms that agree not to compete with each other on the basis of price,production, or other competitive dimensions. Cartel members operate as a monopolist tomaximize their joint profits.
144 � Step 4. Review the Knowledge You Need to Score High
09 (121-144) chapter 9 10/15/09 12:00 PM Page 144