Embed Size (px)
Citation preview

MCB 371/372
quartets
positive selection
4/20/05
Peter Gogarten Office: BSP 404phone: 860 486-4061, Email: [email protected]
Perl assignment #3Write a script that takes all phylip formated aligned multiple sequence files present in a directory, and perfomes a bootstrap analyses using maximum parsimony. I.e., the script should go through the same steps as we did in the exercises #4 tasks 1a and 1c
Files you might want to use are A.fa, B.fa, alpha.fa, beta.fa, and atp_all.phy. BUT you first have to convert them to phylip format AND you should replace some or all gaps with ? (In the end you would be able to answer the question “does the resolution increase if a more related subgroup is analyzed independent from an outgroup?)
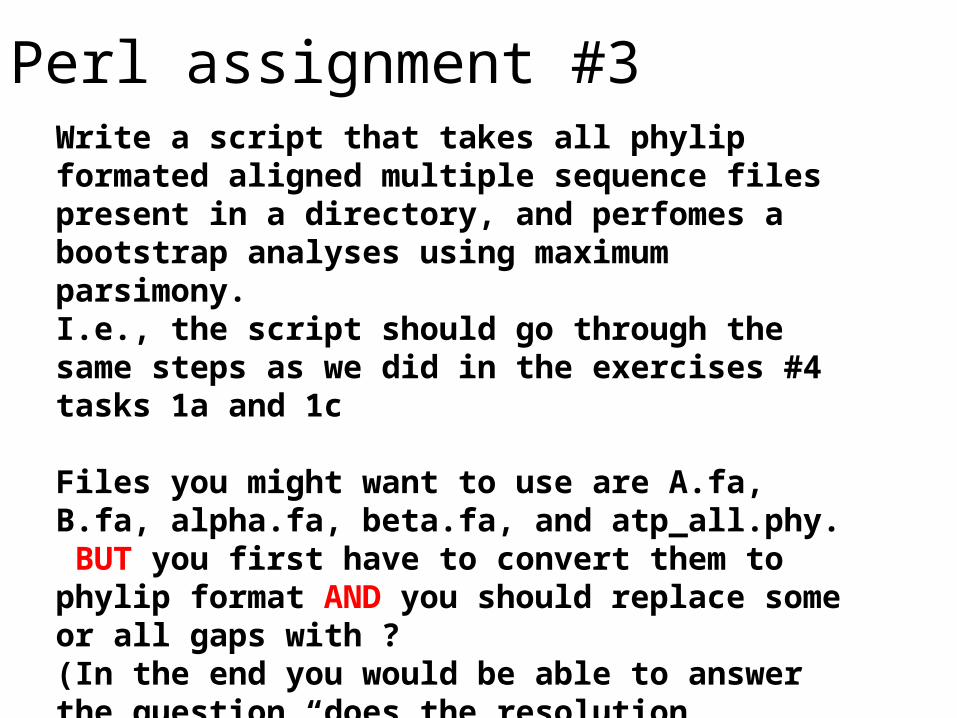
hints Rather than typing commands at the menu, you can write the responses that you would need to give via the keyboard into a file (e.g. your_input.txt)
You could start and execute the program protpars by typing
protpars < your_input.txt
your input.txt might contain the following lines: infile1.txtrt10yrr
in the script you could use the line system (“protpars < your_input.txt”); The main problem are the owerwrite commands if the oufile and outtree files are already existing. You can either create these beforehand, or erase them by moving (mv) their contents somewhere else.
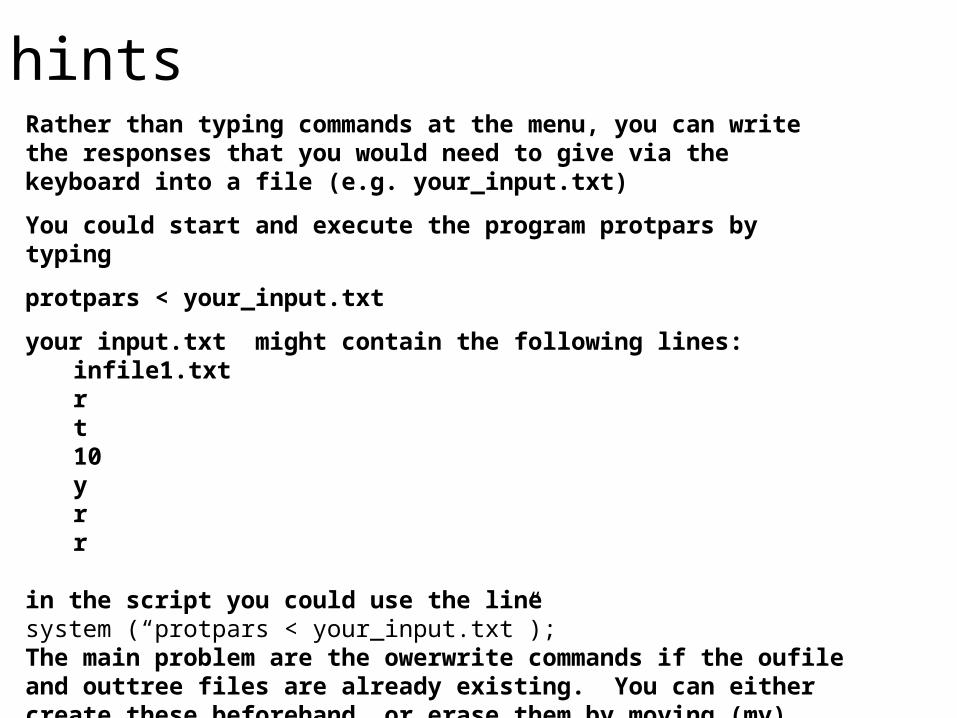
create *.phy files
the easiest (probably) is to run clustalw with the phylip option: For example (here):
#!/usr/bin/perl -w
print "# This program aligns all multiple sequence files with names *.fa \n
# found in its directory using clustalw, and saves them in phyip format.\n“;
while(defined($file=glob("*.fa"))){
@parts=split(/\./,$file);
$file=$parts[0];
system("clustalw -infile=$file.fa -align -output=PHYLIP");
};
# cleanup:
system ("rm *.dnd");
exit;
Alternatively, you could use a web version of readseq – this one worked great for me
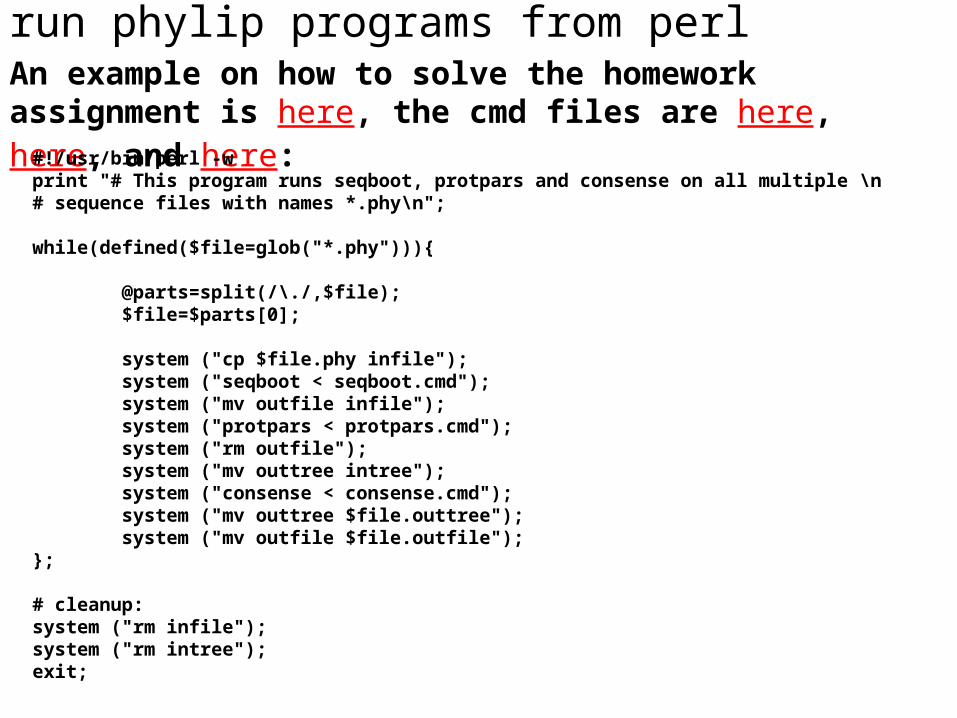
run phylip programs from perlAn example on how to solve the homework assignment is here, the cmd files are here, here, and here:
#!/usr/bin/perl -wprint "# This program runs seqboot, protpars and consense on all multiple \n# sequence files with names *.phy\n";
while(defined($file=glob("*.phy"))){
@parts=split(/\./,$file); $file=$parts[0];
system ("cp $file.phy infile"); system ("seqboot < seqboot.cmd"); system ("mv outfile infile"); system ("protpars < protpars.cmd"); system ("rm outfile"); system ("mv outtree intree"); system ("consense < consense.cmd"); system ("mv outtree $file.outtree"); system ("mv outfile $file.outfile");};
# cleanup:system ("rm infile");system ("rm intree");exit;

Alternative for entering the commands for the menu:
#!/usr/bin/perl -w
system ("cp A.phy infile");
system ("echo -e 'y\n9\n'|seqboot");
exit;
echo returns the string in ‘ ‘, i.e., y\n9\n. The –e options allows the use of \n The | symbol pipes the output from echo to seqboot
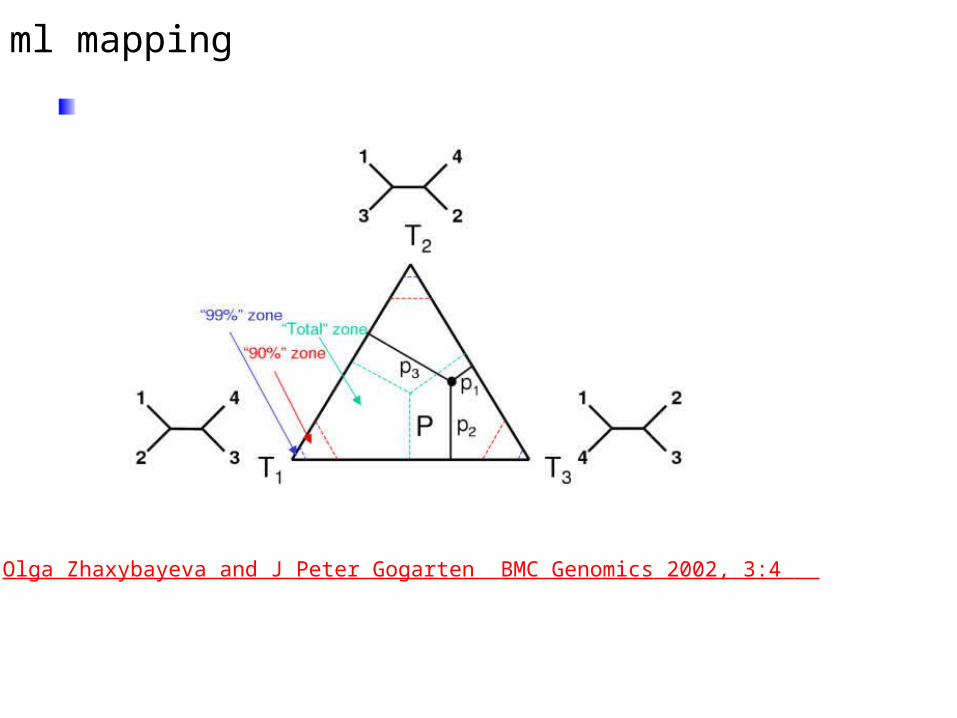
ml mapping
From: Olga Zhaxybayeva and J Peter Gogarten BMC Genomics 2002, 3:4
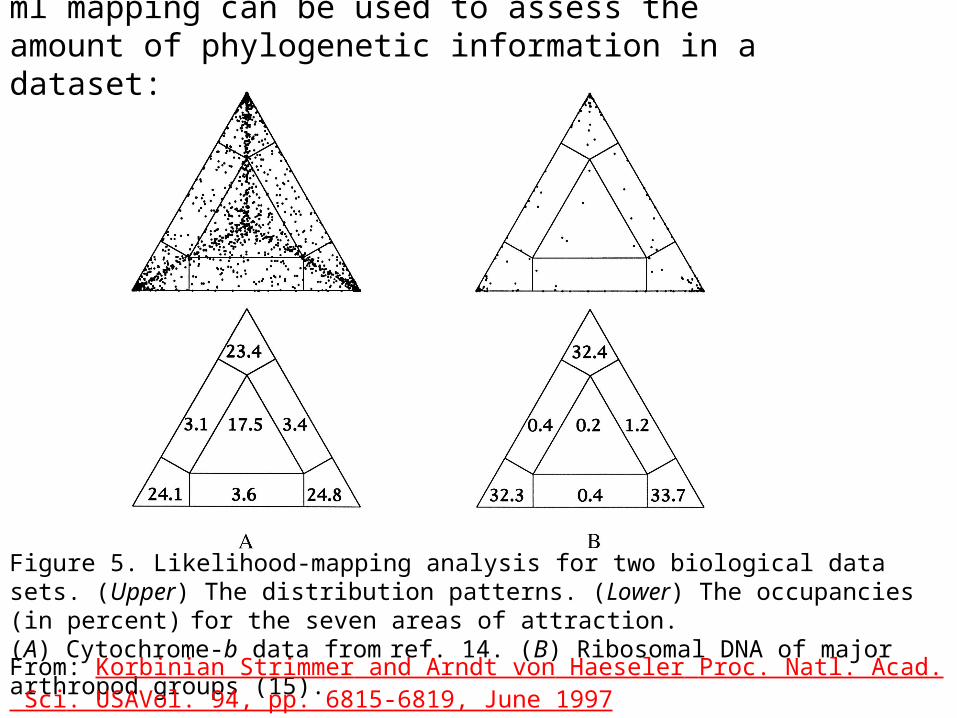
Figure 5. Likelihood-mapping analysis for two biological data sets. (Upper) The distribution patterns. (Lower) The occupancies (in percent) for the seven areas of attraction.
(A) Cytochrome-b data from ref. 14. (B) Ribosomal DNA of major arthropod groups (15). From: Korbinian Strimmer and Arndt von Haeseler Proc. Natl. Acad. Sci. USAVol. 94, pp. 6815-6819, June 1997
ml mapping can be used to assess the amount of phylogenetic information in a dataset:
ml mapping can asses the topology surrounding an individual branch :
E.g.: If we want to know if Giardia lamblia forms the deepest branch within the known eukaryotes, we can use ML mapping to address this problem. To apply ml mapping we choose the "higher" eukaryotes as cluster a, another deep branching eukaryote (the one that competes against Giardia) as cluster b, Giardia as cluster c, and the outgroup as cluster d. For an example output see this sample ml-map.
An analysis of the carbamoyl phosphate synthetase domains with respect to the root of the tree of life is here.
ml mapping can asses the not necessarily treelike histories of genome
Application of ML mapping to comparative Genome analyses
see here for a comparison of different probability measures. Fig. 3: outline of approach Fig. 4: Example and comparison of different measures
see here for an approach that solves the problem of poor taxon sampling that is usually considered inherent with quartet analyses.Fig. 2: The principle of “analyzing extended datasets to obtain embedded quartets” Example next slides:
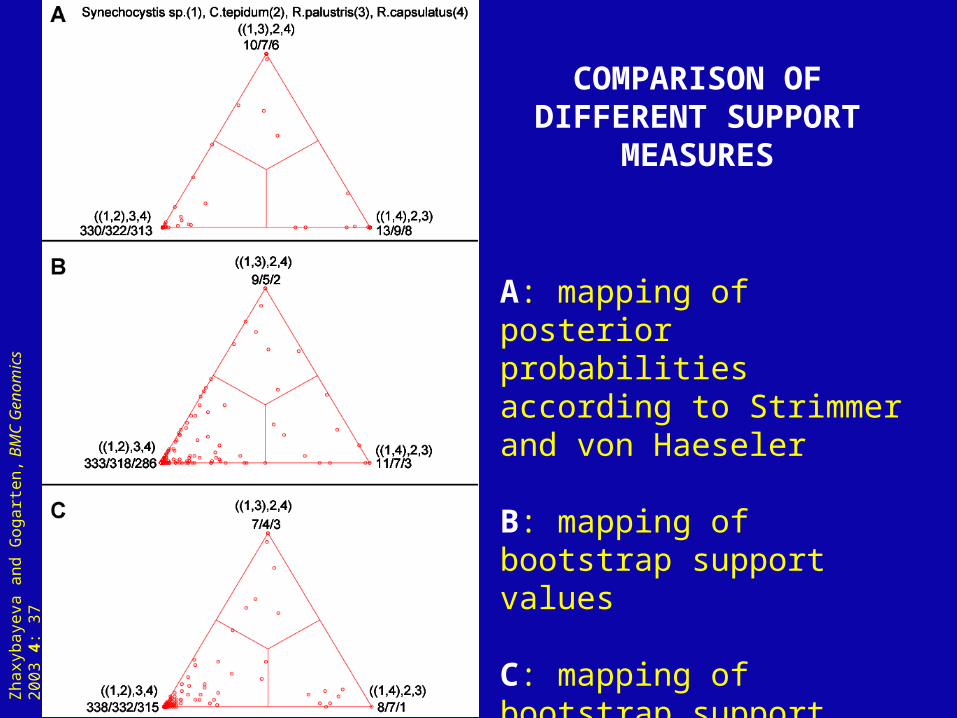
A: mapping of posterior probabilities according to Strimmer and von Haeseler
B: mapping of bootstrap support values
C: mapping of bootstrap support values from extended datasets
COMPARISON OF DIFFERENT SUPPORT
MEASURES
Zha
xyba
yeva
and
Gog
arte
n, B
MC
Gen
omic
s 20
03 4
: 37
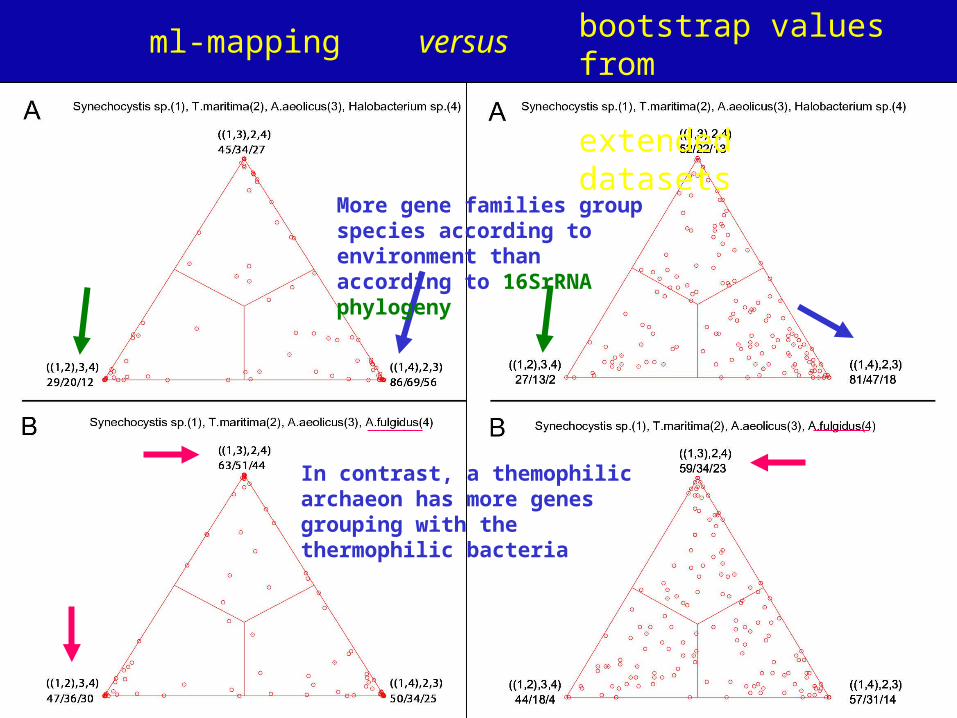
bootstrap values from extended datasets
ml-mapping versus
More gene families group species according to environment than according to 16SrRNA phylogeny
In contrast, a themophilic archaeon has more genes grouping with the thermophilic bacteria
the gradualist point of viewEvolution occurs within populations where the fittest organisms have a selective advantage. Over time the advantages genes become fixed in a population and the population gradually changes.
Note: this is not in contradiction to the the theory of neutral evolution. (which says what ?)
Processes that MIGHT go beyond inheritance with variation and selection? •Horizontal gene transfer and recombination •Polyploidization (botany, vertebrate evolution) see here •Fusion and cooperation of organisms (Kefir, lichen, also the eukaryotic cell) •Targeted mutations (?), genetic memory (?) (see Foster's and Hall's reviews on directed/adaptive mutations; see here for a counterpoint) •Random genetic drift •Gratuitous complexity •Selfish genes (who/what is the subject of evolution??) •Parasitism, altruism, Morons
selection versus drift
see Kent Holsinger’s java simulations at http://darwin.eeb.uconn.edu/simulations/simulations.htmlThe law of the gutter.compare drift versus select + drift The larger the population the longer it takes for an allele to become fixed. Note: Even though an allele conveys a strong selective advantage of 10%, the allele has a rather large chance to go extinct. Note#2: Fixation is faster under selection than under drift.
BUT
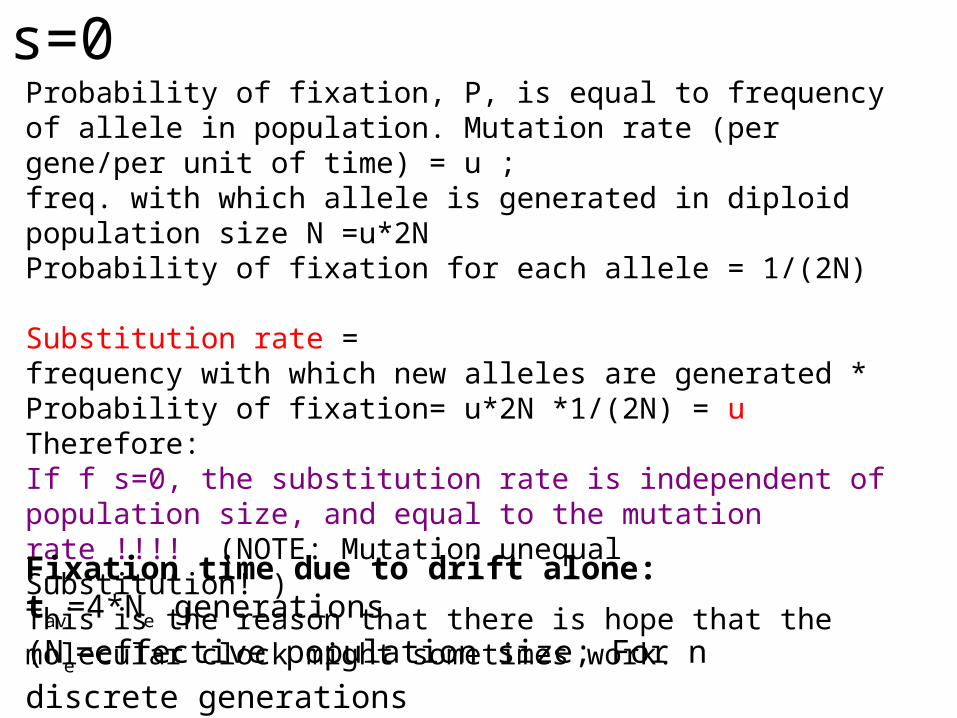
s=0Probability of fixation, P, is equal to frequency of allele in population. Mutation rate (per gene/per unit of time) = u ; freq. with which allele is generated in diploid population size N =u*2N Probability of fixation for each allele = 1/(2N)
Substitution rate = frequency with which new alleles are generated * Probability of fixation= u*2N *1/(2N) = u Therefore: If f s=0, the substitution rate is independent of population size, and equal to the mutation rate !!!! (NOTE: Mutation unequal Substitution! )This is the reason that there is hope that the molecular clock might sometimes work.
Fixation time due to drift alone: tav=4*Ne generations
(Ne=effective population size; For n discrete generations
Ne= n/(1/N1+1/N2+…..1/Nn)
s>0
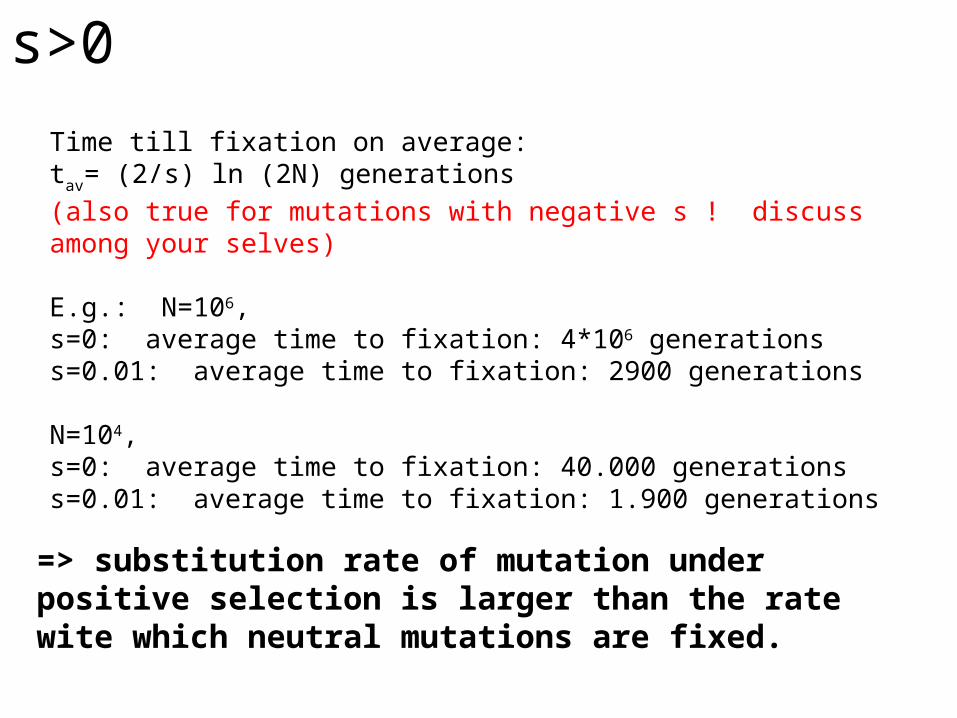
Time till fixation on average: tav= (2/s) ln (2N) generations
(also true for mutations with negative s ! discuss among your selves)
E.g.: N=106, s=0: average time to fixation: 4*106 generationss=0.01: average time to fixation: 2900 generations
N=104, s=0: average time to fixation: 40.000 generationss=0.01: average time to fixation: 1.900 generations
=> substitution rate of mutation under positive selection is larger than the rate wite which neutral mutations are fixed.
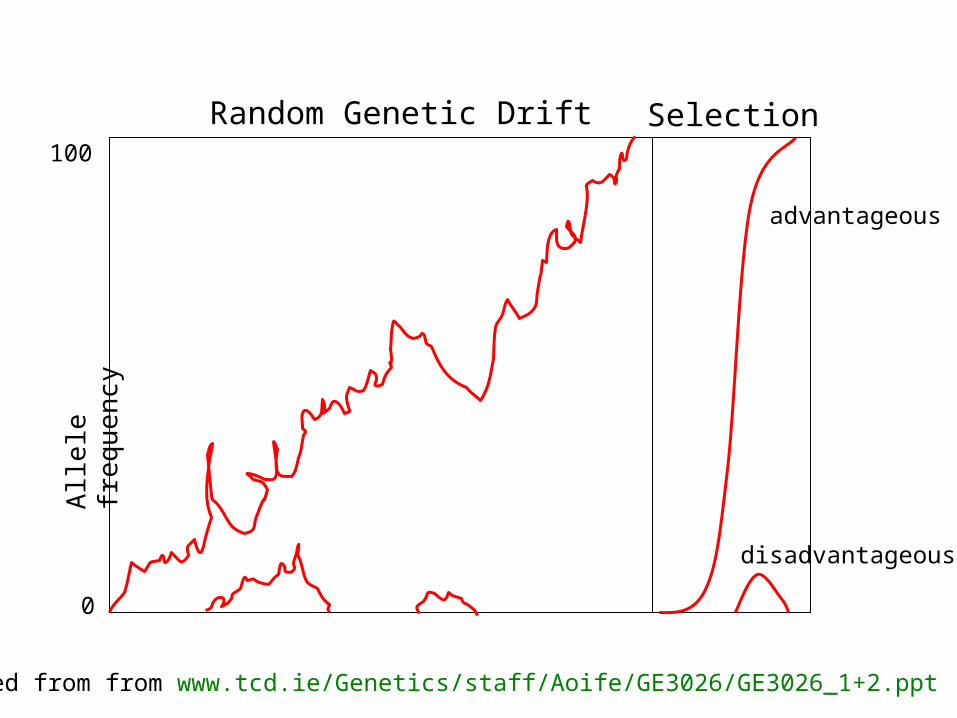
Random Genetic Drift SelectionA
llele
fr
equ
enc
y
0
100
advantageous
disadvantageous
Modified from from www.tcd.ie/Genetics/staff/Aoife/GE3026/GE3026_1+2.ppt
Positive selection
• A new allele (mutant) confers some increase in the fitness of the organism
• Selection acts to favour this allele
• Also called adaptive selection or Darwinian selection.
NOTE: Fitness = ability to survive and reproduce
Modified from from www.tcd.ie/Genetics/staff/Aoife/GE3026/GE3026_1+2.ppt
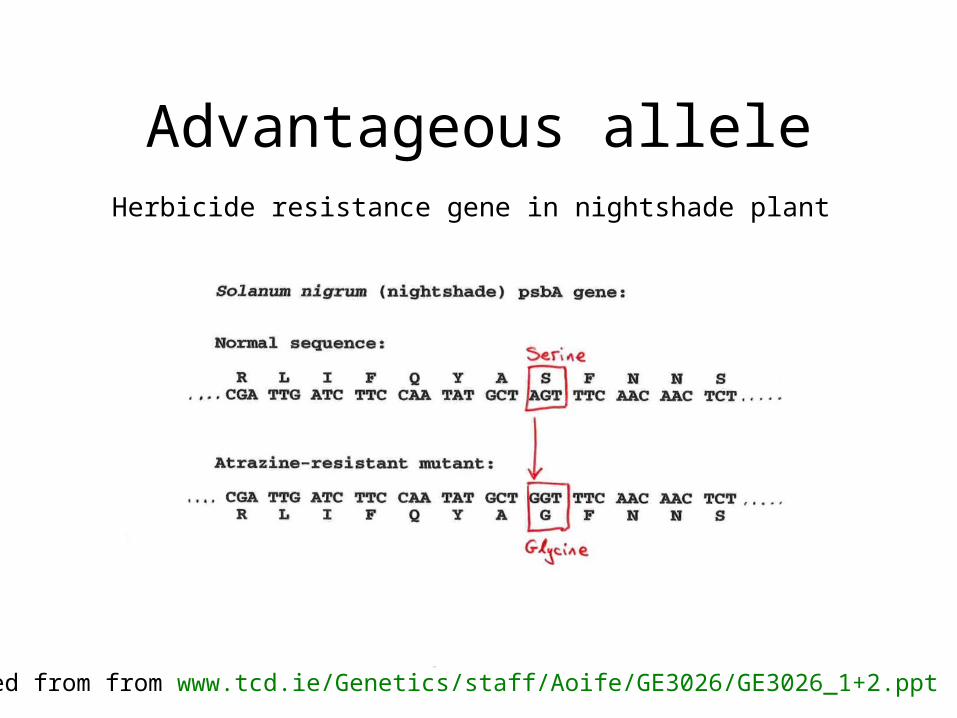
Advantageous alleleHerbicide resistance gene in nightshade plant
Modified from from www.tcd.ie/Genetics/staff/Aoife/GE3026/GE3026_1+2.ppt
Negative selection
• A new allele (mutant) confers some decrease in the fitness of the organism
• Selection acts to remove this allele
• Also called purifying selection
Modified from from www.tcd.ie/Genetics/staff/Aoife/GE3026/GE3026_1+2.ppt
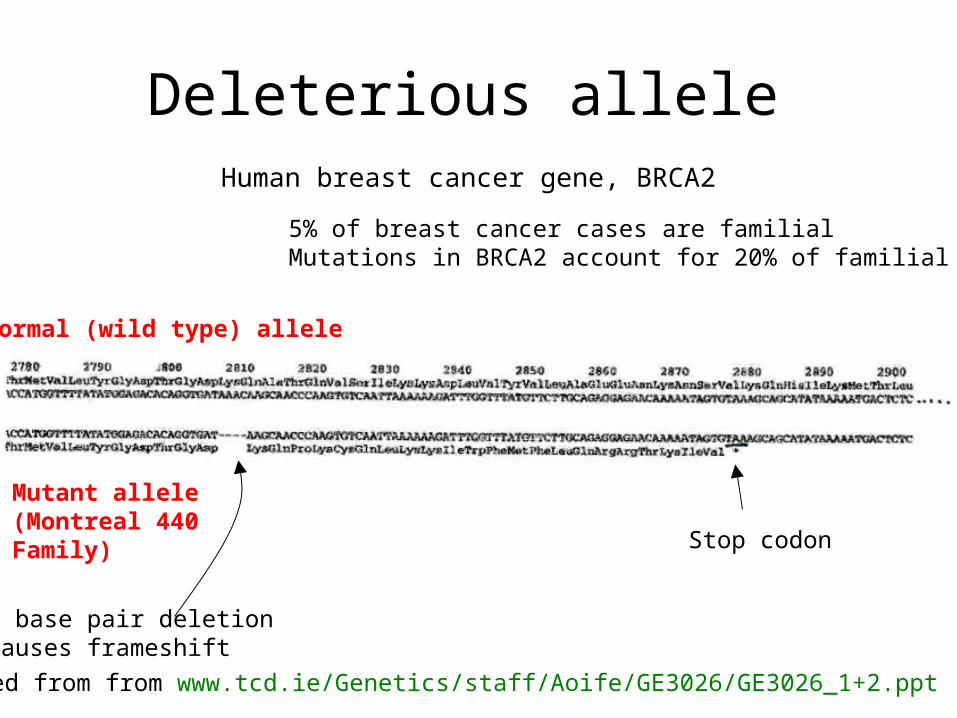
Deleterious alleleHuman breast cancer gene, BRCA2
Normal (wild type) allele
Mutant allele(Montreal 440Family)
4 base pair deletionCauses frameshift
Stop codon
5% of breast cancer cases are familialMutations in BRCA2 account for 20% of familial cases
Modified from from www.tcd.ie/Genetics/staff/Aoife/GE3026/GE3026_1+2.ppt
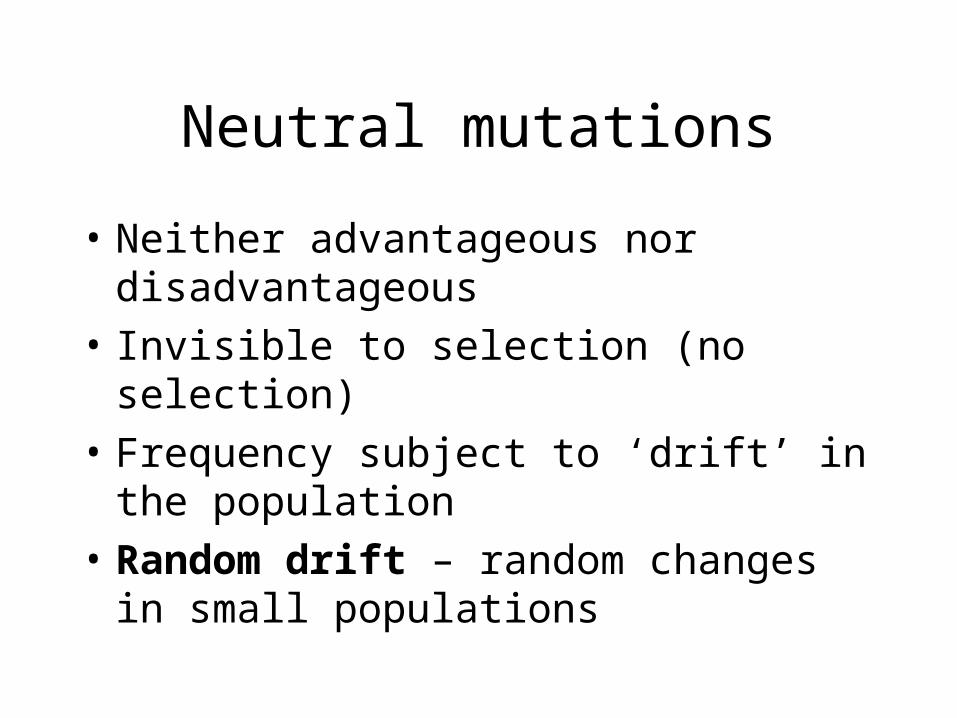
Neutral mutations
• Neither advantageous nor disadvantageous
• Invisible to selection (no selection)
• Frequency subject to ‘drift’ in the population
• Random drift – random changes in small populations

Types of Mutation-Substitution
• Replacement of one nucleotide by another
• Synonymous (Doesn’t change amino acid)– Rate sometimes indicated by Ks
– Rate sometimes indicated by ds
• Non-Synonymous (Changes Amino Acid)– Rate sometimes indicated by Ka
– Rate sometimes indicated by dn
(this and the following 4 slides are from mentor.lscf.ucsb.edu/course/ spring/eemb102/lecture/Lecture7.ppt)
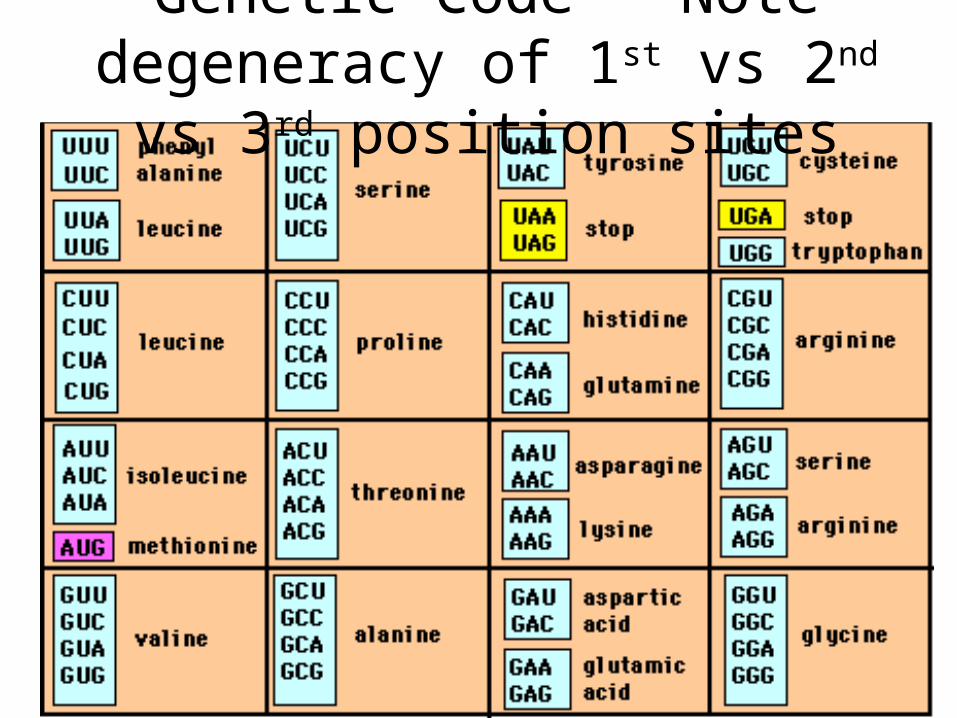
Genetic Code – Note degeneracy of 1st vs 2nd vs 3rd position sites

Genetic Code
Four-fold degenerate site – Any substitution is synonymous
From: mentor.lscf.ucsb.edu/course/spring/eemb102/lecture/Lecture7.ppt
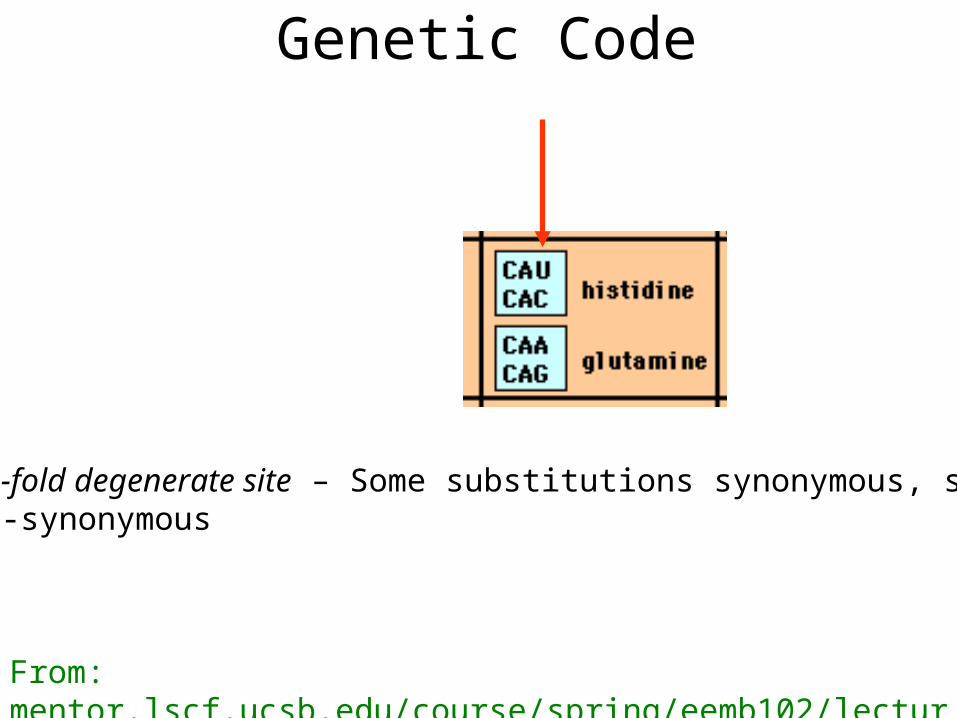
Genetic Code
Two-fold degenerate site – Some substitutions synonymous, some non-synonymous
From: mentor.lscf.ucsb.edu/course/spring/eemb102/lecture/Lecture7.ppt

Measuring Selection on Genes
• Null hypothesis = neutral evolution
• Under neutral evolution, synonymous changes should accumulate at a rate equal to mutation rate
• Under neutral evolution, amino acid substitutions should also accumulate at a rate equal to the mutation rate
From: mentor.lscf.ucsb.edu/course/spring/eemb102/lecture/Lecture7.ppt
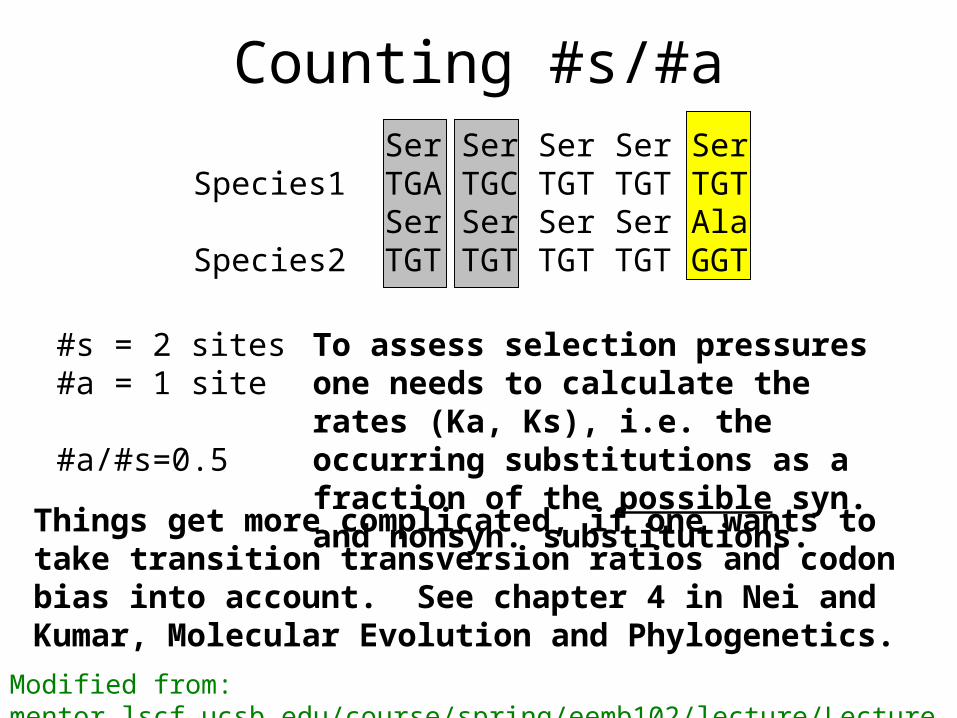
Counting #s/#a Ser Ser Ser Ser Ser Species1 TGA TGC TGT TGT TGT
Ser Ser Ser Ser Ala Species2 TGT TGT TGT TGT GGT
#s = 2 sites #a = 1 site
#a/#s=0.5
Modified from: mentor.lscf.ucsb.edu/course/spring/eemb102/lecture/Lecture7.ppt
To assess selection pressures one needs to calculate the rates (Ka, Ks), i.e. the occurring substitutions as a fraction of the possible syn. and nonsyn. substitutions.
Things get more complicated, if one wants to take transition transversion ratios and codon bias into account. See chapter 4 in Nei and Kumar, Molecular Evolution and Phylogenetics.

reading assignment
Next week we will use the PAML software In preparation please read the documentation pages 38-43.
dambeTwo programs worked well for me to align nucleotide sequences based on the amino acid alignment,
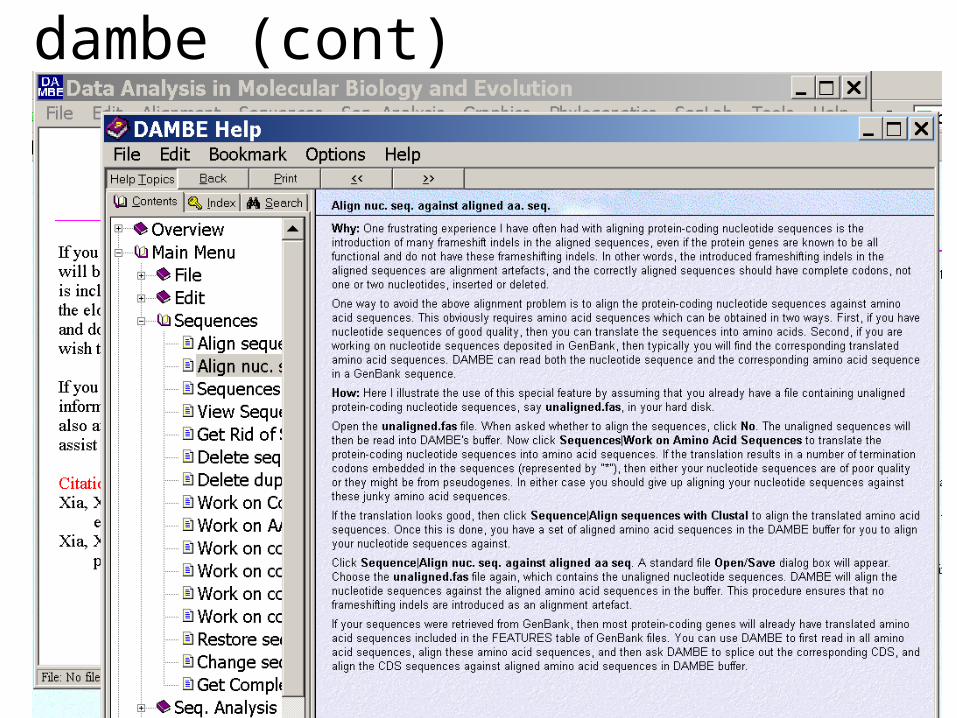
One is DAMBE (only for windows). This is a handy program for a lot of things, including reading a lot of different formats, calculating phylogenies, it even runs codeml (from PAML) for you.
The procedure is not straight forward, but is well described on the help pages. After installing DAMBE go to HELP -> general HELP -> sequences -> align nucleotide sequences based on …->
If you follow the instructions to the letter, it works fine.
DAMBE also calculates Ka and Ks distances from codon based aligned sequences.
dambe (cont)
aa based nucleotide alignments (cont) An alternative is the tranalign program that is part of the emboss package. On bbcxsrv1 you can invoke the program by typing tranalign.
Instructions and program description are here .
If you want to use your own dataset in the lab on Monday, generate a codon based alignment with either dambe or tranalign and save it as a nexus file and as a phylip formated multiple sequence file (using either clustalw, PAUP (export or tonexus), dambe, or readseq on the web)

PAML (codeml) the basic model

sites versus branchesYou can determine omega for the whole dataset; however, usually not all sites in a sequence are under selection all the time.
PAML (and other programs) allow to either determine omega for each site over the whole tree, ,or determine omega for each branch for the whole sequence, .
It would be great to do both, i.e., conclude codon 176 in the vacuolar ATPases was under positive selection during the evolution of modern humans – alas, a single site does not provide any statistics ….

Sites model(s) work great have been shown to work great in few instances. The most celebrated case is the influenza virus HA gene.
A talk by Walter Fitch (slides and sound) on the evolution ofthis molecule is here .This article by Yang et al, 2000 gives more background on ml aproaches to measure omega. The dataset used by Yang et al is here: flu_data.paup .
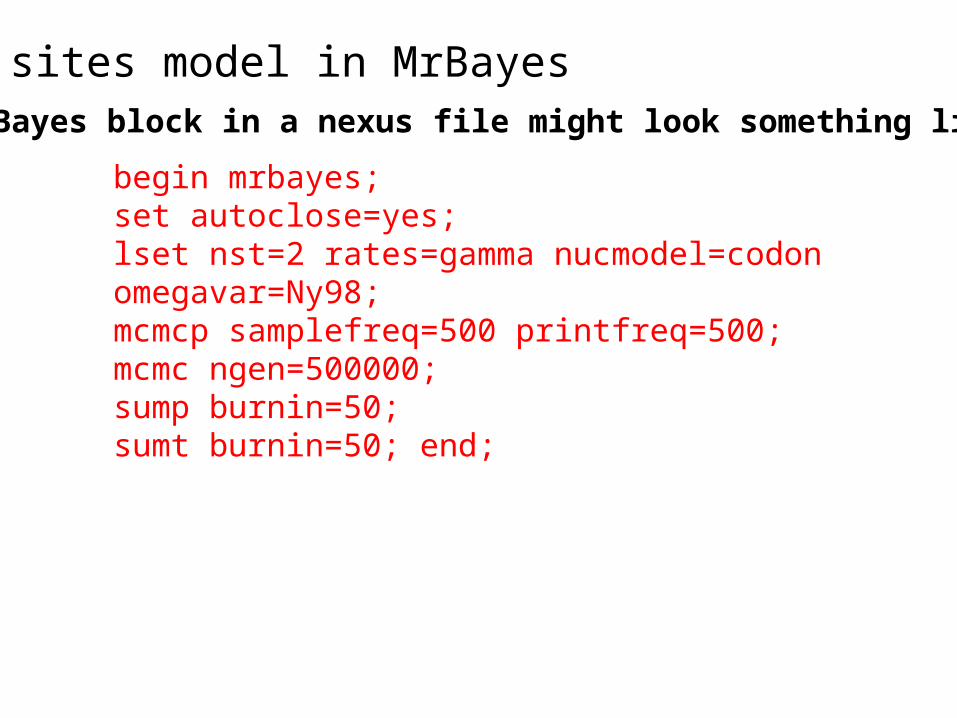
sites model in MrBayes
begin mrbayes; set autoclose=yes; lset nst=2 rates=gamma nucmodel=codon omegavar=Ny98; mcmcp samplefreq=500 printfreq=500; mcmc ngen=500000; sump burnin=50; sumt burnin=50; end;
The MrBayes block in a nexus file might look something like this: