Embed Size (px)
Citation preview
Maximizing Employee Health and Productivity
Disease Management Colloquium
May 11, 2006
Ron Loeppke, MD, MPH
Maximizing Employee Maximizing Employee Health and ProductivityHealth and Productivity
Disease Management ColloquiumDisease Management Colloquium
May 11, 2006May 11, 2006
Ron Loeppke, MD, MPHRon Loeppke, MD, MPH

Integrated Integrated Health and Productivity Health and Productivity
EnhancementEnhancement
•• Converging Trends in the Market (When)Converging Trends in the Market (When)•• Clinical/Financial Business Case (Why)Clinical/Financial Business Case (Why)•• Integrated H&P Solutions (What)Integrated H&P Solutions (What)•• Employer Case Studies (How)Employer Case Studies (How)
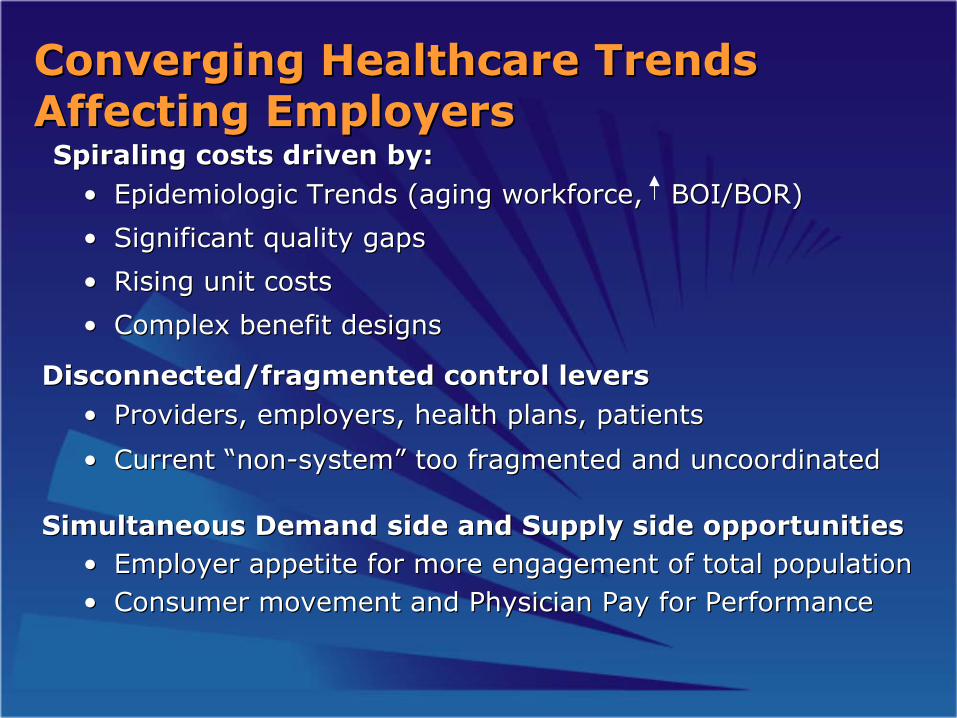
Converging Healthcare Trends Converging Healthcare Trends Affecting EmployersAffecting Employers
Spiraling costs driven by:Spiraling costs driven by:
•• Epidemiologic Trends (aging workforce, BOI/BOR)Epidemiologic Trends (aging workforce, BOI/BOR)
•• Significant quality gapsSignificant quality gaps
•• Rising unit costs Rising unit costs
•• Complex benefit designsComplex benefit designs
Disconnected/fragmented control leversDisconnected/fragmented control levers
•• Providers, employers, health plans, patientsProviders, employers, health plans, patients
•• Current Current ““nonnon--systemsystem”” too fragmented and uncoordinatedtoo fragmented and uncoordinated
Simultaneous Demand side and Supply side opportunitiesSimultaneous Demand side and Supply side opportunities•• Employer appetite for more engagement of total populationEmployer appetite for more engagement of total population•• Consumer movement and Physician Pay for PerformanceConsumer movement and Physician Pay for Performance
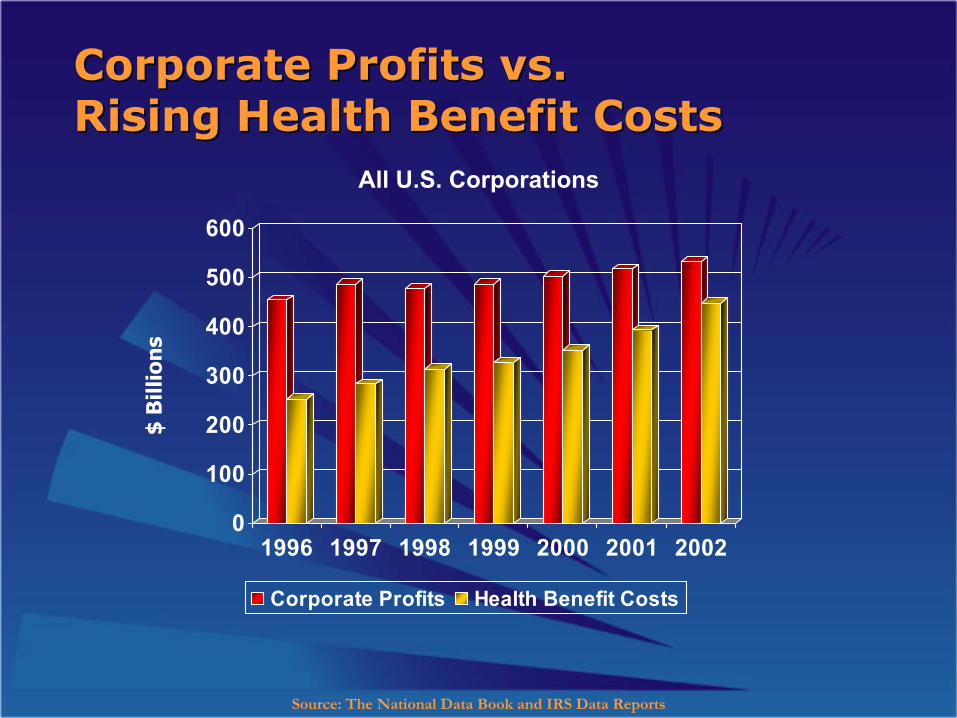
Corporate Profits vs. Corporate Profits vs. Rising Health Benefit CostsRising Health Benefit Costs
0
100
200
300
400
500
600
1996 1997 1998 1999 2000 2001 2002
Corporate Profits Health Benefit Costs
$ B
illio
ns
Source: The National Data Book and IRS Data Reports
All U.S. Corporations

The Real Problem: The Real Problem: The Full Cost of Employee IllnessThe Full Cost of Employee Illness
Medical & Pharmacy Costs
*$6,020 PEPY
Health-related Productivity Costs
$12,000 PEPY
33%
66%
Workers’ Comp
Medical CostsSalary Continuation
Personal Health CostsMedical CarePharmacyHospitalizationBehavioral Health
Productivity Costs
Presenteeism
Turnover
Replacement Training
Temporary Staffing
Administrative Costs
Variable Product Quality
Employee DissatisfactionCustomer Dissatisfaction
Overtime
Off-Site Travel for Care
STDLTD
Sources: Loeppke, et.al., JOEM, 2003; 45:349-359 and Brady, et.al., JOEM, 1997; 39:224-231
Total PEPY= $18,020
*2003 PEPY Avg.
Absenteeism
Health and Human CapitalHealth and Human Capital
““Just as we have a corporate priority on Just as we have a corporate priority on enhancing our financial capital and economic enhancing our financial capital and economic
assets of our company, we must have a assets of our company, we must have a corporate priority on enhancing the human corporate priority on enhancing the human capital and health assets of our company.capital and health assets of our company.””
““The health of our workforce is inextricably The health of our workforce is inextricably linked to the productivity of our workforce linked to the productivity of our workforce
and therefore the health of our bottom line.and therefore the health of our bottom line.””
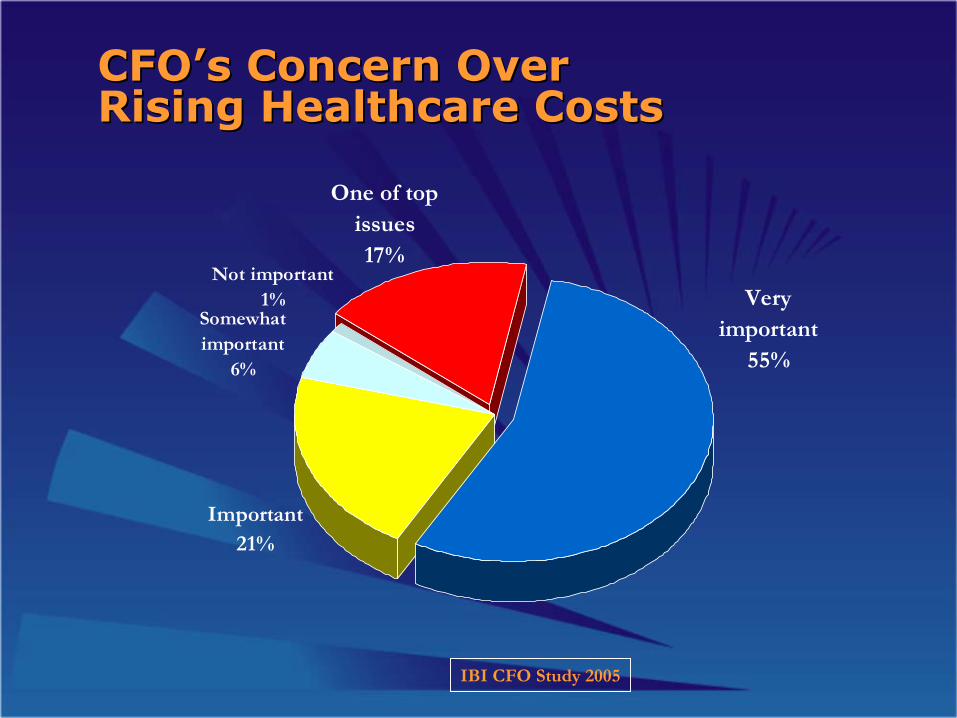
CFOCFO’’s Concern Over s Concern Over Rising Healthcare CostsRising Healthcare Costs
Not important1%
Somewhat important
6%
Important21%
One of top issues17%
Very important
55%
IBI CFO Study 2005
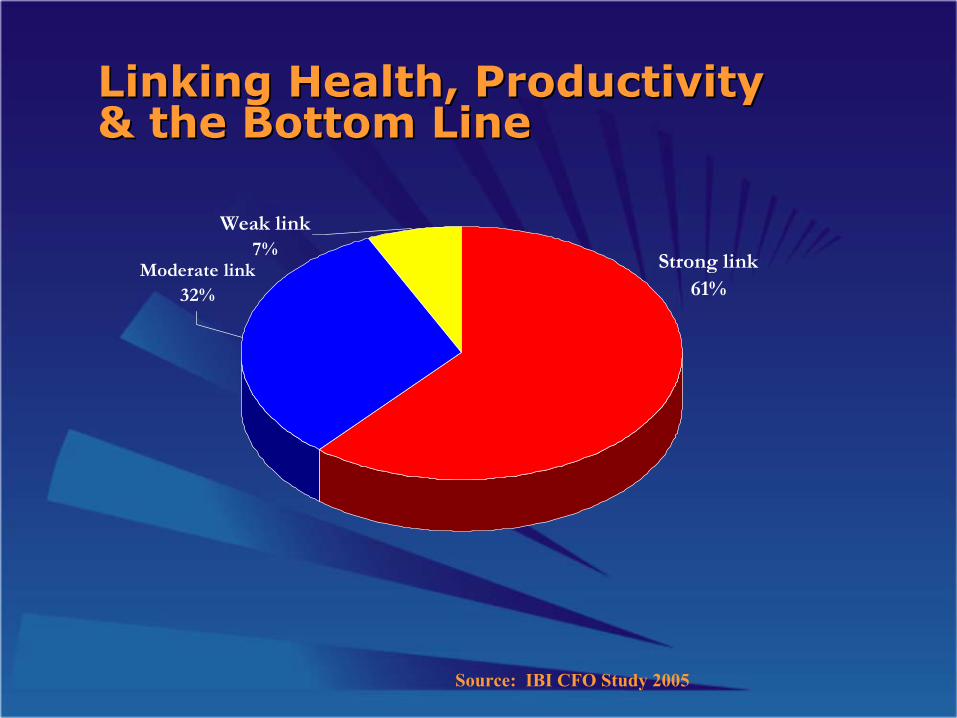
Linking Health, Productivity Linking Health, Productivity & the Bottom Line& the Bottom Line
Moderate link32%
Weak link7%
Strong link61%
Source: IBI CFO Study 2005
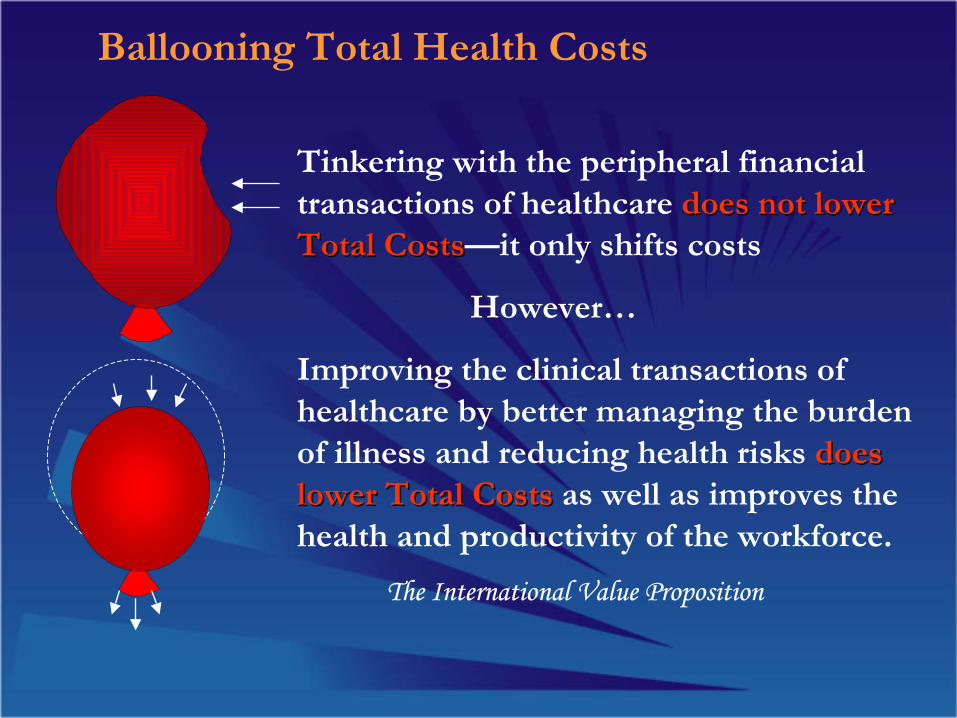
Tinkering with the peripheral financial transactions of healthcare does notdoes not lower lower TotalTotal CostsCosts—it only shifts costs
However…
Improving the clinical transactions of healthcare by better managing the burden of illness and reducing health risks does does lower Total Costslower Total Costs as well as improves the health and productivity of the workforce.
The International Value Proposition
Ballooning Total Health Costs
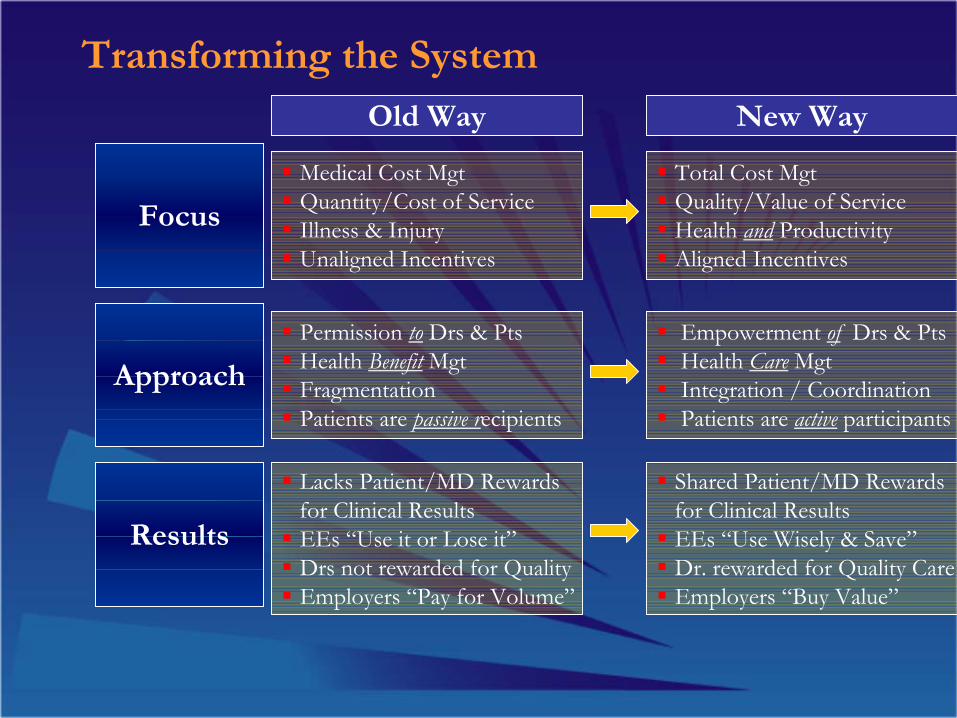
Permission to Drs & PtsHealth Benefit MgtFragmentationPatients are passive recipients
Lacks Patient/MD Rewards for Clinical ResultsEEs “Use it or Lose it” Drs not rewarded for QualityEmployers “Pay for Volume”
Medical Cost MgtQuantity/Cost of ServiceIllness & InjuryUnaligned Incentives
Empowerment of Drs & PtsHealth Care MgtIntegration / CoordinationPatients are active participants
Shared Patient/MD Rewards for Clinical ResultsEEs “Use Wisely & Save”Dr. rewarded for Quality CareEmployers “Buy Value”
Total Cost MgtQuality/Value of ServiceHealth and ProductivityAligned Incentives
Focus
Approach
Results
Old Way New Way
Transforming the System
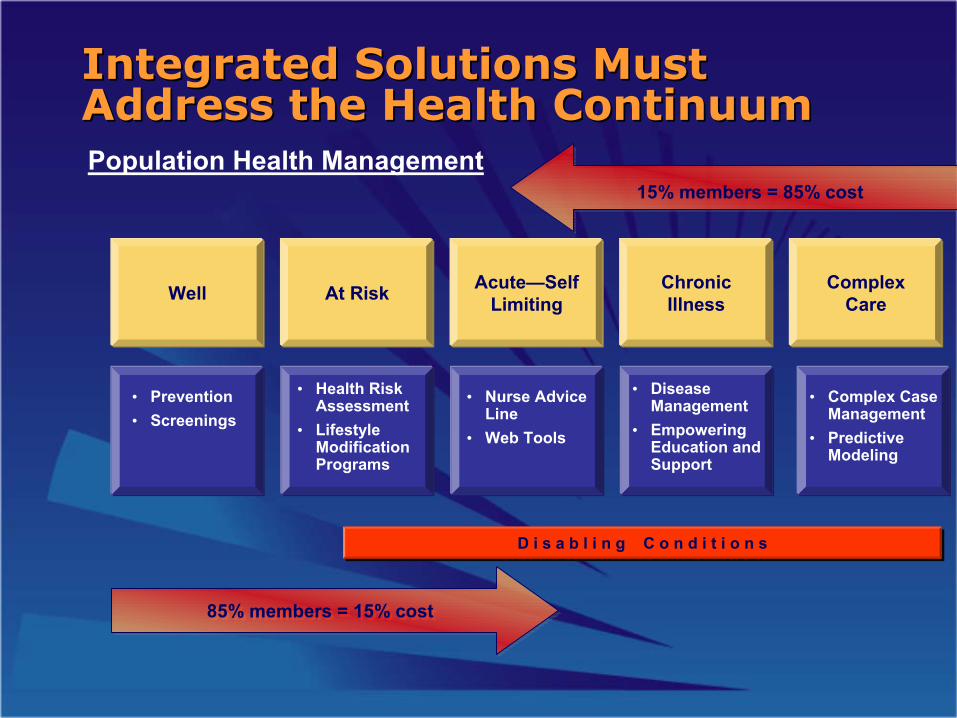
Integrated Solutions Must Integrated Solutions Must Address the Health ContinuumAddress the Health Continuum
Well
Population Health Management
D i s a b l i n g C o n d i t i o n sD i s a b l i n g C o n d i t i o n s
85% members = 15% cost85% members = 15% cost
At Risk Acute—Self Limiting
Chronic Illness
Complex Care
• Complex Case Management
• Predictive Modeling
• Nurse Advice Line
• Web Tools
• DiseaseManagement
• Empowering Education and Support
• Health Risk Assessment
• Lifestyle Modification Programs
• Prevention• Screenings
15% members = 85% cost
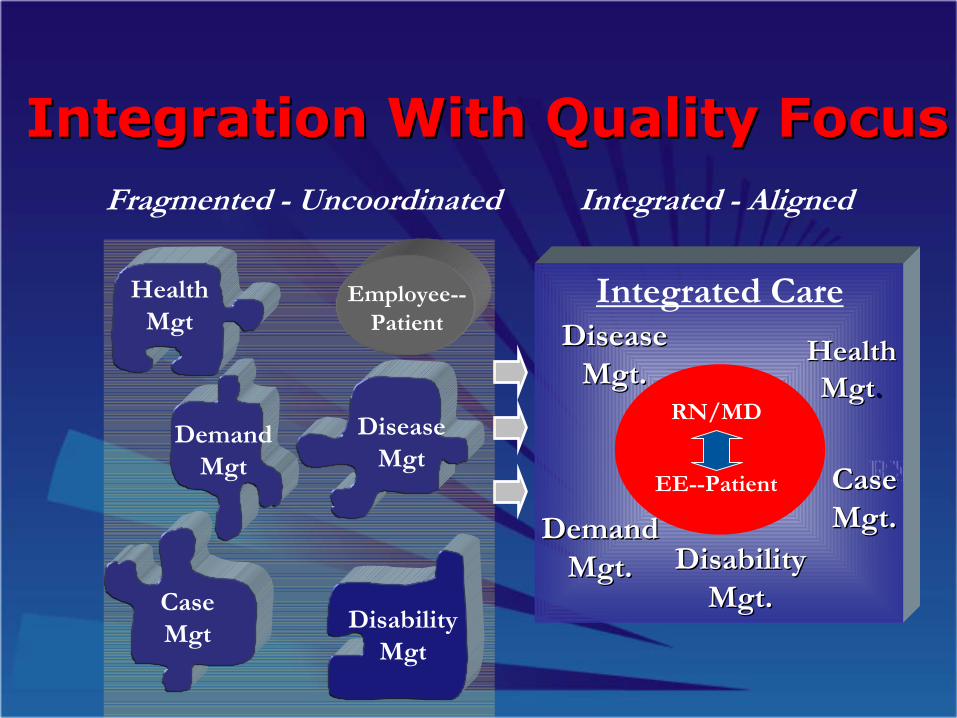
Fragmented - Uncoordinated
Health Mgt
Case Mgt Disability
Mgt
Disease Mgt
Demand Mgt
Employee--Patient
Integrated - Aligned
RN/MD
Patient
RXCase Case Mgt.Mgt.Demand Demand
Mgt.Mgt.
Disease Disease Mgt.Mgt.
Integrated Care
HealthHealthMgtMgt..
Disability Disability Mgt.Mgt.
Integration With Quality FocusIntegration With Quality Focus
RN/MD
EE--Patient
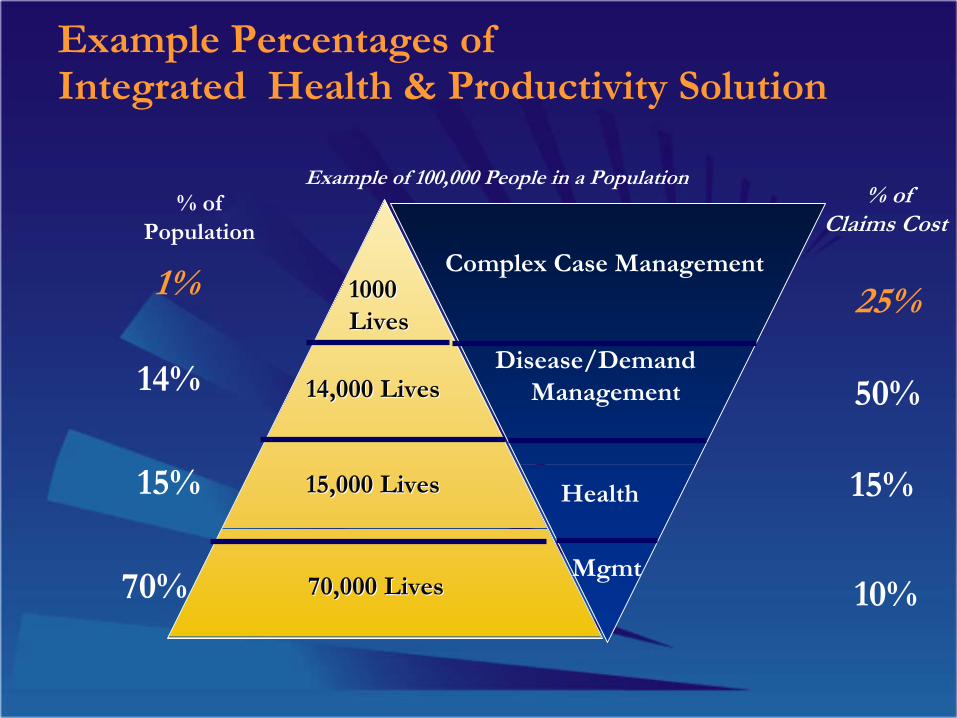
% ofPopulation
1%
15%
70%
14%
25%
15%
10%
50%
Example Percentages ofIntegrated Health & Productivity Solution
1000 1000 LivesLives
14,000 Lives14,000 Lives
15,000 Lives15,000 Lives
70,000 Lives70,000 Lives
Complex Case Management
Disease/Demand Management
Health
Mgmt
% of Claims Cost
Example of 100,000 People in a Population
Prevention Prevention
An An investmentinvestmentto be leveragedto be leveraged……
Rather than a Rather than a costcostto be justified.to be justified.
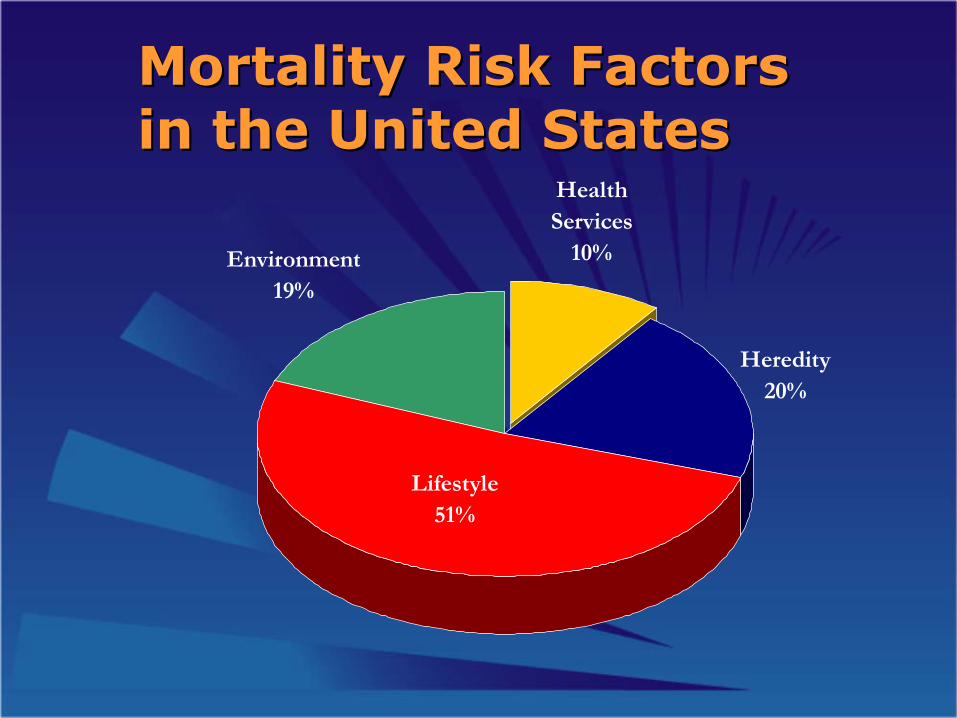
Environment19%
Heredity 20%
Lifestyle51%
Health Services
10%
Mortality Risk Factors Mortality Risk Factors in the United States in the United States
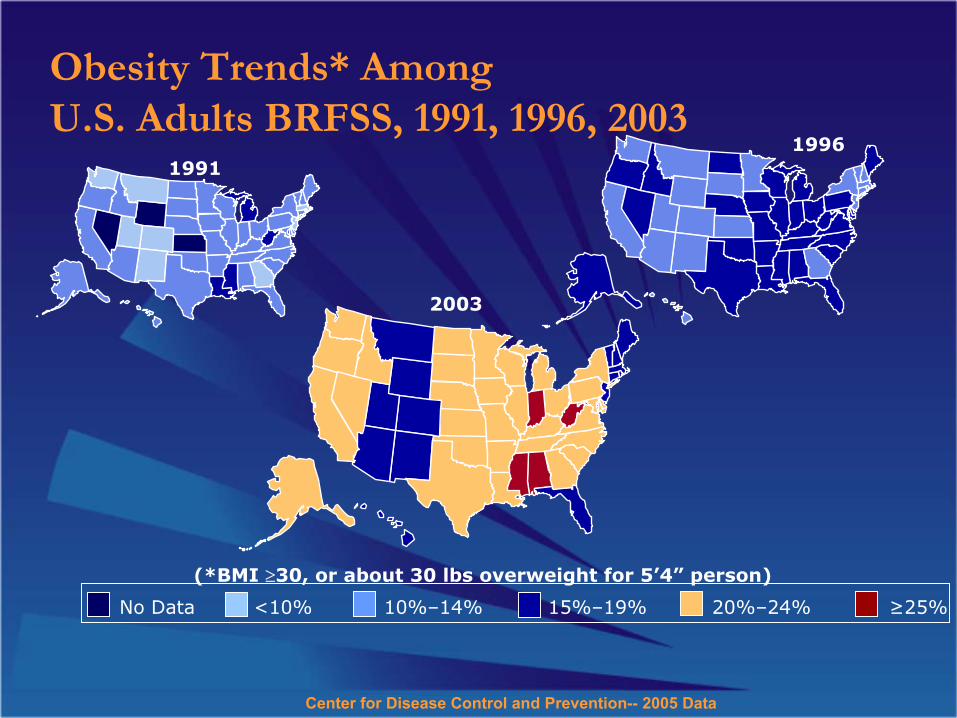
19961991
Obesity Trends* Among U.S. Adults BRFSS, 1991, 1996, 2003
(*BMI ≥30, or about 30 lbs overweight for 5’4” person)
2003
No Data <10% 10%–14% 15%–19% 20%–24% ≥25%
Center for Disease Control and Prevention-- 2005 Data
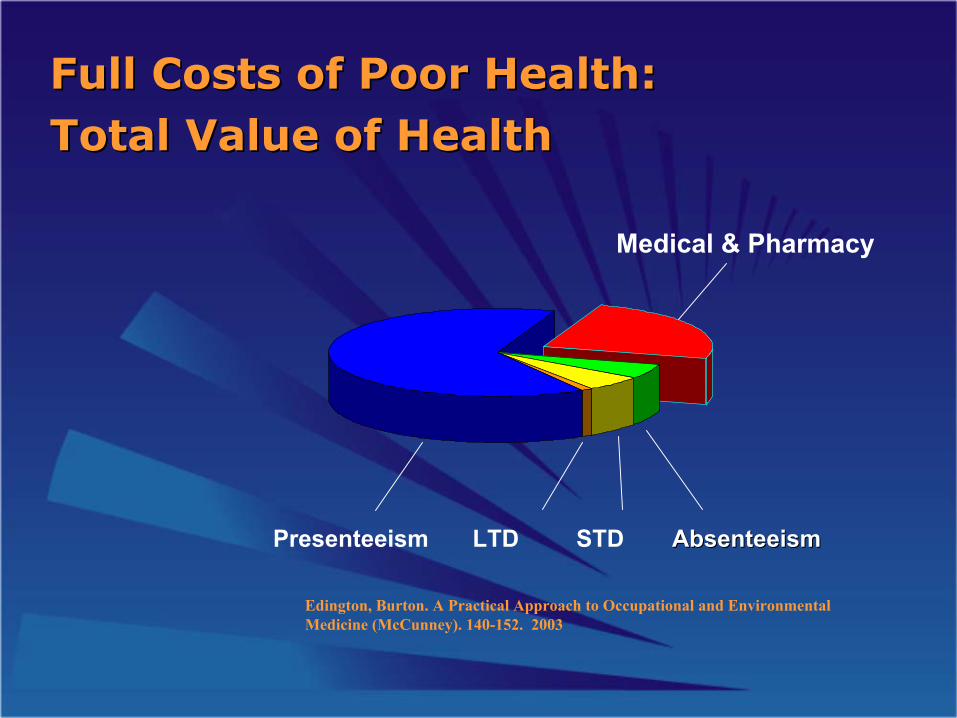
Full Costs of Poor Health: Full Costs of Poor Health: Total Value of HealthTotal Value of Health
Presenteeism AbsenteeismAbsenteeismSTDLTD
Medical & Pharmacy
Edington, Burton. A Practical Approach to Occupational and Environmental Medicine (McCunney). 140-152. 2003
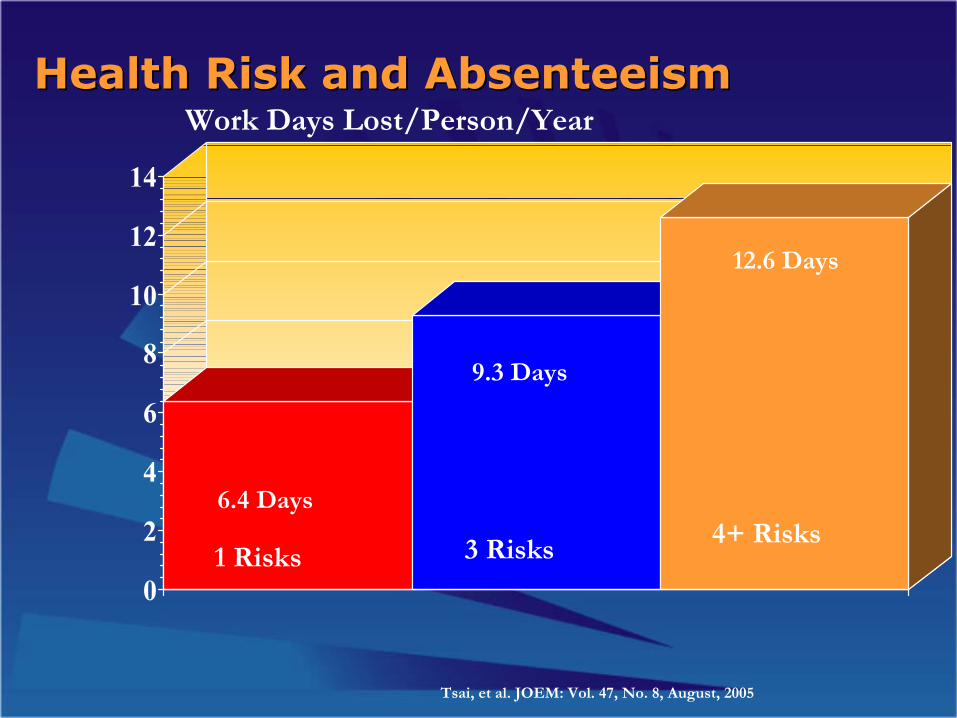
Health Risk and AbsenteeismHealth Risk and AbsenteeismWork Days Lost/Person/Year
0
2
4
6
8
10
12
14
1 Risks 3 Risks 4+ Risks6.4 Days
9.3 Days
12.6 Days
Tsai, et al. JOEM: Vol. 47, No. 8, August, 2005
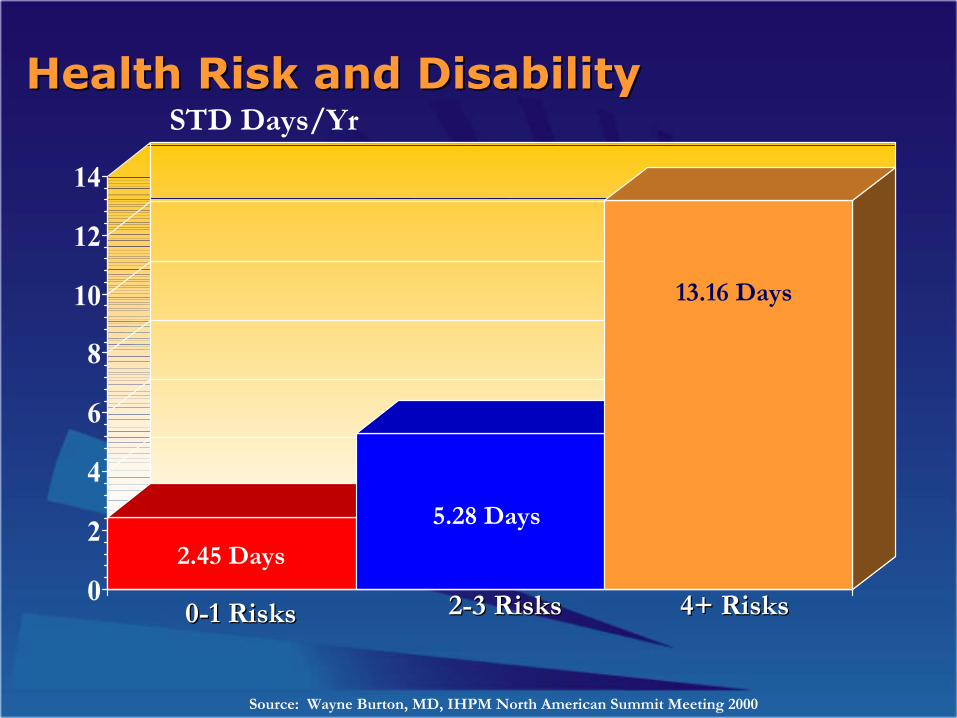
Health Risk and DisabilityHealth Risk and DisabilitySTD Days/Yr
0
2
4
6
8
10
12
14
00--1 Risks1 Risks 22--3 Risks3 Risks 4+ Risks4+ Risks
2.45 Days
5.28 Days
13.16 Days
Source: Wayne Burton, MD, IHPM North American Summit Meeting 2000
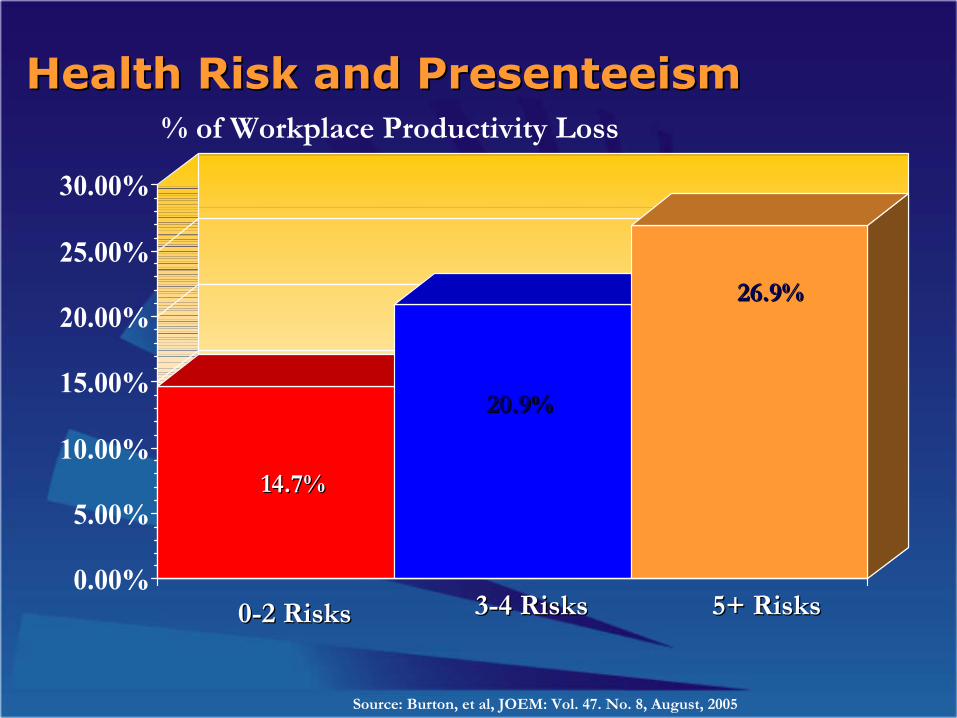
Health Risk and PresenteeismHealth Risk and Presenteeism% of Workplace Productivity Loss
0.00%
5.00%
10.00%
15.00%
20.00%
25.00%
30.00%
00--2 Risks2 Risks 33--4 Risks4 Risks 5+ Risks5+ Risks
14.7%14.7%
20.9%20.9%
26.9%26.9%
Source: Burton, et al, JOEM: Vol. 47. No. 8, August, 2005
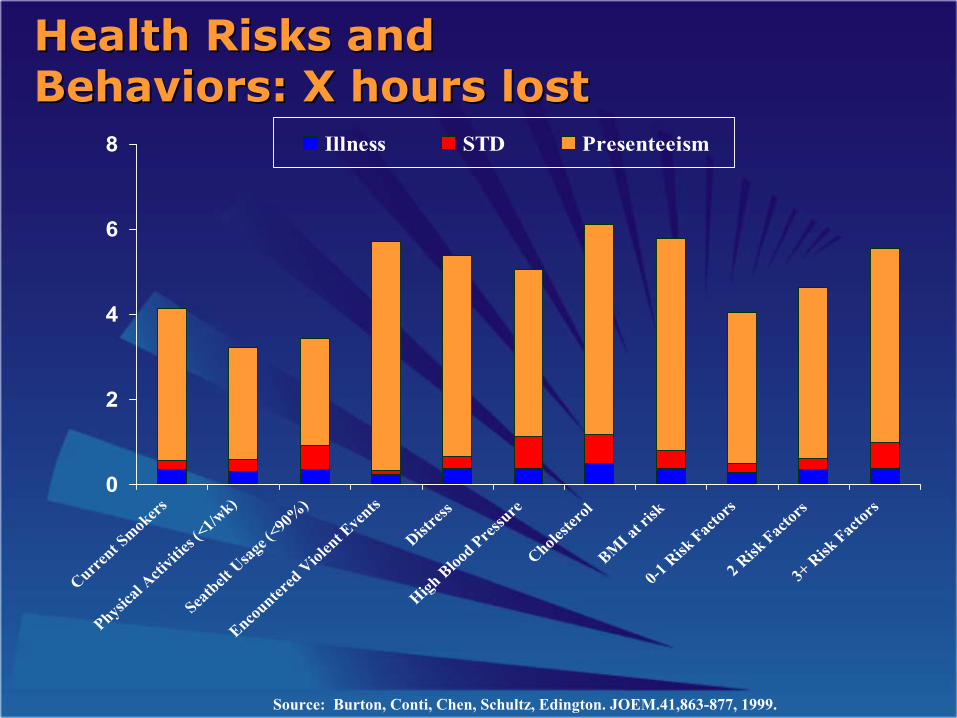
0
2
4
6
8
Current S
mokers
Physical
Acti
vities
(<1/w
k)
Seatbelt
Usag
e (<90
%)
Encounter
ed V
iolen
t Even
ts
Distres
s
High Bloo
d Pressure
Choleste
rolBMI a
t risk
0-1 R
isk Fact
ors2 R
isk Fact
ors3+
Risk
Factors
Illness STD Presenteeism
Source: Burton, Conti, Chen, Schultz, Edington. JOEM.41,863-877, 1999.
Health Risks and Health Risks and Behaviors: X hours lostBehaviors: X hours lost
0
2
4
6
8
10
12
14
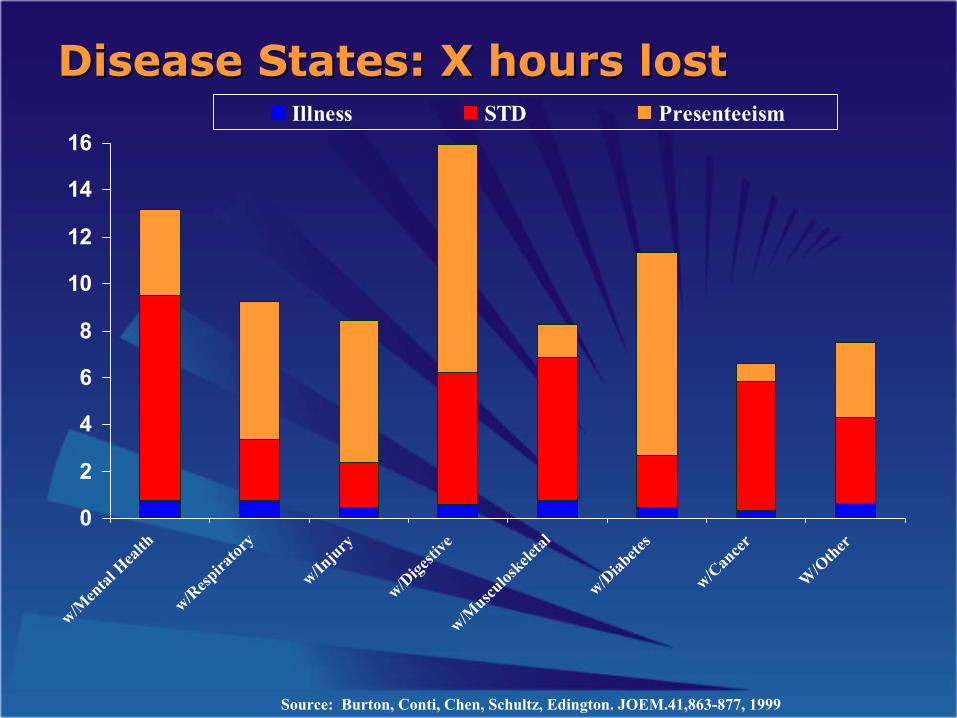
16
w/Men
tal H
ealth
w/Resp
irator
y
w/Injury
w/Dige
stive
w/Muscu
loskele
tal
w/Diab
etes
w/Can
cer
W/O
ther
Illness STD Presenteeism
Source: Burton, Conti, Chen, Schultz, Edington. JOEM.41,863-877, 1999
Disease States: X hours lostDisease States: X hours lost
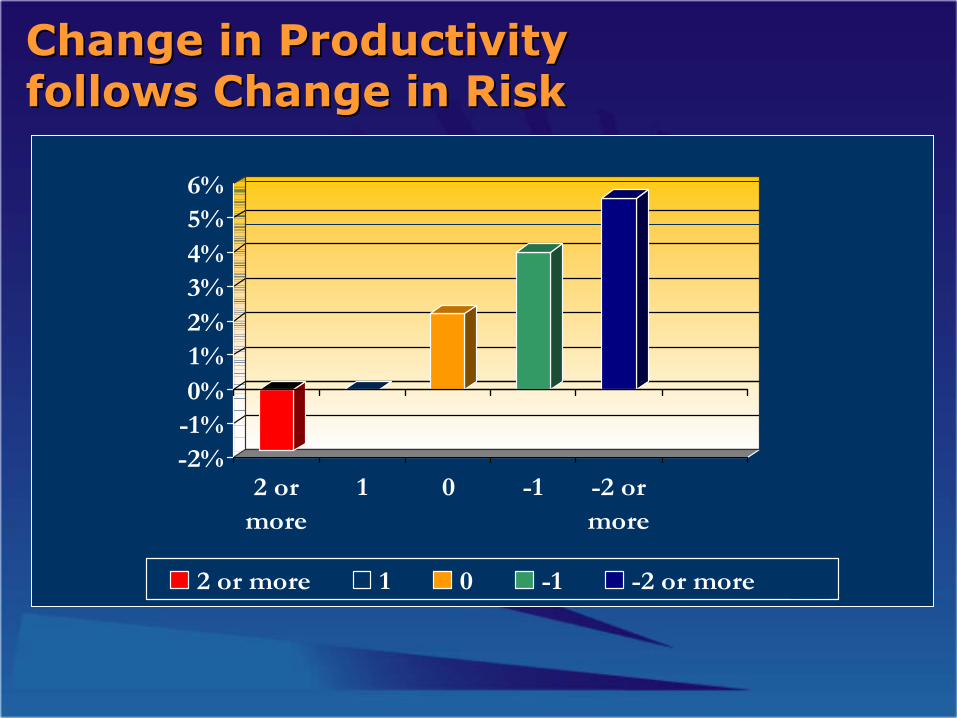
Change in Productivity Change in Productivity follows Change in Riskfollows Change in Risk
-2%-1%0%1%2%3%4%5%6%
2 ormore
1 0 -1 -2 ormore
2 or more 1 0 -1 -2 or more

Change in Costs Change in Costs follow Change in Risksfollow Change in Risks
-$600
-$400
-$200
$0
$200
$400
$600
-3 -2 1 0 1 2 3Cos
t re
du
ced
Cos
t in
crea
sed
Risks Reduced Risks Increased
Source: Updated from Edington, AJHP. 15(5):341-349, 2001.
Overall: Cost per risk reduced: $215; Cost per risk avoided: $304
Actives: Cost per risk reduced: $231; Cost per risk avoided: $320
Retirees<65: Cost per risk reduced: $192; Cost per risk avoided: $621
Retirees>65: Cost per risk reduced: $214; Cost per risk avoided: $264
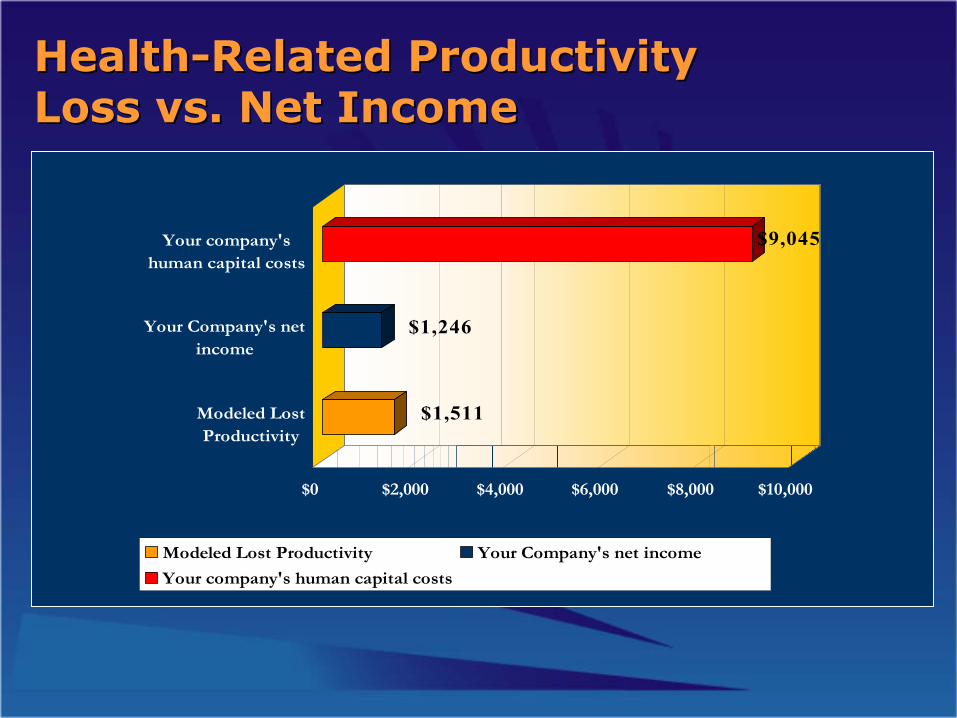
HealthHealth--Related Productivity Related Productivity Loss vs. Net IncomeLoss vs. Net Income
$1,511
$1,246
$9,045
$0 $2,000 $4,000 $6,000 $8,000 $10,000
Modeled LostProductivity
Your Company's netincome
Your company'shuman capital costs
Modeled Lost Productivity Your Company's net income
Your company's human capital costs
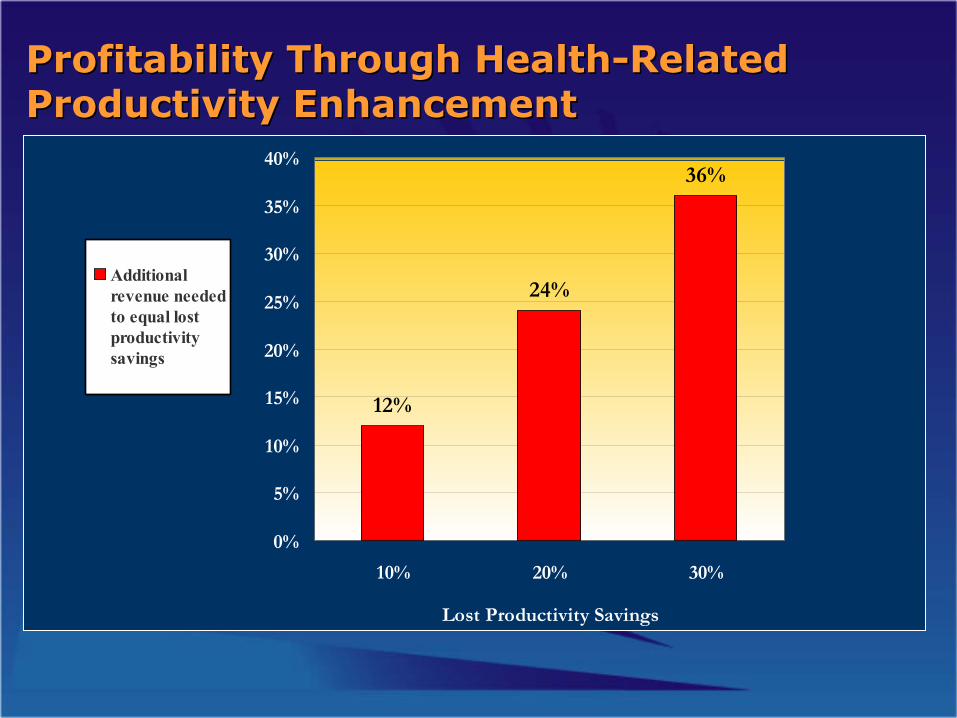
Profitability Through HealthProfitability Through Health--Related Related Productivity EnhancementProductivity Enhancement
12%
24%
36%
0%
5%
10%
15%
20%
25%
30%
35%
40%
10% 20% 30%
Lost Productivity Savings
Additionalrevenue neededto equal lostproductivitysavings

EmployerEmployerCase StudyCase Study
Integrated Integrated Health & Productivity Health & Productivity
EnhancementEnhancement

Who Is Incurring the Medical Costs?Who Is Incurring the Medical Costs?
% ofPopulation
% ofClaims $
$12,001,184 Medical/Rx Costs$12,001,184 Medical/Rx CostsSite Site
$2,921,075$2,921,0751% 24%40 Members40 Members
$ 9,131,472
30% 89%
606 Members
100% 100%4039 Mbrs
15% 75%
$ 10,767,963
1212 Members
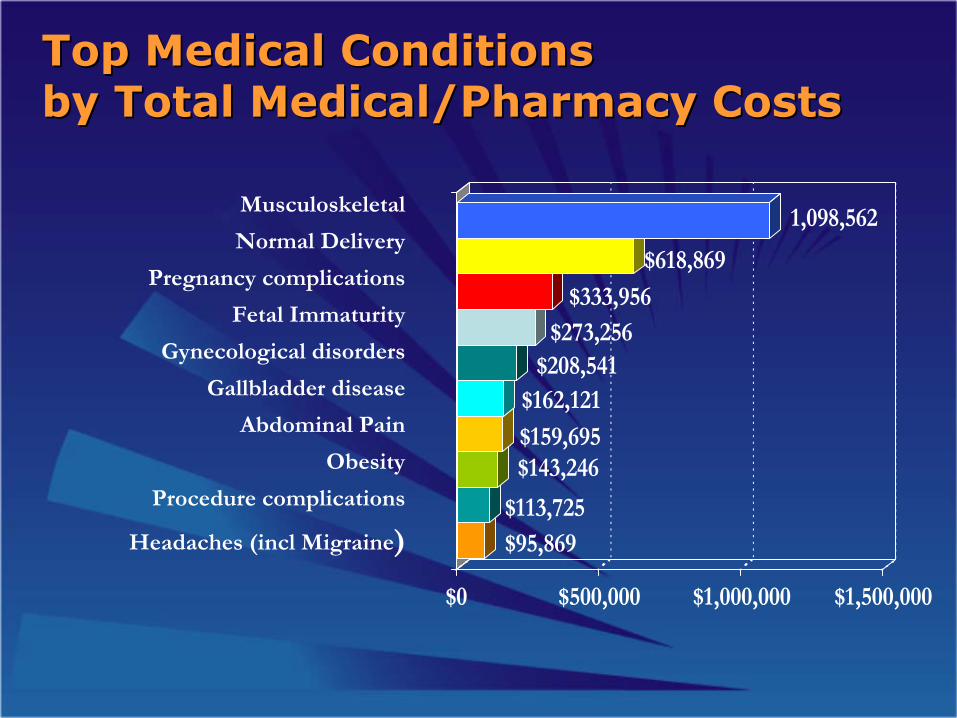
Top Medical Conditions Top Medical Conditions by Total Medical/Pharmacy Costsby Total Medical/Pharmacy Costs
$95,869$113,725
$143,246$159,695
$162,121$208,541
$273,256$333,956
$618,869
1,098,562
$0 $500,000 $1,000,000 $1,500,000
Musculoskeletal
Normal Delivery
Pregnancy complications
Fetal Immaturity
Gynecological disorders
Gallbladder disease
Abdominal Pain
Obesity
Procedure complications
Headaches (incl Migraine)
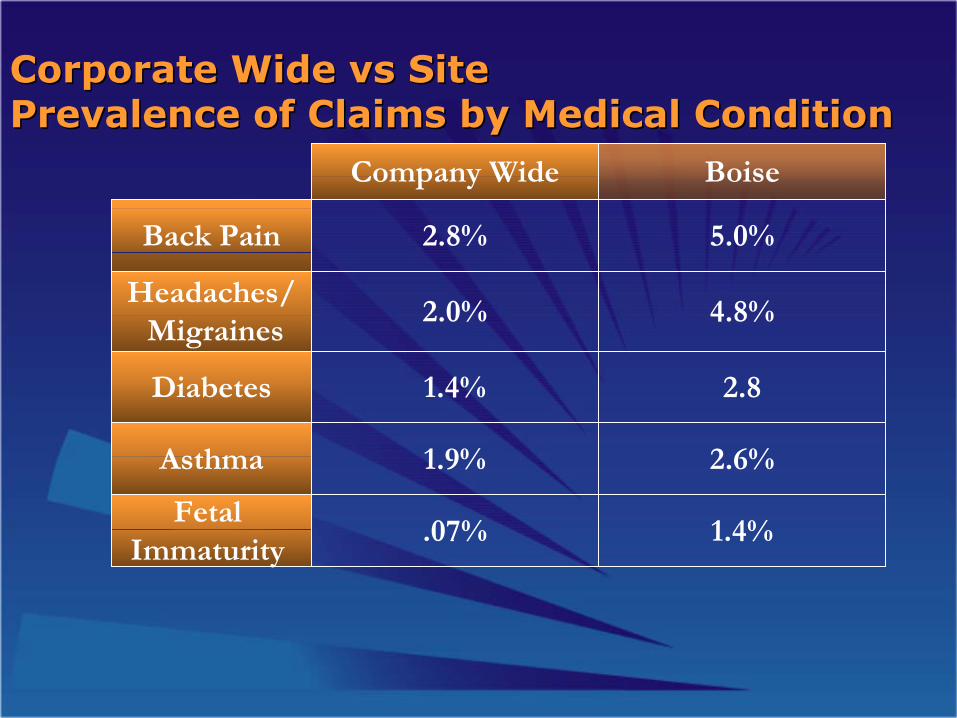
Corporate Wide Corporate Wide vsvs SiteSitePrevalence of Claims by Medical ConditionPrevalence of Claims by Medical Condition
2.8% 5.0%
2.0% 4.8%
1.4% 2.8
1.9% 2.6%
.07% 1.4%
Company Wide Boise
Back Pain
Headaches/Migraines
Diabetes
Asthma
Fetal Immaturity
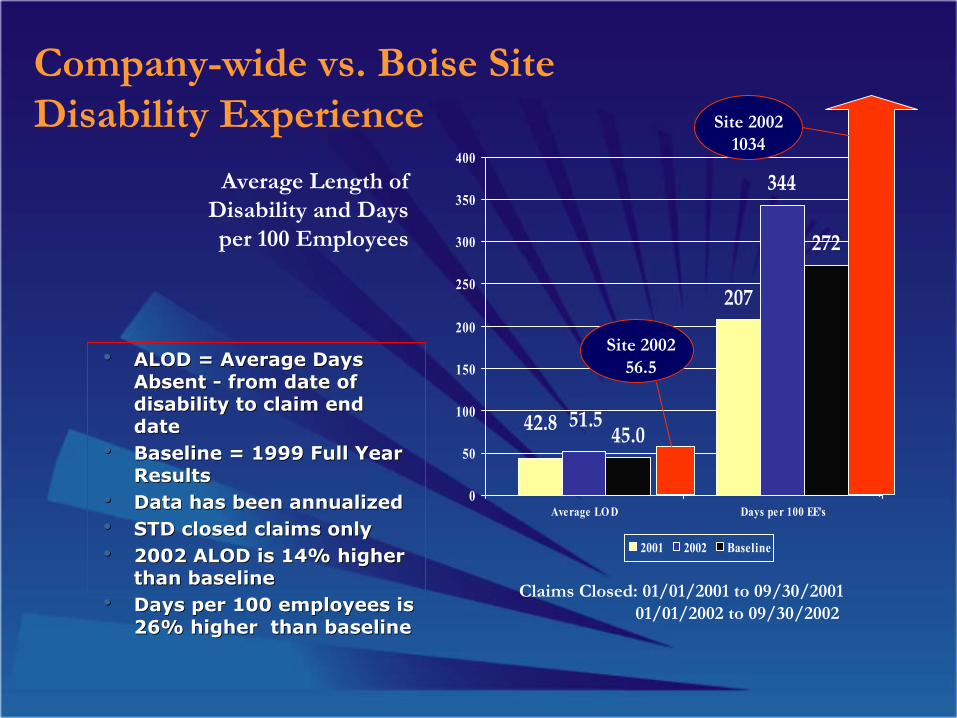
Company-wide vs. Boise Site Disability Experience
hh ALOD = Average Days ALOD = Average Days Absent Absent -- from date of from date of disability to claim end disability to claim end datedate
hh Baseline = 1999 Full Year Baseline = 1999 Full Year Results Results
hh Data has been annualizedData has been annualizedhh STD closed claims onlySTD closed claims onlyhh 2002 ALOD is 14% higher 2002 ALOD is 14% higher
than baselinethan baselinehh Days per 100 employees is Days per 100 employees is
26% higher than baseline26% higher than baseline
Average Length of Disability and Days per 100 Employees
207
344
45.0
272
42.8 51.5
0
50
100
150
200
250
300
350
400
Average LO D Days per 100 EE's
2001 2002 Baseline
Claims Closed: 01/01/2001 to 09/30/200101/01/2002 to 09/30/2002
Site 200256.5
Site 20021034
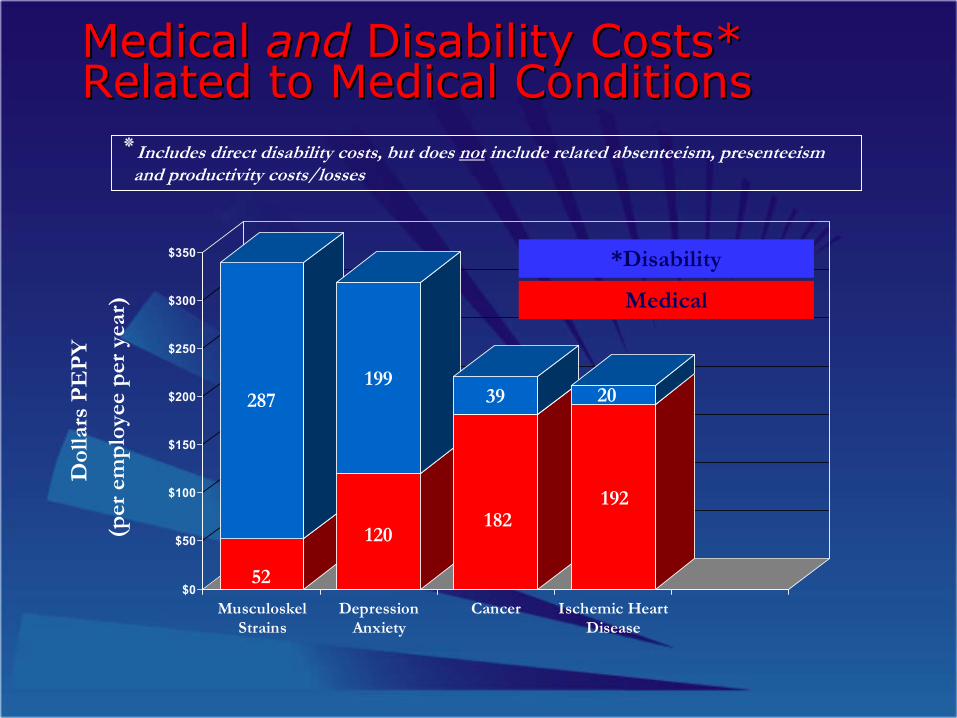
Medical Medical andand Disability Costs* Disability Costs* Related to Medical ConditionsRelated to Medical Conditions
52
287
120
199
182
39
192
20
$0
$50
$100
$150
$200
$250
$300
$350
MusculoskelStrains
DepressionAnxiety
Cancer Ischemic HeartDisease
Dol
lars
PE
PY
(per
em
plo
yee
per
yea
r) Medical
*Disability
Includes direct disability costs, but does not٭ include related absenteeism, presenteeism and productivity costs/losses
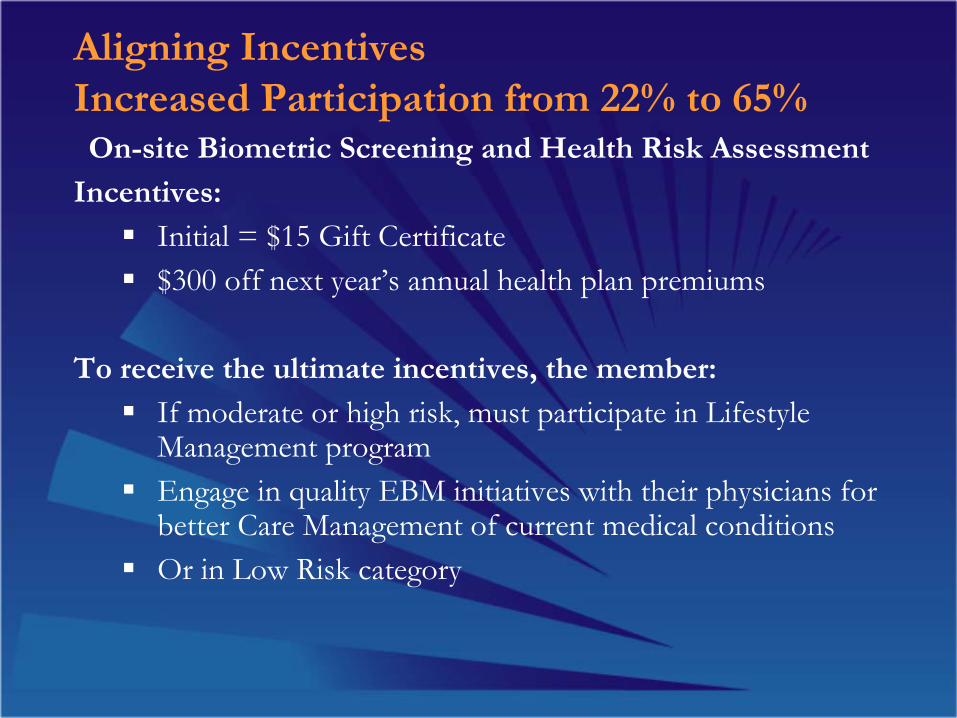
Aligning Incentives Increased Participation from 22% to 65%On-site Biometric Screening and Health Risk Assessment
Incentives:
Initial = $15 Gift Certificate$300 off next year’s annual health plan premiums
To receive the ultimate incentives, the member:
If moderate or high risk, must participate in Lifestyle Management programEngage in quality EBM initiatives with their physicians for better Care Management of current medical conditionsOr in Low Risk category
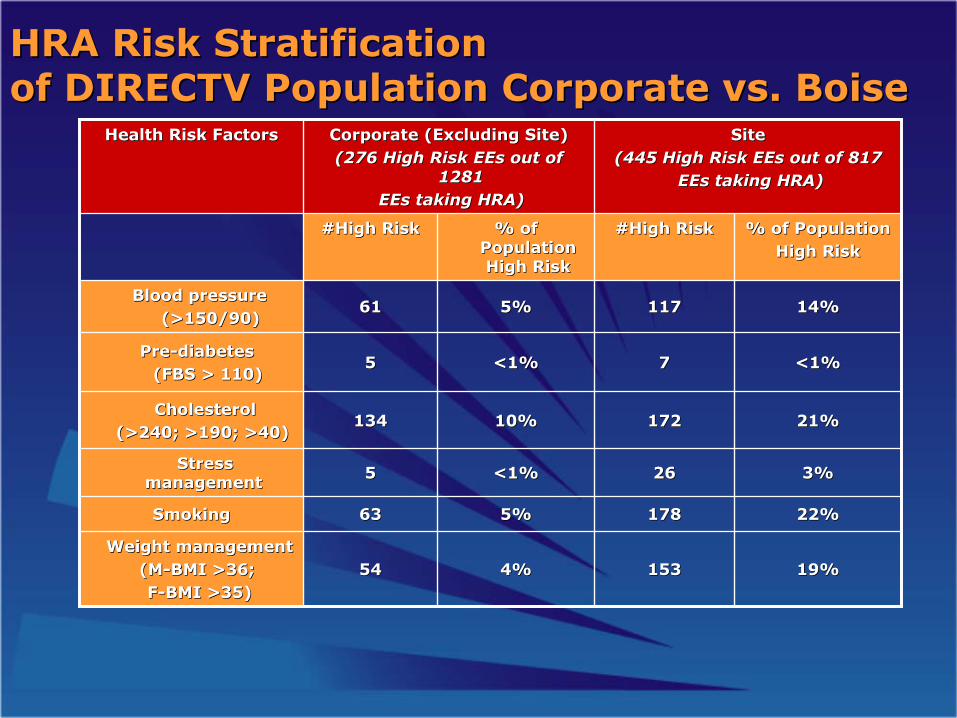
HRA Risk Stratification HRA Risk Stratification of DIRECTV Population Corporate vs. Boiseof DIRECTV Population Corporate vs. Boise
19%19%1531534%4%5454Weight managementWeight management
(M(M--BMI >36;BMI >36;FF--BMI >35)BMI >35)
22%22%1781785%5%6363SmokingSmoking
3%3%2626<1%<1%55Stress Stress managementmanagement
21%21%17217210%10%134134CholesterolCholesterol
(>240; >190; >40)(>240; >190; >40)
<1%<1%77<1%<1%55PrePre--diabetesdiabetes
(FBS > 110)(FBS > 110)
14%14%1171175%5%6161Blood pressureBlood pressure
(>150/90)(>150/90)
% of Population % of Population High RiskHigh Risk
#High Risk#High Risk% of % of Population Population High RiskHigh Risk
#High Risk#High Risk
SiteSite(445 High Risk EEs out of 817(445 High Risk EEs out of 817
EEs taking HRA)EEs taking HRA)
Corporate (Excluding Site)Corporate (Excluding Site)(276 High Risk EEs out of (276 High Risk EEs out of
12811281EEs taking HRA)EEs taking HRA)
Health Risk FactorsHealth Risk Factors
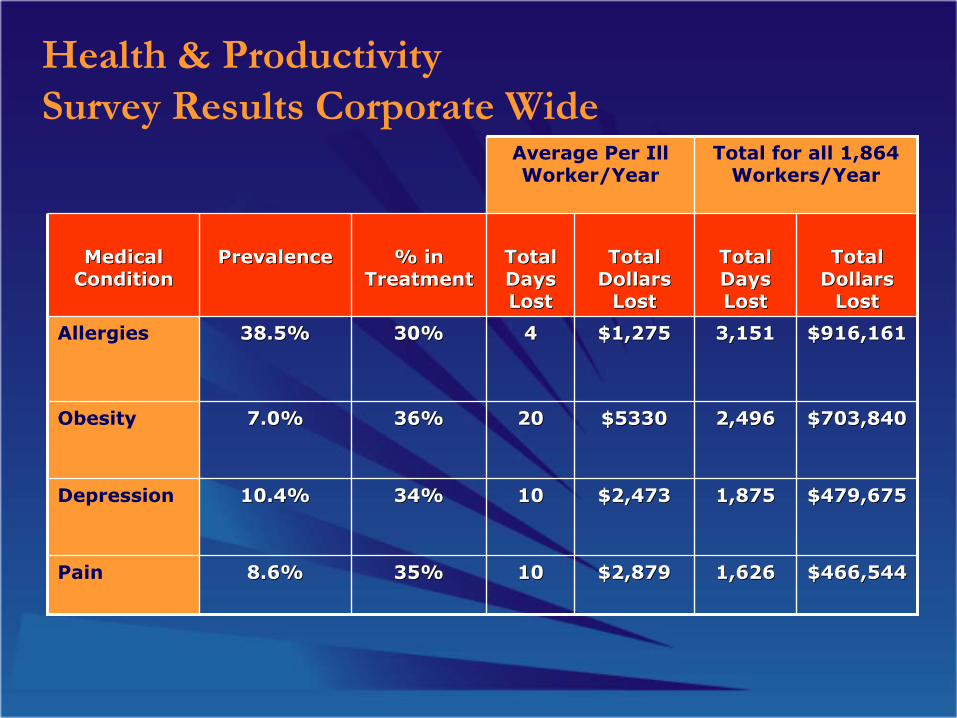
Health & Productivity Survey Results Corporate Wide
$466,544 $466,544 1,626 1,626 $2,879$2,879101035%35%8.6%8.6%Pain
$479,675$479,6751,8751,875$2,473$2,473101034%34%10.4%10.4%Depression
$703,840$703,8402,4962,496$5330$5330202036%36%7.0%7.0%Obesity
$916,161$916,1613,151 3,151 $1,275$1,2754430%30%38.5%38.5%Allergies
Total Total Dollars Dollars
Lost Lost
Total Total Days Days Lost Lost
Total Total Dollars Dollars
Lost Lost
Total Total Days Days Lost Lost
% in % in Treatment Treatment
PrevalencePrevalenceMedical Medical ConditionCondition
Total for all 1,864 Workers/Year
Average Per Ill Worker/Year

Health and Productivity HPQ SurveyHealth and Productivity HPQ Survey
Survey ResultsSurvey ResultsData crossData cross--matched with objective supervisor performance matched with objective supervisor performance data from workplacedata from workplaceResults showed:Results showed:
•• *HPQ presenteeism scale significantly predicts *HPQ presenteeism scale significantly predicts supervisor ratings of performancesupervisor ratings of performance
•• About 10% of workforce has complex coAbout 10% of workforce has complex co--morbidity morbidity issues driving significant productivity losses due to issues driving significant productivity losses due to presenteeismpresenteeism
•• Multiple conditions correlated to lower productivityMultiple conditions correlated to lower productivity
Source: Kessler, Hymel, Loeppke, etal. JOEM. Vol 46 (6). June, 2004.
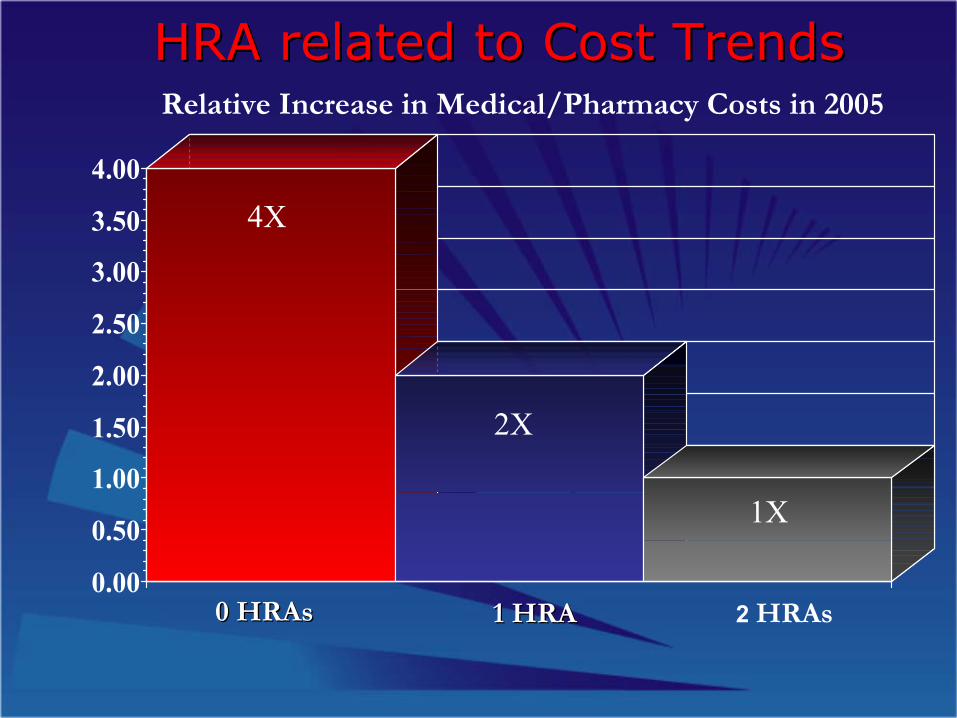
HRA related to Cost TrendsHRA related to Cost TrendsRelative Increase in Medical/Pharmacy Costs in 2005
0.00
0.50
1.00
1.50
2.00
2.50
3.00
3.50
4.00
0 0 HRAsHRAs 1 HRA1 HRA 2 HRAs
4X
1X
2X
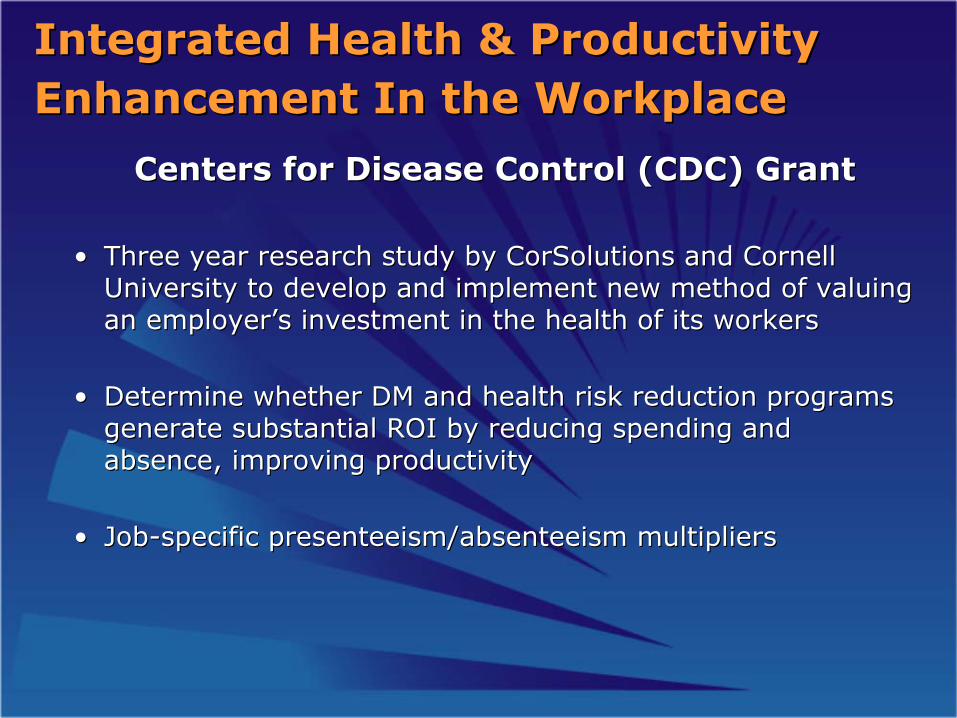
Integrated Health & Productivity Integrated Health & Productivity Enhancement In the WorkplaceEnhancement In the Workplace
Centers for Disease Control (CDC) Grant Centers for Disease Control (CDC) Grant
•• Three year research study by Three year research study by CorSolutionsCorSolutions and Cornell and Cornell University to develop and implement new method of valuing University to develop and implement new method of valuing an employeran employer’’s investment in the health of its workerss investment in the health of its workers
•• Determine whether DM and health risk reduction programs Determine whether DM and health risk reduction programs generate substantial ROI by reducing spending and generate substantial ROI by reducing spending and absence, improving productivityabsence, improving productivity
•• JobJob--specific specific presenteeismpresenteeism/absenteeism multipliers/absenteeism multipliers
Good Health Good Health is is
Good BusinessGood Business
The Bottom Line