Embed Size (px)
Citation preview

MATHEMATICS II- Unit 5 Step and Piecewise Functions Part 1 – Piecewise Functions Day 1 Piecewise Functions – Domain – Range – Intervals that are Constant,
and Intervals of Increase & Decrease E. Q. – How are piecewise functions used to identify situations in everyday life? Standard – MM2A1b: Investigate and explain characteristics of a variety of
piecewise functions including domain, range, zeros, intercepts, extrema, points of discontinuity, intervals over which the function is constant, intervals of increase and decrease.
Opening – The teacher will define a piecewise function, and go over Key Idea p. 80 #6 (domain and range), also p. 82 #9 (constant and intervals of increase and decrease), found in the Mathematics II EOCT.
Work session –
Students will work in pairs to complete “Putting the Pieces Together – Part 1”. Complete worksheet #10 – Interval Notation; and Ws on domain and range of a graph.
Closing – Worksheet on Interval Notation
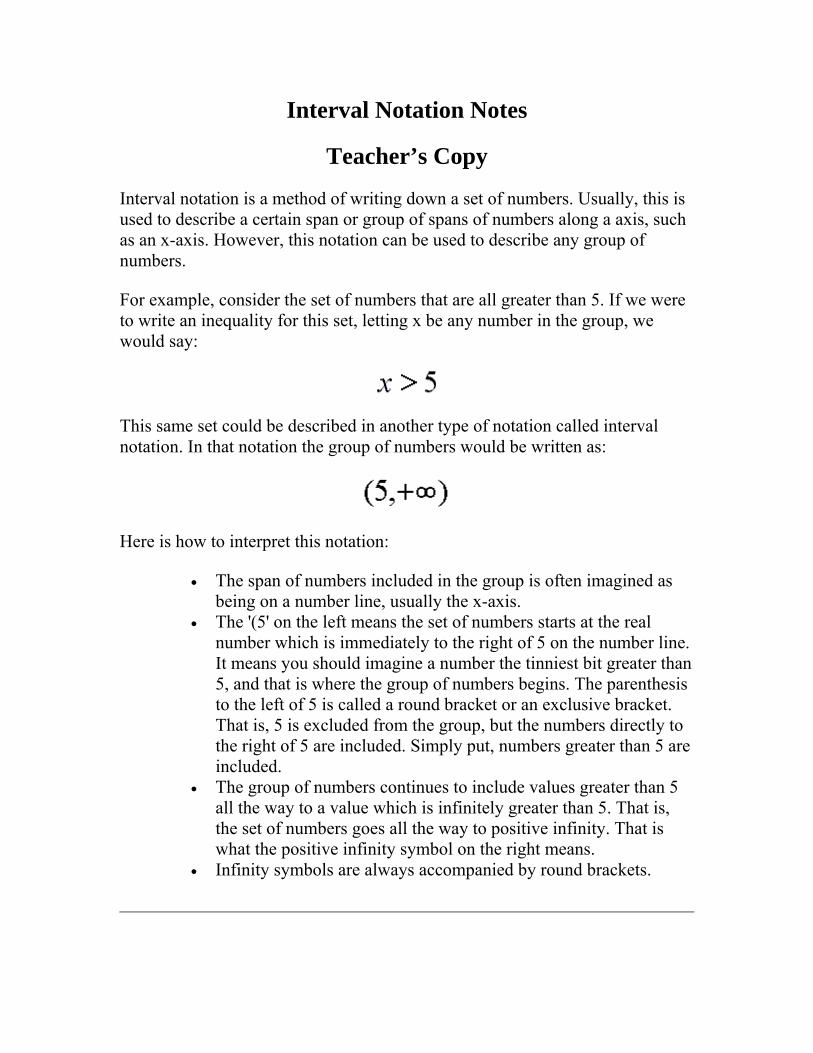
Interval Notation Notes
Teacher’s Copy
Interval notation is a method of writing down a set of numbers. Usually, this is used to describe a certain span or group of spans of numbers along a axis, such as an x-axis. However, this notation can be used to describe any group of numbers.
For example, consider the set of numbers that are all greater than 5. If we were to write an inequality for this set, letting x be any number in the group, we would say:
This same set could be described in another type of notation called interval notation. In that notation the group of numbers would be written as:
Here is how to interpret this notation:
• The span of numbers included in the group is often imagined as being on a number line, usually the x-axis.
• The '(5' on the left means the set of numbers starts at the real number which is immediately to the right of 5 on the number line. It means you should imagine a number the tinniest bit greater than 5, and that is where the group of numbers begins. The parenthesis to the left of 5 is called a round bracket or an exclusive bracket. That is, 5 is excluded from the group, but the numbers directly to the right of 5 are included. Simply put, numbers greater than 5 are included.
• The group of numbers continues to include values greater than 5 all the way to a value which is infinitely greater than 5. That is, the set of numbers goes all the way to positive infinity. That is what the positive infinity symbol on the right means.
• Infinity symbols are always accompanied by round brackets.

Now consider the group of numbers that are equal to 5 or greater than 5. That group would be described by this inequality:
In interval notation this set of numbers would look like this:
This interval notation would be interpreted just like the interval above, except:
• The '[5' on the left means the set of numbers starts on the number line with 5. The square bracket to the left of 5 is called an inclusive bracket. That is, 5 is included within the group. Simply put, the number 5 and all numbers greater than 5 are included.
Now, what about numbers greater than 5 but less than 7? Expressed as an inequality this group would look like this:
This same group of numbers expressed with interval notation would look like this:
Again the round, exclusive brackets on the left and right mean 'up to but not including'.
And here is an inequality showing a group of numbers equal to or greater than 5 and less than 7:

Here is this group of numbers expressed with interval notation:
Notice that there is a square, or inclusive, bracket on the left of this interval notation next to the 5. This means that this group of numbers starts at 5 and continues for values greater than 5. The round bracket on the right next to the 7 is, again, an exclusive bracket. This means that the numbers in this group have values up to but not including the 7.
Well, by now, hopefully interval notation is clear to you. Let us go through one last simple example. Consider the group of numbers equal to or greater than 5 and less than or equal to 7. An inequality for this set would look like this;
Since both the 5 and the 7 are included in the group we will need inclusive, or square, brackets at each end of the interval notation. That notation looks like this:
Well, let us get just a bit more complicated. Using interval notation we will show the set of number that includes all real numbers except 5. First, stated as inequalities this group looks like this:
The statement using the inequalities above joined by the word or means that x is a number in the set we just described, and that you will find that number somewhere less than 5 or somewhere greater than 5 on the number line.
In interval notation a logically equivalent statement does not use the word or, but rather a symbol for what is called the union of two groups of numbers. The symbol for union coincidentally looks like a U, the first letter of union. However, it is really not a letter of the alphabet. Here is what the union symbol looks like:

So, the group of numbers that includes all values less than 5 and all values greater than 5, but does not include 5 itself, expressed as interval notation looks like this:
Let us consider one last set of numbers. We will consider a group of numbers containing all numbers less than or equal to 5 and also those numbers that are greater than 7 but less than or equal to 12. Using inequalities this group of numbers could be notated like this:
And using interval notation as described throughout this material this group would look like this:
We would interpret this interval notation as representing the total group of numbers as the union of two other groups. The first would start at negative infinity and proceed toward the right down the number line up to and including 5. The second would start just to the right of 7, but not including 7, and continue to the right down the number line up to and including 12. The total set of numbers would be all those in the first group along with all of those in the second, and this would be the same total group of numbers which we considered in the above inequality where we first introduced this last example.
So, we see that interval notation is useful for stating the members of groups of numbers. It is often used to state the set of numbers which make up the domain and range of a function.

Student’s Interval Notation Notes with Practice
Interval notation is another method for writing domain and range.
In set builder notation braces (curly parentheses {} ) and variables are used to express the domain and range. Interval notation is often considered more efficient.
In interval notation, there are only 5 symbols to know:
• Open parentheses ( ) • Closed parentheses [ ] • Infinity <apply>∞</apply> • Negative Infinity −∞ • Union Sign ⋃
To use interval notation:
Use the open parentheses ( ) if the value is not included in the graph. (i.e. the graph is undefined at that point... there's a hole or asymptote, or a jump)
If the graph goes on forever to the left, the domain will start with ( −∞. If the graph travels downward forever, the range will start with ( −∞. Similarly, if the graph goes on forever at the right or up, end with <apply>∞</apply>)
Use the brackets [ ] if the value is part of the graph.
Whenever there is a break in the graph, write the interval up to the point. Then write another interval for the section of the graph after that part. Put a union sign between each interval to "join" them together.
Now for some practice so you can see if any of this makes sense.
Write the following using interval notation:
Exercise 1
Figure 1

Exercise 2
Figure 2
Exercise 3
Figure 3
Exercise 4
Figure 4
Exercise 5
Figure 5
Exercise 6
Figure 6

Write the domain and range of the following in interval notation:
Exercise 7
Figure 7
Exercise 8
Figure 8

Exercise 9
Figure 9
Exercise 10
Figure 10

Exercise 11
Figure 11
Exercise 12
Figure 12

Exercise 13
Figure 13
Exercise 14
Figure 14
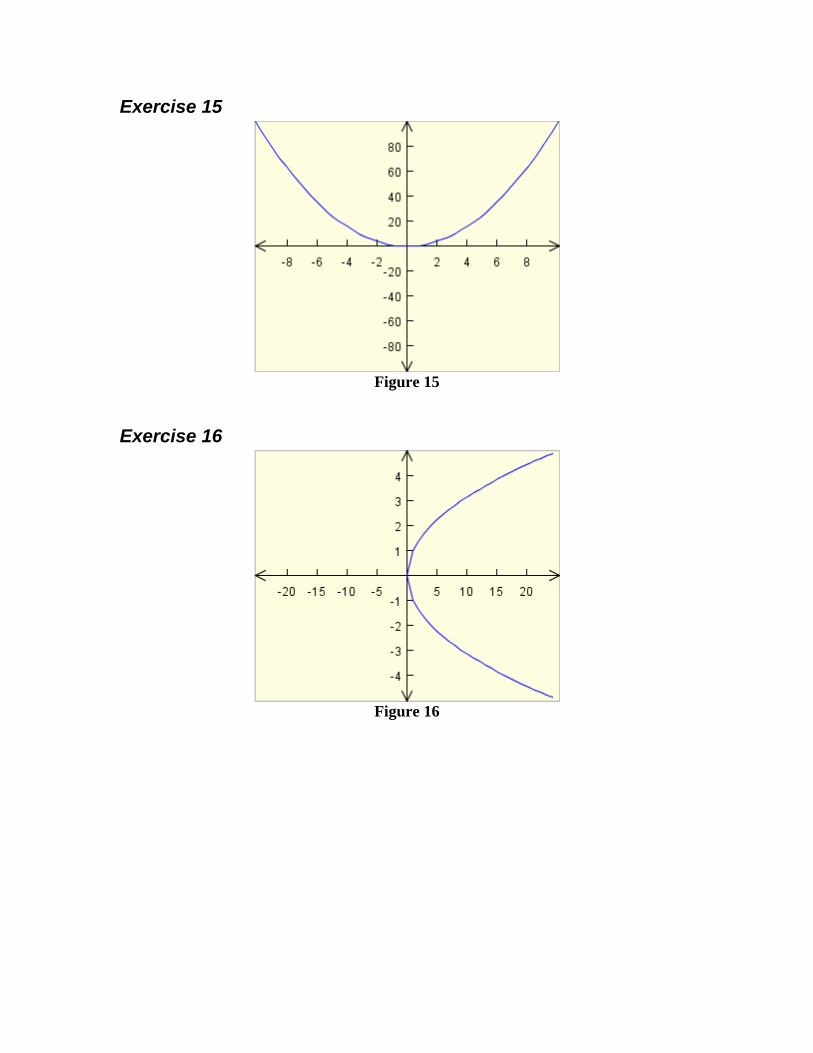
Exercise 15
Figure 15
Exercise 16
Figure 16

Exercise 17
Figure 17
Exercise 18
Figure 18

Exercise 19
Figure 19
Exercise 20
Figure 20

Putting the Pieces Together
Part 1: Training for a Race Saundra is a personal trainer at a local gym. Earlier this year, three of her clients asked her to help them train for an upcoming 5K race. Though Saundra had never trained someone for a race, she developed plans for each of her clients that she believed would help them perform their best. She wanted to see if her plans were effective, so when she attended the race to cheer them on, she collected data at regular intervals along the race. Her plan was to create graphs for each of the runners and compare their performances. Since each had an individualized strategy, each runner ran a different plan during the race. One of her clients (Sue, the oldest one), was supposed to begin slowly, increasing over the first kilometer until she hit a speed which she believed she could maintain over the rest of the race. Her second client, Jim, was supposed to begin with a strong burst for the first kilometer, then slow to a steady pace until the final kilometer when he would finish with a strong burst. Her third client, Jason, is a very experienced runner. His plan was to run at a steady pace for the first two kilometers, then run at his maximum speed for the final 3 kilometers. Each of the clients came close to performing as they planned. 1. Saundra created graphs for two of the clients, but she set them aside without labeling the graphs. Now she cannot remember whose graphs she has. Can you identify the client based on these graphs? Explain how you know. Graph 1 Graph 2

2. Describe how the runner in Graph #1 performed. For what distance did the runner increase speed, decrease speed, or maintain speed? 3. Compare the performance of the runner in Graph #2 to the runner in Graph #1. 4. Saundra found the data for her third client on her desk. Graph the data for this runner. Time Km 4:00 1 8:30 2 13:00 3 22:00 4 26:00 5 While you may be tempted to find a line that describes this data, a single line does not really show how the runner performed at each interval. A piecewise function is a graph that shows differences in specified intervals; that is, it is a graph with two or more pieces. The slope of the pieces may not be the same and even the shape of the pieces may not be the same. 5. Connect the points in the third graph to show the “pieces” of different performance levels by the runner. 6. Using the third graph, write the equations of the “pieces,” or segments, of the graph. Be sure to indicate the appropriate interval for each piece (for which x-values that equation is the correct graph).


Name ____________________________ Date ______________ Period ____________ Please describe the domain and range of each function using interval notation. 1.
Domain: Range:
2.
Domain: Range:
3.
Domain: Range:
4.
Domain: Range:
5.
Domain: Range:
6.
Domain: Range:
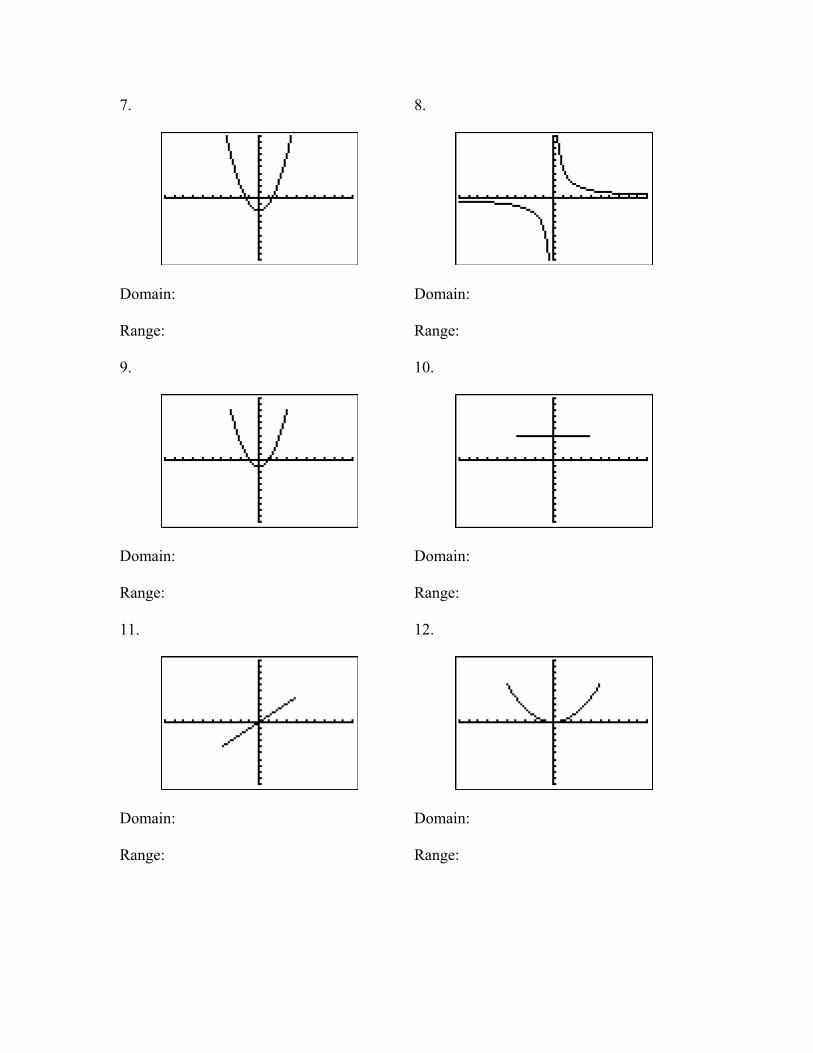
7.
Domain: Range:
8.
Domain: Range:
9.
Domain: Range:
10.
Domain: Range:
11.
Domain: Range:
12.
Domain: Range:

13.
Domain: Range:
14.
Domain: Range:

Name _____________________________ Date ____________ Period _________
Interval Notation
Please write the following sets in interval notation. 1. The set of all numbers less than or equal to – 3.
2. The set of all real numbers greater than or equal to 4 and less than 8.
3. The set of all real numbers either greater than 6 or between, but not equal to, -3 and -2.
4. The set of all real numbers between 12 and 8, including 12 but not including 8.
Display the following sets on real number lines.
5. [−3, 1)
6. (2,1)
7. (2, 4] and [3, 8)
8. (−1,−3) [ (1, 2]

Day 2 Piecewise Functions – Zeros – Intercepts – Extrema E. Q. – How can piecewise functions be described? Standard – MM2A1b: Investigate and explain characteristics of a variety of
piecewise functions including domain, range, zeros, intercepts, extrema, points of discontinuity, intervals over which the function is constant, intervals of increase and decrease.
Opening – The teacher will define zeros, intercepts, and extrema (maximum and minimum found on p. 81 #7 in the Mathematics II EOCT). Key Idea #1, found in the Mathematics II EOCT found on page 78 and use “Putting the Pieces Together – Part 4” to introduce the student work session worksheet. Optional opener could be: Powerpoint on “Teaching Piecewise Functions”.
Work session –
Students will complete the Graphing Piecewise Function Worksheet. Two worksheets are provided.
Closing – Students will summarize the definitions given on day 1 and day 2.

Putting the Pieces Together Part 4: Manufacturing Moldings Piecewise functions do not always have to be line segments. The “pieces” could be pieces of any kind of graph. Try to graph some of these piecewise functions. You may find it helpful to use what you already know about transformations of the parent functions
1. ( )⎪⎩
⎪⎨⎧
≥+
<+=
0,4
0,42
xx
xxxf
2. ( )⎩⎨⎧
−≤+
−>−=
1,31,1
xxxx
xf
3. ( )⎪⎩
⎪⎨
⎧
≤≤<≤−
−<≤−
=31,3
11,13,3
2
xforxforx
xforxf
4. In some manufacturing settings, machines can be programmed to make certain cuts based on piecewise functions the operator can define. What equations would you program into the machine to cut to create the following shape?


Graph each piecewise function. 1.
2.
3.

4.
5.
6.
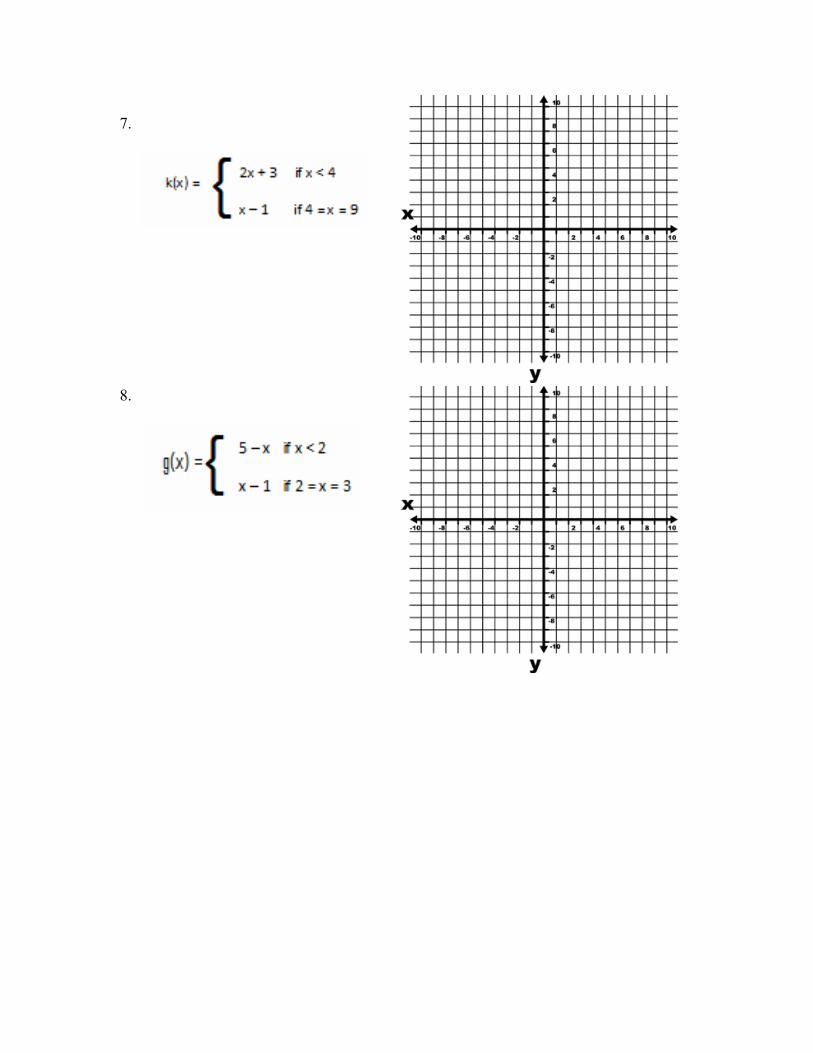
7.
8.
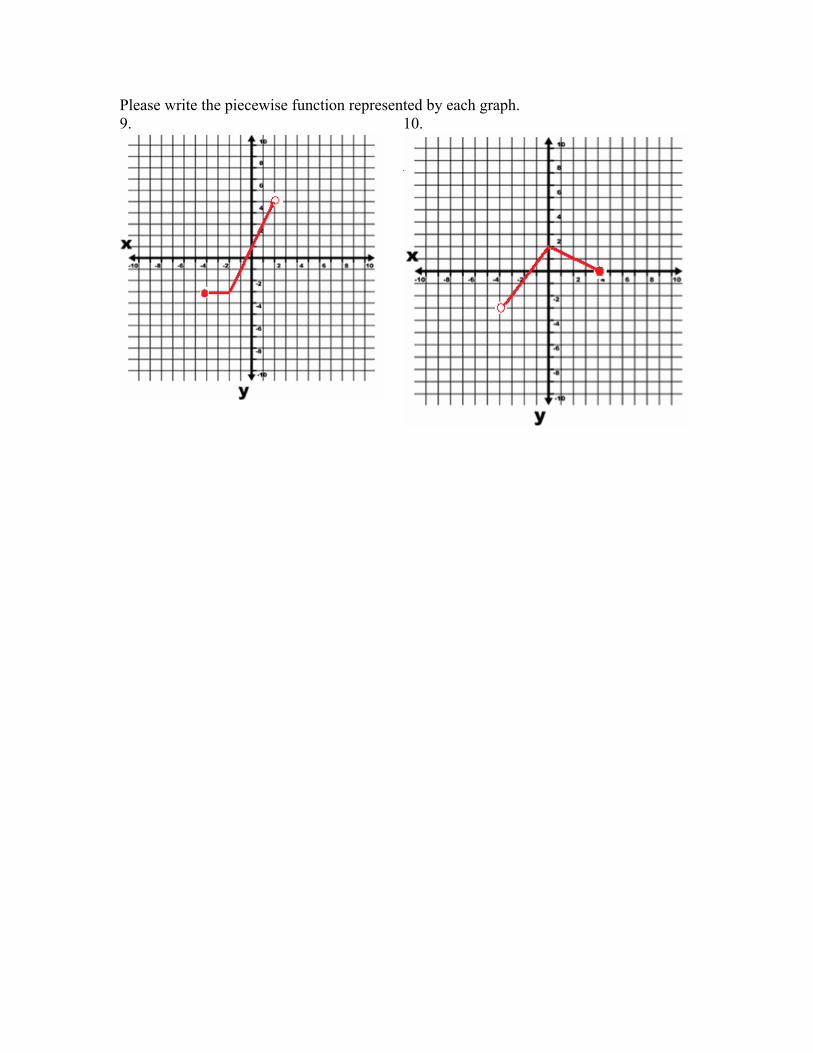
Please write the piecewise function represented by each graph. 9.
10.

Lesson 3 Point of Discontinuity and Review E. Q. – How do I identify points of discontinuity in piecewise functions? Standard – MM2A1b: Investigate and explain characteristics of a variety of
piecewise functions including domain, range, zeros, intercepts, extrema, points of discontinuity, intervals over which the function is constant, intervals of increase and decrease.
Opening – The teacher will go over p. 81 #8 (point of discontinuity) found in the Mathematics II EOCT.
Work session –
Students will complete “Piecewise Defined Functions” review sheet.
Closing – Students will state the types of items that they expect to see on the quiz when they come into the classroom on day 4. The teacher will make sure that any items not discussed by the students are discussed.

Piecewise Defined Functions NAME _____ DATE PERIOD
– x – 5 for −5 x ≤ −2 f(x) = −x2 + 1 for −2 < x < 2 (x – 3)3 + 2 for 2 ≤ x ≤ 4 Find the following values: f(−4) = f(−2) = f(0) = f(2) = What are the x-intercept(s) (zeroes) of the function? What are the y-intercept(s) of the function? Extrema: What is the maximum? The minimum? Give answers in interval notation for the next three questions. Find the interval(s) on which the function is increasing. Find the interval(s) on which the function is decreasing.

Find the interval(s) on which the function is constant. List any points of discontinuity. What is the rate of change on the interval [−5, −2]? Graph the following piecewise function and then answer questions relating to it. x + 1 for x < −4 f(x) = 2 for −4≤ x < 0 x2 for x ≥ 0
Find the following values: f(−6) = f(−4) = f(0) = f(3) = What are the x-intercept(s) (zeroes) of the function? What are the y-intercept(s) of the function? Extrema:
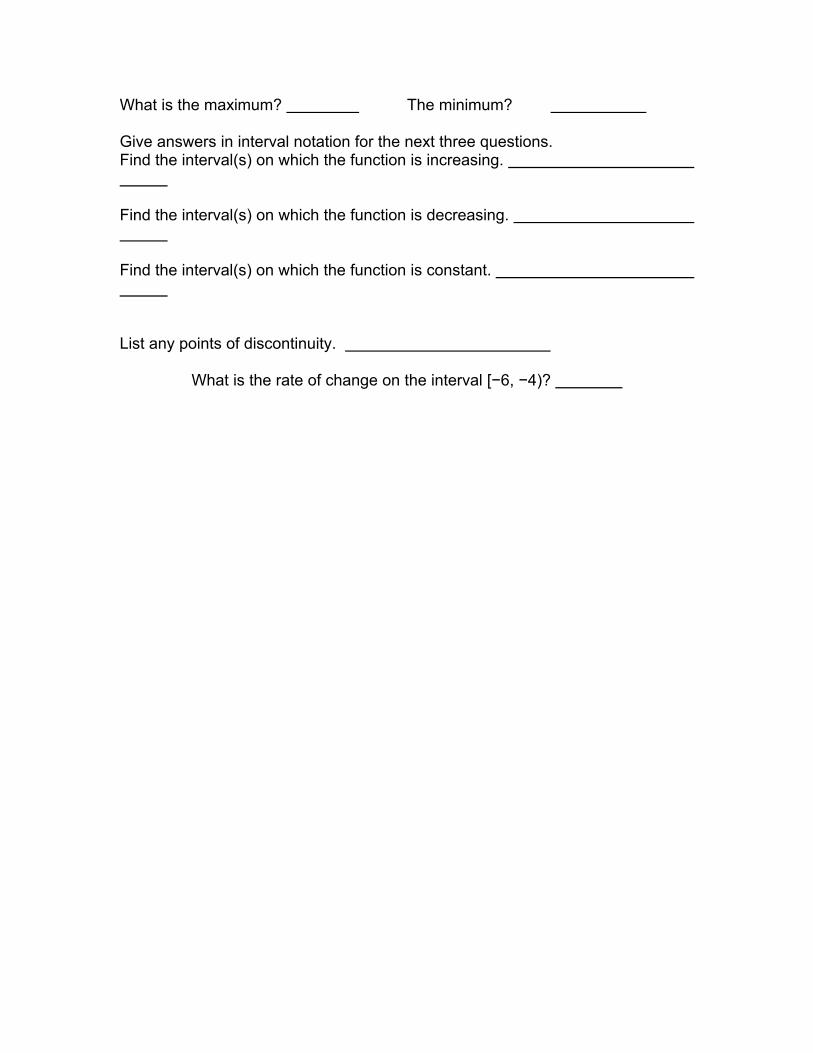
What is the maximum? The minimum? Give answers in interval notation for the next three questions. Find the interval(s) on which the function is increasing. Find the interval(s) on which the function is decreasing. Find the interval(s) on which the function is constant. List any points of discontinuity.
What is the rate of change on the interval [−6, −4)?
Lesson 4 Greatest Integer Function – Floor Function and Quiz E. Q. – How do I graph a greatest integer function?
How do I determine if a piecewise function is a floor function? Standard – MM2A1b: Investigate and explain characteristics of a variety of
piecewise functions including domain, range, zeros, intercepts, extrema, points of discontinuity, intervals over which the function is constant, intervals of increase and decrease.
Opening – Students will take a quiz over days 1, 2 and 3. The teacher will go over examples of greatest integer functions and show how to graph by hand and by using a graphing calculator.
Work session –
Students will complete the Discover Transformations Activity.
Closing – Students will complete the Greatest Integer Function Graphing Activity.

Piecewise Functions Quiz Please use the function below to answer the questions that follow. Please use interval notation to communicate all intervals.
1. What is the domain of the function in interval notation?
2. What is the range of the function in interval notation?
3. Are there any points of discontinuity? If so, where are they located?
4. Is there a maximum value? If so, what is it?
5. Is there a minimum value? If so, what is it?
6. What is the interval of decrease?
7. What is the interval of increase?
Please use the graph below to answer the questions that follow. Use interval notation when the answer is an interval.
8. What is the constant interval?

9. Over what interval is the function decreasing?
10. Over what interval is the function increasing?
11. Are there any points of discontinuity? If so, what are they?
12. What are the domain and range of the function shown on the graph?
13. Is there a maximum value? If so, where does it occur?
14. Is there a minimum value? If so, where does it occur?
15. Please write a piecewise function for the graph.
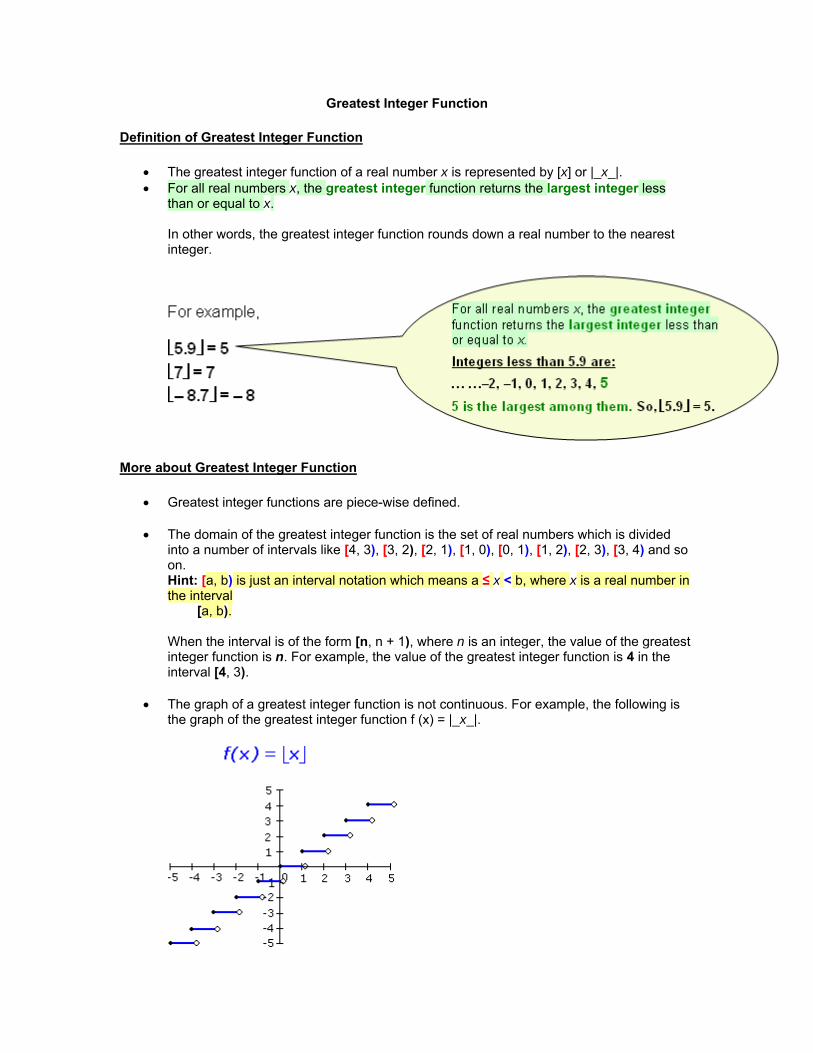
Greatest Integer Function
Definition of Greatest Integer Function
• The greatest integer function of a real number x is represented by [x] or |_x_|. • For all real numbers x, the greatest integer function returns the largest integer less
than or equal to x. In other words, the greatest integer function rounds down a real number to the nearest integer.
More about Greatest Integer Function
• Greatest integer functions are piece-wise defined.
• The domain of the greatest integer function is the set of real numbers which is divided into a number of intervals like [4, 3), [3, 2), [2, 1), [1, 0), [0, 1), [1, 2), [2, 3), [3, 4) and so on. Hint: [a, b) is just an interval notation which means a ≤ x < b, where x is a real number in the interval [a, b). When the interval is of the form [n, n + 1), where n is an integer, the value of the greatest integer function is n. For example, the value of the greatest integer function is 4 in the interval [4, 3).
• The graph of a greatest integer function is not continuous. For example, the following is the graph of the greatest integer function f (x) = |_x_|.

The graph above looks like a stair case (a series of steps). So, the greatest integer function is sometimes called a step function. One endpoint in each step is closed (black dot) to indicate that the point is a part of the graph and the other endpoint is open (open circle) to indicate that the points is Not a part of the graph. Observe in the graph above that in each interval, the function f(x) is constant. Within an interval, the value of the function remains constant. For example, in the interval [–5, –4) the value of the function f(x) remains – 5.
In different intervals, however, the function f(x) can take different constant values.
• Greatest integer function is also called floor function.
Solved Example on Greatest Integer Function
Find:
(a) |_-256_|
(b) |_3.506_| (c) |_-0.7_| Solution: By the definition of greatest integer function,
(a) |_-256_| = -256
(b) |_3.506_| = 3
(c) |_-0.7_| = -1

The greatest integer function (also called a step function) is actually a piecewise defined function with a special definition. The function has the notation f(x)=||x|| or f(x)=[[x]] when it is written, but the TI-83 and the TI-84 designate this function by using f(x)=int(x) and is found in the MATH NUM menu. This function is the greatest integer less than or equal to x. So, f(1)=1 and f(1.4)=1. Since this is a piece-wise function you should use DOT mode.
Example: Graph the function f(x)=||x|| (the greatest integer function.) Make sure that you use DOT mode.
Access int( using MATH - NUM 5
Enter the function. Graph with ZDecimal. Without DOT (not good).

Using the Greatest Integer Function, y = int(x) , as an introduction to transformations. The greatest integer function, y = int(x) is referred to as the “step” function or “floor or ceiling” function. A greatest integer function rounds any number down to the nearest integer. Below are some examples of this function. Try and make your window look like these graphs and find the correct equation for the last graphs.
1. y = int(x) or f(x) = [x] 2. y = 3int(x) or f(x) = 3[x]
3. y = int(x - 2) or f(x) = [x – 2] 4. y =

5. y = 6. y =
7. y =

Greatest Integer Graphing Activity Please graph the following functions.
1. f(x) = [x] + 2 2. f(x) = [x] ‐ 2
3. f(x) = [x + 1] 4. f(x) = [x – 1]

5. f(x) = 2 [x] ‐2 6. f(x) = 2 [x] + 2
7. f(x) = [2x ‐3] 8. f(x) = [2x] ‐1

Lesson 5 Step Functions E. Q. – How are graphs of step functions used in everyday life? Standard – MM2A1b: Investigate and explain characteristics of a variety of
piecewise functions including domain, range, zeros, intercepts, extrema, points of discontinuity, intervals over which the function is constant, intervals of increase and decrease.
Opening – The teacher will go over p. 79 #2 (step function) found in the Mathematics II EOCT.
Work session –
The students will work in pairs to complete part 2 on “Putting the Pieces Together”.
Closing – Students will complete “Graphing Step Functions” worksheet.

Putting the Pieces Together Part 2: Income Tax Piecewise functions are used to describe a wide variety of data sets. One good example of a piecewise function is income tax. The 2007 Federal Tax Rate Schedule for a single person filing taxes is Taxable Income Tax $0 - $7,825 10% $7,825 - $31,850 782.50 plus 15% of amount over $7,825 $31,850 - $77,100 $4,386.25 plus 25% of the amount over $31,850 $77,100 - $160,850 $15,698.75 plus 28% of the amount over $77,100 $160,850 - $349,700 $39,148.75 plus 33% of the amount over $160,850 $349,700 + $101,469.25 plus 35% of the amount over $349,700 1. Write the equation for a piecewise function that would accurately represent the income tax for a single person in the United States. 2. Graph the function. 3. Dick Armey has made a proposal for a flat tax for US taxpayers. He has proposed that every taxpayer should pay 17% of their taxable income in taxes. Write an equation to represent Mr. Armey’s proposal. Graph this equation on the same coordinate plane as #2. 4. At what income level would a flat tax be the same as our current tax rate? Explain. 5. The US Census Bureau reported that the median income in the US for the year 2006 was $48,201. The Census Bureau also reported that about 19% of the working population of the US had an income of over $100,000. Who do you believe is most likely to prefer a flat tax? Which type of tax do you believe a majority of US taxpayers would prefer? Explain.

Graphing Step Functions Graph the step function. 3, if -1 ≤ x < 2 5, if 2 ≤ x < 4 1. f(x) = 8, if 4 ≤ x < 9 10, if 9 ≤ x < 12
2. g(x) = [x + 3]
3. Write equations for the piecewise function whose graph is shown.

Lesson 6 Step Functions – Ceiling Functions E. Q. – How do I determine if a piecewise function is a ceiling function? Standard – MM2A1b: Investigate and explain characteristics of a variety of
piecewise functions including domain, range, zeros, intercepts, extrema, points of discontinuity, intervals over which the function is constant, intervals of increase and decrease.
Opening – The teacher will go over p. 79 #2 & #3 found in the Mathematics II EOCT.
Work session –
Students will work in pairs to complete “Putting the Pieces Together – Part 3”.
Closing – Ticket Out The Door: “Floor, Ceiling, or Neither?” TI Activity: How much is that phone call found at education.ti.com under Algebra 1, piecewise functions. A Powerpoint and a handout about the ceiling and floor functions. There are examples and shows the use of technology. Transformations are also shown.

Name: ___________________________________ Lesson 5 – Piecewise Functions Floor, Ceiling, or Neither? Tell if each of the following is an example of a floor function, a ceiling function, or neither. 1. A graph of the income tax of a single person in the United States? _______________ 2. A graph of the greatest integer function? ____________________ 3. A graph of the mailing rates for a package of varying weights? _______________ 4. A graph of the speed of a car taking a road trip from Atlanta, Georgia to Washington, D. C.? _______________ 5. A graph of f(x) = x2 + 4, x < 0 √x + 4, x > 0 ______________

Putting the Pieces Together Part 3: Mailing a Package Mrs. Speer’s daughter, Jennie, is a freshman in college. Jennie asked her mom to send her a package of her favorite cookies because she really missed her mom’s cooking. So Mrs. Speer baked the cookies, packed them in a box and went to the post office to mail the cookies. The line at the post office was so long that Mrs. Speer tossed the cookies in the back seat of her car and headed off to work, planning to mail the cookies later in the day. At work, Mrs. Speer looked online to find the cost of mailing that package to Jennie. She found the following chart of cost for mailing a package using regular mail from Marietta, GA, to Statesboro, GA, where Jennie is attending school.
Weight Not Over (pounds)
Zone 1 & 2
1 3.67 2 4.34 3 4.96 4 5.37 5 5.74 6 6.09 7 6.42 8 6.95 9 7.24 10 7.55
1. Mrs. Speer, who loves math, began to wonder what a graph of these postal rates would look like. Graph this data. 2. Write an equation that represents this function.

This type of function is called a step function. Two particular kinds of step functions are called “ceiling functions” or “floor functions.” In the case of a ceiling function, all non-integers are rounded up to the nearest integer; in the case of a floor function, all non-integers are rounded down to the nearest integer. Here in the United States, how we count our ages is an example of a floor function. We do not add a year to our age until we have passed our birthday. 3. For example, if you met someone who was born on July 2, 1988, how old would you expect he would say he is? In the case of a floor function, we would write the function as ( ) ⎣ ⎦xxf = ,
meaning that for every non-integer value of x, we would round down to the nearest integer. In the case of a ceiling function, we would write the function as ( ) ⎡ ⎤xxf = , meaning that for every non-integer value of x, we would round
up to the nearest integer. 4. Graph the functions ( ) ⎣ ⎦xxf = and ( ) ⎡ ⎤xxf = .
5. How are the graphs different? How are they similar? 6. Can you give an example of a ceiling function? how much you pay for gasoline birthdays in Japan or China number of people we need in a survey
Lesson 7 Review E. Q. – How do I graph and describe piecewise functions? Standard – MM2A1b: Investigate and explain characteristics of a variety of
piecewise functions including domain, range, vertex, axis of symmetry, zeros, intercepts, extrema, points of discontinuity, intervals over which the function is constant, intervals of increase and decrease.
Opening – The teacher will show the Piece Fun Powerpoint which gives a good review of piecewise functions.
Work session –
Students will complete a review worksheet. (Review worksheet needs to be created.)
Closing – Students will discuss what they expect to see on the test. The teacher will include any areas left out by students.
Lesson 8 Test E. Q. – How do I graph and describe piecewise functions? Standard – MM2A1b: Investigate and explain characteristics of a variety of
piecewise functions including domain, range, vertex, axis of symmetry, zeros, intercepts, extrema, points of discontinuity, intervals over which the function is constant, intervals of increase and decrease.
Opening – Teacher will give instructions and pass out test. Work session –
Students will complete the test.
Closing – Give out exponent rules sheet and have students to complete the “Practice Exponent Rules” worksheet.

Test on Piecewise Functions Name ______________________________ Date _______________ Period _______ 1) A coordinate grid represents a rectangular pool table. A ball is on a pool table at the point
(2,3). The ball is rolled so that it hits the side of the pool table at the point (9, 10). Then it rolls toward the other side, as shown in the diagram below.
a) Write a piecewise function that can represent the path of the ball.
b) If the ball continues to roll, at what point will it hit the other side of the pool table?
c) What do the x‐value and the y‐value represent?

2.) A computer repair person charges $75 per hour for labor. She charges her labor in increments of 15 minutes. For example, if she works for 39 minutes, she rounds up to 45 minutes and charges $60.
a) Write a function to represent the amount the repair person charges up to and including
90 minutes of labor.
b) Graph the function from part a. Let x represent the number of minutes of labor charged.
Please do the following for exercises 3 and 4:
• Please graph the function.
• Give the domain and range of each function in interval notation.
• List any constant intervals, increasing, or decreasing intervals.
• Note any minimum or maximum values or points of discontinuity, if they occur.

3.
Domain: Range: Constant Interval: Increasing Interval: Decreasing Interval: Maximum: Minimum: Points of Discontinuity:

4.
Domain: Range: Constant Interval: Increasing Interval: Decreasing Interval: Maximum: Minimum: Points of Discontinuity:

MATHEMATICS II - Unit 5 Step and Piecewise Functions Part 2 – Exponential Functions Day 1
E. Q. – How do you use properties of exponents to simplify algebraic expressions?
Standard – MM2A2. Students will explore exponential functions. a. Extend properties of exponents to include all integer exponents. d. Solve simple exponential equations and inequalities analytically, graphically, and by using appropriate technology.
Opening – Vocabulary- exponential function exponential growth function exponential decay function end behavior geometric sequence constant ratio
natural base e common ratio asymptotes domain
range zeros intercept power function integer exponents exponential inequalities
Geometric series Growth factor Decay factor
Opening - • You Tube Video- Exponential growth and decay (Choose One) http://www.youtube.com/watch?v=cb7wBQIR2_0
• http://www.youtube.com/watch?v=BjhHBC2d28Y • http://www.youtube.com/watch?v=R3Mt2E1M6dU • Vocabulary Strategies Review Properties-KWL (all vocabulary)-Exponential Functions • Introduce exponential equations
Work session –
• Properties of Exponents and Solving Exponential Equations
(worksheet)
Closing – Students share out work from the worksheet. Students answer the essential question.

KWL Exponential Functions
Know it Want of Learn it Learned it
Word Bank exponential function domain growth factor exponential growth function range decay factor exponential decay function zeros end behavior intercept geometric sequence power function constant ratio integer exponents natural base e exponential common ratio inequalities asymptotes geometric series

Properties of Exponents and Solving Exponential Equations
There are 5 basic properties of exponents. 1. mnmn aaa +=
2. ( ) mnmn aa ⋅= 3. 10 =a
4. mnm
n
aaa −=
5. nn
aa 1
=−
Use these properties to simplify the following problems.
1. ( )( )5243 yxyx 2. ( )32 yx
3. ( )01526 zyx 4. ( )yx7
5. ( )( )yy xx 32 6. y
y
xx 2
7. 54
83
813
yxyx
8. ( )( )xx 22
9. xx 22 + 10. x
xx
333 +

The properties of exponents can be used to solve exponential equations. The first step is to rewrite the equation so that the bases on both sides of the equation are the same. If the bases on both sides are the same, then the exponents must be equal. For instance,
xx 93 1 =+
both bases can be made the same… ( )xx 21 33 =+ using the exponent properties… xx 21 33 =+ if the bases are the same, then the exponents must be equal, so…
xx 21 =+ and 1=x Try these problems. 1. 82 =x 2. 25 93 =+x
3. 125
15 32 =+x 4. 4
11 82
xx
+−⎛ ⎞ =⎜ ⎟
⎝ ⎠
5. 2
51 819
xx
−−⎛ ⎞ =⎜ ⎟
⎝ ⎠ 6. 937 168 += xx
7. 3 5 37 7x x+ −= 8. 4771 +=⎟⎠⎞
⎜⎝⎛ x
x
9. 353 1010 −+ = xx 10. 7 3 927 81x x+=

Day 2
E. Q. – How do you use the properties of exponents to solve exponential equations and inequalities?
Standard – MM2A2. Students will explore exponential functions. a. Extend properties of exponents to include all integer exponents. d. Solve simple exponential equations and inequalities analytically, graphically, and by using appropriate technology.
Opening – • Review exponential equations • Introduce exponential inequalities • Example 3 in Math II Workbook CD (Teacher led) Section 4-6
McDougal Littell
Work session –
Problems from Math II Workbook 4-6 (listed above) McDougal Littell
Closing – Share out problems from work session.
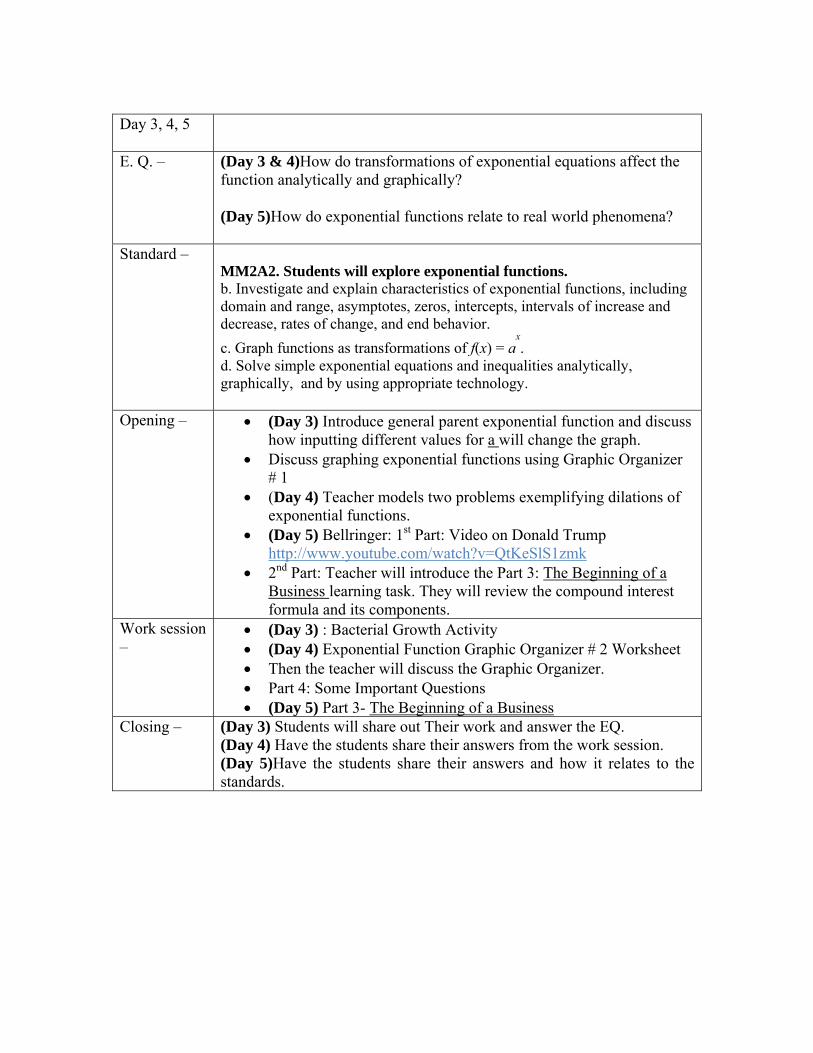
Day 3, 4, 5
E. Q. – (Day 3 & 4)How do transformations of exponential equations affect the
function analytically and graphically? (Day 5)How do exponential functions relate to real world phenomena?
Standard – MM2A2. Students will explore exponential functions. b. Investigate and explain characteristics of exponential functions, including domain and range, asymptotes, zeros, intercepts, intervals of increase and decrease, rates of change, and end behavior. c. Graph functions as transformations of f(x) = a
x.
d. Solve simple exponential equations and inequalities analytically, graphically, and by using appropriate technology.
Opening – • (Day 3) Introduce general parent exponential function and discuss how inputting different values for a will change the graph.
• Discuss graphing exponential functions using Graphic Organizer # 1
• (Day 4) Teacher models two problems exemplifying dilations of exponential functions.
• (Day 5) Bellringer: 1st Part: Video on Donald Trump http://www.youtube.com/watch?v=QtKeSlS1zmk
• 2nd Part: Teacher will introduce the Part 3: The Beginning of a Business learning task. They will review the compound interest formula and its components.
Work session –
• (Day 3) : Bacterial Growth Activity • (Day 4) Exponential Function Graphic Organizer # 2 Worksheet • Then the teacher will discuss the Graphic Organizer. • Part 4: Some Important Questions • (Day 5) Part 3- The Beginning of a Business
Closing –
(Day 3) Students will share out Their work and answer the EQ. (Day 4) Have the students share their answers from the work session. (Day 5)Have the students share their answers and how it relates to the standards.

Exponential Function GO 1 Exponential Function y = ax
1. Graph f(x) = 3x. Complete the table
of values. x f (x) – 4 – 2 0 1 3 4

2. Graph f(x) = 5x. Complete the table
of values. x f (x) – 4 – 2 0 1 3 4
3. Graph f(x) = 3x + 2. Complete the table
of values. x f (x) – 4 – 2 0 1 3 4 How did adding the 2 change the original function?
4. Graph f(x) = 5x – 3. Complete the table
of values. x f (x) – 4 – 2 0 1 3 4 How did subtracting the 3 change the original function?

Exponential Function GO 2 Exponential Function y = ax
f (x) = 5x + 1 f (x) = – 5x
x f (x) = x f (x) = – 2 – 2 – 1 – 1 0 0 1 1 2 2 3 3

f (x) =(0.125)3x f (x) = (2)5x x f (x) = x f (x) = – 2 – 2 – 1 – 1 0 0 1 1 2 2 3 3
f (x) = 5x – 3 f (x) = 3x + 2 x f (x) = X f (x) = – 2 – 2 – 1 – 1 0 0 1 1 2 2 3 3

Exponential Function GO 3 Function: f(x) = ( – 2 ) 3x + 2 Domain______________________ Range________________________ Asymptotes____________________ Zeros________________________ y-intercepts___________________ intervals of decrease______________ intervals of increase_______________ rates of change___________________ Function: f(x) = (0.85) 3x – 2 – 1 Domain______________________ Range________________________ Asymptotes____________________ Zeros________________________ y-intercepts___________________ intervals of decrease_______________ intervals of increase_______________ rates of change___________________ Function: f(x) = (2) 3x – 1 + 2 Domain______________________ Range________________________ Asymptotes____________________ Zeros________________________ y-intercepts___________________ intervals of decrease_______________ intervals of increase_______________ rates of change___________________

Unit 5 Exponential Functions Day 5 Quiz
Simplify using the exponential properties.
1. (x 3 y2) (x3 y7)=
2. X3y X2y
3. Solve the exponential equation‐ (a) 3x+1 = 27x+3 (b) 9x+2 = (1/27)x+12
Solve each inequality.
4. 8x 22x+1
5. 4x 43x‐1
6. #23 p. 130 word problems (McDougal Littell – possibly)

Exponential Decay Experiments The following are experiments to explore the phenomena of exponential decay. Each of these experiments will require you to collect materials, take repeated measurements and graph the resulting data. Experiment 1: Cooling Water You will need: a container of hot water, a watch, and a candy thermometer 1. For this experiment, you need to measure the temperature of the hot
water. Record this measurement in the table below. Recheck and record the temperature of the water every minute until the water reaches room temperature.
x (time in minutes) y (temperature of water)
0 1 2 3 4 5 6 7 8 9 10 11 12 13 14 15 16
2. Graph the ordered pairs (time, temperature) on graph paper. 3. Does this data appear exponential? Why or why not?
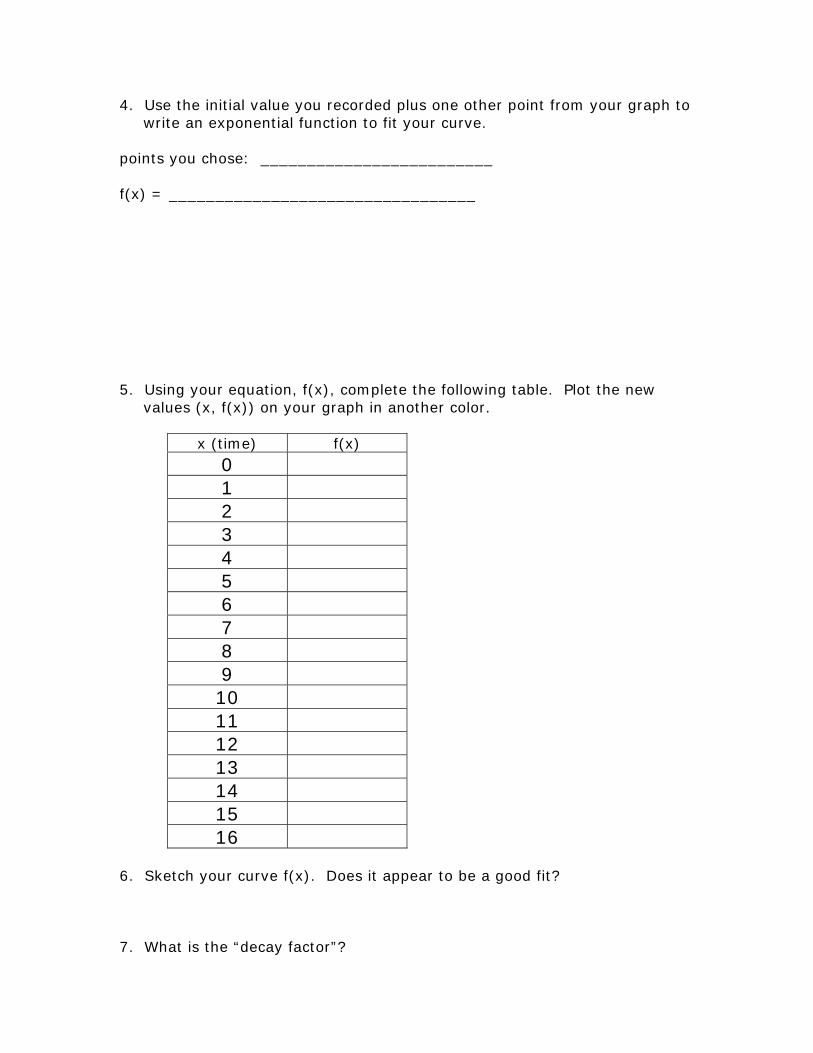
4. Use the initial value you recorded plus one other point from your graph to write an exponential function to fit your curve.
points you chose: _________________________ f(x) = _________________________________ 5. Using your equation, f(x), complete the following table. Plot the new
values (x, f(x)) on your graph in another color.
x (time) f(x)
0 1 2 3 4 5 6 7 8 9 10 11 12 13 14 15 16
6. Sketch your curve f(x). Does it appear to be a good fit? 7. What is the “decay factor”?

Part 3: The Beginning of a Business How in the world did Linda ever save enough to buy the franchise to an ice cream store? Her mom used to say, “That Linda, why she could squeeze a quarter out of a nickel!” The truth is that Linda learned early that patience with money is a good thing. When she was just about 9 years old, she asked her dad if she could put her money in the bank. He took her to the bank and she opened her very first savings account. Each year until Linda was 16, she deposited her birthday money into her savings account. Her grandparents (both sets) and her parents each gave her money for her birthday that was equal to her age; so on her ninth birthday, she deposited $27 ($9 from each couple). Linda’s bank paid her 3% interest, compounded quarterly. The bank calculated her interest using the following formula.
nt
nrPA ⎟⎠⎞
⎜⎝⎛ += 1
where A = final amount, P = principal amount, r = interest rate, n = number of times per year the interest was compounded 1. Using the following chart, calculate how much money Linda had on
her 16th birthday.
Age Birthday $ Amt from previous year plus Birthday
Total at year end
9 27 0 27.81916 10 30 57.81916 90.48352 11 33 123.4835 161.2311 12 36 197.2311 240.3071 13 39 279.3071 327.9643 14 42 369.9643 424.463 15 45 469.463 530.0714

2. On her 16th birthday, the budding entrepreneur asked her parents if she could invest in the stock market. She studied the newspaper, talked to her economics teacher, researched a few companies and finally settled on the stock she wanted. She invested all of her money in the stock and promptly forgot about it. When she graduated from college on her 22nd birthday, she received a statement from her stocks and realized that her stock had appreciated an average of 10% per year. How much was her stock worth on her 22nd birthday?
3. When Linda graduated from college and got her first job, she
decided that each year on her birthday she would purchase new stock in the amount of half what her last stock was worth. On her 30th birthday she looked back and saw that her stock had appreciated each year a percent that was half of her age that year. So on her 23rd birthday, her stock had appreciated 11.5%; and so on. What was her stock worth on her 30th birthday?
Age Amt from previous
year Amt Linda added Amt at year end
22 938.73 469.47 23 24 25 26 27 28 29 30 147,888.83

Part 4: Some Important Questions All of these examples from Linda’s journey are examples of exponential growth functions… the rumor, compounding interest in a savings account, appreciation of a stock. Real-life situations tend to have restricted domains. 1. How is the domain restricted in each of the scenarios? 2. How would the graph of the rumor be different if the domain was
unrestricted? 3. Graph the function ( ) xxf 2= . 4. What is the range of the function? 5. Why doesn’t the graph drop below the x-axis?

6. Now graph ( ) 32 += xxf . 7. What is the range of the function? 8. An exponential function has a horizontal asymptote. Where is the
asymptote located in the graph for #3? Where is the asymptote located in the graph for #6?
9. Use your graphing utility to graph the following equations.
( ) xxf 4= ( ) xxf 42 ⋅= ( ) 34 += xxf ( ) 34 += xxf ( ) xxf 4−=

10. Make some generalizations. What impact did each of the changes you made to the equation have on the graph?
shifts how? shifts how?
( ) 34 1 +−= +xxf shifts how?

Day 6
E. Q. – How do exponential functions relate to real world phenomena?
Standard – MM2A2. Students will explore exponential functions. e. Understand and use basic exponential functions as models of real phenomena.
Opening – • Real World Phenomena Problem-Teacher will walk through how to solve, graph, and discuss the transformations of the exponential functions using Worksheet – Real World Phenomena (Handout)
Work session –
Students will work two problem McDougal Littell Mathematics II textbook.(Compound interests problems)
1. Pg 125 mathII example 4 2. Pg 127 mathII #18-20 3. Students will make a problem, solve it, graph it & discuss
what occurred. (in-class & homework) Closing –
Students share out work and answer EQ if they can.

Mathematics II - Unit 5 Real World Phenomena Worksheet
INVESTMENTS Consider a $1000 investment that is compounded annually at three different interest rates: 5%, 5.5%, and 6%.
a. Write and graph a function for each interest rate over a time period from 0 to 60 years.
b. Compare the graphs of the three functions.
c. Compare the shapes of the graphs for the first 10 years with the shapes of the graphs between 50 and 60 years.

Day 7 E. Q. – How do Geometric Sequences relate to exponential functions? Standard – MM2A2f Understand and recognize geometric sequences as exponential
functions with domains that are whole numbers.
Opening – Review Functions by letting students come to board and demonstrate different representation of the function.
Work session –
See Geometric Series Activity that follows.
ACTIVITY PREPARATION AND MATERIALS
• Decide how to divide the class into pairs. • Students should be able to perform the necessary
operations without a calculator. Decide whether you want to allow calculator use.
ACTIVITY MANAGEMENT
• Introduce this activity by asking students if they have heard the term fractal before. The fractals shown in this activity are 2-dimensional and are self-similar. At each stage of the construction, new polygons are drawn that are similar to the original and to all polygons in previous stages. The first fractal is known as the Sierpinski Triangle.
• Have students work with a partner to complete each of the two constructions and to describe the constructions. In describing the constructions it is helpful to remind students that their description must not depend on the reader seeing the design. In other words, how could you describe the process to someone over the telephone? This tends to help students focus on the words they use in their description.
• Before the Draw Conclusions section, ask students about the process of the construction and if it could be continued. In other words, if the design was sufficiently large enough, could additional stages be constructed? Could students predict how many white triangles (or squares) would result at each stage?
• Students should not have much difficulty in completing the remainder of the activity. They should make the connections that the number of white triangles (or squares) is growing exponentially.
• A-Level Alternative Choose one of the two Explores for students to do. You can split the class so that half do each of the two patterns.
• C-Level Alternative Ask whether anything is decaying. The answer is yes. The area of each successive white triangle (or square) is decaying. Each triangle is 1/4 the area of the next larger white

triangle and each white square is 1/9 the area of the next larger white square. Capable students could investigate summing a geometric sequence. You could also ask students about the number of shaded triangles at each stage.
Closing – Activity and Closure Questions
Ask these questions as a class. Use the diagram to answer questions 1–3.
1. Describe how each stage is constructed from the previous stage.
Answer: Each white square is divided into four congruent squares and the top left and bottom right corners are shaded.
2. Predict how many white squares there will be in Stages 3 and 4.
Answer: 8; 16
3. Write a function for the number of white squares at stage n.
Answer: f(n) = 2n
4. How is the base of an exponential function related to the number of white triangles (or squares) in this activity?
Answer: The number of white triangles (or squares) is a power of the base. The number of white triangles at Stage n is 3n, the number of white squares at Stage n is

5n.
LESSON TRANSITION This activity relates a geometric sequence to exponential functions. Although geometric sequences are not defined, students generate one. After students have completed this activity define geometric sequence and common ratio. Discuss how the two sequences generated in the activity are geometric sequences. Find the common ratio for each sequence.
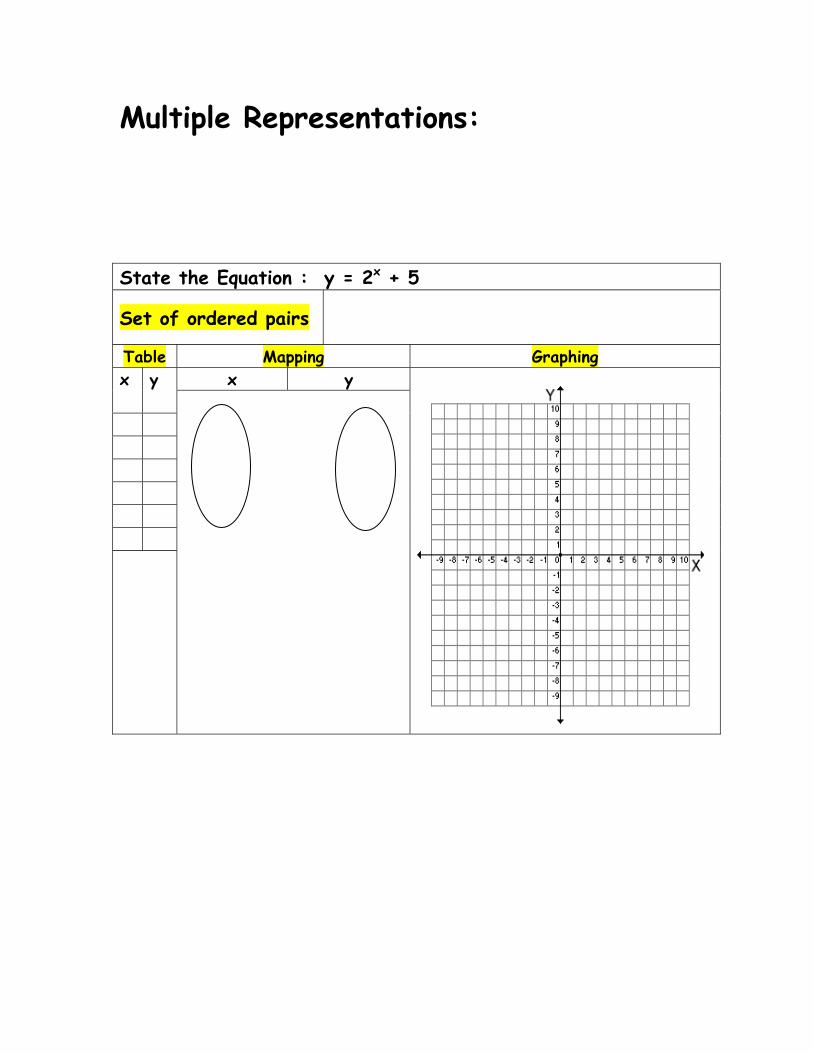
Multiple Representations:
State the Equation : y = 2x + 5
Set of ordered pairs
Table Mapping Graphing x y x y

Multiple Representations: (blank)
State the Equation :
Set of ordered pairs
Table Mapping Graphing x y x y

Name________________________ Date______ Class Period ____
Activity Creating Geometric Sequences
MATERIALS • pencil and paper
QUESTION How can you model a geometric pattern? EXPLORE 1
Investigate triangles
STEP 1 Complete stage 3 The first three stages of a construction are shown. Complete Stage 3.
STEP 2 Count Triangles Record the number of white triangles at Stages 1–3 in the table.
Stage 0 1 2 3
Number White Triangles 1
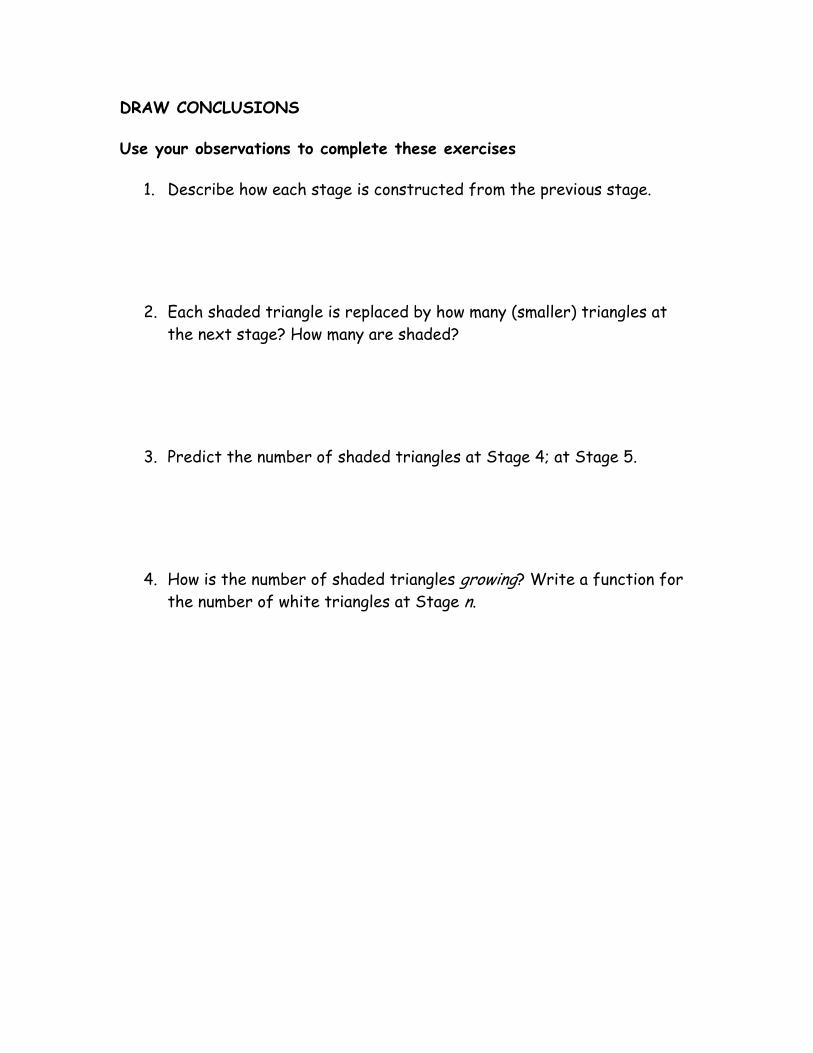
DRAW CONCLUSIONS
Use your observations to complete these exercises
1. Describe how each stage is constructed from the previous stage.
2. Each shaded triangle is replaced by how many (smaller) triangles at the next stage? How many are shaded?
3. Predict the number of shaded triangles at Stage 4; at Stage 5.
4. How is the number of shaded triangles growing? Write a function for the number of white triangles at Stage n.

Name________________________ Date______ Class Period ____
Activity Creating Geometric Sequences MATERIALS • pencil and paper
QUESTION How can you model a geometric pattern?
EXPLORE 2 Investigate squares
STEP 1 Complete stage 3
The first three stages of a construction are shown. Complete Stage 2 and 3.
STEP 2 Count squares
Record the number of white squares at Stages 1–3 in the table.
Stage 0 1 2 3
Number White Squares 1

DRAW CONCLUSIONS
Use your observations to complete these exercises
1. Describe how each stage is constructed from the previous stage.
2. Each white square is replaced by how many (smaller) squares at the next stage? How many are white?
3. Predict the number of white squares at Stage 4; at Stage 5.
4. How is the number of white squares growing? Write a function for the number of white squares at Stage n.

Answer Key Creating Geometric Sequences EXPLORE 1
STEP 1
STEP 2
Stage 0 1 2 3
Number White Triangles 1 3 9 27
EXPLORE 2
STEP 1
STEP 2
Stage 0 1 2 3
Number White Squares 1 5 25 125
DRAW CONCLUSIONS
1. Each white triangle is divided into 4 congruent triangles; the middle triangle is shaded and the remaining 3 are white.
2. 4; 3 3. 81; 243 4. growing by a factor of 3; f(n) = 3n

5. Each white square is divided into 9 congruent squares; the four corners and middle squares are white and the remaining 4 squares are shaded.
6. 9; 5 7. 625; 3125 8. growing by a factor of 5; f(n) = 5n

Name________________________ Date______ Class Period ____
Activity and Closure Questions
Ask these questions as a class. Use the diagram to answer questions 1–3.
1. Describe how each stage is constructed from the previous stage.
2. Predict how many white squares there will be in Stages 3 and 4.
3. Write a function for the number of white squares at stage n.
4. How is the base of an exponential function related to the number of white triangles (or squares) in this activity?

Day 8
E. Q. – How do we use the common ratio in a Geometric sequence with exponential functions?
Standard – MM2A2g
Opening – Frayer model for Geometric and Arithmetic Sequences. Work session – ACTIVITY PREPARATION AND MATERIALS
• Divide the class into groups of two. If there are an odd number of students, then have two students in a group of three using the same method.
• Each student needs a pair of scissors and one piece of 8.5 in. by 11 in. paper. You can use 8.5 in. by 11 in. scrap paper for this activity.
ACTIVITY MANAGEMENT
• Common Error Make sure students record the number of pieces of paper after each cut. It is common for students cutting using Method B to count only the number of half-inch strips. They should also be counting the larger piece of paper that they are holding in their hand. For example, after two cuts using Method B, students will have 2 half-inch strips and 1 8.5 by 10 inch piece of paper.
• After students complete Step 2 they no longer need the strips of paper. Have recycling bins or trash cans available for students to discard the paper.
Closing – Activity and Closure
Questions
As a class:
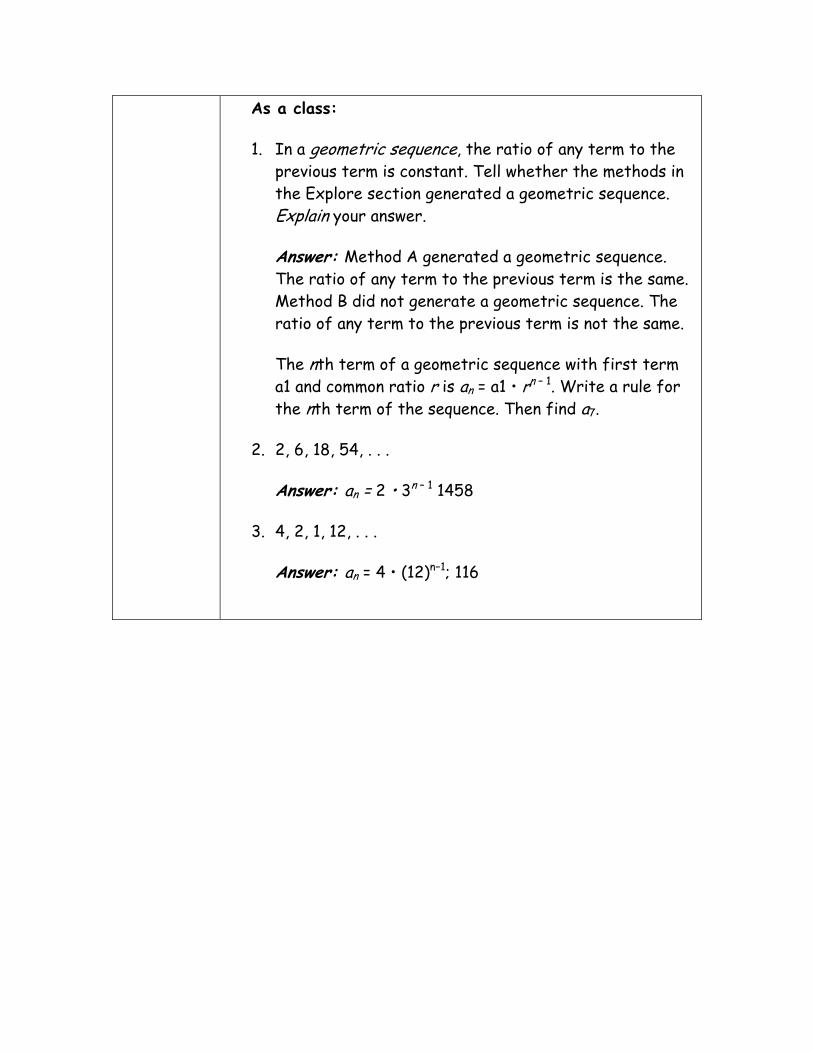
1. In a geometric sequence, the ratio of any term to the previous term is constant. Tell whether the methods in the Explore section generated a geometric sequence. Explain your answer.
Answer: Method A generated a geometric sequence. The ratio of any term to the previous term is the same. Method B did not generate a geometric sequence. The ratio of any term to the previous term is not the same.
The nth term of a geometric sequence with first term a1 and common ratio r is an = a1 • rn – 1. Write a rule for the nth term of the sequence. Then find a7.
2. 2, 6, 18, 54, . . .
Answer: an = 2 • 3n – 1 1458
3. 4, 2, 1, 12, . . .
Answer: an = 4 • (12)n−1; 116

Definition
Geometric Sequences
Characteristics
Examples Non-Examples
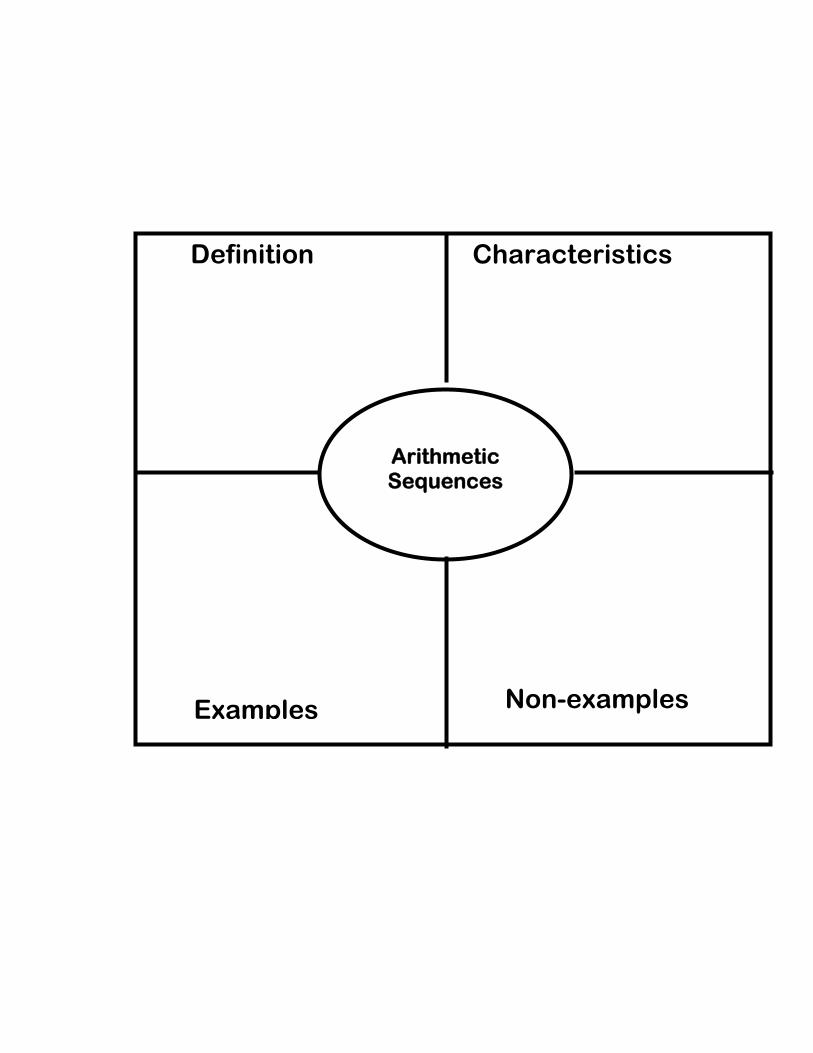
Definition
Arithmetic Sequences
Characteristics
Examples Non-examples

NAME_________________date_______period_____ Activity Comparing Geometric and Arithmetic Sequences QUESTION How do the results of two different methods for cutting a
piece of paper compare? EXPLORE Comparing sequences
STEP 1 Assign methods Your teacher will divide the class into pairs. One person will follow Method A and the other will follow Method B. Decide who will follow which method. Do not start cutting until you get to Step 2.
Method A Method B
1. Cut the paper in half. 1. Cut a thin strip of paper
about a half-inch wide.
2. Stack the halves. Cut the stack in half.
2. Continue cutting strips.
3. Continue stacking and cutting.
STEP 2 Cut paper Turn your piece of paper sideways. Follow the method you were assigned in Step 1. Each time you make a cut, record the total number of pieces of paper in the table. Stop after making 4 cuts.
Number of pieces of
paper Number of
cuts Method A Method B
1
2
3
4
5
6
7

STEP 3 Extend without cutting Copy the data for your partner’s method into your table. Together, look for a pattern in the number of pieces of paper in each column. Use your patterns to complete the table for 5, 6, and 7 cuts without cutting the paper.

Name__________________________ Date____________Class Period_______
DRAW CONCLUSIONS Use your observations to complete these exercise
1. Choose the correct word to complete the statement: In Method A, the number of pieces of paper (doubles, decreases by 1, increases by 1) with each cut.
2. Choose the correct word to complete the statement: In Method B, the number of pieces of paper (doubles, decreases by 1, increases by 1) with each cut.
3. For the sequence formed by Method A, find the following ratios. What do you notice about the ratios? a2/a1, a3/a2, a4/a3, a5/a4
4. Repeat Exercise 3 for the sequence formed by Method B. Are the ratios the same or different?
Use the following information for Exercises 5 and 6.
When the ratio of any term in a sequence to the previous term is constant, the nth term can be found by raising the ratio to the n – 1 power and multiplying the result by the first term.
5. Which of the following is the rule for the nth term of the sequence formed by Method A? A. an = 2 • (1/2)n−1 B. an = 2 + (n – 1) C. an = 2 • 2n – 1
6. What kind of sequence is formed by Method B? Write a rule for the nth term of the sequence.
7. Find a10 using the rule you chose in Exercise 5. 8. Find a10 using the rule you wrote in Exercise 6.

Answer Key A EXPLORE
STEPS 2 AND 3
Number of pieces
Number of cuts Method A Method B
1 2 2
2 4 3
3 8 4
4 16 5
5 32 6
6 64 7
7 128 8
DRAW CONCLUSIONS
1. doubles 2. increases by 1 3. The ratios are all equal. They are all equal to 2. 4. The ratios are all different: 2/3; 3/4; 4/5; 5/6 5. C: an = 2 • 2n – 1 6. arithmetic; an = 2 + (n − 1) 7. 1024 8. 11

Activity and Closure Questions 1. In a geometric sequence, the ratio of any term to the previous term is
constant. Tell whether the methods in the Explore section generated a geometric sequence. Explain your answer.
The nth term of a geometric sequence with first term a1 and common ratio r is an = a1 • rn – 1. Write a rule for the nth term of the sequence. Then find a7.
2. 2, 6, 18, 54, . . .
3. 4, 2, 1, 12, . . .

Supplemental Resource: Name ____________________________ Date _____________ Class Period _________
Activity A 12.1 Exploring Sequences and Series MATERIALS • graph paper • calculator
QUESTION How can you predict values in a sequence?
A sequence is a function whose domain consists of consecutive integers, and whose range consists of values called terms. In a sequence a1, a2, a3, a4,..., an, the notation an refers to the term in the nth position in the sequence.
EXPLORE Find a pattern and write a rule
STEP 1 Find a Pattern
The sequences in the table follow patterns. Determine the pattern that each sequence follows. Then complete the table.
Sequence a1 a2 a3 a4 a5 a6
A 7 11 15 23
B 2 3 5 8
C 22 17 2
D 64 16 8
E 1 √2 2 4
STEP 2 Write a rule

In the table in Step 1, sequence A can be thought of as the function f, where f(1) = 7, f(2) = 11, f(3) = 15, and so on. For sequence A you can write the general function rule f(n) = an = 4(n – 1) + 7.
Write function rules for sequences C and D in the table.
DRAW CONCLUSIONS Use your observations to complete these exercises
1. Use the function rules you found in Step 2 to determine the given term in the sequence.
a. the 20th term in sequence C b. the 11th term in sequence D
2. Find the first term in sequence C that is less than –322. 3. In sequence D, what number do the terms an approach as n increases? 4. Graph the first six terms of sequences A and E. Describe the graphs in terms of
other graphs you are familiar with.
Answer Key A EXPLORE
STEP 1
Sequence a1 a2 a3 a4 a5 a6
A 7 11 15 19 23 27
B 2 3 5 8 12 17
C 22 17 12 7 2 –3
D 64 32 16 8 4 2
E 1 √2 2 2/√2 4 2/√2

STEP 2
Sequence C: 22 – 5(n – 1)
Sequence D: 64 (12)n–1
DRAW CONCLUSIONS
1. a. f(20) = 22 – 5(19) = 22 – 95 = – 73 b. f(11) = 64(12)11–1= 64(12)10= 0.0625
2. Write the inequality –322 > 22 – 5(n – 1). Solving for n, you get n < 69.8 So, the 70th term is the first term less than –322.
3. 0 4. Sequence A:
5. The graph is linear. 6. Sequence E:
7. The graph is exponential.

Teacher Notes ACTIVITY PREPARATION AND MATERIALS
• Pencils, graph paper, and calculators should be distributed if students do not already have them.
ACTIVITY MANAGEMENT
• Students may work in groups of up to 4. If students work in groups, they should determine the terms of each sequence together, instead of assigning a sequence to each member.
• Encourage students to discuss how they might recognize a linear, quadratic, or exponential pattern.
Activity and Closure Questions Ask these questions as a class.
1. Complete the table.
t1 t2 t3 t4 t5
Number of circles 1 3 6
Number of circles added
Answer:
t1 t2 t3 t4 t5
Number of circles 1 3 6 10 15
Number of circles added 1 2 3 4 5

2. Without drawing the figure, determine how many circles are in figure t6. Answer: 21 circles
3. The pattern of growth in the table is most similar to which sequence in Step 1 of the Explore section? Answer: Sequence B.
4. Write a function rule for the sequence 2, 6, 18, 54, 162,... Answer: f(n) = 2 • 3n – 1
LESSON TRANSITION
In this activity students are introduced to sequences as both lists of numbers and functions with integer domains. Students learn to write rules for the nth term in a sequence. In Lesson 12.1, students will review these concepts and learn about series and summation notation.

Name _________________________________________ Date ___________________ Unit 5 Assessment
Piecewise, Exponential and Inverses (Use of scientific calculator is permissible.) 1. 6( )ab a. 7 7a b c. 6a b
b. 6 6a b d. 7 6a b
2.
a. b. c. d.
3.
a. b. c. d.
4. Let 2( ) 5f x x= − and 2( ) 3g x x= . Find g(f(x)).
a. 4 23 30 75x x− + c. 43 5x − b. 43 15x − d. 49 4x −
5. Let 2( ) 4f x x= − and 2( ) 3g x x= − . Find f(g(x)). a. 43 12x− + c. 49 4x − b. 4 23 24 48x x− + − d. 43 4x− −

6. Amy runs at a steady pace on flat ground. When she runs up a hill, her speed decreases to a slower steady pace. Which graph represents this situation?
.
a. Graph A: c. Graph C:
b. Graph B: d. Graph D:
7. Which is an equation for the inverse of the function y = 4x +2?
a. 2 4y x= + c. 24
xy +=
b. 4 24
xy −= d. 2
4xy −
=

8. Which of the following is an equation for the inverse of the function 2( ) 23
f x x= + ?
a. 1 1( )2 3
g x x= + c. 1 3( )2 2
g x x= +
b. 1 1( )2 3
g x x= − d. 1 3( )2 2
g x x= −
9. Which shows the graph of 22 2y x= − and its inverse?
a. c.
b. d.
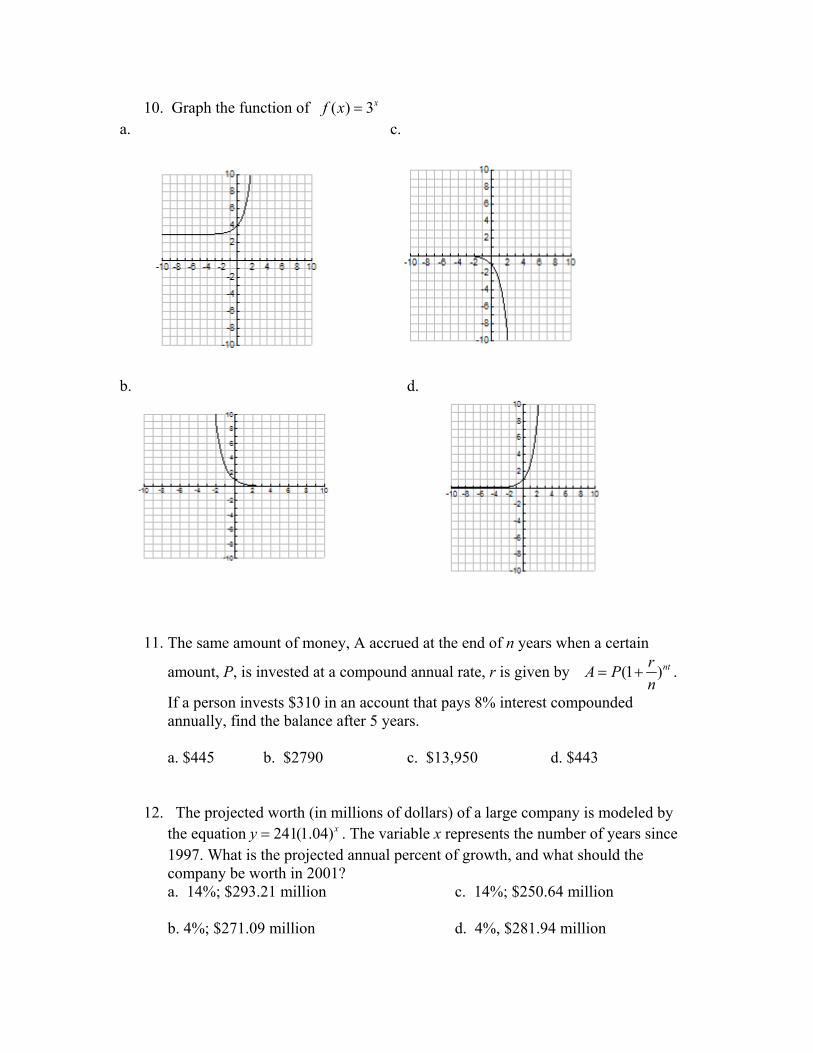
10. Graph the function of ( ) 3xf x = a. c.
b. d.
11. The same amount of money, A accrued at the end of n years when a certain
amount, P, is invested at a compound annual rate, r is given by (1 )ntrA Pn
= + .
If a person invests $310 in an account that pays 8% interest compounded annually, find the balance after 5 years. a. $445 b. $2790 c. $13,950 d. $443
12. The projected worth (in millions of dollars) of a large company is modeled by the equation 241(1.04)xy = . The variable x represents the number of years since 1997. What is the projected annual percent of growth, and what should the company be worth in 2001? a. 14%; $293.21 million c. 14%; $250.64 million b. 4%; $271.09 million d. 4%, $281.94 million

13. Sara brought 6 fish. Every month the number of fish she has doubles. After m
months she have F fish, where 6 2mF = ⋅ . How may fish will Sara have after 2 months if she keeps all of them and the fish stay healthy?
a. 20 b. 10 c. 14 d. 24
14. If there are initially 4000 bacteria in a culture, and the number of bacteria double each hour, the number of bacteria after t hours can be found using the formula
4000(2 )tN = . How many bacteria will be present after 9 hours?
a. 2,048,000 b. 4,096,00 c. 1,024,000 d. 72,000
15. Graph the following function. 1( )4
x
f x ⎛ ⎞= ⎜ ⎟⎝ ⎠
a. c.
b. d.

16. Simplify. 19
6
735
ee
a. 255e b. 1315
e c. 135e d. 2515
e
17. If $2500 is invested at a rate 11% compounded continuously, find the balance in the account after 4 years. Use the formula rtA Pe= .
a. $3795.18 b. $3881.77 c. $4333.13 d. $18472.64
18. The formula 2000 rtA e= can be used to find the dollar value of an investment of $2000 after t years when the interest is compounded continuously at a rate of r percent. Find the value of the investment after 6 years if the interest rate is 7%. Find the investment after 12 years if the interest rate is 8%.
a. $3043.92; $2920 c. $3043.92; $5223.39 b. $4901.85; $52223.39 d. $4901.85; $2920.47
19. Solve for x. 7 61 279
x−=
a. 47
b. 2021
− c. 1621
d. 2021
20. Use composition of functions to determine if the functions f and g below are
inverse of each other?
a. yes b. no

21. Use composition of function to determine if the function f and g below are inverses of each other?
a. yes b. no
22. Which functions below are one-to-one functions?
I. II
a. I only b. II only
c. I and II
d. Neither I nor II
23. What is the domain and range of the function f(x) = 3.2x?
A. domain: all real numbers; range: all positive numbers B. domain: all positive numbers; range: all real numbers
C. domain: all real numbers; range: all real numbers
D. domain: all positive numbers; range: all positive numbers

24. Which of these describes the graph of f(x) = 3x + 4?
A. It has a vertical asymptote at x = 0.
B. It has a vertical asymptote at x = -4.
C. It has a horizontal asymptote at y = 0.
D. It has a horizontal asymptote at y = 4. 25. What is the asymptote of the graph of f(x) = 2x?
A. x-axis
B. y-axis
C. y = 1
D. y = -1 26. How would you translate the graph of f(x) = 5x to produce the graph of
f(x) = 5x – 3?
A. translate the graph of f(x) = 5x left 3 units
B. translate the graph of f(x) = 5x right 3 units
C. translate the graph of f(x) = 5x up 3 units
D. translate the graph of f(x) = 5x down 3 units 27. Write the rule for the geometric sequence below. -6, 24, -96, 384, …
A. an = 24n-1
B. an = -1
23 −n
C. an = -6(-4)n-1
D. an = -6(-41 )n-1

28. What is the base of the exponential function that defines the following geometric sequence? 2, -8, 32, -128, …
A. 4
B. -4
C. 64
D. -64 29. Find the y-intercept of the graph of y = -3(7x) .
A. 4
B. -21
C. -3
D. 7
30. Find the x-intercept and y-intercept of the piecewise function.
3 if 3( )
3 if 3x x
f xx x+ ≥ −⎧ ⎫
= ⎨ ⎬− − < −⎩ ⎭
a. x intercept = -3; y-intercept= -3
b. x-intercept = -3; y-intercept = 3
c. x-intercept = 3; y-intercept = 3
d. x-intercept = 3; y-intercept = -3
31. Over what interval is f(x) increasing?
6 if 6
( )6 if 6x x
f xx x
− ≥⎧ ⎫= ⎨ ⎬− <⎩ ⎭
a. ( ,6)−∞ b. ( , )−∞ ∞ c. [0, )∞ d.[6, )∞

Math II Answer Key with Standards—Unit 5 Assessment
1. B MM2A2a 22. C MM2A5a 2. D MM2A2a 23. A MM2A2b 3. D MM2A5a 24. D MM2A2b 4. A MM2A5d 25. A MM2A2b 5. C MM2A5d 26. D MM2A2c 6. D MM2A1b 27. C MM2A2f 7. D MM2A5b 28. B MM2A2g 8. B MM2A5b 29. C MM2A2b 9. A MM2A5c 30. B MM2A1b 10. D MM2A2c 31. D MM2A1b 11. A MM2A2e 12. D MM2A2e 13. D MM2A2e 14. A MM2A2e 15. A MM2A2c 16. B MM2A2a 17. D MM2A2c 18. B MM2A2e 19. C MM2A2d 20. A MM2A5d 21. A MM2A5d

MATHEMATICS II – Unit 5
Step and Piecewise Functions Part 3 - Inverses Day 1 E. Q. – What are the characteristics of functions and their inverses?
Standard – MM2A5 – Students will explore inverses of functions.
a. Discuss the characteristics of functions and their inverses, including one-to-oneness, domain, and range. c. Explore the graphs of functions and their inverses.
Opening – Introduction to Exploring Inverses of Functions Review previous key vocabulary and new vocabulary K-H-N (Know, How, Now) of Key Vocabulary Model of domain and range: give ordered pairs and demonstrate finding the inverse
Work session –
Find values for function and inverse t-tables Graph function and inverse State domain and range of each Student Worksheet---Graphing the Inverse of a Function
-Choose 4 of the 6 problems -Student choose 1 task from scenario problems list (1,2, or 3)
Closing – Student sharing
Instructions for the Know-How-Now Purpose: Introductory activity to new vocabulary and a review over prior knowledge. Have students pair up and discuss the Know column as a review over previous vocabulary that is pertinent to this section. Give approximately 5 minutes for this section. Students will brainstorm and write mathematically or in word form How the vocabulary is used and How they are interrelated. Introduce the new (Now) vocabulary and possible relationships between it and the old (Know). Once you have completed the training on this standard, then revisit this chart and have students brainstorm on creating a concept map on showing the connections between all the vocabulary, old and new.
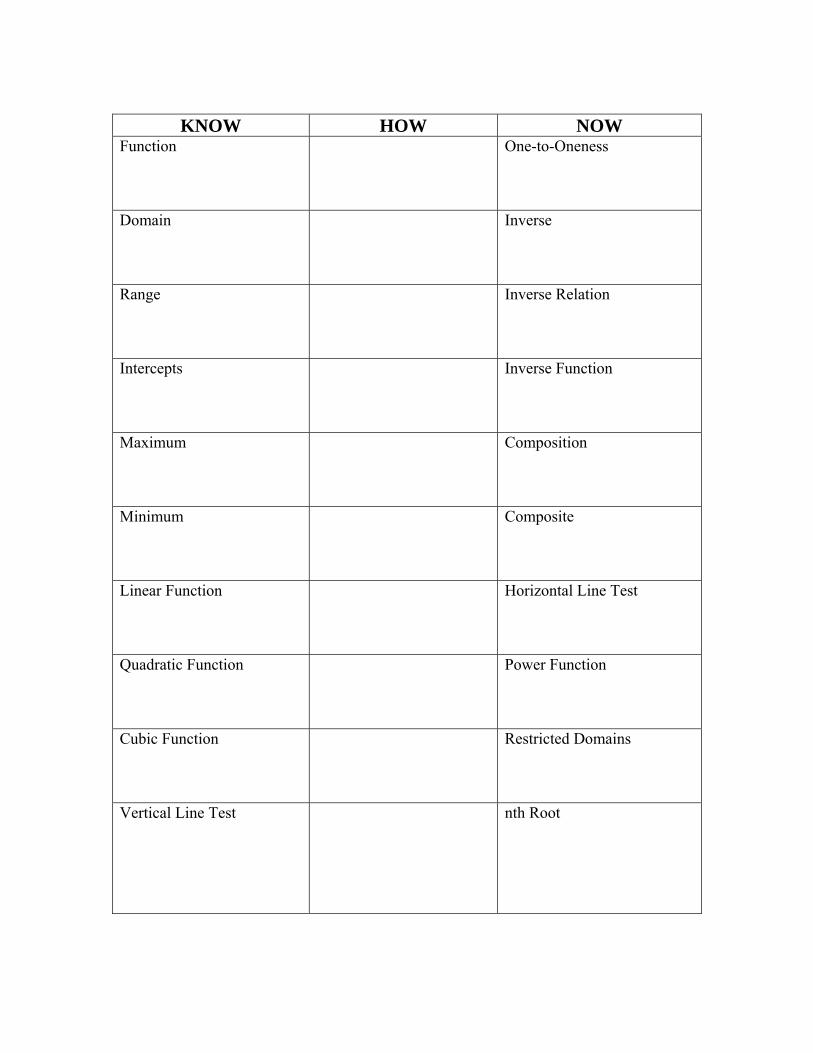
KNOW HOW NOW
Function
One-to-Oneness
Domain
Inverse
Range
Inverse Relation
Intercepts
Inverse Function
Maximum
Composition
Minimum
Composite
Linear Function
Horizontal Line Test
Quadratic Function
Power Function
Cubic Function
Restricted Domains
Vertical Line Test
nth Root

State the Equation - Relation:
Set of ordered pairs Inverse:
Table Mapping Graphing x y x y
x y
Relation Inverse
1. Is the Relation a Function? Explain how you know.
2. Is the Inverse a Function? Explain how you know.

Graphing the Inverse of a Function Create a t-chart for each function and its inverse. Graph each using different colors. 1. f(x) = -5x + 2 Inverse Graph
D: _______ D: ______ R: _______ R: ______ 2. f(x) = 3x + 5 Inverse Graph
D: _______ D: ______ R: _______ R: ______ 3. f(x) = x2 + 2 Inverse Graph
D: _______ D: ______ R: _______ R: ______
X Y
X Y
X Y
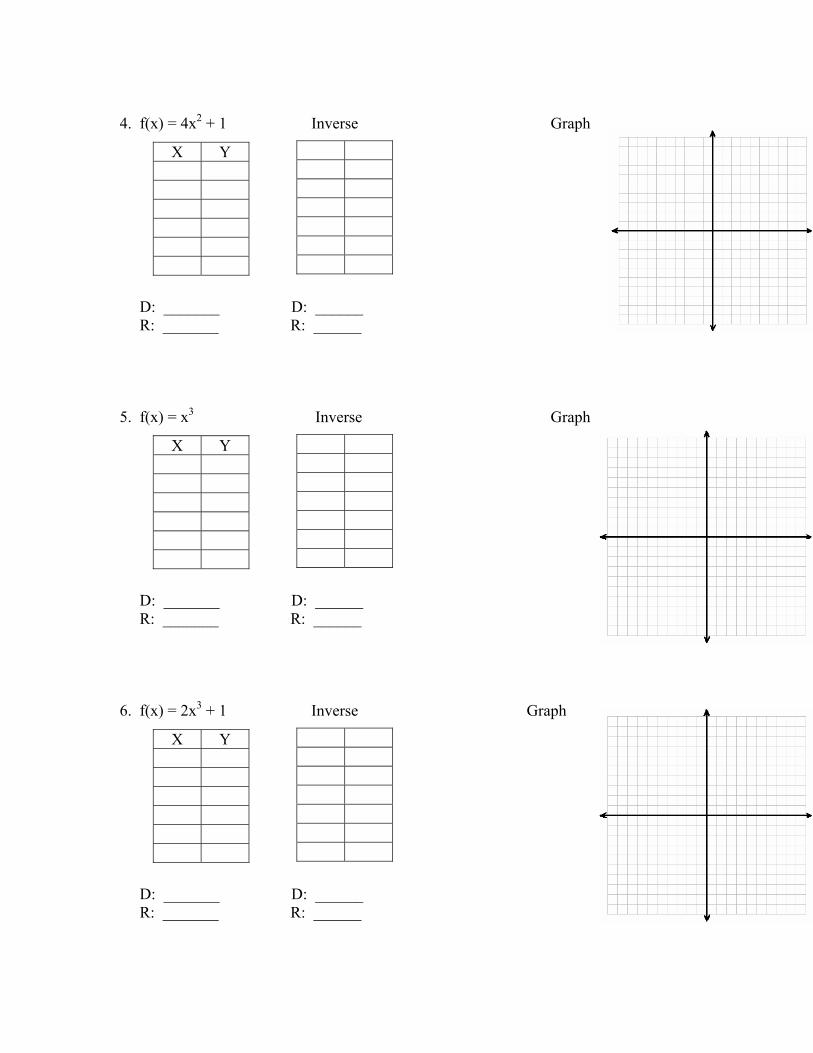
4. f(x) = 4x2 + 1 Inverse Graph
D: _______ D: ______ R: _______ R: ______ 5. f(x) = x3 Inverse Graph
D: _______ D: ______ R: _______ R: ______ 6. f(x) = 2x3 + 1 Inverse Graph
D: _______ D: ______ R: _______ R: ______
X Y
X Y
X Y

Day 2 E. Q. – How do I determine the inverse of linear and quadratic functions?
Standard – MM2A5 – Students will explore inverses of functions.
b. Determine inverses of linear, quadratic, and power functions and functions of the form f(x) = xa, including the use of restricted domains.
Opening – Fingerprints are a function because ….. **Answer: There is a one-to-one relationship between a person and his/her fingerprints. Introduce the process of finding the inverse of linear and quadratic functions. Work examples and use guided practice. Reference inverse Graphic Organizer.
Work session –
Find the inverse of linear and quadratic functions. Student worksheet --- Inverse of Linear and Quadratic Functions
Closing – Ticket Out The Door f(x) = 4x – 5 f(x) = (x – 5)2
`
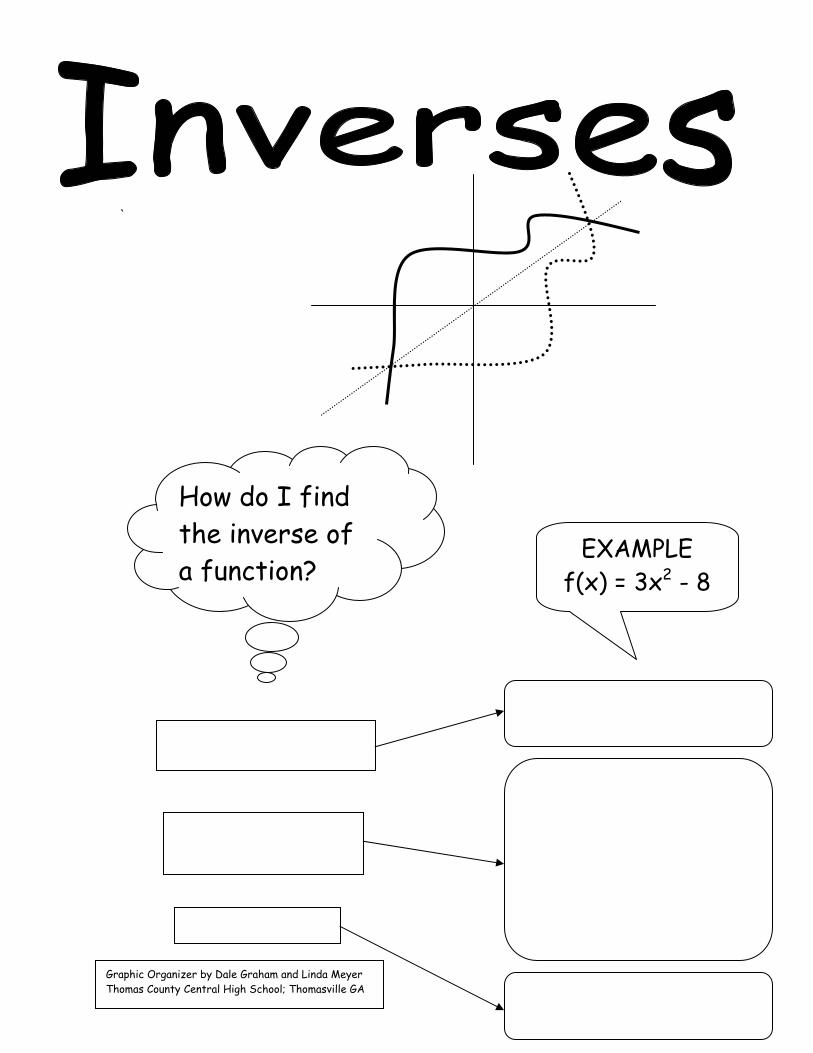
How do I find the inverse of a function?
EXAMPLE f(x) = 3x2 - 8
Graphic Organizer by Dale Graham and Linda Meyer Thomas County Central High School; Thomasville GA

Name ________________________
Inverse of Linear and Quadratic Functions Find the inverse of f(x).
1. f(x) = x
2. f(x) = 6x – 3
3. f(x) = x2 + 2
4. f(x) = (x + 1)2
5. f(x) = 4 – 5x
6. f(x) = 3x – 4
7. f(x) = 5x² - 1
8. f(x) = -x² + 5

Day 3 E. Q. – How do I determine the inverses of power functions?
Standard – MM2A5 – Students will explore inverses of functions.
b. Determine inverses of linear, quadratic, and power functions and functions of the form f(x) = xa, including the use of restricted domains.
Opening – Return and review Ticket Out The Door Introduce the process of finding the inverse of power functions. Work examples and use guided practice.
Work session –
Find the inverse of power functions. Student worksheet --- Inverse of Power Functions
Closing –
Ticket Out The Door f(x) = x4 + 7 f(x) = (2x – 5)3

Name _____________________________
Inverse of Power Functions Find the inverse of f(x).
1. f(x) = 3x4 + 2
2. f(x) = 4x4
3. f(x) = x5
4. f(x) = 4x7
5. f(x) = 5 x 6. f(x) = 5√(x + 2) 7. f(x) = (x – 1)3 + 2 8. f(x) = (x + 5)4
9. f(x) = 8x3 + 5 10. f(x) = x5 + 4

Day 4 E. Q. – What are the characteristics of functions and their inverses, and how do
you find the inverse of linear, quadratic and power functions?
Standard – MM2A5 – Students will explore inverses of functions. a. Discuss the characteristics of functions and their inverses, including one-to-oneness, domain, and range. b. Determine inverses of linear, quadratic, and power functions and functions of the form f(x) = xa, including the use of restricted domains. c. Explore the graphs of functions and their inverses.
Opening – Return and review Ticket Out The Door Review concepts covered on days 1, 2, and 3
Work session –
Quiz --- Inverse of Functions Quiz
Closing – Journal Writing. Answer EQ from days 1,2,3,4.
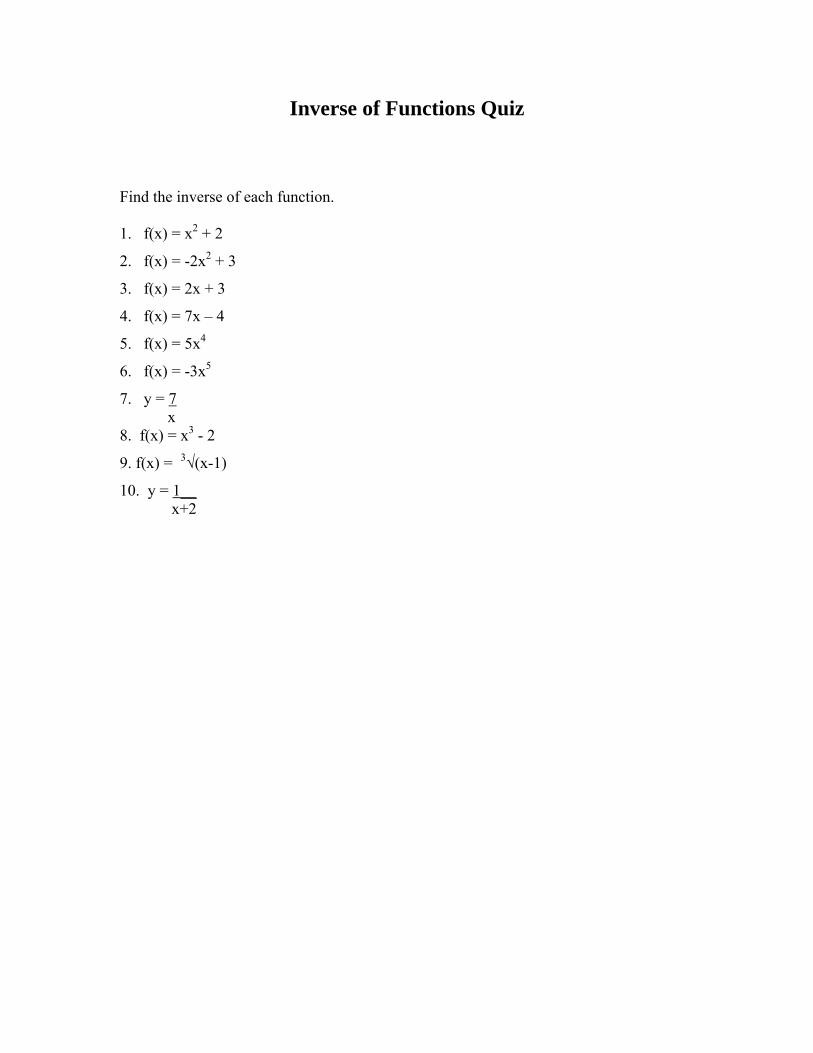
Inverse of Functions Quiz
Find the inverse of each function. 1. f(x) = x2 + 2
2. f(x) = -2x2 + 3
3. f(x) = 2x + 3
4. f(x) = 7x – 4
5. f(x) = 5x4
6. f(x) = -3x5
7. y = 7 x 8. f(x) = x3 - 2
9. f(x) = 3√(x-1)
10. y = 1__ x+2

Day 5 E. Q. – How do I graph functions and their inverses applying the line tests and
determining one-to-one? What is the relationship between the domain and range of a function and its inverse?
Standard – MM2A5 – Students will explore inverses of functions. c. Explore the graphs of functions and their inverses.
Opening – Return and review quiz Review Vertical Line Test and introduce Horizontal Line Test Explain the concept of one-to-one
Work session –
Graph functions and their inverses State domain and range Apply Vertical and Horizontal Line Tests to determine one-to-oneness Student Worksheet --- Exploring Graphs of Functions and their Inverses
Closing – Student Sharing Results from student worksheet.

Name _____________________________ Exploring Graphs of Functions and their Inverses
Graph the following functions. Identify the domain and range. Use the vertical line test to determine if it is a function. 1. f(x) = 2x – 5 2. f(x) = 9x2 – 1
D: __________________ D: __________________ R: __________________ R: __________________ Function? ____________ Function? ____________ 3. f(x) = 3x3 4. f(x) = 4 x
D: __________________ D: __________________ R: __________________ R: __________________ Function? ____________ Function? ____________

Write and graph the inverse of the following functions. Identify the domain and range. Use the horizontal line test to determine if the inverse is a function. 5. f(x) = 3 – 2x 6. f(x) = √x + 3 f’-¹(x) = ____________ f’-¹ (x) = _____________
D:___________________ D:__________________ R: __________________ R: __________________ Function? ____________ Function? ____________ 7. f(x) = 1 8. f(x) = 2x2 - 3 3x f’-¹ (x) = ________________ f’-¹ (x) = ____________________
D: __________________ D: __________________ R: __________________ R: __________________ Function? ____________ Function? ____________

Day 6 E. Q. – How do I find the composition of functions?
Standard – MM2A5 – Students will explore inverses of functions.
d. Use composition to verify that functions are inverses of each other.
Opening – Review solving multi-step equations Introduce composition of functions using explanation and guided practice.
Work session –
Student worksheet --- Composition of Functions
Closing – Ticket Out The Door f(x) = 2x – 5; g(x) = x2 + 1 Find f(g(x)) and g(f(x))

Name _____________________________
Composition of Functions
I. Let f(x) = 5x – 4 and g(x) = 3x. Find the following. a. f(g(x)) b. g(f(x))
II. Let f(x) = 2x + 3 and g(x) = x2 – 1. Find the following
a. f(g(x)) b. g(f(x))
III. Let f(x) = 4x3 and g(x) = 2x4. Find the following. a. f(g(x)) b. g(f(x))
Find f(g(x)) and g(f(x)) for each of the following 1. f(x) = 4x g(x) = x + 6 2. f(x) = x -2 g(x) = x/4 3. f(x) = -3x g(x) = x + 5 4. f(x) = x² g(x) = x – 1 5. f(x) = 0.5x g(x) = 2x 6. f(x) = x² g(x) = x³ 7. f(x) = 3x + 1 g(x) = x² - 1 8. f(x) = 7x – 3 g(x) = 5x² - 8

Day 7 E. Q. – How do I use composition of functions to verify that functions are
inverses of each other?
Standard – MM2A5 – Students will explore inverses of functions. d. Use composition to verify that functions are inverses of each other.
Opening – Return and review Ticket Out The Door Review composition of functions and explain how to use composition of functions to verify one-to-one Introduce f-1 as the symbol of the inverse of a function
Work session –
Algebraically verify that the function and its inverse have one-to-one. Continue practicing composition of functions using technology
-Task 4 from scenario problems Student worksheet --- Using composition to verify one-to-one
-Choose 5 of the 10 Closing – Teacher questioning

Using Composition to Verify One-to-Oneness Verify algebraically that the following functions are one-to-one. 1. f(x) = 5x + 2 f -1(x) = x - 1
5 2. f(x) = 2x-1 f -1(x) = 2x + 1 4 2 3. f(x) = 2x² + 1 f -1(x) = + √(x-1) √(2) 4. f(x) = 1x f -1(x) = 3x 3 5. f(x) = √(2x + 5) f -1(x) = x² - 5 2 2 6. f(x) = 5√(5x + 4) f -1(x) = x5 – 4 5 7. f(x) = 3x4 + 1 f -1(x) = 4√(x – 1) √3 8. f(x) = 4x3 – 5 f -1(x) = 3√(x +5) √(4) 9. f(x) = (x + 1)² f -1(x) = √(x – 1) 10. f(x) = 4x7 f -1(x) = 7√(x) √(4)

Day 8 E. Q. – How will students explore inverses of functions?
Standard – MM2A5 – Students will explore inverses of functions.
a. Discuss the characteristics of functions and their inverses, including one-to-oneness, domain, and range. b. Determine inverses of linear, quadratic, and power functions and functions of the form f(x) = xa, including the use of restricted domains. c. Explore the graphs of functions and their inverses. d. Use composition to verify that functions are inverses of each other.
Opening – Work EOCT problems Review topics covered on days 1 – 7
Work session –
Culminating activity
Closing – Each group will summarize different parts of the activity
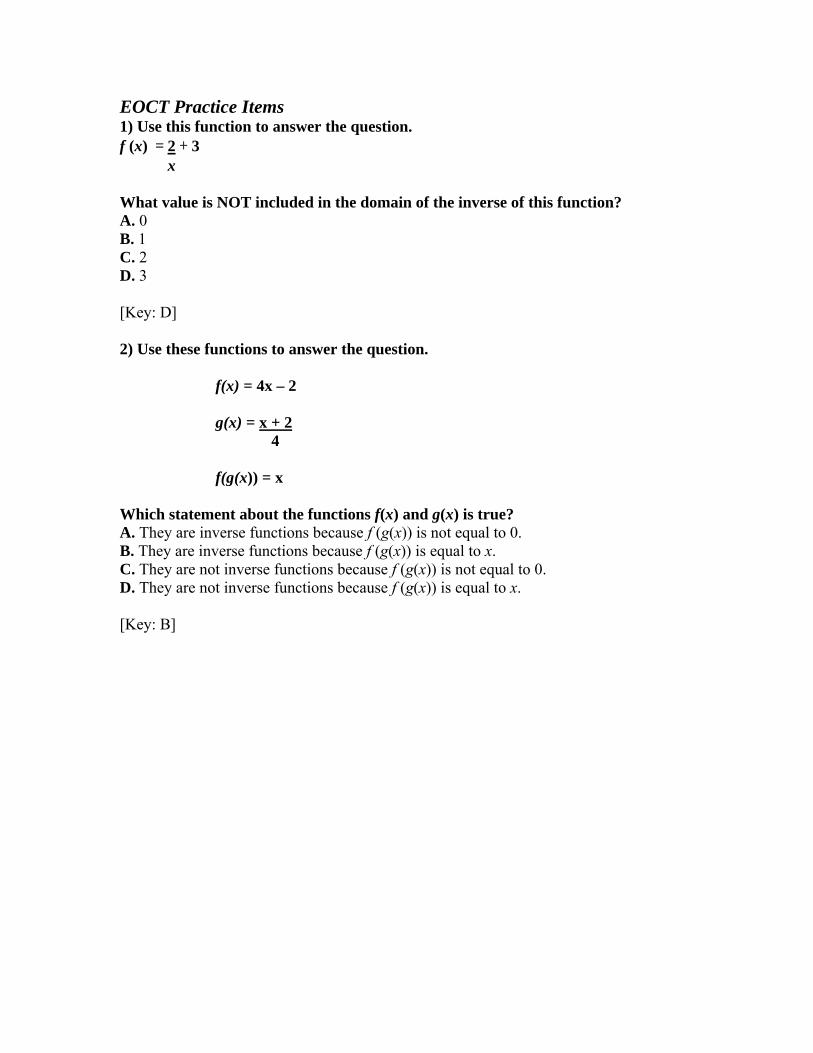
EOCT Practice Items 1) Use this function to answer the question. f (x) = 2 + 3
x What value is NOT included in the domain of the inverse of this function? A. 0 B. 1 C. 2 D. 3 [Key: D] 2) Use these functions to answer the question. f(x) = 4x – 2 g(x) = x + 2 4 f(g(x)) = x Which statement about the functions f(x) and g(x) is true? A. They are inverse functions because f (g(x)) is not equal to 0. B. They are inverse functions because f (g(x)) is equal to x. C. They are not inverse functions because f (g(x)) is not equal to 0. D. They are not inverse functions because f (g(x)) is equal to x. [Key: B]

Name __________________ Date _____________
Class Period _____
Activity Exploring Inverse Functions
MATERIALS • graph paper • straightedge QUESTION How are a function and its inverse related?
EXPLORE Find the inverse of f(x) = x − 32
.
STEP 1 Graph function
Choose values of x and find the corresponding values of y = f(x). Plot the points and draw the line that passes through them.
STEP 2 Interchange coordinates
Interchange the x- and y-coordinates of the ordered pairs found in Step 1. Plot the new points and draw the line that passes through them.
STEP 3 Write equation
Write an equation of the line from Step 2. Call this function g.
STEP 4 Compare graphs
Fold your graph paper so that the graphs of f and g coincide. How are the graphs geometrically related?
STEP 5 Describe functions
In words, f is the function that subtracts 3 from x and then divides the result by 2. Describe the function g in words.
STEP 6 Find compositions
Predict what the compositions f(g(x)) and g(f(x)) will be. Confirm your predictions by finding f(g(x)) and g(f(x)).
The functions f and g are called inverses of each other.

Name __________________
Date _____________ Class Period _____
DRAW CONCLUSIONS
Use your observations to complete these exercises
Complete Exercises 1–3 for each function below.
f(x)= 2 5x − f(x)= x −1
6 f(x)= 432
− x .
1. Complete Steps 1–3 above to find the inverse of the function.
2. Complete Step 4. How can you graph the inverse of a function without first finding ordered pairs (x, y)?
3. Complete Steps 5 and 6. How can you test to see if the function you found in Exercise 1 is indeed the inverse of the original function?

Name __________________ Date _____________
Class Period _____
GRAPH PAPER

Answer Key DRAW CONCLUSIONS
1. g(x) = x − 23
, g(x) = 6 1x + , g(x) = 432
−− x
2. Reflect the graph of f in the line y = x. 3. Find the compositions f(g(x)) and g(f(x)). If they both equal x, then they are
inverses of each other.
Teacher Notes ACTIVITY PREPARATION AND MATERIALS
• Have one student pass out 4 pieces of graph paper to each student or group of students. Have another student pass out the straightedges.
ACTIVITY MANAGEMENT
• You can also have students use the table feature of a graphing calculator to
choose several points on the graph of f(x)= x − 32
.
• Using colored pencils to draw their lines may help students distinguish between the two graphs.
• Tell students to be sure to draw their graphs dark enough so that they can align them properly when they fold their papers.
• Common Error As you check students’ work, make sure that they have correctly identified the equation of the second line they graphed. Otherwise, their answers to Step 5 and Step 6 will be incorrect.
• A-Level Alternative Have all students use –3, 0, and 3 as the values of x in Step 1. After completing this step, have students compare their work to a classmate’s work, which should look exactly the same.
• C-Level Alternative What is the equation of the line that lies along the fold in your paper? Students should discover that this line is y = x. Why does it make sense that the graph of a function and its inverse are reflected in this line? Students should be able to state that the function y = x is its own inverse.
Activity and Closure Questions Discuss these questions as a class.
1. What is the equation of the line that lies along the fold of your paper?
• Answer: y = x
2. If (a, b) is a solution of a function f, what point is a solution of the inverse of f?
• Answer: (b, a)
3. Write an equation in slope-intercept form for the inverse of the function y = ax + b.
• Answer: y=x−ba .
4. Describe the relationship between the intercepts of a function f and its inverse g.
• Answer: The y-intercept of f is the x-intercept of g and the x-intercept of f is the y-intercept of g.
5. Where does the intersection of a linear function and its inverse always lie?
• Answer: on the line y = x
LESSON TRANSITION
In this activity students fold paper to discover that a function and its inverse are reflections in the line y = x. They learn to generate the inverse of a function by interchanging the x- and y-variables. Finally, they see that the composition of inverse functions is the identity function. Students learn that the property they explored in Step 6 defines inverse functions. They practice reflecting functions in the line y = x, and apply inverse functions to real-world problems.

Scenario Problems Task 1 – Finding the Inverse The tenth-grade class officers at Columbus High School want to have a special event to welcome the incoming ninth-grade students for $1500, they can rent the Big Ten Entertainment Center for an evening. Table 1
Price P (dollars) Ticket Sales Needed (n)
1 1500 3 500 6 250 9 167 12 125 15 100
1. Identify domain and range. Create Graph. 2. Look for a pattern and write a rule. 3. What if one input value has 2 output values? Justify your decision. 4. Is the given relation a function? Provide support for your decision. 5. Write the inverse of the function. Make a table. 6. Graph the table. 7. Use the vertical line test and tell whether it is a function or not. Justify your answer.

Task 2 – Finding the Inverse Why do they taste different?
Substance Ph Level Hand Soap 10 Egg White 9 Sea Water 8 Pure Water 7
White Bread 6 Coffee 5
Tomato Juice 4 Orange Juice 3
1. Identify domain and range. Create Graph. 2. What if one input value has 2 output values? Justify your decision. 3. Is the given relation a function? Provide support for your decision. 4. Write the inverse of the function. Make a table. 5. Graph the table. 6. Use the vertical line test and tell whether it is a function or not. Justify your answer.

Task 3 – Finding the Inverse The function f(x) = 25x + 40 gives the total cost of hiring a disc hockey for x hours. What is the inverse of this function? 1. Make a table. 2. Identify domain and range. 3. Write the ordered pairs and graph them. 4. Is this relation a function? Provide support for your decision. (Hint: Vertical Line Test) 5. Write the inverse of this function using a table. 6. Identify domain and range. 7. Write the ordered pairs and graph them. 8. Is this inverse relation a function? Justify your answer. (Hint: Horizontal Line Test)
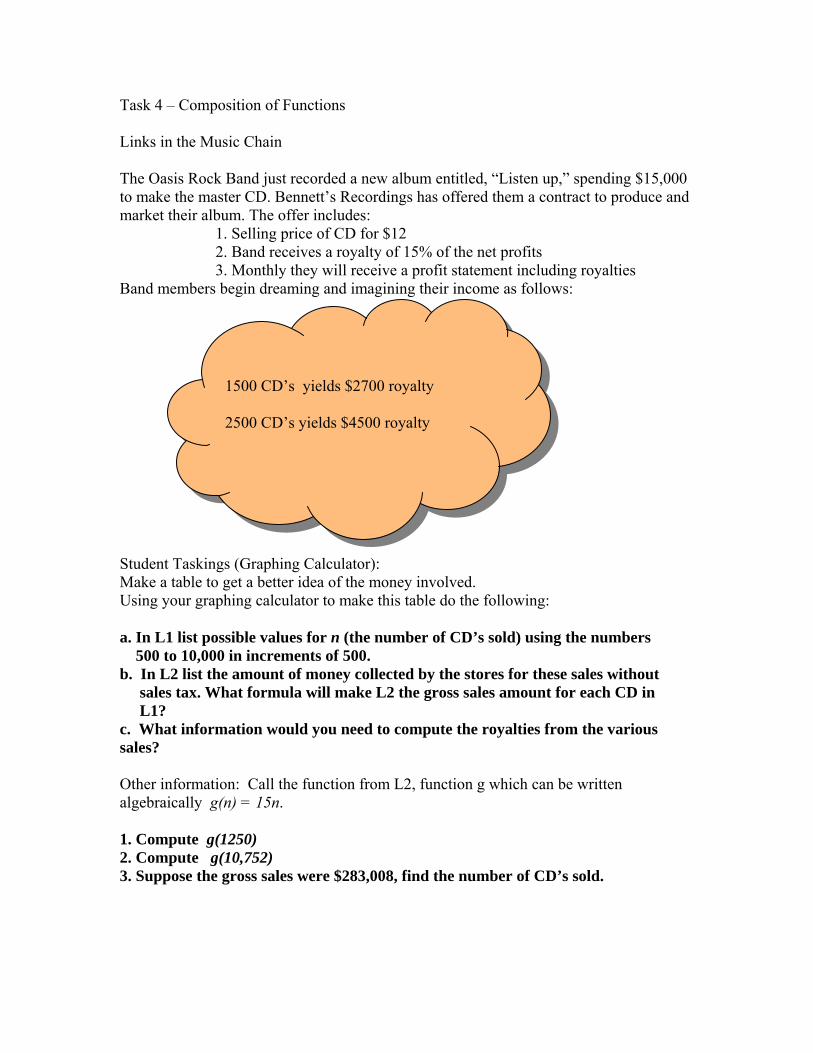
Task 4 – Composition of Functions Links in the Music Chain The Oasis Rock Band just recorded a new album entitled, “Listen up,” spending $15,000 to make the master CD. Bennett’s Recordings has offered them a contract to produce and market their album. The offer includes: 1. Selling price of CD for $12 2. Band receives a royalty of 15% of the net profits 3. Monthly they will receive a profit statement including royalties Band members begin dreaming and imagining their income as follows: Student Taskings (Graphing Calculator): Make a table to get a better idea of the money involved. Using your graphing calculator to make this table do the following: a. In L1 list possible values for n (the number of CD’s sold) using the numbers 500 to 10,000 in increments of 500. b. In L2 list the amount of money collected by the stores for these sales without sales tax. What formula will make L2 the gross sales amount for each CD in L1? c. What information would you need to compute the royalties from the various sales? Other information: Call the function from L2, function g which can be written algebraically g(n) = 15n. 1. Compute g(1250) 2. Compute g(10,752) 3. Suppose the gross sales were $283,008, find the number of CD’s sold.
1500 CD’s yields $2700 royalty 2500 CD’s yields $4500 royalty

One year later, the CD is now on the market and your band gets the first order. In the first month, 2658 CD’s have been sold, but the check amount is only $1435.32. The band believes they have been shortchanged and call the recording company. Bennett’s Recordings instructs the band to check their contract in the fine print for:
Retail stores get 40 % discount – forcing wholesale price to be 60% of the list price
Distributor gets 25% discount Net sales price is the remaining 75% of the wholesale price Band’s royalty is 15% of the net sales price
Remember that each of these 3 steps represent a function.
Wholesale can be represented by the function w(x) where x represents the gross sales
o Function is: w(x) = 0.6x Net sales can be represented by s(x) where x represents the wholesale
amount o Function is: s(x) = 0.75x
The royalty is represented by r(x) where x represents the net sales amount o Function is: r(x) = 0.1x
Using your graphing calculators conduct the following exercises to represent the composition of sales functions. 1. In L3, enter your wholesale formula that corresponds to gross sales amount in L2. 2. Information from L1 and L2 represent the gross sale function g. What function does correspondence between L1 and L3 represent? Write it as a formula. 3. In L4, enter the formula for the net sales corresponding to the wholesale amounts in L3. What function does this formula represent? 4. What function does the correspondence between L1 and L4 represent? Write it as a formula. 5. In L5, enter a formula to compute the royalty amounts that correspond to the net sales amount in L4. What function does this formula represent? 6. What function does the correspondence between L1 and L5 represent? Write it as a formula. 7. If 4500 CD’s are sold, how much royalty money should the band receive? What if 9000 CD’s were sold? Explain how you interpreted your responses from the calculators. 8. If 42,367 CD’s are sold, how much royalty money does the band receive? Explain how to get the answer without entering new data into the list. (Hint: Look at your answer for question 6). The activity is an example of using function compositions in utilizing spreadsheets, in a calculator, for examining links of composition calculations. The royalty function utilized in this scenario is an example of combining multiple functions into one more efficient function.