Embed Size (px)
Citation preview
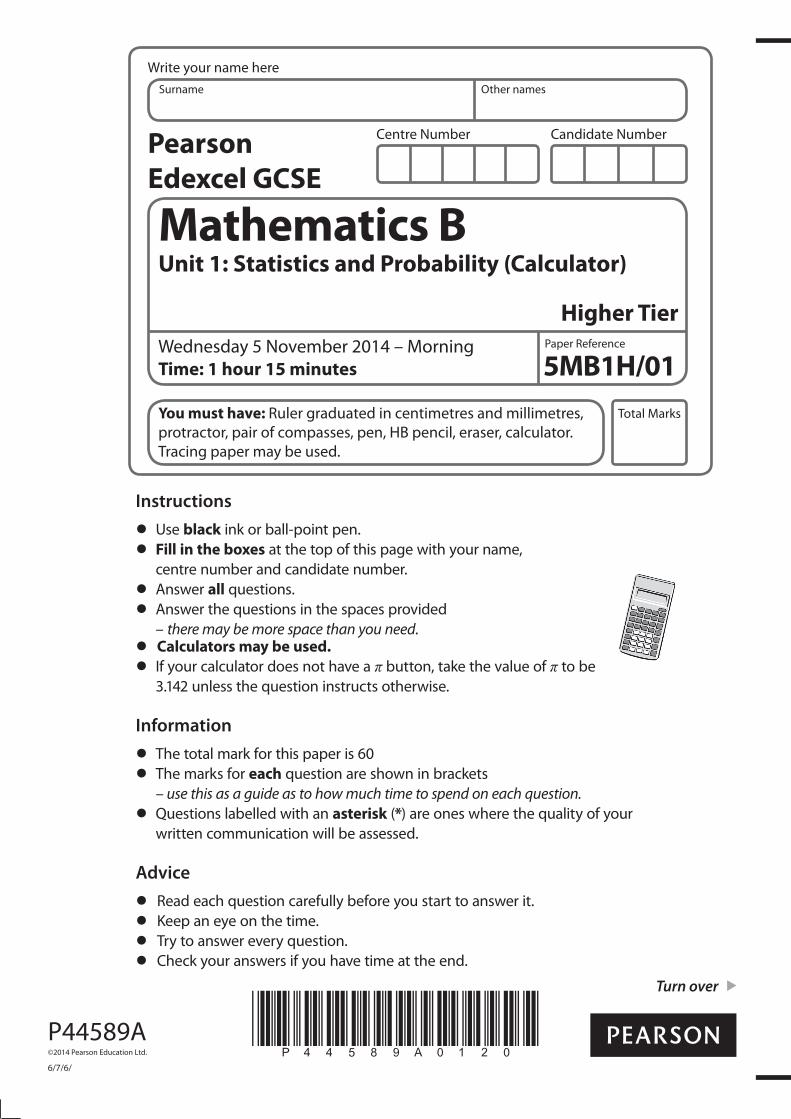
Centre Number Candidate Number
Write your name hereSurname Other names
Total Marks
Turn over
Paper Reference
P44589A©2014 Pearson Education Ltd.
6/7/6/
*P44589A0120*
Mathematics BUnit 1: Statistics and Probability (Calculator)
Higher Tier
Wednesday 5 November 2014 – MorningTime: 1 hour 15 minutes 5MB1H/01
You must have: Ruler graduated in centimetres and millimetres, protractor, pair of compasses, pen, HB pencil, eraser, calculator. Tracing paper may be used.
Instructions Use black ink or ball-point pen. Fill in the boxes at the top of this page with your name,
centre number and candidate number. Answer all questions. Answer the questions in the spaces provided
– there may be more space than you need. Calculators may be used.
If your calculator does not have a button, take the value of to be 3.142 unless the question instructs otherwise.
Information The total mark for this paper is 60 The marks for each question are shown in brackets
– use this as a guide as to how much time to spend on each question. Questions labelled with an asterisk (*) are ones where the quality of your
written communication will be assessed.
Advice Read each question carefully before you start to answer it. Keep an eye on the time. Try to answer every question. Check your answers if you have time at the end.
Pearson
Edexcel GCSE

2
*P44589A0220*
GCSE Mathematics 2MB01
Formulae: Higher Tier
You must not write on this formulae page.Anything you write on this formulae page will gain NO credit.
Volume of prism = area of cross section × length Area of trapezium = 12
(a + b)h
Volume of sphere = 43
3 Volume of cone = 13
2h
Surface area of sphere = 4 2 Curved surface area of cone =
In any triangle ABC The Quadratic Equation The solutions of ax2 + bx + c = 0
where 0, are given by
xb b ac
a=
− ± −( )2 42
Sine Rule aA
bB
cCsin sin sin
= =
Cosine Rule a2 = b2 + c2 – 2bc cos A
Area of triangle = 12
ab sin C
length
sectioncross
b
a
h
rl
r
h
C
ab
c BA

3
*P44589A0320* Turn over
Answer ALL questions.
Write your answers in the spaces provided.
You must write down all stages in your working.
1 Here are the heights, in centimetres, of 15 children.
123 147 135 150 147
129 148 149 125 137
133 138 133 130 151
Show this information in an ordered stem and leaf diagram.
(Total for Question 1 is 3 marks)

4
*P44589A0420*
2 Tendai is doing a survey to find out how often people travel by bus. She is going to ask 10 women leaving a railway station.
(a) This may not produce a good sample for Tendai’s survey. Give 2 reasons why.
Reason 1 . . . . . . . . . . . . . . . . . . . . . . . . . . . . . . . . . . . . . . . . . . . . . . . . . . . . . . . . . . . . . . . . . . . . . . . . . . . . . . . . . . . . . . . . . . . . . . . . . . . . . . . . . . . . . . . . . . . . . . . . . . . . . . . . . . . . . . . . . . . . . . . . . . . . . . . . . . . . . . . . . . . . . . . . . . . . . . . . . . . . . . . . . . . . . . . . . . . . . . . . . . . . . . . . . . . . . . . . . . . .
. . . . . . . . . . . . . . . . . . . . . . . . . . . . . . . . . . . . . . . . . . . . . . . . . . . . . . . . . . . . . . . . . . . . . . . . . . . . . . . . . . . . . . . . . . . . . . . . . . . . . . . . . . . . . . . . . . . . . . . . . . . . . . . . . . . . . . . . . . . . . . . . . . . . . . . . . . . . . . . . . . . . . . . . . . . . . . . . . . . . . . . . . . . . . . . . . . . . . . . . . . . . . . . . . . . . . . . . . . . . . . . . . . . . . . . . . . . . . . . . . .
. . . . . . . . . . . . . . . . . . . . . . . . . . . . . . . . . . . . . . . . . . . . . . . . . . . . . . . . . . . . . . . . . . . . . . . . . . . . . . . . . . . . . . . . . . . . . . . . . . . . . . . . . . . . . . . . . . . . . . . . . . . . . . . . . . . . . . . . . . . . . . . . . . . . . . . . . . . . . . . . . . . . . . . . . . . . . . . . . . . . . . . . . . . . . . . . . . . . . . . . . . . . . . . . . . . . . . . . . . . . . . . . . . . . . . . . . . . . . . . . . .
Reason 2 . . . . . . . . . . . . . . . . . . . . . . . . . . . . . . . . . . . . . . . . . . . . . . . . . . . . . . . . . . . . . . . . . . . . . . . . . . . . . . . . . . . . . . . . . . . . . . . . . . . . . . . . . . . . . . . . . . . . . . . . . . . . . . . . . . . . . . . . . . . . . . . . . . . . . . . . . . . . . . . . . . . . . . . . . . . . . . . . . . . . . . . . . . . . . . . . . . . . . . . . . . . . . . . . . . . . . . . . . . . .
. . . . . . . . . . . . . . . . . . . . . . . . . . . . . . . . . . . . . . . . . . . . . . . . . . . . . . . . . . . . . . . . . . . . . . . . . . . . . . . . . . . . . . . . . . . . . . . . . . . . . . . . . . . . . . . . . . . . . . . . . . . . . . . . . . . . . . . . . . . . . . . . . . . . . . . . . . . . . . . . . . . . . . . . . . . . . . . . . . . . . . . . . . . . . . . . . . . . . . . . . . . . . . . . . . . . . . . . . . . . . . . . . . . . . . . . . . . . . . . . . .
. . . . . . . . . . . . . . . . . . . . . . . . . . . . . . . . . . . . . . . . . . . . . . . . . . . . . . . . . . . . . . . . . . . . . . . . . . . . . . . . . . . . . . . . . . . . . . . . . . . . . . . . . . . . . . . . . . . . . . . . . . . . . . . . . . . . . . . . . . . . . . . . . . . . . . . . . . . . . . . . . . . . . . . . . . . . . . . . . . . . . . . . . . . . . . . . . . . . . . . . . . . . . . . . . . . . . . . . . . . . . . . . . . . . . . . . . . . . . . . . . .
(2)
(b) Design a suitable question for Tendai to use on a questionnaire to find out the number of times people travel by bus.
(2)
(Total for Question 2 is 4 marks)

5
*P44589A0520* Turn over
3 Dan, Harry and Regan sell cars.
Dan sells x cars. Harry sells 5 more cars than Dan. Regan sells twice as many cars as Dan.
Write an expression, in terms of x, for the mean number of cars Dan, Harry and Regan sell.
. . . . . . . . . . . . . . . . . . . . . . . . . . . . . . . . . . . . . . . . . . . . .
(Total for Question 3 is 2 marks)

6
*P44589A0620*
4 The table shows information about the heights, in centimetres, of 30 sunflower plants.
Height(h centimetres) Frequency
100 < h 120 2
120 < h 140 6
140 < h 160 7
160 < h 180 12
180 < h 200 3
(a) On the grid, draw a frequency polygon for this information.
(2)
(b) Write down the modal class interval.
.. . . . . . . . . . . . . . . . . . . . . . . . . . . . . . . . . . . . . . . . . . . .
(1)
(Total for Question 4 is 3 marks)
15
10
5
0
Frequency
100 120 140 160 180 200Height (h centimetres)

7
*P44589A0720* Turn over
5 There are only red counters, yellow counters, blue counters and green counters in a bag. Olu takes at random a counter from the bag.
The table shows each of the probabilities.
Colour Red Yellow Blue Green
Probability 0.6 0.25 2x x
The probability that Olu will take a blue counter is twice the probability that he will take a green counter.
(a) Work out the value of x.
. . . . . . . . . . . . . . . . . . . . . . . . . . . . . . . . . . . . . . . . . . . . .
(3)
Olu takes a counter from the bag. He writes down the colour of the counter. He puts the counter back in the bag.
Olu does this 50 times.
(b) Work out an estimate for the number of times that Olu takes a red counter from the bag.
.. . . . . . . . . . . . . . . . . . . . . . . . . . . . . . . . . . . . . . . . . . . .
(2)
(Total for Question 5 is 5 marks)

8
*P44589A0820*
6 Nick has 2 cars. Car A uses petrol. Car B uses diesel.
Petrol costs £1.39 per litre. Diesel costs £1.47 per litre.
The table below shows the average distance that Nick can drive each car using 1 litre of fuel.
Car A 10.3 miles per litre of petrol
Car B 14.6 miles per litre of diesel
Nick is going on a journey in one of his cars. The distance Nick is going to drive is 450 miles.
Work out the difference of the total costs of the fuel for the 2 cars for this journey.
£.. . . . . . . . . . . . . . . . . . . . . . . . . . . . . . . . . . . . . . . . . . . .
(Total for Question 6 is 4 marks)

9
*P44589A0920* Turn over
7 60 children go to a nursery. The ratio of girls to boys is 3 : 2
The children go to the nursery either in the morning or in the afternoon.
34
of the children go to the nursery in the morning.
The rest of the children go to the nursery in the afternoon.
7 boys go to the nursery in the afternoon.
Work out how many girls go to the nursery in the morning.
.. . . . . . . . . . . . . . . . . . . . . . . . . . . . . . . . . . . . . . . . . . . .
(Total for Question 7 is 5 marks)

10
*P44589A01020*
8 Kelvin and Mamady are in the same class. The probability that Kelvin arrives on time is 0.7 The probability that Mamady arrives on time is 0.9
Complete the probability tree diagram.
(Total for Question 8 is 2 marks)
Not on time
On time
Not on time
Not on time
On time
Mamady
. . . . . . . . . . . . . . . . . . . . . . .
. . . . . . . . . . . . . . . . . . . . . . .
. . . . . . . . . . . . . . . . . . . . . . .
. . . . . . . . . . . . . . . . . . . . . . .
. . . . . . . . . . . . . . . . . . . . . . .
. . . . . . . . . . . . . . . . . . . . . . .
On time
Kelvin

11
*P44589A01120* Turn over
9 The scatter graph shows information about 10 newborn babies. It shows each baby’s body length and head circumference.
Another baby has a body length of 47 cm and head circumference 34 cm.
(a) Show this information on the scatter graph.(1)
(b) What type of correlation does the scatter graph show?
... . . . . . . . . . . . . . . . . . . . . . . . . . . . . . . . . . . . . . . . .
(1) A baby has head circumference 35 cm.
(c) Estimate the body length of this baby.
.. . . . . . . . . . . . . . . . . . . . . . . . . . . . . . . . . . . . . . . . . . cm(2)
(Total for Question 9 is 4 marks)
38
37
36
35
34
33
3244 46 48 50 52 54
Body length (cm)
Head circumference (cm)
56

12
*P44589A01220*
10 Mason invests £1500 at 2.5% per year compound interest. Work out the value of Mason’s investment at the end of 3 years.
£.. . . . . . . . . . . . . . . . . . . . . . . . . . . . . . . . . . . . . . . . . .
(Total for Question 10 is 3 marks)

13
*P44589A01320* Turn over
11* Tina went on a cycling holiday. For the first 5 days, Tina cycled a mean distance of 55 kilometres per day.
On the sixth day, Tina cycled 50 kilometres.
Andy says,
“for all 6 days, the mean distance that Tina cycled per day was 52.5 kilometres”.
Is Andy correct? You must show your working.
(Total for Question 11 is 4 marks)

14
*P44589A01420*
12 60 people took a driving theory test.
The cumulative frequency graph shows information about their test scores.
(a) Use the graph to find an estimate for the median test score.
.. . . . . . . . . . . . . . . . . . . . . . . . . . . . . . . . . . . . . . . . . .
(1)
People pass the test when their test score is 43 or more.
(b) Find an estimate for the number of these people who passed the test.
. . . . . . . . . . . . . . . . . . . . . . . . . . . . . . . . . . . . . . . . . . .
(2)
60
50
40
30
20
10
10 20 30 40 500
Cumulative frequency
Test score
0
15
*P44589A01520* Turn over
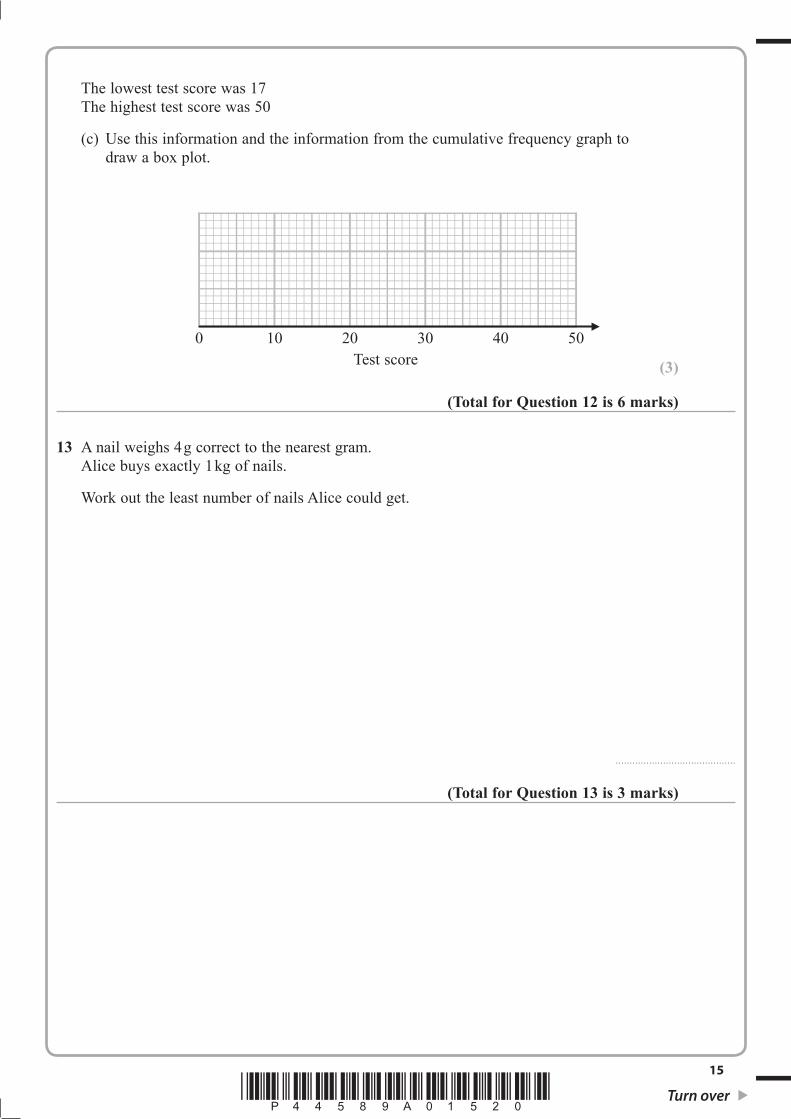
The lowest test score was 17 The highest test score was 50
(c) Use this information and the information from the cumulative frequency graph to draw a box plot.
(3)
(Total for Question 12 is 6 marks)
13 A nail weighs 4g correct to the nearest gram. Alice buys exactly 1kg of nails.
Work out the least number of nails Alice could get.
.. . . . . . . . . . . . . . . . . . . . . . . . . . . . . . . . . . . . . . . . . .
(Total for Question 13 is 3 marks)
0 10 20 30 40 50Test score
16
*P44589A01620*
14 (a) Explain what is meant by a stratified sample.
.. . . . . . . . . . . . . . . . . . . . . . . . . . . . . . . . . . . . . . . . . . . . . . . . . . . . . . . . . . . . . . . . . . . . . . . . . . . . . . . . . . . . . . . . . . . . . . . . . . . . . . . . . . . . . . . . . . . . . . . . . . . . . . . . . . . . . . . . . . . . . . . . . . . . . . . . . . . . . . . . . . . . . . . . . . . . . . . . . . . . . . . . . . . . . . . . . . . . . . . . . . . . . . . . . . . . . . . . . . . . . . . . . . . . . . . . . . . . . . . . .
. . . . . . . . . . . . . . . . . . . . . . . . . . . . . . . . . . . . . . . . . . . . . . . . . . . . . . . . . . . . . . . . . . . . . . . . . . . . . . . . . . . . . . . . . . . . . . . . . . . . . . . . . . . . . . . . . . . . . . . . . . . . . . . . . . . . . . . . . . . . . . . . . . . . . . . . . . . . . . . . . . . . . . . . . . . . . . . . . . . . . . . . . . . . . . . . . . . . . . . . . . . . . . . . . . . . . . . . . . . . . . . . . . . . . . . . . . . . . . . . . .
(1)
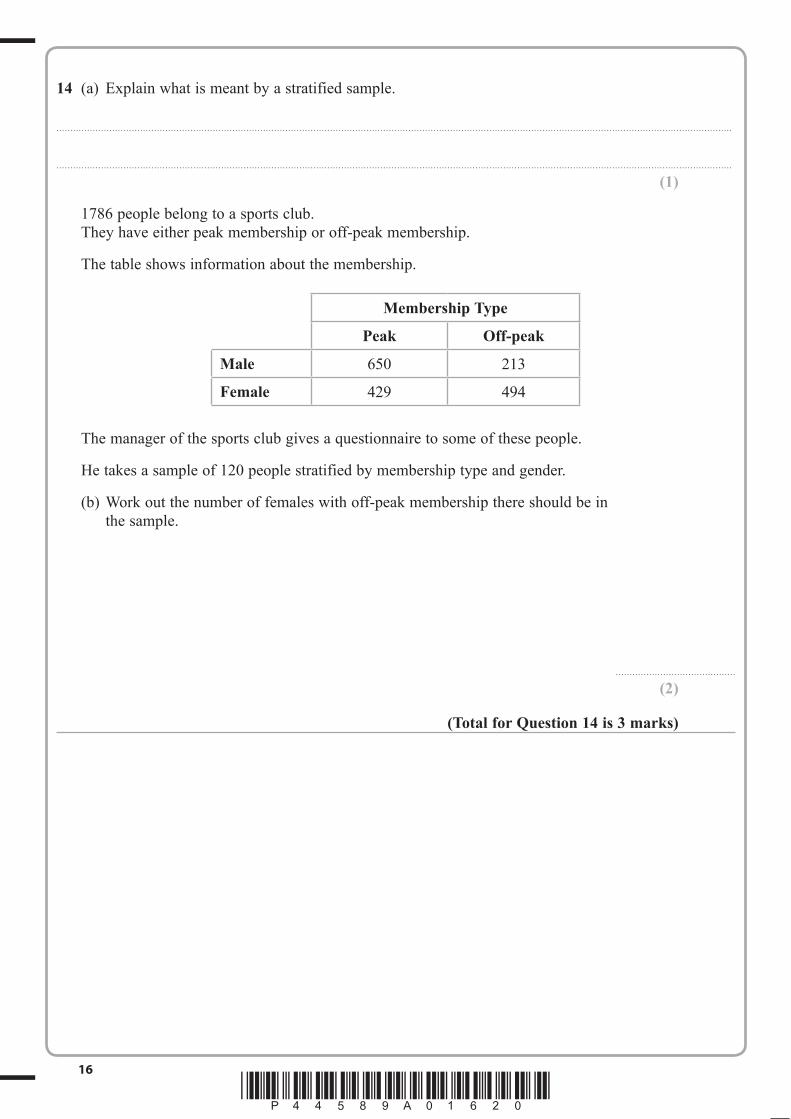
1786 people belong to a sports club. They have either peak membership or off-peak membership.
The table shows information about the membership.
Membership Type
Peak Off-peak
Male 650 213
Female 429 494
The manager of the sports club gives a questionnaire to some of these people.
He takes a sample of 120 people stratified by membership type and gender.
(b) Work out the number of females with off-peak membership there should be in the sample.
.. . . . . . . . . . . . . . . . . . . . . . . . . . . . . . . . . . . . . . . . . .
(2)
(Total for Question 14 is 3 marks)

17
*P44589A01720*
15 These 6 coins are in a box.
10p 10p 10p 20p 20p 50p
Pritesh takes at random 2 coins from the box.
Work out the probability that the total value of the 2 coins is at least 40p.
.. . . . . . . . . . . . . . . . . . . . . . . . . . . . . . . . . . . . . . . . . .
(Total for Question 15 is 4 marks)
Turn over

18
*P44589A01820*
16 The table shows information about the times, in minutes, that 84 customers spent in a cafe.
Time (m minutes) Frequency
0 < m 5 6
5 < m 15 21
15 < m 30 33
30 < m 40 16
40 < m 60 8
(a) Draw a histogram for the information in the table.
(3)
(b) Work out an estimate for the number of customers who spent 20 minutes or less in the cafe.
.. . . . . . . . . . . . . . . . . . . . . . . . . . . . . . . . . . . . . . . . . .
(2)
(Total for Question 16 is 5 marks)
TOTAL FOR PAPER IS 60 MARKS
Frequency density
0 10 20 30 40 50Time (m minutes)
60

19
*P44589A01920*
BLANK PAGE

20
*P44589A02020*
BLANK PAGE