Embed Size (px)
Citation preview

Master's Thesis in Business Administration
Chief executive officer characteristics and microfinance institutions performance
A global survey
by
Daudi Pascal
Supervisor
Roy Mersland
A thesis submitted in partial fulfilment of the requirements of the University of Agder for the
master program in Business administration degree and, therefore, approved as a part of this
education. However, the university is not responsible for the methods applied or the
conclusions drawn.
University of Agder, June 2012
Kristiansand School of Business
Department of Economics and Business Administration

ii
DECLARATION
I attest that this work has never been submitted in evidence for any degree, and it is not
concurrently submitted for any other degree than that of the master thesis studied at
University of Agder. Also, I declare that this work is the outcome of my own investigations
with exceptions only where acknowledged by references and that, I have not plagiarised
another’s work

iii
ACKNOWLEDGEMENTS
The accomplishment of this master thesis cannot pass without acknowledging the
contributions made by some few specials persons who devoted their time, means and
intellectual abilities to make my master studies at University of Agder successful.
First and foremost, I would like to thank Associate Professor Roy Mersland, my supervisor,
who worked tirelessly in assisting me to have this work accomplished to this end. He was at
all times there when I needed some help and advice.
Second, I am grateful to Neema Mori, Doctoral Candidate International Management (2012)
at University of Agder for critically reading my draft chapters and making constructive
suggestions.
My Masters studies in MBA international management at University Agder in Norway would
have just remained a dream without obtaining financial support from the Norwegian
Government Loan Fund (Statens Lånekasse for Utdanning) during the entire period of my
study. To this effect I would like to thank the Norwegian government, the International
education office staff, Economics and Business Administration staff and the library staff at
University of Agder for their support during the entire period of my studies.
Finally, I appreciate the moral and spiritual support received from my lovely wife Happyness,
sons Amani and Baraka. May the Lord Jesus Christ, bless them all!

iv
LIST OF ACRONYMS AND ABBREVIATIONS
CEO - Chief Executive Officer
CEOBEDU - Chief executive Business education
CEOBEXP - Chief executive officer Business experience
MFIs - Microfinance institutions
PaR30 - Portfolio at Risk for more than 30 days
AROA - Adjusted Return on assets
CGAP - Consultative Group for assisting the poor
HDI - Human Development Index
OSS - Operational Self-Sufficiency
MBA - Masters of Business Administration
Uia - University of Agder
CGAP - Consultative Group to Assist the Poor
ROE - Return on equity
FEM - Fixed effect Model
REM - Random effect model
SST - Sum square total
Wclients - Percentage of women clients
CrClients - Credit clients
Lsize - Average loan size

i
ABSTRACT
This study examines the relationship between formal business education, business experience
as CEO characteristics and MFIs performance. It uses a global dataset of 403 rated MFIs
located in 74 countries for the period of 2001 to 2009. This study uses random effects panel
data estimations to analyses the effect of CEO with formal business education and business
experience on return on assets, portfolio at risk of 30 days, which measures financial
performance, and average loan size, percentage of women clients and number of credit
clients, which capture, outreach performance. The results show that MFIs with CEO with
business experience have better return on assets, few loan defaults, smaller loan size, higher
percentage of women clients and associated with credit clients’ increase compared to MFIs
with CEO without business experience. While MFIs with CEO with formal business
education have a higher percentage of women clients, credit clients’ growth and smaller loan
size compared to MFIs with CEO without formal business education, the study find no
difference in performance on return on assets and portfolio at risk for 30 days. These findings
suggest that, in the future, the microfinance industry can benefit from non-microfinance
industry CEO with business experience.

ii
TABLE OF CONTENTS
DECLARATION ....................................................................................................................... ii
ACKNOWLEDGEMENTS ..................................................................................................... iii
LIST OF ACRONYMS AND ABBREVIATIONS ................................................................. iv
ABSTRACT ................................................................................................................................ i
LIST OF FIGURES .................................................................................................................. iv
LIST OF TABLES .................................................................................................................... iv
CHAPTER ONE: INTRODUCTION ........................................................................................ 1
1.1 Background of the study ............................................................................................. 1
1.2 Statement of the research problem .............................................................................. 2
1.3 Research objective....................................................................................................... 2
1.4 Research question ........................................................................................................ 3
1.5 Contribution of the study............................................................................................. 3
1.6 Organisation of the study ............................................................................................ 3
CHAPTER TWO: MICROFINANCE INDUSTRY AND CEOs LABOR MARKET ............. 4
2.1 Global Microfinance industry ..................................................................................... 4
2.2 CEOs labor market ...................................................................................................... 4
CHAPTER THREE: THEORIES AND RESEARCH HYPOTHESES .................................... 6
3.1 Overview of empirical evidence from past research ................................................... 6
3.2 Theoretical Background .............................................................................................. 9
3.3 Conceptual framework and research hypotheses ...................................................... 10
CHAPTER FOUR: RESEARCH METHODOLOGY............................................................ 13
4.1 Data and sample ........................................................................................................ 13
4.2 Operationalization and measurement of concepts ..................................................... 14
4.3 The conceptual model ............................................................................................... 18
4.4 Data analysis approach .............................................................................................. 19
4.5 Managing Omitted Variables Bias ............................................................................ 20

iii
4.6 The Econometric analysis ......................................................................................... 21
4.7 Assumptions of multiple regression analysis ............................................................ 25
4.8 Instrumental variable approach ................................................................................. 29
4.9 The choice between fixed effect model or random effect model .............................. 31
CHAPTER FIVE: DATA ANALYSIS AND FINDINGS ...................................................... 34
5.1 Descriptive evidence ................................................................................................. 34
5.2 Regression results and data analysis ......................................................................... 35
5.3 Additional regression analyses and robustness checks ............................................. 39
CHAPTER SIX: DISCUSSION, CONCLUSION, IMPLICATIONS, AREAS FOR FUTURE
STUDIES AND LIMITATIONS ............................................................................................. 48
6.1 Discussion ................................................................................................................. 48
6.2 Conclusion ................................................................................................................. 50
6.3 Theoretical, policy and managerial implications ...................................................... 51
6.4 Areas for future studies ............................................................................................. 52
6.5 Limitations of the study............................................................................................. 52
REFERENCES ........................................................................................................................ 54

iv
LIST OF FIGURES
CHAPTER THREE
Fig 3-1 Conceptual Framework ............................................................................................... 12
LIST OF TABLES
CHAPTER FOUR
Table 4-1 List of countries and number of microfinance institutions ...................................... 14
Table 4-2 Explanations of independent and control variables ................................................. 16
Table 4-3 Summary of dependent variables used in the study ................................................ 17
Table 4-4 Correlations analysis ............................................................................................... 22
Table 4-5 Variance of Inflation Factor (VIF) .......................................................................... 24
Table 4-6 Breusch-Pagan tests for heteroscedasticity ............................................................. 26
Table 4-7 Transformation of variable assets (MFI size) .......................................................... 27
Table 4-8 Wooldridge test for autocorrelation in panel data ................................................... 28
Table 4-9 testing for endogeneity results ................................................................................. 29
Table 4-10 Hausman test ......................................................................................................... 31
Table 4-11 results Fixed Effect Model vs. Random Effect Model Hausman Test .................. 33
CHAPTER FIVE
Tab 5-1 Descriptive statistics for dependent, independent and control variables .................... 34
Tab 5-2 Correlations for dependent variables .......................................................................... 35
Tab 5-3 CEO characteristics and MFI Financial performance ................................................ 36
Tab 5-4 CEO characteristics and MFI outreach performance ................................................. 38
Tab 5-5 additional regression and robustness checks testing for endogeneity results ............. 40
Tab 5-6 CEO characteristics and MFI financial performance without CEO founder ............. 41
Tab 5-7 CEO characteristics and MFI Outreach performance without CEO founder ............. 42
Tab 5-8 additional regression Breusch-Pagan test for heteroscedasticity ............................... 43
Tab 5-9 Wooldridge test for Autocorrelation results ............................................................... 44
Tab 5-10 additional regression Hausman test results .............................................................. 45
Tab 5-11 CEO characteristics and operational self-sufficiency .............................................. 46
Tab 5-12 CEO characteristics and the write-off ...................................................................... 47

1
CHAPTER ONE: INTRODUCTION
This chapter discusses the background study of CEOs characteristics influence in MFIs
performance, statement of the research problem, objective, research question, contribution of
the study and organisation of the study.
1.1 Background of the study
Microfinance institutions (MFIs) are organisations that offer banking services to poor people,
who are economically in desperate need of a small amount of loan to finance for, example,
their business, educations, manage emergencies, obtain assets, or smooth consumption (Di
Bella, 2011).
Existing Chief executive officers (CEO) and MFI performance literatures focuses on
the role of CEO gender and MFI performance (e.g. Strøm. et al., working paper, Mersland
and Strøm, 2009b), impact of duality of CEO and MFI performance (e.g. Galema et al., 2012)
and, the role of founder CEO and MFI performance (e.g. Mersland. et al., 2011). There are
few empirical findings related to CEO characteristics, or top management team demographic
profile influences and MFI performance (Sow Hup, 2010). This study responds into filling
this gap by investigating the influence of CEO characteristics on MFI performance, in
particular, with the focus on CEO formal business education and business experience. The
influence of CEO in any firm cannot be ignores because;
“CEOs control the management staff of a firm and acts as the liaison between company
employees and the Board of Directors. CEOs are responsible for planning and implementing
the strategy of a firm and are accountable for the success or failure of a firm through the
Board of Directors and shareholders” (Martelli and Abels, 2011pp.19).
The CEOs have potential impact to influence performance in MFIs if she/he has
leadership quality, management quality and development quality (Midgal et al., 2006)
provided there is strong board of directors and strong senior management (Galema et al.,
2012, Mori and Mersland, 2011, Hudon, 2010). Particularly, they steer efficient productivity,
performance and development of staff within the MFI and are responsible for maintaining
sound financial solvency by having the ability to mobilize financial resource (Ruth Jacobs et
al., 2007).

2
The empirical research on CEO characteristics1 and MFI performance is few and limited;
hence this study uses empirical findings from international business corporations for better
understand the role of CEO characteristics in MFI performance and managerial implications
thereof (Mersland et al., 2011). Both microfinance and international business research on
corporations show that, in general, characteristic of CEO is indispensable in any
organisations (Martelli and Abels, 2010, Martelli and Abels, 2011, Gwin, 2011, Mersland and
Strøm, 2009b, Chan, 2010). Among the characteristics of the CEO which have empirical
evidence in international business corporations, includes formal business education and
business experience, of which shows, to have influence in firm performance (Gottesman and
Morey, 2010, Bhagat et al., 2010a, Soriano and Castrogiovanni, 2012, Guthrie and Datta,
1997). This implies that MFIs can benefit from formal business education and business
experience of CEOs as the business corporations does. By studying the influence of CEOs
formal business education and CEOs business experience on MFIs performance, decision
makers can have a better understanding of whether the existing labor force of CEOs has
influence in MFIs performance and if CEOs with business experience from non-microfinance
can be employed in MFIs successful and drive MFIs performance.
1.2 Statement of the research problem
In MFIs, lack of professionalism and technical expertise at senior management level creates
poor internal controls environment and poor implementation and formulation of strategies,
particularly being lack of senior management level with experience and coupled with finance
and banking (Lascelles, 2011). Therefore, these impediments to the microfinance industry
need to be addressed empirically from different scenes for future prospect of the industry and
the people it serves. Considering the role of CEO in MFI, it is the purpose of this study to
examine the way CEO formal business education and business experience overcome these
impediments and contributes into MFIs performance.
1.3 Research objective
To analyse the relationship between formal business education, business experience as CEOs
characteristics and MFIs performance
1 Formal business education and business experience

3
1.4 Research question
Do the MFIs with CEO with formal business education and business experience have better
performance compared with MFIs with CEO without formal business education and business
experience?
1.5 Contribution of the study
Using Resource Based Theory and Upper echelons theory, this study provides a better
understanding of the management succession in MFIs. This study adds literature to the
international business management and strategy of MFI by linking the management;
governance of MFIs and, the importance of training, human capital investments and CEOs
labour market (Deresky, 2011, Thomsen, 2008, Garibaldi, 2006).
1.6 Organisation of the study
This study organised as follows. There are six chapters. Microfinance global industry and
CEO labor markets covered in chapter two. Theoretical background, conceptual framework
and hypotheses, covered in chapter three. Chapter four cover the methodology of the study
and chapter five cover the findings and data analysis. Chapter six cover discussion,
conclusion, theoretical, policy and managerial implications, areas for future studies and
limitations of the study.
4
CHAPTER TWO: MICROFINANCE INDUSTRY AND CEOs LABOR MARKET
This chapter provides overview of the global microfinance industry and CEOs labor market
in MFIs.
2.1 Global Microfinance industry
Microfinance refers to the provision of small loan and other related financial services like
savings, money transfer services and microinsurance to poor people and microenterprises
(Karlan and Goldberg, 2011, Mersland, 2009b). The microfinance industry became popular
when the founder of Grameen bank Muhammad Yunus and the Grameen bank received a
2Nobel Peace Prize in 2006 recognizing the effort in creating economic and social
opportunities for the poor people through lending small amount of money (Tharoor, 2006).
From his book, (Yunus, 1999) it took him relentless effort to pioneer the idea of microfinance
as a mean to fight poverty hence be recognised by the policy maker within the government.
He was the founder and CEO of the Grameen bank; hence it made him more popular for the
success.
In general, microfinance remain the only way to reach the poor, for example,
according to (Lascelles et al., 2011) the microfinance industry is currently serving 150
million clients worldwide, of which is approximately 6% of the 2.7 billion people who still
cannot afford the formal, traditional banking system. The aggressiveness of the microfinance
industry to reach the 2.7 billion clients posit higher competition among MFIs (Lascelles et al.,
2011). This intense competition is a result of readily available capital for MFIs to expand
their services, the entry of commercial banks, which vested with knowing the end customers
due to being in the financial industry and the leverage they have due to well established
technology in the banking industry, (Lascelles et al., 2011).
2.2 CEOs labor market
The labor market force for CEOs in MFIs is not bulky. This is because, like in for profit only
business corporations one may expect the external market force to play a role in reshaping the
microfinance industry to have well qualified CEOs. This is not the case in MFIs, because, in
for profit only business Corporations, the market force for CEOs characterised, for example,
by takeover and mergers. In MFIs, the scenario is different. These forces have limited role
because of different ownership of MFIs; hence, most MFs has no true owners (Hartarska,
2005, Mersland and Strøm, 2010). This has led into having weak governance in MFIs
2 http://www.nobelprize.org/nobel_prizes/peace/laureates/2006/

5
characterised by poor management quality and staffing due to having insufficient qualified,
resourceful and knowledgeable personnel (Lascelles et al., 2011, Mersland, 2009c).
Is CEOs in microfinance important? This is a serious and fascinating question for one
reason: That is; shareholders, donors and prospective investors in MFIs are in constant search
of capable and competent CEOs who can run the MFI profitably and reach more poor clients.
Particularly the focuses of MFIs on social achievement and financial sustainability are of
considerable concerns especially to stakeholders. Also, great concerns by the public at
general is that of reaching poorer clients strata especially women customers who has
empirically shown to have fewer loans defaults (for example see D’Espallier et al., 2011).
Another concern is that of remaining financially sustainable or commercially viable in the
perspective of donors and shareholders of the MFIs so that they can earn the return and
continue to serve the poor (e.g. Hermes and Lensink, 2011, Hermes et al., 2011). Also, the
data for business education and business experience of CEOs are one of the publicly
available, which make possible for this study to investigate the influence of these
characteristics on MFIs performance.

6
CHAPTER THREE: THEORIES AND RESEARCH HYPOTHESES
This chapter discusses the empirical evidence from past research on CEOs formal business
education, business experience and firm performance. It draws literature from both
microfinance and international business research in order for better understanding the
influence of CEOs formal business education and business experience on MFIs performance.
The empirical evidence if followed by discussion of theoretical background of resource based
view theory and upper echelon theory. The conceptual framework covers the last section of
this chapter.
3.1 Overview of empirical evidence from past research
Education and Experience of CEOs are one of the criteria that considered when hiring a CEO
(Mackey, 2008, Gwin, 2011, Magnusson and Boggs, 2006, Sow Hup, 2010). The focus is on
whether such attribute has an impact on firm performance. To study CEO experience and
firm performance (Guthrie and Datta, 1997) studied a sample of 214 CEO. Their results
indicate that experience of CEO has a positive relationship with firm performance. Another
study by (Soriano and Castrogiovanni, 2012) who studied sample of 2,713 SMEs within
European Union, they found that CEO experience has a positive influence on firm
productivity but not profitability. The productivity measured based on revenue per employee.
Using a sample of 393 CEOs (Slater and Dixon-Fowler, 2009) CEOs international
assignment experience positively related to the corporate social performance. Also, (Daily et
al., 2000) studied sample of CEOs from fortune 500 on the influence of CEO international
experience on firm performance. They found that there is a strong, positive relationship
between CEO experience and firm performance.
The owners or founders of firms considered to have experience in managing their
business. Empirical evidence by (Mersland. et al., 2011) who studied the impact of CEO
founders in microbanks using 286 microbanks in73 developing countries for the period of 10
years. Their main argument for their study was that founder CEO has tremendous interest of
ownership in the firm; hence they are better manager and have competencies. This is in
support with the finding by (Soriano and Castrogiovanni, 2012) where they found that CEO-
owner firm has better management hence they have better performance. In their finding, they
concluded that microbanks managed by founder CEOs have better management. That is they
exhibit higher growth, fewer loans defaults (PaR30) and lower cost of operation.
The study by (Laveren et al., 2011) investigated CEOs experience on 511 sample of small
firms. They found that experience contribute to growth of firm up to a certain level after

7
which experience does not contribute to growth. They found that growth rate lessen as the
age of CEO increase. Another study done by (Stone and Tudor, 2005) on CEO experience
and firm performance, they surveyed 58 CEOs in publicly traded corporations. Their result
shows that CEOs experience has a positive relationship with return on assets (ROA).
To study the influence of CEOs education on firm performance (Gottesman and
Morey, 2006) studied whether the better education for CEOs has an impact on firm
performance. Better education compared based on those CEOs who attended prestigious
school and those from less prestigious school. They found that there is no difference in firm
performance between those firm managed by CEO with MBA and those firm managed by
CEOs without a graduate degree. Furthermore, they found that there was no difference in
performance of firm between those managed by CEOs from the prestigious school and those
from less prestigious school. That is they found that there is the negative relationship between
CEO from the prestigious school and firm performance.
To study the influence of CEOs educational background on firm performance,
(Gottesman and Morey, 2010) studied 390 US firms. Their question was whether better
educated CEOs produce better firm financial performance. They examined the undergraduate
degree CEO holds and, whether CEO has MBA or law degree or other degrees. They also
controlled for industry effects. Their findings show that education background of CEO is not
related to firm financial performance. Further their results indicated that CEOs with MBA or
law degree does not outperform CEO without a graduate degree. Their main argument for the
results was that MBA program concentrate much on quantitative-based, analytical skills
rather than developing leadership and relational expertise that are essential for attainment of
high level of managerial cadre.
The study by (Bhagat et al., 2010b) on CEO education and firm performance based on
the role played by education in replacing new CEO and the subsequent effect of education on
firm performance. They used more than 2,600 cases of CEO for the period of 14 years. To
measure CEO education, they set criteria of whether the CEO attended top twenty
undergraduate schools, whether the CEO has MBA or law master degree and whether the
master degree is from the top twenty programs. They found that education does not play a
role in replacing a poorly performing CEO, as they replace without due consideration of their
education background. On the other hand, they found that, in case of new CEO who is
replacing a poorly performing, CEO education play a significant, notable, role as there is a
positive correlation for the new CEO and the one they replace. In case of firm performance
with CEO education background, they found that MBA degrees have a positive impact in

8
short-term financial performance of the firm. However, they found that there is no significant
relationship between CEO education and long term financial performance of the firm. Their
conclusion was that CEO education does not reflect ability.
Also, (Slater and Dixon-Fowler, 2010) studied the impact of CEO education on
corporate environmental performance. They investigated by testing empirically 416 S&P 500
CEOs. They studied CEO particularly with MBA education, which measured it, as
categorical variable. The environment impact measured by looking on the firm activities
adhere to environmental regulations. Their results showed that there is a positive relationship
between CEO MBA education and corporate environment performance.
In MFI, the empirical evidence literature on CEO formal business education and experience
influence on MFI performance is few and limited; the only available literature known to the
author is that of CEO founder, CEO gender and CEO duality of chair/CEO position.
In microfinance, gender has influence in MFIs performance. An empirical research by
(Strøm. et al., working paper), studied among other things the influence of female as CEO in
MFIs performance and governance. They used data from 379 microbanks in 73 countries. In
their study, they found that female CEO has a positive impact on financial performance but
not on governance. Similarly, (Mersland and Strøm, 2009b) using data from 60 countries
covering 278 MFs in the year between 2000 to 2007; they found the same results which
shows that financial performance of MFI improves when the CEO is female. The conclusion
for both studies on the positive impact for female CEO on MFI performance is due to female
leadership, which is associated with more female customers, (Strøm. et al., working paper,
Mersland and Strøm, 2009b) This attribution is in consistent with the current trend where
there is an emphasize of empowering women through loans (Mayoux, 2010). For example,
the study by (D’Espallier et al., 2011) concluded that female client have fewer loans defaults.
Duality of CEO in MFI studied by (Hartarska and Mersland, 2009) found that when
CEO position is same with board chairmanship, the MFI become less efficient. This may
cause monitoring by the board of directors to become less effective. Similarly, study by
(Galema et al., 2012) using 280 MFIs from 60 countries with data from 2000 to 2007 they
found that powerful CEO in MFI is associated with higher performance variability. In their
study, they considered the powerful CEO in MFI is the one who has dual positions, that is
CEO/Chairman. They argued further that performance variability is driven by the CEO
managerial discretion, of which is prevalent only when there are no stakeholder electives on
board.

9
3.2 Theoretical Background
This section discusses the theoretical framework of resource based view theory and upper
echelon theory. It explains the theory and applicability of these theories in determining the
influence of CEO formal business education, business experience on MFIs performance.
The resources based view theory argues that collections of resources within firm
enables it to have unique attributes and hence better performance (Barney, 1991, Penrose,
1959). The resources for the firm include individual and group resources. The group
resources include organisational resources, physical resources and human resources (Barney,
1991). The human resources categories include education and experience (Barney, 1991).
Empirical evidence based on the resource based view theory found that higher education of
CEO is associated with sales growth and, experience is associated with firm growth rate (e.g.
Rajagopalan and Datta, 1996). This shows that formal education and experience of CEO has
influence in firm performance, and this study argues that it is applicable also for CEOs in
MFIs. Past literatures in both international business and MFIs emphasize the importance of
resources and competence such as experience, managerial capability and education
background of an employee within firm (e.g.Peteraf, 1993, Hall, 1992, Barney et al., 2011,
Galema et al., Forthcoming, Foss, 2011). These are crucial to firm as they translate into firm
performance (Peteraf, 1993, Wernerfelt, 1984).
Upper echelons theory explains the relationship between managerial characteristics
and organisational outcome. It predicts that the performance of firm partially determined by
managerial characteristics, which are observable, particularly formal education and
experience (Hambrick and Mason, 1984, Holger et al., 2009, Carpenter and Sanders, 2004).
The CEO as part of the top management team, their observable demographic profiles are
associated with better firm performance (Troy et al., 2011, Li and Tang, 2010, Wang et al.,
2011, Ng and Sears, 2012, Louis et al., 2010, Hambrick and Mason, 1984, Holger et al.,
2009, Buyl et al., 2011). CEO education and experience are useful during strategic decision
making because they act as indicators in determining firm performance (Wang et al., 2011,
Ng and Sears, 2012, Waldman et al., 2004, Hambrick and Mason, 1984).
Recently, the Upper Echelons theory empirically used to study CEO education, experience
and firm performance, as their empirical evidence shows that CEO education and experience
are associated with better firm performance (Li and Tang, 2010, Slater and Dixon-Fowler,
2009, Ng and Sears, 2012, Koyuncu et al., 2010, Waldman et al., 2004, Mackey, 2008,
Carmeli et al., 2011, Manner, 2010, Holger et al., 2009). I follow this trend of literature and

10
argue that CEO formal business education and business experience have influence in MFI
performance.
3.3 Conceptual framework and research hypotheses
This section presents the hypotheses based on empirical evidence from past literature and
theoretical background. The conceptual framework draws the hypothesized relationship
between the CEO characteristics (education and experience) and MFI financial and outreach
performance.
The CEO formal business education literatures in international business argues that
education serve as cognitive ability of CEO in understanding the business environment where
the firm operate (Bhagat et al., 2010b, Martelli and Abels, 2010, Hansen et al., 2010, Barker
and Mueller, 2002, Bhagat et al., 2010a, Gitsham, 2011, Jalbert et al., 2011, Dreher and
Ryan, 2001). To link this characteristic with firm performance education classified into
different categories like business education, law and engineering (Rajagopalan and Datta,
1996, Jalbert et al., 2011, Martelli and Abels, 2010, Slater and Dixon-Fowler, 2010, Doms et
al., 2010, Goh et al., 2008).
Of all the education discipline, business education is popular among CEOs in the firm
as it has formal training on the way to manage business successfully (Hansen et al., 2010,
Dreher and Ryan, 2001, Slater and Dixon-Fowler, 2010, Pfeffer, 2004, David and David,
2011).
Empirical evidence shows that firm with CEOs with formal business education had
their firm performance ranks higher than firm with CEO without formal business education
(Hansen et al., 2010, Pfeffer, 2004). This study argues that this also is applicable in MFIs.
That is MFIs with CEO with formal business education have better performance compared to
MFIs with CEO without formal business education.
From resource based view theory, CEO formal business education is regarded as human
resource, which nurture basic, understanding for the CEO to have the ability in terms of
knowledge to influence performance (Roth, 1995). From the upper echelon theory, CEO
formal business education and the strategic choices act together to determine firm
performance (Hambrick and Mason, 1984). This also expected in MFIs, where CEO with
formal business education has increased financial performance compared to MFIs with CEO
without formal business education. In case of outreach, MFIs with CEOs with formal
business education reach more poor clients. Basing on the above arguments it is apparent
that;

11
Hypothesis 1a: MFIs with CEO with formal business education have better financial
performance compared with MFIs with CEO without formal business education
Hypothesis 1b: MFIs with CEO with formal business education have better outreach
performance compared with MFIs with CEO without formal business education
The CEO business experience held as the top cognitive ability of CEO when it comes
to fulfilling their duties (Rajagopalan and Datta, 1996, Zhang and Rajagopalan, 2010). CEOs
with experience possess general knowledge, and it reflects their functional background of
specialization (Laveren et al., 2011, Herrmann and Datta, 2006, Slater and Dixon-Fowler,
2009, Ryan and Wang, 2011, Koyuncu et al., 2010, Elsaid et al., 2011). The functional
background includes whether the CEO has previous experience in management of business,
has previous international experience or number of years in a managerial position as CEO
(Carpenter et al., 2001, Musteen et al., 2006, Troy et al., 2011, Reed and Reed, 1989, Ryan
and Wang, 2011, Stanley, 2011, Peter and David, 2006, Bigley and Wiersema, 2002b).
Hence, with business experience CEOs has a better understanding of various business
scenario for, example, how to manage resources within firm (Mendelson, 2011, Lascelles et
al., 2011).
The newness of MFIs requires the CEO to be well knowledgeable with the customers
it serves (Lascelles et al., 2011, Sow Hup, 2010). This is because the MFIs serve customers
who are poor and there is a possibility of higher transactions costs and risk. The CEO with
business experience can handle this situation especially in this period where there are diverse
influences. Of recently MFIs the current trends for, example, innovations in the microfinance
industry, growing concern to the lending methodologies and ownership of MFIs (Mersland
and Strøm, forthcoming, Rahman and Nie, 2011, Valadez and Buskirk, 2011b, Hoque et al.,
2011, Byström, 2008, Mersland and Strøm, 2010, Mersland, 2009b).
Empirical evidence finds that CEO with business experience have better firm
performance compared with firm without business experience (Reed and Reed, 1989,
Laveren et al., 2011, Eubanks, 1992, Herrmann and Datta, 2006, Slater and Dixon-Fowler,
2009, Ryan and Wang, 2011, Elsaid et al., 2011, Stanley, 2011). This study argues that it is
also applicable in MFIs (Hartarska and Mersland, 2009).
The arguments from the resource based view theory contends that business experience
enable the CEOs to deploy their know how in MFI to drive better performance. The upper
echelon theory contends that CEO with experience has a better understanding of strategic
choice that has influences on MFI performance. This study argues that MFIs with CEO with
business experience have better performance. Therefore, I hypothesize that

12
Hypothesis 2a: MFIs with CEO with business experience have better financial performance
compared with MFIs with CEO without business experience.
Hypothesis 2b: MFIs with CEO with business experience have more outreach performance
compared with MFIs with CEO without business experience.
The conceptual framework took into considerations of the resource based view theory,
which regards CEOs in human resources perspective as the resources having business
experience and business education to drive firm performance. The upper echelons theory
regards the CEOs business education and business experience as characteristics which
influence firm performance (Hambrick and Mason, 1984, Barney, 1991). Given the above
argument, following is the conceptual framework in figure 3-1.
Fig 3-1 Conceptual Framework
Source: Author own constructs
+/-H2a
+/-H1a
+/-H2b
+/-H1b
Business
Experience
Business
education
Outreach
performance
financial
performance
CEO characteristics MFI performance

13
CHAPTER FOUR: RESEARCH METHODOLOGY
This chapter presents source of data, the procedures used in gathering data and data validity
and reliability in general. The measurements of concepts used in the study and the conceptual
model applied in this study. The data analysis approach, managing omitted variable bias and
econometrics analysis. The assumptions of multiple regression analysis, the issue of
instrumental variable approach and the choice between fixed effect model (FEM) and random
effect model (REM).
4.1 Data and sample
This study uses data from rated MFIs (Mersland et al., 2011) This dataset consists of 403
MFIs gathered in 74 countries. Table 4-1 in the next page shows the list of countries and
number of MFIs. The information for this data was extracted from www.ratingfund2.org, a
publicly available website. The dataset information’s in the www.ratingfund2.org are from
the five rating agencies risk assessment reports that include MicroRate, Microfinanza, Planet
Rating, Crisil and M-Cril. The rating agencies were selected based on approval by the Rating
Fund of the Consultative Group to Assist the Poor (Mersland et al., 2011) and are the leading
five players in the rating of MFIs, and their rating report contains most of MFIs information.
The methods use the rating agencies to assess MFIs are almost similar and there is no
difference found.
This study is not the only one using dataset from rating report to write a master thesis.
There are several others studies written based on rating agencies reports (e.g. Mersland,
2009a). Also, there are several articles in different journals written based on extracting
information from rating report (e.g. Galema et al., 2012) used extracted information from
rating report to study sample of 280 MFI, which its finding recently published in Journal of
Management Studies. Therefore, the quality of information from the source is well
recognised in the academics.
Sample selection procedures considered inclusion of sample in the dataset based on
only rated MFIs. This is because most of the rated MFIs are the one able, and willing to be
rated and had most of the rating categories being represented in the data. This helped to
eliminate the background noise.
The missing data account for 25% in overall, and it varies from 0% for some variables
and to above 70% to other variables. The effect has been accounted for by using STATA.

14
Table 4-1 List of countries and number of microfinance institutions
Number Country Name
Number of
MFIs Number Country Name Number of MFIs
1 Albania 3 38 Romania 1
2 Argentina 1 39 Russian Federation 15
3 Armenia 3 40 Senegal 10
4 Benin 9 41 South Africa 3
5 Bolivia 15 42 Sri Lanka 1
6 Bosnia Hercegovina 12 43 Tanzania 5
7 Brazil 13 44 Togo 4
8 Bulgaria 2 45 Trinidad and Tobago 1
9 Burkina Faso 4 46 Tunisia 1
10 Cambodia 13 47 Uganda 10
11 Chile 2 48 Montenegro 2
12 Colombia 6 49 Cameroun 5
13 Dominican Republic 4 50 Guinee 1
14 Ecuador 18 51 East Timor 1
15 Egypt 5 52 Bangladesh 2
16 El Salvador 6 53 Nepal 5
17 Ethiopia 10 54 Vietnam 1
18 Georgia 6 55 Azerbaijan 7
19 Guatemala 6 56 Mongolia 2
20 Haiti 3 57 Nigeria 3
21 Honduras 8 58 Mozambique 1
22 India 32 59 Tajikistan 7
23 Indonesia 2 60 Croatia 1
24 Jordan 3 61 Chad 1
25 Kazakhstan 4 62 Rwanda 4
26 Kenya 9 63 Zambia 1
27 Kyrgyzstan 4 64 China 1
28 Madagascar 2 65 Serbia 1
29 Mali 3 66 Ghana 4
30 Mexico 18 67 Malawi 1
31 Moldova 2 68 Gambia 1
32 Morocco 6 69 Kosovo 4
33 Nicaragua 13 70 Rep of Congo Brazzaville 1
34 Pakistan 1 71 Burundi 1
35 Paraguay 2 72 Niger 3
36 Peru 32 73 DRC - Kinshasa 1
37 Philippines 7 74 Zambia 1
Total Number of MFIs 403
Source: Author owns constructs from MFIs panel dataset 2001 to 2009
4.2 Operationalization and measurement of concepts
According to (Sager, 1976) the operational definition or research definition is the definition
of the concept which its properties or operations can be measured through observation. For

15
non-observable operational definition, their events, presence or absence behavior can be
measured by inferring to the behaviour that can be observed. This study operationalizes the
following concepts based on the theories. This study uses dependent variables comprises of
adjusted return on assets (AROA) and portfolio at risk for 30 days (PaR30) to measure
financial performance, and average loan size, percentage of women clients and credit clients
to capture outreach performance. The independent variables are CEO with formal business
education and CEO with business experience. I also use set of control variables. The
following sections explain each of these variables, and at the end, a table of summary with
explanations of the way measured each variable is presented.
The concept of education measured by (Soriano and Castrogiovanni, 2012) based on
the formal business education acquired at the university either undergraduate or graduate
courses. Similarly, education measured by (Gottesman and Morey, 2010) based on MBA.
This measure implies business education, and in this study education uses as an independent
variable in determining its influence on MFI performance. Particularly, education measures
as university level undergraduate or graduate in business, banking, accounting, management,
and economics and similar. It assigns 1 if CEO has formal business education or 0 if CEO
does not have formal business education.
The concept of experience defined by (Begley and Boyd, 1985, Dyke et al., 1992,
Stuart and Abetti, 1990) as the total time the CEO has been in that position or the time has
been with the firm, previous years in management of business and ownership. To measure the
concept of experience (Sandberg and Hofer, 1987) uses dummy to indicate the presence or
absence of business experience. This study uses experience as an independent variable in
determining its influence in MFI performance. Experience used as business experience where
CEO has either ownership or management of business prior to becoming the CEO and if the
CEO is hired within the MFI. This study assigns 1 if CEO has business experience or 0 if
CEO does not have business experience.
Control variables used in this study includes MFI specifics control variables and
country control variables to minimize the possibility of associating the influence of
independent variables for which they are not responsible for the change in the dependent
variable (Hair, 2010, Zikmund et al., 2010). This study uses control variables recently used
in MFI literature (Galema et al., 2012, Mersland et al., 2011). It includes MFI experience,
which indicates the number of years that the MFIs have been in operation. MFI size assessed
by the amount of assets it owns and used as the natural logarithm. Regulation, which shows if
the MFI is included in the formal banking regulation of which according to (Galema et al.,

16
2012) regulated act as hints for loan provider, as a trust to the MFI itself and, indicates the
MFI follow the formal institutions of the jurisdictions they operate. Competition means local
level of MFI competition. HDI means human development index which control country
specifics like institutions and differing background (Mersland and Strøm, 2009a) Also, this
study uses regional dummies for Asia, Latin America, Africa, Middle East and Eastern
Europe. The following table 4-2 below summarise all the independent variables and control
variables.
Table 4-2 Explanations of independent and control variables
Independent
variables
Explanation (measure)
Hypothesis
Financial
(AROA,
PaR30)
Outreach (Average loan size,
Percentage women clients and
credit clients)
CEO formal business
education
A dummy with value of 1 if CEO has
business education
+/- +/-
CEO business
experience
A dummy with value of 1 if CEO has
business experience
+/- +/-
Control variables
MFI size logarithm of MFI total asset
MFI age Number of years since the establishment
Competition A self-constructed measure of the local level of competition where 1 mean
little or no competition and 7 high competition
Regulation A dummy with value of 1 if the MFI is regulated by banking authority
Regional A dummies for Latin America, Africa, Middle East and Eastern Europe
Human Development
Index (HDI)
An index ranking for each country covering health, education and income
(GDP per capita in PPP terms (constant 2005 international $)3
MFIs have dual objectives hence their performance is captured based on financial
performance and outreach performance (Mersland and Strøm, 2009b). I measure financial
performance using return on assets (profitability) and portfolio quality (PaR30).
I use adjusted return on assets (aroa) to measure MFIs profitability. I adjusted for
inflation . It measures the extent which the MFIs uses
it assets to generate return, that is
(Galema et al., 2012). This
3 Source http://hdr.undp.org/en/data/build/ as also used by MERSLAND, R. & STRØM, Ø. R. 2009a.
Performance and governance in microfinance institutions. Journal of Banking & Finance, 33, 662-669.

17
measure was used in (Mersland. et al., 2011 pp. 19) to capture the overall financial
performance in MFIs industry as they argued that due to differing organisational forms of
MFI where others are owned, others are without owners and differing objectives as others are
after profit while others are not for profit. The effect of this differing organisation form lead
to differing debt/equity levels between MFIs, hence this make ROA to be the best proxy
measure for capturing financial performance than using return on equity (ROE).
To measure portfolio at quality this study uses a proxy measure of Portfolio at risk
(PaR30) which shows the ability to collect loan. Furthermore, this measure can be regarded
as a proxy for competence of management, because the loan repayment is a key to the
survival of the MFI in order to continue serving other clients (D’Espallier et al., 2011,
Mersland and Strøm, 2008).
Par30 is computed as;
I use average loan size, percentage of women clients and number of credit clients to
capture the depth of outreach performance (Mersland et al., 2011, Mersland and Strøm,
2009a).
I measure the average loan size as:
(Galema et al., 2012
pp. 11).
The following table 4-3 below summarises the explanations of all dependent variables
used in this study.
Table 4-3 Summary of dependent variables used in the study Variable Explanation (Measure)
Financial Performance/profitability
AROA Return on assets (ROA) at the end of a given period, Adjusted for
inflation =
Par30 The fraction of the portfolio with more than 30 days in arrears
Outreach Performance
Average loan size Average loan size =
Women clients Percentage of women clients
Credit clients Number of credit clients

18
4.3 The conceptual model
The relationship between the dependent and independent variables in this study is explained
using panel data model. The panel data is a set of data comprising recurring observations of
the same individual (e.g. MFIs) collected over a number of periods e.g. years (Baum, 2006,
Cameron and Trivedi, 2009, Gujarati and Porter, 2010, Johnston and DiNardo, 1997,
Wooldridge, 2006). The panel data combine cross-section and time series data of the same
individual collected over time (Gujarati, 2003).
Since the panel data provides a relationship, over time to individual (e.g. MFIs), this
implies that these individuals are bound to be heterogeneous. The panel data estimation takes
into considerations such heterogeneity by allowing individual-specific (MFI) variables to be
tested (Studenmund, 2006).
Therefore, in the course of establishing a relationship between dependent and
independent variables given a focus to individual characteristics of MFIs, such as MFIs
country, MFI year of the report, MFI type and so on, a panel data was considered to be an
appropriate tool. This is because; the panel data can measure and detect appropriately the
effects that cannot easily be detected by using pure cross-sectional data or pure time series
data (Gujarati and Porter, 2010, Johnston and DiNardo, 1997, Wooldridge, 2006).
Furthermore, the panel data is flexible, it gives more information on data analysis, it has more
variability; it has less collinearity among variables, and enhance efficiency (Gujarati, 2003
pp. 637). Following is a general panel data regression model (Bollen and Brand, 2010).
Where;
Represent the dependent variable (measure of financial sustainability and outreach)
for cross-section unit i at time t, where i = 1….n and t = 1…..T
Represent heterogeneity or an individual effect which comprises the constant term in
the model, and it contain set of observable individual or group specific variables for
example MFIs type, MFIs region and so on, or unobserved MFI characteristics (for
example composition of governance mechanism within the MFIs) which are
considered to not to vary over time (Wooldridge, 2006).
Represent the partial effect measure of in time t for the unit i

19
Represent the jth
predictor variable for unit i at time t. In this study there are K
predictor variables indexed by j=1…….K which means that is a K dimensional
vector
Represent the error term
Operational models for the above general equations are presented in the linear regression
section.
The presented previous model can be adapted for use either with fixed effect model or
random effect model. The fixed effect model assumes that the individual effect of is
correlated with the predictor variable while the random effect model assume that the
individual effect is not correlated with the predictor variable hence, the error term in
random effects become ( ), whereby is the specific random effects element for the
group which is similar to except that with , for every group there is a single draw that is
considered into the regression identically for each time (Gujarati and Porter, 2010,
Wooldridge, 2006).
4.4 Data analysis approach
The data from the dataset were put together and in an acceptable format to enable inter-MFI
comparison. Then, converted into the CSV (comma delimited) format, that enables
transferring to STATA econometric software for analysis.
This study uses STATA for data analysis because it is enabling efficient and easy
data analysis for researchers (Baum, 2006, Cameron and Trivedi, 2009). Furthermore,
STATA software ability to analyse panel data in a range of time and units fits the purposes of
this study, hence appropriate software for this study (Cameron and Trivedi, 2009). The
STATA software also is user friendly and interactive to the researchers. The online technical
support and abundance of learning resources available makes this software more convenient
for uses in this study. Also one of its advantages over other statistical software packages is
that it follows strict rules with its commanding syntax, for example in grammatical terms,
there are few notable irregular verbs (Baum et al., 2011). Also, makes easy for panel data
implementation in regression (Baum, 2006, Cameron and Trivedi, 2009). Lastly, it is
convenient to use this software because the researcher is knowledgeable in use of this
statistical software, and has a full time access to it.

20
4.5 Managing Omitted Variables Bias
With multivariate models, there is a possibility that the coefficient derived from regression
analysis suffers from the omitted variable bias (Børing, 2010, Sessions and Stevans, 2006).
This effect occurs when the models suffer from missing variable which has influence on the
dependent variables, and this may lead into affecting the coefficients in the model which may
be biased and hence misleading (Chamberlain, 1985). This requires controlling of the
unobserved effects of these omitted variable (Kim and Frees, 2006). Following is the general
equation model for unobserved effect (Wooldridge, 2006 pp. 251 ):
Where;
Is 1 × K which may contain variables that;
Vary across t but not i
Vary across i but not t
Vary across i and t
Unobserved heterogeneity or individual effects or individual heterogeneity
The idiosyncratic errors as it vary across t as well as across i
Therefore, from the above equation, controlling for unobserved effects largely depends on the
nature of the omitted variable, that is, whether is changing over time or is constant over time,
and whether is changing over cases or is constant overs cases (Kim and Frees, 2006). This
phenomenon sometimes known as time specific and unit (case) specific effect of the
unobserved variable (Gujarati and Porter, 2010, Studenmund, 2006). From the econometric
literatures, there are several methods for dealing with omitted variables. Two of these are
fixed effects model and random effects model (Kim and Frees, 2006, Børing, 2010, Cameron
and Trivedi, 2009, Gujarati and Porter, 2010, Johnston and DiNardo, 1997, Studenmund,
2006, Wooldridge, 2006).
The fixed effect model assumes that the constant term differences can capture the
difference across cases or MFIs as used in this study. This allows the unobserved individual
case effects to be controlled by correlating it with predictor variable (Gujarati and Porter,
2010, Studenmund, 2006, Wooldridge, 2006). This gets rid of the effects of the unobserved
effects from the predictor variable, and, hence enables assessment of the predictors’ net effect
(Gujarati and Porter, 2010, Wooldridge, 2006). Hence, the changes in variables over time
(given the result of unobserved effect of omitted variable), can be utilised when estimating
the effect of predictor variables on the criterion variable. This makes the fixed effect model to

21
be suitable when one want to control for the omitted variable that differ across case (MFI)
which exhibit constant variation over time (Baum, 2006, Johnston and DiNardo, 1997,
Studenmund, 2006, Wooldridge, 2006, Kim and Frees, 2006). The random effect is
appropriate when one want to control the omitted variable that is the same across case (MFI)
but exhibit difference over time (Johnston and DiNardo, 1997, Studenmund, 2006,
Wooldridge, 2006, Greene, 2012).
The advantage with the random effect is that it includes the unobserved heterogeneity,
while in fixed effect it is absorbed by the intercept (Greene, 2012, Gujarati and Porter, 2010,
Wooldridge, 2006). The disadvantage of the random effects is its assumption of uncorrelated
relationship between the predictor variable with the unobserved effects. Many researchers
think it as unrealistic assumptions. The unobserved heterogeneity usually correlates with the
predictor variables (Baum, 2006, Børing, 2010, Greene, 2012, Kim and Frees, 2006, Stock
and Watson, 2003). This assumption make the fixed effect model superior to random effect as
it does not include such assumption (e.g. Sven and Daniel, 2007).
However, this has to be taken with precautions, because there is a scenario where the
random effect is more appropriate to use. This is when the omitted variable effect differs
across case but are constant over time (as the case with fixed effect model), and provided the
omitted variable effect are constant but change over time (Greene, 2012, Gujarati and Porter,
2010). If the assumptions hold, the random effects estimator is more efficient since it allows
identification of the intercept which is differenced out under fixed effects. Given the above
arguments of fixed effect model and random effect model the researcher rely on the Hausman
test (Hausman, 1978) to measure the appropriateness of each model assumptions for use in
this study.
4.6 The Econometric analysis
This section discusses the econometric analysis approaches used in the study, this include, the
correlation analysis, Multicollinearity, assumptions of multiple regression analysis, the choice
between fixed effect model and random effect model.
I run correlation analysis using STATA to determine whether the variables correlate or not.
However the results show the variables were correlated. The correlation analysis also helped
to determine the extent of multicollinearity for the variables. The table below shows the
correlation of the variables. From table 4-4 in the next page, it shows that the correlations
coefficient for CEO business experience and business education is 0.3823.

22
Multicollinearity occurs when there is a high but not perfect correlation among the
independent variables within the multiple regression models.
Table 4-4 Correlations analysis Variables 1 2 3 4 5 6 7 8 9 10
(1)CEO=Experience 1
(2)CEO=Education 0.3823 1
(3)MFI age 0.0554 0.1699 1
(4)MFI size 0.0914 0.1579 0.2045 1
(5)Regulation 0.0377 0.0927 0.0350 0.1459 1
(6)Competition -0.0603 0.0251 0.1965 0.2498 -0.026 1
(7)Human Dev. Index -0.0449 -0.107 -0.0879 -0.032 -0.317 0.0759 1
(8)Latin America 0.0243 0.1166 0.1325 0.0368 -0.177 0.2718 0.3667 1
(9)Africa 0.0687 0.1560 0.0481 0.0399 0.225 -0.152 -0.807 -0.379 1
(10)Middle East 0.0516 0.0940 -0.1126 0.0794 -0.049 -0.162 0.0139 -0.16 -0.099 1
(11)Eastern Europe -0.0803 -0.223 -0.2823 0.0210 -0.017 -0.047 0.343 -0.398 -0.246 -0.1037 1
The results of high multicollinearity are contrary to the expectations for the independent
variables to correlate with the dependent variables, and the problem is not on the model
specification but it relates to the sample (Verbeek, 2012, Hair, 2010). This can cause in the
decreases of the explanatory power information of the independent variables to the dependent
variables and, hence may draw a wrong conclusion that the independent variables are not
related to the dependent variables (Hair, 2010). With multicollinearity, the standard errors for
the estimated regression coefficient are relatively large, but are not biased estimates (Greene,
2012, Verbeek, 2012).
The extent with which correlation can cause multicollinearity is not well set. Scholars
in econometrics and statistics have difference view as to the cut-off in the correlation that
could alarm existence of multicollinearity. In their book (Hair, 2010) argue that the cut-off
point is 0.9 correlation coefficient of which below that there is no effect of multicollinearity.
Others (Bagheri and Midi, 2009) argue that when the correlation coefficient exceed 0.9 then
multicollinearity can be detected. Both authors have the same cut off point of 0.9 correlation
coefficients. However, (Wooldridge, 2006) argue differently, he affirm that there is no
absolute number to conclude that there is multicollinearity problem, the only hints that will
tell that whether there is multicollinearity or not is when there is a high correlation between
the overall sample variation (SST) and the respective individual variables variance (δ2). This

23
study took an approach in assessing, determining the multicollinearity and applying the
remedies thereof (Hair, 2010)
The correlation coefficient between the moderated effect of CEO business experience
and business education is lower than the suggested cut off point of 0.9 (Hair, 2010). This
correlations coefficient provides a hint of no problem of multicollinearity.
Furthermore, Multicollinearity can also be detected by calculating variance of
inflation factor (VIF) for each coefficient. This test statistics is used as a diagnostic tool to
detect the seriousness of multicollinearity problem (Mansfield and Helms, 1982). There is no
consensus for cut-off point for VIF, for example (Hair, 2010, Gujarati, 2003, Curto and Pinto,
2011) argues that VIF above 10.0 means there is a multicollinearity problem while (Greene,
2003) argued that VIF below 20.0, there is no multicollinearity problem. Furthermore, (Hair,
2010) argue that the is 0.9 cut-off for tolerance value which corresponds to VIF of 10.0
The literature in econometrics lays down methods that can be used to handle
multicollinearity problem in dataset. These are omit one or more variable suggested by (Hair,
2010) that is causing multicollinearity, do nothing, increase the sample size or just obtain
more data as the problem may be corrected if the sample size is more than 100 observations
(Gujarati, 2003, Gujarati and Porter, 2010, Verbeek, 2012). The problem can be corrected by
doing variable transformation (Hair, 2010).
To see if there is a multicollinearity problem, variance of inflation factor (VIF) was
calculated using collinearity diagnostic tool in STATA.
The results in table 4-5 in the next page, show that CEO business experience has the
VIF value of 1.18 while CEO business education has VIF of 1.31, which implies that they
both below the VIF value of 10 (Hair, 2010).

24
Table 4-5 Variance of Inflation Factor (VIF) Variable VIF SQRT VIF Tolerance R-Squared
CEO=Business experience 1.18 1.09 0.8463 0.1537
CEO=Business education 1.31 1.15 0.7613 0.2387
MFI age 1.22 1.10 0.8201 0.1799
MFI size 1.20 1.10 0.8301 0.1699
Regulation 1.17 1.08 0.8548 0.1452
Competition 1.24 1.11 0.8066 0.1934
Human Dev. Index 3.67 1.92 0.2725 0.7275
Latin America 2.24 1.50 0.447 0.553
Africa 3.28 1.81 0.3046 0.6954
Middle East 1.29 1.14 0.7744 0.2256
Eastern Europe 2.15 1.47 0.4657 0.5343
Mean VIF 1.81
The above table confirms that there is no multicollinearity. Moreover the sample size is large
enough (403 cases) and the use of panel data analysis offer more options that lead to reduced
multicollinearity problem (Mersland and Strøm, 2008).
The linear regression model used incorporated additive to cover the hypotheses and
conceptual framework that established in this study. Hypothesis H1a, H2a on CEO
characteristics and MFI financial performance linear regression equation 1 and 2. Linear
regression equation 3, 4 and 5 tests H1b and H2b which is CEO characteristics and MFI
outreach performance. The regression models were run with and without control variables. In
order to interpret the results in a meaningful way; the models were tested for robustness.
Following are the linear regression models;
CEO characteristics and MFI profitability
………... (1)
Where;
=Return on assets for MFI i at time t, where i=1…..n and t=1….T
CEOBEXP=CEO business experience
CEOBEDU=CEO business education
Controls = control variables (MFI size, age, competition, HDI, bank regulation and region
dummies)
Unobserved heterogeneity MFI specific effect

25
The idiosyncratic errors as it vary across t as well as across i
CEO characteristics and portfolio quality
……… (2)
Where;
= Portfolio at risk with more than 30 days in arrears for MFI i at time t
CEO characteristics and MFI outreach
……….. (3)
Where;
= Average loan size for MFI i at time t
…… (4)
Where;
=Percentage of women clients for MFI i at time t
….... (5)
Where;
= Number Credit clients for MFI i at time t
4.7 Assumptions of multiple regression analysis
This section focuses in investigating whether the variables in the regression equation meets
these assumptions (Hair, 2010).These assumptions need to be met for the regression model to
precisely, predict the actual relationship among the variables (Hair, 2010). These are
particularly necessary when estimating the regression coefficients and dependent variable
prediction (Hair, 2010). The assumptions include linearity of the relationship between
dependent variables and independent variables, constant variance of the error term,
independence of the error terms and normality of the error term.
To test for Heteroscedasticity I use Breusch-Pagan test, which offer a test of a null
hypothesis that there is no heteroscedasticity across the range of independent variables. The
test results were not statistically significant (p>0.05 for 5 percent significant level) for
determinants of credit clients (CrClients), hence I failed to reject the null hypothesis. The test
results were statistically significant for determinants of profitability (aroa), determinants of
portfolio quality (PaR30), determinants of average loan size (Lsize) and, determinants of
percentage of women clients (Wclients); hence I rejected the null hypothesis (See table 4-6
from page 26 to 27 for detailed results). The presence of unequal variance, made this study

26
run these regression models with constant error as suggested by econometrics literature
(Greene, 2012, Studenmund, 2006, Verbeek, 2012).
Table 4-6 Breusch-Pagan tests for heteroscedasticity
Determinants of profitability (AROA)
Determinants of portfolio quality (PaR30)
Determinants of average loan size (Lsize)
Prob > chi2 = 0.0013 chi2(1) = 10.36
Variables: fitted values of aroa Ho: Constant varianceBreusch-Pagan / Cook-Weisberg test for heteroskedasticity
. hettest
Prob > chi2 = 0.0000 chi2(1) = 89.88
Variables: fitted values of PaR30 Ho: Constant varianceBreusch-Pagan / Cook-Weisberg test for heteroskedasticity
. hettest
Prob > chi2 = 0.0000 chi2(1) = 1819.38
Variables: fitted values of Lsize Ho: Constant varianceBreusch-Pagan / Cook-Weisberg test for heteroskedasticity
. hettest

27
Determinants of percentage of women clients (Wclients)
Determinants of credit clients (CrClients)
To test the normality of the error term this study uses normal probability plot (Hair, 2010).
The MFI size (assets) was not normally distributes. Hence a log transformation was
computed and the results are shown in table 4-7 below.
Table 4-7 Transformation of variable assets (MFI size)
All other variables were normally distributed.
Prob > chi2 = 0.0798 chi2(1) = 3.07
Variables: fitted values of Wclients Ho: Constant varianceBreusch-Pagan / Cook-Weisberg test for heteroskedasticity
. hettest
Prob > chi2 = 0.0000 chi2(1) = 500.44
Variables: fitted values of CrClients Ho: Constant varianceBreusch-Pagan / Cook-Weisberg test for heteroskedasticity
. hettest
0
2.0
00e
-084.0
00e
-086.0
00e
-08
8.0
00e
-08
De
nsity
0 50000000 1.000e+08 1.500e+08 2.000e+08 2.500e+08assets
Assets before Log Transformation
kernel = epanechnikov, bandwidth = 9.2e+05
Kernel density estimate
0.2
.4.6
De
nsity
4 5 6 7 8 9Logasset
Assets after Log Transformation
kernel = epanechnikov, bandwidth = 0.1213
Kernel density estimate

28
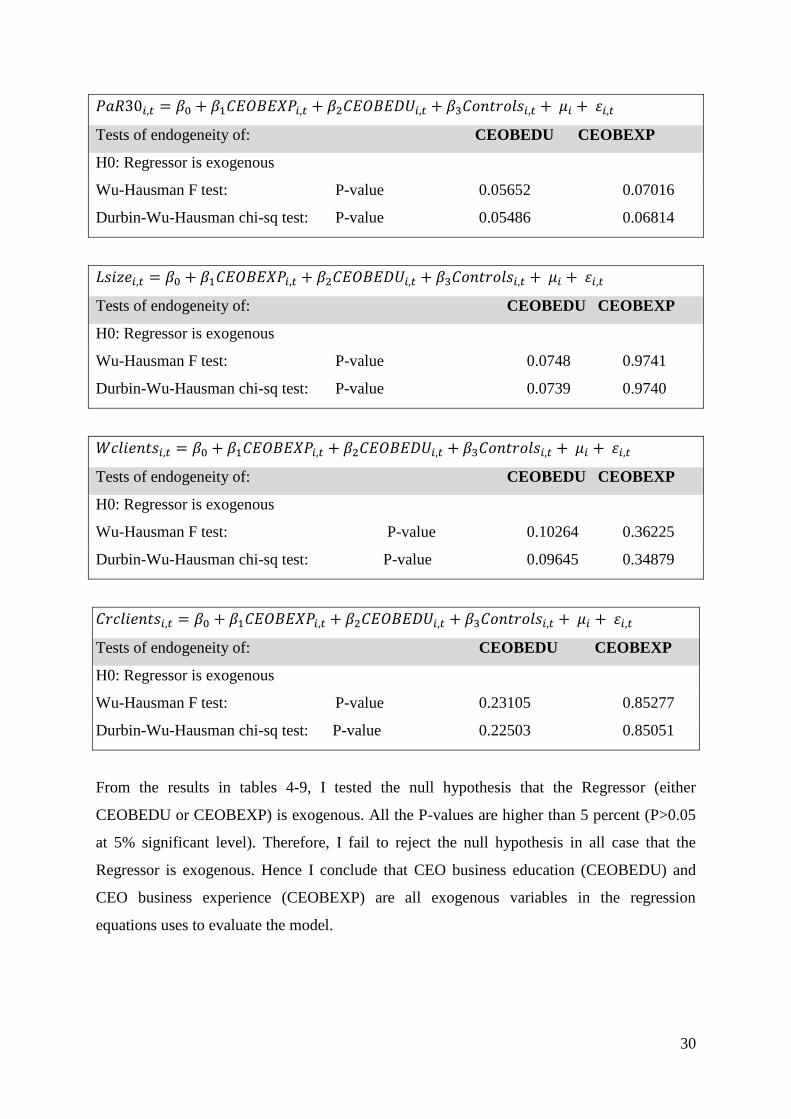
To test for autocorrelation of the error term I use Wooldridge test for autocorrelation
in panel data which test the null hypothesis that there is no first order autocorrelation (see
table 4-8 below for detailed information). The test results for determinants of credit clients
(CrClients) were not significant (p<0.05 for 5 percent significant level), hence I failed to
reject the null hypothesis.
Table 4-8 Wooldridge test for autocorrelation in panel data
Prob > F = 0.0000 F( 1, 83) = 44.790H0: no first order autocorrelationWooldridge test for autocorrelation in panel data
. xtserial aroa CEOBEXP CEOBEDU `controls'
Prob > F = 0.0001 F( 1, 120) = 15.602H0: no first order autocorrelationWooldridge test for autocorrelation in panel data
. xtserial PaR30 CEOBEXP CEOBEDU `controls'
Prob > F = 0.0000 F( 1, 123) = 63.750H0: no first order autocorrelationWooldridge test for autocorrelation in panel data
. xtserial Lsize CEOBEXP CEOBEDU `controls'
Prob > F = 0.0383 F( 1, 1) = 275.552H0: no first order autocorrelationWooldridge test for autocorrelation in panel data
. xtserial Wclients CEOBEXP CEOBEDU `controls'
Prob > F = 0.8885 F( 1, 123) = 0.020H0: no first order autocorrelationWooldridge test for autocorrelation in panel data
. xtserial CrClients CEOBEXP CEOBEDU `controls'

29
The test results for determinants of profitability (aroa), determinants of portfolio quality
(PaR30), determinants of average loan size (Lsize) and determinants of women clients
(Wclients) were all statistically significant (p<0.05 for 5 percent significant level); hence
rejected the null hypothesis. The presence of first order autocorrelation, made this study run
the regression model with standard error as suggested in econometrics literature (Gujarati and
Porter, 2010, Stock and Watson, 2003).
4.8 Instrumental variable approach
The objective of this study was to examine the effects of CEO characteristics (CEO formal
business education and business experience) on performance of MFIs. Given the causal
relationship I predicted, sometimes the MFIs may influence the CEO characteristics. Its
influence can emanate from being big or having better both financial and outreach
performance. This may lead into recruiting well educated (in the area of business education)
and well experience (in the area of business experience). Under such situation MFI
performance and CEO characteristics depends on each other (Marra and Radice, 2011). This
relationship creates a causal relationship to be on both directions, a problem which is called
endogeneity of the independent variables which is the main focus of the study in predicting
the dependent variable (Marra and Radice, 2011). If such situation exist it requires use of
simultaneous equations models (Gujarati, 2011, Gujarati and Porter, 2010).
The solution to such a situation is the use of instrumental variables approach as
suggested in the econometrics literature (e.g. Wooldridge, 2006). This method provides
consistent outcomes and is applicable in all form of analysis (Johnston and DiNardo, 1997,
Studenmund, 2006, Wooldridge, 2006). This offers a means by which it is possible to get
consistent estimator for when the predictor variables that are correlated with the error term
(Stock and Watson, 2003). To test the existence of endogeneity between CEO characteristics
and MFIs performance, I run instrumental variable two-stage least squares (2SLS) estimation
to obtain the Wu-Hausman F test and Durbin-Wu-Hausman chi-sq test for each regression
equation (Masaaki et al., 2011).
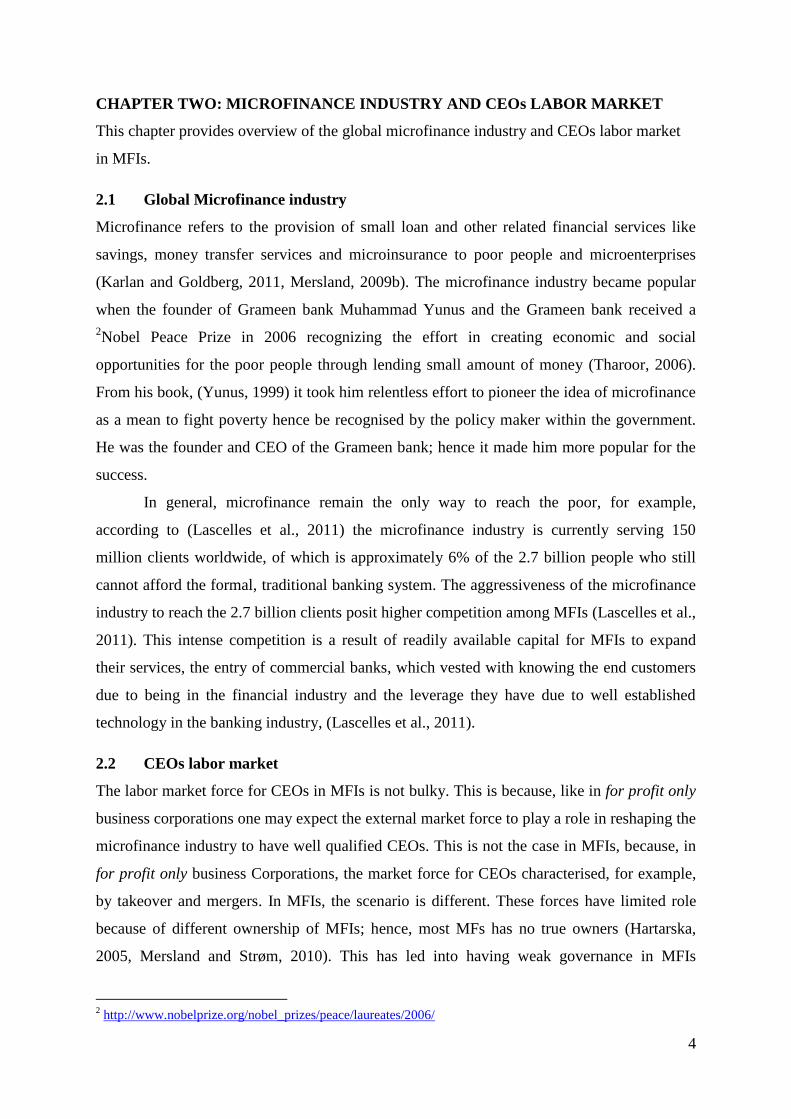
Table 4-9 testing for endogeneity results
Tests of endogeneity of: CEOBEDU CEOBEXP
H0: Regressor is exogenous
Wu-Hausman F test: P-value 0.30551 0.44793
Durbin-Wu-Hausman chi-sq test: P-value 0.29915 0.44158
30
Tests of endogeneity of: CEOBEDU CEOBEXP
H0: Regressor is exogenous
Wu-Hausman F test: P-value 0.05652 0.07016
Durbin-Wu-Hausman chi-sq test: P-value 0.05486 0.06814
Tests of endogeneity of: CEOBEDU CEOBEXP
H0: Regressor is exogenous
Wu-Hausman F test: P-value 0.0748 0.9741
Durbin-Wu-Hausman chi-sq test: P-value 0.0739 0.9740
Tests of endogeneity of: CEOBEDU CEOBEXP
H0: Regressor is exogenous
Wu-Hausman F test: P-value 0.10264 0.36225
Durbin-Wu-Hausman chi-sq test: P-value 0.09645 0.34879
Tests of endogeneity of: CEOBEDU CEOBEXP
H0: Regressor is exogenous
Wu-Hausman F test: P-value 0.23105 0.85277
Durbin-Wu-Hausman chi-sq test: P-value 0.22503 0.85051
From the results in tables 4-9, I tested the null hypothesis that the Regressor (either
CEOBEDU or CEOBEXP) is exogenous. All the P-values are higher than 5 percent (P>0.05
at 5% significant level). Therefore, I fail to reject the null hypothesis in all case that the
Regressor is exogenous. Hence I conclude that CEO business education (CEOBEDU) and
CEO business experience (CEOBEXP) are all exogenous variables in the regression
equations uses to evaluate the model.

31
4.9 The choice between fixed effect model or random effect model
The use of panel data model allows using either the fixed effect models or random effect
models to estimates the dependence relationship among the variables, while taking care the
issue of omitted variables. The decision of whether to use fixed effect or random effect
models was made based on the results of Hausman test as suggested in the econometrics
literature (Baum, 2006, Chamberlain, 1985, Stock and Watson, 2003, Verbeek, 2012,
Wooldridge, 2006). Table 4-10 show detailed results for the Hausman test and table 4-11
shows summarised results for the choice of the model.
Table 4-10 Hausman test Determinants of profitability (AROA)
Determinants of Portfolio quality (PaR30)
Prob>chi2 = 0.1971 = 8.60 chi2(6) = (b-B)'[(V_b-V_B)^(-1)](b-B)
Test: Ho: difference in coefficients not systematic
B = inconsistent under Ha, efficient under Ho; obtained from xtreg b = consistent under Ho and Ha; obtained from xtreg LatinA -.032546 -.0354563 .0029103 .1259948 MFIsize -.1111447 .0568407 -.1679853 .0989882 MFIage .0420736 .0016794 .0403943 .0174841 hdi -2.210625 .0475361 -2.258161 1.938425 Regulation -.2169349 -.0615208 -.1554141 .1033061 Competition -.015015 .0042918 -.0193068 .0290122 fe re Difference S.E. (b) (B) (b-B) sqrt(diag(V_b-V_B)) Coefficients
. hausman fe re
Prob>chi2 = 0.9642 = 1.43 chi2(6) = (b-B)'[(V_b-V_B)^(-1)](b-B)
Test: Ho: difference in coefficients not systematic
B = inconsistent under Ha, efficient under Ho; obtained from xtreg b = consistent under Ho and Ha; obtained from xtreg LatinA .0361179 .0201253 .0159925 .1203207 MFIsize -.0314872 -.038391 .0069038 .0655606 MFIage .0035804 .0027212 .0008592 .009701 hdi .3445742 -.0495416 .3941159 1.789824 Regulation .0020437 .0167473 -.0147037 .0189982 Competition -.0146404 .0008625 -.0155029 .0164937 fe re Difference S.E. (b) (B) (b-B) sqrt(diag(V_b-V_B)) Coefficients
. hausman fe re

32
Determinants of average loan size (Lsize)
Determinants of percentage of women clients (Wclients)
(V_b-V_B is not positive definite) Prob>chi2 = 0.5080 = 5.28 chi2(6) = (b-B)'[(V_b-V_B)^(-1)](b-B)
Test: Ho: difference in coefficients not systematic
B = inconsistent under Ha, efficient under Ho; obtained from xtreg b = consistent under Ho and Ha; obtained from xtreg LatinA -.2667962 .5465986 -.8133949 .3971688 MFIsize .1073759 -.2989781 .406354 .2485243 MFIage -.0371241 -.0064502 -.0306739 .0403167 hdi -5.123757 .3672725 -5.491029 7.910399 Regulation .0511063 .1250261 -.0739198 .0417709 Competition .0160854 -.0135836 .029669 .0834212 fe re Difference S.E. (b) (B) (b-B) sqrt(diag(V_b-V_B)) Coefficients
. hausman fe re
(V_b-V_B is not positive definite) Prob>chi2 = 0.1472 = 8.17 chi2(5) = (b-B)'[(V_b-V_B)^(-1)](b-B)
Test: Ho: difference in coefficients not systematic
B = inconsistent under Ha, efficient under Ho; obtained from xtreg b = consistent under Ho and Ha; obtained from xtreg MFIsize .0150331 -.0177035 .0327366 .1175202 MFIage -.0036629 .0022717 -.0059346 .0310397 hdi 2.815781 1.13776 1.678022 1.069967 Regulation -.0237408 -.0179774 -.0057634 .0042089 Competition -.0086884 .0052816 -.01397 .0168393 fe re Difference S.E. (b) (B) (b-B) sqrt(diag(V_b-V_B)) Coefficients
. hausman fe re

33
Determinants of credit clients (CrClients)
Table 4-11 results Fixed Effect Model vs. Random Effect Model Hausman Test Variable Fixed Effect Model Random Effect Model
Profitability (AROA) X
Portfolio quality (PaR30) X
Outreach (average Loan size,
percentage of women clients,
credit clients)
X
Source: Author own constructs
Key: X= Not appropriate;
= Appropriate
From the Hausman test table 4-10 and table 4-11 which show summary of the results, the
conclusion is that, there is a failure to reject the null hypothesis of “difference in coefficients
not systematic” to determinants of profitability (aroa), determinants of portfolio quality
(PaR30), determinants of average loan size (Lsize), determinants of percentage of women
clients (Wclients) and, determinants of credit client (CrClients). This is because the value of
is . Therefore, this implies that, these are analysed using the random
effects model.
Prob>chi2 = 0.8136 = 2.96 chi2(6) = (b-B)'[(V_b-V_B)^(-1)](b-B)
Test: Ho: difference in coefficients not systematic
B = inconsistent under Ha, efficient under Ho; obtained from xtreg b = consistent under Ho and Ha; obtained from xtreg LatinA 524.9933 -8688.773 9213.766 10384.01 MFIsize 13315.42 17414.15 -4098.729 5651.443 MFIage 376.4987 -39.26258 415.7613 856.2036 hdi 47561.51 -59798.61 107360.1 159570.8 Regulation -3524.48 -2645.105 -879.3746 1350.661 Competition -1811.413 -330.204 -1481.209 1368.395 fe re Difference S.E. (b) (B) (b-B) sqrt(diag(V_b-V_B)) Coefficients
. hausman fe re

34
CHAPTER FIVE: DATA ANALYSIS AND FINDINGS
This chapter presents the finding and empirical analysis of the relationships predicted in the
hypotheses. The empirical analyses include use of random effect model. Relationships
between variables are presented with brief comments on this chapter and, fully discussions
are done on the next chapter.
Tab 5-1 Descriptive statistics for dependent, independent and control variables Variable Mean Std. Dev. Min Max N
Dependent variables
Adjusted Return on Assets (AROA) 0.0105 0.1217 -0.9900 0.3420 1421
Portfolio at risk (PaR30) 0.0634 0.0967 -0.2710 0.9730 1465
Average loan size 1.1584 7.1619 0.0000 175.4167 1390
Percentage of women clients 0.7087 0.2520 0.0000 1.0000 243
Credit clients 12909.18 27295.36 0.0000 394462 1438
Independent variables
CEO business experience 0.6387 0.4805 0.0000 1.0000 1019
CEO business education 0.5209 0.4998 0.0000 1.0000 566
MFI Control variables
Regulation 0.2827 0.4561 0.0000 3.0000 1567
MFI size 7.7488 1.6122 2.9089 12.8498 1537
MFI age 9.2631 6.7452 0.0000 79.0000 1604
Country control variable
Human Deve. Index (HDI) 0.5627 0.1343 0.2390 0.7640 1573
Competition 4.3943 1.5311 1.0000 7.0000 459
Region control variables
Latin America 0.2934 0.4554 0.0000 1.0000 3627
Africa 0.2357 0.4245 0.0000 1.0000 3627
Middle East 0.0372 0.1893 0.0000 1.0000 3627
Eastern Europe 0.1830 0.3867 0.0000 1.0000 3627
5.1 Descriptive evidence
From the table 5-1; 63.87% of CEO has business experience; this is because the business
experience includes attributes such as CEO ownership of business, management of the
previous business prior to becoming the CEO and if the CEO is hired internally within the
MFI. This is evidenced by the fact that most MFIs are started by an individual who has

35
entrepreneurial skills and or ideas to help poor people and, who eventually become CEO (e.g
Valadez and Buskirk, 2011a, Yunus, 1999). There is 52.09% of CEO with business
education. This is not surprising because the CEO education is considered as a university
level undergraduate or graduate in business, banking, accounting, management, and
economics and similar. It takes many years to acquire this formal business education. This
implies that there are more CEOs with business experience than CEO with business
education.
The region control variables has the highest number of observations because there is
no missing value and the number of cases from 74 countries were 403 of which were
collected from 2001 to 2009 for 9 years ( . There are few numbers of
observations for percentages of women clients and competition because there are one to two
years of records available which capture these variables.
Tab 5-2 Correlations for dependent variables
1 2 3 4 5
(1)AROA 1
(2)PaR30 -0.2696* 1
(3)Average loan size -0.0775* 0.0021 1
(4)Percentage of women clients 0.1048 -0.0255 0.0407 1
(5)Credit clients 0.1162* -0.0958
* -0.0527
* 0.1991
* 1
*indicates p < 0.05
From table 5-2 above, the correlation between the return on assets and portfolio at risk is
negative which means that better return on assets is related to fewer loans defaults and is
significant at p<0.05 (at 5 percent significant level). The practice of clients paying the loan
amount plus interest thereon ensures availability of loan to other clients. The average loan
size is negatively related to return on assets and is significant at p<0.05 (at 5 percent
significant level). More credit clients are associated with profitability.
5.2 Regression results and data analysis
This section analyses the results from the regression output of the relationship between CEO
formal business education and experience on financial and outreach performance.
CEO characteristics and MFIs financial performance of return on assets and portfolio
at risk (PaR30) are presented in table 5-3.

36
Tab 5-3 CEO characteristics and MFI Financial performance (1) (2) (3) (4)
AROA AROA PaR30 PaR30
CEO=Bus. experience 0.106* 0.167
* -0.118
* -0.157
*
(2.03) (2.18) (-2.16) (-2.33)
CEO=Bus. education 0.0402 0.0111 0.00760 -0.00996
(0.99) (0.28) (0.38) (-0.46)
MFI age 0.00168 0.00271*
(0.83) (2.47)
MFI size 0.0563* -0.0382
**
(2.37) (-2.72)
Competition 0.00438 0.000915
(0.50) (0.19)
Regulation -0.0627* 0.0178
(-2.01) (1.36)
Human Dev. Index -0.501***
0.373***
(-3.30) (4.23)
_cons 0.305**
0.423**
-0.118***
-0.107***
(2.69) (2.92) (-3.46) (-3.73)
N 312 149 453 198
Overall R-sq 0.0128 0.1011 0.0267 0.17
Wald χ2 (2) 5.95 (11) 21.09 (2) 12.91 (11) 36.49
Prob > chi2 0.0510 0.0205 0.0016 0.0001
z statistics in parentheses
+indicates p<0.10, *indicates p < 0.05,
**indicates p < 0.01,
*** indicates p < 0.001
The data analysis of the output is based on the research question “Does MFIs with CEO with
formal business education and business experience have better outreach and financial
performance compared with MFIs with CEO without formal business education and business
experience?” and the following hypotheses.
Hypothesis 1a: MFIs with CEO with formal business education have better financial
performance compared with MFIs with CEO without formal business education.
Hypothesis 2a: MFIs with CEO with business experience have better financial performance
compared with MFIs with CEO without business experience.

37
From the table 5-3 page 36 (model 2 and 4 ) the coefficient of CEO with business experience
on return on assets is positive, as expected, and on portfolio at risk for 30 days is negative, as
expected, and all are statistically significant at p<0.05 (for 5 percent significant level). This
confirms the second hypothesis (H2a) namely; MFIs with CEO with business experience
have better financial performance compared with MFIs with CEO without business
experience. This variable also has significant influence on return on assets t=2.18; Portfolio at
risk for 30 days t=-2.33 which both are higher than t=1.96 (for 95 percent confidence
level).The coefficient for CEO with formal business education (model 2 and 4) on return on
assets is positive, as expected, and on portfolio at risk for 30 days is negative, as expected but
all are statically not significant. This result does not support the first hypothesis (H1a)
namely; MFIs with CEO with formal business education have better financial performance
compared with MFIs with CEO without formal business education.
CEO characteristics and MFIs outreach performance of average loan size, percentage
of women clients and credit clients are presented in table 5-4. The analysis of the output is
based on the research question “Does MFI with CEO with formal business education and
business experience have better outreach and financial performance compared with MFIs
with CEO without formal business education and business experience?” and the following
hypotheses.
Hypothesis 1b: MFIs with CEO with formal business education are associated with more
outreach performance compared with MFIs with CEO without formal business education.
Hypothesis 2b: MFIs with CEO with business experience have more outreach performance
compared with MFIs with CEO without business experience.

38
Tab 5-4 CEO characteristics and MFI outreach performance (1) (2) (3) (4) (5) (6)
Average
Loan
size
Average
Loan size
Percenta
ge of
Women
Clients
Percentage
of Women
Clients
Credit
clients
Credit
clients
CEO=Bus. experience -1.522* -1.598
* 0.161
** 0.153
* 1447.6
* 1910.0
*
(-2.25) (-2.52) (2.49) (2.28) (2.03) (-2.09)
CEO=Bus. education -0.648 -0.873* 0.147
* 0.161
* 3693.7 1695.6
+
(-1.67) (-2.22) (2.38) (2.48) (1.38) (1.65)
MFI age -0.00641 0.00035 136.9
(-0.36) (0.08) (1.02)
MFI size -0.284 -0.0109 5567.1***
(-1.70) (-0.78) (5.66)
Competition -0.0147 0.0139 -1798.7
(-0.22) (0.93) (-1.75)
Regulation 0.120 -0.0140 -518.8
(1.25) (-1.28) (-0.78)
Human Dev. Index 4.233***
1.097***
-29109.9*
(3.88) (3.32) (-2.05)
_cons -2.922**
-3.598**
0.668***
0.124**
7564.6***
-50023.2***
(-3.25) (-4.52) (18.63) (10.52) (6.67) (-3.50)
N 464 197 100 88 618 509
Overall R-sq 0.0138 0.1276 0.0387 0.2099 0.0074 0.2644
Wald χ2 (2) 12.02 (11)30.95 (2)6.24 (11) 29.89 (2) 32.56 (11) 40.07
Prob > chi2 0.0025 0.0006 0.0441 0.0017 0.0008 0.0003
z statistics in parentheses
+indicates p<0.10,
*indicates p < 0.05,
**indicates p < 0.01,
*** indicates p < 0.001
From table 5-4 above (model 2, 4 and 6) the coefficient for CEO with business experience on
average loan size is negative, as expected, and on percentage of women clients is positive, as
expected, and on credit clients is positive, as expected, and all are statistically significant at
p<0.05 (for 5 percent significant level). These confirm the second hypothesis (H2b) namely;
MFIs with CEO with business experience have better outreach than MFIs with CEO without
business experience. This variable also has a strong influence on average loan size (t=-2.52);

39
percentage of women clients (t=2.28); and credit clients (t=-2.09) which both are higher than
t=1.96 (for 95 percent confidence interval).
The coefficient for CEO with formal business education (model 2, 4 and 6) on
average loan size is negative, as expected, and on percentage of women clients is positive, as
expected, and on credit clients is positive, as expected, and all are statistically significant at
p<0.05 for average loan size and percentage of women clients; and p<0.1 for credit clients.
These confirm the first hypothesis (H1b) namely; MFIs with CEO with formal business
education have better outreach performance compared with MFIs with CEO without formal
business education. This variable has pronounced influence on average loan size and
percentage of women clients where the absolute value of t is higher than 1.96 (for 95 percent
confidence level).
5.3 Additional regression analyses and robustness checks
I performed additional regression analysis to see if the outcomes of CEO characteristics on
MFIs performance are influenced by CEO founder, given that empirical evidence shows that
CEO founder are associated with better MFIs performance (Mersland. et al., 2011). Using
random effect model (REM), I run a regression for each of the dependent variables in
financial and outreach performance as previously used with the option of “if CEO
founder==0”. This means that CEO with formal business education and experience who are
not founder of the MFI they manage. Lastly, I run regression analysis with Operating Self-
Sufficiency (OSS) and Write-off have as dependent variables in the model, in order to check
the extent of influence of CEO formal business education and business experience. I also use
the option of “if CEO is founder==0”
I also tested for the existence of endogeneity in the relationship between CEO
characteristics who are not founder, Operating self-sufficiency and write-off and MFIs
performance. The results in table 5-5 next page show that endogeneity problem does not exist
in these relationships.

40
Tab 5-5 additional regression and robustness checks testing for endogeneity results
AROA If CEO founder==0
Tests of endogeneity of:
CEOBEDU CEOBEXP
H0: Regressor is exogenous
Wu-Hausman F test: P-value 0.13364 0.35115
Durbin-Wu-Hausman chi-sq test: P-value 0.12461 0.33734
PaR30 If CEO founder==0
Tests of endogeneity of:
CEOBEDU CEOBEXP
H0: Regressor is exogenous
Wu-Hausman F test: P-value 0.25889 0.13269
Durbin-Wu-Hausman chi-sq test: P-value 0.24837 0.12533
Average Loan size If CEO founder==0
Tests of endogeneity of:
CEOBEDU CEOBEXP
H0: Regressor is exogenous
Wu-Hausman F test: P-value 0.87275 0.24701
Durbin-Wu-Hausman chi-sq test: P-value 0.87144 0.23655
Percentage of Women clients If CEO founder==0
Tests of endogeneity of:
CEOBEDU CEOBEXP
H0: Regressor is exogenous
Wu-Hausman F test: P-value 0.09865 0.6435
Durbin-Wu-Hausman chi-sq test: P-value 0.08641 0.62526
Credit Clients If CEO founder==0
Tests of endogeneity of:
CEOBEDU CEOBEXP
H0: Regressor is exogenous
Wu-Hausman F test: P-value 0.19715 0.84215
Durbin-Wu-Hausman chi-sq test: P-value 0.19155 0.83974
Operating Self-Sufficiency
Tests of endogeneity of:
CEOBEDU CEOBEXP
H0: Regressor is exogenous
Wu-Hausman F test: P-value 0.33874 0.99111
Durbin-Wu-Hausman chi-sq test: P-value 0.32605 0.99085
Operating Self-Sufficiency If CEO founder==0
Tests of endogeneity of:
CEOBEDU CEOBEXP
H0: Regressor is exogenous
Wu-Hausman F test: P-value 0.0733 0.90675
Durbin-Wu-Hausman chi-sq test: P-value 0.06568 0.90263
Write-off
Tests of endogeneity of:
CEOBEDU CEOBEXP
H0: Regressor is exogenous
Wu-Hausman F test: P-value 0.13076 0.67756
Durbin-Wu-Hausman chi-sq test: P-value 0.12569 0.67219
Write-off If CEO founder==0
Tests of endogeneity of:
CEOBEDU CEOBEXP
H0: Regressor is exogenous
Wu-Hausman F test: P-value 0.4531 0.50478
Durbin-Wu-Hausman chi-sq test: P-value 0.44168 0.49384

41
Table 5-6 below report CEO characteristics and MFIs return on assets and portfolio at risk for
30 days when CEO is not founder. The results show that there is a positive and statically
significant p<0.05 (at 5 percent significant level), as expected, coefficient for CEO business
experience on return on assets; negative and statistically significant p<0.05 (at 5 percent
significant level), as expected, on portfolio at risk for 30 days. The coefficient of CEO formal
business education is not significant, as expected, in both return on assets and portfolio at risk
for 30 days.
Table 5-7 report CEO characteristics and MFIs outreach when CEO is not founder.
The results shows that there is a positive and statistically significant p<0.05 (at 5 percent
significant level), as expected, coefficient of CEO business experience on percentage of
women clients and credit clients.
Tab 5-6 CEO characteristics and MFI financial performance without CEO founder (1) (2) (3) (4)
AROA AROA PaR30 PaR30
CEO=Bus. experience 0.0514+ 0.0374
* -0.048
* -0.0366
*
(1.91) (2.20) (-1.98) (-2.26)
CEO=Bus. education -0.0037 -0.00098 0.0005 0.0110
(-0.28) (-0.07) (0.03) (0.69)
MFI age 0.000148 0.00128
(0.15) (1.22)
MFI size 0.0262* 0.00857
*
(4.15) (2.11)
Competition 0.00255 0.00360
(0.60) (0.72)
Regulation -0.0376* 0.00901
(-2.31) (0.79)
Human Dev. Index -0.167* -0.0809
(-2.08) (-1.06)
_cons 0.0396* 0.260
** -0.230
** -0.227
***
(2.36) (2.81) (-2.58) (-3.37)
N 600 507 592 559
Overall R-sq 0.0192 0.1178 0.0539 0.0785
Wald χ2 (2)10.95 (11) 43.09 (2)21.54 (11) 35.75
Prob > chi2 0.0042 0.0053 0.0001 0.0003
z statistics in parentheses
+indicates p<0.10, *indicates p < 0.05,
**indicates p < 0.01,
*** indicates p < 0.001

42
The coefficient for CEO business experience on average loan size is negative, as expected,
and statistically significant p<0.05 (at 5 percent significant level).
The coefficient for CEO with formal business education is positive and statistically
significant p<0.05 (at 5 significant level), as expected, on percentage of women clients, and is
positive and statistically significant p<0.1 (at 10 percent significant level), as expected, on
credit clients. The coefficient of CEO formal business education on average loan size is
negative, as expected, and statistically significant p<0.05 (at 5 percent significant level).
Tab 5-7 CEO characteristics and MFI Outreach performance without CEO founder (1) (2) (3) (4) (5) (6)
Average
Loan
size
Average
Loan
size
Percentage
of Women
Clients
Percentage
of Women
Clients
Credit
clients
Credit
clients
CEOBEXP -1.167* -1.374
* 0.0731
* 0.0669
* 10341.5
* 1180.5
*
(-2.13) (-2.24) (2.31) (2.19) (1.98) (2.04)
CEOBEDU -0.576 -0.784* 0.119
* 0.1497
* 3563.5 1676.0
+
(-1.41) (-2.03) (2.11) (2.36) (1.22) (1.67)
MFI age -0.0088 -0.00364 69.49
(-0.48) (-0.67) (0.38)
MFI size -0.0359 0.0250 7190.5***
(-0.32) (1.20) (8.08)
Competition 0.135 -0.0146 -1068.4
(1.55) (-0.67) (-1.24)
Regulation -0.162 -0.0218 -1074.8
(-0.57) (-0.24) (-0.48)
Human Dev. Index -0.178 1.466***
-23514.2
(-0.13) (3.79) (-1.60)
_cons 0.1456**
-0.2504**
0.665***
-0.783***
-6050.9**
-76490.4***
(2.49) (-3.03) (5.15) (-6.84) (-3.32) (-5.22)
N 258 242 54 47 259 243
Overall R-sq 0.0129 0.0493 0.0187 0.1554 0.0044 0.1635
Wald χ2 (2) 9.77 (11)28.8
9
(2) 4.24 (11) 24.78 (2) 27.00 (11)29.49
Prob > chi2 0.0016 0.0003 0.0243 0.0058 0.0000 0.0000
z statistics in parentheses
+indicates p<0.10,
*indicates p < 0.05,
**indicates p < 0.01,
*** indicates p < 0.001
From the robust regression in table 5-6 and 5-7, I conclude that I find no effect when the
CEO fonder is not included as CEO with business experience and formal business, hence the
report results are robust.
43
To run the additional regression analysis for operating self-sufficiency and write-off, this
study checked whether they models that are used obey the assumptions of multiple regression
analysis. The operating self-sufficiency and write-off variables were normally distributed.
I tested for heteroscedasticity using Breusch-Pagan test. Table 5-8 below shows the
results. The test results for determinants of operating self-sufficiency (OSS) were not
statistically significant (p>0.05 for 5 percent significant level), hence I failed to reject the null
hypothesis. The test results for determinants of write off is statistically significant (p<0.05 for
5 percent significant level), which implies that there is unequal variance. Therefore, this
model was run with constant error as suggested by econometrics literature (Verbeek, 2012,
Studenmund, 2006, Greene, 2012).
Tab 5-8 additional regression Breusch-Pagan test for heteroscedasticity
Determinants of write-off
I tested autocorrelation using Wooldridge test. Table 5-9 next page shows the results. The
results for determinants of write off were not significant (p>0.05 for 5 percent significant
level), hence I failed to reject the null hypothesis. The result for determinants of operating
self-sufficiency was statistically significant (p<0.05 for 5 percent significant level), hence I
rejected the null hypothesis, apparently, the model was run with standard error as suggested
in econometrics literature (Gujarati and Porter, 2010, Stock and Watson, 2003).
Prob > chi2 = 0.4790 chi2(1) = 0.50
Variables: fitted values of OSS Ho: Constant varianceBreusch-Pagan / Cook-Weisberg test for heteroskedasticity
. hettest
Prob > chi2 = 0.0000 chi2(1) = 157.06
Variables: fitted values of write_off Ho: Constant varianceBreusch-Pagan / Cook-Weisberg test for heteroskedasticity
. hettest

44
Tab 5-9 Wooldridge test for Autocorrelation results Determinants of operating self-sufficiency (OSS)
Determinants of write off
I also run Hausman test to decide the model for use. Table 5-10 next page shows the results.
All test results were statistically not significant (p>0.05 for 5 percent significant level); hence
I failed to reject the null hypothesis. Following these results, I used random effect model to in
the regression analysis.
Prob > F = 0.0007 F( 1, 75) = 12.465H0: no first order autocorrelationWooldridge test for autocorrelation in panel data
. xtserial OSS CEOBEXP CEOBEDU `controls'
Prob > F = 0.0765 F( 1, 118) = 3.193H0: no first order autocorrelationWooldridge test for autocorrelation in panel data
. xtserial write_off CEOBEXP CEOBEDU `controls'

45
Tab 5-10 additional regression Hausman test results Determinants of operating self-sufficiency
Determinants of write-off
Table 5-11 next page shows robust regression results for CEO characteristics and MFIs
operational self-sufficiency (OSS) when the CEO is founder and when the CEO not founder.
From the table, CEO business experience coefficient is positive and statistically significant
p<0.05 (at 5 percent significant level) in both case when the CEO is founder and not founder.
The coefficient for CEO with formal business education is not significant in both case, when
the CEO is founder and when the CEO is not founder.
Table 5-12 page 47 shows robust regression results for CEO characteristics and MFIs
write-off when the CEO is fonder and when not founder. The coefficient for CEO with
business experience in both case is negative, and statistically significant p<0.05 (at 5 percent
Prob>chi2 = 0.5072 = 3.31 chi2(4) = (b-B)'[(V_b-V_B)^(-1)](b-B)
Test: Ho: difference in coefficients not systematic
B = inconsistent under Ha, efficient under Ho; obtained from xtreg b = consistent under Ho and Ha; obtained from xtreg MFIsize -1.158702 .2122747 -1.370976 1.08068 MFIage .3444186 -.0113806 .3557993 .2242918 hdi .166146 .0061652 .1599808 14.87311 Competition -.3521799 -.0049933 -.3471866 .249044 fe re Difference S.E. (b) (B) (b-B) sqrt(diag(V_b-V_B)) Coefficients
. hausman fe re
Prob>chi2 = 0.3168 = 5.89 chi2(5) = (b-B)'[(V_b-V_B)^(-1)](b-B)
Test: Ho: difference in coefficients not systematic
B = inconsistent under Ha, efficient under Ho; obtained from xtreg b = consistent under Ho and Ha; obtained from xtreg MFIsize .0214028 -.0061793 .0275821 .0166707 MFIage -.0052218 .0002503 -.0054721 .002527 hdi -.0645513 .062998 -.1275493 .4700812 Regulation .00125 -.0017047 .0029547 .0045331 Competition .0001789 -.0026148 .0027936 .0062354 fe re Difference S.E. (b) (B) (b-B) sqrt(diag(V_b-V_B)) Coefficients
. hausman fe re

46
significant level). The results for CEO with formal business education are somehow
appealing.
Tab 5-11 CEO characteristics and operational self-sufficiency With CEO founder Without CEO founder
(1) (2) (3) (4)
OSS OSS OSS OSS
CEOBEXP 0.0415 0.0779* 0.0316 0.06117
*
(1.14) (2.12) (1.01) (2.01)
CEOBEDU 0.0569 -0.0229 -0.0302 -0.0874
(0.75) (-0.29) (-0.21) (-0.67)
MFI age -0.00638 -0.00895
(-1.36) (-1.70)
MFI size 0.0902***
0.143***
(4.15) (4.85)
Competition 0.00741 0.0149
(0.34) (0.60)
Regulation -0.104 -0.238**
(-1.28) (-2.65)
Human Dev. Index 0.650 0.402
(1.32) (0.67)
_cons 1.087***
1.543**
1.071**
-1.334**
(4.31) (5.29) (3.55) (-4.72)
N 368 341 170 159
Overall R-sq 0.0031 0.1004 0.0067 0.2354
Wald χ2 (2) 5.21 (11)31.41 (2)18.32 (11)36.61
Prob > chi2 0.048 0.0009 0.0051 0.0001
z statistics in parentheses
+indicates p<0.10, *indicates p < 0.05,
**indicates p < 0.01,
*** indicates p < 0.001
When the CEO founder is grouped with the CEO characteristics, the coefficient is negative
and not significant, but when the CEO founder is not included, the coefficient is positive and
statistically significant p<0.05 (at 5 percent significant level).
I found significant results (p<0.05 at 5 percent significant level) from the robust
regression results in table 5-11 and 5-12 on CEO characteristics, MFIs operational self-
sufficiency and write-off when the CEO is founder grouped in CEO characteristics and when
excluded. CEO business experience is associated with covering their cost of operation
through revenue. The results are significant in both cases when the CEO founder grouped in
CEO characteristics and when excluded. This is consistent with the result I obtained when I
used the return on assets. The results also show that CEO with business experience is
associated with few write-offs of loan. This is same in both cases when the CEO founder is
grouped in CEO characteristics and when excluded.

47
Tab 5-12 CEO characteristics and the write-off With CEO founder Without CEO founder
(1) (2) (3) (4)
Write-off Write-off Write-off Write-off
CEOBEXP -0.00409 -0.00801* -0.00505 -0.00619
*
(-1.10) (-2.00) (-1.35) (-1.98)
CEOBEDU -0.00527 -0.00352 0.0161* 0.0166
*
(-1.07) (-1.26) (2.86) (3.30)
MFI age 0.000169 0.000293
(0.70) (0.88)
MFI size -0.00308* -0.00448
*
(-2.21) (-2.05)
Competition -0.000978 -0.00262
(-0.87) (-1.63)
Regulation 0.00247 0.00363
(0.65) (0.67)
Human Dev. Index 0.0417 0.0144
(1.72) (0.38)
_cons 0.0217***
0.1420***
0.03721***
0.0742****
(7.23) (8.74) (6.75) (7.01)
N 576 557 245 234
Overall R-sq 0.0161 0.1543 0.0170 0.0866
Wald χ2 (2)36.72 (11)30.83 (2)41.89 (11)39.99
Prob > chi2 0.0013 0.0000 0.000 0.000
z statistics in parentheses
+indicates p<0.10, *indicates p < 0.05,
**indicates p < 0.01,
*** indicates p < 0.001

48
CHAPTER SIX: DISCUSSION, CONCLUSION, IMPLICATIONS, AREAS FOR
FUTURE STUDIES AND LIMITATIONS
This section discusses the results from the data analysis in chapter five. The discussion covers
theoretical policy and managerial implications of the findings, future areas of study and
limitations of the study.
6.1 Discussion
Most of the existing literature on CEO characteristics and firm performance are in the context
of limited liabilities companies which focuses on profit motives only (e.g. Barker and
Mueller, 2002, Rajagopalan and Datta, 1996, Harjoto and Jo, 2009, Nelson, 2005, Manner,
2010, Bigley and Wiersema, 2002a, Bhagat et al., 2010a, Gottesman and Morey, 2010,
Gottesman and Morey, 2006, Jalbert et al., 2011). A critical question is that, is there
significant results to support the fact that MFIs with CEO with formal business education and
business experience have better performance compared to MFI with CEO without these
characteristics?
Drawing from resource based view theory and upper echelons theory (Slater and
Dixon-Fowler, 2009, Kunc and Morecroft, 2010, Roth, 1995); I have argued that, CEO is
unique, resourceful personnel having managerial characteristics of formal business education
and business experience. The interactions of these managerial characteristics with strategic
decision making process enable the MFIs they manage to have better financial and outreach
performance compared to MFIs with CEO without these managerial characteristics (Stuart,
2011). The results support this argument for MFIs with CEO with business experience and
partly support the argument for MFIs with CEO with formal business education.
The positive and significant results coefficient of CEO with business experience on
return on assets; credit clients and percentage of women clients are vital. This is because
MFIs with CEO with business experience are more profitable; associated with credit clients
growth and serves more women clients who have an exemplary record of paying their loan
(D’Espallier et al., 2011, McCarter, 2006) than MFIs which their CEO does not have business
experience.
The negative and significant results (at p<0.05 for 5 percent significant level)
coefficient of CEO with business experience on average loan size, and portfolio at risk for 30

49
days imply that MFI with CEO with business experience provide smaller loan and their
clients have fewer default of outstanding loan for 30 days. The smaller loan is the reflection
of reaching more poor clients (Galema and Lensink, 2011, Armendariz and Labie, 2011),
and timely repayment rate of loan is consistent with the focus on women clients, which has
fewer defaults. The use of average loan size, percentage of women clients and credit clients
measures of outreach are also, recently used in the MFIs literature (Mersland et al., 2011,
Mersland and Strøm, 2009a, Hartarska and Mersland, 2009, Galema and Lensink, 2011).
Therefore, MFIs with CEO with business experience, reach more clients, have fewer
defaults and are profitable compared with MFIs with CEO without business experience
(Hartarska, 2005, Stuart and Abetti, 1990, Stuart, 2011, Sow Hup, 2010). There is anecdotal
evidence to support this argument that profitability with a focus on clients is a core to success
of many MFIs business model (DiLeo., 2012, Ayayi and Sene, 2010).
The statistical insignificance coefficient of CEO with formal business education on
return on assets and portfolio at risk for 30 days, means, that MFIs with CEO with formal
business education profitability and rate of defaults does not perform differently from those
MFIs which their CEO without formal business education (e. g. University degree in
engineering and law). There is empirical support to this results in the international business
research, where CEO with formal business education does not perform differently from those
CEO with other discipline of education4 (Gottesman and Morey, 2010, Gottesman and
Morey, 2006, Jalbert et al., 2011, Martelli and Abels, 2010, Dreher and Ryan, 2001). Other
studies (e.g. Bhagat et al., 2010a) show that formal business education brings short term
improvement in financial performance, but the relationship is not significant in the long term
financial performance.
The positive statistical significant results coefficient of CEO with formal business
education on percentage of women clients (p<0.05 at 5 percent significant level); and on
credit clients (p<0.1 at 10 percent significant level) is vital. This is because, MFIs with CEO
with formal business education serves more female clients and have better credit clients’
growth compared to MFIs with CEO without formal business education. This implies that
CEO with formal business education fosters outreach through reaching more credit clients
4 For example CEO with University degree in Engineering and law

50
who are women and who has a solid history of repaying their loan (D’Espallier et al., 2011,
Chowdhury and Chowdhury, 2011, Krishnan, 2011, McCarter, 2006).
The negative statistical significant (p<0.05 at 5 percent significant level) coefficient of
CEO with formal business education on average loan size implies that MFIs with CEO with
formal business education provide small loan size.
An interesting question to this result is why these CEO with formal business
education provides smaller loan. While they know that small loan has higher transaction costs
(Armendariz and Labie, 2011, Galema and Lensink, 2011, Mersland and Strøm, 2010). I
could argue that these higher transaction costs compensated using higher interest rate to cover
all the costs (Cull et al., 2011, Garmaise and Natividad, 2010, Rosengard, 2011). With higher
interest rate, they could serve more credit clients as the findings of this study indicated and,
that they serve more credit clients, but also with more women clients. However, this need to
be interpreted with precautions because, sometimes higher interest rates lead into a higher
rate of defaults (see CGAP, 2010).
A critical, empirical question without guiding theory is that, does the CEO with
formal business education still choose to offer smaller loan size given these consequences?
The argument could be yes! However, anecdotal evidence in MFIs argues that CEOs in MFIs
are aware of the issue of mission drift (Stuart, 2011), which makes them, more concerned
with creating public value that is directly advantageous to clients and legally accepted.
6.2 Conclusion
The growing concern among MFIs practitioners and other stakeholder in the microfinance
industry is that of short supply of CEOs with managerial experiences in finance, banking and
accounting, or technical expertise and professionalism (Mendelson, 2011, Lascelles et al.,
2011). Regardless of this concern, there are limited empirical evidence to whether MFIs with
CEO with formal business education and business experience have better performance than
MFIs with CEO without formal business education and business experience (Sow Hup,
2010).
This study was able to add knowledge on the issue using data from 403 rated MFIs in
74 countries for the period of 9 years from 2001 to 2009, by providing both descriptive and

51
econometric evidence from panel data estimation using random effect model (REM) on the
influence of CEO with formal business education and experience on MFIs performance.
The conclusions are that, the MFIs with CEO with business experience have better
financial and outreach performance compared with the MFIs with CEO without business
experience. MFIs with CEO with formal business education have better outreach compared to
MFIs with CEO without formal business education, while the study find that the financial
performance of MFIs with CEO with formal business education does not differ significantly
with those of MFIs with CEO without formal business education. These results were
consistent even after running robustness check and additional regression analysis.
6.3 Theoretical, policy and managerial implications
The findings of this study on two of the managerial characteristics of the CEOs in MFIs are
applicable in many different ways, mainly with respect to understanding the influence of
CEOs with formal business education and experience in MFIs performance broadly. The
better financial and outreach performance of MFIs with CEO with business experience
compared to those MFIs with CEO without business experience highlights the need and
importance of this managerial characteristic for a better future of the microfinance industry as
also addressed in the microfinance banana skin 2011 (Lascelles et al., 2011).
Even though, the results show no difference in terms of return on assets and portfolio
at risk for 30 days between MFIs with CEO with formal business education and those MFIs
with CEO without such characteristics, empirical studies uphold the importance of formal
business education for CEOs (see Hansen et al., 2010). This is further empirically confirmed
by the results of this study, where MFIs with CEO with formal business education has better
outreach compared to MFIs with CEO without formal business education.
The flaw associated with practical applications of formal business education in MFIs
is unavoidable because most program in business education concentrate much on
quantitative-based analytical skills rather than developing leadership and interpersonal skills
that are necessary for success in high level of managerial cadre (Gottesman and Morey,
2010). I, therefore, suggest that apart from training on quantitative-based analytical skill,

52
business school should focus also on developing5 leadership and interpersonal skill that could
help those who aspire for higher managerial cadre.
Moreover, the labor market for CEO in MFIs is thin, and there are few qualified
CEOs (Mersland and Strøm, 2010, Mendelson, 2011, Lascelles et al., 2011). This could be
due to the limited external forces to shape the CEO labor markets in MFIs, for example, due
to differing ownership, as most MFI does not have true owners as compared to for profit only
limited liability companies (Hartarska, 2005). I suggest those MFIs practitioners and other
stakeholder like academician needs to pay attention to the way the labor market for CEOs in
MFIs can be expanded. One issue that remain not well researched is that of compensation of
CEOs in the microfinance industry. For example, unresolved CEOs compensations may not
attract well qualified CEOs to work in the microfinance industry, or there could be
nonalignment of interest of CEOs and owners in MFIs, hence poor performance (Ozkan,
2011, Krause, 2009, Walker and Kramer, 2011).
To the microfinance industry, the consistence of the regression results after running
without the CEO founder implies that MFIs performance do better with CEOs with business
experience who is non-founder. This implies that, in the future, the microfinance industry can
benefit with CEO business experience from non-microfinance industry.
6.4 Areas for future studies
This study used only two of the CEO characteristics from the upper echelon theory; I propose
future studies to include more variables of the CEO characteristic like CEO tenure in MFI,
functional background and CEO age. The upper echelon theory proposes two moderating
effect of managerial discretion and executive job demands (Hambrick, 2007). I propose that
future studies could include one of these moderating effects. Also, future study can looks into
the relationship between CEO and top management team size influence on MFIs
performance.
6.5 Limitations of the study
The results in this study are subject to limitations. Use of secondary data renders data
limitations. The data set used comprises of only rated MFIs which makes these data not to be
5 For example “Internationalization Laboratory” a known program to author for MBA students at University of
Agder which “Provide an in-depth understanding of Strategy and International Management, and use this
knowledge in a real-life business case” (for further information see www.uia.no).

53
representatives of all MFIs population. The data do not include such smaller MFIs which the
five rating agencies does not, and large MFIs, which the regular banking agencies asses them.
Also, the MFIs used in this study were only once rated during the sample period by rating
agencies, and, therefore, the CEO characteristics do not vary over time, and I could not
measure the effects of change of CEO characteristics over time.

54
REFERENCES
ARMENDARIZ, B. & LABIE, M. 2011. On Mission drift in Microfinance Institutions. In:
ARMENDARIZ, B. & LABIE, M. (eds.) The Handbook of Microfinance. Singapore:
World scientific publishing Co. Pte. Ltd.
AYAYI, A. G. & SENE, M. 2010. What drives Microfinance institution's financial
sustainability. Journal of Developing Areas, 44, 303-324.
BAGHERI, A. & MIDI, H. 2009. Robust Estimations as a Remedy for Multicollinearity
Caused by Multiple High Leverage Points. Journal of Mathematics & Statistics, 5,
311-321.
BARKER, V. L. I. & MUELLER, G. C. 2002. CEO Characteristics and Firm R&D
Spending. Management Science, 48, 782–801.
BARNEY, J. 1991. Firm Resources and Sustained Competitive Advantage. Journal of
Management, 17, 99-120.
BARNEY, J. B., KETCHEN, D. J. & WRIGHT, M. 2011. The Future of Resource-Based
Theory: Revitalization or Decline? Journal of Management, 37, 1299-1315.
BAUM, C. F. 2006. An Introduction to Modern Econometrics Using Stata Texas, Stata press
publication.
BAUM, C. F., SCHAFFER, M. E. & STILLMAN, S. 2011. Using STATA for applied
research: reviewing its capabilities. Journal of Economic Surveys, 25, 380-394.
BEGLEY, T. M. & BOYD, D. P. 1985. Company and Chief Executive Officer
Characteristics Related to Financial Performance in Smaller Business. In:
HORNADAY, J. A. (ed.) Frontiers of entrepreneurship research, 1985: Proceedings
of the Fifth Annual Babson College Entrepreneurship Research Conference.
Wellesley Center for Entrepreneurial Studies, Babson College.
BHAGAT, S., BOLTON, B. & SUBRAMANIAN, A. 2010a. CEO Education, CEO
Turnover, and Firm Performance [Online]. Available:
http://papers.ssrn.com/sol3/papers.cfm?abstract_id=1670219.
BHAGAT, S., BOLTON, B. J. & SUBRAMANIAN, A. 2010b. CEO Education, CEO
Turnover, and Firm Performance. SSRN eLibrary.
BIGLEY, G. & WIERSEMA, M. 2002a. New CEOs and corporate strategic refocusing: How
experience as heir apparent influences the use of power. Administrative Science
Quarterly, 47, 707-727.
BIGLEY, G. A. & WIERSEMA, M. 2002b. New CEOs and corporate strategic refocusing:
How experience as heir apparent influences the use of power. Administrative Science
Quarterly, 47, 707-727.
BOLLEN, K. A. & BRAND, J. E. 2010. A General Panel Model with Random and Fixed
Effects: A Structural Equations Approach. Social Forces, 89, 1-34.
BØRING, P. 2010. Gamma Unobserved Heterogeneity and Duration Bias. Econometric
Reviews, 29, 1-19.
BUYL, T., BOONE, C. & MATTHYSSENS, P. 2011. Upper echelons research and
managerial cognition. Strategic Organization, 9, 240-246.
BYSTRÖM, H. N. E. 2008. The Microfinance Collateralized Debt Obligation: A Modern
Robin Hood? World Development, 36, 2109-2126.
CAMERON, A. C. & TRIVEDI, P. K. 2009. Microeconometrics using Stata, College
Station, Tex., Stata Press.
CARMELI, A., SCHAUBROECK, J. & TISHLER, A. 2011. How CEO empowering
leadership shapes top management team processes: Implications for firm
performance. Leadership Quarterly, 22, 399-411.

55
CARPENTER, M. A. & SANDERS, W. G. 2004. The effects of top management team pay
and firm internationalization on MNC performance. Journal of Management, 30, 509-
528.
CARPENTER, M. A., SANDERS, W. G. & GREGERSEN, H. B. 2001. Bundling human
capital with organizational context: The impact of international assignment
experience on multinational firm performance and CEO pay. Academy of
Management Journal, 44, 493-511.
CGAP 2010. Andhra Pradesh 2010: Global Implications of the Crisis in Indian Microfinance.
Focus Note 67. Washington, D.C: CGAP, November.
CHAMBERLAIN, G. 1985. Heterogeneity, Omitted Variable Bias, and Duration
Dependence. In: HECKMAN, J. J. & SINGER, B. (eds.) Longitudinal Analysis of
Labor Market Data. Cambridge: Cambridge University Press.
CHAN, S. H. 2010. The influence of leadership expertise and experience on organizational
performance: a study of Amanah Ikhtiar Malaysia. Asia Pacific Business Review, 16,
59-77.
CHOWDHURY, S. S. & CHOWDHURY, S. A. 2011. Microfinance and Women
Empowerment: A Panel Data Analysis Using Evidence from Rural Bangladesh.
International Journal of Economics & Finance, 3, 86-96.
CULL, R., DEMIRGÜҪ-KUNT, A. & MORDUCH, J. 2011. Microfinance Trade-Offs:
Regulation, Competition and Financing. In: ARMENDÁRIZ, B. & LABIE, M. (eds.)
The Handbook of Microfinance. Singapore: World Scientific Publishing Co. Pte. Ltd.
CURTO, J. D. & PINTO, J. C. 2011. The corrected VIF (CVIF). Journal of Applied
Statistics, 38, 1499-1507.
D’ESPALLIER, B., GUÉRIN, I. & MERSLAND, R. 2011. Women and Repayment in
Microfinance: A Global Analysis. World Development, 39, 758-772.
DAILY, C. M., CERTO, S. T. & DALTON, D. R. 2000. International experience in the
executive suite: The path to prosperity? Strategic Management Journal, 21, 515-523.
DAVID, F. R. & DAVID, F. R. 2011. Comparing Management Curricula With Management
Practice. SAM Advanced Management Journal (07497075), 76, 48-55.
DERESKY, H. 2011. International management: managing across borders and cultures :
text and cases, Boston, Pearson.
DI BELLA, G. 2011. The Impact of the Global Financial Crisis on Microfinance and Policy
Implications. International Monetary Fund, IMF Working Papers: 11/175.
DILEO., P. 2012. The Promises and Risks of Commercializing Microfinance [Online]. CGAP
Microfinance Blog. Available: http://microfinance.cgap.org/2012/01/04/the-promises-
and-risks-of-commercializing-microfinance/ [Accessed Wednesday, January 4 2012].
DOMS, M., LEWIS, E. & ROBB, A. 2010. Local labor force education, new business
characteristics, and firm performance. Journal of Urban Economics, 67, 61-77.
DREHER, G. F. & RYAN, K. C. 2001. Evaluating MBA-Porgram admission criteria: The
relationship between pre-MBA work experience and post-MBA carrier outcomes.
Research in higher education, 43, 727-744.
DYKE, L. S., FISCHER, E. M. & REUBER, R. 1992. An inter-industry examination of the
impact of owner experience on firm performance. Journal of Small Business
Management, 30, 72-87.
ELSAID, E., WANG, X. & III, W. N. D. 2011. Does experience matter? CEO successions by
former CEOs. Managerial Finance, 37, 915 - 939.
EUBANKS, P. 1992. The CEO experience TQM CQI. Hospitals, 66, 24-&.
FOSS, N. J. 2011. Why Micro-Foundations for Resource-Based Theory Are Needed and
What They May Look Like. JOURNAL OF MANAGEMENT, 37, 1413-1428.

56
GALEMA, R. & LENSINK, R. 2011. Social Investment in Microfinance: The Trade-off
Between Risky, Return and Outreach to the Poor. In: ARMENDARIZ, B. & LABIE,
M. (eds.) The Handbook of Microfinance. Singapore: World scientific publishing Co.
Pte. Ltd.
GALEMA, R., LENSINK, R. & MERSLAND, R. 2012. Do Powerful CEOs Determine
Microfinance Performance? Journal of Management Studies, no-no.
GALEMA, R., LENSINK, R. & MERSLAND, R. Forthcoming. Governance and
Microfinance Institutions. In: BARTH, J. R., LIN, C. & WIHLBORG, C. (eds.) Research
Handbook for Banking and Governance. New York: Edward Elgar.
GARIBALDI, P. 2006. Personnel economics in imperfect labour markets, New York, Oxford
University Press.
GARMAISE, M. J. & NATIVIDAD, G. 2010. Information, the Cost of Credit, and
Operational Efficiency: An Empirical Study of Microfinance. Review of Financial
Studies, 23, 2560-2590.
GITSHAM, M. 2011. CEO perspectives: management education in a changing context.
Corporate governance, 11, 501-512.
GOH, S. C. C., COAKER, W. C. & THORPE, D. C. 2008. How engineers become CEOs:
implications for education and training. Journal of Achievements in Materials and
Manufacturing Engineering, 31, 846-852.
GOTTESMAN, A. A. & MOREY, M. R. 2006. Does a Better Education Make For Better
Managers? An Empirical Examination of CEO Educational Quality and Firm
Performance. SSRN eLibrary.
GOTTESMAN, A. A. & MOREY, M. R. 2010. CEO Educational Background and Firm
Financial Performance. Journal of applied finance, 2, 70-82.
GREENE, W. H. 2003. Econometric analysis, Upper Saddle River, N.J., Prentice Hall.
GREENE, W. H. 2012. Econometric analysis, Boston, Pearson.
GUJARATI, D. 2011. Econometrics by example, Basingstoke, Palgrave Macmillan.
GUJARATI, D. N. 2003. Basic econometrics, New York, McGraw-Hill.
GUJARATI, D. N. & PORTER, D. C. 2010. Essentials of econometrics, Boston, McGraw-
Hill.
GUTHRIE, J. & DATTA, D. 1997. Contextual influences on executive selection: Firm
characteristics and CEO experience. Journal of Management Studies, 34, 537-560.
GWIN, B. W. 2011. The Changing Profile Of Board Recruitment. THE CORPORATE
BOARD, 32, 1-5.
HAIR, J. F. 2010. Multivariate data analysis: a global perspective, Upper Saddle River, N.J.,
Pearson.
HALL, R. 1992. The strategic analysis of intangible resources. Strategic Management
Journal, 13, 135-144.
HAMBRICK, D. C. 2007. Upper echelons theory: An update. Academy of Management
Review, 32, 334-343.
HAMBRICK, D. C. & MASON, P. A. 1984. Upper Echelons - the Organization as a
Reflection of Its Top Managers. Academy of Management Review, 9, 193-206.
HANSEN, M. T., IBARRA, H., PEYER, U., VON BERNUTH, N. & ESCALLON, C. 2010.
The Best-Performing CEOs in the World. Harvard Business Review, 88, 104-113.
HARJOTO, M. A. & JO, H. 2009. CEO Power and Firm Performance: A Test of the Life-
Cycle Theory. Asia-Pacific Journal of Financial Studies, 38, 35-66.
HARTARSKA, V. 2005. Governance and performance of microfinance institutions in central
and eastern Europe and the newly independent states. World Development, 33, 1627-
1643.

57
HARTARSKA, V. & MERSLAND, R. 2009. Which Governance Mechanisms Promote
Efficiency in Reaching Poor Clients? Evidence from Rated Microfinance Institutions.
European Financial Management, 1-22.
HAUSMAN, J. A. 1978. Specification Tests in Econometrics. Econometrica: Journal of the
Econometric Society, 46, 1251-1271.
HERMES, N. & LENSINK, R. 2011. Microfinance: Its Impact, Outreach, and Sustainability.
World Development, 39, 875-881.
HERMES, N., LENSINK, R. & MEESTERS, A. 2011. Outreach and Efficiency of
Microfinance Institutions. World Development, 39, 938-948.
HERRMANN, P. & DATTA, D. 2006. CEO experiences: Effects on the choice of FDI entry
mode. Journal of Management Studies, 43, 755-778.
HOLGER, P., DODO ZU, K.-A. & HEIKO, T. F. 2009. Upper echelons and portfolio
strategies of venture capital firms. Journal of Business Venturing, 24, 558-572.
HOQUE, M., CHISHTY, M. & HALLOWAY, R. 2011. Commercialization and changes in
capital structure in microfinance institutions: An innovation or wrong turn?
Managerial Finance, 37, 414 - 425.
HUDON, M. 2010. Management of Microfinance Institutions: Do Subsidies Matter? Journal
of International Development, 22, 890-905.
JALBERT, T., FURUMO, K. & JALBERT, M. 2011. Does Educational Background Affect
CEO Compensation And Firm Performance? Journal Of Applied Business Research,
27, 15-39.
JOHNSTON, J. & DINARDO, J. 1997. Econometric methods, New York, McGraw-Hill.
KARLAN, D. & GOLDBERG, N. 2011. Microfinance Evaluation Strategies: Notes on
Methodology and Findings. In: ARMENDÁRIZ, B. & LABIE, M. (eds.) The
handbook of microfinance. Singapore: World Scientific Publishing Co. Pte. Ltd.
KIM, J.-S. & FREES, E. W. 2006. Omitted Variables in Multilevel Models. Psychometrika,
71, 659-690.
KOYUNCU, B., FIRFIRAY, S., CLAES, B. & HAMORI, M. 2010. CEOs with a functional
background in operations: reviewing their performance and prevalence in the top post.
Human Resource Management, 49, 869-882.
KRAUSE, R. 2009. Does "Long-Term Compensation" Make CEOs Think Long-Term? A
Study of CEO Compensation in the Commercial Banking Industry. Michigan Journal
of Business, 2, 77-103.
KRISHNAN, C. 2011. Microfinance for Financial Inclusion and Women Empowerment.
International Journal of Business Economics and Management Research, 2, 136-152.
KUNC, M. H. & MORECROFT, J. D. W. 2010. Managerial Decision Making and Firm
Performance under a Resource-Based Paradigm. Strategic Management Journal, 31,
1164–1182.
LASCELLES, D. 2011. Is Microfinance Losing Its Fairy Dust? RMA Journal, 93, 22-25.
LASCELLES, D., MENDELSON, S. & CUMMINGS, J. 2011. Microfinance Banana Skins
2011: The CSFI survey of microfinance risk London: The Centre for the Study of
Financial Innovation (CSFI).
LAVEREN, E., HELLEBOOGH, D., MOLLY, V. & LIMERE, A. 2011. CEO experience
and firm growth in small family firms. International journal of entrepreneurship and
small business, 11, 242-262.
LI, J. T. & TANG, Y. 2010. Ceo Hubris and Firm Risk Taking in China: The Moderating
Role of Managerial Discretion. Academy of Management Journal, 53, 45-68.
LOUIS, T. W. C., RICKY, Y. K. C. & LEUNG, T. Y. 2010. Management demography and
corporate performance: Evidence from China. International Business Review, 19,
261-275.

58
MACKEY, A. 2008. THE EFFECT OF CEOS ON FIRM PERFORMANCE. Strategic
Management Journal, 29, 1357-1367.
MAGNUSSON, P. & BOGGS, D. J. 2006. International experience and CEO selection: An
empirical study. Journal of International Management, 12, 107-125.
MANNER, M. H. 2010. The Impact of CEO Characteristics on Corporate Social
Performance. Journal of Business Ethics, 93, 53-72.
MANSFIELD, E. R. & HELMS, B. P. 1982. Detecting Multicollinearity. American
Statistician, 36, 158.
MARRA, G. & RADICE, R. 2011. A flexible instrumental variable approach. Statistical
Modelling: An International Journal, 11, 581-603.
MARTELLI, J. & ABELS, P. 2010. The Education of a Leader: Educational Credentials and
Other Characteristics of Chief Executive Officers. JOURNAL OF EDUCATION FOR
BUSINESS, 85, 209–217.
MARTELLI, J. T. & ABELS, P. B. Becoming a leader: What does it take? Global
Conference on Business and Finance Proceedings, 2011. 19-23.
MASAAKI, K., CRYSTAL XIANGWEN, J. & JANET, Y. M. 2011. Managerial ties,
knowledge acquisition, realized absorptive capacity and new product market
performance of emerging multinational companies: A case of China. Journal of World
Business, 46, 166-176.
MAYOUX, L. 2010. Reaching and Empowering Women: Towards a Gender Justice Protocol
for a Diversified, Inclusive, and Sustainable Financial Sector. Perspectives on Global
Development & Technology, 9, 581-600.
MCCARTER, E. 2006. The global advancement of women: barriers and best practices:
women and microfinance: why we should do more. University of Maryland Law
Journal of Race, Religion, Gender and Class, 6, 353.
MENDELSON, S. 2011. Microfinance banana skins 2011 Losing its fairy dust? Financial
world-London then Canterbury-chartered institute of bankers then institute of
financial management, 29-33.
MERSLAND, R. 2009a. Corporate governance and ownership in microfinance
organizations. Doctoral dissertation, University of Agder.
MERSLAND, R. 2009b. The Cost of Ownership in Microfinance Organizations. World
Development, 37, 469-478.
MERSLAND, R. 2009c. The governance of non-profit micro finance institutions: lessons
from history. Journal of Management & Governance, 15, 327-348.
MERSLAND, R., RANDØY, T. & STRØM, R. Ø. 2011. The impact of international
influence on microbanks’ performance: A global survey. International Business
Review, 20, 163-176.
MERSLAND, R. & STRØM, Ø. R. 2009a. Performance and governance in microfinance
institutions. Journal of Banking & Finance, 33, 662-669.
MERSLAND, R. & STRØM, R. O. 2009b. Performance and governance in microfinance
institutions. Journal of Banking & Finance, 33, 662-669.
MERSLAND, R. & STRØM, R. Ø. 2008. Performance and trade‐offs in Microfinance
Organisations—Does ownership matter? Journal of International Development, 20,
598-612.
MERSLAND, R. & STRØM, R. Ø. 2010. Microfinance Mission Drift? World Development,
38, 28-36.
MERSLAND, R. & STRØM, R. Ø. forthcoming. The Past and Future of Innovatitions in
Microfifinance. In: CUMMING, D. (ed.) The Oxford Handbook of Entrepreneurial
Finance. Forthcoming ed. Oxford UK:: Oxford University Press.

59
MERSLAND., R., RANDØY., T. & STRØM., R. Ø. The Impact of Founder-CEOs in
Microbanks: A Global Survey. Second European Research Conference in Microfinance, 16-18
June 2011 Gröningen, Holland. 33.
MIDGAL, T., WILKINS, W. & DAVIS, G. 2006. Leading Growth in MFIs: Key Attributes
and Characteristics [Online]. Unitus, Inc. Available:
http://www.microcreditsummit.org/papers/Assocsession/Davis.pdf [Accessed April,
16 2012].
MORI, N. & MERSLAND, R. 2011. Boards in microfinance institutions: how do
stakeholders matter? Journal of Management & Governance.
MUSTEEN, M., BARKER, V. L. & BAETEN, V. L. 2006. CEO attributes associated with
attitude toward change: The direct and moderating effects of CEO tenure. Journal of
Business Research, 59, 604-612.
NELSON, J. 2005. Corporate governance practices, CEO characteristics and firm
performance. Journal of Corporate Finance, 11, 197-228.
NG, E. S. & SEARS, G. J. 2012. CEO Leadership Styles and the Implementation of
Organizational Diversity Practices: Moderating Effects of Social Values and Age.
Journal of Business Ethics, 105, 41-52.
OZKAN, N. 2011. CEO Compensation and Firm Performance: an Empirical Investigation of
UK Panel Data. European Financial Management, 17, 260-285.
PENROSE, E. T. 1959. The Theory of Growth of the Firm, London, Basil Blackwell.
PETER, M. & DAVID, J. B. 2006. International experience and CEO selection: An empirical
study. Journal of International Management, 12, 107-125.
PETERAF, M. A. 1993. The Cornerstones of Competitive Advantage: A Resource-Based
View. Strategic Management Journal, 14, 179-191.
PFEFFER, J. 2004. Managers not MBAs: A hard look at the soft practice of managing and
management development. Administrative Science Quarterly, 49, 476-479.
RAHMAN, R. & NIE, Q. 2011. The Synthesis of Grameen Bank Microfinance Approaches
in Bangladesh. International Journal of Economics & Finance, 3, 207-218.
RAJAGOPALAN, N. & DATTA, D. K. 1996. CEO characteristics: Does industry matter?
Academy of Management Journal, 39, 197-215.
REED, R. & REED, M. 1989. Ceo Experience and Diversification Strategy Fit. Journal of
Management Studies, 26, 251-270.
ROSENGARD, J. K. 2011. Oversight is a Many-Splendored Thing: Choice and
Proportionality in Regulating and Supervising Microfinance Institutions. In:
ARMENDARIZ, B. & LABIE, M. (eds.) The Handbook of Microfinance. Singapore:
World Scientific Publishing Co. Pte. Ltd.
ROTH, K. 1995. Managing International Interdependence - Ceo Characteristics in a
Resource-Based Framework. Academy of Management Journal, 38, 200-231.
RUTH JACOBS, RUTH DUECK MBEBA & HARRINGTON, B. 2007. Board and
Governance Training for Microfinance Institutions Toolkit.
RYAN, H. E., JR. & WANG, L. 2011. CEO Mobility and the CEO-Firm Match: Evidence
from CEO Employment History. SSRN eLibrary.
SAGER, E. 1976. Operational definition. Journal of Business Communication, 14, 23-26.
SANDBERG, W. R. & HOFER, C. W. 1987. Improving New Venture Performance - the
Role of Strategy, Industry Structure, and the Entrepreneur. Journal of Business
Venturing, 2, 5-28.
SESSIONS, D. N. & STEVANS, L. K. 2006. Investigating omitted variable bias in
regression parameter estimation: A genetic algorithm approach. Computational
Statistics & Data Analysis, 50, 2835-2854.

60
SLATER, D. J. & DIXON-FOWLER, H. R. 2009. CEO International Assignment Experience
and Corporate Social Performance. Journal of Business Ethics, 89, 473-489.
SLATER, D. J. & DIXON-FOWLER, H. R. 2010. The Future of the Planet in the Hands of
MBAs: An Examination of CEO MBA Education and Corporate Environmental
Performance. Academy of Management Learning & Education, 9, 429-441.
SORIANO, D. R. & CASTROGIOVANNI, G. J. 2012. The impact of education, experience
and inner circle advisors on SME performance: insights from a study of public
development centers. Small Business Economics, 38, 333-349.
SOW HUP, C. 2010. The influence of leadership expertise and experience on organizational
performance: a study of Amanah Ikhtiar Malaysia. Asia Pacific Business Review, 16,
59-77.
STANLEY, P. 2011. In search of responsible CEOs: The case of CEOs with non-profit
experience. Journal of Business Research.
STOCK, J. H. & WATSON, M. W. 2003. Introduction to econometrics, Boston, Mass.,
Addison Wesley.
STONE, W. S. & TUDOR, T. R. 2005. The effects of functional background experience,
industry experience, generic executive management experience on perceived
environmental uncertainty and firm performance. Advances in Competitiveness
Research, 13, 1-8.
STRØM., R. Ø., D’ESPALLIER., B. & MERSLAND., R. working paper. Gender,
performance, and governance in microfinance institutions [Online]. Available:
http://www.rug.nl/feb/Onderzoek/events/WorkshopMicroFinance2010/pdfMicro/Stro
mEspallierMersland.pdf [Accessed January, 11 2011].
STUART, G. 2011. Micorfinance-A strategic Management Framework. In: ARMENDARIZ,
B. & LABIE, M. (eds.) The Handbook of microfinance. Singapore: World scientific
publishing Co. Pte. Ltd.
STUART, R. W. & ABETTI, P. A. 1990. Impact of Entrepreneurial and Management
Experience on Early Performance. Journal of Business Venturing, 5, 151-162.
STUDENMUND, A. H. 2006. Using econometrics: a practical guide, Boston, Mass.,
Pearson Education.
SVEN, E. W. & DANIEL, M. B. 2007. A Lot More to Do: The Sensitivity of Time-Series
Cross-Section Analyses to Simple Alternative Specifications. Political Analysis, 15,
101.
THAROOR, I. 2006. Muhammad Yunus. Time Inc.
THOMSEN, S. 2008. An Introduction to Corporate Governance: Mechanisms and Systems,
Copenhagen, Djøf publishing
TROY, C., SMITH, K. G. & DOMINO, M. A. 2011. CEO demographics and accounting
fraud: Who is more likely to rationalize illegal acts? Strategic Organization, 9, 259-
282.
VALADEZ, R. M. & BUSKIRK, B. 2011a. From Microcredit to Microfinance: a business
perspective. Journal of Finance & Accountancy, 6, 1-17.
VALADEZ, R. M. & BUSKIRK, B. 2011b. From Microcredit to Microfinance: a business
perspective. Journal of Finance & Accountancy,, 6, 1-17.
VERBEEK, M. 2012. A guide to modern econometrics, Chichester, Wiley.
WALDMAN, D. A., JAVIDAN, M. & VARELLA, P. 2004. Charismatic leadership at the
strategic level: A new application of upper echelons theory. Leadership Quarterly, 15,
355-380.
WALKER, J. S. & KRAMER, J. K. 2011. Executive compensation at U.S. community banks:
an empirical study of the relationship between direct compensation and financial
return. North American Journal of Finance & Banking Research, 5, 23-39.
61
WANG, H., TSUI, A. S. & XIN, K. R. 2011. CEO leadership behaviors, organizational
performance, and employees' attitudes. Leadership Quarterly, 22, 92-105.
WERNERFELT, B. 1984. A Resource-Based View of the Firm. Strategic Management
Journal, 5, 171-180.
WOOLDRIDGE, J. M. 2006. Introductory econometrics: a modern approach, Mason, Ohio,
Thomson South-Western.
YUNUS, M. 1999. Banker to the poor: Micro-lending and the battle against world poverty,
New York, With Alan Jolis.
ZHANG, Y. & RAJAGOPALAN, N. 2010. Once an Outsider, Always an Outsider? Ceo
Origin, Strategic Change, and Firm Performance. Strategic Management Journal, 31,
334-346.
ZIKMUND, W. G., BABIN, B. J., CARR, J. C. & GRIFFIN, M. 2010. Business Research
Methods, South-Western Cengage Learning.