Embed Size (px)
Citation preview

Björn Gunnarsson, Andreas Löfgren
Light Rail - Experiences from Germany,
France and Switzerland
2001:303
MASTER'S THESIS
Civilingenjörsprogrammet
Samhällsbyggnadsteknik
Institutionen för SamhällsbyggnadsteknikAvdelningen för Trafikteknik
2001:303 • ISSN: 1402-1617 • ISRN: LTU-EX--01/303--SE
Light Rail –experiences from Germany, France and Switzerland
1
Glossary
Barrier effects – Effects caused by barriers like a tram track.
Congestion – Traffic crowds, mostly for individual traffic
Corridor effects – Trams serve as transportation for a zone not a line.
Deficit - Yearly lost of money, in our cases for transport systems.
DUWAG – Former manufacturer of trams.
Grooved rail – Rail with a groove, used in the city for trams.
Individual traffic – Traffic like cars, motorbikes and trucks on roads.
LR - Light rail a developed modern tramway.
LRT - Light rail transit = is a modern tram system.
LRV – Light rail vehicle, which is modern, trams
Metro – Underground train system in cities.
Public transport – Can be trains, trams or buses.
Renewal – Modernised
Relay car parks – Place to park your car in order to change transportation mode
Right-of-way – Type of traffic accessibility
Rolling stock – Vehicles used for a tram or bus system
Traffic congestion – Vehicles get crowded and speed is strongly reduced
Tram – City train that runs on the streets
Transient effects – Problems with new systems due to lack of knowledge and that disappearswith time.

Light Rail –experiences from Germany, France and Switzerland
2
Preface
Our intentions with this thesis work were to bring knowledge about modern tramways fromEurope to Sweden. In order to do so we had to abounded Sweden for foreign countries wheretrams are more common. This was done from January to May 2000 in Kaiserslauten Germanyfor the Traffic division at Luleå University of Technology.The method used for this thesis was an information gathering. We have search for informationin archives, the Internet and mostly by speaking to people.Björn Gunnarsson and Andreas Löfgren have taken the most pictures in this thesis, otherpictures have a reference given below them.
Supervisor was Glenn Lundborg, lecturer, and examiner is Professor Ilja Cordi, both at theTraffic division at Luleå University of Technology.We would like to thank:
• Professor Dr.-Ing. Hartmund H. Topp at the University of Kaiserslauten, who was kindenough to welcome us to his department.
• Ulrike Huwer who helped us a lot with different problems and made it possible for us toattend the LRT international workshop.
• Glenn Lundborg – Our supervisor for his support• The city of Mannheim and Mr Rabe who guided us and was a big help for our work.• The city of Saarbrucken and the Saarbahn.• The city of Strasbourg with Mr George Muller at CTS.• The city of Zurich and Mr Berger and Mr Schaffer.• Harry Hondius – Light rail expert who helped us with some questions.
LuleåJanuary 2001
_________________ _________________
Björn Gunnarsson Andreas Löfgren

Light Rail –experiences from Germany, France and Switzerland
3
Abstract
Modern trams, ”light rail vehicles” (LRV), have become more and more popular since the1980ies. To give a definition of “light rail” is not easy. Since all tram systems are differentdepending on the city they are in. Light rail is usually tram systems that can go on both tramtracks and train tracks.
During the first half of the 20th century trams where common in European cities butdisappeared during the 1960’ies. Motor traffic took over and tram tracks were replaced byroad. Later, when cities got environmental and congestion problems, several cities choose toreintroduced trams.
This thesis work is an information gathering about modern trams, not only about ”light rail”.Which also was one of the most important criteria’s when choosing case study cities.Saarbrucken and Karlsruhe have typical LR systems, Mannheim has an upgraded tramsystem, and Strasbourg has a completely new trams system, finally Zurich who has a more oldfashion tram system.The fact that all cities have tram systems so unlike the other ones means that most possibleinformation could be gathered.
Saarbrucken has had trams since 1890 but they were removed on behalf to motor traffic. Inthe early 1990ies a decision were made to build a new tram system with a LR system. Somelines are still under construction.
Mannheim has had trams since the end of 19th century and has modernised the system withtime. They have recently bought new trams and have also rebuilt the tram stops.
Zurich has an old but huge tram system and will soon have to exchange their vehicle fleet. InZurich trams and motor vehicles use the same space have therefore developed an efficienttraffic system. This has increased the travel speed for trams.
Strasbourg built a completely new tram system in the 1980ies. The city used a lot of resourcesto make the tram a human friendly transport by special trams, stops and lots of threes alongtram routes.
Karlsruhe was the first city in the world that introduced LR. They have since the startextended their LR system not only within the city but also to the whole region. Karlsruhe hadan old tram system in the city, which were used together with train tracks. (In Saarbruckenthey had to build tracks in the city.)
One of the most important reasons to why many cities have reintroduced trams is theenvironmental advantage. In a city there is a huge demand of transportation, if everyonewould travel with cars congestion and pollution would be an extensive problem. With busesand trams you will get both lower congestion and pollution.The energy it takes to run trams is much less per personal kilometres compared with a car,which makes it a more environmental friendly alternative. The energy used by a tram comesfrom electricity which better than petrol and reduces pollution.Trams are a very space efficient transportation mode, which is important since land often is inshortage in cities.

Light Rail –experiences from Germany, France and Switzerland
4
An environmental problem that is common in cities is noise pollutions. Tram produce lessnoise than cars and the noise level becomes even lower if grass is planted between the tracks.
Modern trams have proven to be a safe transportation mode in the city, with low accidentrates both for passages and other traffic groups. The accident types that is most common fortrams are collision between trams and cars. These are especially common in cities where carsand trams share the same space. On the other hand these collisions are rare in cities withseparated space like in Saarbrucken.On the place where most accidents occur are around the tram stops. There are differentdesigns of tram stops and they are more or less safe.Trams are generally safe and only few accidents result in lethal outcome.

Light Rail –experiences from Germany, France and Switzerland
5
Sammanfattning
Moderna spårvagnar, så kallade ”light rail vehicles” (LRV) har blivit allt mer populära sedan1980-talet. Att ge en definition på vilka spårvagns system som är ”light rail” eller inte är intehelt lätt. Varje stad har sitt speciella spårvagnssystem vilket är olikt andra städers. Light railsystem kallas vanligtvis de system som både går på spårvagnsspår inne i staden ochjärnvägsspår utanför staden.
Efter att spårvagnar under första hälften av 1900-talet praktiskt taget funnits i varje stad iEuropa försvann de till stor del under 1960-talet. Konkurrensen från biltrafiken gjorde attgjorde att städerna i stället satsade på vägar. På senare tid, med miljö och transport problemhar många städer återinfört spårvagnar vilket har visat sig framgångsrikt.
Detta examensarbete är ett informations samlande arbete om moderna spårvagnar dvs. intebara ”light rail” system. Vilka städer som valdes till fältstudier gjordes så att olika typer avspårvagnssystem fanns med bland fältstudie städerna. Så att olika typer av spårvagns systemtas med. Saarbrucken och Karlsruhe har typiska LR system, Mannheim har ett uppgraderatspårvagns system, Strasbourg har ett helt nytt spårvagns system och Zürich har ett gammaltspårvagnssystem.Genom att städerna har så olika spårvagnssystem kan mesta möjliga information samlas in.
Saarbrucken hade ett spårvagnar under första hälften av 1900-talet men dessa togs bort tillfördel för biltrafik. Under början av 1990-talet så togs beslut att återinföra spårvagnar med ettLR system. Spårvagnar är så nya att alla linjer ännu inte är färdigbyggda.
Mannheim har haft sina spårvagnar sedan slutet av 1800-talet och har ändrats allteftersomtiden har passerat. De har nyligen uppgraderat sina spårvagnar och arbetar aktivt för attförbättra transporterna t.ex. genom att göra hållplatserna bättre.
Zürich har också ett gammalt men också stort spårvagnssystem och ska till med att byta utsina spårvagnar. Här delar spårvagnarna gatorna med annan trafik och därmed har det satsatsmycket på effektivt trafiksystem så att pauserna vid trafikljusen minimeras.
Strasbourg byggde ett helt nytt spårvagnssystem under 1980-talet. Staden satsade mycket påatt skapa en människovänlig transport med stora satsningar på hållplatser, spårvagnar ochgrönska runt omkring spåren.
Karlsruhe var den första staden i världen som införde LR. De har sedan starten byggt ut sittspårsystem så att det inte bara täcker staden utan också flera närbelägna mindre städer. Tillskillnad från Saarbrucken hade Karlsruhe redan ett spårvagnssystem när de började satsa påsitt LR system.
En av de starkaste orsakerna till att många städer åter har satsat på spårvagnar är demiljömässiga fördelarna. Med den mängd av människor som förflyttar sig i en stad blir detträngsel och stora avgasutsläpp om alla ska sitta i en bil. Med buss eller spårvagn minskarman trängseln.Driften av en spårvagn är väldigt miljövänligt, dels för att den drivs av el och även att denförbrukar lite energi per person kilometer jämfört med biltrafik. Vilket ger minskadeavgasutsläpp och därigenom påverkar växthuseffekten.

Light Rail –experiences from Germany, France and Switzerland
6
Spårvagnar är ett väldigt utrymmeseffektivt transportsätt vilket är bra eftersom mark ofta ären bristvara inom städer.Ett miljöproblem i städer är ljudutsläpp. Även här är spårvagnar bättre än biltrafik och blir änbättre med gräs mellan spåren.
Moderna spårvagnar har bevisat sig vara ett väldigt säkert transportsätt i staden, med lågaolyckstal både för passagerare och omgivande trafik. De olyckor som spårvagnar oftast ärinblandad i är kollisioner mellan spårvagn och bil. Dessa är särskilt vanliga i system därmotortrafik och spårvagnar delar utrymmet på gatorna. Däremot om spårvagnen har egna spårär olycksstatistiken mycket lägre, ett exempel är Saarbrucken.Ett av de ställen som är mest påverkat av olyckor för en spårvagnslinje är hållplatserna. Härfinns även många olika alternativ för hur hållplatsen kan se ut. Beroende på utformningen blirolycksrisken olika.Generellt sker inte så många dödliga olyckor med spårvagnar utan det är oftast mindre farligakollisioner.

Light Rail –experiences from Germany, France and Switzerland
7
Table of Contents
I. INTRODUCTION ................................................................................................................. 10
I.I BACKGROUND ......................................................................................................................... 10I.II PURPOSE............................................................................................................................... 10I.III BOUNDARIES......................................................................................................................... 10I.IV METHOD .............................................................................................................................. 10
1. HISTORY ............................................................................................................................. 11
1.1 THE 18TH CENTURY ........................................................................................................... 111.2 THE 19TH CENTURY ........................................................................................................... 111.3 THE 20TH CENTURY UNTIL TODAY ...................................................................................... 13
2 INTRODUCTION TO LIGHT RAIL..................................................................................... 15
2.1 WHAT IS A MODERN TRAM OR LIGHT RAIL?............................................................................. 152.2 BRIDGING THE CAPACITY GAP BETWEEN BUS AND METRO ....................................................... 182.3 TRAM AND LIGHT RAIL NETWORK........................................................................................... 192.4 LEVEL BOARDING AND OTHER VEHICLE FEATURES ................................................................. 192.5 TRAM AND LRT IN PEDESTRIAN ZONES .................................................................................. 202.6 UTILIZING RAILWAY TRACKS FOR TRAM AND LRT................................................................... 212.7 EASY ACCESS AND USABILITY................................................................................................. 22
3. CASE STUDY CITIES .......................................................................................................... 23
3.1 SAARBRUCKEN...................................................................................................................... 253.1.1 HISTORY .............................................................................................................................253.1.2 THE SAARBRUCKEN REGIONAL MODEL .................................................................................253.1.3 SYSTEM COMPONENTS.........................................................................................................273.2. MANNHEIM.......................................................................................................................... 293.2.1 HISTORY .............................................................................................................................293.2.2 SYSTEM TODAY ...................................................................................................................293.2.3 ROLLING STOCK ..................................................................................................................303.3 ZURICH................................................................................................................................. 323.3.1 HISTORY .............................................................................................................................323.3.2 CITY OF TODAY ...................................................................................................................333.3.3 SYSTEM TODAY ...................................................................................................................333.3.4 ROLLING STOCK ..................................................................................................................343.4 STRASBOURG ........................................................................................................................ 363.4.1 HISTORY .............................................................................................................................363.4.2 THE TRAM SYSTEM IN STRASBOURG .....................................................................................363.4.3 ABOUT THE TRAMS..............................................................................................................373.4.4 RELAY CAR PARKS...............................................................................................................383.4.5 THE TRAMWAY WILL BE EXTENDED ......................................................................................383.4.6 GALERIE À L'EN-VERRE & THE HOMME DE FER.....................................................................383.5 KARLSRUHE.......................................................................................................................... 403.5.1 HISTORY .............................................................................................................................403.5.2 TODAYS LIGHT RAIL SYSTEM ...............................................................................................413.5.3 ROLLING STOCK ..................................................................................................................43

Light Rail –experiences from Germany, France and Switzerland
8
4. ENVIRONMENTAL ISSUES. .............................................................................................. 45
4.1 ENVIRONMENT ESTHETICAL .................................................................................................. 454.1.1 TRAFFIC IN SENSITIVE AREAS................................................................................................464.1.2 STOPS .................................................................................................................................464.2 BARRIER EFFECTS................................................................................................................. 474.3 ENERGY CONSUMPTION......................................................................................................... 484.4 AIR POLLUTION’S .................................................................................................................. 504.5 GREENHOUSE EFFECT........................................................................................................... 514.6 TRAFFIC CONGESTION........................................................................................................... 514.6.1 SECOND HAND EFFECTS........................................................................................................514.7 LAND AREA IMPACT, CONSUMPTION OF LAND IN THE CITY. ...................................................... 524.8 NOISE................................................................................................................................... 524.8.1 THE SAARBAHN NOISE INVESTIGATION .................................................................................534.8.2 ANALYSE: TODAY’S ROAD AND RAIL TRAFFIC .......................................................................544.8.3 NOISE CALCULATION ...........................................................................................................544.8.4 RESULTS OF THE NOISE-LEVEL CALCULATIONS......................................................................554.8.5 WHAT CAN BE DONE TO REDUCE NOISE FROM TRAMS? ...........................................................565. SAFETY.................................................................................................................................. 585.1 INTRODUCTION/IN GENERAL.................................................................................................. 585.1.1 SAFETY AT STOPS.................................................................................................................585.1.2 STRETCHING (IN PEDESTRIAN ZONES AND BUSY CORRIDORS)..................................................665.1.3 CROSSINGS (AT-GRADE).......................................................................................................665.1.4 PERSONAL SECURITY............................................................................................................675.2 SAFETY EVALUATION OF TRAM/LRT SYSTEM.......................................................................... 675.2.1 VEHICLE-KILOMETRE...........................................................................................................675.2.2 PASSENGER-KILOMETRE.......................................................................................................685.2.3 SEVERITY............................................................................................................................685.2.5 CORRIDOR EFFECTS..............................................................................................................685.2.6 TRANSIENT EFFECTS ............................................................................................................685.3 SAARBRUCKEN SAFETY.......................................................................................................... 695.4 MANNHEIM SAFETY .............................................................................................................. 695.5 ZURICH SAFETY .................................................................................................................... 715.6 STRASBOURG SAFETY ............................................................................................................ 735.7 KARLSRUHE SAFETY.............................................................................................................. 73
6. CONCLUSIONS ................................................................................................................... 74
6.1 IN GENERAL.......................................................................................................................... 746.2 ENVIRONMENT...................................................................................................................... 746.3 SAFETY................................................................................................................................. 74
7. DISCUSSION ........................................................................................................................ 75
7.1 IN GENERAL.......................................................................................................................... 757.2 ECONOMY............................................................................................................................. 757.3 ENVIRONMENT...................................................................................................................... 757.4 SAFETY................................................................................................................................. 76
REFERENCES ......................................................................................................................... 77
LITERATURE............................................................................................................................... 77

Light Rail –experiences from Germany, France and Switzerland
9
STUDY VISITS .............................................................................................................................. 79ORAL REFERENCES..................................................................................................................... 79INTERNET REFERENCES.............................................................................................................. 79APPENDIX 1- ROLLING STOCK OF SAABRUCKEN ........................................................................... 80APPENDIX 2 - SAARBRUCKEN’S NETWORK.................................................................................... 81APPENDIX 3 - ROLLING STOCK OF MANNHEIM............................................................................. 82APPENDIX 4 - MANNHEIM NETWORK ........................................................................................... 83APPENDIX 5 - ROLLING STOCK OF ZURICH................................................................................... 84APPENDIX 6 - ZURICH’S NETWORK .............................................................................................. 85APPENDIX 7 - ROLLING STOCK OF STRASBOURG........................................................................... 86APPENDIX 8 - STRASBOURG NETWORK......................................................................................... 87APPENDIX 9 - ROLLING STOCK OF KARLSRUHE ............................................................................ 88APPENDIX 10 - KARLSRUHES NETWORK ....................................................................................... 89APPENDIX 11 - ECONOMY AND ECOLOGY ARE NO CONTRADICTIONS .............................................. 90APPENDIX 12 - KARLSRUHE MODEL ATTRACTS WORLD-WIDE INTEREST...................................... 100APPENDIX 13- DIRECT AND INDIRECT POLLUTION FOR DIFFERENT TRANSPORTATION MODES...... 103

Light Rail –experiences from Germany, France and Switzerland
10
I. Introduction
This is a thesis work about light rail, which means modern trams, and its traffic safety andeffects on the environment. It was done in Kaiserslauten Germany during the first part of2000 for the Traffic division at Luleå University of Technology.
I.I Background
Light rail has become more and more popular in the world the last 15 years. Many cities havebuilt new tram system and cities with old systems have modernised them. There have beenseveral reports made to show whether trams are economically feasible, but few concerningtraffic safety and environmental effects. The knowledge about modern tramways in Sweden islimited to the tram system in Göteborg and Norrköping.
I.II Purpose
Since modern trams are so common in Europe and Sweden have lost much of our knowledgeabout trams, we want to gather information about light rail in some European cities especiallywithin traffic safety and environmental effect.
I.III Boundaries
We have limited our thesis to focus on five cities in three different countries in Europe. It willbe an information-gathering thesis and not a scientific one. The main topics of the thesis arelight rails’ effects on traffic safety and the surrounding environment.
I.IV Method
The methods we used for finding information were mainly literature studies and case studies.Information was also found on the Internet and in articles mainly on the Internet. A part of ourcase studies was an international workshop and study visits to our case cities. During theworkshop and study visits we interviewed many people to get deeper knowledge. The thesis isan information gathering rapport.

Light Rail –experiences from Germany, France and Switzerland
11
1. History
From the beginning people used horses and wagons for transportation in cities. The ones whocould afford it had their own horse and wagon and often someone to drive the wagon forthem, and some had neither. But people who wanted to travel with wagon and could afford itbecame larger and larger but did not want to own a horse and a wagon. The need and marketfor transportation was born.
1.1 The 18th century
It started with a single horse and carriage; soon “transportation companies” noticed that manypeople travelled along the same routes. So they started to use bigger wagons, horse-drawnomnibuses. Now they could offer more people transportation to a lower cost. These kinds ofvehicles were operating around London as early as in 1798. France was the first nation to usethem in inner city areas. Muller, G. (1994).
But there was one problem, the more people the carriage could take the more horses wereneeded, so they had to come up with a solution to increase capacity. It was well known by thistime that a steel wheel on a steel rail had a lower friction. The railroads had been in use forsome time, so the technology already existed. So they laid tracks in the cities and let thehorses draw carriages with steel wheels, horse-drawn trams.
1.2 The 19th century
The first horse-drawn “street railway” opened in New York in 1832, the line ran from Harlemto lower Manhattan. A couple of years later, New Orleans opened a horse-drawn tramway,but they were the only cities that had a horse-drawn tramway for almost two decades. In 1856Boston builds a system and was followed by five other cities. The explanation of the suddeninterest for horse-drawn tramways was that the grooved rail was introduced. In 1852 the firstgrooved rail horse tramway in New York opens and a French engineer, Alphonse Loubat,built it. In 1853 Mr. Loubat opened Europe’s first horse tramway in Paris, but the Europeanhorse tramway development did not really got under the way until the late 1860ies.
This technology had of course its limits and problems; and the capacity roof were soonreached. The horses were expensive to purchase, stable, and feed, and were soon worn out ofthe street work. Their sensitivity to diseases was dramatically demonstrated in 1872 whenthousands horses died in the Great Epizootic, an equine-influenza epidemic, the carriages hadto be powered by something else.
There were some attempts in England year 1821 to 1840 to use steam-powered engines butthey were not suited to the inner city environment. The trams became very noisy, slow, heavyand bulky. They attracted few passengers from horse-drawn trams while working the sameroute and became a commercial failure. Later the same century developments of the steamengine led to a renewed interest but even then it never became successful for inner city use.Other attempts to find an alternative source of power were “fireless steam engine” and theMekarski compressed-air system, but none of these engines succeeded.

Light Rail –experiences from Germany, France and Switzerland
12
The first electric powered rail guided vehicle was shown in 1837, it was build by a blacksmithfrom Massachusetts. The following year Robert Davidson ran his locomotive on Scottishrailway with a top speed of 6 km/h, both of these vehicles had a battery. They were neversuccessful because of high costs and low capacity.
In 1870ies the dynamo and the electric engine were developed by Werner Von Siemens(1816-1892), Z. T. Gramme, C. F. Brush, Pacinotti and others. This became to be a turningpoint for electric powered rail guided vehicles. In 1879, Siemens firm, Siemens & Halske,built a demonstration electric railway for the Berlin Trade Fair. Two years later were theworld’s first electric streetcar line developed by the same firm and opened at Lichterfelde nearBerlin.A similar railway was opened in Brighton (England) in 1883.
There was a problem, using exposed conductors in public streets had its disadvantages. Theconductors had to be protected by fencing. This limited the use of electric power source andthe electrification of tramway routes therefore proceeded very hesitantly.Siemens & Halske put a lot of effort to solve this problem and for the Paris Exposition 1880they presented overhead copper-wire conductor, which was set inside a slotted pipe.
Figure 1. A “Wagen 573” from 1885. (www.lrta.org)
In most American cities the electrification of tramway had a more direct development. Thetechnology being used was overhead-wires. A lot of transportation companies, entrepreneurs,started to build tramway systems without esthetical aspects and only few safety regulations.The fact that the entrepreneur’s activities generally happened to be beneficial to the generalpublic was in such cases of secondary importance in the minds of urban politicians steeped inthe ideology of “free enterprise” and material progress. There were some exceptions. Oldcities like Washington, Boston, Philadelphia and New York had a bit more European way ofdevelop tram systems, sometimes with very strong regulation. For example in Philadelphiathe Transit Company had to maintain all streets on which its streetcar ran.
In Europe planning of tramway systems was considered to be a governmental issue, they feltthat streets and square should not be wrapped in an untidy web of overhead wires andbelieved that further technical work would yield a feasible and visually unobtrusivealternative to the American overhead trolley system. So the manufacturers had to come upwith something better. There were three main alternatives that were explored: battery traction,continuous-contact conductors in underground conduit, and surface-contact systems.

Light Rail –experiences from Germany, France and Switzerland
13
There were a lot of problems to find a reliable, efficient and economical solution, in the endthe overhead system became accepted by the public and the authorities. This because theyrecognized the fact that the electric tramway offered positive social benefits, resultingprimarily from greatly increased travel speed and reduced fares. Vuchic, V. (1981).
1.3 The 20th century until today
In the beginning of the 20th century trams were in use in most large and medium-sized cities.Some early streetcar fleets had special summer cars with open sides and some others hadconvertible car, design for pleasure. The typical streetcar was 2-axle, wooden-body and prettyshort, up to 10 meters and was the most common streetcar until after the World War 1.Gradually it was replaced with 4-axle vehicles, 12 to 16 meters, and by 1920 the dominatedmost transit systems in the larger cities.
Figure 2. A “Wagen 2990” from 1910. (www.lrta.org)
Even though trams played an important part in the cities with rising rider ship the companieshad difficulties to achieve continuous financial success. The reason for this was the low fares.Regulatory bodies did not allow corresponding fares to the increasing operating andmaintenance cost, which led to many bankruptcies. In 1920, after looking at the problems, theFederal Electric Railway Commission stated and set new recommendation to counteract thesituation of the transit market. They succeeded in many ways.
During the 1920ies and early 1930ies the private automobile started to compete with tramsand making an impact on rider ship. Congestion started to occur in streets and the tram haddifficulties to compete with cars and buses in mixed traffic because they had too slowacceleration ability. With improved technology they continued their struggle against theautomobile.More and more traffic was set to be highway traffic and less to be rail transit, the most citiesstarted to convert their inner city traffic to buses. This was discontinued during the SecondWorld War and a few years after when the demand for transit service increased.
A couple years after the Second World War cars became more and more popular again, therestarted to be more congestion in the cities. During this period the trams was considered oldfashion and ineffective. The conversion started again, but now even more rapidly. Thepatronage of tramways decline, more and more cities across Europe and USA abandoned theirtramway systems in order to complete relay on cars and buses.

Light Rail –experiences from Germany, France and Switzerland
14
There were few cities across the world that kept their tramway systems, some in the US butmost of them in Germany.
The space gained by removing trams from the streets had only a temporary effect, the annualincrease of cars was too big so the congestion remained and got worse for every year.Cars were thought to be the future so the cities had to be adjusted for cars; they build morehighways and wider roads. The more they build the more cars were being used, and the morecars being used the more they had to build and so on.
Finally it came to a breaking point, they could not build more in the cities, there were nospace left. The only alternative was to tear down old culture buildings and monuments.With a very strong local opinion against it the politicians and city-planers had to come upwith another solution.There were, and still is, cities with no or small congestion problems, these cities got a lotattention from authorities, politicians and city-planer from cities with congestion problems.These cities without congestion problems seemed apparently often have one thing incommon; they had kept and developed their tramway systems into Light rail systems. (Lightrail systems are also known as Light rail transit systems, LRT-systems.)
Figure 3. A modern LRV, the “Eurotram” in Strasbourg.
There should be pointed out that some of the cities that have kept their tramway systems havenot developed them into LRT-systems. For further reading about the difference between lightrail and trams see “Introduction to light rail”. Vuchic, V. (1981).
Today there is about 350 trams or light rail systems all over the world. The total length of thesystems is approximate 15 000 km with 35 000 vehicles operating on them. www.lrta.org

Light Rail –experiences from Germany, France and Switzerland
15
2 Introduction to light rail
2.1 What is a modern tram or light rail?
It will simplify the attempt to define modern tram and light rail, by starting to explain thedifferent types of right-of-way. Because the main criterion to distinguish tram systems andLRT systems from each other as well as from metro systems is the type of right-of-way.
Shared right-of way means that the rail going vehicle have to share the space with other trafficmodes in the street, such as cars, bicycles and trucks. There is no priority at crossings andintersections, and can be caught in traffic jams and bothered by congestion as any other trafficmode.Reserved right-of-way means that there is a specific space left in the street for the vehicle, butother traffic modes is able to use this space, such as when cars have to make a turn to the left,but there is no physical barrier to prevent intrusion on the tracks. There can be priority incrossings and intersections. This right-of-way can be, but it is rare, bothered by congestionand caught in traffic jams.Exclusive right-of-way have it’s own space with physical barrier to prevent intrusion. It haspriority in crossings and intersection and can hardly be bothered by congestion.A traditional tram mainly operates on shared right-of-way, which over the years have madethem more and more ineffective and unreliably the more traffic that have appeared. Sharedright-of-way is the traditional trams main characteristic. A modern tram mainly operates inreserved right-of-way, this type of right-of-way have been developed through the years toincrease the effectiveness for trams in modern society. The main characteristic for a moderntram is the combination of different types of right-of-way. Light rail emerges from these typesof right-of-way to exclusive right-of-way, like a mini metro. Exclusive right-of-way is themain characteristic for light rail, but another characteristic for light rail is that it is flexible, sothere can be other types of right-of-way in an LRT system.
As the name light rail suggests, there is some sort of definition in vehicle weight and size.Compared with a regional train a light rail is lighter and shorter, but compared with a moderntram it can be a bit heavier and longer. The border between a modern tram and light rail, insize, is somewhat fluid and can be considered an academic issue. Because many times it is thesame type, model, of vehicle, but in the case of light rail they have coupled a number ofvehicles together. A normal length for light rail is 80 to 100 meters; this of course depends onwhat kind of route it will traffic. It is not suitable with to long train on routes with a lot ofreserved right-of-way.
There is a wide range from the traditional tram sharing space with car traffic to the light railwith its own right-of-way between intersections and its own signalling at intersections. Inmany cases light rail systems were developed from old tramways, extended or totally newlybuilt. Modern bus systems have similar characteristics and in numerous cases there are mixedoperations of light rail vehicles and buses on separate public transport lanes. In the largecities, light rail systems often have some underground routes within the city centre.The biggest advantage of light rail and at the same time part of its definition is its flexibility.It can be operated as a traditional tram with shared right-of-way in outer parts of the city and

Light Rail –experiences from Germany, France and Switzerland
16
also as a metro on a separate railroad with segregated or even exclusive right-of-way in thecity centre with all other types of right-of-way in-between.
As an example, Hannover was one of the first cities to open a light rail system; it was openedin 1975. Their system is combined light metro running underground within the city centre andan advanced tram system in other parts of the city. They use retractable steps on the vehiclesso they can be adjusted to stations with high and low platforms. The system in Hannover haveproved it self to be very flexible, offering full use within every stage of its development fromtraditional tram to modern light rail. Total double-track length today is nearly 100 km, with 15per cent underground, 60 per cent with segregated railroad and 25 per cent with shared right-of-way. 330 000 passenger are served daily, which is nearly 75 per cent of the total number ofusers/customers of the Hannover transport authority.
In Karlsruhe the light rail operates on very different types of track. It has shared right-of-waywith car traffic in outer areas, where car traffic is limited to residents, service and delivery,shared right-of-way with pedestrians in two pedestrian zones, reserved right-of-way on transitlanes separated by markings or special surface, or by rumble ground strips. Segregated right-of-ways in the middle or alongside a boulevard with open rock surface, pavement or grass,and mixed operation with railway on railway tracks. An underground section with exclusiveright-of-way under main shopping street, in addition to on-ground within the street wasrejected by the population in a poll two years ago.Hannover and Karlsruhe are two different examples that demonstrate the flexibility of lightrail owing to the combination of different tracks with different right-of-way. A light railsystem can be developed step by step from traditional tram on the street surface with orwithout its own right-of-way to a separated system. Each step of development can be the finalstep, which should admit further development if it is later considered. This flexibility andstep-by-step development is the main characteristic of light rail compared with a metrosystem. (Professor Dr.-Ing Topp, H. 1998)
A very important feature of a street-level light rail system is that it should be able to beintegrated into urban fabric. To be able to be that one can not try to achieve the same standardas a metro, because if one would succeed this achievement one would most certainly haveruined a lot of the townscape. One of street-level light rail systems major benefits is that youcan transport a lot of people down a street and pedestrian still can cross the same street fromone side to the other without become delayed by weeks. The importance of good integrationof a system in a city of course applies to stops too, maybe even more. Because they have toprovide comfortable access, convenient stay and personal safety when waiting people canobserve other people and can be seen by others. This is a totally different quality comparedwith underground stations.
Above, Hannover and Karlsruhe have been used as two examples to show how differentsystems can be. They are different in several respects: the main feature in Hannover is themetro-like underground section in the city centre, whereas in Karlsruhe it is the use of railwaytracks to connect the region directly with the inner city. Derived from such differences as wellas from the way a system has developed, nine types of LRT may be distinguished:

Light Rail –experiences from Germany, France and Switzerland
17
Different types of LRT
Type 1:Modernized tramway systems usually have shared or reserved, and in sometimes segregated, right-of-way. Theyrun through pedestrian zones and have priority treatment at junctions. Low-floor cars are replacing old vehicles.Examples with extended network are Amsterdam, Oslo, Zurich and Vienna.
Type 2:New tramway systems are based on low-floor vehicles, they are well integrated into to the townscape and aconsiderable part of the network is segregated from other traffic. Examples are Grenoble, Strasbourg andValencia.
Type 3:Evolutionary LRT systems are upgraded from trams, having segregated right-of-way over long sections or evenunderground exclusive right-of-way. Some were planned for final conversion into metro systems, as in Frankfurtand Stuttgart. Other examples are Gothenburg, Hannover and Rotterdam.
Type 4:New LRT systems are similar to case three. Since they cannot use old tracks they usually consist of only a fewlines. North America has the greatest number of these systems with Calgary, Edmonton, Portland and San Diego.In Europe, Utrecht and Sheffield fit into this category as well as Tunis, Kuala Lumpur and Sydney.
Type 5:Mini-metro type LRT is fully grade-separated systems that usually include underground sections in the innercity. In fact, they represent mini-metros, with consequent loss of the flexibility that is one of the main advantagesof tram/LRT systems. A recent example is Copenhagen.
Type 6:AGT-type LRT systems are automatically guided and operated, as in Dockland London, Lille and Vancouver. Ofcourse, they need exclusive right-of-way within their whole networks; here again, as in type 5, the flexibility oftram/LRT system is lost.
Type 7:LRT-regional rail integrated systems use railroad tracks to expand service into the region. They can be based ona tram system as in Karlsruhe or represent transitional forms towards a metro system as in Manchester.
Type 8:Regional trains on tram tracks is similar to type 7 but instead of adjusting a tram vehicle to operate on railroads arailroad vehicle is adjusted to run on public streets. Regional rail service, with light vehicles, is to be connectedby tram directly into the city centre. It was introduced in Zwickau, Germany, in 1999.
Type 9:Track-guided rubber-tired tram was developed by Bombardier and received approval at the end of 1997. It issupposed to combine a tram in the inner city with the flexibility of a bus at the periphery. It is guided by amonorail and supplied with electricity by overhead wires. It may be implemented in Caen, France.
When evaluating these different types of tram/LRT, Prof. Dr. Ing. H. Topp, University ofKaiserslauten, suggests that, for Europe, cases 1,2 and 7 will be the most interesting ones inthe future. This is based on recent developments, and the estimation that advanced trams on-ground with segregated right-of-way wherever it is feasible, combined with utilizing existingrailway tracks, represent an efficient form of public transport at reasonable able investmentcosts. A benefit analysis for Bologna, for instance, comparing an LRT system, with someunderground sections, with an on-ground tram system was highly in favour of the tram. Twoyears ago it was decided that, after 35 years, a tram of 19-km length in the first phase andfinally of 52 km will return to the city.

Light Rail –experiences from Germany, France and Switzerland
18
Trams and LRT ought to be integrated into urban life, because they represent a friendly modefor vibrant cities. This is what makes them so popular in Europe among planners andpoliticians as well as passenger and residents. Trams pass right into the city, whereasunderground systems miss the urban life. The passenger recognizes where the trams operate,waits for the tram in a public open space, feels safe, sees the tram coming, enters easilywithout steps, experiences urban life and is a part of it.Trams are preferred to buses even when journey times are the same and they are morefrequently used. This effect is known as “tram bonus” and means more passengers owing tomore comfort, originality and perceivability of the line within the street. This “tram bonus”could be observed several times when tramlines were opened: it amounts to up to 30 per cent.(Professor Dr.-Ing Topp, H. 1998)
2.2 Bridging the capacity gap between bus and metro
One of the most important features for a transit mode is the capacity; a LRT has a highvehicle capacity of about 220-250 persons per 35-meter long car. This can be compared withan 18-meter long bus, which only have half of that capacity, and a 12-meter standard bus,which only have a fourth of that capacity. In most LRT system you also have the opportunityto operate LRT vehicles in trains, which multiplies the capacity. All systems don’t have thisopportunity because a vehicle longer than 40 meters is not suitable for operation in mixedtraffic and shared right-of-way. In systems with separated rails and signalised crossings LRT-vehicles with a length of 80-meters are feasible, this gives them an unique opportunity toincrease the capacity during peak hours with the same number of staff and lines.
Figure 4. Passenger capacities for different transit modes. (Vuchic, V. 1981)
Light rail meets the capacity gap between buses and metro; with a practical line capacity of upto 5000 passenger per hour in each direction and a maximum trunk capacity up to 20 000passenger. This can be showed in a capacity diagram, as in figure 1.The capacity depends, as earlier mentioned on the number of vehicles but also on the stopspacing and the headway. More about stop spacing in chapter 2.3, the headway is often theparameter that gives a line its practical capacity. This is because there is a need of spacebetween the vehicles, especially in the city centre. Light rail usually is sufficient to servecities up to two million inhabitants. (Vuchic, V. 1981)

Light Rail –experiences from Germany, France and Switzerland
19
2.3 Tram and Light rail network
The normal stop spacing for a tram/LRT in a city centre is 400-600 meters; with a walkingdistance up to 6 min or 350 meters a stop covers approximately a strip of 700 meters. This canbe compared with the metros stop spacing of at least 800 meters, if the metro stop spacing isless than 800 meters the advantage of higher journey speed is lost. The normal averagejourney speed for a metro is somewhat around 40 km/h and tram/LRT have an averagejourney speed at 25km/h.
Figure 5. Stop-spacing. (Vuchic, V. 1981)
Take an everyday trip from the periphery of a city into the city centre, a door-to-door journey.The access time including waiting for the tram/LRT might be 10 min. Almost the sameapplies to the metro for people living within walking distance, but the majority living outsidewalking distance so the need access to a feeder bus. So for people travelling with the metroone has to add bus journey time, transfer to the metro from the bus and some waiting, thistime can easily be 25 min. So when comparing the door-to-door journey one will find that thetram/LRT journey will be faster up to a distance of 15 kilometres. This radius easily covers acity with 2 million inhabitants, most parts of central Europe. This radius can probably not beapplied to Swedish cities because of the low density.The door-to-door journey will take about 45 min, and have to be considered appropriate forcommuters as well as for other purposes. If one would increase the distance between stops ina tram/LRT system, the need of feeder buses would occur and a decrease would be inefficientfor the system because it would slow down the average speed within the system.
2.4 Level boarding and other vehicle features
To be able to attract commuters, keep and gain patronage the trams/LRTs have to offer acomfortably, pleasant and fast ride. So the vehicles have not only to be practical and usefulbut also have to look good and appealing to the eyes of the inhabitants. The issue of beautifuland appealing design will not be dealt with here, just commend as an issue where themanufacturers have put in a lot of man-hours and succeeded. This text will mainly focus onthe practical parts of the tram’s/LRT’s design.
One of the most important changes in tram/LRT operations is the vehicles floor height, asmall change have given the transit mode large benefits, and still the idea goes back as far asto 1894 in Vienna. It was here the first low-floor was developed. A low-floor vehicle have anentry height of about 290 to 300 mm above the top of the rail, this can be compared with thetraditional trams with an entry height of about 560-mm. The modern low-floor vehicles are

Light Rail –experiences from Germany, France and Switzerland
20
using free wheel boogies, where there are no axle between the wheel pair, and every wheelare driven by it’s own electric motor.
Figure 6. No good boarding height.
Low-floor gives easy mental and physical access to the vehicle, it feels easier to board thevehicle, one do not have to climb onboard, as was the case with old trams with three or foursteps to get in. It is easier for handicapped people to get on board the vehicles and it is easierfor people with perambulator to enter, easier entry, and easier exit. Low-floor combined withsomewhat wider door’s gives shorter stop time at each station and a more efficient system, 3to 4 percentages efficient compared with a system operated with high-floor vehicles.With low-floor comes low platform, not only are they easier to fit in the urban environmentand make less intrusion in the city, they are also easier to get up on, both physically andmentally. The numbers of doors on the vehicles have also increased, which also contributes toeasier and faster entry and exit time, and following less dwell time.
Some cities have gone even further in developing the low-floor vehicles, Vienna for instancehave developed ultra low-floor vehicles (ULF), with an entry height of 197 mm top of the rail,this to increase the advantages low-floor have. It is most interesting that a city like Viennadoes something like this because they run one of the world’s largest tram networks with 36lines, 254-km double track and 1000 stops, metro and buses is not included. An Austrianbased group, SGP/ELIN/SIEMENS, was chosen to cooperate with; the first vehicles havebeen in traffic for more than a year. (Professor Dr.-Ing Topp, H. 1998)
Earlier the driver sold tickets on board; nowadays there are tickets vending machines on theplatform instead, so the time for buying tickets does not affect the vehicles journey time.
2.5 Tram and LRT in pedestrian zones
Trams have a long tradition of operation in pedestrian zones, because it was here where thefirst routes were laid and it was here were people gathered. There are few accidents andproblems, pedestrians and public transportation are in good coexistence.According to Prof. Dr.-Ing. H. Topp, trams/LRTs and pedestrians fit together, better thanbuses and pedestrians. This because of trams and LRTs owing to the rails. But buses routesthrough pedestrian zones are no problem as long as the bus headway is clearly marked byspecial pavement and/or small kerbs.In Germany the maximum speed of vehicles in pedestrian zones is generally 7 km/h, butpublic transportation often gets an exemption to 20 km/h like in Mannheim, or 25 km/h like inKarlsruhe and Freiburg.

Light Rail –experiences from Germany, France and Switzerland
21
The capacity doesn’t seem to be a severe problem, in Bremen for example 88 tram and 30buses pass through the pedestrian zone per hour in each direction. The street width is 20,5meters.
But there can be to many trams/LRTs in a pedestrian zone, in Karlsruhe during peak hours,144 trams of six different lines passes through the main shopping street, which is about 22meter wide. Some people in Karlsruhe felt like that the trams were like a wall, so the questionwas raised if there should be a tunnel under the tracks instead. The voters recently rejected thetunnel project, and now a new tunnel is being planed a bit further south. (Professor Dr.-IngTopp, H. 1999)
2.6 Utilizing railway tracks for tram and LRT
In order to expand the service of trams and LRT to the city surroundings and the region someoperators have started to use railway tracks. Bye doing so, they can offer a very fast and directjourney to the city without changing modes at the railway station. From customers polls it isknown that a direct ride together with a short journey time and reliability are the mostimportant factors in attracting passenger. The first city to use railway tracks for LRT wasKarlsruhe, who introduced the world’s first dual tram in 1992
In using railway tracks for LRT vehicles, several cases can be distinguished:
1. An abandoned track is used. This means a d.c. electricity system usually with 750 V hasto be installed. Gauge width has to be changed if the tram/LRT uses a meter gaugeinstead of the “normal” gauge of 1435 mm. Platform height and edge need to be adjusted,maybe combined with adjustments to the vehicle such as retractable steps or ramps.
2. The railway track is still used by some freight trains with diesel propulsion. In this casethe necessary adjustments are basically the same, though maybe they are more restricted.For instance, in case of a meter gauge a three-rail track is needed; for adjustment of theplatform edge in the case of Kassel, Germany, even a four-rail track was used within astation to handle the different widths of freight trains and LRT vehicles. The electricity,of course, will be direct current for the LRT, which means that normal tram/LRT vehiclesand diesel locomotives can use the same track.
3. The third case considered is mixed operation of the tram/LRT and passenger service ofthe railways with diesel propulsion. Adjustments are similar to those with freight train,but an additional problem arises with platform height and edge.
4. The most complex case realized so far has been mixed operation of the tram/LRT withdirect current and passenger railway trains with alternating current. In addition to all theadjustments mentioned above, a dual-current vehicle is needed. This case was the firstrealized in Karlsruhe in 1992.
5. There might be an even more complex case if the tram/LRT is considered to operate ondifferent railway systems with different electricity supplies. This will happen with theplanned tram/LRT for Luxembourg, which is supposed to run within the city and on the

Light Rail –experiences from Germany, France and Switzerland
22
railway tracks of the Luxembourgian, French, German and the Belgian railways. Thisadds up to four different electricity systems.
In both Karlsruhe and Saarbrucken the first four cases can be found in the same system, andthere are at least three similar projects going on in Germany, (Aachen, Chemnitz andZwickau), but there is numerous of examples of single case systems through out all ofGermany. Luxembourg will probably be the next city to introduce a tram system according tothe Karlsruhe model. (Prof. Dr.-Ing. Topp, Hartmund H.)
2.7 Easy access and usability
Stops have to meet a number of demands, these demands can be easy to access, a comfortablyaccess, be identifiable for as far as possible, of course without to intrude on the townscape, bea shelter against wind and rain. People have to feel safe when they are waiting on the tram orLRT. In order to do so there have to be good lightning, there should be more people around aswaiting passenger can see and be seen by. So to place a stop nearby a kiosk, a store, a phone,have several benefits. The new platform for low-floor vehicles simplify the adjustments madeto increase the accessibility for handicapped. A stop should have easy-to-read information,actual information by a dynamic board announcing the next tram or LRT.When placing a bicycle garage nearby a station, theft-proof is to prefer, one increases thecatchments area with almost nine times, and of course there have to be one or more vendingmachines there. Vending machines contains money, which attracts thieves, vandalism isusually a problem, and in order to avoid this many operators are developing “cash-less”payment solutions and electronic tickets.

Light Rail –experiences from Germany, France and Switzerland
23
3. Case study cities
To get a deeper knowledge about the general concept of light rail and modern tramways fivecase cities were chosen.There are many cities with trams in Europe so some specifics were needed to select the rightcities. Our parameters were chose to be geographical location, size of city, age of the tramsystem and others.
Geographical location means were in Europe the city is located. To get as much informationas possible about different kind of light rail systems we want to have our case study cities inat least two different countries. We decided that the city must be located in the central part ofwest Europe. The circle on the picture shows our geographical limitation.
Figure 7. Map over Europe(www.maps.com)
There are cities of many sizes that havelight rail systems. Sometimes a city is bigenough to have both a metro and a LRTsystem. We would like our case studycities to vary in city size. A LRT is usuallysuited for medium size cities and not bigcities. Our aim is that our case study citiesshould have a population between 150 000to 1000 000 inhabitants.
Age of the tram system is also importantfor us. Many tram system in Europe areold, they run on their tracks as they did for100 years ago. Only minor changes havebeen made at most of tram roots. This isnot what we mainly want to look at. Mostof our case study cities should have a newor upgraded LRT system. But also at leastone city has an old fashion tram system.
Other things that can be special about the system could for example be dual systems were thelight rail vehicles could run on both railway and normal tram tracks.Countries to chose from; Belgium, Netherlands, France, Germany, Italy, Switzerland, Austria,Czech republic and England.
In these countries there are still too many cities with trams so we only focus on the countieswho have lots of LRT systems and are close to Germany. That leaves Austria, France,Germany, Netherlands and Switzerland.
Light Rail –experiences from Germany, France and Switzerland
24
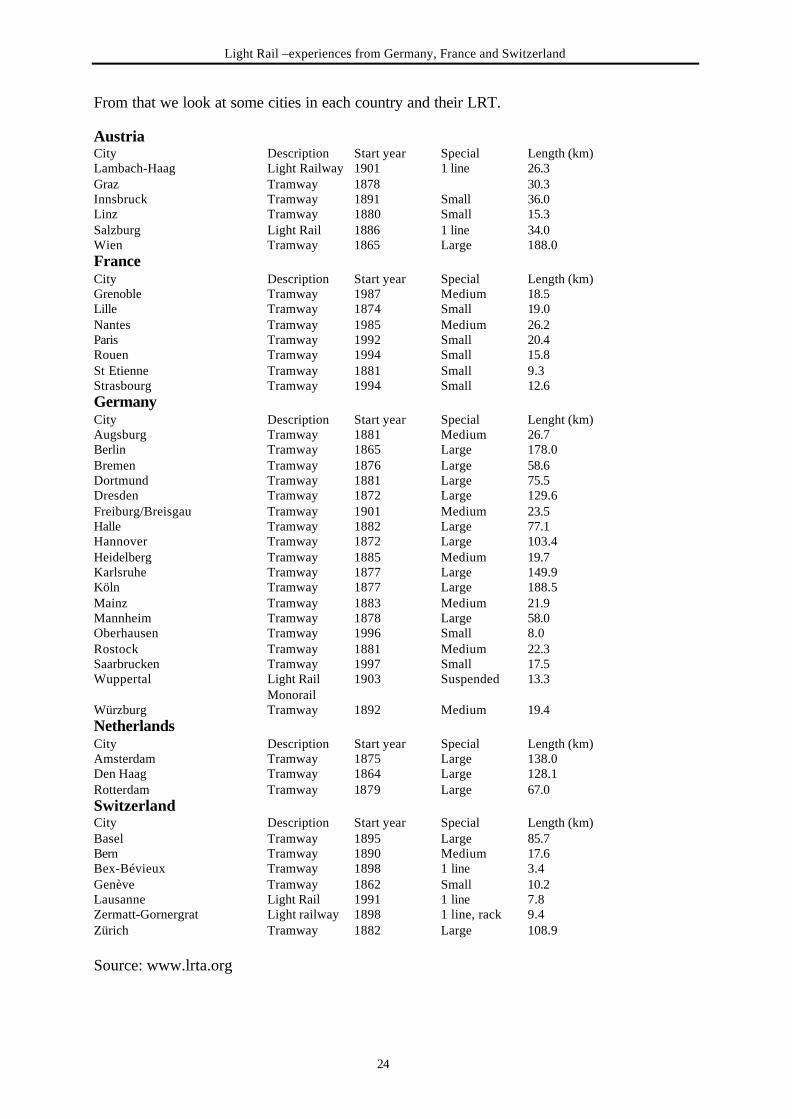
From that we look at some cities in each country and their LRT.
AustriaCity Description Start year Special Length (km)Lambach-Haag Light Railway 1901 1 line 26.3Graz Tramway 1878 30.3Innsbruck Tramway 1891 Small 36.0Linz Tramway 1880 Small 15.3Salzburg Light Rail 1886 1 line 34.0Wien Tramway 1865 Large 188.0FranceCity Description Start year Special Length (km)Grenoble Tramway 1987 Medium 18.5Lille Tramway 1874 Small 19.0Nantes Tramway 1985 Medium 26.2Paris Tramway 1992 Small 20.4Rouen Tramway 1994 Small 15.8St Etienne Tramway 1881 Small 9.3Strasbourg Tramway 1994 Small 12.6GermanyCity Description Start year Special Lenght (km)Augsburg Tramway 1881 Medium 26.7Berlin Tramway 1865 Large 178.0Bremen Tramway 1876 Large 58.6Dortmund Tramway 1881 Large 75.5Dresden Tramway 1872 Large 129.6Freiburg/Breisgau Tramway 1901 Medium 23.5Halle Tramway 1882 Large 77.1Hannover Tramway 1872 Large 103.4Heidelberg Tramway 1885 Medium 19.7Karlsruhe Tramway 1877 Large 149.9Köln Tramway 1877 Large 188.5Mainz Tramway 1883 Medium 21.9Mannheim Tramway 1878 Large 58.0Oberhausen Tramway 1996 Small 8.0Rostock Tramway 1881 Medium 22.3Saarbrucken Tramway 1997 Small 17.5Wuppertal Light Rail 1903 Suspended 13.3
MonorailWürzburg Tramway 1892 Medium 19.4NetherlandsCity Description Start year Special Length (km)Amsterdam Tramway 1875 Large 138.0Den Haag Tramway 1864 Large 128.1Rotterdam Tramway 1879 Large 67.0SwitzerlandCity Description Start year Special Length (km)Basel Tramway 1895 Large 85.7Bern Tramway 1890 Medium 17.6Bex-Bévieux Tramway 1898 1 line 3.4Genève Tramway 1862 Small 10.2Lausanne Light Rail 1991 1 line 7.8Zermatt-Gornergrat Light railway 1898 1 line, rack 9.4Zürich Tramway 1882 Large 108.9
Source: www.lrta.org

Light Rail –experiences from Germany, France and Switzerland
25
After having reviewing all cities interesting, these were finally chosen as our case study cities.
1.Saarbrücken (Germany) A city, which hasreintroduced a LRT system in the city, isfollowing the Karlsruhe model.2. Mannheim (Germany) A typical Germantram system which in recent years have beenupgraded with new vehicles.3. Karlsruhe (Germany) has a big region LRTsystem that has been named “The Karlsruhemodel” in an average size city.4. Strasbourg (France) A very new LRT city,which have had a huge success.5. Zurich (Switzerland) One of the mosteffective tram systems in Europe, an oldertram system.
Figure 8. Case study cities (www.maps.com)
By choosing these cities our aim is to get information from LRT system that is not like eachother and by that way get much information as one can get from five systems.
3.1 SaarbruckenSaarbrucken is one of several German cities that have reintroduced trams. Saarbrucken is acity with a population of 190 000 which makes it both the biggest and the capital city ofSaarland.Saarland is located in the west part Germany on the boarder to France and Luxembourg; thisis a region that has belonged to different countries through history.
3.1.1 HistoryFrom the end of the 1900th century until the middle of the 1960ies Saarbrucken had a tramsystem like most cities in Germany. In the 1960ies the general opinion among city planerswere that transportation should be on roads and not rail, especially in cities. Tramsdisappeared in many cities, not only in Germany but also France, Great Britain, USA etc.One reason behind the disappearance of trams was that bus traffic was considered cheaperthan trams. The lost of the tram system in Saarbrucken is typical of the development for thattime (www.saarbahn.de).
3.1.2 The Saarbrucken Regional modelIn the beginning of 1990ies the federal state capital of Saarbrucken took a decision to developa new transit system based on the example of Karlsruhe. The reasons for this decision werebased on:1. Individual motor traffic had become a problem in the city.2. Deutch bahn (The German railroad) had been privatised and put down several lines inSaarland.3. The “Karlsruhe model” had proven that trams could be reintroduced successfully onregional base.

Light Rail –experiences from Germany, France and Switzerland
26
The new tram project (Saarbahn) would be a very small compared with the tram systemSaarbrucken once had. It would involve regional public transport connections that don’t stopwere the city ends. The role model for the Saarbrucken project was the “Karlsruhe model”,which were based on an existing tram system and regional rail system. The “Karlsruhe model” has got a great deal of national (German) and international attention.The Saarbahn in Saarbrucken and it’s surrounding provides an example that it is still possibleto develop a LRT system for the region without the existences of a tramway system.
Of Saarbruckens 190 000 inhabitants more than 60 000 commute to and from work every day.Even when public transports stand for a very high share (25%) of overall inner-city trafficflows, the disturbance cause by traffic is serious. Another problem is that cars make most tripsto and from Saarbrucken. Together these two problems have made the roads in the citycongested.
Figure 9. The tram train in Saarbrucken
With this background, the city council developed a concept to decrease the individual trafficwith 20%. This means that the public transport capacity need to increase with 65 % to handleall the new passengers. Earlier experiences have shown that buses could not provide anenvironmental friendly alternative. At the same time one of the major roads in the city centrewas turned into a pedestrian area, which made it important to increase the public transportpassing the centre.
The city council decided therefore unanimously to develop a regional LRT network. From thedecision that was taken in 1992 until the tram system was opened for traffic it only took 5years, the opening was in October 1997. Which is one of the fastest planning and constructionperiods for a modern tram system in the world.
The use of existing regional rail is an important factor for the Saarbahns development.Saarbahn’s first line is between Sarreguimines in Lorraine (France) to Lebach in the middle ofSaarland. At present the line is not complete, the last part is under construction. The line willbe 45 km when it is ready and has three different kinds of stretches.From Sarreguimines to Saarbrucken the tram run on old railway and uses normal electricityvoltage from trains, 15 kV, 16 2/3 Hz.

Light Rail –experiences from Germany, France and Switzerland
27
The second part is the new build link trough Saarbrucken; this part is like a normal tram trackwith complete right of way. 5 km of the 15 km planed section are now in service, whichincludes part in the downtown area.The last part up to Lebach is mainly on single-track with full right of way, these track alreadyexist but need to be electrified (Professor Dr.-Ing Topp, H. (1998)).
The idea of combining existing stretches and right of way with newly built sections throughthe central axis has advantages, particularly in terms of costs. It is fairly certain that totalreconstruction of the whole stretch of line would not have been financially viable given thecircumstances found in the Saarbrucken area.
3.1.3 System ComponentsThe trams in Saarbrucken are dual system light rail vehicles, which means that they can runon both train tracks and normal tram tracks. This is due to that there are special engines thatrun on 750 V DC (downtown area) and 15 kV 162/3 Hz (train tracks). The trams are also low-floor which means that the door opening is 40 cm above the ground; this with specialplatforms 35 cm high makes the entrance to the tram very comfortable.
The vehicle has three car sections and is around 37 m long. The central car is carried by twobogies, doesn’t have any doors and has a floor that is 80,5 cm above ground. Between theboogies of the middle section, the current feeder components are housed under the floor.Over its entire length it is 48% low-floor area. A single axle motor drives all eight of thevehicle axles that produce 960 kW.
Figure 10. Closed door Figure 11. Open door
Since the tram will stop at both train station and tram stop the doors have been speciallyconstructed to make the entrance easy at both places. When the tram stops at a rail station anextra step folds out which covers the gap between tram and platform.Saarbruckens light rail vehicles meet requirements both from the national railway inspectionorg. and the regional technical supervisory org. Something that is especially important sincethe tram will go on stretches where trains run as well.

Light Rail –experiences from Germany, France and Switzerland
28
All downtown sections are twin track and run either centrally or laterally. There are no single-track sections, as this would preclude the tight service headways during peak hours in. Furtheraway for the centre this will not be possible. The smallest radius for the track is 30 m.
The new stops in the central of Saarbrucken have a 75 m long platform, which makes themlong enough for two-tram set coupled together. These long tram sets are necessary at peakhours. At each stop there are shelters and a digital timetable that say how long until next tramwill arrive. Ramps for people in wheelchair are also on the stops, which make the tram accesseasy for everybody (Mrs Del Savio, Saarbahn).
The overall concept involves service intervals of 7.5 minutes, all day in the central areas. ToSarreguimines there is a tram every 30 minute.The price for a one-way ticket is 3 dm for a one-way ticket or 55 dm for a month pass withinthe city. In appendix 1 is technical information about the tram.

Light Rail –experiences from Germany, France and Switzerland
29
3.2. Mannheim
3.2.1 HistoryIn 1678, the first public transportation was instituted by the city of Mannheim in the form of ahorse-drawn coach connection from Mannheim to Frankfurt am Main. In 1700 the first publictransport service in the city, began operating, this was a horse-drawn coach.The first discounts were granted in 1749 for two-way rides with the horse drawn coachesoperating within Mannheim. In 1878 the first horse-drawn streetcar service was opened. Itwas electrified the 10th December 1900 and the track gauge was change at the same time to 1meter gauge. Before that it was 1435 mm, the reason they changed was because of the systemin Ludwigshafen had a 1 meter gauge. After 1900, there was a two-phase expansion of thenetwork with a route from the main train station to the Neckarau West district.The bus has been used since it was introduced in 1928.The only time when the trams and buses not have worked was in the end of the Second WorldWar. Almost 90% of Mannheim was destroyed of the bombs from the allied. In May 1945 thetrams started to operate on parts of its original stretching, the next year the bridge over theRhein was build up again. The tram could then connect Ludwigshafen with Mannheim again.(Dipl-Ing. Werner Rabe. MVV)
3.2.2 System todayThe total number of inhabitants in the area where the system is operating is 625 000, there is328 000 inhabitants in Mannheim, 165 000 in Ludwigshafen, and 140 000 in Heidelberg.The system that Mannheim Versorgungs- und Verkehrsgesellschaft mbH (MVV) operatehave over 60 millions passenger every year. There has been an increase in number ofpassengers every year since 1990, when they had 45 million passengers per year. This gives ayearly increase of 1.5 million passengers during the last ten years. The exact reason why thisincrease has appeared is not clear, but it is very pleasant. (Dipl.-Ing. Werner Rabe. MVV)
Figure 12. A truck passing the tracks in Mannheim.
Travelling speed is 20 km/h within the city, in pedestrian areas; Mannheim transit authoritieshave an exemption from German law. The German laws saying that the highest speed inpedestrian areas should be 7 km/h, which have to be consider as a way to low speed. On theoutside of the pedestrian areas there is stretching with 50 km/h and 30 km/h depending on thetracks. The average speed is 23 km/h within the system, which have to be considered quitegood.
There are 57.2-km double tracks and 7 km single track within Mannheim.

Light Rail –experiences from Germany, France and Switzerland
30
MVV don’t only use their own tracks, on some parts they use tracks who belongs toOberrheinische Eisenbahn Gesellschaft, (OEG), which is a outer regional train company.This is a great advantage for the service but has been, and still is, a problem. It gives MVVand OEG problems how to divide the track cost.
The total number of routes is 7, and the average distance between stops/stations is about 560meter, the maximum distance is 800 meter. They have 312 stops, bus stops included.25 stops have newly been rebuilt and made better for disabled persons. This work willcontinue as soon as possible, i.e., as soon as they have the money for it.
MVV have five cameras shifting in the vehicles and cameras at vending machines, todocument scrawls and vandalism. They bring the pictures to the schools and with help fromthe teachers identify the youths. The youth that are caught have to help them clean thevehicles, if someone reaches more than 30 days of service, the errand will be turned over tothe local police authorities.
MVV have “bike and ride” facilities at approximately 35 tram stops, and are planning toinstall an additional 35. The government in city of Mannheim provided the funding for thesefacilities. There are no “park and ride” facilities in Mannheim because the regional structure isnot suited for it; the three cities are very close to one and another. Mannheim is very wellserved by its transit system. Only before Christmas was passengers offered “park and ride”opportunities.
The operating costs in Mannheim is about 130-140 millions DM, the deficit from the vendingmachines is about 60-70 million DM which gives a deficit rate of about 50%.The running deficits most are borne by each individual city in Germany itself. In general, andas is the case with Mannheim, such deficits are financed by profits from the electric power,natural gas, water, and from the district-heating business.Companies in Mannheim have the possibility to buy “job tickets” for their employees, whichis quite popular. The companies consider the space saving to finance the tickets.
The bus network is located to the periphery of Mannheim; that is, passengers must transfer totrams in order to reach the inner city. They operate their bus system with 54 buses, of thesebuses 45 is their own. The total number of seats is 3 705, and the total number of routes is 18.
3.2.3 Rolling stockMVV have 50 low-floor trams, which are 30 meter long, 23 trams with a low middle section(26 meter long) and approximately 15 older articulated trams, (19 meter long). The totalnumber or seats is 13 751.They have 10% extra rolling stocks, this is to be able to cover up for trams that break down orbecome damaged in accidents.The old vehicles, from late 60’s shall be removed before 2004 and replaced with trams fromAdtranz, the “Vario-tram”.The only major problem Mannheim has had with their vehicles is with the new vehicles, theone from DUWAG, they are too stiff in the boogie. So in curves with small radius, whichthere are a lot of since the network in Mannheim is old, it scrapes against the outer rail. Thishas been, and still is, a very expensive problem. Another problem with the vehicles fromDUWAG is that the wheels can’t be turned like the wheels on the other vehicles this would be

Light Rail –experiences from Germany, France and Switzerland
31
really needed when it is always scraping against the rails. So instead of turn the wheel theyhave to replace it with a new one, which are quiet expensive.
MVV have their own workshop where they can repair their vehicles. Other cities nearby alsohave their vehicles to be repaired there. This is something that has become really importantfor Mannheim because of the bankruptcy of DUWAG’s tram section. Because of thisbankruptcy DUWAG haven’t been able to fulfil the 10-year guarantee for their vehicles.MVV have to, and still do, repair their own vehicles but they send the bill to the DUWAGconcern. (Dipl.-Ing. Werner Rabe. MVV)
Figure 13. A DUWAG tram in Mannheim.
MVV have had to install oil shock absorber to minimize the vibration and noise in the vehicle.The rail is also affected of this, it is exposed for larger horizontal force, which leads to ahigher tear and wear on the construction and gives a higher cost to maintain the network.The surface on the rail is getting bumpy which leads to a higher tear and wear on the wheels.There are two more German cities that have DUWAG trams and both have reported the sameproblem. In appendix 3 is technical information about the tram.

Light Rail –experiences from Germany, France and Switzerland
32
3.3 Zurich
3.3.1 HistoryThe Roman customs post "Turicum" (= Zurich) was established in 15 B.C. and have had acity status since the 10th century. The Zurich assembly was ousted by Rudolf Brun in 1336,and replaced by a guild constitution. Zurich joined the Swiss federation in 1351. HuldrychZwingli initiated the reformation in 1519. The 19th century saw the city rise to become thefinancial and business capital of Switzerland.
The first efforts to establish a tramway network in Zurich date back to the year 1864, whenseveral railroad companies tried to start operations. In 1881 the communities of Zurich, Enge,Riesbach and Aussersihl organized a joint venture to establish a horse or steam tramwayservice. One year later the joint-stock company "Aktiengesellschaft der ZürcherStrassenbahn" was founded and three standard-gauge horse railway routes were built withLondon Meston & Cie. as general contractor. All three lines were opened to the public in1882.
The "Elektrische Strassenbahn Zurich" (ESB) company, established in 1893 started servingthe higher-lying suburbs of Zurich using meter-gauge electric streetcars as had been done inthe Vevey-Montreux-Chillon line.
The municipality of Zurich took over the tramway network of the ESB after the incorporationof several neighbouring communities in 1896 and established the first community tramnetwork in Europe, operating as the Zurich City Tram Company (StStZ). The horse-drawntramline also merged with StStZ in 1897 and was converted into a meter-gauge network in1900. (www.vbz.ch)
Many new tramway routes were built in the inner city area around the year 1900 and severalprivate companies began to serve the outlying areas. For example, the "Zentrale Zürichbahn"company opened the Bellvue-Kirche Fluntern and Platte-Oberstrass routes in 1895 and theRigiplatz-Seilbahn Rigiviertel route in 1901. The "StrassenbahnZurich-Oerlikon-Seebach" followed by inaugurating streetcar service on the routes fromCentral to Oerlikon and Seebach, from Oerlikon to Schwamendingen and from Seebach toGlattbrugg. Other companies established new routes linking the industrial areas of Höngg,Dietikon and Albisgütli.
Numerous private companies merged with StStZ after the turn of the century. Many newroutes were built in the 1920ies, which include the connections to the Zoo and to Triemli,Wollishofen and Albisrieden. Unfortunately, some routes were taken out of service in the1930ies: like the ZOS lines to Glattbrugg and Schwamen-dingen and the Schlieren-Weiningensection. (www.vbz.ch)
The StStZ was renamed to "Verkehrsbetriebe der Stadt Zurich" (VBZ) in 1950. Service onroute 1 and the route from Farbhof to Schlieren was abandoned in 1954. In the followingyears several subway projects failed to pass the plebiscite and were not realized due to thepre-eminence of the automobile. A new combination highway-tram tunnel in the Milchbuckarea was opened in 1986. Because platforms are located between tracks, the trains run on the

Light Rail –experiences from Germany, France and Switzerland
33
left-hand side, deviating from the remaining VBZ network. Hence, the tunnel entries are ofspecial interest: due to the grade-separation the Milchbuck portal is a two-level crossing andthe Schwamendingen entry is a grade-level crossing. The operator today, still isVerkehrsbetriebe Zurich, VBZ.Buses were introduced in Zurich in 1927, and have been in use ever since it’s introduction,nowadays mostly outside of Zurich and in the region.Switzerland have most person-kilometres with rail going vehicle per year and citizen in theworld, they have 1817 person-kilometres per year and citizen. (GVF, 1998).
3.3.2 City of todayThe city of Zurich is situated at the northern end of the lake of Zurich on Switzerland's centralplain, in the heart of Europe. The charming old city is clustered around the banks of theLimmat River. The city covers a total area of approx. 92 km2; its highest point is 871 m abovesea level (Üetliberg/Uto Kulm). The Zurich Lake is 27 km long, up to 4 km wide and 142 mdeep, and safe for bathing.
Zurich City center has today 360,000 inhabitants, and is Switzerland's largest city, and thereare 960,000 inhabitants in the Zurich conurbation (city plus 100 surrounding localities).In total there are 1.2 million inhabitants in the canton of Zurich.
Zurich has over 100 hotels with 10,000 beds. In 1999 more than 1 million arrivals with morethan 2 million overnight accommodations were registered. 82% were foreign guests.Categorized by country of origin, most were from Switzerland itself, with visitors fromGermany and the USA in second and third place. In addition, some 25 million day-trippersvisited Zurich. 11 km away lays the city's gateway to the world, the airport at Zurich-Kloten:it is among the largest and most efficient airports in Europe, as well as being one of the safestin the world. The train journey from the airport to the city centre lasts just ten minutes. Mostmajor European cities have good railway connections with Zurich. (Infas AG, 1997)
3.3.3 System todayThe system have 280.9 millions of passenger every year, 187.9 of these travels with trams,78.5 millions travels with buses, 1.9 millions travels with the neighbourhood buses and 12.6millions travels with the regional buses.
Figure 14. Grass-covered exclusive “right-of-way”.
70 km is double track. Total length of the tram system is 109.3 kilometres.

Light Rail –experiences from Germany, France and Switzerland
34
30% of the track is separated with exclusive right-of-way with physical barriers to preventcars and other traffic modes to cross the tracks; most of it is located outside of Zurich. 50% isseparated but vehicles such as cars are able to cross the tracks when turning left.
The tram system in Zurich is very old, and therefore some of the radius in curves is verysmall, the smallest radius in the system is 14.50 meter. When they plan new routes theminimum radius is 18.00 meter. This affects the speed within the system. At some points,small radius and old switches, the tram can only travel with a speed of 12 km/h. This speed isadjusted to the case when the switch doesn’t work like it should, then the tram driver shall beable to stop before the switch. This is very important because if the tram doesn’t stop before abroken switch there is a big risk that an accident will happen.
Figure 15. Small radius in Zurich.
The newest route in Zurich was build in 1986, it is the line to Schwamendingen andInkraftreten. VBZ introduced a new route concept with exclusive right-of-way with physicalbarriers and some stops underground, like a metro.
Trams have 18.228 millions vehicle-kilometres with trams every year, which is 57% of allpublic/transit vehicle-kilometres in Zurich, the autobus stands for 5.197 millions vehicle-kilometres and the trolleys stands for 5.178 millions vehicle-kilometres. The total amount ofvehicle-kilometres is 32.252 millions. http://www.vbz.ch
There are 13 tram routes, 7 trolley routes, 16 autobus routes, 7 neighbourhood-bus routes, and22 regional bus routes. The autobus routes is 81.2 millions km and the trolleys routes are 57.8millions km. http://www.vbz.ch
VBZ have a deficit of 35-40% and a renewal of 487 505 million Fr. the losses is covered bythe city’s water and heat businesses. This is a very common way to cover losses in Europe,but forbidden in Sweden, according to “kommunallagen”. (Mr. Berger)
3.3.4 Rolling stockVBZ have 230 powered tram vehicles and 125 wagons, this gives a total number of tram seatsto 53 002. They also have 83 trolley buses with 12 895 seats and 148 regular buses with 17182 seats. http://www.vbz.ch
VBZ possesses three different kinds of trams, including vehicles from several generations.Almost all vehicles are painted standard white and blue, with advertising trams being theexception. Because of the route alignment and passenger loads, various vehicle types are in

Light Rail –experiences from Germany, France and Switzerland
35
service on the different routes. The "Tram 2000" type is the largest series and so is generallyseen followed by the series 1601 - 1690.
VBZ have ordered new Cobra vehicles five years ago, but Adtranz have not delivered themyet. Adtranz seems to have some technical problems to solve and there is some speculation ofthat Adtranz want to deliver their own models instead. Cobra is originally designed of amanufactory from Switzerland that Adtranz bought.VBZ and Adtranz is working with an idea to construct a soft front for the vehicles and at sametime make it impossible for pedestrians whom is hit by a tram to get under it. (Mr. Berger) Inappendix 5 is technical information about the tram.
Figure 16. A tram in Zurich.

Light Rail –experiences from Germany, France and Switzerland
36
3.4 Strasbourg
Strasbourg is a city in eastern France, and the capital of Bas-Rhin Department in Alsace. It islocated near the Rhine River and Germany. Strasbourg is a commercial, manufacturing,transportation and cultural centre in Alsace.
3.4.1 HistoryThe Ill River divides Strasbourg and Ills arms and canals surround the oval-shaped centraldistrict, which is the old section of the city. The famous Cathedral of Notre Dame ofStrasbourg is situated in the southeastern part of the old quarter. Construction of the cathedralwas begun about 1015, but only the crypt and part of the choir remain from this period. TheRomanesque choir dates from the 11th and 12th centuries; the Gothic nave was reconstructedin 1275, and the western facade, begun in 1270, has a tall spire that was completed in 1439.Other features of the cathedral include stained-glass windows, an astronomic clock, andnumerous sculptures. Among additional points of interest in the city are the Gothic church ofSaint Thomas (13th-14th century); the Palais de Rohan (1731-1741), now housing themunicipal art museum; and the Hôtel du Commerce, the best example of Renaissancearchitecture in Strasbourg.
The city is the seat of the Universities of Strasbourg (1538, reorganized 1970) and the Councilof Europe. Strasbourg is a meeting place of the European Parliament, an organ of theEuropean Union.
By the time of the Reformation, in the 16th century, Strasbourg was a prosperous community,and its inhabitants accepted Protestantism at an early date (1523). In 1681Louis XIV ofFrance took possession of the city, and the Peace of Ryswick recognized the right of France toStrasbourg in 1697. The city passed to Germany in 1871 as a result of the Franco-PrussianWar but was returned to France in 1919, following World War I. It was occupied by theGermans and badly damaged in World War II (1939-1945). Population (1999) was 264,115(www.strasbourg.fr)
3.4.2 The tram system in StrasbourgThe first line of the tram system was opened for traffic in 1994, and it run 10 kilometres toconnect the Hautepierre district (to the west of Strasbourg) and the town of Illkirch-Graffenstaden (to the south), via the station and the city centre. Twenty-six trams serveeighteen stops, one of which is an underground stop. The trams run 24 hours per day with onetram every 2.5 minutes at peak hours and one every 10 minutes at night. The reason for thehigh number of trams at night is that the inhabitants in Strasbourg feel safe with opportunityto always have a tram around. (Muller. G 1994)
Strasbourg had early plans for a subway in the city, but they were put on ice because of thehigh costs. In the end of the 1980ies the discussion was brought up again because motortraffic were a problem and there was a need to be reduced this kind of traffic in the city. Adecision was taken in 1989 that the city would build a new tramway.

Light Rail –experiences from Germany, France and Switzerland
37
Figure 21. The Eurotram
The trams in Strasbourg are calledEurotram are modern, fast and non-polluting, not more than what theelectricity produces. They are distinctiveboth due to their technical efficiency andtheir original architecture. As the firsttrams in France with low floors, theyprovide freedom of access, which is much,appreciated by disabled and elderly people.Their enormous windows make themalmost transparent. From inside the cars,passengers have a mobile panoramic viewof the town.
The appeal, comfort and the modern design of the trams are certainly some of the reasons forthe great success Strasbourg have had with their tram system. The tram system transports60,000 people every day, which is far more than the original forecast.
The complete design of the whole tram system was of highest significant for the city council.To make the light rail a part of the city there was big constructions around the tracks, whichhas made the centre of Strasbourg more beautiful. In fact as much money that was spend ontracks and trams were spent on the appearance of the system; stops, trees around the track(1600 new trees were planted), grass in the track and electrical wiring. The total cost wasabout 2 billion French francs (Muller, G. (1994)).
3.4.3 About the tramsStrasbourg has a completely new tram called the Eurotram built by several companies whereAdtranz was the biggest and most known. Several demands were placed on the trams by thecity of Strasbourg. The city felt that the appearance of the tram was very important to how theinhabitants in the city would welcome the new way of transport. So unlike other trams theEurotram is 100 % low-floor for the passengers, this makes the entrance and exit very easy.The doors are not like on other trams, instead of two doors on each exit, the Eurotram has onebig sliding door.
Figure 22. Sliding door on Eurotram.
The advantage with this is that one canhave a big window on this door, which notis possible, if there are two doors. Thefeeling of space in the tram is another newthing that the constructors have thought of.Even though the tram is only 2.40 m wideit feels spacey due to the big window thatare along the whole tram except theboogie.Improvements to reduce the noise levelwere also made with new engines and inparticular with new suspension.In short this tram put up new guidelines forwhat a tram could look like. In appendix 7is technical information about the tram.

Light Rail –experiences from Germany, France and Switzerland
38
3.4.4 Relay car parksIts success is also due to an innovative system - at least in France - called relay car parks,whereby people can have quick access to the city centre by combining the use of their privatecar and public transport. Relay car parks are common in USA and in Japan they have relaybike parks at some metro stops.For a flat, all-in charge of 12 F (1,83 Euro), you can park your car in any one of the threerelay car parks and obtain return tram tickets for all the people in the car, regardless of howlong your car is parked. The benefit is less car traffic in central areas in the city (Conseil deCommunaute Urbaine de Strasbourg (1999)).
3.4.5 The tramway will be extendedAs planned at the outset, the tramway will be extended southwards up to the Illkirch-Graffenstaden University campus. A second line is already built and the first part of the B linewill be opened for traffic the 1 of September 2000.
The B-line will run to the north, and serve the National Theatre of Strasbourg, the universitylibrary, the conference hall and the fair ground, banks and European institutions, and thencontinue towards the towns of Schiltigheim, Bischheim and Hoenheim. At the same time, theline will go eastwards to the Esplanade district and the Strasbourg University campus.
Eventually, by 2010, a cross-shaped system will provide access by tram to all the districts ofStrasbourg and its close suburbs.
Since 1992, the overall offer of public transport has increased by 30%. Finally, the launch ofthe tram system was also an opportunity to rethink the bus network so as to provide optimumclient service and ensure that buses and trams complement each other to the full. Since 1992,the overall offer of public transport has increased by 30%, which is a performance unequalledby any other French town. With a fast transport available at all hours the tram have becomepopular in the city among the inhabitants, 97 % of them say that they are happy with the tram.(George Muller)
3.4.6 Galerie à l'En-Verre & the Homme de FerTo further decorate the city special effort was put in the central tram stations. The tram stationlocated 17 meters under the Station Square communicates with a shopping gallery, called theGallery à l'En-Verre, via stairways, escalators and lifts. This 3,700 m2-shopping gallery isparallel to the station building, and is embedded into the ground. It is covered by a glass top,which brings in natural light. A fine geometrical construction of glass panels increases thelight and makes the gallery transparent, as it is intended to be. In this way, the station buildingcan be seen from the underground gallery.

Light Rail –experiences from Germany, France and Switzerland
39
Figure 23. Tram stop Homme de Fer
Last, at the Homme de Fer tram station, a shelter designed by Architect Guy Clapot gives thesquare its scale. At a height of 8.5 meters above the square, the Rotunda looks like a glasscrown with a 35-meter diameter, supported by a circular framework, which is it supported byeight twin posts. The entire structure is made of metal, and painted in anthracite grey.

Light Rail –experiences from Germany, France and Switzerland
40
3.5 Karlsruhe
The city of Karlsruhe is located in the south west of Germany close to the river Rhine and theFrench border. It is located at the northern most tip of the famous Black Forest.
3.5.1 HistoryKarl Wilhelm is well known as the founder of the city of Karlsruhe. He was born on the 18th
January 1679 in Durlach (his first residence), and died in Karlsruhe in 1738. He belonged tothe protestant line of the House of Baden, which he wanted to reunite for the sake of politicalstability.
In 1803 universal compulsory education was introduced in Baden. This ‘Reading revolution'created the basis for the politicisation of the lower classes. In 1848 the French FebruaryRevolution lit the spark in Germany. The German uprising began in Baden, and ended here in1849 with the bloody suppression by Prussian troops of the first, short- lived republic onGerman soil. In the liberal Era Baden became the ‘Model State' with respect to many issues,with the universally popular and admired Prince Friedrich I (1826-1907) at the helm.
In spite of the educational development of the population, in the 19th century Karlsruhe wasstill a town in which the court, the civil service and the garrison determined the way of life.Karlsruhe became the cultural centre of the Grand Duchy: Johann Peter Hebel and Viktor vonScheffel achieved literary recognition for Karlsruhe in the beginning and middle of thecentury.
The first polytechnic in Germany was founded in Karlsruhe in 1825, following the Frenchmodel. Karlsruhe's first main station was opened in 1843. The industrialization of the town,which was to have a big effect on its development, began on the ‘Tracks of progress'. Thedevelopment of industry quickly reduced the importance of the residence for the town. Thecultural sphere continued to be influenced by the palace, however, e.g. the founding of theApplied Arts School and the Majolika Factory.
Figure 24. The palace in Karlsruhe.

Light Rail –experiences from Germany, France and Switzerland
41
After 1918 and the abdication of the last Grand Duke, the state maintained the culturalinstitutions of the days of the Grand Duchy. The Baden State Museum was set up in thepalace. During this time the state of Baden became a republic and Karlsruhe lost its status asthe royal residence.
After a war begun by the National Socialists and after more than fifty air raids, 35 % of thecity was destroyed.Since then the townscape has changed: the civil service city, the former capital of Baden,became an industrial and economic centre with 276.000 inhabitants (1997). Karlsruhe becamethe "Residence of justice" with the opening of the Federal High Court in 1950 and the FederalConstitutional Court in 1951. Petrochemical and electronic industries have settled here, andthe Hi-Tech area is meanwhile becoming ever more important. The ‘Technology Region' ofKarlsruhe and the Technology Park of Karlsruhe was founded in1987, and the Centre for Artand Media was opened in 1997.
The city of Karlsruhe has today about 270.000 inhabitants and 42.000 working places, and theregion have about 950.000 inhabitants.
The system started as a horse-drawn carriage system in the 1890ies and became electrifiedaround 1900. They celebrated 100 years anniversary in the year 2000.
3.5.2 Todays light rail systemThere are several system interchanges:
• At Durlach Bahnhof (station) in the east (routes to the east and north),• At the Albtalbahnhof (near the main railway station) for the routes to the south,• At Knielingen in the west.
From Knielingen, the trams travel on the railway route over the Rhine Bridge to Worth. Herethey leave the railway again and ride on a street in the village for about 1 km. Due to thedistance between tracks and buildings 15 kV a.c. were used in the street instead of the normal750 V d.c. Furthermore there is a single-track system interchange in Ettlingen West (theOldest), which at the moment is not in use for passenger traffic.
The Light Rail in Karlsruhe is classified as a type 7 Light Rail. This class consists of LightRail whom is integrated with regional train, using regional train tracks to extend the serviceinto the region. In Karlsruhe´s case it is based upon a dual-current tram system and was thefirst dual-current tram system in the world when it was introduced in 1992. A dual-systemmeans that there is two different type of voltage. The vehicles are equipped with on boardtransformers and rectifiers that convert 15 000 V a.c. that are used by heavy rail to 750 V d.c.which do trams use. This gives the opportunity for trams to travel on “heavy rail” as long asthey have standard gauge, which is 1435, (the same as in Sweden).

Light Rail –experiences from Germany, France and Switzerland
42
Figure 25. Different types of LRV’s in Karlsruhe.
The growth of the Karlsruhe public transportation system and the number of passengers areimpressive.
Figure 26. Information about Karlsruhe trams system.Year Track length (km) No of stops Motorcars1975 82,7 100 981980 86,5 109 961985 88 112 1281990 112,3 144 1401995 140,5 (plus 110,2
DB)200 175
1998 179 (plus 88 DB) 201 1851999 195,9 (plus 88 DB) 202 185
The total number of passengers (yearly) grew from 55 million in 1985 to 80 million in 1995and over 100 million in 1998. Just imagine the extra number of cars on the road without thegrowth in public transport!
During peak hour in Karlsruhe, 144 trams on six different routes pass through the mainshopping street, which is 22 m wide. The traffic has reached the point were the pedestrian’sfeel that the traffic is a wall in the street, a barrier. A tunnel for pedestrians is being planed;the exact position is not yet decided. The population in a toll a couple years ago, in addition toon-ground within the street, rejected an underground section with exclusive right-of-wayunder the main shopping street.
In Karlsruhe the LRT operates on very different type of tracks. It has shared right-of-way withcar traffic in outer areas (where car traffic is limited to residents) service and delivery. Sharedright-of-way with pedestrians in two pedestrian zones. Reserved right-of-way on transit lanesseparated by markings or special surface, pavement or grass, and mixed operation withrailway on railway tracks. The exact percentage for the different types of right-of-way is notexactly known, but approximately the reserved right-of-way with some physical barrier is50%, and when rebuilding they try to build this type of right-of-way.
KVV have been very successful when planning and starting new routes. During 93-94 theyopened 3 new direct routes, from outer areas to Karlsruhe centre.The route S4, from Bretten-Karlsruhe had in 1993 2000 passenger; this route went fromBretten-Karlsruhe main station. One year after the introduction (1995), when it started to run

Light Rail –experiences from Germany, France and Switzerland
43
to the city center it had 7400 passengers, and has further grown since.The route S31 Bruchsal-Menzingen, grew from 2000 to 4500 passengers daily, and the routeS5 Worth-Karlsruhe, the number of passengers has doubled from 1993 to 1998.
Three factors facilitated this growth: higher frequencies, a single tariff and (most) the directrides into the city centre. 20% of the passengers switched from car to public transport. It isworth to notice here that the main station in Karlsruhe is located about 3-4 km from the innercity centre were the most people work, get education, shopping and visiting culture events,and it was to this point the trains arrived earlier.
The trams/LRVs run at a speed op 25 km/h in the pedestrian areas, 50 km/h to 70 km/h onfree tracks in the urban area and 90 km/h or 100 km/h on the railway tracks.
3.5.3 Rolling stockThe rolling stock in Karlsruhe have a variation from old tramcar from the 1940-1950’s tomodern LRV from 1997, the new vehicles have dual-voltage system on board and it is thesevehicles that runs like the “Karlsruhe model”. The oldest vehicles run within the city centre astraditional trams.
The vehicle from 1997 was bought from Duwag/ABB, and is not totally “low-floor” vehicles,there is a middle section that is low-floor and the rest have normal height, semi low-floor. Themajor concerns why they are made as they are are because the dual-voltage system uesa lot ofspace.
In 1999 and 2000 20 low-floor urban tramway cars (niederflurwagen GT 8-70 D/N) and 20two-system semi low-floor tramway cars (mittelflurwagen GT 8-100 D/2SY-M) were addedto the Karlsruhe tramway fleet. The first five-section low-floor trams are in operation onetramline 1. The new LRV’s will replace a number of old Duwag articulated tramcars, but arealso destined for the new routes and to accommodate the growing number of passengers.
Figure 27. A mittelflurwagen GT 8-100 D/2SY-M in Karlsruhe
To buy new LRV is not cheap, a single vehicle costs about 3,8 to 4,5 million German marks,depending on the size and number of axle. Karlsruhe has bought both 6- and 8-axle vehicles.

Light Rail –experiences from Germany, France and Switzerland
44
The costs of new urban low-floor vehicles are dropping due to standardization. Recent orders,for example of Combino and the new DWA-vehicle for Kassel shows costs per vehicle ofabout 3 million German marks. In appendix 9 is technical information about the tram.
Karlsruhe has their own workshop where they repair and maintain their own vehicles, as wellas others, such as DB (Deutsche Bahn) vehicles and Saarbruckens vehicles.

Light Rail –experiences from Germany, France and Switzerland
45
4. Environmental issues.
Trams are in many cities a so natural part of the city that the inhabitants take them for grantedjust like the police force or a hospital. The tram have even in some cities become the city’spride and symbol, examples are cities like Strasbourg or Karlsruhe. Cities that now arebecome famous for their light rails systems. During the last 10 years the interest for tramshave increased and many cities plan to modernize and expanded their systems there are alsomany cities are building new LR systems. The reasons for cities to choose trams as its newtransportation mode are many. Better capacity than buses are one but the most common arethe environmental advantages. We will give it a try to examine what environmental impactstram has in relation to other transportation modes (e.g. buses).The environmental effects that will be brought up are:• Environment esthetical including natural and cultural effects• Barrier effects• Energy consumption• Air pollution• Congestion• Land area impact, consumption of land in the city.• Noise and vibrations
These chapters will cover the most environmental effects that light rails have in a city.
4.1 Environment esthetical
Environmental impacts are pollution’s, noise and energy consumption’s but also the estheticalappearance of the tram system. People live in the city and it’s important for them to have abeautiful city. Traffic with its roads and signs are often a problem when it comes to makingthe city more beautiful. Tram systems also have certain components that can be consideredugly. But the possibility to make the city better looking is possible easier for a LR track than aroad.
What is it then that makes a town beautiful and what makes a town ugly?The opinion if a city is beautiful or not changes with whom the judge is. Some thinks thatsome buildings are pretty while other hates them. A few things do how ever most people havein common they don’t like desert like landscape in the city, big walls of concrete and asphalt.It is of course a matter of opinion and taste but not entirely otherwise it would be hard to plana city that people like.
With light rail in a city there are some parts that specifically one can look at:The tracksA tram track or a road is not beautiful but for the tram advantage, it takes up less space. Anormal road is ca 3.5 m wide and a track is about 2.65 this makes that it at least is less oftracks than roads.
Electrical wires is something that can bevery ugly but are necessary for trams. It is

Light Rail –experiences from Germany, France and Switzerland
46
therefore important to adjust them as muchas possible to the surrounding environmentand to not have more wires than needed. InZurich, which has had, it’s tram system fora long time one can see the lack ofplanning for the electrical wires. One goodexample how to place electrical wires isStrasbourg. (Mr Bessier).
Figure 28. Lots of wires in Zurich
4.1.1 Traffic in sensitive areasEven in the city there is a need to have places with no traffic, places with some peace andquiet. It can be park or pedestrian areas. In many cities pedestrian areas didn’t exist 40 yearsago, everywhere there was a road there were auto traffic. Trams have proven to work insensitive areas like pedestrian areas without being an obstacle (Hall, P and Hass-Klau, C.).In Mannheim trams are running on the major pedestrian street but with a low speed of 20km/h which is both safe and give little disturbance to pedestrians. The big advantage with thisis that one can literately take the tram to the entrance of ones favourite store.
4.1.2 StopsTram stops are maybe the part of the tram system where design matters the most. It onlydepends the amount of money that one is willing to spend for how it will look. Strasbourg hasthe maybe most know and photographed tram stops. Which both give information, protectionagainst rain and are a piece of architecture. There is a picture of the stop under the Strasbourgsection.
Figure 29. Tram stop in Saarbrucken Figure 30. Information post Strasbourg

Light Rail –experiences from Germany, France and Switzerland
47
The ticket machine in Strasbourg is designed to also include information about the tram routeand when the next tram will arrive on a digital screen.
4.2 Barrier effects
A barrier in the city can be many things; a house, a road, or a railway track. To evaluate thebarrier effect of a new tram route in a city is not easy especially not if there were othertransportation mode there before, (like a road or a bikeway).Like a road a tram track will prevent people to move over the place at the exact moment thewant to. Since a tram will pass there now and then. To try to show the difference in impact fora pedestrian on a road and a light rail track I will do a short mathematical example.
Let’s say that we have 4000 persons who want to travel from point A to point B, in one hour.Lets also assume that there are 1,5 persons in each car and that each tram can carry 150persons. At one point between A and B you would like to cross but is that possible if 4000people are passing by cars or trams?Nr of cars passing the distance 4000/1,5 = 2670Nr of trams passing that distance 4000/150 = 27
With traffic flows as high as 2670 cars/hour one need a two-lane road to prevent congestion.Now if how easy is it to pass the tram track compared with the road under the assumption thatwe don’t have any red lights on the distance and that both cars are coming with an evenperiod.These figures are assumptionsRoad (one-way 2 files)Width 7 mTraffic flow 2 670 cars/hour (1 335 cars /file*h)Length of one car 4.5 mSpeed 20 km/h
Time for one car to pass your cross place 3.6*4.5/20 = 0,81Total time with cars in front of your cross place 1335* 0,81 = 2469 s = 18 min
Tram (one-way)Width 3 mTraffic flow 27 trams/hourLength of one tram 40 mSpeed 15 km/h
Time for one car to pass your cross point 3.6*40/15 = 9,6Total time with cars in front of you over one hour, 27* 9,6 = 288 s = 4,3 min
The time with cars in front of pass point 18 min of one hour or 30 % of all the time.Time with trams in front of the pass point is 4.8 min of one hour or 7 % of all the time
As one easily can se it is far a very short time that there is a tram in your way and that afterthe tram have left one can safely pass. This is not the case with cars since they pass moreoften. To see how much time one really need to pass this road another calculation is made.That tells the time between each vehicle.Tram (60-4,3)/27 = ca 2 min

Light Rail –experiences from Germany, France and Switzerland
48
Car (60-18)/1335 = ca 2 sec
Two seconds is in distance: 20/3.6 * 2 = 11 m
The conclusion of this small calculation is:It is almost impossible to cross the road and still be alive. For the tram however it is very easyto pass. Therefore the barrier effect of a road is much greater than a tramway when the carrythe same amount of people wants to transport from point A to point B.
Figure 31. People crossing tracks in Mannheim
One thing that is included in the calculation is the possibility the cars in the two differentlanes not are driving next to each other. This means that there could be even less time to passif the cars in one lane is slightly ahead of the other lane. Also the distance to cross is muchgreater for the road 7 m compared with tram track 3 m. The road not only is harder to crossfor pedestrians and bikers but it takes more space, which in a city is a very valuable andlimited resource.
Our own experiences in different cities are that a tram is not a barrier as long as it is only tramtracks and not combined with a road. People can easily see when the tram comes and thedistance to cross is much smaller.
4.3 Energy consumption
A calculation of how much energy it takes for one person to travel with a light rail wagoncompared with bus or car.
Data from statistics in Mannheim (MVV)A tram energy consumption approx. 4 kWh / kmThe average numbers of people on one tram ride:Person kilometre / wagon kilometre = 221.2 / 5.698 = 39 personsEnergy consumption per person and kilometre travelling with tram: 4/39 = 0.1 kWh/ person * km
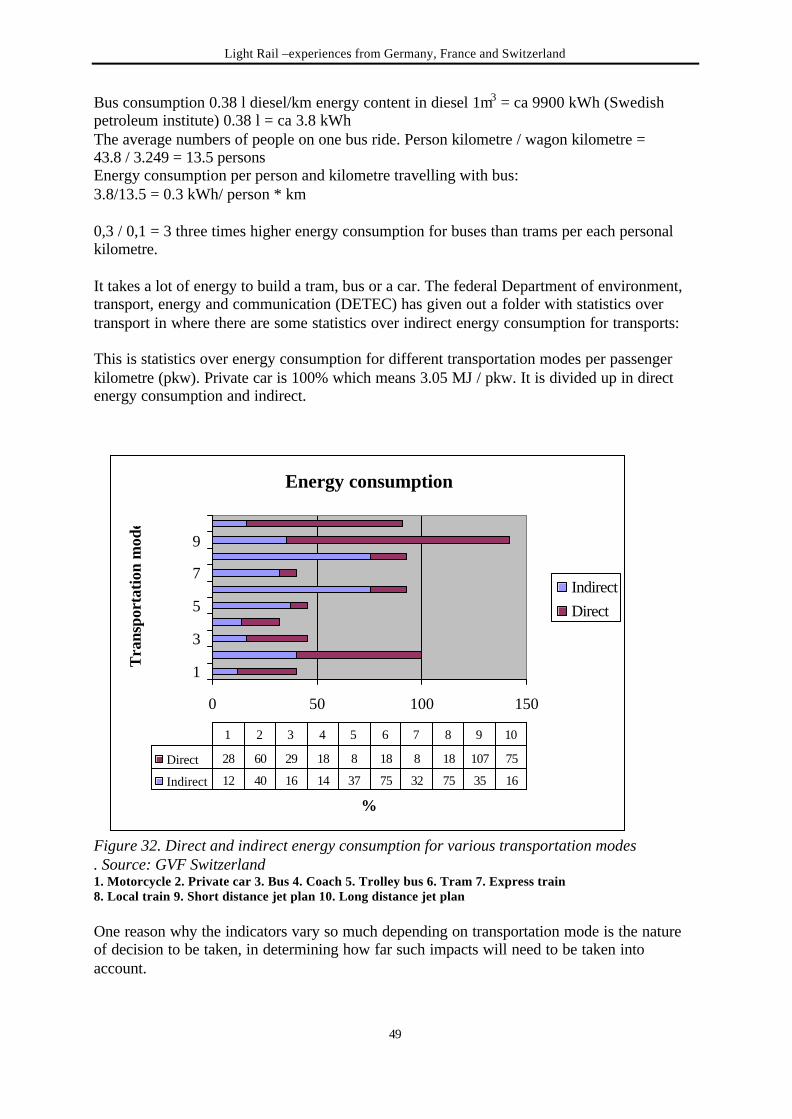
Light Rail –experiences from Germany, France and Switzerland
49
Bus consumption 0.38 l diesel/km energy content in diesel 1m3 = ca 9900 kWh (Swedishpetroleum institute) 0.38 l = ca 3.8 kWhThe average numbers of people on one bus ride. Person kilometre / wagon kilometre =43.8 / 3.249 = 13.5 personsEnergy consumption per person and kilometre travelling with bus:3.8/13.5 = 0.3 kWh/ person * km
0,3 / 0,1 = 3 three times higher energy consumption for buses than trams per each personalkilometre.
It takes a lot of energy to build a tram, bus or a car. The federal Department of environment,transport, energy and communication (DETEC) has given out a folder with statistics overtransport in where there are some statistics over indirect energy consumption for transports:
This is statistics over energy consumption for different transportation modes per passengerkilometre (pkw). Private car is 100% which means 3.05 MJ / pkw. It is divided up in directenergy consumption and indirect.
Figure 32. Direct and indirect energy consumption for various transportation modes. Source: GVF Switzerland1. Motorcycle 2. Private car 3. Bus 4. Coach 5. Trolley bus 6. Tram 7. Express train8. Local train 9. Short distance jet plan 10. Long distance jet plan
One reason why the indicators vary so much depending on transportation mode is the natureof decision to be taken, in determining how far such impacts will need to be taken intoaccount.
Energy consumption
0 50 100 150
1
3
5
7
9
Tra
nspo
rtat
ion
mod
e
%
IndirectDirect
Direct 28 60 29 18 8 18 8 18 107 75
Indirect 12 40 16 14 37 75 32 75 35 16
1 2 3 4 5 6 7 8 9 10

Light Rail –experiences from Germany, France and Switzerland
50
The environmental indicators are supposed to tell us about the different effects on theenvironment from different transportation modes. Higher indicator means bigger impact onthe environment.
The reason behind the high-energy consumption for trams is not easy to explain. As shown ofthe diagram most of the energy consumed by a tram is consumed during the construction ofthe tracks and tram (indirect energy consumption).
The construction of a tram track takes long time and therefore consumes lots of energy. Buton another hand the track for a tram last a long time, much longer than a road. Maintenancefor tram track is also not higher compared with a road.
Since tracks are in the city the construction is more complicated than train tracks and mighttherefore use more energy. One can see that construction for tram and regional train tracksconsume twice the amount of energy of what it does for an express train track. Theexplanation is for this is:• Easier constructions for express train, no need to make it possible for cars to run on the
same lanes. For trams there is a need for a concrete foundation and concrete filled upbetween the tracks all that demands lots of work and energy, all that not necessary forexpress train.
• More people travel on the express train tracks per day than on trams tracks, which doesnot seems likely since there often come one tram every five minute in Zurich.
• Low load factor for trams can be have something to do with the direct energyconsumption but not with the indirect, which is almost four times as big as the directenergy consumption.
But it still does not give a good answer why the construction of light rail uses so much energy.
4.4 Air pollution’s
Even when a tram has such a surprisingly high-energy consumption, it still has low pollutions.In appendix 13 you can see tables over how much pollution’s different transportation modesproduce. The amount in pollution from direct energy consumption are in these table zerowhich is because trams exclusively run on electricity and Switzerland have a very low part ofits production that come from fossil fuels (oil, coal). For other countries the pollution directenergy consumption would be something different since they produce electricity differently.France has for example about 95 % of its electricity production from nuclear plants. It wouldbe interesting to see how much nuclear waste the electricity consumption for light railvehicles would cause in France.The pollutions from indirect energy consumption are in all cases low both for CO2, NOx andNHMC in compassion with the total pollution for car traffic. Both construction and operationof trams are environmental friendly.
To build new rail tracks in a city is a complicated and expensive project that takes a long time.Even if one don’t include the costs that a closed road means to a community is just the actualconstructions costs huge (The European Conference of Ministers of Transport. (1994)).

Light Rail –experiences from Germany, France and Switzerland
51
4.5 Greenhouse effect
One of the major pollutions behind the green house effect is CO2, which is produced in excesswhen oil fossil fuels (oil, coal etc) are consumed. Which happens when you drive your car.According to the environmental indicators trams only produce CO2 during its constructionphase according to the tables. This it not completely true since oil or coal is used in mostcountries to produce electricity (Appendix 1 shows pollution values for different transportmodes). In Switzerland where these environmental indicators were made, fossil stands for ca2% of electrical production. This is a very low figure, in Europe in average fossil fuels standsfor 40-45 % and in Sweden it is 2.5 % (http://lwww.vattenfall.se).
4.6 Traffic congestion
Traffic congestion is one of the biggest problems in a city. A city relays on it transportationsystem to get people to work, with congestion this becomes hard.Traffic congestion is the effect of too many vehicles on a limited road area. For a long timecity planers solved the problem with congested roads by building more roads and parkingspaces. That resulted in even more motor vehicles on the roads, which soon again werecongested. This experience has among others Zurich made. The solution for the problem thatZurich picked was to increase public transportation and making it more effective, so that itbecame easier and faster to use trams, trolley buses or buses than your own car.With effective traffic planning like the one in Zurich one can organize the publictransportation without congestion that leads to less pollution’s. Congested traffic produce 250% more pollution compared with traffic that runs without stops. Which has a huge effect onthe city environment. Threes, stone buildings and pedestrians are the ones that in first handare affected by the extra pollution caused by congestion (Dipl-Ing. Hondius, Harry).
4.6.1 Second hand effectsSecond hand effect due to light rail can be increased or decreased traffic on surroundingroads. Not only on the road where a new tramline is located but also on roads parallel towhere the tram is. The biggest second hand effect is when public transportation increases andindividual traffic decreases. There are several cases when these have happened after a newlight rail line was introduced. In Strasbourg there have been a huge increase in passengerssince the opening of the first line in 1994. Also in Karlsruhe have the number of passengersincreased with the regional tram system. Decreased individual traffic leads to less congestionand less pollutions.When a tramline is introduced in a city, traffic flows will changes depending how the lineshave been planed. In Saarbrucken they closed some roads for car traffic to make room for thetram, other roads were narrow from 4 lanes to two lanes. This reduced the traffic in the downtown area but increased traffic on other roads, total there were a decrease in traffic with 2% inthe city of Saarbrucken.
Accessibility for persons with handicaps (wheelchairs) is very well developed for tram stopsin the German cities. In Saarbrucken there were special ramps for wheelchairs in ordermaking the entrance as easy as possible. There are also special bricks on the platform thathave a pattern, this works as guidance for people who are blind. These bricks were at all trainstops we saw and tram stops in Saarbrucken, Strasbourg and Mannheim.

Light Rail –experiences from Germany, France and Switzerland
52
According to a questionnaire in Strasbourg inhabitants in the city felt more secure because ofthe tram. Since they knew that a tram passed often so that there always was an easy way to gethome. This is one major reason why there is tram every teen minute at night(Umweltverträglichkeitstudie, (UVS)).
4.7 Land area impact, consumption of land in the city.
Land is one of the most valuable resources in a city. There are many different interests thatare interested in using the land available. A good proof for this is to see how high the landprices are in big cities. It is therefore important to find a public transportation that uses aslittle land as possible. In big cities where the demand for public transport is big the obvioussolution is to go underground and build a metro. This is not economical possible for smallercities, and then light rail is a good alternative.
Figure 33. Source: GVF Switzerland1. Car 2. Bus 3. Coach 4. Trolley bus 5. Tram 6. Local train 7. Regional Train 8. Short distance jetplan 9. Long distance jet plan Car = 100% = 0.0069 m2*a / pkm
The table shows that trams use the least area of all ground-based transportations, only 1/5 ofthe space that car traffic uses.
4.8 Noise
Noise is one of the modern society’s problems and one major source to noise pollution’s aretraffic. It is easy to feel the difference in noise level if one stand next to a pedestrian area andto a road. Noise is a part of a city but it is important to try to keep it at as low level aspossible.
There are few vehicles that don’t produce noise bicycle are one. There are even fewer when itcomes to vehicles with engines. From that viewpoint it is natural that a modern tram producenoise. There is friction between wheel and rail, brake noise, engine noise; noise producedwhen the tram turns, bad rail transitions, and corrosion on the rail. These are just somereasons why a modern light rail vehicle makes noises. In an environment without any noise
Land area impact
100777783
23110
24532
11
0 50 100 150 200 250 300
1
4
7
%

Light Rail –experiences from Germany, France and Switzerland
53
pollution any new pollutions would be a big impact. In most cases tramlines are in the roadand replaces bus and/or car traffic. Places where noise already before was a problem.
Figure 34. Sharp curve for tram, which causes noise
What does happens when a tram rout replaces a heavily trafficked road when it comes tonoise pollution?Even if there still will be some car traffic in the area, there will be a significant lower amountof traffic. The light rail line will take up space from the former road so that the space for cartraffic decreases. If a four-lane road would be transformed into a 1-2-lane road plus a tramlinenoise levels would change. It is1-2 lanes depends upon if there is a stop for the tram or not inthat section.Less road area leads to less traffic and less noise. One can argue that the tram will replace thenoise produced by the lost traffic. Which is not true!Before the construction of the new light rail system in Saarbrucken they investigated how thenoise levels would change when a tramline was introduced in the road.
This noise study was part of an environmental impact study made before the construction ofthe new light rail system in Saarbrucken.
4.8.1 The Saarbahn Noise investigationSource: Umweltverträglichkeitstudie, (UVS) 1995. The investigation looked at noise pollutions for three cases1 Analyse: Today’s road and rail traffic2 Prognoses: With new tram traffic3 Prognoses: With new tram traffic and road traffic.
From the German law regulations in the case of a new building or a substantial modificationof railways, the noise limits are. (A modification is substantial after 1, because those in thefollowing limit values exceeded are;1. A railway around one or more continuous tracks is built or2. By a substantial structural intervention of the traffic route outgoing traffic noise rises withat least 3 dB (A).

Light Rail –experiences from Germany, France and Switzerland
54
Further a modification is substantial after 1, if the evaluation level of at least 70 dB (A) at dayor 60 dB (A) by night with a substantial structural or with a substantial structural change hasbeen done.
Table 1. Emission limits. (UVS) 1995Emission limits in dB (A)Place for noise pollution
Day time 6-22 Nights 22-6Hospital, school, rehabilitation home and daycare centres.
57 47
Living areas 59 49Villages-, and mixed areas 64 54Business areas 69 59
4.8.2 Analyse: Today’s road and rail trafficThe traffic analyses came from Joachim Schwarz’s investigation bureau.The heavy traffic proportions come of to the traffic volume of the Saarland from the year1990. The proportions to overall traffic in the time interval come of at night the RLS-90 (2).The following traffic volumes were taken as a basis for the calculation.
Table 2. Emission analyses. (UVS) 1995Average trafficV/24 h
Road
Analyse Prognoses
Heavy vehicles(%) Day/night
aN(%)
VzulKm/h
BAB A1To AS to Heydt
28 000 22 400 6,0/6,0 11,2 120
BAB A1To AS to Heydt
27 600, 22 080 6,0/6,0 11,2 120
4.8.3 Noise calculationThe noise calculation that are made involves both motor and tram traffic. Emission levels forthe tram noise are calculated for a distance of 25 m from the driving touching axle. Accordingto the RLS-90 (2) the following influence are to be considered:1. Average of one day’s traffic.2. Heavy traffic proportions over 2,8 t. total weight.3. Allocation of the traffic volumes on the time intervals: day 6-22 and at night 22-6 o'clock.4. Admissible rates of the passenger cars and trucks.5. Carriageway surfacing noise.6. Addition with pitch attitudes > 5 %.

Light Rail –experiences from Germany, France and Switzerland
55
The following emission levels were taken as a base.
Table 3. Calculated emission levels. (UVS) 1995AnalysedB (A)
Prognoses with tramdB (A)
Road
Day Night Day Night
BAB A1To AS to Heydt
73,5 67, 1 72,5 66,2
BAB A1To AS to Heydt
73,4 67,1 72,4 66,1
4.8.4 Results of the noise-level calculationsThe noise levels for the surrounding areas from the tram were calculated for threerepresentative emissions. Concerned of local parts are Heydt, Kirschheck, and Heinrichshaus.With the following values were the emission values for the tram calculated.
Table 4. Results calculations.Evaluation levelsdB (A)
Exceeding limitsdB (A)
Emission place Noise limit valuesDay/night
Day Night Day NightKirschheck EG 1. OG
59/49 4144
3937
--
--
Heinrichshaus EG 1. OG
59/49 5052
48 45
--
--
Heydt EG 1. OG
59/49 4040
3636
--
--
If one compares the today’s situation with a future one, including the noise nuisances of theBAB A1, then the results are:
Table 5. Comparison between analyses and prognoses. (UVS) 1995Analyses only BABA1 dB (A)
Prognoses tram + A1dB (A)
DifferencedB (A)
Emission place
Day Night Day Night Day Night
Kirschheck EG 1. OG
7677
7071
7576
6970
-1-1
-1-1
Heinrichshaus EG 1. OG
7676
6970
7575
6969
-1-1
0-1
Heydt EG 1. OG
5454
4848
5354
4747
-10
-1-1
At the nearest buildings noise levels are reduced up to 1 dB (A) in the future prognoses withtram traffic. The metropolitan railway plays thereby a minor roll compared with today’smotor traffic. The reduction of the levels is to be back-driven on the prognosticated reductionof the individual traffic.

Light Rail –experiences from Germany, France and Switzerland
56
The metropolitan railway runs thereby parallel to BAB A1. The emissions of the metropolitanrailway are far under those causes by a motorway. The measured values are almost identicalto the analysed situation.
The differences between analysis and prognosis are very small. At close range of theSaarbrucken light rail the sound-related situation changes only insignificantly. The change iscaused by the reduction of the individual traffic.
4.8.5 What can be done to reduce noise from trams?Noise reflects on hard surfaces and if one can lower the reflecting surface the noise level willdecrease. In many cities grass have been planed between the tracks of the light rail. This fortwo reasons:1. Esthetical appearance2. Noise reduction.
Figure 35. Grass between tracks in Zurich
In Zurich they have measured the noise level with grass between the tracks and without, theresult shows a big difference in noise level.The result for different trams passing one section with grass and one without was like this
Tracks with grass Normal tracks with concreteTram A 73,5 dB (A) 85,5 dB (A)Tram B 73 dB (A) 85 dB (A)Tram C 73,5 dB (A) 86 dB (A)
As shown of the figures, the noise level decreased with 10 dB (A) for the different trams ifthere is grass between the tracks. Since noise if calculated logarithmically is a difference of 10dB (A) half the noise to the ear (Mr. Berger, VBZ).

Light Rail –experiences from Germany, France and Switzerland
57
Figure 36. Tree along the tram track in Strasbourg
In Strasbourg the city have planted an alley of trees along some parts of the tram tracks. Thisis not only beautiful it is also practical. The trees give the trams shadow and works as a barrierfor the road. The shadow is important since the trams in Strasbourg have such big windows,which work, as greenhouse. They make the tram too warm if the sun shines directly on thewindows. Trees work like lungs in a city and absorb pollutions and even some noise (Conseilde Communaute Urbaine de Strasbourg (1999)).

Light Rail –experiences from Germany, France and Switzerland
58
5. Safety
5.1 Introduction/in general
Safety is a critical issue throughout any transit system. However, nowhere are safety issuesmore visible than around a LRT station. Four potential safety concerns are found here.First is the conflict between pedestrians and street traffic. Whether station platforms arelocated in the middle or beside the road, pedestrians need to cross the road to get to thestation. Passengers trying to catch an approaching train may pay little attention to car traffic.The second conflict occurs between LRVs and pedestrians who usually are allowed to crossthe tracks near the stations. Because a LRV may approach relatively rapidly and silently,passengers disembarking a LRV may fail to notice a train approaching from the oppositedirection. Other pedestrians may fail to look both ways before crossing the tracks.The third safety conflict is between LRVs and car traffic. Although this issue is not directlyrelated to the station, on-street stations are often located at intersections where roads crosstracks. The overall layout of the station and intersection is integrated for safe LRT operation.Depending on the frequency of LRVs and the volume of the car traffic and pedestrians, thesefirst three conflicts can be mitigated by visible crosswalks, clear roadway marking, physicalbarriers, signs, and signals for vehicles, trains, and pedestrians. In the most severe cases,grade separation may be used. (Walmsley D.A, 1992).
Personal security of passenger is the fourth safety issue at on-street stations. The on-streetlocation of these stations provides more visibility and natural surveillance from thecommunity than most off-street locations. However, in some cases, increased visibility,enhanced lighting, and/or emergency call boxes are suggested. If a station is even perceived tobe unsafe, the patronage will suffer.
Can a LRV be too silent?Well the question must be addressed. Because it seems to be the case when many operatorschoose to use signals, such as, flashing lights and bells on their vehicles when runningthrough a pedestrian zone or a mall. The disadvantage of this solution is that it can be verydisturbing for the people who live near by the area were it is being used. Nevertheless, it isimportant that the vehicle run smooth and silently during operation to keep and gainpatronage.
5.1.1 Safety at stopsStops are the “business cards” of public transport; they should be identifiable from as faraway as possible and easy to access. But at the same time, they should fit well in the urbanenvironment. The two major safety concerns is the conflict between trams and pedestrians,and between cars and pedestrians.
The conflict between LRV and pedestrians occurs often in the situation when pedestrians areon their way to a LRV or leaving a LRV. When trying to catch a LRV, the danger is oftenanother LRV arriving or departure from the station, the pedestrians attention is drawn to thevehicle he/she is trying to catch. With some or little stress, a smooth and silent LRV can bevery hard to notice. The same problem occurs in the conflict between cars and pedestrians.We will take a look on these different stations set-ups.

Light Rail –experiences from Germany, France and Switzerland
59
1. Centre platform station in street medianFigure 41 shows a centre platform station located in the street median with LRT tracks onexclusive right-of-way. Access to platforms in this arrangement, like most medianstations, is normally limited to one or both ends of the station. Care must be taken thatpedestrians waiting on the median to cross do not block the tracks. If sufficient right-of-way is available kerbside parking can be located along the side of the street at the stationor parking can begin beyond the station as tracks and roadways converge. Operation ofLRV on exclusive right-of-way at the station limits the impact on the traffic and LRToperation, particularly if left turn lanes are provided.A similar layout with LRVs in mixed traffic at the station is also feasible. Left turn lanesare not practical with this layout. Operation of LRVs in mixed traffic at the station has asignificant impact on traffic and LRV operation, LRVs may have to wait for cars waitingat the signal to move before stopping at the station and cars, particularly those turning left,must wait for an LRV to leave. Therefore such a layout is more useful where traffic islight and available right-of-way is minimal.
Figure 37. Centre platform station in street median. (Walmsley D.A, 1992).
At a stop like this it is important that the cars crossing the tracks in a left turn do it nearbythe stop, because the LRV haven’t such a high speed yet. This results in that the LRV iseasier to discover for the car driver and it is easier to feel the presents of the LRV. Onemore advantage for LRV having low speed is that if there is an accident it will be lesssevere.The major risk for pedestrians is the cars when they cross the road to/from the LRVstation. One question that you have to think about is what will be most safe, to have asignal for pedestrians or to make a crossing zone for pedestrians?
2. Side platform station in street medianFigure 37 shows a side platform station located in the street median with LRT tracks anexclusive right-of-way. Access to platforms may be limited to one or both ends of thestation or, if traffic is light and low platforms are used, crosswalks to adjacent sidewalk

Light Rail –experiences from Germany, France and Switzerland
60
can be located along the length of the station. If sufficient right-of-way is available,kerbside parking can be located along the side of the streets at the station or parking canbegin beyond the station as tracks and roadways converge. Operation of LRVs on anexclusive right-of-way at the station limits the impact of the traffic and LRT operation,particularly if left turn lanes are provided.
Figure 38. Side platform station in street median. (Walmsley D.A, 1992).
At a stop like this it is important that the cars crossing the tracks in a left turn do it nearbythe stop, because the LRV have a low speed. This result is that the LRV is easier todiscover for the car driver and it is easier to feel the presents of the LRV. One moreadvantage for a LRV with low speed is that if there is an accident it will be less severe.The major risk for pedestrians is cars when they cross the road to/from the LRV stop.
3. Near and far platform station (with left turn lanes/ in minimum right of way)Figures 38 and 39 shows “near and far” platform stations located in the street median withLRT tracks on exclusive right-of-way. Figure 38 shows the layout with a straight trackalignment and left turn lanes, whereas Figure 39 shows the layout with an S-curve butwithout left turn lanes. The primary advantage of these schemes is their minimal right-of-way requirements. “Near and far” platforms arrangements offer the narrowest right-of-way requirements. A layout in which the outside track on each side of the intersection is inmixed traffic is also possible. Access to platforms may be limited to one or both ends ofthe station or, if traffic is light and low platforms are being used, crosswalks to adjacentsidewalks can be located along the length of the station. If sufficient right-of-way isavailable, kerbside parking can be located along the side of the streets at the stationbeyond the station or beyond the station. Operation of LRVs on an exclusive right-of-wayat the station limits the impact of traffic and LRT operation, particularly if left turn lanesare provided.

Light Rail –experiences from Germany, France and Switzerland
61
Figure 39. Near and far platform station. (Walmsley D.A, 1992).
A stop like this can be a bit more dangerous for pedestrians than stops with platforms sideto side. Statistic say it is more common with accidents between pedestrians and LRVwhen the LRV is on it’s way to the stop and not from the stop. So the further in front theplatform pedestrians cross the tracks the higher is the speed. With higher speed comes lesstime to discover the LRV, react, and there will be a more severe accident.
4. Sidewalk platform station with LRT along both sides of the streetFigure 40 present a sidewalk platform station with LRT along both sides of the street. Thislayout may be applied either with the LRT on exclusive right-of-way (as shown) or inmixed traffic. Platform may be fully integrated with sidewalks or may be separate,particularly if high platforms are used. The layout of the street and turn lanes is flexiblewith this arrangement but kerbside parking is not possible with either layout. Operation ofLRVs on an exclusive right-of-way limits the impact on the traffic, whereas mixed trafficoperation in kerbside lanes affect traffic and invites standing or disables vehicles to blockLRVs. In either case, buses can stop at the platform, providing a direct LRT-to-bustransfer.

Light Rail –experiences from Germany, France and Switzerland
62
Figure 40. Sidewalk platform station with LRT along both sides of the street. (WalmsleyD.A, 1992).
Here you have the same problems as for figure 43, with pedestrians crossing the tracks infront of the stop.
5. Sidewalk platform station with LRT on the outsideFigure 41 presents a sidewalk platform station with LRT tracks located on the “outboard”on both side of the platforms and sidewalks are between the street and the LRT tracks.The layout of the street and turn lanes is flexible with this arrangement and operation ofLRVs on an exclusive right-of-way limits the effects on traffic and LRT operation. Unlikethe arrangement presented in Figure 40 the “outboard” configuration does not affectparking in the curb lane. Buses can stop adjacent to the station platforms, making for adirect transfer between LRT and bus. However, direct access to properties along the right-of-way is limited unless a parallel walkway is provided. This alignment is most usefulwhere properties do not front directly on the street.

Light Rail –experiences from Germany, France and Switzerland
63
Figure 41. Sidewalk platform station with LRT on the outside. (Walmsley D.A, 1992).
The major advantage for this type of stop is that the cars cross the track, when turning left,more perpendicular. This is very good, because the car driver have a better view over thetrack, and somewhat more generous spacing.
6. Centre platform station on one side of the streetFigure 42 presents a centre platform station where both tracks are located in exclusiveright-of-way on one side of the street. Access to the platform is limited to one or both endsof the station. Care must be taken to pedestrians waiting at the end of the station to crossthe street are aware of train and do not block tracks. Because one track is adjacent to thestreet, cars cannot park along the curb, and direct bus loading is not possible. Directaccess to properties along the right-of-way is limited, making this arrangement mostuseful where properties do not front directly on the street. The layout of the street and turnlanes is flexible with this arrangement and operation of LRVs. An exclusive right-of-waylimits the impact on the traffic and LRT operation.

Light Rail –experiences from Germany, France and Switzerland
64
Figure 42. Centre platform station on one side of the street. (Walmsley D.A, 1992).
This kind of stop has the same advantage as for the stop in figure 40.
7. Side platform station on one side of the streetFigure 43 presents a side platform where both tracks are located to one side of the street.Care must be taken to pedestrians that wait at the end of the station to cross the street areaware of train and do not block tracks. With side platform and continuous sidewalkbetween the roadway and the adjacent tracks, curb parking can be located along the sideof the street. The station or buses can stop adjacent to station platforms, making for adirect transfer between LRT and bus. Access to adjacent properties is not limited by thisarrangement, and the layout of the street and turn lanes is flexible.

Light Rail –experiences from Germany, France and Switzerland
65
Figure 43. Side platform station on one side of the street. (Walmsley D.A, 1992).
Here only one lane has a left turn over the tracks and they have the same generous spacingas in the case of figure 40 and figure 41.
8. Mid-block stationMost of the arrangements presented for stations in intersections may also be applied atmid-block locations. A mid-block station may be located where a major trip generator orpedestrian route lies between intersections. A mid-block station also avoids the congestionand competition for limited space found at intersections.
Figure 44. Mid-block station. (Walmsley D.A, (1992).

Light Rail –experiences from Germany, France and Switzerland
66
This kind of stop has the same advantage as in the case of figure 42.
9. Stations in pedestrian area/mallsClosing a street to general traffic and developing a transit/pedestrian mall is the ultimateway to minimizing pedestrian-automobile and tram/LRV-automobile conflicts. Thisoption is useful where traffic can be diverted, where pedestrian volumes are heavy, orwhere available space is limited. A transit mall may be limited to LRVs, or may allowbuses to share the same roadway and station facilities.
It is important for the safety that the track area is covered or in some way different fromthe surroundings, so the pedestrians is well aware that there is a track and there will comea LRV. To use lights and bell is certainly an effective way to catch the pedestrianawareness but it can also ruin the atmosphere in the mall or pedestrian area.
According to the operators in our case study cities, there is no bigger problem with theconflict between pedestrians and LRVs, neither between pedestrians and cars. The accidentstatistics they have given us shows this to be correct. The number of accidents between LRVand cars are at least four times higher than the accident with pedestrians, (Zurich). In the caseof Saarbrucken the quota is 15, according to the information we received from them. The cityof Mannheim haven’t left enough precise statistic for this comparison, but the officials fromMVV, (Mannheimer Versongungs- und Verkehrsgesellschaft), claims that the most number ofaccidents occurs between cars and LRVs/trams. (Mr. Rabe)The largest problem is the conflict between LRVs and cars.
5.1.2 Stretching (in pedestrian zones and busy corridors)Pedestrian zones in the centres of German cities have a long tradition. In many cases the mainroutes of trams or buses go through these pedestrian zones. Pedestrians and public transport isin good coexistence. Of course, trams and pedestrians fit better together than buses andpedestrians, because trams are easier to be perceived owing to the rails. An explanation forthis good coexistent is that, whenever a person steps on the rail they feel that a tram/LRV canand will come along the rails. To have a clear marked track area, contributes to this feeling. Ifthis is the exact reason for the better coexistent between trams/LRV and pedestrian thanbetween buses and pedestrians is hard to prove.
In Germany the maximum speed of vehicles in pedestrian zones is generally 7 km/h. Publictransport usually gets an exemption to 20 km/h (Mannheim) or 25 km/h (Freiburg, Karlsruhe).Full separated tracks, running as ordinary trains on its own track, are the most safe, they havethe least accidents and none interactions with other traffic modes. (Prof. Dr.-Ing. Topp,Hartmund H)
5.1.3 Crossings (at-grade)It is here, were the officials from the different transit companies consider having the mostaccidents. The statistics shows this very well, especially in those cities were the tracks arefully segregated. The biggest problem seems to be the cars. In all case study cities the mostcommon accident is between the tram/LRV and a car. In Zurich for example, the accidentwith cars is 91% of all collisions, and 45% of the total number of accidents. In Saarbruckenthe accidents with cars stands for almost 100% during the two and a half years of operation.Very often the car driver have missed the signal or ignored them.

Light Rail –experiences from Germany, France and Switzerland
67
When there is a crossing, there should be a special lane for cars turning and passing the tracks.This can be very well seen in the different systems in the case study cities. Those case studycities with a lot of separated tracks have fewer accidents than those case study cities with a lotof shared right-of-way. The cities with more separated tracks have their most accidents incrossing between tram and car.When designing a LRT system you should try to achieve to get all crossing to beperpendicular to the tracks, which gives them good sight in both directions. There should be atleast signals in the crossings, maybe even some physical hindrances. The time for signalsgoing on and off plays an important part to gain the car driver’s patronage. Because, if theydon’t believe in the signals they will ignore them and drive over the tracks any way, this willresult in accidents. This has been shown in Zurich where they have cut down on the time forsignals with very good results. The car drivers believe in the signals and they know that whenthe signal is on the tram will show up in a few seconds.
5.1.4 Personal securityTo keep and to gain patronage for a Light rail system it is important to have a high personalsafety, and a feeling to be safe when travelling or waiting on a tram.On board safety can be solved with surveillance cameras on board and phones for emergencysituations.It is at the stops were the most problems within personal security occur, it is here were themost crimes and assaults take place.
To create a safe stop or station it is important to have good lightning, because dark placesmakes people feel unsafe, at least the most people. The stops should be located in open places,it feels and it is safer to see and to be seen by other people. To have a kiosk nearby the stop isalso a very good idea. The stops and stations in a Light rail system are often located onground and this advantage should be used compared with a metro system.
The police should also play a important part in this work, to regular patrol the station andsometimes ride with the LRV if not the operator have trained staff for this kind of job.There should also be some education of all the staff and passenger, what to do and how toreact in the case of an assault or emergency.
If you are interested to read more about personal security, the author recommends a researchpaper, “Crime on mass transit in the U.S.”, written by Jim Nichols from University ofMinnesota, USA, which deal with this matter.
5.2 Safety evaluation of tram/LRT system
5.2.1 Vehicle-kilometreWhen you evaluate the safety within a tram/LRT system there is a couple of issue that youhave to keep in mind. From the pedestrians and other road users point of view, it is thevehicle-kilometre accident rate that is important. The risk of injury depends on the presence ofthe light rail vehicles. But if light rail can give the same travel service with less number ofvehicle-kilometres, then the exposure will be reduced and so will the risk of an accident.

Light Rail –experiences from Germany, France and Switzerland
68
5.2.2 Passenger-kilometreFor the passenger, it is the rate of accident per passenger-kilometre that is important. Becausethis gives the probability of be involved in an accident as a passenger on a given journey. Butthe rate will not account the fact of how severe the accident is. Furthermore the rate ofaccident per passenger-kilometre also gives a measure of the social/community benefit peraccident, i.e. how many people can travel per accident.
5.2.3 SeverityNone of accident rate per vehicle-kilometre or accident rate per passenger-kilometre gives ameasure about how severe the accidents are. It is a well-known fact that the accidents with atram/LRV usually get more severe than with buses. When making a deeper and broaderresearch and safety evaluation it is necessary to have detailed accident statistics. This issomething that very few operators have, so an idea is to compare the police accident statisticwith hospital statistic. Which can give you a very good apprehension on how severe theaccidents are.
5.2.4 TrendsThere are always trends within traffic, this will affect the safety evaluation, no matter if it isincreasing or decreasing. When looking on statistics for several years you have to view thestatistic against a background of the trends in traffic. There can also be shorter terms ofvariation in accident statistics; these are often results of economical changes or e.g. drink-driving programs. One thing that is important to keep in mind when you compare buses withtrams/LRV is that the trends are affecting them very similar.
5.2.5 Corridor effectsWhen evaluating a tram/light rail system you have to be aware of corridor effects. Becausethis can give a light rail system a higher accident rate. A light rail line is in generally builtalong a high traffic intensive corridor to maximize its economic viability. This implies that thelight rail vehicle carries more passengers per vehicle-km, and (depending on the trackalignment) encounters more pedestrians and other road traffic, than would be the case onother corridors, which continue to be served by buses. Light rail therefore operates in acorridor where the risk of accident is higher than elsewhere.
5.2.6 Transient effectsTransient effects are something that can occur when you have built a new line or system. Itconsists of a higher number of accidents during the first year of operation. The number ofaccident will later on decline, after a year or two it will have reach a stabile number of annualaccidents. The decline will appear not because of safety work, but of the facts of that driversof other traffic modes have got used to the trams/LRVs, and the LRV drivers isn’t that skilful.
One important thing when looking on transient effects is that there should be no changes inthe system to get as good result as possible. This is also the problem, because as soon as theoperator finds out that there are some (e.g. crossings with) a high number of accidents theywill try to do something about it. To get an approximate value of the transient effect you canalways project the accident rate backward in time. In cities like Buffalo, the accident rate havefallen 30% per annum since 1987, this indicate that transient effects might last for severalyears. Transient effects have been discovered in cities like Grenoble and Portland.

Light Rail –experiences from Germany, France and Switzerland
69
5.3 Saarbrucken Safety
The system in Saarbrucken is a new build system with a lot of exclusive right-of-way andphysical barrier, such as grass and fencing to prevent cars to drive on the tracks. In the innercity area there is some shared right-of-way.Because of the fact that the system in Saarbrucken is new, the operator doesn’t have anystatistics over accidents in the system. They know that they had 15 accidents the first year andnowadays the accidents have decreased to about 6-7 accidents per year. (Mrs Del Savio,Saarbahn)
The first year they had 15 accidents and about 1 million vehicle kilometre, this gives a ratethat is 66 666 vehicle-kilometre per accident. It have dropped to 6-7 accidents per year withthe same number of vehicle kilometre, this gives the rate of 142 857 vehicle-kilometre peraccident. There has been a cut down on more than 50%; the question is how this can beexplained.One explanation could be transient effects, and it has probably something to do with it, and itwould have been very interesting to do a minor research about this. This is not possiblebecause the second explanation, they have rebuild three crossings.The three crossings they rebuild had more than half of the accidents during the first year.
In one of these crossings, there was a major signalling error and intersection design error. Theintersection is located just along the tracks. When coming from west and driving to east youwill drive through the intersection and after just a couple of meter comes the crossing over thetracks. The problem was that drivers got a green light for the intersection and missed that theyhad red light for the crossing over the tracks. This is not all; to this there is also a house thatdeteriorates your sight when coming from west.The other two crossings were without signals and left-turns over the tracks, they havenowadays signals and left-turn lanes.
5.4 Mannheim Safety
According to officials from the Transit Company in Mannheim they have about 3-4 mortalaccidents in the system every year, but they don’t consider this to be a problem, or having asafety problem anyway. (Dipl-Ing. Werner Rabe)The total number of accident in 1997 was 158, but there is a decrease in accidents. Lookingback in time you will see that there were more accidents.In 1997 there was 158 accidents and there was 4 744 575 vehicles-kilometres giving a rate on30 029 vehicle-kilometre/accident. In 1965 there was 669 accidents and 6 770 064 vehicle-kilometres giving a rate on 10 119 vehicle-kilometres/accident.

Light Rail –experiences from Germany, France and Switzerland
70
Figure 45. Vehicle-kilometres per accidents for trams in MannheimWhen you compare accident statistics from Mannheim with statistics from other Germancities with new systems you will find that they have very higher number of accidents. Theexplanation for this is to find in the type of separation. The system in Mannheim has manystretching with shared right-of-way. This lead to many conflicts between cars and tramsfortunately the accidents are not so severe, this because of the relative low speed, especiallyfor trams. Many of the accidents would be mortal if it had been a heavy train in full speed.
The accident statistic for trams can be compared with buses; they have gone from 180accidents in 1965 to 52 accidents in 1997. During the same time the vehicle-kilometres havedecreased from 5 101 099 km to 3 273 000, this gives that the vehicle-km/ accident haveincreased from 33 340 to 62 896. The quota for buses is twice as high as for trams.
Figure 46. Vehicle-kilometres per accident for buses in Mannheim.
The diagram shows that buses have a better safety calculated on vehicle-kilometres, and inMannheim’s case the rate of vehicle-kilometres/accident is twice as high as for trams. But isnot really fair, we have to take the number of passenger in the calculation. Than will find thattram have a better rate than for buses. The explanation for this is of course that trams takemore passengers per ride, approximately four times more passenger. This has to be morereasonably, because we have to look on which use/benefit the operation gives to the city.In this case it have to be defined through the number of passenger it will serve.
The exact figures for Mannheim’s trams is 220,1 million passenger-kilometres in 1997, andfor buses it is 49.3 million passenger-kilometres in 1997. Approximately this is a bit morethan 4 times higher. If we divide the number of passenger-kilometres for each transit modewith the accident number for each transit mode we will get a measure of safety for thepassenger. For trams that will be 220 100 000/158 = 1 393 038 passenger-kilometres/accident.
Vehicle-kilometres per accident for trams
010000200003000040000
1991 1992 1993 1994 1995 1996 1997 1998
Years
Veh
. km
/acc
.
Vehicle-kilometres per accident for buses
0
50000
100000
1991 1992 1993 1994 1995 1996 1997 1998
Years
Veh
.-km
-/ac
c.

Light Rail –experiences from Germany, France and Switzerland
71
Figure 47. Million passenger-kilometres per accident for trams in Mannheim.
And for buses if becomes 49 300 000/52 = 948 077 passenger-kilometres/accident.
Figure 48. Million passenger-kilometres per accident for buses in Mannheim.
The quota for trams is almost 1.5 times higher than for buses, or so to speak 50% safer. Sowhen looking to the number of passenger-kilometres the trams is safer.
It have been hard to evaluate if there is any corridor effects, it’s most certain are, when theinner city area is served by trams and the periphery is served with buses. Any transient effectsare not likely to be present in Mannheim, there are no new lines and it is an old system.We haven’t got any information about the general trends within traffic safety in Mannheim soany discussion about trends would be speculations.
5.5 Zurich SafetyThe tram system in Zurich is an old system, with a lot of shared right-of-way. Buses areoperating in the periphery and also trolley buses are operating in the surroundings. Both busesand trolley buses have some routes into the city centre area.The information was received from, VBZ, the Transit Company in Zurich, is the accidentstatistics from 1993 to 1998. The number of accidents is the total number of accident dividedinto different types of transit mode. Unfortunately only vehicle- and passenger-kilometres for1998 were received. Out of this we can still make a comparison between the different types oftransit mode, but just for 1998. A general look on how the total number of accidents hasdeveloped was made.
Passenger-kilometres per accident
0
0,5
1
1992 1993 1994 1995 1996 1997 1998
Year
M. p
ass.
-km
/acc
.
Passenger-kilometres per accident for trams
00,5
11,5
1992 1993 1994 1995 1996 1997 1998
Year
M. p
ass.
-km
/acc
.

Light Rail –experiences from Germany, France and Switzerland
72
Figure 49. Accident statistics for transit modes in Zurich, 1993 to 1998.
During these years accidents for trams have decreased with about 10%, for the trolley bus it isabout 6% and for the autobus it is 30%. The decrease for trams and trolley buses seems to bequite normal. In the case for autobus, it must exist some other explanation than it just followsthe common traffic trend. The VBZ have probably made some changes within the autobussystem, most likely drawn one or two auto bus routes to the outside of the city.
Let’s make the comparison between the different types of transit modes according to vehicle-and passenger-kilometres during 1998. Here we have to put trolley bus and auto bus together,this because VBZ have put the statistics for them together.The tram had 18,228 million vehicle-kilometres, 331 million passenger-kilometres and totally1269 accidents. This gives a rate on 14 364 vehicle-kilometres per accident and 260 835passenger-kilometres per accident.
The buses had 10,375 million vehicle-kilometres, 159 million passenger-kilometres and 1076accidents. This gives a rate at 9642 vehicle-kilometres per accident and 147 770 passenger-kilometres per accident.
According to this the tram is safer than the buses in both vehicle-kilometres per accident andpassenger-kilometres per accident. The quota in passenger-kilometres is 1,77, or 77% safer.As mentioned earlier, this is just for 1998.In the case of Zurich we can have a look at the severity differences between buses, autobusesand trams. A comparison between the numbers of fatal accidents with the total numbers ofaccidents shows that, with statistics from 1993 to 1999, during this year’s trams have totallyhad 10646 accidents, trolley buses have totally had 5117 accidents and autobus have totallyhad 4465 accidents.Of 5117 accidents trolley buses haven’t had a single fatal accident, the auto bus have killed 3people on 4465 accidents which gives a fatal quota on 0,067%.Trams have killed 25 people on 10646 accidents; this gives a fatal quota on 0,23%.In a smaller severity test in Zurich for the three different types of transit, it seems that it is thetram that gives the most severe injuries, which was not so unexpected.
In 1989 there was an analysis made on the accidents in Zurich, (Brändli and Kobe, VBZ1989). They found that 60% of all severe accidents occur at stops, with about twice as manywhen the tram was stopping/arriving to the station as when it was starting/departure.
Transit accidents in Zurich, 1993-1998.
0
200
400
600
800
1000
1200
1400
1600
1993 1994 1995 1996 1997 1998
Year
Nu
mb
er o
f ac
cid
ents
TramTrolleybus
Autobus

Light Rail –experiences from Germany, France and Switzerland
73
5.6 Strasbourg safety
The system in Strasbourg is the most recent build system among our case study cities.This is also the reason why the statistics over the safety in Strasbourg is so poor.What we know, is that there have been two fatal accidents in Strasbourg, one was suicide theother was an accident with a bicycle. This is what we been told. (Mr. Muller)When looking on how the system in Strasbourg is constructed, you will find a lot of exclusiveright-of-way with standard stops and reasonably crossings.The only conclusions that can be made about the system in Strasbourg are that it should havea good safety.One thing that can be mentioned is that the LRVs have a lower speed in the system in thebeginning to make it easier for the inhabitants to get used to the LRVs. These of course toprevent, hold back, on the transient effects.
5.7 Karlsruhe Safety
There cannot be any deeper analysis of the safety within the system in Karlsruhe. This isbecause of the lack of information from the operator in Karlsruhe. The accident statistic isclassified information, a decision made by the local politicians.
One can only wonder, why the statistic is classified. If you look at their system, it is like mostof the other system we have looked on, i.e. within the central city area. Outside it runsaccording to the “Karlsruhe model”. Of course with an increasing number of vehicles runningon the same tracks there will be an increase of potential accidents. But imagine a heavy trainsmashes a full LRV, a nightmare scenario. If it had happened, there would have been on thenews, which leads to the conclusion that it hasn’t happened. There might have been safetyconflicts, but this is something we know nothing about.
There have been suggestions that the accident statistics have been classified because of thebusiness with the “Karlsruhe model” and it’s importance for TTK. This make’s no sense,because, the most accidents in every system occur in the city area, where the “Karlsruhemodel” not is amplified. So this explanation doesn’t hold, the system in Karlsruhe shouldhave the same statistic as the others cities with similar systems.

Light Rail –experiences from Germany, France and Switzerland
74
6. Conclusions
6.1 In general
The tram/LRT system play an important part in the cities where it exists. In some cities theinhabitants are very proud over “their system” and in many of these cities they identify verystrong with their tram.A Tram/LRT system takes a lot of space within a city, but not compared with the spaceneeded if the same amount of people would travel by cars. Tram/LRT systems are not thesolution for the major cities as the major transit mode; there it fits more like a complement tometros, bridging the capacity gap between buses and metros. In middle-sized cities it canwork perfectly well as the major transit mode complemented with, or without, feeder buses.
6.2 Environment
Trams are good for the environment for 6 major reasons.• The energy consumption for tram operation is much smaller than for both bus and cars
calculated per personal kilometre.• Trams run on electricity, which produce less pollution than vehicles driven on fossil fuels.• Trams work well in an urban environment; they don’t cause barrier effects and offers a
convenient and effective transports mode.• The land use of a tramline is much smaller than a road and since land is one a cities most
valuable resources this is important.• Trams do not cause congestion.• By replacing diesel driven buses with trams in a city one reduce the amount of pollutions
that harm buildings and statues.
6.3 Safety
Tram/LRV is safer than buses in many ways. Measured in passenger-kilometre per accidentthe tram/LRV is safer than buses but when it comes to vehicle-kilometre per accident it isgetting more equal. But if the tram/LRV can provide the same service as the bus but withfewer vehicle-kilometre than the number of potential accidents will drop. The exposure forpedestrians will be smaller and so will even the risk of being in an accident with a tram/LRV.If the tram/LRV can meet that demand, than you can say that the tram/LRV is safer than thebus in general.
How can one build and create a safe tram/LRT system?Well, the first and most important issue is about right-of-way. An exclusive right-of-way isthe safest form of right-of-way. This stands clear when comparing system with different typesof right-of-way.
The second issues that have to be addressed are the crossings. They should have signal and beperpendicular to the tracks. One should try to avoid left turns over the tracks, this is of coursenot possible to totally avoid but try to keep it to a minimum. When there are left turns over thetracks, one should try to give them an own lane.

Light Rail –experiences from Germany, France and Switzerland
75
7. Discussion
7.1 In general
It seems, wherever there are trams, the inhabitants appreciate this transit mode and in manycities they identifies their city with it. It becomes a natural part of the urban environment, apart of the city. The authors to this thesis have been riding with trams/LRVs during the springof 2000, and are both convinced that this transit mode is superior to, for example buses. It ismore convenient to ride with a tram/LRV, one have more space and it travels more rapidlythan the buses. Sure, during rush hour, this transit mode is crowded, but we never felt this tobe inconvenient. But, there is one thing that should be added; it is the yearly use of a transitmode that gives the real answers to how convenient a transit mode really is. This is somethingthat the authors not have any experience and knowledge about.
7.2 Economy
Only Strasbourg has revenue among our case study cities, it shows that there isn’t any profitto be made in transit. There is revenue for the inhabitants and they are paying for it becausethe revenue from heat and water business covers up the losses for the transit companies.This is something that we should try in Sweden, unfortunately, it is forbidden through the“Kommunallagen”; this is something that someone should take a look at.
There is obviously something wrong with the cost-benefit analysis, when every study showsthat it is not economical for the society to build LRT systems. Imdad Hussein, who is aresearcher from VTI that works with cost-benefit analysis, supports this opinion. If thereshould be any future for LRT systems in Sweden something have to be done about the benefitside of the analysis.
7.3 Environment
The most surprising thing that we discovered was that trams use almost as much energy perpassenger kilometres as for cars. Most on the energy consumption for trams came from theconstruction of trams and tracks (indirect energy). But still with high indirect energyconsumption the amount of pollutions are low. We have not found an explanation for this,sure the work like transports and cement foundation use a lot of energy but they also producea lot of pollution, which is not produced by the tram construction. The manufacture of railscould be the solution but since express train has lower indirect energy consumption this seemsnot to be the solution either. See figures for pollution in appendix 1 and energy consumptionin chapter 9.3.
Trams seem to have a very low barrier effect for pedestrians, which make it an idealtransportation mode in cities. By replacing some car lanes with tram tracks one also gainspace for pedestrians. This is hard to do with buses since the understanding for special lanesfor buses are lower among car drivers than for tram tracks. Another thing that is advantage fortrams is that it uses a small land area in comparison to how many people it can transport.A new tramline gives a good opportunity to redesign a city and make it more beautiful.
Light Rail –experiences from Germany, France and Switzerland
76
7.4 Safety
Of course one starts to wonder about the safety in the “Karlsruhe model” when the accidentstatistic from Karlsruhe is classified information. But as mentioned earlier in this thesis, ifthere would have been a major accident, it would have been on the news. But we don’t knowanything about the number of conflicts.
In general, a lot of the transit companies don’t consider the safety to be any problem, notofficially any way, and sure, they have fewer accidents than other transit modes and provide avery good service to the inhabitants. One can understand that, a city like Strasbourg, whichonly has two lines, a lot of exclusive right-of-way and following few accidents, don’t pay somuch attention to safety, but a city like Zurich should work harder with safety. They haveabout 1200 accidents per year; sure this is something the inhabitants accept but why not try todo it better, to improve the safety within the system.It is hard to push for tram/LRT for its safety when the trolley buses in Zurich haven’t killed asingle person during the last seven year, under the same time the tram have killed 25.This is one of the biggest problems with trams, the severity in accidents, and this issomething, fortunately, VBZ is working with. How much and how hard is not known for theauthors.
Light Rail –experiences from Germany, France and Switzerland
77
References
Literature
Conseil de Communaute Urbaine de Strasbourg (1999). Plan De Deplacements Urbains.
The European Conference of Ministers of Transport. (1994). Light Rail Transit Systems.
Fachgebiet verkehrwesen, (1995). Aktuell: Renaissance der strassenbahn,Universität Kaiserslauten. grune reihe Nr. 31
Flyvberg, B. et al.(1995). Facts about the Fehmarn belt. The Danish transport council,Copenhagen. ISBN 87-90037-23-5 ISSN 0908-5556
Flyvberg, B. et al.(1995). Fehmarn belt: Issues of Accountability, The Danish transportcouncil, Copenhagen , ISBN 87-90037-24-3, ISSN 0908-5556
Gilgore, E. (1995). Regionalbahn, Stadt- und Strassenbahn im Systemverbund – vom”Karlsruhe modell” zum ”Kaiserslauten modell”. Fachgebeit Verkehrswessen, UniversitätKaiserslauten, Kaiserslauten. Grune reihe Nr. 45
GVF, (1998). Transportation yesterday, today, tomorrow Bureau for transport studies.Switzerland
Hall, P and Hass-Klau, C. (1985). Can rail save the city. Gower Publising Company.ISBN 0-566-00947-1
Hedström, R. (1999), (1999). Light Rail – Light Cost, förstudie. Väg och Transportforsknings Institutet ISSN 1101-2986
Infas AG, (1997). Umweltindikatoren im verkehr GS EVD. Switzerland
International Assosiation of Public Transport, (1998). Light rail 1998: Trends. Thirdconference, San Jose. ISBN 30.IX-02.X.
Manheim, M.(1996). Fundamental of transportation system analysis. The MIT Press,Cambrige, Massachusetts, and London, England. ISBN 0-262-13129-3.
Muller, G. (1994). L’Annee du Tram. Les Editions Ronald Hirle, Strasbourg.ISBN 2-910048-15-2
Mueller, S. and Polhill, P. (1999). Let those who receive the benefits pay the costs.
Schull, R.( 1995). Dynamische strassenraumfreigabe fur strassenbahn/stadtbahn,Universität Hannover, Hannover. FE-Nr 70440/94

Light Rail –experiences from Germany, France and Switzerland
78
Schull, R. (1993). Möglichkeiten zur integration von bahnkörpern der stadtbahn/strassenbahnin strassenräume von städtischen hauptverkehrstrassen mit wohnbebauung.Universität Hannover, Hannover. FE-Nr 77038/85
Professor Dr.-Ing. Topp, H.(1999). Renaissance of trams in Germany – five case study.Journal of Rail and Rapid Transit. London (1998) p227..233
Professor Dr.-Ing Topp, H. (1998). Innovations in trams and light rail systems Journal of Rail and Rapid transit. London (1999)
Transportation Research Board, National Research Council, (1992). Light Rail Transit:Planing, Design, and Operating Experience. National Academy Press, Washington.ISSN 0361:1981; No 1361.
Umweltverträglichkeitstudie, (UVS), (1995).Stadtbahn Saar Bauabschnitte.
Verkehrs-Club der Schweiz, (1998). Trambahnen in der Schweiz.
Vuchic, V. (1981). Urban public transportation, system and technology. Prentice-Hall,ISBN 0-13-939496-6.
Walmsley D.A, (1992). Light Rail accidents in Europe and in North America.Crowthorne, Berkshire: Transport and Road Research Laboratory. ISSN 0266-5247

Light Rail –experiences from Germany, France and Switzerland
79
Study visits
Mr. Rabe. MVV Mannheim Versorgungs- und verkehrsgesellschaftMr. Berger, VBZ Zurich Verkehrsbetriebe det Stadt ZurichMr. Kuhn, KVV Karlsruhe,Mr. Muller, CTS Strasbourg Compagnie des Transports StrasbourgoisMrs Del Savio, Saarbahn Gmbh Saarbrucken,LRT Workshop 2000 March 20th-24th
Oral references
Dipl-ing Berger, Ernst. VBZ ZurichMr Bessier, Stefan University of KaiserslautenMr Böhmer, Lars. IRISBUSMr Haatveit, Thor. Ministry of Transport NorwayProf. Dr. Hass-Klau, Carmen. Environmental and Transport planning, Stanford House /University of WuppertalDipl-Ing. Hondius, Harry. Freelance journalistPh.D. Hussian, Imadad, Swedish National Road and Transport Research Institute, (VTI)Ph.D. Dr.Laverny-Rafter, David. Minnesota State University, urban planningProf. Muller, George. Compagnie des Transports StrasbourgoisDipl-ing. Schaffer, Horst. VBZ ZurichProfessor Dr.-Ing. Topp, Hartmund H. University of Kaiserslauten Transportation DepartmentMr. Tsuda, Masayuki. Development Bank Japan, Planning Department for RegionalDevelopmentPh.D. Dr. Vuchic, Vukan R. University of Pennsylvania, Department of Systems EngineeringDr Wolf, ConsultDipl.-Ing. Werner Rabe, MVV Mannheim
Internet references
http://i2i.org/suptdocs/transportation/letrecieverspay.htmhttp://encarta.msn.comhttp://www.kvv.dehttp://www.vbz.chhttp://www.traminfo.comhttp://www.euronet.nlhttp://www.siemens.comhttp://www.adtranz.comhttp://www.bombardier.comhttp://www.saarbahn.dehttp://www.lrta.orghttp://www.vattenfall.se
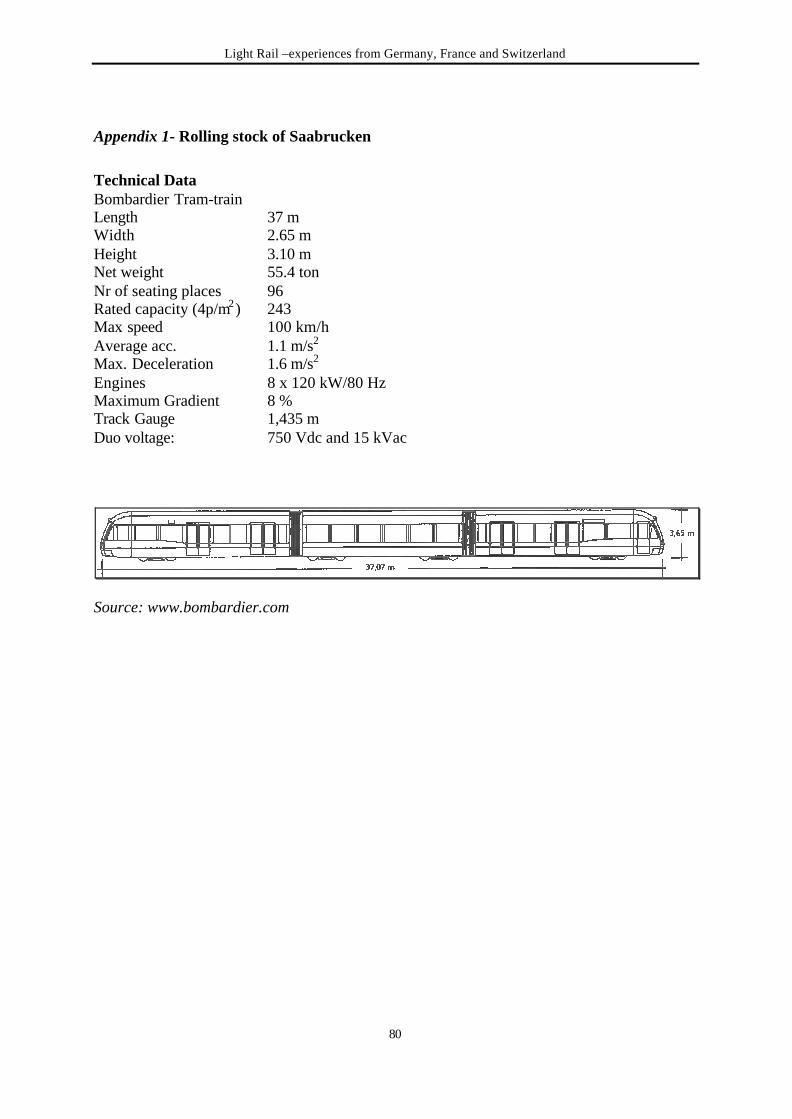
Light Rail –experiences from Germany, France and Switzerland
80
Appendix 1- Rolling stock of Saabrucken
Technical DataBombardier Tram-trainLength 37 mWidth 2.65 mHeight 3.10 mNet weight 55.4 tonNr of seating places 96Rated capacity (4p/m2) 243Max speed 100 km/hAverage acc. 1.1 m/s2
Max. Deceleration 1.6 m/s2
Engines 8 x 120 kW/80 HzMaximum Gradient 8 %Track Gauge 1,435 mDuo voltage: 750 Vdc and 15 kVac
Source: www.bombardier.com

Light Rail –experiences from Germany, France and Switzerland
81
Appendix 2 - Saarbrucken’s network
Source: www.saarbahn.de

Light Rail –experiences from Germany, France and Switzerland
82
Appendix 3 - Rolling stock of Mannheim
Technical data8MGT-LLDE by DuwagLength 42.778 mWidth 2.40 mHeight 3.40 mTrack width 1.00 mNet weight 48.65 tonNr of seating places 125Rated capacity (4p/m2) 124Max speed 80 km/hMax. Deceleration 3 m/s2
Engines Four 95,5 kW motors

Light Rail –experiences from Germany, France and Switzerland
83
Appendix 4 - Mannheim network
Source: www.mvv.de

Light Rail –experiences from Germany, France and Switzerland
84
Appendix 5 - Rolling stock of Zurich
Technical DataGelenkmotorwagen Be 4/6Length 21.4 mWidth 2.2 mHeight 3.6 mNet weight 26.5 tonNr of seating places 50Rated capacity (6p/m2) 157Max speed 65 km/hTrack Gauge 1,0 mFloor height over track, 0.83 m

Light Rail –experiences from Germany, France and Switzerland
85
Appendix 6 - Zurich’s network
Source: www.vbz.ch

Light Rail –experiences from Germany, France and Switzerland
86
Appendix 7 - Rolling stock of Strasbourg
Technical dataEurotram by AdtranzLength 33.10 mWidth 2.40 mHeight 3.10 mNet weight 29.15 tonNr of seating places 66Rated capacity (4p/m2) 230Max capacity (6p/m2) 290Max speed 60 km/hAverage acc. >40 km/h 1 m/s2
Average acc. >60 km/h 0.77 m/s2
Max. Deceleration 3 m/s2
Engines Four 26, 5 kW (432 hp) motors

Light Rail –experiences from Germany, France and Switzerland
87
Appendix 8 - Strasbourg network
Source: www.strasbourg.fr

Light Rail –experiences from Germany, France and Switzerland
88
Appendix 9 - Rolling stock of Karlsruhe
Technical DataSiemens GT8-100D/2S-MLength 36.7 mWidth 2.65 mHeight 3.3 mNet weight 58.5 tonNr of seating places 100Rated capacity (4p/m2) 223Max speed 105 km/hAverage acc. 0.85 m/s2
Max. Deceleration 1.6 m/s2
Engines 4 x 127 kW/750 VTrack Gauge 1,435 mDuo voltage: 750 V dc and 15 kV acFloor height over track, 0.88, 0.63, 0.89 mSmallest turning radius 23 m

Light Rail –experiences from Germany, France and Switzerland
89
Appendix 10 - Karlsruhes network

Light Rail –experiences from Germany, France and Switzerland
90
Appendix 11 - Economy and Ecology are no contradictions“Three messages from Zurich concerning the new transport policy”
The increasing significance of private motorized transport has kept our cities locked in avicious circle for years. The blocking of roads and the lack of car parks are being counteractedby the construction of new roads and car parks and the extension of existing ones. The resultis that even the new roads are blocked and the lack of car parks becomes even greater. A citybecomes more unattractive, and this evil is once again dealt with by the most obvious means:with the construction of new roads and car parks! The transport policy of the City of Zurichhas broken this vicious circle and transformed it into a "rainbow", a symbol of environmentalprotection and economic strength (Figure 1). The overflow of private motor traffic wasanswered not by increasing but by redistributing the existing road area in favour of localpublic transport and pedestrians. The result is greater urbanity, better environmentalconditions, increased economic strength (!) and stabilized private transport.
The transport policy of the Council of the City of Zurich has 4 objectives:
• Promoting a change from the car to public, environment-friendly transport.
• Channelling motor traffic - creating quieter conditions in residential areas.
• Limiting the parking places for commuters.
• Reducing motor traffic in the city. This objective of generally reducing the motor trafficwas first formulated with this stringency in 1987 under the impression that atmosphericpollution was increasing.
This transport policy is based on a recognition of the fact that, for physical reasons alone, it isnot possible to make a city of half a million people accessible with the car. Car traffic takesup too much space, so that there is a danger that there will no longer be any city left after ithas been adapted to meet the traffic needs. We are aware of similar examples from the USA.
In the interests of the economy, the quality of the environment and living and leisurestandards, an above-average proportion of passenger journeys was assigned to publictransport. An essential requirement for this is the provision of an attractive local publictransport system and good conditions for pedestrians. Furthermore, because the individualcitizen is not willing voluntarily to dispense with the use of his car despite a clear knowledgeof the relationships, at the same time neither additional streets nor car parks were constructed.The objectives have been substantially achieved. A comparison of the distribution ofjourneys made over the various forms of transport shows that about twice as many journeysare made by public transport in Zurich than in comparative German cities; the proportion ofjourneys made by car is correspondingly smaller (Figure 2). The number of journeys perinhabitant per year still shows marked differences compared with other European cities(Figure 3).

Light Rail –experiences from Germany, France and Switzerland
91
First message from ZurichIf you ask the inhabitants of a town, which transport policy, should be followed, the citizenswill not choose the car. They are much more intelligent, than politicians and other opinionleaders believe and have higher values than merely standing still in a traffic jam.
The answer to the question as to how it was possible in Zurich to convince the citizens of theadvantages of a transport policy which gives preference to public transport in the existingroad system over private motor transport is as follows: Politicians and experts did not have topersuade the citizens. On the contrary, the citizens themselves initiated this transport policythrough several referendums and a public campaign, in opposition to the will of politiciansand experts. In Zurich, the public must vote every public construction project that costs morethan SFr. 10 million on. As long as 20 years ago a phenomenon emerged which has beenvery clearly developed by Brög Sozialdata Munchen, in the publication "Estimates ofmobility in Europe" for the countries of the European Community:
• The citizens are very well aware of what has to be done in terms of transport policy:84% would like to promote local public transport at the expense of private motortransport, 85% want preferential treatment for pedestrians and 73% want this forcyclists at the expense of private motor transport.
• The decision-makers (politicians, experts, etc.) do not believe the citizens to becapable of this insight. They believe that only 49% are in favour of promoting localpublic transport at the expense of private motor transport, only 43% want to givepreference to pedestrians and only 30% favour cyclists.
• The citizens are also prepared to accept restrictions in the use of a car: 75% favourenlarging the pedestrian zones, 71% would like to see restrictions on car traffic and53% are in agreement with parking restrictions.
• The decision-makers very considerably underestimate this willingness. They believethat only 51% are prepared to agree to enlarging the pedestrian zones, only 48% areprepared to accept restrictions on car traffic and only 36% are willing to see parkingrestrictions.
The question of course does arise as to why the citizens of these countries do not behave in acorresponding manner. The difference between collective reason and individual reason isevident here:in a group, at a strategic level, the citizens are quite able to recognize the superior interest astheir own interest and to decide accordingly - in questionnaires or in referendums. As anindividual, when leaving the house early in the morning, only individual reason applies: asaving of 10 minutes or the greater convenience of using the car results in a decision in favourof this form of transport. Only when this has no immediate advantages (no available parkingspaces, travelling time longer than with local public transport, more stress, etc.) owing tosuperior (individual decisions) does the attitude change, giving way to greater insight. No onewould then seriously suggest replacing taxes with voluntary donations. We know very wellthat the fundamental (collective) view that taxes must be paid is not sufficient to overcome theshort-term individual advantage of using the money for something "more intelligent".

Light Rail –experiences from Germany, France and Switzerland
92
The misjudgement of the citizens opinion and the underestimation of the citizens' collectivereason by politicians and experts was corrected in Zurich by the necessary referendum: thecitizens rejected projects for new roads and multi-store car parks and they refused investmentcredit for underground local public transport systems (underground tram, metro). On theother hand - contrary to the recommendation of the town council - they agreed with the publiccampaign which demanded giving priority to trams and buses in the existing road system and,by constructional and operational measures, ensuring that they are able to travel from stop tostop without delays, without interference from the car traffic and at the technically feasiblespeed.
The instrument of the referendum is very clearly responsible for the fact that transport policyin Zurich differs from that in towns where elected representatives of the public determinewhat happens. Brög (kleine Fibel) has an explanation for this phenomenon too:representatives of the citizens, politicians, are generally men aged between 20 and 60 andhence belong to that quarter of the population which uses the car to an above-average extentof 66% (average for all citizens 40%) and makes only 30% of journeys by public transport orbicycle or on foot (average for all citizens 49%). Expressed more simply, the quarter ofcitizens who travel by car at above-average frequency also make the decisions and, becausethey use their own needs as a measure of the needs of all citizens, they decide in favour of cartraffic.
Second massage from ZurichThe future of urban transport policy lies not in expansion but in the intelligent use of theexisting traffic areas. The objective of ensuring mobility for people when travelling to workand shopping and during leisure time requires imaginative urban traffic management based onmodern information technology.
In a city, there will always be a shortage of space for traffic owing to the apparentlyunstoppable growth of private motor traffic with its enormous need for space. The expansionof these traffic areas through the extension of roads and car parks or the construction of newones is extremely expensive and takes place at the expense of economically useful areas or ofopen spaces and is therefore in competition with other basic values of the citizen. If thetraffic areas cannot be expanded, the popular request is not fully met. Coming to terms withthis problem without economic and ecological losses means urban traffic management.Figure 8 impressively shows the different space requirements of 240 people who travel towork or to the shops by various means of transport. A tram transports about 8000 people perhour on one track, and a bus about 4000. Ten and five tracks, respectively, are required fortransporting the same number of people in cars. Trams or buses do not occupy parking spacesin the inner city. An employee who travels to work by car occupies twice the useful areathere compared with someone who uses public transport: like himself, his car requires about25 m2.
These physical facts explain why the growth in road systems and the construction of car parkscannot solve the traffic problem in the city. Accessibility for employees and visitors can beensured only when a decisive proportion uses space-saving public transport.If, as decided by referendum in Zurich, the citizens as taxpayers do not find it reasonable toreplace the trams with expensive underground railways or find it more attractive if trams andbuses travel through the urban streets in daylight in the interests of short walking distances,the high density of stops and high frequency in the timetables, the first requirement in the

Light Rail –experiences from Germany, France and Switzerland
93
management of the valuable traffic area is the priority for public transport in the existing roadnetwork.
Numerous analyses of the hindrance of trams and buses indicate three technical/operationalinstruments of urban traffic management, which permit this priority:
• Free travel, unhindered by private traffic, between the junctions with the creation ofindividual routes and separate bus lanes.
• Maximum preference for public transport at the junctions controlled by traffic lightsthrough real-time detection of trams and buses with the aim of ensuring "Waiting TimeZero" for public transport.
• Introduction of the tram- and bus-operation control system so that, on the one hand,the drivers are continuously informed about their timetable situation and can thereforeadhere exactly to the timetable, and so that, on the other hand, the operations controlcentre is always informed about deviations from the timetable and faults and canintervene in a corrective and helpful manner with prepared measures.
Travel unhindered by private traffic between junctionsThe measures under this heading must ensure that trams and buses can overtake slow-movingor stationary lines of cars and quickly reach the next junction, so that the priorities providedthere are effective. Furthermore, it is necessary to avoid the situation where cars turning leftin the free sections or cars pulling out to avoid parked vehicles force trams and buses to brakeor to stop. In Zurich, these measures have to be realized without extending the road area,either by converting an entire road section into a pedestrian public transport only area, or byeliminating the parking spaces along the edge of the road or by structural redesign of the roadcross section with a separate track, etc. With this objective in mind, the following measuresare among those implemented over the past twenty years: parking and stopping prohibited in17 road sections. 41 bans on left turn in roads with tram routes. 72 "Give way" signs atintersections in roads carrying bus and tram traffic. 21 kilometres of bus lanes. About 40building projects, such as islands for bus and tram stops, separate tracks, pedestrian zoneswith trams and buses, multi-track systems, bus lanes, etc. 2 newly constructed sections forextending a tram line by 2 and 6.4 km, respectively, with a separate track throughout.
Maximum preference for public transport at traffic lightsModem urban traffic management requires not only clear priorities in the allocation of theavailable traffic areas but also modern operating systems which manage these areas andalways maintain them in a state which permits maximum movement. A novel traffic lightoperating system is of key importance.
A very special traffic light operating system designed for active management of the limitedtraffic area was developed and set up in Zurich over the past twenty years. Typically, thework is carried out not by transport engineers but by electrical engineers that work accordingto the principles of operations research. The Zurich traffic light operating system requiresabout five times more hardware and five times more software than system usually installed incomparable European cities. 14 process computers, 2 central coordination computers and over3000 SESAM detectors in the road surfacing permit completely dynamic signal programswitching. The controllers do not contain any fixed signal plans but merely conditions relating

Light Rail –experiences from Germany, France and Switzerland
94
to safety and priority. The signal sequence will be calculated at each point in time - on-line -on the basis of the many pieces of information from the detectors. All traffic lights arecontrolled centrally: the computers control 7 areas, each in a duplex system and with about 60traffic lights. The traffic lights are combined in small groups of varying size and shape,depending on the traffic situation and are internally coordinated in terms of time.
Between these intersection groups are back-up spaces (intermediate storage areas) whichmake the groups independent of one another with regard to time. Coordination in terms ofquantity is always guaranteed, to such an extent that the flow towards an overloaded group isrestricted whereas the flow towards a poorly used intersection group is promoted. A centralmaster computer coordinates the 14 area computers and serves in particular for storage ofoperational data, detection of system faults and continuous counting of the traffic volumes.Furthermore, the master computer serves to revise continuously the control programs, whichcan then be loaded into the traffic computers via the cable network connecting all trafficlights.
Conventional traffic light controllers serve two purposes: traffic safety and optimisation of theefficiency of an individual junction or of a group of junctions combined to form a green zone.If the traffic light operating system is to fulfil the objectives of urban traffic management, thefollowing requirements also apply:
• Prevention of "overcrowding" of the road network by continuous counting of traffic areaby area and metering of access to maintain the mobility of cars at a stabilized level. Everyhousewife knows that a washing machine must not be completely filled if a good result isto be achieved. The same applies to the urban road network.
• Preferential treatment of trams and buses through constant readiness to give them prioritywithout delay when they arrive.
• Taking into account the importance of pedestrians by keeping pedestrian waiting timesshort.
• Continuous possibility of observing program sequences centrally and making programchanges centrally and without great effort, so that it is possible to react rapidly andexpediently to roadworks, diversions or traffic conditions altered in some other way.
Unfortunately, such an operating system cannot be simply bought, set up and left to functionby itself. Industry offers no such controls at this time. They have to be developed afresh forevery city; set up step-by-step and then operated. A very decisive factor is that one body inthe city should be responsible for the entire operating system, including the fixed road signalsand signs: planning, design, construction and operation are so closely intertwined that apermanent group - in Zurich there are 22 people, including 6 programmers - must beemployed. The traffic light operating system set up in Zurich meets the requirementsdescribed to a high degree. It is very clearly superior to traffic light operating systemsconventionally installed. Although the same traffic lights are present in the roads, they switchon the basis of more wide-ranging objectives and more complex, refined technology and witha result, which is evidently different.

Light Rail –experiences from Germany, France and Switzerland
95
The tram- and bus-operation control systemThe second modem operating system is a high-quality management instrument with which theTraffic Manager can talk to every driver and to the passengers in every tram and every bus.The master computer of this system knows where these are located to an accuracy of 10 m.However, all the timetables are stored in the system, so that it is always clear whether avehicle is travelling according to the timetable or, if not, how great the difference in thetimetable is. The comparison of the actual and ideal situations is communicated continuouslyto every driver in his vehicle. He is therefore able to monitor himself. Conformity to thetimetable and hence regularity can thus be considerably improved.
The tram- and bus-operation control system permits efficient fault management. The controlcentre has two manned, central positioned trams and five buses distributed over the networkand can use these to replace a late or missing vehicle in the correct position in the timetable.Where accidents, processions, demonstrations, etc- block sections, the control centre ordersdiversions and - if required - organizes operation with extra buses as a replacement. Inaddition, the police, ambulances and technical assistants can be summoned very quickly whenrequired. The aim of all measures is to eliminate faults rapidly and to limit their effects sothat as few uninvolved people as possible have to suffer from them. The informationprovided for the passengers in the vehicles and at the most important stops of the Zuri-Lineover loudspeakers connected to the control centre should not be forgotten.
In order to be able to maintain continuous operation of the tram network when sections areblocked or during authorized processions in the inner cities, some additional set-vice tracks,i.e. branching facilities, diversion sections and turning loops, were constructed. Thus,operations control is flexible and can also order diversions for the tram network.
With the tram- and bus-operation control system, the journeys by the vehicles can be storedand can be described in terms of certain evaluation criteria. These serve, for example, as abasis for the timetable or for evaluating trouble spots. Investigations of the situations beforeand afterwards show the effectiveness of improvement measures of a constructional ororganizational type. The line and travel time files are also used for the timetable generationprogram, the results of which in turn forms the basis of the service plan generation programand the service plan disposition and salary bonus program.
Third massage from ZurichWith regard to urban transport policy, economy and ecology are by no means contradictory.Zurich is living proof of the fact that a transport policy, which promotes public transport at theexpense of private motor transport, results in considerable economic development of the city.
The urban transport policy must provide optimal conditions for the development of theeconomy. It is vital to ensure accessibility for employees and visitors in sufficient numbersand under attractive conditions and to enable freight transport to be conducted economically.Whether the visitors come by car or by public transport is unimportant for the economicdevelopment of the city; a decisive factor is that they come and are restricted as little aspossible in their freedom of movement. Unfortunately, it has been found again and again thatprivate motor traffic bas a tendency to stifle itself. If its volume is not stabilised at a level,which corresponds to the efficiency of the urban road network (cf. washing machine), theresult is congestion, and accessibility is no longer guaranteed.

Light Rail –experiences from Germany, France and Switzerland
96
The transport policy must also ensure that, when providing mobility, the negative effects onthe environment do not exceed a tolerance level. Ecology in its widest sense means anenvironment worth living in, an environment that brings joy to the majority of those affectedand in particular does not make them ill. Unfortunately, private motor transport is rapidlyreaching the limit of tolerability from this point of view too. Although certain adverse sideeffects can be suppressed by technical measures, for example NOx emission by means ofcatalysts, however atmospheric pollution, noise, the danger of accidents, etc. are unacceptablefor the environment in the case of a major proportion of private motor traffic. The transportpolicy chosen in Zurich by the citizens themselves is clearly more advantageous from thepoints of view of ecology, quality of life and leisure time value. The greater the number ofpassenger journeys combined into large vehicles of the local public transport system the lowerthe risk of accidents, the less space required and the lower the level of emissions, and thehigher the quality of the environment and the quality of life and of leisure time in the city.Less private motor traffic with the same or better accessibility means:
• Greater safety in traffic, less danger for children and the elderly,
• Less noise in residential areas and along important street sections,
• Roads and squares are used to a greater extent for social activity and play and are not socluttered with cars from other districts,
• Better air quality and less danger to the health.
From economic points of view, it is first necessary to consider the benefit of mobility. Thereis no doubt that benefits can be obtained from an increase in mobility. It is just as clear thatthis increase gives rise to costs. Figure 1 shows how benefits and expenditure change with anincrease in mobility: the benefits initially increase sharply and subsequently level off.
Figure 1. Cost and benefit of mobility. Source Prof. Rotach, ETH Zurich.
The expenditure shows the opposite behaviour: the initial increase in mobility costs littlewhereas further increases require higher and higher expenditure. If the two curves aresuperposed, it is evident that there is a region in which the cost/benefit ratio is optimal. Toillustrate the cost/benefit ratio, three different approaches are shown Figure 2 in whichinitially the benefits in terms of the number of people transported are compared with the costsin money. Figure 2 shows that the cost/benefit ratio - expressed in francs per person per hour- is about six times more advantageous for an underground railway and almost ten times more

Light Rail –experiences from Germany, France and Switzerland
97
favourable for a tram system on a separate route than the corresponding ratio for an urbanmotorway.
Figure 2. Cost and benefit ratio expressed in £/person per hour.
Figure 3 shows that the cost-benefit ratio for the development measures is eight times moreadvantageous for trams and buses and four to five times more favourable for the suburbanrailway than for the urban motorway network.
Figure 3.Cost and benefit ratio expressed in £/person per hour.
In Figure 4, it is assumed that all eight cities compared had the same conditions about 20years ago: historic city centre, increasing concentration of jobs in the city centre and privatetraffic reaching the limits. All eight cities had a well developed tram network and had thesame aim, which they have since achieved: the creation of an attractive reliable local publictransport system. The three largest cities, Munich, Stockholm and Vienna, constructedunderground railways, which was unavoidable in view of the large numbers of passengers tobe transported. Four cities constructed light rail systems, which are comparable to tramsystems in their transportation capacity but travel in tunnels in the city centres and leave thetraffic space in the inner city road free for private motor traffic. The existing tram networkswere removed. Zurich remained loyal to the tram and gave it priority in the allocation of theroad area and in the operation of the traffic lights (and did the same for buses).

Light Rail –experiences from Germany, France and Switzerland
98
Figure 4. Cost/benefit ratio comparison between different cities.
Even with all the problems of this comparison, it is quite clear that the investments in localpublic transport in Zurich have resulted in an excellent cost/benefit ratio with comparablequality of service: 4 - 11 times better, based on the passengers, and 2 - 6 times better, basedon the residents, than in the case of the cities compared.
Economic data provide a valid answer to the question as to whether the transport policy issuccessful. And – surprisingly (?) - this answer is extremely positive for the City of Zurich.The economic strength of this city is unaffected.
• The Zurich land prices - which are a reliable yardstick for the profitability per unitarea - are among the highest in the world.
• Switzerland has one of the highest gross national products; Zurich can be shown to beresponsible for a significant part of this.
• The people of Zurich pay the state 30% of the gross national product in taxes andsocial security contributions. The inhabitants in neighbouring states on the other handpay over 40%. Note: Transport policy is paid for from taxes.
Final considerationsThe transport policy of the City of Zurich may be regarded as a model of an economic,environment friendly transport policy for a city with a population of half a million. Therequirements of the Environment Protection Law and clean air regulations need no revisionbut consistent further development. The policy is based on management of the existing roadsystem with clear preference for tram and buses, for which "unhindered travel without delaysbetween the stops" is ensured and preferential treatment of pedestrians. It is the result of along political process and is based on a freely chosen restriction of the requirements of privatemotor traffic in the interests of superior political objectives.
The fact that it is necessary to set limits to the free market economy in urban traffic and thatthe "free" car traffic destroys not only one's own freedom but also the quality of theenvironment and the economy are not new discoveries. Not so well known was the fact that,when backed up by the necessary political will and modern technology, the good old tram is avery up-to-date means of public transport which is very particularly valued by the passengers.

Light Rail –experiences from Germany, France and Switzerland
99
The Zurich model of an economic, environment-friendly transport policy proves that theredistribution of road areas and of green time at traffic lights in favour of trams, buses andpedestrians is not only an aesthetic idealistic aim but also a well-founded materialisticobjective of a modern urban transport policy.

Light Rail –experiences from Germany, France and Switzerland
100
Appendix 12 - Karlsruhe Model attracts world-wide interest
The successful Karlsruhe track-sharing experience -- with light rail vehicles sharing DB(Deutsche Bahn) tracks with heavy rail traffic -- has attracted interest from far beyondGermany.During 1984/1985 "track-sharing" by light rail and heavy rail vehicles in the Karlsruhe regionwas investigated in an initial study sponsored by the German Ministry for Research(Bundesforschungsministerium). This triggered the development of the so-called KarlsruheModel.
This consists of three components- A vehicle equally able to use regional DB tracks and light rail tracks in the city centre- Connecting DB tracks to a tramway system, in the case of Karlsruhe, an existing network- Building new stops on existing heavy rail lines which can be served without extendingjourney times, thanks to the improved acceleration of light rail vehicles.
The ultimate aim is to create direct connections without passengers having to change vehicles,as every interchange causes modal split losses making the public transport system lessattractive. Converting this idea to reality did not prove easy during the years, which followedthe initial studies, especially where the suitability of light rail vehicles -- in particular theirsafety -- on DB lines had to be proved.
These problems have been solved in the last years. Light rail services using DB tracksbetween Karlsruhe and Bretten commenced in September 1992 and the scheme has been ahuge success, with a 500 % increase in passengers. Since the establishment of the KarlsruheVerkehrsverbund (KVV) in 1994, light rail vehicles are now operating in a preliminary phaseon DB's Karlsruhe-Bruchsal, Bruchsal-Bretten, Karlsruhe via Rastatt to Baden-Baden, andKarlsruhe-Wörth routes. And DB AG has made its own rolling stock investment in theproject, acquiring four dual-mode GT8/2S vehicles, which it operates alongside those ofKarlsruhe public transport operators VBK and AVG.
The Karlsruhe Model has attracted much interest both within Germany and beyond,prompting other cities to explore its potential. When considering the model, a fundamentalquestion must be asked: does the region already have direct connections to the city centrewithout passenger interchange?
For large conurbations such as Frankfurt, München or Stuttgart for example, where there isalready a metro in the shape of S-Bahn services, the Karlsruhe Model is less suitable.However, in large urban areas such as London or Paris, the implementation of tangential linesto connect regional sub-centres can be of interest.
Transferability does not mean adopting the Karlsruhe Model in all respects: the basic idea ofproviding through connections should be adapted to the specific conditions of the region. Useof the regional railway infrastructure and the linking of regional and city transport is what allprojects have in common. The basic concept is the key: solutions must be adapted to specificlocal conditions.
Adopting the model is ideal where standard gauge tracks exist in the city as well as thesurrounding region, and where the regional lines are electrified. However, this position does

Light Rail –experiences from Germany, France and Switzerland
101
not always apply: quite a number of cities abandoned their tramway networks in the 1969sand are building new systems.
This may not be the disadvantage it might seem, as existing infrastructure can often be moreof a hindrance than help. Even where other track gauges are in use, the Karlsruhe Model canbe applied, for example linking meter-gauge tram networks and local lines. If different gaugesexist, as is the case in Ulm, with a small city centre network, gauge conversion can beconsidered. In other cases, 3-rail tracks will allow the sharing of existing lines, a solutionapplied in Genève. Even 4-rail tracks can be used to combine heavy rail clearance restrictionswith 2.3m-wide low floor vehicles, as the Kassel-Baunatal line demonstrates.
The Karlsruhe dual-mode vehicle is the first of its kind on the market. Without doubt low-floor developments will follow. Both the dual-mode vehicles for Saarbrucken and thoserecently ordered for Karlsruhe are examples of this. Both will be partly low-floor, and thelast-mentioned will be equipped with a bistro-restaurant in the panorama middle section.Vehicle length and width can be selected according to specific conditions in the area, and thisflexibility allows a city with a medieval centre, like Graz, to consider the Karlsruhe Model.
The type of power to be used is not fixed. Initial developments for a battery/direct currentvehicle were abandoned due to a lack of suitable battery technology. A hybrid diesel/directcurrent vehicle is a potentially attractive solution for regions with little or no electrification. InKarlsruhe, the development of such a dual-mode vehicle has just started. Differing powersystems in various European countries also require suitable solutions. Lastly, a power pack asis being used in Chemnitz could also be a solution for non-electrified lines.
Since 1990/91, following the success of the Karlsruhe-Bretten project, the transferability ofthe Karlsruhe Model has been actively discussed not only in Germany, but also in otherEuropean countries.
In these difficult financial times for cities and regions all over Europe, the use of existing andlittle-used tracks is preferable to the construction of new and often parallel tram lines. Thishowever is dependent on local transport operators not having to pay track access chargeswhich make the use of existing infrastructure more expensive than using their own newly-built lines.
The Karlsruhe experience has certainly been positive, and there are already several follow-upschemes in Germany:- Saarbrucken is the most advanced system. Implementation started in 1995 and the first linehas gone in service in autumn 1997.- Heilbronn, a city of only 120 000 residents, will follow during the next few years. With only8km of newly constructed tracks through the city centre, the light rail system will gain accessto some 200 km of regional DB lines.- Aachen took the political decisions to develop a scheme in the summer of 1995.- Kassel is to use the tracks of a private railway with low-floor vehicles and 750V-dcelectrification. A special solution here is the use of 4-rail tracks at stations to allow low-floorplatforms outside of heavy rail clearances.- Chemnitz will use low-floor light rail vehicles equipped with a power-pack for use on non-electrified regional DB lines.- Dresden, with a gauge of 1,450mm, is investigating the possibilities of track sharing withDB by widening the latter's standard gauge tracks.

Light Rail –experiences from Germany, France and Switzerland
102
Kiel, Osnabrück, Paderborn, Rostock and Ulm are other German cities where the GermanModel has been an issue during studies, but where no political decision has been taken so far.Meanwhile, elsewhere in Europe, the model is being discussed in several countries, Austrianprojects in Graz and St-Pölten have not yet been sufficiently developed for a definiteassessment, but first steps have been made. What is possible for DB should not be a problemfor ÖBB.
In Great Britain, the question of track sharing is being discussed for a number of schemes,such as Cardiff, the Medway Valley in Kent, Newcastle and Nottingham. The railwayauthorities seem to change their attitudes to the concept. In a country which private funding isthe key term for public transport projects, and where German financing methods such as thelocal authorities transport-financing act (GVFG) are admired, the best possible use of existinginfrastructure should be the first priority.
In France a few years ago SNCF discussed the use of the Karlsruhe Model in internal papersand confirmed its feasibility for certain selected lines. A number of cities and regions -- suchas Ile de France, Marseille, and Valenciennes -- are beginning to think about this concept. Inthe Netherlands, studies into mixed tram and heavy rail use are being carried out in the Rijnand Bolenstreek region covering Alphen, Gouda, Leiden and Nordwijk. Similar work is beingdone in the border region around Maastricht, Heerlen and Kerkrade, which lies close toAachen.
The state and city of Luxembourg has already decided to follow the Karlsruhe Model byintroducing a new light rail system in the city centre and connecting this with the nationalCFL rail network. In view of frontier traffic into France, Germany and perhaps Belgium, amulti-mode vehicle will be one of the characteristics of this project.
Interest in the Karlsruhe Model has also been shown in Norway and Sweden as well.Examples where the initiative has come from national railways are more the exception thanthe rule, but Slovenian Railways' interest in such a scheme for Ljubljana is one instance. Soonother national railways operation is not only a matter for city transport authorities or non-national undertakings.Compared with other solutions, the Karlsruhe Model seems to be a particularly attractivealternative for medium-sized cities and for regions of 200,000 to 500,000 inhabitants.

Appendix 13. Direct and Indirect pollution for different transportation modes
103
NHMC Emission
0 50 100 150
1
3
5
7
9
Tra
nspo
rtat
ion
mod
e
%
IndirectDirect
Direct 83 48 8 5 2 1
Indirect 56 52 23 16 4 7 4 9 61 36
1 2 3 4 5 6 7 8 9 10
0000
CO2 Emission
0 50 100 150 200
1
3
5
7
9
Tra
nspo
rtat
ion
mod
e
%
IndirectDirect
Direct 28 63 31 19 0 0 0 0 125 80
Indirect 12 37 12 10 7 18 17 38 30 15
1 2 3 4 5 6 7 8 9 10
1. Motorbike2. Car3. Bus4. Coach5. Trolleybus6. Tram7. Express Train8. Regional Train9. Short distance jet plane10. Long distance jet plane Car = 100 % = 200 g/Pkm CO2
1. Motorbike2. Car3. Bus4. Coach5. Trolleybus6. Tram7. Express Train8. Regional Train9. Short distance jet plane10. Long distance jet planeCar = 100 % = 1.12 g/Pkm

104
NOx Emission
0 50 100 150 200
1
3
5
7
9
Tra
nspo
rtat
ion
mod
e
%
IndirectDirect
Direct 19 75 125 65 0 0 0 0 136 58
Indirect 3 25 16 14 6 28 14 32 35 19
1 2 3 4 5 6 7 8 9 10
1. Motorbike 2. Car 3. Bus 4. Coach 5. Trolleybus 6. Tram 7. Express Train8. Regional Train 9. Short distance jet plane 10. Long distance jet planeCar = 100% = 0.74 g/Pkm


![Outline Concepts for Trams South London[1]](https://img.dokumen.tips/doc/110x75/55cf862d550346484b950b55/outline-concepts-for-trams-south-london1.jpg)