Embed Size (px)
Citation preview

Mastering Near-Real-Time Telemetry and Big Data: Invaluable Superpowers for Ordinary SREs
Ivan IvanovSr. CDN Reliability EngineerNetflix Open Connect

● 137M subscribers (Q3 2018)● 190 countries● 1,000s of devices types

DATA PLANEOpen Connect
ContentDeliveryNetwork
CONTROL PLANE
STREAMNETFLIX DEVICE

before streaming starts = control plane =

streaming = data plane = Open Connect CDN

Q: What is a Content Delivery Network?
A: Geographically distributed content servers attached to networks
+a way of routing requests to the closest (and/or best performing)
server / network path

Open Connect CDN
A NETFLIX ORIGINAL

Netflix Open Connect CDN● Purpose built for Netflix use case● Globally distributed sites/pops (1,000s of locations)● Connecting directly to residential ISP networks
(>95% of our traffic is directly connected)● Highly optimized commodity hardware● Purpose built Open Connect backbone
https://openconnect.netflix.com/

Design goals● Use of open source software● Ability to efficiently read from disk and write to network sockets● High-performance HTTP(S) delivery● Ability to gather routing information via BGP
Components● Operating System: FreeBSD-CURRENT - https://www.freebsd.org● Web Server: NGINX - http://nginx.org ● Routing Intelligence Proxy: BIRD internet routing daemon -
https://bird.network.cz Performance ● “Serving 100 Gbps from an Open Connect Appliance”
https://medium.com/netflix-techblog/serving-100-gbps-from-an-open-connect-appliance-cdb51dda3b99
Open Connect Appliance - Software


Service Reliability & Quality of Experience (QoE)

Quality of Experience (QoE)Video Quality
<200kbps video bitrate >2Mbps video bitrate

Netflix Data Platform
CDN telemetry system implemented on top of Netflix Data Platform:● Data warehouse with many PB (petabytes) of
data● Hundreds of billions of events/day● Available for use as self-service internally● More detailed information available online in
presentations and blog posts...
https://medium.com/netflix-techblog/tagged/big-data

Lumen
Atlas UI
Servers
Clients
Cache Control Service & Log Ingestion❏ Health❏ Status❏ Routability❏ Assets❏ Stats❏ Logs❏ Events
Client Telemetry❏ Events❏ QoE❏ Errors
Big Data API
Atlas Query Layer
Data Sources Ingestion & Transformation Data Hub / Storage Processing Engines UI & API
High Level Data Flow Diagram Big Data Portal

● Multi-dimensional● Near-real-time (latency in the range of couple of minutes)● Self-service● Engineered for performance and scale
○ In-memory storage (fast)○ Data stored in S3
● UI for browsing data and constructing queries● URL friendly stack language● Dashboards & Alerts
https://medium.com/netflix-techblog/introducing-atlas-netflixs-primary-telemetry-platform-bd31f4d8ed9a
https://github.com/Netflix/atlas
Atlas as a Platform for Time-Series Data

● Stats collected and uploaded by all servers● Hundreds of counters
○ Network / memory / CPU Utilization...○ Request per second (RPS) ○ HTTP Status Codes○ Interface Errors○ Bytes per protocol type (IPv4 vs IPv6)○ Disk related counters○ ….
● Main platform for all NRT stats collection & visualization
● UI - alerts & dashboards● API - programmatic access
Atlas: CDN Related Data

● Easy to use: simple self-service dashboards in minutes!
● Consumes various data sources● Variety of visualization options● Support for variables & filtering● Very useful for aggregation of data on
various layers
Lumen: Custom, Self-Service Dashboarding
https://medium.com/netflix-techblog/lumen-custom-self-service-dashboarding-for-netflix-8c56b541548c

Main NRT (near-real-time) data platform usage: ● Multi-dimensional (limited cardinality) time series in Atlas + Lumen● “Event-like” data in Elasticsearch + Kibana - event data with high level of
verbosity available for search & visualization● Limited time frame (purely practical reasons)
Big Data platform:● Large quantities of verbose data from server and client logs● Longer term storage needs for some of this data (months, years, or
“forever”) ● The need to aggregate and join data from various sources
Longer Term Multi-Dimensional Data: Aggregation, Queries & Visualization

● Main data hub and source of truth in S3 + Hive metastore ● Big data transformations and queries via:
○ Scheduled background asynchronous jobs; ETL; etc… - in Hive and Spark
○ Presto - mostly for interactive queries and data extracts● Tableau - visualization layer; scheduled reports; dashboards● Let’s take a look on some examples next...
Longer Term Multi-Dimensional Data: Aggregation, Queries & Visualization
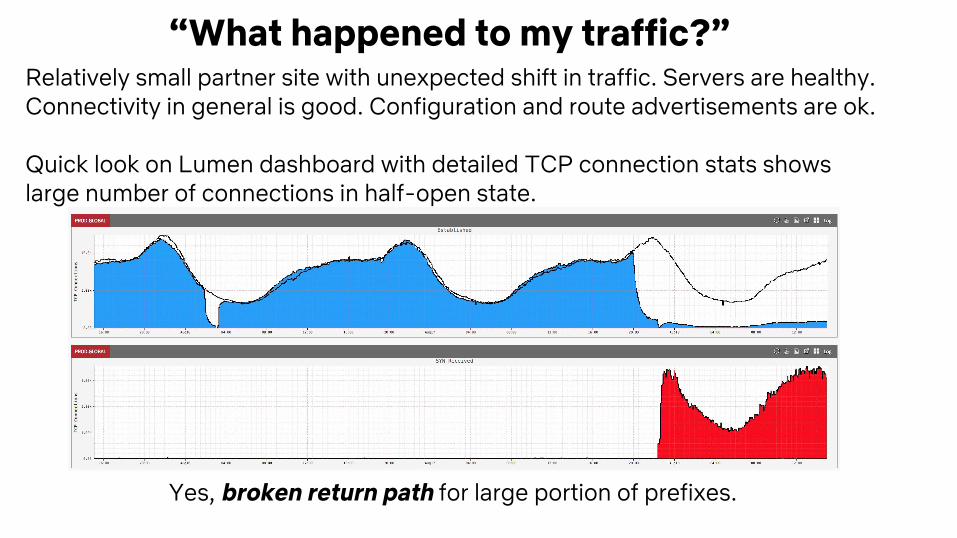
Relatively small partner site with unexpected shift in traffic. Servers are healthy. Connectivity in general is good. Configuration and route advertisements are ok.
Quick look on Lumen dashboard with detailed TCP connection stats shows large number of connections in half-open state.
“What happened to my traffic?”
Yes, broken return path for large portion of prefixes.

We had an earlier case of site migration in one of our facilities. Peering and traffic for multiple partners migrated from the old location to a new location in the same area.During the migration, as part of validation we identified noticeable degradation in performance, but only for a small subset of ASNs (Autonomous System Numbers). Hmmm… sooo, something, somewhere is not right, but what exactly?● Server related issues? - Nope● Increase in retransmits? - Nope● Physical connectivity or bad optics/patch panel/cables? - Possibly; but not
likely since there is no increase in interface errors ● So, something else?
Site Move

How about latency?
Site Move
Yes, clearly. Closer look on network path shortly after that uncovered incomplete network configuration on one of the partner peering links.

Tableau + Big Data ● Dashboards and reports based on aggregated data from different sources● Usually based on scheduled Tableau data extracts done daily/hourly (as
needed)● Very few cases (for lightweight queries) directly - e.g. Presto connection● Very helpful for long term traffic trends, utilization, capacity, error trends,
forecasting, modeling, hardware status and failures, etc…
Example - daily aggregation of data for encoding changes overtime for specific device category

Fade InYou are on-call. Customer support team is pinging you about increased volume of calls from customers of XYZ ISP, with specific category of devices intermittently failing to start playback with error code 1234:
“Are you aware of any current issues that could cause this?” You:
“Hmmm... not really, but let me take a look... Yes, so everything looks green on my side. It’s gotta be something outside of our network. Can we get some more details - sample client IPs, HTTP or possibly Wireshark captures?
Customer Errors -fictional screenplay based on past events
Well, this can take a while. Maybe you can proceed with Stage 2 of the investigation in parallel...

1. Use your psychic abilities to identify and locate impacted customers2. Run (or fly) really fast, ring the doorbell, introduce yourself, use your
smartwatch/phone/tablet/laptop to take the captures.3. Analyze the captures, correlate the data, identify the issue.4. Mitigate the issue. 5. Fix the root problem.
Customer Errors - Stage 2, Option 1
Well… if you only had such superpowers. You will need to wait... or maybe there is another option...
5.a. (optional) If the problem is fiber cut use your laser vision to quickly splice the damaged fiber cables.

1. Launch a new real-time query on top of Mantis stream-processing platform that selects the desired client events for devices from the desired category scoped to the ASN in question
Customer Errors - Stage 2, Option 2
*Mantis post: https://medium.com/netflix-techblog/stream-processing-with-mantis-78af913f51a6
2. Couple of minutes later you have the first verbose data in UI and Elasticsearch.3. Five minutes later you have enough data points to see the common pattern and identify the issue - bad connectivity between specific IP ranges outside our network and subset of servers in a specific location.4. Mitigate the issue - reroute traffic in scope away from the impacted servers.

Good! We fixed the problem!
But wait... to be in this situation is not really “good”:
TTD (Time to Detect): unknown… possibly couple hours??TTR (Time to Recover): ~10-12 min
So, we will need to make the client server communications for this data flow more resilient. In parallel, for the next time when something like this happens we need to improve:● Already have a job running all the time, that collects data for such issues and
stores it in Elasticsearch● Make a Kibana dashboard that shows the data and allows search;
visualizations, etc…● Implement an Atlas metric, and trigger alert based on it when this happens● Consider implementing auto-mitigation
Customer Errors - Epilogue

Customer Errors - Epilogue
TTD (Time to Detect): 2-3 minTTR (Time to Recover): ~5-6 min (*when actionable on service side)

● Near-real-time collection and aggregation on data from all applicable layers - fundamental requirement for having the complete end-to-end picture of your environment
● Capability to correlate related events from different sources - extremely helpful for really getting the holistic view of your service
● Use of real time data processing technologies can help you minimize TTD and TTR
● Longer term trends of aggregated & correlated data over long periods of time (days, months, years) will allow you to see the big picture easier, help you identify slower moving trends (see the “Boiling frog” fable), and also plan for future events.
● In case if you already have some of these technologies available in your environment, but you are not using them as part of your toolset, please go ahead and try to start using them. They can help a lot!
● I realize that you may not have these capabilities available at your disposal today, but this could be something that you can consider implementing in the future. Cloud computing vendor of your choice can help you to get this done.
Takeaway

Questions?

Thank you