Embed Size (px)
Citation preview

MASTERARBEIT / MASTER’S THESIS
Titel der Masterarbeit / Title of the Master‘s Thesis
Argumentative Reasoning and the Sunk Cost Fallacy
The influence of reason-based choice and the confirmation bias on investments in failing endeavours in financial decision making
verfasst von / submitted by
Ina Ho Yee Bauer, BA
angestrebter akademischer Grad / in partial fulfilment of the requirements for the degree of
Master of Science (MSc)
Wien, 2016 / Vienna, 2016
Studienkennzahl lt. Studienblatt / degree programme code as it appears on the student record sheet:
A 066 013
Studienrichtung lt. Studienblatt / degree programme as it appears on the student record sheet:
Joint Degree Programme MEi:CogSci Cognitive Science
Betreut von / Supervisor:
Mitbetreut von / Co-Supervisor:
Ass.-Prof. Dr. Christoph Eisenegger
Ass.-Prof. Christophe Heintz, PhD


Abstract 3
Abstract
Objective: This study aimed to investigate the social environment triggering psychological
mechanisms at the origin of the Sunk Cost Fallacy. The hypothesis was that an argumentative
context favouring reason-based choice leads people to be more affected by a confirmation bias
which in turn causes this cognitive bias. Method: Eighty participants in the role of managers
took two financial investment decisions of which the first one always resulted in negative out-
comes. The Sunk Cost Fallacy was measured by the propensity in the second round to invest in
the same department as in the first round. In a between-group design participants either anony-
mously submitted their decisions in voting boxes or justified their decisions to an audi-
ence. Results: Many participants in the audience condition either invested nothing to the failing
department (“I made a mistake”) or allocated equal amounts (rewarding and fair behaviour, hope
of a turnaround), whereas in the anonymous condition allocations of five or fifteen million dol-
lars out of twenty were preferred. Participants in the audience condition decided on salient points
of investments more often and specific reasons underlay their investments. Although there was
no significant difference between second investments in the two conditions, correlations between
questionnaire answers and second investments indicated a relationship between the failure to
update beliefs and second investments in the audience condition only. Conclusions: In an argu-
mentative context participants take justifiable decisions. Results on the role of the confirmation
bias are ambiguous. A follow-up experiment on decision making in hierarchical versus egalitar-
ian groups is recommended.

4

Kurzfassung 5
Kurzfassung
Zielsetzung: Der Fokus der Studie lag auf dem Einfluss des sozialen Umfelds auf psychologi-
sche Mechanismen, welche der Sunk Cost Fallacy zu Grunde liegen. Die Hypothese war, dass
ein argumentativer Kontext die Wahl rechtfertigbarer Entscheidungen begünstigt was zu einem
Bestätigungsfehler führt. Dieser verursacht die kognitive Verzerrung. Methode: Achtzig Teil-
nehmerInnen in der Rolle von Managern trafen zwei finanzielle Investitionsentscheidungen, wo-
bei die erste immer zu negative Resultaten führte. Die Sunk Cost Fallacy wurde an der Neigung
gemessen in der zweiten Runde in die gleiche Abteilung zu investieren wie in der ersten. Teil-
nehmerInnen reichten ihre Entscheidungen entweder anonym in Wahlboxen ein (anonymous
condition) oder rechtfertigten sie gegenüber einem Publikum (audience condition). Resultate:
Viele TeilnehmerInnen in der audience condition investierten nichts in die scheiternde Abteilung
(„Ich habe einen Fehler gemacht“) oder ließen beiden Abteilungen gleich hohe Anteile zukom-
men (belohnendes und faires Verhalten, Hoffnung auf positive Umkehr). In der anonymous con-
dition hingegen wurden Allokationen von fünf oder fünfzehn von insgesamt zwanzig Millionen
Dollar präferiert. Zudem entschieden sich TeilnehmerInnen in der audience condition öfter für
Investitionspunkte welche die Aufmerksamkeit auf sich zogen. Bestimmte Gründe standen hinter
ihren Investitionsentscheidungen. Obgleich es keine signifikante Differenz zwischen den Investi-
tionen in den beiden Konditionen gab, deuteten Korrelationen zwischen Fragebogen-Antworten
und Investitionsentscheidungen daraufhin, dass nur in der audience condition zweite Investiti-
onsentscheidungen und das Misslingen eigene Überzeugungen zu verändern in einer Beziehung
zueinander standen. Schlussfolgerungen: In einem argumentativen Kontext treffen Teilnehme-
rInnen rechtfertigbare Entscheidungen. Resultate betreffend der Rolle des Bestätigungsfehlers
sind nicht eindeutig. Ein Folge-Experiment über Entscheidungsfindung in hierarchischen versus
egalitären Gruppen wird empfohlen.

Kurzfassung 6

Acknowledgements 7
Acknowledgements
I want to thank my supervisor, Christophe Heintz, for making this work possible and his invalu-
able advice throughout the process of conducting this thesis. I also want to thank the people of
the Cognitive Science Department at the Central European University for welcoming me as an
intern and especially the lab managers for their support in organisational matters of the experi-
ment. Thankful words shall also go to the Mei:CogSci team from the University of Vienna for
providing education in and dedication to Cognitive Science and Christoph Eisenegger for being
my formal supervisor. I want to express my gratitude towards my parents for their invaluable
support reaching beyond this thesis work. I also want to thank my friends and special people in
my life for their continuous support.


Table of Contents 9
Table of Contents
Abstract ............................................................................................................................ 3
Kurzfassung ..................................................................................................................... 5
Acknowledgements .......................................................................................................... 7
Table of Contents ............................................................................................................ 9
List of Figures ................................................................................................................ 11
List of Tables .................................................................................................................. 12
List of Abbreviations ..................................................................................................... 13
1. Introduction ............................................................................................................... 15
1.1 The Sunk Cost Fallacy as a cognitive bias ........................................................... 15
1.2 Debated determinants of the Sunk Cost Fallacy .................................................. 16
1.3 Hypothesis and its rationale ................................................................................. 19
1.3.1 Reason-based choice ............................................................................................ 20
1.3.2 Argumentative theory of reasoning ..................................................................... 21
1.4 Predictions ............................................................................................................ 23
1.4.1 Audience Effect ................................................................................................... 23
1.4.2 Experimenter Demand Effects ............................................................................. 24
2 Method ................................................................................................................ 26
2.1 Participants ........................................................................................................... 26
2.2 Procedure ............................................................................................................. 26
2.3 The D&A Financial Decision Case ...................................................................... 27
2.3.1 The first decision .................................................................................................. 28
2.3.2 The second decision ............................................................................................. 29
2.4 Variables .............................................................................................................. 30
2.4.1 Dependent variable .............................................................................................. 30
2.4.2 Independent variables .......................................................................................... 30
2.5 Questionnaire ....................................................................................................... 34
2.5.1 Likert-scale questions .......................................................................................... 34
2.5.2 Open questions ..................................................................................................... 37
2.6 Data analysis ........................................................................................................ 38
2.6.1 Quantitative analysis ............................................................................................ 38
2.6.2 Qualitative analysis .............................................................................................. 38
3 Results ................................................................................................................. 39

Table of Contents 10
3.1 Results on the first prediction – Reason-based choice ........................................ 39
3.1.1 Extreme versus intermediate investment decisions ............................................. 39
3.1.2 Salient points of investment ................................................................................. 40
3.1.3 Association between investments and reasons in the audience condition ........... 40
3.2 Results on the second prediction – Confirmation bias ........................................ 46
3.2.1 Second investments in the two conditions ........................................................... 46
3.2.2 Questionnaire results on the second prediction ................................................... 48
3.3 Results on situations in which the Sunk Cost Fallacy is likely to occur ............. 51
3.3.1 Correlations between questionnaire answers and second investments ................ 51
3.3.2 Factors behind the Sunk Cost Fallacy proposed in previous studies ................... 52
3.3.3 Satisfaction with the first decision and opinion change over time ...................... 53
4 Discussion ........................................................................................................... 55
4.1 Discussion of the results ...................................................................................... 55
4.1.1 Results on the first prediction – Reason-based choice ........................................ 55
4.1.2 Results on the second prediction – Confirmation bias ........................................ 58
4.1.3 Circumstances under which the Sunk Cost Fallacy is likely to occur ................. 60
4.1.4 Role of the experimental setting for investment decisions .................................. 62
4.2 Limitations ........................................................................................................... 62
4.3 Impact and practical applications ........................................................................ 63
4.4 Outlook ................................................................................................................ 64
References ...................................................................................................................... 67
Appendix A – Instructions ........................................................................................... 71
Anonymous condition ..................................................................................................... 71
Audience condition ......................................................................................................... 82
Appendix B – Results .................................................................................................... 92
Appendix C – Comparison to the study by Staw (Staw, 1976) ................................. 97
Appendix D – Data analysis ......................................................................................... 99
Analysis of the audio recordings ..................................................................................... 99
Post-hoc matching ......................................................................................................... 100
Correlations between second investments and questionnaire answers ......................... 102
Regression models ........................................................................................................ 106
Comments from participants ......................................................................................... 107
Summary (Extended Abstract) .................................................................................. 109
Zusammenfassung (Extended Abstract in German) ............................................... 111
Curriculum Vitae ........................................................................................................ 113

List of Figures 11
List of Figures
Figure 1: Variable overview ........................................................................................................ 30
Figure 2: Setup in the audience condition ................................................................................... 31
Figure 3: Setup in the anonymous condition ............................................................................... 33
Figure 4: Modes differ in the anonymous and the audience condition ....................................... 39
Figure 5: Distribution curve and its segments ............................................................................. 41
Figure 6: Reasons underlying second investments in the audience condition based on
the audio data ................................................................................................................... 42
Figure 7: Investments of participants expecting or hoping that the data might change in
the future .......................................................................................................................... 46
Figure 8: Histograms with plotted normal curves ....................................................................... 47

List of Tables 12
List of Tables
Table 1: Frequency table of second investments ........................................................................ 40
Table 2: Correlations between second investments and questionnaire answers differing
in the two conditions ....................................................................................................... 48
Table 3: Regression model predicting investments in the anonymous condition ....................... 49
Table 4: Regression model predicting investments in the audience condition ........................... 50
Table 5: Correlations between second investments and questionnaire answers which
are similar in the two conditions ..................................................................................... 52
Table 6: Correlations between second investments and factors proposed in previous
studies .............................................................................................................................. 52
Table 7: Decision making in hierarchical and egalitarian groups ............................................... 65
Table 8: Investment decisions and answers to likert-scale questions of participants in
the anonymous condition ................................................................................................ 93
Table 9: Investment decisions and likert-scale answers of participants in the audience
condition .......................................................................................................................... 95
Table 10: Similarities and differences to the study by Staw ....................................................... 97
Table 11: Matched pairs ............................................................................................................ 100
Table 12: RMS differences of questionnaire answers .............................................................. 101
Table 13: Correlations between second investments and questionnaire answers in the
anonymous condition .................................................................................................... 102
Table 14: Correlations between second investments and questionnaire answers in the
audience condition......................................................................................................... 103
Table 15: Initial regression analysis in the anonymous condition ............................................ 106
Table 16: Initial regression analysis in the audience condition ................................................ 106

List of Abbreviations 13
List of Abbreviations
An. Anonymous condition
Aud. Audience condition
B Regression coefficient (unstandardized)
SE B Standard error of B
β Standardized regression coefficient
CP Consumer products department
D Test value of the Kolmogorov-Smirnov test for normality
EDE Experimenter Demand Effect
F F-ratio (regression model)
IP Industrial products department
K-S Z Two-sample Kolmogorov-Smirnov Z test value
M Mean
Mdn Median
Mio. Million
n Number of participants in subsample
N Total number of participants in sample
ns Not significant
p Probability value (significance value of a test)
r Effect size estimate
rs Spearman’s rank correlation coefficient
R² Coefficient of determination
RMS Root mean square
R&D Research and development
SCF Sunk Cost Fallacy
SD Standard deviation
sig. Significant
SP Salient point of investment

List of Abbreviations 14
t Test value of a t-test (regression model)
T Test value of the Wilcoxon’s signed-ranks matched-pairs test
U Test value of the Mann-Whitney U test
€ Euros
$ US dollars
% Percentage
< Less-than sign

1. Introduction 15
1. Introduction
1.1 The Sunk Cost Fallacy as a cognitive bias
Neoclassical economic theory has depictured the individual actor as a “homo economicus”, char-
acterized by being “self-interested” and “outcome-oriented”, having “exogenously given and
determinate preferences” and “a rate of time preference that allows him to allocate consumption
over time in a consistent manner” (Gintis, 2000, p. 312). Experimental Economists, applying for
instance game theory, laboratory experiments, and field observations as tools (Gintis, 2000),
have proven the limitations of this model: Human decision making “violates the axioms of deci-
sion theory” as humans are “hyperbolic rather than exponential discounters of benefits and costs”
and show cooperative rather than solely self-regarding behaviour (Gintis, 2000, p. 313). Standard
economic theory was built on the assumption of perfect use of information, but as Herbert Simon
pointed out, an organism only possesses “limited information and limited computational facili-
ties” (Simon, 1956, p. 129). Bounded rationality is not necessarily “an inferior form of rational-
ity” and the application of “so-called fallacies” can be seen as “reasonable strategy under plausi-
ble assumptions about the environment” (Gigerenzer & Selten, 2002, p. 6). Nonetheless, much
experimental evidence has been gathered (e.g., Kahneman, 2003b) suggesting that deviance from
rational behaviour in the neoclassical sense in human decision making can also lead to biases
which can result in negative outcomes for an individual.
The Sunk Cost Fallacy (SCF) forms such a class of irrational decisions. This cognitive bias has
been defined by Arkes and Blumer:
This effect is manifested in a greater tendency to continue an endeavor once an invest-
ment in money, effort, or time has been made. The prior investment, which is motivating
the present decision to continue, does so despite the fact that it objectively should not in-
fluence the decision. (Arkes & Blumer, 1985, p. 124)
Instances of the SCF can be encountered in everyday situations: Lewis Broad, a student of
Thaler, for example measured that more food was consumed in an all-you-can-eat pizza restau-
rant by customers who had to pay for their food in comparison to those who got it free of charge
(Thaler, 1980). In this experiment, the refund and the non-refund group were composed of cus-
tomers who had already taken the decision of entering the restaurant. Therefore, the cost of the
lunch should not have been considered anymore in deciding on the amount of food to consume
since they represented sunk costs. Eating more slices in the non-refund group to get a good value
for the money only led to overeating, not to a recovery of the sunk costs as Frank pointed out
(Frank, 2008). Being a seemingly trivial example, serious problems emerge out of the SCF if it
occurs in the context of management or governmental decision making in which big quantities of
resources or even lives are at stake. An illustrative example is the argument of supporters of the

1. Introduction 16
Vietnam War. They claimed that the war should not end before the “total victory” because this
“would have meant the waste of those lives already lost” (Arkes & Blumer, 1985, p. 126).
1.2 Debated determinants of the Sunk Cost Fallacy
Under various names, as for example “sunk cost effect” (Thaler, 1980, p. 47), “escalation of
commitment” (Staw, 1976, p. 41), “entrapment” (Brockner, Rubin, & Lang, 1981, p. 68), “too
much invested to quit” (Teger, 1980, p. 1), this phenomenon has been studied for more than 35
years with the goal to understand its cognitive foundations. As I will discuss in this section, the
theories offer valuable information on the determinants of the Sunk Cost Fallacy, but questions
remain open.
In 1980 Thaler argued that the SCF could be explained through Prospect Theory (Thaler, 1980),
which had been developed earlier by Kahneman and Tversky (Kahneman & Tversky, 1979). The
value function of Prospect Theory depicts that, once an investment has been made which resulted
in negative outcomes, the “pain”, as Thaler termed it, of further loosing is smaller than the
“pleasure” of comparable gains (Thaler, 1980, p. 48). Therefore, a person, who has already made
an investment which led to negative outcomes, is more likely to choose a risky option than a
person who did not invest yet. In addition, a “certainty effect” is at work: If there is a possibility
that an investment becomes less negative in the future, this long-term option will be preferred
over a certain loss as “certain losses are particularly aversive” (Arkes & Blumer, 1985, p. 132).
Left open is the question why people remain hopeful that an endeavour, which resulted in nega-
tive outcomes in the past, could lead to positive outcomes eventually. Even if future investments
would lead to gains, the sunk costs would remain irrecoverable.
Arkes and Blumer focused on another aspect of the SCF which Prospect Theory failed to answer:
They argued that Prospect Theory described the fact that “sure losses are so aversive and sunk
costs are so difficult to ignore” but not why this is the case (Arkes & Blumer, 1985, p. 132).
They hypothesized that people are irrationally taking sunk costs into consideration because oth-
erwise the lost money would be rendered wasted (Arkes & Blumer, 1985). They gathered evi-
dences for this theory of wastefulness through experiments with college students from Ohio and
Oregon, which became standard scenarios used for a variety of consecutive experiments on the
SCF (e.g., Garland, 1990; Soman & Cheema, 2001; Putten, Zeelenberg, & Dijk, 2010). In one of
their experiments, to give an example, they sold different types of theatre tickets to students wan-
ting to buy a season ticket for the Ohio University theatre: The first type provided a two dollars
discount, the second one a seven dollars discount and the last type was sold at the normal price
of fifteen dollars. Results showed that those students who did not get a refund went to the theatre
significantly more often than both refund groups during the first half of the season (Arkes &
Blumer, 1985). Researchers continue to study wastefulness as a determinant of the SCF to date.
One example is a study by Haller and Schwabe who applied functional magnetic resonance im-
aging to examine the role of wastefulness. The desire not to appear wasteful (based on the an-
swers of participants provided on their desire not to appear wasteful) was shown to be associated

1. Introduction 17
with increased activation of the dorsolateral prefrontal cortex (dlPFC) which plays a role in rule-
and norm-based decision making, of the amygdala, associated with emotions and framing ef-
fects, and of the anterior cingulate cortex (ACC), which is linked to conflict processing. Brain
imaging results depictured a decreased activation of the ventromedial prefrontal cortex (vmPFC),
and the nucleus accumbens if participants had made a prior investment. Both areas had been
shown to be involved in the integration of costs and potential gains. The activation of the dlPFC
was negatively correlated to vmPFC activation. The authors interpreted from the data that the
rule not to waste resources, associated with the activation of the dlPFC, can override the activity
of the vmPFC, which is linked to costs and benefits calculations (Haller & Schwabe, 2014).1
Although the theory of wastefulness added valuable insights to the theory of loss aversion it can-
not answer under which circumstances concerns about wastefulness appear and lead to the SCF.
The question when a misapplication of the rule occurs is left open.
Staw, who published his work almost at the same time as Arkes and Blumer, introduced self-
justification as an alternative theory aiming to clarify the determinants of the SCF. Staw claimed
that “only self-justification would predict an interaction of personal responsibility and decision
consequences such that increases in commitment would be even greater than the additive effect
of these two separate factors” (Staw, 1976, p. 30). Using a 2 x 2 factorial design he manipulated
both of these factors. In a financial decision case subjects had to decide on the allocation of re-
search and development funds for the hypothetical “Adams and Smith Company”. For the first
decision half of the participants were asked to decide whether to invest ten million dollars in the
industrial products department or the consumer products department (high personal responsibil-
ity condition). The other half was told that another financial officer has made the decision (low
personal responsibility condition). In each of the two conditions, half of the participants obtained
data depicting the negative consequences and the other half data showing the positive results of
the initial decision. For the second decision they were asked to make another investment choice,
but were provided with 20 million dollars which they could divide in any way they wished
among the departments. The dependent variable was the amount of money spent in the second
decision on the initially chosen, failing department. Staw obtained results providing evidence
that self-justification indeed plays a major role for the SCF: Investments of participants in the
high personal responsibility and negative consequence condition (with an average investment of
13.07 million dollars) were significantly higher than those of participants in the other three con-
ditions (with average investments between 8 and 9.50 million dollars) (Staw, 1976). Nonethe-
less, the study by Staw does not explain why people do not choose rational arguments to justify
themselves. Instead of investing more, participants could argue that under conditions of uncer-
tainty they could not have predicted that their decision would lead to negative outcomes.
An interdisciplinary study supported both the theory of wastefulness and self-justification. Arkes
and Ayton first researched upon decision making in animals: In the realm of Cognitive Biology
1 The study by Haller and Schwabe (Haller & Schwabe, 2014) also illustrated how the Sunk Cost Fallacy can be
studied in different disciplines relevant for Cognitive Science, in this case Neuroscience.

1. Introduction 18
the SCF was studied under the name “Concorde Effect” but mostly independently from other
fields. As Arkes and Ayton pointed out, there is much literature on both the Concorde Fallacy
and the SCF, but both fields seemed to be rather ignorant of the existence of the other:
Researchers have used the term Concorde fallacy to refer to the tendency of lower ani-
mals to commit the sunk cost effect. We have found no published paper in the human
judgment/decision-making literature that cites any of the extensive literature on the Con-
corde fallacy, and we have found no published paper in the animal literature that cites the
sunk cost effect. (Arkes & Ayton, 1999, p. 591)
Based on the study of literature published on the Concorde Effect, Arkes and Ayton claimed that
there is no unambiguous evidence for the existence of the phenomenon in animals.2 In the second
step, they looked into studies on children. As a result of their analysis and comparisons of studies
by Kahneman and Tversky (Tversky & Kahneman, 1981), and Baron et al. (Baron, Granato,
Spranca, & Teubal, 1993) on the SCF as well as Krouse (Krouse, 1986) and Webley and Plaisier
(Webley & Plaisier, 1998) on mental accounting, they concluded that adults commit the SCF
more often than children. Arkes and Ayton presented two explanations for adults committing the
SCF more often than both animals and children: First, adults are more likely to use abstract rules.
Children and animals are not aware of the rule to avoid wasting. Therefore, they do not fall into
the danger of its overgeneralization. Second, adults are under social pressures which lead to the
desire to appear consistent and to justify own behaviour (Arkes & Ayton, 1999). Arkes and Ay-
ton hereby referred to studies on reason-based choice by Simonson (Simonson, 1989), suggest-
ing that humans sometimes choose the most justifiable rather than the most rational choice, and
to studies on self-justification by Brockner (Brockner, 1992), Fox (Fox & Staw, 1979), Ross
(Staw & Ross, 1978), and Staw (Staw, 1976). The authors emphasized that adults are under “so-
cial psychological pressures” which play a major role for the occurrence of the SCF (Arkes &
Ayton, 1999, p. 597). Arkes and Ayton thus add to self-justification theory and the theory of
wastefulness by taking social pressure and reason-based choice into account. Nonetheless, their
findings cannot explain why adults base subsequent decisions on the same reasons as their first
decision which led to negative consequences. Why adults do not choose different reasons for
justifying their second decision thus remains unanswered by this study.
With questions left open by the major theories developed during the early stages of research, the
study of the determinants of the SCF continues to the present day. Soman and Cheema, for ex-
ample, studied whether a “windfall gain”, i.e. an unexpected monetary gain received during the
time of the decision, can weaken or eliminate the SCF (Soman & Cheema, 2001, p. 52). Results
by Strough et al. suggested that age has an influence: The likelihood of committing a SCF was
lower in older adults (58 to 91 years) than in younger adults (18 to 27 years) (Strough, Mehta,
McFall, & Schuller, 2008). Garland and Newport found that relative (“dollars in proportion to an
2 Nonetheless, the existence of the Concorde Effect is still debated. A recent study, for example, yielded results
suggesting that pigeons are biased towards choices in which previous investments had been made (Magalhaes &
White, 2014).

1. Introduction 19
overall project budget”) instead of absolute amounts of sunk costs (“dollars”) were taken into
consideration. This supports the idea that humans keep mental accounts, where “existing invest-
ments are compared with reference states” (Garland & Newport, 1991, p. 55).
In 2012 Sleesman and colleagues presented a meta-analysis aimed to provide an overview on the
state-of-the-art of the research on the SCF (Sleesman, Conlon, McNamara, & Miles, 2012). They
categorized 166 articles published in 35 years of research into four main categories which had
been previously defined by Staw and Ross: Project, psychological, social and structural determi-
nants (Staw & Ross, 1987). The results of the quantitative meta-analysis by Sleesman et al. indi-
cated that a main driver of escalation behaviour is the psychological determinant “ego threat”:
Maintaining one’s own reputation yielded the highest sample-size weighted average correlation
(correlation coefficient of .378, n = 391) among all determinants tested (Sleesman et al., 2012, p.
551). 3 Their résumé was that researchers have laid their focus mainly on psychological and pro-
ject determinants, with social and structural determinants being not sufficiently researched upon.
They stated that group contexts lack attention and that “social context is a vastly underrepre-
sented area in the escalation literature in spite of its significance in organizations” (Sleesman et
al., 2012, p. 557).
1.3 Hypothesis and its rationale
The aim of my study was to contribute to the research on the “underrepresented” social factors
behind the SCF (Sleesman et al., 2012, p. 557). Nonetheless, the focus was not laid on social
determinants only since social and psychological determinants are necessarily entangled. Hu-
mans in most cases do not take decisions in isolation but in social environments. My study fo-
cused on the social environment triggering psychological mechanisms at the origin of this bias
and offered an alternative hypothesis regarding the determinants of the SCF: Situations favour-
ing reason-based choice, i.e. choosing the most justifiable rather than the most rational choice
(see section 1.3.1), leads people to be more affected by a confirmation bias (see section 1.3.2.),
which in turn causes the SCF. This is because people who feel a need to justify their own choices
come up with reasons. After the first decision, while looking for reasons for the second decision,
they fall prey of a confirmation bias, because the reasons for their first decision remained salient.
The newly acquired information, by contrast, tends to be disregarded since they look as refuta-
tions of the good reasons one came up with for the first decision. To test the hypothesis I con-
ducted an experiment with two conditions as will be discussed in the Methods section. In the
audience condition self-justification needs were enhanced relative to an anonymous condition
through audience presence and the need to state reasons. The scenario used was an adaptation of
the one which had been applied in the above described study by Staw on the role of self-
justification for the SCF (Staw, 1967). Predictions will be discussed in section 1.4 after having
3 Note. An overview table can be found in “Cleaning up the big muddy: A meta-analytic review of the determinants
of escalation of commitment” by D. J. Sleesman, D. E. Conlon, G. McNamara and J. E. Miles, 2012, Academy of
Management Journal, 55 (3), p. 551. Copyright by the Academy of Management.

1. Introduction 20
clarified reason-based choice and the argumentative theory of reasoning on which this hypothe-
sis was grounded.
1.3.1 Reason-based choice
In the late 1980s the theory of reason-based choice was proposed. According to this theory, hu-
mans do not always tend to select the most rational choice but under specific circumstances the
most justifiable one. Previous studies by Simonson indicated that, although applied not only for
interpersonal purposes, but also in order to convince oneself, reason-based choice is more likely
to occur if a need for justification is anticipated (Simonson, 1989). The theory of reason-based
choice can explain phenomena which are deemed irrational by classical decision theory, as for
example extremeness aversion or asymmetric dominance effects (Shafir, Simonson, & Tversky,
1993). Various experiments have proven that the preference for an option depends on its position
within a choice set. Huber, Payne and Puto, for example, discovered that, given two choices, the
better option was perceived as being more attractive if the worse choice was also presented
(Huber, Payne, & Puto, 1982). Similarly, Simonson and Tversky experimentally demonstrated
that, given the choice of monetary reward or a free pen, the introduction of the option of a
cheaper pen increased the number of participants choosing the more expensive pen by ten per-
cent in comparison to conditions in which the third option was not presented at all (Tversky &
Simonson, 1993). Value-based choice cannot explain these phenomena of context dependency of
preferences. Reason-based choice, on the other hand, offers an explanation: A reason for choos-
ing the more expensive pen was generated by introducing an inferior option. The introduction of
the better pen made the choice easier to explain, defend and justify (Shafir et al., 1993). This
explanation was supported by findings indicating that asymmetric dominance effects are en-
hanced if individuals anticipate a justification need to others (Simonson, 1989). In the audience
condition of my experiment I exactly operated on this increased application of reason-based
choice elicited by anticipated justification needs. The prediction was that reason-based choice
would be applied more often in the audience condition than in the anonymous condition as rea-
son-based choice is more likely to occur under social pressure (Shafir et al., 1993).
Reason-based choice is often not in line with value-based choice as for example an experiment
by Shafir and colleagues showed: They obtained results suggesting that more than half of a
group of students would choose to go on vacation as a reward for passing an exam. Even more
students would decide to do so if they failed, in order to consulate themselves. Therefore, it
would be rational to buy a vacation package, which is on promotion only for a limited time, even
without knowing the results of the exam. Nonetheless, given that the exam results were un-
known, only one third of the students stated that they would buy the tickets. 61% of the students
decided that they would pay five dollars in order to postpone the decision until the exam results
would be known. As Shafir and colleagues argued, paying for non-instrumental information
makes justification of the choice easier, but could be deemed irrational since the students would
have bought the vacation package independently of whether they failed or passed (Shafir et al.,

1. Introduction 21
1993). They concluded that “it appears that people often do not have well-established values, and
that preferences are actually constructed – not merely revealed – during their elicitation” (Shafir
et al., 1993, p. 34). Although reason-based choice can explain phenomena which value-based
choice cannot, they pointed out that reason-based choice does not “replace value-based models
of choice” (Shafir et al., 1993, p. 35).
My hypothesis was that the SCF is a possible instance of irrational decision making caused by a
confirmation bias resulting from reason-based choice. According to the argumentative theory of
reasoning – developed recently by Mercier and Sperber – reason-based choice should occur par-
ticularly often if people have only weak intuitions about a choice (Mercier & Sperber, 2011).
Uncertainty is a common feature in real-world management situations and reflected in the study
design by Staw in which it is explicitly communicated to participants that they should be able to
make a good decision with the limited information provided (Staw, 1976). I predicted that rea-
son-based choice would occur more often in the audience condition than in the anonymous con-
dition. Experiments by Norton and Thompson supported this prediction by demonstrating that
individuals preferred products with many features under conditions of public choice. On the
other hand, if they had to use the products in public, they chose products containing less features
(Thompson & Norton, 2011). These findings, along with the research on reason-based choice
described above, indicate that, anticipating a justification need to an audience, individuals would
decide on justifiable options.
1.3.2 Argumentative theory of reasoning
Mercier and Sperber introduced the argumentative theory of reasoning claiming that the function
of reasoning is to “devise and evaluate arguments intended to persuade” as, from an evolutionary
perspective, humans are relying to an exceptionally high extent on the communication of correct
information (Mercier & Sperber, 2011, p. 57). They argued that biases occurring through com-
mitment are not necessarily accounting for limited decision making capacities in humans but
conclude that reason-based choice is well-adapted in the sense that it allows individuals to search
“for arguments that support a given conclusion, and, ceteris paribus, favor conclusions for which
arguments can be found” (Mercier & Sperber, 2011, p. 57). According to Mercier and Sperber
human decision making can be explained by a dual-process model, but not in the classical sense,
i.e. by distinguishing between effortless intuition (system 1) and reasoning (system 2) as had
been proposed by Kahneman and Tversky (Daniel Kahneman, 2003a). Instead, Mercier and
Sperber argued that individuals always reach conclusions unconsciously through the production
of inferences which generate “intuitive beliefs” (Mercier & Sperber, 2011, p. 58). These intuitive
beliefs lead to conscious conclusions. In addition, “reasoning proper” emerges, which is charac-
terized by “the awareness not just of a conclusion but of an argument that justifies accepting that
conclusion” (Mercier & Sperber, 2011, p. 58). Mercier and Sperber distinguished between, first,
an “epistemic decision that we take at a personal level” (accepting an argument because it is “in-
tuitively strong enough”) or “personal-level mental action” (i.e. to “construct a complex argu-

1. Introduction 22
ment by linking argumentative steps, each of which we see as having sufficient intuitive
strength”) and, second, “what is commonly and traditionally meant by reasoning” (Mercier &
Sperber, 2011, p. 59). By this second type the authors referred to the act of producing arguments
and to verbally express these to convince others of the rightfulness of the conclusion. Impor-
tantly, the authors regarded reasoning as “a public action that we consciously undertake”
(Mercier & Sperber, 2011, p. 59). According to this dual-system theory, the decision making
process in the anonymous condition might consist of a personal epistemic decision or a “per-
sonal-level mental action” (Mercier & Sperber, 2011, p. 59) but not of reasoning. Only in the
audience condition reasoning would be elicited through the need to state reasons to the experi-
menter.
In my experiment the combination of audience presence and the need to state reasons in the au-
dience condition put participants in a position in which an argument supporting the (uncon-
sciously generated) conclusion had to be publically expressed. I predicted that this would lead to
greater average investments to a failing endeavour due to a confirmation bias. This bias has been
defined by Nickerson as the “seeking or interpreting of evidence in ways that are partial to exist-
ing beliefs, expectations, or a hypothesis in hand” (Nickerson, 1998, p. 175). Mercier and Sper-
ber claimed that the term “confirmation bias” has been used for two different phenomena: First,
for the absence of reasoning proper. Individuals believe in the positive consequences of their
intuitive beliefs and, therefore, do not reason if there is no need to argue. In this sense, a confir-
mation bias could also occur in the anonymous condition, but Mercier and Sperber pointed out
that this phenomenon expresses trust in one’s own beliefs and cannot be regarded as a real con-
firmation bias (Mercier & Sperber, 2011). Second, the term confirmation bias has been used to
describe the tendency of individuals to overlook evidences and arguments going against their
own claims and focusing on those supporting their conclusion. This “genuine confirmation bias”
(Mercier & Sperber, 2011, p. 64) derives from the attempt to convince others of the rightfulness
of one’s own conclusion. Thus, this type of confirmation bias will not lead an individual to fa-
vour confirmation in general but only evidences that confirm their own claims. Mercier and
Sperber predicted that this type of confirmation bias would only occur in argumentative settings
and only when producing, not evaluating, arguments (Mercier & Sperber, 2011).
I predicted that in my experiment a confirmation bias would only occur in the audience condition
in which an argumentative setting was provided. The first decision would be based on partici-
pants’ intuition, especially since they only got limited information which was assumed to lead to
uncertainty. I expected that the second decision would be based on the initial, intuitive model,
i.e. the first decision: Participants look for reasons to uphold their initial opinion, not because
they aim to convince themselves of its correctness, but “to be ready to meet the challenges of
others” (Mercier & Sperber, 2011, p. 66). In the audience condition the search for “belief-
bolstering material” (McGuire, 1964, p. 222), a term introduced by McGuire to describe the ten-
dency of individuals to search for evidence supporting their view, should occur more frequently

1. Introduction 23
than in the anonymous condition because participants have already publically stated their opin-
ion during the first decision:
According to the argumentative theory, however, the function of reasoning is primarily
social: In particular, it allows people to anticipate the need to justify their decisions to
others. This predicts that the use of reasoning in decision making should increase the
more likely one is to have to justify oneself. (Mercier & Sperber, 2011, p. 71)
Mercier and Sperber suggested that individuals could become more objective in their reasoning
by distancing themselves from their own opinion and by anticipating objections from others.
Nonetheless, they argued that this attitude is seldom to be found in real-world situations (Mercier
& Sperber, 2011). Therefore, in the control condition I did not create a setting in which partici-
pants were more likely to reflect upon their choice and predict objections, but rather introduced
an anonymous, and importantly, non-argumentative setting.
1.4 Predictions
To test the hypothesis I conducted an experiment with eighty participants in which the effects of
an argumentative setting on investments in a failing endeavour were investigated. In an adapta-
tion of the study by Staw (Staw, 1976) I introduced two conditions: An audience condition in
which participants informed the experimenter – who served as a proxy for an audience – about
their decisions. In addition, the need for argumentation was enhanced by the experimenter’s re-
quest to state reasons and the application of voice recording. In the anonymous condition, by
contrast, decisions were made through the submission of decision sheets in voting boxes. Partici-
pants neither had to reveal their identity nor did they have to interact or state reasons to the ex-
perimenter. The predictions were, first, that in the audience condition reason-based choice would
be applied more often, and second, that the argumentative context would lead to a greater occur-
rence of the SCF by means of enhancing a confirmation bias, because the function of reasoning
is to provide arguments for already held beliefs rather than to update beliefs (Mercier & Sperber,
2011). Therefore, I expected to find that participants in the audience condition, first, choose in-
vestments which are easy to justify and, second, on average invest more money into the initially
chosen, failing department due to a confirmation bias leading to the SCF. The experiment drew
on studies on the Audience Effect (see section 1.4.1). I assumed that audience presence would
contribute to creating an argumentative context because a need for reputation management and
self-justification would be generated. In the next two chapters the Audience Effect and Experi-
menter Demand Effects are discussed as in my study the experimenter served as a proxy for an
audience.
1.4.1 Audience Effect
The Audience Effect (AE) describes the phenomenon that “we behave differently when we be-
lieve ourselves to be observed” (Frith & Frith, 2012, p. 298). This effect has been first reported

1. Introduction 24
by Zajonc, who demonstrated that the mere presence of others is sufficient to increase the
arousal level of an individual. He suggested that presence of others might also play a role for
learning, evaluation of danger, and provides cues for appropriate behaviour (Zajonc, 1965).
Since Zajonc first described the AE, much research has been conducted in the field. It has been
shown that alteration of behaviour due to cues of social observation can happen unconsciously.
Haley and Fessler, for example, demonstrated that dictators in a dictator game allocated on aver-
age more money to recipients – 37.9% of their endowment in comparison to 24.5% in the control
condition – if eye cues were present, i.e. with eyes instead of a university logo on the desktop
screen. This difference was less incurred by participants giving more money to recipients in the
eye cues condition, but emerged from the increased number of participants allocating above
zero: In the eye cues condition twenty-one out of twenty-four participants gave money to the
recipients whereas in the control condition only thirteen out of twenty-five did so (Haley &
Fessler, 2005). This experiment provides evidence that a cue for human presence is sufficient to
increase prosocial concerns. Tennie and colleagues pointed out that the AE is linked to reputa-
tion management:
The audience effect and effects of anonymity are two sides of the same coin, working in
opposite directions. When there is anonymity, and this is often the case with large groups,
it is hard to track individual reputation, and free riders can invade more easily [21]4. Re-
moving anonymity and reinstating an audience will allow reputation to be acquired again,
and will lead to increases in cooperation [135,256]. (Tennie, Frith, & Frith, 2010, p. 484)
In my experiment voice recording was applied to increase concerns about reputation manage-
ment. I assumed that participants would infer that these audio recordings make their decisions
and arguments available over time.
1.4.2 Experimenter Demand Effects
In my study the experimenter served as a proxy for an audience. Experimenter Demand Effects
(EDE) were defined as “changes in behavior by experimental subjects due to cues about what
constitutes appropriate behavior” (Zizzo, 2010, p. 75). Zizzo distinguished between purely cog-
nitive EDE and social EDE. Social EDE always contain cognitive EDE but not vice versa. Purely
cognitive EDE derive from “identifying the task at hand and behaving accordingly, by picking
up clues on what constitutes behavior that is appropriate for the task” (Zizzo, 2010, p. 95)
whereas social EDE “benefit from the perceived social pressure that the experimenter, as an au-
thority, explicitly or implicitly puts on a subject through instructions and cues.” (Zizzo, 2010, p.
79) In my experiment, the anonymous condition only involved purely cognitive EDE. Zizzo ar-
gued that this type of EDE can be disregarded because the beliefs about the objectives of the
4 (Andreoni & Bernheim, 2009)
5 (Fehr & Gächter, 2002)
6 (Milinski, Semmann, & Krambeck, 2002)

1. Introduction 25
experiment, which participants form and behave according to, are uncorrelated to the true objec-
tives (Zizzo, 2010). I assumed that in my experiment subjects might understand that the experi-
ment tests for commitment to an initial decision after negative feedback, but, given that indi-
viduals in different conditions were always tested in different sessions, would not be able to infer
that the experiment investigates the role of argumentation for the SCF.
In the audience condition the appearance of social EDE was triggered purposefully. Social EDE,
similar to the Audience Effect, create social pressure. In the Milgram experiment (Milgram,
1974), for example, the presence of the experimenter seemed to have an influence on subjects’
behaviour similar to effects evoked by real-world situations with a dictator or other authorities
present (Zizzo, 2010). Zizzo argued that an experimenter has both “legitimacy and expertise”
(Zizzo, 2010, p. 77), which are both important factors for social power according to French and
Raven (French & Raven, 1959). In addition, the experimenter creates the working environment
and, therefore, is always in an authorative position relative to the subject (Zizzo, 2010). In the
anonymous condition, on the other hand, I aimed to reduce social EDE by creating the belief that
both decisions could not be connected to each other and that the identity of the participant could
not be identified on the decision sheets. This study design is based on experiments showing that
double-blindness reduces social EDE (Zizzo, 2010). Hoffman et al., for instance, observed that
in double-blind settings self-regarding preferences drastically increase. In a double-blind dictator
game only four out of thirty-six participants gave an endowment of three dollars or more to the
recipients. The authors concluded that the “presence of the experimenter, as one who knows sub-
jects’ bargaining outcomes, can be one of the most significant of all treatments for reducing the
incidence of self-regarding behavior” (Hoffman, McCabe, Shachat, & Smith, 1994, p. 371).
In my experiment, the audience was only a contextual factor which caused a need for argumenta-
tion. Thus, the vertical nature of the relationship between experimenter and participant, the de-
sire of a subject to support the experimenter (Rosnow & Rosenthal, 1997), and the characteristics
of the audience only played a minor role. Important was that in the audience condition an argu-
mentative context was created in which participants faced a person who explicitly asked them to
state reasons while this was not the case in the anonymous condition.

2 Method 26
2 Method
2.1 Participants
Eighty subjects, forty per condition, participated in the experiment which was conducted at the
Central European University (CEU) in Budapest, Hungary. Participants were recruited via the
online CEU Research Participation System7 or directly at the CEU Main Building8. The mean
age of participants was 24.83 years in the anonymous condition and 25.03 years in the audience
condition. Thirty-two participants in the anonymous condition and thirty-four in the audience
condition were students. Out of forty participants nineteen were female in the anonymous condi-
tion and twenty-one in the audience condition. The only selection criterion was sufficient Eng-
lish proficiency. One participant in the anonymous condition had to be excluded because he left
the decision sheets which he entered into the voting boxes blank. An additional participant was
tested to keep sample sizes equal across conditions. Participants were randomly assigned to ei-
ther of the two conditions except for those directly recruited by the experimenter at the CEU
Main Building. These participants were tested in the audience condition to avoid that personal
contact endangers the feeling of anonymity in the anonymous condition. All experiments were
conducted between April and June 2015 in the CEU Somby Lab9 and in the CEU Main Building.
2.2 Procedure
Upon arrival participants were informed about the procedure of the experiment and their tasks:
First, participants were asked to fill out a consent form for psychological experiments, which
guaranteed anonymity in resulting publications, safety during the experiment, and the right to
withdraw from the study at any time. Second, participants were provided with a description of
the task (cover letter). Third, the first financial report, which contained short descriptions of the
two departments and the financial data on sales and earnings of the hypothetical D&A Company
from 1999 to 2009, was handed out. Fourth, participants were asked to take their first decision
either by filling out a decision sheet (anonymous condition) or by explaining their choice to the
experimenter (audience condition). Fifth, participants obtained the results sheet which depicted,
along with the initial financial information, the sales and earnings from 2010 to 2014. Both pos-
sible initial decisions, investments in the consumer products department or the industrial prod-
ucts department, led to a decline in the chosen department in comparison to the other department.
Sixth, participants were asked to make their second decision, again either through a decision
sheet (anonymous condition) or by personally stating and justifying their choice to the experi-
menter (audience condition). Finally, participants were asked to fill out a questionnaire. In addi-
7 https://ceuparticipate.sona-systems.com
8 The CEU Main building is located in Nádor utca 9, 1051 Budapest, Hungary.
9 The CEU Somby Lab is located in Zrinyi utca 14, 1051 Budapest, Hungary.

2 Method 27
tion, a personal data sheet including age10, sex, current profession, background in Economics or
Business11 and experience in Behavioural Economics had to be filled out. Consent form, cover
letter, financial reports, decision sheets, questionnaire, and personal data sheet can be found in
Appendix A. At the end of the experiment a short debriefing session took place in which partici-
pants were informed about the aim of the experiment, the two conditions, deception in the
anonymous condition and that both possible choices in the first decision would have led to nega-
tive consequences.
2.3 The D&A Financial Decision Case
The “D&A Financial Decision Case” is an adaptation of a scenario used by Staw to study the
Sunk Cost Fallacy (Staw, 1976). Although the study by Staw is relatively old, this experimental
design was chosen not only because it has been proven to be appropriate for studying the role of
self-justification for the SCF, but also because it bears the advantage to introduce high personal
responsibility: Participants are not only told what the initial decision was, but take it themselves.
This distinguishes it from other standard scenarios applied to study the SCF (e.g., Arkes &
Blumer, 1985).
The “D&A Company” stands for “Davis & Anderson Company”, which is a hypothetical com-
pany equivalent to the “Adams & Smith Company” in Staw’s study (Staw, 1976, p. 31). The
name was made-up of surnames selected from lists of the most common names in the USA.12
The company name was changed to prevent a too obvious connection to Staw’s study for partici-
pants with experience in Behavioural Economics. Nonetheless, the same numerical values were
used for the financial information provided in first and second decision (compare Staw, 1976 and
instructions in Appendix A). These values did not differ between the two conditions. Although
one might argue that the amount of money should be adapted due to the time span of almost
forty years since Staw conducted his study, the numbers were not increased as the total value
should not play a major role but only the perception that the stakes are high. Differences and
similarities to the study by Staw are listed under “Conditions compared to those of Staw (1976)”
in Appendix B.
In the cover letter participants were asked to play the role of a corporate executive and to take
decisions in the “D&A Financial Decision Case”. They were informed that the company is spe-
cialized on camera technologies. Participants were provided with the company’s financial infor-
mation of sales and earnings of the previous years and a short description of the relevant depart-
ments. They were asked to decide about the allocation of research and development funds. This
10
Age is asked to rule-out the possibility that the mean age is significantly different in the two conditions. This
could be problematic because it has been shown that older adults (58-91 years) commit the Sunk Cost Fallacy
less often than younger adults (18 to 27 years) (Strough et al., 2008). 11
Arkes and Blumer found out that knowledge about the Sunk Cost Fallacy (through textbook and class lectures)
does not lead Economics students to commit this fallacy less often (Arkes & Blumer, 1985). 12
http://www.census.gov/topics/population/genealogy/data/2000_surnames.html

2 Method 28
introduction was followed by task descriptions which differed between the two conditions (Ap-
pendix A)
2.3.1 The first decision
As basis for their first decision participants obtained the sheet “The D&A Financial Decision
Case” (Appendix A). Similar as in the experiment conducted by Staw (Staw, 1976) – with partly
the same phrasing to comply with the study design – participants first obtained information on
the company and task:
The Davis and Anderson Company is a large technologically-oriented firm. As the finan-
cial history including ten prior years of sales and earnings data depict, the company has
started to decline over several preceding years. The directors of the company agree that
one of the major reasons for the decline in corporate earnings and deterioration in com-
petitive position lay in some aspects of the firm’s program of research and development.
Therefore, the directors have concluded that 10 million dollars of additional Research and
Development (R&D) funds should be made available. This money can be invested in one
of the corporation’s two largest divisions: Consumer Products or Industrial Products. For
the time being, only one of the two divisions can receive the additional funding. Please
imagine yourself in the role of the Financial Vice President and decide upon the division
which should receive the 10 million dollars. Make your decision on the basis of the fi-
nancial data and with regard to the potential benefits that R&D funding will have on the
future earnings of the divisions.
This introductory paragraph was followed by descriptions of the consumer products department
(CP) and the industrial products department (see Appendix A). These descriptions were written
specifically for this experiment because the ones used by Staw were not available in the original
paper (Staw, 1976) and including contemporary topics was considered beneficial. The camera
industry was chosen as it is an industry producing products to which laypersons can easily relate
to. With the financial information being very limited, the descriptions should prevent random
choices and add to the feeling of commitment to the initial decision without eliminating uncer-
tainty (for information on the impact of uncertainty for decision making see section 1.3.1 and
Mercier & Sperber, 2011). Both departments were aimed to be equally attractive options.
On the same data sheet the financial information, which was taken from the study by Staw
(Staw, 1976), was provided. The only difference to the material applied by Staw was that nega-
tive numbers were not presented in brackets but through a minus sign (“−“). The financial infor-
mation was identical in both conditions and depicted the decline of both departments in the last
two years (Appendix A). Based on this data participants were asked to make their first decision,
which was to choose whether to invest 10 million dollars of additional research and development
funds in the consumer products department or the industrial products department. The hypotheti-
cal money had to be invested in one department only and could not be split-up. Participants were

2 Method 29
informed that they should take the decision in the role of the Financial Vice President and with
regard to potential benefits for the profitability of the departments in the future.
2.3.2 The second decision
After submitting their first decision, participants obtained the sheet “The D&A Financial Deci-
sion Case 2015”. Participants had already been told at the beginning of the experiment that the
data they would obtain for the second decision would depend on their first decision. It was im-
portant that participants felt responsible for the financial situation at the time of the second deci-
sion. Therefore, four versions (one per condition and initial decision) of the “The D&A Financial
Decision Case 2015” sheet were produced. The experimenter handed-out the appropriate one,
according to the initial choice, in the audience condition. In the anonymous condition partici-
pants were asked to open one of two envelopes (marked with “IP” as an abbreviation for indus-
trial products department and “CP” for consumer products department) depending on their first
decision.
The data sheet started with an introductory paragraph explaining the situation of the company
five years after the first decision and describing the second decision:
Today, five years after the initial allocation of the 10 million dollars of additional re-
search and development funds to the Consumer Products division13, the R&D program of
the Davis and Anderson Company is again up for re-evaluation. The management of the
company is convinced that there is an even greater need for expenditure on research and
development. Twenty million dollars have been made available from a capital reserve for
R&D funding. As the Financial Vice President you are asked to decide upon its proper al-
location. Financial data is provided for each of the five years since the initial allocation
and, as earlier, the investment decision is to be made on the basis of future contribution to
earnings. Please specify the amount of money that should be allocated to either the Con-
sumer Products or Industrial Products division. This time, however, you are allowed to
divide the R&D money in any way you wish among the two major divisions.
On the same sheet the initial (1999 to 2009) and the updated financial data (2010 to 2014) were
provided. The department chosen was always the one declining. It had less sales and earnings
between 2010 and 2014 than the other department. After the 2009 data on the sheet a text box
was depicted which should remind the participant in which department he or she has initially
invested in: “First R & D funding decision as of 2009 – 10 million $ for the … division” (see
Appendix A). This should, on the one hand, make it more salient to the participant that the first
choice led to negative outcomes and, on the other hand, assure him or her that the data provided
for the second decision was dependent on the department he or she has initially chosen to invest
the 10 million dollars in.
13
“Industrial Products division” was written at this place if the participant has initially chosen to invest in IP.

2 Method 30
Similarly to the procedure for the first decision, participants were asked to take the role of the
Financial Vice President and to base their second decision on the financial data with regard to
potential benefits on future profitability of the departments. Nonetheless, there were two major
differences: First, the R&D funding open for allocation consisted of 20 million dollars instead of
10 million dollars. Second, participants could choose how much they wanted to invest in each of
the two departments. As the experiment aimed to clarify why people keep investing in a failing
endeavour, a simple all-or-nothing question in the second decision would have be unsuitable.
Instead, the possibility for participants to split the endowment of twenty million dollars between
the two departments enabled the analysis of investment patterns.
2.4 Variables
2.4.1 Dependent variable
The study aimed to contribute to the research on underlying mechanisms behind the Sunk Cost
Fallacy. The degree to which the SCF has been committed was measured by the amount of
money participants allocated in the second decision to the initially chosen, failing department.
This amount could range from 0 to 20 million dollars. Different than for the initial decision,
which had to be an all-or-nothing-investment, participants could now split the available 20 mil-
lion dollars in any way they wished between the two departments. This design was taken-over
from the experiment by Staw, which had been able to shed light on how “negative consequences
may actually cause decision makers to increase the commitment of resources and undergo the
risk of further negative consequences” (Staw, 1976, p. 27). Although there was no most rational
choice in the scenario, investment patterns could be compared.
2.4.2 Independent variables
As depicted in Figure 1, two conditions were implemented: An audience condition (treatment
group) and an anonymous condition (control group).
Figure 1: Variable overview

2 Method 31
The prediction was that an argumentative context would trigger reason-based choice which
would then lead to a confirmation bias which in turn would cause the Sunk Cost Fallacy. In the
present experiment the need for argumentation was manipulated: It was enhanced in the audience
condition through the presence of the experimenter and the need to justify own choices, and low-
ered in the anonymous condition in which the identity of the subject did not have to be revealed.
The two independent variables were reasoning in front of an audience versus anonymous deci-
sion making.
2.4.2.1 The audience condition
In the audience condition an argumentative context was created. In the audience condition the
experimenter, who was the author of the study, served as a proxy for an audience.
Figure 2 depicts the setup in the audience condition including (from left to right) the consent
form (and beneath it cover letter, personal data sheet and data sheet for the first decision), the
audio recorder to record decisions and arguments of the participants, data sheets for the second
decision and the questionnaire. The data sheets for the second decision were labelled “IP” or
“CP” to assure the participant that the second data sheet was not randomly selected by the ex-
perimenter but corresponded to his or her initial decision.
Figure 2: Setup in the audience condition
The audience condition had five main characteristics:
a.) The identity of the participant was revealed
Participants were asked to state their full name on the personal data sheet. Different than in the
anonymous condition, the personal data sheet had to be filled-out before the two decisions were
made. Therefore, a feeling of personal responsibility was elicited already at the beginning of the
experiment.
b.) The experimenter was present in the room during the whole experiment
The experimenter did not only give the explanation for the task, but stayed in the room with the
participant during the whole experiment. The experimenter was seated in front of a laptop be-
sides or opposite from the participant. Only one participant was tested per session.

2 Method 32
c.) Participants had to personally inform the experimenter about their decisions
Participants were asked to inform the experimenter about their first decision (Appendix A):
If you have made your decision, please go to the experimenter and tell him or her in
which division you would like to invest the 10 million dollars and state the reasons for
your choice.
Based on the initial choice of the participant, i.e. the investment in industrial or consumer prod-
ucts department, the experimenter handed-out the appropriate second data sheet. This data sheet
always depicted negative consequences of the initial choice. The participant was then asked to
make the second investment decision and to approach the experimenter to personally report his
or her choice (Appendix A):
Please decide in the role of the Financial Vice President what amount of money you
want to spend on each of the two divisions. Inform the experimenter about your deci-
sion and the reasons for your choice.
d.) Participants had to state reasons for their decisions
Most importantly for reasoning, which per definition of Mercier and Sperber involves the “men-
tal action of working out a convincing argument” and “the public action of verbally producing
this argument so that others will be convinced by it” (Mercier & Sperber, 2011, p. 59), to take
place, participants were asked to provide the experimenter with reasons for their first and second
investment decisions. This enhanced justification needs and created an argumentative setting
emphasizing the need of reasoning. If participants gave very short or ambiguous explanations for
their choices, the experimenter asked questions for clarification and / or to support participants in
thinking consciously about the reasons for their choice. Reasons had to be stated at the time of
the decisions, not post-hoc.
e.) Audio recording was applied
Participants were informed in the consent form that audio recording might be applied. Addition-
ally, when participants approached the experimenter to make their first decisions, they were
asked for their consent. All participants agreed to have their arguments for the first and second
decision recorded. The audio recordings started when the participant informed the experimenter
about the decision and lasted until the participant stated the reasons he or she wanted to provide.
Before stating the first decision, between the two decisions and after the second decision audio
recording was not applied.
2.4.2.2 The anonymous condition
In the anonymous condition decisions were not reported directly to the experimenter but submit-
ted via voting boxes. This was to avoid that participants feel a need for justification because of
audience presence. Voting boxes were chosen as a tool to increase perceived anonymity as many
participants were expected to have experienced them previously during elections. Several sheets
were placed inside the voting boxes to generate the impression that submissions could not be

2 Method 33
connected to a participant’s identity. If several participants took part in the experiment during the
same session they submitted decisions in the same boxes. Four separated voting boxes were set-
up: The first one for the consent form, the second one for the first decision, the third one for the
second decision sheet and the last one for the questionnaire.
The experiment started with instructions by the experimenter, who then left the room. Then, the
participant submitted the consent form and the first decision sheet in the appropriate voting
boxes. Afterwards the participant opened the envelope “IP” if the first choice had been to invest
in the industrial products department or “CP” if the first choice had been to spend the 10 million
dollars to the consumer products department. The envelope contained the updated financial re-
port. Similar as in the audience condition, the initially chosen department was always the one
declining in comparison to the other department. The envelopes were sealed. Therefore, it was
possible for the experimenter to evaluate afterwards whether the participant opened the correct
envelope. One limitation of this study design was that it involved deception: It was necessary for
the analysis of the data to relate first decision, second decision and questionnaire to each other.
Thus, the experimenter opened the voting boxes after each participant. If several participants
were tested during one session, they obtained pens in different neutral colours before starting the
experiment, to enable sorting the materials per participant. Participants were informed about this
process of deception during the debriefing session which took place at the end of the experiment.
Figure 3 depicts the setup in the anonymous condition including the four voting boxes, consent
form (and beneath it cover letter and data sheet for the first decision), the first decision sheet, the
two envelopes containing the second data sheets (dependent on the first decision), the second
decision sheet and the questionnaire (including personal data form).
Figure 3: Setup in the anonymous condition
The characteristics of the anonymous condition were the following:
a.) Personal data was separated from the decision sheets and no name had to be stated
In the anonymous condition the personal data sheet was part of the questionnaire and therefore
only had to be filled-out after the investment decisions were made. This should enhance the feel-
ing of anonymity during the decision making process. Also, participants did not have to state

2 Method 34
their names. The consent form was put in a separate box from the decision sheets. It was avoided
to recruit participant for this condition personally. An online recruiting tool was used to prevent
much personal contact between experimenter and participant before the experiment.
b.) No audience was present
Interactions with the experimenter only took place before and after the experiment. The experi-
menter left the room after the instructions were provided and met the participant outside of the
lab room after he or she has taken both decisions and has filled-out the questionnaire. Nonethe-
less, participants were told that they could leave the room to ask the experimenter questions. In
some sessions several participants (up to three) were tested during the same session. This was
expected to not interfere with perceived anonymity, but to rather enhance it as participants en-
tered their decision sheets in the same voting boxes.
c.) The second decision sheet was separated from the first one
The two decision sheets were put into separate voting boxes. This should encourage participants
to think that their second decision could not be connected to their initial decision. Therefore,
reputation management should become unnecessary: There is no need to keep-on investing in the
initially chosen, failing department in order to appear as a good decision-maker.
d.) It was not required to state reasons for the decisions
Participants only had to circle the department they wanted to give the 10 million dollars to (first
decision) and write down their allocations (second decision). The experimenter did not have to
be faced for the decisions, no reasons for the choices had to be stated and no questions about the
decisions were asked ad-hoc. The questionnaire offered the possibility to explain the decisions
but only after both decisions had been made.
e.) No audio recording was applied
Different than in the audience condition, no audio recording was applied.
2.5 Questionnaire
In the last part of the experiment participants were asked to fill-out a questionnaire consisting of
likert-scale questions and open questions. General and condition-specific questions were asked.
The questionnaires applied in the two conditions can be found in Appendix A.
2.5.1 Likert-scale questions
The questionnaire included seventeen (anonymous condition) or twenty-four (audience condi-
tion) 5-point likert-scale questions. Participants were asked to select one of five possible an-
swers: “Strongly disagree”, “Disagree”, “Neither agree nor disagree”, “Agree”, “Strongly agree”.

2 Method 35
2.5.1.1 General questions
Most of the questions which were asked in both conditions (= general questions) were based on
previous studies published on the SCF:
“I had a strong desire to complete the started project.”
Keil and colleagues manipulated state of completion and sunk costs in combination (15%, 40%,
65% and 90% of the project completed / overall budget spent) in two conditions (with and with-
out alternative project offered). Thus, the experiment used a 2 x 4 factorial design (i.e. eight
treatment conditions with n = 39). Time was held constant with a six to eight months project
completion period across all treatment groups. They found out that the desire to complete a
started project did play a role no matter if an alternative existed or not. In the questionnaire of
their study participants mentioned the completion effect half as often as the sunk costs (Keil,
Truex, & Mixon, 1995).
“I spent a long time on the initial decision and perceived it as effortful.”
Cunha and Caldieraro obtained results suggesting that the effort level of the initial decision in-
fluences whether subjects fall prey of the SCF or not. They found out that the more cognitively
demanding a task was the more subjects exaggerated the desirability of the decision outcome.
Their results indicated that people recognize time costs invested in cognitive tasks. Therefore,
they argued that not only monetary investments but also “nonrecoverable behavioral invest-
ments” should be treated as sunk costs (Cunha & Caldieraro, 2009, p. 106).
“I spent a long time on the second decision and perceived it as effortful.”
This question is related to the study by Cunha and Caldieraro described above (Cunha &
Caldieraro, 2009).
“Although my initial decision led to negative consequences, I believe that continued in-
vestment in the initially chosen department would result in positive consequences even-
tually.”
Arkes and Blumer found that subjects in the sunk cost condition of their experiment had an “in-
flated estimate of the likelihood that the completed project will be a success” (Arkes & Blumer,
1985, p. 130). It is unclear whether this was the reason or the consequence of the decision to con-
tinue investing (Arkes & Blumer, 1985).
“I had the feeling that the 10 million dollars would be wasted if I choose to invest the 20
million dollars to the other division.”
A different experiment by Arkes and Blumer indicated that people would not buy a product
which works cheap and fast if they bought a similar product, although of lower quality, not long
ago. Arkes and Blumer argued that this might be due to concerns of participants that they would
duplicate a recent investment which has been taken not long ago if they would take the new of-
fer. This duplication was aversive since it appeared wasteful (Arkes & Blumer, 1985).

2 Method 36
“I get over negative events quickly and focus on taking actions that result in better out-
comes.”
Putten et al. obtained results showing that the more “action-oriented people” were, i.e. the more
likely they were to “get over negative events quickly, and focus on taking actions to solve them”
(Putten et al., 2010, p. 33), the more their decision whether to invest or not came to a 50-50 divi-
sion. By contrast, investments of “state-oriented people”, i.e. people who “typically find it diffi-
cult to overcome a negative event, and keep ruminating about it and how it affects their current
state” (Putten et al., 2010, p. 33), were motivated by sunk costs. Their conclusion was that ac-
tion-orientation did not prevent participants from committing the SCF but decreased the likeli-
hood. Mindset seemed to have an effect on the SCF. The authors argued that this supported
strength of association models. These models proposed that the SCF depended on the strength of
the association between the current investment decision and sunk costs (Putten et al., 2010).
“I find it difficult to overcome a negative event and keep ruminating about how it affects
the current state.”
This question was also referring to the study mentioned above (Putten et al., 2010).
“I felt personally responsible for the outcome of the initial decision.”
Staw experimentally demonstrated that participants escalated commitment to a higher extent if
they were personally responsible for the initial decision that led to negative outcomes, i.e. when
they took the initial decision themselves and were not only told what the first decision was
(Staw, 1976).
“I had the feeling that my initial decision led to negative consequences.”
The study by Staw mentioned above provided evidence that commitment to a failing endeavour
only occurred to an exceptionally high extent if participants had the feeling that their initial deci-
sion led to negative results (Staw, 1976).
The last five questions were not based upon a specific study previously published:
“I felt very committed to my initial decision throughout the experiment.”
“My initial decision influenced my second decision more than the updated financial re-
port.”
“The financial information at the point of the second decision was the major reason for
my decision.”
“I based my second decision on the same reasons as my initial decision.”
“I have been very satisfied with my initial decision directly after taking it.”
“Before taking the second decision I had the feeling that my initial decision would lead to
a desirable outcome.”
2.5.1.2 Condition-specific questions
Except for the question about evaluation by others, all questions condition-specific questions
were not formulated based on previous findings but customized for the present experiment.

2 Method 37
The following questions were asked only in the audience condition of my experiment:
“I had the feeling that my decisions were evaluated by others.”
Experiments by Brockner and colleagues suggested that investment decisions were influenced by
self-presentation. Participants were concerned about how they were perceived by others. Social
anxiety and audience size had an impact on investments, for example instructions had more in-
fluence on participants with high social anxiety performing in front of a large audience than on
those with low social anxiety participating in front of a small audience (Brockner et al., 1981).
“The presence of the experimenter influenced my decision.”
“It was important for me what others think about my decision.”
“It was important for me what impression the experimenter has of my decision.”
“I had the feeling that I have to make decisions fast because the experimenter was pre-
sent.”
“I had the feeling that I would violate social norms if I invested all money in one division
only in the second decision.”
“I had the feeling that I would violate social norms if I would invest nothing in the failing
division in the second decision.”
“I wanted others to think that I make good decisions.”
“I had the feeling that I would be judged based on the decisions I make.”
In the anonymous condition the questionnaire contained the following condition-specific likert-
scale questions:
“I felt that nobody can track my initial decision.”
“I had the feeling that my decisions were completely anonymous.”
2.5.2 Open questions
In both conditions the questionnaire contained open questions which permitted participants to
explain their decisions. The obtained data provided information on post-hoc reasoning. The
questionnaire contained three open questions and space for comments. Two of the three ques-
tions appeared in both conditions, one was condition-specific.
2.5.2.1 General questions
The open questions asked in both conditions were the following:
“How satisfied have you been with your first decision directly after taking it? Did your
satisfaction change in the course of the experiment, for example after you received the
data for the second decision? If so, please explain.”
“Did you change your opinion during the experiment in which department you want to
invest more? Why?”
“Do you have any other comments which you want to mention here?”

2 Method 38
2.5.2.2 Condition-specific questions
The condition-specific question in the audience condition focused on the perception of the argu-
mentative context:
“Did you have the feeling that your decisions were monitored? Would you have made
decisions differently if this would not have been the case?”
In the anonymous condition, by contrast, the open question targeted the perception of anonymity
in the setting:
“Did you have the feeling that your decisions were anonymous? Would you have made
decisions differently if this would not have been the case?”
2.6 Data analysis
2.6.1 Quantitative analysis
The first and second investment decisions as well as most of the questionnaire data were ana-
lysed based on quantitative tests. Statistical results, if not stated otherwise, were calculated using
the software IBM SPSS Statistics version 23. The alpha level used as significance criterion was
set as .05. The statistical tests applied are stated along with the corresponding test results in the
Results section. Non-parametric tests were used to analyse second investments as the data was
not found to be normally distributed. Correlations between second investments and questionnaire
answers were calculated with Spearman’s test. Scatterplots were visually checked for linearity
before building the regression models described in Tables 3 and 4. For reasons of clarity no zero
points were calculated: The regression models describe predicted investments as intercept plus
point of agreement on the 5-point-scale multiplied by the regression coefficient. Part of the ques-
tions described in section 2.5.2 allowed for categorization of the answers. As stated in the Re-
sults section the resulting categories were used as grouping variables.
2.6.2 Qualitative analysis
Arguments which participants in the audience condition provided for their decisions were audio
recorded and analysed based on a procedure recommended by Gorden (Gorden, 1992). I, as the
experimenter, listened to the arguments for the first decision to recognize whether participants
had carried-over reasons from the first to the second decision. The arguments for the second de-
cision were coded two times, with time in between, based on a list of codes. The two codings
were compared and aligned. In the last step, the coded reasons were connected to the second
investment decisions of the participants. In Appendix D the list of codes and a more detailed
description of the procedure of the analysis can be found. The results of the analysis are stated in
subchapter 3.1.3 of the Results section.

3 Results 39
3 Results
The aim of the experiment conducted with eighty participants was to test the hypothesis that the
Sunk Cost Fallacy is caused by reason-based choice in an argumentative context leading to a
confirmation bias. In this section I report the results on the main predictions defined before con-
ducting the experiment and additional results on situations in which the SCF is likely to occur.
3.1 Results on the first prediction – Reason-based choice
The first prediction was that participants in the audience condition would take decisions which
are easy to justify due to reason-based choice triggered by a need for argumentation.
3.1.1 Extreme versus intermediate investment decisions
For the second decision, participants divided 20 million dollars between the two departments. As
the bar charts (Figure 4) depict, investments into the failing department differed between the two
conditions: The modes were 15 million dollars in the anonymous condition (n = 9) and 0 dollars
in the audience condition (n = 11). Additional peaks of investments were 5 million dollars in the
anonymous condition (n = 8) and 10 million dollars in the audience condition (n = 8). Audio
recording data, described in section 3.1.3, indicated that investments in the audience condition
were indeed easy to justify and could be understood as signals: Consideration of the updated data
depicting the negative results of the initial decision led to zero investments in the audience con-
dition (“I made a mistake”). The expectation or hope of a turnaround as a consequence of con-
tinued investment and the desire to “give a boost” to the department which performed well (fair
and rewarding behaviour) were the major motivators to invest 10 million dollars.
Figure 4: Modes differ in the anonymous (left) and the audience condition (right)
The data signified that in the anonymous condition intermediate options were preferred, i.e. in-
vestments which allocate part of the money to both departments and still allow expressing a

3 Results 40
preference (5 or 15 million dollars). In the audience condition, by contrast, more extreme deci-
sions were made, in particular because of the many zero investments.
3.1.2 Salient points of investment
Across conditions the investment points most often chosen were 0, 5, 8, 10, 15 and 20 million
dollars. Except for investment point 8, each could be associated with one condition (see section
3.1.3). These condition-specific investment points (0, 5, 10, 15, and 20 million dollars) might
have been especially salient because of their position within the total range: 0% 25%, 50%, 75%
and 100% of the maximum possible investment. They accounted for 65% of all investments in
the anonymous condition and 75% of investments in the audience condition (Table 1). In the
audience condition these “salient points” were chosen 10% more often than in the anonymous
condition, indicating that saliency is more important if a need for argumentation exists.
Table 1: Frequency table of second investments
The underlying assumption of salient points was that certain numbers were chosen more fre-
quently than others because of their saliency, similarly to the phenomenon that social judgment
is determined by the saliency of certain attributes or characteristics, i.e. features that “attract our
attention when we see something or someone with them” (Stangor, n.d., p. 94). The applicability
of the concept of saliency in this context was supported by the result that, although participants
had the possibility to choose any investment within the range 0 to 20 million dollars, only one
participant chose an investment which was not an integer: 19.9 million dollars (Table 1).
3.1.3 Association between investments and reasons in the audience condition
The distribution curve of investments into the failing department across conditions could be dis-
sected into six segments (Figure 5). Each segment was a range starting at a local minimum and
Frequency table of second investments
Million $ n % n %
0 3 7.5 11 27.51 2 5.0 1 2.52 2 5.0 1 2.53 0 0.0 1 2.54 1 2.5 0 0.05 8 20.0 4 10.06 1 2.5 1 2.57 1 2.5 0 0.08 3 7.5 3 7.59 0 0.0 0 0.010 4 10.0 8 20.011 0 0.0 0 0.012 2 5.0 0 0.013 1 2.5 1 2.514 0 0.0 1 2.515 9 22.5 3 7.516 0 0.0 0 0.017 0 0.0 0 0.018 0 0.0 1 2.519 0 0.0 0 0.0
19,9 1 2.5 0 0.020 2 5.0 4 10.0
Total (N = 80) 40 100.0 40 100.0
Anonymous condition Audience condition

3 Results 41
ending at the next local minimum. The segments could be associated with one condition each.
Investments within ranges A and D were chosen by double as many participants in the audience
as in the anonymous condition whereas the opposite was true for segments B and E.
Figure 5: Distribution curve and its segments
A.) Range = {0; 3.5}
SP = 0
n: 7 (An.) / 14 (Aud.)
M: 0.86 (An.) / 0.43 (Aud.)
% SP: 42.86% (An.) / 78.57% (Aud.)
% N: 17.5% (An.) / 35% (Aud.)
D.) Range = {9; 11}
SP = 10
n: 4 (An.) / 8 (Aud.)
M: 10 (An.) / 10 (Aud.)
% SP: 100% (An.) / 100% (Aud.)
% N: 10% (An.) / 20% (Aud.)
F.) Range = {16.5; 20}
SP = 20
n: 3 (An.) / 5 (Aud.)
M: 19.97 (An.) / 19.60 (Aud.)
% SP: 66.67% (An.) / 80% (Aud.)
% N: 7.5% (An.) / 12.5% (Aud.)
C.) Range = {6.5; 9}
SP = 8
n: 4 (An.) / 3 (Aud.)
M: 7.75 (An.) / 8 (Aud.)
% SP: 75% (An.) / 100% (Aud.)
% N: 10% (An.) / 7.5% (Aud.)
B.) Range = {3.5; 6.5}
SP = 5
n: 10 (An.) / 5 (Aud.)
M: 5 (An.) / 5.20 (Aud.)
% SP: 80% (An.) / 80% (Aud.)
% N: 25% (An.) / 12.5% (Aud.)
E.) Range = {11; 16.5}
SP = 15
n: 12 (An.) / 5 (Aud.)
M: 14.33 (An.) / 14.40 (Aud.)
% SP: 75% (An.) / 60% (Aud.)
% N: 30% (An.) / 12.5% (Aud.)
SP… Salient point of investment / Mode
n... Number of participants choosing an
investment within this range
M… Mean investment of participants
investing in this range (in Mio. $)
% SP… Percentage of participants investing in this range choosing the salient point of
investment
% N… Percentage of participants per
condition investing in this range
Fig. 2a: Modes in the
anonymous condition
Fig. 2b: Modes in the
audience condition

3 Results 42
Audio data provided information on the reasons which guided investment decisions in the audi-
ence condition. As the overview of the audio recording results in Figure 6 depicts, specific rea-
sons were associated with investments in certain ranges. This supports the prediction that par-
ticipants chose investments which were expected to be comprehensible to others.
Figure 6: Reasons underlying second investments in the audience condition based on the audio data
Range A = {0; 3.5} n = 14/14 (100%)
Range B = {3.5; 6.5} n = 5/5 (100%)
Range E = {11; 16.5} n = 3/5 (60%)
Consideration of updated financial report: bad
outcomes of the initially chosen department or /
and good outcomes of the other department
Range C = {6.5; 9}
n = 2/3 (66,67%)
Consideration of updated financial report
Data shows decline because of external
factors, e.g. financial crisis
Diversification: Invest in both departments
as trends might change in the future
Range D = {9; 11}
n = 6/8 (75%)
The data might change in the future
o IP is a long-term endeavour
based on long-term cooperation
o The initially chosen department
still needs more money to
become better in the future
o The market might change
“Give a boost” to the department
developing well
Range F = {16.5; 20}
n = 3/5 (60%)
The other division did well even without the
10 million dollars of investment
Might explain
investment
patterns in the
anonymous
condition

3 Results 43
The overview of reasons underlying investments in certain ranges described in Figure 6 sup-
ported the prediction that participants in the audience condition chose investments which were
easy to justify: The majority of the participants who invested between 0 and 3.5 million dollars
to the failing department stated that consideration of the data, i.e. the bad outcomes of their ini-
tial decision, the good results yielded by the not chosen department, or both, was the main reason
for their choice. Investments in ranges 3.5 to 6.5 and 11 to 16.5 million dollars were also mainly
due to consideration of the updated financial report. Although there was no most rational choice
in the scenario, these results suggested that participants who focused on the updated data only
invested within these ranges. This is of particular interest since in the anonymous condition the
majority of participants (n = 22), double as many as in the audience condition (n = 10), chose an
investment lying within these two ranges. In the audience condition, by contrast, consideration of
the updated data mainly led to investments between 0 and 3.5 million dollars (n = 14) with zero
being the mode (n = 11). In the anonymous condition only three participants invested nothing
into the failing department. Zero investments as results of consideration of the updated financial
report might indicate the aim of participants in the audience condition to present themselves as
good decision-makers and to signal to the experimenter that they learned from their mistake.
Salient points of investment (see section 3.1.2) can be associated with the same reasons as those
of the corresponding ranges (Figure 6). Consideration of the updated data was the reason stated
by all participants in the audience condition investing nothing (n = 11/11) or 5 million dollars (n
= 4/4) in the initially chosen department and by 66.67% of those investing 15 million dollars (n =
2/3). 75% of participants who allocated an equal amount of money to both departments (10 mil-
lion dollars) expressed the hope or expectation that the data might change in the future (n = 6/8).
Reasons underlying full investments (20 million dollars) were the expectation that the data might
change in the future and the argument that the other department did well even without initial
investment (each n = 2/4). In sum, all reasons underlying salient points of investments (SP) were
the same as those underlying investments in the corresponding ranges with only two exceptions:
First, consideration of external factors was a dominant reason behind SP 15 but not investments
in range E. Second, the expectation that the data might change was a dominant reason behind SP
20 but not investments in range F.14
These overviews of reasons are based on the analysis of the ad-hoc reasons participants provided
for their second investment decisions. These reasons are described in more detail below.
3.1.3.1 Consideration of the updated financial report
Almost all participants (n = 33) referred to the updated data, i.e. how sales and earnings in the
two departments developed, in their argumentation for the second decision. 27.5% of the partici-
pants in the audience condition (n = 11) stated the updated data as the only reason for their sec-
ond choice. All of these participants invested within range A and 81.82% (n = 9) invested noth-
14
The selection criterion for a reason to be “dominant” was that it had been stated by 50% or more of the partici-
pants choosing an investment within the specific range or investing in the specific salient point.

3 Results 44
ing into the initially chosen department. The remaining two participants invested one and three
million dollars. By contrast, all seven participants who did not mention the updated data as a
reason for their second decision invested above zero. Their investments fell within ranges C to F
and thus are relatively high. All participants choosing to invest everything in the failing depart-
ment (20 million dollars) fell into this category (n = 4). Overall, this data suggested that high
investments were associated with disregarding the updated data.
3.1.3.2 Expecting the data to change in the future
Sixteen participants stated the argument that the data might change in the future. They argued
that IP is a long-term branch (n = 3), that the initially chosen department needs more money to
show improvement (n = 6), that the market might change (n = 1), and that a diversified product
range is important as market trends could change (n = 3). The reason that the data might change
in the future is an argument stated by 66.67% of the participants who invested eight million dol-
lars in the failing department (n = 2), and by 75% of the participants who distributed the money
equally between the two departments (n = 6). This reason stood behind investments in all ranges.
3.1.3.3 “Give a boost” to the department developing well
Thirteen participants expressed that they wanted to invest parts of the 20 million dollars endow-
ment to the department not initially chosen because they want to give it a “boost”, so it will con-
tinue to rise in sales and earnings or at least stay stable. This reason underlay investments in all
ranges, but was particularly often stated by participants investing in range C or D: 66.67% of
those who invested eight million dollars (n = 2) and 75% of those who invested 10 million dol-
lars (n = 6) stated this reason. Two out of these thirteen participants explicitly said that they in-
vested in the initially not chosen department to offer it “reward” for its good development in
recent years. These rewards were relatively high: Eight and ten million dollars.
3.1.3.4 “The other department performed well even without the ten million dollars”
Seven participants stated that the other department performed well even without the allocation of
money in the first decision. The reason was often provided to argue in favour of high invest-
ments in the failing department (ten million dollars or more): It only appeared as an argument for
investments in ranges D to F with the exception of one outlier (investment of five million dollars
in initially chosen department). Similarly to the argument described in 3.1.3.3 this reason was
always mentioned in combination with other reasons.
3.1.3.5 Outsourcing of responsibility
Responsibility for the negative outcome of the initial decision was not always searched upon
oneself: 20% of the participants (n = 8) outsourced responsibility. Responsibility for the negative
outcomes was searched for in two factors: First, participants referred to external factors, as for
example the financial crisis after 2008 or claimed that cooperation with hospitals (as mentioned
in the instructions, see Appendix A) might have failed. Second, participants argued that the ini-

3 Results 45
tially chosen department might have done “something wrong”, for example in marketing. Par-
ticipants who outsourced responsibility invested in ranges A, C, D and E. 66.67% of the partici-
pants (n = 2) who invested eight million dollars referred to external factors (n = 2). Also, 37.50%
(n = 3) who allocated equal amounts to both conditions emphasized the possible failure of the
department itself.
3.1.3.6 Holding on to the initial decision
“Holding on to the initial decision” is a category containing several arguments:
Reasons for the initial decision were carried over to the second decision (n = 4)
Self-justification: Claiming that one’s initial decision was good (n = 2)
Wastefulness: Arguing that giving-up on the failing department would mean wasting the
money already invested (n = 1)
Stick with “gut feeling” one had at the time of the first decision (n = 1)
“Gamble”: Take the risk of further investing in the declining department (n = 1)
Eight out of nine participants who held on the initial decision invested ten million dollars or
more to the failing department. All investments lay within ranges C, D, E, and F and thus were
relatively high.
3.1.3.7 Feeling that the initial decision was bad
Five participants stated that they had the feeling that their initial decision was bad. The invest-
ments of these participants did not follow a certain pattern but appeared in ranges A, B, C and E.
80% of these participants chose a salient point of investment..
3.1.3.8 Multiple reasons for the second decision
Twenty-six participants stated not only one of the reasons described in sections 3.1.3.1 to 3.1.3.7
but multiple reasons for their second decision. All participants who invested an equal amount of
money in both departments (n = 8) fell into this category. The updated financial report was stated
as one reason by twenty-two of them. Eighteen out of these twenty-two participants considered
more than one factor apart from the updated financial data. Only one of these participants with
multiple reasons apart from the updated report invested nothing in the initially chosen depart-
ment whereas seven out of eight who had chosen an equal investment fell into this category.
With the modes of investments in the audience condition being zero and ten million dollars, this
data indicated that relatively high investments (ten million dollars) were associated with sophis-
ticated reasoning (multiple reasons apart from the updated report).
In sum, the influence of the argumentative context became evident through the investment in
different ranges in the two conditions. Specific reasons underlay certain investments in the audi-
ence condition. These reasons made the choices justifiable.

3 Results 46
3.2 Results on the second prediction – Confirmation bias
The second prediction was that participants in the audience condition would on average invest
more money into the failing department than participants in the anonymous condition due to a
confirmation bias leading to the Sunk Cost Fallacy.
3.2.1 Second investments in the two conditions
3.2.1.1 Disproving the influence of the first decision
In order to study the investment differences in the two conditions, the possibility of an influence
of the first decision on second investments had to be taken into consideration in a preliminary
analysis. In the anonymous condition twelve and in the audience condition nine out of forty par-
ticipants chose to invest the initial endowment of ten million dollars in the consumer products
department (CP). Although designed as equally attractive options, the descriptions which the
participants obtained before their first decision might explain why the majority of the partici-
pants in both conditions initially invested into the industrial products department (IP): A small
cue is provided pointing towards the advantages of IP in a long-term perspective (Appendix A).
Audio recording data supported this interpretation: Only three out of thirteen participants in the
audience condition who stated the argument that the data might change in the future as a motive
behind their second investment decision had chosen CP in their first decision (Figure 7). Three
participants in the audience condition explicitly stated that they kept on investing in the failing
department because IP was a “long-term branch” (see section 3.1.4.2).
Figure 7: Investments of participants expecting or hoping that the data might change in the future
Nonetheless, the initial decision had no significant influence on investments in the second deci-
sion: In the audience condition participants who had initially chosen to invest in CP (Mdn = 3)
did not invest differently in the failing department in the second decision than those who had
chosen IP (Mdn =10) as the Kolmogorov-Smirnov Z test proved, K-S Z = 1.16, p = .073 (ns, ex-

3 Results 47
act sig., 2-tailed). Second investments in the anonymous condition also did not differ signifi-
cantly, K-S Z = 0.66, p = .538 (ns, exact sig., 2-tailed), based on whether participants had ini-
tially invested in CP (Mdn = 6) or IP (Mdn = 9).
3.2.1.2 Comparison of second investments in the audience and the anonymous condition
The mean investment was slightly lower in the audience condition (M = 7.65, SD = 6.73, n = 40)
than in the anonymous condition (M = 8.97, SD = 5.91, n = 40). Nonetheless, the histograms
(bin: √n = 6) with plotted normal curves (Figure 8) indicated that means failed to capture the
differences between investments in the two conditions since no normal distribution was found.
Kolmogorov-Smirnov tests with Lilliefors Significance Correction confirmed that the distribu-
tion of second investments in the anonymous condition, D (40) = 0.15, p = .025 (< .05), and in
the audience condition, D (40) = 0.15, p = .029 (< .05), were significantly non-normal. Thus,
non-parametric tests were applied.
Figure 8: Histograms with plotted normal curves
Different than predicted, a Mann-Whitney U test showed that there was no significant difference
between second investments in the two conditions, U = 686.50, p = .137 (ns, exact sig., 1-
tailed15), r = −.1216. Although the initial decision had no significant influence on investment deci-
sions (see section 3.2.1.1), the data was post-hoc matched to minimize a potential influence of
the initial decision to invest in IP or CP and individual differences.17 Participants were matched
based on their initial decision (CP vs. IP) and the root mean square (RMS) differences of their
questionnaire answers (information on the procedure and data used can be found in the section
15
The prediction was one-directional: Second investments were predicted to be higher in the audience than in the
anonymous condition. Therefore, a 1-tailed test was performed. 16
The effect size estimate r was not calculated through SPSS. The equation used to convert a Z-score given by SPSS
into r was r = Z/√N (Field, 2005, p. 532) 17
Post-hoc matching, opposed to analysing the differences between the conditions independently according to the
initial decision, provided the advantage that sample sizes did not have to be reduced.

3 Results 48
“Post-hoc matching” in Appendix D). The Wilcoxon signed-rank test performed on the matched
data confirmed that there is no significant difference between the second investments in the two
conditions, T = 225.00, p = .163 (ns, exact sig., 1-tailed), r = −.16.
3.2.2 Questionnaire results on the second prediction
3.2.2.1 Correlations of second investments and questionnaire answers
Correlations between investments in the second decision and questionnaire answers were calcu-
lated using Spearman’s test.18 Correlation coefficients of all fifteen general questions and two
(An.) or nine (Aud.) condition-specific questions are listed in Appendix D. Bonferroni correc-
tions were performed by dividing the desired significance level (p < .05) by the number of ques-
tions asked per condition. The Bonferroni-corrected significance thresholds were .003 (α =
.05/17) in the anonymous condition and .002 (α = .05/24) in the audience condition. The differ-
ence between the conditions was caused by the higher number of condition-specific questions in
the audience condition (see section 2.5.1). As the Bonferroni correction increased the probability
of a Type 2 error to occur (e.g., Sinclair et al., 2013) “moderate” correlations which were equal
or larger than .30 (Cramer & Howitt, 2004, p. 39) were reported in this section. The uncorrected
p-values are presented in the tables, but correlations which remained significant after Bonferroni
correction are marked with an asterisk.
Correlations which were larger than .30 in one condition, but not in the other, provided insights
on the hypothesis tested (Table 2).
Table 2: Correlations between second investments and questionnaire answers differing in the two conditions
In the anonymous condition a significant correlation between second investments and the belief
that continued investment in initially chosen department might lead to positive outcomes in the
18
As the initial choice had no significant effect on second investments (see section 3.2.1.1), correlation coefficients
were calculated without separating answers of participants who had initially chosen IP and CP.
Question r s p n r s p n
“Although my initial decision led to negative
consequences, I believe that continued investment in
the initially chosen department would result in
positive consequences eventually.”
.64 < .001* 39 .24 .137 40
“I based my second decision on the same reasons as
my initial decision.” .10 .562 39 .42 .008 40
“I get over negative events quickly and focus on
taking actions that result in better outcomes.” -.25 .129 38 -.48 .002* 40
* surviving Bonferroni correction by the respective number of questions
Audience conditionAnonymous condition

3 Results 49
future was found. In the audience condition second investments were significantly correlated, in
a negative relationship, with being “action-oriented” as per definition of Putten and colleagues
(Putten et al., 2010, p. 33) Although not significant after Bonferroni correction, the positive rela-
tionship in the audience condition between second investments and agreement to have taken this
decision based on the same reasons as the first decision should be noted. These results indicated
that in an argumentative context high investments were linked to a failure to update beliefs.
3.2.2.2 Regression models
In the anonymous condition a regression model was built based on all significant19 correlations
between second investments and questionnaire answers in this condition (Table 13 in Appendix
D) using a stepwise backward method20 in SPSS. Nonetheless, none of the regression coefficients
reached significance except for the belief that continued investment in the failing department
would eventually result in positive outcomes (Table 15 in Appendix D).
A simple linear regression was calculated to predict second investments in the anonymous condi-
tion based on this belief. A significant regression equation was found (F (1, 37) = 23.63, p <
.001), with an R² of .39. A participant’s predicted investment in the failing department is equal to
−0.33 (constant) + 2.86 (agreement on belief) million dollars when this belief is measured on a
5-point likert-scale (1 = “Strongly disagree” to 5 = “Strongly agree”). Participant’s second in-
vestment increased 2.86 million dollars for each higher point on the scale of the belief (Table 3).
Table 3: Regression model predicting investments in the anonymous condition
In the audience condition a regression model was also calculated based on the correlations be-
tween second investments and questionnaire answers which were significant before Bonferroni
correction. The regression model depicted in Table 16 in Appendix D was built with a stepwise
backward method and showed that the only the two significant regression coefficients were
agreement to have based the second decision on the same reasons as the initial decision and be-
ing “action-oriented” (Putten et al., 2010, p. 33). A multiple linear regression was calculated to
predict investments based on agreement to these two factors. A significant regression equation
19
For the regression models in both anonymous and audience condition all correlations which were significant be-
fore Bonferroni correction were considered as in the second step non-significant regression coefficients were ex-
cluded (see Table 15 and 16 in Appendix D). 20
The backward method was preferred over a forward method to reduce the probability of suppressor effects to
occur (Field, 2005, p. 161).
Variable B SE B β t p
Constant -0.33 2.08 -0.16 .877
“Although my initial decision led to negative consequence, I 2.86 0.59 .62* 4.86 < .001
believe that continued investment in the initially chosen
department would result in positive consequences eventually.”
Note: R² = .39, *p < .001

3 Results 50
was found (F (2, 37) = 12.58, p < .001), with and R² of .41. A participant’s predicted second in-
vestment is equal to 10.89 (constant) + 2.28 (agreement to have based the second decision on the
same reasons as the first decision) – 2.88 (agreement to being action-oriented). Agreement is
measured as 1 = “Strongly disagree”, 2 = “Disagree”, 3 = “Neither agree nor disagree”, 4 =
“Agree”, 5 = “Strongly agree”. Investments in the failing department increased 2.28 million dol-
lars for each step in agreement to have based the second decision on the same reason as the first
decision and decreased 2.88 million dollars for each step in agreement to being action-oriented.
Both questionnaire answers were significant predictors of second investment decisions (Table 4).
Table 4: Regression model predicting investments in the audience condition
3.2.2.3 Open questions on the feeling to be monitored and perceived anonymity
Participants in the audience condition were asked whether they felt that their decisions were
monitored and whether they would have made decisions differently if this would not have been
the case. Eight out of forty participants stated to have felt monitored, twenty-five answered with
“No”, two with “Maybe”, three gave unclear answers and two did not answer the question. It
remained unclear why only 20% of the participants felt monitored. Some answers suggested that
participants did not perceive experimenter presence and the need to state reasons as “monitoring”
(one participant, for example, stated that she did not have this feeling “because the experimenter
was not watching me all the time”) and that the question was interpreted as referring to the posi-
tion within the scenario (“a business decision definitely other people can monitor”), but the
statements could not be generalized. Three participants wrote that they would have made deci-
sions differently without monitoring and two answered with “Maybe”, but the number of partici-
pants was too small to detect a common pattern. Nonetheless, some insights were given on why
participants claimed that they would not have made decisions differently without monitoring:
Participants claimed that they based their decisions on facts only (n = 6), that they did not let
themselves be influenced by others’ opinions (n = 3), that they believed to have made the right
decision (n = 3), that they only cared for the aim to maximize profits for the company (n = 1),
that they were “independently minded” or sure of themselves (n = 2), and that monitoring only
played a small factor as not enough information was provided (n = 1). Investments were not in-
fluenced based on whether participants felt monitored (Mdn = 7) or not (Mdn = 5), U = 99.50, p
= .993 (ns, exact sig., 2-tailed), r = −.003.
Variable B SE B β t p
Constant 10.89 4.14 2.63 .012
“I based my second decision on the same reasons as my 2.28 0.75 .39* 3.03 .004
initial decision.”
“I get over negative events quickly and focus on taking actions -2.88 0.82 -.45* -3.52 < .001
that result in better outcomes.”
Note: R² = .41, *p < .001

3 Results 51
In the anonymous condition participants were asked whether they felt that their decisions were
anonymous and whether they would have made decisions differently if this would not have been
the case. Twenty-two participants agreed to have felt that their decisions were anonymous, nine
stated their doubts, one answered with “Maybe” and eight participants either did not give a defi-
nite answer (n = 5) or did not answer at all (n = 3). Participants explained their doubts by stating
that they “still felt some sort of pressure (of the norms to be successful, to make the right deci-
sion, and to be better than the other participants)” or that “I don’t believe in anonymity generally,
so did not have this feeling”. Eighteen out of forty participants were tested with other partici-
pants during the same session. The proportion of participants feeling anonymous was almost the
same among those who were tested with others (61.11%, n = 11/18) and those tested alone (50%,
n = 11/22). 27.27% of those tested alone indicated that they did not feel anonymous (n = 6) as
opposed to 16.67% among those tested with others (n = 3). There was no significant difference
in investments between participants tested alone and with others, U = 169.00, p = .434 (ns, exact
sig., 2-tailed), r = -.13. Four participants claimed that they would have made decisions differ-
ently in a non-anonymous setting. Although not generalizable, participants offered explanations:
“I may have put more money into consumer goods because I wouldn’t want it to look as though,
to others, that I was investing our money into a sinking ship” and “probably yes, especially for
the second one, since I wouldn’t have admitted or accepted I chose a department which had less
potential (even if it was still lucrative) in the real world: I would had to face those who don’t
receive any more funding. I would have invested a ‘minimal’ sum to it”. Statements on why par-
ticipants would not have changed their decision were numerous: Participants argued that they
made the best possible decision with the information and knowledge they had (n = 5), that ano-
nymity does not influence strategy or information amounts which guided their choice (n = 2) and
that within the scenario they played a non-anonymous role anyways (n = 1). Second investments
did not differ based on whether participants stated to have felt anonymous (Mdn = 10) or not
(Mdn = 6), U = 79.00, p = .394 (ns, exact sig., 2-tailed), r = −.16.
3.3 Results on situations in which the Sunk Cost Fallacy is likely to occur
The questionnaire offered additional results which provided insights into factors behind the Sunk
Cost Fallacy which were related to but not captured by the two experimental conditions.
3.3.1 Correlations between questionnaire answers and second investments
In both anonymous and audience condition investments in the initially chosen, failing depart-
ment were significantly correlated, in a negative relationship, with agreement that the updated
financial information was the major reason for the second decision. This result supports the pre-
diction that high investments in the failing department were due to disregarding the updated data.
In both conditions, although not significant after Bonferroni correction, moderate correlations
between second investments and commitment to the initial decision as well as the desire to com-
plete the started project should be noted (Table 5).

3 Results 52
Table 5: Correlations between second investments and questionnaire answers which are similar in the two conditions
3.3.2 Factors behind the Sunk Cost Fallacy proposed in previous studies
The questionnaire contained likert-scale questions targeting factors which were proposed as de-
terminants of the SCF in previous studies (see section 2.5.1). Correlations between these factors
and second investments of participants are described in Table 6.
Table 6: Correlations between second investments and factors proposed in previous studies
The only factor which was found to be moderately (although not significantly after Bonferroni
correction) correlated with second investments in both conditions was the desire to complete a
Question r s p n r s p n
“I felt very committed to my initial decision .45 .005 38 .38 .014 40
throughout the experiment”
“The financial information at the point of the second -.43 .007 39 -.58 < .001 * 40
decision was the major reason for my decision.”
“I had a strong desire to complete the started .43 .007 38 .41 .009 40
project.”
* surviving Bonferroni correction by the respective number of questions
Audience conditionAnonymous condition
Question r s p n r s p n
“I had a strong desire to complete the started .43 .007 38 .41 .009 40
project.”
“I spent a long time on the initial decision and -.23 .165 39 -.16 .339 40
perceived it as effortful.”
“I spent a long time on the second decision and -.01 .953 39 -.14 .405 40
perceived it as effortful.”
“Although my initial decision led to negative .64 < .001 * 39 .24 .137 40
consequences, I believe that continued investment in
the initially chosen department would result in positive
consequences eventually.”
“I had the feeling that the 10 million dollars .27 .097 39 .14 .386 40
would be wasted if I choose to invest the 20 million
dollars to the other division.”
“I get over negative events quickly and focus -.25 .129 38 -.48 .002 * 40
on taking actions that result in better outcomes.”
“I find it difficult to overcome a negative event .05 .748 38 .15 .348 40
and keep ruminating about how it affects the current
state.”
* surviving Bonferroni correction by the respective number of questions
Audience conditionAnonymous condition

3 Results 53
started project. This factor has previously been studied by Keil et al. (Keil et al., 1995). Arkes
and Blumer have observed in one of their experiments that participants in the sunk cost condition
rated the chances of a project to be successful higher than participants who had not invested in
the project yet (Arkes & Blumer, 1985). This finding is supported by the present experiment:
Second investments were in the anonymous condition significantly correlated with agreement to
the belief that continued investment in the initially chosen department would result in positive
consequences eventually. Agreement to being “action-oriented” (Putten et al., 2010, p. 33),
which in the questionnaire was described as to “get over negative events quickly and focus on
taking actions that result in better outcomes” following the wording used by Putten and col-
leagues (Putten et al., 2010), on the other hand, was significantly correlated to second invest-
ments in the audience condition only. Evidence for the influence of effort, as has been suggested
by a study by Cunha and Caldieraro (Cunha & Caldieraro, 2009), on second investments could
not be found, neither for the perceived effort of the first nor the second decision. Also, the theory
of wastefulness which had been proposed by Arkes and Blumer (Arkes & Blumer, 1985) was not
supported by these results: There was no significant correlation in neither of the two conditions.
3.3.3 Satisfaction with the first decision and opinion change over time
Participants in both conditions were asked the same question: “How satisfied have you been with
your first decision directly after taking it? Did your satisfaction change in the course of the ex-
periment, for example after you received the data for the second decision? If so, please explain.”
Responses were categorized into Yes/Yes (“I have been satisfied with the first decision directly
after taking it and my satisfaction changed after I received the data for the second decision.”),
Yes/No (“I have been satisfied directly after taking the first decision, but my satisfaction
changed in the course of the experiment”) and No/No (“I was neither satisfied directly after tak-
ing the initial decision nor later in the course of the experiment”). Without considering partici-
pants whose answers could not be categorized either because the statements were unclear or be-
cause they did not answer, the highest proportion of participants in both anonymous condition (n
= 11) and audience condition (n = 11) were initially satisfied but their satisfaction changed after
they had received the updated data. The number of participants who were initially satisfied and
remained so is almost equally high in both anonymous condition (n = 11) and audience condition
(n = 9). Only a very small number of participants in both anonymous condition (n = 3) and audi-
ence condition (n = 5) stated to neither have been satisfied directly after taking the decision nor
after receiving the updated data. This categorization allowed for comparison of second invest-
ment decisions between categories and across conditions: Second investments of participants
belonging to satisfaction category Yes/Yes (Mdn = 15 (An.), Mdn = 10 (Aud.)) and Yes/No
(Mdn = 5 (An.), Mdn = 1 (Aud.) differed significantly both within the anonymous condition, U =
27.00, p = .025 (< .05, exact sig., 2-tailed), r = −.48, and within the audience condition, U =
17.50, p = .012 (< .05, exact sig., 2-tailed), r = −.56. Participants who remained satisfied over the
course of the experiment (Yes/Yes) tended to invest more into the failing department (An.: M =

3 Results 54
12.73, Mdn = 15, Mode = 15, Aud.: M = 12.56, Mdn = 10, Mode = 10) than those whose satisfac-
tion changed (Yes/No) (An.: M = 6.55, Mdn = 5, Modes = 5 and 15, Aud.: M = 4, Mdn = 1,
Mode = 0). Sample sizes in category No/No were in both conditions too small for comparison. In
sum, this data suggested that satisfaction had an influence on investment decisions. This influ-
ence did not differ between anonymous and audience condition: Investments within category
Yes/Yes, U = 46.50, p = .840 (ns, exact sig., 2-tailed), r = −.05, and within category Yes/No, U =
37.00, p = .120 (ns, exact sig., 2-tailed), r = −.33, were not significantly different in the condi-
tions. In conclusion, answers to this question suggested that satisfaction had an influence on in-
vestments into a failing department, but that this influence was the same across conditions.
The second open question was also similar in both conditions: “Did you change your opinion
during the experiment in which department you want to invest more? Why?” The number of par-
ticipants who stated that they changed their opinion during the experiment was the same (n = 22)
in both conditions. The number of participants who claimed to not have changed their opinion
was also almost equal in both anonymous condition (n = 16) and audience condition (n = 13).
One answer in the anonymous condition and four in the audience condition could not be identi-
fied as either “Yes” (opinion change) or “No” (no opinion change). In both conditions one par-
ticipant did not answer this question. Participants’ second investments differed significantly
based on whether they changed their opinion (Mdn = 5 (An.), Mdn = 2 (Aud.)) or not (Mdn = 15
(An.), Mdn = 15 (Aud.)) both in the anonymous, U = 20.50, p < .001 (exact sig., 2-tailed), r =
−.75 and in the audience condition, U = 27.50, p < .001 (exact sig., 2-tailed), r = −.68. Second
investments of participants who changed their opinion were much lower (An.: M = 5.23, Mdn =
5, Mode = 5, Aud.: M = 3.68, Mdn = 2, Mode = 0) than second investments of those who did not
change their opinion (An.: M = 14.49, Mdn = 15, Mode = 15, Aud.: M = 14.23, Mdn = 15, Mode
= 20). Investments of those who changed their opinion ((Mdn = 5 (An.), Mdn = 2 (Aud.)) were
not significantly different in the anonymous and audience condition, U = 184.50, p = .172 (ns,
exact sig., 2-tailed), r = −.21. Similarly, investments of those who did not change their opinion
(Mdn = 15 (An.), Mdn = 15 (Aud.)) were not significantly different in the two experimental con-
ditions, U = 96.50, p = .746 (ns, exact sig., 2-tailed), r = −.06. In sum, whether participants
changed their opinion in which department they wanted to invest more during the experiment
had an influence on their investment decisions, but this influence was the same across condi-
tions.

4 Discussion 55
4 Discussion
4.1 Discussion of the results
This study aimed to investigate determinants of the Sunk Cost Fallacy (SCF) by manipulating
the social environment which triggers psychological mechanisms at the origin of this cognitive
bias. The hypothesis was that the SCF is caused by reason-based choice combined with a con-
firmation bias. The predictions were, first, that participants in the audience condition would ap-
ply reason-based choice more often than participants in the anonymous condition due to the ar-
gumentative context of their decisions and, second, that they would on average invest more
money into the failing department due to a confirmation bias. The first prediction is supported by
the results of the experiment conducted with eighty participants: Participants in the audience
condition tended to take more extreme decisions and chose salient points of investments more
often. In addition, audio recording data revealed that specific reasons underlay certain invest-
ments indicating that participants chose justifiable investment points. On the second prediction,
on the other hand, the results are ambiguous: There was no significant difference between the
investments in the two conditions and only few instances of participants carrying over their rea-
sons from first to second decision were documented by the audio recording data. Nonetheless,
regression models showed that agreement to being “action-oriented” (Putten et al., 2010, p. 33)
and to have based the second decision on the same reasons as the first decision are significant
predictors of second investments in the audience condition, but not in the anonymous condition.
Whether these ambiguous results are due to the experimental setup – reason-based choice in this
scenario led to zero investments – or if the hypothesis should be rejected can only be answered
by a follow-up experiment. Nonetheless, the results of the present study offer valuable informa-
tion on the factors underlying the SCF and the circumstances under which this bias is more likely
to occur.
4.1.1 Results on the first prediction – Reason-based choice
The data suggest that participants in the audience condition indeed applied reason-based choice
more often than participants in the anonymous condition:
First, participants in the audience condition made more extreme decisions than participants in the
anonymous condition: 27.5% of the participants in the audience condition (as opposed to 7.5% in
the anonymous condition) invested nothing and 10% (in comparison to 5% in the anonymous
condition) everything in the initially chosen department. In the anonymous condition participants
chose less extreme options by allocating money to both departments and still showing a prefer-
ence for one (5 or 15 million dollars). In addition, equal allocations of 10 million dollars to both
departments were taken by 20% of the participants in the audience condition, but only by 10% of
the participants in the anonymous condition.
4 Discussion 56
Second, 75% of the participants chose salient investment points. These were 10% more than in
the anonymous condition. This backs the claim that saliency is more important if there is a need
to communicate: The investment points 0, 5, 10, 15 and 20 million dollars might be salient, as
described in section 3.1.2., because they are fractions of the whole endowment (0%, 25 %, 50%,
75%, 100% of 20 million dollars). Salient features per definition attract attention (Stangor, n.d.)
and as such are easier to explain than investment points which do not draw the attention of the
audience (e.g., intermediate investment points as for example 2, 3, 4 etc.). The fact that 80% of
the participants who mentioned that they had the feeling that their initial decision “was bad”
chose a salient point of investment (n = 4/5) indicates that participants feeling a need for justifi-
cation were likely to choose a salient point (see section 3.1.3.7).
Third, different investment points were preferred in the two conditions and certain types of rea-
sons were associated with them. In the audience condition the modes of investments were 0 and
10 million dollars as opposed to 5 and 15 million dollars in the anonymous condition (see section
3.1.1). The analysis of the audio recordings, which provide ad-hoc information on the reasoning
behind participants’ decisions in the audience condition, suggests that investments of 10 million
dollars were taken by participants who either hoped for a positive turnaround or wanted to give
the other department, which developed well, “a boost”. It was explicitly mentioned by some par-
ticipants that they wanted to give a “reward” to this department. Therefore, the audio data indi-
cate that appearing fair might have motivated equal investments. Zero investments, by contrast,
were chosen by participants who mainly focused on the updated financial report. The financial
data was also the major motivator behind investments of 5 and 15 million dollars into the failing
department. The fact that consideration of the updated data led to zero investments in the audi-
ence condition but also to investments of 5 and 15 million dollars indicates that participants in
the anonymous condition might have often chosen investments of 5 and 15 million dollars be-
cause they had considered the updated financial report. In the audience condition, by contrast,
participants learned from the updated financial data that made a mistake. Thus, they took zero
investments to signal to the experimenter that they learned from their mistake (see section 3.1.3
including Figure 6).
Although there was no statistically significant difference between investments in the two condi-
tions (see section 3.2.1.2) the distribution curve reveals differences in the investment patterns.
Local minima and maxima allowed for a dissection of the distribution curve into ranges: 0 to 3.5
(range A), 3.5 to 6.5 (range B), 6.5 to 9 (range C), 9 to 11 (range D), 11 to 16.5 (range E) and
16.5 to 20 (range F). Double as many or more participants in the audience condition than in the
anonymous condition chose an investment within ranges A and D whereas the opposite holds
true for investments in ranges B and E (see Figure 5 in section 3.1.3).
Previous findings suggested that humans anticipating a need to justify themselves apply reason-
based choice more often (Simonson, 1989) . Thus, the prediction was that in the audience condi-
tion participants would often choose the most justifiable rather than the most rational choice due
to the need to state reasons for their decisions to the experimenter. The prediction is confirmed

4 Discussion 57
mainly by the insights which the audio recordings provide into the arguments which underlay
certain investments in the audience condition.
Zero investments (n = 11):
o All participants mentioned the updated financial report as the main reason for their deci-
sion (see section 3.1.3.1).
o Only one participant provided more than one reason apart from the updated financial re-
port (see section 3.1.3.8). This supports the interpretation that only considering the up-
dated report led to zero investments in the audience condition.
o 81.8% of the participants who mentioned the updated financial report as the only reason
for their choice invested nothing in the initially chosen department. All of them invested
within range A (see section 3.1.3.1). This supports the interpretation that participants in
the audience condition wanted to signal that they have realized that their first decision
has been a mistake and therefore turned away from this department completely.
o Seven out of forty participants did not mention the updated financial report at all. None
of them invested anything in the failing department (see section 3.1.3.1).
Investments of 5 million dollars (n = 4):
o All participants who invested 5 million dollars in the failing department mentioned the
updated financial report as the main reason for their decision (see Figure 6 in section
3.1.3).
Investments of 10 million dollars (n = 8):
o 75% (n = 6/8) chose this investment point because they hoped or expected the data to
change in the future (see section 3.1.3.2) This supports self-justification theory, which
predicts that participants escalate commitment in “hope of a turnaround” that would
make their initial decision justifiable (Sleesman, Conlon, McNamara, & Miles, 2012, p.
546).
o All eight participants stated multiple reasons for their second decision. Except for one,
all considered more than one factor apart from the updated financial report. This sug-
gests that sophisticated reasoning stood behind equal investments and thus, that appear-
ing to be considerate seemed to be goal (see section 3.1.3.8).
o 75% of the participants (n = 6/8) argued that they want to “give a boost” to the depart-
ment doing well. One of these participants explicitly stated that she wanted to give a
“reward” to the department. This indicates that participants were interested in present-
ing themselves as being fair (see section 3.1.3.3).
o Three participants outsourced responsibility for the negative outcomes of the initial de-
cision by claiming that the department “did something wrong” with marketing. This
also indicates the wish to appear fair: Participants punished the department as they did
not regard the negative outcomes of the initial decision as their own mistake but rather
as the mistake of others (see section 3.1.3.5)

4 Discussion 58
Investments of 15 million dollars (n = 3):
o The dominant reasons behind this investment (each stated by n = 2/3) were the updated
financial report and/or outsourcing of responsibility to external factors as for example
the financial crisis (see section 3.1.3).
Investments of 20 million dollars (n = 4):
o Recurring reasons (each stated by n = 2) which motivated these investments were the
hope or expectation that the data would change in the future and the argument that the
other department did well even without the initial investment (see section 3.1.3).
o None of the participants who invested everything in the initially chosen department
mentioned the updated financial report as a factor driving their choice (see section
3.1.3.1).
Audio recording data demonstrate that the same reasons underlay the above mentioned invest-
ment points and investments in the corresponding ranges. The only exceptions were that in range
F the argument that the data might change in the future played a minor role and that in range E
consideration of the updated financial data was the only major reason, not with external factors
in addition (see section 3.1.4). In sum, the audio recording data support the prediction that in the
audience condition participants would have an interest in making their investments comprehen-
sible to others: Zero investments were chosen more often than 5 and 15 million dollars if the
updated financial report was considered, which indicates that participants wanted to show that
they learned from their mistake. The argument that the other department performed well even
without initial investment was often provided to argue in favour of high investments (equal or
higher than 10 million dollars) into the failing department. The argument appeared for invest-
ments in ranges D to F with the exception of one outlier. This reason was always mentioned in
combination with other reasons (see section 3.1.3.4). Sophisticated reasoning behind high in-
vestments might express the aim to make decisions more comprehensible to the audience (see
section 3.1.3.8).
4.1.2 Results on the second prediction – Confirmation bias
Mercier and Sperber have argued that a “genuine confirmation bias” (Mercier & Sperber, 2011,
p. 64), i.e. the tendency to overlook evidences and arguments going against own claims and fo-
cusing on those supporting own conclusions, would only occur in argumentative settings and
only when producing, not evaluating, arguments (Mercier & Sperber, 2011). The second predic-
tion that a confirmation bias would occur more often in the audience than in the anonymous con-
dition due to the argumentative context in this setting was based on this claim. The results on this
prediction are ambiguous. The prediction is not supported by investment decisions and audio
data: First, no significant difference between the investments in the two conditions was found
(see section 3.2.1.2). Second, audio recording data revealed that only four participants carried
reasons from their first decision over to the second decision (see section 3.1.3.6). Third, the
modes of investments were higher in the anonymous condition (5 and 15 million dollars) than in

4 Discussion 59
the audience condition (0 and 10 million dollars). Nonetheless, questionnaire data support the
hypothesis. Different factors are correlated with second investments in the two conditions: In the
anonymous condition the belief that continued investment in the failing department would even-
tually result in positive outcomes was significantly correlated, in a positive relationship, with
second investments. In the audience condition, by contrast, second investments were signifi-
cantly correlated, in a negative relationship, with agreement to getting over negative events
quickly and focusing on taking actions that result in better outcomes, i.e. being “action-oriented”
as defined by Putten and colleagues (Putten et al., 2010, p. 33). Also, a positive correlation of a
moderate size (although not significant after Bonferroni correction) between agreement to having
based the second decision on the same reasons as the initial decision and second investments was
found (see section 3.2.2.1). In addition, regression models support the hypothesis. 41% of the
variability of second investments in the audience condition could be explained by a regression
model (described in section 3.2.2.2) considering participants’ agreement to have based their sec-
ond decision on the same reasons as their first decision and to agreement to the statement “I get
over negative events quickly and focus on taking actions that result in better outcomes”. An in-
crease of 2.28 million dollars per point in agreement to have based the second decision on the
same reason as the first decision (on a 5-point likert-scale ranging from “Strongly disagree” to
“Strongly agree”)21 was predicted. This supports the hypothesis that a confirmation bias leads to
investments in failing endeavours. The regression model predicted a decrease of 2.88 million
dollars in investments per step in agreement to being “action-oriented” (Putten et al., 2010, p.
33). This indicates that overcoming a negative decision is important to avoid falling prey of the
Sunk Cost Fallacy. These results are of particular interest since in the anonymous condition nei-
ther of these two variables was moderately correlated with second investment decisions (see sec-
tion 3.2.2.1). A simple regression model, with the predictor variable being the agreement to the
belief that continued investment in the failing department would result in positive consequences
eventually, accounted for 39% of the variability of second investments in the anonymous condi-
tion. For each point of agreement on the 5-point likert-scale the model predicted that 2.86 million
dollars more would be spent on the failing department (see section 3.2.2.2). In conclusion, high
investments into the failing department in the anonymous condition seem to be motivated by the
belief that continued investment would lead to positive results in the future. In the audience con-
dition, by contrast, high investments were likely to occur if participants were not “action-
oriented” (Putten et al., 2010, p. 33) and held on to the reasons that guided their initial decision.
The open questions do not offer much insights into the second prediction: Investments do not
differ based on whether participants stated to have felt that their decisions were monitored or not
(audience condition) or whether they have felt that their decisions were anonymous or not
(anonymous condition). Only eight out of forty participants in the audience condition stated to
21
It has to be noted that a methodological limitation of this study is that the scale was created post-hoc: The num-
bers (1 = “Strongly disagree”, 2 = “Disagree”, 3 = “Neither agree nor disagree”, 4 = “Disagree”, 5 = “Strongly
disagree”) were not presented in the questionnaire but only the corresponding text as can be seen in the instruc-
tions in Appendix A.

4 Discussion 60
have felt that their decisions were monitored. There was no significant difference found between
investments of participants in the audience condition stating to have felt monitored and those
who did not (see section 3.2.2.3). It might be the case that the question was misunderstood. An
Experimenter Demand Effect as described by Zizzo (Zizzo, 2010) might have been at work: In
the audience condition stating that one felt observed was irrelevant as it was expected in an ex-
periment. So, participants might have taken the question as “to what extent have you been af-
fected by the audience?” and so they wanted to assert their autonomy by stating that they had not
been affected. Also, results indicate that participants thought that the question referred to the
position within the scenario (see section 3.2.2.3).
In sum, the data offered ambiguous results on the tested hypothesis: On the one hand, question-
naire data provided strong evidence that a failure to update beliefs stands behind high second
investments in an argumentative context only. Also, investment patterns and audio data confirm
the prediction that reason-based choice occurred in the audience condition. On the other hand,
investment decisions did not differ significantly between the two conditions and there were only
few instances documented in the audio data of participants carrying-over reasons from the first to
the second decision. A follow-up experiment is suggested in section 4.4 to clarify these results.
4.1.3 Circumstances under which the Sunk Cost Fallacy is likely to occur
Which factors underlie the SCF and under which circumstances is this bias more likely to occur?
The present study offers some insights with regard to these questions:
First, the presence or absence of an argumentative context has an influence on investments in a
failing endeavour. This concerns the main hypothesis of this study and arguments speaking in
favour and against it can be found in sections 4.1.1 and 4.1.2.
Second, correlations between investment decisions and answers to likert-scale questions provide
insights into the variables which might make high investments into a failing endeavour more
likely: In both conditions a moderate correlation between second investments and agreement that
the updated financial information was the major reason for the second decision was found. None-
theless, the correlation was only significant in the audience condition (see section 3.3.1). This
indicates that high investments in a failing endeavour are linked to disregarding the updated in-
formation. In addition, the desire to complete a started project and commitment to the initial de-
cision were moderately, although not significantly after Bonferroni correction, correlated with
second investments in both condition (see section 3.3.1). These results suggest that these are fac-
tors important for the occurrence of the SCF independent of the existence of an argumentative
context.
Third, open questions show that satisfaction with the initial decision and opinion change over
time both had large effects on investment decisions regardless of the condition (see section
3.3.3).

4 Discussion 61
Fourth, several questions targeting different factors proposed in previous studies were included
in the questionnaire as a meta-study has shown that multiple factors might account for the SCF
(Sleesman et al., 2012). The prediction was that different determinants interact, but that reason-
based choice combined with a confirmation bias is a major driver:
Wastefulness, although previously suggested to be one of the main determinants of the Sunk
Cost Fallacy (e.g., Arkes & Blumer, 1985; Haller & Schwabe, 2014), was not significantly
correlated with investment decisions in neither anonymous nor audience condition in my
experiment (see section 3.3.2). In addition, only one participant mentioned wastefulness as a
factor ad-hoc according to the audio recording data (see section 3.1.3.6). Nonetheless, the
belief that continued investments would lead to positive outcomes in the future was found to
be significantly correlated with second investments in the anonymous condition (see section
3.2.2.1). Arkes and Blumer argued that this might either be a reason, a consequence, or both
of the decision to continue investing (Arkes & Blumer, 1985).
Putten, Zeelenberg and Dijk have argued that mindset influences how prone an individual is
to commit a SCF (Putten et al., 2010). Agreement to being “action-oriented”, i.e. to “get
over negative events quickly, and focus on taking action to solve them” (Putten et al., 2010,
p. 33), was in my experiment significantly correlated with second investments in the audi-
ence condition, but not in the anonymous condition (see section 3.3.2). Agreement to being
“state-oriented”, i.e. to “find it difficult to overcome a negative event, and keep ruminating
about it and how it affects their current state” (Putten et al., 2010, p. 33), on the other hand,
was not significantly correlated with second investments in neither of the two conditions
(see section 3.3.2.). These results indicate that not mindset is a determinant of the SCF, but
the failure to update beliefs and that this failure is more likely to occur if individuals who are
not “action-oriented” (Putten et al., 2010, p. 33) face the need for argumentation.
Cunha and Caldieraro suggested that perceived effort influences whether participants are
likely to hold-on to a failing endeavour because not only monetary but also behavioural re-
sources are taken into consideration (Cunha & Caldieraro, 2009). Results of my study do not
support this claim: Neither perceived effort of the first nor the second decision was found to
be significantly correlated with allocations to the failing department (see section 3.3.2).
Keil, Truex and Mixon experimentally demonstrated that “subjects’ willingness to continue
a project increased with the level of sunk cost and the degree of project completion, but that
subjects were more apt to justify their continuation on the basis of sunk cost” (Keil et al.,
1995, p. 372). The results of the present experiment back these findings but further investi-
gation is recommended: Although not significantly after Bonferroni corrections, the desire
to complete the started project was moderately correlated with second investments in both
conditions (see section 3.3.2).

4 Discussion 62
4.1.4 Role of the experimental setting for investment decisions
Audio data suggest that participants in the audience condition tended to invest nothing in the
failing department to prove that they learned from their mistake (see section 3.1.3). The study
design might favour zero investments if reason-based choice is at work as admitting a mistake
might be easier in this experimental setting than in real-world situations:
First, real stakes might be lacking. In real-world settings long-term reputation management and
concerns about resources, for example, are important. In this one-shot game participants had no
relationship to the experimenter, no future encounter was to be expected and no real monetary
stakes were involved. Incentivization is recommended for future experiments to mirror decision
making in real-world settings more accurately.
Second, commitment to the initial decision, although not significant after Bonferroni correction,
was found to be moderately correlated with second investments in both conditions (see section
3.3.1). A prerequisite for commitment might be the feeling of being capable of taking a good
decision in the first place. Results of my experiment prove that participants indeed applied rea-
son-based choice in an argumentative context. Nonetheless, participants might not have felt ca-
pable of providing good reasons for their initial decision since they did not feel like experts in
the field and the information provided left participants in uncertainty. Therefore, they might have
provided the best reasons they could come-up with, but were not committed to them. Thus, no
failure to update beliefs occurred in the second decision. Participants who regard themselves as
epistemic authorities in comparison to the audience or feel knowledgeable in the field might not
admit a mistake as easily. This might contribute to the explanation why the results of the experi-
ment by Staw were not replicated although the same scenario was used (see section 2): Being
business students “enrolled in the College of Commerce and Business Administration at the Uni-
versity of Illinois” (Staw, 1976, p. 30) participants might have been more self-confident with
regard to the task independent of the experimental conditions.
4.2 Limitations
The experiment I conducted bore several limitations:
First, a limitation of the present study is that the two options (investing in the consumer products
department or the industrial products department) in the first decision turned out not to be
equally attractive. A small cue in the description of the industrial products department suggested
its advantages in a long-term perspective. The advantage of this cue is that it provided further
evidence that participants in the audience condition applied reason-based choice. Its disadvan-
tage is that it led to an asymmetry between the two conditions: The effect of the first decision on
second investments seemed to be larger in the audience than in the anonymous condition. None-
theless, in neither of the two conditions second investments differed significantly based on
whether CP or IP has been chosen for the initial investment (see section 3.2.1.1).

4 Discussion 63
Second, the audience might not have been large enough to mirror an argumentative context as it
would occur in real-world settings: The audience only consisted of one experimenter. Partici-
pants who often take part in experiments might be used to this kind of observation. Nonetheless,
the main element of the argumentative context in the present study was not audience presence
but the need to state reasons. This element was implemented in the study. In addition, audio re-
cording was applied.
Third, the scenario did not provide a measure of irrationality. This is a structural limitation which
is inherent to many studies on the SCF since irrationality is detected at an aggregated, not an
individual level. This particular scenario has been chosen despite this limitation due to the bene-
fits it bears: It has already been successfully applied to test for the impact of self-justification on
the SCF (Staw, 1976). Also, it enabled participants to take the first decision themselves. Partici-
pants were not only informed about what the initial decision has been as it is the case in many
other standard experiments on the SCF (e.g., Arkes & Blumer, 1985). This was advantageous
because “explicitly choosing the failed course of action creates a condition that comprises only
decision makers who have an actual preference for the course of action” (Sleesman et al., 2012,
p. 546). Although having no measure of irrationality could be regarded as a limitation, the sce-
nario should be suitable to test the hypothesis: If the SCF is indeed caused by reason-based
choice, it is not important what investments participants choose, but to detect whether preference
reversal occurs. If reason-based choice is applied in an argumentative context, it is unlikely that
subjects take inconsistent choices.
4.3 Impact and practical applications
The impact of my study is threefold:
First and foremost, it contributes to the scientific understanding of the SCF and targets social
determinants which have been underrepresented in the last 35 years of research (Sleesman et al.,
2012). My study drew on a relatively new theory to investigate the bias from a different view-
point: The argumentative theory of reasoning by Mercier and Sperber (Mercier & Sperber,
2011). This shed light on the social environment behind self-justification, a psychological
mechanism which had been shown to be a major driver behind the SCF (Staw, 1976). The ex-
periment presented in this Master thesis pinned down one bias and studied its underlying mecha-
nisms and conditions of appearance and thereby demonstrated the limitations of the concept of
the homo economicus. From a Cognitive Science perspective this study is of relevance due to the
inherent interdisciplinarity of the field of Behavioural Economics: Research on the SCF is not
only conducted in Psychology and Economics, but also in other disciplines involved in Cognitive
Science, as for example Neuroscience (e.g., Haller & Schwabe, 2014) and Cognitive Biology
(e.g., Magalhaes & White, 2014). In my experiment an economic topic was studied with methods
from experimental Psychology. In addition, this study took social factors underlying psychologi-
cal mechanisms into account and drew on a theory grounded in Philosophy (Mercier & Sperber,
2011).

4 Discussion 64
Second, my study adds to the understanding of social determinants behind the SCF. This can
support management decisions in the private and public sector. Results of the experiment which
could be of interest for practical considerations include, for example, the following:
More extreme decisions can be expected if a person has to justify her or his decisions in
front of others. This is the case because reason-based choice is likely to be applied in an
argumentative context. If the person takes his or her decisions anonymously, by contrast,
less extreme decisions could be expected.
Investment points which are “salient”, i.e. investment points which draw the attention of
the audience, might be preferred in a setting in which people anticipate a need for justifi-
cation.
People who find or expect to find themselves in an argumentative context tend to take
choices which are justifiable.
Arkes and Blumer obtained results which showed that participants who had already in-
vested in an endeavour “have an inflated estimate of the likelihood that the completed
project will be a success” in comparison to participants who had not made a prior invest-
ment (Arkes & Blumer, 1985, p. 130). In my experiment the hope of a turnaround was
significantly correlated with high investments in a failing endeavour in an anonymous
setting.
Whether the Sunk Cost Fallacy occurs seems to be highly dependent on whether updated
data is considered or not.
These insights can be used for nudging initiatives (Thaler & Sunstein, 2008), for example by
facilitating less extreme decisions through increasing anonymity or lessening personal responsi-
bility, for consulting and leadership seminars (e.g. raising awareness about heuristics and biases
unconscious to the decision-makers themselves), to create a better working environment by mak-
ing decisions more understandable to colleagues or employees, and for raising awareness that the
organizational structure influences decision making (e.g. in an argumentative context people will
choose justifiable decisions).
Third, the present study provides data on individual decision making which can serve as a basis
for future experiments, as for example the planned study comparing the occurrence of the Sunk
Cost Fallacy in hierarchical versus egalitarian groups described in the next chapter.
4.4 Outlook
My study provided experimental evidence that participants apply reason-based choice in an ar-
gumentative context. Open remains the question how and under which circumstances choosing
the most justifiable rather than the most rational choice can lead to the Sunk Cost Fallacy since
my results on the role of the confirmation bias were ambiguous. In this section a follow-up ex-
periment is proposed which mirrors social settings under which managerial decisions in the real-
world are taken more accurately. Previous studies have shown that “groups in escalation situa-
tions exacerbate tendencies dominant at the individual level, even if those tendencies are coun-

4 Discussion 65
terproductive” (Whyte, 1993, p. 446f.). An experiment on group decision making could help to
clarify the ambiguous results I obtained on the role of the confirmation bias for the SCF. The
hypothesis of the proposed follow-up experiment is the same as in the experiment I conducted:
An argumentative context favouring reason-based choice leads people to be more affected by a
confirmation bias which in turn causes the SCF. The study design is identical with the difference
lying only in the manipulation of the independent variable: Investment decisions of leaders in
hierarchical groups are compared to decisions resulting from majority votes in egalitarian groups
(Table 7).
Table 7: Decision making in hierarchical and egalitarian groups
In the hierarchical condition one participant per group is appointed as the leader, takes the first
decision and has to justify it in front of the other group members. In the egalitarian condition, by
contrast, the decision of each member is submitted anonymously. The decision of a leader (hier-
archical group condition) or the outcome of a majority vote (egalitarian group condition) always
leads to negative consequences, meaning that the sales and earnings of the chosen department are
lower than those of the other department. For the second decision, hierarchical group members
are informed about the outcome of their leader’s decision. The leader now decides on the second
decision and again has to justify it in front of his or her group. In the egalitarian group the out-
come of the initial decision is mutually discussed and the second decision taken collaboratively.

4 Discussion 66
Ideally, the experiment should be conducted with participants who have a background in busi-
ness or economics and be incentivized. Group sizes should be odd numbers to guarantee clear
results from the anonymous votes, large enough to provide a feeling of anonymity about the first
decision within the egalitarian group and should be the same in both conditions. The anonymous
condition of the present study could serve as baseline condition (Table 7).
In addition, insights into group decision making could be gained: Uniformity pressure is sus-
pected to be especially strong under conditions of uncertainty, i.e. in situations in which
“whether or not an opinion is correct cannot be immediately determined by reference to the
physical world” (Festinger, 1954, p. 118). Participants could be asked to anonymously state the
decision they would take on an individual level before they discuss the results of the first deci-
sion in the group. These individual decisions could be assessed to gain insights into informa-
tional influence and its effect on group polarization (Myers & Lamm, 1976). Nonetheless, the
main aim of the follow-up study is to test whether reason-based choice and a confirmation bias
cause the SCF. The prediction is that leaders of hierarchical groups will apply reason-based
choice which in turn will lead to a confirmation bias as leaders fail to update their beliefs. Thus,
leaders are expected to fall prey of the SCF more often than members of an egalitarian group.
Investments in the failing department during the second round of decision making are predicted
to be higher in the hierarchical group condition than in the egalitarian group condition.

References 67
References
Andreoni, J., & Bernheim, B. D. (2009). Social image and the 50-50 norm: A theoretical and
experimental analysis of audience effects. Econometrica, 77, 1607–1636.
Arkes, H. R., & Ayton, P. (1999). The sunk cost and concorde effects: Are humans less rational
than lower animals? Psychological Bulletin, 125(5), 591–600.
Arkes, H. R., & Blumer, C. (1985). The psychology of sunk cost. Organizational Behavior and
Human Decision Processes, 35, 124–140.
Baron, J., Granato, L., Spranca, M., & Teubal, E. (1993). Decision-making in children and early
adolescents: Exploratory studies. Merrill-Palmer Quarterly, 39, 22–46.
Brockner, J. (1992). The escalation of commitment to a failing course of action: Toward
theoretical progress. Academy of Management Review, 17(1), 39–61.
Brockner, J., Rubin, J. Z., & Lang, E. (1981). Face-saving and entrapment. Journal of
Experimental Social Psychology, 17, 68–79.
Cramer, D., & Howitt, D. (2004). The SAGE dictionary of statistics: A practical resource for
students in the social sciences. London, England: SAGE Publications Ltd.
Cunha, M., & Caldieraro, F. (2009). Sunk-cost effects on purely behavioral investments.
Cognitive Science, 33, 105–113.
Fehr, E., & Gächter, S. (2002). Altruistic punishment in humans. Nature, 415, 137–140.
Festinger, L. (1954). A theory of social comparison processes. Human Relations, 7, 117–140.
Field, A. (2005). Discovering statistics using SPSS (2nd ed.). London, England: SAGE
Publications Ltd.
Fox, F. V., & Staw, B. M. (1979). The trapped administrator: Effects of job insecurity and policy
resistance upon commitment to a course of action. Administrative Science Quarterly, 24(3),
449–471.
Frank, R. (2008). Micro-economics and behavior (7th ed.). New York, NY: McGraw-Hill/Irwin.
French, J. R. P., & Raven, B. (1959). The bases of social power. In D. Cartwright (Ed.), Studies
in social power (pp. 150–167). Ann Arbor, MI: Research Center for Group Dynamics
University of Michigan.
Frith, C. D., & Frith, U. (2012). Mechanisms of social cognition. Annual Review of Psychology,
63, 287–313.
Garland, H. (1990). Throwing good money after bad: The effect of sunk costs on the decision to
escalate commitment to an ongoing project. Journal of Applied Psychology, 75(6), 728–
731.
Garland, H., & Newport, S. (1991). Effects of absolute and relative sunk costs on the decision to
persist with a course of action. Organizational Behavior and Human Decision Processes,
48, 55–69.
Gigerenzer, G., & Selten, R. (2002). Bounded rationality: The adaptive toolbox. Cambridge,
MA: MIT Press.
Gintis, H. (2000). Beyond homo economicus: Evidence from experimental economics.
Ecological Economics, 35, 311 – 322.
Gorden, R. (1992). Basic interviewing skills. Itasca, IL: F. E. Peacock.

References 68
Haley, K. J., & Fessler, D. M. T. (2005). Nobody’s watching? Subtle cues affect generosity in an
anonymous economic game. Evolution and Human Behavior, 26, 245–256.
Haller, A., & Schwabe, L. (2014). Sunk costs in the human brain. NeuroImage, 97, 127–133.
Hoffman, E., McCabe, K., Shachat, K., & Smith, V. (1994). Preferences, property rights, and
anonymity in bargaining games. Games and Economic Behavior, 7, 346–380.
Huber, J., Payne, J. W., & Puto, C. (1982). Adding asymmetrically dominated alternatives:
Violations of regularity and the similarity hypothesis. Journal of Consumer Research, 9(1),
90–98.
Kahneman, D. (2003a). A perspective on judgment and choice: Mapping bounded rationality.
American Psychologist, 58(9), 697–720.
Kahneman, D. (2003b). Maps of bounded rationality: Psychology for behavioral economics. The
American Economic Review, 93(5), 1449–1475.
Kahneman, D., & Tversky, A. (1979). Prospect theory: An analysis of decision under risk.
Econometrica, 47(2), 263–292.
Keil, M., Truex, D., & Mixon, R. (1995). The effects of sunk cost and project completion on
information technology project escalation. IEEE Transactions on Engineering
Management, 42(4), 372–381.
Krouse, H. J. (1986). Use of decision frames by elementary school children. Perceptual and
Motor Skills, 63, 1107–1112.
Magalhaes, P., & White, K. G. (2014). The effect of a prior investment on choice: The sunk cost
effect. Journal of Experimental Psychology: Animal Learning and Cognition, 40(1), 22–37.
McGuire, W. J. (1964). Inducing resistance to persuasion: Some contemporary approaches. In L.
Berkowitz (Ed.), Advances in Experimental Social Psychology (Vol. 1, pp. 192–227). New
York, NY: Academic Press, Inc.
Mercier, H., & Sperber, D. (2011). Why do humans reason? Arguments for an argumentative
theory. Behavioral and Brain Sciences, 34, 57–111.
Milgram, S. (1974). Obedience to authority: An experimental view. New York, NY: Harper and
Row.
Milinski, M., Semmann, D., & Krambeck, H.-J. (2002). Reputation helps solve the “tragedy of
the commons.” Nature, 415, 424–426.
Myers, D. G., & Lamm, H. (1976). The group polarization phenomenon. Psychological Bulletin,
83(4), 602–627.
Nickerson, R. S. (1998). Confirmation bias: A ubiquitous phenomenon in many guises. Review
of General Psychology, 2(2), 175–220.
Putten, M. Van, Zeelenberg, M., & Dijk, E. Van. (2010). Who throws good money after bad?
Action vs. state orientation moderates the sunk cost fallacy. Judgment and Decision
Making, 5(1), 33–36.
Rosnow, R. L., & Rosenthal, R. (1997). People studying people: Artifacts and ethics in
behavioral research. New York, NY: W. H. Freeman.
Shafir, E., Simonson, I., & Tversky, A. (1993). Reason-based choice. Cognition, 49, 11–36.
Simon, H. A. (1956). Rational choice and the structure of the environment. Psychological
Review, 63(2), 129–138.
Simonson, I. (1989). Choice based on reasons: The case of attraction and compromise effects.

References 69
Journal of Consumer Research, 16(2), 158–174.
Sinclair, J., Taylor, P., & Hobbs, S. (2013). Alpha level adjustments for multiple dependent
variable analyses and their applicability – A review. International Journal of Sports Science
and Engineering, 07(01), 17–20.
Sleesman, D. J., Conlon, D. E., McNamara, G., & Miles, J. E. (2012). Cleaning up the big
muddy: A meta-analytic review of the determinants of escalation of commitment. Academy
of Management Journal, 55(3), 541–562.
Soman, D., & Cheema, A. (2001). The effect of windfall gains on the sunk-cost effect.
Marketing Letters, 12(1), 51–62.
Stangor, C. (n.d.). Social psychology principles. Retrieved from http://2012books.lardbucket.org
Staw, B. M. (1976). Knee-deep in the big muddy: A study of escalating commitment to a chosen
course of action. Organizational Behavior and Human Performance, 16, 27–44.
Staw, B. M., & Ross, J. (1978). Commitment to a policy decision: A multi-theoretical
perspective. Administrative Science Quarterly, 23(1), 40–64.
Staw, B. M., & Ross, J. (1987). Behavior in escalation situations: Antecedents, prototypes, and
solutions. In L. L. Cummings & B. M. Staw (Eds.), Research in Organizational Behavior
(Vol. 9, pp. 39–78). Greenwich, CT: JAI.
Strough, J., Mehta, C. M., McFall, J. P., & Schuller, K. L. (2008). Are older adults less subject to
the sunk-cost fallacy than younger adults? Psychological Science, 19(7), 650–652.
Teger, A. I. (1980). Too much invested to quit. New York, NY: Pergamon Press.
Tennie, C., Frith, U., & Frith, C. D. (2010). Reputation management in the age of the world-wide
web. Trends in Cognitive Sciences, 14(11), 482–488.
Thaler, R. (1980). Toward a positive theory of consumer choice. Journal of Economic Behavior
and Organization, 1, 39–60.
Thaler, R. H., & Sunstein, C. R. (2009). Nudge: Improving decisions about health, wealth, and
happiness. London, England: Penguin Books.
Thompson, D. V, & Norton, M. I. (2011). The social utility of feature creep. Journal of
Marketing Research, 48, 555–565.
Tversky, A., & Kahneman, D. (1981). The framing of decisions and the psychology of choice.
Science, 211(4481), 453–458.
Tversky, A., & Simonson, I. (1993). Context-dependent preferences. Management Science,
39(10), 1179–1189.
Webley, P., & Plaisier, Z. (1998). Mental accounting in childhood. Children’s Social and
Economics Education, 3(2), 55–64.
Whyte, G. (1993). Escalating commitment in individual and group decision making: A prospect
theory approach. Organizational Behavior and Human Decision Processes, 54, 430–455.
Zajonc, R. B. (1965). Social facilitation. Science, 149(3681), 269–274.
Zizzo, D. J. (2010). Experimenter demand effects in economic experiments. Experimental
Economics, 13, 75–98.

References 70

Appendix A – Instructions 71
Appendix A – Instructions
Anonymous condition
CONSENT FORM
Psychology experiment, Budapest, ….. / ….. / 2015
You are about to participate in an experiment on decision-making. Your participation is voluntary and you can
withdraw at any time from the experiment.
None of your personal details will appear in any published document. Furthermore, it will not be possible to
associate your name to any decision or behavior related to the task. The results of the experiment may lead to
the publication of statistical data that will under no circumstances refer to you personally.
We do not envisage any negative consequence for you in taking part in this experiment. You participation will
allow us to investigate specific aspects of human psychology and behavior.
If you need any further information, please ask the experimenter.
Please complete the form and sign below if you agree to take part in the experiment.
I, ……………………………………………………………..… agree to participate in the current research
study.
I am participating voluntarily. I understand that I can withdraw from the study, without repercussions, at any
time. I understand that anonymity in any resulting publications will be ensured.
Signed: …………………………………………………………….. Date: …..... / …….. / 2015

Appendix A – Instructions 72
Department of Cognitive Science
Central European University
Oktober 6 street 7, 1st floor
Budapest, 1051, Hungary
[t]: +36 1 887-5138
[e]: [email protected]
Budapest, summer term 2015
The D&A Financial Decision Case
Thank you for volunteering for this experiment on financial problem-solving. Your participation helps us to
understand decision-making in various contexts. Your task is to play the role of a corporate executive and to
solve the “D&A Financial Decision case”. Attached to this paper you find information about the “Davis and
Anderson company” (D&A) which is specialized on camera technologies. You are provided with the
company’s financial information of sales and earnings of the previous years and a short description of relevant
departments. The information is taken from the annual report of the company. You are going to decide about
the allocation of research and development funds.
Please take your first decision in view of the financial report. Then, according to your initial decision please
open the envelope “IP” if you have chosen Industrial Products or “CP” if you have chosen Consumer Products
and take out one package containing the financial report and the second decision sheet. The updated financial
report depicts the sales and earnings of the D&A company five years after your initial decision. Based on this
information make your second decision and fill-out the decision sheet which is attached to it. After taking your
second decision please fill out the questionnaire.
Thank you for your participation!

Appendix A – Instructions 73
The D&A Financial Decision Case
The Davis and Anderson Company is a large technologically-oriented firm. As the financial history including ten prior
years of sales and earnings data depict, the company has started to decline over several preceding years. The directors of
the company agree that one of the major reasons for the decline in corporate earnings and a deterioration in competitive
position lay in some aspects of the firm’s program of research and development. Therefore, the directors have concluded
that 10 million dollars of additional Research and Development (R&D) funds should be made available. This money can
be invested in one of the corporation’s two largest divisions: Consumer Products or Industrial Products. For the time
being, only one of the two divisions can receive the additional funding. Please imagine yourself in the role of the
Financial Vice President and decide upon the division which should receive the 10 million dollars. Make your decision on
the basis of the financial data and with regard to the potential benefits that R&D funding will have on the future earnings
of the divisions.
Consumer Products The consumer products developed by the D&A company are high-tech cameras at affordable prices. These products are
split into two main specializations: Cameras for outdoor activities and small, low-weight cameras for everyday usage.
The main challenge is to provide compelling advantages in comparison to mobile phone cameras without exceeding the
price limits for the target group, which are active, travel-loving and social adults in the age range of 18 to 45 years. Future
investment could target design elements and new products like a waterproof and particularly small hybrid model.
Industrial Products
The D&A company does not limit itself to the production of consumer products but also uses its technologies for the
production of cameras used in industry. Recently two new potential targets were defined: The development of cameras
for clinical usage and cameras for laptops. Technological features initially developed for consumer products, as for
example water and lipid resistance, could be re-adapted for these purposes. Both ideas for new industrial products require
intense research but have the potential to lead to long-term cooperation with major technology-oriented companies and
hospitals.
CONSUMER PRODUCTS CONTRIBUTION TO SALES AND EARNINGS
Fiscal year Sales* Earnings*
1999 624 14.42
2000 626 10.27
2001 649 8.65
2002 681 8.46
2003 674 4.19
2004 702 5.35
2005 717 3.92
2006 741 4.66
2007 765 0.48
2008 770 -0.12
2009 769 -0.63
INDUSTRIAL PRODUCTS CONTRIBUTION TO SALES AND EARNINGS
Fiscal year Sales* Earnings*
1999 670 15.31
2000 663 10.92
2001 689 11.06
2002 711 10.44
2003 724 9.04
2004 735 6.38
2005 748 5.42
2006 756 3.09
2007 784 3.26
2008 788 -0.81
2009 791 -0.80
* In millions of dollars.
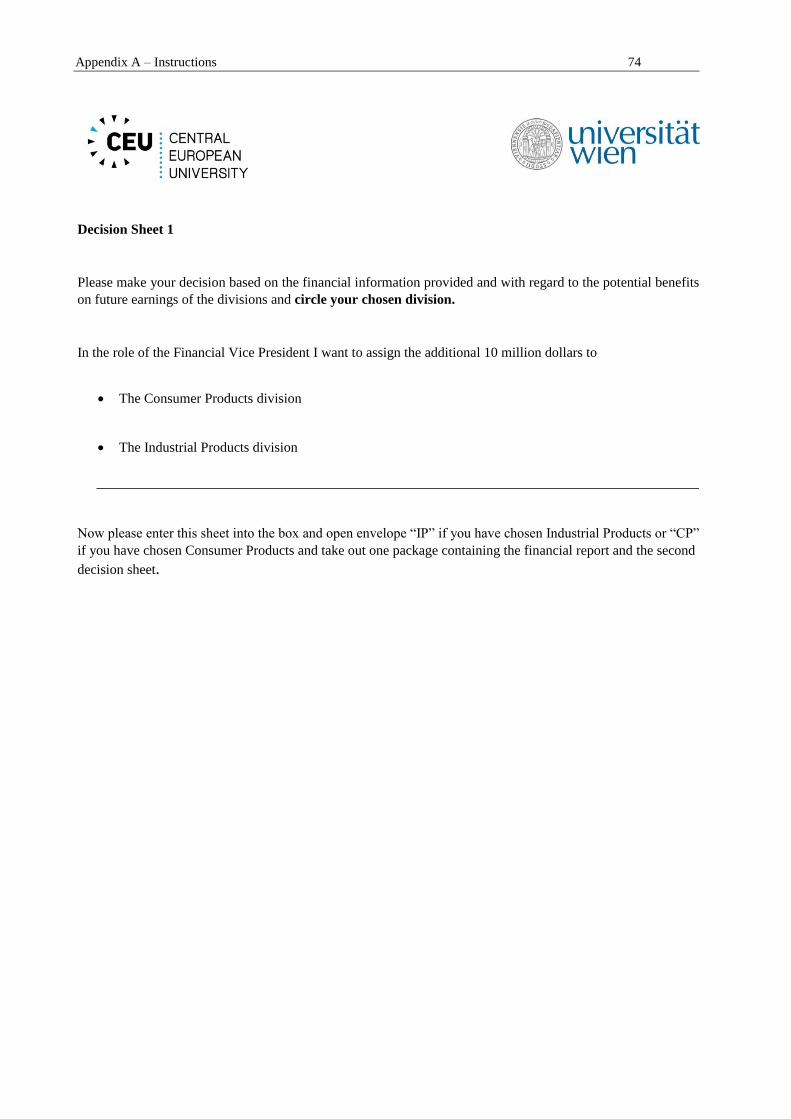
Appendix A – Instructions 74
Decision Sheet 1
Please make your decision based on the financial information provided and with regard to the potential benefits
on future earnings of the divisions and circle your chosen division.
In the role of the Financial Vice President I want to assign the additional 10 million dollars to
The Consumer Products division
The Industrial Products division
Now please enter this sheet into the box and open envelope “IP” if you have chosen Industrial Products or “CP”
if you have chosen Consumer Products and take out one package containing the financial report and the second
decision sheet.

Appendix A – Instructions 75
The D&A Financial Decision Case 2015
Today, five years after the initial allocation of the 10 million dollars of additional research and development funds to the
Consumer Products division, the R&D program of the Davis and Anderson Company is again up for re-evaluation. The
management of the company is convinced that there is an even greater need for expenditure on research and development.
Twenty million dollars have been made available from a capital reserve for R&D funding. As the Financial Vice
President you are asked to decide upon its proper allocation. Financial data is provided for each of the five years since the
initial allocation decision and, as earlier, the investment decision is to be made on the basis of future contribution to
earnings. Please specify the amount of money that should be allocated to either the Consumer Products or Industrial
Products division. This time, however, you are allowed to divide the R&D money in any way you wish among the two
major divisions.
CONSUMER PRODUCTS CONTRIBUTION TO SALES AND EARNINGS
Fiscal year Sales* Earnings*
1999 624 14.42
2000 626 10.27
2001 649 8.65
2002 681 8.46
2003 674 4.19
2004 702 5.35
2005 717 3.92
2006 741 4.66
2007 765 0.48
2008 770 -0.12
2009 769 -0.63
2010 771 -1.12
2011 774 -1.96
2012 762 -3.87
2013 778 -3.83
2014 783 -4.16
First R & D funding decision as of 2009 – 10 million $ for the Consumer Products division
INDUSTRIAL PRODUCTS CONTRIBUTION TO SALES AND EARNINGS
Fiscal year Sales* Earnings*
1999 670 15.31
2000 663 10.92
2001 689 11.06
2002 711 10.44
2003 724 9.04
2004 735 6.38
2005 748 5.42
2006 756 3.09
2007 784 3.26
2008 788 -0.81
2009 791 -0.80
2010 818 0.02
2011 829 -0.09
2012 827 -0.23
2013 846 0.06
2014 910 1.28
* In millions of dollars.
First R & D funding decision as of 2009 – 10 million $ for the Consumer Products division

Appendix A – Instructions 76
The D&A Financial Decision Case 2015
Today, five years after the initial allocation of the 10 million dollars of additional research and development funds to the
Industrial Products division, the R&D program of the Davis and Anderson Company is again up for re-evaluation. The
management of the company is convinced that there is an even greater need for expenditure on research and development.
Twenty million dollars have been made available from a capital reserve for R&D funding. As the Financial Vice
President you are asked to decide upon its proper allocation. Financial data is provided for each of the five years since the
initial allocation decision and, as earlier, the investment decision is to be made on the basis of future contribution to
earnings. Please specify the amount of money that should be allocated to either the Consumer Products or Industrial
Products division. This time, however, you are allowed to divide the R&D money in any way you wish among the two
major divisions.
INDUSTRIAL PRODUCTS CONTRIBUTION TO SALES AND EARNINGS
Fiscal year Sales* Earnings*
1999 670 15.31
2000 663 10.92
2001 689 11.06
2002 711 10.44
2003 724 9.04
2004 735 6.38
2005 748 5.42
2006 756 3.09
2007 784 3.26
2008 788 -0.81
2009 791 -0.80
2010 771 (1.12)
2011 774 (1.96)
2012 762 (3.87)
2013 778 (3.83)
2014 783 (4.16)
First R & D funding decision as of 2009 – 10 million $ for the Industrial Products division
CONSUMER PRODUCTS CONTRIBUTION TO SALES AND EARNINGS
Fiscal year Sales* Earnings*
1999 624 14.42
2000 626 10.72
2001 649 8.65
2002 681 8.46
2003 674 4.19
2004 702 5.35
2005 717 3.92
2006 741 4.66
2007 765 2.48
2008 770 -0.12
2009 769 -0.63
2010 818 0.02
2011 829 -0.09
2012 827 -0.23
2013 846 0.06
2014 910 1.28
* In millions of dollars.
First R & D funding decision as of 2009 – 10 million $ for the Industrial Products division

Appendix A – Instructions 77
Decision Sheet 2
Please make your decision based on the financial information provided and with regard to the potential benefits
on future earnings of the divisions and write down the amount of money you want to spend on each
division.
Out of the 20 million dollars for R&D funding I, as the Financial Vice President, want to assign
million dollars to the Consumer Products division
million dollars to the Industrial Products division
After making your decision please put this sheet into the box and fill-out the questionnaire.

Appendix A – Instructions 78
1) I felt very committed to my initial decision throughout the experiment.
Strongly disagree Disagree Neither agree nor
disagree
Agree Strongly agree
2) I felt personally responsible for the outcome of the initial decision.
Strongly disagree Disagree Neither agree nor
disagree
Agree Strongly agree
3) I had the feeling that my initial decision led to negative consequences.
Strongly disagree Disagree Neither agree nor
disagree
Agree Strongly agree
4) I felt that nobody can track my initial decision.
Strongly disagree Disagree Neither agree nor
disagree
Agree Strongly agree
Questionnaire
Thank you for your work on the D&A Financial Decision Case. This questionnaire is the last part of the
experiment. Please write the answers or circle the most appropriate choice.
Age:
Sex:
Current profession (student, employed, in training, etc.):
I have a background in Economics or Business:
If yes, please explain:
I have experience in Behavioural Economics:

Appendix A – Instructions 79
5) I had the feeling that my decisions were completely anonymous.
Strongly disagree Disagree Neither agree nor
disagree
Agree Strongly agree
6) My initial decision influenced my second decision more than the updated financial report.
Strongly disagree Disagree Neither agree nor
disagree
Agree Strongly agree
7) The financial information at the point of the second decision was the major reason for my decision.
Strongly disagree Disagree Neither agree nor
disagree
Agree Strongly agree
8) I based my second decision on the same reasons as my initial decision.
Strongly disagree Disagree Neither agree nor
disagree
Agree Strongly agree
9) I have been very satisfied with my initial decision directly after taking it.
Strongly disagree Disagree Neither agree nor
disagree
Agree Strongly agree
10) Before taking the second decision I had the feeling that my initial decision would lead to a desirable
outcome.
Strongly disagree Disagree Neither agree nor
disagree
Agree Strongly agree
11) I had a strong desire to complete the started project.
Strongly disagree Disagree Neither agree nor
disagree
Agree Strongly agree
12) I spent a long time on the initial decision and perceived it as effortful.
Strongly disagree Disagree Neither agree nor
disagree
Agree Strongly agree
13) I spent a long time on the second decision and perceived it as effortful.
Strongly disagree Disagree Neither agree nor
disagree
Agree Strongly agree

Appendix A – Instructions 80
14) Although my initial decision led to negative consequences, I believe that continued investment in the
initially chosen department would result in positive consequences eventually.
Strongly disagree Disagree Neither agree nor
disagree
Agree Strongly agree
15) I had the feeling that the 10 million dollars would be wasted if I choose to invest the 20 million dollars
to the other division.
Strongly disagree Disagree Neither agree nor
disagree
Agree Strongly agree
16) I get over negative events quickly and focus on taking actions that result in better outcomes.
Strongly disagree Disagree Neither agree nor
disagree
Agree Strongly agree
17) I find it difficult to overcome a negative event and keep ruminating about how it affects the current
state.
Strongly disagree Disagree Neither agree nor
disagree
Agree Strongly agree
18) How satisfied have you been with your first decision directly after taking it? Did your satisfaction
change in the course of the experiment, for example after you received the data for the second deci-
sion? If so, please explain.
19) Did you change your opinion during the experiment in which department you want to invest more?
Why?

Appendix A – Instructions 81
20) Did you have the feeling that your decisions were anonymous? Would you have made decisions dif-
ferently if this would not have been the case?
21) Do you have any other comments which you want to mention here?
This is the end of the experiment.
Thank you for your participation!

Appendix A – Instructions 82
Audience condition
CONSENT FORM
Psychology experiment, Budapest, ….. / ….. / 2015
You are about to participate in an experiment on decision-making. Your participation is voluntary and you can
withdraw at any time from the experiment.
None of your personal details will appear in any published document. Furthermore, it will not be possible to
associate your name to any decision or behavior related to the task. The results of the experiment may lead to
the publication of statistical data that will under no circumstances refer to you personally.
In the course of the experiment voice recording might be applied. Under no circumstances will these audio
tapes be handed to third persons or associated with your name in any resulting publication.
We do not envisage any negative consequence for you in taking part in this experiment. You participation will
allow us to investigate specific aspects of human psychology and behavior.
If you need any further information, please ask the experimenter.
Please complete the form and sign below if you agree to take part in the experiment.
I, ……………………………………………………………..… agree to participate in the current research
study.
I am participating voluntarily. I understand that I can withdraw from the study, without repercussions, at any
time. I understand that anonymity in any resulting publications will be ensured.
Signed: …………………………………………………………….. Date: …..... / …….. / 2015

Appendix A – Instructions 83
Personal Data
First name:
Surname:
Age:
Sex:
Current profession (student, employed, in training, etc.):
I have a background in Economics or Business:
If yes, please explain:
I have experience in Behavioural Economics:

Appendix A – Instructions 84
Department of Cognitive Science
Central European University
Oktober 6 street 7, 1st floor
Budapest, 1051, Hungary
[t]: +36 1 887-5138
[e]: [email protected]
Budapest, summer term 2015
The D&A Financial Decision Case
Thank you for volunteering for this experiment on financial problem-solving. Your participation helps us to
understand decision-making in various contexts.
Your task is to play the role of a corporate executive and to solve the “D&A Financial Decision case”. Attached
to this paper you find information about the “Davis and Anderson company” (D&A) which is specialized on
camera technologies. You are provided with the company’s financial information of sales and earnings of the
previous years and a short description of the relevant departments. You are going to decide about the allocation
of research and development funds.
Please take your first decision in view of the financial report. Then, you will receive an updated financial report
which depicts the sales and earnings of the D&A company five years after your initial decision. Based on this
information we ask you to take the second decision. In the last part of the experiment you are asked to fill-out a
questionnaire.

Appendix A – Instructions 85
The D&A Financial Decision Case
The Davis and Anderson Company is a large technologically-oriented firm. As the financial history including ten prior
years of sales and earnings data depict, the company has started to decline over several preceding years. The directors of
the company agree that one of the major reasons for the decline in corporate earnings and a deterioration in competitive
position lay in some aspects of the firm’s program of research and development. Therefore, the directors have concluded
that 10 million dollars of additional Research and Development (R&D) funds should be made available. This money can
be invested in one of the corporation’s two largest divisions: Consumer Products or Industrial Products. For the time
being, only one of the two divisions can receive the additional funding. Please imagine yourself in the role of the
Financial Vice President and decide upon the division which should receive the 10 million dollars. Make your decision on
the basis of the financial data and with regard to the potential benefits that R&D funding will have on the future earnings
of the divisions.
Consumer Products The consumer products developed by the D&A company are high-tech cameras at affordable prices. These products are
split into two main specializations: Cameras for outdoor activities and small, low-weight cameras for everyday usage.
The main challenge is to provide compelling advantages in comparison to mobile phone cameras without exceeding the
price limits for the target group, which are active adults in the age range of 18 to 45 years interested in social activities,
sports and travel. Future investment could target design elements and new products, e.g. a waterproof and particularly
small hybrid model.
Industrial Products
The D&A company does not limit itself to the production of consumer products but also applies its technologies for the
production of cameras used in industry. Recently two new potential targets were defined: The development of cameras
for clinical usage and cameras for laptops. Technological features initially developed for consumer products, as for
example water and lipid resistance, could be re-adapted for these purposes. Both ideas for new industrial products require
intense research but have the potential to lead to long-term cooperation with major technology-oriented companies and
hospitals.
CONSUMER PRODUCTS CONTRIBUTION TO SALES AND EARNINGS
Fiscal year Sales* Earnings*
1999 624 14.42
2000 626 10.27
2001 649 8.65
2002 681 8.46
2003 674 4.19
2004 702 5.35
2005 717 3.92
2006 741 4.66
2007 765 2.48
2008 770 -0.12
2009 769 -0.63
INDUSTRIAL PRODUCTS CONTRIBUTION TO SALES AND EARNINGS
Fiscal year Sales* Earnings*
1999 670 15.31
2000 663 10.92
2001 689 11.06
2002 711 10.44
2003 724 9.04
2004 735 6.38
2005 748 5.42
2006 756 3.09
2007 784 3.26
2008 788 -0.81
2009 791 -0.80
* In millions of dollars.
If you have made your decision, please go to the experimenter and tell him or her in which division you would
like to invest the 10 million dollars and state the reasons for your choice.

Appendix A – Instructions 86
The D&A Financial Decision Case 2015
Today, five years after the initial allocation of the 10 million dollars of additional research and development funds to the
Consumer Products division, the R&D program of the Davis and Anderson Company is again up for re-evaluation. The
management of the company is convinced that there is an even greater need for expenditure on research and development.
Twenty million dollars have been made available from a capital reserve for R&D funding. As the Financial Vice
President you are asked to decide upon its proper allocation. Financial data is provided for each of the five years since the
initial allocation and, as earlier, the investment decision is to be made on the basis of future contribution to earnings.
Please specify the amount of money that should be allocated to either the Consumer Products or Industrial Products
division. This time, however, you are allowed to divide the R&D money in any way you wish among the two major
divisions.
CONSUMER PRODUCTS CONTRIBUTION TO SALES AND EARNINGS
Fiscal year Sales* Earnings*
1999 624 14.42
2000 626 10.27
2001 649 8.65
2002 681 8.46
2003 674 4.19
2004 702 5.35
2005 717 3.92
2006 741 4.66
2007 765 2.48
2008 770 -0.12
2009 769 -0.63
2010 771 -1.12
2011 774 -1.96
2012 762 -3.87
2013 778 -3.83
2014 783 -4.16
First R&D funding decision as of 2009: 10 million $ for the Consumer Products division
INDUSTRIAL PRODUCTS CONTRIBUTION TO SALES AND EARNINGS
Fiscal year Sales* Earnings*
1999 670 15.31
2000 663 10.92
2001 689 11.06
2002 711 10.44
2003 724 9.04
2004 735 6.38
2005 748 5.42
2006 756 3.09
2007 784 3.26
2008 788 -0.81
2009 791 -0.80
2010 818 0.02
2011 829 -0.09
2012 827 -0.23
2013 846 0.06
2014 910 1.28
*In millions of dollars.
Please decide in the role of the Financial Vice President what amount of money you want to spend on each of the two
divisions. Inform the experimenter about your decision and the reasons for your choice.
First R&D funding decision as of 2009: 10 million $ for the Consumer Products division

Appendix A – Instructions 87
The D&A Financial Decision Case 2015
Today, five years after the initial allocation of the 10 million dollars of additional research and development funds to the
Industrial Products division, the R&D program of the Davis and Anderson Company is again up for re-evaluation. The
management of the company is convinced that there is an even greater need for expenditure on research and development.
Twenty million dollars have been made available from a capital reserve for R&D funding. As the Financial Vice
President you are asked to decide upon its proper allocation. Financial data is provided for each of the five years since the
initial allocation decision and, as earlier, the investment decision is to be made on the basis of future contribution to
earnings. Please specify the amount of money that should be allocated to either the Consumer Products or Industrial
Products division. This time, however, you are allowed to divide the R&D money in any way you wish among the two
major divisions.
INDUSTRIAL PRODUCTS CONTRIBUTION TO SALES AND EARNINGS
Fiscal year Sales* Earnings*
1999 670 15.31
2000 663 10.92
2001 689 11.06
2002 711 10.44
2003 724 9.04
2004 735 6.38
2005 748 5.42
2006 756 3.09
2007 784 3.26
2008 788 -0.81
2009 791 -0.80
2010 771 -1.12
2011 774 -1.96
2012 762 -3.87
2013 778 -3.83
2014 783 -4.16
First R&D funding decision as of 2009: 10 million $ for the Industrial Products division
CONSUMER PRODUCTS CONTRIBUTION TO SALES AND EARNINGS
Fiscal year Sales* Earnings*
1999 624 14.42
2000 626 10.72
2001 649 8.65
2002 681 8.46
2003 674 4.19
2004 702 5.35
2005 717 3.92
2006 741 4.66
2007 765 2.48
2008 770 -0.12
2009 769 -0.63
2010 818 0.02
2011 829 -0.09
2012 827 -0.23
2013 846 0.06
2014 910 1.28
* In millions of dollars.
Please decide in the role of the Financial Vice President what amount of money you want to spend on each of the two
divisions. Inform the experimenter about your decision and the reasons for your choice.
First R&D funding decision as of 2009: 10 million $ for the Industrial Products division

Appendix A – Instructions 88
1) I felt very committed to my initial decision throughout the experiment.
Strongly disagree Disagree Neither agree nor
disagree
Agree Strongly agree
2) I felt personally responsible for the outcome of the initial decision.
Strongly disagree Disagree Neither agree nor
disagree
Agree Strongly agree
3) I had the feeling that my initial decision led to negative consequences.
Strongly disagree Disagree Neither agree nor
disagree
Agree Strongly agree
4) I had the feeling that my decisions were evaluated by others.
Strongly disagree Disagree Neither agree nor
disagree
Agree Strongly agree
5) The presence of the experimenter influenced my decision.
Strongly disagree Disagree Neither agree nor
disagree
Agree Strongly agree
6) It was important for me what others might think about my decision.
Strongly disagree Disagree Neither agree nor
disagree
Agree Strongly agree
7) It was important for me what impression the experimenter has of my decision.
Strongly disagree Disagree Neither agree nor
disagree
Agree Strongly agree
8) I had the feeling that I have to make decisions fast because the experimenter was present.
Strongly disagree Disagree Neither agree nor
disagree
Agree Strongly agree
9) My initial decision influenced my second decision more than the updated financial report.
Strongly disagree Disagree Neither agree nor
disagree
Agree Strongly agree
Questionnaire
Thank you for your work on the D&A Financial Decision Case. This questionnaire is the last part of the
experiment. Please write the answers or circle the most appropriate choice.

Appendix A – Instructions 89
10) The financial information at the point of the second decision was the major reason for my decision.
Strongly disagree Disagree Neither agree nor
disagree
Agree Strongly agree
11) I based my second decision on the same reasons as my initial decision.
Strongly disagree Disagree Neither agree nor
disagree
Agree Strongly agree
12) I had the feeling that I would violate social norms if I invested all money in one division only in the
second decision.
Strongly disagree Disagree Neither agree nor
disagree
Agree Strongly agree
13) I had the feeling that I would violate social norms if I would invest nothing in the failing division in
the second decision.
Strongly disagree Disagree Neither agree nor
disagree
Agree Strongly agree
14) I wanted others to think that I make good decisions.
Strongly disagree Disagree Neither agree nor
disagree
Agree Strongly agree
15) I had the feeling that I would be judged based on the decisions I make.
Strongly disagree Disagree Neither agree nor
disagree
Agree Strongly agree
16) I have been very satisfied with my initial decision directly after taking it.
Strongly disagree Disagree Neither agree nor
disagree
Agree Strongly agree
17) Before taking the second decision I had the feeling that my initial decision would lead to a desirable
outcome.
Strongly disagree Disagree Neither agree nor
disagree
Agree Strongly agree
18) I had a strong desire to complete the started project.
Strongly disagree Disagree Neither agree nor
disagree
Agree Strongly agree

Appendix A – Instructions 90
19) I spent a long time on the initial decision and perceived it as effortful.
Strongly disagree Disagree Neither agree nor
disagree
Agree Strongly agree
20) I spent a long time on the second decision and perceived it as effortful.
Strongly disagree Disagree Neither agree nor
disagree
Agree Strongly agree
21) Although my initial decision led to negative consequences, I believe that continued investment in the
initially chosen department would result in positive consequences eventually.
Strongly disagree Disagree Neither agree nor
disagree
Agree Strongly agree
22) I had the feeling that the 10 million dollars would be wasted if I choose to invest the 20 million dollars
to the other division.
Strongly disagree Disagree Neither agree nor
disagree
Agree Strongly agree
23) I get over negative events quickly and focus on taking actions that result in better outcomes.
Strongly disagree Disagree Neither agree nor
disagree
Agree Strongly agree
24) I find it difficult to overcome a negative event and keep ruminating about how it affects the current
state.
Strongly disagree Disagree Neither agree nor
disagree
Agree Strongly agree
25) How satisfied have you been with your first decision directly after taking it? Did your satisfaction
change in the course of the experiment, for example after you received the data for the second deci-
sion? If so, please explain.
26) Did you change your opinion during the experiment in which department you want to invest more?
Why?

Appendix A – Instructions 91
27) Did you have the feeling that your decisions were monitored? Would you have made decisions differ-
ently if this would not have been the case?
28) Do you have any other comments which you want to mention here?
Thank you for your participation!

Appendix B – Results 92
Appendix B – Results
In Table 8 and Table 9 investment decisions (in hypothetical million dollars) and answers to
likert-scale questions (5-point scale: 1 = “Strongly disagree”, 2 = “Agree”, 3 = “Neither agree
nor disagree”, 4 = “Agree”, 5 = “Strongly Agree”) are provided. Personal data (age, sex, profes-
sion etc.) and information on the experimental session (date, location etc.) are not included to
guarantee anonymity to the participants. All gathered data, including the original forms filled-out
by the participants, are stored by the experimenter. Answers to open questions and the audio files
containing the arguments provided by participants in the audience condition can be obtained by
contacting the author of the study ([email protected]).

Appendix B – Results 93
Part
icip
ant
Deci
sion 1
CP
IP
Q1
: “I
felt
ver
y
com
mit
ted
to
my
in
itia
l
dec
isio
n
thro
ugh
ou
t
the
exp
erim
ent”
Q2
: “I
felt
per
son
ally
resp
on
sib
le
for
the
ou
tco
me
of
the
init
ial
dec
isio
n.”
Q3
: “I
had
th
e
feel
ing
that
my
in
itia
l
dec
isio
n l
ed t
o
neg
ativ
e
con
seq
uen
ces.
”
Q4
: ”M
y
init
ial
dec
isio
n
infl
uen
ced
my
seco
nd
dec
isio
n m
ore
than
th
e
up
dat
ed
fin
anci
al
rep
ort
.”
Q5
: “T
he
fin
anci
al
info
rmat
ion
at
the
po
int
of
the
seco
nd
dec
isio
n w
as
the
maj
or
reas
on
fo
r m
y
dec
isio
n.”
Q6
: “I
bas
ed
my
sec
on
d
dec
isio
n o
n
the
sam
e
reas
on
s as
my
init
ial
dec
isio
n.”
Q7
: “I
hav
e
bee
n v
ery
sati
sfie
d w
ith
my
in
itia
l
dec
isio
n
dir
ectl
y a
fter
tak
ing
it.”
Q8
: “B
efo
re
tak
ing
the
seco
nd
dec
isio
n I
had
the
feel
ing
that
my
in
itia
l
dec
isio
n
wo
uld
lea
d t
o
a d
esir
able
ou
tco
me.
”
Q9
: “I
had
a
stro
ng
des
ire
to c
om
ple
te
the
star
ted
pro
ject
.”
Q1
0:
“I
spen
t
a lo
ng
tim
e o
n
the
init
ial
dec
isio
n a
nd
per
ceiv
ed i
t as
effo
rtfu
l.”
Q1
1:
“I
spen
t
a lo
ng
tim
e o
n
the
seco
nd
dec
isio
n a
nd
per
ceiv
ed i
t as
effo
rtfu
l.”
Q1
2:
“A
lth
ou
gh
my
in
itia
l
dec
isio
n l
ed t
o
neg
ativ
e
con
seq
uen
ces,
I
bel
iev
e th
at
con
tin
ued
inv
estm
ent
in t
he
init
iall
y c
ho
sen
dep
artm
ent
wo
uld
res
ult
in
po
siti
ve
con
seq
uen
ces
even
tual
ly.”
Q1
3:
“I
had
the
feel
ing
that
th
e 1
0
mil
lio
n d
oll
ars
wo
uld
be
was
ted
if
I
cho
ose
to
inv
est
the
20
mil
lio
n d
oll
ars
to t
he
oth
er
div
isio
n.”
Q1
4:
“I
get
ov
er n
egat
ive
even
ts
qu
ick
ly a
nd
focu
s o
n
tak
ing
acti
on
s
that
res
ult
in
bet
ter
ou
tco
mes
.”
Q1
5:
“I
fin
d i
t
dif
ficu
lt t
o
ov
erco
me
a
neg
ativ
e ev
ent
and
kee
p
rum
inat
ing
abo
ut
ho
w i
t
affe
cts
the
curr
ent
stat
e.”
Q A
n.
1:
“I
felt
th
at
no
bo
dy
can
trac
k m
y
init
ial
dec
isio
n.”
Q A
n.
2:
“I
had
th
e fe
elin
g
that
my
dec
isio
ns
wer
e
com
ple
tely
ano
ny
mo
us.
”
An1
CP
020
21
32
21
52
22
22
42
24
2
An2
IP15
53
32
32
24
24
22
42
43
42
An3
IP20
02
44
55
25
54
43
44
22
43
An4
CP
515
44
33
52
51
23
33
32
25
1
An5
IP10
10
34
43
45
21
14
42
35
42
2
An6
CP
15
54
53
25
25
13
24
44
54
42
An7
CP
416
34
42
22
42
34
44
32
22
4
An8
IP10
10
45
43
42
42
34
42
44
44
2
An9
IP15
54
44
3n.
a.n.
a.n.
a.n.
a.n.
a.n.
a.n.
a.n.
a.n.
a.n.
a.n.
a.n.
a.n.
a.
An1
0IP
19
1n.
a.n.
a.2
44
25
2n.
a.3
n.a.
32
22
n.a.
n.a.
An1
1C
P12
84
34
44
24
42
43
22
44
33
An1
2IP
14
62
33
23
25
43
24
33
55
54
An1
3IP
0.1
19.9
52
34
22
35
34
53
35
24
4
An1
4IP
15
54
24
34
44
42
44
42
23
44
An1
5C
P12
83
42
54
44
24
34
32
22
22
An1
6IP
18
24
54
24
25
22
44
43
24
44
An1
7IP
20
01
42
22
15
54
42
44
12
24
An1
8C
P15
53
44
52
44
45
44
34
45
34
An1
9IP
515
54
32
53
35
44
53
35
24
2
An2
0IP
515
45
21
42
42
44
44
43
54
2
An2
1C
P7
13
24
33
24
44
32
24
43
43
3
An2
2C
P10
10
43
13
52
42
43
33
34
24
4
An2
3IP
19
12
45
32
15
54
n.a.
24
41
14
2
An2
4IP
515
44
22
52
53
54
44
44
21
4
An2
5C
P5
15
44
33
32
43
43
24
22
34
4
An2
6IP
15
52
22
24
15
14
44
32
14
41
An2
7IP
515
n.a.
43
33
43
33
34
44
34
33
An2
8IP
12
82
44
42
25
43
23
25
45
52
An2
9IP
12
83
44
35
55
24
44
32
34
44
An3
0IP
020
55
12
21
15
54
43
35
42
4
An3
1C
P2
18
44
44
32
44
33
44
32
34
2
An3
2IP
515
53
31
21
51
34
41
15
25
1
An3
3IP
515
33
23
42
35
34
43
32
43
3
An3
4IP
020
34
23
32
54
44
23
33
13
3
An3
5IP
12
82
24
23
34
24
44
43
44
42
An3
6IP
515
24
44
54
34
24
43
34
52
3
An3
7C
P5
15
22
23
42
42
32
23
44
24
2
An3
8IP
713
55
11
15
55
53
55
35
55
4
An3
9IP
15
54
44
35
25
52
55
33
43
44
An4
0IP
10
10
33
42
31
52
33
32
24
24
2
Deci
sion 2
Quest
ionnair
e a
nsw
ers
Tab
le 8
: In
ves
tmen
t d
ecis
ion
s an
d a
nsw
ers
to l
iker
t-sc
ale
qu
esti
ons
of
par
tici
pan
ts i
n t
he
anon
ym
ous
con
dit
ion

Appendix B – Results 94

Appendix B – Results 95
CP
IP
Q1: “I
felt
ver
y
com
mit
ted t
o
my
init
ial
dec
isio
n
thro
ugh
out
the
exp
erim
ent”
Q2: “I
felt
per
sonal
ly
resp
onsi
ble
for
the
outc
om
e of
the
init
ial
dec
isio
n.”
Q3: “I
had
the
feel
ing
that
my
init
ial
dec
isio
n led
to
neg
ativ
e
conse
quen
ces.
”
Q4: “M
y
init
ial dec
isio
n
infl
uen
ced m
y
seco
nd
dec
isio
n m
ore
than
the
up
dat
ed
finan
cial
rep
ort
.”
Q5: “T
he
finan
cial
info
rmat
ion a
t
the
poin
t of
the
seco
nd
dec
isio
n w
as
the
maj
or
reas
on f
or
my
dec
isio
n.”
Q6: “I
bas
ed
my
sec
ond
dec
isio
n o
n
the
sam
e
reas
ons
as m
y
init
ial
dec
isio
n.”
Q7: “I
hav
e
bee
n v
ery
sati
sfie
d w
ith
my
init
ial
dec
isio
n
dir
ectl
y a
fter
takin
g it
.”
Q8: “B
efore
takin
g th
e
seco
nd
dec
isio
n I
had
the
feel
ing
that
my
init
ial
dec
isio
n
would
lea
d t
o
a des
irab
le
outc
om
e.”
Q9: “I
had
a
stro
ng
des
ire
to c
om
ple
te
the
star
ted
pro
ject
.”
Q10: “I
spen
t
a lo
ng
tim
e on
the
init
ial
dec
isio
n a
nd
per
ceiv
ed it
as
effo
rtfu
l.”
Q11: “I
spen
t
a lo
ng
tim
e on
the
seco
nd
dec
isio
n a
nd
per
ceiv
ed it
as
effo
rtfu
l.”
Q12: “A
lthough
my
init
ial
dec
isio
n led
to
neg
ativ
e
conse
quen
ces,
I
bel
ieve
that
conti
nued
inves
tmen
t in
the
init
ially
chose
n
dep
artm
ent
would
res
ult
in
posi
tive
conse
quen
ces
even
tual
ly.”
Q13: “I
had
the
feel
ing
that
the
10
million d
ollar
s
would
be
was
ted if
I
choose
to
inves
t th
e 20
million d
ollar
s
to t
he
oth
er
div
isio
n.”
Q14: “I
get
over
neg
ativ
e
even
ts
quic
kly
and
focu
s on
takin
g ac
tions
that
res
ult
in
bet
ter
outc
om
es.”
Q15: “I
find it
dif
ficu
lt t
o
over
com
e a
neg
ativ
e ev
ent
and k
eep
rum
inat
ing
about
how
it
affe
cts
the
curr
ent
stat
e.”
Q A
ud. 1: “I
had
the
feel
ing
that
my
dec
isio
ns
wer
e
eval
uat
ed b
y
oth
ers.
”
Q A
ud. 2:
“T
he
pre
sence
of
the
exp
erim
ente
r
infl
uen
ced m
y
dec
isio
n.”
Q A
ud. 3: “It
was
imp
ort
ant
for
me
what
oth
ers
mig
ht
thin
k a
bout
my
dec
isio
n.”
Q A
ud. 4: “It
was
imp
ort
ant
for
me
what
imp
ress
ion
the
exp
erim
ente
r
has
of
my
dec
isio
n.”
Q A
ud. 5: “I
had
the
feel
ing
that
I h
ave
to
mak
e
dec
isio
ns
fast
bec
ause
the
exp
erim
ente
r
was
pre
sent.
”
Q A
ud. 6: “I
had
the
feel
ing
that
I w
ould
vio
late
soci
al
norm
s if
I
inves
ted a
ll
money
in o
ne
div
isio
n o
nly
in t
he
seco
nd
dec
isio
n.”
Q A
ud. 7: “I
had
the
feel
ing
that
I w
ould
vio
late
soci
al
norm
s if
I
would
inves
t
noth
ing
in t
he
failin
g
div
isio
n in t
he
seco
nd
dec
isio
n.”
Q A
ud. 8: “I
wan
ted o
ther
s
to t
hin
k t
hat
I
mak
e go
od
dec
isio
ns.
”
Q A
ud. 9: “I
had
the
feel
ing
that
I w
ould
be
judge
d
bas
ed o
n t
he
dec
isio
ns
I
mak
e.”
Aud
1IP
19
14
45
21
42
14
32
22
54
54
14
42
14
2
Aud
2IP
020
43
21
13
42
44
42
24
23
44
23
14
14
Aud
3IP
10
10
44
22
51
41
24
22
24
22
43
24
43
43
Aud
4C
P2
18
44
24
34
32
45
25
45
43
44
44
45
33
Aud
5C
P0
20
45
22
41
42
45
23
34
42
44
44
52
44
Aud
6IP
515
44
33
32
33
34
42
23
23
22
44
32
33
Aud
7IP
020
45
24
32
43
33
42
33
43
35
33
42
32
Aud
8C
P3
17
44
34
24
42
25
23
34
23
44
44
33
52
Aud
9C
P0
20
34
42
12
31
24
21
14
23
42
33
55
42
Aud
10
IP10
10
44
52
13
43
24
22
24
22
34
44
24
43
Aud
11
IP20
04
42
41
44
14
42
22
42
34
23
24
44
3
Aud
12
CP
020
24
54
14
21
25
41
14
22
22
24
51
42
Aud
13
IP0
20
44
23
11
12
33
41
14
14
45
43
42
42
Aud
14
IP10
10
45
34
25
52
34
23
45
43
14
44
43
24
Aud
15
IP20
01
44
21
11
11
45
21
42
24
24
42
54
2
Aud
16
IP12
83
54
33
14
11
44
11
43
44
44
41
14
2
Aud
17
IP15
53
44
41
43
11
42
12
44
43
25
33
35
3
Aud
18
IP7
13
44
43
12
11
33
43
33
34
45
33
44
42
Aud
19
IP0
20
44
34
22
22
42
42
24
43
35
43
54
21
Aud
20
IP20
01
22
11
51
11
55
11
15
54
24
42
15
4
Aud
21
IP10
10
53
24
22
11
24
42
23
25
54
44
52
43
Aud
22
IP10
10
43
43
12
21
34
32
24
24
44
44
54
43
Aud
23
IP12
84
45
35
54
45
43
35
44
45
52
24
42
2
Aud
24
IP20
03
42
41
11
12
42
11
22
44
51
12
15
1
Aud
25
CP
812
55
21
22
22
25
52
21
15
54
54
55
52
Aud
26
IP20
02
23
24
44
44
42
23
44
23
34
31
23
2
Aud
27
IP12
62
42
41
52
21
52
11
44
14
14
43
25
1
Aud
28
CP
515
44
43
23
32
54
43
34
44
34
33
43
44
Aud
29
CP
515
43
31
11
11
24
31
13
14
42
22
32
24
Aud
30
IP20
02
44
43
45
41
51
22
45
44
54
23
44
3
Aud
31
IP15
54
44
12
34
32
52
11
43
34
22
23
14
1
Aud
32
IP10
10
22
44
23
33
42
44
44
43
44
24
14
24
Aud
33
CP
10
10
43
32
11
21
44
43
24
44
44
22
44
32
Aud
34
IP5
15
44
44
34
34
24
42
23
42
44
22
42
42
Aud
35
IP5
15
44
23
14
13
43
55
23
34
43
33
53
43
Aud
36
IP20
05
52
42
15
23
34
22
32
54
33
34
15
1
Aud
37
IP20
04
35
52
32
21
52
11
24
33
34
41
34
2
Aud
38
IP6
14
42
34
42
25
41
45
53
33
44
21
55
24
Aud
39
IP10
10
34
44
24
34
43
22
24
41
54
42
42
42
Aud
40
IP2
18
44
13
22
22
32
42
22
24
33
22
42
24
Tab
le 9
: In
ves
tmen
t d
ecis
ion
s an
d l
iker
t-sc
ale
answ
ers
of
par
tici
pan
ts i
n t
he
aud
ien
ce c
on
dit
ion

Appendix B – Results 96

Appendix C – Comparison to the study by Staw (Staw, 1976) 97
Appendix C – Comparison to the study by Staw (Staw, 1976)
The scenario used in the present experiment is an adaptation of the one applied by Staw to study
self-justification as a determinant of the Sunk Cost Fallacy (Staw, 1976). Similarities and differ-
ences between the original scenario and the adaptation are described in Table 10.
Table 10: Similarities and differences to the study by Staw
Staw (1976) Similar Differences in the present experiment
Simulation of a business decision mak-
ing scenario (role-playing exercise)
Two independent variables: Personal
responsibility for the initial decision (yes
/ no) and consequences of the initial de-
cision (positive / negative)
One independent variable: Reasoning in
front of an audience versus anonymous
decision making
Dependent variable: Investments to a
failing department, i.e. the amount of
money subjects allocate to an initially
chosen department (0 to 20 million $)
Location: College of Commerce and
Business Administration, University of
Illinois, Urbana-Champaign (USA)
Location: Central European University,
Budapest (Hungary)
Year: 1976 Year: 2015
240 participants 80 participants
Undergraduate students studying at the
College of Commerce and Business
Administration (University of Illinois)
Neither a business- / economics-related
background nor a student status is a pre-
requisite for participation
No real monetary stakes
Incentive: Participation “as one means to
fulfil a course research requirement”
(Staw, 1976, p. 30)
Not incentivized
Subjects are asked to provide their
names on each page of the material
Only participants in the audience condi-
tion are asked to state their names
Hypothetical corporation Adams & Smith
Company
Hypothetical corporation Davis &
Anderson Company
Hypothetical times of the decisions: De- Hypothetical times of the decisions: De-

Appendix C – Comparison to the study by Staw (Staw, 1976) 98
cision 1: 1967 | Decision 2: 1972 cision 1: 2010 | Decision 2: 2015
Scenario: The sales and earnings of a
large technology-oriented company have
started to decline in the previous years
with the reason lying in the research and
development program
Subjects take the decisions in the role of
the Financial Vice President
Decision 1: Decide whether to spend 10
million $ of R&D funds in the Consumer
or the Industrial Products department
Decision 2: Subjects are told that 5 years
after the first decision the R&D program
is again up for re-evaluation. Now they
can divide 20 million dollars in any way
they wish among the same two depart-
ments.
Subjects are asked to take the decisions
based on the data of the last ten years
(decision 1) / last 15 years (decision 2)
with regard to the potential benefits on
future earnings of the departments.
Participants in all conditions are asked to
circle the chosen department (decision 1)
/ to state the amount they want to allo-
cate to the departments (decision 2) and
to write a brief paragraph defending their
allocation decision after each decision
Anonymous condition: Similar to Staw’s
procedure | Audience condition: Inform
the experimenter personally about the
decisions and provide arguments
Consequences of the first decision: Half
of the participants receive data suggest-
ing that the first decision led to positive
outcomes, the other half that it led to
negative outcomes
The initial choice always leads to nega-
tive consequences (in both conditions)
Manipulation of personal responsibility:
Half of the subjects take the first deci-
sion themselves, the other half are told
that the first decision has been made by
another financial officer
All participants take the first and the
second decision themselves
Self-justification as a determinant of the
SCF is studied through manipulating
personal responsibility and consequences
of the first decision
The role of the social environment trig-
gering psychological mechanisms is
studied: Absence or presence of an ar-
gumentative context (incl. audience)

Appendix D – Data analysis 99
Appendix D – Data analysis
Analysis of the audio recordings
Arguments of participants in the audience condition were audio recorded and analysed based on
a procedure recommended by Gorden (Gorden, 1992): First, I defined coding categories (see
“list of codes”). They are based on the notes which I have taken during the experiment. Catego-
ries are “all-inclusive”, i.e. a category exists for every relevant argument, and “mutually exclu-
sive”, i.e. every argument can only fall into one category (Gorden, 1992, p. 183). Participants’
responses can fall into multiple categories, however, if they stated several arguments. Second,
codings were assigned numerical values. In the next step, I listened to the voice recordings of the
first decision to recognize reasons recurring for the second decision (see section 3.1.4.6). Then, I
listened to the argumentation for the second decision of the same participant and assigned the
corresponding codes. This was repeated until all responses of participants in the audience condi-
tions were coded. To test the reliability of the coding, the “test-retest method” was applied
(Gorden, 1992, p. 185): I coded the audio recordings a second time, after a time span in between,
without referring to the initial coding. Afterwards, I compared the two codings: If there were
differences, I re-listened to the audio recording and then determined the final coding. In the final
step, I connected the codings with second investment decisions of the participants.
List of codes
1. Consideration of updated financial report: Bad outcomes of initially chosen department or
positive outcomes of the other department
2. “The other division did well even without the 10 million dollars of initial investment.”
3. The data might change in the future.
3a. IP is a long-term endeavour based on long-term cooperation.
3b.The initially chosen department still needs more money to yield better results in the future.
4. Outsourcing of responsibility:
4a. The data is negative because of external factors, e.g. financial crisis.
4b. “What they have done” vs. “What I have done”
5. Reasons stated in the first decision are carried over to the second decision.
6. Self-justification: “My initial decision was good.”
7. Absence of reasons
8. Fairness
9. Feeling that not enough information is provided, insecurity what to think about the data
10. Wastefulness
11. “Give a boost” to the department doing well
12. “Reward”: The department with the better outcomes deserves the money.
13. Diversification: Invest in both departments as trends might change.
14. “Obviously, my decision was bad.”
15. Stick with gut feeling
16. “Gamble”: Take the risk of further investing in declining department.

Appendix D – Data analysis 100
Post-hoc matching
In the first step the root mean square (RMS) differences of questionnaire answers (only questions
which were similar in both conditions were considered) between all participants in the two con-
ditions were calculated. In the second step, the initial choice was marked (see 3.2.1.1). In the
third step, participants were matched according to RMS difference and initial choice: First, par-
ticipants initially choosing CP in the audience condition were matched to participants, who also
chose CP, with the smallest RMS difference in the anonymous condition, because fewer partici-
pants in the audience condition initially decided on CP. Second, participants in the anonymous
condition initially choosing IP were matched to participants with the smallest RMS difference in
the audience condition who also chose IP, because there are less participants initially choosing IP
in the anonymous condition. Third, the three remaining participants in the anonymous condition
were matched with the remaining participants in the audience condition with the smallest RMS
difference regardless of the initial choice. Finally, the two exceptional cases in the anonymous
condition – participant “An9” answered only 3 out of 15 questions and “pAn10” 9 out of 15 –
were matched with the two remaining participants in the audience condition.
Table 11: Matched pairs
Audience condition Anonymous condition Selection critera
Participant 2. investment (m. $) Participant 2. investment (m. $) RMS Difference Initial choice
Step 1: Aud4 2 An6 15 1 Both CP
Aud5 0 An22 10 1,125462868 Both CP
Aud8 3 An4 5 0,774596669 Both CP
Aud9 0 An21 7 1,238278375 Both CP
Aud12 0 An37 5 1,211060142 Both CP
Aud25 8 An31 2 1,460593487 Both CP
Aud28 5 An18 15 0,816496581 Both CP
Aud29 5 An25 5 0,894427191 Both CP
Aud33 10 An11 12 0,856348839 Both CP
Step 2: Aud17 5 An2 5 0,894427191 Both IP
Aud16 8 An3 0 0,774596669 Both IP
Aud39 10 An5 10 1,095445115 Both IP
Aud3 10 An8 10 0,774596669 Both IP
Aud7 20 An12 6 1,505545305 Both IP
Aud21 10 An13 19,9 0,930949336 Both IP
Aud26 0 An14 5 1,125462868 Both IP
Aud10 10 An16 2 0,632455532 Both IP
Aud20 0 An17 0 1,032795559 Both IP
Aud13 20 An19 15 0,577350269 Both IP
Aud11 0 An20 15 1,095445115 Both IP
Aud37 0 An23 1 1,195228609 Both IP
Aud14 10 An24 15 1,154700538 Both IP
Aud30 0 An26 5 1,095445115 Both IP
Aud18 13 An27 15 0,88640526 Both IP
Aud15 0 An28 8 1,154700538 Both IP
Aud23 8 An29 8 1,032795559 Both IP
Aud40 18 An30 20 1,095445115 Both IP
Aud24 0 An32 15 1,183215957 Both IP
Aud2 20 An33 15 0,966091783 Both IP
Aud6 15 An34 20 0,894427191 Both IP
Aud22 10 An35 8 0,774596669 Both IP
Aud19 20 An36 15 1,032795559 Both IP
Aud35 15 An38 13 1,264911064 Both IP
Aud34 15 An39 5 0,856348839 Both IP
Aud31 5 An40 10 0,730296743 Both IP
Step 3: Aud27 6 An1 0 1,238278375 An.-CP, Aud.-IP
Aud32 10 An7 4 1,341640786 An.-CP, Aud. IP
Aud36 0 An15 12 1,414213562 An.-CP, Aud.-IP
Step 4: Aud1 1 An10 1 1,632993162 Both IP
Aud38 14 An9 5 1,290994449 Both IP

Appendix D – Data analysis 101
An
1A
n2
An
3A
n4
An
5A
n6
An
7A
n8
An
9A
n10
An
11A
n12
An
13A
n14
An
15A
n16
An
17A
n18
An
19A
n20
An
21A
n22
An
23A
n24
An
25A
n26
An
27A
n28
An
29A
n30
An
31A
n32
An
33A
n34
An
35A
n36
An
37A
n38
An
39A
n40
Au
d1
1,80
71,
506
1,39
01,
461
1,94
91,
807
1,41
41,
571
0,57
71,
633
1,77
02,
160
1,96
61,
633
1,46
11,
673
1,86
21,
673
1,71
31,
673
1,50
61,
612
1,43
91,
732
1,29
11,
949
1,48
81,
915
1,54
92,
266
1,39
02,
049
1,82
61,
390
1,52
81,
897
1,57
12,
324
1,96
61,
592
Au
d2
1,84
41,
751
1,57
11,
826
1,73
21,
949
1,26
51,
612
1,29
11,
374
1,29
11,
789
1,63
31,
211
1,15
51,
461
1,54
91,
317
1,67
31,
549
1,36
61,
528
2,01
81,
390
1,39
01,
732
1,16
51,
880
1,36
61,
770
1,39
02,
176
0,96
61,
438
1,65
31,
265
1,80
71,
949
1,50
61,
789
Au
d3
1,34
21,
155
1,43
81,
033
1,39
01,
065
1,21
10,
775
1,15
51,
155
1,00
01,
317
1,31
71,
414
1,31
71,
095
1,71
31,
414
1,31
71,
033
1,31
70,
856
1,83
21,
342
1,18
31,
528
1,10
21,
291
1,36
61,
653
1,18
31,
291
1,21
11,
125
1,29
11,
366
1,06
51,
880
1,21
11,
033
Au
d4
1,84
41,
317
1,57
11,
461
1,39
01,
000
1,31
71,
065
1,15
51,
599
1,29
11,
317
1,59
21,
366
1,26
51,
095
1,86
21,
033
1,46
10,
816
1,15
51,
238
2,12
11,
238
1,34
21,
612
0,80
21,
438
1,03
31,
770
1,29
11,
807
1,31
71,
483
1,12
51,
155
1,48
31,
342
1,36
61,
549
Au
d5
1,91
51,
461
1,57
11,
414
1,52
81,
125
1,31
71,
238
1,29
11,
453
1,48
31,
506
1,46
11,
461
1,41
41,
211
1,93
21,
461
1,36
61,
317
1,41
41,
125
2,08
71,
291
1,43
82,
017
1,16
51,
693
1,26
51,
915
1,43
81,
732
1,63
31,
342
1,48
31,
506
1,48
31,
528
1,26
51,
506
Au
d6
1,41
41,
065
1,03
31,
291
1,75
11,
317
1,12
51,
317
0,57
71,
247
1,21
11,
438
1,39
01,
238
1,18
31,
291
1,34
21,
342
1,29
11,
342
0,77
51,
095
1,25
41,
211
0,89
41,
826
0,92
61,
366
1,43
81,
713
0,89
41,
897
1,18
30,
894
1,41
41,
390
1,09
51,
751
1,39
01,
291
Au
d7
1,84
41,
317
1,39
01,
414
1,48
31,
291
1,26
51,
125
1,29
11,
247
1,23
81,
506
1,15
51,
414
1,03
31,
414
1,75
11,
366
0,73
01,
211
1,31
71,
183
1,81
31,
238
1,34
21,
807
0,96
41,
571
1,46
11,
342
1,00
01,
612
1,09
51,
183
1,43
81,
265
1,43
81,
571
1,21
11,
366
Au
d8
1,41
41,
125
1,15
50,
775
1,71
30,
894
1,12
50,
816
0,57
71,
000
1,26
51,
342
1,43
81,
291
1,29
10,
856
1,69
31,
390
1,29
10,
775
1,34
21,
095
1,51
21,
366
1,09
51,
265
1,06
91,
265
1,23
81,
932
0,81
61,
366
1,29
11,
211
1,03
31,
528
1,21
11,
713
1,18
31,
065
Au
d9
1,59
21,
065
1,50
61,
342
1,36
61,
033
1,43
80,
816
0,57
71,
667
0,96
61,
183
1,65
31,
571
1,57
11,
238
1,91
51,
238
1,52
81,
065
1,23
81,
366
1,85
21,
633
1,26
51,
549
1,22
51,
095
1,29
11,
826
1,26
51,
461
1,43
81,
461
0,96
61,
183
1,26
51,
932
1,43
81,
065
Au
d10
1,48
31,
414
1,29
11,
095
1,57
11,
125
0,96
60,
931
0,57
71,
453
1,18
31,
414
1,59
21,
155
1,46
10,
632
1,78
91,
366
1,59
21,
095
1,26
51,
483
1,55
81,
612
1,12
51,
528
0,96
41,
291
1,26
52,
049
0,77
51,
770
1,31
71,
571
1,18
31,
317
1,48
32,
017
1,26
51,
265
Au
d11
1,69
30,
966
1,57
11,
265
1,34
21,
238
1,36
61,
125
1,15
51,
247
1,06
51,
366
1,54
91,
265
1,15
51,
211
1,86
21,
265
1,41
41,
095
1,15
51,
000
2,01
81,
483
1,00
01,
571
1,03
51,
528
0,96
61,
732
1,29
11,
483
1,31
71,
238
1,18
31,
265
1,29
11,
571
1,46
11,
265
Au
d12
1,36
61,
483
1,31
71,
483
1,86
21,
549
1,61
21,
414
1,29
11,
795
1,36
61,
483
1,69
31,
770
1,77
01,
732
1,80
71,
770
1,61
21,
915
1,39
01,
633
1,36
31,
826
1,63
32,
098
1,64
81,
211
1,80
72,
309
1,41
41,
751
1,77
01,
317
1,59
21,
653
1,21
12,
394
1,52
81,
065
Au
d13
1,86
21,
238
1,26
51,
438
1,67
31,
366
1,29
11,
211
1,15
51,
333
1,31
71,
483
1,00
01,
291
1,12
51,
438
1,73
21,
291
0,57
71,
125
1,39
01,
095
1,73
21,
211
1,26
51,
673
1,00
01,
633
1,39
01,
366
0,96
61,
592
1,06
51,
155
1,21
11,
390
1,41
41,
414
1,18
31,
390
Au
d14
1,78
91,
291
1,59
21,
528
1,54
90,
966
1,12
51,
265
0,81
61,
374
1,46
11,
438
1,61
21,
571
1,23
81,
238
1,80
71,
342
1,52
81,
291
1,12
51,
211
1,87
11,
155
1,26
51,
966
0,92
61,
549
1,39
01,
713
1,26
51,
966
1,52
81,
461
1,50
61,
390
1,41
41,
713
1,57
11,
483
Au
d15
1,59
21,
612
1,09
51,
693
2,06
61,
789
1,57
11,
506
1,73
21,
826
1,36
61,
438
1,94
91,
612
1,88
01,
438
1,34
21,
571
1,91
51,
483
1,18
31,
897
1,30
91,
966
1,46
11,
673
1,33
61,
155
1,80
72,
129
1,21
12,
280
1,18
31,
549
1,46
11,
342
1,59
22,
280
1,52
81,
612
Au
d16
1,65
31,
592
0,77
51,
317
2,20
61,
693
1,09
51,
390
0,81
61,
414
1,61
21,
862
1,67
31,
549
1,41
41,
317
1,26
51,
673
1,46
11,
414
1,54
91,
571
0,80
21,
483
1,23
81,
612
1,46
41,
653
1,71
31,
983
0,85
61,
949
1,31
71,
125
1,57
11,
789
1,61
22,
206
1,41
41,
414
Au
d17
1,43
80,
894
1,12
51,
155
1,98
31,
183
1,15
51,
238
0,57
71,
202
1,39
01,
366
1,67
31,
461
1,50
61,
095
1,54
91,
506
1,63
31,
155
1,26
51,
183
1,30
91,
528
0,77
51,
438
1,30
91,
390
1,41
41,
949
1,00
01,
693
1,46
11,
238
1,12
51,
673
1,18
31,
983
1,54
91,
095
Au
d18
1,88
01,
366
1,29
11,
506
1,43
81,
291
1,31
70,
856
0,00
01,
599
1,00
01,
265
1,09
51,
211
1,31
71,
265
1,89
70,
894
0,73
01,
033
1,31
71,
390
1,75
31,
438
1,29
11,
653
0,88
61,
291
1,15
51,
438
0,85
61,
571
1,03
31,
438
1,00
01,
033
1,57
11,
483
1,03
31,
317
Au
d19
2,14
51,
506
1,77
01,
826
1,23
81,
438
1,59
21,
342
0,57
71,
915
1,34
21,
633
1,41
41,
549
1,36
61,
713
2,16
01,
317
1,03
31,
366
1,36
61,
653
2,20
41,
571
1,69
32,
017
0,96
41,
693
1,59
21,
483
1,29
11,
949
1,31
71,
732
1,34
21,
033
1,69
31,
653
1,54
91,
713
Au
d20
1,52
81,
592
1,00
01,
897
2,69
62,
176
1,67
32,
049
2,38
01,
374
1,88
01,
713
1,78
91,
751
1,86
21,
932
1,03
31,
862
1,93
21,
932
1,63
31,
483
1,22
51,
693
1,43
81,
770
1,81
31,
807
1,96
62,
236
1,61
22,
295
1,50
61,
125
1,69
32,
129
1,43
82,
295
1,78
91,
673
Au
d21
1,93
21,
390
1,36
61,
693
2,03
31,
506
1,48
31,
366
1,41
41,
599
1,41
41,
571
0,93
11,
528
1,57
11,
612
1,77
01,
342
0,85
61,
291
1,65
31,
033
1,79
31,
033
1,36
61,
862
1,33
61,
751
1,61
21,
366
1,31
71,
633
1,34
21,
155
1,36
61,
732
1,50
61,
506
1,23
81,
483
Au
d22
1,73
21,
211
1,29
11,
506
1,48
31,
065
1,26
50,
931
0,57
71,
700
1,06
51,
095
1,09
51,
211
1,46
11,
211
1,86
20,
816
1,03
31,
033
1,21
11,
183
1,79
31,
238
1,23
81,
693
0,88
61,
238
1,09
51,
612
1,06
51,
612
1,26
51,
390
0,77
51,
155
1,34
21,
438
1,09
51,
265
Au
d23
2,20
61,
789
1,73
21,
826
1,23
81,
693
1,46
11,
238
0,57
71,
915
1,23
81,
789
1,63
31,
414
1,31
71,
549
2,22
11,
095
1,31
71,
549
1,63
31,
807
2,13
81,
612
1,69
31,
915
1,28
21,
807
1,03
31,
949
1,43
81,
770
1,54
91,
732
1,29
11,
095
1,98
31,
880
1,41
41,
592
Au
d24
1,69
31,
506
1,69
31,
211
2,01
71,
807
1,59
21,
483
1,29
10,
943
1,65
31,
932
1,78
91,
751
1,21
11,
713
2,03
32,
000
1,54
91,
633
2,00
01,
438
1,90
91,
880
1,57
11,
291
1,81
31,
949
1,63
32,
176
1,43
81,
183
1,59
21,
438
1,61
22,
000
1,61
22,
324
1,75
11,
211
Au
d25
2,39
41,
693
1,59
21,
949
2,30
91,
506
1,94
91,
461
1,41
42,
082
1,67
31,
571
1,61
21,
880
1,98
31,
653
2,04
91,
390
1,29
11,
125
1,73
21,
673
2,05
31,
592
1,63
32,
066
1,53
51,
633
1,77
01,
592
1,46
12,
033
1,57
11,
673
1,63
31,
807
2,00
01,
155
1,43
81,
915
Au
d26
1,15
51,
291
1,36
61,
183
1,63
31,
713
1,12
51,
633
1,73
21,
000
1,50
61,
770
1,84
41,
125
1,00
01,
438
1,57
11,
732
1,84
41,
612
1,18
31,
461
1,58
11,
713
1,31
71,
317
1,13
41,
751
1,39
02,
394
1,21
11,
966
1,34
21,
366
1,21
11,
483
1,15
52,
309
1,77
01,
390
Au
d27
1,23
81,
317
1,48
31,
033
2,04
91,
528
1,63
31,
528
1,63
30,
943
1,65
31,
789
2,06
61,
862
1,75
11,
549
1,67
32,
129
2,00
01,
549
1,54
91,
528
1,58
11,
949
1,52
81,
571
1,71
11,
571
1,96
62,
436
1,48
31,
770
1,71
31,
342
1,61
21,
932
1,12
52,
490
1,82
61,
317
Au
d28
1,91
51,
414
1,29
11,
633
1,52
81,
438
1,31
71,
238
0,00
01,
633
1,18
31,
265
1,21
11,
033
1,26
51,
317
1,86
20,
816
1,03
31,
414
1,09
51,
291
1,81
31,
390
1,18
31,
983
0,88
61,
438
0,81
61,
732
1,12
51,
844
1,31
71,
342
1,23
81,
155
1,57
11,
291
1,15
51,
461
Au
d29
1,46
11,
183
1,31
71,
483
1,75
11,
673
1,00
01,
366
0,81
60,
816
0,96
61,
612
1,34
21,
291
1,12
51,
390
1,39
01,
390
1,43
81,
528
1,39
00,
966
1,60
41,
095
0,89
41,
592
1,36
31,
751
1,34
21,
592
1,26
51,
549
1,18
30,
816
1,41
41,
483
1,31
72,
098
1,39
01,
065
Au
d30
1,67
31,
291
1,41
41,
342
1,82
61,
211
1,06
51,
155
1,15
51,
202
1,41
41,
342
1,77
01,
528
1,39
01,
000
1,77
01,
438
1,73
21,
125
1,61
21,
414
1,77
31,
506
1,26
51,
095
1,36
31,
549
1,18
32,
066
1,21
11,
549
1,48
31,
549
0,96
61,
528
1,54
92,
033
1,43
81,
125
Au
d31
1,34
21,
211
1,39
00,
816
1,77
01,
483
1,31
71,
183
0,00
00,
943
1,23
81,
826
1,71
31,
549
1,26
51,
414
1,82
61,
826
1,50
61,
549
1,63
31,
342
1,43
91,
653
1,23
81,
483
1,62
61,
653
1,50
62,
206
1,18
31,
065
1,63
31,
065
1,43
81,
789
1,29
12,
352
1,54
90,
730
Au
d32
1,75
11,
880
1,50
61,
983
1,63
32,
129
1,34
21,
673
1,63
31,
886
1,41
41,
770
1,69
31,
238
1,48
31,
653
1,65
31,
291
1,80
71,
770
1,34
21,
789
1,89
01,
789
1,59
21,
826
1,13
41,
751
1,48
32,
000
1,46
12,
394
1,06
51,
713
1,46
11,
125
1,75
12,
309
1,65
31,
844
Au
d33
1,77
01,
265
1,43
81,
549
1,39
01,
483
1,41
41,
125
0,81
61,
491
0,85
61,
317
1,21
11,
155
1,09
51,
461
1,86
20,
966
0,96
61,
265
1,26
51,
291
1,90
91,
390
1,29
11,
571
1,03
51,
438
1,03
31,
571
1,12
51,
483
1,03
31,
291
1,06
51,
033
1,48
31,
528
1,21
11,
265
Au
d34
1,54
91,
342
1,26
51,
183
1,50
61,
414
1,23
80,
966
0,00
01,
291
0,73
01,
390
1,06
51,
183
1,34
21,
238
1,80
71,
483
0,93
11,
438
1,48
31,
317
1,55
81,
549
1,26
51,
673
1,30
91,
414
1,39
01,
751
0,89
41,
155
1,18
31,
155
1,31
71,
291
1,41
41,
966
0,85
60,
856
Au
d35
1,96
61,
291
1,36
61,
732
1,63
31,
549
1,57
11,
317
1,15
51,
795
1,15
51,
342
1,06
51,
342
1,39
01,
612
1,77
01,
065
0,77
51,
342
1,18
31,
155
1,89
01,
366
1,26
52,
000
1,06
91,
506
1,34
21,
265
1,26
51,
789
1,12
51,
155
1,36
61,
238
1,46
11,
265
1,23
81,
528
Au
d36
2,01
71,
366
1,48
31,
461
2,01
71,
612
1,71
31,
390
1,41
41,
333
1,61
21,
897
1,46
11,
751
1,41
41,
789
1,96
61,
673
0,89
41,
414
1,67
31,
291
1,75
31,
571
1,39
01,
949
1,46
41,
807
1,71
31,
612
1,29
11,
571
1,54
91,
183
1,65
31,
897
1,57
11,
732
1,63
31,
506
Au
d37
1,18
31,
366
1,18
30,
966
2,01
71,
390
1,09
51,
238
0,81
61,
374
1,39
01,
673
1,78
91,
366
1,50
61,
033
1,63
31,
673
1,78
91,
317
1,46
11,
528
1,19
51,
653
1,12
51,
291
1,38
91,
438
1,54
92,
295
0,85
61,
732
1,46
11,
438
1,29
11,
751
1,39
02,
324
1,54
91,
155
Au
d38
2,28
01,
770
2,12
92,
266
1,41
42,
066
1,80
71,
751
1,29
12,
261
1,21
11,
693
1,39
01,
483
1,73
21,
949
2,35
21,
438
1,52
81,
880
1,73
21,
713
2,61
91,
897
1,75
12,
191
1,46
42,
066
1,61
21,
506
1,78
92,
066
1,39
01,
966
1,59
21,
183
1,96
62,
000
1,69
31,
880
Au
d39
1,82
61,
483
1,59
21,
291
1,09
51,
506
1,23
81,
265
0,57
71,
528
1,26
51,
732
1,52
81,
183
1,34
21,
291
2,08
21,
653
1,39
01,
528
1,52
81,
549
1,90
91,
789
1,50
61,
789
1,22
51,
826
1,29
12,
129
1,26
51,
592
1,52
81,
549
1,21
11,
238
1,54
92,
098
1,34
21,
342
Au
d40
1,93
21,
342
1,67
31,
844
1,71
31,
789
1,43
81,
592
1,73
21,
491
1,31
71,
693
1,29
11,
571
1,18
31,
770
1,69
31,
483
1,23
81,
612
1,43
81,
033
2,08
71,
265
1,26
52,
000
1,30
91,
932
1,61
21,
095
1,50
61,
862
1,18
31,
155
1,71
31,
483
1,50
61,
826
1,61
21,
571
Tab
le 1
2:
RM
S d
iffe
ren
ces
of
qu
esti
onn
aire
an
swer
s (f
irst
dec
isio
n C
P m
ark
ed g
rey
and
IP
wh
ite)

Appendix D – Data analysis 102
Correlations between second investments and questionnaire answers
The correlation coefficients of second investments and questionnaire answers were calculated in
both anonymous condition (Table 13) and audience condition (Table 14) applying Spearman’s
test.
Table 13: Correlations between second investments and questionnaire answers in the anonymous condition
Question r s pSignificance threshold
(Bonferroni-corrected)n
A.) General questions
Q1: “I felt very committed to my initial decision
throughout the experiment”0.45 .005 < .003 38
Q2: “I felt personally responsible for the outcome of
the initial decision.”0.17 .292 < .003 39
Q3: “I had the feeling that my initial decision led to
negative consequences.”-0.29 .071 < .003 40
Q4: ”My initial decision influenced my second
decision more than the updated financial report.”0.26 .117 < .003 39
Q5: “The financial information at the point of the
second decision was the major reason for my decision.”-0.43 .007 < .003 39
Q6: “I based my second decision on the same reasons
as my initial decision.”0.10 .562 < .003 39
Q7: “I have been very satisfied with my initial decision
directly after taking it.”0.23 .164 < .003 38
Q8: “Before taking the second decision I had the
feeling that my initial decision would lead to a
desirable outcome.”
0.23 .160 < .003 38
Q9: “I had a strong desire to complete the started
project.”0.43 .007 < .003 38
Q10: “I spent a long time on the initial decision and
perceived it as effortful.”-0.23 .165 < .003 39
Q11: “I spent a long time on the second decision and
perceived it as effortful.”-0.01 .953 < .003 39

Appendix D – Data analysis 103
Table 14: Correlations between second investments and questionnaire answers in the audience condition
Q12: “Although my initial decision led to negative
consequences, I believe that continued investment in
the initially chosen department would result in positive
consequences eventually.”
0.64 < .001 < .003 39
Q13: “I had the feeling that the 10 million dollars
would be wasted if I choose to invest the 20 million
dollars to the other division.”
0.27 .097 < .003 39
Q14: “I get over negative events quickly and focus on
taking actions that result in better outcomes.”-0.25 .129 < .003 38
Q15: “I find it difficult to overcome a negative event
and keep ruminating about how it affects the current
state.”
0.05 .748 < .003 38
B.) Condition-specific questions
Q An. 1: “I felt that nobody can track my initial
decision.”-0.08 .613 < .003 40
Q An. 2: “I had the feeling that my decisions were
completely anonymous.”0.05 .782 < .003 39
Question r s pSignificance threshold
(Bonferroni corrected)n
A.) General questions
Q1: “I felt very committed to my initial decision
throughout the experiment”0.38 .014 < .002 40
Q2: “I felt personally responsible for the outcome of
the initial decision.”-0.02 .902 < .002 40
Q3: “I had the feeling that my initial decision led to
negative consequences.”-0.19 .232 < .002 40
Q4: “My initial decision influenced my second
decision more than the updated financial report.”0.30 .056 < .002 40
Q5: “The financial information at the point of the
second decision was the major reason for my decision.”-0.58 < .001 < .002 40

Appendix D – Data analysis 104
Q6: “I based my second decision on the same reasons
as my initial decision.”0.41 .008 < .002 40
Q7: “I have been very satisfied with my initial decision
directly after taking it.”-0.01 .962 < .002 40
Q8: “Before taking the second decision I had the
feeling that my initial decision would lead to a
desirable outcome.”
-0.06 .719 < .002 40
Q9: “I had a strong desire to complete the started
project.”0.41 .009 < .002 40
Q10: “I spent a long time on the initial decision and
perceived it as effortful.”-0.16 .339 < .002 40
Q11: “I spent a long time on the second decision and
perceived it as effortful.”-0.14 .405 < .002 40
Q12: “Although my initial decision led to negative
consequences, I believe that continued investment in
the initially chosen department would result in positive
consequences eventually.”
0.24 .137 < .002 40
Q13: “I had the feeling that the 10 million dollars
would be wasted if I choose to invest the 20 million
dollars to the other division.”
0.14 .386 < .002 40
Q14: “I get over negative events quickly and focus on
taking actions that result in better outcomes.”-0.48 .002 < .002 40
Q15: “I find it difficult to overcome a negative event
and keep ruminating about how it affects the current
state.”
0.15 .348 < .002 40
B.) Condition-specific questions
Q Aud. 1: “I had the feeling that my decisions were
evaluated by others.”0.02 .939 < .002 40
Q Aud. 2: “The presence of the experimenter
influenced my decision.”0.10 .560 < .002 40
Q Aud. 3: “It was important for me what others might
think about my decision.”-0.14 .387 < .002 40
Q Aud. 4: “It was important for me what impression
the experimenter has of my decision.”-0.12 .468 < .002 40

Appendix D – Data analysis 105
Q Aud. 5: “I had the feeling that I have to make
decisions fast because the experimenter was present.”0.31 .054
< .002
40
Q Aud. 6: “I had the feeling that I would violate social
norms if I invested all money in one division only in
the second decision.”
0.28 .081 < .002 40
Q Aud. 7: “I had the feeling that I would violate social
norms if I would invest nothing in the failing division
in the second decision.”
0.26 .100 < .002 40
Q Aud. 8: “I wanted others to think that I make good
decisions.”-0.12 .448 < .002 40
Q Aud. 9: “I had the feeling that I would be judged
based on the decisions I make.”-0.11 .487 < .002 40

Appendix D – Data analysis 106
Regression models
Regression models were built based on questionnaire answers which were significantly corre-
lated (before Bonferroni correction) with second investments in the anonymous (Table 15) and
audience condition (Table 16).
Table 15: Initial regression analysis in the anonymous condition
Table 16: Initial regression analysis in the audience condition
Variable B SE B β t p
Constant 3.45 5.31 0.65 .521
“I felt very committed to my initial decision throughout the
experiment.”1.27 0.83 .24 1.54 .133
“The financial information at the point of the second decision
was the major reason for my decision.”-1.44 0.82 -.23 -1.76 .088
“I had a strong desire to complete the started project.” 0.38 0.93 .06 0.41 .686
“Although my initial decision led to negative consequences, I
believe that continued investment in the initially chosen
department would result in positive consequences eventually.”
1.89 0.64 .42* 2.93 .006
Note: R² = .52, *p < .01
Variable B SE B β t p
Constant 5.46 6.11 0.89 .378
“I felt very committed to my initial decision throughout the
experiment.”1.58 0.79 .23 2.01 .053
“The financial information at the point of the second decision
was the major reason for my decision.”-1.80 0.91 -.26 -1.98 .056
“I based my second decision on the same reasons as my initial
decision.”1.73 0.69 .30* 2.53 .016
“I had a strong desire to complete the started project.” 1.19 0.68 .21 1.76 .088
“I get over negative events quickly and focus on taking actions
that result in better outcomes.”-1.66 0.80 -0.26* -2.08 .045
Note: R ² = .60, *p < .05

Appendix D – Data analysis 107
Comments from participants
At the end of the questionnaire participants were offered the possibility to state comments. Par-
ticipants expressed their concerns about the limited amount of information provided for the deci-
sions (n = 3 (Aud.), n = 3 (An.)) and asked for more information about the market. They were
also interested in “non-financial data (…) like consumer reports or market research reports to
know what is the trend in consumers’ preferences”, a “discount rate (in order to calculate a net
present value)” and how much of the money was spent for production. They also wished to know
what the sales and earnings were before 2007. Two participants, one person in each condition,
pointed out that R&D investments need more time to show their effects. Two participants in the
audience condition expressed that they might have done better if they had a background in Busi-
ness. Some comments referred to means of improving the decision making process and the sce-
nario: “The way numbers are presented (in a column e.g. instead of a graph) may perhaps influ-
ence what I can read off them (and what decision I make after)” (Aud.), “allocating money for
R&D is important but more important is to supervise the R&D activities” (Aud.), “for the first
part of the experiment, the data was too similar, so it was hard to find any significant difference
between two options” (Aud.), “I wouldn’t invest as much money neither in first decision, nor in
2nd decision” (An.). One participant expressed that he did not believe that he could make a cor-
rect choice (An.): “I felt that my first choice couldn’t be right even if I chose the other depart-
ment, because the experiment should be symmetric”. In general, more participants wrote com-
ments in the audience condition (n =14) than in the anonymous condition (n = 9). In addition,
participants in the audience condition responded more politely, e.g. thanked for the experiments
or expressed that they liked it (n = 5 (Aud.), n = 1 (An.)) and did not leave improper remarks (n
= 2 in the anonymous condition). In sum, this could indicate that participants were more con-
cerned about their reputation and felt more responsible for their part in the experiment.

Appendix D – Data analysis 108

Summary (Extended Abstract) 109
Summary (Extended Abstract)
Committing a Sunk Cost Fallacy (SCF) consists in basing the decision whether to invest in a
project or activity on past decisions rather than on benefits expected in the future. Behavioural
economists hypothesized that people fall prey of this cognitive bias because of loss aversion,
concerns about wastefulness or self-justification needs. The present study drew on the latter one
and aimed to investigate the social environment triggering psychological mechanisms at the ori-
gin of the fallacy. My hypothesis was that situations favouring reason-based choice lead people
to be more affected by a confirmation bias, a bias which has been demonstrated to be at work
especially when people have to reason deliberate, which in turn causes the SCF. This is because
people who feel a need for justification have to find reasons for their choices. Therefore, they
will put too much weight on the reasons for their initial decision, which remained salient, and too
little on newly acquired information as they appear as refutations of their initial choice. The hy-
pothesis was based on studies on reason-based choice by Shafir and colleagues, who suggested
that people under specific circumstances choose the most justifiable rather than the most rational
choice (Shafir et al., 1993), and on the argumentative theory of reasoning by Mercier and Sper-
ber, which proposed that reasoning evolved for argumentation due to the reliance of humans on
communication (Mercier & Sperber, 2011).
An experiment with eighty participants was conducted at the Central European University in
Budapest. In an adaptation of a scenario by Staw (Staw, 1976) participants solved a financial
decision case: For the first decision participants in the role of managers had to assign 10 million
dollars to one of two company departments. For the second decision they received updated fi-
nancial information depicting the negative consequences of their initial choice and had to decide
how to divide 20 million dollars among the same two departments. The SCF was measured by
the propensity in the second round of decision making to invest in the same department as in the
first round (dependent variable). In a between-group design participants either anonymously
submitted their decisions in voting boxes (anonymous condition) or justified their decisions to
the experimenter (audience condition). The predictions were, first, that participants in the audi-
ence condition would apply reason-based choice more often due to the argumentative context,
and, second, that this in turn would lead to a greater occurrence of the SCF because of a confir-
mation bias.
Experimental results confirmed the first prediction: Participants in the audience condition chose
justifiable decisions by either investing nothing to the failing department (“I made a mistake”) or
allocating equal amounts (rewarding and fair behaviour, hope of a turnaround), whereas in the
anonymous condition allocations of 5 or 15 million dollars were preferred. In addition, partici-
pants in the audience condition decided on salient points of investments more often. Evidence
that specific reasons underlay investment decisions was provided by the audio data. Regarding
the second prediction results were ambiguous: There was no significant difference between sec-

Summary (Extended Abstract) 110
ond investments in the two conditions. Also, only few participants carried reasons from the first
decision over to the second decision according to the audio data. Nonetheless, correlations be-
tween questionnaire answers and second investments indicated a relationship between the failure
to update beliefs and second investments in the audience condition only. Additionally, regression
models support the hypothesis: Being action-oriented and basing the second decision on the
same reasons as the first decision were significant predictors of second investments in the audi-
ence condition. A follow-up experiment on hierarchical versus egalitarian group decision making
is recommended to clarify these ambiguous results. Additionally, the study offered insights on
factors underlying the SCF: Moderate correlations, although not significant after Bonferroni cor-
rection, indicate that high second investments in both conditions were positively correlated with
the desire to complete a started project and commitment to the initial decision. Negative correla-
tions between second investments and agreement that the financial information was the major
reason for the second decision were found in both conditions. Nonetheless, this correlation was
only significant in the audience condition. This finding supports the hypothesis that the SCF is
caused by a failure to update beliefs.
This study is relevant for Cognitive Science due to its interdisciplinarity: The hypothesis is
grounded in Philosophy and takes social factors into account. The topic relevant for Economics
is studied with methods from experimental Psychology and offers insights into human decision
making with possible applications in management.

Zusammenfassung (Extended Abstract in German) 111
Zusammenfassung (Extended Abstract in German)
Unter der Sunk Cost Fallacy (SCF) versteht man das Phänomen, dass Entscheidungen, anstatt im
Hinblick auf die Zukunft, auf Basis vergangener Entscheidungen und Investitionen getroffen
werden. Verhaltensökonomen stellten die Hypothesen auf, dass diese kognitive Verzerrung
(cognitive bias) auf Grund von Verlustaversion (loss aversion), Bedenken bezüglich Verschwen-
dung (wastefulness) oder einem Rechtfertigungsbedürfnis (self-justification) auftritt. Die vorlie-
gende Studie stützte sich auf letzteres und setzte den Fokus auf den Einfluss des sozialen Um-
felds auf psychologische Mechanismen, welche der SCF zu Grunde liegen. Die Hypothese war,
dass Situationen welche die Wahl der am rechtfertigbarsten anstatt der rationalsten Entscheidung
(reason-based choice) begünstigen zu einem höheren Auftreten eines Bestätigungsfehlers (con-
firmation bias) führen, welcher besonders häufig auftritt wenn Menschen bewusst argumentie-
ren, was wiederum zum Auftreten der SCF führt. Dies ist der Fall, da Menschen die das Gefühl
haben sich rechtfertigen zu sollen, Gründe für ihre Entscheidungen suchen. Die Aufmerksamkeit
wird auf die Gründe für die erste Entscheidung, die präsent bleiben, gerichtet und zu wenig auf
die neu gewonnenen Informationen, da diese als widersprüchlich zur ersten Entscheidung er-
scheinen. Diese Hypothese basierte auf Studien von Shafir über reason-based choice (Shafir et
al., 1993) und der Argumentative Theory of Reasoning von Mercier und Sperber, welche besagt,
dass vernünftiges Urteilen (reasoning) sich, aus evolutionärer Perspektive, entwickelt hat um
Argumentation zu ermöglichen. Grund dafür ist die Abhängigkeit des Menschen von Kommuni-
kation (Mercier & Sperber, 2011).
Zur Testung der Hypothese wurde ein Experiment mit achtzig TeilnehmerInnen an der Central
European University in Budapest durchgeführt. In einer Adaption des Szenarios, welches von
Staw verwendet wurde (Staw, 1976), trafen die TeilnehmerInnen finanzielle Entscheidungen: In
der ersten Entscheidung konnten sie 10 Millionen Dollar in eine von zwei Firmenabteilungen
investieren. Für die zweite Entscheidung erhielten sie aktualisierte finanzielle Informationen,
welche die negativen Konsequenzen ihrer ersten Entscheidung zeigten und bekamen 20 Millio-
nen Dollar zur Verfügung gestellt, welche sie auf dieselben Firmenabteilungen aufteilen konn-
ten. Die Sunk Cost Fallacy wurde an der Neigung gemessen, bei der zweiten Entscheidung in die
gleiche Abteilung zu investieren wie in der ersten Entscheidung (abhängige Variable). In einem
between-group design reichten die TeilnehmerInnen ihre Entscheidungen entweder anonym in
Wahlboxen ein (anonymous condition) oder teilten die Entscheidung inklusive der Begründung
der Leiterin des Experiments mit (audience condition). Die Vorhersagen waren, erstens, dass
TeilnehmerInnen in der audience condition rechtfertigbare Entscheidungen treffen würden, was
wiederum, zweitens, zu vermehrten Auftreten der SCF führen würde auf Grund eines Bestäti-
gungsfehlers.
Experimentelle Resultate bestätigten die erste Vorhersage: TeilnehmerInnen in der audience
condition trafen leichter rechtfertigbare Entscheidungen indem sie entweder nichts in die schei-

Zusammenfassung (Extended Abstract in German) 112
ternde Abteilung investierten („Ich habe einen Fehler gemacht“) oder indem sie beiden Abtei-
lungen gleich hohe Anteile zukommen ließen (belohnendes und faires Verhalten, Hoffnung auf
positive Umkehr in der Zukunft). In der anonymous condition hingegen wurden Allokationen
von 5 oder 15 Million Dollar präferiert. Zudem entschieden sich TeilnehmerInnen in der audien-
ce condition öfter für salient points of investment, also Investitionspunkte welche die Aufmerk-
samkeit auf sich zogen. Beweise dafür, dass bestimmte Gründe hinter spezifischen Investitions-
entscheidungen standen lieferten Tonaufnahmen. Betreffend der zweiten Vorhersage waren die
Resultate nicht eindeutig: Es gab keine signifikante Differenz zwischen den Investitionen, die in
der zweiten Entscheidung getätigt worden waren, zwischen den beiden Konditionen. Außerdem
übernahmen, gemäß den Tonaufnahmen, nur wenige TeilnehmerInnen die Gründe ihrer ersten
Entscheidung für die zweite Entscheidung. Allerdings deuten Korrelationen zwischen Fragebo-
gen-Antworten und Investitionsentscheidungen darauf hin, dass nur in der audience condition
zweite Investitionsentscheidungen und das Misslingen eigene Überzeugungen zu verändern in
einer Beziehung zueinander standen. Regressionsmodelle unterstützen ebenfalls die Hypothese:
Die Eigenschaft handlungsorientiert zu sein und die zweite Entscheidung basierend auf den glei-
chen Gründen wie die erste Entscheidung zu treffen waren in der audience condition signifikante
Prädiktoren der zweiten Investitionsentscheidungen. Ein Folgeexperiment über Entscheidungen
in hierarchischen versus egalitären Gruppen wird empfohlen um diese nicht eindeutigen Resulta-
te zu klären. Die Studie gab zudem Einsicht in Faktoren, die der SCF unterliegen: Die modera-
ten, wenn auch nach Bonferroni-Korrektur nicht signifikanten, Korrelationen deuteten auf eine
mögliche Beziehung zwischen Investitionen, die in der zweiten Entscheidung getätigt wurden,
sowohl mit dem Wunsch ein Projekt fertig zu stellen, als auch einem Verbundenheitsgefühl zur
ersten Entscheidung, hin. Negative Korrelationen zwischen diesen Investitionen und der aktuali-
sierten, finanziellen Information als Hauptgrund für die zweite Entscheidung wurde in beiden
Konditionen gefunden, war jedoch nur in der audience condition signifikant. Dieses Ergebnis
unterstützte die Hypothese, dass die SCF dadurch ausgelöst wird, dass Meinungen nicht aktuali-
siert werden.
Diese Studie ist relevant für die Kognitionswissenschaft auf Grund ihrer Interdisziplinarität: Die
Hypothese ist grundiert in der Philosophie und berücksichtigt soziale Faktoren. Das Thema, wel-
ches relevant für die Ökonomie ist, wird erforscht mit Methoden der experimentellen Psycholo-
gie und bringt Erkenntnisse über menschliche Entscheidungsprozesse mit möglichen Anwen-
dungsbereichen im Management.

Curriculum Vitae 113
Curriculum Vitae
Ina Ho Yee Bauer, BA
Personal Information
Born on March 8th, 1992
in Vienna; raised in Vienna
Citizenship: Austrian
Professional Experience
Since 09/2015 Die Umsetzer Unternehmensberatung GmbH (Vienna)
Project support / Internship
Project Management
Support the consulting team specialized in strategy, implementation and
leadership
Organizing and preparing strategy workshops and management projects
for international companies and public administration organisations
Research, especially in the field of Behavioural Economics
09/2014 – 06/2015 Central European University – Behavioural Economics Lab (Budapest)
Internship
Working as part of an international research team on Behavioural
Economics and Behavioural Game Theory
Project work on altruistic versus mind-directed punishment
Conducting and supporting experiments on cognitive biases
03/2014 - 07/2014 Research Studios Austria – Studio Smart Agent Technologies (Vienna)
Internship
Bridging business and academic research
Introductory work on Information Extraction and Natural Language
Processing
10/2007 – 09/2012 Der Standard Verlagsgesellschaft m.b.H. (Vienna)
Freelance Journalist
Wrote a variety of articles ranging from political debates to cultural
phenomena, first for the student supplement, later for the university
supplement of the quality newspaper
Research through digital sources and interviews
Communication with editorial team and working in teams
Academic Studies
Since 10/2013 University of Vienna (Vienna)
Cognitive Science, MSc
Interdisciplinary Focus: Linguistics, Computer Science, Artificial
Intelligence, Biology, Neuroscience, Philosophy, Psychology
International Focus: English Master program supported by the European
Union, degree awarded from home institution and five partner
universities
Specialization: Behavioural Economics – Decision-making, nudging,
cognitive heuristics and biases

Curriculum Vitae 114
09/2010 – 06/2014 University of Vienna (Vienna)
Comparative Literature, BA
Conferment of Bachelor degree with Excellent Pass (“Ausgezeichneter
Erfolg”)
Complementary Programmes: Sociology, Social Anthropology,
Psychoanalysis, Sinology
Academic Studies Abroad
09/2014 – 06/2015 Eötvös Loránd University (Budapest)
09/2012 – 05/2013 University of St. Andrews (St. Andrews)
Extracurricular Engagement
06/2015 Workshop on Electroencephalography (EEG)
University of Ljubljana and University Medical Centre Ljubljana
/ Ljubljana
09/2012 – 05/2013 Professional Skills Curriculum
University of St. Andrews / St. Andrews
04/2011 Media project Backpack Journalism
People’s media / Austria and Romania
10/2008– 06/2009 Weiße Flecken–Journalistic memorial project for the victims
of Nazism Step 21 / Austria, Germany, Poland
Qualification / Additional Skills / Prizes
Languages English: Business fluent
Cantonese: Native speaker (spoken)
French: Elementary skills
Mandarin: Elementary skills
Hungarian: Beginner’s level
Latin: Elementary reading skills
EDP Excellent proficiency in MS Excel, MS PowerPoint, MS Word
Proficient knowledge of reference management programs (Mendeley,…)
Basic knowledge of SPSS (Software Package for Statistical Analysis)
Elementary knowledge of GATE (General Architecture for Text
Engineering)
Scholarships Scholarship from e-fellows.net
Merit-based scholarship, University of Vienna (2010, 2011, 2012,
2013)
Erasmus Grant (9 months for studies in the UK, 10 months for studies
in Hungary)