Embed Size (px)
Citation preview

Massachusetts Electronics Recycling Program
�Massachusetts Recycling Infrastructure 1990-1999
�Massachusetts plan for electronics
�The cost of doing nothing
Five Years Later:The uncensored storyOf a CRT Waste Ban
1998-2003

Summary
• Background– MA state role in bottle bill and curbside recycling infrastructure development
• How MA DEP instituted a 6-point planto create a CRT Infrastructure in advance of HDTV transition
• Successful implementation of the first Waste Ban
• Problems/Lessons learned– public financed domestic programs vs. free market exports

Background: MA DEP and Recycling Infrastructure Development 1990-1998
•Access to residential recycling increased from 10% to 90%
•Participation in the bottle bill captures 85% of the 1.6 billion beer and soft drink containers sold in Massachusetts
•State Procurement of recycled products increased over 500%
•Costs of operating the state’s 225TPD MRF fell from $1.6M per year to $0, through long-term contracts
•Assignment: create convenient access, high participation, state demand, and low cost infrastructure for electronics

Previous Largest Access investment: To ensure an infrastructure for curbside recycling, DEP built and contracted operation of the Springfield MRF in 1990.
Construction: $6MCapacity: 50,000 TPY1990-95 operating cost: $1.6M/Year1995-2005 operating cost: $0/Year
If the state guarantees a market, municipalities can handle collection costs

Why Massachusetts tackled E-Waste
• Massachusetts. 6M Residents, 2.2M households, heavy commercial and institutional stream. About 25,000 tons of electronics are returned for warrantee, resold, repaired, stored, or landfilled. (Because they are durable products, the entire product chain could be impacted by legislation).
• Digital and HDTV may create a landslide in the year 2005. TV Repair is already in a freefall, dropping 80% since 1980s. As digital systems replace TVs, VCRs, and other analogue machines, DEP projected that basements will begin to empty. 300,000 tons may be discarded in one year.
• A Cathode Ray Tube (CRT) may contain 4-8 lbs. of lead. While intact, CRTs are safe to handle. However, once incinerated, the lead from CRTs concentrates in the ash, making disposal more toxic and more expensive.
• Markets for leaded glass will be around for 5-10 more years – states which wait will lose access to TV tube manufacturing markets.

The Massachusetts Electronics Strategy
1. Exemptintact CRTs as hazardous waste
2. Develop CRT recycling markets
3. Establish 2 statewide Processing Contractsfor municipalities.
4. Establish regional centers and 3rd party collection systems.
5. Est. single-payer systemfor municipalities on state contract.
6. BanCRTs from solid waste disposal facilities: June 1999

6. Ban CRTs from Disposal5. Establish single-payer system
(grant program)
2. Develop end Markets
3. Establish statewide
Processing Contract
2 State processors
4. Establish Regional Collection
centers & contractors
Regional CollectorsEnd Markets
1. Exempt intact CRTs from hazardous waste requirements
6-Point Plan

Massachusetts DEP demonstrated to EPA that the effect of a waste ban (covering both residential and commercial material) surpassed the effects of RCRA.HW enforcement..
HW Regulations regulate collection, reuse and repair, tying up regulators and truck drivers with paperwork; meanwhile, residences (where the TVs are) would be exempt. Waste Bansregulate more effectively, and capture residential material – including TVs, the focus of Massachusetts efforts.
40,000 commercial CRT generators (businesses, factories, sports bars, ATMs, schools, etc.)
1,500 TV and computer repairers, charities,
parts and material scrap recyclers
85Solid Waste transfer and disposal facilities
2,200,000 residences
1. Exempt intact CRTs from hazardous waste requirements
HW Enforcement
SW Enforcement

DEP issued a contract, jointly funded by EPA, to survey 400 TV repair shops, 600 computer repair shops, 50 electronics “recyclers”, dozens of exporters, and 400 second-hand thrift stores.
Consumer Electronics
Resale
Upgrade & Repair
Salvage & Scrap
Export
Landfills and Incinerators
1
2
3
4
2. Develop end Markets

Commercial generators
(40-50,000?)Municipalities (351)
Used Goods / Charities(180)
TV Repair (420) or PC Repair(614)
Household generators
(approx 2,200,000)
Recyclers/Reclaimers (48)
CRT Special-ists (3)
End Users(2)
Exports
DISPOSAL
Market Research: Secondary Commodities infrastructure is complex. Loopholes, potential contractors, markets, and other “stakeholders” became apparent as influential players in the total system.
2. Develop end Markets

Under an state & EPA Grants, UMass performed inventories, market analysis, and recycling time studies on TVs and PCs collected from 115,000 residents. UMass became the first “permanent regional facility”, as well as a market and operations research center.
2. Develop end Markets

• grants for plastic recycling
• grants for CRT glass processing
• $4M Recycling Loan Fund
• New “EPP” procurement language for $50M /year state computer procurement contract
Other market development activities:
2. Develop end Markets

DEP selected 2 vendors to provide processing services to cities and towns for CRT and other electronics collections for the first six months.
FY1998: PCs from state and municipal office buildings only
FY1999: Add 8 permanent regional facilities, 1,335,000 residents
$100,000, single-payer contract
FY2001: Rebid contract for 10-12 facilities, serving 6,000,000 residents
$400,000 single-payer contract
3. Establish Statewide Processing Contract

• Reduced emphasis of truck fleetvia regional centers, reduced HW transport paperwork
• Emphasized points for reuse
• Emphasized accountability for lead glass
• Standard insurance, closure plans, record-keeping, reporting
• Single-payer accountingvery attractive to bidders
• 2 Statewide Processors bid 40% previous state contract cost (Onyx, ElectroniCycle)
3. Establish Statewide Processing Contract

DEP provided free recycling to regional centers which agreed to consolidate from large populations. University of Massachusetts at Amherst, three Salvation Army centers and three Goodwill charitable donation centers signed up.
Part of the purpose of these regional collection programs was to demonstrate a manageable logistical flow to potential state contractors. More contractors could bid on trailerloads from central locations than could put out a truck fleet for 351 municipalities.
Existing small contractors, such as white goods collectors, were also set up as “3rd Party”collectors eligible to deliver on municipalities behalf to the state contractors. Two of these collectors later went on to invest in processing capacity, and bid on state contracts.
1999 Pop.Served* Since Tons/DateUMASS AMHERST 115,329 October 14.58 GLOBAL RECYCLING 54.15GOODWILL BOSTON 825,599 March 0GOODWILL SPRINGFIELD 190,835 January 13.04 108,300 LBS TO DATE 61%GOODWILL PITTSFIELD 62,234 April 0 70,000 EST. OTHER GLOBAL ACCTS 39%SALVATION ARMY SAUGUS 756,372 November 11.64SALVATION ARMY SPRINGFIELD 150,000 January 1.76CHICOPEE LANDFILL 150,000 November 10.75GLOBAL RECYCLING TECH 90,284 October 2.38
TOTAL TO DATE 1,325,901 54.15
4. Establish Regional Collection centers & contractors

Salvation Army and Goodwill Industries screen donations to see if the equipment works, but does not do complex repairs.
Equipment which does not work, or does not sell in 45 days, is placed in 8-10 pallets for collection by the state contractor
4. Establish Regional Collection centers & contractors

Until 2002, Salvation Army and Goodwill Industries provided free collection and screening in return for free recycling

Units ReUse % Reuse ReUse $ Cost50 0 0% 0 30049 1 2% 50 24448 2 4% 40 20847 3 6% 30 19246 4 9% 20 196
Significant, but Diminishing Returns on Reuse: The higher the ReUse %, the lower the NET value (Resale or Technician Cost).
Collect in a way which preserves repair and reuse value

Transport#-> 1 2 3 4PROCESSOR
CRTs Residents Munic ipality PERMANENT REGIONAL FACILITY (STATE CONTRACT)Pop.Served* Since Tons/Date
487 36,504 AMHERST UMASS AMHERST 115,329 October 14.58 GLOBAL RECYCLING 54.15581 43,587 ARLINGTON GOODWILL BOSTON 825,599 March 0
7,657 574,283 BOSTON GOODWILL SPRINGFIELD 190,835 January 13.04 108,300 LBS TO DATE 61%1,331 99,858 CAMBRIDGE GOODWILL PITTSFIELD 62,234 April 0 70,000 EST. OTHER GLOBAL ACCTS39%
251 18,825 GREENFIELD SALVATION ARMY SAUGUS 756,372 November 11.64 62.87 UNION CO. NJ618 46,324 HOLYOKE SALVATION ARMY SPRINGFIELD150,000 January 1.76
83 6,247 LEE CHICOPEE LANDFILL 150,000 November 10.7576 5,663 LENOX GLOBAL RECYCLING TECH 90,284 October 2.38
200 15,032 LONGMEADOW TOTAL TO DATE 1,325,901 54.15144 10,772 MAYNARD
163 12,228 MILLBURY
344 25,803 MILTON
89 6,700 NEWBURY
1,093 81,968 NEWTON
385 28,879 NORTHAMPTON
639 47,927 PITTSFIELD
341 25,553 SAUGUS
2,000 150,000 SPRINGFIELD
32 2,397 STOCKBRIDGE 17,679 1,325,901 1999 Grantees800 60,000 UMASS/ FRK Co 82,667 6,200,000 Entire state175 13,091 WAYLAND
190 14,260 WESTBORO
- GLOUCESTER
- LEVERETT
5. Establish single-payer system (grant program)

FY2001: Types of Collection Programs • 7 charities
• 25 one-day events
• 4 city curbside contracts
• 100 town drop offs
• 10 back end (dump and pick) collections
• 6 intermediary electronics recyclers
• 2 retailer take-back programs • hundreds of commercial clients, schools
#1 Source of Material: 3rd Party Private collectors
Waste Ban in effect 12 Months. No Train Wreck.
6. Ban CRTs from Disposal

Drop-off65%
Special Events14%
Curbside9%
Charity8%
Curbside/Drop-off
4%
Types of Massachusetts collection programs (not by tonnage)
6. Ban CRTs from Disposal

Service and ResaleWholesale ReUseWholesale Repair/partsScrapResidue
What happened to it
Glass to glass
Plastic recycled
Gold, copper, other metals recovered
6. Ban CRTs from Disposal
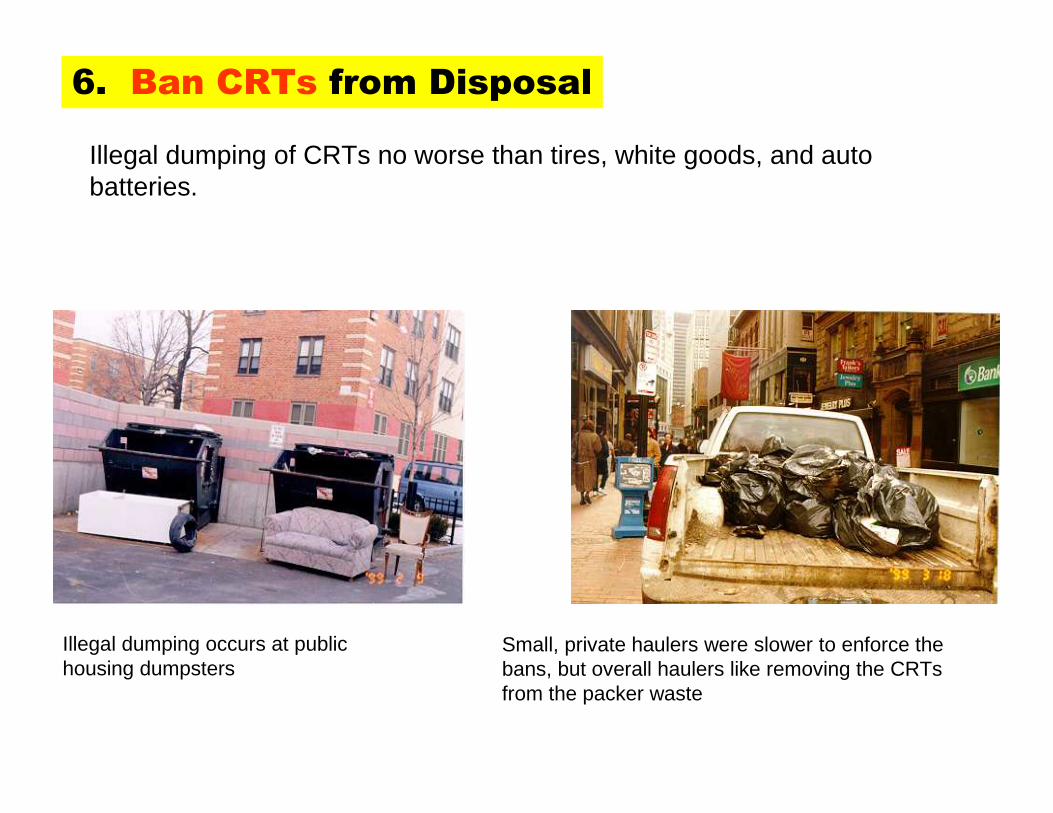
Illegal dumping of CRTs no worse than tires, white goods, and auto batteries.
Illegal dumping occurs at public housing dumpsters
Small, private haulers were slower to enforce the bans, but overall haulers like removing the CRTs from the packer waste
6. Ban CRTs from Disposal

Other States Build on MA Infrastructure
• Vermont: Permanent collections in all but one district; TVs included in half of programs. 2lbs per resident, close to MA. Local collector uses MA state processing contract for unrepairable items.
• New Hampshire: Permanent collections in the last year in ½ of state. Local collector uses MA state processing contract for unrepairable items.
• Maine: Contracted both MA state processors
• Rhode Island: Contracted MA regional collector, which now has processing facility
• CT: Bankruptcy of CRRA halts collections…foreshadowing of MA?

Problems/Lessons learned
In 1999, DEP had over $10M budget, single-payer CRT grants cost about $400K per year.
In 2002, DEP cut CRT budget
In 2003, DEP’s budget was cut
Without a single payer, is being state contractor a blessing or a curse?

6. Ban CRTs from Disposal5. Establish single-payer system
(grant program)
2. Develop end Markets
3. Establish statewide
Processing Contract
2 State processors
4. Establish Regional Collection
centers & contractors
Regional CollectorsEnd Markets
1. Exempt intact CRTs from hazardous waste requirements
FY2003: State cuts program 80%. FY2004: $0
MUNICIPALITIES and 3RD Party Haulers are on their own.

State recycling contractRegional CentersEnd Markets
FY2003: State cuts program 80%. FY2004: $0
Out of state, out of country export markets win low bids.
1. Exempt intact CRTs from hazardous waste requirements
4. Establish Regional Collection
centers & contractors 2. Develop end Markets
3. Establish statewide
Processing Contract
6. Ban CRTs from Disposal

Scrap Recycling
Toxics Along for the Ride
Repair & Reuse
Overseas legitimate demand for reuse and copper become an excuse for CRT dumping?

Giant Sucking SoundGrowth in Chinese demand for copper (ore and scrap): 20% per year 1999-2002
0
5
10
15
20
1999 2000 2001 2002
Reuse Forces
1. High tolerance/demand for used2. “Free” software3. Cheap parts4. Good, cheap tech. labor
Understanding Export Forces to Asia
Recycling Forces
1. Metal demand2. Balance of Trade3. Cheap labor 4. Cheap env. Laws

Understanding USA demand
Anti-Reuse Forces
1. Technical Labor cost2. Affluence3. Software rules4. Parts, manuals costs
Anti-Recycling Forces
1. Mining preferences2. Labor cost 3. Population-based env. standards4. Loss of manufacturing demand
TAR under control. We are the best at throwing things away.

How the market forces affect your Recycling Costs
Next 3 Slides:
-USA costs currently (1000 monitors)-USA costs with 1900 copper prices-USA costs with Chinese labor rates

Overall USA Monitor Management$ spent and earned per 1000 monitors
-2000
-1500
-1000
-500
0
500
1000
1500
Copper revenue
Other materialrevenue25% monitor resale
Demanufacturing
Repair Labor
Scrap handling
Most demand for used is overseas
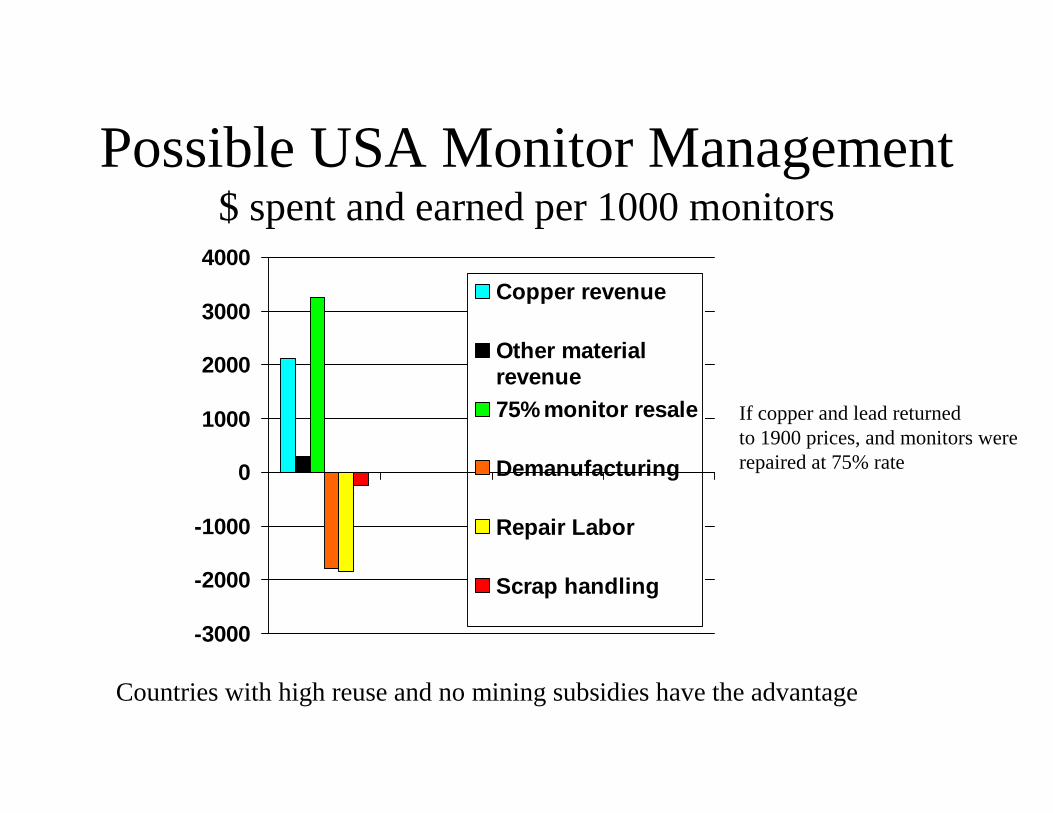
Possible USA Monitor Management$ spent and earned per 1000 monitors
-3000
-2000
-1000
0
1000
2000
3000
4000
Copper revenue
Other materialrevenue75% monitor resale
Demanufacturing
Repair Labor
Scrap handling
If copper and lead returnedto 1900 prices, and monitors wererepaired at 75% rate
Countries with high reuse and no mining subsidies have the advantage

Overseas Monitor Management$ spent and earned per 1000 monitors
-1000
-500
0
500
1000
1500
2000
2500
3000
3500
Copper revenue
Other materialrevenue75% monitor resale
Demanufacturing
Repair Labor
Scrap handling
No mining subsidies, and 10%technical and handling labor cost
Countries with high reuse, no mining subsidies, and low wages are the winners

CRT Glass Test- no known market in Asia for screen burned, scratched or busted tubes. Legitimate USA recyclers must be able to show where the non-repairable glass goes.
Guidance document at retroworks.com, several other sites

Better to meet demand than not to?E-Scrap is 300% richer in copper and other metals than mined ore
Recycling produces a fraction of the pollution from mining.
Gorilla and orangutan extinction is arguably driven by electrics metal mining.
One Copper mine in Papua New Guinea (feeding China) dumped 80,000 Tons Per Day of Cyanide tailings into the OK Tedi River from 1990-2000
USGS – At 1990 rate of consumption, all known copper reserves will be exhausted this century: Ocean mining will be the primary source of copper in our lifetimes.
USA Model? 95% from federal lands, $5/acre, 14/15 largest Superfund sites
Hard rock mining produces 45% of all toxics produced by all USA industries.
Gold mining releases more mercury into the environment thanmercury production and disposal combined!!!

Basic Export Lessons
REALITY: If USA exports everything, we send 1/3 reusables, 1/3 recyclables, and 1/3 Toxics Along for the Ride.
REALITY: if USA exports nothing, we destroy reuseables (and they cannot afford new); they mine to replace the recycled metals, and mining produces even more toxic harm than recycling.
SOLUTION: Setting a Higher Standard. USA processing, limited exports (tested equipment, copper scrap), simple tests (like CRT Glass Test); market development to promote best practices; (funded) state processing contracts with restrictions and incentives; etc.

Conclusions
6 Point Plan was effective strategy (Exports are just as high oreven higher in states which have HW or UWR)
Single payer systems are great unless the single payer goes broke.
Statewide processing contracts provide a necessary backstop, and setGood rules for exports and environmental stewardship. But if no one can afford them, “the perfect can become the enemy of the good”
Bans jump start decision makers to provide access, but participation rates are high in states without bans, once accessis established.

For copies and links to other resources, visit
www.retroworks.com