Embed Size (px)
Citation preview
8/6/2019 Mass Layoffs June 2011
http://slidepdf.com/reader/full/mass-layoffs-june-2011 1/10
For release 10:00 a.m. (EDT) Friday, July 22, 2011 USDL-11-1083
Technical information: (202) 691-6392 • [email protected] • www.bls.gov/mls
Media contact: (202) 691-5902 • [email protected]
MASS LAYOFFS — JUNE 2011
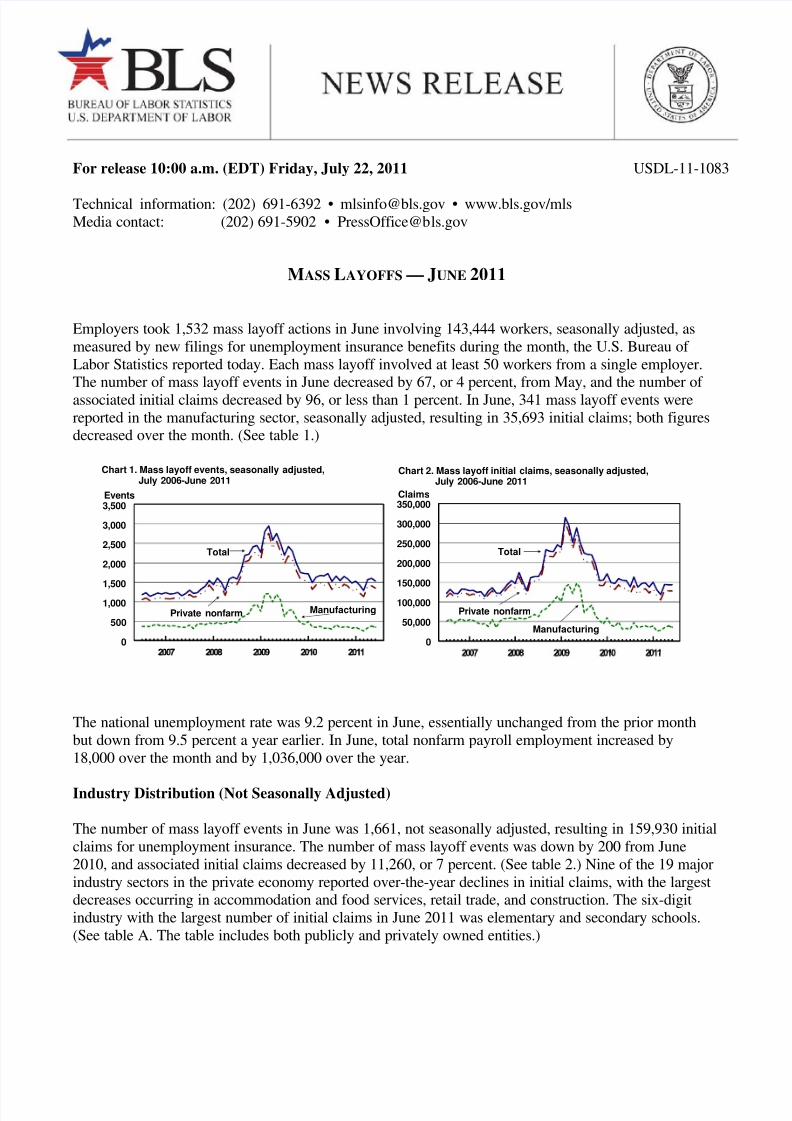
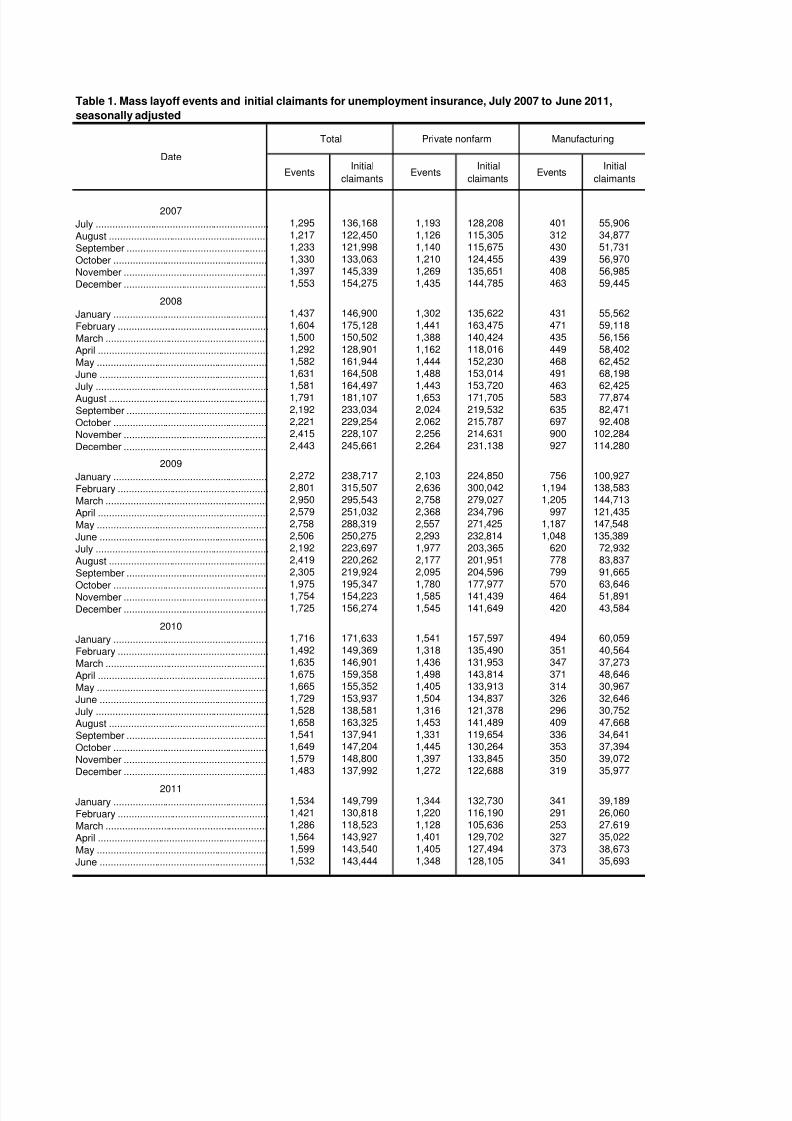
Employers took 1,532 mass layoff actions in June involving 143,444 workers, seasonally adjusted, as
measured by new filings for unemployment insurance benefits during the month, the U.S. Bureau of
Labor Statistics reported today. Each mass layoff involved at least 50 workers from a single employer.The number of mass layoff events in June decreased by 67, or 4 percent, from May, and the number of
associated initial claims decreased by 96, or less than 1 percent. In June, 341 mass layoff events were
reported in the manufacturing sector, seasonally adjusted, resulting in 35,693 initial claims; both figuresdecreased over the month. (See table 1.)
The national unemployment rate was 9.2 percent in June, essentially unchanged from the prior month
but down from 9.5 percent a year earlier. In June, total nonfarm payroll employment increased by
18,000 over the month and by 1,036,000 over the year.
Industry Distribution (Not Seasonally Adjusted)
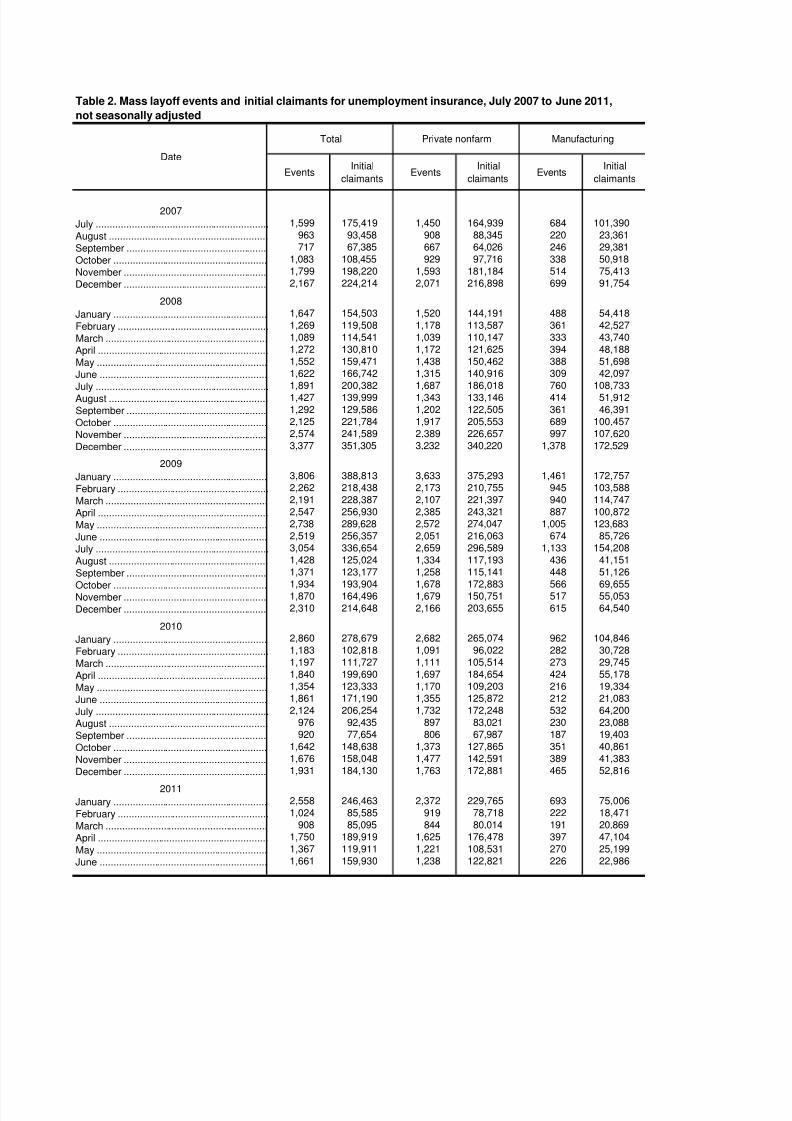
The number of mass layoff events in June was 1,661, not seasonally adjusted, resulting in 159,930 initial
claims for unemployment insurance. The number of mass layoff events was down by 200 from June
2010, and associated initial claims decreased by 11,260, or 7 percent. (See table 2.) Nine of the 19 major
industry sectors in the private economy reported over-the-year declines in initial claims, with the largestdecreases occurring in accommodation and food services, retail trade, and construction. The six-digit
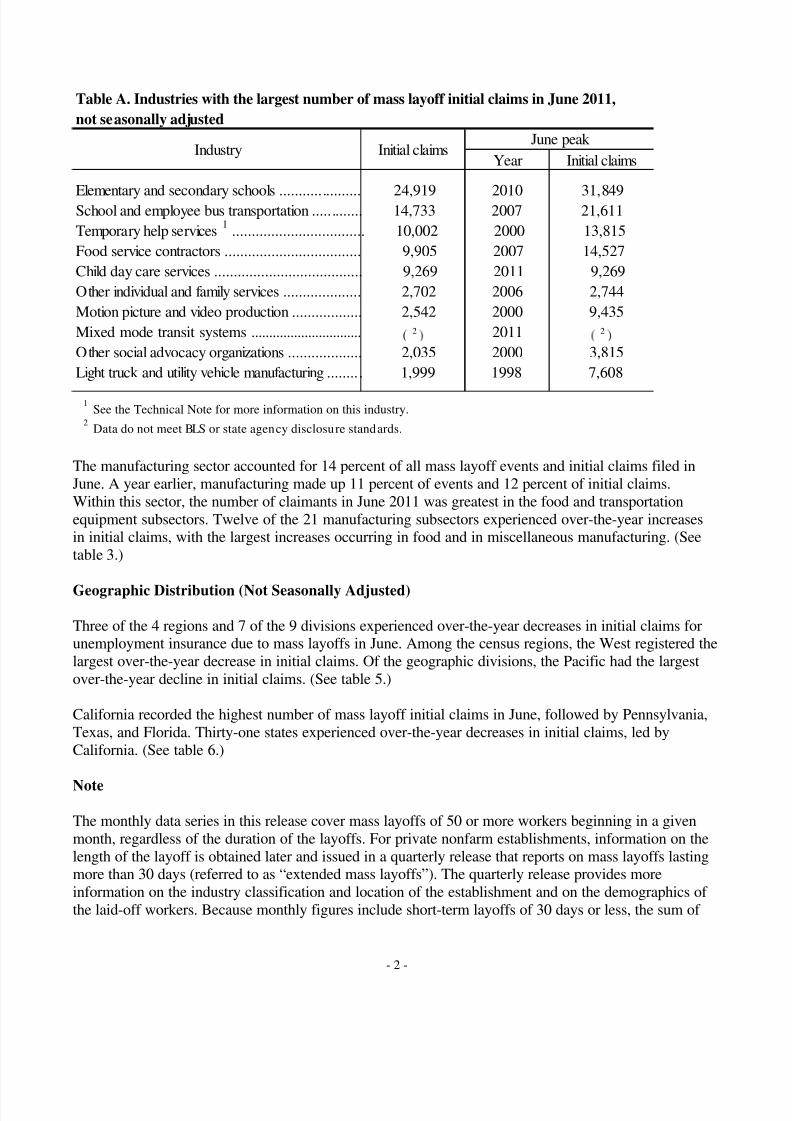
industry with the largest number of initial claims in June 2011 was elementary and secondary schools.
(See table A. The table includes both publicly and privately owned entities.)
0
500
1,000
1,500
2,000
2,500
3,000
3,500Events
Manufacturing
Chart 1. Mass layoff events, seasonally adjusted,July 2006-June 2011
Total
Private nonfarm
0
50,000
100,000
150,000
200,000
250,000
300,000
350,000Claims
Total
Manufacturing
Chart 2. Mass layoff initial claims, seasonally adjusted,July 2006-June 2011
Private nonfarm
8/6/2019 Mass Layoffs June 2011
http://slidepdf.com/reader/full/mass-layoffs-june-2011 2/10
- 2 -
Table A. Industries with the largest number of mass layoff initial claims in June 2011,
not seasonally adjusted
Year Initial claims
Elementary and secondary schools ..................... 24,919 2010 31,849School and employee bus transportation ............. 14,733 2007 21,611
Temporary help services1
.................................. 10,002 2000 13,815
Food service contractors ................................... 9,905 2007 14,527
Child day care services ...................................... 9,269 2011 9,269
Other individual and family services .................... 2,702 2006 2,744
Motion picture and video production .................. 2,542 2000 9,435
Mixed mode transit systems ............................... 2 2011 2
Other social advocacy organizations ................... 2,035 2000 3,815
Light truck and utility vehicle manufacturing ......... 1,999 1998 7,608
1See the Technical Note for more information on this industry.
2Data do not meet BLS or state agency disclosure standards.
Industry Initial claimsJune peak
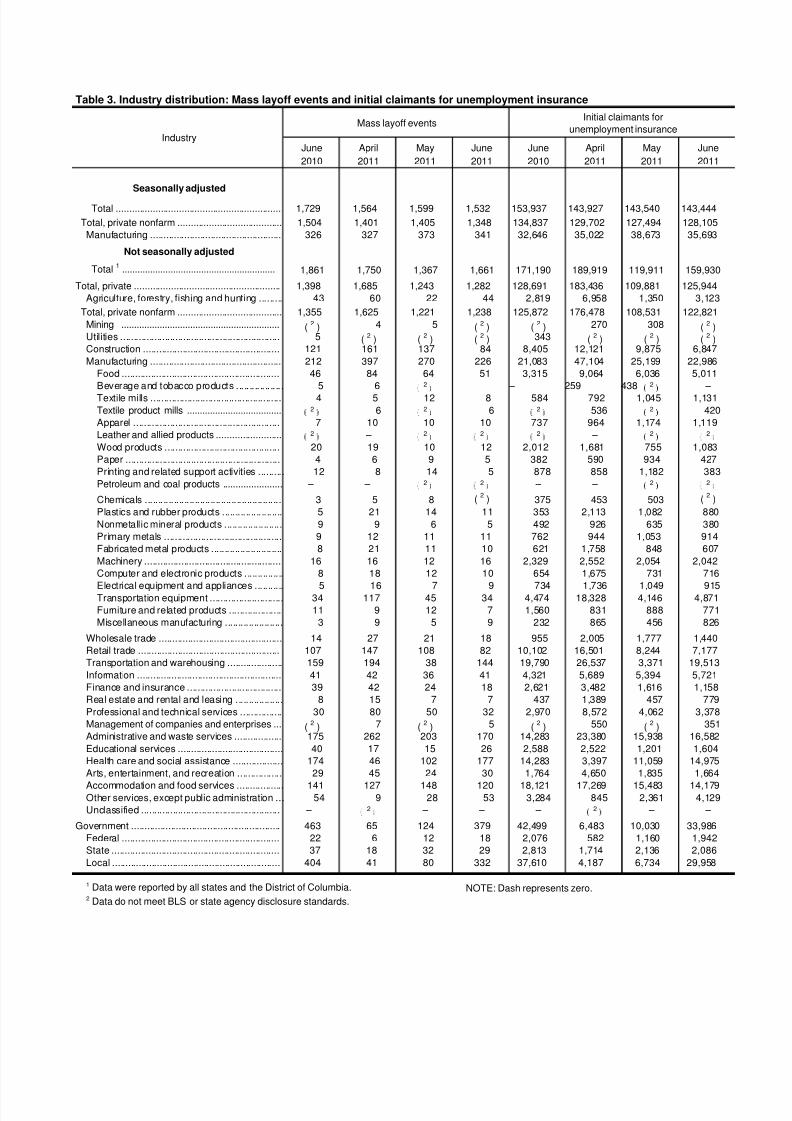
The manufacturing sector accounted for 14 percent of all mass layoff events and initial claims filed in
June. A year earlier, manufacturing made up 11 percent of events and 12 percent of initial claims.
Within this sector, the number of claimants in June 2011 was greatest in the food and transportation
equipment subsectors. Twelve of the 21 manufacturing subsectors experienced over-the-year increasesin initial claims, with the largest increases occurring in food and in miscellaneous manufacturing. (See
table 3.)
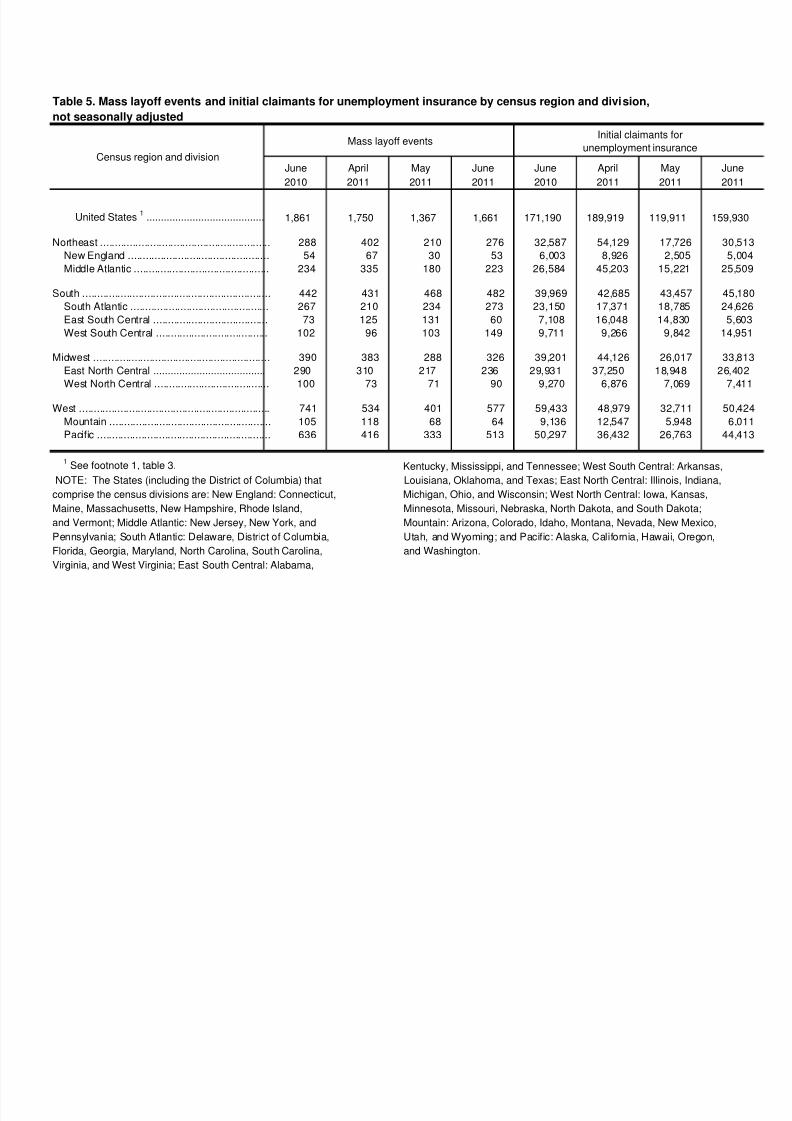
Geographic Distribution (Not Seasonally Adjusted)
Three of the 4 regions and 7 of the 9 divisions experienced over-the-year decreases in initial claims forunemployment insurance due to mass layoffs in June. Among the census regions, the West registered the
largest over-the-year decrease in initial claims. Of the geographic divisions, the Pacific had the largest
over-the-year decline in initial claims. (See table 5.)
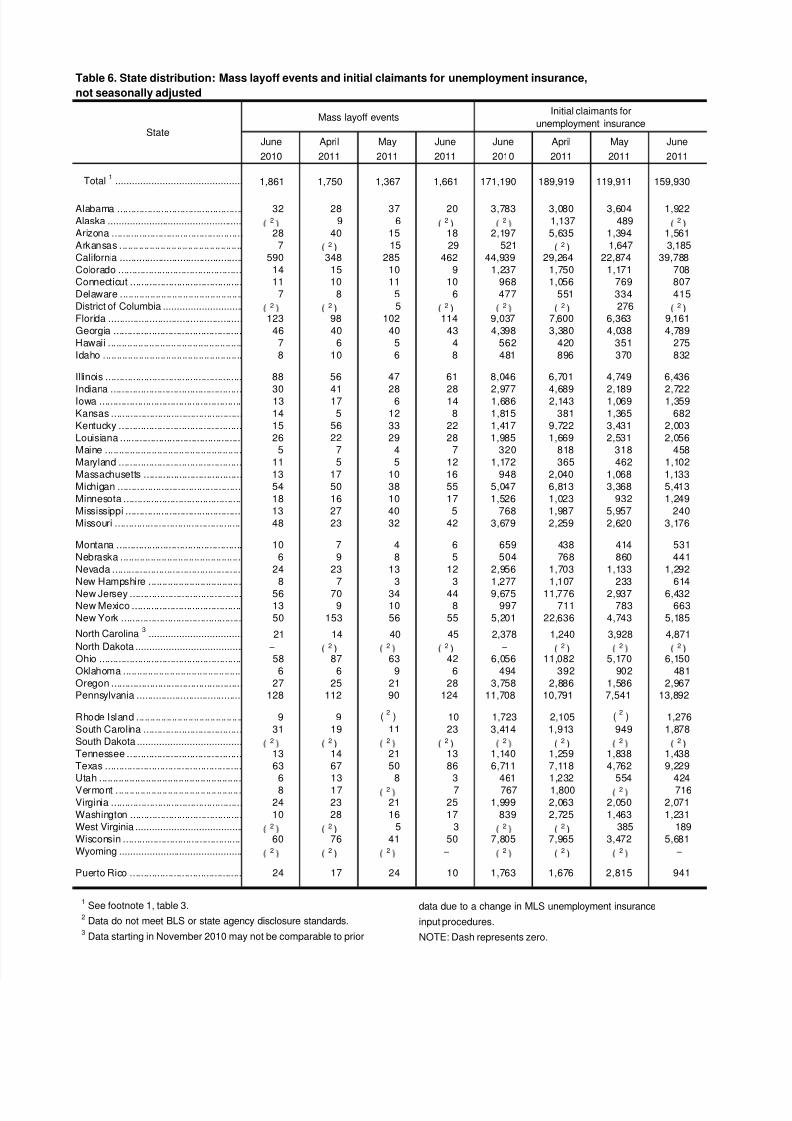
California recorded the highest number of mass layoff initial claims in June, followed by Pennsylvania,
Texas, and Florida. Thirty-one states experienced over-the-year decreases in initial claims, led by
California. (See table 6.)
Note
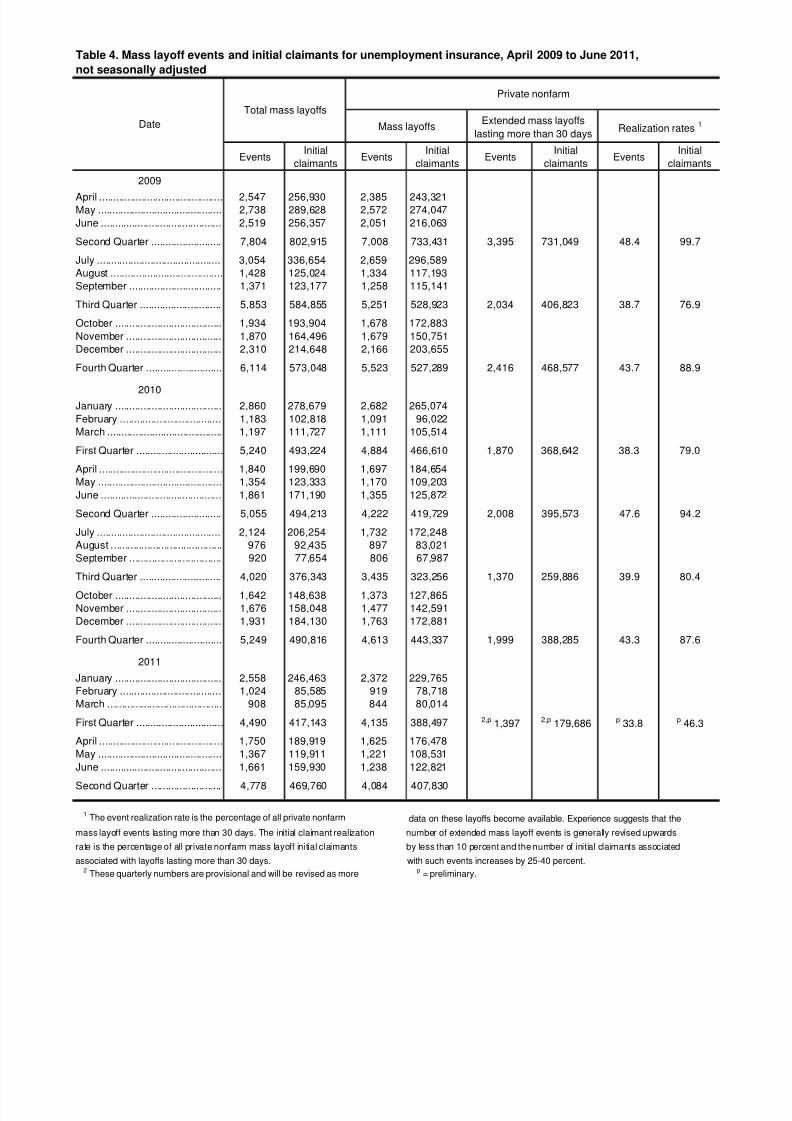
The monthly data series in this release cover mass layoffs of 50 or more workers beginning in a given
month, regardless of the duration of the layoffs. For private nonfarm establishments, information on the
length of the layoff is obtained later and issued in a quarterly release that reports on mass layoffs lastingmore than 30 days (referred to as “extended mass layoffs”). The quarterly release provides more
information on the industry classification and location of the establishment and on the demographics of
the laid-off workers. Because monthly figures include short-term layoffs of 30 days or less, the sum of

8/6/2019 Mass Layoffs June 2011
http://slidepdf.com/reader/full/mass-layoffs-june-2011 3/10
- 3 -
the figures for the 3 months in a quarter will be higher than the quarterly figure for mass layoffs of more
than 30 days. (See table 4.) See the Technical Note for more detailed definitions.
____________
The Extended Mass Layoffs news release for the Second Quarter 2011 is scheduled to be released
on Wednesday, August 10, 2011, at 10:00 a.m. (EDT). The Mass Layoffs news release for July is
scheduled to be released on Tuesday, August 23, 2011, at 10:00 a.m. (EDT).
8/6/2019 Mass Layoffs June 2011
http://slidepdf.com/reader/full/mass-layoffs-june-2011 4/10
Technical Note
The Mass Layoff Statistics (MLS) program is a federal-
state program that uses a standardized automated approach to
identifying, describing, and tracking the effects of major job
cutbacks, using data from each state's unemployment
insurance database. Each month, states report on employers
which have at least 50 initial claims filed against them during
a consecutive 5-week period. These employers then are
contacted by the state agency to determine whether these
separations lasted 31 days or longer, and, if so, other
information concerning the layoff is collected. States report
on layoffs lasting more than 1 month on a quarterly basis.
A given month contains an aggregation of the weekly
unemployment insurance claims filings for the Sunday
through Saturday weeks in that month. All weeks are
included for the particular month, except if the first day of the
month falls on Saturday. In this case, the week is included in
the prior month's tabulations. This means that some months
will contain 4 weeks and others, 5 weeks. The number of
weeks in a given month may be different from year to year,and the number of weeks in a year may vary. Therefore,
analysis of over-the-month and over-the-year change in not
seasonally adjusted series should take this calendar effect into
consideration.
The MLS program resumed operations in April 1995
after it had been terminated in November 1992 due to lack of
funding. Prior to April 1995, monthly layoff statistics were
not available.
Information in this release will be made available to
sensory impaired individuals upon request. Voice phone:
(202) 691-5200; Federal Relay Service: (800) 877-8339
Definitions
Employer . Employers in the MLS program include
those covered by state unemployment insurance laws.
Information on employers is obtained from the Quarterly
Census of Employment and Wages (QCEW) program, which
is administered by the Bureau of Labor Statistics (BLS).
Industry. Employers are classified according to the
2007 version of the North American Industry Classification
System (NAICS). For temporary help and professional
employer organization industries, monthly MLS-related
statistics generally reflect layoffs related to underlying client
companies in other industries. An individual layoff action ata client company can be small, but when initial claimants
associated with many such layoffs are assigned to a tem-
porary help or professional employer organization firm, a
mass layoff event may trigger.
Initial claimant . A person who files any notice of un-
employment to initiate a request either for a determination of
entitlement to and eligibility for compensation, or for a
subsequent period of unemployment within a benefit year or
period of eligibility.
Mass layoff event . Fifty or more initial claims for
unemployment insurance benefits filed against an employer
during a 5-week period, regardless of duration.
Seasonal adjustment
Effective with the release of data for January 2005, BLS
began publishing six seasonally adjusted monthly MLS
series. The six series are the numbers of mass layoff eventsand mass layoff initial claims for the total, private nonfarm,
and manufacturing sectors.
Seasonal adjustment is the process of estimating and
removing the effect on time series data of regularly recurring
seasonal events such as changes in the weather, holidays, and
the beginning and ending of the school year. The use of
seasonal adjustment makes it easier to observe fundamental
changes in time series, particularly those associated with
general economic expansions and contractions.
The MLS data are seasonally adjusted using the X-12-
ARIMA seasonal adjustment method on a concurrent basis.
Concurrent seasonal adjustment uses all available monthly
estimates, including those for the current month, in de-veloping seasonal adjustment factors. Revisions to the most
recent 5 years of seasonally adjusted data will be made once a
year with the issuance of December data. Before the data are
seasonally adjusted, prior adjustments are made to the
original data to adjust them for differences in the number of
weeks used to calculate the monthly data. Because weekly
unemployment insurance claims are aggregated to form
monthly data, a particular month's value could be calculated
with 5 weeks of data in 1 year and 4 weeks in another. The
effects of these differences could seriously distort the
seasonal factors if they were ignored in the seasonal
adjustment process. These effects are modeled in the X-12-
ARIMA program and are permanently removed from thefinal seasonally adjusted series.
8/6/2019 Mass Layoffs June 2011
http://slidepdf.com/reader/full/mass-layoffs-june-2011 5/10
Table 1. Mass layoff events and initial claimants for unemployment insurance, July 2007 to June 2011,
seasonally adjusted
2007
July ............................................................... 1,295 136,168 1,193 128,208 401 55,906
August .......................................................... 1,217 122,450 1,126 115,305 312 34,877
September ................................................... 1,233 121,998 1,140 115,675 430 51,731
October ........................................................ 1,330 133,063 1,210 124,455 439 56,970
November .................................................... 1,397 145,339 1,269 135,651 408 56,985
December .................................................... 1,553 154,275 1,435 144,785 463 59,445
2008
January ........................................................ 1,437 146,900 1,302 135,622 431 55,562
February ....................................................... 1,604 175,128 1,441 163,475 471 59,118
March ........................................................... 1,500 150,502 1,388 140,424 435 56,156
April .............................................................. 1,292 128,901 1,162 118,016 449 58,402
May .............................................................. 1,582 161,944 1,444 152,230 468 62,452
June ............................................................. 1,631 164,508 1,488 153,014 491 68,198
July ............................................................... 1,581 164,497 1,443 153,720 463 62,425
August .......................................................... 1,791 181,107 1,653 171,705 583 77,874
September ................................................... 2,192 233,034 2,024 219,532 635 82,471
October ........................................................ 2,221 229,254 2,062 215,787 697 92,408
November .................................................... 2,415 228,107 2,256 214,631 900 102,284
December .................................................... 2,443 245,661 2,264 231,138 927 114,280
2009
January ........................................................ 2,272 238,717 2,103 224,850 756 100,927
February ....................................................... 2,801 315,507 2,636 300,042 1,194 138,583
March ........................................................... 2,950 295,543 2,758 279,027 1,205 144,713
April .............................................................. 2,579 251,032 2,368 234,796 997 121,435
May .............................................................. 2,758 288,319 2,557 271,425 1,187 147,548
June ............................................................. 2,506 250,275 2,293 232,814 1,048 135,389
July ............................................................... 2,192 223,697 1,977 203,365 620 72,932
August .......................................................... 2,419 220,262 2,177 201,951 778 83,837
September ................................................... 2,305 219,924 2,095 204,596 799 91,665
October ........................................................ 1,975 195,347 1,780 177,977 570 63,646November .................................................... 1,754 154,223 1,585 141,439 464 51,891
December .................................................... 1,725 156,274 1,545 141,649 420 43,584
2010
January ........................................................ 1,716 171,633 1,541 157,597 494 60,059
February ....................................................... 1,492 149,369 1,318 135,490 351 40,564
March ........................................................... 1,635 146,901 1,436 131,953 347 37,273
April .............................................................. 1,675 159,358 1,498 143,814 371 48,646
May .............................................................. 1,665 155,352 1,405 133,913 314 30,967
June ............................................................. 1,729 153,937 1,504 134,837 326 32,646
July ............................................................... 1,528 138,581 1,316 121,378 296 30,752
August .......................................................... 1,658 163,325 1,453 141,489 409 47,668
September ................................................... 1,541 137,941 1,331 119,654 336 34,641
October ........................................................ 1,649 147,204 1,445 130,264 353 37,394
November .................................................... 1,579 148,800 1,397 133,845 350 39,072
December .................................................... 1,483 137,992 1,272 122,688 319 35,977
2011
January ........................................................ 1,534 149,799 1,344 132,730 341 39,189
February ....................................................... 1,421 130,818 1,220 116,190 291 26,060
March ........................................................... 1,286 118,523 1,128 105,636 253 27,619
April .............................................................. 1,564 143,927 1,401 129,702 327 35,022
May .............................................................. 1,599 143,540 1,405 127,494 373 38,673
June ............................................................. 1,532 143,444 1,348 128,105 341 35,693
Date
Total Private nonfarm Manufacturing
EventsInitial
claimantsEvents
Initial
claimantsEvents
Initial
claimants
8/6/2019 Mass Layoffs June 2011
http://slidepdf.com/reader/full/mass-layoffs-june-2011 6/10
Table 2. Mass layoff events and initial claimants for unemployment insurance, July 2007 to June 2011,
not seasonally adjusted
2007
July ............................................................... 1,599 175,419 1,450 164,939 684 101,390
August .......................................................... 963 93,458 908 88,345 220 23,361
September ................................................... 717 67,385 667 64,026 246 29,381
October ........................................................ 1,083 108,455 929 97,716 338 50,918
November .................................................... 1,799 198,220 1,593 181,184 514 75,413
December .................................................... 2,167 224,214 2,071 216,898 699 91,754
2008
January ........................................................ 1,647 154,503 1,520 144,191 488 54,418
February ....................................................... 1,269 119,508 1,178 113,587 361 42,527
March ........................................................... 1,089 114,541 1,039 110,147 333 43,740
April .............................................................. 1,272 130,810 1,172 121,625 394 48,188
May .............................................................. 1,552 159,471 1,438 150,462 388 51,698
June ............................................................. 1,622 166,742 1,315 140,916 309 42,097
July ............................................................... 1,891 200,382 1,687 186,018 760 108,733
August .......................................................... 1,427 139,999 1,343 133,146 414 51,912
September ................................................... 1,292 129,586 1,202 122,505 361 46,391
October ........................................................ 2,125 221,784 1,917 205,553 689 100,457
November .................................................... 2,574 241,589 2,389 226,657 997 107,620
December .................................................... 3,377 351,305 3,232 340,220 1,378 172,529
2009
January ........................................................ 3,806 388,813 3,633 375,293 1,461 172,757
February ....................................................... 2,262 218,438 2,173 210,755 945 103,588
March ........................................................... 2,191 228,387 2,107 221,397 940 114,747
April .............................................................. 2,547 256,930 2,385 243,321 887 100,872
May .............................................................. 2,738 289,628 2,572 274,047 1,005 123,683
June ............................................................. 2,519 256,357 2,051 216,063 674 85,726
July ............................................................... 3,054 336,654 2,659 296,589 1,133 154,208
August .......................................................... 1,428 125,024 1,334 117,193 436 41,151
September ................................................... 1,371 123,177 1,258 115,141 448 51,126
October ........................................................ 1,934 193,904 1,678 172,883 566 69,655November .................................................... 1,870 164,496 1,679 150,751 517 55,053
December .................................................... 2,310 214,648 2,166 203,655 615 64,540
2010
January ........................................................ 2,860 278,679 2,682 265,074 962 104,846
February ....................................................... 1,183 102,818 1,091 96,022 282 30,728
March ........................................................... 1,197 111,727 1,111 105,514 273 29,745
April .............................................................. 1,840 199,690 1,697 184,654 424 55,178
May .............................................................. 1,354 123,333 1,170 109,203 216 19,334
June ............................................................. 1,861 171,190 1,355 125,872 212 21,083
July ............................................................... 2,124 206,254 1,732 172,248 532 64,200
August .......................................................... 976 92,435 897 83,021 230 23,088
September ................................................... 920 77,654 806 67,987 187 19,403
October ........................................................ 1,642 148,638 1,373 127,865 351 40,861
November .................................................... 1,676 158,048 1,477 142,591 389 41,383
December .................................................... 1,931 184,130 1,763 172,881 465 52,816
2011
January ........................................................ 2,558 246,463 2,372 229,765 693 75,006
February ....................................................... 1,024 85,585 919 78,718 222 18,471
March ........................................................... 908 85,095 844 80,014 191 20,869
April .............................................................. 1,750 189,919 1,625 176,478 397 47,104
May .............................................................. 1,367 119,911 1,221 108,531 270 25,199
June ............................................................. 1,661 159,930 1,238 122,821 226 22,986
Date
Total Private nonfarm Manufacturing
EventsInitial
claimantsEvents
Initial
claimantsEvents
Initial
claimants
8/6/2019 Mass Layoffs June 2011
http://slidepdf.com/reader/full/mass-layoffs-june-2011 7/10
Table 3. Industry distribution: Mass layoff events and initial claimants for unemployment insurance
Mass layoff eventsInitial claimants for
unemployment insurance
June April May June June April May June
2010 2011 2011 2011 2010 2011 2011 2011
Seasonally adjusted
Total ............................................................... 1,729 1,564 1,599 1,532 153,937 143,927 143,540 143,444
Total, private nonfarm ........................................ 1,504 1,401 1,405 1,348 134,837 129,702 127,494 128,105
Manufacturing .................................................. 326 327 373 341 32,646 35,022 38,673 35,693
Not seasonally adjusted
Total1
............................................................ 1,861 1,750 1,367 1,661 171,190 189,919 119,911 159,930
Total, private ........................................................ 1,398 1,685 1,243 1,282 128,691 183,436 109,881 125,944
Agriculture, forestry, fishing and hunting ......... 43 60 22 44 2,819 6,958 1,350 3,123
Total, private nonfarm ........................................ 1,355 1,625 1,221 1,238 125,872 176,478 108,531 122,821
Mining .............................................................. (2
) 4 5 (2
) (2
) 270 308 (2
)Utilities ............................................................. 5 (
2) (
2) (
2) 343 (
2) (
2) (
2)
Construction .................................................... 121 161 137 84 8,405 12,121 9,875 6,847
Manufacturing .................................................. 212 397 270 226 21,083 47,104 25,199 22,986
Food ............................................................ 46 84 64 51 3,315 9,064 6,036 5,011
Beverage and tobacco products .................. 5 6 2 – 259 438 2 –
Textile mills .................................................. 4 5 12 8 584 792 1,045 1,131
Textile product mills ..................................... 2 6 2 6 2 536 2 420
Apparel ........................................................ 7 10 10 10 737 964 1,174 1,119
Leather and allied products ......................... 2 –
2 2
2 –
2 2
Wood products ............................................ 20 19 10 12 2,012 1,681 755 1,083
Paper ........................................................... 4 6 9 5 382 590 934 427
Printing and related support activities .......... 12 8 14 5 878 858 1,182 383
Petroleum and coal products ....................... – – 2
2 – –
2 2
Chemicals .................................................... 3 5 8 (2
) 375 453 503 (2
)
Plastics and rubber products ....................... 5 21 14 11 353 2,113 1,082 880
Nonmetallic mineral products ...................... 9 9 6 5 492 926 635 380
Primary metals ............................................. 9 12 11 11 762 944 1,053 914
Fabricated metal products ........................... 8 21 11 10 621 1,758 848 607
Machinery .................................................... 16 16 12 16 2,329 2,552 2,054 2,042
Computer and electronic products ............... 8 18 12 10 654 1,675 731 716
Electrical equipment and appliances ........... 5 16 7 9 734 1,736 1,049 915Transportation equipment ............................ 34 117 45 34 4,474 18,328 4,146 4,871
Furniture and related products .................... 11 9 12 7 1,560 831 888 771
Miscellaneous manufacturing ...................... 3 9 5 9 232 865 456 826
Wholesale trade ............................................... 14 27 21 18 955 2,005 1,777 1,440
Retail trade ...................................................... 107 147 108 82 10,102 16,501 8,244 7,177
Transportation and warehousing ..................... 159 194 38 144 19,790 26,537 3,371 19,513
Information ....................................................... 41 42 36 41 4,321 5,689 5,394 5,721
Finance and insurance .................................... 39 42 24 18 2,621 3,482 1,616 1,158
Real estate and rental and leasing .................. 8 15 7 7 437 1,389 457 779
Professional and technical services ................ 30 80 50 32 2,970 8,572 4,062 3,378
Management of companies and enterprises ... (2
) 7 (2
) 5 (2
) 550 (2
) 351
Administrative and waste services .................. 175 262 203 170 14,283 23,380 15,938 16,582
Educational services ........................................ 40 17 15 26 2,588 2,522 1,201 1,604
Health care and social assistance ................... 174 46 102 177 14,283 3,397 11,059 14,975
Arts, entertainment, and recreation ................. 29 45 24 30 1,764 4,650 1,835 1,664
Accommodation and food services .................. 141 127 148 120 18,121 17,269 15,483 14,179Other services, except public administration ... 54 9 28 53 3,284 845 2,361 4,129
Unclassified ..................................................... – 2 – – –
2 – –
Government ......................................................... 463 65 124 379 42,499 6,483 10,030 33,986
Federal ............................................................ 22 6 12 18 2,076 582 1,160 1,942
State ................................................................ 37 18 32 29 2,813 1,714 2,136 2,086
Local ................................................................ 404 41 80 332 37,610 4,187 6,734 29,958
1 Data were reported by all states and the District of Columbia. NOTE: Dash represents zero.
2 Data do not meet BLS or state agency disclosure standards.
Industry
8/6/2019 Mass Layoffs June 2011
http://slidepdf.com/reader/full/mass-layoffs-june-2011 8/10
Table 4. Mass layoff events and initial claimants for unemployment insurance, April 2009 to June 2011,
not seasonally adjusted
Extended mass layoffs
lasting more than 30 daysRealization rates
1
EventsInitial
claimantsEvents
Initial
claimantsEvents
Initial
claimantsEvents
Initial
claimants
2009
April ............................................ 2,547 256,930 2,385 243,321May ............................................ 2,738 289,628 2,572 274,047
June ........................................... 2,519 256,357 2,051 216,063
Second Quarter ......................... 7,804 802,915 7,008 733,431 3,395 731,049 48.4 99.7
July ............................................ 3,054 336,654 2,659 296,589
August ........................................ 1,428 125,024 1,334 117,193
September ................................. 1,371 123,177 1,258 115,141
Third Quarter ............................. 5,853 584,855 5,251 528,923 2,034 406,823 38.7 76.9
October ...................................... 1,934 193,904 1,678 172,883
November .................................. 1,870 164,496 1,679 150,751
December .................................. 2,310 214,648 2,166 203,655
Fourth Quarter ........................... 6,114 573,048 5,523 527,289 2,416 468,577 43.7 88.9
2010January ...................................... 2,860 278,679 2,682 265,074
February .................................... 1,183 102,818 1,091 96,022
March ......................................... 1,197 111,727 1,111 105,514
First Quarter ............................... 5,240 493,224 4,884 466,610 1,870 368,642 38.3 79.0
April ............................................ 1,840 199,690 1,697 184,654
May ............................................ 1,354 123,333 1,170 109,203
June ........................................... 1,861 171,190 1,355 125,872
Second Quarter ......................... 5,055 494,213 4,222 419,729 2,008 395,573 47.6 94.2
July ............................................ 2,124 206,254 1,732 172,248
August ........................................ 976 92,435 897 83,021
September ................................. 920 77,654 806 67,987
Third Quarter ............................. 4,020 376,343 3,435 323,256 1,370 259,886 39.9 80.4
October ...................................... 1,642 148,638 1,373 127,865
November .................................. 1,676 158,048 1,477 142,591
December .................................. 1,931 184,130 1,763 172,881
Fourth Quarter ........................... 5,249 490,816 4,613 443,337 1,999 388,285 43.3 87.6
2011
January ...................................... 2,558 246,463 2,372 229,765
February .................................... 1,024 85,585 919 78,718
March ......................................... 908 85,095 844 80,014
First Quarter ............................... 4,490 417,143 4,135 388,497 2,p 1,397 2,p 179,686 p 33.8 p 46.3
April ............................................ 1,750 189,919 1,625 176,478
May ............................................ 1,367 119,911 1,221 108,531
June ........................................... 1,661 159,930 1,238 122,821
Second Quarter ......................... 4,778 469,760 4,084 407,830
1The event realization rate is the percentage of all private nonfarm data on these layoffs become available. Experience suggests that the
mass layoff events lasting more than 30 days. The initial claimant realization number of extended mass layoff events is generally revised upwards
rate is the percentage of all private nonfarm mass layoff initial claimants by less than 10 percent and the number of initial claimants associated
associated with layoffs lasting more than 30 days. with such events increases by 25-40 percent.2
These quarterly numbers are provisional and will be revised as morep
= preliminary.
Date
Total mass layoffs
Private nonfarm
Mass layoffs
8/6/2019 Mass Layoffs June 2011
http://slidepdf.com/reader/full/mass-layoffs-june-2011 9/10
Table 5. Mass layoff events and initial claimants for unemployment insurance by census region and division,
not seasonally adjusted
Mass layoff eventsInitial claimants for
unemployment insurance
June April May June June April May June
2010 2011 2011 2011 2010 2011 2011 201
United States1
......................................... 1,861 1,750 1,367 1,661 171,190 189,919 119,911 159,93
Northeast .......................................................... 288 402 210 276 32,587 54,129 17,726 30,51
New England ................................................ 54 67 30 53 6,003 8,926 2,505 5,00
Middle Atlantic .............................................. 234 335 180 223 26,584 45,203 15,221 25,50
South ................................................................ 442 431 468 482 39,969 42,685 43,457 45,18
South Atlantic ............................................... 267 210 234 273 23,150 17,371 18,785 24,62
East South Central ....................................... 73 125 131 60 7,108 16,048 14,830 5,60
West South Central ...................................... 102 96 103 149 9,711 9,266 9,842 14,95
Midwest ............................................................ 390 383 288 326 39,201 44,126 26,017 33,81
East North Central ........................................ 290 310 217 236 29,931 37,250 18,948 26,40
West North Central ....................................... 100 73 71 90 9,270 6,876 7,069 7,41
West ................................................................. 741 534 401 577 59,433 48,979 32,711 50,42
Mountain ....................................................... 105 118 68 64 9,136 12,547 5,948 6,01
Pacific ........................................................... 636 416 333 513 50,297 36,432 26,763 44,41
1See footnote 1, table 3. Kentucky, Mississippi, and Tennessee; West South Central: Arkansas,
NOTE: The States (including the District of Columbia) that Louisiana, Oklahoma, and Texas; East North Central: Illinois, Indiana,
comprise the census divisions are: New England: Connecticut, Michigan, Ohio, and Wisconsin; West North Central: Iowa, Kansas,
Maine, Massachusetts, New Hampshire, Rhode Island, Minnesota, Missouri, Nebraska, North Dakota, and South Dakota;
and Vermont; Middle Atlantic: New Jersey, New York, and Mountain: Arizona, Colorado, Idaho, Montana, Nevada, New Mexico,
Pennsylvania; South Atlantic: Delaware, District of Columbia, Utah, and Wyoming; and Pacific: Alaska, California, Hawaii, Oregon,
Florida, Georgia, Maryland, North Carolina, South Carolina, and Washington.
Virginia, and West Virginia; East South Central: Alabama,
Census region and division
8/6/2019 Mass Layoffs June 2011
http://slidepdf.com/reader/full/mass-layoffs-june-2011 10/10
Table 6. State distribution: Mass layoff events and initial claimants for unemployment insurance,
not seasonally adjusted
Mass layoff eventsInitial claimants for
unemployment insurance
June April May June June April May June
2010 2011 2011 2011 2010 2011 2011 2011
Total 1 .............................................. 1,861 1,750 1,367 1,661 171,190 189,919 119,911 159,930
Alabama .............................................. 32 28 37 20 3,783 3,080 3,604 1,922
Alaska ................................................. 2 9 6 2 2 1,137 489 2
Arizona ................................................ 28 40 15 18 2,197 5,635 1,394 1,561
Arkansas ............................................. 7 2 15 29 521 2 1,647 3,185
California ............................................. 590 348 285 462 44,939 29,264 22,874 39,788
Colorado ............................................. 14 15 10 9 1,237 1,750 1,171 708
Connecticut ......................................... 11 10 11 10 968 1,056 769 807
Delaware ............................................. 7 8 5 6 477 551 334 415
District of Columbia ............................. 2 2 5 2 2 2 276 2
Florida ................................................. 123 98 102 114 9,037 7,600 6,363 9,161
Georgia ............................................... 46 40 40 43 4,398 3,380 4,038 4,789
Hawaii ................................................. 7 6 5 4 562 420 351 275
Idaho ................................................... 8 10 6 8 481 896 370 832
Illinois .................................................. 88 56 47 61 8,046 6,701 4,749 6,436
Indiana ................................................ 30 41 28 28 2,977 4,689 2,189 2,722Iowa .................................................... 13 17 6 14 1,686 2,143 1,069 1,359
Kansas ................................................ 14 5 12 8 1,815 381 1,365 682
Kentucky ............................................. 15 56 33 22 1,417 9,722 3,431 2,003
Louisiana ............................................ 26 22 29 28 1,985 1,669 2,531 2,056
Maine .................................................. 5 7 4 7 320 818 318 458
Maryland ............................................. 11 5 5 12 1,172 365 462 1,102
Massachusetts .................................... 13 17 10 16 948 2,040 1,068 1,133
Michigan ............................................. 54 50 38 55 5,047 6,813 3,368 5,413
Minnesota ........................................... 18 16 10 17 1,526 1,023 932 1,249
Mississippi .......................................... 13 27 40 5 768 1,987 5,957 240
Missouri .............................................. 48 23 32 42 3,679 2,259 2,620 3,176
Montana .............................................. 10 7 4 6 659 438 414 531
Nebraska ............................................ 6 9 8 5 504 768 860 441
Nevada ............................................... 24 23 13 12 2,956 1,703 1,133 1,292
New Hampshire .................................. 8 7 3 3 1,277 1,107 233 614
New Jersey ......................................... 56 70 34 44 9,675 11,776 2,937 6,432
New Mexico ........................................ 13 9 10 8 997 711 783 663
New York ............................................ 50 153 56 55 5,201 22,636 4,743 5,185
North Carolina3
.................................. 21 14 40 45 2,378 1,240 3,928 4,871
North Dakota ....................................... – 2 2 2 – 2 2 2
Ohio .................................................... 58 87 63 42 6,056 11,082 5,170 6,150
Oklahoma ........................................... 6 6 9 6 494 392 902 481
Oregon ................................................ 27 25 21 28 3,758 2,886 1,586 2,967
Pennsylvania ...................................... 128 112 90 124 11,708 10,791 7,541 13,892
Rhode Island ....................................... 9 9 (2
) 10 1,723 2,105 (2
) 1,276
South Carolina .................................... 31 19 11 23 3,414 1,913 949 1,878
South Dakota ...................................... 2 2 2 2 2 2 2 2
Tennessee .......................................... 13 14 21 13 1,140 1,259 1,838 1,438
Texas .................................................. 63 67 50 86 6,711 7,118 4,762 9,229
Utah .................................................... 6 13 8 3 461 1,232 554 424
Vermont .............................................. 8 17 2 7 767 1,800 2 716
Virginia ................................................ 24 23 21 25 1,999 2,063 2,050 2,071
Washington ......................................... 10 28 16 17 839 2,725 1,463 1,231
West Virginia ....................................... 2 2 5 3 2 2 385 189
Wisconsin ........................................... 60 76 41 50 7,805 7,965 3,472 5,681
Wyoming ............................................. 2 2 2 – 2 2 2 –
Puerto Rico ......................................... 24 17 24 10 1,763 1,676 2,815 941
1See footnote 1, table 3. data due to a change in MLS unemployment insurance
2 Data do not meet BLS or state agency disclosure standards. input procedures.3
Data starting in November 2010 may not be comparable to prior NOTE: Dash represents zero.
State