Embed Size (px)
Citation preview

Maryland Jurisdiction Epidemiological Profiles on Substance Use and Mental Health | 1
Maryland Epidemiological Profiles on Substance Use And Mental Health Among
Alcohol Users in High School
Jurisdiction Profiles 13 June 2017
The Maryland Statewide Epidemiological Outcomes Workgroup
Department of Pharmaceutical Health Services Research
University of Maryland Baltimore School of Pharmacy
Saratoga Building, 12th Floor
220 Arch Street
Baltimore, Maryland 21201
www.pharmacy.umaryland.edu/programs/seow
Maryland Jurisdiction Epidemiological Profiles on Substance Use and Mental Health | 2
CONTRIBUTORS This report was compiled by the following faculty, staff, and students of the Department of Pharmaceutical Health Services Research in the University Of Maryland School Of Pharmacy: Linda Simoni-Wastila, BSPharm, PhD Professor and Director, SEOW 410.706.4352 [email protected] Sean Fleming, MSW Senior Research Analyst Michelle Choi, PharmD Post-Doctoral Fellow Bilal Khokar, PhD Post-Doctoral Fellow Patience Moyo, MS, PhD Graduate Research Assistant Aida Kuzucan, PharmD, PhD Student Graduate Research Assistant Kriti Sharma, MPH Peter Lamy Center Fellow Abree Johnson, MS Project Analyst, Pharmaceutical Research Computing
Maryland Jurisdiction Epidemiological Profiles on Substance Use and Mental Health | 3
Table of Contents Data Sources and Considerations for Use ...................................................................................... 4
Jurisdiction Profiles
Allegany County .............................................................................................................................................. 5-6
Anne Arundel County ...................................................................................................................... 7-8
Baltimore County ........................................................................................................................... 9-10
Calvert County ............................................................................................................................. 11-12
Caroline County ........................................................................................................................... 13-14
Carroll County .............................................................................................................................. 15-16
Cecil County ................................................................................................................................................. 17-18
Charles County ............................................................................................................................ 19-20
Dorchester County ...................................................................................................................... 21-22
Frederick County ........................................................................................................................ 23-24
Garrett County .............................................................................................................................. 25-26
Harford County ............................................................................................................................ 27-28
Howard County .......................................................................................................................................... 29-30
Kent County .................................................................................................................................. 31-32
Montgomery County ................................................................................................................... 33-34
Prince George’s County ............................................................................................................ 35-36
Queen Anne’s County ................................................................................................................. 37-38
Saint Mary’s County .................................................................................................................... 39-40
Somerset County ....................................................................................................................................... 41-42
Talbot County .............................................................................................................................. 43-44
Washington County .................................................................................................................... 45-46
Wicomico County ........................................................................................................................ 47-48
Worcester County ........................................................................................................................ 49-50
Baltimore City ............................................................................................................................... 51-52
Maryland Jurisdiction Epidemiological Profiles on Substance Use and Mental Health | 4
Data Sources & Considerations for Use Maryland Youth Risk Behavior Survey (YRBS): The YRBS provides state and county level data on behaviors and perceptions linked to disease and death among middle and high school students in the United States. YRBS, a part of the Centers for Disease Control and Prevention’s Youth Risk Behavior Surveillance System (CDC YRBSS), is facilitated by The Maryland Department of Health and Mental Hygiene. Maryland’s participation in the CDC YRBSS has been mandated since 2005 with survey data available for 2007, 2009, 2011, 2013 and 2014. The 2014 YRBS was administered in the fall of 2014 to a representative sample of students in grades 6-8 and 9-12. From 175 and 183, public middle schools and high schools respectively, over 80,000 students completed the survey. The results from the 2014 high school YRBS were analyzed to explore polysubstance use and mental health among alcohol users in each jurisdiction in Maryland. The profiles build on the report published by the Maryland Department of Health and Mental Hygiene (DHMH). Jurisdiction reports were distributed to public health officials and stakeholders identified by the Behavioral Health Administration (BHA) in the state of Maryland. Recipients were encouraged to share the documents, utilize the information for needs assessments and planning. The SEOW team welcomes any questions, feedback, and suggestions that arise from the review of these profiles. Important considerations regarding YRBS data:
• All YRBS data are self-reported and the extent of under reporting or over reporting behaviors has not been determined.
• Out-of-school, home schooled and privately educated youth are not represented in the survey. For more information visit: http://phpa.dhmh.maryland.gov/ccdpc/Reports/Pages/yrbs.aspx

SUMMARY—
Alcoho
Co
This report highlights recent information on the consumption and consequences of alcohol in Allegany County, Maryland.
Alcohol Consumption According to the 2014 YRBS, 44.6% of 9th
graders, 63.7% of 10th graders, 65.9% of
11th graders, and 73.1% of 12th graders
reported using alcohol in their lifetime; and
20.1% of 9th graders, 30.9% of 10th graders,
34.9% of 11th graders, and 44.9% of 12th
graders reported current alcohol use (Fig.
1). Compared to peers statewide, Allegany
County high schoolers reported higher rates
of current alcohol use in every grade
(statewide data not shown).
Pg. 1/2 June 2017
Maryland State Epidemiological Outcomes Workgroup
(SEOW)
Allegany County female students reported a higher rate of any lifetime alcohol use (64.0%) than female students statewide (58.3%) (Fig. 2a). One third of Allegany County female students reported current alcohol use, slightly higher than females statewide (33.2% vs. 31.1%, respectively) (Fig. 2b). Allegany County female and male students reported similar rates of binge alcohol use (20.3% and 20.1%, respectively), both higher than students statewide (15.0% and 15.1%, respectively) (Fig. 2c).
Allegany County: Substance Use and Mental Health Among Alcohol Users in High School
High School Demographics:
Allegany County
Students Surveyed: 1,726
Racial Mix: 3.6% Black; 85.2% White; 11.2% Other Gender: 49.7% Female; 50.3% Male
Grade: 31.1% 9th Grade; 21.1% 10th Grade; 24.9% 11th Grade; 22.9% 12th Grade
SUMMARY— The Maryland Statewide Epidemiological Workgroup (SEOW) analyzed the
2014 Maryland High School Youth Risk Behavior Survey (YRBS) data for Maryland and each
jurisdiction. In Allegany County:
Female students reported higher rates of alcohol use than male students
Students who ever used alcohol had higher rates of ever using other drugs
Students who were current or binge alcohol users had higher rates of current marijuana
and prescription drug use without a prescription
Students who were current or binge alcohol users had higher rates of feeling sad or
hopeless, and considered suicide and/or made a suicide plan
The 2014 Maryland YRBS is the source of data used for all tables and graphs. The survey uses three time frame measurements when assessing students’ substance use and mental health status. Any lifetime use is defined as whether or not a student has ever used a substance. Past year substance use is defined as any use in the past 12 months. Current use is defined as substance use in the past 30 days. Current binge alcohol use is defined as five or more drinks in a row in the past thirty days.

The Maryland SEOW is led by Dr. Linda Simoni-Wastila at the University of Maryland Baltimore School of Pharmacy, [email protected]. For more information, visit http://www.pharmacy.umaryland.edu/programs/seow/
Allegany County students who reported any lifetime alcohol use were slightly less likely to report using marijuana and prescription drugs without a doctor’s prescription compared to peers statewide (Fig. 3). Over half of those who ever drank alcohol also used marijuana, and over one-fifth reported using a prescription drug without a doctor’s prescription. Overall, 27.9% of Allegany County students who reported ever using alcohol reported using at least one other drug including: inhalants (12.1%), synthetic marijuana (8.7%), or ecstasy (10.7%).
‘Other drug use’ includes inhalants, synthetic marijuana, ecstasy, cocaine, steroids, heroin, and methamphetamine.
Other Drug Use
Allegany County students who currently drank were more likely to report current marijuana use than non-drinking peers (48.8% vs. 6.5%, respectively); 17.9% of current drinkers reported using a prescription drug without a doctor’s prescription (Fig. 4a).
Students who reported binge drinking were more likely to report current marijuana use (59.3%) than peers who do not binge drink (10.1%); 23.7% of binge drinkers reported using a prescription drug without a doctor’s prescription (Fig. 4b).
Compared to non-drinking peers, Allegany County high school students who reported current alcohol use were more likely to report feel-
ing sad or hopeless (36.6% vs. 20.1%, respectively) and considered suicide/made a suicide plan (29.0% vs. 13.2%, respectively). Students who
reported current alcohol use plus current marijuana use and/or prescription drug use without a doctor’s prescription were more likely to
report feeling sad or hopeless (44.0%) and considered suicide/made a suicide plan (38.0%) (Fig. 5a).
A higher percentage of binge drinkers in Allegany County high schools reported feeling sad or hopeless (39.9%) as compared to non-binge-
drinking peers (22.0%) and had higher rates of considering suicide/making a suicide plan (34.1% vs. 14.8%, respectively) (Fig. 5b).
Pg. 2/2 June 2017
Mental Health
SUMMARY—
Alcohol Use and Consequences:
Allegany County
Co
This report highlights recent information on the consumption and consequences of alcohol in Allegany County, Maryland.
Alcohol Consumption
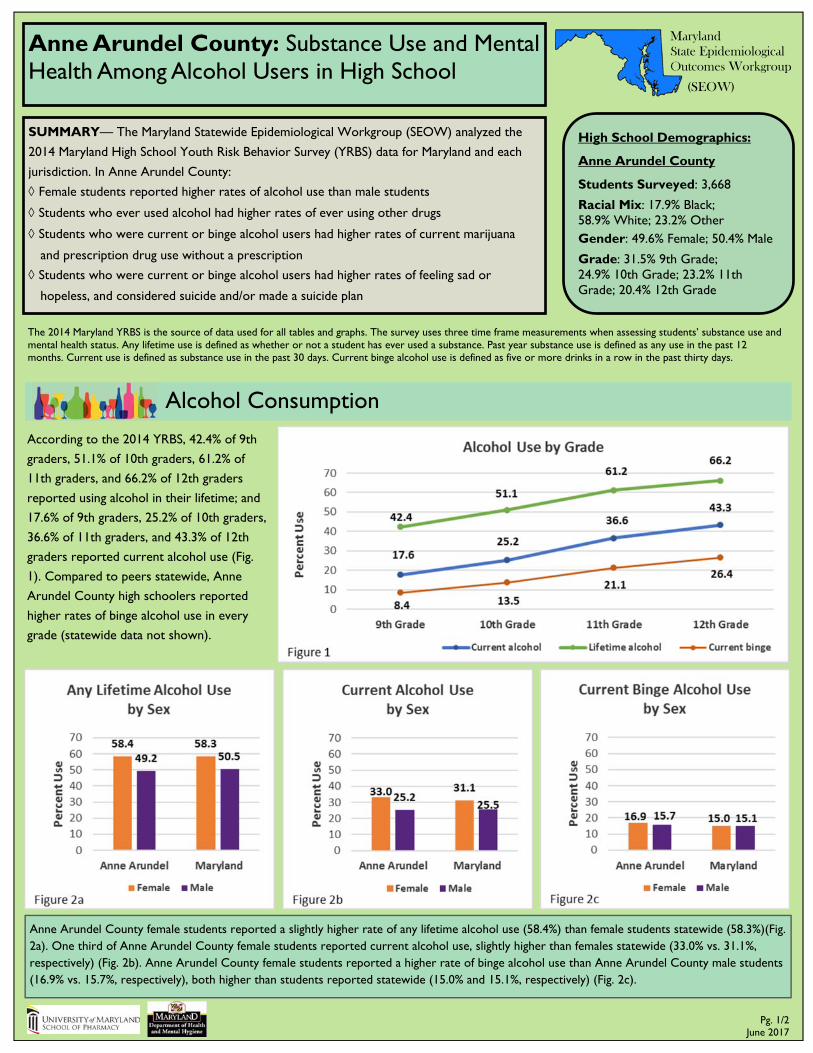
According to the 2014 YRBS, 42.4% of 9th
graders, 51.1% of 10th graders, 61.2% of
11th graders, and 66.2% of 12th graders
reported using alcohol in their lifetime; and
17.6% of 9th graders, 25.2% of 10th graders,
36.6% of 11th graders, and 43.3% of 12th
graders reported current alcohol use (Fig.
1). Compared to peers statewide, Anne
Arundel County high schoolers reported
higher rates of binge alcohol use in every
grade (statewide data not shown).
Pg. 1/2 June 2017
Maryland State Epidemiological Outcomes Workgroup
(SEOW)
Anne Arundel County female students reported a slightly higher rate of any lifetime alcohol use (58.4%) than female students statewide (58.3%)(Fig. 2a). One third of Anne Arundel County female students reported current alcohol use, slightly higher than females statewide (33.0% vs. 31.1%, respectively) (Fig. 2b). Anne Arundel County female students reported a higher rate of binge alcohol use than Anne Arundel County male students (16.9% vs. 15.7%, respectively), both higher than students reported statewide (15.0% and 15.1%, respectively) (Fig. 2c).
Anne Arundel County: Substance Use and Mental Health Among Alcohol Users in High School
High School Demographics:
Anne Arundel County
Students Surveyed: 3,668
Racial Mix: 17.9% Black; 58.9% White; 23.2% Other Gender: 49.6% Female; 50.4% Male
Grade: 31.5% 9th Grade; 24.9% 10th Grade; 23.2% 11th Grade; 20.4% 12th Grade
SUMMARY— The Maryland Statewide Epidemiological Workgroup (SEOW) analyzed the
2014 Maryland High School Youth Risk Behavior Survey (YRBS) data for Maryland and each
jurisdiction. In Anne Arundel County:
Female students reported higher rates of alcohol use than male students
Students who ever used alcohol had higher rates of ever using other drugs
Students who were current or binge alcohol users had higher rates of current marijuana
and prescription drug use without a prescription
Students who were current or binge alcohol users had higher rates of feeling sad or
hopeless, and considered suicide and/or made a suicide plan
The 2014 Maryland YRBS is the source of data used for all tables and graphs. The survey uses three time frame measurements when assessing students’ substance use and mental health status. Any lifetime use is defined as whether or not a student has ever used a substance. Past year substance use is defined as any use in the past 12 months. Current use is defined as substance use in the past 30 days. Current binge alcohol use is defined as five or more drinks in a row in the past thirty days.

The Maryland SEOW is led by Dr. Linda Simoni-Wastila at the University of Maryland Baltimore School of Pharmacy, [email protected]. For more information, visit http://www.pharmacy.umaryland.edu/programs/seow/
Anne Arundel County students who reported any lifetime alcohol use were more likely to report using other substances than non-drinking peers (Fig. 3). Over half of those who ever drank alcohol also used marijuana, almost eight times the rate of non-drinkers, and almost a quarter reported using a prescription drug without a doctor’s prescription. Overall, 28.5% of students who reported ever using alcohol reported using at least one other drug, including: inhalants (11.1%), synthetic marijuana (18.6%), or ecstasy (10.6%).
‘Other drug use’ includes inhalants, synthetic marijuana, ecstasy, cocaine, steroids, heroin, and methamphetamine.
Other Drug Use
Anne Arundel County students who currently drank were more likely to report current marijuana use than non-drinking peers (51.6% vs. 5.6%, respectively); 21.1% of current drinkers reported using a prescription drug without a doctor’s prescription (Fig. 4a). Students who reported binge drinking were more likely to report current marijuana use (63.3%) or prescription drug use without a doctor’s prescription (28.9%), compared to peers who denied binge drinking (10.7% and 3.6%, respectively) (Fig. 4b).
Compared to non-drinking peers, Anne Arundel County high school students who reported current alcohol use were more likely to report
feeling sad or hopeless (40.9% vs. 20.4%, respectively) and considered suicide/made a suicide plan (29.6% vs. 14.6%, respectively). Students
who reported current alcohol use plus current marijuana use and/or prescription drug use without a doctor’s prescription were more likely
to report feeling sad or hopeless (42.8%) and considered suicide/made a suicide plan (32.5%) (Fig. 5a).
A higher percentage of binge drinkers in Anne Arundel County high schools reported feeling sad or hopeless (43.1%) as compared to non-
binge-drinking peers (23.5%) and had higher rates of considering suicide/making a suicide plan (30.3% vs. 17.3%, respectively) (Fig. 5b).
Pg. 2/2 June 2017
Mental Health

SUMMARY—
Alcoho
Co
This report highlights recent information on the consumption and consequences of alcohol in Allegany County, Maryland.
Alcohol Consumption
According to the 2014 YRBS, 40.1% of 9th
graders, 51.4% of 10th graders, 59.2% of
11th graders, and 66.6% of 12th graders
reported using alcohol in their lifetime; and
14.3% of 9th graders, 22.0% of 10th graders,
31.0% of 11th graders, and 36.9% of 12th
graders reported current alcohol use (Fig.
1). Compared to their peers statewide,
Baltimore County high schoolers reported
lower rates of all alcohol use in every grade
(statewide data not shown).
Pg. 1/2 June 2017
Maryland State Epidemiological Outcomes Workgroup
(SEOW)
Baltimore County female students reported a higher rate of any lifetime alcohol use (59.2%) than female students statewide (58.3%) (Fig. 2a). A lower percentage of Baltimore County female students reported current alcohol use than females statewide (29.2% vs. 31.1%, respectively) (Fig. 2b). Baltimore County female and male students reported similar rates of binge alcohol use (12.5% and 12.7%, respectively), both lower than students reported statewide (15.0% and 15.1%, respectively) (Fig. 2c).
Baltimore County: Substance Use and Mental Health Among Alcohol Users in High School
High School Demographics:
Baltimore County
Students Surveyed: 3,885
Racial Mix: 35.4% Black; 40.6%White; 24.0% Other Gender: 51.1% Female; 48.9% Male
Grade: 25.9% 9th Grade; 30.2% 10th Grade; 22.4% 11th Grade; 21.3% 12th Grade
SUMMARY— The Maryland Statewide Epidemiological Workgroup (SEOW) analyzed the
2014 Maryland High School Youth Risk Behavior Survey (YRBS) for Maryland and each
jurisdiction. In Baltimore County:
Female students reported higher rates of alcohol use than male students
Students who ever used alcohol had higher rates of ever using other drugs
Students who were current or binge alcohol users had higher rates of current marijuana
and prescription drug use without a prescription
Students who were current or binge alcohol users had higher rates of feeling sad or
hopeless, and considered suicide and/or made a suicide plan
The 2014 Maryland YRBS is the source of data used for all tables and graphs. The survey uses three time frame measurements when assessing students’ substance use and mental health status. Any lifetime use is defined as whether or not a student has ever used a substance. Past year substance use is defined as any use in the past 12 months. Current use is defined as substance use in the past 30 days. Current binge alcohol use is defined as five or more drinks in a row in the past thirty days.

The Maryland SEOW is led by Dr. Linda Simoni-Wastila at the University of Maryland Baltimore School of Pharmacy, [email protected]. For more information, visit http://www.pharmacy.umaryland.edu/programs/seow/
Baltimore County students who reported any lifetime alcohol use were more likely to report using other substances than non-drinking peers (Fig. 3). Over half of those who ever drank alcohol also used marijuana, more than six times the rate of non-drinkers, and over one-fifth reported using a prescription drug without a doctor’s prescription. Overall, 23.2% of students who reported ever using alcohol reported using at least one other drug, including: inhalants (11.6%), synthetic marijuana (12.7%), or ecstasy (9.0%).
‘Other drug use’ includes inhalants, synthetic marijuana, ecstasy, cocaine, steroids, heroin, and methamphetamine.
Other Drug Use
Baltimore County students who currently drank were more likely to report current marijuana use (49.5%) or prescription drug use without a doctor’s prescription (17.1%) than non-drinking peers (6.6% and 2.6%, respectively) (Fig. 4a).
Students who reported binge drinking were more likely to report current marijuana use (64.6%) or prescription drug use without a doctor’s prescription (25.3%), compared to peers who denied binge drinking (11.8% and 4.3%, respectively) (Fig. 4b).
Compared to non-drinking peers, Baltimore County high school students who reported current alcohol use were more likely to report feel-
ing sad or hopeless (41.2% vs. 23.0%, respectively) and considered suicide/made a suicide plan (29.6% vs. 14.2%, respectively) (Fig. 5a). Stu-
dents who reported current alcohol use plus current marijuana use and/or prescription drug use without a doctor’s prescription were more
likely to report feeling sad or hopeless (47.5%) and considered suicide/made a suicide plan (36.2%) (Fig. 5a).
A higher percentage of binge drinkers in Baltimore County high schools reported feeling sad or hopeless (43.1%) compared to non-binge-
drinking peers (25.9%) and had higher rates of considering suicide/making a suicide plan (29.8% vs. 16.8%, respectively) (Fig. 5b).
Pg. 2/2 June 2017
Mental Health
SUMMARY—
Alcoho
Co
This report highlights recent information on the consumption and consequences of alcohol in Allegany County, Maryland.
Alcohol Consumption
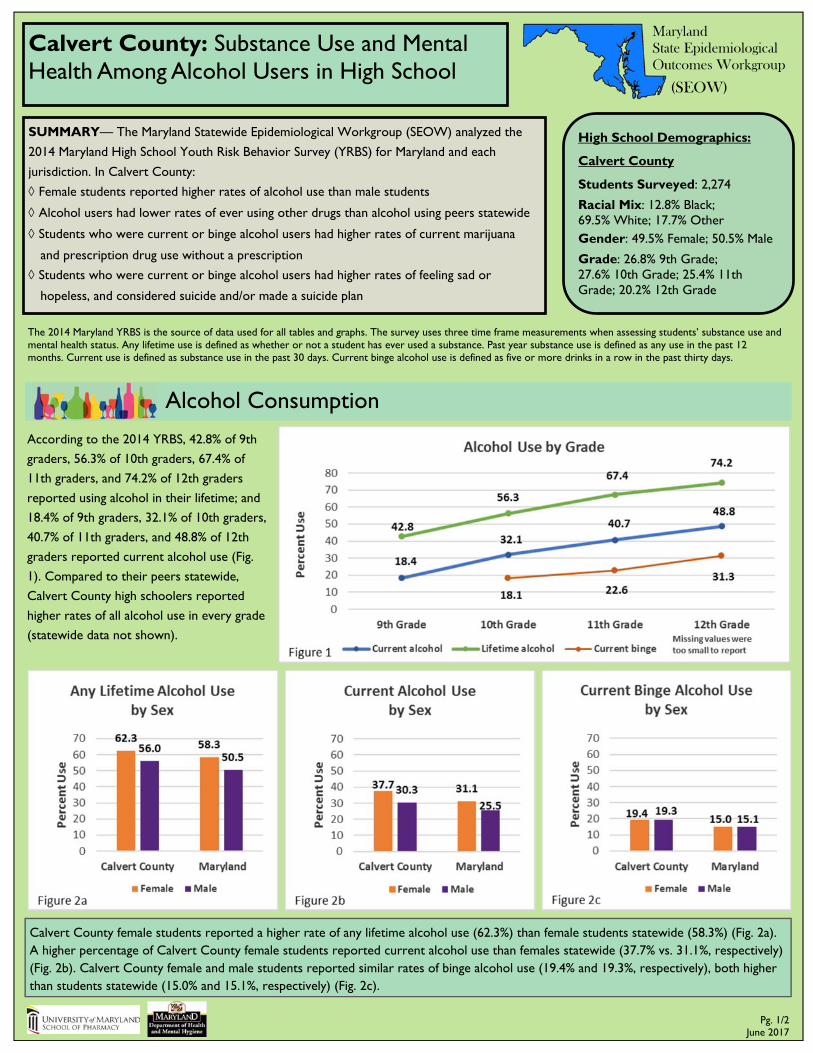
According to the 2014 YRBS, 42.8% of 9th
graders, 56.3% of 10th graders, 67.4% of
11th graders, and 74.2% of 12th graders
reported using alcohol in their lifetime; and
18.4% of 9th graders, 32.1% of 10th graders,
40.7% of 11th graders, and 48.8% of 12th
graders reported current alcohol use (Fig.
1). Compared to their peers statewide,
Calvert County high schoolers reported
higher rates of all alcohol use in every grade
(statewide data not shown).
Pg. 1/2 June 2017
Maryland State Epidemiological Outcomes Workgroup
(SEOW)
Calvert County female students reported a higher rate of any lifetime alcohol use (62.3%) than female students statewide (58.3%) (Fig. 2a). A higher percentage of Calvert County female students reported current alcohol use than females statewide (37.7% vs. 31.1%, respectively) (Fig. 2b). Calvert County female and male students reported similar rates of binge alcohol use (19.4% and 19.3%, respectively), both higher than students statewide (15.0% and 15.1%, respectively) (Fig. 2c).
Calvert County: Substance Use and Mental Health Among Alcohol Users in High School
High School Demographics:
Calvert County
Students Surveyed: 2,274
Racial Mix: 12.8% Black; 69.5% White; 17.7% Other Gender: 49.5% Female; 50.5% Male
Grade: 26.8% 9th Grade; 27.6% 10th Grade; 25.4% 11th Grade; 20.2% 12th Grade
SUMMARY— The Maryland Statewide Epidemiological Workgroup (SEOW) analyzed the
2014 Maryland High School Youth Risk Behavior Survey (YRBS) for Maryland and each
jurisdiction. In Calvert County:
Female students reported higher rates of alcohol use than male students
Alcohol users had lower rates of ever using other drugs than alcohol using peers statewide
Students who were current or binge alcohol users had higher rates of current marijuana
and prescription drug use without a prescription
Students who were current or binge alcohol users had higher rates of feeling sad or
hopeless, and considered suicide and/or made a suicide plan
The 2014 Maryland YRBS is the source of data used for all tables and graphs. The survey uses three time frame measurements when assessing students’ substance use and mental health status. Any lifetime use is defined as whether or not a student has ever used a substance. Past year substance use is defined as any use in the past 12 months. Current use is defined as substance use in the past 30 days. Current binge alcohol use is defined as five or more drinks in a row in the past thirty days.
The Maryland SEOW is led by Dr. Linda Simoni-Wastila at the University of Maryland Baltimore School of Pharmacy, [email protected]. For more information, visit http://www.pharmacy.umaryland.edu/programs/seow/
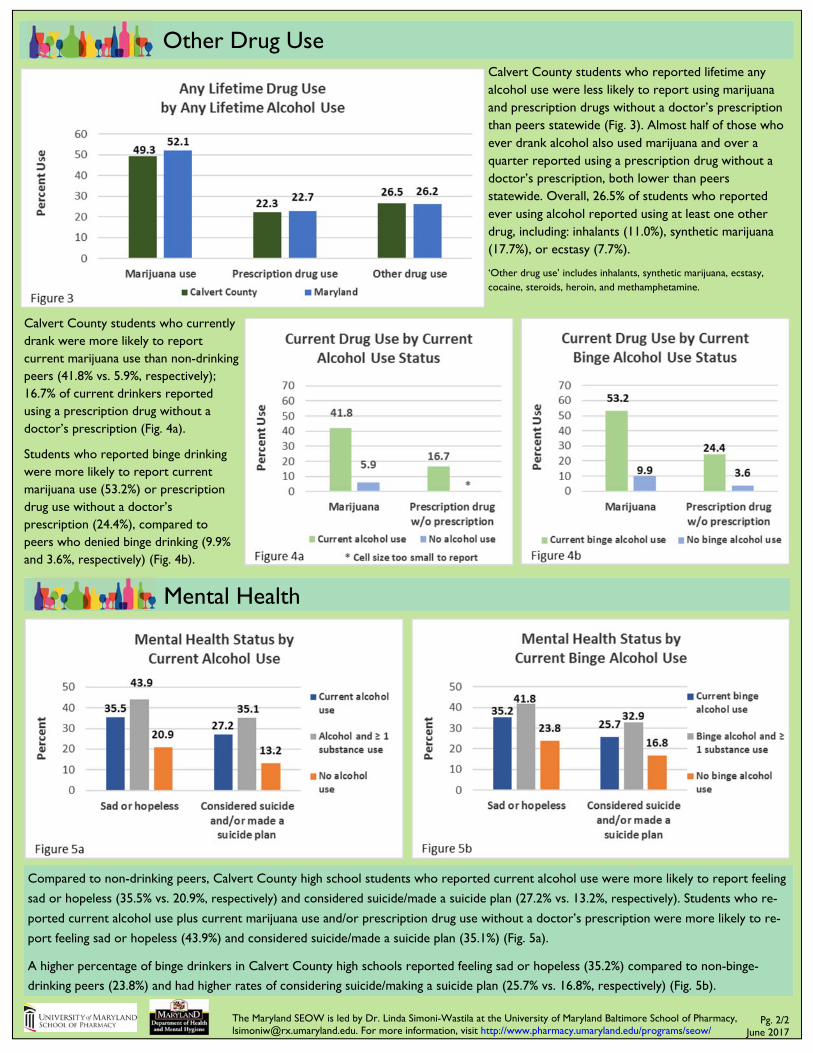
Calvert County students who reported lifetime any alcohol use were less likely to report using marijuana and prescription drugs without a doctor’s prescription than peers statewide (Fig. 3). Almost half of those who ever drank alcohol also used marijuana and over a quarter reported using a prescription drug without a doctor’s prescription, both lower than peers statewide. Overall, 26.5% of students who reported ever using alcohol reported using at least one other drug, including: inhalants (11.0%), synthetic marijuana (17.7%), or ecstasy (7.7%).
‘Other drug use’ includes inhalants, synthetic marijuana, ecstasy, cocaine, steroids, heroin, and methamphetamine.
Other Drug Use
Calvert County students who currently drank were more likely to report current marijuana use than non-drinking peers (41.8% vs. 5.9%, respectively); 16.7% of current drinkers reported using a prescription drug without a doctor’s prescription (Fig. 4a).
Students who reported binge drinking were more likely to report current marijuana use (53.2%) or prescription drug use without a doctor’s prescription (24.4%), compared to peers who denied binge drinking (9.9% and 3.6%, respectively) (Fig. 4b).
Compared to non-drinking peers, Calvert County high school students who reported current alcohol use were more likely to report feeling
sad or hopeless (35.5% vs. 20.9%, respectively) and considered suicide/made a suicide plan (27.2% vs. 13.2%, respectively). Students who re-
ported current alcohol use plus current marijuana use and/or prescription drug use without a doctor’s prescription were more likely to re-
port feeling sad or hopeless (43.9%) and considered suicide/made a suicide plan (35.1%) (Fig. 5a).
A higher percentage of binge drinkers in Calvert County high schools reported feeling sad or hopeless (35.2%) compared to non-binge-
drinking peers (23.8%) and had higher rates of considering suicide/making a suicide plan (25.7% vs. 16.8%, respectively) (Fig. 5b).
Pg. 2/2 June 2017
Mental Health

SUMMARY—
Alcoho
Co
This report highlights recent information on the consumption and consequences of alcohol in Allegany County, Maryland.
Alcohol Consumption
According to the 2014 YRBS, 46.5% of 9th
graders, 60.6% of 10th graders, 65.8% of
11th graders, and 65.9% of 12th graders
reported using alcohol in their lifetime; and
18.6% of 9th graders, 32.2% of 10th graders,
38.8% of 11th graders, and 41.1% of 12th
graders reported current alcohol use (Fig.
1). Compared to their peers statewide,
Caroline County high schoolers reported
higher rates of current alcohol use in every
grade except 12th (statewide data not
shown).
Pg. 1/2 June 2017
Maryland State Epidemiological Outcomes Workgroup
(SEOW)
Caroline County female students reported a higher rate of any lifetime alcohol use (59.2%) than female students statewide (58.3%)(Fig. 2a). Almost one third of Caroline County female students reported current alcohol use similar to females statewide (31.2% vs. 31.1%, respectively) (Fig. 2b). Caroline County female students reported a lower rate of binge alcohol use than Caroline County male students (17.3% vs. 20.7%, respectively), both higher than students reported statewide (15.0% and 15.1%, respectively) (Fig. 2c).
Caroline County: Substance Use and Mental Health Among Alcohol Users in High School
High School Demographics:
Caroline County
Students Surveyed: 1,036
Racial Mix: 13.6% Black; 65.8% White; 20.6% Other Gender: 50.3% Female; 49.7% Male
Grade: 35.4% 9th Grade; 26.1% 10th Grade; 20.0% 11th Grade; 17.7% 12th Grade
SUMMARY— The Maryland Statewide Epidemiological Workgroup (SEOW) analyzed the
2014 Maryland High School Youth Risk Behavior Survey (YRBS) for Maryland and each
jurisdiction. In Caroline County:
Female students reported higher rates of alcohol use than male students
Alcohol users had higher rates of ever using other drugs than alcohol using peers statewide
Students who were current or binge alcohol users had higher rates of current marijuana
and prescription drug use without a prescription than peers statewide
Students who were current or binge alcohol users had higher rates of feeling sad or
hopeless, and considered suicide and/or made a suicide plan
The 2014 Maryland YRBS is the source of data used for all tables and graphs. The survey uses three time frame measurements when assessing students’ substance use and mental health status. Any lifetime use is defined as whether or not a student has ever used a substance. Past year substance use is defined as any use in the past 12 months. Current use is defined as substance use in the past 30 days. Current binge alcohol use is defined as five or more drinks in a row in the past thirty days.
The Maryland SEOW is led by Dr. Linda Simoni-Wastila at the University of Maryland Baltimore School of Pharmacy, [email protected]. For more information, visit http://www.pharmacy.umaryland.edu/programs/seow/
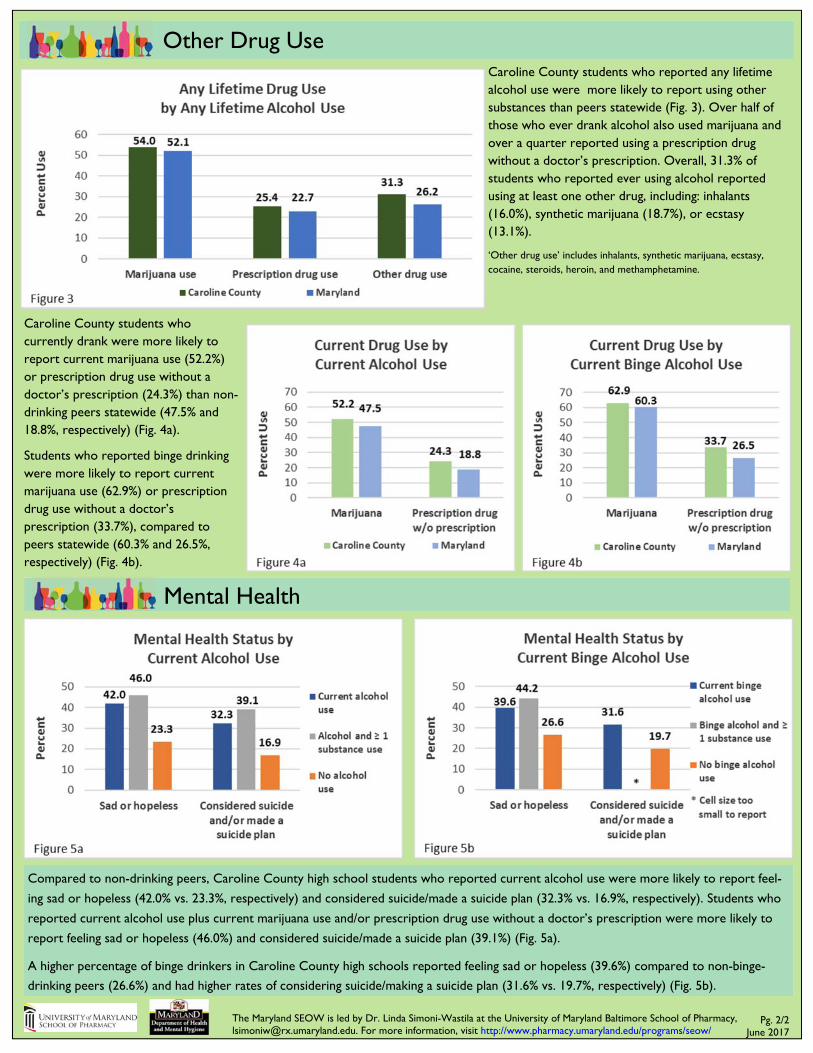
Caroline County students who reported any lifetime alcohol use were more likely to report using other substances than peers statewide (Fig. 3). Over half of those who ever drank alcohol also used marijuana and over a quarter reported using a prescription drug without a doctor’s prescription. Overall, 31.3% of students who reported ever using alcohol reported using at least one other drug, including: inhalants (16.0%), synthetic marijuana (18.7%), or ecstasy (13.1%).
‘Other drug use’ includes inhalants, synthetic marijuana, ecstasy, cocaine, steroids, heroin, and methamphetamine.
Other Drug Use
Caroline County students who currently drank were more likely to report current marijuana use (52.2%) or prescription drug use without a doctor’s prescription (24.3%) than non-drinking peers statewide (47.5% and 18.8%, respectively) (Fig. 4a).
Students who reported binge drinking were more likely to report current marijuana use (62.9%) or prescription drug use without a doctor’s prescription (33.7%), compared to peers statewide (60.3% and 26.5%, respectively) (Fig. 4b).
Compared to non-drinking peers, Caroline County high school students who reported current alcohol use were more likely to report feel-
ing sad or hopeless (42.0% vs. 23.3%, respectively) and considered suicide/made a suicide plan (32.3% vs. 16.9%, respectively). Students who
reported current alcohol use plus current marijuana use and/or prescription drug use without a doctor’s prescription were more likely to
report feeling sad or hopeless (46.0%) and considered suicide/made a suicide plan (39.1%) (Fig. 5a).
A higher percentage of binge drinkers in Caroline County high schools reported feeling sad or hopeless (39.6%) compared to non-binge-
drinking peers (26.6%) and had higher rates of considering suicide/making a suicide plan (31.6% vs. 19.7%, respectively) (Fig. 5b).
Pg. 2/2 June 2017
Mental Health
SUMMARY—
Alcoho
Co
This report highlights recent information on the consumption and consequences of alcohol in Allegany County, Maryland.
Alcohol Consumption
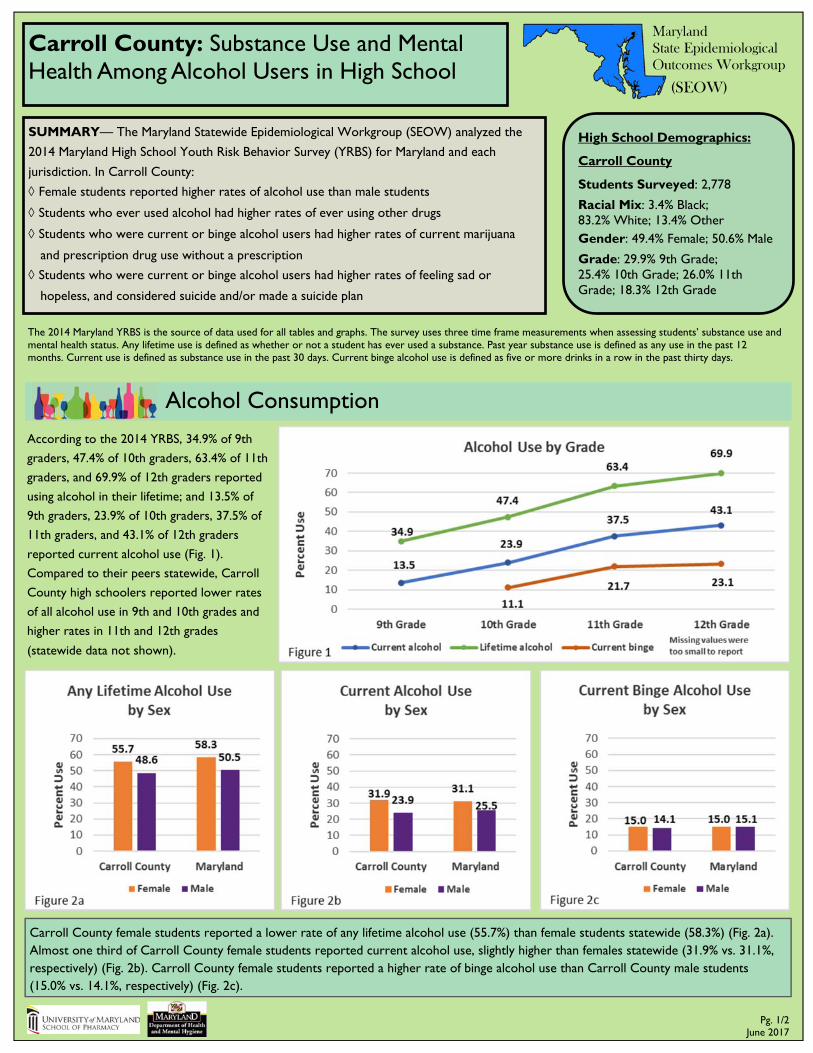
According to the 2014 YRBS, 34.9% of 9th
graders, 47.4% of 10th graders, 63.4% of 11th
graders, and 69.9% of 12th graders reported
using alcohol in their lifetime; and 13.5% of
9th graders, 23.9% of 10th graders, 37.5% of
11th graders, and 43.1% of 12th graders
reported current alcohol use (Fig. 1).
Compared to their peers statewide, Carroll
County high schoolers reported lower rates
of all alcohol use in 9th and 10th grades and
higher rates in 11th and 12th grades
(statewide data not shown).
Pg. 1/2 June 2017
Maryland State Epidemiological Outcomes Workgroup
(SEOW)
Carroll County female students reported a lower rate of any lifetime alcohol use (55.7%) than female students statewide (58.3%) (Fig. 2a). Almost one third of Carroll County female students reported current alcohol use, slightly higher than females statewide (31.9% vs. 31.1%, respectively) (Fig. 2b). Carroll County female students reported a higher rate of binge alcohol use than Carroll County male students (15.0% vs. 14.1%, respectively) (Fig. 2c).
Carroll County: Substance Use and Mental Health Among Alcohol Users in High School
High School Demographics:
Carroll County
Students Surveyed: 2,778
Racial Mix: 3.4% Black; 83.2% White; 13.4% Other Gender: 49.4% Female; 50.6% Male
Grade: 29.9% 9th Grade; 25.4% 10th Grade; 26.0% 11th Grade; 18.3% 12th Grade
SUMMARY— The Maryland Statewide Epidemiological Workgroup (SEOW) analyzed the
2014 Maryland High School Youth Risk Behavior Survey (YRBS) for Maryland and each
jurisdiction. In Carroll County:
Female students reported higher rates of alcohol use than male students
Students who ever used alcohol had higher rates of ever using other drugs
Students who were current or binge alcohol users had higher rates of current marijuana
and prescription drug use without a prescription
Students who were current or binge alcohol users had higher rates of feeling sad or
hopeless, and considered suicide and/or made a suicide plan
The 2014 Maryland YRBS is the source of data used for all tables and graphs. The survey uses three time frame measurements when assessing students’ substance use and mental health status. Any lifetime use is defined as whether or not a student has ever used a substance. Past year substance use is defined as any use in the past 12 months. Current use is defined as substance use in the past 30 days. Current binge alcohol use is defined as five or more drinks in a row in the past thirty days.
The Maryland SEOW is led by Dr. Linda Simoni-Wastila at the University of Maryland Baltimore School of Pharmacy, [email protected]. For more information, visit http://www.pharmacy.umaryland.edu/programs/seow/
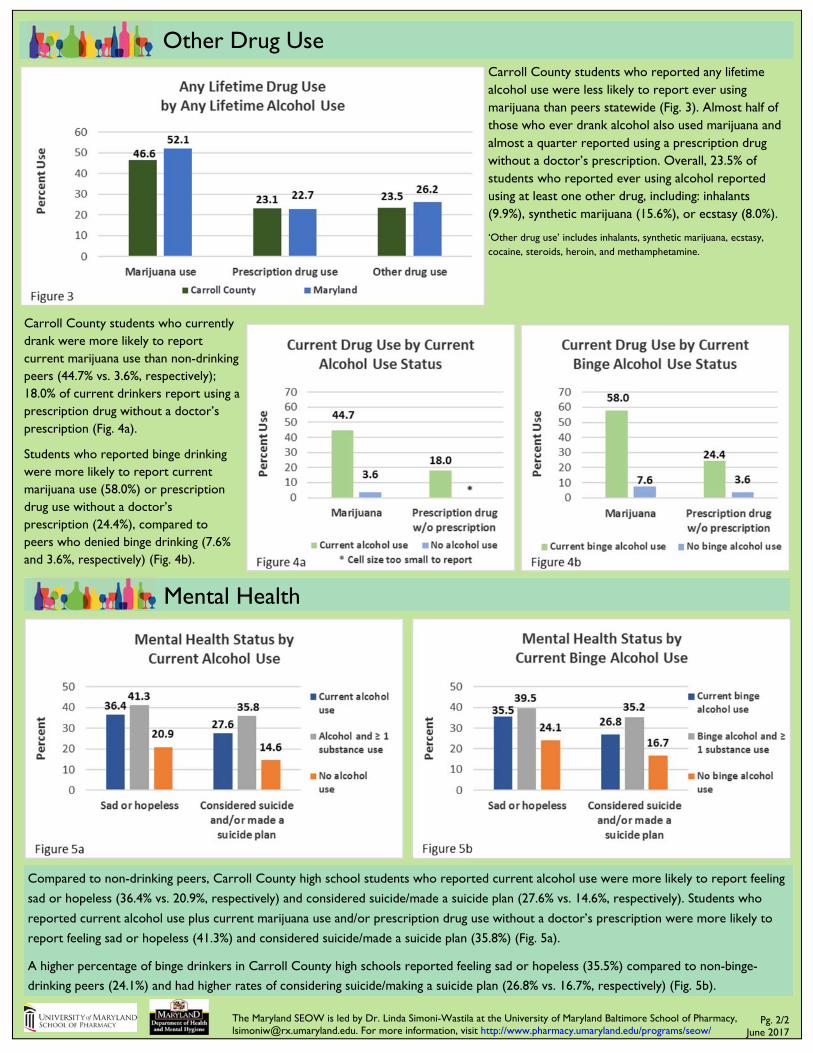
Carroll County students who reported any lifetime alcohol use were less likely to report ever using marijuana than peers statewide (Fig. 3). Almost half of those who ever drank alcohol also used marijuana and almost a quarter reported using a prescription drug without a doctor’s prescription. Overall, 23.5% of students who reported ever using alcohol reported using at least one other drug, including: inhalants (9.9%), synthetic marijuana (15.6%), or ecstasy (8.0%).
‘Other drug use’ includes inhalants, synthetic marijuana, ecstasy, cocaine, steroids, heroin, and methamphetamine.
Other Drug Use
Carroll County students who currently drank were more likely to report current marijuana use than non-drinking peers (44.7% vs. 3.6%, respectively); 18.0% of current drinkers report using a prescription drug without a doctor’s prescription (Fig. 4a).
Students who reported binge drinking were more likely to report current marijuana use (58.0%) or prescription drug use without a doctor’s prescription (24.4%), compared to peers who denied binge drinking (7.6% and 3.6%, respectively) (Fig. 4b).
Compared to non-drinking peers, Carroll County high school students who reported current alcohol use were more likely to report feeling
sad or hopeless (36.4% vs. 20.9%, respectively) and considered suicide/made a suicide plan (27.6% vs. 14.6%, respectively). Students who
reported current alcohol use plus current marijuana use and/or prescription drug use without a doctor’s prescription were more likely to
report feeling sad or hopeless (41.3%) and considered suicide/made a suicide plan (35.8%) (Fig. 5a).
A higher percentage of binge drinkers in Carroll County high schools reported feeling sad or hopeless (35.5%) compared to non-binge-
drinking peers (24.1%) and had higher rates of considering suicide/making a suicide plan (26.8% vs. 16.7%, respectively) (Fig. 5b).
Pg. 2/2 June 2017
Mental Health
SUMMARY—
Alcoho
Co
This report highlights recent information on the consumption and consequences of alcohol in Allegany County, Maryland.
Alcohol Consumption
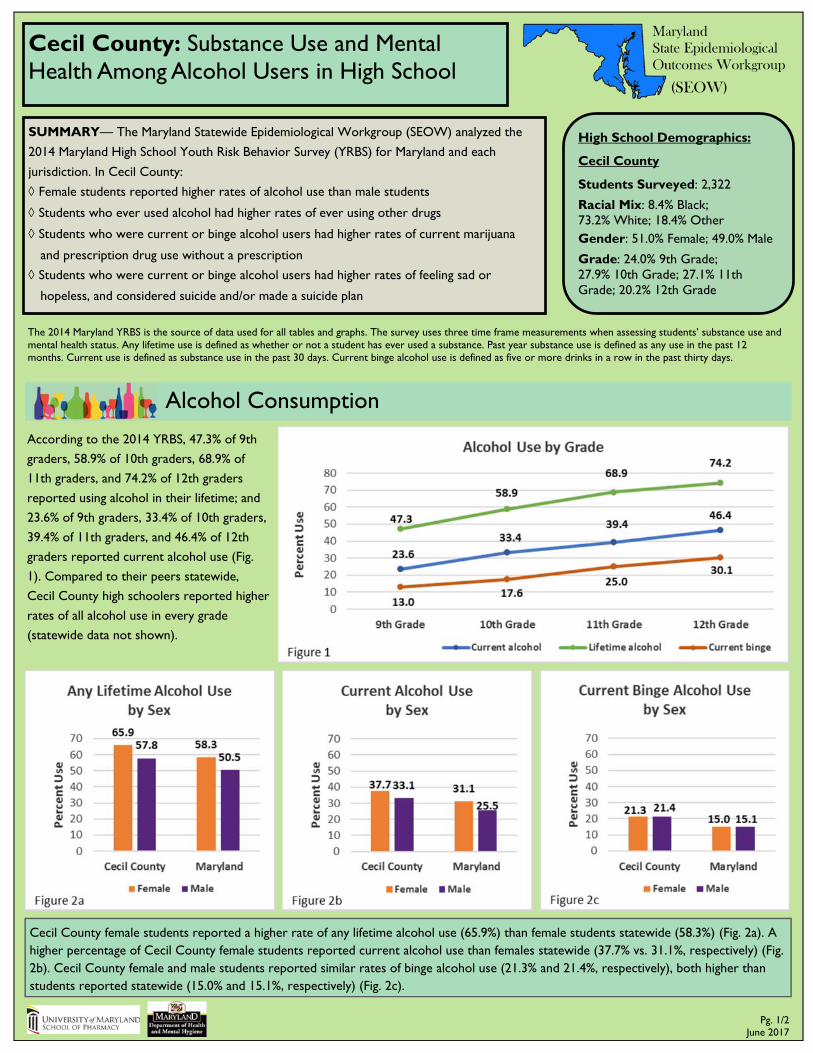
According to the 2014 YRBS, 47.3% of 9th
graders, 58.9% of 10th graders, 68.9% of
11th graders, and 74.2% of 12th graders
reported using alcohol in their lifetime; and
23.6% of 9th graders, 33.4% of 10th graders,
39.4% of 11th graders, and 46.4% of 12th
graders reported current alcohol use (Fig.
1). Compared to their peers statewide,
Cecil County high schoolers reported higher
rates of all alcohol use in every grade
(statewide data not shown).
Pg. 1/2 June 2017
Maryland State Epidemiological Outcomes Workgroup
(SEOW)
Cecil County female students reported a higher rate of any lifetime alcohol use (65.9%) than female students statewide (58.3%) (Fig. 2a). A higher percentage of Cecil County female students reported current alcohol use than females statewide (37.7% vs. 31.1%, respectively) (Fig. 2b). Cecil County female and male students reported similar rates of binge alcohol use (21.3% and 21.4%, respectively), both higher than students reported statewide (15.0% and 15.1%, respectively) (Fig. 2c).
Cecil County: Substance Use and Mental Health Among Alcohol Users in High School
High School Demographics:
Cecil County
Students Surveyed: 2,322
Racial Mix: 8.4% Black; 73.2% White; 18.4% Other Gender: 51.0% Female; 49.0% Male
Grade: 24.0% 9th Grade; 27.9% 10th Grade; 27.1% 11th Grade; 20.2% 12th Grade
SUMMARY— The Maryland Statewide Epidemiological Workgroup (SEOW) analyzed the
2014 Maryland High School Youth Risk Behavior Survey (YRBS) for Maryland and each
jurisdiction. In Cecil County:
Female students reported higher rates of alcohol use than male students
Students who ever used alcohol had higher rates of ever using other drugs
Students who were current or binge alcohol users had higher rates of current marijuana
and prescription drug use without a prescription
Students who were current or binge alcohol users had higher rates of feeling sad or
hopeless, and considered suicide and/or made a suicide plan
The 2014 Maryland YRBS is the source of data used for all tables and graphs. The survey uses three time frame measurements when assessing students’ substance use and mental health status. Any lifetime use is defined as whether or not a student has ever used a substance. Past year substance use is defined as any use in the past 12 months. Current use is defined as substance use in the past 30 days. Current binge alcohol use is defined as five or more drinks in a row in the past thirty days.

The Maryland SEOW is led by Dr. Linda Simoni-Wastila at the University of Maryland Baltimore School of Pharmacy, [email protected]. For more information, visit http://www.pharmacy.umaryland.edu/programs/seow/
Cecil County students who reported any lifetime alcohol use were more likely to report ever using marijuana than peers statewide (Fig. 3). Over half of those who ever drank alcohol also used marijuana and over one-fifth reported using a prescription drug without a doctor’s prescription. Overall, 29.6% of students who reported ever using alcohol reported using at least one other drug, including: inhalants (12.4%), synthetic marijuana (20.9%), or ecstasy (9.6%).
‘Other drug use’ includes inhalants, synthetic marijuana, ecstasy, cocaine, steroids, heroin, and methamphetamine.
Other Drug Use
Cecil County students who currently drank were more likely to report current marijuana use than non-drinking peers (53.9% vs. 6.4%, respectively); 17.1% of current drinkers reports using a prescription drug without a doctor’s prescription (Fig. 4a).
Students who reported binge drinking were more likely to report current marijuana use (62.0%) or prescription drug use without a doctor’s prescription (21.4%), compared to peers who denied binge drinking (12.6% and 3.8%, respectively) (Fig. 4b).
Compared to non-drinking peers, Cecil County high school students who reported current alcohol use were more likely to report feeling
sad or hopeless (42.1% vs. 23.3%, respectively) and considered suicide/made a suicide plan (33.1% vs. 15.6%, respectively). Students who
reported current alcohol use plus current marijuana use and/or prescription drug use without a doctor’s prescription were more likely to
report feeling sad or hopeless (50.5%) and considered suicide/made a suicide plan (41.6%) (Fig. 5a).
A higher percentage of binge drinkers in Cecil County high schools reported feeling sad or hopeless (46.0%) compared to non-binge-
drinking peers (26.5%) and had higher rates of considering suicide/making a suicide plan (35.0% vs. 19.0%, respectively) (Fig. 5b).
Pg. 2/2 June 2017
Mental Health
SUMMARY—
Alcoho
Co
This report highlights recent information on the consumption and consequences of alcohol in Allegany County, Maryland.
Alcohol Consumption
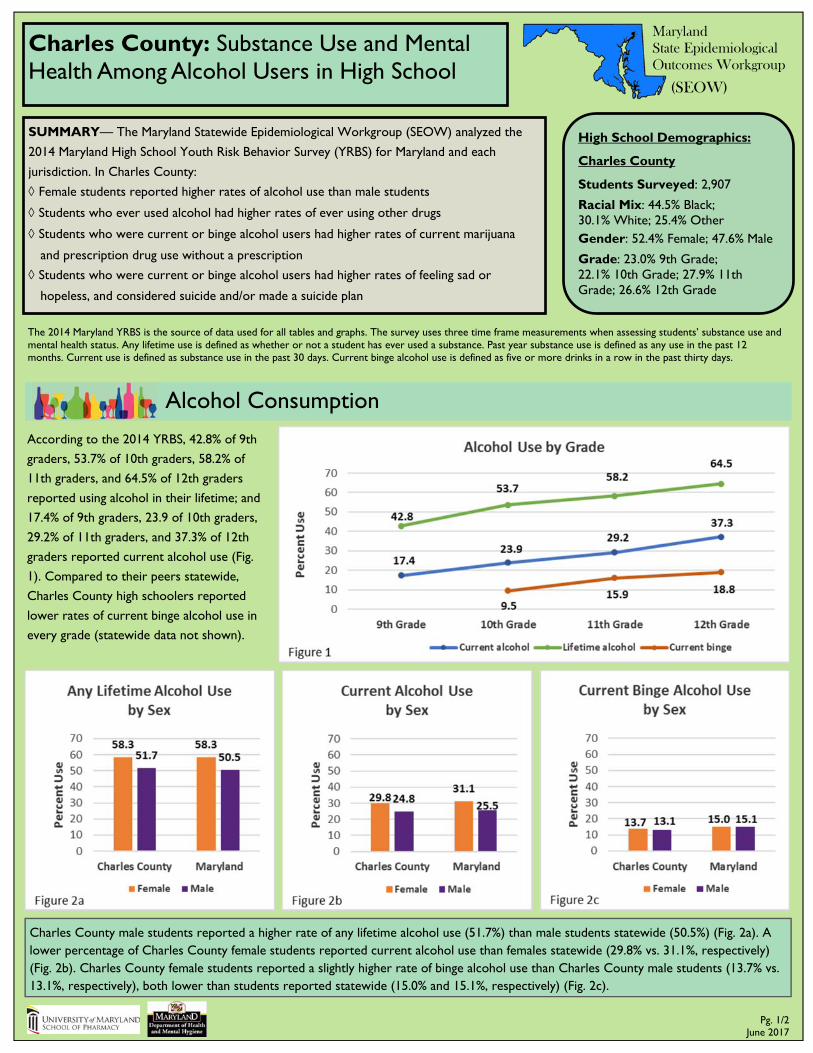
According to the 2014 YRBS, 42.8% of 9th
graders, 53.7% of 10th graders, 58.2% of
11th graders, and 64.5% of 12th graders
reported using alcohol in their lifetime; and
17.4% of 9th graders, 23.9 of 10th graders,
29.2% of 11th graders, and 37.3% of 12th
graders reported current alcohol use (Fig.
1). Compared to their peers statewide,
Charles County high schoolers reported
lower rates of current binge alcohol use in
every grade (statewide data not shown).
Pg. 1/2 June 2017
Maryland State Epidemiological Outcomes Workgroup
(SEOW)
Charles County male students reported a higher rate of any lifetime alcohol use (51.7%) than male students statewide (50.5%) (Fig. 2a). A lower percentage of Charles County female students reported current alcohol use than females statewide (29.8% vs. 31.1%, respectively) (Fig. 2b). Charles County female students reported a slightly higher rate of binge alcohol use than Charles County male students (13.7% vs. 13.1%, respectively), both lower than students reported statewide (15.0% and 15.1%, respectively) (Fig. 2c).
Charles County: Substance Use and Mental Health Among Alcohol Users in High School
High School Demographics:
Charles County
Students Surveyed: 2,907
Racial Mix: 44.5% Black; 30.1% White; 25.4% Other Gender: 52.4% Female; 47.6% Male
Grade: 23.0% 9th Grade; 22.1% 10th Grade; 27.9% 11th Grade; 26.6% 12th Grade
SUMMARY— The Maryland Statewide Epidemiological Workgroup (SEOW) analyzed the
2014 Maryland High School Youth Risk Behavior Survey (YRBS) for Maryland and each
jurisdiction. In Charles County:
Female students reported higher rates of alcohol use than male students
Students who ever used alcohol had higher rates of ever using other drugs
Students who were current or binge alcohol users had higher rates of current marijuana
and prescription drug use without a prescription
Students who were current or binge alcohol users had higher rates of feeling sad or
hopeless, and considered suicide and/or made a suicide plan
The 2014 Maryland YRBS is the source of data used for all tables and graphs. The survey uses three time frame measurements when assessing students’ substance use and mental health status. Any lifetime use is defined as whether or not a student has ever used a substance. Past year substance use is defined as any use in the past 12 months. Current use is defined as substance use in the past 30 days. Current binge alcohol use is defined as five or more drinks in a row in the past thirty days.

The Maryland SEOW is led by Dr. Linda Simoni-Wastila at the University of Maryland Baltimore School of Pharmacy, [email protected]. For more information, visit http://www.pharmacy.umaryland.edu/programs/seow/
Charles County students who reported any lifetime alcohol use were more likely to report ever using marijuana than peers statewide (Fig. 3). Over half of those who ever drank alcohol also used marijuana, almost five times the rate of non-drinkers (data not shown), and over one-fifth reported using a prescription drug without a doctor’s prescription. Overall, 29.3% of students who reported ever using alcohol reported using at least one other drug, including: inhalants (13.6%), synthetic marijuana (17.9%), or ecstasy (10.6%).
‘Other drug use’ includes inhalants, synthetic marijuana, ecstasy, cocaine, steroids, heroin, and methamphetamine.
Other Drug Use
Charles County students who currently drank were more likely to report current marijuana use than non-drinking peers (49.6% vs. 8.2%, respectively); 17.9% of current drinkers reported using a prescription drug without a doctor’s prescription (Fig. 4a).
Students who reported binge drinking were more likely to report current marijuana use (60.6%) or prescription drug use without a doctor’s prescription (25.7%), compared to peers who denied binge drinking (13.9% and 4.2%, respectively) (Fig. 4b).
Compared to non-drinking peers, Charles County high school students who reported current alcohol use were more likely to report feeling
sad or hopeless (37.5% vs. 20.8%, respectively) and considered suicide/made a suicide plan (25.7% vs. 14.2%, respectively). Students who
reported current alcohol use plus current marijuana use and/or prescription drug use without a doctor’s prescription were more likely to
report feeling sad or hopeless (40.4%) and considered suicide/made a suicide plan (26.8%) (Fig. 5a).
A higher percentage of binge drinkers in Charles County high schools reported feeling sad or hopeless (37.6%) compared to non-binge-
drinking peers (23.8%) and had higher rates of considering suicide/making a suicide plan (24.9% vs. 16.5%, respectively) (Fig. 5b).
Pg. 2/2 June 2017
Mental Health
SUMMARY—
Alcohol Use and Consequences:
Allegany County
Co
This report highlights recent information on the consumption and consequences of alcohol in Allegany County, Maryland.
Alcohol Consumption
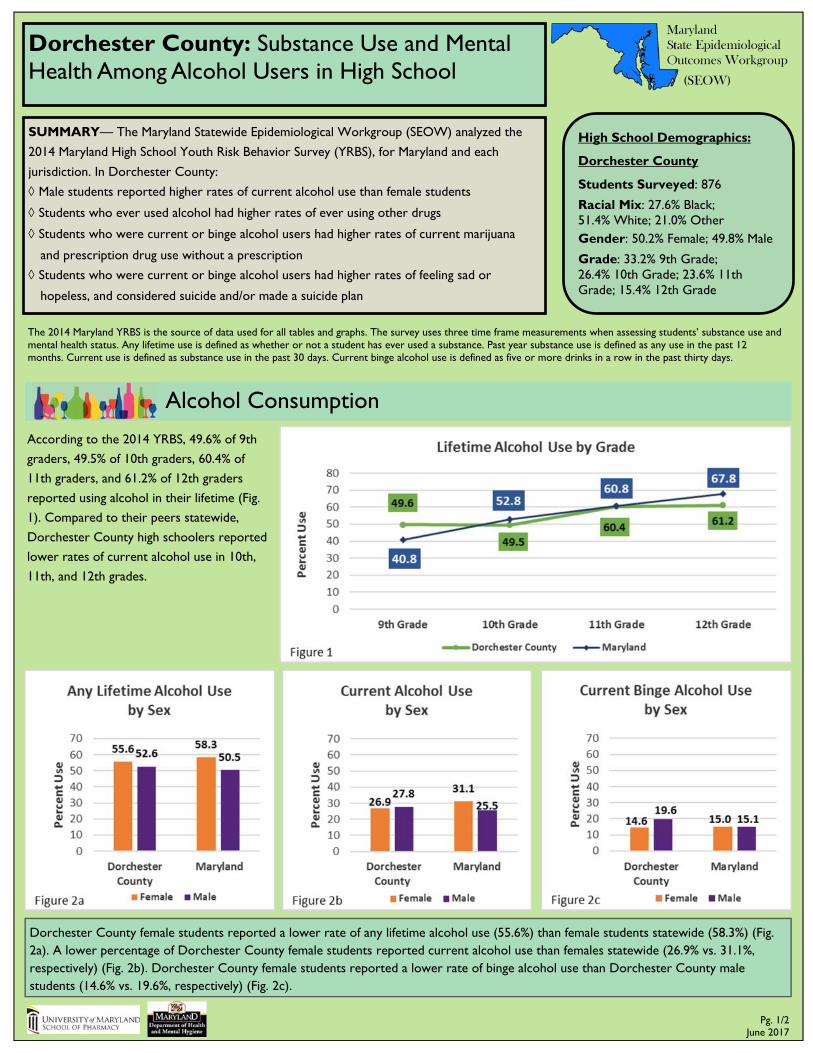
According to the 2014 YRBS, 49.6% of 9th
graders, 49.5% of 10th graders, 60.4% of
11th graders, and 61.2% of 12th graders
reported using alcohol in their lifetime (Fig.
1). Compared to their peers statewide,
Dorchester County high schoolers reported
lower rates of current alcohol use in 10th,
11th, and 12th grades.
Pg. 1/2 June 2017
Maryland State Epidemiological Outcomes Workgroup
(SEOW)
Dorchester County female students reported a lower rate of any lifetime alcohol use (55.6%) than female students statewide (58.3%) (Fig. 2a). A lower percentage of Dorchester County female students reported current alcohol use than females statewide (26.9% vs. 31.1%, respectively) (Fig. 2b). Dorchester County female students reported a lower rate of binge alcohol use than Dorchester County male students (14.6% vs. 19.6%, respectively) (Fig. 2c).
Dorchester County: Substance Use and Mental Health Among Alcohol Users in High School
High School Demographics:
Dorchester County
Students Surveyed: 876
Racial Mix: 27.6% Black; 51.4% White; 21.0% Other Gender: 50.2% Female; 49.8% Male
Grade: 33.2% 9th Grade; 26.4% 10th Grade; 23.6% 11th Grade; 15.4% 12th Grade
SUMMARY— The Maryland Statewide Epidemiological Workgroup (SEOW) analyzed the
2014 Maryland High School Youth Risk Behavior Survey (YRBS), for Maryland and each
jurisdiction. In Dorchester County:
Male students reported higher rates of current alcohol use than female students
Students who ever used alcohol had higher rates of ever using other drugs
Students who were current or binge alcohol users had higher rates of current marijuana
and prescription drug use without a prescription
Students who were current or binge alcohol users had higher rates of feeling sad or
hopeless, and considered suicide and/or made a suicide plan
The 2014 Maryland YRBS is the source of data used for all tables and graphs. The survey uses three time frame measurements when assessing students’ substance use and mental health status. Any lifetime use is defined as whether or not a student has ever used a substance. Past year substance use is defined as any use in the past 12 months. Current use is defined as substance use in the past 30 days. Current binge alcohol use is defined as five or more drinks in a row in the past thirty days.
The Maryland SEOW is led by Dr. Linda Simoni-Wastila at the University of Maryland Baltimore School of Pharmacy, [email protected]. For more information, visit http://www.pharmacy.umaryland.edu/programs/seow/
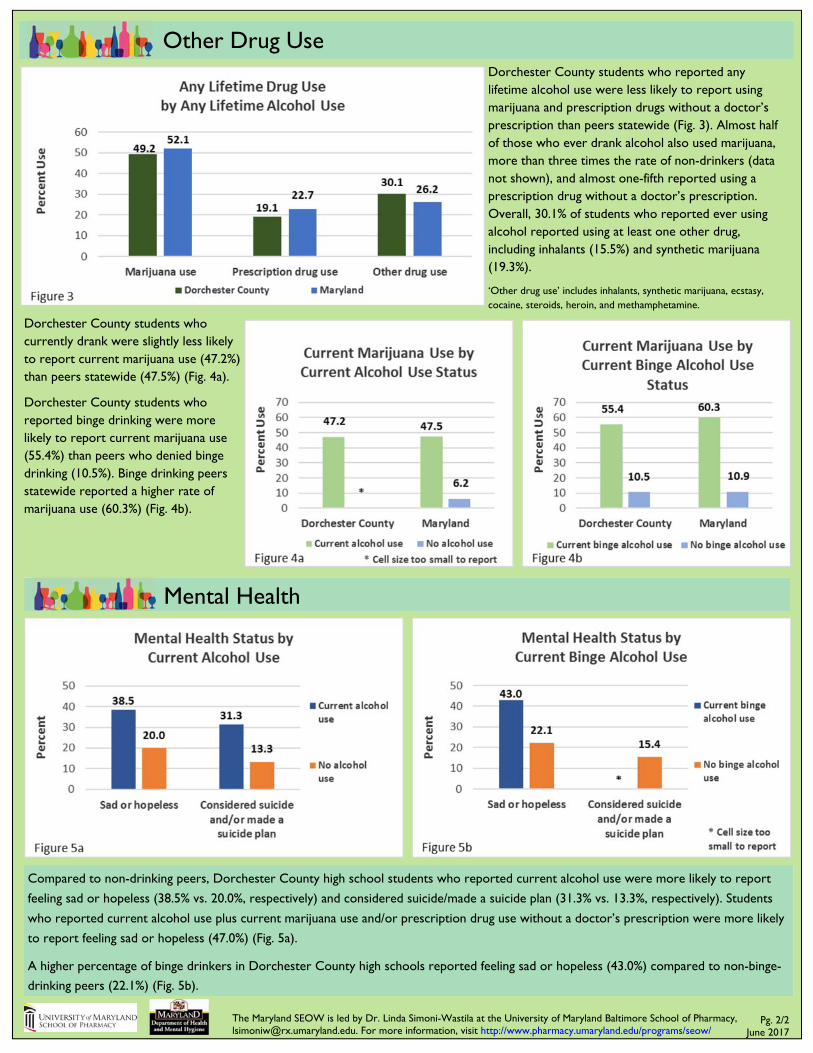
Dorchester County students who reported any lifetime alcohol use were less likely to report using marijuana and prescription drugs without a doctor’s prescription than peers statewide (Fig. 3). Almost half of those who ever drank alcohol also used marijuana, more than three times the rate of non-drinkers (data not shown), and almost one-fifth reported using a prescription drug without a doctor’s prescription. Overall, 30.1% of students who reported ever using alcohol reported using at least one other drug, including inhalants (15.5%) and synthetic marijuana (19.3%).
‘Other drug use’ includes inhalants, synthetic marijuana, ecstasy, cocaine, steroids, heroin, and methamphetamine.
Other Drug Use
Dorchester County students who currently drank were slightly less likely to report current marijuana use (47.2%) than peers statewide (47.5%) (Fig. 4a).
Dorchester County students who reported binge drinking were more likely to report current marijuana use (55.4%) than peers who denied binge drinking (10.5%). Binge drinking peers statewide reported a higher rate of marijuana use (60.3%) (Fig. 4b).
Compared to non-drinking peers, Dorchester County high school students who reported current alcohol use were more likely to report
feeling sad or hopeless (38.5% vs. 20.0%, respectively) and considered suicide/made a suicide plan (31.3% vs. 13.3%, respectively). Students
who reported current alcohol use plus current marijuana use and/or prescription drug use without a doctor’s prescription were more likely
to report feeling sad or hopeless (47.0%) (Fig. 5a).
A higher percentage of binge drinkers in Dorchester County high schools reported feeling sad or hopeless (43.0%) compared to non-binge-
drinking peers (22.1%) (Fig. 5b).
Pg. 2/2 June 2017
Mental Health
SUMMARY—
Alcoho
Co
This report highlights recent information on the consumption and consequences of alcohol in Allegany County, Maryland.
Alcohol Consumption
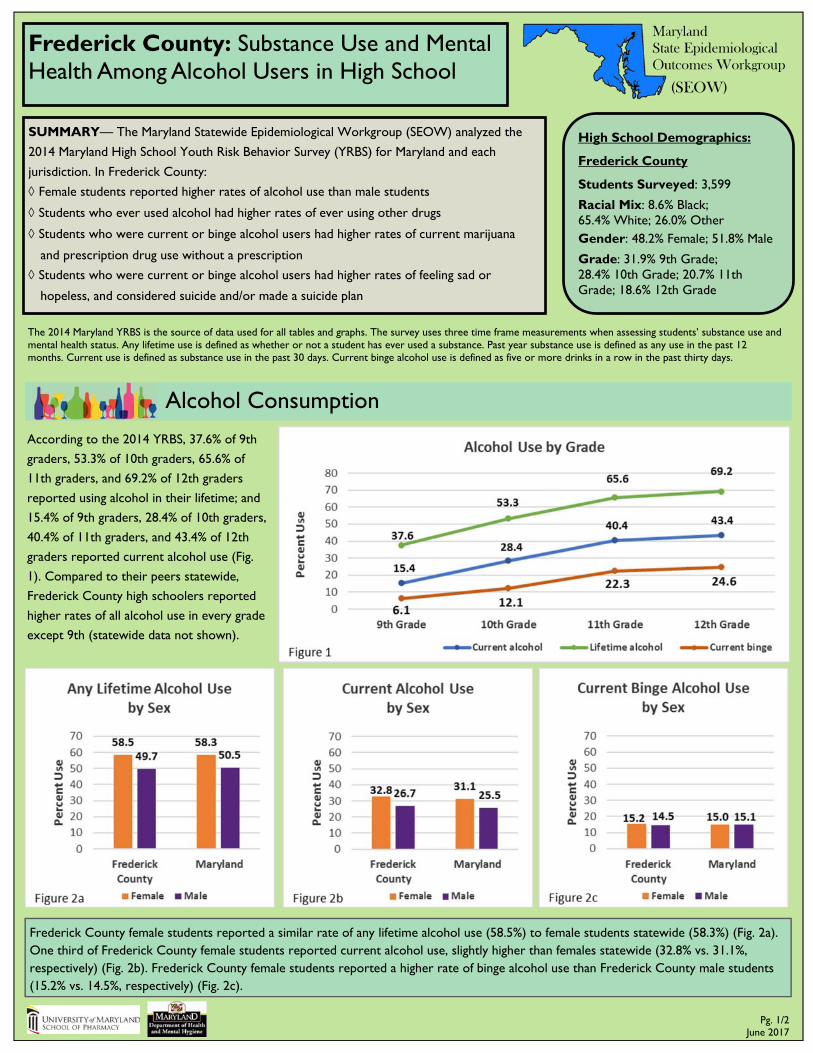
According to the 2014 YRBS, 37.6% of 9th
graders, 53.3% of 10th graders, 65.6% of
11th graders, and 69.2% of 12th graders
reported using alcohol in their lifetime; and
15.4% of 9th graders, 28.4% of 10th graders,
40.4% of 11th graders, and 43.4% of 12th
graders reported current alcohol use (Fig.
1). Compared to their peers statewide,
Frederick County high schoolers reported
higher rates of all alcohol use in every grade
except 9th (statewide data not shown).
Pg. 1/2 June 2017
Maryland State Epidemiological Outcomes Workgroup
(SEOW)
Frederick County female students reported a similar rate of any lifetime alcohol use (58.5%) to female students statewide (58.3%) (Fig. 2a). One third of Frederick County female students reported current alcohol use, slightly higher than females statewide (32.8% vs. 31.1%, respectively) (Fig. 2b). Frederick County female students reported a higher rate of binge alcohol use than Frederick County male students (15.2% vs. 14.5%, respectively) (Fig. 2c).
Frederick County: Substance Use and Mental Health Among Alcohol Users in High School
High School Demographics:
Frederick County
Students Surveyed: 3,599
Racial Mix: 8.6% Black; 65.4% White; 26.0% Other Gender: 48.2% Female; 51.8% Male
Grade: 31.9% 9th Grade; 28.4% 10th Grade; 20.7% 11th Grade; 18.6% 12th Grade
SUMMARY— The Maryland Statewide Epidemiological Workgroup (SEOW) analyzed the
2014 Maryland High School Youth Risk Behavior Survey (YRBS) for Maryland and each
jurisdiction. In Frederick County:
Female students reported higher rates of alcohol use than male students
Students who ever used alcohol had higher rates of ever using other drugs
Students who were current or binge alcohol users had higher rates of current marijuana
and prescription drug use without a prescription
Students who were current or binge alcohol users had higher rates of feeling sad or
hopeless, and considered suicide and/or made a suicide plan
The 2014 Maryland YRBS is the source of data used for all tables and graphs. The survey uses three time frame measurements when assessing students’ substance use and mental health status. Any lifetime use is defined as whether or not a student has ever used a substance. Past year substance use is defined as any use in the past 12 months. Current use is defined as substance use in the past 30 days. Current binge alcohol use is defined as five or more drinks in a row in the past thirty days.

The Maryland SEOW is led by Dr. Linda Simoni-Wastila at the University of Maryland Baltimore School of Pharmacy, [email protected]. For more information, visit http://www.pharmacy.umaryland.edu/programs/seow/
Frederick County students who reported any lifetime alcohol use were more likely to report using other substances than non-drinking peers (Fig. 3). Over half of those who ever drank alcohol also used marijuana, more than eight times the rate of non-drinkers, and over a quarter reported using a prescription drug without a doctor’s prescription. Overall, 24.2% of students who reported ever using alcohol reported using at least one other drug, including: inhalants (11.4%), synthetic marijuana (14.8%), or ecstasy (8.2%).
Other drug use’ includes inhalants, synthetic marijuana, ecstasy, cocaine, steroids, heroin, and methamphetamine.
Other Drug Use
Frederick County students who currently drank were more likely to report current marijuana use (47.7%) or prescription drug use without a doctor’s prescription (21.0%) compared to non-drinking peers (4.4% and 2.3%, respectively) (Fig. 4a). Students who reported binge drinking were more likely to report current marijuana use (64.0%) or prescription drug use without a doctor’s prescription (28.5%), compared to peers who denied binge drinking (9.3% and 4.6%, respectively) (Fig. 4b).
Compared to non-drinking peers, Frederick County high school students who reported current alcohol use were more likely to report feel-
ing sad or hopeless (41.0% vs. 21.2%, respectively) and considered suicide/made a suicide plan (28.8% vs. 14.7%, respectively). Students who
reported current alcohol use plus current marijuana use and/or prescription drug use without a doctor’s prescription were more likely to
report feeling sad or hopeless (45.7%) and considered suicide/made a suicide plan (32.2%) (Fig. 5a).
A higher percentage of binge drinkers in Frederick County high schools reported feeling sad or hopeless (41.2%) compared to non-binge-
drinking peers (25.0%) and had higher rates of considering suicide/making a suicide plan (29.2% vs. 17.4%, respectively) (Fig. 5b).
Pg. 2/2 June 2017
Mental Health
SUMMARY—
Alcoho
Co
This report highlights recent information on the consumption and consequences of alcohol in Allegany County, Maryland.
Alcohol Consumption
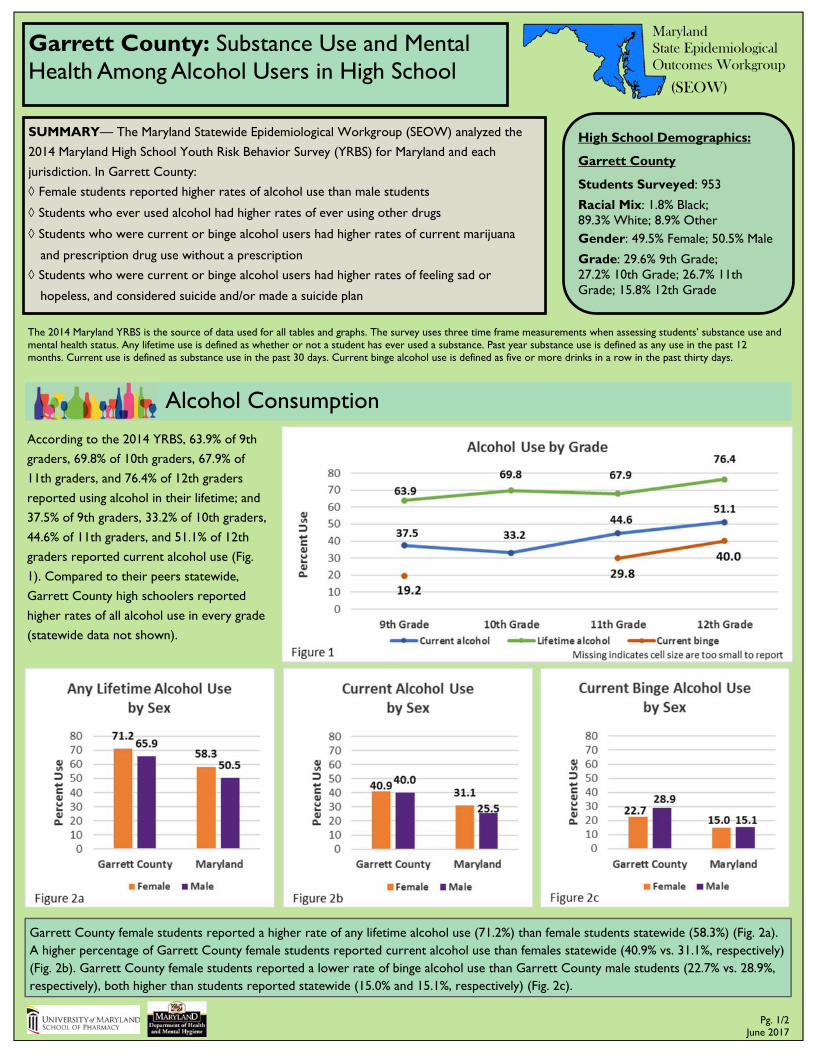
According to the 2014 YRBS, 63.9% of 9th
graders, 69.8% of 10th graders, 67.9% of
11th graders, and 76.4% of 12th graders
reported using alcohol in their lifetime; and
37.5% of 9th graders, 33.2% of 10th graders,
44.6% of 11th graders, and 51.1% of 12th
graders reported current alcohol use (Fig.
1). Compared to their peers statewide,
Garrett County high schoolers reported
higher rates of all alcohol use in every grade
(statewide data not shown).
Pg. 1/2 June 2017
Maryland State Epidemiological Outcomes Workgroup
(SEOW)
Garrett County female students reported a higher rate of any lifetime alcohol use (71.2%) than female students statewide (58.3%) (Fig. 2a). A higher percentage of Garrett County female students reported current alcohol use than females statewide (40.9% vs. 31.1%, respectively) (Fig. 2b). Garrett County female students reported a lower rate of binge alcohol use than Garrett County male students (22.7% vs. 28.9%, respectively), both higher than students reported statewide (15.0% and 15.1%, respectively) (Fig. 2c).
Garrett County: Substance Use and Mental Health Among Alcohol Users in High School
High School Demographics:
Garrett County
Students Surveyed: 953
Racial Mix: 1.8% Black; 89.3% White; 8.9% Other Gender: 49.5% Female; 50.5% Male
Grade: 29.6% 9th Grade; 27.2% 10th Grade; 26.7% 11th Grade; 15.8% 12th Grade
SUMMARY— The Maryland Statewide Epidemiological Workgroup (SEOW) analyzed the
2014 Maryland High School Youth Risk Behavior Survey (YRBS) for Maryland and each
jurisdiction. In Garrett County:
Female students reported higher rates of alcohol use than male students
Students who ever used alcohol had higher rates of ever using other drugs
Students who were current or binge alcohol users had higher rates of current marijuana
and prescription drug use without a prescription
Students who were current or binge alcohol users had higher rates of feeling sad or
hopeless, and considered suicide and/or made a suicide plan
The 2014 Maryland YRBS is the source of data used for all tables and graphs. The survey uses three time frame measurements when assessing students’ substance use and mental health status. Any lifetime use is defined as whether or not a student has ever used a substance. Past year substance use is defined as any use in the past 12 months. Current use is defined as substance use in the past 30 days. Current binge alcohol use is defined as five or more drinks in a row in the past thirty days.
The Maryland SEOW is led by Dr. Linda Simoni-Wastila at the University of Maryland Baltimore School of Pharmacy, [email protected]. For more information, visit http://www.pharmacy.umaryland.edu/programs/seow/
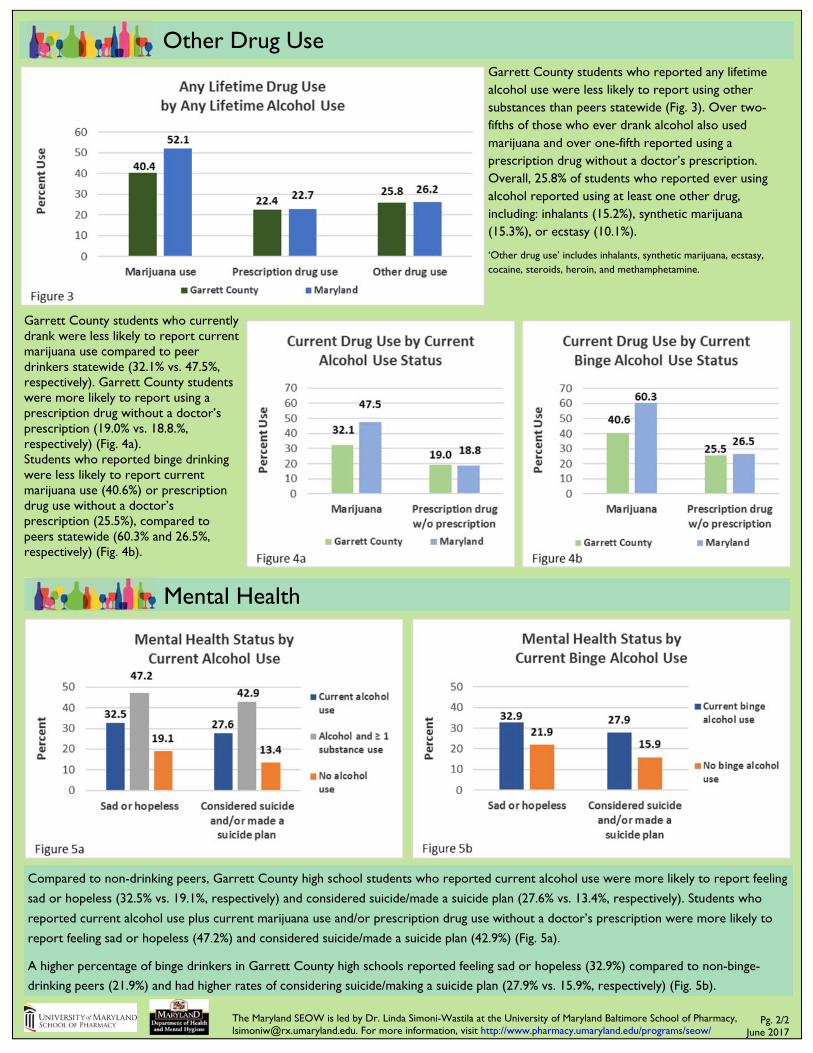
Garrett County students who reported any lifetime alcohol use were less likely to report using other substances than peers statewide (Fig. 3). Over two-fifths of those who ever drank alcohol also used marijuana and over one-fifth reported using a prescription drug without a doctor’s prescription. Overall, 25.8% of students who reported ever using alcohol reported using at least one other drug, including: inhalants (15.2%), synthetic marijuana (15.3%), or ecstasy (10.1%).
‘Other drug use’ includes inhalants, synthetic marijuana, ecstasy, cocaine, steroids, heroin, and methamphetamine.
Other Drug Use
Garrett County students who currently drank were less likely to report current marijuana use compared to peer drinkers statewide (32.1% vs. 47.5%, respectively). Garrett County students were more likely to report using a prescription drug without a doctor’s prescription (19.0% vs. 18.8.%, respectively) (Fig. 4a). Students who reported binge drinking were less likely to report current marijuana use (40.6%) or prescription drug use without a doctor’s prescription (25.5%), compared to peers statewide (60.3% and 26.5%, respectively) (Fig. 4b).
Compared to non-drinking peers, Garrett County high school students who reported current alcohol use were more likely to report feeling
sad or hopeless (32.5% vs. 19.1%, respectively) and considered suicide/made a suicide plan (27.6% vs. 13.4%, respectively). Students who
reported current alcohol use plus current marijuana use and/or prescription drug use without a doctor’s prescription were more likely to
report feeling sad or hopeless (47.2%) and considered suicide/made a suicide plan (42.9%) (Fig. 5a).
A higher percentage of binge drinkers in Garrett County high schools reported feeling sad or hopeless (32.9%) compared to non-binge-
drinking peers (21.9%) and had higher rates of considering suicide/making a suicide plan (27.9% vs. 15.9%, respectively) (Fig. 5b).
Pg. 2/2 June 2017
Mental Health

SUMMARY—
Alcoho
Co
This report highlights recent information on the consumption and consequences of alcohol in Allegany County, Maryland.
Alcohol Consumption
According to the 2014 YRBS, 40.0% of 9th
graders, 55.2% of 10th graders, 64.4% of
11th graders, and 73.2% of 12th graders
reported using alcohol in their lifetime; and
18.0% of 9th graders, 31.6% of 10th graders,
39.3% of 11th graders, and 49.7% of 12th
graders reported current alcohol use (Fig.
1). Compared to their peers statewide,
Harford County high schoolers reported
higher rates of current alcohol use in every
grade (statewide data not shown).
Pg. 1/2 June 2017
Maryland State Epidemiological Outcomes Workgroup
(SEOW)
Harford County female students reported a higher rate of any lifetime alcohol use (60.4%) than female students statewide (58.3%) (Fig. 2a). A higher percentage of Harford County female students reported current alcohol use than females statewide (37.4% vs. 31.1%, respectively) (Fig. 2b). Harford County female students reported a higher rate of binge alcohol use than Harford County male students (19.0% and 17.7%, respectively), both higher than students reported statewide (15.0% and 15.1%, respectively) (Fig. 2c).
Harford County: Substance Use and Mental Health Among Alcohol Users in High School
High School Demographics:
Harford County
Students Surveyed: 3,630
Racial Mix: 14.4% Black; 64.7% White; 20.9% Other Gender: 49.3% Female; 50.7% Male
Grade: 27.8% 9th Grade; 21.5% 10th Grade; 27.2% 11th Grade; 23.3% 12th Grade
SUMMARY— The Maryland Statewide Epidemiological Workgroup (SEOW) analyzed the
2014 Maryland High School Youth Risk Behavior Survey (YRBS) for Maryland and each
jurisdiction. In Harford County:
Female students reported higher rates of alcohol use than male students
Students who ever used alcohol had higher rates of ever using other drugs
Students who were current or binge alcohol users had higher rates of current marijuana
and prescription drug use without a prescription
Students who were current or binge alcohol users had higher rates of feeling sad or
hopeless, and considered suicide and/or made a suicide plan
The 2014 Maryland YRBS is the source of data used for all tables and graphs. The survey uses three time frame measurements when assessing students’ substance use and mental health status. Any lifetime use is defined as whether or not a student has ever used a substance. Past year substance use is defined as any use in the past 12 months. Current use is defined as substance use in the past 30 days. Current binge alcohol use is defined as five or more drinks in a row in the past thirty days.

The Maryland SEOW is led by Dr. Linda Simoni-Wastila at the University of Maryland Baltimore School of Pharmacy, [email protected]. For more information, visit http://www.pharmacy.umaryland.edu/programs/seow/
Harford County students who reported any lifetime alcohol use were slightly more likely to report using marijuana and prescription drugs without a doctor’s prescription than peers statewide (Fig. 3). Over half of those who ever drank alcohol also used marijuana, almost nine times the rate of non-drinkers (data not shown), and almost a quarter reported using a prescription drug without a doctor’s prescription. Overall, 24.4% of students who reported ever using alcohol reported using at least one other drug, including: inhalants (10.9%), synthetic marijuana (15.1%), or ecstasy (9.6%). ‘Other drug use’ includes inhalants, synthetic marijuana, ecstasy, cocaine, steroids, heroin, and methamphetamine.
Other Drug Use
Harford County students who currently drank were more likely to report current marijuana use compared to peers who were not current drinkers (47.0% vs. 6.1%, respectively); 16.5% of current drinkers reported using a prescription drug without a doctor’s prescription (Fig. 4a). Students who reported binge drinking were more likely to report current marijuana use (60.8%) or prescription drug use without a doctor’s prescription (21.6%) compared to peers who denied binge drinking (11.1% and 3.6%, respectively) (Fig. 4b).
Compared to non-drinking peers, Harford County high school students who reported current alcohol use were more likely to report feel-
ing sad or hopeless (37.4% vs. 21.1%, respectively) and considered suicide/made a suicide plan (26.0% vs. 14.4%, respectively). Students who
reported current alcohol use plus current marijuana use and/or prescription drug use without a doctor’s prescription were more likely to
report feeling sad or hopeless (43.0%) and considered suicide/made a suicide plan (31.7%) (Fig. 5a).
A higher percentage of binge drinkers in Harford County high schools reported feeling sad or hopeless (39.0%) compared to non-binge-
drinking peers (24.0%) and had higher rates of considering suicide/making a suicide plan (27.8% vs. 16.5%, respectively) (Fig. 5b).
Pg. 2/2 June 2017
Mental Health

SUMMARY—
Alcoho
Co
This report highlights recent information on the consumption and consequences of alcohol in Allegany County, Maryland.
Alcohol Consumption
According to the 2014 YRBS, 26.7% of 9th
graders, 45.9% of 10th graders, 51.7% of
11th graders, and 59.9% of 12th graders
reported using alcohol in their lifetime; and
8.8% of 9th graders, 19.9% of 10th graders,
27.7% of 11th graders, and 36.0% of 12th
graders reported current alcohol use (Fig.
1). Compared to their peers statewide,
Howard County high schoolers reported
lower rates of all alcohol use in every grade
(statewide data not shown).
Pg. 1/2 June 2017
Maryland State Epidemiological Outcomes Workgroup
(SEOW)
Howard County female students reported a lower rate of any lifetime alcohol use (49.2%) than female students statewide (58.3%) (Fig. 2a). A lower percentage of Howard County female students reported current alcohol use than females statewide (26.3% vs. 31.1%, respectively) (Fig. 2b). Howard County female students reported a higher rate of binge alcohol use than Howard County male students (11.1% and 9.9%, respectively), both lower than students reported statewide (15.0% and 15.1%, respectively) (Fig. 2c).
Howard County: Substance Use and Mental Health Among Alcohol Users in High School
High School Demographics:
Howard County
Students Surveyed: 3,796
Racial Mix: 19.9% Black; 17.6% Asian; 44.5% White; 18% Other Gender: 50.2% Female; 49.8% Male
Grade: 27.8% 9th Grade; 21.5% 10th Grade; 27.2% 11th Grade; 23.3% 12th Grade
SUMMARY— The Maryland Statewide Epidemiological Workgroup (SEOW) analyzed the
2014 Maryland High School Youth Risk Behavior Survey (YRBS) for Maryland and each
jurisdiction. In Howard County:
Female students reported higher rates of alcohol use than male students
Students who ever used alcohol had higher rates of ever using other drugs
Students who were current or binge alcohol users had higher rates of current marijuana
and prescription drug use without a prescription
Students who were current or binge alcohol users had higher rates of feeling sad or
hopeless, and considered suicide and/or made a suicide plan
The 2014 Maryland YRBS is the source of data used for all tables and graphs. The survey uses three time frame measurements when assessing students’ substance use and mental health status. Any lifetime use is defined as whether or not a student has ever used a substance. Past year substance use is defined as any use in the past 12 months. Current use is defined as substance use in the past 30 days. Current binge alcohol use is defined as five or more drinks in a row in the past thirty days.
The Maryland SEOW is led by Dr. Linda Simoni-Wastila at the University of Maryland Baltimore School of Pharmacy, [email protected]. For more information, visit http://www.pharmacy.umaryland.edu/programs/seow/
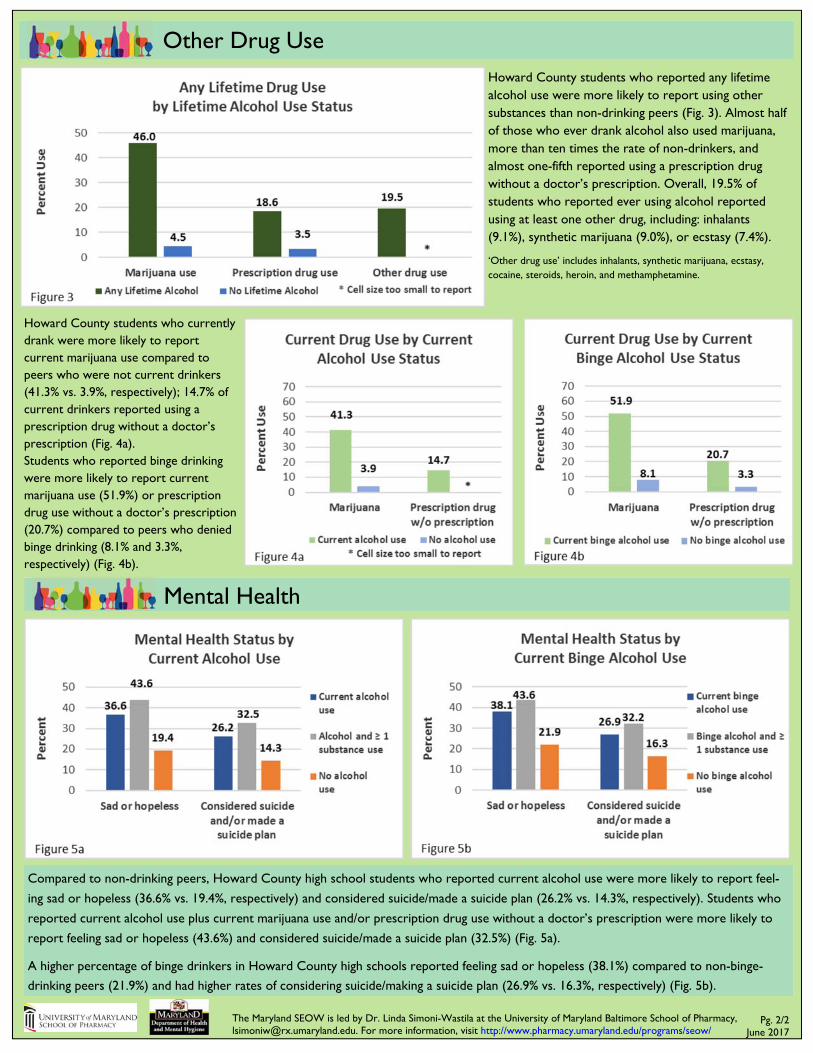
Howard County students who reported any lifetime alcohol use were more likely to report using other substances than non-drinking peers (Fig. 3). Almost half of those who ever drank alcohol also used marijuana, more than ten times the rate of non-drinkers, and almost one-fifth reported using a prescription drug without a doctor’s prescription. Overall, 19.5% of students who reported ever using alcohol reported using at least one other drug, including: inhalants (9.1%), synthetic marijuana (9.0%), or ecstasy (7.4%).
‘Other drug use’ includes inhalants, synthetic marijuana, ecstasy, cocaine, steroids, heroin, and methamphetamine.
Other Drug Use
Howard County students who currently drank were more likely to report current marijuana use compared to peers who were not current drinkers (41.3% vs. 3.9%, respectively); 14.7% of current drinkers reported using a prescription drug without a doctor’s prescription (Fig. 4a). Students who reported binge drinking were more likely to report current marijuana use (51.9%) or prescription drug use without a doctor’s prescription (20.7%) compared to peers who denied binge drinking (8.1% and 3.3%, respectively) (Fig. 4b).
Compared to non-drinking peers, Howard County high school students who reported current alcohol use were more likely to report feel-
ing sad or hopeless (36.6% vs. 19.4%, respectively) and considered suicide/made a suicide plan (26.2% vs. 14.3%, respectively). Students who
reported current alcohol use plus current marijuana use and/or prescription drug use without a doctor’s prescription were more likely to
report feeling sad or hopeless (43.6%) and considered suicide/made a suicide plan (32.5%) (Fig. 5a).
A higher percentage of binge drinkers in Howard County high schools reported feeling sad or hopeless (38.1%) compared to non-binge-
drinking peers (21.9%) and had higher rates of considering suicide/making a suicide plan (26.9% vs. 16.3%, respectively) (Fig. 5b).
Pg. 2/2 June 2017
Mental Health
SUMMARY—
Alcoho
Co
This report highlights recent information on the consumption and consequences of alcohol in Allegany County, Maryland.
Alcohol Consumption
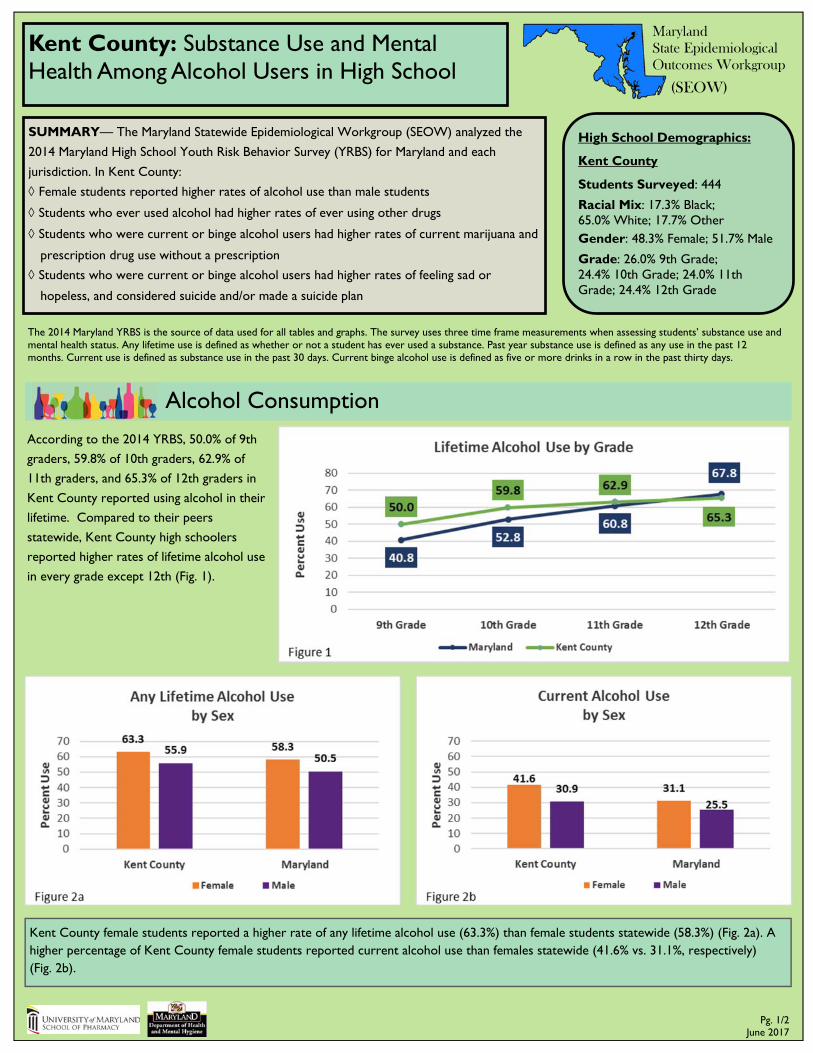
According to the 2014 YRBS, 50.0% of 9th
graders, 59.8% of 10th graders, 62.9% of
11th graders, and 65.3% of 12th graders in
Kent County reported using alcohol in their
lifetime. Compared to their peers
statewide, Kent County high schoolers
reported higher rates of lifetime alcohol use
in every grade except 12th (Fig. 1).
Pg. 1/2 June 2017
Maryland State Epidemiological Outcomes Workgroup
(SEOW)
Kent County female students reported a higher rate of any lifetime alcohol use (63.3%) than female students statewide (58.3%) (Fig. 2a). A higher percentage of Kent County female students reported current alcohol use than females statewide (41.6% vs. 31.1%, respectively) (Fig. 2b).
Kent County: Substance Use and Mental Health Among Alcohol Users in High School
High School Demographics:
Kent County
Students Surveyed: 444
Racial Mix: 17.3% Black; 65.0% White; 17.7% Other Gender: 48.3% Female; 51.7% Male
Grade: 26.0% 9th Grade; 24.4% 10th Grade; 24.0% 11th Grade; 24.4% 12th Grade
SUMMARY— The Maryland Statewide Epidemiological Workgroup (SEOW) analyzed the
2014 Maryland High School Youth Risk Behavior Survey (YRBS) for Maryland and each
jurisdiction. In Kent County:
Female students reported higher rates of alcohol use than male students
Students who ever used alcohol had higher rates of ever using other drugs
Students who were current or binge alcohol users had higher rates of current marijuana and
prescription drug use without a prescription
Students who were current or binge alcohol users had higher rates of feeling sad or
hopeless, and considered suicide and/or made a suicide plan
The 2014 Maryland YRBS is the source of data used for all tables and graphs. The survey uses three time frame measurements when assessing students’ substance use and mental health status. Any lifetime use is defined as whether or not a student has ever used a substance. Past year substance use is defined as any use in the past 12 months. Current use is defined as substance use in the past 30 days. Current binge alcohol use is defined as five or more drinks in a row in the past thirty days.
The Maryland SEOW is led by Dr. Linda Simoni-Wastila at the University of Maryland Baltimore School of Pharmacy, [email protected]. For more information, visit http://www.pharmacy.umaryland.edu/programs/seow/
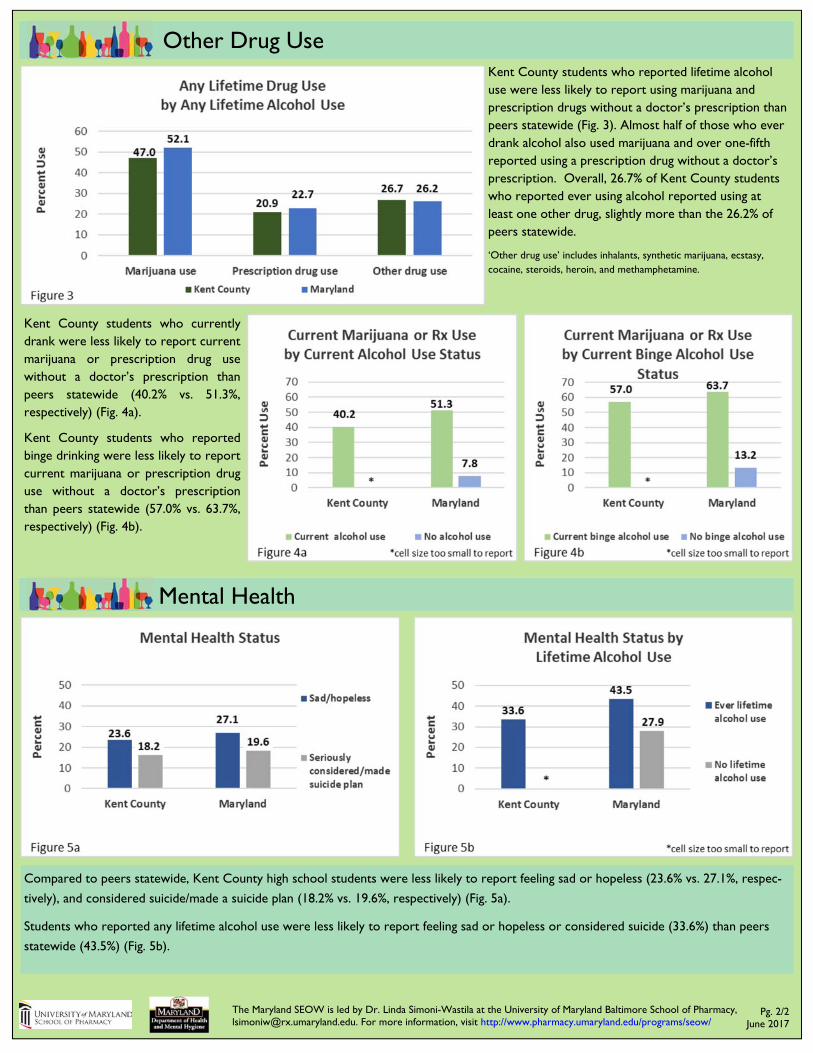
Kent County students who reported lifetime alcohol use were less likely to report using marijuana and prescription drugs without a doctor’s prescription than peers statewide (Fig. 3). Almost half of those who ever drank alcohol also used marijuana and over one-fifth reported using a prescription drug without a doctor’s prescription. Overall, 26.7% of Kent County students who reported ever using alcohol reported using at least one other drug, slightly more than the 26.2% of peers statewide.
‘Other drug use’ includes inhalants, synthetic marijuana, ecstasy, cocaine, steroids, heroin, and methamphetamine.
Other Drug Use
Kent County students who currently drank were less likely to report current marijuana or prescription drug use without a doctor’s prescription than peers statewide (40.2% vs. 51.3%, respectively) (Fig. 4a).
Kent County students who reported binge drinking were less likely to report current marijuana or prescription drug use without a doctor’s prescription than peers statewide (57.0% vs. 63.7%, respectively) (Fig. 4b).
Compared to peers statewide, Kent County high school students were less likely to report feeling sad or hopeless (23.6% vs. 27.1%, respec-
tively), and considered suicide/made a suicide plan (18.2% vs. 19.6%, respectively) (Fig. 5a).
Students who reported any lifetime alcohol use were less likely to report feeling sad or hopeless or considered suicide (33.6%) than peers
statewide (43.5%) (Fig. 5b).
Pg. 2/2 June 2017
Mental Health

SUMMARY—
Alcohol Use and Consequences:
Allegany County
Co
This report highlights recent information on the consumption and consequences of alcohol in Allegany County, Maryland.
Alcohol Consumption
According to the 2014 YRBS, 33.2% of 9th
graders, 48.1% of 10th graders, 57.8% of
11th graders, and 67.2% of 12th graders
reported using alcohol in their lifetime; and
12.1% of 9th graders, 22.8% of 10th graders,
30.5% of 11th graders, and 38.3% of 12th
graders reported current alcohol use (Fig.
1). Compared to their peers statewide,
Montgomery County high schoolers
reported lower rates of all alcohol use in
every grade (statewide data not shown).
Pg. 1/2 June 2017
Maryland State Epidemiological Outcomes Workgroup
(SEOW)
Montgomery County female students reported a lower rate of any lifetime alcohol use (53.5%) than female students statewide (58.3%) (Fig. 2a). A lower percentage of Montgomery County female students reported current alcohol use than females statewide (27.8% vs. 31.1%, respectively) (Fig. 2b). Montgomery County female and male students reported similar rates of binge alcohol use (11.9% and 11.7%, respectively), both lower than students reported statewide (15.0% and 15.1%, respectively) (Fig. 2c).
Montgomery County: Substance Use and Mental Health Among Alcohol Users in High School
High School Demographics:
Montgomery County
Students Surveyed: 4,439
Racial Mix: 19.7% Black; 16.1% Asian; 32.9% White; 31.3% Other Gender: 51.5% Female; 48.5% Male
Grade: 27.1% 9th Grade; 24.0% 10th Grade; 25.8% 11th Grade; 22.7% 12th Grade
SUMMARY— The Maryland Statewide Epidemiological Workgroup (SEOW) analyzed the
2014 Maryland High School Youth Risk Behavior Survey (YRBS) for Maryland and each
jurisdiction. In Montgomery County:
Female students reported higher rates of alcohol use than male students
Students who ever used alcohol had higher rates of ever using other drugs
Students who were current or binge alcohol users had higher rates of current marijuana
and prescription drug use without a prescription
Students who were current or binge alcohol users had higher rates of feeling sad or
hopeless, and considered suicide and/or made a suicide plan
The 2014 Maryland YRBS is the source of data used for all tables and graphs. The survey uses three time frame measurements when assessing students’ substance use and mental health status. Any lifetime use is defined as whether or not a student has ever used a substance. Past year substance use is defined as any use in the past 12 months. Current use is defined as substance use in the past 30 days. Current binge alcohol use is defined as five or more drinks in a row in the past thirty days.
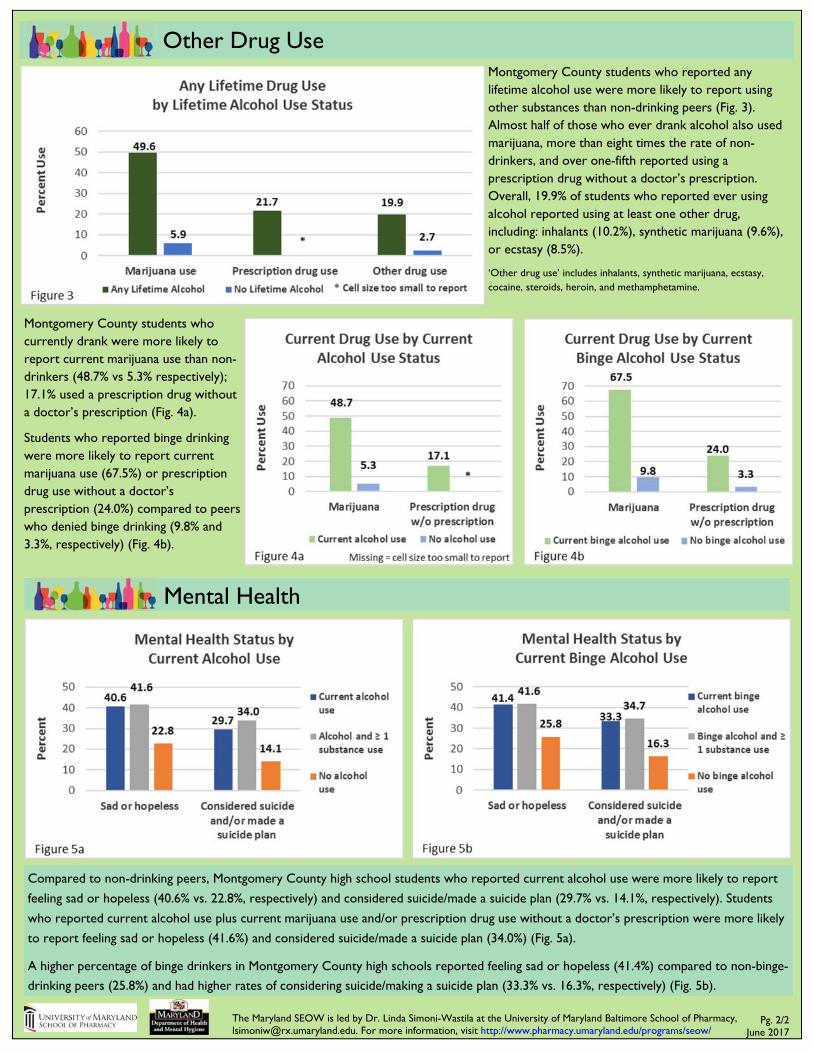
The Maryland SEOW is led by Dr. Linda Simoni-Wastila at the University of Maryland Baltimore School of Pharmacy, [email protected]. For more information, visit http://www.pharmacy.umaryland.edu/programs/seow/
Montgomery County students who reported any lifetime alcohol use were more likely to report using other substances than non-drinking peers (Fig. 3). Almost half of those who ever drank alcohol also used marijuana, more than eight times the rate of non-drinkers, and over one-fifth reported using a prescription drug without a doctor’s prescription. Overall, 19.9% of students who reported ever using alcohol reported using at least one other drug, including: inhalants (10.2%), synthetic marijuana (9.6%), or ecstasy (8.5%).
‘Other drug use’ includes inhalants, synthetic marijuana, ecstasy, cocaine, steroids, heroin, and methamphetamine.
Other Drug Use
Montgomery County students who currently drank were more likely to report current marijuana use than non-drinkers (48.7% vs 5.3% respectively); 17.1% used a prescription drug without a doctor’s prescription (Fig. 4a).
Students who reported binge drinking were more likely to report current marijuana use (67.5%) or prescription drug use without a doctor’s prescription (24.0%) compared to peers who denied binge drinking (9.8% and 3.3%, respectively) (Fig. 4b).
Compared to non-drinking peers, Montgomery County high school students who reported current alcohol use were more likely to report
feeling sad or hopeless (40.6% vs. 22.8%, respectively) and considered suicide/made a suicide plan (29.7% vs. 14.1%, respectively). Students
who reported current alcohol use plus current marijuana use and/or prescription drug use without a doctor’s prescription were more likely
to report feeling sad or hopeless (41.6%) and considered suicide/made a suicide plan (34.0%) (Fig. 5a).
A higher percentage of binge drinkers in Montgomery County high schools reported feeling sad or hopeless (41.4%) compared to non-binge-
drinking peers (25.8%) and had higher rates of considering suicide/making a suicide plan (33.3% vs. 16.3%, respectively) (Fig. 5b).
Pg. 2/2 June 2017
Mental Health
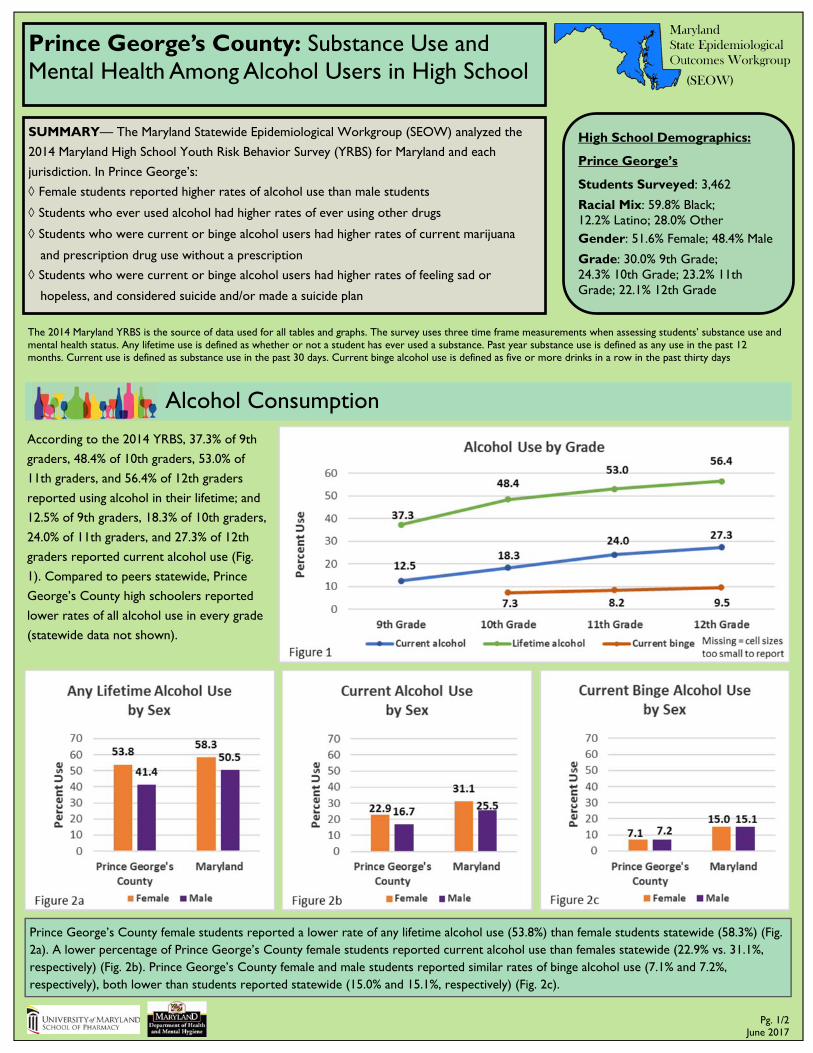
SUMMARY—
Alcohol Use and Consequences:
Allegany County
Co
This report highlights recent information on the consumption and consequences of alcohol in Allegany County, Maryland.
Alcohol Consumption
According to the 2014 YRBS, 37.3% of 9th
graders, 48.4% of 10th graders, 53.0% of
11th graders, and 56.4% of 12th graders
reported using alcohol in their lifetime; and
12.5% of 9th graders, 18.3% of 10th graders,
24.0% of 11th graders, and 27.3% of 12th
graders reported current alcohol use (Fig.
1). Compared to peers statewide, Prince
George’s County high schoolers reported
lower rates of all alcohol use in every grade
(statewide data not shown).
Pg. 1/2 June 2017
Maryland State Epidemiological Outcomes Workgroup
(SEOW)
Prince George’s County female students reported a lower rate of any lifetime alcohol use (53.8%) than female students statewide (58.3%) (Fig. 2a). A lower percentage of Prince George’s County female students reported current alcohol use than females statewide (22.9% vs. 31.1%, respectively) (Fig. 2b). Prince George’s County female and male students reported similar rates of binge alcohol use (7.1% and 7.2%, respectively), both lower than students reported statewide (15.0% and 15.1%, respectively) (Fig. 2c).
Prince George’s County: Substance Use and Mental Health Among Alcohol Users in High School
High School Demographics:
Prince George’s
Students Surveyed: 3,462
Racial Mix: 59.8% Black; 12.2% Latino; 28.0% Other Gender: 51.6% Female; 48.4% Male
Grade: 30.0% 9th Grade; 24.3% 10th Grade; 23.2% 11th Grade; 22.1% 12th Grade
SUMMARY— The Maryland Statewide Epidemiological Workgroup (SEOW) analyzed the
2014 Maryland High School Youth Risk Behavior Survey (YRBS) for Maryland and each
jurisdiction. In Prince George’s:
Female students reported higher rates of alcohol use than male students
Students who ever used alcohol had higher rates of ever using other drugs
Students who were current or binge alcohol users had higher rates of current marijuana
and prescription drug use without a prescription
Students who were current or binge alcohol users had higher rates of feeling sad or
hopeless, and considered suicide and/or made a suicide plan
The 2014 Maryland YRBS is the source of data used for all tables and graphs. The survey uses three time frame measurements when assessing students’ substance use and mental health status. Any lifetime use is defined as whether or not a student has ever used a substance. Past year substance use is defined as any use in the past 12 months. Current use is defined as substance use in the past 30 days. Current binge alcohol use is defined as five or more drinks in a row in the past thirty days
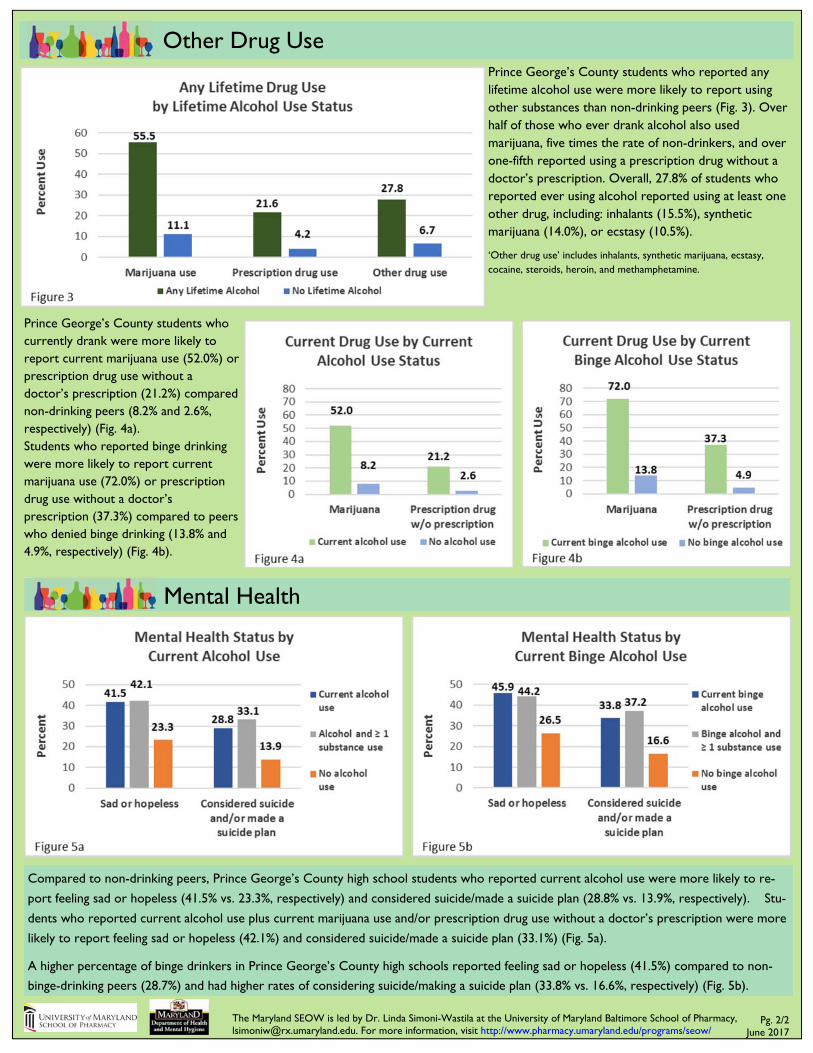
The Maryland SEOW is led by Dr. Linda Simoni-Wastila at the University of Maryland Baltimore School of Pharmacy, [email protected]. For more information, visit http://www.pharmacy.umaryland.edu/programs/seow/
Prince George’s County students who reported any lifetime alcohol use were more likely to report using other substances than non-drinking peers (Fig. 3). Over half of those who ever drank alcohol also used marijuana, five times the rate of non-drinkers, and over one-fifth reported using a prescription drug without a doctor’s prescription. Overall, 27.8% of students who reported ever using alcohol reported using at least one other drug, including: inhalants (15.5%), synthetic marijuana (14.0%), or ecstasy (10.5%).
‘Other drug use’ includes inhalants, synthetic marijuana, ecstasy, cocaine, steroids, heroin, and methamphetamine.
Other Drug Use
Prince George’s County students who currently drank were more likely to report current marijuana use (52.0%) or prescription drug use without a doctor’s prescription (21.2%) compared non-drinking peers (8.2% and 2.6%, respectively) (Fig. 4a). Students who reported binge drinking were more likely to report current marijuana use (72.0%) or prescription drug use without a doctor’s prescription (37.3%) compared to peers who denied binge drinking (13.8% and 4.9%, respectively) (Fig. 4b).
Compared to non-drinking peers, Prince George’s County high school students who reported current alcohol use were more likely to re-
port feeling sad or hopeless (41.5% vs. 23.3%, respectively) and considered suicide/made a suicide plan (28.8% vs. 13.9%, respectively). Stu-
dents who reported current alcohol use plus current marijuana use and/or prescription drug use without a doctor’s prescription were more
likely to report feeling sad or hopeless (42.1%) and considered suicide/made a suicide plan (33.1%) (Fig. 5a).
A higher percentage of binge drinkers in Prince George’s County high schools reported feeling sad or hopeless (41.5%) compared to non-
binge-drinking peers (28.7%) and had higher rates of considering suicide/making a suicide plan (33.8% vs. 16.6%, respectively) (Fig. 5b).
Pg. 2/2 June 2017
Mental Health
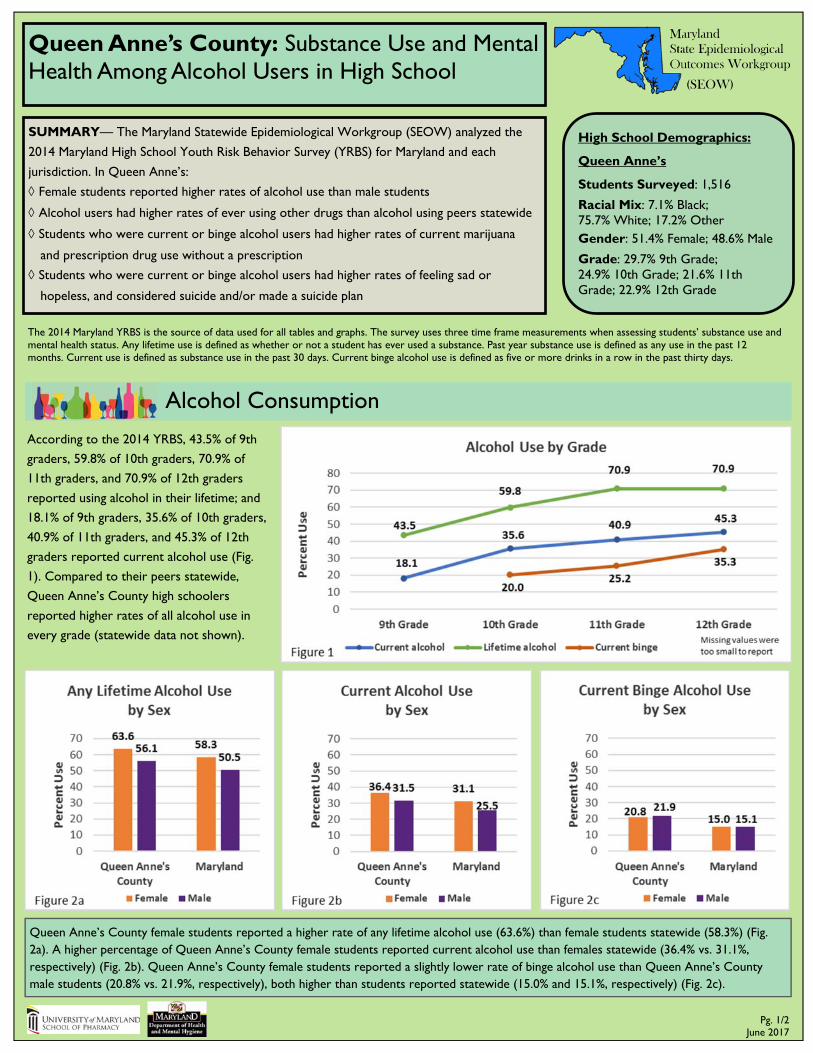
SUMMARY—
Alcohol Use and Consequences:
Allegany County
Co
This report highlights recent information on the consumption and consequences of alcohol in Allegany County, Maryland.
Alcohol Consumption
According to the 2014 YRBS, 43.5% of 9th
graders, 59.8% of 10th graders, 70.9% of
11th graders, and 70.9% of 12th graders
reported using alcohol in their lifetime; and
18.1% of 9th graders, 35.6% of 10th graders,
40.9% of 11th graders, and 45.3% of 12th
graders reported current alcohol use (Fig.
1). Compared to their peers statewide,
Queen Anne’s County high schoolers
reported higher rates of all alcohol use in
every grade (statewide data not shown).
Pg. 1/2 June 2017
Maryland State Epidemiological Outcomes Workgroup
(SEOW)
Queen Anne’s County female students reported a higher rate of any lifetime alcohol use (63.6%) than female students statewide (58.3%) (Fig. 2a). A higher percentage of Queen Anne’s County female students reported current alcohol use than females statewide (36.4% vs. 31.1%, respectively) (Fig. 2b). Queen Anne’s County female students reported a slightly lower rate of binge alcohol use than Queen Anne’s County male students (20.8% vs. 21.9%, respectively), both higher than students reported statewide (15.0% and 15.1%, respectively) (Fig. 2c).
Queen Anne’s County: Substance Use and Mental Health Among Alcohol Users in High School
High School Demographics:
Queen Anne’s
Students Surveyed: 1,516
Racial Mix: 7.1% Black; 75.7% White; 17.2% Other Gender: 51.4% Female; 48.6% Male
Grade: 29.7% 9th Grade; 24.9% 10th Grade; 21.6% 11th Grade; 22.9% 12th Grade
SUMMARY— The Maryland Statewide Epidemiological Workgroup (SEOW) analyzed the
2014 Maryland High School Youth Risk Behavior Survey (YRBS) for Maryland and each
jurisdiction. In Queen Anne’s:
Female students reported higher rates of alcohol use than male students
Alcohol users had higher rates of ever using other drugs than alcohol using peers statewide
Students who were current or binge alcohol users had higher rates of current marijuana
and prescription drug use without a prescription
Students who were current or binge alcohol users had higher rates of feeling sad or
hopeless, and considered suicide and/or made a suicide plan
The 2014 Maryland YRBS is the source of data used for all tables and graphs. The survey uses three time frame measurements when assessing students’ substance use and mental health status. Any lifetime use is defined as whether or not a student has ever used a substance. Past year substance use is defined as any use in the past 12 months. Current use is defined as substance use in the past 30 days. Current binge alcohol use is defined as five or more drinks in a row in the past thirty days.

The Maryland SEOW is led by Dr. Linda Simoni-Wastila at the University of Maryland Baltimore School of Pharmacy, [email protected]. For more information, visit http://www.pharmacy.umaryland.edu/programs/seow/
Queen Anne’s County students who reported any lifetime alcohol use were more likely to report using other substances than peers statewide (Fig. 3). Over half of those who ever drank alcohol also used marijuana and over a quarter reported using a prescription drug without a doctor’s prescription. Overall, 30.7% of students who reported ever using alcohol reported using at least one other drug, including: inhalants (16.4%), synthetic marijuana (19.5%), or ecstasy (13.3%).
‘Other drug use’ includes inhalants, synthetic marijuana, ecstasy, cocaine, steroids, heroin, and methamphetamine.
Other Drug Use
Queen Anne’s County students who currently drank reported current marijuana use (49.1%) or prescription drug use without a doctor’s prescription (22.0%) (Fig. 4a).
Students who reported binge drinking were more likely to report current marijuana use (60.5%) or prescription drug use without a doctor’s prescription (28.1%) compared to peers who denied binge drinking (9.6% and 5.5%, respectively) (Fig. 4b).
Compared to non-drinking peers, Queen Anne’s County high school students who reported current alcohol use were more likely to report
feeling sad or hopeless (34.9% vs. 21.9%, respectively) and considered suicide/made a suicide plan (27.9% vs. 17.9%, respectively). Students
who reported current alcohol use plus current marijuana use and/or prescription drug use without a doctor’s prescription were more likely
to report feeling sad or hopeless (41.8%) and considered suicide/made a suicide plan (33.1%) (Fig. 5a).
A higher percentage of binge drinkers in Queen Anne’s County high schools reported feeling sad or hopeless (37.1%) compared to non-
binge-drinking peers (24.6%) and had higher rates of considering suicide/making a suicide plan (28.4% vs. 19.6%, respectively) (Fig. 5b).
Pg. 2/2 June 2017
Mental Health
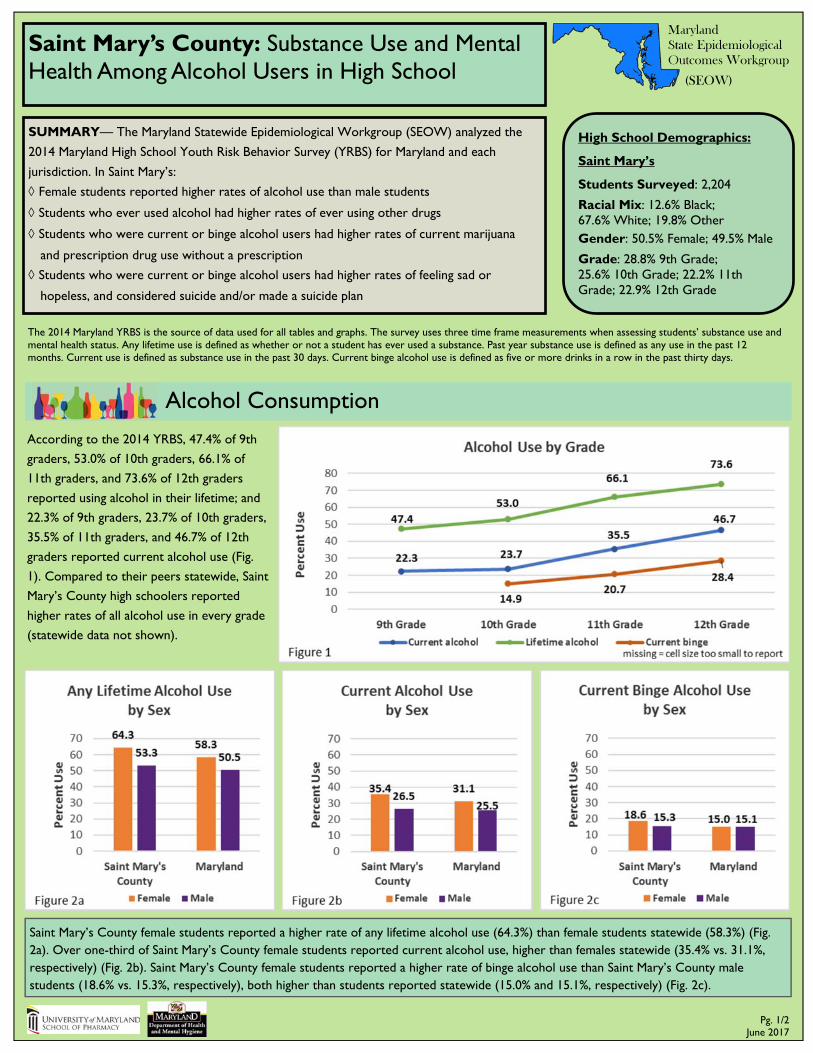
SUMMARY—
Alcohol Use and Consequences:
Allegany County
Co
This report highlights recent information on the consumption and consequences of alcohol in Allegany County, Maryland.
Alcohol Consumption
According to the 2014 YRBS, 47.4% of 9th
graders, 53.0% of 10th graders, 66.1% of
11th graders, and 73.6% of 12th graders
reported using alcohol in their lifetime; and
22.3% of 9th graders, 23.7% of 10th graders,
35.5% of 11th graders, and 46.7% of 12th
graders reported current alcohol use (Fig.
1). Compared to their peers statewide, Saint
Mary’s County high schoolers reported
higher rates of all alcohol use in every grade
(statewide data not shown).
Pg. 1/2 June 2017
Maryland State Epidemiological Outcomes Workgroup
(SEOW)
Saint Mary’s County female students reported a higher rate of any lifetime alcohol use (64.3%) than female students statewide (58.3%) (Fig. 2a). Over one-third of Saint Mary’s County female students reported current alcohol use, higher than females statewide (35.4% vs. 31.1%, respectively) (Fig. 2b). Saint Mary’s County female students reported a higher rate of binge alcohol use than Saint Mary’s County male students (18.6% vs. 15.3%, respectively), both higher than students reported statewide (15.0% and 15.1%, respectively) (Fig. 2c).
Saint Mary’s County: Substance Use and Mental Health Among Alcohol Users in High School
High School Demographics:
Saint Mary’s
Students Surveyed: 2,204
Racial Mix: 12.6% Black; 67.6% White; 19.8% Other Gender: 50.5% Female; 49.5% Male
Grade: 28.8% 9th Grade; 25.6% 10th Grade; 22.2% 11th Grade; 22.9% 12th Grade
SUMMARY— The Maryland Statewide Epidemiological Workgroup (SEOW) analyzed the
2014 Maryland High School Youth Risk Behavior Survey (YRBS) for Maryland and each
jurisdiction. In Saint Mary’s:
Female students reported higher rates of alcohol use than male students
Students who ever used alcohol had higher rates of ever using other drugs
Students who were current or binge alcohol users had higher rates of current marijuana
and prescription drug use without a prescription
Students who were current or binge alcohol users had higher rates of feeling sad or
hopeless, and considered suicide and/or made a suicide plan
The 2014 Maryland YRBS is the source of data used for all tables and graphs. The survey uses three time frame measurements when assessing students’ substance use and mental health status. Any lifetime use is defined as whether or not a student has ever used a substance. Past year substance use is defined as any use in the past 12 months. Current use is defined as substance use in the past 30 days. Current binge alcohol use is defined as five or more drinks in a row in the past thirty days.

The Maryland SEOW is led by Dr. Linda Simoni-Wastila at the University of Maryland Baltimore School of Pharmacy, [email protected]. For more information, visit http://www.pharmacy.umaryland.edu/programs/seow/
Saint Mary’s County students who reported any lifetime alcohol use were less likely to report using marijuana than peers statewide (Fig. 3). Almost half of those who ever drank alcohol also used marijuana and almost a quarter reported using a prescription drug without a doctor’s prescription. Overall, 30.5% of students who reported ever using alcohol reported using at least one other drug, including: inhalants (12.6%), synthetic marijuana (21.0%), or ecstasy (9.7%).
‘Other drug use’ includes inhalants, synthetic marijuana, ecstasy, cocaine, steroids, heroin, and methamphetamine.
Other Drug Use
Saint Mary’s County students who currently drank were more likely to report current marijuana use compared non-drinking peers (43.1% vs. 5.7%, respectively); 20.8% of current drinkers reported prescription drug use without a doctor’s prescription (Fig. 4a). Students who reported binge drinking were more likely to report current marijuana use (55.5%) or prescription drug use without a doctor’s prescription (28.5%) compared to peers who denied binge drinking (9.9% and 4.0%, respectively) (Fig. 4b).
Compared to non-drinking peers, Saint Mary’s County high school students who reported current alcohol use were more likely to report
feeling sad or hopeless (37.0% vs. 21.2%, respectively) and considered suicide/made a suicide plan (28.4% vs. 15.0%, respectively). Students
who reported current alcohol use plus current marijuana use and/or prescription drug use without a doctor’s prescription were more likely
to report feeling sad or hopeless (44.8%) and considered suicide/made a suicide plan (36.4%) (Fig. 5a).
A higher percentage of binge drinkers in Saint Mary’s County high schools reported feeling sad or hopeless (39.3%) compared to non-binge-
drinking peers (24.1%) and had higher rates of considering suicide/making a suicide plan (27.8% vs. 17.5%, respectively) (Fig. 5b).
Pg. 2/2 June 2017
Mental Health
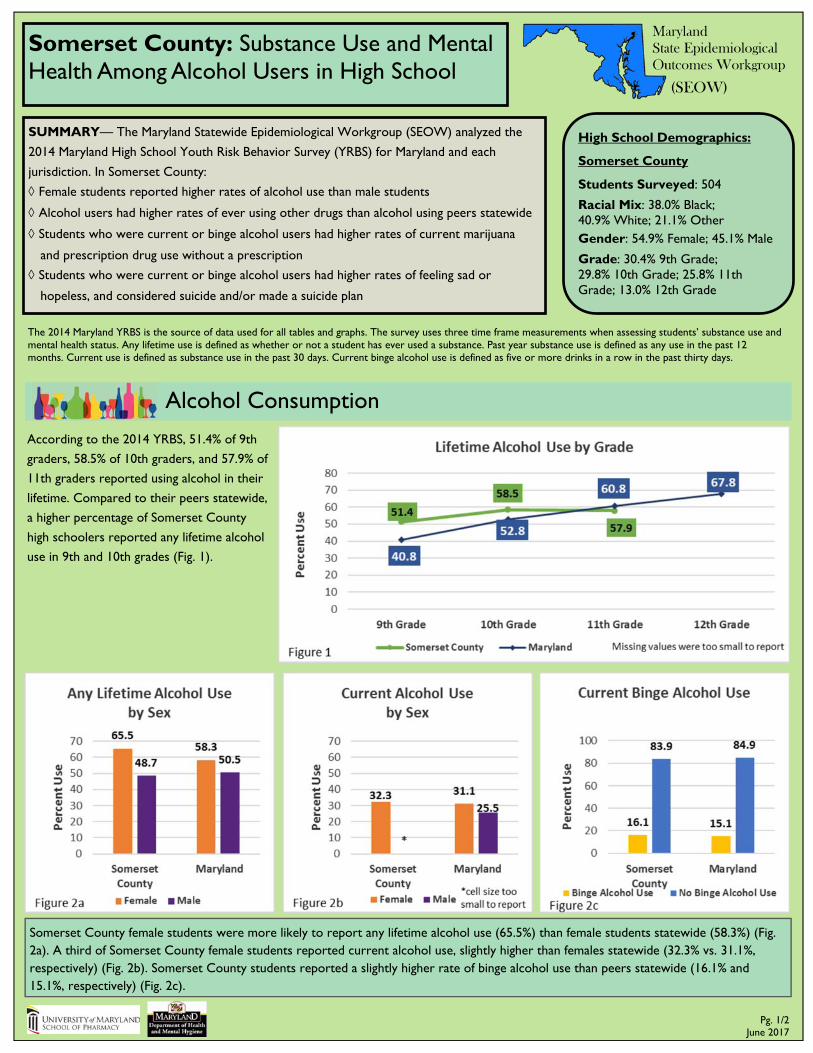
SUMMARY—
Alcoho
Co
This report highlights recent information on the consumption and consequences of alcohol in Allegany County, Maryland.
Alcohol Consumption
According to the 2014 YRBS, 51.4% of 9th
graders, 58.5% of 10th graders, and 57.9% of
11th graders reported using alcohol in their
lifetime. Compared to their peers statewide,
a higher percentage of Somerset County
high schoolers reported any lifetime alcohol
use in 9th and 10th grades (Fig. 1).
Pg. 1/2 June 2017
Maryland State Epidemiological Outcomes Workgroup
(SEOW)
Somerset County female students were more likely to report any lifetime alcohol use (65.5%) than female students statewide (58.3%) (Fig. 2a). A third of Somerset County female students reported current alcohol use, slightly higher than females statewide (32.3% vs. 31.1%, respectively) (Fig. 2b). Somerset County students reported a slightly higher rate of binge alcohol use than peers statewide (16.1% and 15.1%, respectively) (Fig. 2c).
Somerset County: Substance Use and Mental Health Among Alcohol Users in High School
High School Demographics:
Somerset County
Students Surveyed: 504
Racial Mix: 38.0% Black; 40.9% White; 21.1% Other Gender: 54.9% Female; 45.1% Male
Grade: 30.4% 9th Grade; 29.8% 10th Grade; 25.8% 11th Grade; 13.0% 12th Grade
SUMMARY— The Maryland Statewide Epidemiological Workgroup (SEOW) analyzed the
2014 Maryland High School Youth Risk Behavior Survey (YRBS) for Maryland and each
jurisdiction. In Somerset County:
Female students reported higher rates of alcohol use than male students
Alcohol users had higher rates of ever using other drugs than alcohol using peers statewide
Students who were current or binge alcohol users had higher rates of current marijuana
and prescription drug use without a prescription
Students who were current or binge alcohol users had higher rates of feeling sad or
hopeless, and considered suicide and/or made a suicide plan
The 2014 Maryland YRBS is the source of data used for all tables and graphs. The survey uses three time frame measurements when assessing students’ substance use and mental health status. Any lifetime use is defined as whether or not a student has ever used a substance. Past year substance use is defined as any use in the past 12 months. Current use is defined as substance use in the past 30 days. Current binge alcohol use is defined as five or more drinks in a row in the past thirty days.

The Maryland SEOW is led by Dr. Linda Simoni-Wastila at the University of Maryland Baltimore School of Pharmacy, [email protected]. For more information, visit http://www.pharmacy.umaryland.edu/programs/seow/
Somerset County students who reported lifetime alcohol use were more likely to report using other substances than peers statewide (Fig. 3). Over half of those who ever drank alcohol also used marijuana, and almost a quarter reported using a prescription drug without a doctor’s prescription. Overall, 36.5% of students who reported ever using alcohol reported using at least one drug (other than marijuana or prescription drugs), including: synthetic marijuana (23.3%).
‘Other drug use’ includes inhalants, synthetic marijuana, ecstasy, cocaine, steroids, heroin, and methamphetamine.
Other Drug Use
Somerset County students who currently drank were more likely to report current marijuana use than peers statewide (51.3% vs. 47.5%, respectively) (Fig. 4a).
Students who reported binge drinking were more likely to report current marijuana use or prescription drug use without a doctor’s prescription (71.6%) compared to peers statewide (63.7%)(Fig. 4b).
Somerset County high school students who reported current alcohol use were more likely to endorse symptoms of mental health distress,
which is defined as reported feelings of sadness or hopelessness, considering suicide, or making a suicide plan. Compared to peers statewide,
a higher percentage of Somerset County students reported mental health distress (47.5% vs. 42.8%, respectively). Students who denied
current alcohol use were less likely to report feeling sad or hopeless or considering suicide in Somerset County and statewide
(21.0% vs. 24.5%) (Fig. 5a).
Pg. 2/2 June 2017
Mental Health

SUMMARY—
Alcoho
Co
This report highlights recent information on the consumption and consequences of alcohol in Allegany County, Maryland.
Alcohol Consumption
According to the 2014 YRBS, 39.0% of 9th
graders, 46.5% of 10th graders, 53.5% of
11th graders, and 64.7% of 12th graders
reported using alcohol in their lifetime; and
26.7% of 10th graders, 31.3% of 11th
graders, and 38.0% of 12th graders reported
current alcohol use (Fig. 1). Compared to
their peers statewide, Talbot County high
schoolers reported lower rates of lifetime
alcohol use in every grade (statewide data
not shown).
Pg. 1/2 June 2017
Maryland State Epidemiological Outcomes Workgroup
(SEOW)
Talbot County female students reported a lower rate of any lifetime alcohol use (54.9%) than female students statewide (58.3%) (Fig. 2a). A lower percentage of Talbot County female students reported current alcohol use than females statewide (29.1% vs. 31.1%, respectively) (Fig. 2b). Talbot County female and male students reported similar rates of binge alcohol use (17.1% and 16.9%, respectively), both higher than students reported statewide (15.0% and 15.1%, respectively) (Fig. 2c).
Talbot County: Substance Use and Mental Health Among Alcohol Users in High School
High School Demographics:
Talbot County
Students Surveyed: 976
Racial Mix: 12.2% Black; 67.1% White; 20.7% Other Gender: 48.1% Female; 51.9% Male
Grade: 29.2% 9th Grade; 26.1% 10th Grade; 23.8% 11th Grade; 20.3% 12th Grade
SUMMARY— The Maryland Statewide Epidemiological Workgroup (SEOW) analyzed the
2014 Maryland High School Youth Risk Behavior Survey (YRBS) for Maryland and each
jurisdiction. In Talbot County:
Female students reported higher rates of alcohol use than male students
Students who ever used alcohol had higher rates of ever using other drugs
Students who were current or binge alcohol users had higher rates of current marijuana
and prescription drug use without a prescription
Students who were current or binge alcohol users had higher rates of feeling sad or
hopeless, and considered suicide and/or made a suicide plan
The 2014 Maryland YRBS is the source of data used for all tables and graphs. The survey uses three time frame measurements when assessing students’ substance use and mental health status. Any lifetime use is defined as whether or not a student has ever used a substance. Past year substance use is defined as any use in the past 12 months. Current use is defined as substance use in the past 30 days. Current binge alcohol use is defined as five or more drinks in a row in the past thirty days.
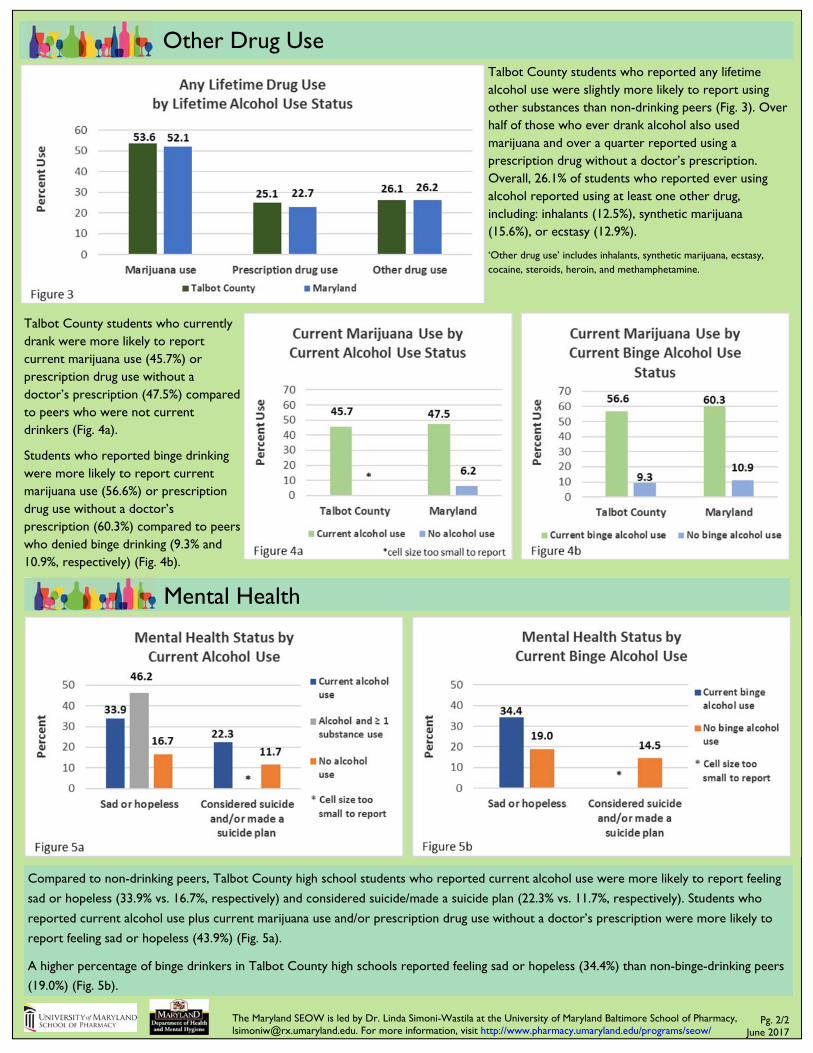
The Maryland SEOW is led by Dr. Linda Simoni-Wastila at the University of Maryland Baltimore School of Pharmacy, [email protected]. For more information, visit http://www.pharmacy.umaryland.edu/programs/seow/
Talbot County students who reported any lifetime alcohol use were slightly more likely to report using other substances than non-drinking peers (Fig. 3). Over half of those who ever drank alcohol also used marijuana and over a quarter reported using a prescription drug without a doctor’s prescription. Overall, 26.1% of students who reported ever using alcohol reported using at least one other drug, including: inhalants (12.5%), synthetic marijuana (15.6%), or ecstasy (12.9%).
‘Other drug use’ includes inhalants, synthetic marijuana, ecstasy, cocaine, steroids, heroin, and methamphetamine.
Other Drug Use
Talbot County students who currently drank were more likely to report current marijuana use (45.7%) or prescription drug use without a doctor’s prescription (47.5%) compared to peers who were not current drinkers (Fig. 4a).
Students who reported binge drinking were more likely to report current marijuana use (56.6%) or prescription drug use without a doctor’s prescription (60.3%) compared to peers who denied binge drinking (9.3% and 10.9%, respectively) (Fig. 4b).
Compared to non-drinking peers, Talbot County high school students who reported current alcohol use were more likely to report feeling
sad or hopeless (33.9% vs. 16.7%, respectively) and considered suicide/made a suicide plan (22.3% vs. 11.7%, respectively). Students who
reported current alcohol use plus current marijuana use and/or prescription drug use without a doctor’s prescription were more likely to
report feeling sad or hopeless (43.9%) (Fig. 5a).
A higher percentage of binge drinkers in Talbot County high schools reported feeling sad or hopeless (34.4%) than non-binge-drinking peers
(19.0%) (Fig. 5b).
Pg. 2/2 June 2017
Mental Health
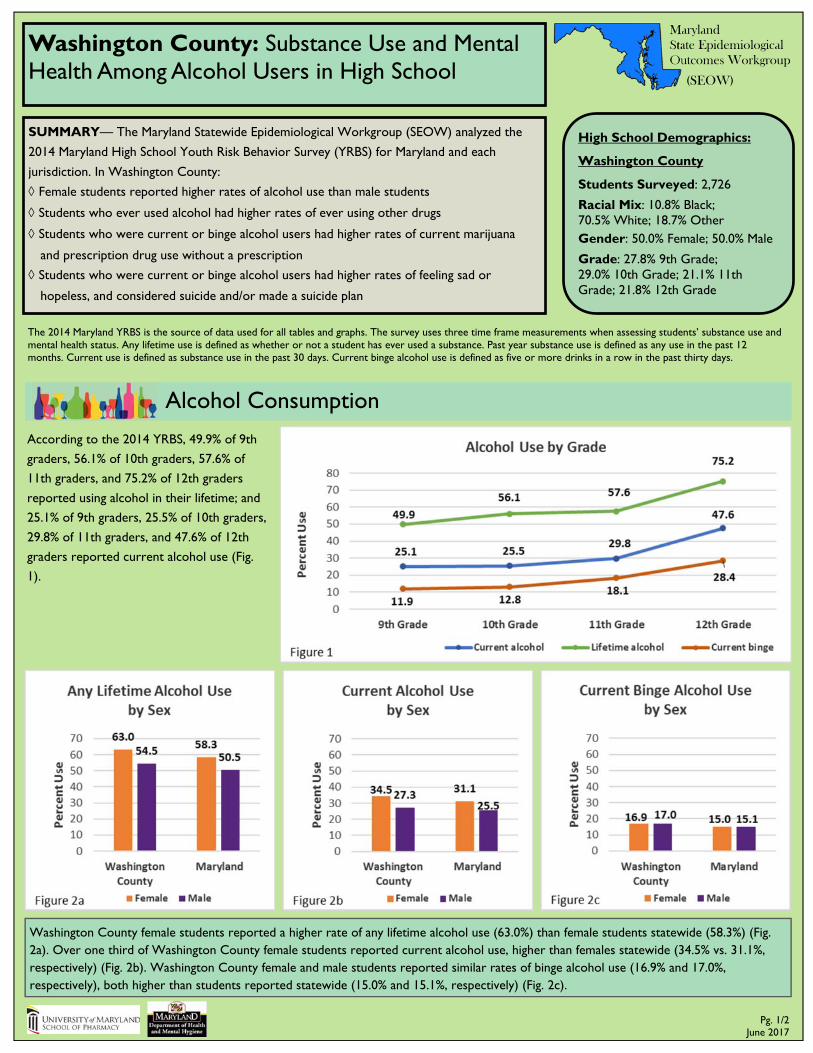
SUMMARY—
Alcohol Use and Consequences:
Allegany County
Co
This report highlights recent information on the consumption and consequences of alcohol in Allegany County, Maryland.
Alcohol Consumption
According to the 2014 YRBS, 49.9% of 9th
graders, 56.1% of 10th graders, 57.6% of
11th graders, and 75.2% of 12th graders
reported using alcohol in their lifetime; and
25.1% of 9th graders, 25.5% of 10th graders,
29.8% of 11th graders, and 47.6% of 12th
graders reported current alcohol use (Fig.
1).
Pg. 1/2 June 2017
Maryland State Epidemiological Outcomes Workgroup
(SEOW)
Washington County female students reported a higher rate of any lifetime alcohol use (63.0%) than female students statewide (58.3%) (Fig. 2a). Over one third of Washington County female students reported current alcohol use, higher than females statewide (34.5% vs. 31.1%, respectively) (Fig. 2b). Washington County female and male students reported similar rates of binge alcohol use (16.9% and 17.0%, respectively), both higher than students reported statewide (15.0% and 15.1%, respectively) (Fig. 2c).
Washington County: Substance Use and Mental Health Among Alcohol Users in High School
High School Demographics:
Washington County
Students Surveyed: 2,726
Racial Mix: 10.8% Black; 70.5% White; 18.7% Other Gender: 50.0% Female; 50.0% Male
Grade: 27.8% 9th Grade; 29.0% 10th Grade; 21.1% 11th Grade; 21.8% 12th Grade
SUMMARY— The Maryland Statewide Epidemiological Workgroup (SEOW) analyzed the
2014 Maryland High School Youth Risk Behavior Survey (YRBS) for Maryland and each
jurisdiction. In Washington County:
Female students reported higher rates of alcohol use than male students
Students who ever used alcohol had higher rates of ever using other drugs
Students who were current or binge alcohol users had higher rates of current marijuana
and prescription drug use without a prescription
Students who were current or binge alcohol users had higher rates of feeling sad or
hopeless, and considered suicide and/or made a suicide plan
The 2014 Maryland YRBS is the source of data used for all tables and graphs. The survey uses three time frame measurements when assessing students’ substance use and mental health status. Any lifetime use is defined as whether or not a student has ever used a substance. Past year substance use is defined as any use in the past 12 months. Current use is defined as substance use in the past 30 days. Current binge alcohol use is defined as five or more drinks in a row in the past thirty days.

The Maryland SEOW is led by Dr. Linda Simoni-Wastila at the University of Maryland Baltimore School of Pharmacy, [email protected]. For more information, visit http://www.pharmacy.umaryland.edu/programs/seow/
Washington County students who reported lifetime alcohol use were slightly less likely to report using marijuana than peers statewide (Fig. 3). Over half of those who ever drank alcohol also used marijuana, almost seven times the rate of non-drinkers (data not shown), and almost a quarter reported using a prescription drug without a doctor’s prescription. Overall, 27.8% of students who reported ever using alcohol reported using at least one other drug, including: inhalants (12.0%), synthetic marijuana (20.0%), or ecstasy (10.1%).
‘Other drug use’ includes inhalants, synthetic marijuana, ecstasy, cocaine, steroids, heroin, and methamphetamine.
Other Drug Use
Washington County students who currently drank were more likely to report current marijuana use than non-drinkers (46.1% vs. 7.1%, respectively) (Fig. 4a); 21.2% of current drinkers reported prescription drug use without a doctor’s prescription. Students who reported binge drinking were more likely to report current marijuana use (58.6%) or prescription drug use without a doctor’s prescription (29.5%), compared to peers who denied binge drinking (11.3% and 4.0%, respectively) (Fig. 4b).
Compared to non-drinking peers, Washington County high school students who reported current alcohol use were more likely to report
feeling sad or hopeless (37.1% vs. 22.0%, respectively) and considered suicide/made a suicide plan (28.8% vs. 15.8%, respectively) (Fig. 5a).
Students who reported current alcohol use plus current marijuana use and/or prescription drug use without a doctor’s prescription were
more likely to report feeling sad or hopeless (42.6%) and considered suicide/made a suicide plan (36.0%) (Fig. 5a).
A higher percentage of binge drinkers in Washington County high schools reported feeling sad or hopeless (37.0%) compared to non-binge-
drinking peers (24.8%) and had higher rates of considering suicide/making a suicide plan (31.0% vs. 17.7%, respectively) (Fig. 5b).
Pg. 2/2 June 2017
Mental Health
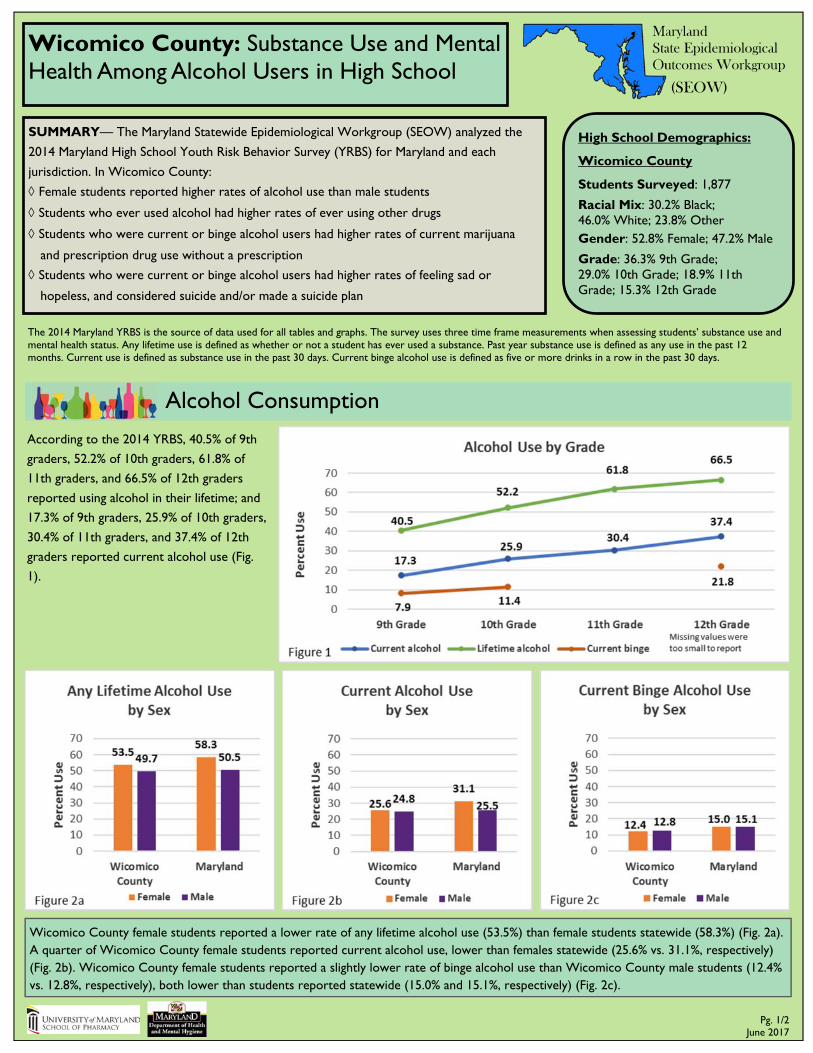
SUMMARY—
Alcoho
Co
This report highlights recent information on the consumption and consequences of alcohol in Allegany County, Maryland.
Alcohol Consumption
According to the 2014 YRBS, 40.5% of 9th
graders, 52.2% of 10th graders, 61.8% of
11th graders, and 66.5% of 12th graders
reported using alcohol in their lifetime; and
17.3% of 9th graders, 25.9% of 10th graders,
30.4% of 11th graders, and 37.4% of 12th
graders reported current alcohol use (Fig.
1).
Pg. 1/2 June 2017
Maryland State Epidemiological Outcomes Workgroup
(SEOW)
Wicomico County female students reported a lower rate of any lifetime alcohol use (53.5%) than female students statewide (58.3%) (Fig. 2a). A quarter of Wicomico County female students reported current alcohol use, lower than females statewide (25.6% vs. 31.1%, respectively) (Fig. 2b). Wicomico County female students reported a slightly lower rate of binge alcohol use than Wicomico County male students (12.4% vs. 12.8%, respectively), both lower than students reported statewide (15.0% and 15.1%, respectively) (Fig. 2c).
Wicomico County: Substance Use and Mental Health Among Alcohol Users in High School
High School Demographics:
Wicomico County
Students Surveyed: 1,877
Racial Mix: 30.2% Black; 46.0% White; 23.8% Other Gender: 52.8% Female; 47.2% Male
Grade: 36.3% 9th Grade; 29.0% 10th Grade; 18.9% 11th Grade; 15.3% 12th Grade
SUMMARY— The Maryland Statewide Epidemiological Workgroup (SEOW) analyzed the
2014 Maryland High School Youth Risk Behavior Survey (YRBS) for Maryland and each
jurisdiction. In Wicomico County:
Female students reported higher rates of alcohol use than male students
Students who ever used alcohol had higher rates of ever using other drugs
Students who were current or binge alcohol users had higher rates of current marijuana
and prescription drug use without a prescription
Students who were current or binge alcohol users had higher rates of feeling sad or
hopeless, and considered suicide and/or made a suicide plan
The 2014 Maryland YRBS is the source of data used for all tables and graphs. The survey uses three time frame measurements when assessing students’ substance use and mental health status. Any lifetime use is defined as whether or not a student has ever used a substance. Past year substance use is defined as any use in the past 12 months. Current use is defined as substance use in the past 30 days. Current binge alcohol use is defined as five or more drinks in a row in the past 30 days.

The Maryland SEOW is led by Dr. Linda Simoni-Wastila at the University of Maryland Baltimore School of Pharmacy, [email protected]. For more information, visit http://www.pharmacy.umaryland.edu/programs/seow/
Wicomico County students who reported any lifetime alcohol use were slightly less likely to report using marijuana than peers statewide (Fig. 3). Over half of those who ever drank alcohol also used marijuana, almost six times the rate of non-drinkers, and almost a quarter reported using a prescription drug without a doctor’s prescription. Overall, 26.8% of students who reported ever using alcohol reported using at least one other drug, including: inhalants (14.0%), synthetic marijuana (16.3%), or ecstasy (12.3%).
‘Other drug use’ includes inhalants, synthetic marijuana, ecstasy, cocaine, steroids, heroin, and methamphetamine.
Other Drug Use
Wicomico County students who currently drank were more likely to report current marijuana use compared to peers who were not current drinkers (49.1% vs. 6.4%, respectively); 21.4% of current drinkers reported prescription drug use without a doctor’s prescription (Fig.4a). Students who reported binge drinking were more likely to report current marijuana use (61.6%) or prescription drug use without a doctor’s prescription (31.8%) compared to peers who denied binge drinking (11.4% and 4.2%, respectively) (Fig. 4b).
Compared to non-drinking peers, Wicomico County high school students who reported current alcohol use were more likely to report
feeling sad or hopeless (40.9% vs. 22.5%, respectively) and considered suicide/made a suicide plan (32.3% vs. 15.0%, respectively). Students
who reported current alcohol use plus current marijuana use and/or prescription drug use without a doctor’s prescription were more likely
to report feeling sad or hopeless (44.6%) and considered suicide/made a suicide plan (37.6%) (Fig. 5a).
A higher percentage of binge drinkers in Wicomico County high schools reported feeling sad or hopeless (41.3%) compared to non-binge-
drinking peers (25.5%) and had higher rates of considering suicide/making a suicide plan (31.8% vs. 17.9%, respectively) (Fig. 5b).
Pg. 2/2 June 2017
Mental Health

SUMMARY—
Alcohol Use and Consequences:
Allegany County
Co
This report highlights recent information on the consumption and consequences of alcohol in Allegany County, Maryland.
Alcohol Consumption
According to the 2014 YRBS, 45.8% of 9th
graders, 56.3% of 10th graders, 62.9% of
11th graders, and 69.3% of 12th graders
reported using alcohol in their lifetime; and
22.2% of 9th graders, 29.6% of 10th graders,
39.1% of 11th graders, and 45.8% of 12th
graders reported current alcohol use (Fig.
1). Compared to their peers statewide,
Worcester County high schoolers reported
higher rates of all alcohol use in every grade
(statewide data not shown).
Pg. 1/2 June 2017
Maryland State Epidemiological Outcomes Workgroup
(SEOW)
Worcester County female students reported a higher rate of any lifetime alcohol use (60.9%) than female students statewide (58.3%) (Fig. 2a). A higher percentage of Worcester County female students reported current alcohol use than females statewide (37.6% vs. 31.1%, respectively) (Fig. 2b). Worcester County female students reported a lower rate of binge alcohol use than Worcester County male students (19.3% vs. 21.2%, respectively), both higher than students reported statewide (15.0% and 15.1%, respectively) (Fig. 2c).
Worcester County: Substance Use and Mental Health Among Alcohol Users in High School
High School Demographics:
Worcester County
Students Surveyed: 1,201
Racial Mix: 19.5% Black; 64.0% White; 16.5% Other Gender: 52.6% Female; 47.4% Male
Grade: 25.5% 9th Grade; 23.7% 10th Grade; 24.3% 11th Grade; 25.5% 12th Grade
SUMMARY— The Maryland Statewide Epidemiological Workgroup (SEOW) analyzed the
2014 Maryland High School Youth Risk Behavior Survey (YRBS) for Maryland and each
jurisdiction. In Worcester County:
Female students reported higher rates of alcohol use than male students
Alcohol users had higher rates of ever using other drugs than alcohol using peers statewide
Students who were current or binge alcohol users had higher rates of current marijuana
and prescription drug use without a prescription
Students who were current or binge alcohol users had higher rates of feeling sad or
hopeless, and considered suicide and/or made a suicide plan
The 2014 Maryland YRBS is the source of data used for all tables and graphs. The survey uses three time frame measurements when assessing students’ substance use and mental health status. Any lifetime use is defined as whether or not a student has ever used a substance. Past year substance use is defined as any use in the past 12 months. Current use is defined as substance use in the past 30 days. Current binge alcohol use is defined as five or more drinks in a row in the past thirty days.
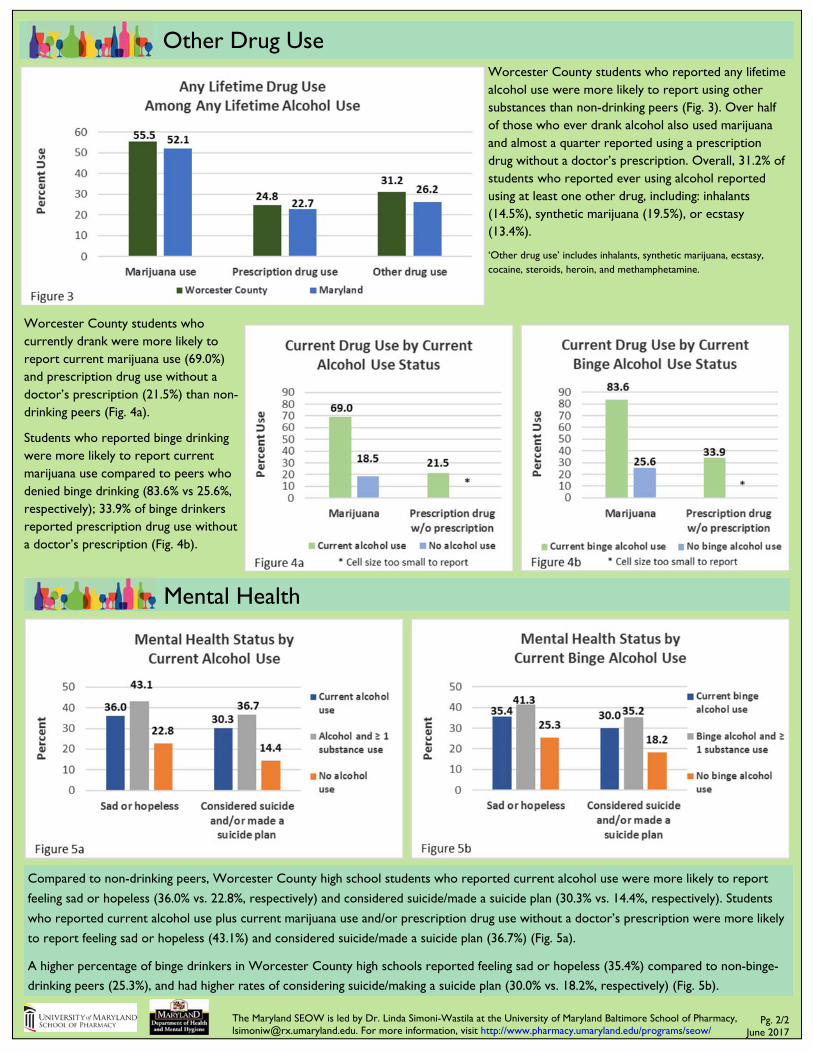
The Maryland SEOW is led by Dr. Linda Simoni-Wastila at the University of Maryland Baltimore School of Pharmacy, [email protected]. For more information, visit http://www.pharmacy.umaryland.edu/programs/seow/
Worcester County students who reported any lifetime alcohol use were more likely to report using other substances than non-drinking peers (Fig. 3). Over half of those who ever drank alcohol also used marijuana and almost a quarter reported using a prescription drug without a doctor’s prescription. Overall, 31.2% of students who reported ever using alcohol reported using at least one other drug, including: inhalants (14.5%), synthetic marijuana (19.5%), or ecstasy (13.4%).
‘Other drug use’ includes inhalants, synthetic marijuana, ecstasy, cocaine, steroids, heroin, and methamphetamine.
Other Drug Use
Worcester County students who currently drank were more likely to report current marijuana use (69.0%) and prescription drug use without a doctor’s prescription (21.5%) than non-drinking peers (Fig. 4a).
Students who reported binge drinking were more likely to report current marijuana use compared to peers who denied binge drinking (83.6% vs 25.6%, respectively); 33.9% of binge drinkers reported prescription drug use without a doctor’s prescription (Fig. 4b).
Compared to non-drinking peers, Worcester County high school students who reported current alcohol use were more likely to report
feeling sad or hopeless (36.0% vs. 22.8%, respectively) and considered suicide/made a suicide plan (30.3% vs. 14.4%, respectively). Students
who reported current alcohol use plus current marijuana use and/or prescription drug use without a doctor’s prescription were more likely
to report feeling sad or hopeless (43.1%) and considered suicide/made a suicide plan (36.7%) (Fig. 5a).
A higher percentage of binge drinkers in Worcester County high schools reported feeling sad or hopeless (35.4%) compared to non-binge-
drinking peers (25.3%), and had higher rates of considering suicide/making a suicide plan (30.0% vs. 18.2%, respectively) (Fig. 5b).
Pg. 2/2 June 2017
Mental Health
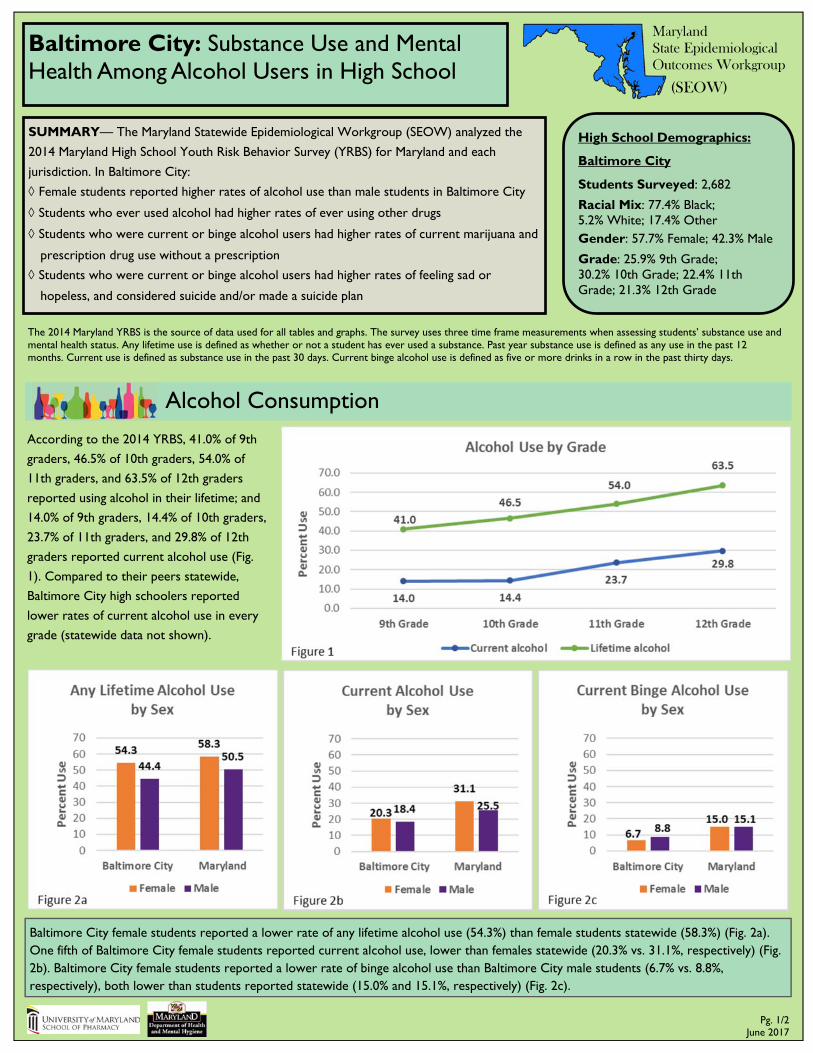
SUMMARY—
Alcoho
Co
This report highlights recent information on the consumption and consequences of alcohol in Allegany County, Maryland.
Alcohol Consumption
According to the 2014 YRBS, 41.0% of 9th
graders, 46.5% of 10th graders, 54.0% of
11th graders, and 63.5% of 12th graders
reported using alcohol in their lifetime; and
14.0% of 9th graders, 14.4% of 10th graders,
23.7% of 11th graders, and 29.8% of 12th
graders reported current alcohol use (Fig.
1). Compared to their peers statewide,
Baltimore City high schoolers reported
lower rates of current alcohol use in every
grade (statewide data not shown).
Pg. 1/2 June 2017
Maryland State Epidemiological Outcomes Workgroup
(SEOW)
Baltimore City female students reported a lower rate of any lifetime alcohol use (54.3%) than female students statewide (58.3%) (Fig. 2a). One fifth of Baltimore City female students reported current alcohol use, lower than females statewide (20.3% vs. 31.1%, respectively) (Fig. 2b). Baltimore City female students reported a lower rate of binge alcohol use than Baltimore City male students (6.7% vs. 8.8%, respectively), both lower than students reported statewide (15.0% and 15.1%, respectively) (Fig. 2c).
Baltimore City: Substance Use and Mental Health Among Alcohol Users in High School
High School Demographics:
Baltimore City
Students Surveyed: 2,682
Racial Mix: 77.4% Black; 5.2% White; 17.4% Other Gender: 57.7% Female; 42.3% Male
Grade: 25.9% 9th Grade; 30.2% 10th Grade; 22.4% 11th Grade; 21.3% 12th Grade
SUMMARY— The Maryland Statewide Epidemiological Workgroup (SEOW) analyzed the
2014 Maryland High School Youth Risk Behavior Survey (YRBS) for Maryland and each
jurisdiction. In Baltimore City:
Female students reported higher rates of alcohol use than male students in Baltimore City
Students who ever used alcohol had higher rates of ever using other drugs
Students who were current or binge alcohol users had higher rates of current marijuana and
prescription drug use without a prescription
Students who were current or binge alcohol users had higher rates of feeling sad or
hopeless, and considered suicide and/or made a suicide plan
The 2014 Maryland YRBS is the source of data used for all tables and graphs. The survey uses three time frame measurements when assessing students’ substance use and mental health status. Any lifetime use is defined as whether or not a student has ever used a substance. Past year substance use is defined as any use in the past 12 months. Current use is defined as substance use in the past 30 days. Current binge alcohol use is defined as five or more drinks in a row in the past thirty days.

The Maryland SEOW is led by Dr. Linda Simoni-Wastila at the University of Maryland Baltimore School of Pharmacy, [email protected]. For more information, visit http://www.pharmacy.umaryland.edu/programs/seow/
Baltimore City students who reported lifetime alcohol use were more likely to report using other substances than non-drinking peers (Fig. 3). Almost two-thirds of those who ever drank alcohol also used marijuana, more than three times the rate of non-drinkers, and almost one-fifth reported using a prescription drug without a doctor’s prescription. Overall, 27.0% of students who reported ever using alcohol reported using at least one other drug, including: inhalants (15.8%), synthetic marijuana (14.1%), or ecstasy (10.7%).
‘Other drug use’ includes inhalants, synthetic marijuana, ecstasy, cocaine, steroids, heroin, and methamphetamine.
Other Drug Use
Baltimore City students who currently drank were more likely to report current marijuana use (54.0%) or prescription drug use without a doctor’s prescription (17.0%) compared to peers who were not current drinkers (12.8% and 3.3%, respectively) (Fig. 4a).
Students who reported binge drinking were more likely to report current marijuana use (64.7%) or prescription drug use w i thout a doctor ’ s prescription (31.0%) compared to peers who denied current binge drinking (18.6% and 4.8%, respectively) (Fig. 4b).
Compared to non-drinking peers, Baltimore City high school students who reported current alcohol use were more likely to report feeling
sad or hopeless (42.5% vs. 26.1%, respectively) and considered suicide/made a suicide plan (27.8% vs. 16.6%, respectively) (Fig. 5a). Students
who reported current alcohol use plus current marijuana use and/or a prescription drug use without a doctor’s prescription were more
likely to report feeling sad or hopeless (43.9%), and considered suicide/made a suicide plan (32.5%) (Fig. 5a).
A higher percentage of binge drinkers in Baltimore City high schools reported feeling sad or hopeless (41.5%) compared to non-binge-
drinking peers (28.7%), and had higher rates of considering suicide/making a suicide plan (29.0% vs. 19.0%, respectively) (Fig. 5b).
Pg. 2/2 June 2017
Mental Health
*Cell size too small to report