Embed Size (px)
Citation preview

Please refer to important disclosures at the end of this report 1
Y/E March (` cr) 1QFY14* 1QFY13 % chg (yoy) 4QFY13* % chg (qoq) Net Sales 10,237 10,778 (5.0) 13,304 (23.1) EBITDA 1,166 786 48.3 2,000 (41.7) EBITDA Margin (%) 11.4 7.3 410bp 15.0 (364)bp Adj. PAT 632 424 49.0 1,240 (49.0)
Source: Company, Angel Research; Note * not comparable due to SPIL merger
Favorable forex and SPIL merger drives performance: For 1QFY2014, Maruti Suzuki (MSIL) reported strong results on the operating front, which was in-line with our estimates; however, net profit was slightly lower-than-expected due to higher tax rate (at 25.3% as against expectation of 21%). The quarterly results are not comparable on a yoy as well as sequential basis as 1QFY2014 and 4QFY2013 results reflect the impact of the consolidation of Suzuki Power Train India (SPIL) operations. The top-line for the quarter declined 5% yoy to `10,237cr and was in-line with our estimate of `10,284cr. The performance was aided by a strong 5.4% yoy growth in net average realization driven by a better product-mix and price increases which although were partially offset by higher discounts (up ~15% yoy). Volumes however posted a decline of 10% yoy due to demand slowdown in the domestic (down 6.8% yoy) as well as export (down 35.4% yoy) markets. On the operating front, the EBITDA margin stood at 11.4% (significant expansion of 410bp yoy), in-line with our estimate, largely led by favorable impact of forex movement and also supported by the ongoing cost reduction initiatives and re-distribution of expenses owing to the SPIL merger. Net profit surged 49% yoy to `632cr aided by strong operating performance and also due to higher other income (up 81.9% yoy). However, a higher tax-rate and increase in depreciation expense (up 41.3% yoy) due to SPIL merger restricted bottom-line growth.
Outlook and valuation: While rural sales for the company continue to grow at a robust pace (up ~19% yoy), urban sales witnessed a high single digit decline during 1QFY2014. The Management stated that the demand for diesel vehicles too has turned weak and expects average discounts to inch upwards in 2QFY2014. We revise our FY2014 volume estimates downwards to ~2% from ~7% earlier to factor in the weak demand environment that the industry is currently facing. Nonetheless, we retain our EBITDA margin estimates and expect an expansion of 150bp in FY2014, driven by favorable currency movement, easing of commodity cost pressures, ongoing cost reduction initiatives and also on account of the SPIL merger. We increase our tax-rate assumptions to 24% from 21% earlier as guided by the Management. Consequently, we revise downwards our earnings estimates by 11.3%/9.5% for FY2014/15 respectively. We expect MSIL to register a strong earnings CAGR of ~18% over FY2013-15. We maintain our Buy rating on the stock with a target price of `1,648.
Key financials (post SPIL merger) Y/E March (` cr) FY2012 FY2013E FY2014E FY2015E Net Sales 35,587 43,588 45,862 52,647 % chg (2.8) 22.5 5.2 14.8 Net Profit 1,635 2,392 2,856 3,318 % chg (28.6) 46.3 19.4 16.2 EBITDA (%) 7.1 9.7 11.2 11.1 EPS (`) 54.1 79.2 94.6 109.8 P/E (x) 25.4 17.4 14.5 12.5 P/BV (x) 2.7 2.2 2.0 1.7 RoE (%) 11.3 14.2 14.4 14.6 RoCE (%) 8.7 12.6 13.8 14.4 EV/Sales (x) 0.8 0.8 0.7 0.6 EV/EBITDA (x) 11.4 8.3 6.5 5.6 Source: Company, Angel Research; Note: CMP as of July 26, 2013
BUY CMP `1,375 Target Price `1,648
Investment Period 12 Months
Stock Info
Sector
Bloomberg Code
Shareholding Pattern (%)
Promoters
MF / Banks / Indian Fls
FII / NRIs / OCBs
Indian Public / Others
Abs. (%) 3m 1yr 3yr
Sensex 2.4 18.7 9.6
Maruti Suzuki (17.8) 24.1 15.4
Automobile
Avg. Daily Volume
Market Cap (` cr)
Beta
52 Week High / Low
41,538
0.8
1,773/1,082
74,732
Net Debt (` cr) (5,744)
Face Value (`)
BSE Sensex
Nifty
Reuters Code
MSIL@IN
5
19,748
5,886
MRTI.BO
56.2
19.5
22.1
2.2
Yaresh Kothari 022-3935 7800 Ext: 6844
Maruti Suzuki Performance Highlights
1QFY2014 Result Update | Automobile
July 27, 2013
Maruti Suzuki | 1QFY2014 Result Update
July 27, 2013
2
Exhibit 1: Quarterly financial performance
Y/E March (` cr) 1QFY14* 1QFY13 % chg (yoy) 4QFY13* % chg (qoq) FY2013* FY2012 % chg (yoy)
Net Sales 10,237 10,778 (5.0) 13,304 (23.1) 43,588 35,587 22.5
Raw-material cost 6,802 7,930 (14.2) 8,289 (17.9) 30,554 26,533 15.2
(% of Sales) 66.4 73.6 62.3 70.1 74.6 Staff cost 295 238 23.9 387 (23.8) 1,070 801 33.5
(% of Sales) 2.9 2.2 2.9 2.5 2.3 Purchase of traded goods 564 460 22.5 440 28.1 1,961 1,533 28.0
(% of Sales) 5.5 4.3 3.3 4.5 4.3 Other Expenses 1,410 1,363 3.5 2,187 (35.5) 5,774 4,207 37.2
(% of Sales) 13.8 12.6 16.4 13.2 11.8 Total Expenditure 9,071 9,992 (9.2) 11,304 (19.8) 39,358 33,074 19.0
Operating Profit 1,166 786 48.3 2,000 (41.7) 4,230 2,513 68.3
OPM (%) 11.4 7.3 15.0 9.7 7.1 Interest 44 33 33.4 73 (39.1) 190 55 243.8
Depreciation 480 340 41.3 816 (41.1) 1,861 1,138 63.5
Other Income 204 112 81.9 399 (48.8) 812 827 (1.8)
PBT (excl. Extr. Items) 846 526 61.0 1,510 (44.0) 2,991 2,146 39.4
Extr. Income/(Expense) - - - - - - -
PBT (incl. Extr. Items) 846 526 61.0 1,510 (44.0) 2,991 2,146 39.4
(% of Sales) 8.3 4.9 11.4 6.9 6.0 Provision for Taxation 214 102 110.7 270 (20.7) 599 511 17.2
(% of PBT) 25.3 19.4 17.9 20.0 23.8 Reported PAT 632 424 49.0 1,240 (49.0) 2,392 1,635 46.3
Adj PAT 632 424 49.0 1,240 (49.0) 2,392 1,635 46.3
Adj. PATM 6.2 3.9 9.3 5.5 4.6 Equity capital (cr) 151.0 144.5 151.0 151.0 144.5 Reported EPS (`) 20.9 14.7 42.6 41.0 (49.0) 79.2 56.6 39.9
Source: Company, Angel Research; Note * not comparable due to SPIL merger
Exhibit 2: 1QFY2014 – Actual vs Angel estimates
Y/E March (` cr) Actual Estimates Variation (%)
Net Sales 10,237 10,284 (0.4)
EBITDA 1,166 1,169 (0.2)
EBITDA margin (%) 11.4 11.4 2bp
Adj. PAT 632 663 (4.7)
Source: Company, Angel Research
Maruti Suzuki | 1QFY2014 Result Update
July 27, 2013
3
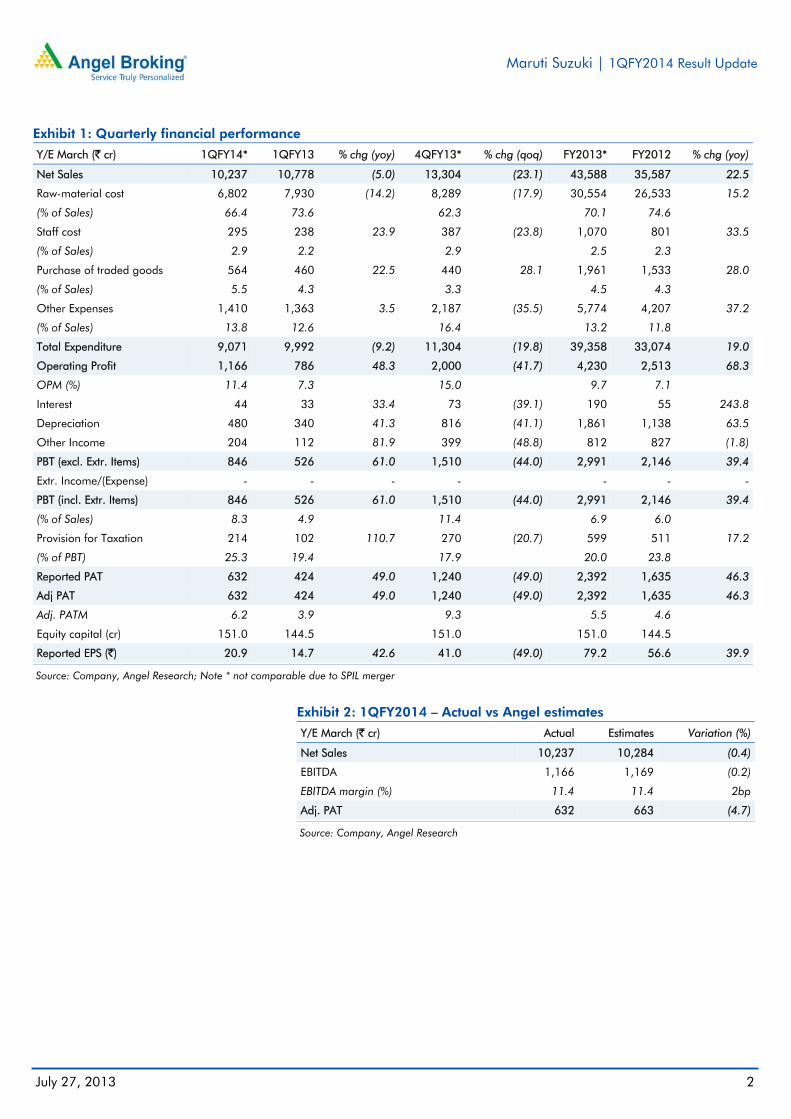
Exhibit 3: Quarterly volume performance
Volume (units) 1QFY14 1QFY13 % chg (yoy) 4QFY13 % chg (qoq) FY2013 FY2012 % chg (yoy)
A: Mini: M800, Alto, A-Star, WagonR 97,668 94,813 3.0 132,837 (26.5) 429,569 491,389 (12.6)
A: Compact: Swift, Estilo, Ritz 59,678 72,986 (18.2) 73,895 (19.2) 255,302 235,754 8.3
A: Super Compact: Dzire 49,259 46,958 4.9 55,454 (11.2) 169,571 110,132 54.0
A: Mid-Size: SX4 1,418 1,447 (2.0) 2,130 (33.4) 6,707 17,997 (62.7)
A: Executive: Kizashi 0 21 - 2 (100.0) 188 458 -
Total Passenger cars 208,023 216,225 (3.8) 264,318 (21.3) 861,337 855,730 0.7
B: Utility Vehicles: Gypsy, Grand Vitara 14,622 18,965 (22.9) 18,540 (21.1) 79,192 6,525 1,113.7
C: Vans: Omni, Eeco 22,701 28,074 (19.1) 26,013 (12.7) 110,517 144,061 (23.3)
Total Domestic 245,346 263,264 (6.8) 308,871 (20.6) 1,051,046 1,006,316 4.4
Total Exports 21,088 32,632 (35.4) 34,838 (39.5) 120,388 127,379 (5.5)
Total Volume 266,434 295,896 (10.0) 343,709 (22.5) 1,171,434 1,133,695 3.3
Source: Company, Angel Research
Top-line growth on expected line: The top-line for the quarter declined 5% yoy to `10,237cr and was in-line with our estimate of `10,284cr. The top-line performance was aided by a strong growth of 5.4% yoy in net average realization, driven by better product-mix and price increases which although were partially offset by higher discounts. Average discounts for the quarter stood at `13,426/ unit up from `11,646 in 1QFY2013 and `10,597/ unit in 4QFY2013. Volumes however posted a decline of 10% yoy due to slowdown in demand in the domestic (down 6.8% yoy) as well as export (down 35.4% yoy) markets. The sale of diesel cars as a proportion of total sales stood at 34% as against 36.3% in 4QFY2013. The export revenue for the quarter stood at `907cr registering a decline of 17.5% yoy following a 35.4% yoy decline in export volumes. Nonetheless, export realization continued its strong momentum and registered a robust growth of 27.6% yoy on the back of better product-mix and better realization on the forex front.
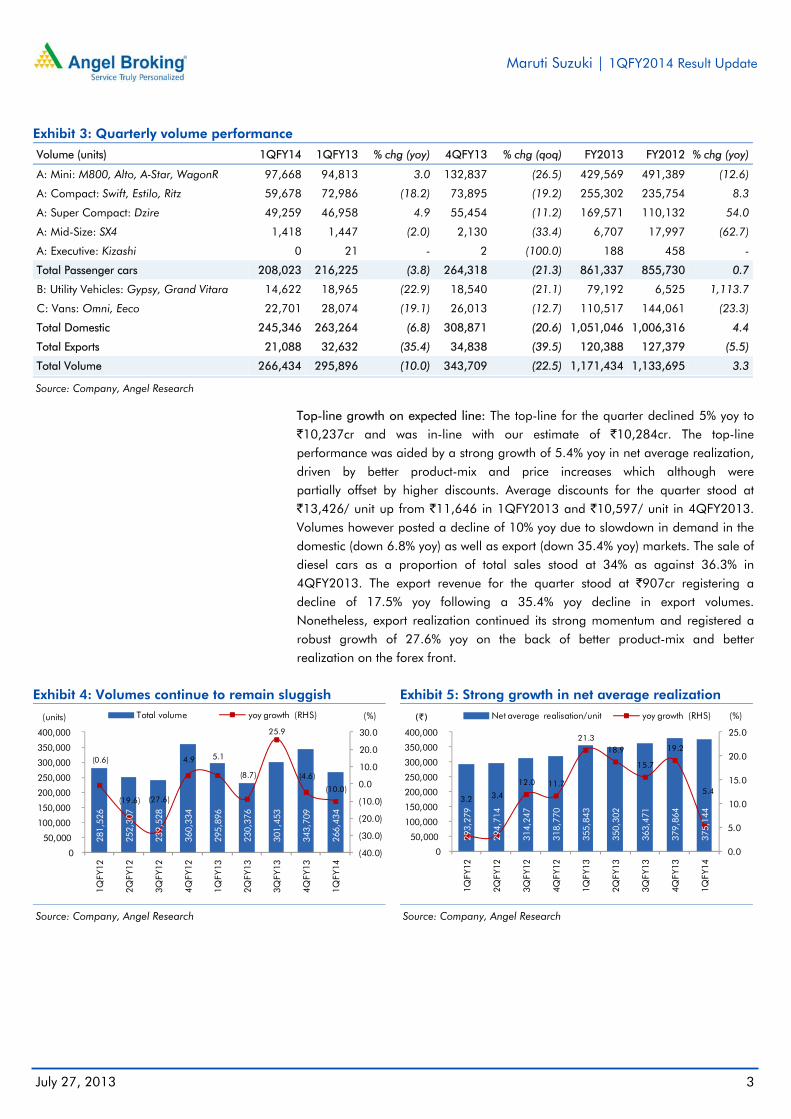
Exhibit 4: Volumes continue to remain sluggish
Source: Company, Angel Research
Exhibit 5: Strong growth in net average realization
Source: Company, Angel Research
281,
526
252,
307
239,
528
360,
334
295,
896
230,
376
301,
453
343,
709
266,
434
(0.6)
(19.6) (27.6)
4.9 5.1
(8.7)
25.9
(4.6)
(10.0)
(40.0)
(30.0)
(20.0)
(10.0)
0.0
10.0
20.0
30.0
0
50,000
100,000
150,000
200,000
250,000
300,000
350,000
400,000
1QFY
12
2QFY
12
3QFY
12
4QFY
12
1QFY
13
2QFY
13
3QFY
13
4QFY
13
1QFY
14
(%)(units) Total volume yoy growth (RHS)
293,
279
294,
714
314,
247
318,
770
355,
843
350,
302
363,
471
379,
864
375,
144
3.2 3.4
12.0 11.7
21.3 18.9
15.7
19.2
5.4
0.0
5.0
10.0
15.0
20.0
25.0
0
50,000
100,000
150,000
200,000
250,000
300,000
350,000
400,000
1QFY
12
2QFY
12
3QFY
12
4QFY
12
1QFY
13
2QFY
13
3QFY
13
4QFY
13
1QFY
14(%)(`) Net average realisation/unit yoy growth (RHS)

Maruti Suzuki | 1QFY2014 Result Update
July 27, 2013
4
Exhibit 6: Net sales in-line with estimates
Source: Company, Angel Research
Exhibit 7: Domestic passenger car market share trend
Source: Company, SIAM, Angel Research
Exhibit 8: Quarterly revenue and realization performance
3QFY12 4QFY12 1QFY13 2QFY13 3QFY13 4QFY13* 1QFY14*
Domestic revenue (` cr) 6,589 10,242 9,429 6,612 9,637 11,526 9,088
Change yoy (%) (21.9) 14.7 27.6 1.0 46.3 12.5 (3.6)
Domestic realization (`) 311,096 318,656 358,165 314,921 358,310 373,175 370,420
Change yoy (%) 10.4 11.5 21.5 7.0 15.2 17.1 3.4
Export revenue (` cr) 938 1,244 1,100 824 1,320 1,530 907
Change yoy (%) 11.8 43.0 26.9 (7.3) 40.7 23.0 (17.5)
Export realization (`) 338,323 319,712 337,092 403,486 406,204 439,176 430,102
Change yoy (%) 25.7 13.7 19.9 35.7 20.1 37.4 27.6
Source: Company, Angel Research; Note * not comparable due to SPIL merger
Favorable currency impact and SPIL merger boost margins: On the operating front, EBITDA margins stood at 11.4% (significant expansion of 410bp yoy), in-line with our estimates, largely led by favorable impact of forex movement and also supported by the ongoing cost reduction initiatives and re-distribution of expenses owing to the SPIL merger. For 1QFY2014, the reported raw-material expense as a percentage of sales stood at 71.9% as against 77.8% in 1QFY2013; it benefitted from the SPIL merger to the tune of 3.5%. The Management stated that the company’s average Yen/USD rate was ~94 during the quarter. Going ahead, 52% of the balance Yen/USD (direct - 80% hedged and indirect - 30% hedged) exposure for FY2014 has been hedged at close to the current market rate. However, USD/INR exposure remains unhedged which along with higher level of discounts could pose a risk to margins. The operating profit for the quarter surged 48.3% yoy to `1,166cr.
8,45
4
7,67
4
7,73
2
11,7
27
10,7
78
8,30
5
11,2
00
13,3
04
10,2
37
2.7
(16.1) (18.6)
17.2
27.5
8.2
44.9
13.4
(5.0)
(30.0)
(20.0)
(10.0)
0.0
10.0
20.0
30.0
40.0
50.0
0
2,000
4,000
6,000
8,000
10,000
12,000
14,000
1QFY
12
2QFY
12
3QFY
12
4QFY
12
1QFY
13
2QFY
13
3QFY
13
4QFY
13
1QFY
14
(%)(` cr) Net sales yoy change (RHS)
44.7 40.9 38.7
43.6 44.6
37.1
47.3 51.5
47.9
0.0
10.0
20.0
30.0
40.0
50.0
60.0
1QFY
12
2QFY
12
3QFY
12
4QFY
12
1QFY
13
2QFY
13
3QFY
13
4QFY
13
1QFY
14
(%)
Maruti Suzuki | 1QFY2014 Result Update
July 27, 2013
5
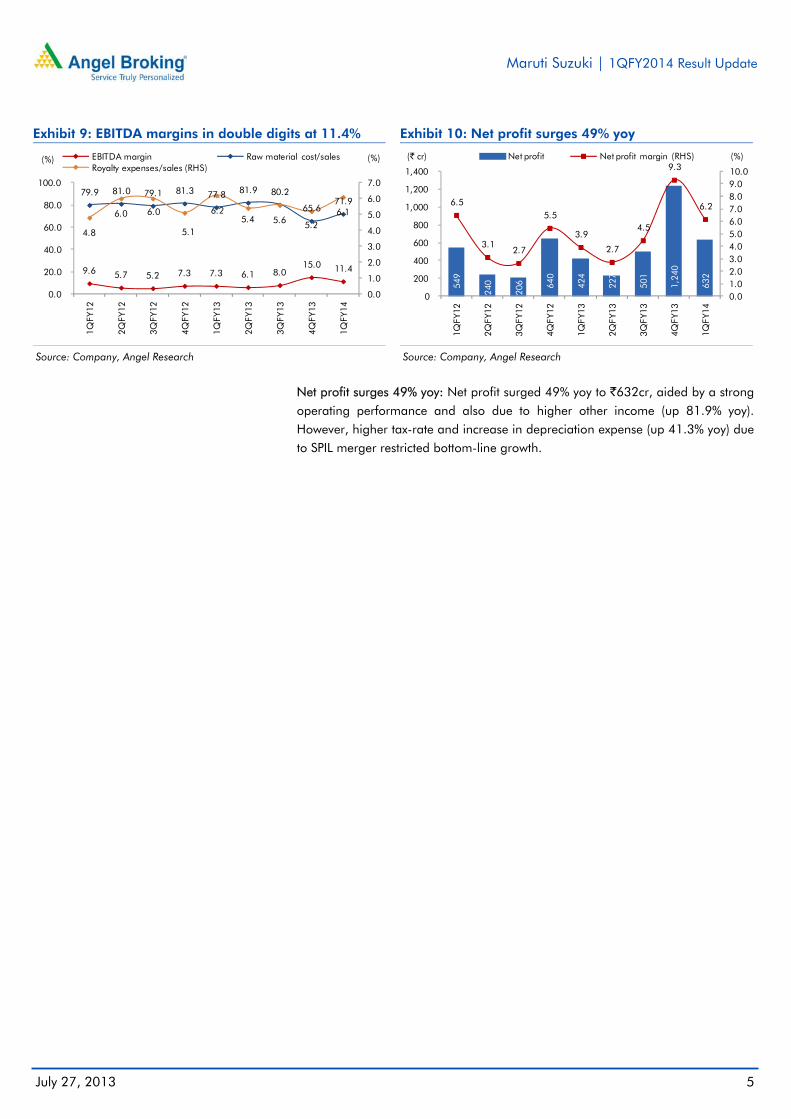
Exhibit 9: EBITDA margins in double digits at 11.4%
Source: Company, Angel Research
Exhibit 10: Net profit surges 49% yoy
Source: Company, Angel Research
Net profit surges 49% yoy: Net profit surged 49% yoy to `632cr, aided by a strong operating performance and also due to higher other income (up 81.9% yoy). However, higher tax-rate and increase in depreciation expense (up 41.3% yoy) due to SPIL merger restricted bottom-line growth.
9.6 5.7 5.2 7.3 7.3 6.1 8.0 15.0 11.4
79.9 81.0 79.1 81.3 77.8 81.9 80.2
65.6 71.9
4.8
6.0 6.0
5.1
6.2 5.4 5.6 5.2
6.1
0.0
1.0
2.0
3.0
4.0
5.0
6.0
7.0
0.0
20.0
40.0
60.0
80.0
100.0
1QFY
12
2QFY
12
3QFY
12
4QFY
12
1QFY
13
2QFY
13
3QFY
13
4QFY
13
1QFY
14
(%)(%) EBITDA margin Raw material cost/salesRoyalty expenses/sales (RHS)
549
240
206 64
0
424
227
501
1,24
0
632
6.5
3.1 2.7
5.5
3.9
2.7
4.5
9.3
6.2
0.0 1.0 2.0 3.0 4.0 5.0 6.0 7.0 8.0 9.0 10.0
0
200
400
600
800
1,000
1,200
1,400
1QFY
12
2QFY
12
3QFY
12
4QFY
12
1QFY
13
2QFY
13
3QFY
13
4QFY
13
1QFY
14
(%)(` cr) Net profit Net profit margin (RHS)

Maruti Suzuki | 1QFY2014 Result Update
July 27, 2013
6
Conference call – Key highlights
According to the Management, the current demand for passenger vehicles remains muted and is not witnessing any material uptick. The retail sales for the company in the month of April, May and June stood at 67,000, 80,000 and 90,000 respectively. Going ahead, the company intends to start building up inventory ahead of the festive season.
The Management has guided for a 0-5% volume growth for FY2014 in the domestic markets. However, it expects volumes to decline by 0-5% in the export markets.
Rural sales now account for ~30% of overall volumes for MSIL and grew robustly by 19% yoy during the quarter. Urban sales however, declined in high single digits. MSIL expects the momentum in rural sales to continue in 2HFY2014 on the back of good monsoons.
Export demand has deteriorated sharply due to slowdown in Europe and specific issues in some countries.
The average discounts for MSIL stood at `13,426/vehicle during the quarter as against `10,600/vehicle in 4QFY2013 and `11,646 in 1QFY2013. Going ahead, MSIL expects average discounts to inch upwards as discounts are now being offered even on diesel models.
Average JPY realization for 1QFY2014 stood at `94/USD and is expected to be around `98/USD during 2QFY2014. The company has hedged around 52% of USD/JPY exposure for the remaining 9MFY2014. This largely covers the company’s direct imports and 2QFY2014 imports for the vendors.
The royalty expenses as a percentage of sales stood at 6.1% as against 6.2% in 1QFY2013 and 4.8% in 4QFY2013.
The import content for MSIL has come down to 19.6% (excluding royalty) from 26% in FY2012 on account of Yen depreciation and the ongoing localization initiatives. The Management expects to improve localization by 8-10% over the next 2-3 years.
MSIL’s third plant at Manesar is expected to commission from September 2013. The new diesel engine capacity is also expected to come on stream around the same time.
According to the Management, tax rate going forward, is expected to remain in the range of 24-25%.
The capital expenditure planned for FY2014 stands at `4,000cr. However, this can be scaled down or postponed depending upon the demand scenario.
Maruti Suzuki | 1QFY2014 Result Update
July 27, 2013
7
Investment arguments
Per capita car penetration near inflexion point: In FY2009, car penetration in India was estimated at around 12 vehicles/1,000 people compared to around 21 vehicles/1,000 people in China. Moreover, India’s PPP-based per capita is estimated to approach US$5,000 over the next four to five years, which is expected to be the inflexion point for the country’s car demand. Further, MSIL has a sizeable competitive advantage over new foreign entrants due to its widespread distribution network (nearly 3,000 and 1,000 service and sales outlets, respectively), which is not easy to replicate.
Suzuki focusing to make Maruti a a small car manufacturing hub: Suzuki Japan is focusing to make MSIL a global small car manufacturing hub to cater to the increasing global demand for small cars due to rising fuel prices and stricter emission standards. Thus, we believe there is a huge potential for the company to increase its market share in the export market. Moreover, R&D capabilities, so far largely housed at Suzuki Japan, are progressively moving to MSIL. The company is aiming to achieve full model change capabilities over the next couple of years, which will enable it to launch new models and variants at a much faster pace. This is expected to reduce its royalty payment in the medium-term (2-3 years).
Merger with SPIL to be positive in the long run: MSIL has merged its associate company, SPIL with itself. SPIL, a 70:30 JV between Suzuki Motor Corporation (SMC), Japan, and MSIL, manufactures and supplies diesel engines and transmission components for vehicles. SPIL currently supplies ~90% of its production to MSIL. We believe the merger of SPIL with MSIL is positive for MSIL given that MSIL itself is setting up a new diesel engine facility (capacity of 300,000 units by FY2014) in Gurgaon. Further, with increasing trend of dieselization, the integration of SPIL will result in better control over diesel engine sourcing, flexibility in production planning, and managing fluctuations in market demand. Additionally, single management control of diesel engine operations will result in better sourcing, localization and cost-reduction.
Maruti Suzuki | 1QFY2014 Result Update
July 27, 2013
8
Outlook and valuation
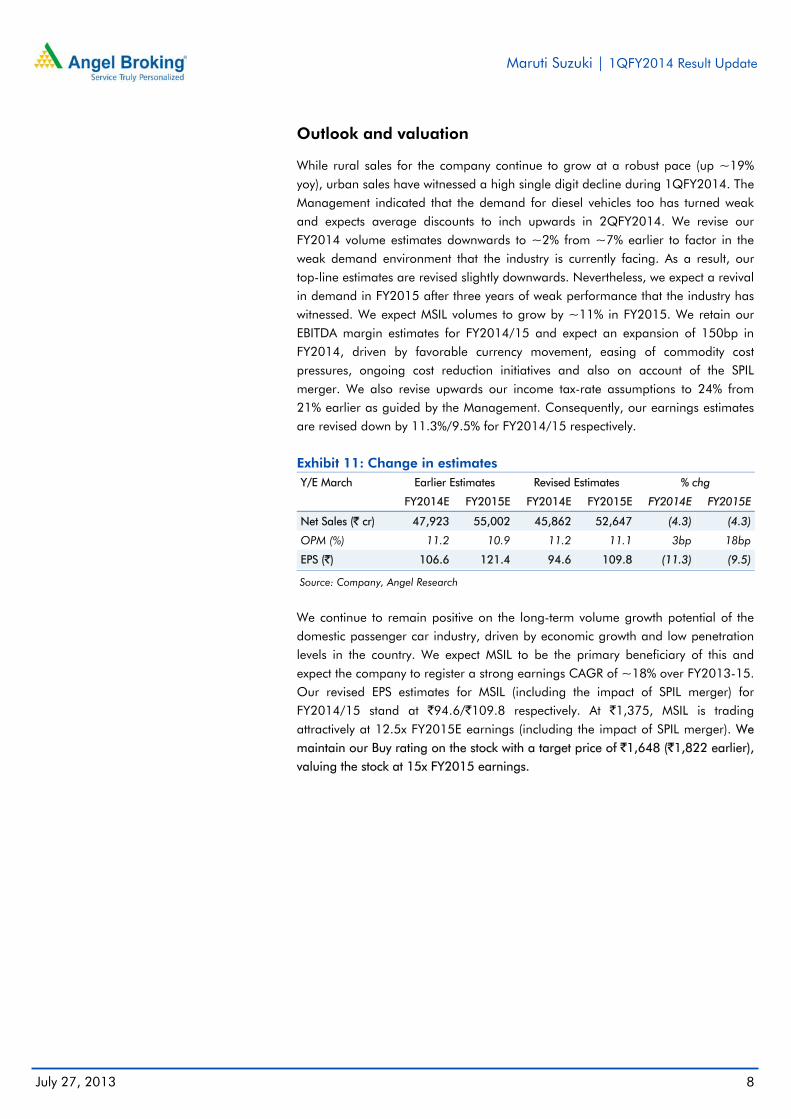
While rural sales for the company continue to grow at a robust pace (up ~19% yoy), urban sales have witnessed a high single digit decline during 1QFY2014. The Management indicated that the demand for diesel vehicles too has turned weak and expects average discounts to inch upwards in 2QFY2014. We revise our FY2014 volume estimates downwards to ~2% from ~7% earlier to factor in the weak demand environment that the industry is currently facing. As a result, our top-line estimates are revised slightly downwards. Nevertheless, we expect a revival in demand in FY2015 after three years of weak performance that the industry has witnessed. We expect MSIL volumes to grow by ~11% in FY2015. We retain our EBITDA margin estimates for FY2014/15 and expect an expansion of 150bp in FY2014, driven by favorable currency movement, easing of commodity cost pressures, ongoing cost reduction initiatives and also on account of the SPIL merger. We also revise upwards our income tax-rate assumptions to 24% from 21% earlier as guided by the Management. Consequently, our earnings estimates are revised down by 11.3%/9.5% for FY2014/15 respectively.
Exhibit 11: Change in estimates Y/E March Earlier Estimates Revised Estimates % chg
FY2014E FY2015E FY2014E FY2015E FY2014E FY2015E
Net Sales (` cr) 47,923 55,002 45,862 52,647 (4.3) (4.3)
OPM (%) 11.2 10.9 11.2 11.1 3bp 18bp
EPS (`) 106.6 121.4 94.6 109.8 (11.3) (9.5)
Source: Company, Angel Research
We continue to remain positive on the long-term volume growth potential of the domestic passenger car industry, driven by economic growth and low penetration levels in the country. We expect MSIL to be the primary beneficiary of this and expect the company to register a strong earnings CAGR of ~18% over FY2013-15. Our revised EPS estimates for MSIL (including the impact of SPIL merger) for FY2014/15 stand at `94.6/`109.8 respectively. At `1,375, MSIL is trading attractively at 12.5x FY2015E earnings (including the impact of SPIL merger). We maintain our Buy rating on the stock with a target price of `1,648 (`1,822 earlier), valuing the stock at 15x FY2015 earnings.
Maruti Suzuki | 1QFY2014 Result Update
July 27, 2013
9
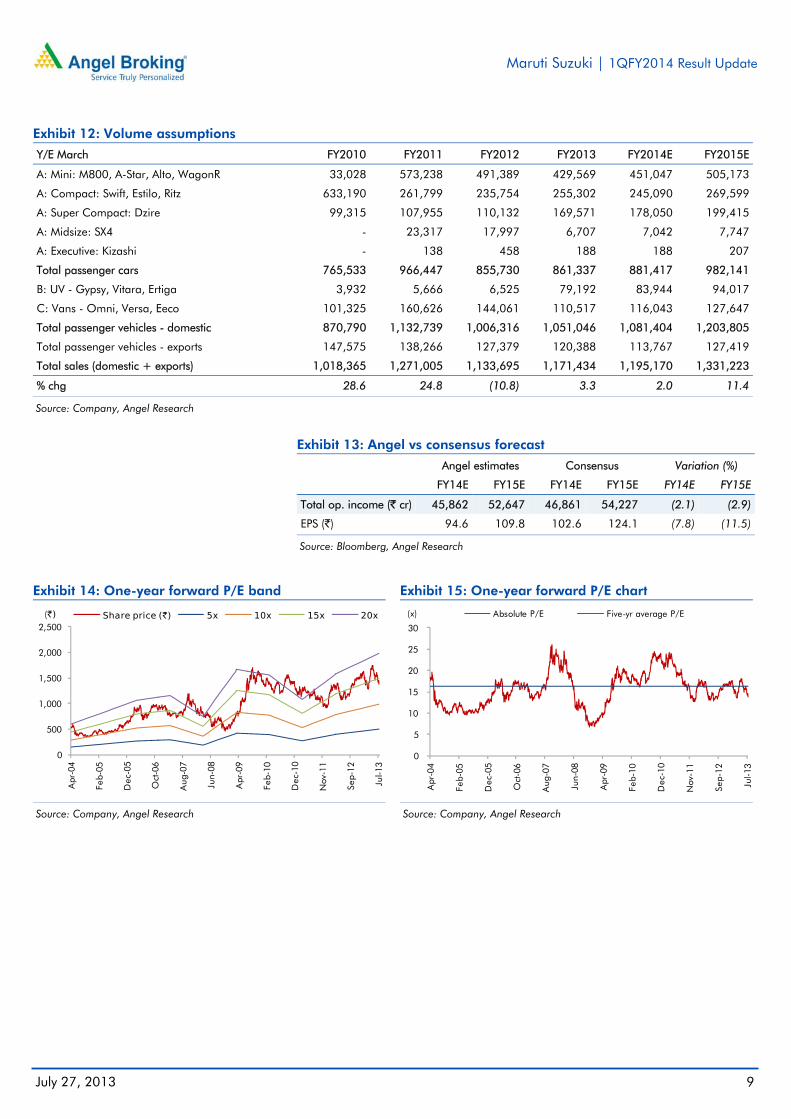
Exhibit 12: Volume assumptions
Y/E March FY2010 FY2011 FY2012 FY2013 FY2014E FY2015E
A: Mini: M800, A-Star, Alto, WagonR 33,028 573,238 491,389 429,569 451,047 505,173
A: Compact: Swift, Estilo, Ritz 633,190 261,799 235,754 255,302 245,090 269,599
A: Super Compact: Dzire 99,315 107,955 110,132 169,571 178,050 199,415
A: Midsize: SX4 - 23,317 17,997 6,707 7,042 7,747
A: Executive: Kizashi - 138 458 188 188 207
Total passenger cars 765,533 966,447 855,730 861,337 881,417 982,141
B: UV - Gypsy, Vitara, Ertiga 3,932 5,666 6,525 79,192 83,944 94,017
C: Vans - Omni, Versa, Eeco 101,325 160,626 144,061 110,517 116,043 127,647
Total passenger vehicles - domestic 870,790 1,132,739 1,006,316 1,051,046 1,081,404 1,203,805
Total passenger vehicles - exports 147,575 138,266 127,379 120,388 113,767 127,419
Total sales (domestic + exports) 1,018,365 1,271,005 1,133,695 1,171,434 1,195,170 1,331,223
% chg 28.6 24.8 (10.8) 3.3 2.0 11.4
Source: Company, Angel Research
Exhibit 13: Angel vs consensus forecast
Angel estimates Consensus Variation (%)
FY14E FY15E FY14E FY15E FY14E FY15E
Total op. income (` cr) 45,862 52,647 46,861 54,227 (2.1) (2.9)
EPS (`) 94.6 109.8 102.6 124.1 (7.8) (11.5)
Source: Bloomberg, Angel Research
Exhibit 14: One-year forward P/E band
Source: Company, Angel Research
Exhibit 15: One-year forward P/E chart
Source: Company, Angel Research
0
500
1,000
1,500
2,000
2,500
Apr
-04
Feb-
05
Dec
-05
Oct
-06
Aug
-07
Jun-
08
Apr
-09
Feb-
10
Dec
-10
Nov
-11
Sep-
12
Jul-1
3
(`) Share price (`) 5x 10x 15x 20x
0
5
10
15
20
25
30
Apr
-04
Feb-
05
Dec
-05
Oct
-06
Aug
-07
Jun-
08
Apr
-09
Feb-
10
Dec
-10
Nov
-11
Sep-
12
Jul-1
3
(x) Absolute P/E Five-yr average P/E

Maruti Suzuki | 1QFY2014 Result Update
July 27, 2013
10
Exhibit 16: One-year forward EV/EBITDA band
Source: Company, Angel Research
Exhibit 17: Premium/Discount to Sensex P/E
Source: Company, Angel Research
Exhibit 18: Automobile - Recommendation summary
Company Reco. CMP (`)
Tgt. price (`)
Upside (%)
P/E (x) EV/EBITDA (x) RoE (%) FY13E-15E EPS
FY14E FY15E FY14E FY15E FY14E FY15E CAGR (%)
Ashok Leyland Buy 15 22 54.3 37.9 7.8 6.0 3.7 2.3 11.0 74.4
Bajaj Auto Neutral 2,027 - - 17.0 14.5 11.9 9.8 38.9 36.5 15.4
Hero MotoCorp Accumulate 1,865 2,048 9.8 16.8 12.7 8.6 7.4 40.1 42.1 17.5
Maruti Suzuki Buy 1,375 1,648 19.8 14.5 12.5 6.5 5.6 14.4 14.6 17.8
Mah. & Mah. Buy 894 1,103 23.4 14.1 12.6 7.5 6.2 23.2 21.8 13.8
Tata Motors Buy 290 347 19.8 8.0 7.0 3.9 3.3 24.6 23.2 13.8
TVS Motor Accumulate 31 35 11.0 6.3 5.4 2.1 1.5 18.1 18.5 15.3
Source: Company, Angel Research
0
10,000
20,000
30,000
40,000
50,000
60,000
70,000
Apr
-04
Feb-
05
Dec
-05
Oct
-06
Aug
-07
Jun-
08
Apr
-09
Feb-
10
Dec
-10
Nov
-11
Sep-
12
Jul-1
3
(`cr) EV (` cr) 6x 8x 10x 12x
(60)
(40)
(20)
0
20
40
60
Apr
-04
Feb-
05
Dec
-05
Oct
-06
Aug
-07
Jun-
08
Apr
-09
Feb-
10
Dec
-10
Nov
-11
Sep-
12
Jul-1
3
(%) Absolute premium Five-yr average premium
Maruti Suzuki | 1QFY2014 Result Update
July 27, 2013
11
Company background
Maruti Suzuki (MSIL), a subsidiary of Suzuki Motor Corporation, Japan (which holds a 54.2% stake), is the largest passenger car (PC) company in India, accounting for ~45% of the domestic passenger car market. MSIL derives ~75% of its overall sales from the small car segment and has a dominant position in the segment with a market share of ~50%, led by popular models like Alto, Wagon R and Swift. The company operates from two facilities in India (Gurgaon and Manesar) and is in the process of expanding its manufacturing capacity to 1.9mn units (currently 1.65mn units) by FY2014. Also, MSIL has steadily increased its presence internationally and exports now account for ~11% of its overall sales volume.
Maruti Suzuki | 1QFY2014 Result Update
July 27, 2013
12
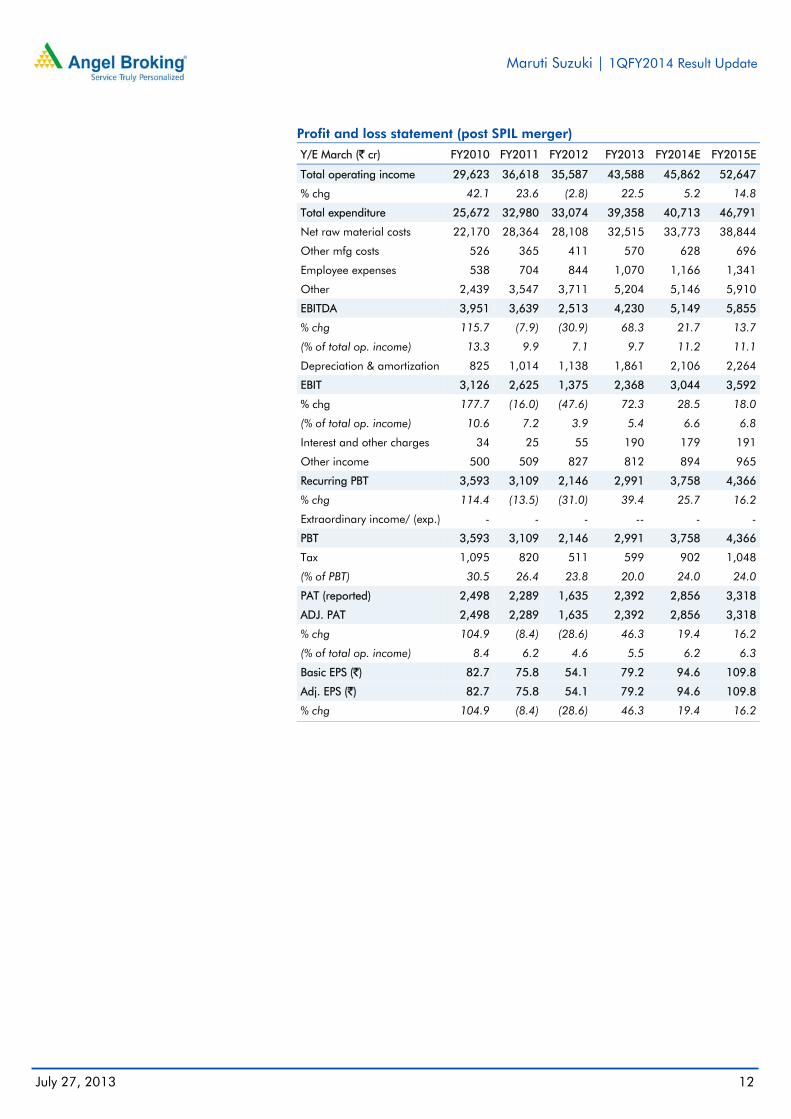
Profit and loss statement (post SPIL merger)
Y/E March (` cr) FY2010 FY2011 FY2012 FY2013 FY2014E FY2015E
Total operating income 29,623 36,618 35,587 43,588 45,862 52,647
% chg 42.1 23.6 (2.8) 22.5 5.2 14.8
Total expenditure 25,672 32,980 33,074 39,358 40,713 46,791
Net raw material costs 22,170 28,364 28,108 32,515 33,773 38,844
Other mfg costs 526 365 411 570 628 696
Employee expenses 538 704 844 1,070 1,166 1,341
Other 2,439 3,547 3,711 5,204 5,146 5,910
EBITDA 3,951 3,639 2,513 4,230 5,149 5,855
% chg 115.7 (7.9) (30.9) 68.3 21.7 13.7
(% of total op. income) 13.3 9.9 7.1 9.7 11.2 11.1
Depreciation & amortization 825 1,014 1,138 1,861 2,106 2,264
EBIT 3,126 2,625 1,375 2,368 3,044 3,592
% chg 177.7 (16.0) (47.6) 72.3 28.5 18.0
(% of total op. income) 10.6 7.2 3.9 5.4 6.6 6.8
Interest and other charges 34 25 55 190 179 191
Other income 500 509 827 812 894 965
Recurring PBT 3,593 3,109 2,146 2,991 3,758 4,366
% chg 114.4 (13.5) (31.0) 39.4 25.7 16.2
Extraordinary income/ (exp.) - - - -- - -
PBT 3,593 3,109 2,146 2,991 3,758 4,366
Tax 1,095 820 511 599 902 1,048
(% of PBT) 30.5 26.4 23.8 20.0 24.0 24.0
PAT (reported) 2,498 2,289 1,635 2,392 2,856 3,318
ADJ. PAT 2,498 2,289 1,635 2,392 2,856 3,318
% chg 104.9 (8.4) (28.6) 46.3 19.4 16.2
(% of total op. income) 8.4 6.2 4.6 5.5 6.2 6.3
Basic EPS (`) 82.7 75.8 54.1 79.2 94.6 109.8
Adj. EPS (`) 82.7 75.8 54.1 79.2 94.6 109.8
% chg 104.9 (8.4) (28.6) 46.3 19.4 16.2

Maruti Suzuki | 1QFY2014 Result Update
July 27, 2013
13
Balance sheet statement (post SPIL merger)
Y/E March (` cr) FY2010 FY2011 FY2012 FY2013E FY2014E FY2015E
SOURCES OF FUNDS Equity share capital 145 145 145 151 151 151
Reserves & surplus 11,691 13,723 15,043 18,428 21,004 24,041
Shareholders’ Funds 11,835 13,868 15,187 18,579 21,155 24,192
Total loans 821 309 1,237 1,389 1,589 1,589
Deferred tax liability 137 164 302 409 409 409
Other long term liabilities - 96 97 104 104 104
Long term provisions - 140 168 226 226 226
Total Liabilities 12,794 14,577 16,992 20,706 23,482 26,519
APPLICATION OF FUNDS Gross block 10,407 11,738 14,735 19,600 23,373 26,928
Less: Acc. depreciation 5,382 6,208 7,214 9,075 11,181 13,444
Net Block 5,025 5,529 7,521 10,525 12,192 13,483
Capital work-in-progress 388 863 611 1,216 943 889
Investments 7,177 5,107 6,147 7,078 7,984 9,017
Long term loans and adv. - 1,255 1,672 1,279 1,279 1,279
Other noncurrent assets - 47 26 895 895 895
Current assets 3,772 5,625 6,325 5,695 6,114 8,078
Cash 98 2,509 2,436 775 1,823 1,540
Loans & advances 1,656 684 778 1,115 877 1,431
Other 2,019 2,433 3,111 3,805 3,414 5,107
Current liabilities 3,568 3,849 5,311 5,982 5,925 7,121
Net current assets 205 1,776 1,014 (287) 189 957
Total Assets 12,794 14,577 16,992 20,706 23,482 26,519
Maruti Suzuki | 1QFY2014 Result Update
July 27, 2013
14
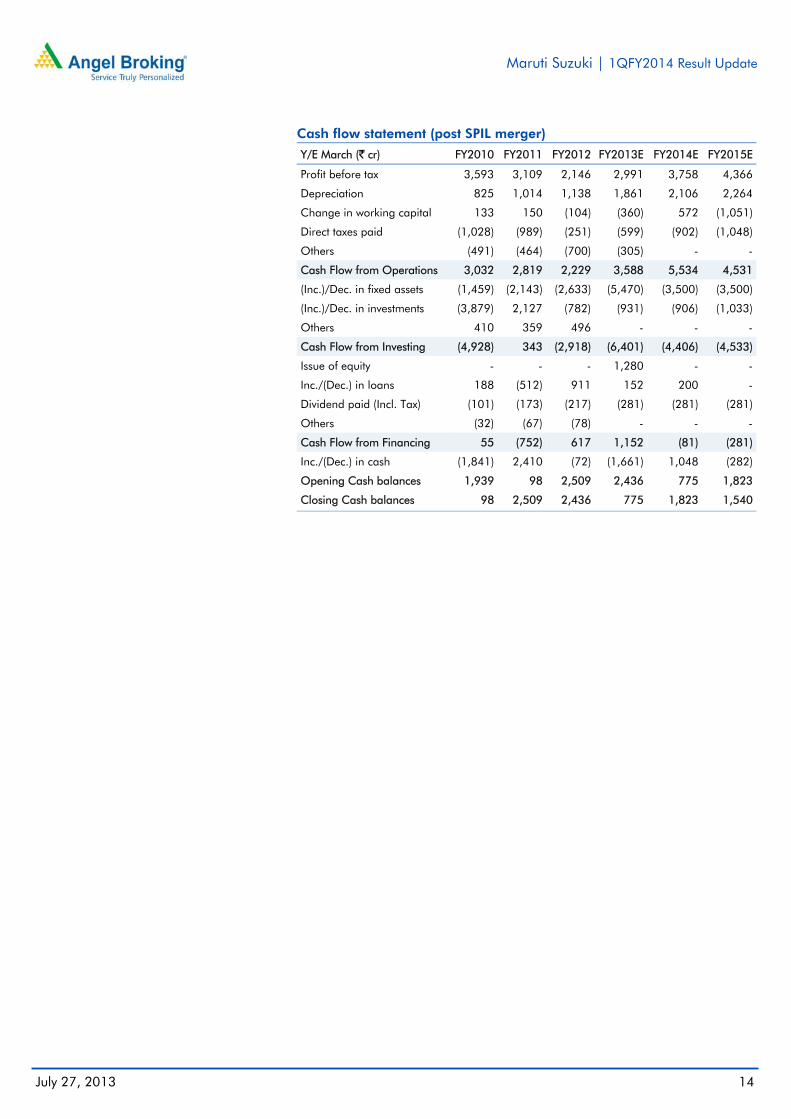
Cash flow statement (post SPIL merger)
Y/E March (` cr) FY2010 FY2011 FY2012 FY2013E FY2014E FY2015E
Profit before tax 3,593 3,109 2,146 2,991 3,758 4,366
Depreciation 825 1,014 1,138 1,861 2,106 2,264
Change in working capital 133 150 (104) (360) 572 (1,051)
Direct taxes paid (1,028) (989) (251) (599) (902) (1,048)
Others (491) (464) (700) (305) - -
Cash Flow from Operations 3,032 2,819 2,229 3,588 5,534 4,531
(Inc.)/Dec. in fixed assets (1,459) (2,143) (2,633) (5,470) (3,500) (3,500)
(Inc.)/Dec. in investments (3,879) 2,127 (782) (931) (906) (1,033)
Others 410 359 496 - - -
Cash Flow from Investing (4,928) 343 (2,918) (6,401) (4,406) (4,533)
Issue of equity - - - 1,280 - -
Inc./(Dec.) in loans 188 (512) 911 152 200 -
Dividend paid (Incl. Tax) (101) (173) (217) (281) (281) (281)
Others (32) (67) (78) - - -
Cash Flow from Financing 55 (752) 617 1,152 (81) (281)
Inc./(Dec.) in cash (1,841) 2,410 (72) (1,661) 1,048 (282)
Opening Cash balances 1,939 98 2,509 2,436 775 1,823
Closing Cash balances 98 2,509 2,436 775 1,823 1,540
Maruti Suzuki | 1QFY2014 Result Update
July 27, 2013
15
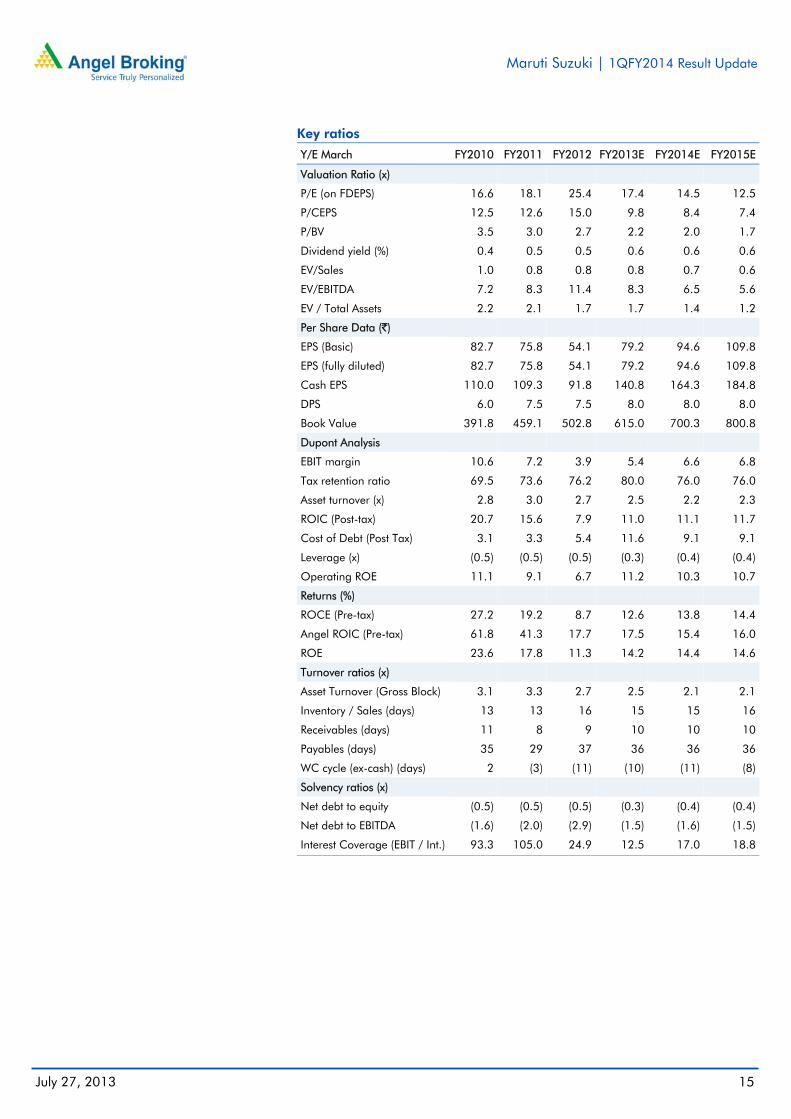
Key ratios
Y/E March FY2010 FY2011 FY2012 FY2013E FY2014E FY2015E
Valuation Ratio (x) P/E (on FDEPS) 16.6 18.1 25.4 17.4 14.5 12.5
P/CEPS 12.5 12.6 15.0 9.8 8.4 7.4
P/BV 3.5 3.0 2.7 2.2 2.0 1.7
Dividend yield (%) 0.4 0.5 0.5 0.6 0.6 0.6
EV/Sales 1.0 0.8 0.8 0.8 0.7 0.6
EV/EBITDA 7.2 8.3 11.4 8.3 6.5 5.6
EV / Total Assets 2.2 2.1 1.7 1.7 1.4 1.2
Per Share Data (`) EPS (Basic) 82.7 75.8 54.1 79.2 94.6 109.8
EPS (fully diluted) 82.7 75.8 54.1 79.2 94.6 109.8
Cash EPS 110.0 109.3 91.8 140.8 164.3 184.8
DPS 6.0 7.5 7.5 8.0 8.0 8.0
Book Value 391.8 459.1 502.8 615.0 700.3 800.8
Dupont Analysis EBIT margin 10.6 7.2 3.9 5.4 6.6 6.8
Tax retention ratio 69.5 73.6 76.2 80.0 76.0 76.0
Asset turnover (x) 2.8 3.0 2.7 2.5 2.2 2.3
ROIC (Post-tax) 20.7 15.6 7.9 11.0 11.1 11.7
Cost of Debt (Post Tax) 3.1 3.3 5.4 11.6 9.1 9.1
Leverage (x) (0.5) (0.5) (0.5) (0.3) (0.4) (0.4)
Operating ROE 11.1 9.1 6.7 11.2 10.3 10.7
Returns (%) ROCE (Pre-tax) 27.2 19.2 8.7 12.6 13.8 14.4
Angel ROIC (Pre-tax) 61.8 41.3 17.7 17.5 15.4 16.0
ROE 23.6 17.8 11.3 14.2 14.4 14.6
Turnover ratios (x) Asset Turnover (Gross Block) 3.1 3.3 2.7 2.5 2.1 2.1
Inventory / Sales (days) 13 13 16 15 15 16
Receivables (days) 11 8 9 10 10 10
Payables (days) 35 29 37 36 36 36
WC cycle (ex-cash) (days) 2 (3) (11) (10) (11) (8)
Solvency ratios (x) Net debt to equity (0.5) (0.5) (0.5) (0.3) (0.4) (0.4)
Net debt to EBITDA (1.6) (2.0) (2.9) (1.5) (1.6) (1.5)
Interest Coverage (EBIT / Int.) 93.3 105.0 24.9 12.5 17.0 18.8
Maruti Suzuki | 1QFY2014 Result Update
July 27, 2013
16
Research Team Tel: 022 - 39357800 E-mail: [email protected] Website: www.angelbroking.com DISCLAIMER This document is solely for the personal information of the recipient, and must not be singularly used as the basis of any investment decision. Nothing in this document should be construed as investment or financial advice. Each recipient of this document should make such investigations as they deem necessary to arrive at an independent evaluation of an investment in the securities of the companies referred to in this document (including the merits and risks involved), and should consult their own advisors to determine the merits and risks of such an investment.
Angel Broking Pvt. Limited, its affiliates, directors, its proprietary trading and investment businesses may, from time to time, make investment decisions that are inconsistent with or contradictory to the recommendations expressed herein. The views contained in this document are those of the analyst, and the company may or may not subscribe to all the views expressed within.
Reports based on technical and derivative analysis center on studying charts of a stock's price movement, outstanding positions and trading volume, as opposed to focusing on a company's fundamentals and, as such, may not match with a report on a company's fundamentals.
The information in this document has been printed on the basis of publicly available information, internal data and other reliable sources believed to be true, but we do not represent that it is accurate or complete and it should not be relied on as such, as this document is for general guidance only. Angel Broking Pvt. Limited or any of its affiliates/ group companies shall not be in any way responsible for any loss or damage that may arise to any person from any inadvertent error in the information contained in this report. Angel Broking Pvt. Limited has not independently verified all the information contained within this document. Accordingly, we cannot testify, nor make any representation or warranty, express or implied, to the accuracy, contents or data contained within this document. While Angel Broking Pvt. Limited endeavours to update on a reasonable basis the information discussed in this material, there may be regulatory, compliance, or other reasons that prevent us from doing so. This document is being supplied to you solely for your information, and its contents, information or data may not be reproduced, redistributed or passed on, directly or indirectly.
Angel Broking Pvt. Limited and its affiliates may seek to provide or have engaged in providing corporate finance, investment banking or other advisory services in a merger or specific transaction to the companies referred to in this report, as on the date of this report or in the past.
Neither Angel Broking Pvt. Limited, nor its directors, employees or affiliates shall be liable for any loss or damage that may arise from or in connection with the use of this information.
Note: Please refer to the important `Stock Holding Disclosure' report on the Angel website (Research Section). Also, please refer to the latest update on respective stocks for the disclosure status in respect of those stocks. Angel Broking Pvt. Limited and its affiliates may have investment positions in the stocks recommended in this report.
Disclosure of Interest Statement Maruti Suzuki
1. Analyst ownership of the stock No
2. Angel and its Group companies ownership of the stock No
3. Angel and its Group companies' Directors ownership of the stock No
4. Broking relationship with company covered No
Ratings (Returns): Buy (> 15%) Accumulate (5% to 15%) Neutral (-5 to 5%) Reduce (-5% to -15%) Sell (< -15%)
Note: We have not considered any Exposure below ` 1 lakh for Angel, its Group companies and Directors