Embed Size (px)
Citation preview
Page 1
The Power of Marketing Metrics: Demonstrating Marketing’s Value to
the Organization
Laura Patterson
President & Author
Improve Your Probability for Success ™ | www.visionedgemarketing.com | ©1999-2010 VisionEdge Marketing. VEM Proprietary. Not for reproduction or redistribution without written permission. 2
Founded in 1999 and headquartered in Austin, TX, VisionEdge Marketing, Inc. serves more than 100 customers, and counting.
VisionEdge Marketing, Inc. is a data-drivenand metrics-focused marketing firm
that specializes in improving marketing performance and creating competitive advantage designed to attract, secure and retain profitable customers.
Services Include:
Marketing performance management
Marketing and sales alignment
Product and strategic marketing
Pipeline re-engineering
Professional development
About VisionEdge Marketing – Experienced Practitioners
Improve Your Probability for Success ™ | www.visionedgemarketing.com | ©1999-2010 VisionEdge Marketing. VEM Proprietary. Not for reproduction or redistribution without written permission. 3
Session Objectives
1. Identify best practices in
marketing measurement,
accountability and analytics
2. Clarify the value of
measuring marketing
3. Create measurable
marketing objectives
4. Establish performance
targets
5. Formulate a set of marketing
measures that will serve as
the foundation for your
dashboard
“Need the math behind the
creativity,”
John Seifert, Chairman-
CEO of Ogilvy & Mather
North America
Page 2
Improve Your Probability for Success ™ | www.visionedgemarketing.com | ©1999-2010 VisionEdge Marketing. VEM Proprietary. Not for reproduction or redistribution without written permission. 4
Why Companies Invest in Marketing
Understand the market and customers
Develop and execute a strategy to create
consideration and preference that enables the
organization to
Acquire more of something
Acquire it faster
Acquire it cheaper
Otherwise, might as well just put more feet on the
street
Need to demonstrate we are “getting the job
done”Improve Your Probability for Success ™ | www.visionedgemarketing.com | ©1999-2010 VisionEdge Marketing. VEM Proprietary. Not for reproduction or redistribution without written permission. 5
3 Things Marketing is Expected to Produce
1. Find Profitable Members
The process of acquisition
New customer acquisition – net new
business
2. Keep Profitable Members
The process of retention
3. Grow Profitable Members
The process of increasing the value of
your members
Improve Your Probability for Success ™ | www.visionedgemarketing.com | ©1999-2010 VisionEdge Marketing. VEM Proprietary. Not for reproduction or redistribution without written permission. 6
Our 3 Roles Enable Us to Move 3 Business Needles
Find/SecureProfitableCustomers
Acquisition
KeepCustomers
Penetration
GrowCustomer
Value
Monetization
Market Share Lifetime ValueBrand/
Customer Equity
Page 3
Improve Your Probability for Success ™ | www.visionedgemarketing.com | ©1999-2010 VisionEdge Marketing. VEM Proprietary. Not for reproduction or redistribution without written permission. 7
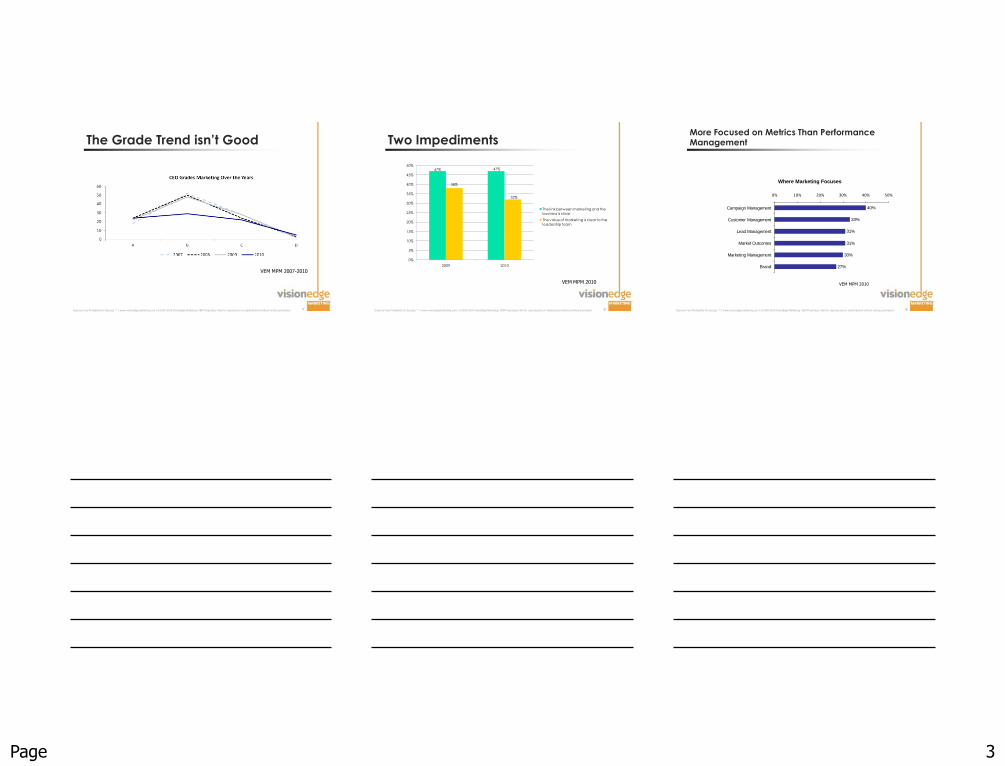
The Grade Trend isn’t Good
VEM MPM 2007-2010
Improve Your Probability for Success ™ | www.visionedgemarketing.com | ©1999-2010 VisionEdge Marketing. VEM Proprietary. Not for reproduction or redistribution without written permission. 8
Two Impediments
VEM MPM 2010
47% 47%
38%
32%
0%
5%
10%
15%
20%
25%
30%
35%
40%
45%
50%
2009 2010
The link between marketing and the
business is clear
The value of marketing is clear to the
leadership team
Improve Your Probability for Success ™ | www.visionedgemarketing.com | ©1999-2010 VisionEdge Marketing. VEM Proprietary. Not for reproduction or redistribution without written permission. 9
More Focused on Metrics Than Performance Management
Where Marketing Focuses
40%
33%
31%
31%
30%
27%
0% 10% 20% 30% 40% 50%
Campaign Management
Customer Management
Lead Management
Market Outcomes
Marketing Management
Brand
VEM MPM 2010
Page 4
Improve Your Probability for Success ™ | www.visionedgemarketing.com | ©1999-2010 VisionEdge Marketing. VEM Proprietary. Not for reproduction or redistribution without written permission. 10
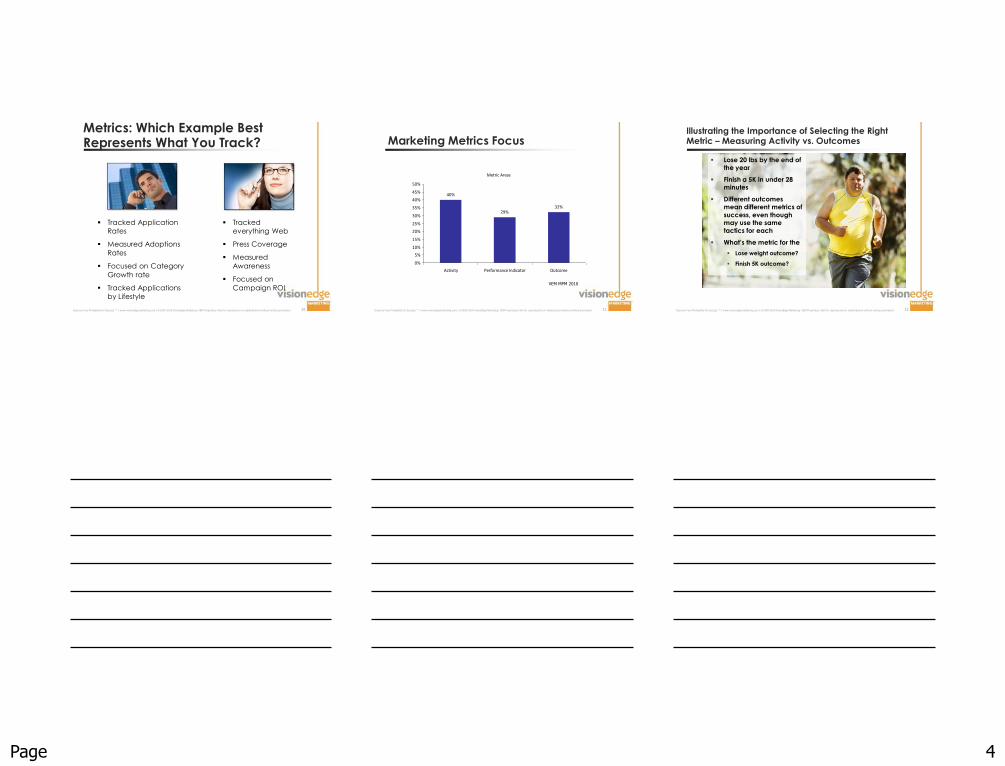
Metrics: Which Example Best Represents What You Track?
Tracked Application
Rates
Measured Adoptions
Rates
Focused on Category
Growth rate
Tracked Applications
by Lifestyle
Tracked
everything Web
Press Coverage
Measured
Awareness
Focused on
Campaign ROI
Improve Your Probability for Success ™ | www.visionedgemarketing.com | ©1999-2010 VisionEdge Marketing. VEM Proprietary. Not for reproduction or redistribution without written permission. 11
Marketing Metrics Focus
Metric Areas
40%
29%32%
0%
5%
10%
15%
20%
25%
30%
35%
40%
45%
50%
Activity Performance Indicator Outcome
VEM MPM 2010
Improve Your Probability for Success ™ | www.visionedgemarketing.com | ©1999-2010 VisionEdge Marketing. VEM Proprietary. Not for reproduction or redistribution without written permission. 12
Illustrating the Importance of Selecting the Right Metric – Measuring Activity vs. Outcomes
Lose 20 lbs by the end of the year
Finish a 5K in under 28 minutes
Different outcomes mean different metrics of
success, even though may use the same tactics for each
What’s the metric for the
Lose weight outcome?
Finish 5K outcome?
Page 5
Improve Your Probability for Success ™ | www.visionedgemarketing.com | ©1999-2010 VisionEdge Marketing. VEM Proprietary. Not for reproduction or redistribution without written permission. 13
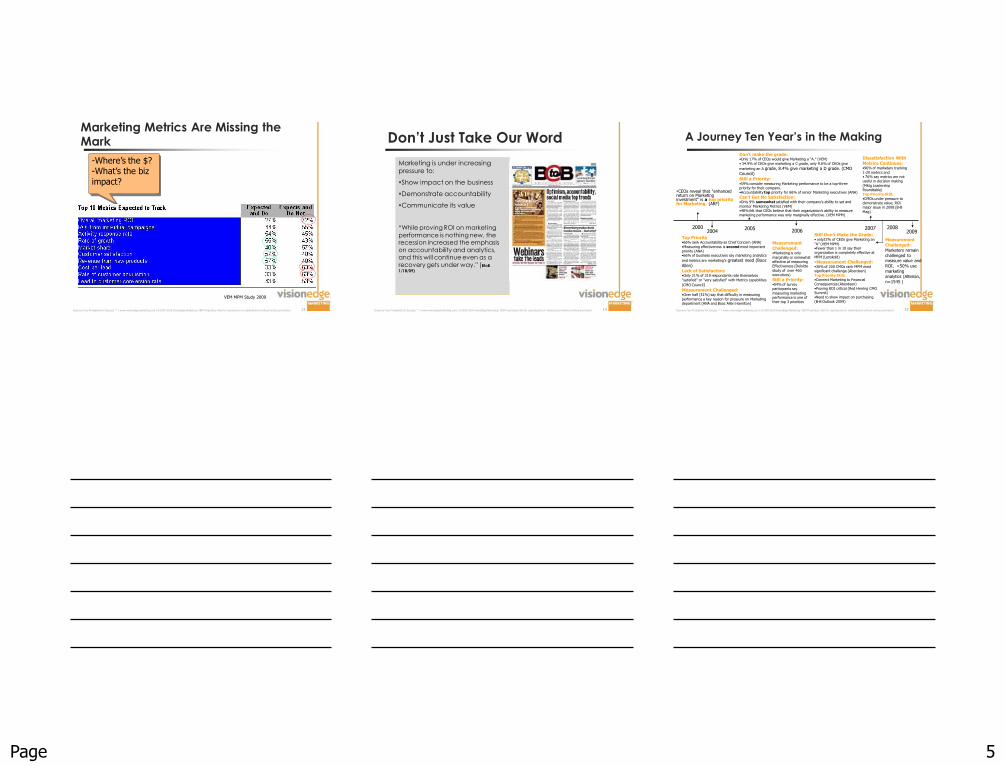
Marketing Metrics Are Missing the Mark
VEM MPM Study 2009
-Where’s the $?-What’s the biz impact?
Improve Your Probability for Success ™ | www.visionedgemarketing.com | ©1999-2010 VisionEdge Marketing. VEM Proprietary. Not for reproduction or redistribution without written permission. 14
Don’t Just Take Our Word
Marketing is under increasing pressure to:
Show impact on the business
Demonstrate accountability
Communicate its value
“While proving ROI on marketing
performance is nothing new, the recession increased the emphasis
on accountability and analytics, and this will continue even as a
recovery gets under way.” (BtoB
1/18/09)
Improve Your Probability for Success ™ | www.visionedgemarketing.com | ©1999-2010 VisionEdge Marketing. VEM Proprietary. Not for reproduction or redistribution without written permission. 15
A Journey Ten Year’s in the Making
CEOs reveal that "enhanced return on Marketing investment“ is a top priority for Marketing. (ARF)
Top Priority•66% rank Accountability as Chief Concern (ANA)
•Measuring effectiveness is second most important priority (ANA)•66% of business executives say marketing analytics
and metrics are marketing’s greatest need (Booz
Allen)
Lack of Satisfaction:•Only 21% of 319 respondents rate themselves
"satisfied" or "very satisfied" with Metrics capabilities
(CMO Council)
Measurement Challenged:•Over half (51%) say that difficulty in measuring
performance a key reason for pressure on Marketing department (ANA and Booz Allen Hamilton)
Don’t make the grade:•Only 17% of CEOs would give Marketing a “A.” (VEM)
• 34.9% of CEOs give marketing a C grade, only 9.6% of CEOs give
marketing an A grade, 8.4% give marketing a D grade. (CMO Council)
Still a Priority:•59% consider measuring Marketing performance to be a top-three priority for their company.•Accountability top priority for 66% of senior Marketing executives (ANA)
Can’t Get No Satisfaction:•Only 9% somewhat satisfied with their company’s ability to set and
monitor Marketing Metrics (VEM)•48% felt that CEOs believe that their organization’s ability to measure marketing performance was only marginally effective. (VEM MPM)
Measurement
Challenged:•Marketing is only
marginally or somewhateffective at measuringEffectiveness (Deloitte
study of over 460 executives)
Still a Priority:•54% of survey participants say
measuring marketing performance is one of their top 3 priorities
Measurement
Challenged:
Marketers remain
challenged to measure value and
ROI, <50% use
marketing
analytics (Alterian,
n=1545 )
Dissatisfaction With
Metrics Continues:•96% of marketers tracking
1-20 metrics and• 76% say metrics are not useful in decision making
(Mktg Leadership Roundtable)Top Priority Still:
•CMOs under pressure to demonstrate value; ROI major issue in 2008 (B-B
Mag)
Still Don’t Make the Grade:• only22% of CEOs give Marketing an
“A” (VEM MPM)•Fewer than 1 in 10 say their organization is completely effective at
MPM (Lenskold)
•Measurement Challenged:•30% of 200 CMOs rank MPM most significant challenge (Aberdeen)
Top Priority Still:•Connect Marketing to Financial Consequences (Aberdeen)
•Proving ROI critical (Red Herring CMO Summit)•Need to show impact on purchasing
(B-B Outlook 2009)
20002004
2005 2006 20092007 2008
Page 6
Improve Your Probability for Success ™ | www.visionedgemarketing.com | ©1999-2010 VisionEdge Marketing. VEM Proprietary. Not for reproduction or redistribution without written permission. 16
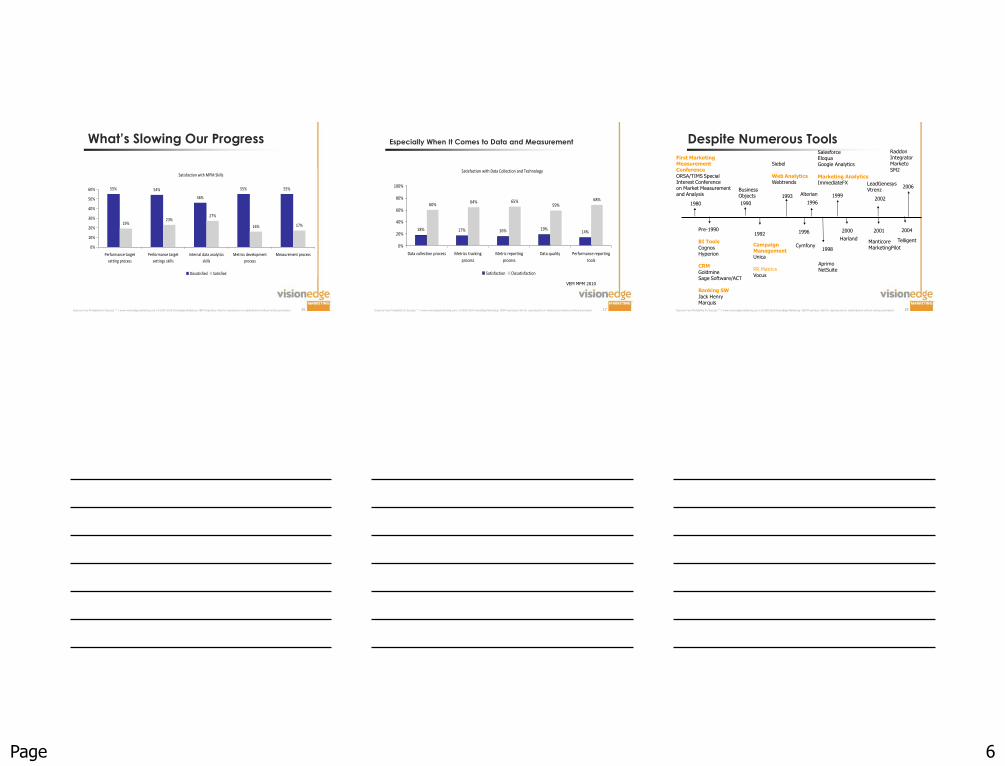
What’s Slowing Our Progress
Satisfaction with MPM Skills
55% 54%
46%
55% 55%
19%23%
27%
16% 17%
0%
10%
20%
30%
40%
50%
60%
Performance target
setting process
Performance target
settings skills
Internal data analytics
skills
Metrics development
process
Measurement process
Dissatisfied Satisfied
Improve Your Probability for Success ™ | www.visionedgemarketing.com | ©1999-2010 VisionEdge Marketing. VEM Proprietary. Not for reproduction or redistribution without written permission. 17
Especially When It Comes to Data and Measurement
Satisfaction with Data Collection and Technology
18% 17% 16% 19%14%
60%64% 65%
59%68%
0%
20%
40%
60%
80%
100%
Data collection process Metrics tracking
process
Metric reporting
process
Data quality Performance reporting
tools
Satisfaction Dissatisfaction
VEM MPM 2010
Improve Your Probability for Success ™ | www.visionedgemarketing.com | ©1999-2010 VisionEdge Marketing. VEM Proprietary. Not for reproduction or redistribution without written permission. 18
Despite Numerous Tools
Pre-1990
BI Tools
CognosHyperion
CRM
GoldmineSage Software/ACT
Banking SW
Jack HenryMarquis
1990
1992
1993
1998
1999
2001
Business Objects
Campaign ManagementUnica
PR MetricsVocus
Siebel
Web AnalyticsWebtrends
AprimoNetSuite
SalesforceEloquaGoogle Analytics
Marketing AnalyticsImmediateFX
ManticoreMarketingPilot
Raddon IntegratorMarketo
SM2
2006
2002
LeadGenesysVtrenz
1980
First MarketingMeasurement Conference
ORSA/TIMS Special Interest Conference on Market Measurement and Analysis
2004
Telligent
1996
Cymfony
1996
Alterian
2000
Harland
Page 7
Improve Your Probability for Success ™ | www.visionedgemarketing.com | ©1999-2010 VisionEdge Marketing. VEM Proprietary. Not for reproduction or redistribution without written permission. 19
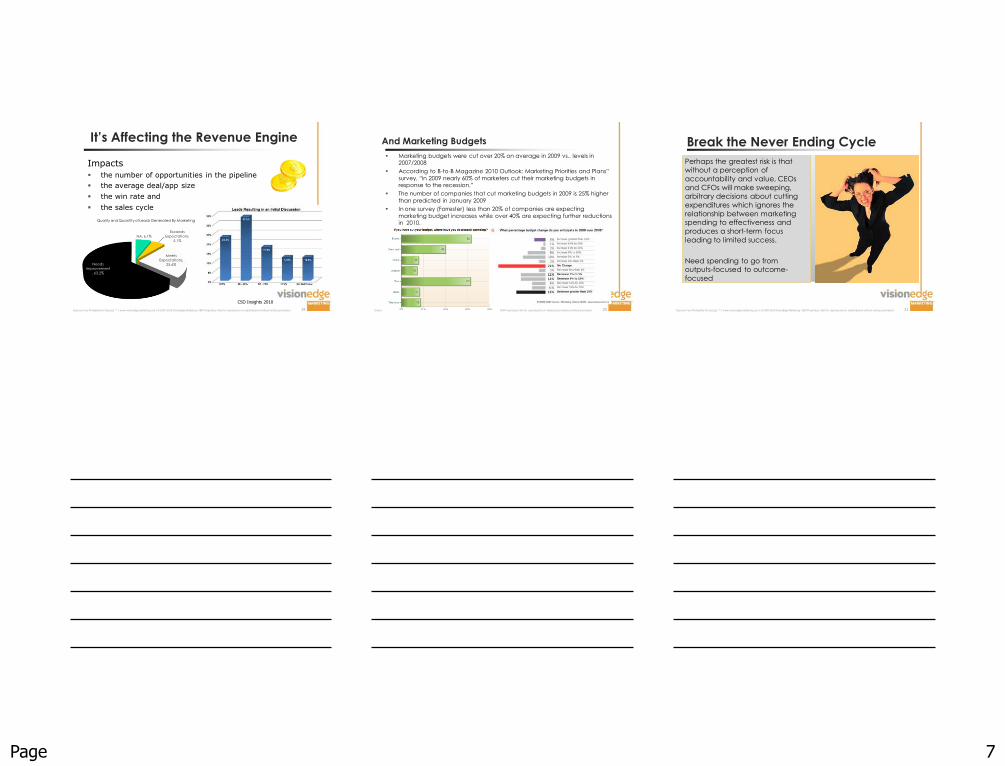
It’s Affecting the Revenue Engine
Impacts
the number of opportunities in the pipeline
the average deal/app size
the win rate and
the sales cycle
CSO Insights 2010
NA, 6.1%
Exceeds
Expectations,
5.1%
Meets
Expectations,
25.6%Needs
Improvement
, 63.2%
Quality and Quantity of Leads Generated By Marketing
Improve Your Probability for Success ™ | www.visionedgemarketing.com | ©1999-2010 VisionEdge Marketing. VEM Proprietary. Not for reproduction or redistribution without written permission. 20
And Marketing Budgets
Marketing budgets were cut over 20% on average in 2009 vs.. levels in 2007/2008
According to B-to-B Magazine 2010 Outlook: Marketing Priorities and Plans”
survey, “in 2009 nearly 60% of marketers cut their marketing budgets in response to the recession.”
The number of companies that cut marketing budgets in 2009 is 25% higher
than predicted in January 2009
In one survey (Forrester) less than 20% of companies are expecting
marketing budget increases while over 40% are expecting further reductions in 2010.
Compared to for example, R&D which was flat to slightly up in 2009 over
2008
Improve Your Probability for Success ™ | www.visionedgemarketing.com | ©1999-2010 VisionEdge Marketing. VEM Proprietary. Not for reproduction or redistribution without written permission. 21
Break the Never Ending Cycle
Perhaps the greatest risk is that
without a perception of
accountability and value, CEOs
and CFOs will make sweeping,
arbitrary decisions about cutting
expenditures which ignores the
relationship between marketing
spending to effectiveness and
produces a short-term focus
leading to limited success.
Need spending to go from
outputs-focused to outcome-
focused
Page 8
Improve Your Probability for Success ™ | www.visionedgemarketing.com | ©1999-2010 VisionEdge Marketing. VEM Proprietary. Not for reproduction or redistribution without written permission. 22
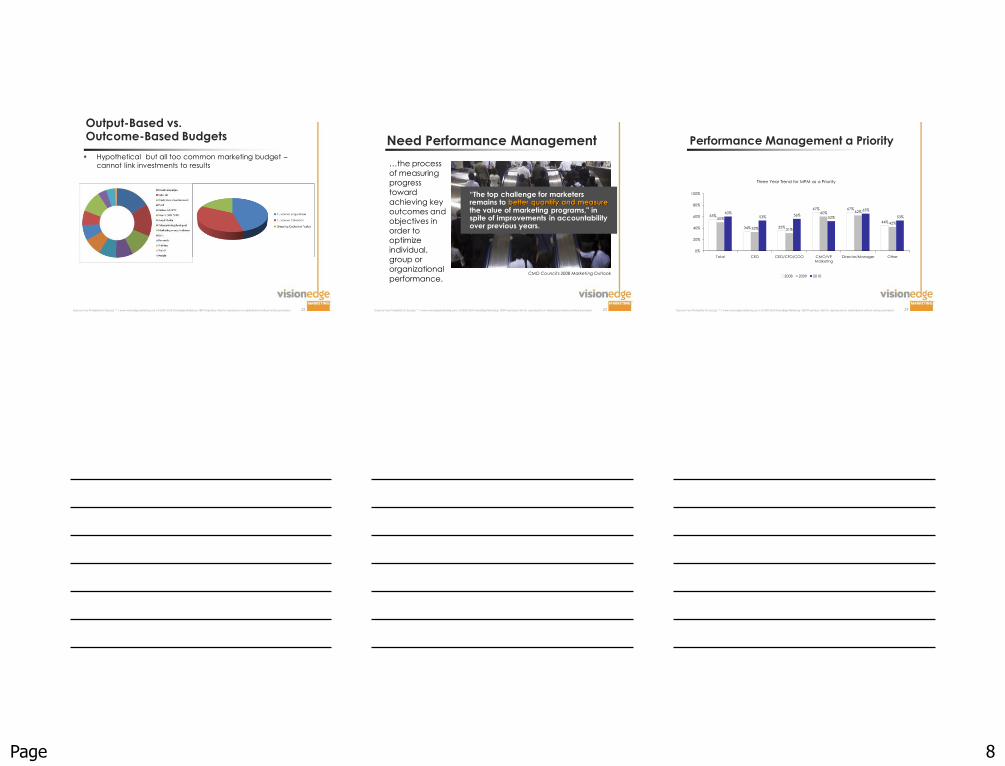
Output-Based vs. Outcome-Based Budgets
Hypothetical but all too common marketing budget –
cannot link investments to results
Improve Your Probability for Success ™ | www.visionedgemarketing.com | ©1999-2010 VisionEdge Marketing. VEM Proprietary. Not for reproduction or redistribution without written permission. 23
Need Performance Management
…the process
of measuring
progress
toward
achieving key
outcomes and
objectives in
order to
optimize
individual,
group or
organizational
performance.CMO Council's 2008 Marketing Outlook
“The top challenge for marketers remains to better quantify and measurethe value of marketing programs," in spite of improvements in accountability over previous years.
Improve Your Probability for Success ™ | www.visionedgemarketing.com | ©1999-2010 VisionEdge Marketing. VEM Proprietary. Not for reproduction or redistribution without written permission. 24
Performance Management a Priority
55%
34% 35%
67% 67%
44%50%
33% 31%
60% 62%
42%
60%53% 56%
52%
65%
53%
0%
20%
40%
60%
80%
100%
Total CEO CEO/CFO/COO CMO/VP
Marketing
Director/Manager Other
Three Year Trend for MPM as a Priority
2008 2009 2010
Page 9
Improve Your Probability for Success ™ | www.visionedgemarketing.com | ©1999-2010 VisionEdge Marketing. VEM Proprietary. Not for reproduction or redistribution without written permission. 25
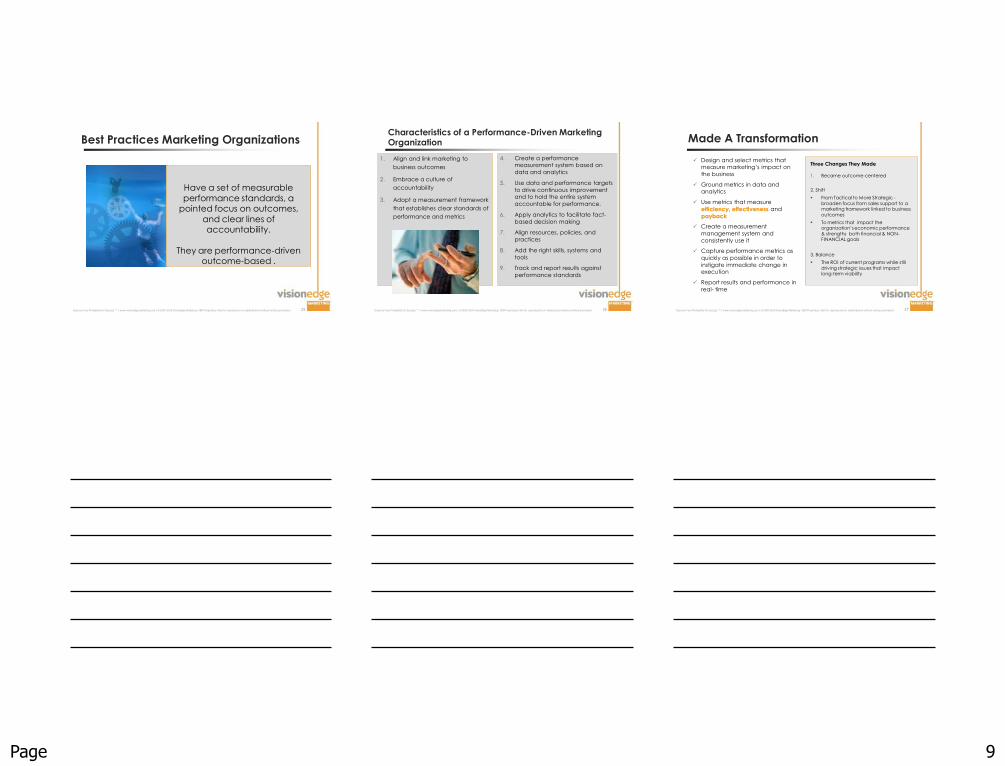
Best Practices Marketing Organizations
Have a set of measurable
performance standards, a pointed focus on outcomes,
and clear lines of accountability.
They are performance-driven outcome-based .
Improve Your Probability for Success ™ | www.visionedgemarketing.com | ©1999-2010 VisionEdge Marketing. VEM Proprietary. Not for reproduction or redistribution without written permission. 26
Characteristics of a Performance-Driven Marketing Organization
1. Align and link marketing to
business outcomes
2. Embrace a culture of
accountability
3. Adopt a measurement framework
that establishes clear standards of
performance and metrics
4. Create a performance measurement system based on
data and analytics
5. Use data and performance targets
to drive continuous improvement and to hold the entire system
accountable for performance.
6. Apply analytics to facilitate fact-
based decision making
7. Align resources, policies, and
practices
8. Add the right skills, systems and
tools
9. Track and report results against
performance standards
Improve Your Probability for Success ™ | www.visionedgemarketing.com | ©1999-2010 VisionEdge Marketing. VEM Proprietary. Not for reproduction or redistribution without written permission. 27
Made A Transformation
Design and select metrics that measure marketing‟s impact on
the business
Ground metrics in data and analytics
Use metrics that measure
efficiency, effectiveness and
payback
Create a measurement
management system and
consistently use it
Capture performance metrics as
quickly as possible in order to
instigate immediate change in execution
Report results and performance in
real- time
Three Changes They Made
1. Became outcome-centered
2. Shift
From Tactical to More Strategic -
broaden focus from sales support to a marketing framework linked to business
outcomes
To metrics that impact the organization‟s economic performance
& strengths both financial & NON-FINANCIAL goals
3. Balance
The ROI of current programs while still
driving strategic issues that impact long-term viability
Page 10
Improve Your Probability for Success ™ | www.visionedgemarketing.com | ©1999-2010 VisionEdge Marketing. VEM Proprietary. Not for reproduction or redistribution without written permission. 28
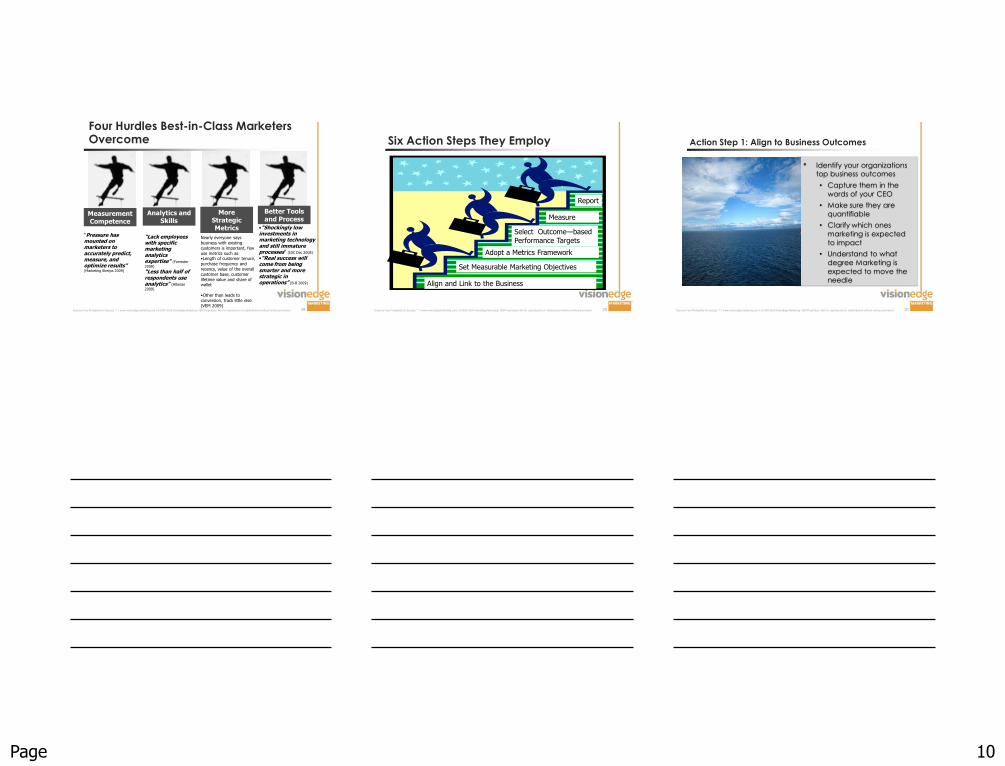
Four Hurdles Best-in-Class Marketers Overcome
Measurement Competence
Analytics and Skills
More Strategic Metrics
Better Tools and Process
Nearly everyone says
business with existing
customers is important, few
use metrics such as•Length of customer tenure,
purchase frequency and
recency, value of the overall
customer base, customer
lifetime value and share of wallet
•Other than leads to
conversion, track little else.
(VEM 2009)
•“Shockingly low investments in marketing technology and still immature processes” (IDC Dec 2008)
•“Real success will come from being smarter and more strategic in operations” (B-B 2009)
“Lack employees with specific marketing analytics expertise” (Forrester
2008)
“Less than half of respondents use analytics” (Alterian
2009)
“Pressure has mounted on marketers to accurately predict, measure, and optimize results”(Marketing Sherpa 2009)
Improve Your Probability for Success ™ | www.visionedgemarketing.com | ©1999-2010 VisionEdge Marketing. VEM Proprietary. Not for reproduction or redistribution without written permission. 29
Six Action Steps They Employ
Align and Link to the Business
Set Measurable Marketing Objectives
Adopt a Metrics Framework
Select Outcome—based
Performance Targets
Measure
Report
Improve Your Probability for Success ™ | www.visionedgemarketing.com | ©1999-2010 VisionEdge Marketing. VEM Proprietary. Not for reproduction or redistribution without written permission. 30
• Identify your organizations
top business outcomes
• Capture them in the
words of your CEO
• Make sure they are
quantifiable
• Clarify which ones
marketing is expected
to impact
• Understand to what
degree Marketing is
expected to move the
needle
Action Step 1: Align to Business Outcomes
Page 11
Improve Your Probability for Success ™ | www.visionedgemarketing.com | ©1999-2010 VisionEdge Marketing. VEM Proprietary. Not for reproduction or redistribution without written permission. 31
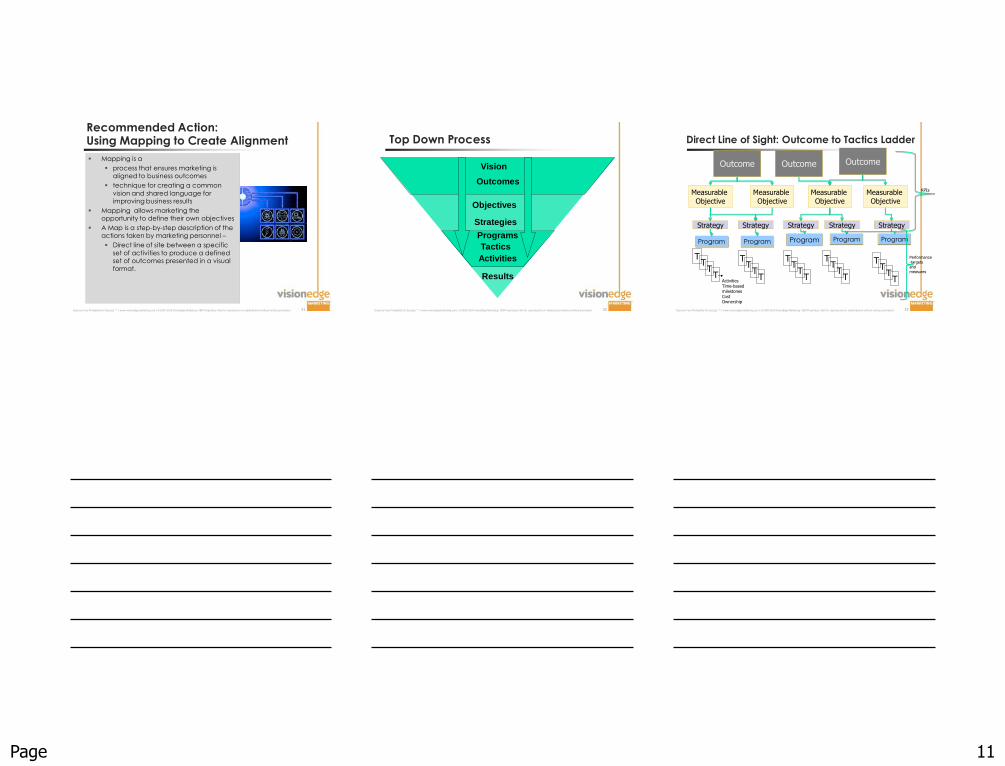
Recommended Action:Using Mapping to Create Alignment
Mapping is a
process that ensures marketing is aligned to business outcomes
technique for creating a common
vision and shared language for improving business results
Mapping allows marketing the opportunity to define their own objectives
A Map is a step-by-step description of the actions taken by marketing personnel –
Direct line of site between a specific
set of activities to produce a defined set of outcomes presented in a visual format.
Improve Your Probability for Success ™ | www.visionedgemarketing.com | ©1999-2010 VisionEdge Marketing. VEM Proprietary. Not for reproduction or redistribution without written permission. 32
Top Down Process
Vision
Outcomes
Objectives
Activities
Strategies
Tactics
Results
Programs
Improve Your Probability for Success ™ | www.visionedgemarketing.com | ©1999-2010 VisionEdge Marketing. VEM Proprietary. Not for reproduction or redistribution without written permission. 33
Direct Line of Sight: Outcome to Tactics Ladder
Outcome
Measurable
Objective
Strategy
T
Outcome Outcome
Measurable
Objective
Measurable
Objective
Measurable
Objective
Strategy Strategy Strategy Strategy
TT
T
TT
TT
TT
TT
TT
TT
TT
TTActivities
Time-based
milestones
CostOwnership
Program Program Program Program Program
KPIs
Performance-targetsand measures
Page 12
By X month, leverage social
media and online events to create a community of X#
active ctm users
-Program $
-- Person
ID social media
- cost
- Person
--date
-- Establish community charter, rqmnts, -Cost
-Person
-date
-Develop community list
--cost
-Person
-Date
-Develop and send invite-Cost
-Person
-Date
Grass roots user
community
X number of customers
renew primary service resulting in $Y
X number of tier 1 and 2 customers
upgrade to new platform resulting in $Y and growth in SOW
X number of ABC segment
customers adopt new platform resulting in $Y and X% growth in MS
Increase customer preference
by X% over competitive products within 12 mos
Increase customer usage by X%
over prior year within 6 mos
Create X number qualified leads
among segment share determiners within 3 months of
platform launch with a 80%+
conversion confidence
3rd Party Influencer
Endorsement Customer
Ambassador
TrialCustomer
Evangelists
High Touch Niche
Events
By X month, create X #
evangelists and X# ambassadors who
engage with X% of tier 1
and 2 ctms
- Ambassador Program
$-- Person
--Evangelist program $
-- Person
By X month, X#
existing ctms & X# new ctms will
complete a trial
-Program $
-- Person
By X month, X# of positive
mentions from tier 1 third party influencers
-Program $
-- Person
Secure X#
prospect appts per niche event
-Program $
-- Person
ID evangelists and ambassadors
-Cost
-- person-- date
Establish group charters and rqmnts-cost
-Person
-- date
Tactics and activities
-Cost
-- person-- date
Tactics and activities-cost
-Person
-- date
Tactics and activities
-Cost
-- person-- date
Tactics and activities-cost
-Person
-- date
Tactics and activities
-Cost
-- person-- date
Tactics and activities-cost
-Person
-- date
Improve Your Probability for Success ™ | www.visionedgemarketing.com | ©1999-2010 VisionEdge Marketing. VEM Proprietary. Not for reproduction or redistribution without written permission.Improve Your Probability for Success ™ | www.visionedgemarketing.com | ©1999-2010 VisionEdge Marketing. VEM Proprietary. Not for reproduction or redistribution without written permission. 35
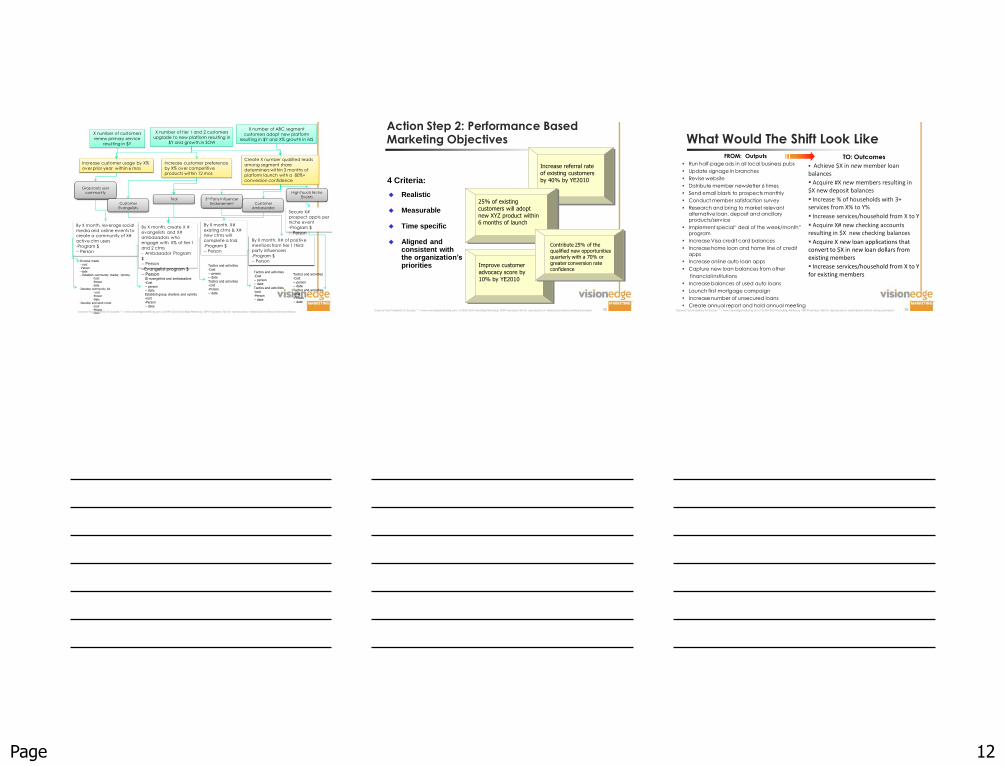
Improve customer
advocacy score by
10% by YE2010
Action Step 2: Performance Based Marketing Objectives
Realistic
Measurable
Time specific
Aligned and consistent with the organization’s priorities
4 Criteria:
Increase referral rate
of existing customers
by 40% by YE2010
25% of existing
customers will adopt
new XYZ product within 6 months of launch
Contribute 25% of the qualified new opportunities quarterly with a 70% or
greater conversion rate confidence
Improve Your Probability for Success ™ | www.visionedgemarketing.com | ©1999-2010 VisionEdge Marketing. VEM Proprietary. Not for reproduction or redistribution without written permission. 36
What Would The Shift Look Like FROM: Outputs
Run half-page ads in all local business pubs
Update signage in branches
Revise website
Distribute member newsletter 6 times
Send email blasts to prospects monthly
Conduct member satisfaction survey
Research and bring to market relevant alternative loan, deposit and ancillary products/service
Implement special“ deal of the week/month” program
Increase Visa credit card balances
Increase home loan and home line of credit
apps
Increase online auto loan apps
Capture new loan balances from other
financial institutions
Increase balances of used auto loans
Launch first mortgage campaign
Increase number of unsecured loans
Create annual report and hold annual meeting
TO: Outcomes
Achieve $X in new member loan balances
Acquire #X new members resulting in $X new deposit balances
Increase % of households with 3+ services from X% to Y%
Increase services/household from X to Y
Acquire X# new checking accounts resulting in $X new checking balances
Acquire X new loan applications that convert to $X in new loan dollars from existing members
Increase services/household from X to Y for existing members
Page 13
Improve Your Probability for Success ™ | www.visionedgemarketing.com | ©1999-2010 VisionEdge Marketing. VEM Proprietary. Not for reproduction or redistribution without written permission. 37
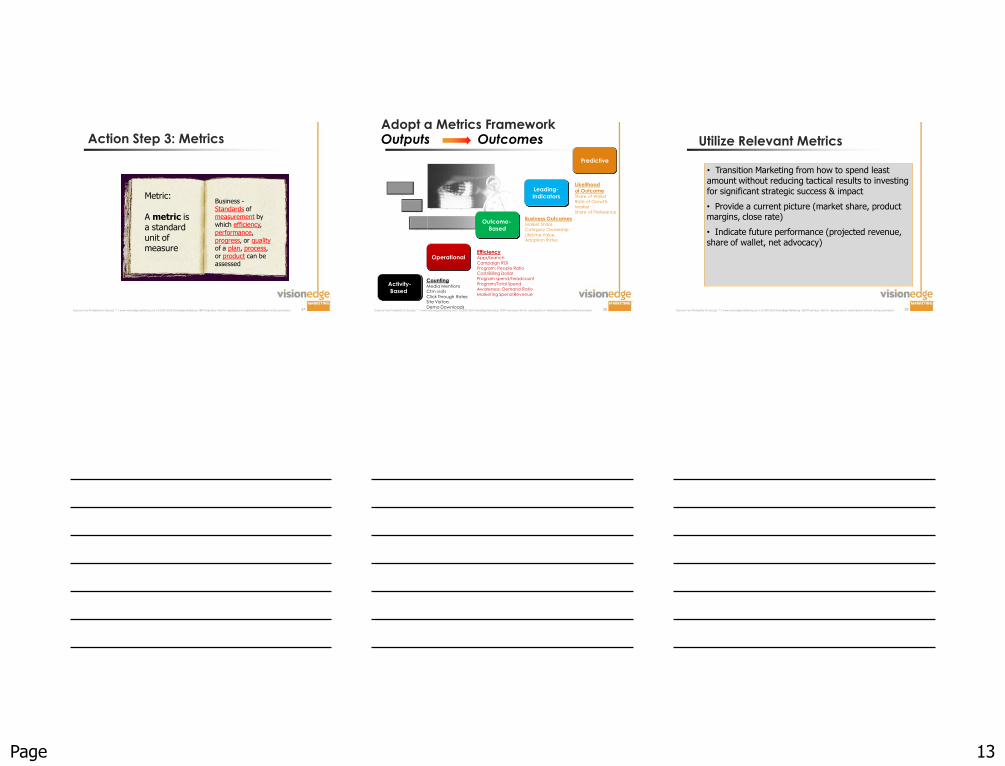
Action Step 3: Metrics
Metric:
A metric is a standard unit of measure
Business -Standards of measurement by which efficiency,
performance, progress, or qualityof a plan, process, or product can be assessed
Improve Your Probability for Success ™ | www.visionedgemarketing.com | ©1999-2010 VisionEdge Marketing. VEM Proprietary. Not for reproduction or redistribution without written permission. 38
Adopt a Metrics FrameworkOutputs Outcomes
Activity-
Based
Operational
Outcome-
Based
Leading-
Indicators
Predictive
CountingMedia Mentions
Ctm visits
Click Through RatesSite Visitors
Demo Downloads
EfficiencyApps/branch
Campaign ROI
Program: People RatioCost/Billing Dollar
Program spend/headcount
Program/Total Spend
Awareness: Demand Ratio
Marketing Spend:Revenue
Business OutcomesMarket Share
Category Ownership
Lifetime ValueAdoption Rates
Likelihood
of OutcomeShare of Wallet
Rate of Growth:
Market
Share of Preference
Improve Your Probability for Success ™ | www.visionedgemarketing.com | ©1999-2010 VisionEdge Marketing. VEM Proprietary. Not for reproduction or redistribution without written permission. 39
Utilize Relevant Metrics
• Transition Marketing from how to spend least amount without reducing tactical results to investing for significant strategic success & impact
• Provide a current picture (market share, product margins, close rate)
• Indicate future performance (projected revenue, share of wallet, net advocacy)
Page 14
Improve Your Probability for Success ™ | www.visionedgemarketing.com | ©1999-2010 VisionEdge Marketing. VEM Proprietary. Not for reproduction or redistribution without written permission. 40
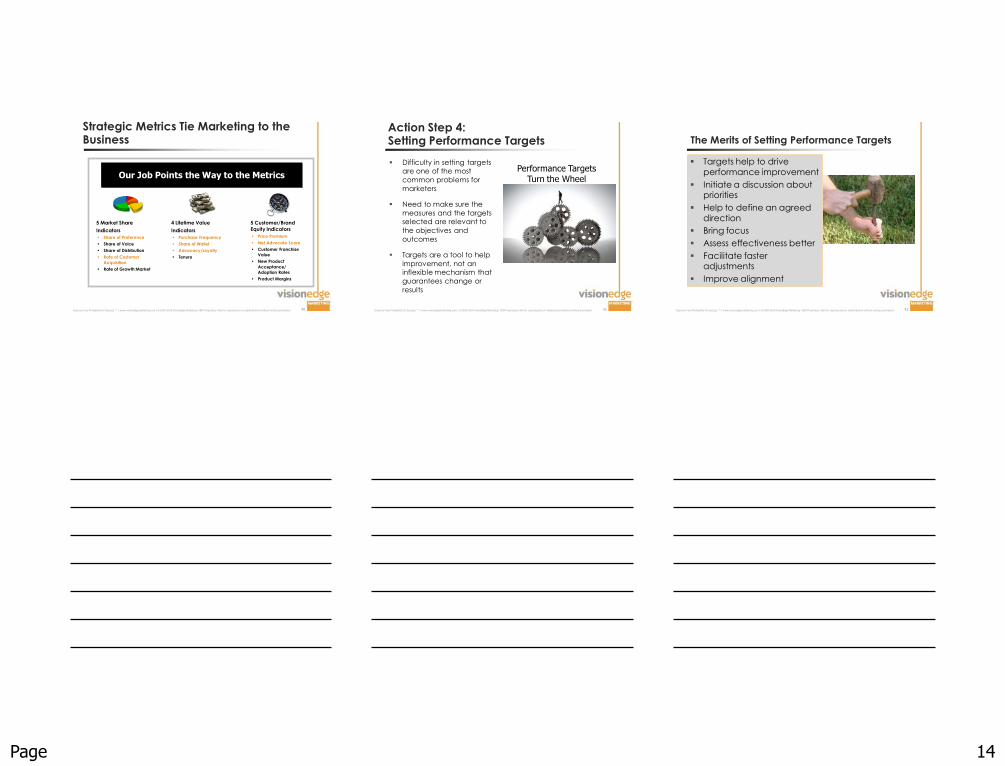
Strategic Metrics Tie Marketing to the Business
Our Job Points the Way to the Metrics
5 Customer/Brand
Equity Indicators
• Price Premium
• Net Advocate Score
• Customer Franchise
Value
• New Product
Acceptance/
Adoption Rates
• Product Margins
4 Lifetime Value
Indicators
• Purchase Frequency
• Share of Wallet
• Advocacy/Loyalty
• Tenure
5 Market Share
Indicators
• Share of Preference
• Share of Voice
• Share of Distribution
• Rate of Customer
Acquisition
• Rate of Growth:Market
Improve Your Probability for Success ™ | www.visionedgemarketing.com | ©1999-2010 VisionEdge Marketing. VEM Proprietary. Not for reproduction or redistribution without written permission. 41
Action Step 4: Setting Performance Targets
Difficulty in setting targets
are one of the most
common problems for
marketers
Need to make sure the
measures and the targets
selected are relevant to
the objectives and
outcomes
Targets are a tool to help
improvement, not an
inflexible mechanism that
guarantees change or
results
Performance TargetsTurn the Wheel
Improve Your Probability for Success ™ | www.visionedgemarketing.com | ©1999-2010 VisionEdge Marketing. VEM Proprietary. Not for reproduction or redistribution without written permission. 42
The Merits of Setting Performance Targets
Targets help to drive
performance improvement
Initiate a discussion about priorities
Help to define an agreed
direction
Bring focus
Assess effectiveness better
Facilitate faster adjustments
Improve alignment
Page 15
Improve Your Probability for Success ™ | www.visionedgemarketing.com | ©1999-2010 VisionEdge Marketing. VEM Proprietary. Not for reproduction or redistribution without written permission. 43
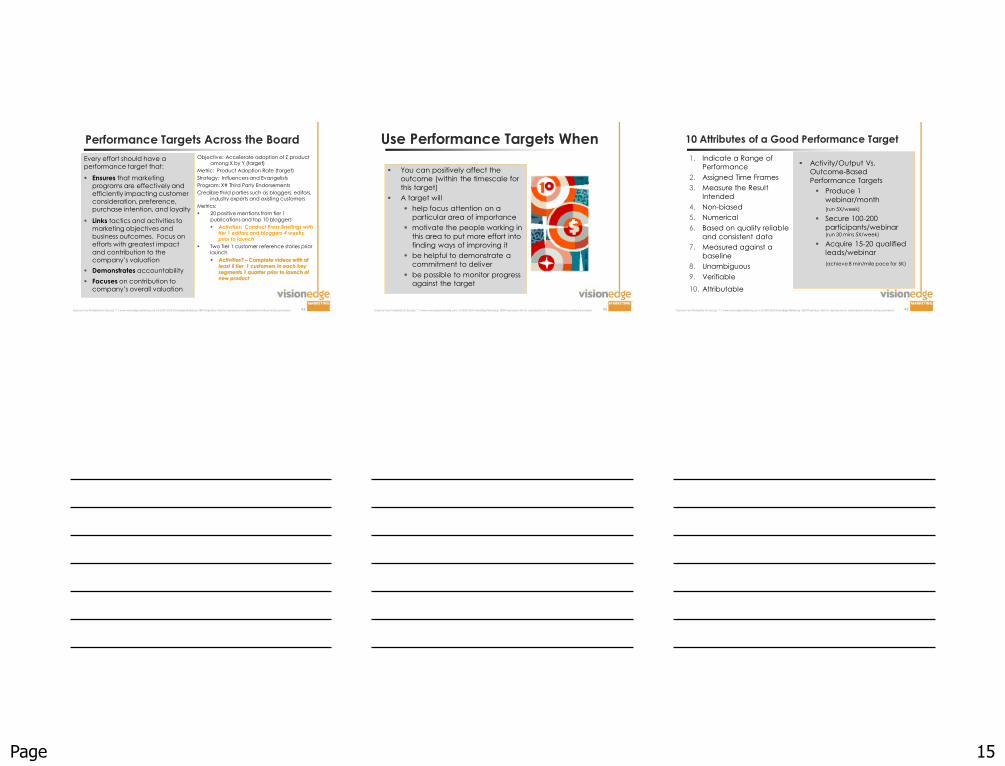
Performance Targets Across the Board
Every effort should have a performance target that:
Ensures that marketing programs are effectively and efficiently impacting customer consideration, preference, purchase intention, and loyalty
Links tactics and activities to marketing objectives and business outcomes. Focus on efforts with greatest impact
and contribution to the company‟s valuation
Demonstrates accountability
Focuses on contribution to company‟s overall valuation
Objective: Accelerate adoption of Z product among X by Y (target)
Metric: Product Adoption Rate (target)
Strategy: Influencers and Evangelists
Program: X# Third Party Endorsements
Credible third parties such as bloggers, editors, industry experts and existing customers
Metrics:
20 positive mentions from tier 1
publications and top 10 bloggers
Activities: Conduct Press Briefings with tier 1 editors and bloggers 4 weeks prior to launch
Two Tier 1 customer reference stories prior launch
Activities? – Complete videos with at
least 5 tier 1 customers in each key segments 1 quarter prior to launch of new product
Improve Your Probability for Success ™ | www.visionedgemarketing.com | ©1999-2010 VisionEdge Marketing. VEM Proprietary. Not for reproduction or redistribution without written permission. 44
Use Performance Targets When
You can positively affect the
outcome (within the timescale for
this target)
A target will
help focus attention on a
particular area of importance
motivate the people working in
this area to put more effort into
finding ways of improving it
be helpful to demonstrate a
commitment to deliver
be possible to monitor progress
against the target
Improve Your Probability for Success ™ | www.visionedgemarketing.com | ©1999-2010 VisionEdge Marketing. VEM Proprietary. Not for reproduction or redistribution without written permission. 45
10 Attributes of a Good Performance Target
1. Indicate a Range of
Performance
2. Assigned Time Frames
3. Measure the Result
Intended
4. Non-biased
5. Numerical
6. Based on quality reliable
and consistent data
7. Measured against a
baseline
8. Unambiguous
9. Verifiable
10. Attributable
Activity/Output Vs.
Outcome-Based
Performance Targets
Produce 1
webinar/month
(run 5X/week)
Secure 100-200
participants/webinar (run 30 mins 5X/week)
Acquire 15-20 qualified
leads/webinar
(achieve 8 min/mile pace for 5K)
Page 16
Improve Your Probability for Success ™ | www.visionedgemarketing.com | ©1999-2010 VisionEdge Marketing. VEM Proprietary. Not for reproduction or redistribution without written permission. 46
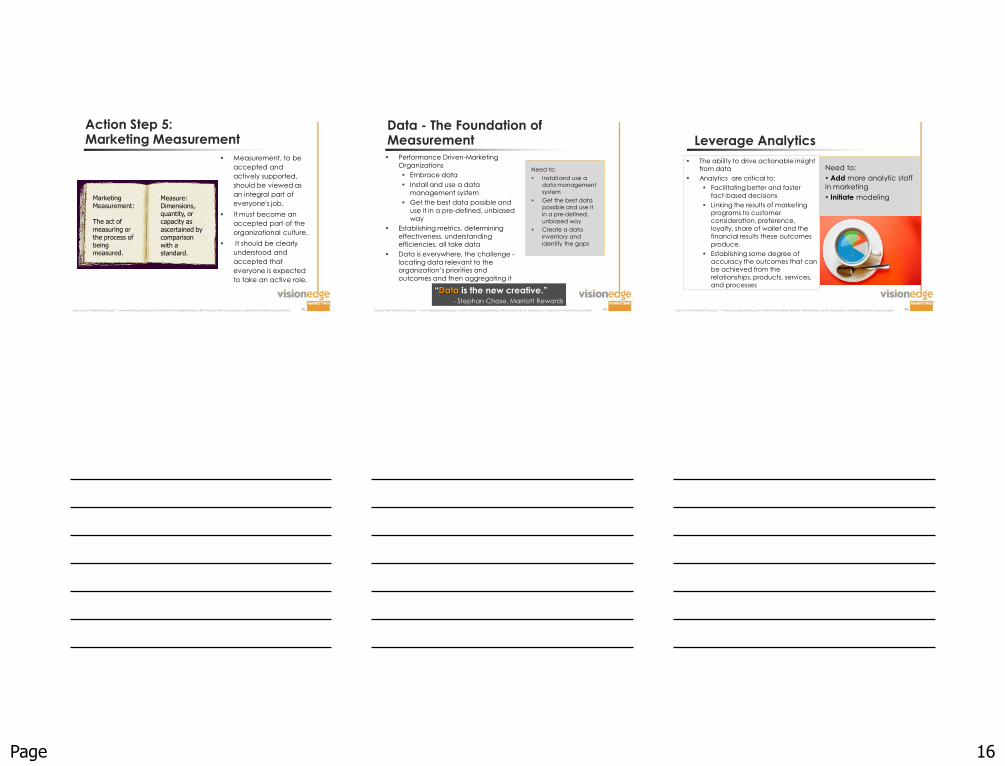
Action Step 5: Marketing Measurement
Marketing Measurement:
The act of
measuring or the process of being measured.
Measure:Dimensions, quantity, or capacity as
ascertained by comparison with a standard.
Measurement, to be
accepted and
actively supported,
should be viewed as
an integral part of
everyone's job.
It must become an
accepted part of the
organizational culture.
It should be clearly
understood and
accepted that
everyone is expected
to take an active role.
Improve Your Probability for Success ™ | www.visionedgemarketing.com | ©1999-2010 VisionEdge Marketing. VEM Proprietary. Not for reproduction or redistribution without written permission. 47
Data - The Foundation of Measurement Performance Driven-Marketing
Organizations
Embrace data
Install and use a data
management system
Get the best data possible and
use it in a pre-defined, unbiased
way
Establishing metrics, determining
effectiveness, understanding efficiencies, all take data
Data is everywhere, the challenge -
locating data relevant to the organization‟s priorities and
outcomes and then aggregating it
“Data is the new creative.”- Stephan Chase, Marriott Rewards
Need to:
Install and use a data management
system
Get the best data possible and use it
in a pre-defined,
unbiased way
Create a data
inventory and
identify the gaps
Improve Your Probability for Success ™ | www.visionedgemarketing.com | ©1999-2010 VisionEdge Marketing. VEM Proprietary. Not for reproduction or redistribution without written permission. 48
Leverage Analytics
The ability to drive actionable insight from data
Analytics are critical to:
Facilitating better and faster
fact-based decisions
Linking the results of marketing programs to customer consideration, preference,
loyalty, share of wallet and the financial results these outcomes
produce.
Establishing some degree of accuracy the outcomes that can be achieved from the relationships, products, services, and processes
Need to:
Add more analytic staff
in marketing
Initiate modeling
Page 17
Improve Your Probability for Success ™ | www.visionedgemarketing.com | ©1999-2010 VisionEdge Marketing. VEM Proprietary. Not for reproduction or redistribution without written permission. 49
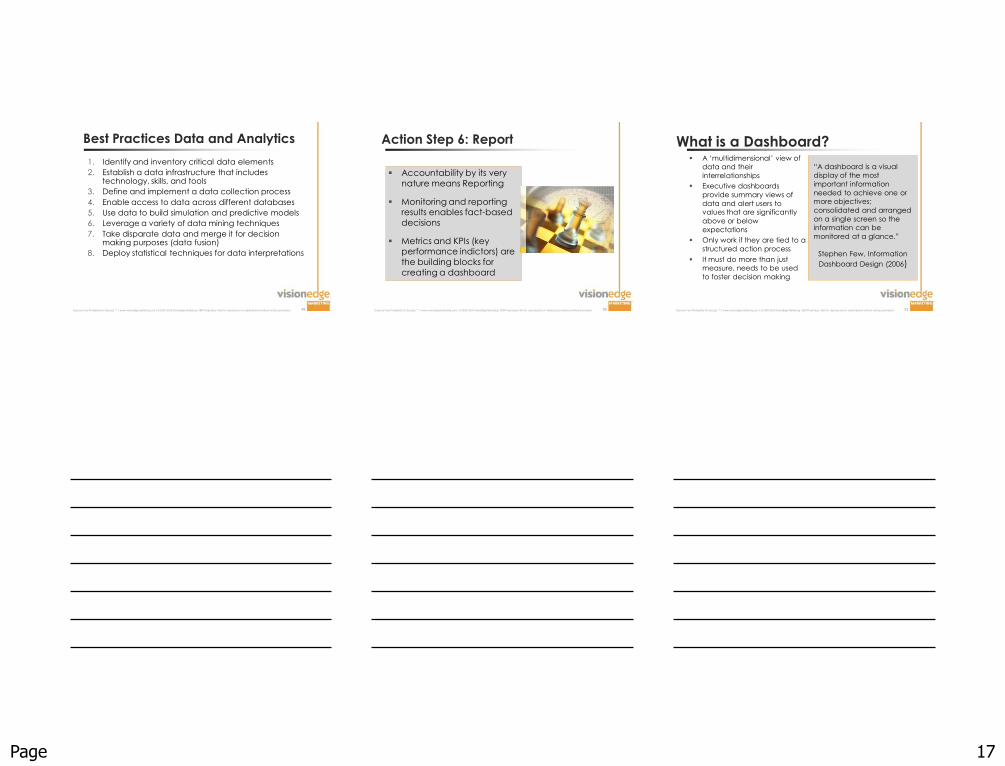
Best Practices Data and Analytics
1. Identify and inventory critical data elements
2. Establish a data infrastructure that includes technology, skills, and tools
3. Define and implement a data collection process
4. Enable access to data across different databases
5. Use data to build simulation and predictive models
6. Leverage a variety of data mining techniques
7. Take disparate data and merge it for decision making purposes (data fusion)
8. Deploy statistical techniques for data interpretations
Improve Your Probability for Success ™ | www.visionedgemarketing.com | ©1999-2010 VisionEdge Marketing. VEM Proprietary. Not for reproduction or redistribution without written permission. 50
Action Step 6: Report
Accountability by its very
nature means Reporting
Monitoring and reporting results enables fact-based
decisions
Metrics and KPIs (key performance indictors) are
the building blocks for
creating a dashboard
Improve Your Probability for Success ™ | www.visionedgemarketing.com | ©1999-2010 VisionEdge Marketing. VEM Proprietary. Not for reproduction or redistribution without written permission. 51
What is a Dashboard? A „multidimensional‟ view of
data and their
interrelationships
Executive dashboards
provide summary views of
data and alert users to
values that are significantly
above or below
expectations
Only work if they are tied to a
structured action process
It must do more than just
measure, needs to be used
to foster decision making
“A dashboard is a visual
display of the most
important information
needed to achieve one or
more objectives;
consolidated and arranged
on a single screen so the
information can be
monitored at a glance.”
Stephen Few, Information
Dashboard Design (2006)
Page 18
Improve Your Probability for Success ™ | www.visionedgemarketing.com | ©1999-2010 VisionEdge Marketing. VEM Proprietary. Not for reproduction or redistribution without written permission. 52
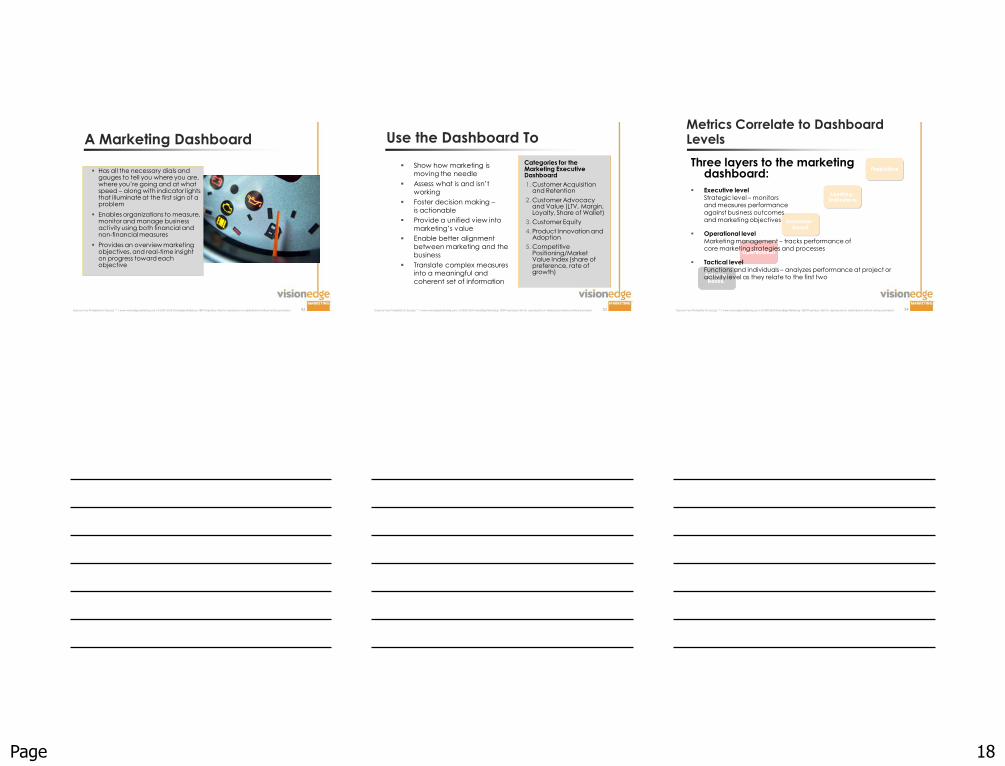
A Marketing Dashboard
Has all the necessary dials and gauges to tell you where you are, where you‟re going and at what speed – along with indicator lights that illuminate at the first sign of a problem
Enables organizations to measure, monitor and manage business activity using both financial and non-financial measures
Provides an overview marketing objectives, and real-time insight on progress toward each objective
Improve Your Probability for Success ™ | www.visionedgemarketing.com | ©1999-2010 VisionEdge Marketing. VEM Proprietary. Not for reproduction or redistribution without written permission. 53
Use the Dashboard To
Show how marketing is
moving the needle
Assess what is and isn‟t
working
Foster decision making –
is actionable
Provide a unified view into
marketing‟s value
Enable better alignment
between marketing and the
business
Translate complex measures into a meaningful and
coherent set of information
Categories for the Marketing Executive Dashboard
1. Customer Acquisition and Retention
2. Customer Advocacy and Value (LTV, Margin, Loyalty, Share of Wallet)
3. Customer Equity
4. Product Innovation and Adoption
5. Competitive Positioning/Market Value Index (share of preference, rate of growth)
Improve Your Probability for Success ™ | www.visionedgemarketing.com | ©1999-2010 VisionEdge Marketing. VEM Proprietary. Not for reproduction or redistribution without written permission. 54
Three layers to the marketing dashboard:
Executive level
Strategic level – monitorsand measures performance
against business outcomes and marketing objectives
Operational level
Marketing management – tracks performance of core marketing strategies and processes
Tactical level
Functions and individuals – analyzes performance at project or activity level as they relate to the first two
Metrics Correlate to Dashboard Levels

Page 19
Improve Your Probability for Success ™ | www.visionedgemarketing.com | ©1999-2010 VisionEdge Marketing. VEM Proprietary. Not for reproduction or redistribution without written permission. 55
Crossing the Finish Line
Improve Your Probability for Success ™ | www.visionedgemarketing.com | ©1999-2010 VisionEdge Marketing. VEM Proprietary. Not for reproduction or redistribution without written permission. 56
Success Factors: Skills, Processes & Tools, Culture
Processes, Systems, Tools
Skills & Training
Solutions to the problems of marketing accountability and creating a ROMI
culture begin with training (ISBM)
Culture
Create, reward and livea measurement culture
Improve Your Probability for Success ™ | www.visionedgemarketing.com | ©1999-2010 VisionEdge Marketing. VEM Proprietary. Not for reproduction or redistribution without written permission. 57
Four Key Processes
Start
Event
Occurs
Decision
Event
Occurs
End
YES
NOEvent
Occurs
Outcome
Start
Event
Occurs
Decision
Event
Occurs
End
YES
NOEvent
Occurs
Outcome
Start
Event
Occurs
Decision
Event
Occurs
End
YES
NOEvent
Occurs
Outcome
Start
Event
Occurs
Decision
Event
Occurs
End
YES
NOEvent
Occurs
Outcome
Alignment Data Collection Performance Monitoring
Metrics Analysis Target Setting Measurement
Reporting -Dashboards
Page 20
Improve Your Probability for Success ™ | www.visionedgemarketing.com | ©1999-2010 VisionEdge Marketing. VEM Proprietary. Not for reproduction or redistribution without written permission. 58
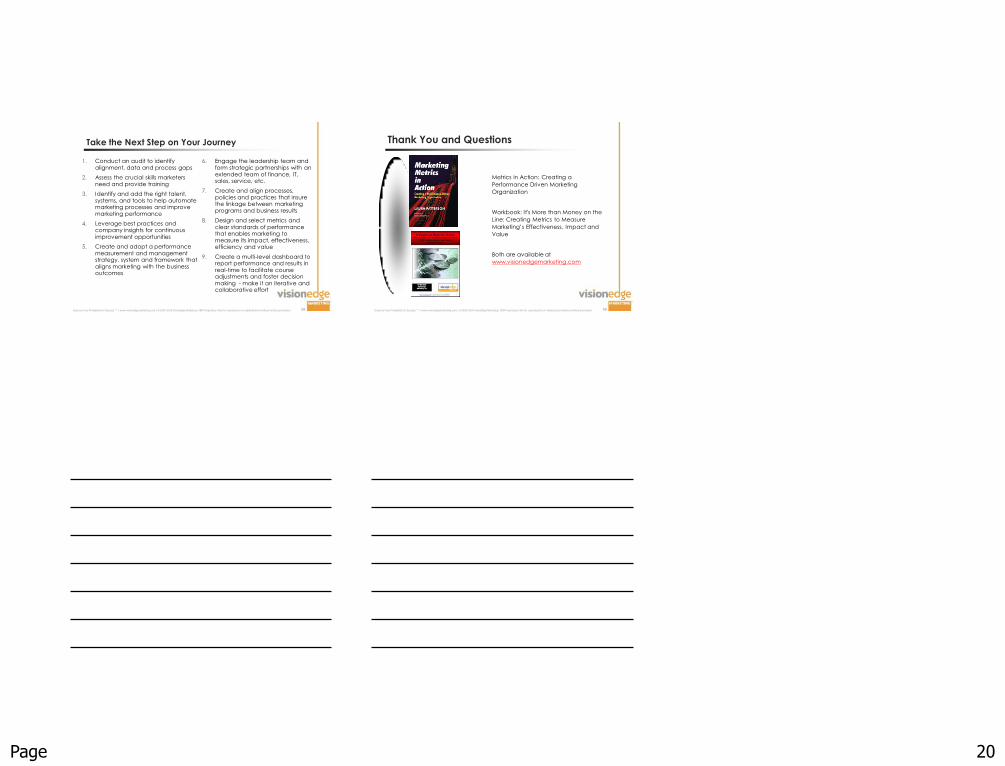
Take the Next Step on Your Journey
1. Conduct an audit to identify alignment, data and process gaps
2. Assess the crucial skills marketers need and provide training
3. Identify and add the right talent, systems, and tools to help automate marketing processes and improve marketing performance
4. Leverage best practices and company insights for continuous improvement opportunities
5. Create and adopt a performance measurement and management strategy, system and framework that aligns marketing with the business outcomes
6. Engage the leadership team and form strategic partnerships with an extended team of finance, IT, sales, service, etc.
7. Create and align processes, policies and practices that insure the linkage between marketing programs and business results
8. Design and select metrics and clear standards of performance that enables marketing to measure its impact, effectiveness, efficiency and value
9. Create a multi-level dashboard to report performance and results in real-time to facilitate course adjustments and foster decision making - make it an iterative and collaborative effort
Improve Your Probability for Success ™ | www.visionedgemarketing.com | ©1999-2010 VisionEdge Marketing. VEM Proprietary. Not for reproduction or redistribution without written permission. 59
Thank You and Questions
Metrics in Action: Creating a
Performance Driven Marketing
Organization
Workbook: It's More than Money on the
Line: Creating Metrics to Measure
Marketing‟s Effectiveness, Impact and
Value
Both are available at
www.visionedgemarketing.com