Embed Size (px)
DESCRIPTION
Uploaded from Google Docs
Citation preview

8/10/2010
1
By Paninee Putwanphen

8/10/2010
2
The market’s growing and we’re seeing intense
competition
Where are we and what do we want to do ?
We need a model to identify our current
positioningand find opportunities in the
market
Yikes, the iPad is
killing our Kindle
8/10/2010
3
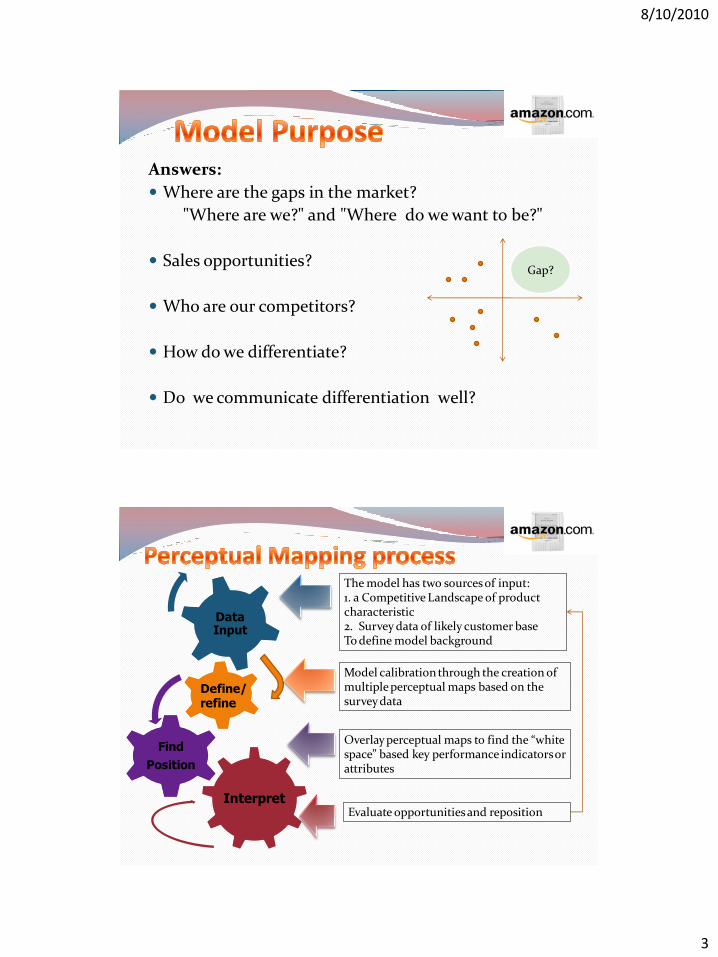
Answers:
Where are the gaps in the market?
"Where are we?" and "Where do we want to be?"
Sales opportunities?
Who are our competitors?
How do we differentiate?
Do we communicate differentiation well?
Gap?
vv
Interpret
Find
Position
Data Input
Define/refine
The model has two sources of input: 1. a Competitive Landscape of product characteristic2. Survey data of likely customer baseTo define model background
Model calibration through the creation of multiple perceptual maps based on the survey data
Overlay perceptual maps to find the “white space” based key performance indicators or attributes
Evaluate opportunities and reposition

8/10/2010
4
Names
Annual
Income
Range Gender
Annual
Income Age
Adopter
Stage
Usage
Screen
Size
Sm.
Portable
Device
Color
Importance
MultiMedia
Capabilities
Applicati
on Usage
Web
Browsing Price
Preference
Scale
Usage/
Importance
Susan A F 150$ 65 2.1 1.1 3.6 3.8 3.1 2.1 0.4 2.3 3.9 4.5-5 High
Kiki A F 150$ 60 2.7 1.3 3.2 3.5 2.3 3.4 1.7 2.8 4.3 3.5-4.4 High Medium
Mike A M 150$ 65 3.4 1.5 4.9 2.4 2.6 3.1 2 4.2 3.8 2.5-3.4 Medium
Bill A M 120$ 70 0.5 1.1 4.2 3.3 2.1 2.4 1.3 3.2 3.6 1.6-2.4 Low Medium
JG A M 100$ 70 5 4.7 3.4 4.9 4.3 4.5 3.9 4.8 2.5 0-1.5 Low
Phil A M 100$ 48 4.6 4.1 3.6 4.7 4.7 5 4.8 5 2.2
Henry B M 90$ 40 3.1 2.5 1.2 3.7 4.1 5 4.4 4.3 2.2 Adopter Status
Jackson B M 90$ 35 4.1 3.7 4.9 2.3 4.5 4.4 4.3 4.2 0.8 4.5 - 5 Innovator
Jason B M 80$ 30 4.9 4.8 3.1 4.1 4.5 4.8 4.7 4.9 2.2 3.5 - 4.4 Early Adopters
Russell B M 80$ 60 3.5 1.1 3.5 2.1 3.2 2.3 3.5 3.7 4.8 2.5 - 3.4 Early Majority
Pat B F 75$ 52 2.6 2.3 3.2 4.1 3.3 2.3 1.5 4.3 3.6 1.6-2.4 Late Majority
Judy B F 70$ 35 2.2 2.5 3.1 3.4 2.1 2.4 2.7 3.2 4.1 0-1.5 Laggards
Alex C M 60$ 45 3.5 2.1 4.5 2.2 3.2 4.1 2.1 3.5 3.8
Kate C F 60$ 40 2.3 2 3.7 4.6 2.1 2.3 2.6 2.8 4.3 Annual Income Range
Kasey C F 60$ 55 4 3.7 4.7 2.3 4.7 3.4 4.8 4.5 2.3 A $100K+
Phyllis C F 60$ 40 2 2.5 2.2 4.3 3.2 4.3 2.7 3.4 3.8 B $99-70K
Louise C F 60$ 80 1 0.5 4.3 2.1 1.4 1.8 1.1 1.6 4.5 C $69-60K
Jason M C M 60$ 32 3.4 2.1 4.7 3.1 3.7 2.4 3.5 3.8 4.7 D $59-50K
Linda D F 55$ 45 2.1 1.5 3.4 4.9 3.3 2.3 0.7 0.8 4.6 E $49-40K
George D M 55$ 47 4.1 1.3 3.6 2.4 2.3 3.6 2.5 2.8 4.7 F $39-30K
Brad D M 50$ 57 4.7 4.9 3.1 3.8 4.3 4.4 3.6 2.6 3.5 G $29-20K
Danny E M 45$ 58 2.1 0.5 2.1 2.2 2.3 2.3 3.1 2.3 5
Robert E M 40$ 55 2.5 2.5 3.1 3.4 3.1 3.5 3.2 3.4 4.9
Marilyn E F 40$ 55 2.6 2.1 2.8 4.6 2.7 2.9 1.2 2.4 4.6
Tommy E M 40$ 60 2.5 0.5 3.1 3.5 3.6 2.5 3.7 3.5 4.3
Lyn E F 40$ 43 1.1 1.1 2.1 3.7 3.8 3.9 3.2 3.8 4.9
Maureen F F 35$ 54 0.5 1.1 3.1 3.2 2.8 2.1 2.1 2.4 4.4
Bridget F F 30$ 28 4.6 3.8 3.1 4.2 4.5 4.1 4.6 5 2.1
Michael F M 30$ 58 2.7 2.1 3.4 4.1 5 4.3 2.6 3.5 3.7
Mari F F 30$ 47 2.5 2.6 4.2 2.3 3.2 3.4 2.1 3.2 4.2
Sue G F 24$ 21 4.5 4.9 4.2 2.3 4.9 3.9 2.9 3.6 4.7
Alexander G M 20$ 18 3.2 3.7 4.1 1.7 3.2 2.1 2.7 4.6 4.8
Harrison G M 20$ 16 3.5 2.1 2.1 4.7 4.5 2.3 2.7 3.7 3.5
8/10/2010
5
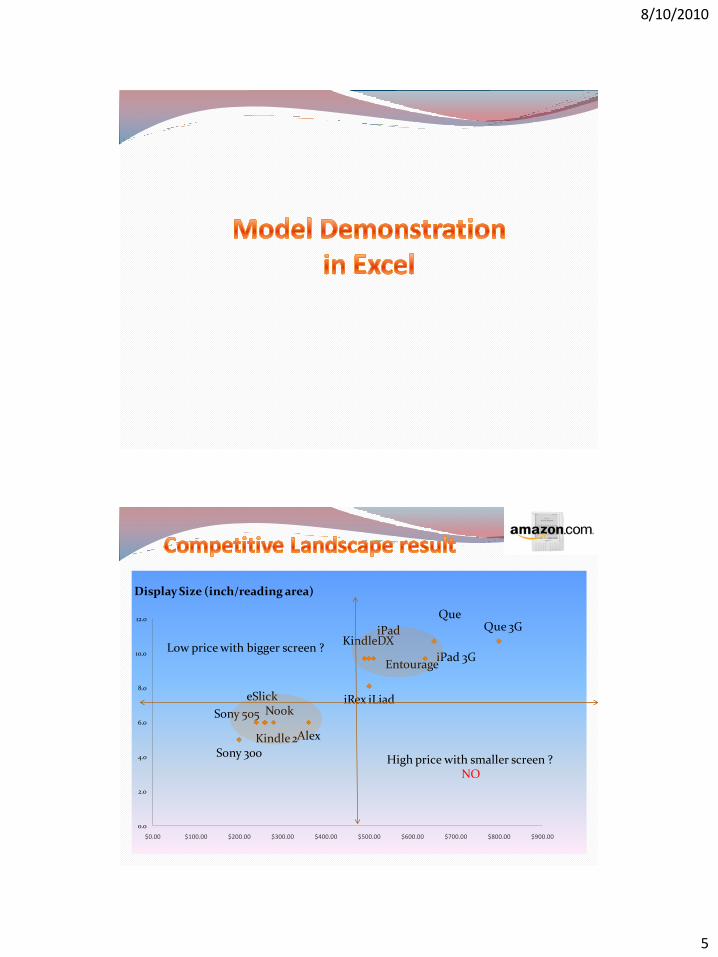
iPad
iPad 3G
Kindle 2
KindleDX
Sony 300
Sony 505 Nook
Alex
iRex iLiad
Entourage
eSlick
QueQue 3G
0.0
2.0
4.0
6.0
8.0
10.0
12.0
$0.00 $100.00 $200.00 $300.00 $400.00 $500.00 $600.00 $700.00 $800.00 $900.00
Display Size (inch/reading area)
Low price with bigger screen ?
High price with smaller screen ?NO

8/10/2010
6
Alex
Entourage Edge
eSlick
iPad
iPad 3G
iRex iLiad
Kindle
KindleDX
Nook
Que-3G
Que-WiFi
Sony PRS-505
Sony PRS-300
$0
$100
$200
$300
$400
$500
$600
$700
$800
$900
0 200000 400000 600000 800000 1000000 1200000 1400000
Price and Display Resolution(expressed in Mpixels)
Kindle
KindleDX iPad
iPad 3G
Nook
Entourage Edge
eSlick
iRex iLiad
Que-WiFi
Que-3G
Sony PRS-300
Sony PRS-505
Alex
$0
$100
$200
$300
$400
$500
$600
$700
$800
$900
0 5 10 15 20
Price and Storage Capacity(Expressed in Gbytes)
Kindle
KindleDXiPad
iPad 3G
Nook
Entourage Edge
eSlick
iRex iLiad
Que-WiFi
Que-3G
Sony PRS-300
Sony PRS-505
Alex
$0
$100
$200
$300
$400
$500
$600
$700
$800
$900
0% 10% 20% 30% 40% 50% 60% 70% 80%
Margin vs. Price
8/10/2010
7
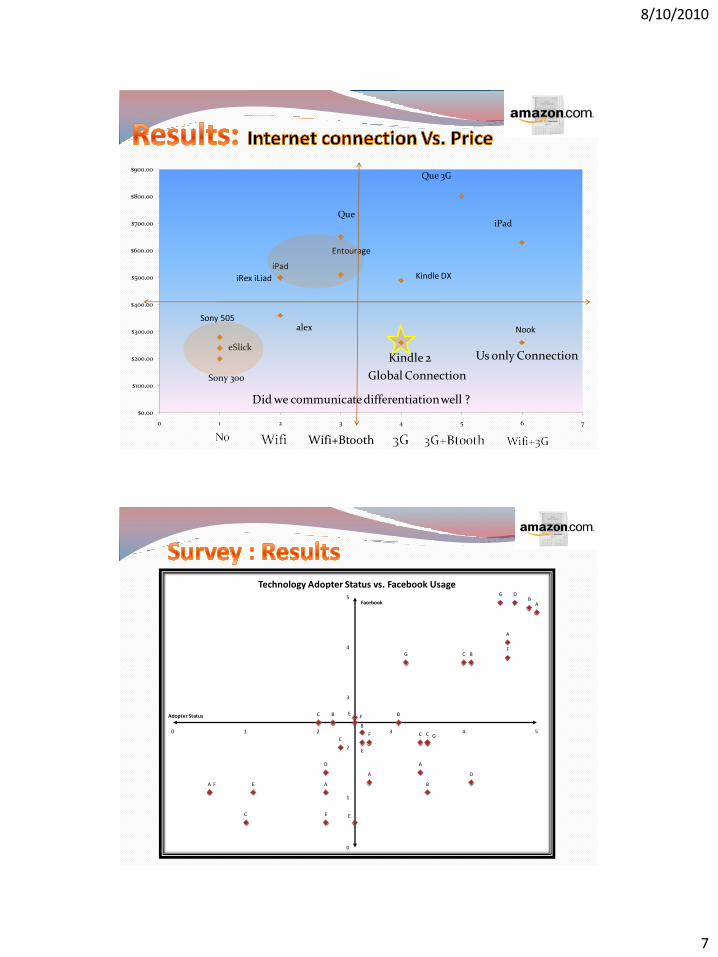
$0.00
$100.00
$200.00
$300.00
$400.00
$500.00
$600.00
$700.00
$800.00
$900.00
0 1 2 3 4 5 6 7
Sony 300
Sony 505
eSlick
iPad
iRex iLiad
alex
Que
Kindle 2
Entourage
Que 3G
Kindle DX
Nook
iPad
Us only Connection
Global Connection
Wifi+Btooth
Did we communicate differentiation well ?
A
A
A
A
A
A
B
B
B
B
B
B
CC
C
C
C
C
D
D
D
E
E
E
E
EF
F
F
F
G
G
G
0
1
2
3
4
5
0 1 2 3 4 5
Adopter Status
Technology Adopter Status vs. Facebook Usage
8/10/2010
8
A
A
A
A
A
A
B
B
B
B
B
B
C
C
C
C
C
C
D
D
D
E
E
E
E
E
F
FF
FG
G
G
0
1
2
3
4
5
0 1 2 3 4 5
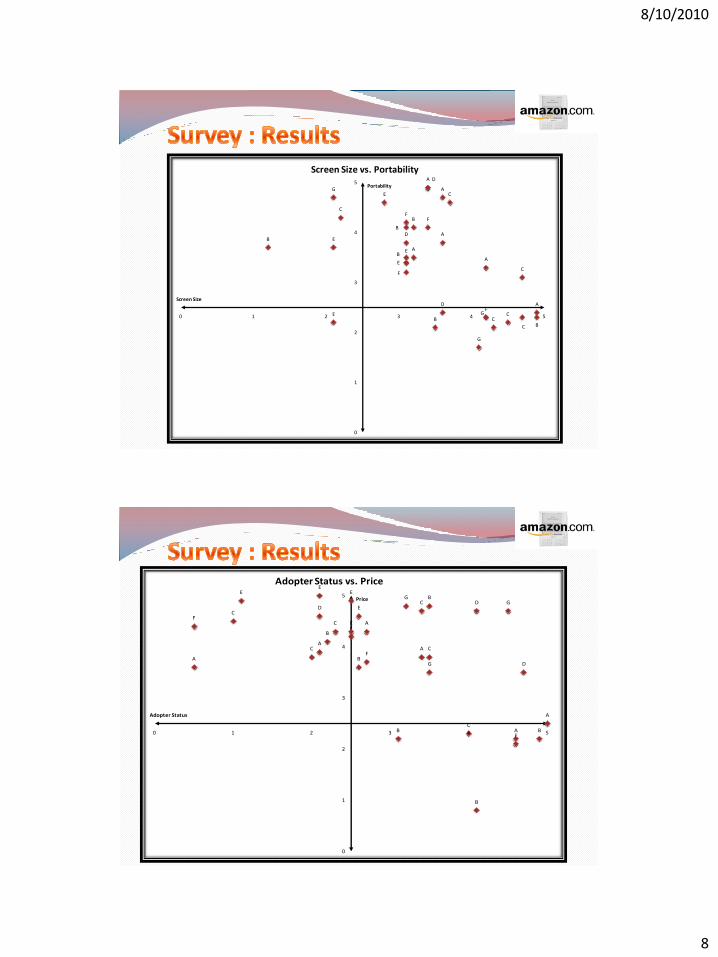
Screen Size
Portability
Screen Size vs. Portability
A
A
A
A
A
AB
B
B
B
B
B
C
C
C
C
C
CD
D
D
EE
E
E
E
F
F
F
F
GG
G
0
1
2
3
4
5
0 1 2 3 4 5
Adopter Status
Price
Adopter Status vs. Price
8/10/2010
9
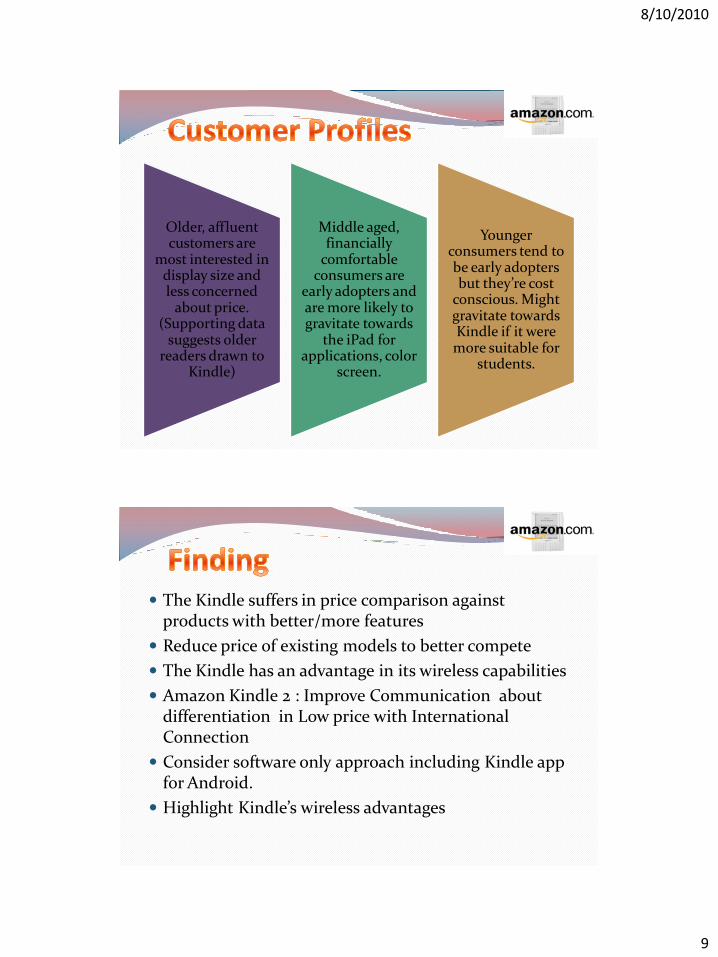
Older, affluent customers are
most interested in display size and less concerned
about price. (Supporting data
suggests older readers drawn to
Kindle)
Middle aged, financially
comfortable consumers are
early adopters and are more likely to gravitate towards
the iPad for applications, color
screen.
Younger consumers tend to be early adopters but they’re cost
conscious. Might gravitate towards Kindle if it were more suitable for
students.
The Kindle suffers in price comparison against products with better/more features
Reduce price of existing models to better compete
The Kindle has an advantage in its wireless capabilities
Amazon Kindle 2 : Improve Communication about differentiation in Low price with International Connection
Consider software only approach including Kindle app for Android.
Highlight Kindle’s wireless advantages

8/10/2010
10
• Perceptual maps provide a visual model useful in evaluating a great deal of seemingly disparate data.
• Survey data provides additional information to understand customer preferences and to create useful segments. Survey data provides a quantitative measurement to a qualitative preference.
• Model still need human judgment to validate business decision.
Increase and improve the variables on survey Increase the sample size Explore additional models that might expose different opportunities
for segmentation and positioning