Embed Size (px)
Citation preview
Building Technologies Office
Market Assessment and Commercialization Strategy for the Radial Sandia Cooler
February 2014
i
NOTICE
This report was prepared as an account of work sponsored by an agency of the
United States Government. Neither the United States Government, nor any
agency thereof, nor any of their employees, nor any of their contractors,
subcontractors, or their employees, makes any warranty, express or implied, or
assumes any legal liability or responsibility for the accuracy, completeness, or
usefulness of any information, apparatus, product, or process disclosed, or
represents that its use would not infringe privately owned rights. Reference herein
to any specific commercial product, process, or service by trade name, trademark,
manufacturer, or otherwise, does not necessarily constitute or imply its
endorsement, recommendation, or favoring by the United States Government or
any agency, contractor or subcontractor thereof. The views and opinions of
authors expressed herein do not necessarily state or reflect those of the United
States Government or any agency thereof.
Available electronically at http://www.osti.gov/home/
ii
Market Assessment and Commercialization
Strategy for the Radial Sandia Cooler
Prepared for:
U.S. Department of Energy
Office of Energy Efficiency and Renewable Energy
Building Technologies Office
http://www.buildings.energy.gov
Prepared by:
Navigant Consulting, Inc.
77 South Bedford Street, Suite 400
Burlington, MA 01803
William Goetzler
Richard Shandross
Daniel Weintraub
Jim Young
February 2014
1
Table of Contents
Table of Contents ............................................................................................................................ 1
List of Figures ................................................................................................................................. 3
List of Tables .................................................................................................................................. 4
Executive Summary ........................................................................................................................ 5
1 Introduction and Background ............................................................................................... 11
1.1 Sandia Cooler Technology Overview ........................................................................... 11
1.2 Project Overview .......................................................................................................... 13
2 Identification of High-Potential Products for Initial Commercialization ............................. 14
2.1 Licensing Goals ............................................................................................................ 14
2.2 Methodology ................................................................................................................. 15
2.2.1 Universe of Products Considered.............................................................................. 15
2.2.2 Screening and Evaluation Steps ................................................................................ 16
2.3 RSC-Product Compatibility Evaluation (Step 1) .......................................................... 17
2.3.1 Product Requirements and Heat Exchanger Characteristics ..................................... 17
2.3.2 Estimating RSC Performance at Various Sizes and Speeds ..................................... 18
2.3.2.1 Scaling Analysis: Size Feasibility ..................................................................... 18
2.3.2.2 Scaling Analysis: Performance vs. Size and Speed .......................................... 21
2.3.2.3 Scaling Analysis: Results and Conclusions ...................................................... 24
2.3.3 Compatibility Analysis ............................................................................................. 28
2.3.3.1 Compatibility Analysis Method ........................................................................ 29
2.3.3.2 Compatibility Analysis Results......................................................................... 30
2.4 Scorecard Evaluation (Step 2) ...................................................................................... 31
2.4.1 Methodology ............................................................................................................. 31
2.4.1.1 Technology Attractiveness................................................................................ 33
2.4.1.2 Market Attractiveness ....................................................................................... 33
2.4.2 Results of the Scorecard Evaluation ......................................................................... 35
2.5 Follow-Up Evaluation (Step 3) ..................................................................................... 37
2.5.1 Determining the Best-Fit Compatible Configuration ............................................... 37
2.5.2 Additional Evaluations: Energy Savings .................................................................. 37
2.5.3 Other RSC Benefits................................................................................................... 39
3 Product Deployment Strategies............................................................................................. 40
3.1 Deployment Process Overview ..................................................................................... 40
2
3.1.1 Deployment Roadmaps ............................................................................................. 40
3.2 Deployment Strategy Activities .................................................................................... 41
3.2.1 Development Activities ............................................................................................ 41
3.2.2 Communication Activities ........................................................................................ 42
3.2.3 Demonstration Activities .......................................................................................... 43
4 Recommendations ................................................................................................................. 44
4.1 Recommended Initiatives for Sandia Cooler Technology ............................................ 44
4.1.1 Recommended Near-Term Initiatives ....................................................................... 45
4.1.2 Recommended Medium-Term Initiatives ................................................................. 45
4.1.3 Recommended Longer-Term Initiatives ................................................................... 47
4.2 Conclusion .................................................................................................................... 47
References ..................................................................................................................................... 48
Appendix A Profiles of Potential RSC Applications................................................................ 49
Appendix B RSC Thermal Resistance Calculations ................................................................ 52
Appendix C RSC Power Consumption Calculations ............................................................... 55
Appendix D RSC Weight and Start-Up Torque Calculations .................................................. 57
Appendix E RSC Pressure and Air Flow Rate Calculations .................................................... 61
Appendix F Scoring Methodology and Results ....................................................................... 63
Appendix G Promising Products for Future RSC Developments ............................................ 65
Appendix H Prioritization of Deployment Activities ............................................................... 66
3
List of Figures
Figure 1-1. Overview of RSC design ............................................................................................ 12
Figure 2-1. Overview of prioritization process ............................................................................. 15
Figure 2-2. Overview of product evaluation process .................................................................... 17
Figure 2-3. Overall size feasibility analysis .................................................................................. 20
Figure 2-4. Basic RSC configurations (solid copper and vapor chamber heat pipe) and their
thermal resistances. ....................................................................................................................... 22
Figure 2-5. RSC thermal resistance and total heat throughput as a function of diameter and
speed, for an assumed temperature difference of 10°C ................................................................ 25
Figure 2-6. RSC heat flux versus diameter and speed, for an assumed T of 10°C ..................... 26
Figure 2-7. Predicted electrical power required for an RSC, versus diameter and speed ............. 26
Figure 2-8. RSC maximum pressure drop for various diameters and speeds ............................... 27
Figure 2-9. Estimated total RSC weight for various diameters, for solid copper and
vapor chamber baseplates ............................................................................................................. 28
Figure 2-10. Overview of RSC selection process for each product .............................................. 29
Figure 2-11. Map of RSC market introduction potential relative to Market
and Technology Attractiveness scores .......................................................................................... 32
Figure 2-12. Technology Attractiveness scorecard ...................................................................... 34
Figure 2-13. Market Attractiveness scorecard .............................................................................. 34
Figure 2-14. Scoring map, by product category ........................................................................... 35
Figure 4-1. Recommended commercialization roadmap for Sandia Cooler technology .............. 44
Figure D-1. RSC impeller weight, scaled for different diameters ................................................ 57
Figure D-2. Required RSC start-up torque ................................................................................... 59
Figure E-1. RSC pressure vs. air flow rate curves ........................................................................ 61
4
List of Tables
Table 1-1. Advanced Sandia Cooler Designs ............................................................................... 13
Table 1-2. Summary of Project Tasks........................................................................................... 14
Table 2-1. Products Initially Evaluated for Compatibility with the RSC ..................................... 16
Table 2-2. Summary of Key Scaling Parameters .......................................................................... 19
Table 2-3. Summary of Feasibility Analysis Findings ................................................................. 21
Table 2-4. Summary of Most Promising Products for Initial RSC Commercialization ............... 36
Table 2-5. Best Size Range for a Single-RSC Configuration for the Most-Promising Products 38
Table 2-6. Potential Fan Energy Savings for Most-Promising Products ...................................... 38
Table 3-1. Overview of Deployment Roadmaps .......................................................................... 40
Table A-1. Basic Profiles of Products Considered for RSC Introduction .................................... 49
Table B-1. RSC Thermal Resistance, Solid Copper Baseplate Configuration ............................. 54
Table C-1. Total RSC Electrical Power ........................................................................................ 56
Table D-1. Estimates of RSC Impeller Weight for Different Sizes .............................................. 58
Table D-2. Required Start-Up Torque for Various RSC Sizes ..................................................... 60
Table E-1. SNL P-Q Test Data for the 10-cm RSC at 2,500 RPM ............................................... 62
Table F-1. Technology Attractiveness Scores .............................................................................. 63
Table F-2. Market Attractiveness Scores ...................................................................................... 64
Table H-1. Communication Activities .......................................................................................... 66
Table H-2. Demonstration Activities ............................................................................................ 67

5
Executive Summary
Background
The U.S. Department of Energy (DOE) Office of Energy Efficiency and Renewable Energy
(EERE) Building Technologies Office (BTO) commissioned Navigant to conduct this market
assessment and commercialization strategy for the rotating heat exchanger technology developed
at Sandia National Laboratories (SNL) and known as the Radial Sandia Cooler (RSC). The
market potential of the RSC was evaluated for the residential, commercial, industrial, and
transportation markets.
Radial Sandia Cooler Overview
The RSC is a novel, motor-driven, rotating, finned heat exchanger developed by Dr. Jeff Koplow
and his team at SNL. The RSC consists of three main components: an impeller (a rotating, finned
heat sink), a baseplate, and an integrated brushless DC motor. The impeller is powered by the
motor, allowing it to rotate on a thin hydrodynamic air bearing above the stationary baseplate.
In operation, the underside of the baseplate is mounted to a heat source. Heat flows through the
baseplate, air bearing gap, impeller base, and impeller fins, and is ultimately transferred to
surrounding airflow. Because the impeller fins are rotating at up to several thousand RPM, the
air flow experiences a centrifugal force that decreases the thickness of the boundary layer, by as
much as a factor of 10. This thinning of the boundary layer significantly improves the air-side
heat transfer coefficient of the heat exchanger, as compared to traditional fan and fin devices.
Overview of RSC design Source: Sandia National Laboratories
Heat-sink-impeller
Vapor chamber baseplate Hydrodynamic air bearing
Anti-friction coating
Sensor-less, brushless motor
6
In 2010 and 2011, the SNL team developed a proof-of-concept prototype of the RSC, designed
for electronics cooling applications. The prototype was 10 cm in diameter and was designed for a
concentrated heat source such as a computer processor chip. As a part of a greater market
assessment and commercialization analysis, this paper explores the feasibility and anticipated
performance of derivative (i.e., scaled) models, both smaller and larger.
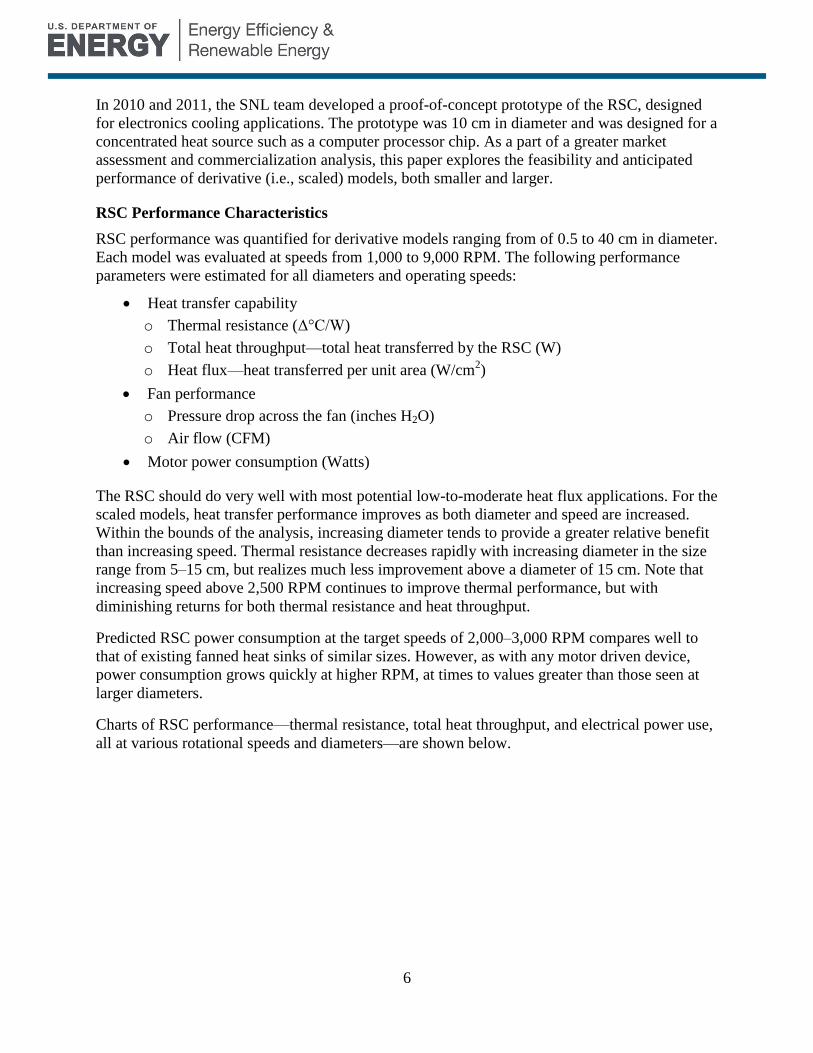
RSC Performance Characteristics
RSC performance was quantified for derivative models ranging from of 0.5 to 40 cm in diameter.
Each model was evaluated at speeds from 1,000 to 9,000 RPM. The following performance
parameters were estimated for all diameters and operating speeds:
Heat transfer capability
o Thermal resistance (Δ°C/W)
o Total heat throughput—total heat transferred by the RSC (W)
o Heat flux—heat transferred per unit area (W/cm2)
Fan performance
o Pressure drop across the fan (inches H2O)
o Air flow (CFM)
Motor power consumption (Watts)
The RSC should do very well with most potential low-to-moderate heat flux applications. For the
scaled models, heat transfer performance improves as both diameter and speed are increased.
Within the bounds of the analysis, increasing diameter tends to provide a greater relative benefit
than increasing speed. Thermal resistance decreases rapidly with increasing diameter in the size
range from 5–15 cm, but realizes much less improvement above a diameter of 15 cm. Note that
increasing speed above 2,500 RPM continues to improve thermal performance, but with
diminishing returns for both thermal resistance and heat throughput.
Predicted RSC power consumption at the target speeds of 2,000–3,000 RPM compares well to
that of existing fanned heat sinks of similar sizes. However, as with any motor driven device,
power consumption grows quickly at higher RPM, at times to values greater than those seen at
larger diameters.
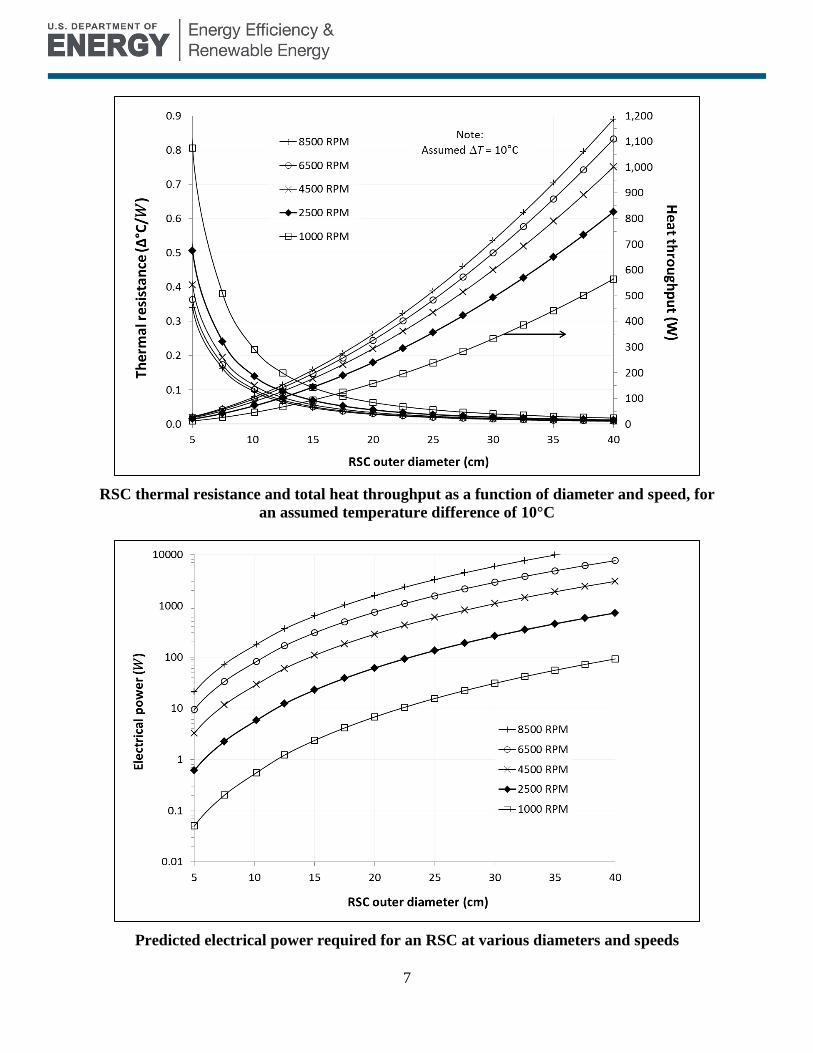
Charts of RSC performance—thermal resistance, total heat throughput, and electrical power use,
all at various rotational speeds and diameters—are shown below.
7
RSC thermal resistance and total heat throughput as a function of diameter and speed, for
an assumed temperature difference of 10°C
Predicted electrical power required for an RSC at various diameters and speeds

8
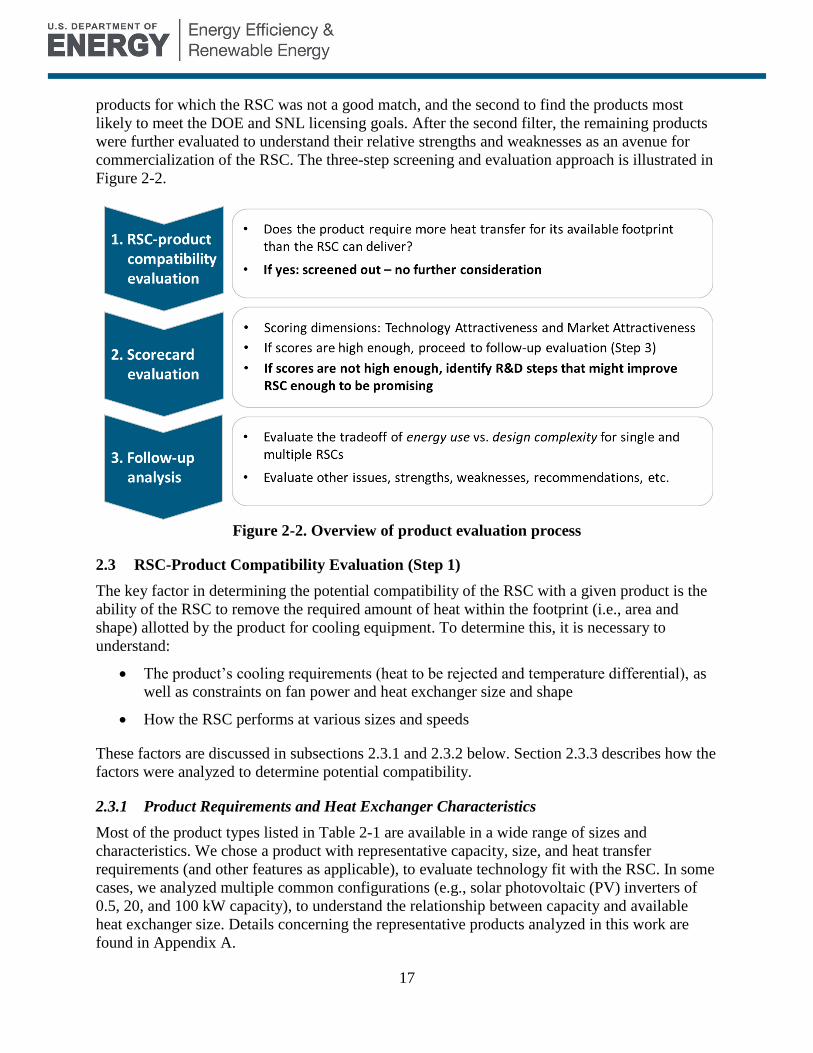
High-Potential Opportunities for Initial Commercialization
Identifying high potential opportunities was a multi-stage process. The first stage involved the
development of a list of all products for which the RSC might be suitable. The products on the
initial list were subjected to two levels of screening: the first to eliminate products for which the
RSC was not a good match, and the second to find the products most likely to meet DOE and
SNL licensing goals. After the second filter, the remaining products were further evaluated to
understand their relative strengths and weaknesses as an avenue for commercialization of the
RSC. The figure below illustrates this process.
Overview of prioritization process
The screening process identified six products with a high potential for successful RSC
introduction. These products are outlined below:
Standard PC processor (laptop-desktop)
Description: Laptop and desktop computers require heat sinks, heat pipes, and fans to
remove heat generated by the processor and other components
Benefits from RSC: Noise and fouling reduction, potential size reduction for laptops
High-performance PC processor (gaming PC)
Description: Gaming PCs use high-performance computing and graphics processors that
typically require large, fanned heat sinks
Benefits from RSC: Significant size advantage, ability to increase clock speeds, variable
capacity, reduced noise and fouling
9
Peltier devices
Description: Using the thermoelectric effect, Peltier devices remove heat from sealed
enclosures at ambient conditions for remote telecommunications, military, and other
mission-critical electronics applications
Benefits from RSC: Opportunity for either size reduction or performance enhancement,
reduced fouling
Data center processor (server)
Description: Within data centers, server processors use heat sinks with either integral fans
or those located within the rack to reject the significant amounts of heat generated in the
server enclosure
Benefit from RSC: Reduced size could allow either more components within a space or a
smaller enclosure, variable capacity
A/V equipment
Description: Audio-visual equipment (e.g., stereo receivers, set-top boxes, game
consoles, projectors) and other enclosed electronic devices require proper thermal
management to maintain operations
Benefits from RSC: Reduced size, noise, and fouling
Residential refrigerator
Description: Refrigerators use fans to supply airflow over condenser coils whose
performance is limited by current fin-and-tube heat exchangers and dust accumulation
over time
Benefits from RSC: Improved coefficient-of-performance (COP), additional refrigerated
space, variable capacity, noise and fouling reduction
Recommended Initiatives for Sandia Cooler Technology
Recommendations for commercialization were made based on assessments of the prototype RSC
and the Sandia Cooler technology in general, as well as an in-depth analysis of the six most
promising products for initial RSC commercialization. Because of the wide applicability of the
technology, multiple cycles of development, demonstration, and subsequent commercialization
are most appropriate for the Sandia Cooler technology.
We recommend the following priorities for commercialization activities:
Focus the initial commercialization effort on high-performance PCs (e.g., gaming
computers), as a readily attainable entry point into the broader electronics market. Within
that broader market, the other identified high-potential products—standard PC processor,
data center processor, and A/V equipment—should be pursued after efforts related to
high-performance PCs are well underway.
10
Pursue lighting and residential refrigeration applications as medium-term goals. These
applications would involve later RSC generations that have benefitted from ongoing
R&D activities and the information gained from experience in the electronics markets.
Continue development of Sandia Coolers for HVAC and other higher-heat-flux
applications, as longer-term prospects whose viability may be assessed through current
and future R&D projects.

11
1 Introduction and Background
The U.S. Department of Energy (DOE) Office of Energy Efficiency and Renewable Energy
(EERE) Building Technologies Office (BTO) commissioned Navigant to conduct this market
assessment and address the commercialization strategy for the rotating heat exchanger
technology developed at Sandia National Laboratories (SNL), which is known as the Radial
Sandia Cooler (RSC). The market potential of the RSC was evaluated for the residential,
commercial, industrial, and transportation markets.
1.1 Sandia Cooler Technology Overview
For a variety of mechanical and electrical systems, air-cooled heat exchangers are used to reject
excess heat from a concentrated source to the surrounding atmosphere. Traditionally, air-side
heat exchanger enhancement is accomplished by increasing surface area and/or the heat transfer
coefficient (e.g., fin number and/or geometry), raising thermal conductivity (e.g., improved
materials), or supplying more airflow (e.g., larger or higher-speed fan). Advancements in heat
exchanger design have been very limited in recent years for most product applications.
Constraints on heat exchanger performance force designers of many products that require
cooling to compromise on product size, capabilities, energy efficiency, or other characteristics. A
significant improvement in the effectiveness of air-cooled heat exchangers would have a
profound effect on the design, efficiency, and performance of such products. With support from
BTO, Dr. Jeff Koplow and his team at SNL have developed a novel rotating heat exchange
technology known as the Sandia Cooler, of which the RSC is one form (Koplow 2010). The
Sandia Cooler technology improves heat exchanger effectiveness considerably.
The core of the Sandia Cooler technology is the rotation of a finned heat sink (“heat-sink-
impeller” or, in this document, simply “impeller”). Rotation induces airflow over the curved fins,
resulting in transfer of heat from a concentrated heat load, located under the impeller base, to the
moving air. Because the impeller fins are rotating at up to several thousand RPM, the air flow
experiences a centrifugal force that reduces the thickness of the boundary layer by as much as a
factor of ten. This thinning of the boundary layer significantly improves the air-side heat transfer
coefficient of the heat exchanger. Imparting motion directly to the impeller, as opposed to
directing a flow of air from a fan at a stationary impeller, also makes it possible to achieve higher
fin/air relative velocity at a given (electrical motor) power consumption. Depending on the
specific application and design, this could result in reduced heat exchanger size, improved
performance, and/or greater efficiency. Additionally, little dust accumulates on the moving heat
transfer surfaces, allowing heat exchanger performance to be maintained over time without
cleaning of the fins.
The Radial Sandia Cooler, or RSC, is a type of Sandia Cooler in which the air is accelerated
radially from the center of the (flat) heat-sink-impeller, outward through the fins. In 2010 and
2011, the team at SNL developed a proof-of-concept prototype of the RSC, designed for
electronics cooling applications, in which the impeller is located above a baseplate. The heat
source, such as a computer processor chip, is attached to the RSC at the baseplate.
Rotation causes the impeller to lift off the baseplate, forming a hydrodynamic air bearing that is
several microns thick. Heat flows from the heat source, through the baseplate, air bearing,
12
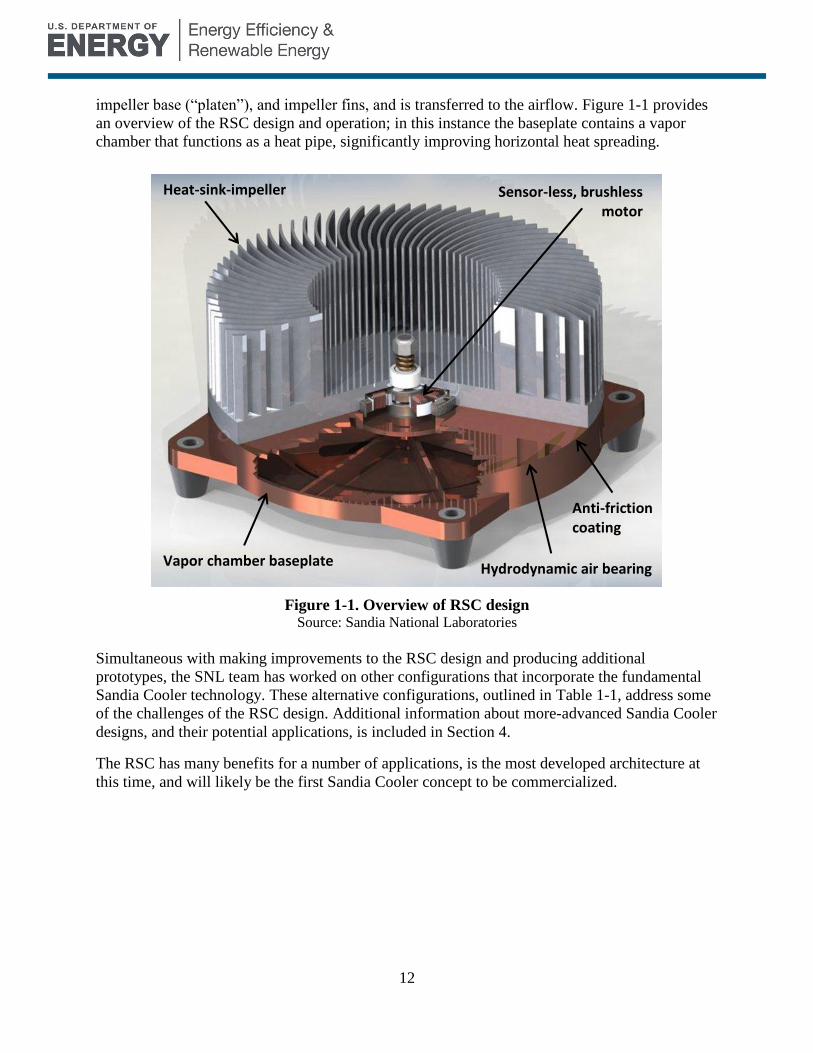
impeller base (“platen”), and impeller fins, and is transferred to the airflow. Figure 1-1 provides
an overview of the RSC design and operation; in this instance the baseplate contains a vapor
chamber that functions as a heat pipe, significantly improving horizontal heat spreading.
Figure 1-1. Overview of RSC design Source: Sandia National Laboratories
Simultaneous with making improvements to the RSC design and producing additional
prototypes, the SNL team has worked on other configurations that incorporate the fundamental
Sandia Cooler technology. These alternative configurations, outlined in Table 1-1, address some
of the challenges of the RSC design. Additional information about more-advanced Sandia Cooler
designs, and their potential applications, is included in Section 4.
The RSC has many benefits for a number of applications, is the most developed architecture at
this time, and will likely be the first Sandia Cooler concept to be commercialized.
Heat-sink-impeller
Vapor chamber baseplate Hydrodynamic air bearing
Anti-friction coating
Sensor-less, brushless motor

13
Table 1-1. Advanced Sandia Cooler Designs
Design Description
RSC without
air bearing
Operating without an air bearing provides three main benefits:
1. Greatly simplifies RSC design, especially for multiple axis orientations
2. Improves heat transfer by removing the air bearing’s thermal resistance
3. Decreases motor power by eliminating the shearing torque of the air
bearing.
Baseplate
integration with
tubing
The current RSC baseplate is designed for contact with solid heat generating
components. Integrating fluid tubing or coils into the baseplate would facilitate
heat transfer for gaseous and liquid applications.
Axial air flow
To achieve greater RSC heat transfer area, the impeller diameter, and therefore
the footprint, generally needs to be increased. Heat transfer area could be
increased without a significant change in footprint with an axial configuration,
in which rows of fins rotate around a central hub. The axial arrangement offers
better performance for a given area (Koplow 2012a).
1.2 Project Overview
For context, in this study the term commercialization means the full process of developing a
technology for introduction to the marketplace, while deployment refers to the process of
acquiring specific avenues for introduction of the technology as a product.
The assessment involved the four tasks outlined in Table 1-2. Because RSC development
continued throughout this assessment, we updated our findings as new information became
available. At the conclusion of each task, we provided our results to SNL and BTO, gathered
feedback, and discussed new developments. This report provides our assessment based on the
information to date.
14
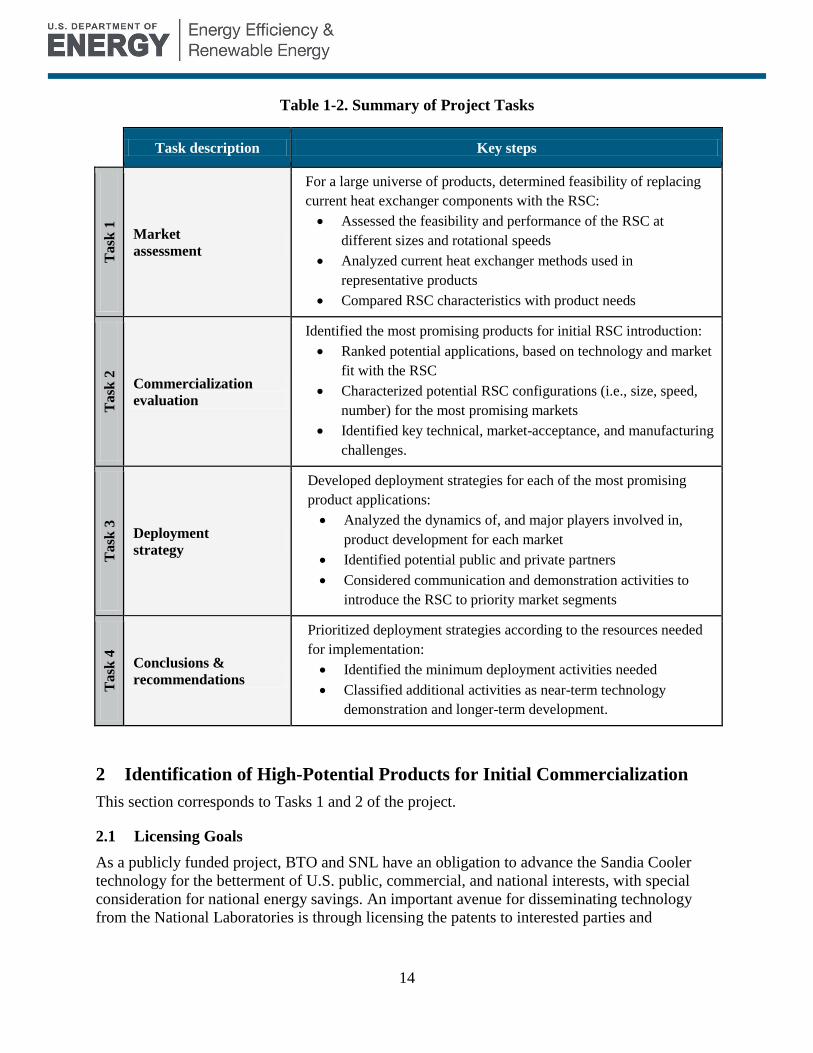
Table 1-2. Summary of Project Tasks
Task description Key steps
Ta
sk 1
Market
assessment
For a large universe of products, determined feasibility of replacing
current heat exchanger components with the RSC:
Assessed the feasibility and performance of the RSC at
different sizes and rotational speeds
Analyzed current heat exchanger methods used in
representative products
Compared RSC characteristics with product needs
Task
2
Commercialization
evaluation
Identified the most promising products for initial RSC introduction:
Ranked potential applications, based on technology and market
fit with the RSC
Characterized potential RSC configurations (i.e., size, speed,
number) for the most promising markets
Identified key technical, market-acceptance, and manufacturing
challenges.
Task
3
Deployment
strategy
Developed deployment strategies for each of the most promising
product applications:
Analyzed the dynamics of, and major players involved in,
product development for each market
Identified potential public and private partners
Considered communication and demonstration activities to
introduce the RSC to priority market segments
Task
4
Conclusions &
recommendations
Prioritized deployment strategies according to the resources needed
for implementation:
Identified the minimum deployment activities needed
Classified additional activities as near-term technology
demonstration and longer-term development.
2 Identification of High-Potential Products for Initial Commercialization
This section corresponds to Tasks 1 and 2 of the project.
2.1 Licensing Goals
As a publicly funded project, BTO and SNL have an obligation to advance the Sandia Cooler
technology for the betterment of U.S. public, commercial, and national interests, with special
consideration for national energy savings. An important avenue for disseminating technology
from the National Laboratories is through licensing the patents to interested parties and

15
providing support to develop the technology for specific product applications. BTO and SNL
have near- and long-term commercialization goals for the RSC:
The near-term goal for the RSC is to license the technology with a major original
equipment manufacturer (OEM). This will demonstrate to other potential partners, and
the market as a whole, that the technology is mature enough to consider for adoption into
commercial products. Furthermore, the experience gained in working on real-world
applications can only help SNL to continue improving the performance and capabilities
of the RSC (and other Sandia Cooler variations) going forward. Licensing has already
occurred in some product categories, but a goal of this work is to assist SNL in
identifying additional products that are likely to succeed.
For the longer term, a wider impact on reducing energy consumption in the United States
and abroad is important, specifically by reaching high annual volume with major industry
partners in several key sectors.
2.2 Methodology
An overview of the process used to identify high-potential products for initial RSC introduction
is shown in Figure 2-1.
Figure 2-1. Overview of prioritization process
2.2.1 Universe of Products Considered
The first step in the multi-stage process shown in Figure 2-1 involved developing a list of
products in the residential, commercial, industrial, and transportation sectors for which the RSC
might be suitable. Table 2-1 summarizes the product types considered for the RSC.
16
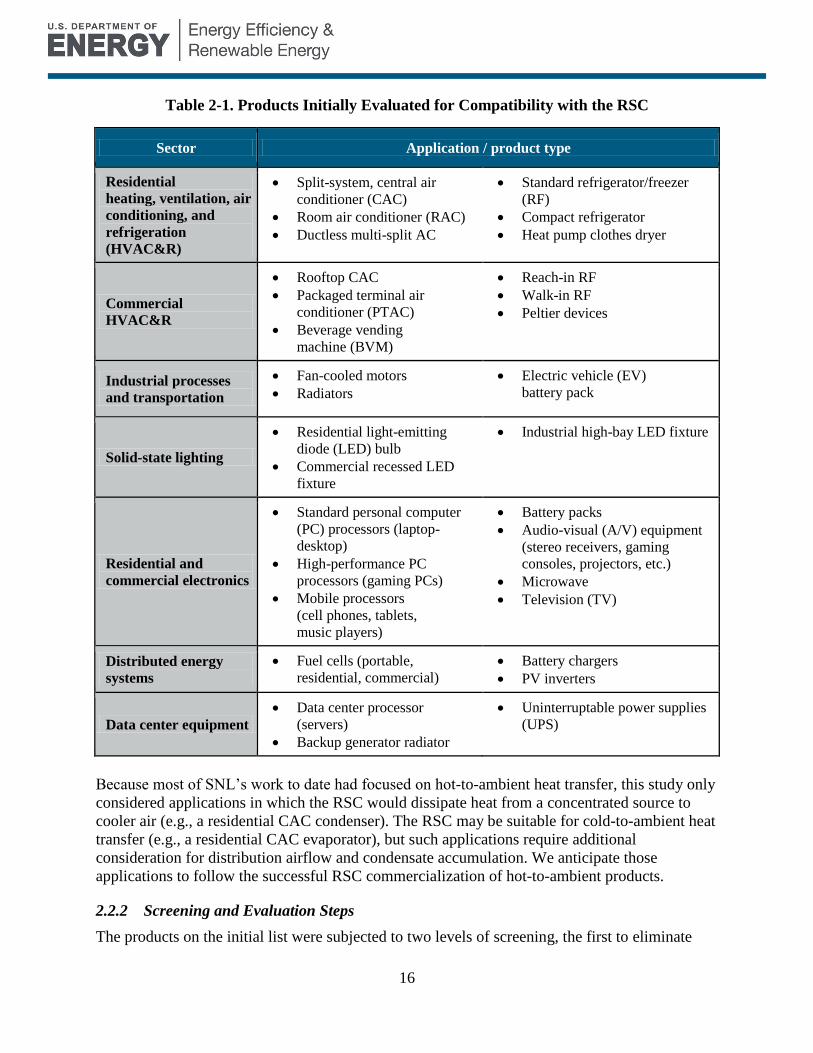
Table 2-1. Products Initially Evaluated for Compatibility with the RSC
Sector Application / product type
Residential
heating, ventilation, air
conditioning, and
refrigeration
(HVAC&R)
Split-system, central air
conditioner (CAC)
Room air conditioner (RAC)
Ductless multi-split AC
Standard refrigerator/freezer
(RF)
Compact refrigerator
Heat pump clothes dryer
Commercial
HVAC&R
Rooftop CAC
Packaged terminal air
conditioner (PTAC)
Beverage vending
machine (BVM)
Reach-in RF
Walk-in RF
Peltier devices
Industrial processes
and transportation
Fan-cooled motors
Radiators
Electric vehicle (EV)
battery pack
Solid-state lighting
Residential light-emitting
diode (LED) bulb
Commercial recessed LED
fixture
Industrial high-bay LED fixture
Residential and
commercial electronics
Standard personal computer
(PC) processors (laptop-
desktop)
High-performance PC
processors (gaming PCs)
Mobile processors
(cell phones, tablets,
music players)
Battery packs
Audio-visual (A/V) equipment
(stereo receivers, gaming
consoles, projectors, etc.)
Microwave
Television (TV)
Distributed energy
systems
Fuel cells (portable,
residential, commercial)
Battery chargers
PV inverters
Data center equipment
Data center processor
(servers)
Backup generator radiator
Uninterruptable power supplies
(UPS)
Because most of SNL’s work to date had focused on hot-to-ambient heat transfer, this study only
considered applications in which the RSC would dissipate heat from a concentrated source to
cooler air (e.g., a residential CAC condenser). The RSC may be suitable for cold-to-ambient heat
transfer (e.g., a residential CAC evaporator), but such applications require additional
consideration for distribution airflow and condensate accumulation. We anticipate those
applications to follow the successful RSC commercialization of hot-to-ambient products.
2.2.2 Screening and Evaluation Steps
The products on the initial list were subjected to two levels of screening, the first to eliminate
17
products for which the RSC was not a good match, and the second to find the products most
likely to meet the DOE and SNL licensing goals. After the second filter, the remaining products
were further evaluated to understand their relative strengths and weaknesses as an avenue for
commercialization of the RSC. The three-step screening and evaluation approach is illustrated in
Figure 2-2.
Figure 2-2. Overview of product evaluation process
2.3 RSC-Product Compatibility Evaluation (Step 1)
The key factor in determining the potential compatibility of the RSC with a given product is the
ability of the RSC to remove the required amount of heat within the footprint (i.e., area and
shape) allotted by the product for cooling equipment. To determine this, it is necessary to
understand:
The product’s cooling requirements (heat to be rejected and temperature differential), as
well as constraints on fan power and heat exchanger size and shape
How the RSC performs at various sizes and speeds
These factors are discussed in subsections 2.3.1 and 2.3.2 below. Section 2.3.3 describes how the
factors were analyzed to determine potential compatibility.
2.3.1 Product Requirements and Heat Exchanger Characteristics
Most of the product types listed in Table 2-1 are available in a wide range of sizes and
characteristics. We chose a product with representative capacity, size, and heat transfer
requirements (and other features as applicable), to evaluate technology fit with the RSC. In some
cases, we analyzed multiple common configurations (e.g., solar photovoltaic (PV) inverters of
0.5, 20, and 100 kW capacity), to understand the relationship between capacity and available
heat exchanger size. Details concerning the representative products analyzed in this work are
found in Appendix A.

18
2.3.2 Estimating RSC Performance at Various Sizes and Speeds
For most forced-convection heat exchangers, increasing the size of the heat exchanger or the
flow rate of the cooling fluid increases the amount of heat that can be removed. This relationship
generally holds true for the RSC as well; i.e., the heat transfer ability of the RSC varies with
impeller diameter and/or rotational speed. The RSC proof-of-concept prototype was originally
designed with a 10 cm diameter (more precisely, 10.16 cm), operating at 2,000–3,000 RPM, to
satisfy a relatively low heat load (75–100 W) that is typical for electronics cooling. To satisfy
greater heat transfer requirements, the diameter of a single RSC can be increased so that the heat
exchanger area increases, or several RSCs could be operated side-by-side.
In order to evaluate the compatibility of the RSC with the products listed in Table 2-1, we
developed an understanding of how RSC performance scales with changes in size, speed, and
number. The scaling analysis consisted of two key tasks:
1. Size feasibility analysis—quantification of factors leading to engineering uncertainty:
Understanding the relationships and tradeoffs between design parameters (e.g.,
weight, friction, torque, and motor selection)
Identifying engineering limitations at different RSC sizes, and how they could be
mitigated
Determining the size and speed combinations for which tradeoffs and limitations
outweigh heat transfer gains, therefore requiring multiple smaller RSCs, product
redesign, or use of alternative architectures instead
2. Performance analysis—development of performance maps at various speeds and sizes:
Heat transfer capabilities (i.e., thermal resistance and heat removed)
RSC power consumption, comprising fan and air-bearing torque components
Heat load requirements ranging from 1 W to several hundred kW (or more) were considered.
2.3.2.1 Scaling Analysis: Size Feasibility
The feasibility analysis began with an investigation of the fundamental engineering viability of
the RSC at diameters above 10 cm. Specifically, engineering viability was viewed as the ability
of the RSC to work—to spin, create an air bearing, and function without failure or damage.
Scale-up was analyzed using general equations for fan performance, solid mechanics, and air
bearings. Fin height and fan inlet diameter were kept constant during the analysis; RSC size was
changed by varying the fan outlet diameter. The analysis relied on SNL data from testing of their
10–cm prototype, as well as motor manufacturer literature. No mechanical or flow simulation
tools (e.g., finite element or finite difference modeling software) were used.
Scaling down from 10 cm was not included in the analysis, as it is not expected to pose a
significant engineering risk; however, we expect that below about 5 cm the RSC would require
additional redesign, such as reduced fin heights.
19
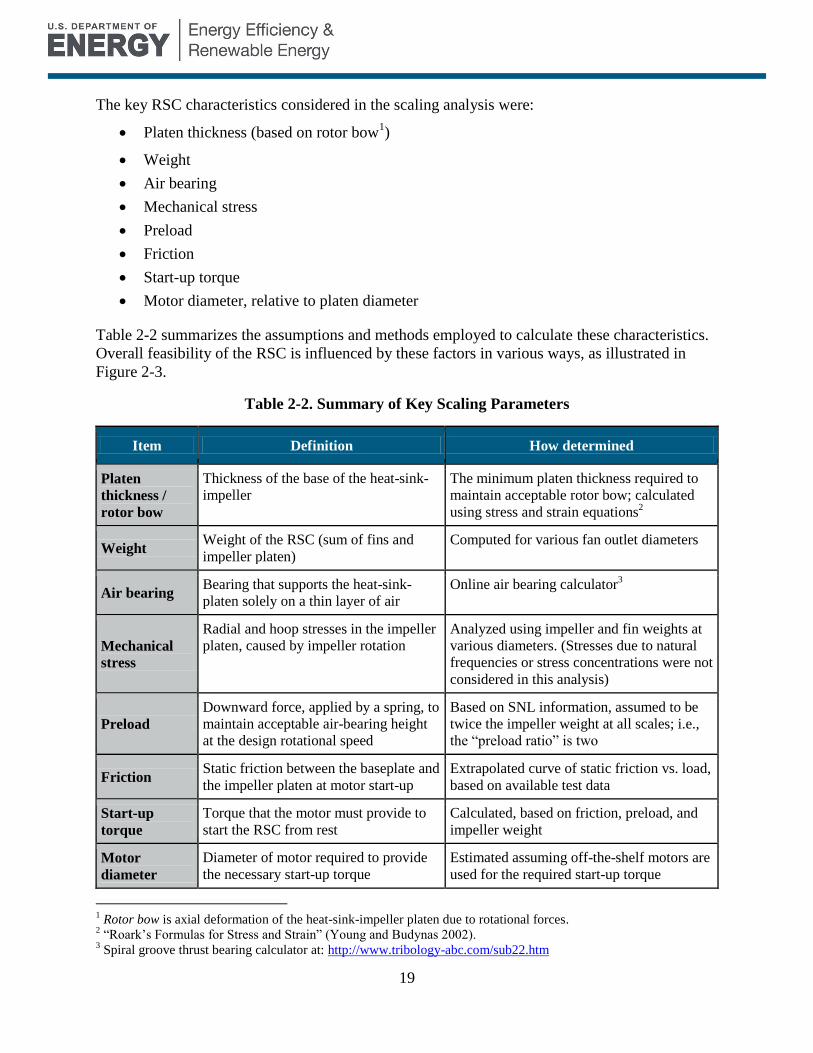
The key RSC characteristics considered in the scaling analysis were:
Platen thickness (based on rotor bow1)
Weight
Air bearing
Mechanical stress
Preload
Friction
Start-up torque
Motor diameter, relative to platen diameter
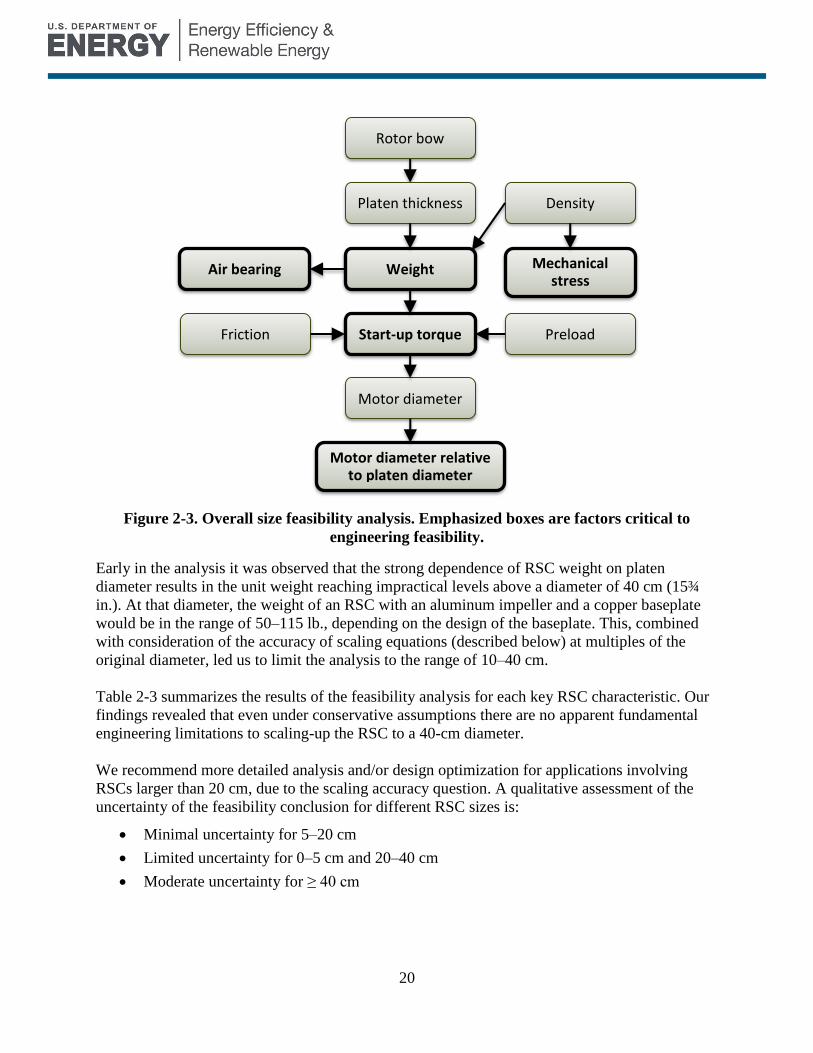
Table 2-2 summarizes the assumptions and methods employed to calculate these characteristics.
Overall feasibility of the RSC is influenced by these factors in various ways, as illustrated in
Figure 2-3.
Table 2-2. Summary of Key Scaling Parameters
Item Definition How determined
Platen
thickness /
rotor bow
Thickness of the base of the heat-sink-
impeller
The minimum platen thickness required to
maintain acceptable rotor bow; calculated
using stress and strain equations2
Weight Weight of the RSC (sum of fins and
impeller platen)
Computed for various fan outlet diameters
Air bearing Bearing that supports the heat-sink-
platen solely on a thin layer of air
Online air bearing calculator3
Mechanical
stress
Radial and hoop stresses in the impeller
platen, caused by impeller rotation
Analyzed using impeller and fin weights at
various diameters. (Stresses due to natural
frequencies or stress concentrations were not
considered in this analysis)
Preload
Downward force, applied by a spring, to
maintain acceptable air-bearing height
at the design rotational speed
Based on SNL information, assumed to be
twice the impeller weight at all scales; i.e.,
the “preload ratio” is two
Friction Static friction between the baseplate and
the impeller platen at motor start-up
Extrapolated curve of static friction vs. load,
based on available test data
Start-up
torque
Torque that the motor must provide to
start the RSC from rest
Calculated, based on friction, preload, and
impeller weight
Motor
diameter
Diameter of motor required to provide
the necessary start-up torque
Estimated assuming off-the-shelf motors are
used for the required start-up torque
1 Rotor bow is axial deformation of the heat-sink-impeller platen due to rotational forces.
2 “Roark’s Formulas for Stress and Strain” (Young and Budynas 2002).
3 Spiral groove thrust bearing calculator at: http://www.tribology-abc.com/sub22.htm
20
Figure 2-3. Overall size feasibility analysis. Emphasized boxes are factors critical to
engineering feasibility.
Early in the analysis it was observed that the strong dependence of RSC weight on platen
diameter results in the unit weight reaching impractical levels above a diameter of 40 cm (15¾
in.). At that diameter, the weight of an RSC with an aluminum impeller and a copper baseplate
would be in the range of 50–115 lb., depending on the design of the baseplate. This, combined
with consideration of the accuracy of scaling equations (described below) at multiples of the
original diameter, led us to limit the analysis to the range of 10–40 cm.
Table 2-3 summarizes the results of the feasibility analysis for each key RSC characteristic. Our
findings revealed that even under conservative assumptions there are no apparent fundamental
engineering limitations to scaling-up the RSC to a 40-cm diameter.
We recommend more detailed analysis and/or design optimization for applications involving
RSCs larger than 20 cm, due to the scaling accuracy question. A qualitative assessment of the
uncertainty of the feasibility conclusion for different RSC sizes is:
Minimal uncertainty for 5–20 cm
Limited uncertainty for 0–5 cm and 20–40 cm
Moderate uncertainty for ≥ 40 cm
Rotor bow
Platen thickness
Weight
Start-up torque Friction
Motor diameter
Motor diameter relative to platen diameter
Mechanical stress
Preload
Density
Air bearing

21
Table 2-3. Summary of Feasibility Analysis Findings
Characteristic Findings
Friction
Static coefficient of friction for baseplate coating improves with total
loading and therefore diameter
Not anticipated to limit feasibility
Rotor bow
Platen deflection grows to the 3rd
power of diameter, and shrinks to
the 3rd
power of impeller platen thickness
Deflection can be easily mitigated by minor RSC redesign
Weight
RSC weight scales to the 3rd
power of diameter
Larger RSCs may be too heavy for some applications, but weight is
not anticipated to be a major limiting factor
Start-up torque
Torque scales to the 3rd
power of diameter
Start-up torque can be accommodated by off-the-shelf brushless
direct-current motors (BLDC) running 12 or 24 V
Motor diameter Off-the-shelf motors fit within the available RSC platen area, but
begin to reduce the available platen heat transfer area at larger RSC
diameters (above 20 to 25 cm)
RSC or motor redesign can mitigate these impacts Platen heat transfer
area
Mechanical stress
Radial and hoop stresses were found to be acceptable
Additional investigation is necessary to evaluate the effect of natural
frequencies on the RSC system
2.3.2.2 Scaling Analysis: Performance vs. Size and Speed
With the feasibility of scaling the RSC to larger sizes established, the next step in our analysis
was to understand how the RSC performs at scaled sizes and speeds. The goal of this analysis
was to map the performance of the RSC for diameters of 0.5 to 40 cm and speeds of 1,000 to
9,000 RPM, and to evaluate the results. Performance was quantified using the measures listed
below and described immediately afterward.
Heat transfer capability:
o Thermal resistance (Δ°C/W)
o Total heat throughput—total heat transferred by the RSC (W)
o Heat flux—heat transferred per unit area (W/cm2)
Fan performance:
o Pressure drop across the fan (inches H2O)
o Air flow (CFM)
Motor power consumption (Watts)
22
2.3.2.2.1 Thermal Resistance
Thermal resistance is an important figure of merit for heat sink thermal performance. It
represents the effective resistance of an object to heat flow, and is characterized by the
temperature difference across the object per unit of heat throughput. The lower the thermal
resistance, the smaller the temperature drop across it when 1 W of heat energy flows through it.
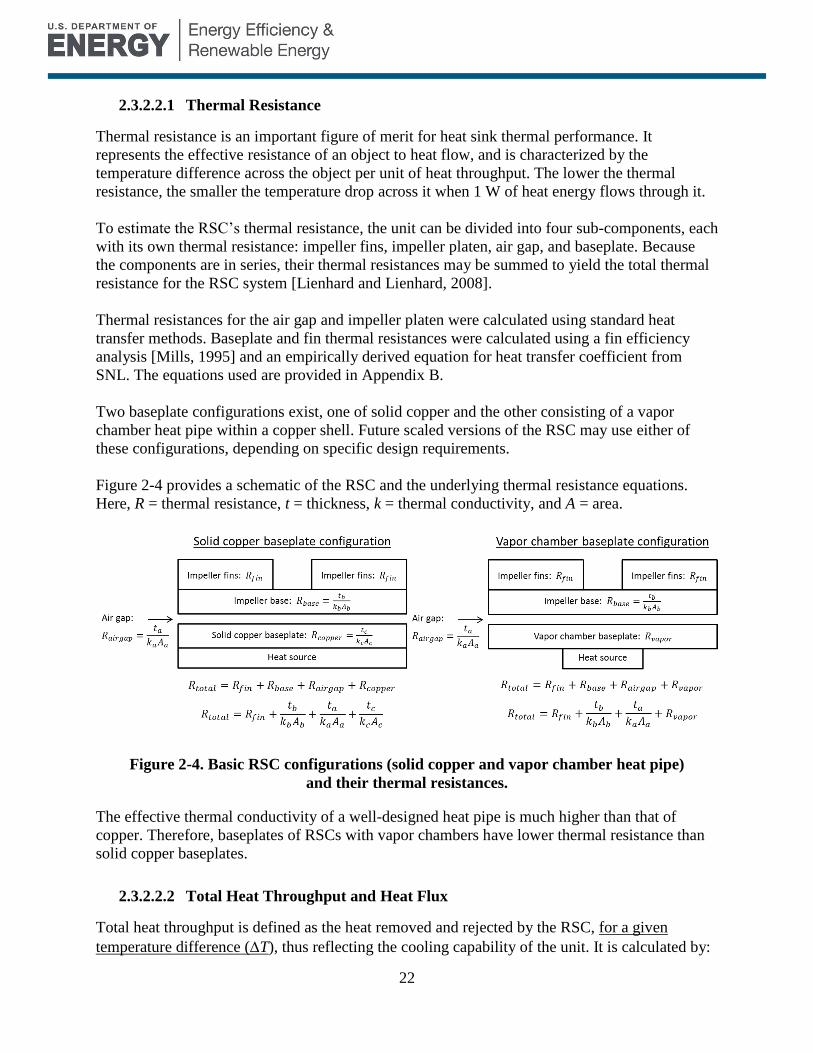
To estimate the RSC’s thermal resistance, the unit can be divided into four sub-components, each
with its own thermal resistance: impeller fins, impeller platen, air gap, and baseplate. Because
the components are in series, their thermal resistances may be summed to yield the total thermal
resistance for the RSC system [Lienhard and Lienhard, 2008].
Thermal resistances for the air gap and impeller platen were calculated using standard heat
transfer methods. Baseplate and fin thermal resistances were calculated using a fin efficiency
analysis [Mills, 1995] and an empirically derived equation for heat transfer coefficient from
SNL. The equations used are provided in Appendix B.
Two baseplate configurations exist, one of solid copper and the other consisting of a vapor
chamber heat pipe within a copper shell. Future scaled versions of the RSC may use either of
these configurations, depending on specific design requirements.
Figure 2-4 provides a schematic of the RSC and the underlying thermal resistance equations.
Here, R = thermal resistance, t = thickness, k = thermal conductivity, and A = area.
Figure 2-4. Basic RSC configurations (solid copper and vapor chamber heat pipe)
and their thermal resistances.
The effective thermal conductivity of a well-designed heat pipe is much higher than that of
copper. Therefore, baseplates of RSCs with vapor chambers have lower thermal resistance than
solid copper baseplates.
2.3.2.2.2 Total Heat Throughput and Heat Flux
Total heat throughput is defined as the heat removed and rejected by the RSC, for a given
temperature difference (T), thus reflecting the cooling capability of the unit. It is calculated by:

23
( ) ( )
( )
Heat flux is the total heat transferred per unit of heat exchange area. This quantity, which also
requires an assumed T, provides insight into how well a device transfers heat for a given
footprint area. Heat flux is simply the heat throughput divided by the base area of the cooler or,
equivalently:
(
)
( )
( )
( )
2.3.2.2.3 Fan Performance
For the purposes of cooling in concert with a heat sink, basic fan performance can be
characterized by a pressure-versus-flow curve. This curve, which is generally constructed from
empirical test data, defines the relationship between pressure and flow at a given rotational
speed.
Given a baseline mechanical design and its fan curve, a set of equations known as the fan affinity
laws can be used to estimate the pressure-flow relationship over a range of speeds and diameters.
The fan affinity laws are summarized below.
Fixed speed, variable size:
𝑄 𝑄 (𝐷 𝐷 )
𝑃 𝑃 (𝐷 𝐷 )
Variable speed, fixed size:
𝑄 𝑄 (𝜔 𝜔 )
𝑃 𝑃 (𝜔 𝜔 )
Here, Q = volumetric flow rate, D = diameter, P = pressure, and = motor rotational speed. The
subscript “1” refers to the property at the initial condition, and “2” refers to the property at the
scaled condition.
SNL provided a pressure-flow curve for the baseline 10-cm diameter RSC. Pressures and flows
for all other speeds and diameters under investigation were estimated using the fan affinity laws.
24
2.3.2.2.4 Power Consumption
In terms of its power consumption, the RSC is essentially a centrifugal fan driven by an electric
motor. In a basic fan-motor system the electric power consumption for any operating condition
can be calculated from four basic quantities: airflow, pressure drop (head), fan efficiency, and
motor efficiency. Additionally, because the RSC rides on an air bearing, the drag caused by the
bearing must also be considered. The values needed to estimate power consumption were
determined as follows:
Pressure and flow: The development of pressure-flow curves for various speeds and
diameters is discussed above.
Fan efficiency: Although fan efficiency was not directly determined by SNL’s fan test,
electrical power input to the slave motor was measured. This input power data, paired
with the slave motor’s rated efficiency profile, allowed an estimated fan efficiency curve
to be calculated. For analytical purposes the efficiency profile is assumed to remain
constant over the range of diameters and speeds investigated. This is consistent with
standard usage of fan affinity laws. While not strictly true, it is a reasonable
approximation within the bounds of the present analysis.4
Motor efficiency: Sandia is designing a BLDC motor for the RSC, but that design is not
yet complete. SNL provided an estimated motor efficiency for analysis purposes.
Air bearing drag: The drag caused by the air bearing was estimated using air gap shearing
torque equations.
Specifics of the power consumption computation are given in Appendix C.
2.3.2.3 Scaling Analysis: Results and Conclusions
Calculations and tabulated results for weight, startup torque, fan performance, thermal resistance,
and power consumption across all diameters and speeds, are included in Appendices B and C.
Thermal resistances are provided for copper baseplates only: vapor chamber baseplate resistance
is dependent on many design factors that have not been settled, so no estimates of Rthermal are
reported for that baseplate type.
From a practical perspective, a vapor chamber is more complex than a solid baseplate, and the
resulting RSC product will be costlier (assuming that the price of copper does not offset the
vapor chamber fabrication and assembly cost). Thus, in a given application there will be a cost-
benefit tradeoff. Some products will require removal of a large amount of heat from an area
smaller than the baseplate (e.g., a high-speed CPU); a vapor chamber baseplate could prove
necessary in such instances, despite the higher cost, to improve horizontal heat spreading.
The net result of better vertical heat transfer combined with uneven heat distribution on the
bottom of the vapor chamber shell will depend on the specifics of the application and the RSC
design used as a solution. For present purposes, we assumed that the two heat transfer factors
balance enough that, when heat spreading is involved, the net thermal performance of a vapor
chamber baseplate is at least as good as that of solid copper. On that assumption, analysis of the
4 It also reflects the fact that there is much design flexibility remaining. For a given size-speed configuration, minor
design changes could likely be made to “make up” the difference in performance due to non-ideal fan efficiency.

25
solid-baseplate RSC design for all applications is the most conservative approach. For this
reason, we assumed a solid baseplate for all calculations used to predict thermal performance of
the RSC.
Figure 2-5 shows the thermal resistance and total heat throughput of the RSC for T = 10 °C.
Figure 2-5. RSC thermal resistance and total heat throughput as a function of diameter
and speed, for an assumed temperature difference of 10°C
Heat transfer performance improves at larger diameters and greater speeds. Increasing diameter
tends to provide a greater relative benefit than increasing speed. Thermal resistance decreases
rapidly with increasing diameter in the size range from 5–15 cm, but realizes much less
improvement above a diameter of 15 cm. Note that increasing speed above 2,500 RPM continues
to improve thermal performance, but with diminishing returns for both thermal resistance and
heat throughput.
Heat flux is shown in Figure 2-6. Compared to the heat flux of an RSC with a speed of 2,500
RPM (a likely value for many applications), increasing speed to 8,500 RPM achieves an
improvement of about 50% for all diameters.
However, scaling up in diameter from 10 to 20 cm results in a decrease in heat flux of about 15%
for all speeds; in going from 10 to 40 cm, the heat flux drops by about 25%. Heat flux, which is
T/(RthermalAbase), decreases because as diameter increases the base area increases faster than the
thermal resistance. Thermal resistance, which governs heat throughput, follows an asymptotic
curve that is relatively flat by a diameter of 20 cm.

26
Figure 2-6. RSC heat flux versus diameter and speed, for an assumed T of 10°C
Figure 2-7. Predicted electrical power required for an RSC, versus diameter and speed
27
Figure 2-7 illustrates the relationship between diameter and power consumption for various
speeds. Predicted RSC power consumption at the target speeds of 2,000–3,000 RPM compares
well to that of existing fanned heat sinks of similar sizes. However, as with any motor-driven
device, power consumption grows quickly at higher RPM, at times to values greater than those
seen at larger diameters.
Due to high power consumption and diminishing improvement in thermal performance, we
expect that most end-users will find that the costs of using high-speed RSCs outweigh the
benefits, especially when combinations of lower-speed RSCs are suitable for the application. In
any case, power-performance tradeoffs are generally application-specific, and end-users are
encouraged to use the figures above, as well as Appendices B and C, to evaluate the potential
performance of the RSC for their specific design goals and constraints. The optimization of size,
speed, and number is discussed further in Section 2.5.1.
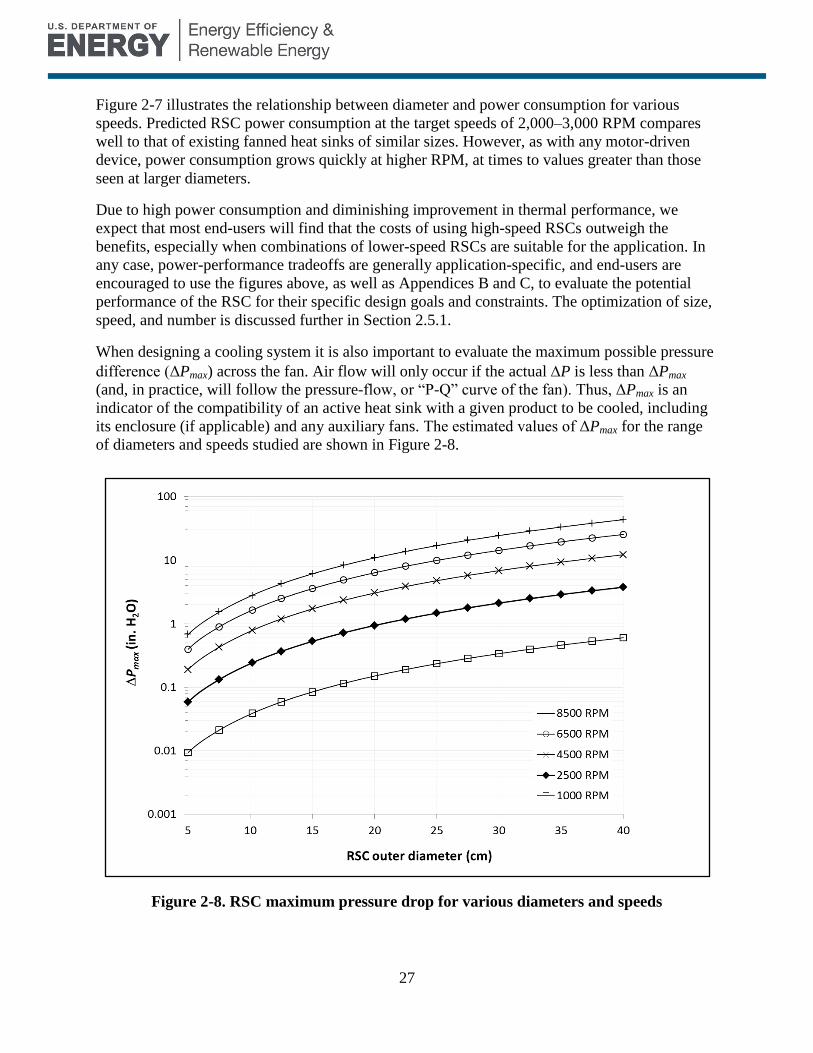
When designing a cooling system it is also important to evaluate the maximum possible pressure
difference (ΔPmax) across the fan. Air flow will only occur if the actual P is less than ΔPmax
(and, in practice, will follow the pressure-flow, or “P-Q” curve of the fan). Thus, ΔPmax is an
indicator of the compatibility of an active heat sink with a given product to be cooled, including
its enclosure (if applicable) and any auxiliary fans. The estimated values of ΔPmax for the range
of diameters and speeds studied are shown in Figure 2-8.
Figure 2-8. RSC maximum pressure drop for various diameters and speeds
28
Because of the radial nature of the air outflow from an unducted RSC, care should be used in
comparing its ΔPmax to the usual active heat sink pressure requirement. For example, a straight-
finned active heat sink is effectively a semi-ducted fan, having a large resistance to outlet flow
due to flow bending and channel effects. The RSC does bend airflow, but the outlet of the
impeller (i.e., fan) does not encounter any intrinsic channeling effects. There are likely other
important differences between an RSC and a typical active heat sink that make comparison of
numbers, as opposed to empirical test results, difficult to interpret.
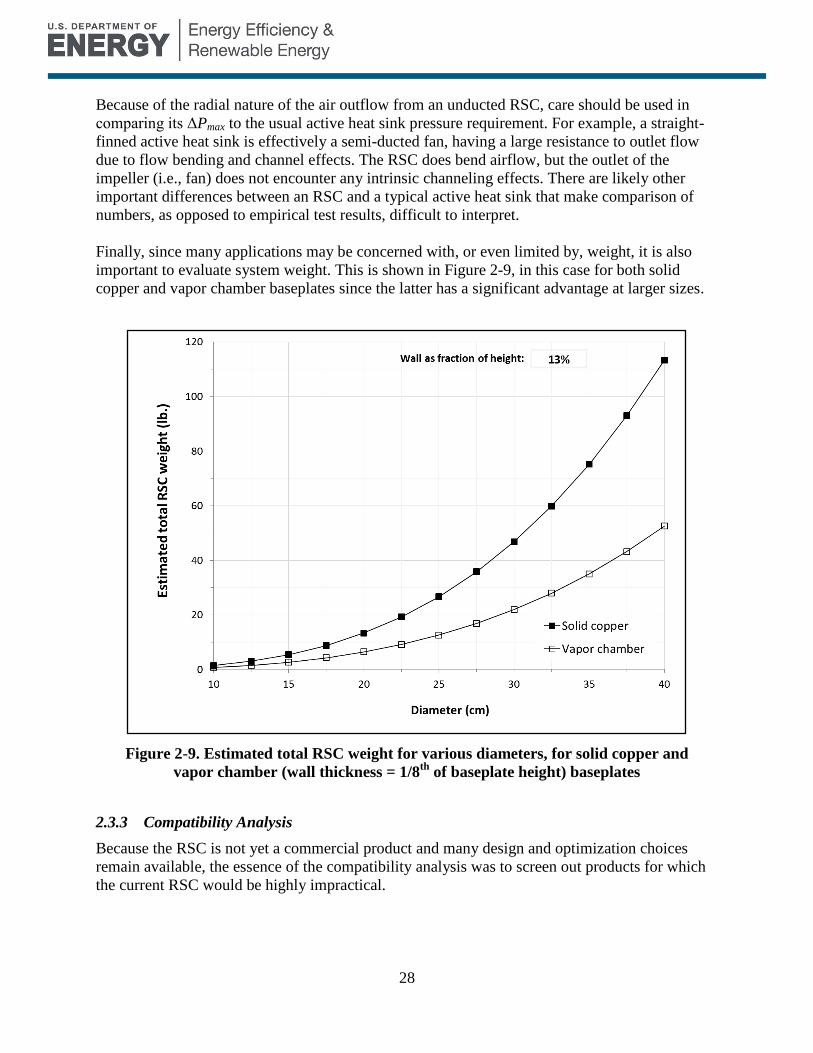
Finally, since many applications may be concerned with, or even limited by, weight, it is also
important to evaluate system weight. This is shown in Figure 2-9, in this case for both solid
copper and vapor chamber baseplates since the latter has a significant advantage at larger sizes.
Figure 2-9. Estimated total RSC weight for various diameters, for solid copper and
vapor chamber (wall thickness = 1/8th
of baseplate height) baseplates
2.3.3 Compatibility Analysis
Because the RSC is not yet a commercial product and many design and optimization choices
remain available, the essence of the compatibility analysis was to screen out products for which
the current RSC would be highly impractical.
29
2.3.3.1 Compatibility Analysis Method
Two critical technical product requirements were considered in determining compatibility at this
stage:
Heat transfer, using thermal resistance as a measure
Area, based on the smallest dimension and the shape (cm x cm) of the heat exchanger
space.
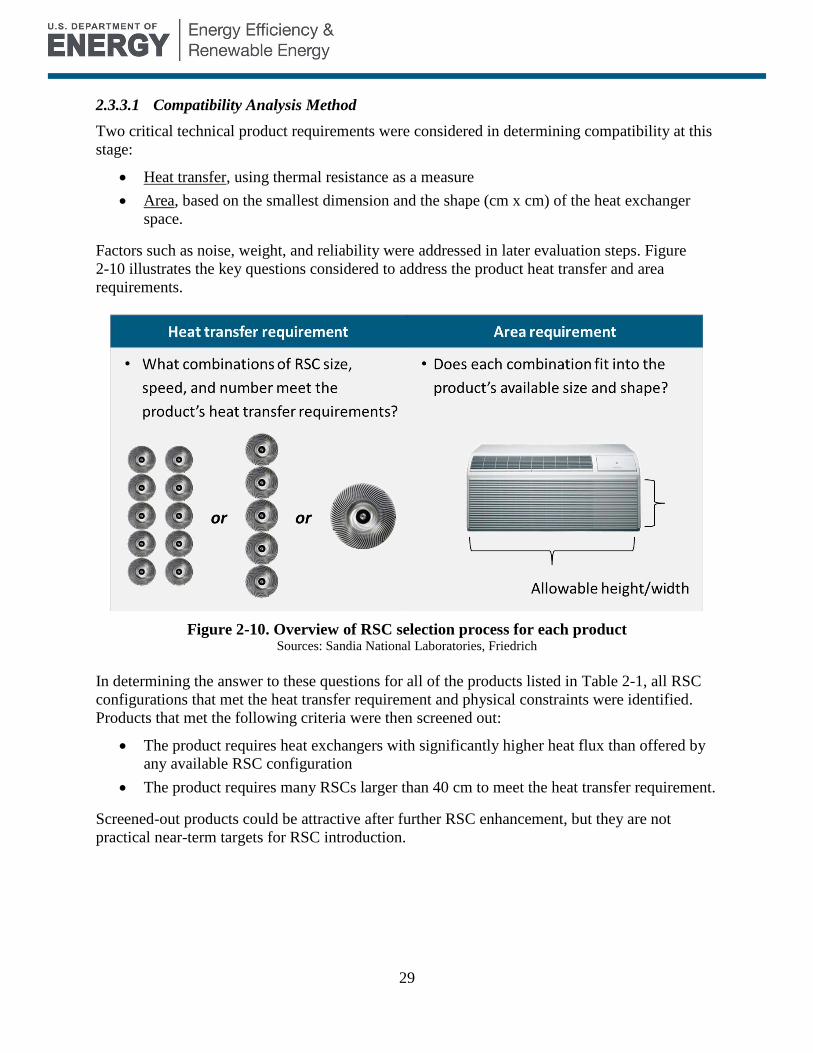
Factors such as noise, weight, and reliability were addressed in later evaluation steps. Figure
2-10 illustrates the key questions considered to address the product heat transfer and area
requirements.
Figure 2-10. Overview of RSC selection process for each product Sources: Sandia National Laboratories, Friedrich
In determining the answer to these questions for all of the products listed in Table 2-1, all RSC
configurations that met the heat transfer requirement and physical constraints were identified.
Products that met the following criteria were then screened out:
The product requires heat exchangers with significantly higher heat flux than offered by
any available RSC configuration
The product requires many RSCs larger than 40 cm to meet the heat transfer requirement.
Screened-out products could be attractive after further RSC enhancement, but they are not
practical near-term targets for RSC introduction.

30
2.3.3.2 Compatibility Analysis Results
The following products passed the compatibility analysis and moved on to Step 2, the scorecard
screening:
Fan-cooled motors (5, 30, and 75 HP)
A/V equipment
Beverage vending machine
Commercial LED bulb
Compact refrigerator
Data center processor
High-performance PC processor
Ice maker
Industrial LED bulb
Microwave
Mobile processor
Peltier devices
Portable fuel cell (500 W)
PTAC
Reach-in RF condenser
Res. CAC condenser
Res. fuel cell (5 kW)
Residential LED bulb
Residential PV inverter (500 W)
Residential PV inverter (20 kW)
Residential RF condenser
Room air conditioner
Small battery
Standard PC processor
TVs
Uninterruptible power supply
These products were filtered out by the initial screen:
Backup generators
Commercial fuel cell
Commercial rooftop CAC
EV battery packs
Heat pump clothes washers
Transportation radiators
Walk-in refrigerators and freezers
31
2.4 Scorecard Evaluation (Step 2)
2.4.1 Methodology
For each of the products passing the screen described in Section 2.3.3, we assembled information
on heat exchanger performance, operating attributes, and market characteristics to assist in
understanding how the RSC needed to perform to meet overall product requirements. The
following are the characteristics considered for each potential application:
Heat to be rejected
Need to have variable heat transfer rate
Temperature differential (air-side and source-to-sink)
Airflow requirements (distribution and heat dissipation of nearby components)
Current heat transfer limitations
Noise
Size (limiting length and allowable area)
Power consumption
Weight
Reliability requirements
Market size
Potential cost premium
Heat exchanger integration factors
Market acceptance of new technology
International market opportunities
This information was compiled from a variety of sources, including:
Manufacturer literature and thermal management guidelines
DOE Energy Efficiency rulemaking technical support documents (TSDs)
Parts supplier catalogs
Technology and market research reports
Discussion with subject matter experts
Hobbyist forums
Other online literature
32
This information provided a basis to evaluate the value of an RSC, or set of RSCs, for each
product application. When quantitative values were unavailable (e.g., allowable cost premium)
we consulted with internal Navigant subject-matter experts and utilized best judgment.
For each candidate product, we used two scorecards to perform an evaluation, based on the
characteristics listed earlier in this section. These characteristics were organized into Market
Attractiveness and Technology Attractiveness dimensions, with the goal of prioritizing products
that show the best technology and market fit with the current RSC. Details on each scorecard
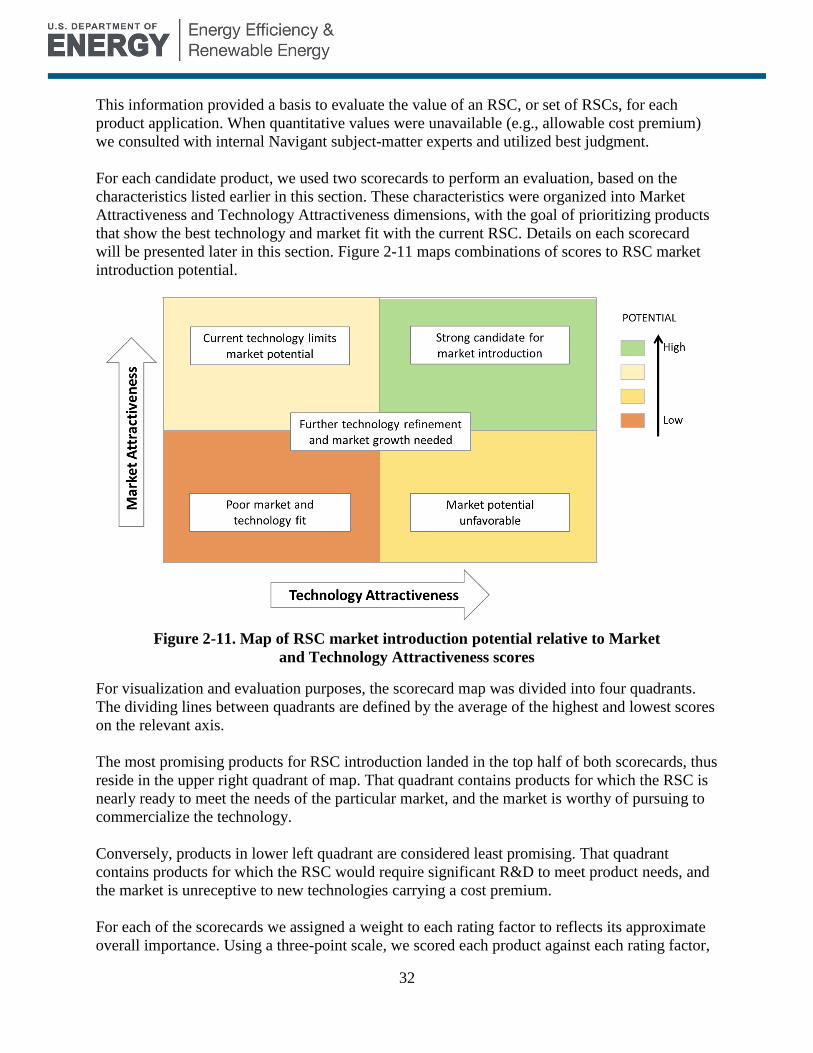
will be presented later in this section. Figure 2-11 maps combinations of scores to RSC market
introduction potential.
Figure 2-11. Map of RSC market introduction potential relative to Market
and Technology Attractiveness scores
For visualization and evaluation purposes, the scorecard map was divided into four quadrants.
The dividing lines between quadrants are defined by the average of the highest and lowest scores
on the relevant axis.
The most promising products for RSC introduction landed in the top half of both scorecards, thus
reside in the upper right quadrant of map. That quadrant contains products for which the RSC is
nearly ready to meet the needs of the particular market, and the market is worthy of pursuing to
commercialize the technology.
Conversely, products in lower left quadrant are considered least promising. That quadrant
contains products for which the RSC would require significant R&D to meet product needs, and
the market is unreceptive to new technologies carrying a cost premium.
For each of the scorecards we assigned a weight to each rating factor to reflects its approximate
overall importance. Using a three-point scale, we scored each product against each rating factor,
33
then calculated an overall score by multiplying the rating factor scores by their weights and
summing them.
2.4.1.1 Technology Attractiveness
The Technology Attractiveness scorecard evaluates how well the current RSC design fits a
market, from the OEM or licensee perspective. The scorecard consisted of four rating factors:
1. Design complexity: A quantitative assessment of the size and number of RSCs needed to
meet the heat transfer requirements of the product. Also, as applicable, the level of risk
and/or uncertainty involved in scaling the current 10-cm RSC to that combination of size,
speed, and number of units.
2. Product integration: A qualitative evaluation of the level of RSC refinement, starting with
the current design, required to integrate it into the product. Levels included:
The current RSC design generally meets the current product configuration with
minimal RSC or product refinement (e.g., a drop-in replacement)
Moderate RSC refinement is required to meet the current product configuration (e.g.,
it needs to operate within a ducted system), or the product needs moderate refinement
to enable an RSC to be used
Substantial RSC refinement is required to meet the current product configuration, or
the product needs substantial refinement to enable an RSC to be used. This may pose
an barrier to RSC introduction.
3. Market advantages: A qualitative evaluation of whether the RSC would provide
significant improvements of certain critical factors for that product, over conventional
heat transfer methods. Includes size, weight, noise, fouling, etc.
4. Potential for breakthrough: A qualitative assessment of whether the RSC can break
through any current market barriers, or enable the product to offer breakthrough
capabilities.
Figure 2-12 below shows the scoring matrix and weight for each rating factor in the Technology
Attractiveness scorecard.
2.4.1.2 Market Attractiveness
The Market Attractiveness scorecard evaluates how promising the market looks, from SNL’s
standpoint, for initial RSC introduction and widespread adoption (i.e., how difficult will it be to
gain market success). The Market Attractiveness scorecard consisted of three rating factors:
1. U.S. market size: Based on the estimated number of units sold in the United States
annually
2. Market adoption of new technologies: A qualitative estimate for the readiness of a given
product category or market to integrate and adopt new technology, specifically related to
heat transfer.
3. Allowable cost premium: A qualitative estimate of the willingness of a given market to
accept a cost premium for a new heat exchanger technology in its products.

34
Rating factors /
Key questions
Wt.
(%)
Score
1 (Low) 2 3 (High)
Design complexity
Does the RSC meet the
requirements for the
product with minimal
complexity?
40
Requires multiple
RSCs, either
above 20 cm or in
the 0–5 cm range
Requires multiple
RSC in 5–20 cm
range, or one RSC in
either the 0–5 cm or
20–40 cm ranges
Requires one RSC
in the 5–20 cm
range
Product integration
Is the current RSC ready
for immediate integration
in products?
25
Significant RSC
refinement
required, potential
issues to
introduction
Moderate RSC
refinement required
for product
introduction
Minimal RSC
refinement required
for product
introduction
Market advantages Does the RSC provide
significant advantages over
current technology in this
product?
25
None expected Limited potential to
address concerns
Moderate potential
to address concerns
Potential for breakthrough
Does the RSC break
through any known product
barriers?
10
None expected Limited, incremental
improvement, or
product differentiation
Significant
improvement, or
market disruption
Figure 2-12. Technology Attractiveness scorecard
Rating factors /
Key questions
Wt.
(%)
Score
1 (Low) 2 3 (High)
U.S. market size What is the potential market
size for the RSC
for this product?
50
< 500 k/year From 500 k/year to
< 5 M/year
> 5 M/year
Market adoption of new
technologies How readily does this
market accept new
technology, historically?
35
Slow adoption of
new technology
(5–10 years), few
innovative
products
Moderate adoption
of new technology
(3–5 years), several
innovative products
in niche areas
Rapid adoption of
new technology
(< 3 years),
numerous
innovative
products
Allowable cost premium
How willing is the market to
bear a more expensive heat
exchanger for this product?
15
Low to moderate,
especially if
product solves key
issue
Moderate to high,
especially if product
solves key issue
Typically high
Figure 2-13. Market Attractiveness scorecard
35
Figure 2-13 above shows the Market Attractiveness scorecard. Appendix F contains scoring
results for each product for both the Technology Attractiveness and Market Attractiveness
scorecards.
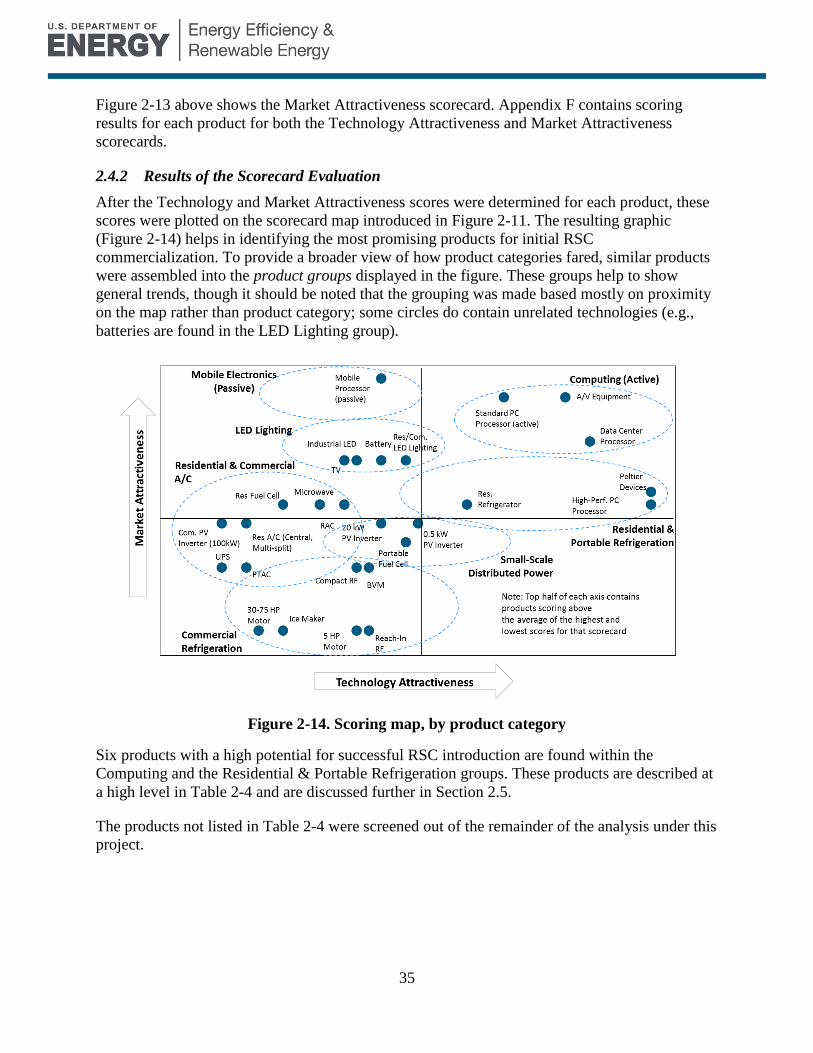
2.4.2 Results of the Scorecard Evaluation
After the Technology and Market Attractiveness scores were determined for each product, these
scores were plotted on the scorecard map introduced in Figure 2-11. The resulting graphic
(Figure 2-14) helps in identifying the most promising products for initial RSC
commercialization. To provide a broader view of how product categories fared, similar products
were assembled into the product groups displayed in the figure. These groups help to show
general trends, though it should be noted that the grouping was made based mostly on proximity
on the map rather than product category; some circles do contain unrelated technologies (e.g.,
batteries are found in the LED Lighting group).
Figure 2-14. Scoring map, by product category
Six products with a high potential for successful RSC introduction are found within the
Computing and the Residential & Portable Refrigeration groups. These products are described at
a high level in Table 2-4 and are discussed further in Section 2.5.
The products not listed in Table 2-4 were screened out of the remainder of the analysis under this
project.
36
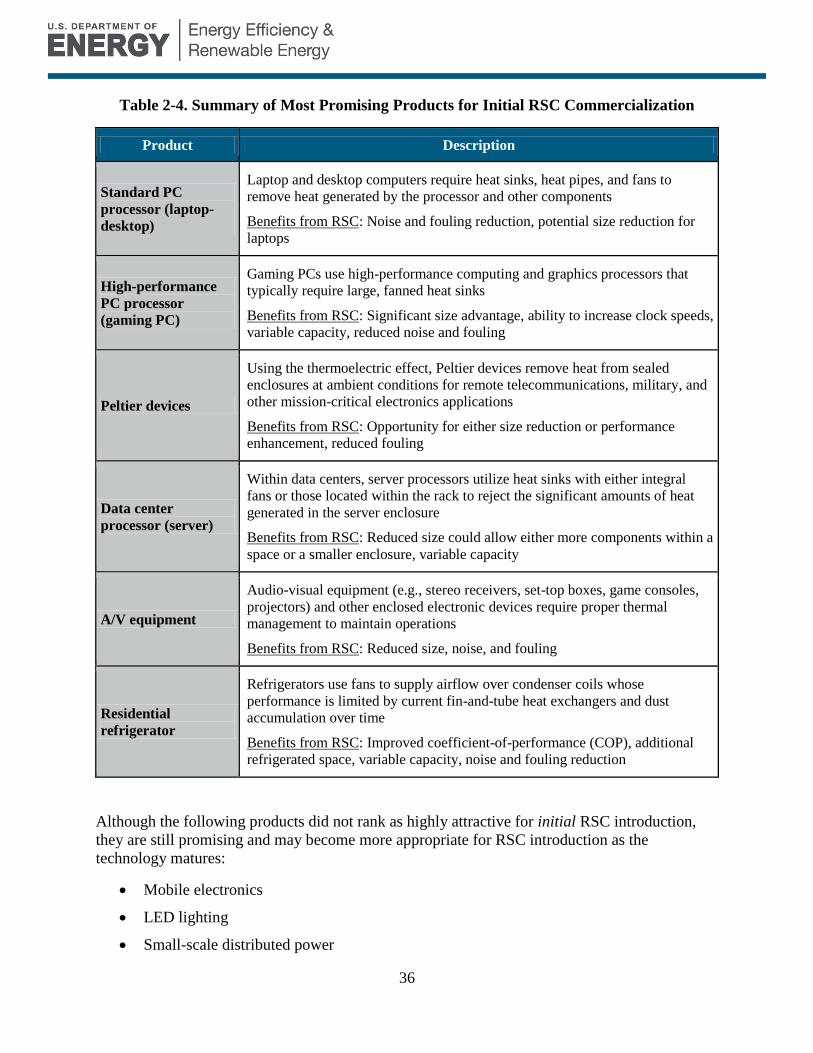
Table 2-4. Summary of Most Promising Products for Initial RSC Commercialization
Product Description
Standard PC
processor (laptop-
desktop)
Laptop and desktop computers require heat sinks, heat pipes, and fans to
remove heat generated by the processor and other components
Benefits from RSC: Noise and fouling reduction, potential size reduction for
laptops
High-performance
PC processor
(gaming PC)
Gaming PCs use high-performance computing and graphics processors that
typically require large, fanned heat sinks
Benefits from RSC: Significant size advantage, ability to increase clock speeds,
variable capacity, reduced noise and fouling
Peltier devices
Using the thermoelectric effect, Peltier devices remove heat from sealed
enclosures at ambient conditions for remote telecommunications, military, and
other mission-critical electronics applications
Benefits from RSC: Opportunity for either size reduction or performance
enhancement, reduced fouling
Data center
processor (server)
Within data centers, server processors utilize heat sinks with either integral
fans or those located within the rack to reject the significant amounts of heat
generated in the server enclosure
Benefits from RSC: Reduced size could allow either more components within a
space or a smaller enclosure, variable capacity
A/V equipment
Audio-visual equipment (e.g., stereo receivers, set-top boxes, game consoles,
projectors) and other enclosed electronic devices require proper thermal
management to maintain operations
Benefits from RSC: Reduced size, noise, and fouling
Residential
refrigerator
Refrigerators use fans to supply airflow over condenser coils whose
performance is limited by current fin-and-tube heat exchangers and dust
accumulation over time
Benefits from RSC: Improved coefficient-of-performance (COP), additional
refrigerated space, variable capacity, noise and fouling reduction
Although the following products did not rank as highly attractive for initial RSC introduction,
they are still promising and may become more appropriate for RSC introduction as the
technology matures:
Mobile electronics
LED lighting
Small-scale distributed power
37
Residential & commercial
HVAC and commercial refrigeration
Appendix G provides further detail on these screened-out products and categories.
2.5 Follow-Up Evaluation (Step 3)
2.5.1 Determining the Best-Fit Compatible Configuration
The follow-up evaluation provided an opportunity to dig deeper into the six most-promising
products. For those products, tradeoffs between energy use and design complexity were explored
to select the RSC configuration, among those identified in the compatibility analysis, with the
best fit in terms of size, speed, and number of units.
Assessing energy use was straightforward, but design complexity was more complicated. That
characteristic consists of two factors, the number of RSCs required and their size.
It is clear that, at this stage in the development of the RSC, solutions requiring a single RSC
close to 10 cm in diameter could be defined as minimally complex. When forced to compare
more-complex combinations of multiple scaled RSC, the idea of design complexity becomes less
clear and more subjective. Several units operating at lower speed could be preferred over a single
unit at higher speed because the configuration is “simple enough” and requires less energy. On
the other hand, operating multiple RSCs in close proximity may introduce risk and uncertainty.
For example, a configuration with three RSCs with lower energy consumption might be less
attractive than a single RSC that requires greater energy use. Best judgment was used for this
study; in practice, the product designer will balance this tradeoff for their specific application.
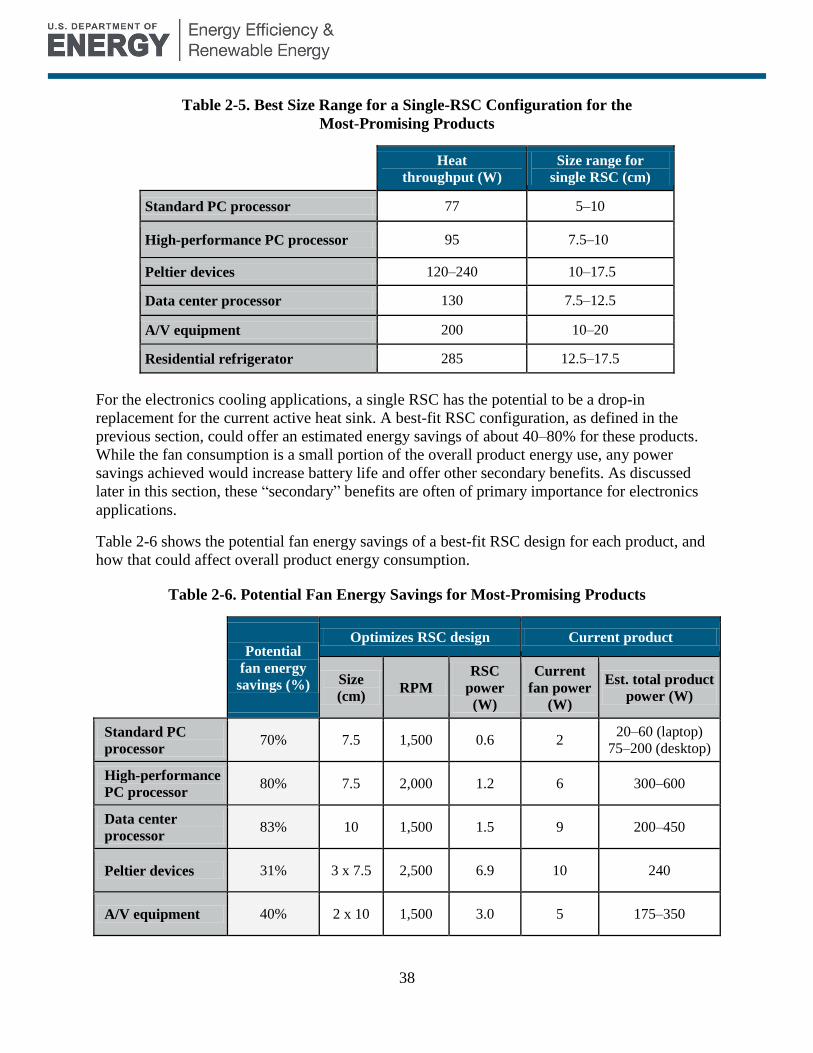
Of the six products evaluated, five had a best-fit solution consisting of a single RSC. Those were
the four electronics and computing applications, plus Peltier devices. Residential refrigerators
could require one RSC, but might also need multiple units, depending on the method of
integration with the condenser’s refrigerant tubes. Table 2-5 below outlines the heat transfer
requirements and anticipated size ranges, for the case of a single RSC, for all six most-promising
products.
2.5.2 Additional Evaluations: Energy Savings
After the best-fit compatible configurations were determined, strengths, weaknesses, and any
other remaining issues were explored in depth. In this report we will focus on exploring energy
savings opportunities in the specified products
38
Table 2-5. Best Size Range for a Single-RSC Configuration for the
Most-Promising Products
Heat
throughput (W) Size range for
single RSC (cm)
Standard PC processor 77 5–10
High-performance PC processor 95 7.5–10
Peltier devices 120–240 10–17.5
Data center processor 130 7.5–12.5
A/V equipment 200 10–20
Residential refrigerator 285 12.5–17.5
For the electronics cooling applications, a single RSC has the potential to be a drop-in
replacement for the current active heat sink. A best-fit RSC configuration, as defined in the
previous section, could offer an estimated energy savings of about 40–80% for these products.
While the fan consumption is a small portion of the overall product energy use, any power
savings achieved would increase battery life and offer other secondary benefits. As discussed
later in this section, these “secondary” benefits are often of primary importance for electronics
applications.
Table 2-6 shows the potential fan energy savings of a best-fit RSC design for each product, and
how that could affect overall product energy consumption.
Table 2-6. Potential Fan Energy Savings for Most-Promising Products
Potential
fan energy
savings (%)
Optimizes RSC design Current product
Size
(cm) RPM
RSC
power
(W)
Current
fan power
(W)
Est. total product
power (W)
Standard PC
processor 70% 7.5 1,500 0.6 2
20–60 (laptop)
75–200 (desktop)
High-performance
PC processor 80% 7.5 2,000 1.2 6 300–600
Data center
processor 83% 10 1,500 1.5 9 200–450
Peltier devices 31% 3 x 7.5 2,500 6.9 10 240
A/V equipment 40% 2 x 10 1,500 3.0 5 175–350

39
For residential refrigerators, modest fan energy savings are available but the main savings in that
product category are associated with heat exchanger thermal resistance and reduction of fouling.
For a refrigeration cycle, a lower heat exchanger air-side thermal resistance has a direct effect on
the overall system coefficient-of-performance (COP).
With a lower thermal resistance, the required temperature difference between the refrigerant and
air can be decreased for a given heat load. In the case of a condenser, lowering the required
condensing temperature improves compressor efficiency, which reduces power consumption.
Preliminary simulations by SNL and a major industry partner indicate that lowering the air-side
thermal resistance by 50% will result in an overall COP improvement of approximately 10%.
Our performance evaluation indicates that this thermal resistance improvement is possible, but
the actual results will depend on refrigerant tube integration with the RSC baseplate.
Additional COP-related benefits may also be gained from the fouling resistance of the RSC.
Current condenser heat exchanger designs are susceptible to dust accumulation, which increases
thermal resistance and negatively affects COP over the lifetime of the product. The rotating
character of the RSC heat exchange surface significantly reduces dust accumulation, which
maintains efficient operation throughout the product life.
2.5.3 Other RSC Benefits
Beyond energy savings, the RSC offers a number of performance benefits that are often more
important than fan energy savings alone. In certain instances, these non-energy benefits are what
will most interest OEMs, potential licensees, and consumers, in that the RSC will enable new
product form factors, improved customer experience, or other product-related improvements.
Non-energy benefits include:
Performance enhancement: By allowing greater heat transfer from a given footprint,
product manufacturers can install more capable components with greater heat dissipation.
Also, RSC speed can be modulated to provide extra heat transfer when needed (at the
cost of energy efficiency), which would be valuable for variable-speed operations,
maintaining small size, increasing processor clock speeds, etc.
Size and form factor: The RSC generally has smaller footprint and height than
conventional fan-plus-heat-exchanger assemblies, which allows for more innovative and
slimmer product designs.
Noise: By maintaining quiet operation, the RSC permits higher-speed operation and
better product performance without diminishing user experience.
Fouling: The RSC design reduces dust build-up that is a major cause of electronics
overheating and long-term loss of heat exchanger performance.
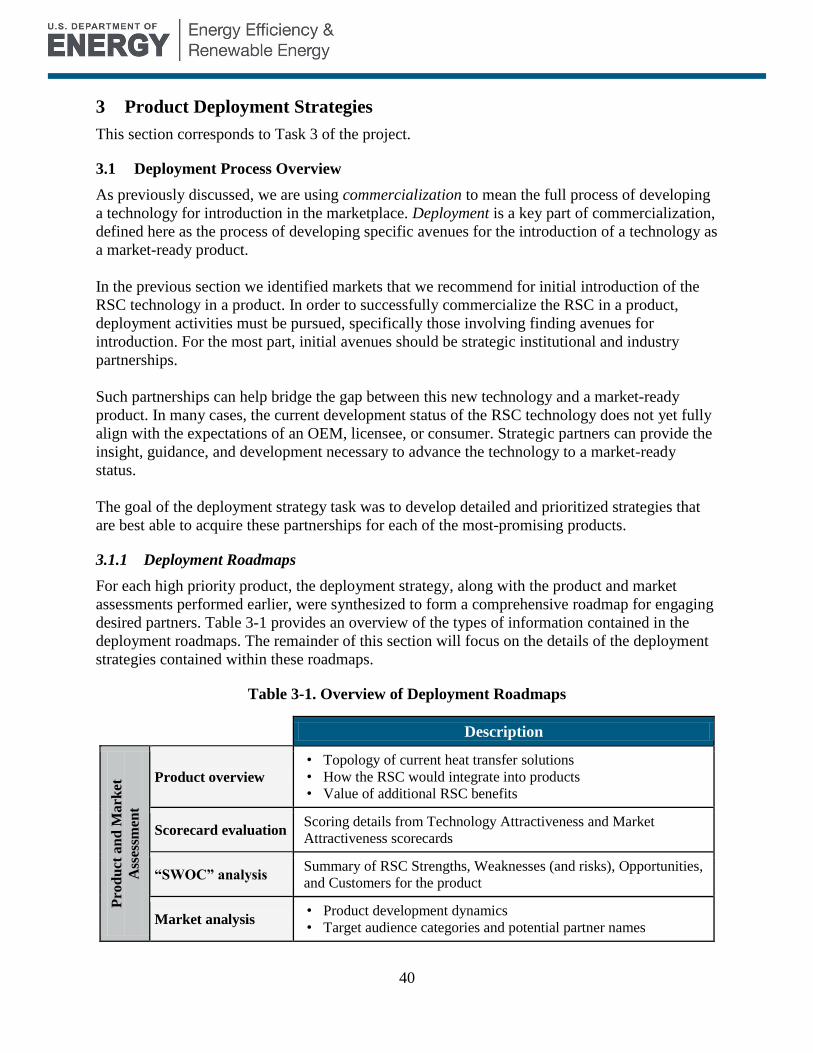
40
3 Product Deployment Strategies
This section corresponds to Task 3 of the project.
3.1 Deployment Process Overview
As previously discussed, we are using commercialization to mean the full process of developing
a technology for introduction in the marketplace. Deployment is a key part of commercialization,
defined here as the process of developing specific avenues for the introduction of a technology as
a market-ready product.
In the previous section we identified markets that we recommend for initial introduction of the
RSC technology in a product. In order to successfully commercialize the RSC in a product,
deployment activities must be pursued, specifically those involving finding avenues for
introduction. For the most part, initial avenues should be strategic institutional and industry
partnerships.
Such partnerships can help bridge the gap between this new technology and a market-ready
product. In many cases, the current development status of the RSC technology does not yet fully
align with the expectations of an OEM, licensee, or consumer. Strategic partners can provide the
insight, guidance, and development necessary to advance the technology to a market-ready
status.
The goal of the deployment strategy task was to develop detailed and prioritized strategies that
are best able to acquire these partnerships for each of the most-promising products.
3.1.1 Deployment Roadmaps
For each high priority product, the deployment strategy, along with the product and market
assessments performed earlier, were synthesized to form a comprehensive roadmap for engaging
desired partners. Table 3-1 provides an overview of the types of information contained in the
deployment roadmaps. The remainder of this section will focus on the details of the deployment
strategies contained within these roadmaps.
Table 3-1. Overview of Deployment Roadmaps
Description
Pro
du
ct a
nd
Mark
et
Ass
essm
ent
Product overview
• Topology of current heat transfer solutions
• How the RSC would integrate into products
• Value of additional RSC benefits
Scorecard evaluation Scoring details from Technology Attractiveness and Market
Attractiveness scorecards
“SWOC” analysis Summary of RSC Strengths, Weaknesses (and risks), Opportunities,
and Customers for the product
Market analysis • Product development dynamics
• Target audience categories and potential partner names
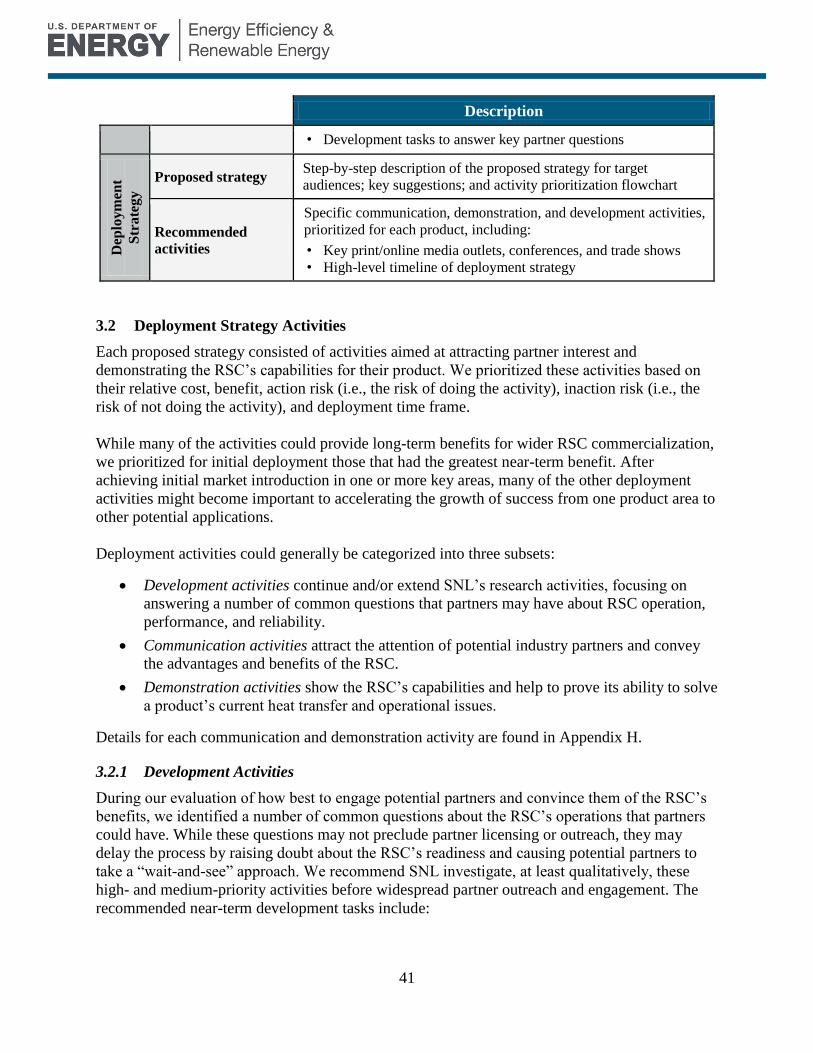
41
Description
• Development tasks to answer key partner questions
Dep
loym
ent
Str
ate
gy
Proposed strategy Step-by-step description of the proposed strategy for target
audiences; key suggestions; and activity prioritization flowchart
Recommended
activities
Specific communication, demonstration, and development activities,
prioritized for each product, including:
• Key print/online media outlets, conferences, and trade shows
• High-level timeline of deployment strategy
3.2 Deployment Strategy Activities
Each proposed strategy consisted of activities aimed at attracting partner interest and
demonstrating the RSC’s capabilities for their product. We prioritized these activities based on
their relative cost, benefit, action risk (i.e., the risk of doing the activity), inaction risk (i.e., the
risk of not doing the activity), and deployment time frame.
While many of the activities could provide long-term benefits for wider RSC commercialization,
we prioritized for initial deployment those that had the greatest near-term benefit. After
achieving initial market introduction in one or more key areas, many of the other deployment
activities might become important to accelerating the growth of success from one product area to
other potential applications.
Deployment activities could generally be categorized into three subsets:
Development activities continue and/or extend SNL’s research activities, focusing on
answering a number of common questions that partners may have about RSC operation,
performance, and reliability.
Communication activities attract the attention of potential industry partners and convey
the advantages and benefits of the RSC.
Demonstration activities show the RSC’s capabilities and help to prove its ability to solve
a product’s current heat transfer and operational issues.
Details for each communication and demonstration activity are found in Appendix H.
3.2.1 Development Activities
During our evaluation of how best to engage potential partners and convince them of the RSC’s
benefits, we identified a number of common questions about the RSC’s operations that partners
could have. While these questions may not preclude partner licensing or outreach, they may
delay the process by raising doubt about the RSC’s readiness and causing potential partners to
take a “wait-and-see” approach. We recommend SNL investigate, at least qualitatively, these
high- and medium-priority activities before widespread partner outreach and engagement. The
recommended near-term development tasks include:
42
High priority
Operating map: Provide pressure vs. airflow curve for 10-cm RSC at different RPM and
performance map of shaft power and thermal resistance for scaled RSCs at different RPM
Medium priority
Duct, enclosure, multiple RSCs: Conduct testing in ducted or enclosed environment to
determine operational issues with nearby walls, other objects, and multiple RSCs
Reliability: Perform accelerated life testing to determine RSC lifetime, points of failure,
and identify ways to increase reliability
Fouling: Conduct testing on the current RSC design to quantify the relationship between
fouling (minor as it may be) and long-term performance
Noise: Perform noise testing for various speeds with the most current RSC design
Low priority
Rotation (transient): Analyze the transient performance of the air bearing when the RSC is
rotated from its primary axis to understand operational limitations of the current design
Rotation (steady): Quantify heat transfer performance losses due to the air bearing
operating outside of the design orientation and investigate ways to adjust pre-load ratio to
different operating orientations.
Safety: Demonstrate safety screen or other mechanism to protect users and other
components and ensure performance
3.2.2 Communication Activities
Communication activities work to attract the attention of industry partners and convey the
advantages and benefits of the RSC. These activities include:
High priority
Print/online publicity update: Update media publications, periodicals, websites, etc. on
RSC development
Public/private webinar: Present introduction and update to RSC technology through online
webinar
Industry or developers conference presentation: Update RSC white paper and present to
technical audience in target sectors
Medium priority
Federal Computing Group outreach: Present to federal researchers and industry groups
working on more efficient data center cooling
ARPA-e Technology Showcase: Participate in the trade show portion of the Innovation
Summit
Low priority
DOE / ENERGY STAR Product Team outreach: Lead discussions among appliance project
teams to raise awareness for future efficiency rulemakings and specifications
43
Innovation conference presentation: Discuss importance of heat exchanger breakthroughs
including RSC
3.2.3 Demonstration Activities
Demonstration activities act to prove the RSC’s capability to solve a product’s current heat
transfer and operational issues. These activities include:
High priority
Provide prototype to interested OEMs/suppliers: Invite interested industry partners to
evaluate an RSC prototype
Medium priority
Conduct testing at federal computing facilities: Work with federal data center staff to
integrate RSCs into current or retired systems
Low priority
Develop/distribute tools and computational fluid dynamics (CFD) modules: Create a CFD
module that simulates RSC operations in different environments, and/or work with major
CFD software vendors to incorporate RSC in design suite.
Test RSC in actual products at SNL: Integrate prototype RSCs in computer, server, and
A/V electronics at SNL
RFP/FOA for demonstration: Offer funding or cost share to demonstrate the technology in
actual product applications or separate concepts
Invitation for press to benchmark: Provide interested media members the opportunity to
conduct performance testing on an RSC prototype.
Co-sponsor development or business plan competition: Partner with industry organization
or university to create competition or project focused around RSC technology
Pre-order and direct manufacture: Offer public to pre-order a prototype version of RSC
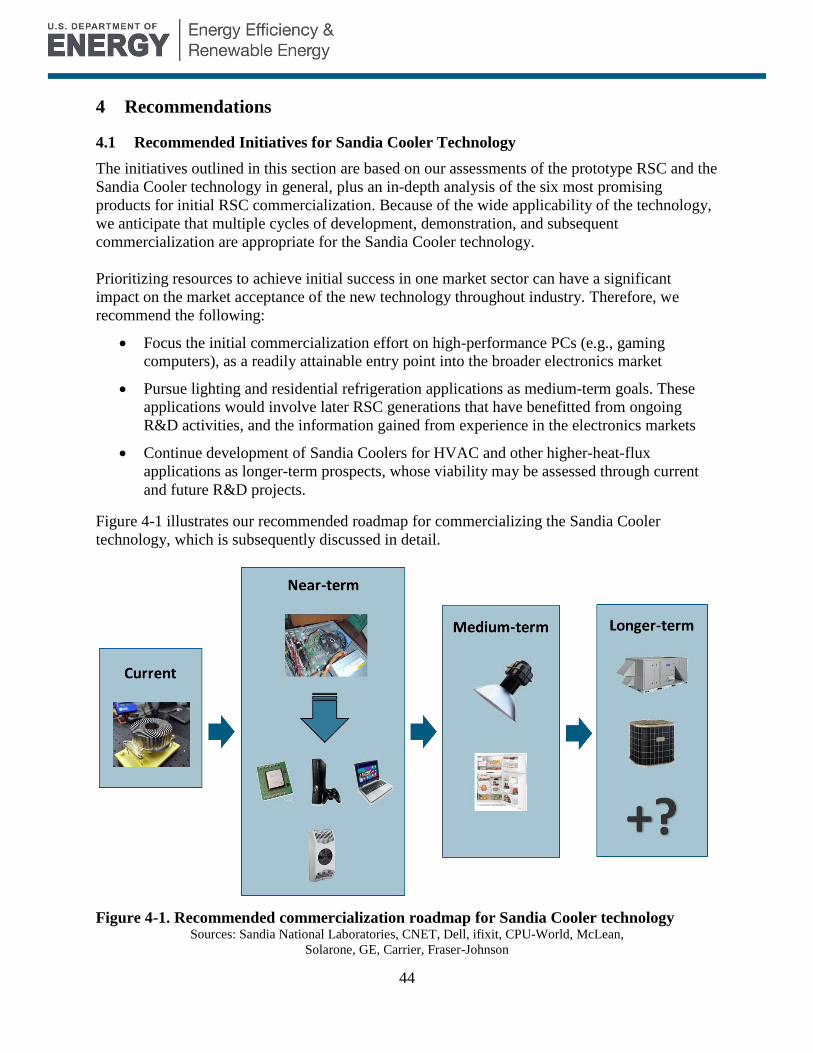
44
4 Recommendations
4.1 Recommended Initiatives for Sandia Cooler Technology
The initiatives outlined in this section are based on our assessments of the prototype RSC and the
Sandia Cooler technology in general, plus an in-depth analysis of the six most promising
products for initial RSC commercialization. Because of the wide applicability of the technology,
we anticipate that multiple cycles of development, demonstration, and subsequent
commercialization are appropriate for the Sandia Cooler technology.
Prioritizing resources to achieve initial success in one market sector can have a significant
impact on the market acceptance of the new technology throughout industry. Therefore, we
recommend the following:
Focus the initial commercialization effort on high-performance PCs (e.g., gaming
computers), as a readily attainable entry point into the broader electronics market
Pursue lighting and residential refrigeration applications as medium-term goals. These
applications would involve later RSC generations that have benefitted from ongoing
R&D activities, and the information gained from experience in the electronics markets
Continue development of Sandia Coolers for HVAC and other higher-heat-flux
applications as longer-term prospects, whose viability may be assessed through current
and future R&D projects.
Figure 4-1 illustrates our recommended roadmap for commercializing the Sandia Cooler
technology, which is subsequently discussed in detail.
Figure 4-1. Recommended commercialization roadmap for Sandia Cooler technology Sources: Sandia National Laboratories, CNET, Dell, ifixit, CPU-World, McLean,
Solarone, GE, Carrier, Fraser-Johnson
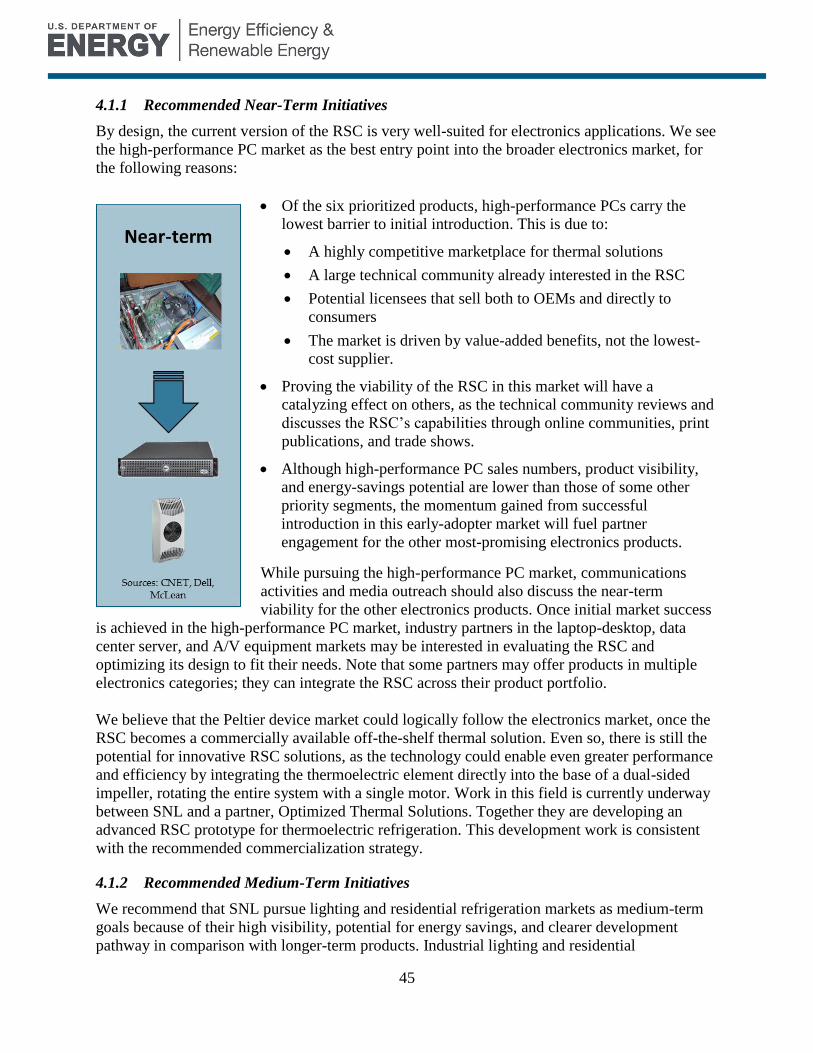
45
4.1.1 Recommended Near-Term Initiatives
By design, the current version of the RSC is very well-suited for electronics applications. We see
the high-performance PC market as the best entry point into the broader electronics market, for
the following reasons:
Of the six prioritized products, high-performance PCs carry the
lowest barrier to initial introduction. This is due to:
A highly competitive marketplace for thermal solutions
A large technical community already interested in the RSC
Potential licensees that sell both to OEMs and directly to
consumers
The market is driven by value-added benefits, not the lowest-
cost supplier.
Proving the viability of the RSC in this market will have a
catalyzing effect on others, as the technical community reviews and
discusses the RSC’s capabilities through online communities, print
publications, and trade shows.
Although high-performance PC sales numbers, product visibility,
and energy-savings potential are lower than those of some other
priority segments, the momentum gained from successful
introduction in this early-adopter market will fuel partner
engagement for the other most-promising electronics products.
While pursuing the high-performance PC market, communications
activities and media outreach should also discuss the near-term
viability for the other electronics products. Once initial market success
is achieved in the high-performance PC market, industry partners in the laptop-desktop, data
center server, and A/V equipment markets may be interested in evaluating the RSC and
optimizing its design to fit their needs. Note that some partners may offer products in multiple
electronics categories; they can integrate the RSC across their product portfolio.
We believe that the Peltier device market could logically follow the electronics market, once the
RSC becomes a commercially available off-the-shelf thermal solution. Even so, there is still the
potential for innovative RSC solutions, as the technology could enable even greater performance
and efficiency by integrating the thermoelectric element directly into the base of a dual-sided
impeller, rotating the entire system with a single motor. Work in this field is currently underway
between SNL and a partner, Optimized Thermal Solutions. Together they are developing an
advanced RSC prototype for thermoelectric refrigeration. This development work is consistent
with the recommended commercialization strategy.
4.1.2 Recommended Medium-Term Initiatives
We recommend that SNL pursue lighting and residential refrigeration markets as medium-term
goals because of their high visibility, potential for energy savings, and clearer development
pathway in comparison with longer-term products. Industrial lighting and residential
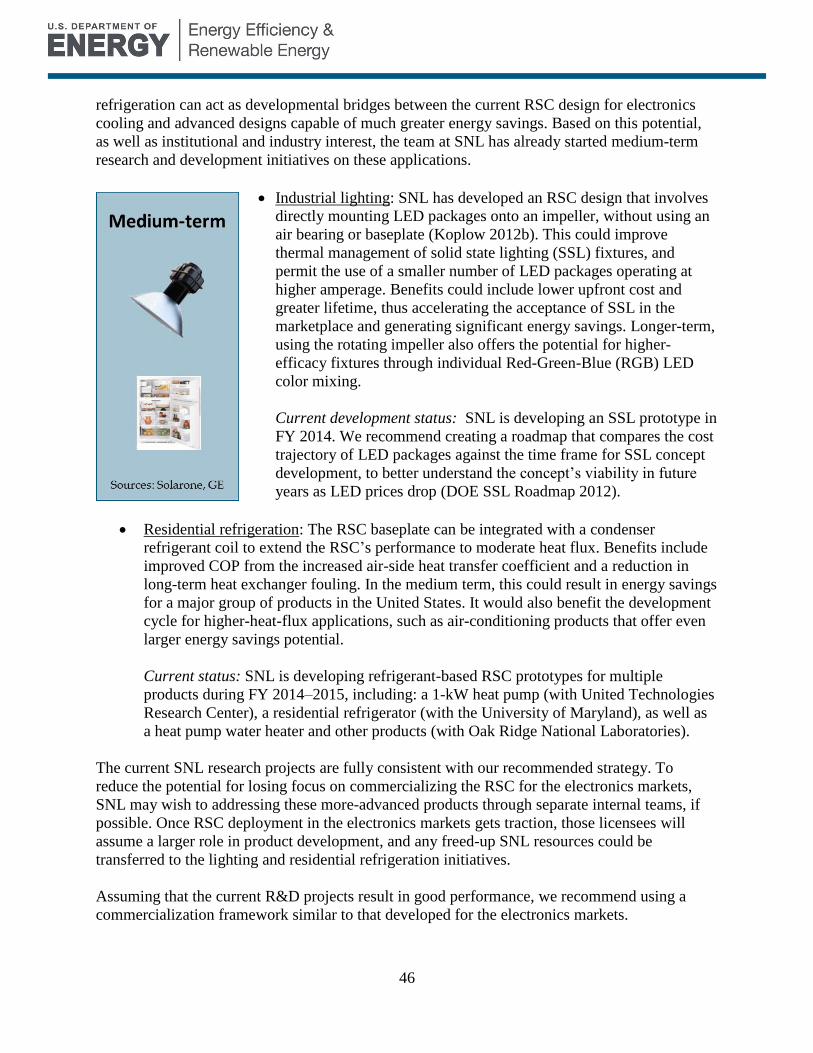
46
refrigeration can act as developmental bridges between the current RSC design for electronics
cooling and advanced designs capable of much greater energy savings. Based on this potential,
as well as institutional and industry interest, the team at SNL has already started medium-term
research and development initiatives on these applications.
Industrial lighting: SNL has developed an RSC design that involves
directly mounting LED packages onto an impeller, without using an
air bearing or baseplate (Koplow 2012b). This could improve
thermal management of solid state lighting (SSL) fixtures, and
permit the use of a smaller number of LED packages operating at
higher amperage. Benefits could include lower upfront cost and
greater lifetime, thus accelerating the acceptance of SSL in the
marketplace and generating significant energy savings. Longer-term,
using the rotating impeller also offers the potential for higher-
efficacy fixtures through individual Red-Green-Blue (RGB) LED
color mixing.
Current development status: SNL is developing an SSL prototype in
FY 2014. We recommend creating a roadmap that compares the cost
trajectory of LED packages against the time frame for SSL concept
development, to better understand the concept’s viability in future
years as LED prices drop (DOE SSL Roadmap 2012).
Residential refrigeration: The RSC baseplate can be integrated with a condenser
refrigerant coil to extend the RSC’s performance to moderate heat flux. Benefits include
improved COP from the increased air-side heat transfer coefficient and a reduction in
long-term heat exchanger fouling. In the medium term, this could result in energy savings
for a major group of products in the United States. It would also benefit the development
cycle for higher-heat-flux applications, such as air-conditioning products that offer even
larger energy savings potential.
Current status: SNL is developing refrigerant-based RSC prototypes for multiple
products during FY 2014–2015, including: a 1-kW heat pump (with United Technologies
Research Center), a residential refrigerator (with the University of Maryland), as well as
a heat pump water heater and other products (with Oak Ridge National Laboratories).
The current SNL research projects are fully consistent with our recommended strategy. To
reduce the potential for losing focus on commercializing the RSC for the electronics markets,
SNL may wish to addressing these more-advanced products through separate internal teams, if
possible. Once RSC deployment in the electronics markets gets traction, those licensees will
assume a larger role in product development, and any freed-up SNL resources could be
transferred to the lighting and residential refrigeration initiatives.
Assuming that the current R&D projects result in good performance, we recommend using a
commercialization framework similar to that developed for the electronics markets.
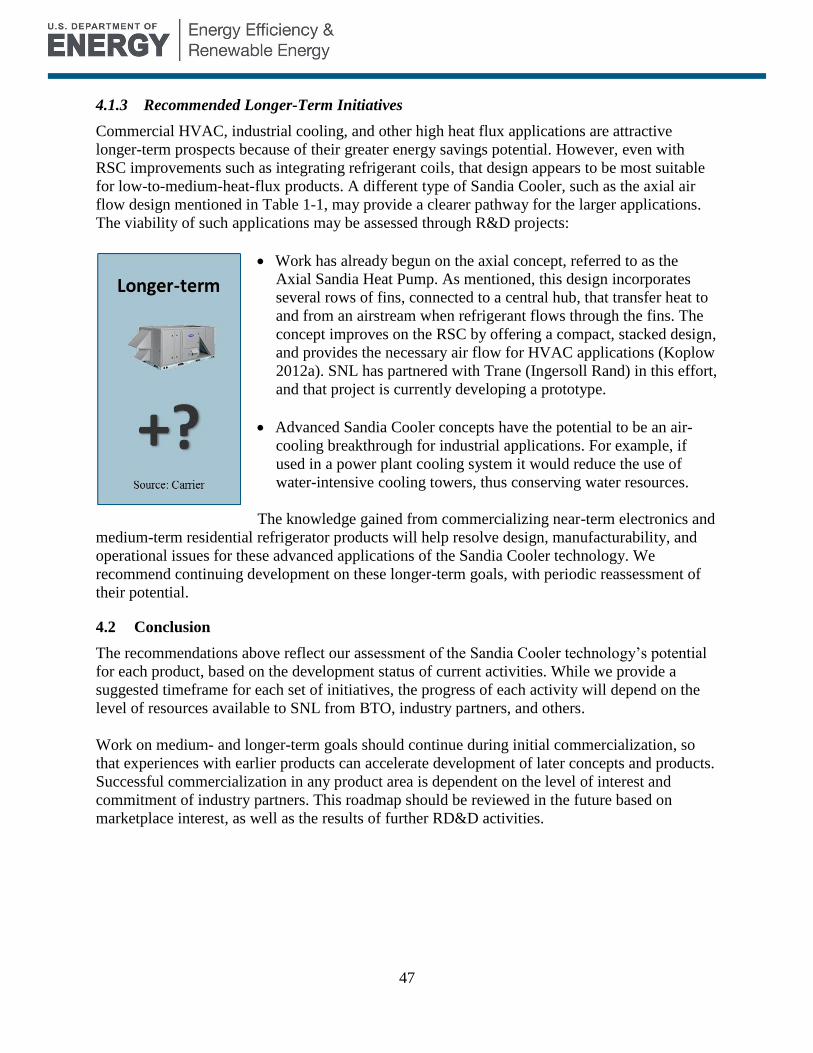
47
4.1.3 Recommended Longer-Term Initiatives
Commercial HVAC, industrial cooling, and other high heat flux applications are attractive
longer-term prospects because of their greater energy savings potential. However, even with
RSC improvements such as integrating refrigerant coils, that design appears to be most suitable
for low-to-medium-heat-flux products. A different type of Sandia Cooler, such as the axial air
flow design mentioned in Table 1-1, may provide a clearer pathway for the larger applications.
The viability of such applications may be assessed through R&D projects:
Work has already begun on the axial concept, referred to as the
Axial Sandia Heat Pump. As mentioned, this design incorporates
several rows of fins, connected to a central hub, that transfer heat to
and from an airstream when refrigerant flows through the fins. The
concept improves on the RSC by offering a compact, stacked design,
and provides the necessary air flow for HVAC applications (Koplow
2012a). SNL has partnered with Trane (Ingersoll Rand) in this effort,
and that project is currently developing a prototype.
Advanced Sandia Cooler concepts have the potential to be an air-
cooling breakthrough for industrial applications. For example, if
used in a power plant cooling system it would reduce the use of
water-intensive cooling towers, thus conserving water resources.
The knowledge gained from commercializing near-term electronics and
medium-term residential refrigerator products will help resolve design, manufacturability, and
operational issues for these advanced applications of the Sandia Cooler technology. We
recommend continuing development on these longer-term goals, with periodic reassessment of
their potential.
4.2 Conclusion
The recommendations above reflect our assessment of the Sandia Cooler technology’s potential
for each product, based on the development status of current activities. While we provide a
suggested timeframe for each set of initiatives, the progress of each activity will depend on the
level of resources available to SNL from BTO, industry partners, and others.
Work on medium- and longer-term goals should continue during initial commercialization, so
that experiences with earlier products can accelerate development of later concepts and products.
Successful commercialization in any product area is dependent on the level of interest and
commitment of industry partners. This roadmap should be reviewed in the future based on
marketplace interest, as well as the results of further RD&D activities.

48
References
DOE SSL Roadmap. 2012. “Solid-State Lighting Research and Development: Manufacturing
Roadmap.” U.S. Department of Energy. August 2012.
Koplow, Jeffrey. 2010. “A Fundamentally New Approach to Air-cooled Heat Exchangers.”
Sandia National Laboratories. SAND2010-0258. January 2010. Available at:
http://prod.sandia.gov/techlib/access-control.cgi/2010/100258.pdf
Koplow, Jeffrey. 2012a. “Axial Flow Heat Exchanger Devices and Methods for Heat Transfer
Using Axial Flow Devices.” U.S. Patent Publication No: US 2012/0180992. July 19, 2012.
Koplow, Jeffrey. 2012b. “Solid State Lighting Devices and Methods with Rotary Cooling
Structures.” U.S. Patent Publication No: US 2012/0223640. September 6, 2012.
Lienhard, JH IV and Lienhard, JH V. 2008. “A Heat Transfer Textbook.” 3rd edition. Phlogiston
Press, Cambridge. Available at: http://web.mit.edu/lienhard/www/ahttv131.pdf
Mills. A.F. 1995. “Heat and Mass Transfer.” Irwin Professional Publishing, Chicago.
Young and Budynas. 2002. “Roark’s Formulas for Stress and Strain.” 7th
edition. McGraw Hill,
New York.
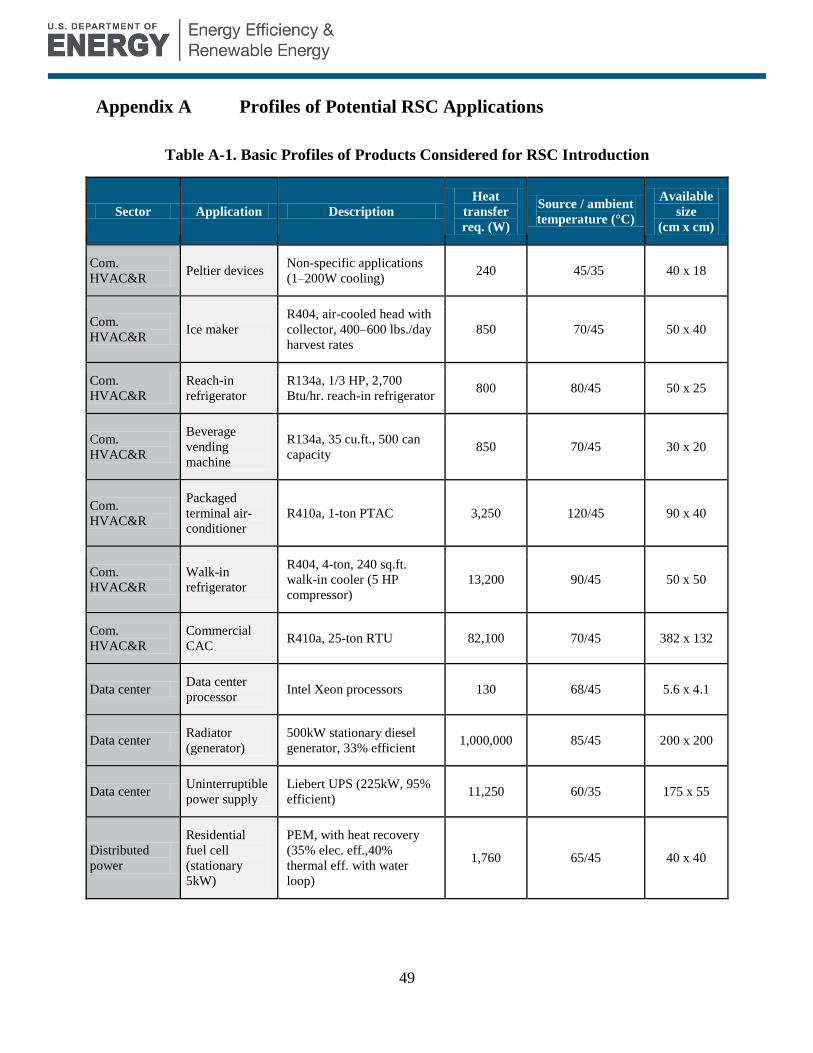
49
Appendix A Profiles of Potential RSC Applications
Table A-1. Basic Profiles of Products Considered for RSC Introduction
Sector Application Description
Heat
transfer
req. (W)
Source / ambient
temperature (°C)
Available
size
(cm x cm)
Com.
HVAC&R Peltier devices
Non-specific applications
(1–200W cooling) 240 45/35 40 x 18
Com.
HVAC&R Ice maker
R404, air-cooled head with
collector, 400–600 lbs./day
harvest rates
850 70/45 50 x 40
Com.
HVAC&R
Reach-in
refrigerator
R134a, 1/3 HP, 2,700
Btu/hr. reach-in refrigerator 800 80/45 50 x 25
Com.
HVAC&R
Beverage
vending
machine
R134a, 35 cu.ft., 500 can
capacity 850 70/45 30 x 20
Com.
HVAC&R
Packaged
terminal air-
conditioner
R410a, 1-ton PTAC 3,250 120/45 90 x 40
Com.
HVAC&R
Walk-in
refrigerator
R404, 4-ton, 240 sq.ft.
walk-in cooler (5 HP
compressor)
13,200 90/45 50 x 50
Com.
HVAC&R
Commercial
CAC R410a, 25-ton RTU 82,100 70/45 382 x 132
Data center Data center
processor Intel Xeon processors 130 68/45 5.6 x 4.1
Data center Radiator
(generator)
500kW stationary diesel
generator, 33% efficient 1,000,000 85/45 200 x 200
Data center Uninterruptible
power supply
Liebert UPS (225kW, 95%
efficient) 11,250 60/35 175 x 55
Distributed
power
Residential
fuel cell
(stationary
5kW)
PEM, with heat recovery
(35% elec. eff.,40%
thermal eff. with water
loop)
1,760 65/45 40 x 40
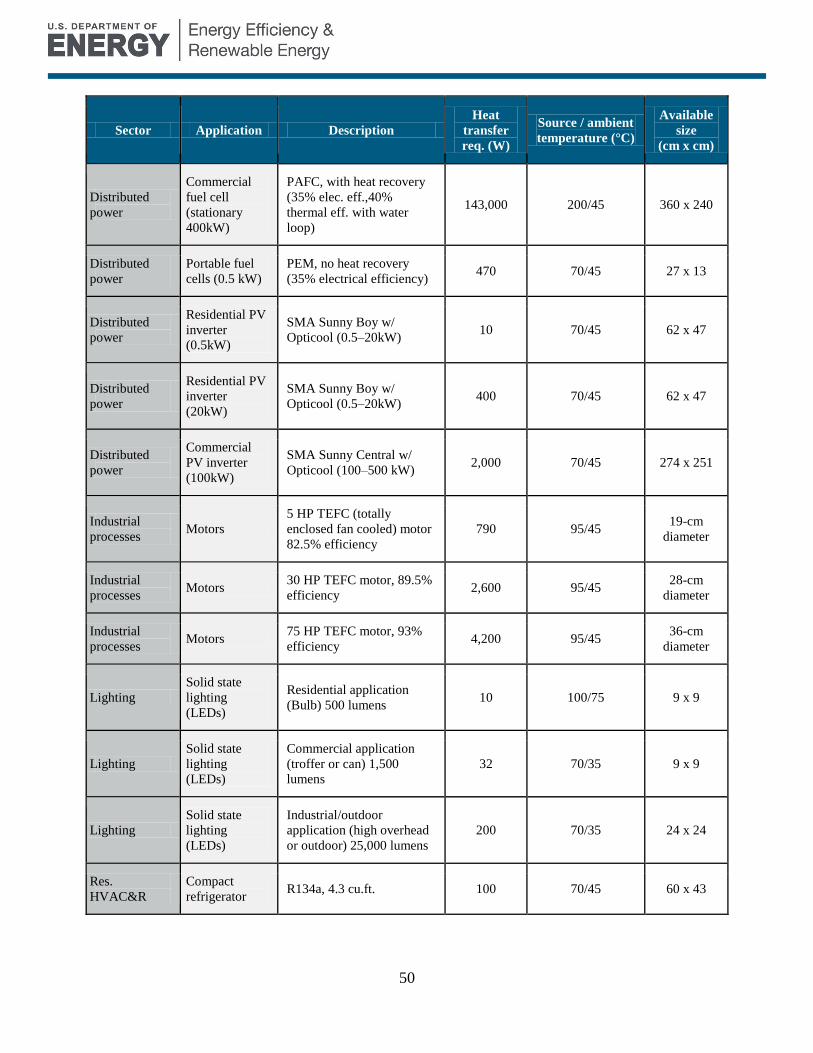
50
Sector Application Description
Heat
transfer
req. (W)
Source / ambient
temperature (°C)
Available
size
(cm x cm)
Distributed
power
Commercial
fuel cell
(stationary
400kW)
PAFC, with heat recovery
(35% elec. eff.,40%
thermal eff. with water
loop)
143,000 200/45 360 x 240
Distributed
power
Portable fuel
cells (0.5 kW)
PEM, no heat recovery
(35% electrical efficiency) 470 70/45 27 x 13
Distributed
power
Residential PV
inverter
(0.5kW)
SMA Sunny Boy w/
Opticool (0.5–20kW) 10 70/45 62 x 47
Distributed
power
Residential PV
inverter
(20kW)
SMA Sunny Boy w/
Opticool (0.5–20kW) 400 70/45 62 x 47
Distributed
power
Commercial
PV inverter
(100kW)
SMA Sunny Central w/
Opticool (100–500 kW) 2,000 70/45 274 x 251
Industrial
processes Motors
5 HP TEFC (totally
enclosed fan cooled) motor
82.5% efficiency
790 95/45 19-cm
diameter
Industrial
processes Motors
30 HP TEFC motor, 89.5%
efficiency 2,600 95/45
28-cm
diameter
Industrial
processes Motors
75 HP TEFC motor, 93%
efficiency 4,200 95/45
36-cm
diameter
Lighting
Solid state
lighting
(LEDs)
Residential application
(Bulb) 500 lumens 10 100/75 9 x 9
Lighting
Solid state
lighting
(LEDs)
Commercial application
(troffer or can) 1,500
lumens
32 70/35 9 x 9
Lighting
Solid state
lighting
(LEDs)
Industrial/outdoor
application (high overhead
or outdoor) 25,000 lumens
200 70/35 24 x 24
Res.
HVAC&R
Compact
refrigerator R134a, 4.3 cu.ft. 100 70/45 60 x 43
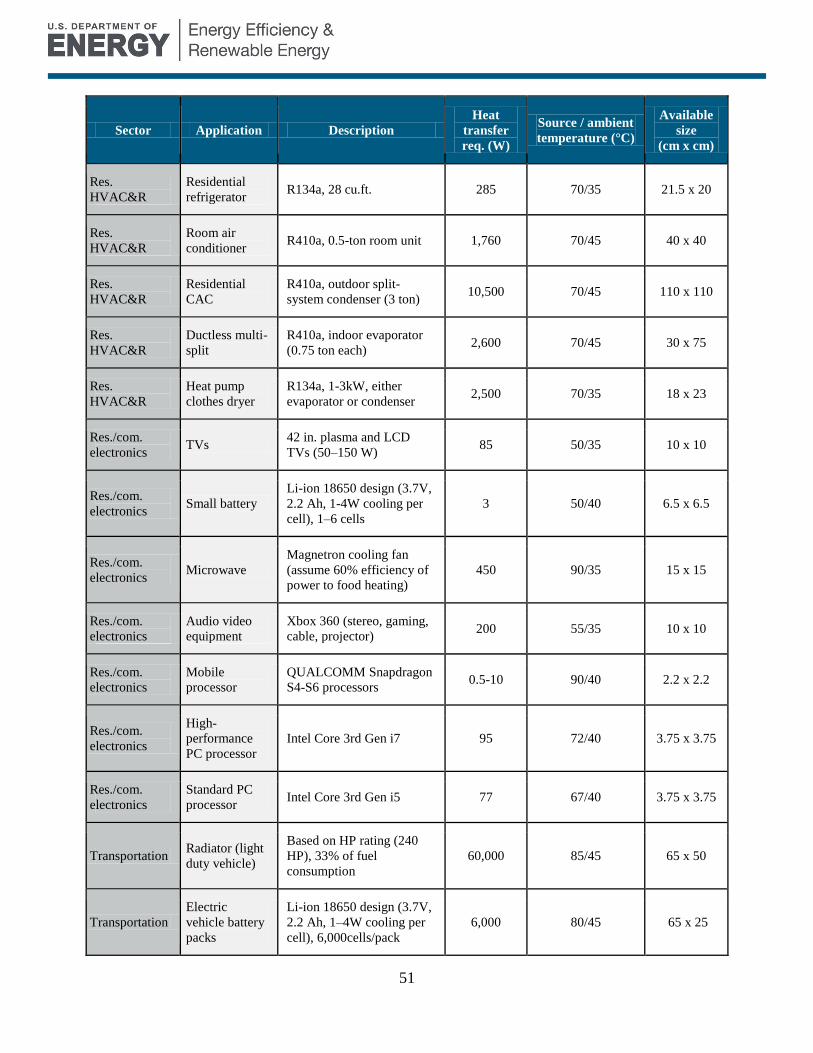
51
Sector Application Description
Heat
transfer
req. (W)
Source / ambient
temperature (°C)
Available
size
(cm x cm)
Res.
HVAC&R
Residential
refrigerator R134a, 28 cu.ft. 285 70/35 21.5 x 20
Res.
HVAC&R
Room air
conditioner R410a, 0.5-ton room unit 1,760 70/45 40 x 40
Res.
HVAC&R
Residential
CAC
R410a, outdoor split-
system condenser (3 ton) 10,500 70/45 110 x 110
Res.
HVAC&R
Ductless multi-
split
R410a, indoor evaporator
(0.75 ton each) 2,600 70/45 30 x 75
Res.
HVAC&R
Heat pump
clothes dryer
R134a, 1-3kW, either
evaporator or condenser 2,500 70/35 18 x 23
Res./com.
electronics TVs
42 in. plasma and LCD
TVs (50–150 W) 85 50/35 10 x 10
Res./com.
electronics Small battery
Li-ion 18650 design (3.7V,
2.2 Ah, 1-4W cooling per
cell), 1–6 cells
3 50/40 6.5 x 6.5
Res./com.
electronics Microwave
Magnetron cooling fan
(assume 60% efficiency of
power to food heating)
450 90/35 15 x 15
Res./com.
electronics
Audio video
equipment
Xbox 360 (stereo, gaming,
cable, projector) 200 55/35 10 x 10
Res./com.
electronics
Mobile
processor
QUALCOMM Snapdragon
S4-S6 processors 0.5-10 90/40 2.2 x 2.2
Res./com.
electronics
High-
performance
PC processor
Intel Core 3rd Gen i7 95 72/40 3.75 x 3.75
Res./com.
electronics
Standard PC
processor Intel Core 3rd Gen i5 77 67/40 3.75 x 3.75
Transportation Radiator (light
duty vehicle)
Based on HP rating (240
HP), 33% of fuel
consumption
60,000 85/45 65 x 50
Transportation
Electric
vehicle battery
packs
Li-ion 18650 design (3.7V,
2.2 Ah, 1–4W cooling per
cell), 6,000cells/pack
6,000 80/45 65 x 25
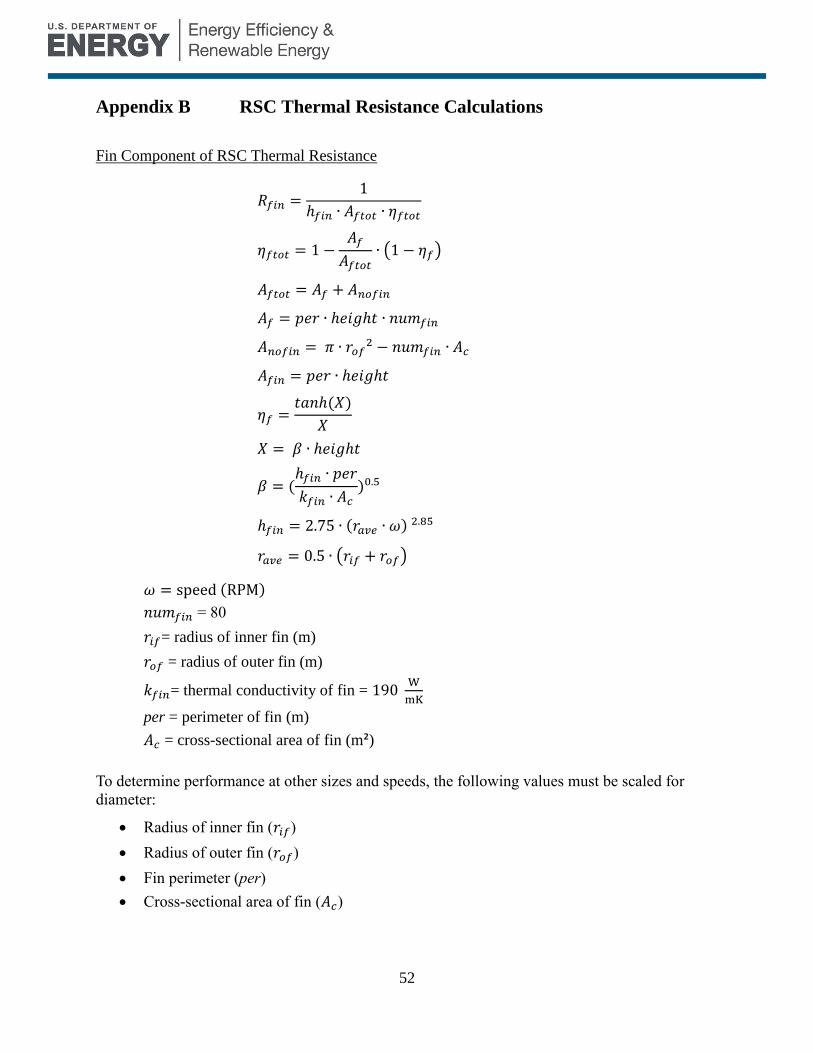
52
Appendix B RSC Thermal Resistance Calculations
Fin Component of RSC Thermal Resistance
( )
𝑛
𝑛
𝑛 ( )
(
)
( 𝜔)
( )
𝜔 speed (RPM)
𝑛 = 80
= radius of inner fin (m)
= radius of outer fin (m)
= thermal conductivity of fin =
per = perimeter of fin (m)
= cross-sectional area of fin (m²)
To determine performance at other sizes and speeds, the following values must be scaled for
diameter:
Radius of inner fin ( )
Radius of outer fin ( )
Fin perimeter (per)
Cross-sectional area of fin ( )
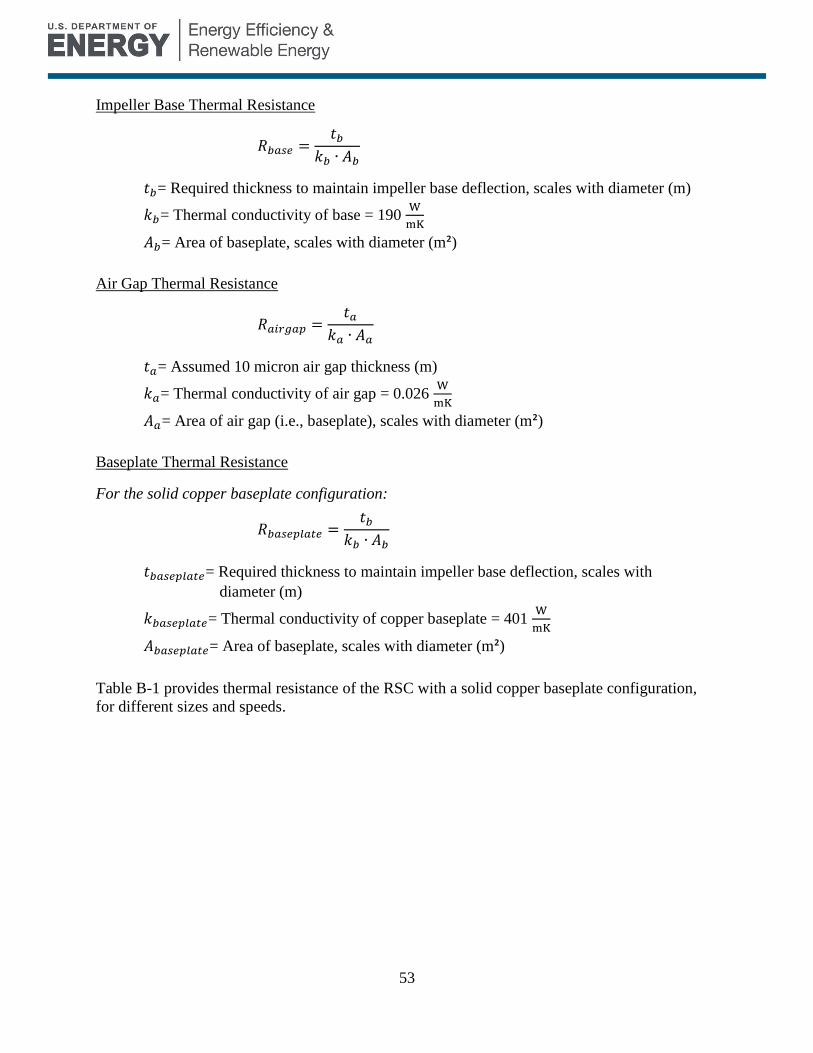
53
Impeller Base Thermal Resistance
= Required thickness to maintain impeller base deflection, scales with diameter (m)
= Thermal conductivity of base = 190
= Area of baseplate, scales with diameter (m²)
Air Gap Thermal Resistance
= Assumed 10 micron air gap thickness (m)
= Thermal conductivity of air gap = 0.026
= Area of air gap (i.e., baseplate), scales with diameter (m²)
Baseplate Thermal Resistance
For the solid copper baseplate configuration:
= Required thickness to maintain impeller base deflection, scales with
diameter (m)
= Thermal conductivity of copper baseplate = 401
= Area of baseplate, scales with diameter (m²)
Table B-1 provides thermal resistance of the RSC with a solid copper baseplate configuration,
for different sizes and speeds.

54
Table B-1. RSC Thermal Resistance, Solid Copper Baseplate Configuration
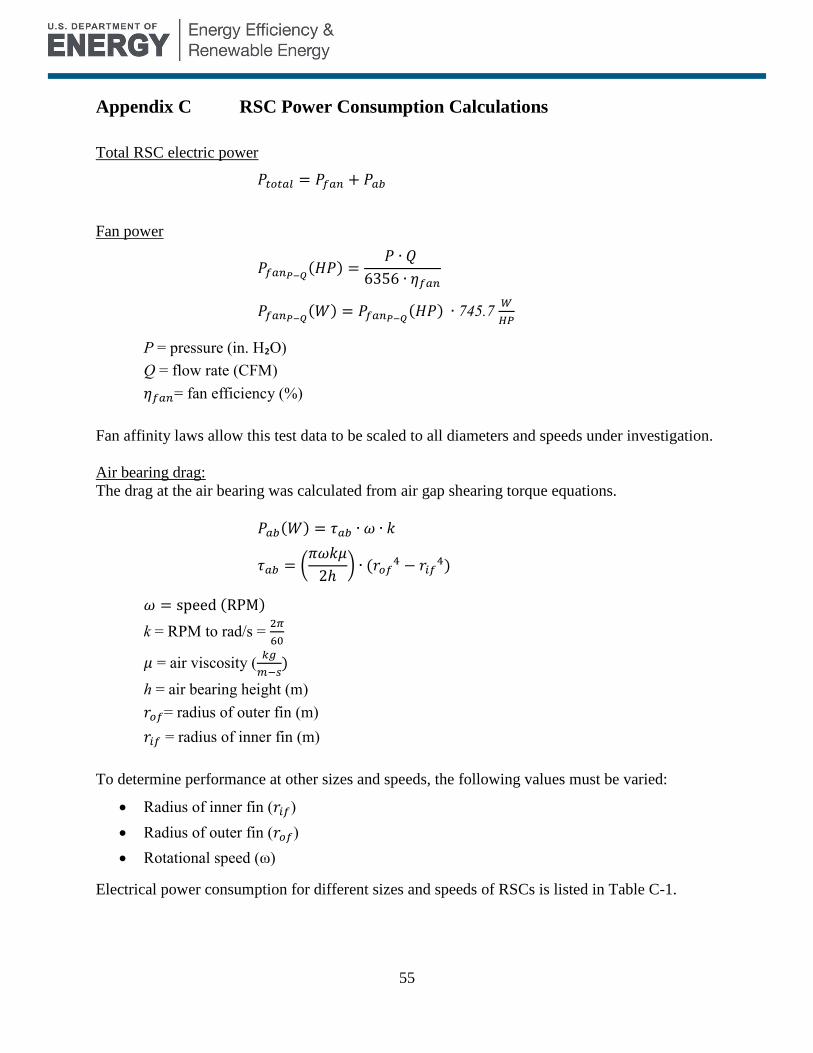
55
Appendix C RSC Power Consumption Calculations
Total RSC electric power
𝑃 𝑃 𝑃
Fan power
𝑃 ( 𝑃) 𝑃 𝑄
63 6
𝑃 ( ) 𝑃 ( 𝑃) 745.7
P = pressure (in. H₂O)
Q = flow rate (CFM)
= fan efficiency (%)
Fan affinity laws allow this test data to be scaled to all diameters and speeds under investigation.
Air bearing drag:
The drag at the air bearing was calculated from air gap shearing torque equations.
𝑃 ( ) 𝜏 𝜔
𝜏 ( 𝜔 𝜇
) (
)
𝜔 speed (RPM)
k = RPM to rad/s =
𝜇 = air viscosity (
)
h = air bearing height (m)
= radius of outer fin (m)
= radius of inner fin (m)
To determine performance at other sizes and speeds, the following values must be varied:
Radius of inner fin ( )
Radius of outer fin ( )
Rotational speed (ω)
Electrical power consumption for different sizes and speeds of RSCs is listed in Table C-1.
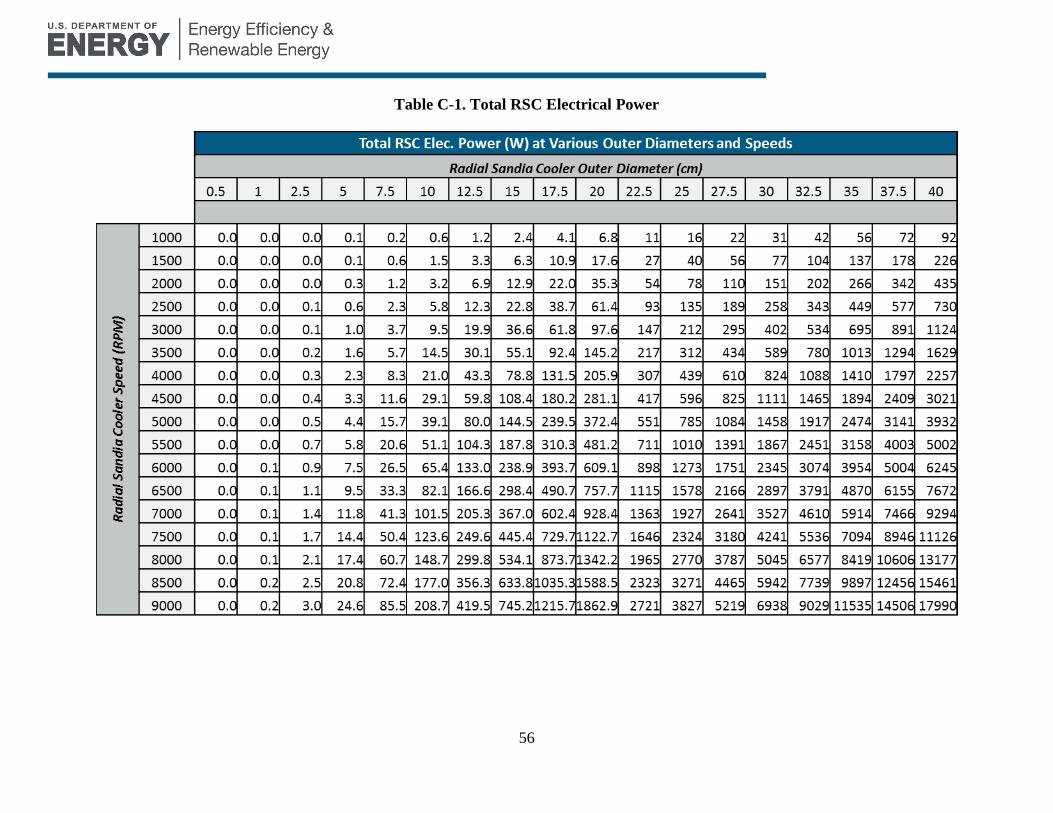
56
Table C-1. Total RSC Electrical Power
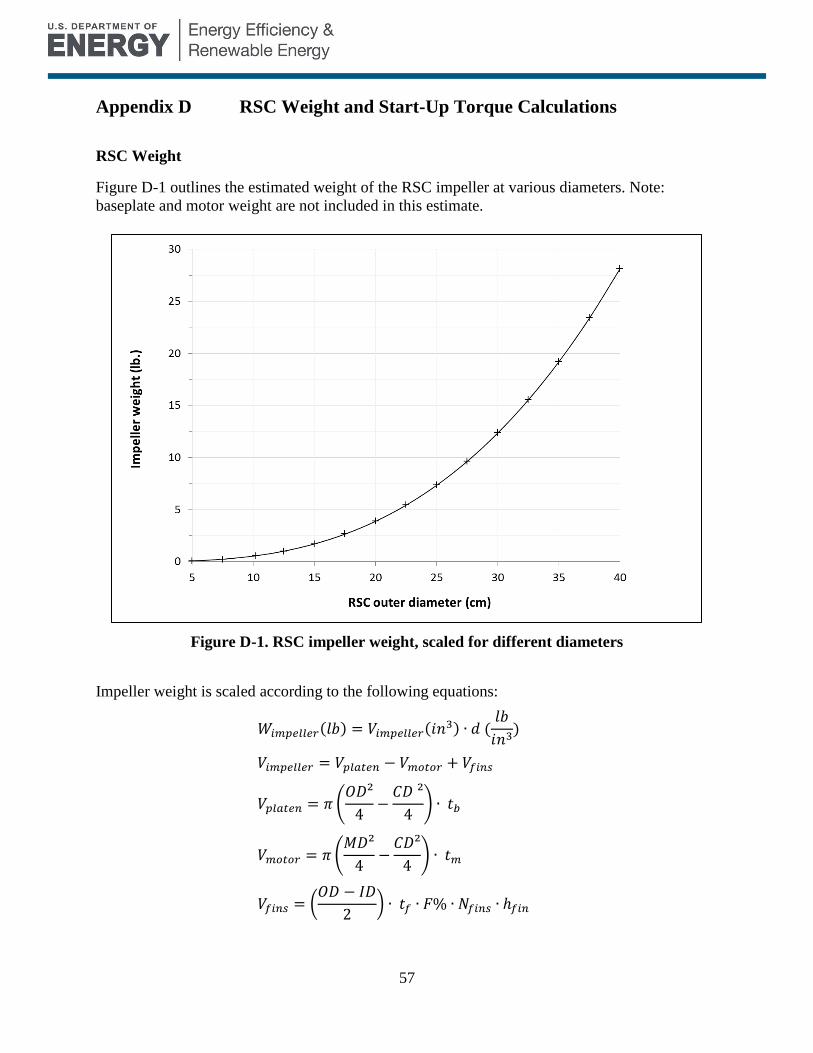
57
Appendix D RSC Weight and Start-Up Torque Calculations
RSC Weight
Figure D-1 outlines the estimated weight of the RSC impeller at various diameters. Note:
baseplate and motor weight are not included in this estimate.
Figure D-1. RSC impeller weight, scaled for different diameters
Impeller weight is scaled according to the following equations:
( ) ( 𝑛 ) (
𝑛 )
( 𝐷
𝐷
)
( 𝐷
𝐷
)
( 𝐷 𝐷
)
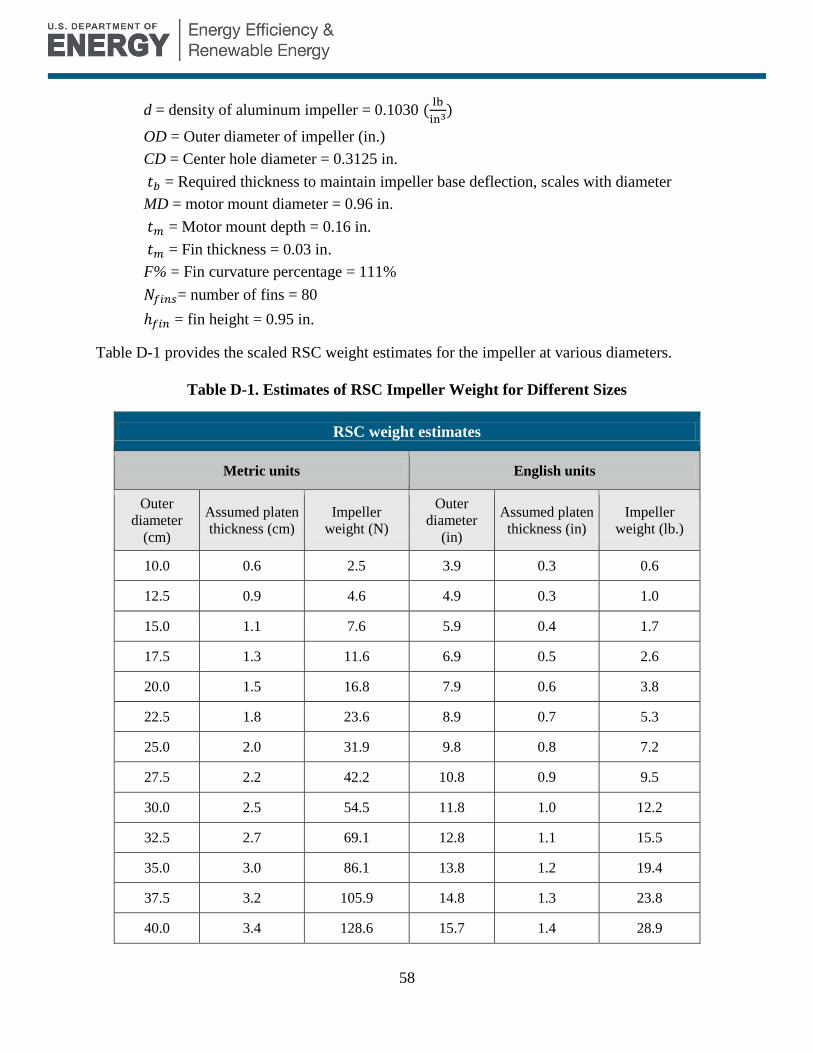
58
d = density of aluminum impeller = 0.1030 (
)
OD = Outer diameter of impeller (in.)
CD = Center hole diameter = 0.3125 in.
= Required thickness to maintain impeller base deflection, scales with diameter
MD = motor mount diameter = 0.96 in.
= Motor mount depth = 0.16 in.
= Fin thickness = 0.03 in.
F% = Fin curvature percentage = 111%
= number of fins = 80
= fin height = 0.95 in.
Table D-1 provides the scaled RSC weight estimates for the impeller at various diameters.
Table D-1. Estimates of RSC Impeller Weight for Different Sizes
RSC weight estimates
Metric units English units
Outer
diameter
(cm)
Assumed platen
thickness (cm)
Impeller
weight (N)
Outer
diameter
(in)
Assumed platen
thickness (in)
Impeller
weight (lb.)
10.0 0.6 2.5 3.9 0.3 0.6
12.5 0.9 4.6 4.9 0.3 1.0
15.0 1.1 7.6 5.9 0.4 1.7
17.5 1.3 11.6 6.9 0.5 2.6
20.0 1.5 16.8 7.9 0.6 3.8
22.5 1.8 23.6 8.9 0.7 5.3
25.0 2.0 31.9 9.8 0.8 7.2
27.5 2.2 42.2 10.8 0.9 9.5
30.0 2.5 54.5 11.8 1.0 12.2
32.5 2.7 69.1 12.8 1.1 15.5
35.0 3.0 86.1 13.8 1.2 19.4
37.5 3.2 105.9 14.8 1.3 23.8
40.0 3.4 128.6 15.7 1.4 28.9
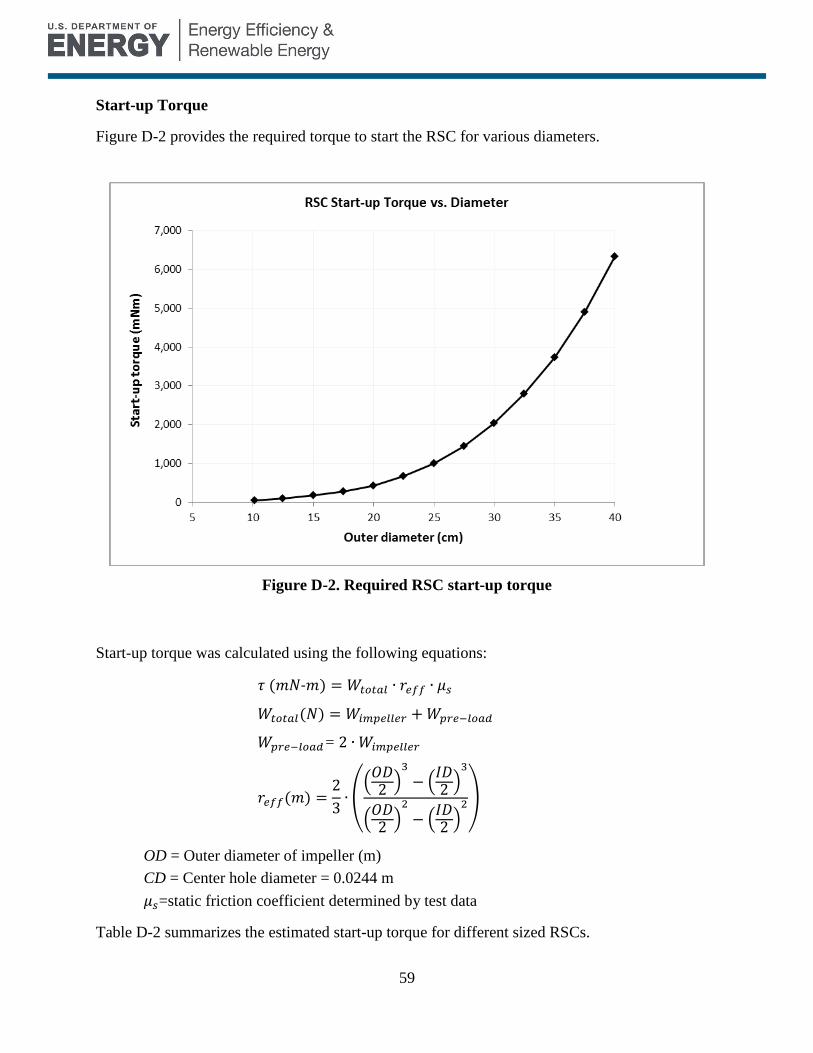
59
Start-up Torque
Figure D-2 provides the required torque to start the RSC for various diameters.
Figure D-2. Required RSC start-up torque
Start-up torque was calculated using the following equations:
𝜏 ( - ) 𝜇
( )
=
( )
3 (( 𝐷 )
( 𝐷 )
( 𝐷 )
( 𝐷 )
)
OD = Outer diameter of impeller (m)
CD = Center hole diameter = 0.0244 m
𝜇 =static friction coefficient determined by test data
Table D-2 summarizes the estimated start-up torque for different sized RSCs.
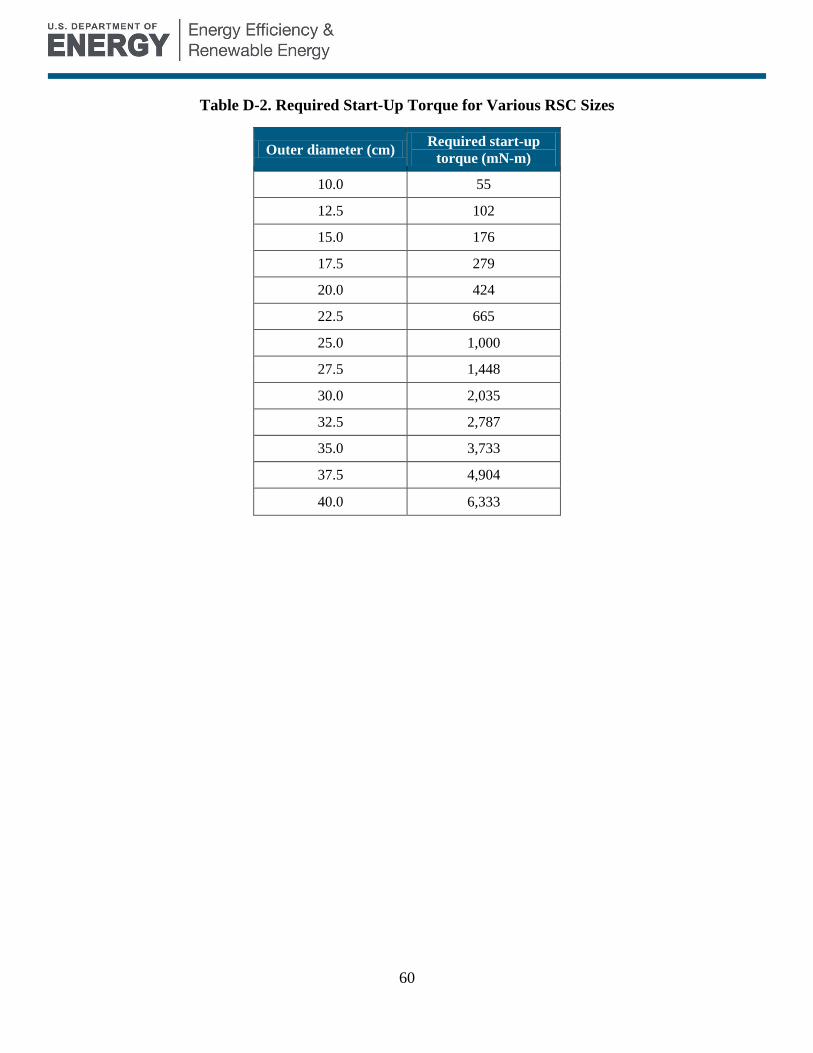
60
Table D-2. Required Start-Up Torque for Various RSC Sizes
Outer diameter (cm) Required start-up
torque (mN-m)
10.0 55
12.5 102
15.0 176
17.5 279
20.0 424
22.5 665
25.0 1,000
27.5 1,448
30.0 2,035
32.5 2,787
35.0 3,733
37.5 4,904
40.0 6,333
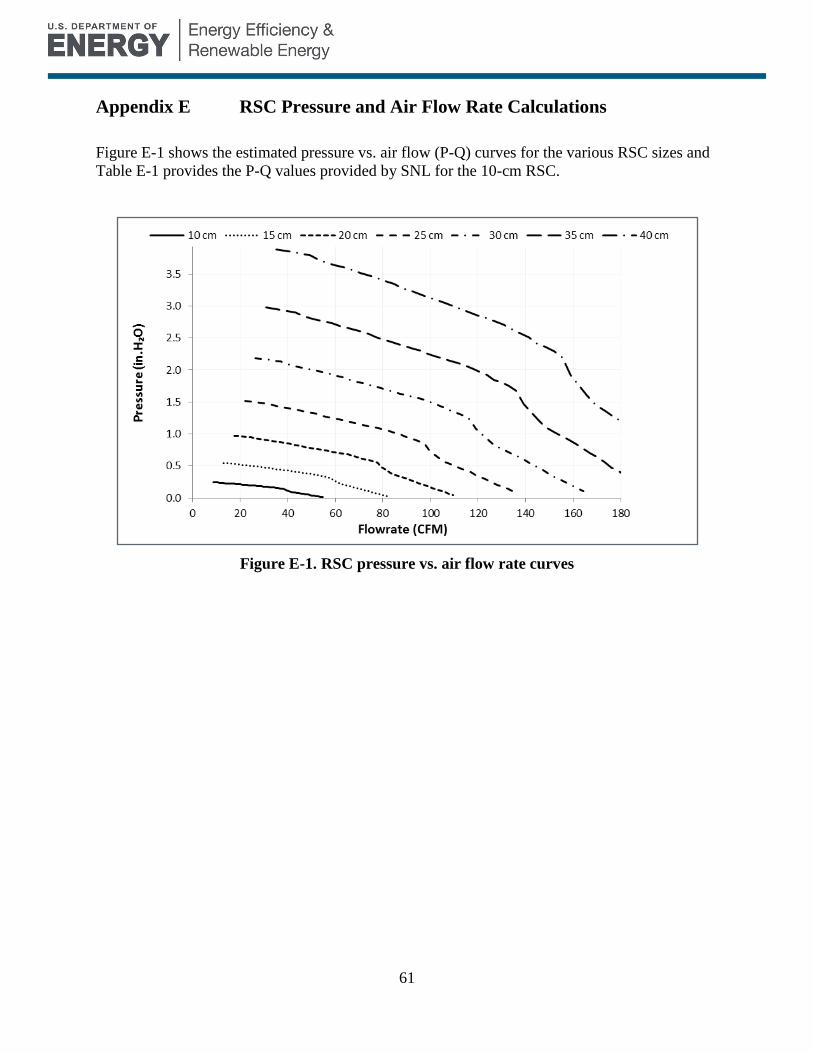
61
Appendix E RSC Pressure and Air Flow Rate Calculations
Figure E-1 shows the estimated pressure vs. air flow (P-Q) curves for the various RSC sizes and
Table E-1 provides the P-Q values provided by SNL for the 10-cm RSC.
Figure E-1. RSC pressure vs. air flow rate curves
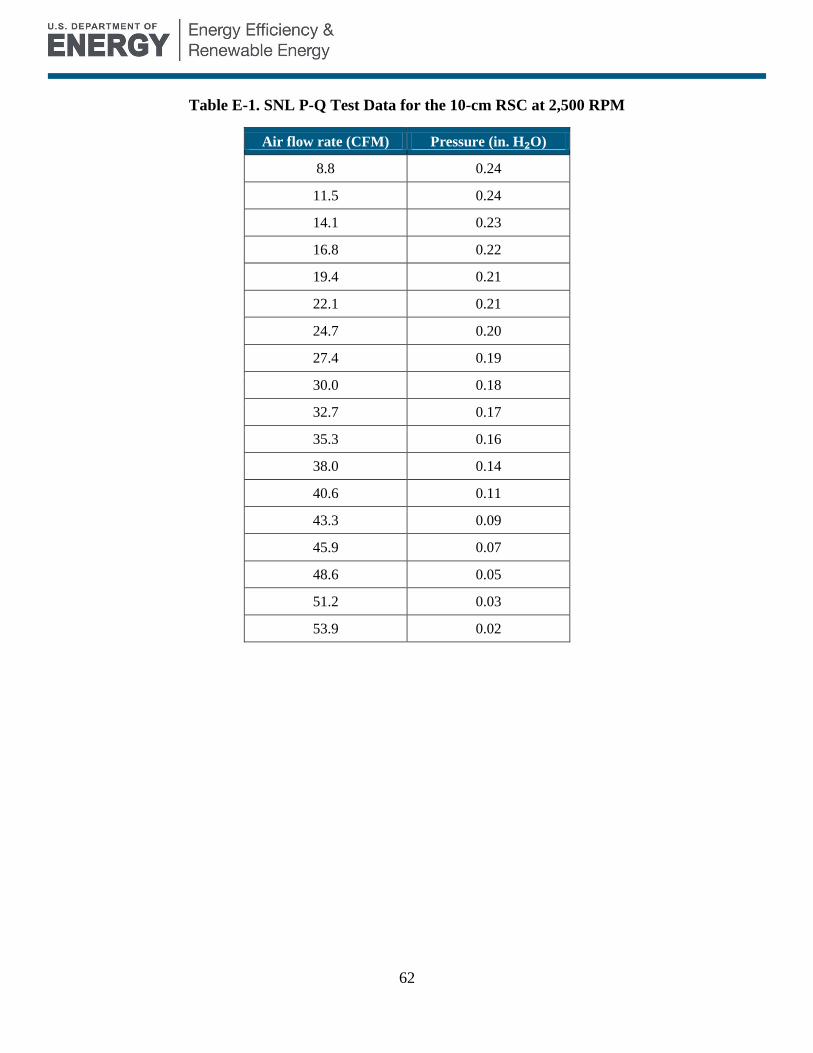
62
Table E-1. SNL P-Q Test Data for the 10-cm RSC at 2,500 RPM
Air flow rate (CFM) Pressure (in. H₂O)
8.8 0.24
11.5 0.24
14.1 0.23
16.8 0.22
19.4 0.21
22.1 0.21
24.7 0.20
27.4 0.19
30.0 0.18
32.7 0.17
35.3 0.16
38.0 0.14
40.6 0.11
43.3 0.09
45.9 0.07
48.6 0.05
51.2 0.03
53.9 0.02
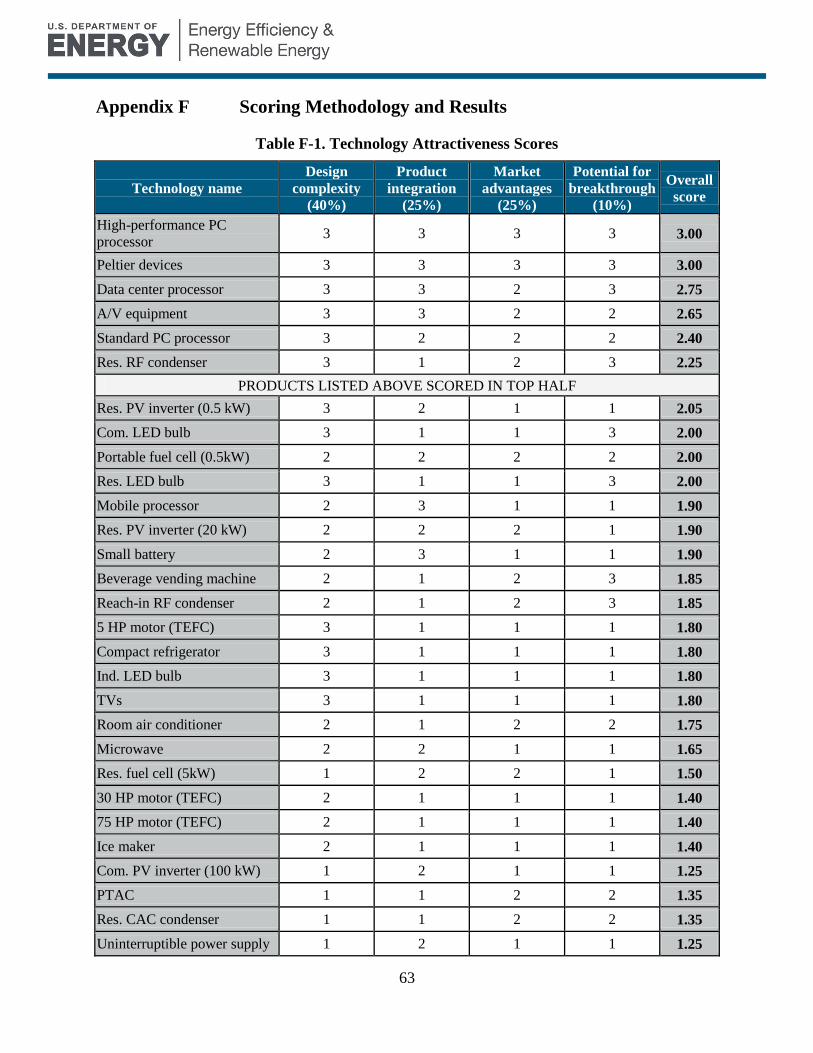
63
Appendix F Scoring Methodology and Results
Table F-1. Technology Attractiveness Scores
Technology name Design
complexity
(40%)
Product
integration
(25%)
Market
advantages
(25%)
Potential for
breakthrough
(10%)
Overall
score
High-performance PC
processor 3 3 3 3 3.00
Peltier devices 3 3 3 3 3.00
Data center processor 3 3 2 3 2.75
A/V equipment 3 3 2 2 2.65
Standard PC processor 3 2 2 2 2.40
Res. RF condenser 3 1 2 3 2.25
PRODUCTS LISTED ABOVE SCORED IN TOP HALF
Res. PV inverter (0.5 kW) 3 2 1 1 2.05
Com. LED bulb 3 1 1 3 2.00
Portable fuel cell (0.5kW) 2 2 2 2 2.00
Res. LED bulb 3 1 1 3 2.00
Mobile processor 2 3 1 1 1.90
Res. PV inverter (20 kW) 2 2 2 1 1.90
Small battery 2 3 1 1 1.90
Beverage vending machine 2 1 2 3 1.85
Reach-in RF condenser 2 1 2 3 1.85
5 HP motor (TEFC) 3 1 1 1 1.80
Compact refrigerator 3 1 1 1 1.80
Ind. LED bulb 3 1 1 1 1.80
TVs 3 1 1 1 1.80
Room air conditioner 2 1 2 2 1.75
Microwave 2 2 1 1 1.65
Res. fuel cell (5kW) 1 2 2 1 1.50
30 HP motor (TEFC) 2 1 1 1 1.40
75 HP motor (TEFC) 2 1 1 1 1.40
Ice maker 2 1 1 1 1.40
Com. PV inverter (100 kW) 1 2 1 1 1.25
PTAC 1 1 2 2 1.35
Res. CAC condenser 1 1 2 2 1.35
Uninterruptible power supply 1 2 1 1 1.25

64
Table F-2. Market Attractiveness Scores
Technology name U.S. market
size (50%) Market adoption of new
technologies (35%) Allowable cost
premium (15%) Overall
score
Mobile processor 3 3 3 3.00
A/V equipment 3 3 2 2.85
Standard PC processor 3 3 2 2.85
Data Center processor 2 3 3 2.50
Com. LED bulb 3 2 1 2.35
Ind. LED bulb 3 2 1 2.35
Res. LED bulb 3 2 1 2.35
Small battery 3 2 1 2.35
TVs 3 2 1 2.35
High-performance PC
processor 1 3 3 2.00
Microwave 3 1 1 2.00
Peltier devices 1 3 3 2.00
Res. fuel cell (5kW) 1 3 3 2.00
Res. RF condenser 3 1 1 2.00
Room Air conditioner 3 1 1 2.00
PRODUCTS LISTED ABOVE SCORED IN TOP HALF
Com. PV inverter (100kW) 1 3 2 1.85
Res. CAC condenser 2 2 1 1.85
Res. PV inverter (0.5 kW) 1 3 2 1.85
Res. PV inverter (20 kW) 1 3 2 1.85
Portable fuel cell (0.5kW) 1 3 1 1.70
Beverage vending machine 2 1 1 1.50
Compact refrigerator 2 1 1 1.50
PTAC 2 1 1 1.50
Uninterruptible power supply 1 2 2 1.50
5 HP motor (TEFC) 1 1 1 1.00
30 HP motor (TEFC) 1 1 1 1.00
75 HP motor (TEFC) 1 1 1 1.00
Ice maker 1 1 1 1.00
Reach-in RF condenser 1 1 1 1.00
65
Appendix G Promising Products for Future RSC Developments
The products below were not considered to be highly attractive for initial RSC introduction, but
may become more appropriate as the RSC technology matures.
Mobile electronics is a large, growing market where heat transfer is a key consideration
as devices are expected to be slim, powerful, and feature long battery life. Examples
include: cell phones, tablets, e-readers, music players, etc. Most products in this space
currently can meet their heat transfer requirements through passive means, often using
the relatively large, flat, back-plate of the device as a the heat transfer surface. 3F
5
Introducing an active heat transfer mechanism adds cost, complexity, and other issues
that would act as a market introduction barrier unless the RSC could enable additional
product capabilities and features. For this reason, we do not recommend pursuing mobile
electronics for initial RSC deployment, but the RSC may be important in the
development of future products, as battery technology and other components allow for
more powerful devices.
LED lighting is an emerging product category that requires careful thermal management
with high potential for energy savings compared to current light fixtures. Although some
products employ forced convection, most LED fixtures currently incorporate fins or fluid
chambers to passively remove heat from the LED packages, driver, and other
components. The main issue impeding RSC adoption for LED lighting is integrating the
RSC impeller and motor into the fixture. Work is underway in FY 2014 at SNL to
develop a solid-state lighting prototype utilizing the RSC.
Small-scale distributed power includes residential and commercial PV inverters (≤ 20
kW) and portable fuel cells. These products score relatively well in both the Technology
and Market Attractiveness scorecards due to their good alignment with the RSC’s
capabilities and allowable cost premium, but ultimately do not make the most promising
list because of small annual sales numbers and the limited market advantage. Once
commercialized in other areas and made available as an off-the-shelf product, these
markets would be expected to utilize the RSC.
Residential & commercial HVAC and commercial refrigeration are attractive product
categories where potentially the RSC could provide breakthrough performance and
energy savings, but do not score well due to integration issues, the uncertainty of using
several larger or dozens of smaller RSCs, and slow market adoption of new technologies.
These sectors are most likely longer-term goals of the Sandia Cooler technology and
could employ alternative concepts or advanced RSC designs. Work is underway in FY
2014–2015 at SNL to integrate refrigerant coils into the RSC baseplate and explore the
potential of advanced RSC designs and other concepts for these sectors. Section 5
discusses these concepts further.
5 The tablet and laptop product categories encompass products with different capabilities ranging from personal
entertainment to business applications and utilize different form factors. Some tablets geared toward business use do
incorporate active heat transfer through fanned heat sinks. Conversely, some laptops do not incorporate active heat
transfer and act more as personal mobile devices. For simplicity, we segmented these two categories based off the
heat transfer strategy for the majority of products: tablets in Mobile Electronics (Passive), and laptops in Computing
(Active).
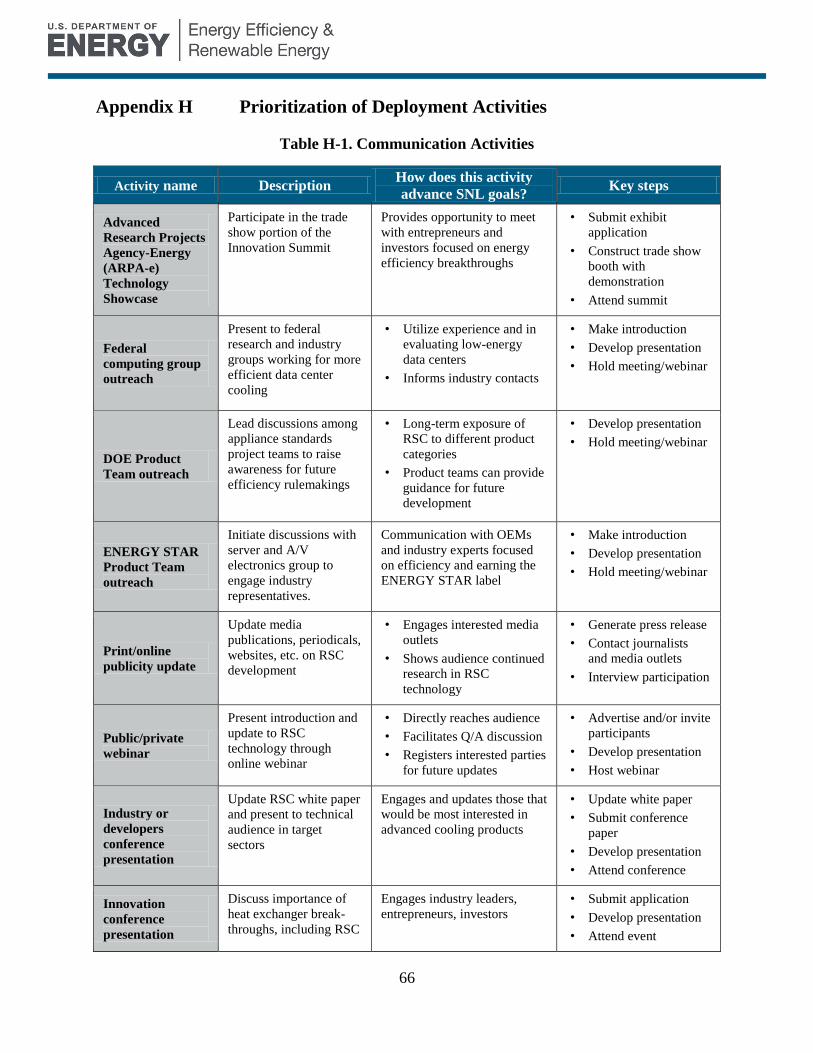
66
Appendix H Prioritization of Deployment Activities
Table H-1. Communication Activities
Activity name Description How does this activity
advance SNL goals? Key steps
Advanced
Research Projects
Agency-Energy
(ARPA-e)
Technology
Showcase
Participate in the trade
show portion of the
Innovation Summit
Provides opportunity to meet
with entrepreneurs and
investors focused on energy
efficiency breakthroughs
• Submit exhibit
application
• Construct trade show
booth with
demonstration
• Attend summit
Federal
computing group
outreach
Present to federal
research and industry
groups working for more
efficient data center
cooling
• Utilize experience and in
evaluating low-energy
data centers
• Informs industry contacts
• Make introduction
• Develop presentation
• Hold meeting/webinar
DOE Product
Team outreach
Lead discussions among
appliance standards
project teams to raise
awareness for future
efficiency rulemakings
• Long-term exposure of
RSC to different product
categories
• Product teams can provide
guidance for future
development
• Develop presentation
• Hold meeting/webinar
ENERGY STAR
Product Team
outreach
Initiate discussions with
server and A/V
electronics group to
engage industry
representatives.
Communication with OEMs
and industry experts focused
on efficiency and earning the
ENERGY STAR label
• Make introduction
• Develop presentation
• Hold meeting/webinar
Print/online
publicity update
Update media
publications, periodicals,
websites, etc. on RSC
development
• Engages interested media
outlets
• Shows audience continued
research in RSC
technology
• Generate press release
• Contact journalists
and media outlets
• Interview participation
Public/private
webinar
Present introduction and
update to RSC
technology through
online webinar
• Directly reaches audience
• Facilitates Q/A discussion
• Registers interested parties
for future updates
• Advertise and/or invite
participants
• Develop presentation
• Host webinar
Industry or
developers
conference
presentation
Update RSC white paper
and present to technical
audience in target
sectors
Engages and updates those that
would be most interested in
advanced cooling products
• Update white paper
• Submit conference
paper
• Develop presentation
• Attend conference
Innovation
conference
presentation
Discuss importance of
heat exchanger break-
throughs, including RSC
Engages industry leaders,
entrepreneurs, investors
• Submit application
• Develop presentation
• Attend event

67
Table H-2. Demonstration Activities
Activity name Description How does this activity
advance SNL goals? Key steps
Complete
development tasks
at SNL
• Continue laboratory
work to understand and
refine RSC operation
• Provides answers to the
questions potential partners
may ask
• Conduct testing to
determine RSC operation
pertaining to: ducts/
enclosures, multiple RSCs,
airstream, reliability,
fouling, noise, safety,
variable speed
Conduct testing at
federal computing
facilities
• Work with federal data
center staff to integrate
RSCs into current or
retired systems
• Engages experts within
data center community to
help refine product
• Demonstrates
performance in actual
environment
• Initial contact with
federal computing
facilities, especially
those evaluating new
technology
• Identify appropriate
servers, test protocol,
and measurement
equipment
• Conduct testing
Test RSC in
actual products at
SNL
Integrate prototype
RSCs in computer,
server, and A/V
electronics at SNL
• Allows for RSC
evaluation in real world
applications
• Helps anticipate issues
with product integration,
controls, and unforeseen
issues
• Obtain prototype RSCs,
test products, and test
plan
• Construct test stand and
measurement system
• Conduct testing
RFP/FOA for
demonstration
Offer funding or cost
share to demonstrate the
technology in actual
product applications or
separate concepts
• Allows organizations
with interest in
technology to apply their
expertise for a specific
application
• Potential to start licensee
based on results
• Identify any gaps in
SNL expertise
• Create RFP/FOA
guidelines
• Evaluate proposals and
select project
• Integrate project results
Provide prototype
to interested
OEMs/suppliers
Invite interested industry
partners to evaluate an
RSC prototype
• Reengages partners who
showed interest before
• Allows testing in each
partner’s R&D facility
• Begin manufacturing or
supplier outreach
• Engage or announce the
opportunity for demo
units
• Manufacture finalized
RSC design
• Distribute to partners
and provide guidance
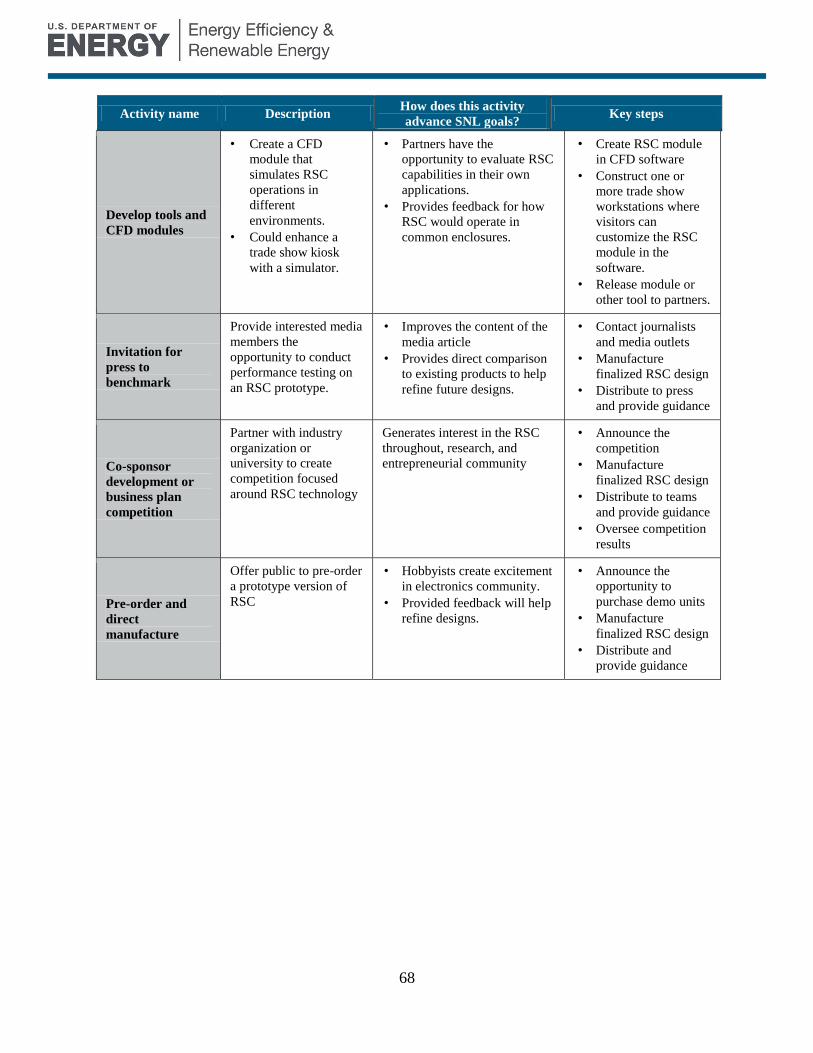
68
Activity name Description How does this activity
advance SNL goals? Key steps
Develop tools and
CFD modules
• Create a CFD
module that
simulates RSC
operations in
different
environments.
• Could enhance a
trade show kiosk
with a simulator.
• Partners have the
opportunity to evaluate RSC
capabilities in their own
applications.
• Provides feedback for how
RSC would operate in
common enclosures.
• Create RSC module
in CFD software
• Construct one or
more trade show
workstations where
visitors can
customize the RSC
module in the
software.
• Release module or
other tool to partners.
Invitation for
press to
benchmark
Provide interested media
members the
opportunity to conduct
performance testing on
an RSC prototype.
• Improves the content of the
media article
• Provides direct comparison
to existing products to help
refine future designs.
• Contact journalists
and media outlets
• Manufacture
finalized RSC design
• Distribute to press
and provide guidance
Co-sponsor
development or
business plan
competition
Partner with industry
organization or
university to create
competition focused
around RSC technology
Generates interest in the RSC
throughout, research, and
entrepreneurial community
• Announce the
competition
• Manufacture
finalized RSC design
• Distribute to teams
and provide guidance
• Oversee competition
results
Pre-order and
direct
manufacture
Offer public to pre-order
a prototype version of
RSC
• Hobbyists create excitement
in electronics community.
• Provided feedback will help
refine designs.
• Announce the
opportunity to
purchase demo units
• Manufacture
finalized RSC design
• Distribute and
provide guidance
BUILDING TECHNOLOGIES OFFICE
DOE/EE-1012 • February 2014 Printed with a renewable-source ink on paper containing at least 50% wastepaper, including 10% post-consumer waste.