Embed Size (px)
Citation preview
481
14.1 Introduction
Gas hydrates are naturally occurring ice-likecrystalline compounds in which gases are trappedwithin a lattice of water molecules. The presence ofgas hydrates is controlled by temperature, pressureand the availability of appropriate gases and water.The first discovery of gas hydrate goes back to 1810,with the pioneering synthesis of chlorine hydrate bySir Humphrey Davy (Davy 1811). In the 1930scrystalline substances were observed to form spon-taneously within natural gas pipelines in permafrostregions, and these deposits, which were clogging thepipelines, were identified as being hydrates of mixedhydrocarbon gases (Hammerschmidt 1934). Therecognition that natural gas hydrates can block gastransmission lines, led the hydrocarbon industry toinvest in efforts aimed at understanding gas hydrates,and thus begins the modern research in this subject.
Russian scientists (Vasil’ev et al. 1970) were thefirst to recognize that methane in natural systemscould form gas hydrate deposits wherever the pressureand temperature conditions were favourable. Theseideas were followed by discovery of gas hydrate, firstin the permafrost regions of Russia (Makogon et al.1971) and Canada’s MacKenzie Delta (Bily and Dick1974), and subsequently in sediments of the CaspianSea and Black Sea (Yefremova and Zhizhchenko 1974).Interest in these deposits prompted the developmentof geophysical prospecting tools, which were usedto predict the occurrence of gas hydrate in sedimentsof the Blake Ridge, of the western Atlantic Ocean(Stoll et al. 1971) and elsewhere (Shipley et al. 1979).In the early 1980s, hydrate was recovered fromsediments of the Middle America Trench offshoreMexico by the Deep Sea Drilling project (Shipley andDidyk 1982). Since then, deep sea drilling hasrecovered hydrate from subsurface sediments along
the Pacific and Atlantic continental slopes(Kvenvolden 1993). In addition, hydrate has beenrecovered from many near-surface environmentsalong continental margins worldwide (Mazurenko andSoloviev 2003).
The number of hydrate publications, scientificsessions and workshops dedicated to gas hydrateresearch has increased substantially during the last10-15 years, reflecting the development of a broadnational and international hydrate research effort inthis field. The interest in gas hydrates emerges fromthe awareness that these deposits may play significantroles in global and regional processes with societaland economic significance. A global hydrateassessment, although still uncertain, suggests thatmethane hydrates might represent an important futureenergy resource (Kvenvolden 1998; Collet 2002). Inaddition, other important hydrate questions that haveattracted attention include: 1) Is there a feedbackbetween methane hydrate stability and climate? 2)What is the role of methane hydrate in the carboncycle? and 3) How much does gas hydrate contributeto seafloor stability on continental slopes?
The purpose of this chapter is to summarize someof the fundamentals of our current understanding ofgas hydrate in marine sediments, its interactions withthe environment, and recent findings from ongoingresearch programs that illustrate key aspects of gashydrate dynamics. We start with general informationon the structure and composition of gas hydrates andaddress their presence and distribution in the marinesediments based on their thermodynamic stability andenvironmental conditions. Because here we emphasizetopics that are relevant to the scope of this textbook,we review the sources and migration mechanism ofgases needed to stabilize the hydrate structure; thechemical and isotopic anomalies associated withhydrate formation; and the interaction of hydrateswith fluid flow along continental margins.
14 Gas Hydrates in Marine SedimentsGERHARD BOHRMANN AND MARTA E. TORRES
14 Gas Hydrates in Marine Sediments
482
14.2 Hydrate Crystal Chemistryand Stability of Gas Hydrates
14.2.1 Cages and Three Crystal Structures
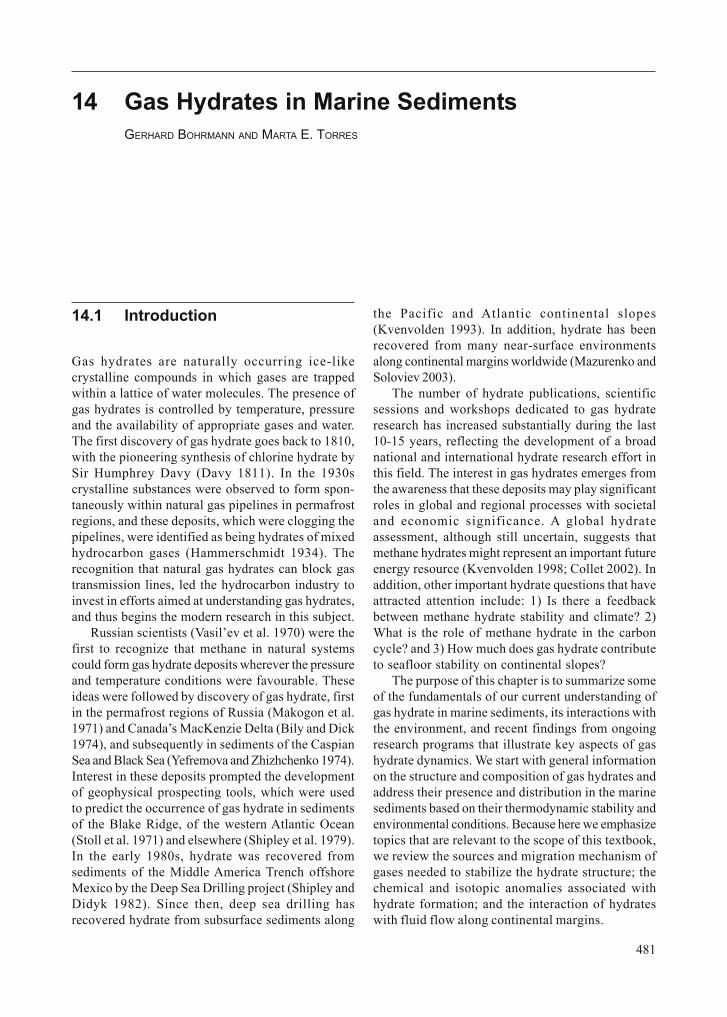
Gas hydrates are non-stoichiometric, solid compoundssimilar to ice crystals (Sloan 1998). In these compounds,also called clathrates (latin clatratus for cage), watermolecules form cage-like structures in which lowmolecular weight gases are enclosed as guestmolecules (Fig. 14.1). The gas molecules interact withwater molecules through van der Waals (nonpolar)forces. Since no bonding exists between the guestand host molecules, the guest molecules are free torotate inside the cages, and this rotation can bemeasured by spectroscopic techniques (e.g. Gutt etal. 1999). Gas hydrate can contain different types ofgas molecules in separate cages, depending on thegas composition in the environment of formation.Methane is the main gas in naturally occurring gashydrates; however H2S, CO2 and, less frequently, otherhydrocarbons, can also be found within the hydratestructure.
To date gas hydrates have been found to occur inthree different crystal structures (Sloan 1998).Structures I and II both crystallize within a cubicsystem, whereas the third structure (also denominatedH) crystallizes within a hexagonal system, analogousto water-ice (Fig. 14.1; Table 14.1). The structure ofgas hydrate can be seen as a packing of polyhedralcages. Five types of hydrate cages are known, from
which the simplest polyhedron is formed by twelvefive-sided polygons (512) known as pentagonaldodecahedra. This cage is the smallest one that occursin all three clathrate crystals (Fig. 14.1; Table 14.1).Larger diameter cages can be formed by adding two,four or eight hexagonal faces, and these are denotedas 51262 in structure I, 51264 in structure II, and 51268 instructure H (Table 14.1). In addition, structure H has amedium-sized cavity with square, pentagonal andhexagonal faces (435663). Figure 1 depicts the fivecavities of all three structures that are known to occurnaturally.
Structure I is most frequently observed. Its unitcell consists of 8 cages: 2 small (512) and 6 large cavities(51262). Inside each cavity resides a maximum of 1 guestmolecule, such that 8 guests molecules are associatedwith 46 water molecules in structure I (2[512] 6[51262]46H2O). A unit cell of structure II consists of 24 cages,i.e. 16 small cavities (512) and 8 large ones (51264), whichaccount for 136 water molecules (16[512] 8[51264]136H2O). Structure H forms a more complicated crystalcomposed of 3 small (512), 2 medium-sized (435663) and1 exceptionally large (51268) cavity associated with 34water molecules (3[512] 2[51264] 1[435663] 34H2O).
When all hydrate cages are filled, the three crystaltypes have similar concentrations of 85 mol% waterand 15 mol% guest molecules. Structure I hydrate withCH4 and C2H6 has minimum (stoichiometric) hydrationnumbers of 5.75 and 7.67, respectively. Only largecavities in the Structure II hydrate are occupied withC3H8 (and i-C4H10), and such hydrates have a hydrationnumber of 17 (e.g. Sloan 1998). However, hydration
Fig. 14.1 Left: Gas hydrate of type structure I; small spheres are water molecules forming cages; large spheres aregas molecules. Right: Cage types and the number of individual cages forming the three common hydrate crystalstructures. The circled numbers denote the numbers of the cages used to form the hydrate structure.
483
14.2 Hydrate Crystal Chemistry and Stability of Gas Hydrates
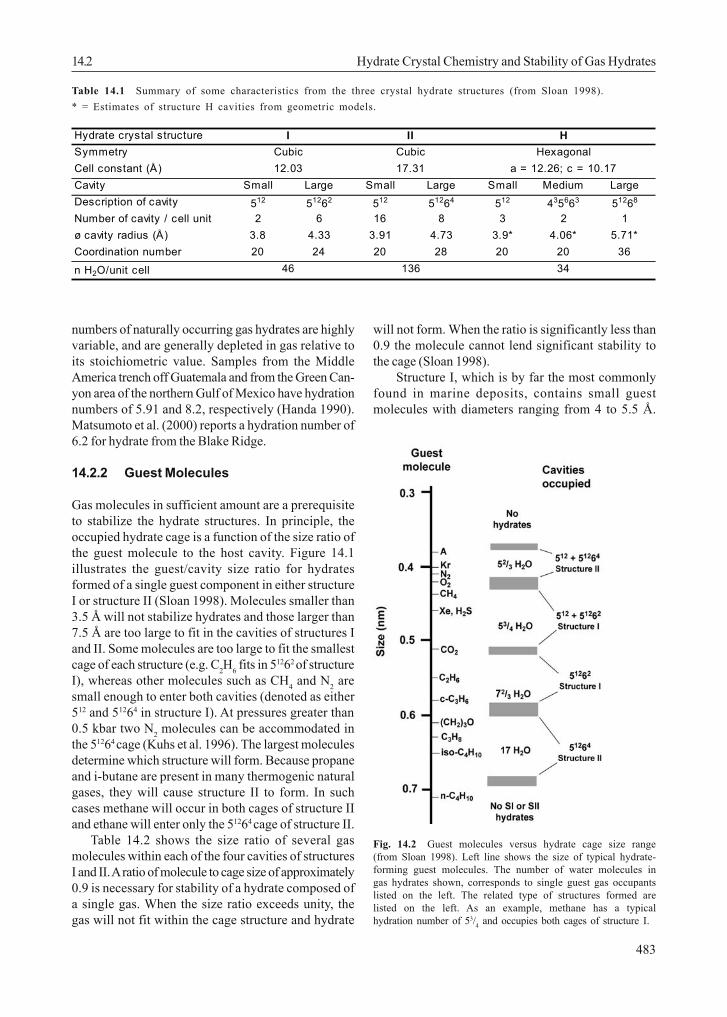
Table 14.1 Summary of some characteristics from the three crystal hydrate structures (from Sloan 1998).* = Estimates of structure H cavities from geometric models.
numbers of naturally occurring gas hydrates are highlyvariable, and are generally depleted in gas relative toits stoichiometric value. Samples from the MiddleAmerica trench off Guatemala and from the Green Can-yon area of the northern Gulf of Mexico have hydrationnumbers of 5.91 and 8.2, respectively (Handa 1990).Matsumoto et al. (2000) reports a hydration number of6.2 for hydrate from the Blake Ridge.
14.2.2 Guest Molecules
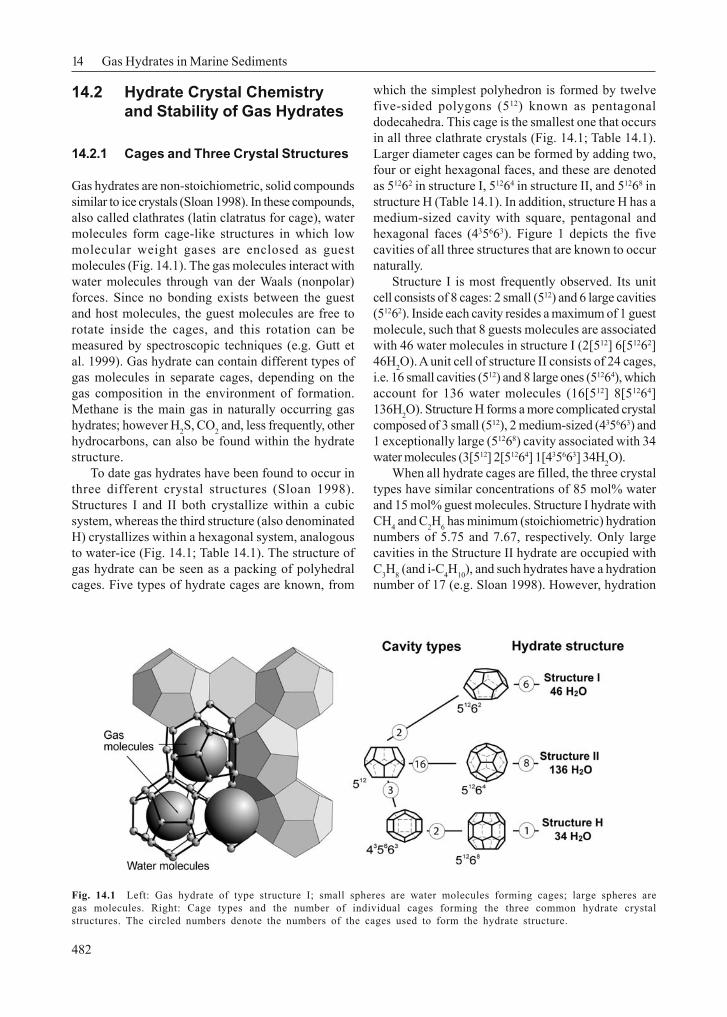
Gas molecules in sufficient amount are a prerequisiteto stabilize the hydrate structures. In principle, theoccupied hydrate cage is a function of the size ratio ofthe guest molecule to the host cavity. Figure 14.1illustrates the guest/cavity size ratio for hydratesformed of a single guest component in either structureI or structure II (Sloan 1998). Molecules smaller than3.5 Å will not stabilize hydrates and those larger than7.5 Å are too large to fit in the cavities of structures Iand II. Some molecules are too large to fit the smallestcage of each structure (e.g. C2H6 fits in 51262 of structureI), whereas other molecules such as CH4 and N2 aresmall enough to enter both cavities (denoted as either512 and 51264 in structure I). At pressures greater than0.5 kbar two N2 molecules can be accommodated inthe 51264 cage (Kuhs et al. 1996). The largest moleculesdetermine which structure will form. Because propaneand i-butane are present in many thermogenic naturalgases, they will cause structure II to form. In suchcases methane will occur in both cages of structure IIand ethane will enter only the 51264 cage of structure II.
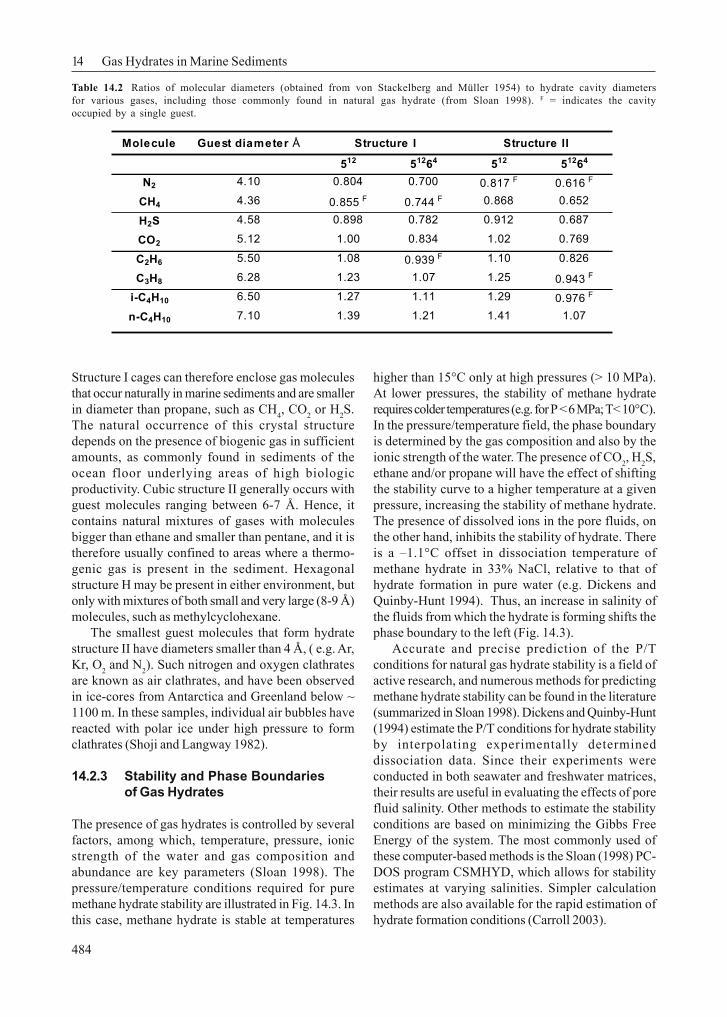
Table 14.2 shows the size ratio of several gasmolecules within each of the four cavities of structuresI and II. A ratio of molecule to cage size of approximately0.9 is necessary for stability of a hydrate composed ofa single gas. When the size ratio exceeds unity, thegas will not fit within the cage structure and hydrate
will not form. When the ratio is significantly less than0.9 the molecule cannot lend significant stability tothe cage (Sloan 1998).
Structure I, which is by far the most commonlyfound in marine deposits, contains small guestmolecules with diameters ranging from 4 to 5.5 Å.
Hydrate crystal structureSymmetryCell constant (Å)Cavity Small Large Small Large Small Medium LargeDescription of cavity 512 51262 512 51264 512 435663 51268
Number of cavity / cell unit 2 6 16 8 3 2 1ø cavity radius (Å) 3.8 4.33 3.91 4.73 3.9* 4.06* 5.71*Coordination number 20 24 20 28 20 20 36
n H2O/unit cell
12.03 17.31 a = 12.26; c = 10.17
46 136 34
I II HCubic Cubic Hexagonal
Fig. 14.2 Guest molecules versus hydrate cage size range(from Sloan 1998). Left line shows the size of typical hydrate-forming guest molecules. The number of water molecules ingas hydrates shown, corresponds to single guest gas occupantslisted on the left. The related type of structures formed arelisted on the left. As an example, methane has a typicalhydration number of 53/4 and occupies both cages of structure I.
14 Gas Hydrates in Marine Sediments
484
Structure I cages can therefore enclose gas moleculesthat occur naturally in marine sediments and are smallerin diameter than propane, such as CH4, CO2 or H2S.The natural occurrence of this crystal structuredepends on the presence of biogenic gas in sufficientamounts, as commonly found in sediments of theocean floor underlying areas of high biologicproductivity. Cubic structure II generally occurs withguest molecules ranging between 6-7 Å. Hence, itcontains natural mixtures of gases with moleculesbigger than ethane and smaller than pentane, and it istherefore usually confined to areas where a thermo-genic gas is present in the sediment. Hexagonalstructure H may be present in either environment, butonly with mixtures of both small and very large (8-9 Å)molecules, such as methylcyclohexane.
The smallest guest molecules that form hydratestructure II have diameters smaller than 4 Å, ( e.g. Ar,Kr, O2 and N2). Such nitrogen and oxygen clathratesare known as air clathrates, and have been observedin ice-cores from Antarctica and Greenland below ~1100 m. In these samples, individual air bubbles havereacted with polar ice under high pressure to formclathrates (Shoji and Langway 1982).
14.2.3 Stability and Phase Boundariesof Gas Hydrates
The presence of gas hydrates is controlled by severalfactors, among which, temperature, pressure, ionicstrength of the water and gas composition andabundance are key parameters (Sloan 1998). Thepressure/temperature conditions required for puremethane hydrate stability are illustrated in Fig. 14.3. Inthis case, methane hydrate is stable at temperatures
higher than 15°C only at high pressures (> 10 MPa).At lower pressures, the stability of methane hydraterequires colder temperatures (e.g. for P < 6 MPa; T< 10°C).In the pressure/temperature field, the phase boundaryis determined by the gas composition and also by theionic strength of the water. The presence of CO2, H2S,ethane and/or propane will have the effect of shiftingthe stability curve to a higher temperature at a givenpressure, increasing the stability of methane hydrate.The presence of dissolved ions in the pore fluids, onthe other hand, inhibits the stability of hydrate. Thereis a –1.1°C offset in dissociation temperature ofmethane hydrate in 33% NaCl, relative to that ofhydrate formation in pure water (e.g. Dickens andQuinby-Hunt 1994). Thus, an increase in salinity ofthe fluids from which the hydrate is forming shifts thephase boundary to the left (Fig. 14.3).
Accurate and precise prediction of the P/Tconditions for natural gas hydrate stability is a field ofactive research, and numerous methods for predictingmethane hydrate stability can be found in the literature(summarized in Sloan 1998). Dickens and Quinby-Hunt(1994) estimate the P/T conditions for hydrate stabilityby interpolating experimentally determineddissociation data. Since their experiments wereconducted in both seawater and freshwater matrices,their results are useful in evaluating the effects of porefluid salinity. Other methods to estimate the stabilityconditions are based on minimizing the Gibbs FreeEnergy of the system. The most commonly used ofthese computer-based methods is the Sloan (1998) PC-DOS program CSMHYD, which allows for stabilityestimates at varying salinities. Simpler calculationmethods are also available for the rapid estimation ofhydrate formation conditions (Carroll 2003).
Table 14.2 Ratios of molecular diameters (obtained from von Stackelberg and Müller 1954) to hydrate cavity diametersfor various gases, including those commonly found in natural gas hydrate (from Sloan 1998). F = indicates the cavityoccupied by a single guest.
Molecule Guest diameter Å
512 51264 512 51264
N2 4.10 0.804 0.700 0.817 F 0.616 F
CH4 4.36 0.855 F 0.744 F 0.868 0.652
H2S 4.58 0.898 0.782 0.912 0.687
CO2 5.12 1.00 0.834 1.02 0.769
C2H6 5.50 1.08 0.939 F 1.10 0.826
C3H8 6.28 1.23 1.07 1.25 0.943 F
i-C4H10 6.50 1.27 1.11 1.29 0.976 F
n-C4H10 7.10 1.39 1.21 1.41 1.07
Structure I Structure II
485
14.3 Hydrate Occurrence in theOceanic Environment
14.3.1 Gas Hydrate Stability Zone inMarine Sediments
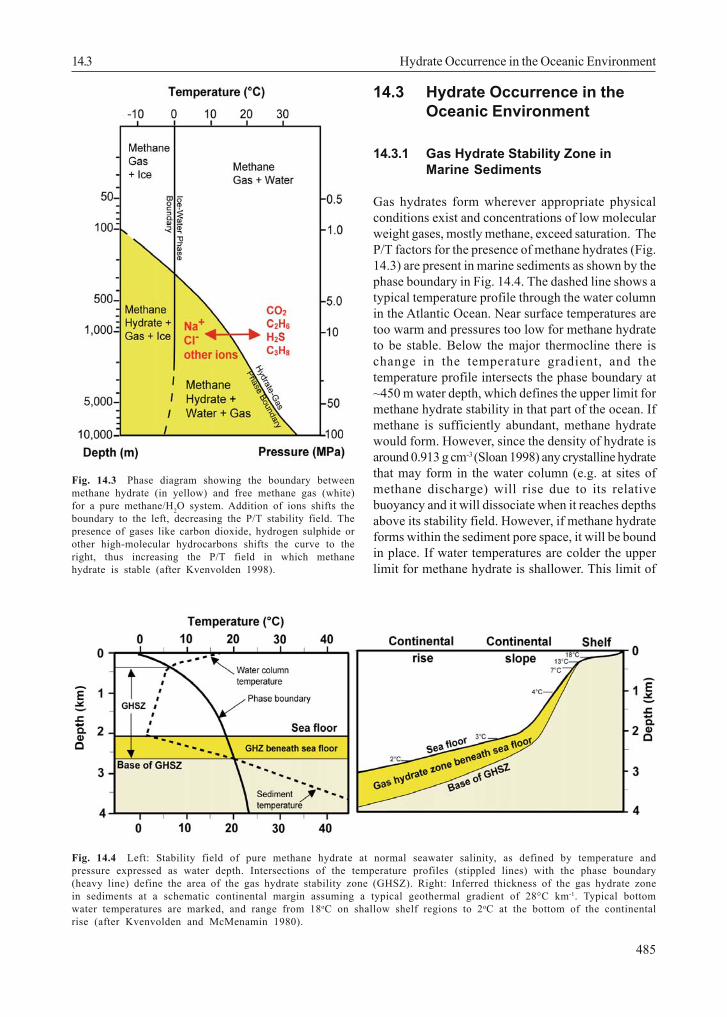
Gas hydrates form wherever appropriate physicalconditions exist and concentrations of low molecularweight gases, mostly methane, exceed saturation. TheP/T factors for the presence of methane hydrates (Fig.14.3) are present in marine sediments as shown by thephase boundary in Fig. 14.4. The dashed line shows atypical temperature profile through the water columnin the Atlantic Ocean. Near surface temperatures aretoo warm and pressures too low for methane hydrateto be stable. Below the major thermocline there ischange in the temperature gradient, and thetemperature profile intersects the phase boundary at~450 m water depth, which defines the upper limit formethane hydrate stability in that part of the ocean. Ifmethane is sufficiently abundant, methane hydratewould form. However, since the density of hydrate isaround 0.913 g cm-3(Sloan 1998) any crystalline hydratethat may form in the water column (e.g. at sites ofmethane discharge) will rise due to its relativebuoyancy and it will dissociate when it reaches depthsabove its stability field. However, if methane hydrateforms within the sediment pore space, it will be boundin place. If water temperatures are colder the upperlimit for methane hydrate is shallower. This limit of
Fig. 14.3 Phase diagram showing the boundary betweenmethane hydrate (in yellow) and free methane gas (white)for a pure methane/H2O system. Addition of ions shifts theboundary to the left, decreasing the P/T stability field. Thepresence of gases like carbon dioxide, hydrogen sulphide orother high-molecular hydrocarbons shifts the curve to theright, thus increasing the P/T field in which methanehydrate is stable (after Kvenvolden 1998).
Fig. 14.4 Left: Stability field of pure methane hydrate at normal seawater salinity, as defined by temperature andpressure expressed as water depth. Intersections of the temperature profiles (stippled lines) with the phase boundary(heavy line) define the area of the gas hydrate stability zone (GHSZ). Right: Inferred thickness of the gas hydrate zonein sediments at a schematic continental margin assuming a typical geothermal gradient of 28°C km-1. Typical bottomwater temperatures are marked, and range from 18oC on shallow shelf regions to 2oC at the bottom of the continentalrise (after Kvenvolden and McMenamin 1980).
14.3 Hydrate Occurrence in the Oceanic Environment
14 Gas Hydrates in Marine Sediments
486
hydrate occurrence in sediments is deeper in closedocean basins where the temperature of the bottomwater is higher. For example, within the Black Sea wherethe bottom water temperature is 9°C, the upper limit ofhydrate stability is around 700 m water depth(Bohrmann et al. 2003). In contrast, in the polaroceans, gas hydrate can be stable in 300 m of water(Kvenvolden 1998).
The local geothermal gradient in marine settingsdetermines the temperature profile below the sea-floor(Fig. 14.4 dashed line in the sediment sequence). Astemperature in the sediments increases with depth,the sediment temperature will eventually get highenough to cross the phase boundary, such that gashydrate will no longer be stable beneath this depth.Other factors like the gas composition and salt contentof the pore water influence the precise location of thelower boundary of the gas hydrate stability zone(GHSZ). Thus, the base of the GHSZ is itself a phaseboundary. Since the geothermal gradient is often quiteuniform across broad regions beneath the seafloor,the thickness of the GHSZ is quite constant for a givenwater depth. However, a change in water depth willinfluence the thickness of the hydrate stability zone(Fig. 14.4). Due to the P/T conditions for hydrate
stability, the thickness of the GHSZ can reach 800 to1000 m below seafloor in deep water areas, and thebase of the GHSZ will shoal up as water depthdecreases (Fig. 14.4).
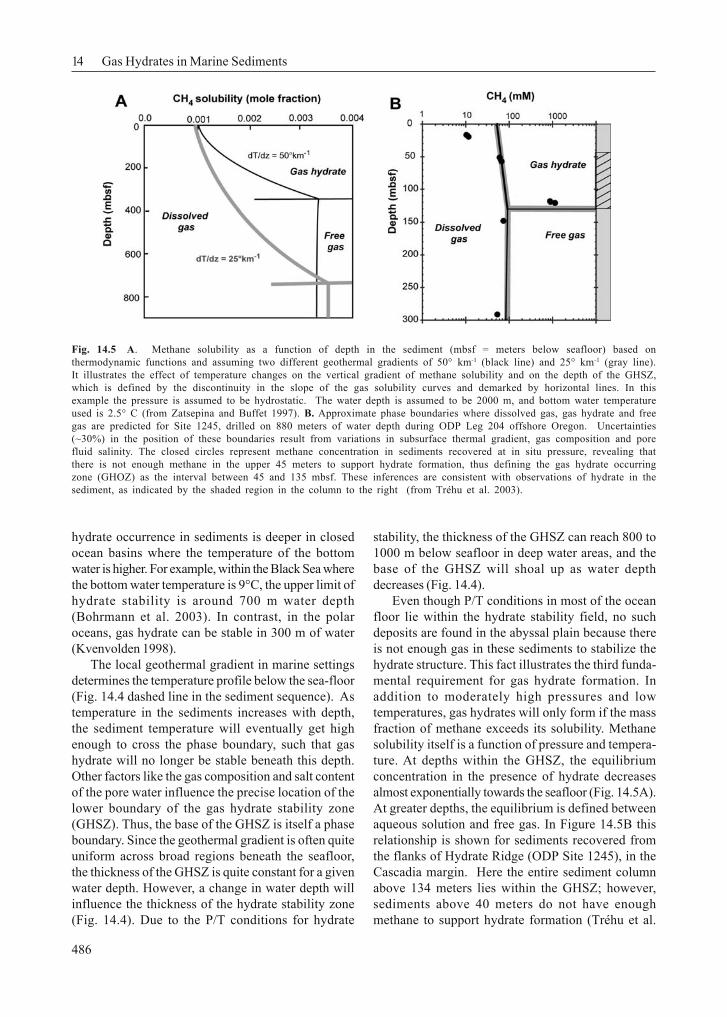
Even though P/T conditions in most of the oceanfloor lie within the hydrate stability field, no suchdeposits are found in the abyssal plain because thereis not enough gas in these sediments to stabilize thehydrate structure. This fact illustrates the third funda-mental requirement for gas hydrate formation. Inaddition to moderately high pressures and lowtemperatures, gas hydrates will only form if the massfraction of methane exceeds its solubility. Methanesolubility itself is a function of pressure and tempera-ture. At depths within the GHSZ, the equilibriumconcentration in the presence of hydrate decreasesalmost exponentially towards the seafloor (Fig. 14.5A).At greater depths, the equilibrium is defined betweenaqueous solution and free gas. In Figure 14.5B thisrelationship is shown for sediments recovered fromthe flanks of Hydrate Ridge (ODP Site 1245), in theCascadia margin. Here the entire sediment columnabove 134 meters lies within the GHSZ; however,sediments above 40 meters do not have enoughmethane to support hydrate formation (Tréhu et al.
Fig. 14.5 A. Methane solubility as a function of depth in the sediment (mbsf = meters below seafloor) based onthermodynamic functions and assuming two different geothermal gradients of 50° km-1 (black line) and 25° km-1 (gray line).It illustrates the effect of temperature changes on the vertical gradient of methane solubility and on the depth of the GHSZ,which is defined by the discontinuity in the slope of the gas solubility curves and demarked by horizontal lines. In thisexample the pressure is assumed to be hydrostatic. The water depth is assumed to be 2000 m, and bottom water temperatureused is 2.5° C (from Zatsepina and Buffet 1997). B. Approximate phase boundaries where dissolved gas, gas hydrate and freegas are predicted for Site 1245, drilled on 880 meters of water depth during ODP Leg 204 offshore Oregon. Uncertainties(~30%) in the position of these boundaries result from variations in subsurface thermal gradient, gas composition and porefluid salinity. The closed circles represent methane concentration in sediments recovered at in situ pressure, revealing thatthere is not enough methane in the upper 45 meters to support hydrate formation, thus defining the gas hydrate occurringzone (GHOZ) as the interval between 45 and 135 mbsf. These inferences are consistent with observations of hydrate in thesediment, as indicated by the shaded region in the column to the right (from Tréhu et al. 2003).
487
2003). Consistent with inferences based on methaneconcentration measured on cores collected at in situpressures, gas hydrate in these sediments is onlypresent between 45 and 134 meters, in what is knownas the gas hydrate occurrence zone (GHOZ).
14.3.2 Seismic Evidence for Gas Hydrates
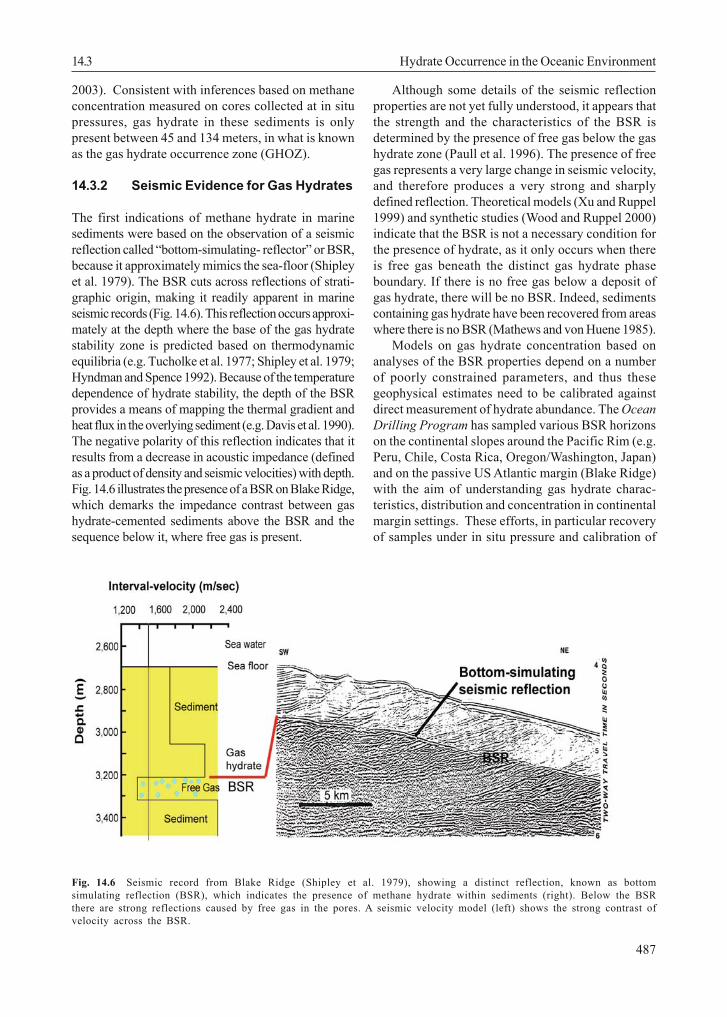
The first indications of methane hydrate in marinesediments were based on the observation of a seismicreflection called “bottom-simulating- reflector” or BSR,because it approximately mimics the sea-floor (Shipleyet al. 1979). The BSR cuts across reflections of strati-graphic origin, making it readily apparent in marineseismic records (Fig. 14.6). This reflection occurs approxi-mately at the depth where the base of the gas hydratestability zone is predicted based on thermodynamicequilibria (e.g. Tucholke et al. 1977; Shipley et al. 1979;Hyndman and Spence 1992). Because of the temperaturedependence of hydrate stability, the depth of the BSRprovides a means of mapping the thermal gradient andheat flux in the overlying sediment (e.g. Davis et al. 1990).The negative polarity of this reflection indicates that itresults from a decrease in acoustic impedance (definedas a product of density and seismic velocities) with depth.Fig. 14.6 illustrates the presence of a BSR on Blake Ridge,which demarks the impedance contrast between gashydrate-cemented sediments above the BSR and thesequence below it, where free gas is present.
Although some details of the seismic reflectionproperties are not yet fully understood, it appears thatthe strength and the characteristics of the BSR isdetermined by the presence of free gas below the gashydrate zone (Paull et al. 1996). The presence of freegas represents a very large change in seismic velocity,and therefore produces a very strong and sharplydefined reflection. Theoretical models (Xu and Ruppel1999) and synthetic studies (Wood and Ruppel 2000)indicate that the BSR is not a necessary condition forthe presence of hydrate, as it only occurs when thereis free gas beneath the distinct gas hydrate phaseboundary. If there is no free gas below a deposit ofgas hydrate, there will be no BSR. Indeed, sedimentscontaining gas hydrate have been recovered from areaswhere there is no BSR (Mathews and von Huene 1985).
Models on gas hydrate concentration based onanalyses of the BSR properties depend on a numberof poorly constrained parameters, and thus thesegeophysical estimates need to be calibrated againstdirect measurement of hydrate abundance. The OceanDrilling Program has sampled various BSR horizonson the continental slopes around the Pacific Rim (e.g.Peru, Chile, Costa Rica, Oregon/Washington, Japan)and on the passive US Atlantic margin (Blake Ridge)with the aim of understanding gas hydrate charac-teristics, distribution and concentration in continentalmargin settings. These efforts, in particular recoveryof samples under in situ pressure and calibration of
Fig. 14.6 Seismic record from Blake Ridge (Shipley et al. 1979), showing a distinct reflection, known as bottomsimulating reflection (BSR), which indicates the presence of methane hydrate within sediments (right). Below the BSRthere are strong reflections caused by free gas in the pores. A seismic velocity model (left) shows the strong contrast ofvelocity across the BSR.
14.3 Hydrate Occurrence in the Oceanic Environment
14 Gas Hydrates in Marine Sediments
488
various proxies for hydrate abundance (e.g. Tréhu etal. 2004a) will continuously improve our imperfectknowledge of the distribution of gas hydrate in theseafloor.
14.3.3 Generation of Gases for HydrateFormation
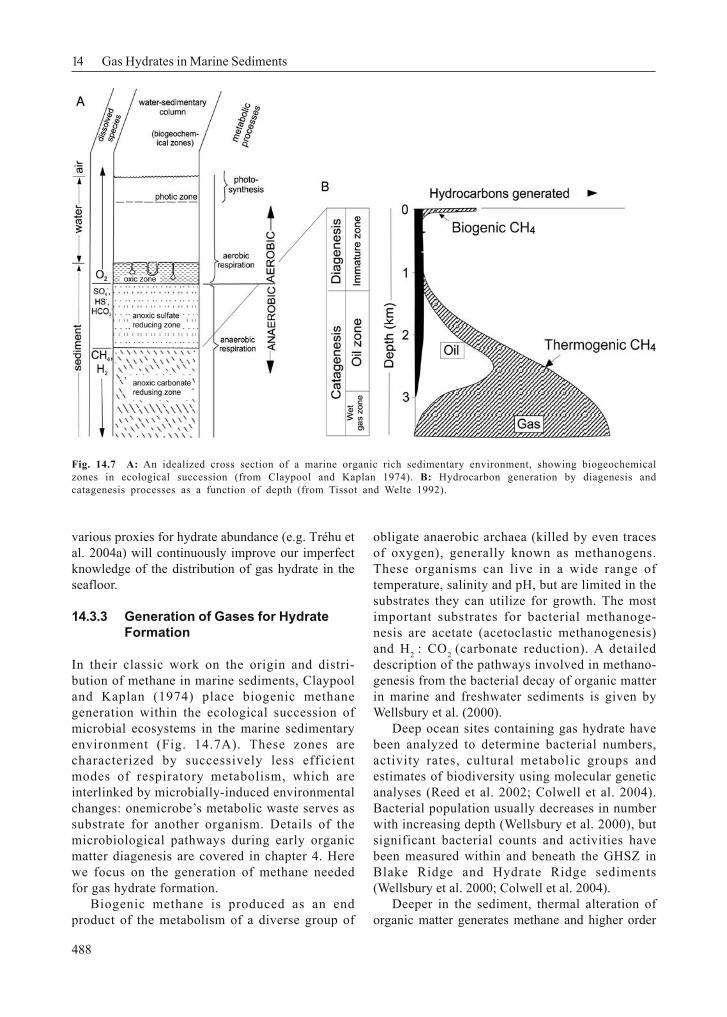
In their classic work on the origin and distri-bution of methane in marine sediments, Claypooland Kaplan (1974) place biogenic methanegeneration within the ecological succession ofmicrobial ecosystems in the marine sedimentaryenvironment (Fig. 14.7A). These zones arecharacterized by successively less efficientmodes of respiratory metabolism, which areinterlinked by microbially-induced environmentalchanges: onemicrobe’s metabolic waste serves assubstrate for another organism. Details of themicrobiological pathways during early organicmatter diagenesis are covered in chapter 4. Herewe focus on the generation of methane neededfor gas hydrate formation.
Biogenic methane is produced as an endproduct of the metabolism of a diverse group of
obligate anaerobic archaea (killed by even tracesof oxygen), generally known as methanogens.These organisms can live in a wide range oftemperature, salinity and pH, but are limited in thesubstrates they can utilize for growth. The mostimportant substrates for bacterial methanoge-nesis are acetate (acetoclastic methanogenesis)and H2 : CO2 (carbonate reduction). A detaileddescription of the pathways involved in methano-genesis from the bacterial decay of organic matterin marine and freshwater sediments is given byWellsbury et al. (2000).
Deep ocean sites containing gas hydrate havebeen analyzed to determine bacterial numbers,activity rates, cultural metabolic groups andestimates of biodiversity using molecular geneticanalyses (Reed et al. 2002; Colwell et al. 2004).Bacterial population usually decreases in numberwith increasing depth (Wellsbury et al. 2000), butsignificant bacterial counts and activities havebeen measured within and beneath the GHSZ inBlake Ridge and Hydrate Ridge sediments(Wellsbury et al. 2000; Colwell et al. 2004).
Deeper in the sediment, thermal alteration oforganic matter generates methane and higher order
Fig. 14.7 A: An idealized cross section of a marine organic rich sedimentary environment, showing biogeochemicalzones in ecological succession (from Claypool and Kaplan 1974). B: Hydrocarbon generation by diagenesis andcatagenesis processes as a function of depth (from Tissot and Welte 1992).
489
hydrocarbons by catagenesis (Fig. 14.7B). Catagenesisoccurs within the temperature range of 50° to 200° C,and gases (methane to butane) are produced at ratesthat are proportional to temperature.
At typical oceanic geothermal gradients of 20° to50° C km-1, sediment depths larger than 1km arerequired to produce significant amounts of gas bythermochemical action. Because thermogenic gasgeneration occurs at temperatures significantlydeeper than those found within the GHSZ, highconcentration of thermogenic gases within the GHSZgenerally indicates the existence of a hydrocarbonmigration pathway.
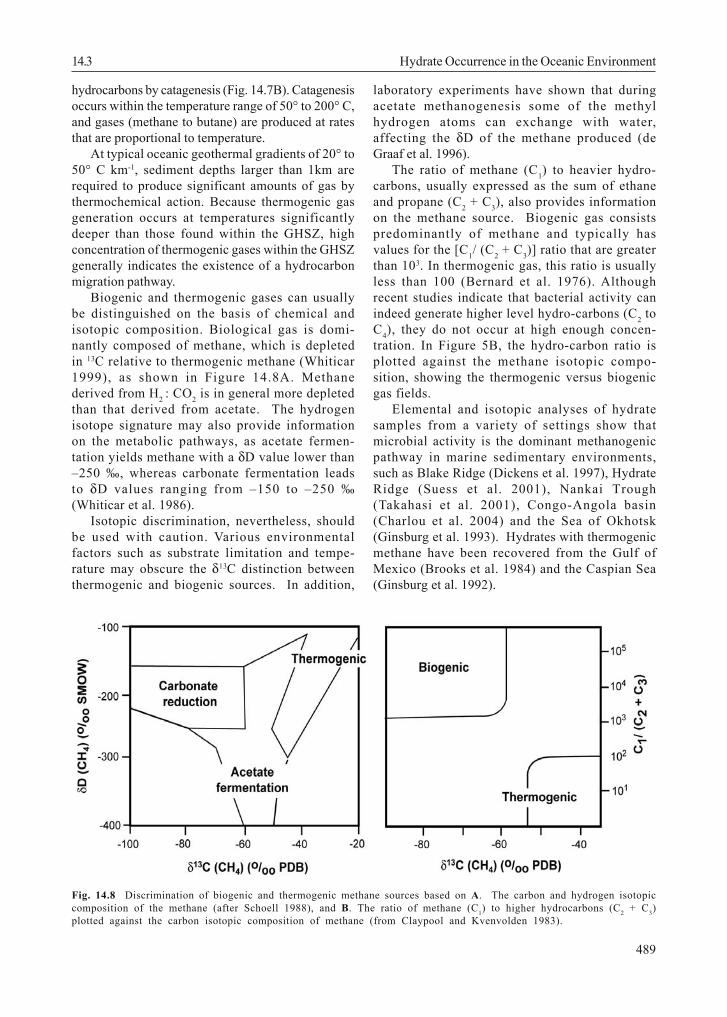
Biogenic and thermogenic gases can usuallybe distinguished on the basis of chemical andisotopic composition. Biological gas is domi-nantly composed of methane, which is depletedin 13C relative to thermogenic methane (Whiticar1999), as shown in Figure 14.8A. Methanederived from H2 : CO2 is in general more depletedthan that derived from acetate. The hydrogenisotope signature may also provide informationon the metabolic pathways, as acetate fermen-tation yields methane with a δD value lower than–250 ‰, whereas carbonate fermentation leadsto δD values ranging from –150 to –250 ‰(Whiticar et al. 1986).
Isotopic discrimination, nevertheless, shouldbe used with caution. Various environmentalfactors such as substrate limitation and tempe-rature may obscure the δ13C distinction betweenthermogenic and biogenic sources. In addition,
laboratory experiments have shown that duringacetate methanogenesis some of the methylhydrogen atoms can exchange with water,affecting the δD of the methane produced (deGraaf et al. 1996).
The ratio of methane (C1) to heavier hydro-carbons, usually expressed as the sum of ethaneand propane (C2 + C3), also provides informationon the methane source. Biogenic gas consistspredominantly of methane and typically hasvalues for the [C1/ (C2 + C3)] ratio that are greaterthan 103. In thermogenic gas, this ratio is usuallyless than 100 (Bernard et al. 1976). Althoughrecent studies indicate that bacterial activity canindeed generate higher level hydro-carbons (C2 toC4), they do not occur at high enough concen-tration. In Figure 5B, the hydro-carbon ratio isplotted against the methane isotopic compo-sition, showing the thermogenic versus biogenicgas fields.
Elemental and isotopic analyses of hydratesamples from a variety of settings show thatmicrobial activity is the dominant methanogenicpathway in marine sedimentary environments,such as Blake Ridge (Dickens et al. 1997), HydrateRidge (Suess et al. 2001), Nankai Trough(Takahasi et al. 2001), Congo-Angola basin(Charlou et al. 2004) and the Sea of Okhotsk(Ginsburg et al. 1993). Hydrates with thermogenicmethane have been recovered from the Gulf ofMexico (Brooks et al. 1984) and the Caspian Sea(Ginsburg et al. 1992).
Fig. 14.8 Discrimination of biogenic and thermogenic methane sources based on A. The carbon and hydrogen isotopiccomposition of the methane (after Schoell 1988), and B. The ratio of methane (C1) to higher hydrocarbons (C2 + C3)plotted against the carbon isotopic composition of methane (from Claypool and Kvenvolden 1983).
14.3 Hydrate Occurrence in the Oceanic Environment
14 Gas Hydrates in Marine Sediments
490
14.3.4 Methane Transport and HydrateFormation
If methane, either from biogenic or thermogenicsources, is present in high enough concentrationto stabilize the hydrate structure at thermodyna-mically favourable conditions (Figs. 14.3 and14.4), it will combine with water to form hydrate.For methane hydrate to occur, the rain rate ofcarbon to the seafloor must be high enough tosupply the required methane via degradation oforganic matter in the sediment. Hydrate stabilityrequires gas concentration in the hydrate at leasttwo orders of magnitude greater than gassolubility in the liquid phase. Thus, methanegeneration and transport processes are key fac-tors for constraining global hydrate inventories.
Hydrate Formation by in situ Biogenic MethaneGeneration and Transport in Advecting Fluids
The amount of biogenic methane is essentiallycontrolled by both the availability and reactivityof organic matter in the upper hundreds of metersof the sedimentary sequence. Davie and Buffett(2001, 2003) demonstrated the critical need forquantitative models of biogenic methane pro-duction to describe the distribution of gashydrate in the top few hundred meters of sedi-ment. Key parameters are rates of sedimentation,quality and quantity of the organic matter andbiological activity rates. They show that hydrateaccumulation from in situ production in sedimentwith a TOC of 1.5%, will be less than 7% of thepore volume
If in situ production of biogenic methane isnot adequate to support observed accumulationswithin the GHSZ, then additional methane mustmigrate from below. Paull et al. (1994), proposed amechanism to concentrate methane via recyclingat the base of the GHSZ in the Blake Ridgehydrate-bearing province. Progressive burial andsubsidence through geologic time shifts the baseof the GHSZ upward, so that deep-seated hydratedecomposes. As hydrate dissociates, the methanesolubility is surpassed, and free gas permeatesfissures in the overlying hydrate stability layer,enhancing gas hydrate contents via precipitationof the “recycled” methane.
Davie and Buffett (2001) also show that bothin situ methane production and transport inupward migrating saturated fluids are needed toexplain the dissolved chloride profiles observed
in Blake Ridge sediment. Similarly, Hensen andWallmann (2005) show that, although organiccarbon degradation in the upper sediments of theCosta Rica margin can account for 0.4 to 1.1 % ofhydrate content of the sediment, it alone cannotexplain the hydrate distribution in this region.Furthermore they show that fluid flow mayincrease the total amount of hydrate that can beformed from the organic reservoir in this marginby more than 50%.
Fluid flow can scavenge methane from a broadregion, thus it is expected that active marginswith pervasive fluid transport would have higherabundance of gas hydrate. Nevertheless, eventhe small rates of fluid flow in passive margins,play a controlling role on the accumulation of gashydrate (Egeberg and Dickens 1999). In fact,using a mechanistic model for the distribution ofhydrate in marine sediment, Buffet and Archer(2004) conclude that the global inventory of gashydrate is particularly sensitive to both, methanegeneration from organic matter and the rate offluid flow.
Methane Transport in the Gas Phase
Most disseminated hydrate in marine sediment isthought to occupy less than 8% of the pore spaceof sediments integrated over the GHSZ. However,there are regions where massive hydrate is knownto form near or at the seafloor. These shallowhydrate deposits are usually associated withareas of fluid venting and gas ebullition(Mazurenko and Soloviev 2003). Geochemicalmodelling of the shallow hydrate at the summit ofsouthern Hydrate Ridge demonstrates the needfor methane transport in the gas phase. Becauseof the low solubility of methane in water,advection of methane-saturated water is notenough to sustain the rapid hydrate growth inthis system (Torres et al. 2004). In general,methane hydrate will only form large concen-trated deposits where gas flow is present.
Methane concentration increases with depthin the sediment due to a combination of pro-cesses including microbial generation, methanerecycling at the base of the GHSZ, and thermo-chemical generation at depth. When methaneconcentration in the pore water exceeds satura-tion, methane gas will exolve. However, thedifficulty of nucleating bubbles of small size infine-grained porous media can lead to significantsupersaturations. Clennell et al. (2000) provide a
491
comprehensive review of processes involved inmovement of methane in marine sediment, with anemphasis on how porosity, pore size distributionand permeability of the sediment control the ratesand mode of transport of gas. They discussissues associated with capillary theory, multi-phase flow, invasion percolation, catenarytransport, and flow in faults and fractures, whichare important to fully understand gas hydrateformation dynamics in marine systems, but arebeyond the scope of this book. Here we provide asimplified overview of two mechanisms that areimportant in gas transport, but refer the reader toClennell et al. (2000) for a more quantitativetreatment of these processes.
Gas Migration Induced by Diapirism
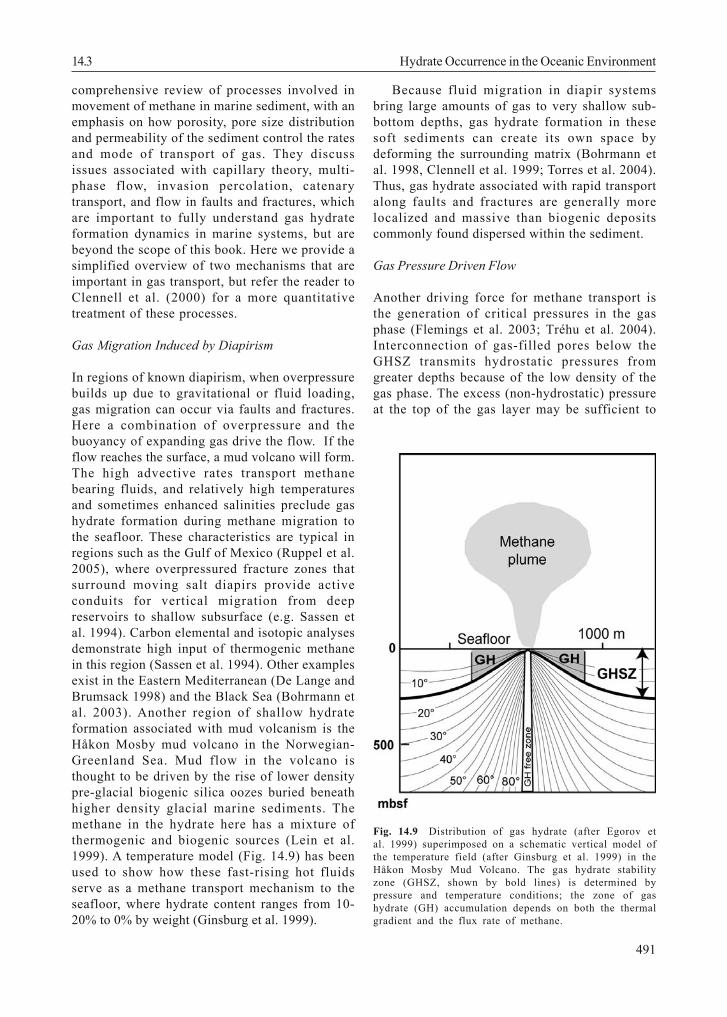
In regions of known diapirism, when overpressurebuilds up due to gravitational or fluid loading,gas migration can occur via faults and fractures.Here a combination of overpressure and thebuoyancy of expanding gas drive the flow. If theflow reaches the surface, a mud volcano will form.The high advective rates transport methanebearing fluids, and relatively high temperaturesand sometimes enhanced salinities preclude gashydrate formation during methane migration tothe seafloor. These characteristics are typical inregions such as the Gulf of Mexico (Ruppel et al.2005), where overpressured fracture zones thatsurround moving salt diapirs provide activeconduits for vertical migration from deepreservoirs to shallow subsurface (e.g. Sassen etal. 1994). Carbon elemental and isotopic analysesdemonstrate high input of thermogenic methanein this region (Sassen et al. 1994). Other examplesexist in the Eastern Mediterranean (De Lange andBrumsack 1998) and the Black Sea (Bohrmann etal. 2003). Another region of shallow hydrateformation associated with mud volcanism is theHåkon Mosby mud volcano in the Norwegian-Greenland Sea. Mud flow in the volcano isthought to be driven by the rise of lower densitypre-glacial biogenic silica oozes buried beneathhigher density glacial marine sediments. Themethane in the hydrate here has a mixture ofthermogenic and biogenic sources (Lein et al.1999). A temperature model (Fig. 14.9) has beenused to show how these fast-rising hot fluidsserve as a methane transport mechanism to theseafloor, where hydrate content ranges from 10-20% to 0% by weight (Ginsburg et al. 1999).
Because fluid migration in diapir systemsbring large amounts of gas to very shallow sub-bottom depths, gas hydrate formation in thesesoft sediments can create its own space bydeforming the surrounding matrix (Bohrmann etal. 1998, Clennell et al. 1999; Torres et al. 2004).Thus, gas hydrate associated with rapid transportalong faults and fractures are generally morelocalized and massive than biogenic depositscommonly found dispersed within the sediment.
Gas Pressure Driven Flow
Another driving force for methane transport isthe generation of critical pressures in the gasphase (Flemings et al. 2003; Tréhu et al. 2004).Interconnection of gas-filled pores below theGHSZ transmits hydrostatic pressures fromgreater depths because of the low density of thegas phase. The excess (non-hydrostatic) pressureat the top of the gas layer may be sufficient to
Fig. 14.9 Distribution of gas hydrate (after Egorov etal. 1999) superimposed on a schematic vertical model ofthe temperature field (after Ginsburg et al. 1999) in theHåkon Mosby Mud Volcano. The gas hydrate stabilityzone (GHSZ, shown by bold lines) is determined bypressure and temperature conditions; the zone of gashydrate (GH) accumulation depends on both the thermalgradient and the flux rate of methane.
14.3 Hydrate Occurrence in the Oceanic Environment
14 Gas Hydrates in Marine Sediments
492
fracture the sediments and drive gas towards theseafloor. This process has been postulated forboth passive (Flemings et al. 2003) and active(Tréhu et al. 2004b) regions, where the volumefraction of gas is ≥ 10% (Flemings et al. 2003).
In their analyses of past and future state ofthe hydrate reservoir, Buffett and Archer (2004b),suggest that if elevated gas pressures do occuras a transient response to warming, a rapidrelease of methane may be triggered by thedevelopment of critical pressures in the gasphase. Critical gas pressure below the base of thegas hydrate stability zone can trigger verticalmigration of free gas to the seafloor.
14.3.5 Gas Hydrate Accumulation inSediments and Fabric of NaturalGas Hydrates
Drilling of marine sediment cores as well as seafloorsampling by research vessels confirmed the presenceof gas hydrate in sediments defined by the stability
field as described in section 14.3.1. Conventionalresearch vessels are only able to sample shallowsediments close to the seafloor, thus drilling campaignsare needed to investigate the distribution of gashydrates deeper within the stability field. Because gashydrates decompose rapidly when removed from thehigh-pressure, deep-water environments in which theyform, the in situ distribution of gas hydrate must beestimated using various proxy techniques, each ofwhich may have different sensitivity and spatialresolution (Tréhu et al. 2004a). Leg 164 of the OceanDrilling Program (ODP) drilled several sites on the BlakeRidge, in the first dedicated academic effort toinvestigate naturally occurring gas hydrates in marinesediments (Paull et al. 1996). Estimates made usingdiverse gas-hydrate proxies revealed that gas hydrateoccupies ~ 1% to 10% of the pore space in the sedimentinterval from 200 to ~450 mbsf. The hydrate occursdispersed within the pore-space of fine-grainedsediments or within fractures and faults (Paull et al.1996). The distribution of fine grained gas hydratewithin the lithologically uniform drift sediments of the
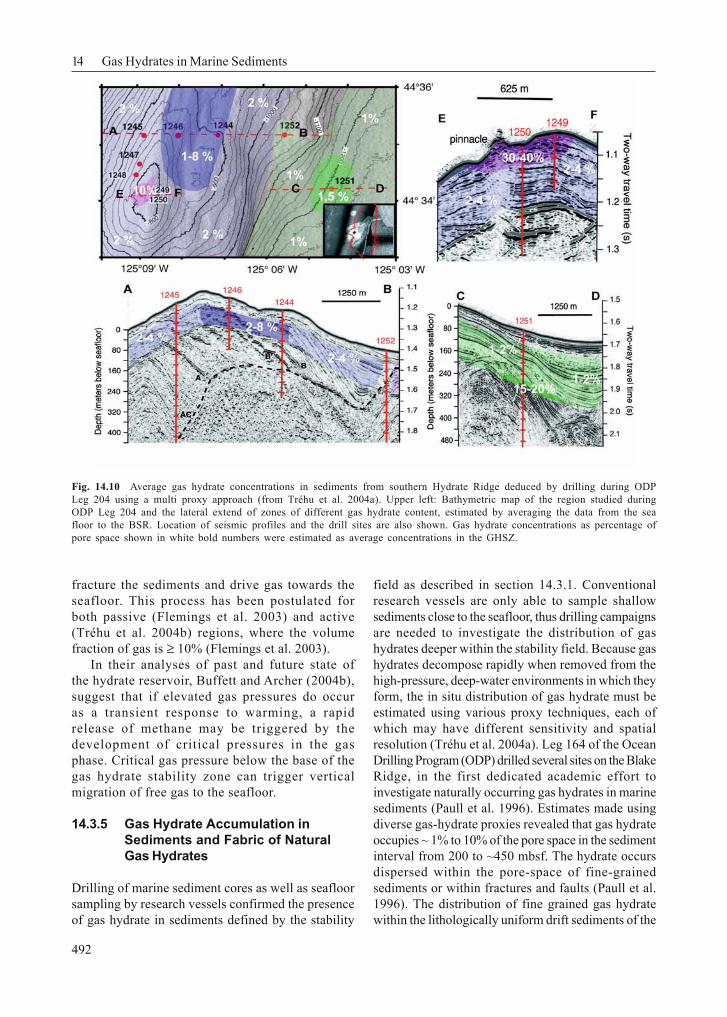
Fig. 14.10 Average gas hydrate concentrations in sediments from southern Hydrate Ridge deduced by drilling during ODPLeg 204 using a multi proxy approach (from Tréhu et al. 2004a). Upper left: Bathymetric map of the region studied duringODP Leg 204 and the lateral extend of zones of different gas hydrate content, estimated by averaging the data from the seafloor to the BSR. Location of seismic profiles and the drill sites are also shown. Gas hydrate concentrations as percentage ofpore space shown in white bold numbers were estimated as average concentrations in the GHSZ.
493
Blake Ridge was surprisingly heterogeneous and couldnot be explained in detail, except for the observationof two weakly defined zones where higher hydrateconcentrations may indeed be caused by smalldifferences in lithology.
Researchers involved in ODP Leg 204 generatedthe first high-resolution data set on the three-dimensional distribution of gas hydrate within HydrateRidge, in the Cascadia subduction zone (Tréhu et al.2003). Several gas hydrate proxies were combined, andthus, the problem of spatial under-sampling inherentin methods traditionally used for estimating the gashydrate was overcome (Tréhu et al. 2004a). The averagegas hydrate content of sediments within the gashydrate stability zone was estimated to be 1-2% of thepore space. Patchy zones of locally higherconcentrations on the ridge flanks occur below ~ 40mbsf, are structurally and stratigraphically controlledand occupy up to 20% of the pore space (Fig. 14.10).In contrast to this overall hydrate distribution, a highaverage gas hydrate content of 30-40% of pore spacewas found on the upper 30-40 mbsf at the ridge summit.Cores containing hydrate in massive chunks, lenses,plates and nodules, where recovered from an areawhere there is persistent and vigorous venting ofmethane gas (Heeschen et al. 2003).
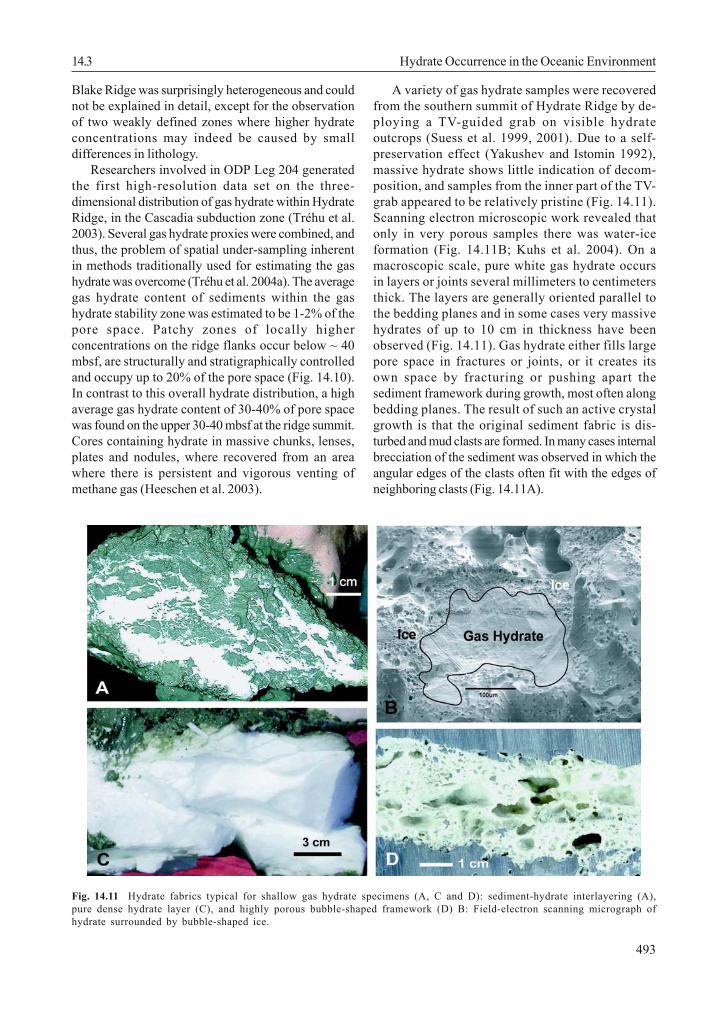
A variety of gas hydrate samples were recoveredfrom the southern summit of Hydrate Ridge by de-ploying a TV-guided grab on visible hydrateoutcrops (Suess et al. 1999, 2001). Due to a self-preservation effect (Yakushev and Istomin 1992),massive hydrate shows little indication of decom-position, and samples from the inner part of the TV-grab appeared to be relatively pristine (Fig. 14.11).Scanning electron microscopic work revealed thatonly in very porous samples there was water-iceformation (Fig. 14.11B; Kuhs et al. 2004). On amacroscopic scale, pure white gas hydrate occursin layers or joints several millimeters to centimetersthick. The layers are generally oriented parallel tothe bedding planes and in some cases very massivehydrates of up to 10 cm in thickness have beenobserved (Fig. 14.11). Gas hydrate either fills largepore space in fractures or joints, or it creates itsown space by fracturing or pushing apart thesediment framework during growth, most often alongbedding planes. The result of such an active crystalgrowth is that the original sediment fabric is dis-turbed and mud clasts are formed. In many cases internalbrecciation of the sediment was observed in which theangular edges of the clasts often fit with the edges ofneighboring clasts (Fig. 14.11A).
Fig. 14.11 Hydrate fabrics typical for shallow gas hydrate specimens (A, C and D): sediment-hydrate interlayering (A),pure dense hydrate layer (C), and highly porous bubble-shaped framework (D) B: Field-electron scanning micrograph ofhydrate surrounded by bubble-shaped ice.
14.3 Hydrate Occurrence in the Oceanic Environment
14 Gas Hydrates in Marine Sediments
494
The internal fabric of pure gas hydrate has apeculiar structure with pores that result from risingmethane gas. Such pores occur in variable sizes, andin some specimens very large pores of up to 3-4 cm indiameter can be observed (Fig.14.11D). The fabric issimilar to that of gas hydrates experimentally formedon the sea-floor (Brewer et al. 1997). There are severallines of evidence that support migration of methanegas from a reservoir located beneath the GHSZ, whicheither turns into macroscopic porous gas hydrates orescapes at the seafloor. A variety of mechanisms arecurrently under investigation to determine how freegas pass through the gas hydrate stability zone. Gasmay migrate through fractures or along tensionalfaults, in which all water is trapped in the gas hydrates,or gas hydrate formation may be inhibited by capillaryforces or by localized high salinity zones. The freegas stream may move upwards very fast up to an areawhere conditions are favorable to form gas hydrates.Hydrate formation may plug up the migration con-duits, and as high gas pressure builds up, the gasmay be rerouted into soft sediment layers. The dyna-mic processes that interact with a complicated plum-ping system may be responsible for the large varietyof gas hydrate and sediment fabrics observed.
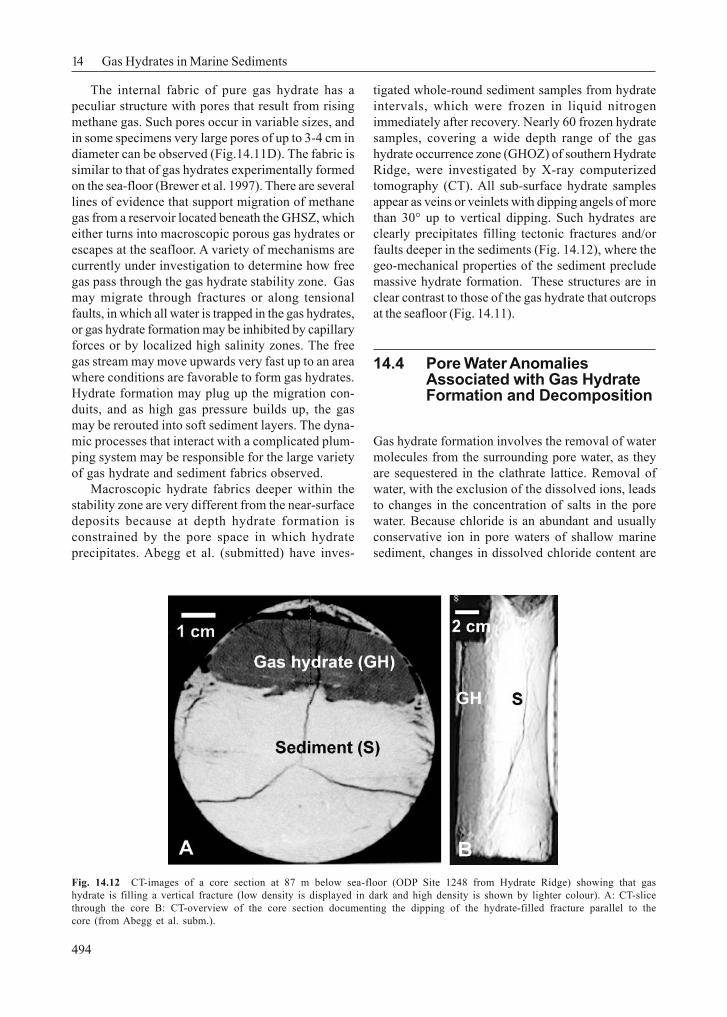
Macroscopic hydrate fabrics deeper within thestability zone are very different from the near-surfacedeposits because at depth hydrate formation isconstrained by the pore space in which hydrateprecipitates. Abegg et al. (submitted) have inves-
tigated whole-round sediment samples from hydrateintervals, which were frozen in liquid nitrogenimmediately after recovery. Nearly 60 frozen hydratesamples, covering a wide depth range of the gashydrate occurrence zone (GHOZ) of southern HydrateRidge, were investigated by X-ray computerizedtomography (CT). All sub-surface hydrate samplesappear as veins or veinlets with dipping angels of morethan 30° up to vertical dipping. Such hydrates areclearly precipitates filling tectonic fractures and/orfaults deeper in the sediments (Fig. 14.12), where thegeo-mechanical properties of the sediment precludemassive hydrate formation. These structures are inclear contrast to those of the gas hydrate that outcropsat the seafloor (Fig. 14.11).
14.4 Pore Water AnomaliesAssociated with Gas HydrateFormation and Decomposition
Gas hydrate formation involves the removal of watermolecules from the surrounding pore water, as theyare sequestered in the clathrate lattice. Removal ofwater, with the exclusion of the dissolved ions, leadsto changes in the concentration of salts in the porewater. Because chloride is an abundant and usuallyconservative ion in pore waters of shallow marinesediment, changes in dissolved chloride content are
Fig. 14.12 CT-images of a core section at 87 m below sea-floor (ODP Site 1248 from Hydrate Ridge) showing that gashydrate is filling a vertical fracture (low density is displayed in dark and high density is shown by lighter colour). A: CT-slicethrough the core B: CT-overview of the core section documenting the dipping of the hydrate-filled fracture parallel to thecore (from Abegg et al. subm.).
495
14.4 Pore Water Anomalies Associated with Gas Hydrate Formation and Decomposition
commonly used to monitor formation and decompo-sition of gas hydrate deposits. In addition, formationof the hydrate lattice results in preferential uptake ofthe heavy oxygen and hydrogen atoms in the solidphase, with consequent depletion in the pore water.These two pore water parameters: dissolved chlorideand the isotopic composition of the water itself, havebeen widely used to identify and quantify hydratedistribution and the dynamic processes involved information and destabilization of these deposits.
14.4.1 Gas Hydrate and Chloride Anomalies
The “Ion Exclusion” Effect
It has long been recognized that the formationand decomposition of gas hydrate lead tochanges in dissolved chloride concentration ofmarine pore fluids (e.g. Hesse and Harrison 1981).Gas hydrates, like normal ice, exclude salts fromthe crystal structure, thus increasing the salinity
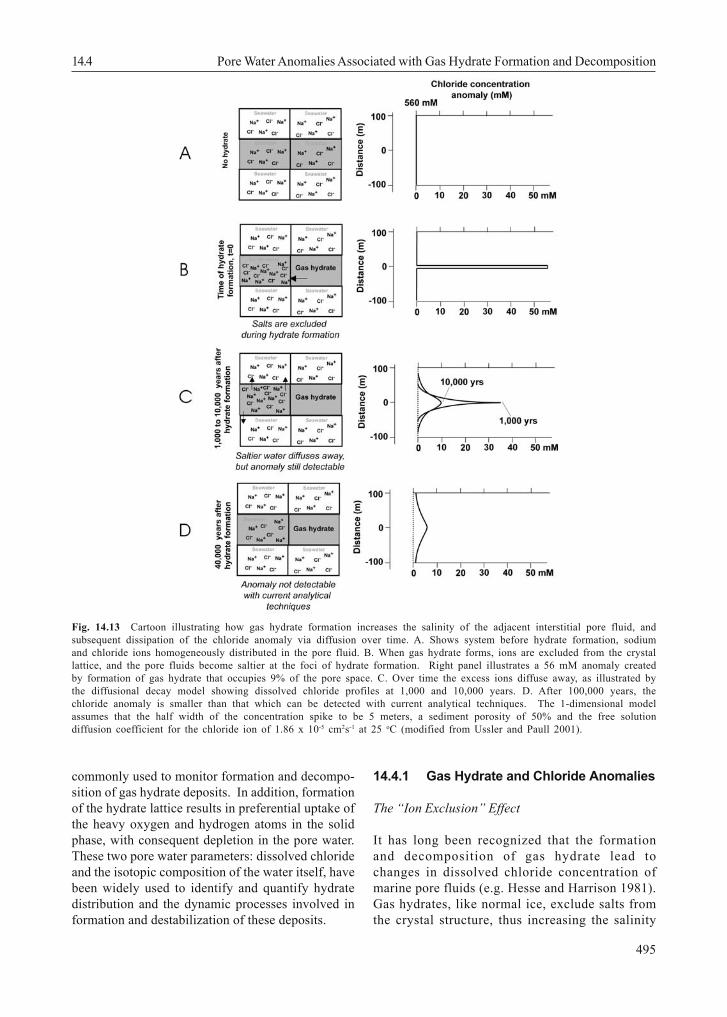
Fig. 14.13 Cartoon illustrating how gas hydrate formation increases the salinity of the adjacent interstitial pore fluid, andsubsequent dissipation of the chloride anomaly via diffusion over time. A. Shows system before hydrate formation, sodiumand chloride ions homogeneously distributed in the pore fluid. B. When gas hydrate forms, ions are excluded from the crystallattice, and the pore fluids become saltier at the foci of hydrate formation. Right panel illustrates a 56 mM anomaly createdby formation of gas hydrate that occupies 9% of the pore space. C. Over time the excess ions diffuse away, as illustrated bythe diffusional decay model showing dissolved chloride profiles at 1,000 and 10,000 years. D. After 100,000 years, thechloride anomaly is smaller than that which can be detected with current analytical techniques. The 1-dimensional modelassumes that the half width of the concentration spike to be 5 meters, a sediment porosity of 50% and the free solutiondiffusion coefficient for the chloride ion of 1.86 x 10⁻⁵ cm2s-1 at 25 oC (modified from Ussler and Paull 2001).
14 Gas Hydrates in Marine Sediments
496
of the surrounding water. The change in inter-stitial ion concentration resulting from this “ionexclusion” mechanism is proportional to theamount of gas hydrate that is formed. Ussler andPaul (2001) use a simple cartoon to represent theeffect on pore water salinity at the foci of gashydrate formation (Fig. 14.13). They furthermodelled the diffusive attenuation of the chlorideanomaly over time, and showed that a positiveanomaly of 56 mM (created by formation ofhydrate that occupies ~9% of the pore space) willnot be detected with current analytical methodsafter about 40,000 years (Fig. 14.13).
Various numerical models have shown thatgenerating gas hydrate to a concentration of~10% of the pore space, in both passive andactive settings (e.g. Blake Ridge, Hydrate Ridge;Nimblett and Ruppel 2003) probably requiredformation times of at least 103, and perhaps asmuch 106 years. Therefore, if chloride behavedconservatively, the pore water in contact withthese deposits should have a chloride concen-tration similar to seawater. This is, however, notcommonly the case. Indeed, fluids with chlorideconcentration significantly lower than seawaterhave been sampled from most convergent marginsand such “freshening” has been attributed to gashydrate dissociation and dehydration of hydrousminerals at depth (e.g. Gieskes et al. 1990;Kastner et al. 1991). The issue of backgroundchloride concentration, and an example of achloride ano-maly created by natural gas hydratedissociation is described in the followingsections.
In situ chloride concentration in pore fluids ofhydrate-bearing sediments also show enrich-ments relative to seawater in some natural sys-tems. These occur when the geological settingsupports formation of brines, or when gas hy-drate forms so rapidly that the resulting excessions do not have sufficient time to diffuse away.These scenarios are also discussed below.
Estimating Gas Hydrate Abundance UsingDissolved Chloride Data
Because gas hydrate is not stable at the temperatureand pressure conditions that exist at the sea surface,most estimates of the in situ distribution and con-centration of gas hydrate rely on a variety of proxies.Perhaps the most widely used of these proxies is basedon the accurate measurement of dissolved chloride inthe pore fluids. During core recovery, gas hydrate
dissociates, resulting in dilution of the chlorideconcentration by addition of water sequestered in thegas hydrate lattice prior to core recovery. The negativechloride anomalies relative to in situ chloride concen-trations are proportional to the amount of gas hydratein a sediment sample. Uncertainties in the estimates ofgas hydrate abundance using the dissolved chlorideproxy arise from a paucity of information on (1) the insitu dissolved chloride values, (2) the chloride contentpotentially trapped within the pores of the gashydrates, and (3) the spatial sampling resolution.
There is to date no reliable data on the amountof Cl– sequestered by the hydrate cage becausethe physical separation of the water released bynatural hydrate dissociation from pore water con-tamination can be very difficult. Suess et al.(2001) suggest that there may be residual chloridetrapped within the hydrate pore space. Never-theless, since this number is small and verypoorly defined, most estimates of hydrate abun-dance in marine sediments assume that hydrateformation excludes all dissolved ions.
If the amount of chloride ions trapped in the hydratestructure is assumed to be negligible, the measuredchloride concentration after hydrate dissociation canbe related to the hydrate abundance by the followingequation (see Ussler and Paull 2001 for derivation).
Cl-s/Cl-
o = 1-[Vh/(w-Vh(w-1))] (1)
where Cl-s is the chloride concentration in the
sample (i.e. after hydrate decomposition), Cl-o is
the pore water concentration in situ (prior todecomposition), Vh is the volume fraction ofhydrate filling pore space, and w represents theoccupancy-density characteristics of the gashydrate formed, as calculated from:
w = ρwMh/(ρhMw mw) (2)
Here, ρw and ρh are the densities of fresh water andgas hydrate respectively, and mw is the number ofmoles of fresh water contained in 1 mole of gashydrate. Mw and Mh represent the molecular weightsof water and gas hydrate, respectively. The value ofMh depends on the degree of occupancy of thehydrate structure. When the structure is fullyoccupied, 1 mole of gas hydrate contains 5.9 molesof water, its density is 910 kg m-3 and its molecularweight is 122.2 g mol-1 (Ussler and Paull 2001).
The use of the chloride proxy is predicated on theassumption that the background chloride concen-tration is known and that the rate of hydrate formation

497
is slow enough that high chloride anomalies resultingfrom salt exclusion during hydrate formation have beenremoved by diffusion and advection. A recurrent issuein these studies is the need for a robust estimate ofthe background chloride values (Clo in equation 3)against which the anomalous discrete excursions canbe calculated.
Ussler and Paull (2001) nicely illustrate theeffect that selecting various values for Clo has onthe estimate of gas hydrate concentration, bycomparing two approaches for estimating porewater baselines (Fig. 14.14). Using examples froma passive (Site 997, Blake Ridge) and activemargin (Site 889, northern Cascadia margin), theyclearly illustrate that simply assuming seawaterdissolved chloride values as a baseline againstwhich to measure the degree of dilution, in mostcases will give wrong results. The smoothedbaseline approach produces an estimate of gashydrate more consistent with other independenthydrate proxies, and with the phase change that
occurs at the bottom of the GHSZ. To constructrobust estimates of the hydrate abundance basedon the dissolved chloride proxy, it is important tounderstand the processes that affect the in situchloride distribution at each location.
The low chloride values measured below theBSR at sites drilled on the Blake Ridge (passivemargin setting) have been attributed to long-termhydrate melting below the gas hydrate stabilityzone. A more pronounced freshening is observedin pore waters from active margin settings, asobserved at Sites 889 in the northern Cascadiamargin (Fig. 14.14), and in the Middle Americatrench at Sites 497, 498 (Harrison and Curiale1982) and 568 (Hesse et al. 1985). It was unclear,though, if this deep freshening effect was due togas hydrate processes or to other reactionsindependent of hydrate formation (Ussler andPaull 2001).
Data generated by drilling along an east-westtransect in the southern Hydrate Ridge region
Fig. 14.14 Comparison of estimates of hydrate concentration based on two approaches for estimating the backgroundchloride concentration (Cl-
o in equation 3). Upper panel uses data from a passive margin (Site 997, Blake Ridge) andbottom panel shows data collected at an active margin (Site 889, northern Cascadia margin). In both cases, the shadedarea denotes the region where gas hydrate is believed to be present, and the BSR denotes the geophysical reflector thatindicates the bottom of the gas hydrate stability zone. The use of a modern seawater baseline predicts much largeramounts of gas hydrate, and suggests the presence of gas hydrate below the GHSZ (from Ussler and Paull 2001).
14.4 Pore Water Anomalies Associated with Gas Hydrate Formation and Decomposition
14 Gas Hydrates in Marine Sediments
498
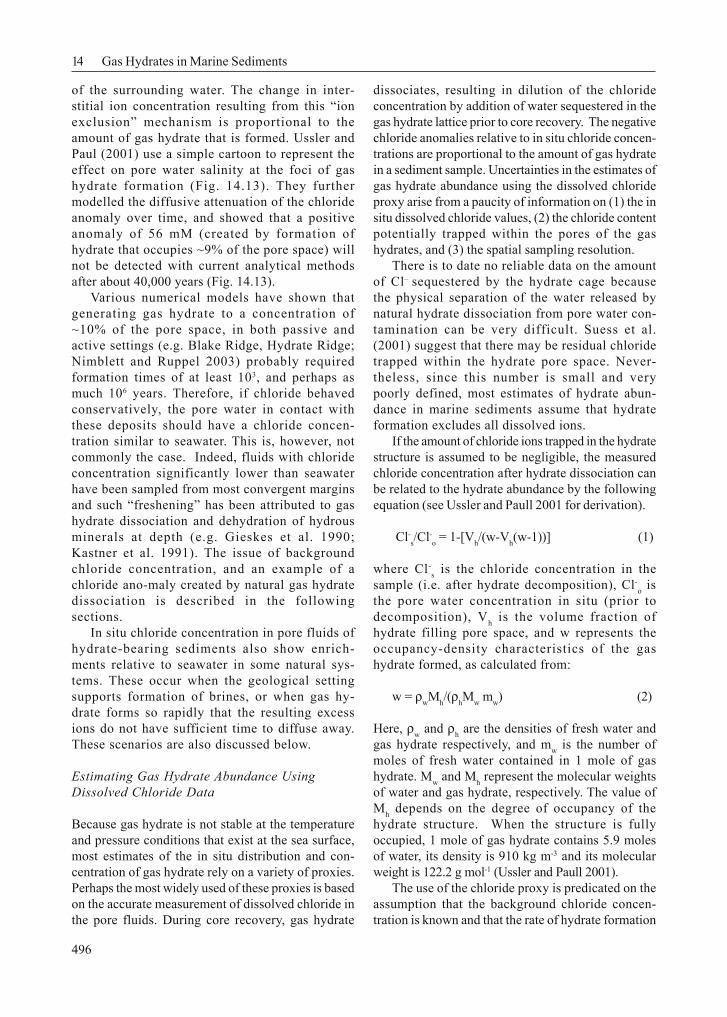
has recently shown the separate effects of claydehydration reactions and gas hydrate dissoci-ation on the dissolved Cl- distribution. These dataprovide geochemical evidence to evaluate thebaseline question, and provide an example of asystem where hydrate is present and backgroundchloride contents do not deviate significantlyfrom seawater values (Torres et al. 2004). Asshown in Fig. 14.15, Sites 1244 and 1245 bothhave very similar gas hydrate contents, averaging2-4 % within the gas hydrate stability zone, and
concentrated in patchy zones that contain up to20 % hydrate (Tréhu et al. 2004). These two sites,however, have highly different chloride baselines(Fig. 14.15). In addition, there is very little gashydrate presence at Site 1252, as evidenced byvarious proxy measurements, including chloridedata (Tréhu et al. 2004a), even though the trendto low chloride values is well defined at this site.
The observed freshening with depth and distancefrom the prism toe is consistent with enhancedconversion of smectite to illite, driven by increase in
Fig. 14.15 Chloride freshening due to progressive illitization along the Cascadia margin accretionary margin. A.Tectonic setting. B. Details of sites drilled during ODP Leg 204, showing the gas hydrate distribution. C. Location ofthe sites relative to a schematic transect arcward from the incoming plate, the relative site locations are not toscale. D. Dissolved chloride at sites drilled less than 10 km away from the toe of the prism, showing no significantfreshening at depth. Gas hydrate is apparent in discrete anomalies in the GHSZ. E. Freshening of deep fluids fromsites drilled at various distances from the prism toe. F. Increase in pore fluid freshening of mélange samples withdistance from the prism toe, consistent with progressive illitization as mélange sequences are exposed to highertemperatures over longer time periods (Figure modified from Torres et al. 2004).
499
temperature and age of accreted sediments (Fig. 14.15).Whereas discrete negative anomalies within the GHSZare indeed the result of gas hydrate dissociation duringcore recovery, the smooth decrease with depth isindependent of gas hydrate processes, and insteadreflects the degree of illitization at depth. These resultsindicate that the smooth decrease with depth, com-monly observed at sites drilled over accreted mélan-ges, is not directly related to gas hydrate abundance.Instead, chloride anomalies associated with gashydrate should be calculated from discrete excursionsto negative values against a background defined bythe envelope of the measurements. In order toconfidently define the dissolved chloride backgroundconcentration, care should be taken in obtainingenough resolution of the pore fluid sampling.
The presence of negative “spikes” in thechloride distribution suggests that the distribu-tion of gas hydrate in marine sediments is highlyheterogeneous. Whereas some observations re-veal association of hydrate with coarse, highporosity horizons (Clennell et al. 1999), thefactors controlling distribution of gas hydrate arenot fully understood. Nevertheless, the questionremains as to whether the patchy distribution ofthese deposits can be adequately mapped withpore water analyses. Limitations on how muchpore water can be extracted from a section of thecore, how many core sections can be dedicated tothese analyses, and the time needed for eachmeasurement, usually only allow for sparsemeasurements of the pore water composition.
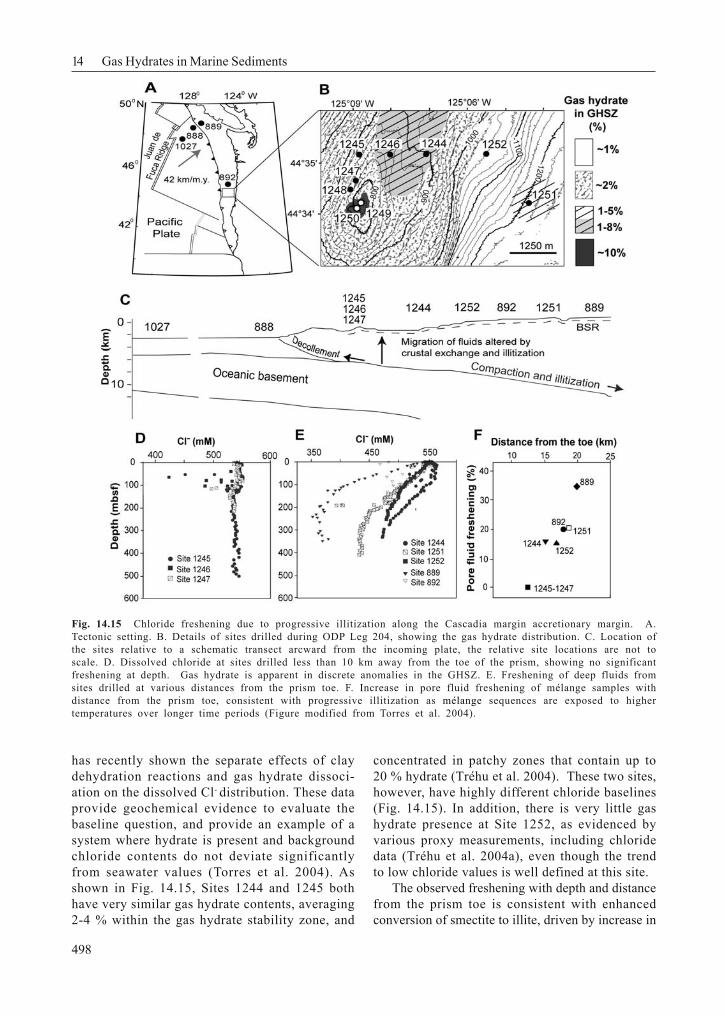
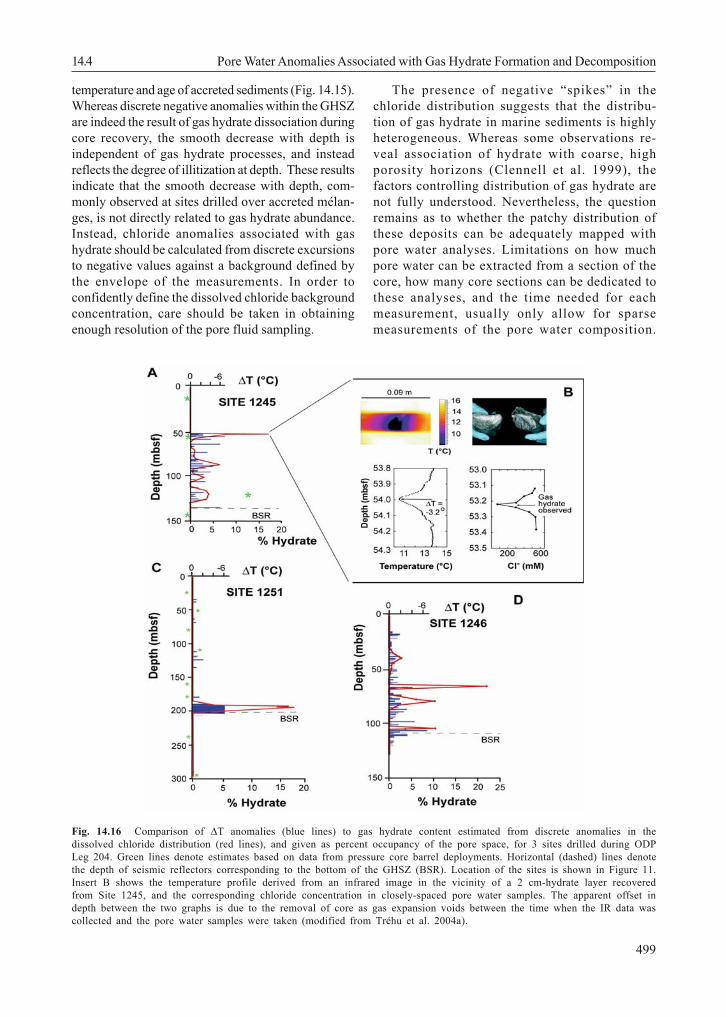
Fig. 14.16 Comparison of ∆T anomalies (blue lines) to gas hydrate content estimated from discrete anomalies in thedissolved chloride distribution (red lines), and given as percent occupancy of the pore space, for 3 sites drilled during ODPLeg 204. Green lines denote estimates based on data from pressure core barrel deployments. Horizontal (dashed) lines denotethe depth of seismic reflectors corresponding to the bottom of the GHSZ (BSR). Location of the sites is shown in Figure 11.Insert B shows the temperature profile derived from an infrared image in the vicinity of a 2 cm-hydrate layer recoveredfrom Site 1245, and the corresponding chloride concentration in closely-spaced pore water samples. The apparent offset indepth between the two graphs is due to the removal of core as gas expansion voids between the time when the IR data wascollected and the pore water samples were taken (modified from Tréhu et al. 2004a).
14.4 Pore Water Anomalies Associated with Gas Hydrate Formation and Decomposition
14 Gas Hydrates in Marine Sediments
500
Typical deep-sea drilling sampling resolution ison the order of one sample every 3 to 10 meters.
Other proxies have been developed to pro-duce a more continuous, high resolution recordof hydrate distribution in marine sediments.Among these, the use of an infrared (IR) camerato map cold spots in the core resulting from theendothermic decomposition of gas hydrate hasproven to be highly effective (e.g. Weinberg et al.2005). However the absolute value of thetemperature measured by the IR camera dependson many different variables, including time of day,core depth and coring technique (Tréhu et al.2003), and plots of temperature along the core arevery noisy. A simple way of parametizing anddisplaying the IR temperature data is to define ∆Tas the temperature anomaly relative to the localbackground. High-resolution measurements ofchloride anomalies in core sections previouslyimaged with an IR camera can provide acalibration function needed to correlate thetemperature anomaly with hydrate content, asshown in Figure 14.16B. These data, not onlyprovide a means of calibrating the temperatureanomalies, but also illustrates how a discretehydrate layer can be easily missed with coarsesampling resolution. Samples collected from a 2-cm-thick hydrate layer and as much as 5 cm awayfrom it show significant anomalies in the chloridecontent, whereas samples collected at distances
>10 cm from the hydrate layer do not show anydeviation from the background chloride values(Fig. 14.15).
Whereas the dissolved chloride measurementsalone may not fully constrain the gas hydratedistribution, the good correlation betweendissolved chloride and temperature anomaliesshown in Figure 14.16 (Tréhu et al. 2004a), givessupport to the use of a combined ∆T-∆Cl approachto best define an heterogeneous hydrate distri-bution. An understanding of the spatial varia-bility in gas hydrate distribution may providevaluable insights into the possible response ofthese deposits to tectonic and environmentalchange.
Gas Hydrate Destabilization via Natural Processes
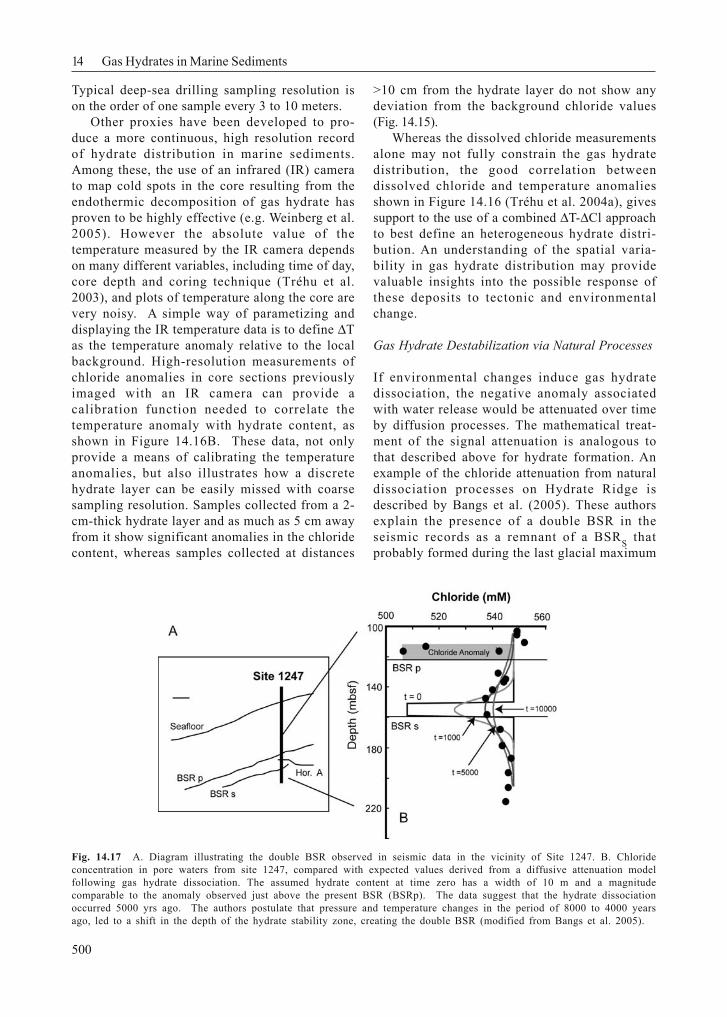
If environmental changes induce gas hydratedissociation, the negative anomaly associatedwith water release would be attenuated over timeby diffusion processes. The mathematical treat-ment of the signal attenuation is analogous tothat described above for hydrate formation. Anexample of the chloride attenuation from naturaldissociation processes on Hydrate Ridge isdescribed by Bangs et al. (2005). These authorsexplain the presence of a double BSR in theseismic records as a remnant of a BSRS thatprobably formed during the last glacial maximum
Fig. 14.17 A. Diagram illustrating the double BSR observed in seismic data in the vicinity of Site 1247. B. Chlorideconcentration in pore waters from site 1247, compared with expected values derived from a diffusive attenuation modelfollowing gas hydrate dissociation. The assumed hydrate content at time zero has a width of 10 m and a magnitudecomparable to the anomaly observed just above the present BSR (BSRp). The data suggest that the hydrate dissociationoccurred 5000 yrs ago. The authors postulate that pressure and temperature changes in the period of 8000 to 4000 yearsago, led to a shift in the depth of the hydrate stability zone, creating the double BSR (modified from Bangs et al. 2005).
501
(18,000 years ago). An increase in temperature of3.3 oC that followed the last glaciation will shift ofthe hydrate stability by ~140 meters, which coup-led with a concomitant sea-level rise of ~120meters, results in an approximate net shift of thehydrate stability horizon of ~20 meters (Bangs etal. 2005). Among other evidence, the authors usea diffusion driven attenuation of the fresheningsignal induced by hydrate dissociation when theGHSZ shifted to a shallower depth. They showthat the observed dissolved chloride distributionat a site drilled through the double BSR isconsistent with a BSR shift that occurred 4,000 to8,000 years ago (Fig. 14.17). This time frame, whenanalyzed in the context of thermal propagation lagin the sediment section and potential lag due tolatent heat needed to dissociate hydrate, is
consistent with P/T changes in the water columnthat occurred at the end of the LGM (Bangs et al.2005). A shift of the depth of hydrate stabilityassociated with post-glaciation P/T changes, hasalso been suggested by others for Northern Cas-cadia (Westbrook et al. 1994), southwestern Japan(Foucher et al. 2002) and the Norwegian margin(Mienert et al. 1998).
Pore Water Brines
In the large body of gas-hydrate bearinglocations drilled to date, the dissolved chlorideshow lower than seawater values (see reviews byUssler and Paull 2001; Hesse 2003). However,there are examples of gas hydrate bearing sites inwhich the dissolved chloride in the pore fluids is
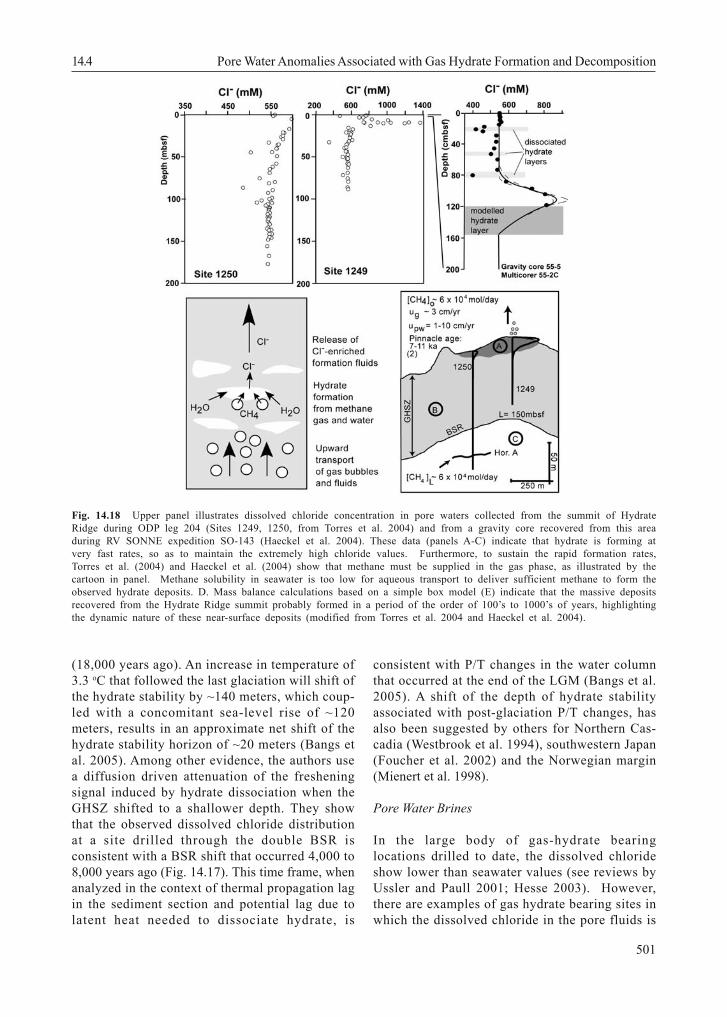
Fig. 14.18 Upper panel illustrates dissolved chloride concentration in pore waters collected from the summit of HydrateRidge during ODP leg 204 (Sites 1249, 1250, from Torres et al. 2004) and from a gravity core recovered from this areaduring RV SONNE expedition SO-143 (Haeckel et al. 2004). These data (panels A-C) indicate that hydrate is forming atvery fast rates, so as to maintain the extremely high chloride values. Furthermore, to sustain the rapid formation rates,Torres et al. (2004) and Haeckel et al. (2004) show that methane must be supplied in the gas phase, as illustrated by thecartoon in panel. Methane solubility in seawater is too low for aqueous transport to deliver sufficient methane to form theobserved hydrate deposits. D. Mass balance calculations based on a simple box model (E) indicate that the massive depositsrecovered from the Hydrate Ridge summit probably formed in a period of the order of 100’s to 1000’s of years, highlightingthe dynamic nature of these near-surface deposits (modified from Torres et al. 2004 and Haeckel et al. 2004).
14.4 Pore Water Anomalies Associated with Gas Hydrate Formation and Decomposition
14 Gas Hydrates in Marine Sediments
502
higher than that of seawater. Most commonlythese brines are associated with regions wherethe presence of old evaporites (e.g. Milano Dome,ODP Site 970 in the eastern Mediterranean,DeLange and Brumsack 1998), or salt-diapirintrusions (e.g. Blake Ridge Diapir ODP Site 996,Egeberg and Dickens 1999; mud volcanoes in theNorthern Gulf of Mexico, Ruppel et al. 2005) leadsto the enhanced chloride content. In addition tothese settings, high dissolved chloride concen-tration associated with hydration reactions in thevicinity of an active spreading ridge was reportedfrom ODP Sites 859 and 860 in the accretionarywedge at the Chile Triple Junction (Froelich et al.1995).
In contrast to these regions in which brinesare produced by geological processes, at theHydrate Ridge summit, the high chloride brinesobserved (Haeckel et al. 2004; Torres et al. 2004)are generated by the rapid formation of gashydrate deposits near the seafloor (Fig. 14.18). Aone-dimensional transport-reaction model wasused to simulate this chloride enrichment andplace constrains on the mechanisms and timeframes necessary to produce the observedconcomitant massive hydrate deposition at theridge summit. The models of Torres et al. (2004)and Haeckel et al. (2004) demonstrate the need forthe presence of a fluid-gas mixture through theGHSZ, since the observed chloride enrichmentcannot be generated exclusively from thetransport of methane dissolved in the pore fluids.These massive hydrate deposits are forming veryrapidly, and the continuous supply of methanegas maintains the pore water brines and theshallow gas hydrate deposits in contact with themethane-poor bottom seawater.
14.4.2 Gas Hydrate and Water IsotopeAnomalies
The water sequestered in the hydrate lattice ispreferentially enriched in 18O and deuterium (D), thusthe isotopic composition of the water in the porespaces collected from gas hydrate bearing sedimentcan provide additional information on the abundanceand the characteristics of these deposits. Pore fluidsamples that had been modified by hydratedecomposition upon core recovery during ODP Legs146 (Kastner et al. 1998), and 164 (Matsumoto andBorowski 2000) provided the first field data to derivethe oxygen isotope fractionation factor for in situhydrate formation. A more comprehensive sampling
protocol was subsequently conducted during Leg 204(Tomaru et al. submitted). These calculations are basedon the percent variation of Cl- relative to background(∆Cl-):
100)1( ×−=∆ − fCl (3)
where f is a fraction of formation water in sampledwater given by:
0−
−
=ClClf S (4)
Cl-S and Cl-
0 are the Cl- concentrations of sampled andformation water (i.e., in situ interstitial water)determined as background, respectively. Thefractionation factors for oxygen (αO) and hydrogen(αH) can be determined from equilibrium equation, suchthat:
)1(ln10000 fGH −⋅⋅=−=∆ αδδδ (5)
where αGH and α0 are is δ18O or δD values for gashydrate and formation (background) water.
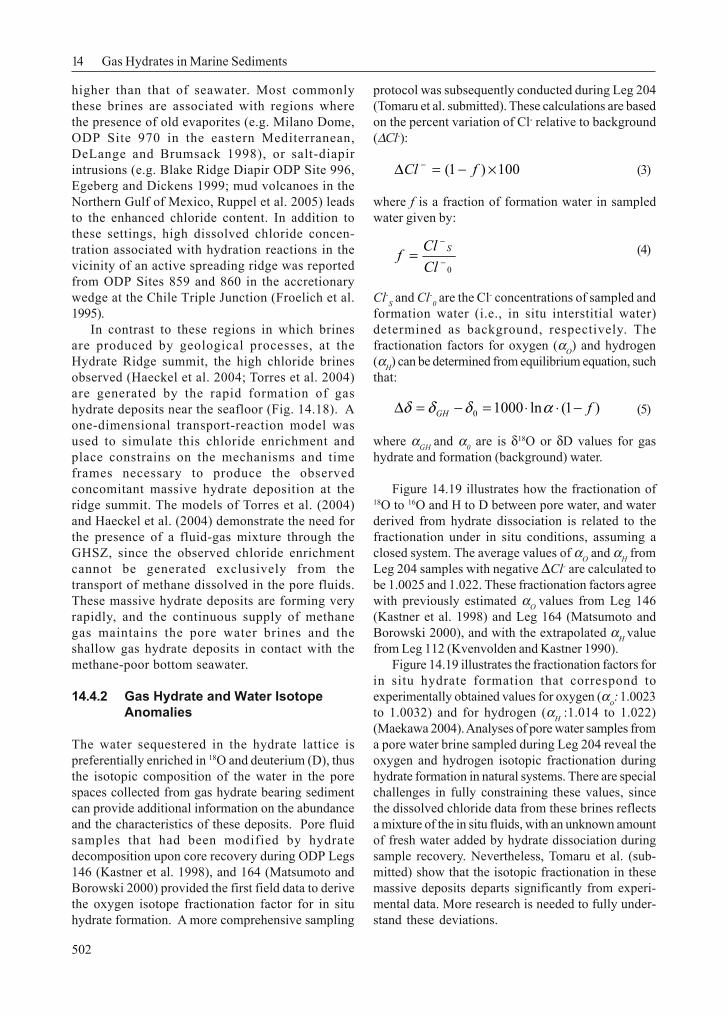
Figure 14.19 illustrates how the fractionation of18O to 16O and H to D between pore water, and waterderived from hydrate dissociation is related to thefractionation under in situ conditions, assuming aclosed system. The average values of αO and αH fromLeg 204 samples with negative ∆Cl- are calculated tobe 1.0025 and 1.022. These fractionation factors agreewith previously estimated αO values from Leg 146(Kastner et al. 1998) and Leg 164 (Matsumoto andBorowski 2000), and with the extrapolated αH valuefrom Leg 112 (Kvenvolden and Kastner 1990).
Figure 14.19 illustrates the fractionation factors forin situ hydrate formation that correspond toexperimentally obtained values for oxygen (αο: 1.0023to 1.0032) and for hydrogen (αH :1.014 to 1.022)(Maekawa 2004). Analyses of pore water samples froma pore water brine sampled during Leg 204 reveal theoxygen and hydrogen isotopic fractionation duringhydrate formation in natural systems. There are specialchallenges in fully constraining these values, sincethe dissolved chloride data from these brines reflectsa mixture of the in situ fluids, with an unknown amountof fresh water added by hydrate dissociation duringsample recovery. Nevertheless, Tomaru et al. (sub-mitted) show that the isotopic fractionation in thesemassive deposits departs significantly from experi-mental data. More research is needed to fully under-stand these deviations.
503
14.5 Gas Hydrate Carbonate Formation and Anaerobic Oxidation of Methane
14.5 Gas Hydrate CarbonateFormation and AnaerobicOxidation of Methane
14.5.1 Petrographic Characteristics ofClathrites
Authigenic carbonates are common features at seafloorseepage sites where fluids enriched in methane oroversaturated in bicarbonate escape from seafloor.Various investigators have described a particularly
large variety of carbonates from the Cascadia margin(Kulm et al. 1986; Ritger et al. 1987; Sample and Reid1998; Greinert et al. 2001). Detailed petrographic,mineralogical and isotopic work was performed on awide collection of samples that document severalpetrographically distinct lithologies. Carbonatesoccurr in boulder fields or in massive autochthonouschemoherm complexes (Teichert et al. 2005a). Othercarbonates were sampled in direct contact withhydrates and in others, a direct relationship to gashydrates was recognized (Bohrmann et al. 1998;Teichert et al. 2004). There are two main lithologies: abreccia composed of micrite-cemented monomictclasts, and pure aragonite of various appearances.
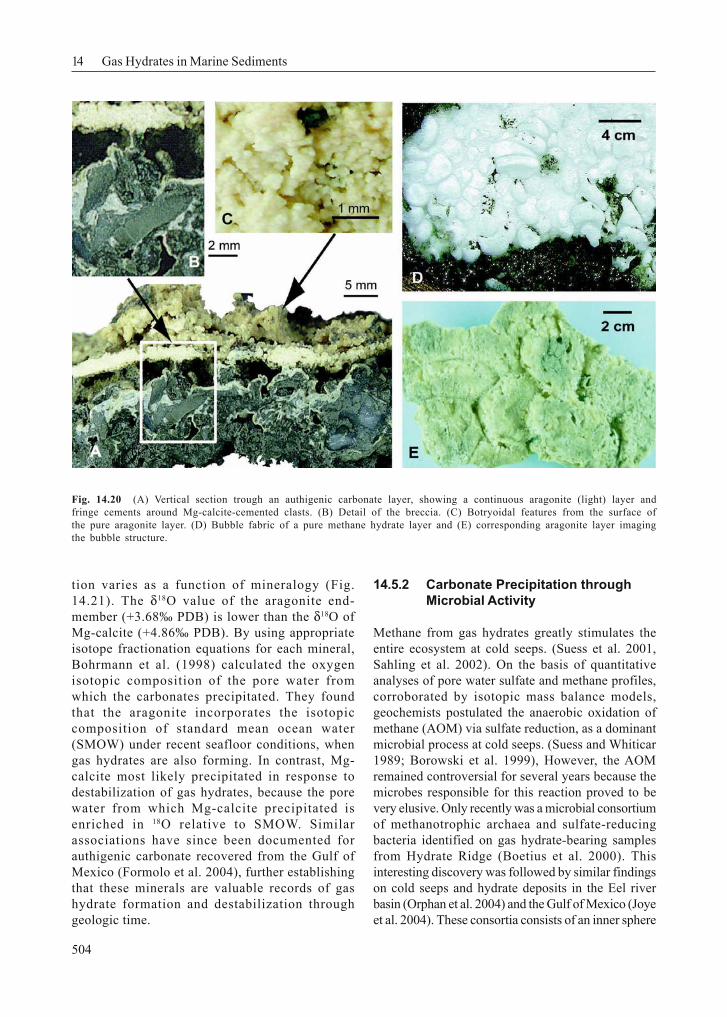
The breccia show angular clasts composed of thesame fine-grained material as the terrigenous softsediment on the seafloor, and submicrometer anhedralMg-calcite crystals have been observed in theintergranular pore space between the terrigenouscomponents (Bohrmann et al. 1998; Greinert et al. 2001).Although the grain-supported texture (Figs. 14.20Aand 14.20B) shows up to 20-30% pore space, the clastsdo not appear to have been transported over longerdistances. The breccia is thought to form by thecollapse of the clasts when gas hydrate in the sedimentdissociates, followed by cementation with Mg-calciteand aragonite.
The second obvious carbonate lithology is com-posed of aragonite precipitates, that appear either aspure isopachous fringe cements (Fig. 14.20B) or asyellow layers of remarkable purity (Figs. 14.20A,14.20C, and 14.20E). Pieces of isolated yellow aragonitelayers have often been found associated with gashydrates. Such layers have variable thicknesses of 1to 3 cm, occur often in pieces of 10 to 20 cm in diameterand reveal truncated edges. The continuous aragonitelayers grow directly within pure gas hydrate layersparallel to stratification and are therefore free ofterrigenous sediment impurities. In several cases thearagonite precipitates have been directly recoveredfrom within pure gas-hydrate layers (Greinert et al.2001). The precipitates often exhibit a shape thatpartially images the inner surface morphology of thegas hydrate bubble fabric (Fig. 14.20E).
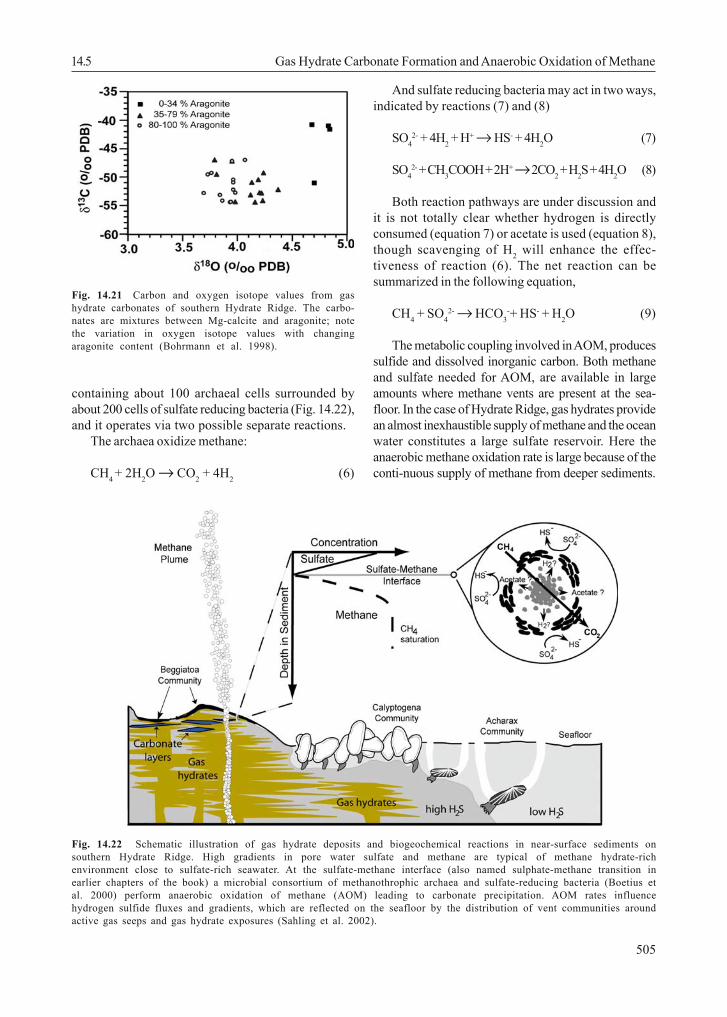
Such gas hydrate carbonates are also calledclathrites and form archives in which geochemicalprocesses of clathrate and clathrite formation iswell documented (Teichert et al. 2005b). Theircarbon isotope values range from -40‰ to -54‰PDB, identifying methane as the dominant carbonsource (Fig. 14.21). Bohrmann et al. (1998)analyzed mixtures of Mg-calcite and aragoniteand showed that their oxygen isotopic composi-
Fig. 14.19 Isotopic fractionation between water in thepore fluid and water in the hydrate lattice as a function ofchloride anomalies (∆Cl). Hydrate dissociation causeschloride dilution and 18O, D enrichment. The fractionationfactors α0 = 1.0025 and αH = 1.022 are based on data fromlow-chloride pore waters recovered from Hydrate Ridgeduring ODP Leg 204. They are in agreement with previousestimates from Legs 146 and 164, as well as with experi-mentally determined values during hydrate formationshown by open circles. Samples collected from pore waterbrines deviate considerably from expected values (fromTomaru et al., submitted).
14 Gas Hydrates in Marine Sediments
504
tion varies as a function of mineralogy (Fig.14.21). The δ18O value of the aragonite end-member (+3.68‰ PDB) is lower than the δ18O ofMg-calcite (+4.86‰ PDB). By using appropriateisotope fractionation equations for each mineral,Bohrmann et al. (1998) calculated the oxygenisotopic composition of the pore water fromwhich the carbonates precipitated. They foundthat the aragonite incorporates the isotopiccomposition of standard mean ocean water(SMOW) under recent seafloor conditions, whengas hydrates are also forming. In contrast, Mg-calcite most likely precipitated in response todestabilization of gas hydrates, because the porewater from which Mg-calcite precipitated isenriched in 18O relative to SMOW. Similarassociations have since been documented forauthigenic carbonate recovered from the Gulf ofMexico (Formolo et al. 2004), further establishingthat these minerals are valuable records of gashydrate formation and destabilization throughgeologic time.
14.5.2 Carbonate Precipitation throughMicrobial Activity
Methane from gas hydrates greatly stimulates theentire ecosystem at cold seeps. (Suess et al. 2001,Sahling et al. 2002). On the basis of quantitativeanalyses of pore water sulfate and methane profiles,corroborated by isotopic mass balance models,geochemists postulated the anaerobic oxidation ofmethane (AOM) via sulfate reduction, as a dominantmicrobial process at cold seeps. (Suess and Whiticar1989; Borowski et al. 1999), However, the AOMremained controversial for several years because themicrobes responsible for this reaction proved to bevery elusive. Only recently was a microbial consortiumof methanotrophic archaea and sulfate-reducingbacteria identified on gas hydrate-bearing samplesfrom Hydrate Ridge (Boetius et al. 2000). Thisinteresting discovery was followed by similar findingson cold seeps and hydrate deposits in the Eel riverbasin (Orphan et al. 2004) and the Gulf of Mexico (Joyeet al. 2004). These consortia consists of an inner sphere
Fig. 14.20 (A) Vertical section trough an authigenic carbonate layer, showing a continuous aragonite (light) layer andfringe cements around Mg-calcite-cemented clasts. (B) Detail of the breccia. (C) Botryoidal features from the surface ofthe pure aragonite layer. (D) Bubble fabric of a pure methane hydrate layer and (E) corresponding aragonite layer imagingthe bubble structure.
505
containing about 100 archaeal cells surrounded byabout 200 cells of sulfate reducing bacteria (Fig. 14.22),and it operates via two possible separate reactions.
The archaea oxidize methane:
CH4 + 2H2O → CO2 + 4H2 (6)
And sulfate reducing bacteria may act in two ways,indicated by reactions (7) and (8)
SO42- + 4H2 + H+ → HS- + 4H2O (7)
SO42- + CH3COOH + 2H+→ 2CO2 + H2S + 4H2O (8)
Both reaction pathways are under discussion andit is not totally clear whether hydrogen is directlyconsumed (equation 7) or acetate is used (equation 8),though scavenging of H2 will enhance the effec-tiveness of reaction (6). The net reaction can besummarized in the following equation,
CH4 + SO42- → HCO3
-+ HS- + H2O (9)
The metabolic coupling involved in AOM, producessulfide and dissolved inorganic carbon. Both methaneand sulfate needed for AOM, are available in largeamounts where methane vents are present at the sea-floor. In the case of Hydrate Ridge, gas hydrates providean almost inexhaustible supply of methane and the oceanwater constitutes a large sulfate reservoir. Here theanaerobic methane oxidation rate is large because of theconti-nuous supply of methane from deeper sediments.
Fig. 14.21 Carbon and oxygen isotope values from gashydrate carbonates of southern Hydrate Ridge. The carbo-nates are mixtures between Mg-calcite and aragonite; notethe variation in oxygen isotope values with changingaragonite content (Bohrmann et al. 1998).
Fig. 14.22 Schematic illustration of gas hydrate deposits and biogeochemical reactions in near-surface sediments onsouthern Hydrate Ridge. High gradients in pore water sulfate and methane are typical of methane hydrate-richenvironment close to sulfate-rich seawater. At the sulfate-methane interface (also named sulphate-methane transition inearlier chapters of the book) a microbial consortium of methanothrophic archaea and sulfate-reducing bacteria (Boetius etal. 2000) perform anaerobic oxidation of methane (AOM) leading to carbonate precipitation. AOM rates influencehydrogen sulfide fluxes and gradients, which are reflected on the seafloor by the distribution of vent communities aroundactive gas seeps and gas hydrate exposures (Sahling et al. 2002).
14.5 Gas Hydrate Carbonate Formation and Anaerobic Oxidation of Methane
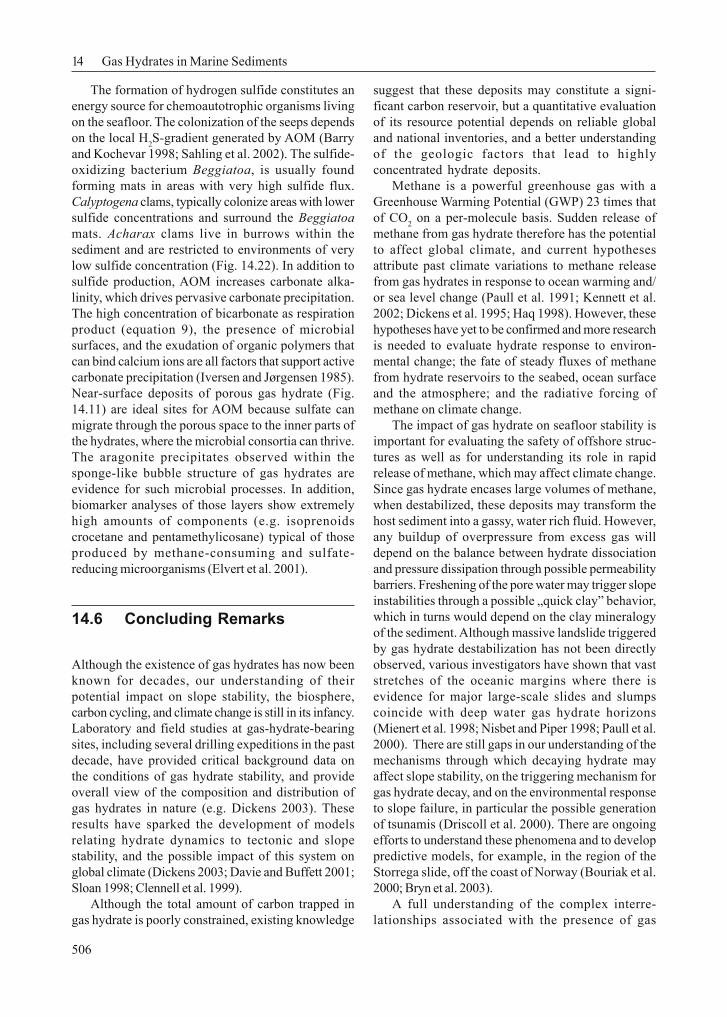
14 Gas Hydrates in Marine Sediments
506
The formation of hydrogen sulfide constitutes anenergy source for chemoautotrophic organisms livingon the seafloor. The colonization of the seeps dependson the local H2S-gradient generated by AOM (Barryand Kochevar 1998; Sahling et al. 2002). The sulfide-oxidizing bacterium Beggiatoa, is usually foundforming mats in areas with very high sulfide flux.Calyptogena clams, typically colonize areas with lowersulfide concentrations and surround the Beggiatoamats. Acharax clams live in burrows within thesediment and are restricted to environments of verylow sulfide concentration (Fig. 14.22). In addition tosulfide production, AOM increases carbonate alka-linity, which drives pervasive carbonate precipitation.The high concentration of bicarbonate as respirationproduct (equation 9), the presence of microbialsurfaces, and the exudation of organic polymers thatcan bind calcium ions are all factors that support activecarbonate precipitation (Iversen and Jørgensen 1985).Near-surface deposits of porous gas hydrate (Fig.14.11) are ideal sites for AOM because sulfate canmigrate through the porous space to the inner parts ofthe hydrates, where the microbial consortia can thrive.The aragonite precipitates observed within thesponge-like bubble structure of gas hydrates areevidence for such microbial processes. In addition,biomarker analyses of those layers show extremelyhigh amounts of components (e.g. isoprenoidscrocetane and pentamethylicosane) typical of thoseproduced by methane-consuming and sulfate-reducing microorganisms (Elvert et al. 2001).
14.6 Concluding Remarks
Although the existence of gas hydrates has now beenknown for decades, our understanding of theirpotential impact on slope stability, the biosphere,carbon cycling, and climate change is still in its infancy.Laboratory and field studies at gas-hydrate-bearingsites, including several drilling expeditions in the pastdecade, have provided critical background data onthe conditions of gas hydrate stability, and provideoverall view of the composition and distribution ofgas hydrates in nature (e.g. Dickens 2003). Theseresults have sparked the development of modelsrelating hydrate dynamics to tectonic and slopestability, and the possible impact of this system onglobal climate (Dickens 2003; Davie and Buffett 2001;Sloan 1998; Clennell et al. 1999).
Although the total amount of carbon trapped ingas hydrate is poorly constrained, existing knowledge
suggest that these deposits may constitute a signi-ficant carbon reservoir, but a quantitative evaluationof its resource potential depends on reliable globaland national inventories, and a better understandingof the geologic factors that lead to highlyconcentrated hydrate deposits.
Methane is a powerful greenhouse gas with aGreenhouse Warming Potential (GWP) 23 times thatof CO2 on a per-molecule basis. Sudden release ofmethane from gas hydrate therefore has the potentialto affect global climate, and current hypothesesattribute past climate variations to methane releasefrom gas hydrates in response to ocean warming and/or sea level change (Paull et al. 1991; Kennett et al.2002; Dickens et al. 1995; Haq 1998). However, thesehypotheses have yet to be confirmed and more researchis needed to evaluate hydrate response to environ-mental change; the fate of steady fluxes of methanefrom hydrate reservoirs to the seabed, ocean surfaceand the atmosphere; and the radiative forcing ofmethane on climate change.
The impact of gas hydrate on seafloor stability isimportant for evaluating the safety of offshore struc-tures as well as for understanding its role in rapidrelease of methane, which may affect climate change.Since gas hydrate encases large volumes of methane,when destabilized, these deposits may transform thehost sediment into a gassy, water rich fluid. However,any buildup of overpressure from excess gas willdepend on the balance between hydrate dissociationand pressure dissipation through possible permeabilitybarriers. Freshening of the pore water may trigger slopeinstabilities through a possible „quick clay” behavior,which in turns would depend on the clay mineralogyof the sediment. Although massive landslide triggeredby gas hydrate destabilization has not been directlyobserved, various investigators have shown that vaststretches of the oceanic margins where there isevidence for major large-scale slides and slumpscoincide with deep water gas hydrate horizons(Mienert et al. 1998; Nisbet and Piper 1998; Paull et al.2000). There are still gaps in our understanding of themechanisms through which decaying hydrate mayaffect slope stability, on the triggering mechanism forgas hydrate decay, and on the environmental responseto slope failure, in particular the possible generationof tsunamis (Driscoll et al. 2000). There are ongoingefforts to understand these phenomena and to developpredictive models, for example, in the region of theStorrega slide, off the coast of Norway (Bouriak et al.2000; Bryn et al. 2003).
A full understanding of the complex interre-lationships associated with the presence of gas
507
hydrate in nature requires comprehensive inter-disciplinary studies that inlude laboratory experiments,numerical modelling and field observations. Becausethe factors that influence gas hydrate stability andthe processes that occur as a consequence of gashydrate formation are highly dynamic, these interre-lationships can only be understood through time-series monitoring of complementary parameters overspace and time though the installation of seafloorobservatories. Efforts to establish such observatoriesare underway at a few key gas hydrate locations. Theseand other ongoing studies may well provide keyanswers to our current challenges of evaluating therole of these deposits in the global energy resourcesof the future, and on the global carbon cycle, climatechange, and perhaps biotic evolution through ourplanet’s geologic history.
Acknowledgements
This research used data provided by the OceanDrilling Program (ODP), which is sponsored by the USNational Science Foundation and participatingcountries under management of Joint OceanographicInstitutions (JOI), Inc. Funding for this research wasprovided by the U.S. Science Support Program (USSP)grant F001557, WCNURP grant PF806880 and by NSFgrant OCE-9731157. The Federal Ministry of Educationand Research (BMBF, Berlin) supported the studiesby grant 03G0604A (collaborative project METRO).This is publication GEOTECH-194 of the programGEOTECHNOLOGIEN of the BMBF and DFG andpublication No 0336 of the Research Center OceanMargins of the University of Bremen.
14.7 Problems
Problem 1
The thermodynamically defined gas hydrate zonein sediments of the deep sea is much thicker thanin sediments underlying shallow water, such asthose in the upper continental slope (see Fig.14.4). Does this mean that gas hydrate concen-trations are higher in the deeper ocean than on theupper slope?
Problem 2
Discuss different methane sources in sediments.Is there a difference in hydrate formation whetherthe gas is biogenic or thermogenic in origin?
Problem 3
A sample collected from 90 meters below seaflooron Hydrate Ridge has an in situ methane concen-tration of 300 mM. Based on the phase boundarydiagram shown in Fig.14.5B, do you expecthydrate to be present in this sample? If a samplewith the same methane concentration was re-covered from 250 mbsf, would there be hydrate init? Why/why not. Discuss also a methaneconcentration of 10 mM in samples from 90 and250 mbsf using Fig 14.5 B.
Problem 4
A water sample recovered from a gas-bearing regionhas a chloride concentration of 530 mM and sulfateconcentration of 26.5 mM. Do you expect methanehydrate to be present?
Problem 5
Pore water samples from a hydrate-bearing core wereshown to have a dissolved chloride concentration of507 mM. If the background concentration at this siteis known to be 550 mM, calculate the percent of thepore space that is occupied by gas hydrate, assu-ming full occupancy of the hydrate structure.
Problem 6
How could you explain the formation of shallowbrines are formed in marine pore water, where thereis no association with evaporites?
14.7 Problems
14 Gas Hydrates in Marine Sediments
508
References
Abegg, F., Bohrmann, G., and Kuhs, W.F., subm., DataReport: Shapes and structures of gas hydrates fromHydrate Ridge imaged by CT-imaging of samplesdrilled during ODP Leg 204.
Bangs, N.L.B., Musgrave, R.J., and Tréhu, A.M., 2005.Upward shifts in the southern Hydrate Ridge gashydrate stability zone following postglacial warming,offshore Oregon. J. Geophys. Res., 110:10.1029/2004JB003293.
Barry, J.P., Kochevar, R.E., 1998. A tale of two clams:Differing chemosynthetic life styles among vesico-myids in Monterey Bay cold seeps. Cahiers de Bio-logie Marine 39 (3-4): 329-331.
Bernard, B.B., Brooks, J.M., and Sackett, W.M. 1976.Natural gas seegage in the Gulf of Mexico. Earth andPlanetary Science Letters 31(1): 48-54.
Bily, C., and Dick, J.W.L., 1974. Naturally occurring gashydrates in the Mackenzie Delta. Bulletin of Cana-dian Petroleum Geology, 22: 320-352.
Boetius, A., K. Ravenschlag, K., Schubert, C.J., Rickert,D., Widdel, F., Gieseke, A., Amann, R., Jørgensen,B.B., Witte, U., and Pfannkuche, O., 2000. A marinemicrobial consortium apparently mediating anaerobicoxidation of methane. Nature, 407: 623-626.
Bohrmann, G., Greinert, J., Suess, E., and Torres, M.,1998. Authigenic carbonates from the Cascadiasubduction zone and their relation to gas hydratestability. Geology 26: 647-650.
Bohrmann, G., Ivanov, M.K., Foucher, J.P., Spiess, V.,Bialas, J., Greinert, J., Weinrebe, W., Abegg, F., Aloisi,G., Artemov, Y., Blinova, V., Drews, M., Heidersdorf,F., Krabbenhöft, A., Klaucke, I., Krastel, S., Leder,T., Polikarpov, I., Saburova, M., Schmale, O., Seifert,R., Volkonskaya, A., and Zillmer, M., 2003. Mudvolcanoes and gas hydrates in the Black Sea: new datafrom Dvurechenskii and Odessa mud volcanoes. Geo-Marine Letters, 23: 239-249.
Borowski, W.S., Paull, C.K., and Ussler, W., III, 1999.Global and local variations of interstitial sulfategradients in deep-water, continental marginsediments: Sensitivity to underlying methane and gashydrates. Marine Geology, 159: 131-154.
Bouriak, S., Vanneste, M., and Saoutkine, A., 2000.Inferred gas hydrate and clay diapirs near theStoregga Slide on the southern edge of the VøringPlateau, offshore Norway. Marine Geology, 163:125-148.
Brewer, P.G., Franklin, M.J., Friedrich, G., Kvenvolden,K.A., Orange, D., McFarlane, J., and Kirkwood, W.,1997. Deep-ocean field test of methane hydrateformation from a remotely operated vehicle. Geo-logy, 25: 407-410.
Brooks, J.M., II, M.C.K., Fay, R.R., and McDonald, T.J.,1984. Thermogenic gas hydrates in the Gulf ofMexico. Science, 223: 696-698.
Bryn, P., Solheim, A., Berg, K., Lien, K., Forsberg, C.F.,Haflidason, H., and Ottensen, D., 2003. The StoreggaSlide complex: repeated large scale sliding in responseto climatic cyclicity, in Locat, J., and Mienert, J.,
(eds.), Submarine mass movements and theirconsequences. Advances in natural and technicalhazards research, 19: 215-222.
Buffet, B., and Archer, D., 2004. Global inventory ofmethane clathrate: sensitivity to changes in the deepocean: Earth and Planetary Science Letters, 227:185-199.
Carroll, J., 2003. Natural gas hydrates - a guide forengineers: Burlington, Ma, Elsevier Science, 270 p.
Charlou, J.L., Donval, J.P., Fouquet, Y., Ondreas, H.,Cochonat, P., Levaché, D., Poirier, Y., Jean-Baptiste,P., Fourré, E., Chazallon, B., and Party, T.Z.L.S.,2004. Physical and chemical characterization of gashydrates and associated methane plumes on theCongo-Angola Basin. Chemical Geology: 205: 405-425.
Claypool, G.E., and Kaplan, I.R., 1974. The origin anddistribution of methane in marine sediments, inKaplan, I.R., ed., Natural gases in marine sediments,pp. 99-139.
Claypool, G.W., and Kvenvolden, K.A., 1983. Methaneand other hydrocarbon gases in marine sediments:Ann. Rev. Earth Planetary Science, 11: 299-327.
Clennell, M.B., Hovland, M., Booth, J.S., Henry, P., andWinters, W.J., 1999. Formation of natural gashydrates in marine sediments, 1, Conceptual model ofgas hydrate growth conditioned by host sedimentproperties: Journal of Geophysical Research, 104:22985-23003.
Clennell, M.B., Judd, A., and Hovland, M., 2000.Movement and accumulation of methane in marinesediments: Relation to gas hydrate systems, in Max,M.D., ed., Natural Gas Hydrate in Oceanic andPermafrost Environments: Dordrecht, Kluwer Acade-mic Publ., pp. 105-122.
Collett, T., 2002. Energy resource potential of naturalgas hydrates: AAPG Bulletin, 86: 1971-1992.
Colwell F., Matsumoto R., Reed D., 2004. A review of thegas hydrates, geology, and biology of the NankaiTrough. Chemical Geology, 205 (3/4): 391-404.
Davie M.K. and Buffett B.A., 2001. A numerical modelfor the formation of gas hydrate below the seafloorJournal of Geophysical Research, 106B (1): 497-514.
Davie, M.K., and Buffett, B.A., 2003. Sources ofmethane for marine gas hydrate: inferences from acomparison of observations and numerical models.Earth and Planetary Science Letters, 206: 51-63.
Davis, E.E., Hyndman, R.D., and Villinger, H., 1990.Rates of fluid expulsion across the Northern Cascadiaaccretionary prism: Constraints from new heat flowand multichannel seismic reflection data. Journal ofGeophysical Research, 95: 8869-8889.
Davy, H., 1811. On a combination of oxymuriatic gasand oxygen gas: Philosophical Transactions of theRoyal Society, 155 pp.
De Graaf, W., Wellsbury, P., Parkes, R.J., and Cappen-berg, T.E., 1996. Comparison of acetate turnover inmethanogenic and sulfate-reducing sediments byradio- and stable-isotope labeling and specificinhibitors: evidence for isotopic exchange. Appl. Env.Microbiol., 62: 772-777.
509
De Lange, G.J., and Brumsack, H.-J., 1998. The occur-rence of gas hydrates in Eastern Mediterranean muddome structures as indicated by pore-water compo-sition, in Henriet, J.P., and Mienert, J., eds., GasHydrates: Relevance to World Margin Stability andClimate Change, Special Publications, 137: London,Geological Society, pp. 167-175.
Dickens, G.R., and Quinby-Hunt, M.S., 1994. Methanehydrate stability in seawater: Geophysical ResearchLetters, 21: 2115-2118.
Dickens, G.R., O’Neil, J.R., Rea, D.K., and Owen, R.M.,1995. Dissociation of oceanic methane hydrate as acause of the carbon isotope excursion at the end ofthe Paleocene. Paleoceanography, 10: 965-971.
Dickens, G.R., Castillo, M.M., and Walker, J.C.G., 1997.A blast of gas in the latest Paleocene: Simulatingfirst-order effects of massive dissociation of oceanicmethane hydrate. Geology, 25: 259-263.
Dickens, G.R., 2003. Rethinking the global carbon cyclewith a large, dynamic and microbially mediated gashydrate capacitor. Earth and Planetary ScienceLetters, 213: 169-183.
Driscoll, N.W., Weissel, J.K., and Goff, J.A., 2000.Potential for large-scale submarine slope failure andtsunami generation along the U.S. mid-Atlantic coast.Geology, 28: 407-410.
Egeberg, P.K., and Dickens, G.R., 1999. Thermodynamicand pore water halogen constraints on gas hydratedistribution at ODP Site 997 (Blake Ridge). ChemicalGeology, 153: 53-79.
Egorov, A.V., Crane, K., Vogt, P.R., and Rozhkov, A.N.,1999. Gas hydrates that outcrop on the sea floor:stability models. Geo-Marine Letters, 19: 89-96.
Elvert, M., Greinert, J., and Suess, E., 2001. Carbonisotopes of biomarkers derived from methane-oxidizing microbes at Hydrate Ridge, CascadiaConvergent Margin, in Paull, C., ed., Natural gashydrates: Occurrence, distribution, and detection:Geophysical Monograph 124, American GeophysicalUnion, pp. 115-129.
Flemings, P., Liu, C.-S., and Winters, W.J., 2003. Criticalpressure and multiphase flow in Blake Ridge gashydrates. Geology, 31: 1057-1060.
Formolo, M.J., Lyons, T.W., Zhang, C., Kelley, C.A.,Sassen, R., Horita, J., and Cole, D.R., 2004. Quanti-fying carbon sources in the formation of authigeniccarbonates at gas hydrate sites in the Gulf of Mexico.Chemical Geology, 205: 253-264.
Foucher, J.-P., Nouzé, H., Henry, P., 2002. Observationand tentative interpretation of a double BSR on theNankai slope. Marine Geology 187 (1-2): 161-175.
Froelich, P.N., Kvenvolden, K.A., Torres, M.E., Waseda,A., Didyk, B.M., and Lorenson, T.D., 1995. Geoche-mical evidence for gas hydrate in sediment near theChile Triple Junction. In Lewis, S.D., Behrmann,J.H., Musgrave, R.J., and Cande, S.C. (Eds.), Proc.ODP, Sci. Results, 141: College Station, TX (OceanDrilling Program), pp. 279–286.
Gieskes, J.M., Blanc, G., Vrolijk, P., Elderfield, H., andBarnes, R., 1990. Interstitial water chemistry—majorconstituents. In Moore, J.C., Mascle, A., et al., Proc.ODP, Sci. Results, 110: College Station, TX (Ocean
Drilling Program), pp. 155–178.Ginsburg, G.D., Guseynov, R.A., Dadashev, A.A.,
Telepnev, E.V., Askeri-Nasirov, P.Y., Yesikov, A.A.,Mal’tseva, V.I., Mashiroav, Y.G., and Shabayeva, I.Y.,1992. Gas hydrates of the southern Caspian: Inter-national Geology Review, 43: 765-782.
Ginsburg, G.D., Soloviev, V.A., Cranston, R.E., Lorenson,T.D., and Kvenvolden, K.A., 1993. Gas hydratesfrom the continental slope, offshore Sakhalin Island,Okhotsk Sea. Geo-Marine Letters, 13: 41-48.
Ginsburg, G., Milkov, A.V., Soloviev, V.A., Egorov, A.V.,Cherkashev, G.A., Vogt, P.R., Crane, K., Lorenson,T.D., and Khutorskoy, M.D., 1999. Gas hydrateaccumulation at the Håkon Mosby Mud Volcano. Geo-Marine Letters, 19: 57-67.
Greinert, J., Bohrmann, G., and Suess, E., 2001. Gashydrate-associated carbonates and methane-ventingat Hydrate Ridge: Classification, distribution, andorigin of authigenic lithologies, in Paull, C. andDillon W.P. ed., Natural gas hydrates: Occurrence,distribution, and detection: Geophysical Monograph124: 87-98, American Geophysical Union, pp. 99-113.
Gutt, C., Asmussen, B., Press, W., Merkl, C., Casalta, H.,Greinert, J., Bohrmann, G., Tse, J., and Hüller, A.,1999. Quantum rotations in natural methane-clathrates from the Pacific sea-floor. EurophysicsLetters, 48: 269-275.
Haeckel, M., Suess, E., Wallmann, K., and Rickert, D.,2004. Rising methane gas bubbles form massivehydrate layers at the seafloor: Geochimica et Cosmo-chimica Acta, 68: 4335-4345.
Hammerschmidt, E.G., 1934. Formation of gas hydratesin natural gas transmission lines. Industrial andEngineering Chemistry, 26: 851 pp.
Handa, Y.P 1990. Effect of hydrostatic pressure andsalinity on the stability of gas hydrates. J Phys.Chem., 94: 2651-2657.
Haq, B.U., 1998. Natural gas hydrates: searching for thelong-term climatic and slope-stability records, inHenriet, J.P., and Mienert, J., eds., Gas Hydrates:Relevance to World Margin Stability and ClimateChange, Volume 137: Special Publications: London,Geological Society, pp. 303-318.
Harrison, W.E., and Curiale, J.A., 1982. Gas hydrates insediments of holes 497 and 498A, Deep Sea DrillingProject Leg 67, in Aubouin, J., and von Huene, R.,eds., Initial Reports of the Deep Sea Drilling Project,Volume 67, U.S.Governmental Printing Office, pp.591-594.
Heeschen, K., Tréhu, A., Collier, R.W., Suess, E., andRehder, G., 2003. Distribution and height of methanebubble plumes on the Cascadia Margin characterizedby acoustic imaging: Geophysical Research Letters,30: 10.1029/2003GL016974.
Hensen, C., and Wallmann, K., 2005, Methane formationat Costa Rica continental margin - constraints for gashydrate inventories and cross-décollement fluid flow.Earth and Planetary Science Letters: 236: 41-60.
Hesse, R., and Harrison, W.E., 1981. Gas hydrates(clathrates) causing pore-water freshening and oxygenistope fractionation in deep-water sedimentary
References
14 Gas Hydrates in Marine Sediments
510
sections of terrigenous continental margins: Earth andPlanetary Science Letters, 55: 453-462.
Hesse, R., Lebel, J., and Gieskes, J.M., 1985. Intersitialwater chemistry of gas-hydrate bearing sections onthe Middle America trench slope, DSDP Leg 84, invon Huene, R., and Aubouin, J., eds., Inital Reports ofDSDP, Volume 84: Washington, U.S. GovernmentalPrinting Office, p. 727-737.
Hesse, R., 2003. Pore water anomalies of submarine gas-hydrate zones as tool to assess hydrate abundance anddistribution in the subsurface - what have we learnedin the past decade. Earth-Science Reviews, 61: 149-179.
Hyndman, R.D., and Spence, G.D., 1992. A seismic studyof methane hydrate marine bottom-simulating reflec-tors. Journal Geophys. Res, (97): 6683-6698.
Iversen, N., Jørgensen, B.B. 1985. Anaerobic methaneoxidation rates at the sulfate-methane transition inmarine sediments from Kattegat and Skagerrak(Denmark). Limnology & Oceanography 30 (5):944-955.
Joye, S.B., Boetius, A., Orcutt, B.N., Montoya, J.P., Schulz,H.N., Erickson, M.J., and Lugo, S.K. 2004. Theanaerobic oxidation of methane and sulfate reduction insediments from Gulf of Mexico cold seeps. ChemicalGeology 205: 219-238
Kastner, M., Elderfield, H., and Martin, J.B., 1991. Fluidsin convergent margins: what do we know about theircomposition, origin, role in diagenesis andimportance for oceanic chemical fluxes: Phil. Trans.R. Soc. London A, 335: 243-259.
Kastner, M., Kvenvolden, K.A., and Lorenson, T.D.,1998. Chemistry, isotopic composition, and origin ofa methane-hydrogen sulfide hydrate at the Cascadiasubduction zone. Earth and Planetary Science Letters,156: 173-183.
Kennett, J., Cannariato, K., Hendy, I., and Behl, R.,2002. Methane hydrates in Quaternary climatechange: the clathrate gun hypothesis, AGU booksboard, 216 p.
Kuhs, W.F., Bauer, F.C., Hausmann, R., Ahsbahs, H.,Dorwarth, R., and Hölzer, K., 1996. Single crystaldiffraction with X-rays and neutrons. High quality athigh pressure? High Press. Res., 14: 341-352.
Kuhs, W.F., Genov, G.Y., Goreshnik, E., Zeller, A.,Techmer, K., and Bohrmann, G. 2004. The impact ofporous microstructures of gas hydrates on theirmacroscopic properties. International Journal of Off-shore and Polar Engineering, 14: 305-309.
Kulm, L.D., Suess, E., Moore, J.C., Carson, B., Lewis,B.T., Ritger, S.D., Kadko, D.C., Thornburg, T.M.,Embley, R.W., Rugh, W.D., Massoth, G.J., Langseth,M.G., Cochrane, G.R., and Scamann, R.L. 1986,Oregon subduction zone: venting, fauna, andcarbonates. Science, 231: 561-566.
Kvenvolden, K.A., and McMenamin, M.A., 1980.Hydrates of natural gas: A review of their geologicaloccurrence. US Geological Survey Circular, 825, 0-11.
Kvenvolden, K.A., 1988, Methane hydrate - a majorreservoir of carbon in the shallow geosphere?Chemical Geology, 71: 41-51.
Kvenvolden, K.A., 1998. A primer on the geological
occurence of gas hydrate, in Henriet, J.P., andMienert, J., eds., Gas Hydrates: Relevance to WorldMargin Stability and Climate Change, Volume 137:Special Publications: London, Geological Society, pp.9-30.
Kvenvolden, K.A., and Kastner, M., 1990. Gas hydratesof the Peruvian outer continental margin, in Suess,E., and von Huene, R., (eds.), Proc. ODP., Scien.Results, Volume 112: College Station, pp. 517-526.
Kvenvolden, K.A., 1993. A primer on gas hydrates. In:Howell. D.G. et al. (eds.) The future of energy gases,U.S. geological survey professional paper, 1570: pp.279-291.
Lein, A., Vogt, P., Crane, K., Egorov, A., and Ivanov, M.,1999. Chemical and isotopic evidence for the natureof the fluid in CH4-containing sediments of theHåkon Mosby Mud Volcano. Geo-Marine Letters, 19:76-83.
Maekawa, T., 2004. Experimental study on isotopicfractionation in water during gas hydrate formation:Geochemical Journal, 38:129-138.
Makogon, Y.F., Trebin, F.A., Trofimuk, A.A., Tsarev,V.P., and Cherskiy, N.V. 1971. Detection of a pool ofnatural gas in a solid (hydrated gas) state: Doklady p.59-66. Akademii Nauk SSSR.
Mathews, M.A., and von Huene, R., 1985. Site 570methane hydrate zone, in Orlofsky, S., ed., DSDPIniterum Reports, Volume 84, U.S. Gov. PrintingOffice, pp. 773-790.
Matsumoto, R., and Borowski, W., 2000. Gas hydrateestimates from newly determined oxygen isotopicfractionation and δ18O anomalies of interstitialwaters: Leg 164, Blake Ridge, in Paull, C.,Matsumoto, R., Wallace, P.J., and Dillon, W.P.,(eds.), Proc. ODP, Sci. Results, Volume 164: CollegeStation, TX (Ocean Drilling Program), 196: pp. 203-206.
Mazurenko, L.L., and Soloviev, V.A., 2003. Worldwidedistribution of deep-water fluid venting and potentialoccurrences of gas hydrate accumulations. Geo-Marine Letters, 23: 162-176.
Mienert, J., Posewang, J., and Baumann, M., 1998. Gashydrates along the northeastern Atlantic margin:possible hydrate-bound margin instabilities andpossible release of methane, in Henriet, J.-P., andMienert, J., eds., Gas Hydrates: Relevance to WorldMargin Stability and Climate Change, Volume 137:London, Geological Society, pp. 275-291.
Nimblett J. ; Ruppel C., 2003. Permeability evolutionduring the formation of gas hydrates in marinesediments. Journal of Geophysical Research, 108 (B9)pp. EPM 2-1, Cite ID 2420, DOI 10.1029/2001JB001650.
Nisbet, E.G., and Piper, D.J.W., 1998. Giant submarinelandslides. Nature, 392: 329-330.
Orphan, V.J., Ussler III, W., Naehr, T.H., House, C.H.,Hinrichs, K.-U., and Paull, C.K. 2004. Geological,geochemical, and microbiological heterogeneity ofthe seafloor around methane vents in the Eel RiverBasin, offshore California. Chemical Geology 205:265-289.
Paull, C.K., Ussler III, W., and Dillon, W.P., 1991. Is the
511
extent of glaciation limited by marine gas-hydrates:Geophysical Research Letters, 18: 432-434.
Paull, C.K., Ussler III, W., and Borowski, W., 1994.Sources of biogenic methane to form marine gashydrates - In situ production or upward migration?:Annals of the New York Academy of Sciences, 715:392-409.
Paull, C.K., Matsumoto, R., and Wallace, P.J., 1996.Proceedings of the ODP, Initial Reports: CollegeStation, TX, 623 pp.
Paull, C.K., Matsumoto, R., Wallace, P.J., and Dillon, W.P.,2000, Proceedings of the Ocean Drilling Program,Scientifc Results: College Station TX, 459 pp.
Reed, D.W., Fujita, Y., Delwiche, M.E., Blackwelder,D.B., Sheridan, P.P., Uchida, T., and Colwell, F.S.2002. Microbial communities from methane-hydratebearing deep marine sediments in a forearc basin.Applied Environmental Microbiology, 20002, 3759-3770.
Ritger, S., Carson, B., and Suess, E., 1987. Methane-derived authigenic carbonates formed by subduction-induced pore-water expulsion along the Oregon/Washington margin: Geological Society of AmericaBulletin, 98: 147-156.
Ruppel, C., Dickens, G.R., Castellini, D.G., Gilhooly, W.,and Lizarralde, D., 2005. Heat and salt inhibition ofgas hydrate formation in the northern Gulf ofMexico: Geophysical Research Letters, 32: L04605,doi:10.1029/2004GL021909.
Sahling, H., Rickert, D., Lee, R.W., Linke, P., and Suess,E., 2002. Macrofaunal community structure andsulfide flux at gas hydrate deposits from the Cascadiaconvergent margin: Marine Ecology Progress Series,231: 121-138.
Sample, J., and Reid, M.R., 1998, Contrasting hydro-geological regimes along strike-slip and thrust faultsin the Oregon convergent margin: Evidence from thechemistry of syntectonic carbonate cements andveins: GSA Bulletin, 110: 48-59.
Sassen, R., Mac Donald, I.R., Requejo, A.G., Guinasso Jr,N.L., Kennicutt II, M.C., Sweet, S.T., and Brooks,J.M., 1994. Organic geochemistry of sediments fromchemosynthetic communities, Gulf of Mexico slope:Geo-Marine Letters, 14: 110-119.
Schoell, M., 1988. Multiple origins of methane in theEarth. Chemical Geology 71 (1-3): 1-10.
Shipley, T.H., Houston, M.H., Buffler, R.T., Shaub, F.J.,McMillen, K.J., Ladd, J.W., and Worzel, J.L., 1979.Seismic evidence for widespread possible gas hydratehorizons on continetal slopes and rises. Am. Assoc.Petrol. Geol. Bull., 63: 2204-2213.
Shipley, T.H., and Didyk, B.M., 1982. Occurrence ofmethane hydrates offshore southern Mexico, inWatkins, J.S., and Moore, J.C., eds., Initial Reports ofthe Deep Sea Drilling Project, Volume 66, U.S.Government Printing Office, pp. 547-555.
Shoji, H., and Langway, C.C., 1982. Air hydrateinclusions in fresh ice core. Nature, 298:548-550.
Sloan, E.D.j., 1998. Physical/chemical properties of gashydrates and application to world margin stability andclimatic change, in Henriet, J.P., and Mienert, J.,(eds.), Gas Hydrates: Relevance to World Margin
Stability and Climate Change, Volume 137: SpecialPublications: London, Geological Society, pp. 31-50.
Stoll, R.D., Ewing, J.I., and Bryan, G.M., 1971.Anomalous wave velocities in sediments containinggas hydrates: Journal Geophys. Res, 76: 2090-2094.
Suess, E., and Whiticar, M.J., 1989. Methane-derived CO2in pore fluids expelled from the Oregon subductionzone. Palaeogeography, Palaeoclimatology, Palaeo-ecology, 71: 119-136.
Suess, E., Torres, M.E., Bohrmann, G., Collier, R.W.,Greinert, J., Linke, L., Rehder, G., Tréhu, A.,Wallmann, K., Winckler, G., and Zuleger, E., 1999.Gas hydrate destabilization: enhanced dewatering,benthic material turnover and large methane plumesat the Cascadia convergent margin: Earth and Plane-tary Science Letters, 170: 1-15.
Suess, E., Torres, M.E., Bohrmann, G., Collier, R.W.,Rickert, D., Goldfinger, C., Linke, P., Heuser, A.,Sahling, H., Heeschen, K., Jung, C., Nakamura, K.,Greinert, J., Pfannkuche, O., Tréhu, A., Klink-hammer, G., Whiticar, M.C., Eisenhauer, A.,Teichert, B., and Elvert, E., 2001. Sea floor methanehydrates at Hydrate Ridge, Cascadia Margin, in Paull,C. and Dillon W.P. ed., Natural gas hydrates:Occurrence, distribution, and detection: GeophysicalMonograph 124: 87-98, American GeophysicalUnion.
Takahashi, H., Japan Petroleum Exploration Co., L.,Yonezawa, T., Corporation, J.N.O., Takedomi, Y.,and Ministry of Economy, T.A.I., 2001. Explorationfor Natural Gas Hydrate in Nankai-Trough WellsOffshore Japan, Offshore Technology Conference,Volume 13040: Houston, Texas, OTC.
Teichert, B.M.A., Gussone, N., Eisenhauer, A., andBohrmann, G., 2004. Clathrites - Archives of near-seafloor pore water evolutions (44Ca, 13C, 18O) in seepenvironments. Geology, 33: 213-216.
Teichert, B.M.A., Bohrmann, G., and Suess, E., 2005a.Chemoherms on Hydrate Ridge: Unique microbiallymediated carbonate build ups in cold seep settings.Palaeogeography, Palaeoclimatology, Palaeoecology,227: 67-85.
Teichert, B.M.A., Bohrmann, G., Torres, M., andEisenhauer, A., 2005b. Fluid sources, fluid pathwaysand diagenetic reactions across an accretionary prismrevealed by Sr and B geochemistry. Earth and Plane-tary Science Letters, 239: 106-121.
Tissot, B., and Welte, H., 1992. Petroleum formationand occurrence. Springer-Verlag, 536 pp.
Tomaru, H., Matsumoto, R., Torres, M.E., and Borowski,W.S., subm., Geological and geochemical constraintson the isotopic composition of interstitial watersfrom the Hydrate Ridge region, Cascadia continentalmargin.
Torres, M.E., Wallmann, K., Tréhu, A.M., Bohrmann, G.,Borowski, W.S., and Tomaru, H., 2004. Gas hydrategrowth, methane transport, and chloride enrichmentat the southern summit of Hydrate Ridge, Cascadiamargin off Oregon. Earth and Planetary ScienceLetters, 226: 225-241.
Tréhu, A.M, Bohrmann, G., Rack, F.R., Torres, M.E., etal., 2003. Proc. ODP, Init. Repts., 204 [CD-ROM].
References
14 Gas Hydrates in Marine Sediments
512
Available from: Ocean Drilling Program, Texas A&MUniversity, College Station TX 77845-9547, USA.
Tréhu, A.M., Long, P.E., Torres, M.E., Bohrmann, G., R.,R.F., Collett, T.S., Goldberg, D.S., Milkov, A.V.,Riedel, M., Schultheiss, P., Bangs, N.L., Barr, S.R.,Borowski, W.S., Claypool, G.E., Delwiche, M.E.,Dickens, G.R., Gracia, E., Guerin, G., Holland, M.,Johnson, J.E., Lee, Y.-J., Liu, C.-S., Su, X., Teichert,B., Tomaru, H., Vanneste, M., Watanabe, M., andWeinberger, J.L., 2004a. Three-dimensional distribu-tion of gas hydrate beneath southern Hydrate Ridge:constraints from ODP Leg 204. Earth and PlanetaryScience Letters, 222: 845-862.
Tréhu, A.M., Flemings, P.B., Bangs, N.L., Chevallier, J.,Gràcia, E., Johnson, J.E., Liu, C.-S., Liu, X., Riedel,M., and Torres, M.E., 2004b. Feeding methane ventsand gas hydrate deposits at south Hydrate Ridge.Geophys. Res. Lett., 31:10.1029/2004GL021286.
Tucholke, B.E., Bryan, G.M., and Ewing, J.I., 1977. Gas-hydrate horizons detected in seismic-profiler data fromthe western North Atlantic. American Association ofPetroleum Geologists Bulletin, 61: 698-707.
Ussler III, W., and Paull, C., 2001. Ion exclusionassociated with marine gas hydrate deposits, in Paull,C., and Dillon, W.P., (eds.), Natural gas hydrates-occurrence, distribution, and detection, GeophysicalMonograph 124: Washington, AGU, pp. 41-51.
Weinberger, J.L., Brown, K.M., and Long, P.E., 2005.Painting a picture of gas hydrate distribution withthermal images. Geophysical Research Letters, 32:doi: 10.1029/2004GL021437.
Westbrook, G.K., Carson, B., Musgrave, R.J., et al. 1994.Proceedings, initial reports, Ocean Drilling Program,Leg 146: Cascadia Margin, 611 pp.
Whiticar, M.J., 1999. Carbon and hydrogen isotope sys-tematics of bacterial formation and oxidation ofmethane. Chemical Geology, 161: 291-314.
Whiticar, M.J., Faber, E., and Schoell, M., 1986.Biogenic methane formation in marine andfreshwater environments. CO2 reduction vs. Acetatefermentation - Isotope evidence. Geochimica etCosmochimica Acta, 50: 693-709.
Vasil’ev, V.G., Makogon, Y.F., Trebin, F.A., A.A., T., andCherskiy, N.V., 1970. The property of natural gasesto occur in the Earth crust in a solid state and toform gas hydrate deposits. Otkrytiya v SSR, pp. 15-17 .
von Stackelberg, M., and Müller, H.R., 1954. FesteGashydrate II: Struktur und Raumchemie. Z. Elektro-chem., 58: 25-39.
Wellsbury, P., Goodman, K., Cragg, B.A., and Parkes,R.J., 2000. The geomicrobiology of deep marinesediments from Blake Ridge containing methanehydrate (Sites 994, 995 and 997), in Paull, C.,Matsumoto, R., Wallace, P.J., and Dillon, W.P., eds.,Proceeding of ODP, Volume 164: 379-391.
Wood, B.J., and Ruppel, C., 2000. Seismic and thermalinvestigations of the Blake Ridge gas hydrate area: asynthesis, in Paull, C., Matsumoto, R., Wallace, P.J.,and Dillon, W.P., (eds.), Proceedings of ODP,Scientific Results, Volume 164: 253-264.
Xu, W., and Ruppel, C., 1999. Predicting the occurrence,
distribution, and evolution of methane gas hydrate inporous marine sediments. Journal of GeophysicalResearch, 104: 5081-5095.
Yakushev, V.S., and Istomin, V.A., 1992. Gas-hydrate self-preservation effect, in Maeno, N., and Hondoh, T., (eds.)Sapporo, Hokkaido University Press, pp. 136-140.
Yefremova, A.G., and Zhizchenko, B.P., 1974. Occur-rence of crystal hydrates of gases in the sediments ofmodern marine basins. Doklady Akademii Nauk SSSR,214: 1,179-1,181.
Zatsepina, O.Y., and Buffett, B.A., 1997. Phaseequilibrium of gas hydrate: implications for theformation of hydrate in the deep sea-floor.Geophysical Research Letters, 24: 1567-1570.