Embed Size (px)
Citation preview
U T R E C H T U N I V E R S I T Y
Faculty of Law, Economics and Governance
International Economics and Business
International Management
MASTER THESIS
Marek Cech
Logit Model Analysis:
Does the Merger-Related Legislation in the Nation of the M&A Target
Company Affect the Probability of the Pre-Merger Deal Failure?
July 31, 2016
Abstract The paper examines the relationship between the nation of an M&A transaction’s
target company and the probability of deal completion/ pre-merger failure based on a sample of
transactions proposed by Dutch bidders during the period ranging from 2003 to 2015 with other
Dutch companies; British (UK); or American (US) targets. By the logistic regression analysis, the
US-targeted deals were found to be associated with higher probabilities of pre-merger failure
which is aimed to be explained by applying a mediation analysis of several country-specific
indicators potentially affecting the deal completion. This way, four factors which are addressed in
the theoretical part of the paper (including the restrictiveness of the merger control mechanisms,
effectiveness of corporate-related legislation and the time and complexity of contract
enforcement) were found to be the mediators of the relationship between the target nation and
pre-merger failure. Additionally, according to the regression results, transactions conducted
during the end of a merger wave are expected to be less likely completed than the ones
negotiated in the earlier or later stages, regardless of the target nation.
Keywords merger control, deal completion
JEL Classifications K21, M21
Acknowledgements Comments, remarks and advices by the supervisor of this thesis, dhr. drs.
Erik Dirksen, are gratefully acknowledged.
2
Table of contents
List of Tables ………………………………………………………………………………….. 4
List of Figures ………………………………………………………………………………… 5
List of Acronyms ……………………………………………………………………………… 6
1 Introduction ……………………………………………………………………………….. 7
2 Literature Review …………………………………………………………………………. 10
3 Merger Regulation ………………………………………………………………………… 13
3.1 Antitrust Laws in the USA ……………………………………………………………. 13
3.1.1 The Sherman Act ………………………………………………………………… 13
3.1.2 The Federal Trade Commission Act ……………………………………………... 15
3.1.3 The Clayton Act …………………………………………………………………. 15
3.1.4 Federal Trade Commission Cases and Proceedings ……………………………… 16
3.2 Merger Regulation in the EU …………………………………………………………. 19
3.2.1 Criteria for the EU Merger Regulation to Apply …………………………………. 19
3.2.2 The EU Merger Regulation Notification, Investigation and Penalties ……………. 20
3.2.3 The EU Merger Regulation Statistics …………………………………………….. 22
3.3 Comparison of the EU and US Merger Control Mechanisms …………………………. 24
4 Takeover Defense Tactics ………………………………………………………………… 26
4.1 Dual-class Shares ……………………………………………………………………… 26
4.2 ESOP …………………………………………………………………………………. 27
4.3 Poison Pills …………………………………………………………………………… 27
4.4 Golden Parachute ……………………………………………………………………... 28
4.5 Staggered Board Amendments ………………………………………………………... 28
4.6 Greenmail …………………………………………………………………………….. 29
4.7 Comparison of the US, UK and Dutch Defense Tactics ……………………………… 29
3
5 Hypotheses Formulation …………………………………………………………………. 31
6 Logit Model Analysis …………………………………………………………………….... 32
6.1 Methodology ………………………………………………………………………….. 32
6.1.1 Basic Assumptions of the Logit Model …………………………………………... 33
6.2 Data Structure and Model Variables …………………………………………………... 33
6.2.1 The Dependent and Independent Variables …………………………………….... 34
6.2.2 The Mediator Variables ………………………………………………………….. 35
6.2.3 The Moderator Variable …………………………………………………………. 37
6.2.4 Descriptive Statistics ……………………………………………………………... 38
6.3 Logistic Regression Analysis …………………………………………………………... 39
6.3.1 Hypothesis Testing ………………………………………………………………. 40
7 Robustness Test: Probit Model Analysis ………………………………………………….. 45
8 Conclusion and Discussion ……………………………………………………………….. 48
Bibliography …………………………………………………………………………………. 51
Appendix A: EU Merger Regulation Thresholds ……………………………………………... 55
4
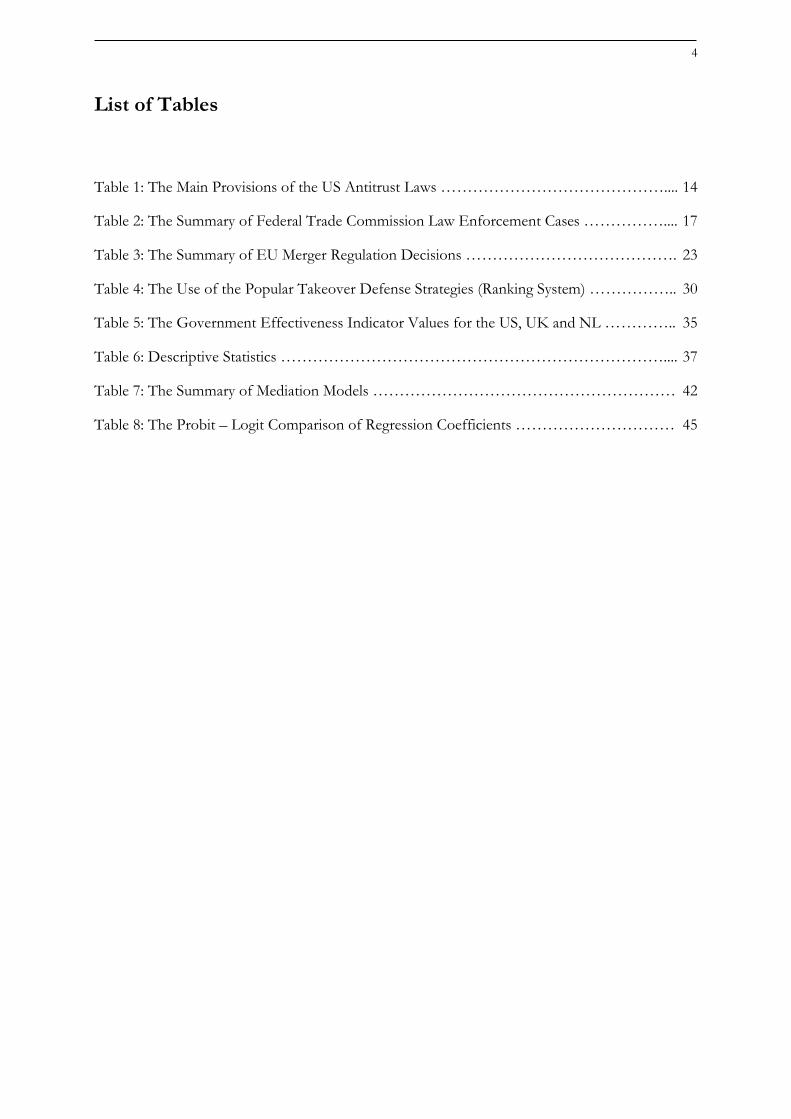
List of Tables
Table 1: The Main Provisions of the US Antitrust Laws …………………………………….... 14
Table 2: The Summary of Federal Trade Commission Law Enforcement Cases …………….... 17
Table 3: The Summary of EU Merger Regulation Decisions …………………………………. 23
Table 4: The Use of the Popular Takeover Defense Strategies (Ranking System) …………….. 30
Table 5: The Government Effectiveness Indicator Values for the US, UK and NL ………….. 35
Table 6: Descriptive Statistics ……………………………………………………………….... 37
Table 7: The Summary of Mediation Models ………………………………………………… 42
Table 8: The Probit – Logit Comparison of Regression Coefficients ………………………… 45
5
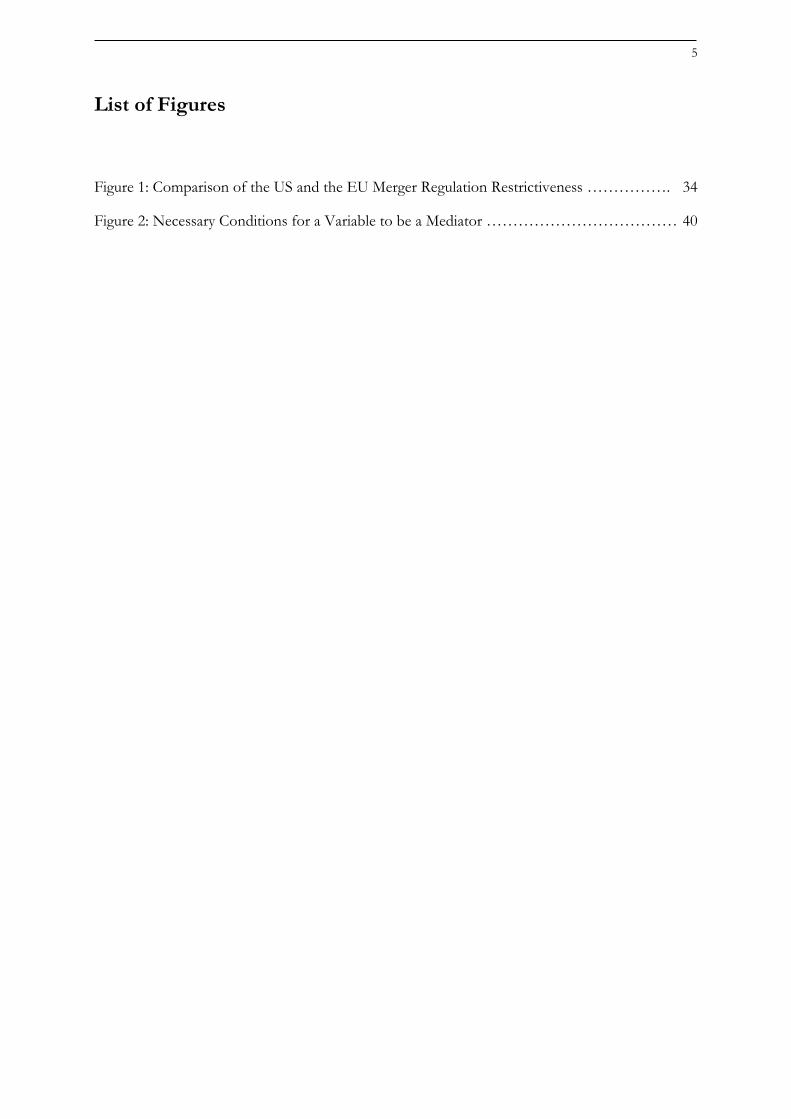
List of Figures
Figure 1: Comparison of the US and the EU Merger Regulation Restrictiveness ……………. 34
Figure 2: Necessary Conditions for a Variable to be a Mediator ……………………………… 40
6
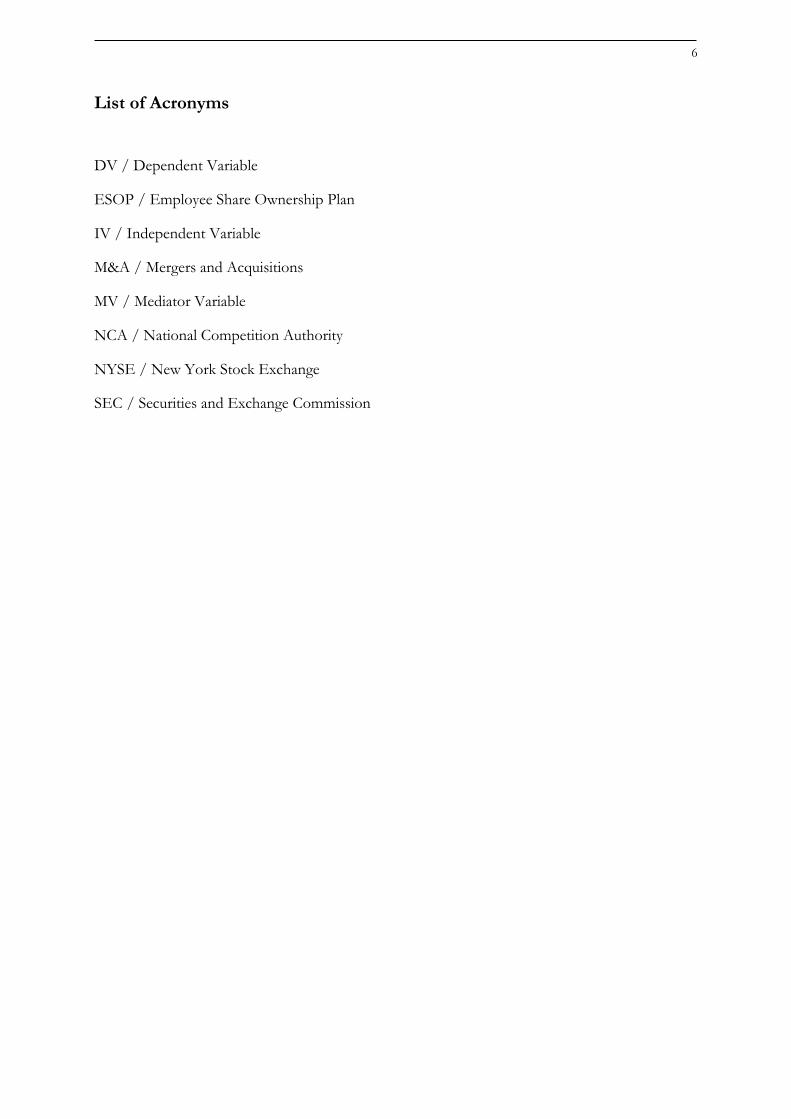
List of Acronyms
DV / Dependent Variable
ESOP / Employee Share Ownership Plan
IV / Independent Variable
M&A / Mergers and Acquisitions
MV / Mediator Variable
NCA / National Competition Authority
NYSE / New York Stock Exchange
SEC / Securities and Exchange Commission
7
1 Introduction
Companies engaging in mergers and acquisitions (M&A) spent more than USD 3.8 trillion on
their deals in 2015, exceeding the previous record amount of money invested in such activities set
in 2007. Currently, high numbers of firms worldwide seem to be more confident and optimistic
about pursuing M&A than they were in the last few years following the financial crisis of 2008.
This trend resembles the six merger waves that occurred over the last 120 years (Baigorri, 2016).
Porzio (2015) has suggested that favorable conditions for M&A transactions are nowadays
present almost in the whole US economy, regardless of sector or industry, and that they have
occurred as a combination of high consumer and management confidence, and low interest rates.
Such environment is not expected to change rapidly in the near future and hence the amount of
M&A deals involving US companies is assumed to continue growing. Similarly, positive
macroeconomic, financial and investment conditions encouraging M&A activity can be observed
in the EU. According to Corte and Horbach (2015), the confidence of European companies has
been resumed after the economic crisis due to the combined effect of improved methods of
financing, high levels of cash reserves on corporate financial statements, rising levels of
investment returns, and strong equity market performance allowing publicly listed bidders to pay
in stock for their takeovers and thus benefit from using such payment method. Based on these
factors, M&A activity is expected to remain important for the global economic development in
the upcoming years (Yoon, 2015).
Generally, companies have various reasons for conducting mergers and acquisitions. To mention
some of them, Sudarsanam (2003) finds that firms are mostly motivated by potential benefits
resulting from the transaction in a form of financial gains (acquiring an undervalued or poorly
managed company which can be restructured, healed and then resold with a premium), strategic
market advantage (increasing market share and power, or taking control over firms attractive for
competitors), diversification, and internal pressures from management and corporate executives
either being concerned about the company’s reputation leading them to follow the others’ M&A
decisions (“following the crowd”), or being self-interested and overconfidently aiming to leave a
legacy or boost their own egos with a specific deal. Other authors see the drivers of M&A
transactions in the globalization and the increased competition in both domestic and international
markets linked to it (Zuhairy et al., 2015), or in the access to new technologies, know-how or
scarce resources (Motis, 2007). Since all of these motives currently lead an increasing amount of
companies that engage in M&A activities (instead of using some other market entry modes),
interact with others internationally and spend billions of US dollars in mutual deals, this field
seems to be highly relevant for the current global economy and thus worth studying within the
scope of this paper.
Regardless of the motives behind M&A, the companies conducting such transactions usually
share one common objective which is delivering positive value to shareholders. However,
according to the current literature, between 70% and 90% of the deals actually fail to create
expected synergies and shareholder value (McMorris, 2015). According to the literature reviewed
on this topic, the reasons why the companies do not succeed in reaching their merger-related
goals often include differences between the involved parties regarding e.g. corporate culture,

8
management structure and habits, business strategy or long-term objectives. This in turn leads to
an unsuccessful post-merger integration of the firms. While there are plenty of papers and
publications analyzing the success or failure of M&A deals from the post-merger perspective and
focusing on the ability of the companies to create and deliver value to their shareholders along
with achieving the expected synergies, there is little amount of literature studying the topic from
the pre-merger point of view. Despite the record figure for the volume of M&A deals completed
recently, in 2015, there has been more than 25% of the total number of proposed transactions
that failed during the pre-merger period, i.e. before they were even finalized (Zephyr and World
Bank, 2016). Since such incompletion (withdrawal or prohibition) of a proposed deal is usually
accompanied by high fees and losses for the bidder harming the company and its shareholders,
this study aims to examine some of the factors assumed to affect the pre-merger M&A failure in
detail and help the companies avoid the costly pre-merger deal incompletion.
Thus, the main purpose of the present paper is to uncover and empirically analyze some of the
reasons why some mergers or acquisitions fail to be completed and others do not. Based on the
literature reviewed on this topic, the most commonly discussed factors have been the legislative,
administrative and business environments linked to the nation of the M&A target company.
While several country-specific factors were addressed by the authors (such as merger regulation
mechanisms, popularity and legality of various takeover defense strategies, complexity of
governmental corporate-related legislation or time-demand of contract administration and
enforcement), the proposed relationship between specific target nations and the pre-merger
failure rate has not been tested empirically by any of them. This paper combines the theoretical
description of the relevant country-specific characteristics of the merger-related legislation
present in the target nation with an econometric logit model analysis designed to test whether the
relationships assumed by the studied literature hold after application of the real-life data.
More specifically, M&A deals proposed by Dutch companies with their most common deal
partners or targets, namely British, American, or other Dutch firms are examined. Another
reason for choosing these nations for the analysis is that they represent the 3 most important
players in the global M&A activity based on the amount and volume of transactions made, and
hence there is also enough data available regarding the deals and their completion/ pre-merger
failure. The time period examined by the analysis spans from 2003 to 2015 in order to cover
three groups of data: (1) the sixth merger wave (2003 – 2008) which is expected to affect the pre-
merger deal failure according to the studied literature, (2) the most recent M&A activity (2014 –
2015) which is considered to be an upward-sloping part of a potential seventh merger wave, and
(3) the years between these two periods as a reference period of time when deal-making is not
affected by any merger wave. In order to find an answer to the primary research question stated
as “Does the merger-related legislation in the nation of the M&A target company affect
the probability of the pre-merger deal failure?”, each target nation in the sample of this paper
is described by variables corresponding to the restrictiveness of the merger regulation (percentage
of penalized or rejected deals in the total amount of deals), effectiveness of the government
legislation and time and number of procedures needed for companies to finalize and inforce
contracts. Additionally, testing the relationship between the fact that a transaction is being
negotiated during the end of a merger wave (when there is a high amount of deterrent examples
9
of deals failed during the earlier stages of the wave) and the probability of successful completion
of such a deal is also part of the empirical analysis.
Since the importance and amount of money involved in the field of M&A seem to be on their
continuous increase, an empirical analysis of the factors, more specifically the regulation-related
characteristics of the target nation, affecting the probability of a deal’s pre-merger failure can
represent a valuable contribution to the field. This paper aims not only to extend the current
literature on this topic (which is mainly focused on post-merger failures) but also provide
companies that consider engaging in M&A transactions with an empirical study suggesting what
kind of country-specific factors are estimated to positively or negatively influence the likelihood
of the deal completion. Such factors are then important to be inspected while choosing a suitable
target company for an M&A activity. Since the present paper is based on the analysis of the
transactions proposed by Dutch bidders, it is expected to be relevant especially for companies
operating in the Netherlands which have been investing the world highest amount of money in
M&A deals relative to the country’s GDP over the last few years (Zephyr, 2016). In addition, as
some authors claim that the global economy is moving towards the top of a seventh merger wave
(Lam, 2016), it is found relevant to examine the effect of the later stage of a merger wave (using
the data from the sixth wave) on the probability of a deal completion that might be applicable on
the current deal-making. This is also one of the unique features of this study by which it aims to
contribute to the existing research and literature.
In the following section, a literature review regarding the main factors expected to affect the pre-
merger M&A deal failure is provided. In Section 3, the focus is put on the most commonly
discussed one, the merger control and regulation mechanisms in the EU and the US. In that part
of the paper the two legislations are summarized and compared according to the levels of
restrictiveness later used for the empirical analysis. An in-depth explanation and comparison of
the two merger regulation systems is provided in order to help the reader understand the
differences between the two regulatory regimes and the reasons why they can influence the
probability of pre-merger M&A deal failure. Section 4 provides an overview of the popularity and
use of the takeover defense strategies as a part of the country-specific merger control
mechanisms since the literature review suggested that countries with higher legal allowance of
such tactics are expected to experience significantly higher pre-merger failure rate. In Section 5,
the hypotheses for the empirical analysis of this paper are stated. Sections 6 and 7 are then related
to the logit model analysis of the proposed hypotheses and the robustness test in a form of a
probit regression. Finally, Section 8 summarized the results and conclusions drawn from the
empirical part of the paper and suggests potential areas of further research.
10
2 Literature Review
In the literature studied on the topic of the pre-merger M&A completion, a few major reasons
for the transactions to fail in this stage of the deal-making process were discussed. Reis et al.
(2013) addressed cross-border deals and found that cultural differences in corporate and social
behavior and habits may make the pre-completion stage of negotiation and deal finalization
difficult or even impossible. Manchin (2004) suggests that the level of M&A deal completion
between the European and US companies is lower than in the case of transactions conducted
within the EU. The author claims that this fact may be affected by various macroeconomic,
legislative and institutional aspects characteristic for each of the involved countries. Such factors
include e.g. the regulatory environment, contract enforcement mechanisms, market for corporate
control, or quality and efficiency of the governmental institutions.
The purpose of this paper is to analyze how the nationality of the target company and the
legislative system linked to it affect the probability that the deal will fail during the pre-merger
stage. In order to do so, a few aspects characterizing the target nation (and being expected to
have an effect on the deal completion) are identified. First, the level of merger control in a nation
of the target has been discussed as an important factor. Although only few deals have been
prohibited as a result of the merger regulation in the EU or the USA compared to the total
amount of deals completed, the potential restrictions or compliance requirements set by the
regulatory authorities can still deter significant amount of companies from proceeding with the
proposed M&A transactions. Phillips (2013) has addressed the fact that strict rules passed by the
US Federal Trade Commission requiring pharmaceutical companies to notify antitrust authorities
when they aim to conduct any kind of M&A, or e.g. just acquire an exclusive patent license, are
observed to result in a relatively high amount of deal withdrawals among drug and biotech
companies. According to De Loecker et al. (2008) and Tsang (2015), similar deterrent effects of
the merger regulation requirements can be also noticed in industries including tobacco, petroleum
products or transportation (specifically railroads or airspace) in the USA. In addition, companies
sometimes back out of their planned M&A activities during the pre-merger stage because of two
factors: (1) the severity and nature (criminal or civil) of the penalties issued to them in case they
would fail to comply with an order received from the regulatory authority, and (2) the extent of
the potential remedial actions required to proceed with the deal. It has been observed that a
threat of criminal penalties discourages more anticompetitive transactions from their completion
than civil penalties (Peitz and Spiegel, 2014). The logit model analysis in Section 6 aims to
estimate the effect of the restrictiveness of merger regulation in the three key players in the world
M&A deals (the USA, the United Kingdom and the Netherlands) on the probability of pre-
merger transaction failure taking into account the number of deals penalized and prohibited by
each of the regulatory legislations.
Also connected to the merger control legislation, the success or failure of an M&A deal
finalization process is assumed to be affected by the legality and popularity of takeover defense
strategies used in the nation of the target company since these practices are designed to prevent
unwanted takeovers and mergers from being completed (Pearce and Robinson, 2004). Gandel
(2014) claims that the tactics, such as poison pills or staggered board membership, have been
11
highly relevant and key defense tools used by target companies to block offers during the pre-
merger negotiation stage of the deal-making process. According to Mason (2016), the popularity
of takeover defense strategies (including golden parachutes, dual-class stock structure, employee
share ownership plans or greenmailing) has significantly increased during the last 20 years and
even though they are allowed by the government and regulatory authorities in an effort to help
companies safeguard the rights and interests of their shareholders in case of a hostile takeover
threat, such tactics are often used by the target’s management for purely self-motivated reasons
to block all kinds of deals, even those potentially beneficial for the shareholders. As stressed by
Sundaramurthy (2000), the defense strategies seem not only to raise barriers to finalization of
transactions that are already being negotiated (leading to the pre-merger M&A deal failure) but
also to deter potential acquirers from initiating a bid. The theoretical part of the paper addresses
primarily the potential effects of the use of the takeover defense tactics on the deal completion,
and compares the popularity and legality of such strategies within the studied countries.
However, because of the lack of data regarding the use of takeover defense in each of the
countries and each year of the examined time period, this factor is not included in the empirical
analysis.
In addition to the country-specific merger regulation and control mechanisms discussed above,
Phillips (2013) argues that a complex government policy regarding corporate activities that is
difficult to understand and apply can also deter companies engaging in M&A deals from
finalizing the transactions. Using the example of unclear changes in rules passed by the Federal
Trade Commission of the USA with respect to the notification requirements applicable for
pharmaceutical companies in 2013, the author claims that vague interpretation of regulatory
policies along with their excessive complexity can have a negative effect on the completion of the
deals being negotiated. Regarding the policy complexity, Smith (2003) has claimed that for some
companies, a short time needed to finalize contract with another firm and receive decision, such
as unconditional clearance or conditions required for clearance, from the regulatory authority is
very important, especially in cases when the deal has to be completed as soon as possible in order
to achieve proposed strategic objectives with time-limited validity. In this sense, a complicated
merger and competition law and contract enforcement can delay takeovers so much that they are
withdrawn during the pre-merger period since the opportunity costs of the companies waiting for
the regulatory decision are higher than expected benefits from the merger (UKSA, 2016).
Lastly, a few authors have addressed the relationship between the occurrence of merger waves
and pre-merger deal withdrawals. Gaugham (2015) has stated that these waves, short periods of
very intense merger activity, start when there is a high amount of potentially attractive target
companies in the market and they usually end with a burst of an economic bubble which led to
such abundance of M&A deals in the first place. Thus, at the top of the merger wave, more deals
are expected to fail during the pre-merger deal-making period since a noticeable number of
companies back out of the deals once they see a lot of unsuccessful deals that were completed at
the beginning of the wave but did not manage to achieve expected synergies and shareholder
value creation. This trend has been observed mainly in the USA. According to Galli and
Pelkmans (2000), towards the end of the merger wave, not only companies observe the deterrent
examples of deals completed at an earlier stage of the wave (eventually with an undesirable
outcome) but also the merger control and antitrust authorities learn their lesson from these cases

12
in a form of stricter merger regulation enforcement that in turn results in more deals penalized or
prohibited increasing the probability of the pre-merger M&A failure.
Besides the above listed factors (namely the level of restrictiveness of the merger control, the use
of takeover defense strategies, understandable and effective government policies, and fast and
uncomplicated enforcement of contracts), there are many other reasons why M&A deals fail
before they are even finalized, e.g. the executive management’s hubris, over-confidence or over-
optimism which leads them to proceed with their bid despite the fact that the merger regulation
or the allowed takeover defense tactics might make the deal impossible to finish. Such companies
are often even willing to take the risk of paying high penalties if the deal is not completed
(Sudarsanam, 2003). However, such factors are hardly observable and measurable and thus, for
the purpose of this paper, they are not included in the empirical model.
The next two sections describe the merger regulation legislation and mechanisms effective in the
USA and the EU along with the legality and use of the takeover defense strategies most
commonly discussed in the examined literature. This way the reader is aimed to be provided with
a sufficient in-depth overview of the topic of merger control for an easier understanding of the
relationships tested by the empirical analysis.
13
3 Merger Regulation
3.1 Antitrust Laws in the USA
Since 1890, the United States Congress has passed three antitrust laws, namely the Sherman Act,
the Federal Trade Commission Act, and the Clayton Act. After some revisions and amendments,
all of them are currently still in effect. The main purpose of the US antitrust laws is to prohibit
unlawful mergers, acquisitions and business practices in general. In order to spot and inspect
such transactions, the laws have set fundamental rules and benchmarks for fair competition
within firms whose activities and operations are in any way affecting the US economy. Since the
antitrust laws define unlawful M&A and business practices in relatively general terms, the
authorized courts then have to decide which of the transactions and activities are illegal based on
the specific characteristics of each case. Yet, the basic objective of the law does not change.
Every antitrust legal proceeding aims to protect competition in the relevant market for the
customers’ benefit, making sure that businesses have strong incentives to operate efficiently and
keep quality of their products up without increasing their prices (Federal Trade Commission,
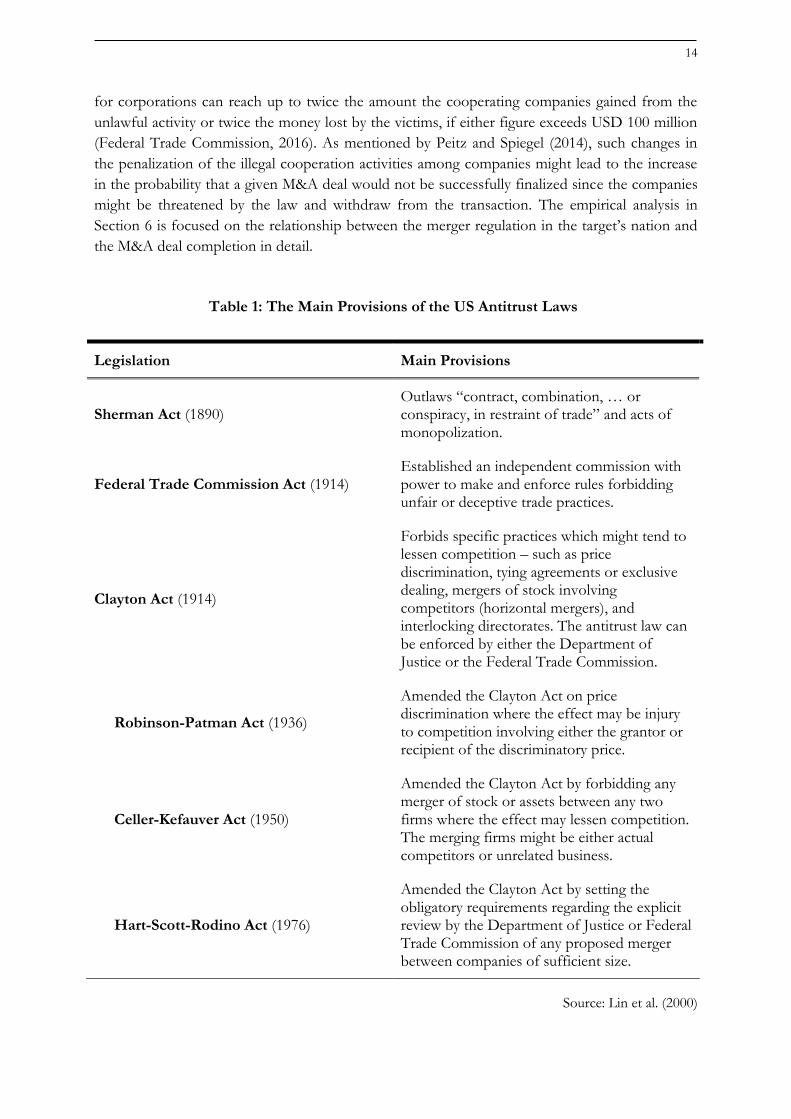
2016). Table 1 summarizes the most important provisions of the three antitrust laws and their
amendments. All of them are described below more in detail.
3.1.1 The Sherman Act
This antitrust law states that “every contract, combination in the form of trust or otherwise, or
conspiracy, in restraint of trade or commerce among the United States, or with foreign nations, is
declared to be illegal” as well as an “attempt to monopolize, combine or conspire with any other
person or persons [corporations or associations by the laws of the United States or any foreign
country] to monopolize any part of the trade or commerce among the United States, or with
foreign nations” (Legal Information Institute, 2016). Although the interpretation of the law by
the courts might differ (potentially leading to declaring agreements lawful even if they restrain
trade), certain acts are perceived to harm competition so seriously that they are declared illegal in
vast majority of cases. Such acts include, among others, intentional bid rigging (promising a
commercial contract to one party even though several other parties present a bid as well), market
division within a few major players, or plain arrangements between competing businesses to fix
prices.
The violation of the Sherman Act is usually penalized financially but can also result in
imprisonment as the Act is the only US antitrust statute which carries criminal penalties because
it is both civil and criminal law. The size of the criminal penalties for intentional and clear
violations of the law (such as bid rigging or price fixing) is one of the few changes that have been
made since its implementation in 1890. As amended in the original version of the Act, the
unlawful activities restraining or monopolizing trade “shall be punished by fine not exceeding
USD 10 million if a corporation, or USD 350 thousand if any other person, or by imprisonment
not exceeding three years” (Legal Information Institute, 2016). In June 22, 2004, the maximum
fines for corporations increased to USD 100 million and for individuals to USD 1 million, along
with up to 10 years in prison. In addition, under federal law, the maximum level of the penalty
14
for corporations can reach up to twice the amount the cooperating companies gained from the
unlawful activity or twice the money lost by the victims, if either figure exceeds USD 100 million
(Federal Trade Commission, 2016). As mentioned by Peitz and Spiegel (2014), such changes in
the penalization of the illegal cooperation activities among companies might lead to the increase
in the probability that a given M&A deal would not be successfully finalized since the companies
might be threatened by the law and withdraw from the transaction. The empirical analysis in
Section 6 is focused on the relationship between the merger regulation in the target’s nation and
the M&A deal completion in detail.
Table 1: The Main Provisions of the US Antitrust Laws
Legislation Main Provisions
Sherman Act (1890) Outlaws “contract, combination, … or conspiracy, in restraint of trade” and acts of monopolization.
Federal Trade Commission Act (1914) Established an independent commission with power to make and enforce rules forbidding unfair or deceptive trade practices.
Clayton Act (1914)
Forbids specific practices which might tend to lessen competition – such as price discrimination, tying agreements or exclusive dealing, mergers of stock involving competitors (horizontal mergers), and interlocking directorates. The antitrust law can be enforced by either the Department of Justice or the Federal Trade Commission.
Robinson-Patman Act (1936)
Amended the Clayton Act on price discrimination where the effect may be injury to competition involving either the grantor or recipient of the discriminatory price.
Celler-Kefauver Act (1950)
Amended the Clayton Act by forbidding any merger of stock or assets between any two firms where the effect may lessen competition. The merging firms might be either actual competitors or unrelated business.
Hart-Scott-Rodino Act (1976)
Amended the Clayton Act by setting the obligatory requirements regarding the explicit review by the Department of Justice or Federal Trade Commission of any proposed merger between companies of sufficient size.
Source: Lin et al. (2000)
15
With regard to the cross-border M&A, a “strict territorial interpretation” was originally used by
courts when applying the Sherman Act to foreign conduct, i.e. they were looking exclusively at
the laws of the locality where the anticompetitive activity occurred. This approach was, however,
replaced by an “effect test” in 1945 which stated that “any state may impose liabilities … for
conduct outside its borders that has consequences within its borders which the state reprehends”
(Becker and Kirtland, 2003). Thus since then, the American merger regulations apply directly not
only to the companies operating in the USA making deals among each other, but also to the
firms based outside the USA entering the American market, strengthening their positions there or
affecting the nature and competitiveness of the market (including import and export) in any other
way.
3.1.2 The Federal Trade Commission Act
All violations of the Sherman Act are according to the Supreme Court of the United States also
outside the law stated in the Federal Trade Commission Act which aims to define and ban unfair
methods of competition and deceptive acts or business practices. Under the Act from 1914, the
Commission is empowered to seek monetary compensation or any other relief for activities
detrimental to customers and market competition; introduce trade regulation rules specifically
defining unfair and deceptive practices along with establishing clear requirements to prevent such
activities; conduct investigations related to the entities suspected of the unlawful practices; and
make public releases and legislative recommendations to the Congress to improve the antitrust
law system. In addition to covering majority of the activities that already violate the Sherman Act,
the Federal Trade Commission Act also reaches some other practices (harming fair competition)
which do not clearly fit into the rules of conduct formally prohibited by the Sherman Act, thus
the legislation addresses and inspects wider range of transactions affecting the American market
(Federal Trade Commission, 2016).
3.1.3 The Clayton Act
Together with its amendments (Robinson-Patman Act, Celler-Kefauver Act and Hart-Scott-
Rodino Act), the Clayton Act defines and forbids such activities as price discrimination (including
rebates and discounts), specific mergers and interlocking directorates (when the same person
makes decisions for competing companies), tying arrangements (when the seller conditions the
sale of one product on the buyer’s agreement to purchase a separate product from the seller), and
exclusive dealing or boycotts. The three amendments to the Clayton Act have noticeably affected
the scope and nature of the US antitrust law. In 1936, the Robinson-Patman Act banned certain
discriminatory price settings and allowances in dealings between companies. However, the effect
of this amendment has diminished since both the Department of Justice and the Federal Trade
Commission have rarely enforced the Act since it became effective (Lin et al., 2000).
In 1950, Section 7 of the Clayton Act was amended by the Celler-Kefauver Antimerger Act
prohibiting M&A which might result in substantial lessening of the competition or tend to create
a monopoly. Prior to this amendment, many firms were able to get around the original version of
the Clayton Act by making use of the fact that asset transactions among competitors were not
16
illegal even though stock deals were. This way the Celler-Kefauver Act aimed to capture more
M&A activities that would lead to explicit or tacit collusion (caused by increased market
concentration) making the US antimerger law stricter than it had been before (Federal Trade
Commission, 2016).
In 1976, the Hart-Scott-Rodino Antitrust Improvements Act brought new obligatory requirements for
companies planning large M&A to notify the government in advance about the purpose,
expected execution and impact of their plans. Since either the Department of Justice or the
Federal Trade Commission acquired the responsibility to formally review the potential mergers,
the role of these institutions became significantly more important with respect to the antitrust law
enforcement affecting the chance that a company‘s proposed merger would not be approved (Lin
et al., 2000). Additionally, the agencies’ role in the US antitrust policy changed from the one
based on law enforcement to one based on regulation. As a result, the importance of their Joint
Merger Guidelines outlining the principal analytical techniques, practices and enforcement policy
with respect to both horizontal and non-horizontal (vertical and conglomerate) M&A naturally
increased as well (Coate and Kleit, 1996). As suggested by the US General Accounting Office
(1990), the new law after the Hart-Scott-Rodino amendment had a significant impact on the
process how specific cases attracted attention of the two enforcement bodies. Since until 1978,
the Antitrust Division of the Office was notified about potentially unlawful mergers through
complaints of attorneys, citizen information, or trade press reports, it was relatively difficult for
them to investigate proposed mergers completely before they were finalized. However, the
“premerger notification program” becoming effective in 1978 as part of the Hart-Scott-Rodino
Act led to a noticeable increase in the number of cases investigated by the regulatory bodies (Lin
et al., 2000).
3.1.4 Federal Trade Commission Cases and Proceedings
As discussed above, one of the Commission’s fundamental missions is to promote fair
competition in the American market. In order to do so, the authority enforces federal antitrust
laws that prohibit anticompetitive M&A and other business practices potentially leading to higher
prices, narrower variety of products, or less innovation (Federal Trade Commission, 2016). Even
though the Commission also enforces federal consumer protection laws that aim to prevent
fraud, deception and unfair practices of companies with respect to the customer welfare, this
section of the paper deals exclusively with the enforcement mechanisms linked to the cases
addressing antitrust issues. These cases are the most relevant for the empirical analysis presented
in Section 6 since they reflect (un)fair competition between market participants responding to
their mutual transactions and cooperation in form of M&A. The effects of these cases’
enforcement proceedings (orders and penalties issued by the Commission) on the probability of
M&A’s failure during the pre-merger stage are tested by the logit model analysis. In this part of
the paper, the Commission’s enforcement practices are briefly summarized and described.
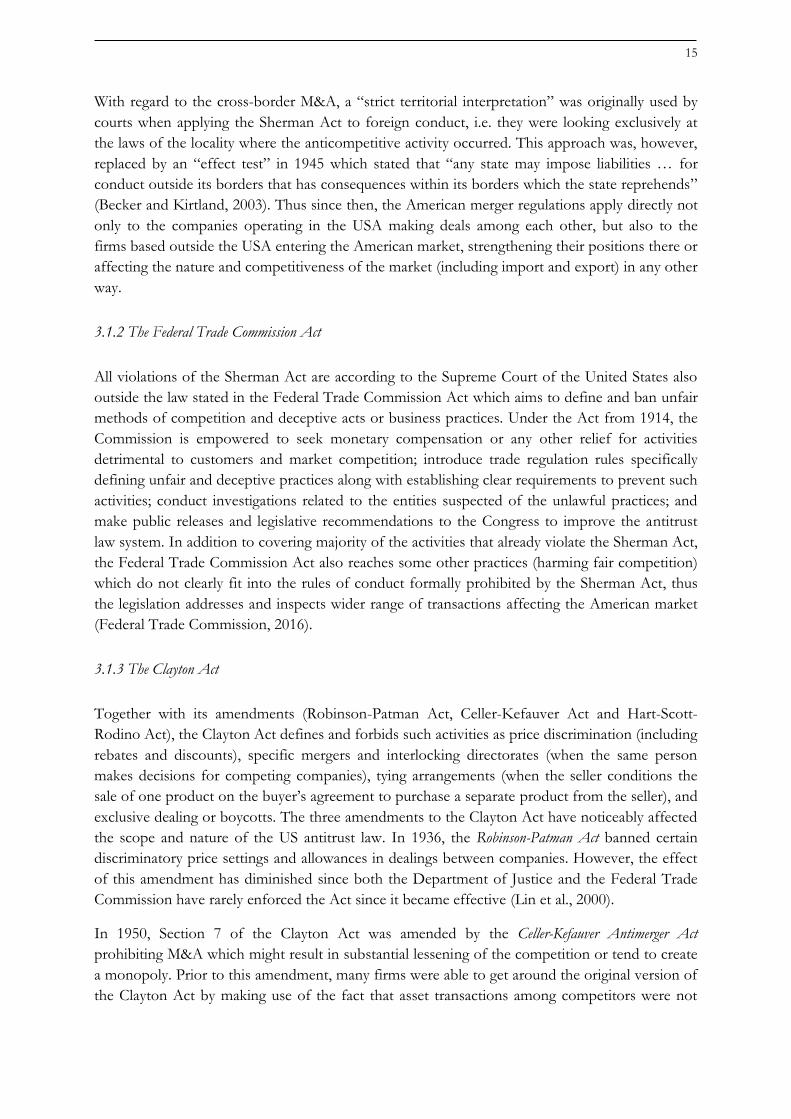
Table 2 contains the amounts of cases that were subject to one of the Commission’s types of the
antitrust law enforcements. These are sorted into four main categories – namely the consent
agreements, federal injunctions, administrative complaints, and civil penalties. The table includes
data for the years spanning from 2003 to the end of 2008, corresponding to the sixth merger
17
wave, compared to the period from 2014 to the end of 2015, reflecting the most recent M&A
activity at the time of writing this paper (and addressed by several authors as the upward-sloping
part of the seventh merger wave). In addition, the percentage shares of the enforcement cases
(that brought any kind of commitments or liabilities to the companies proposing the deal) out of
the total amounts of cases inspected by the authority per each of the examined years are indicated
in the table. All the percentage values were computed by the author of this paper in order to
create an indicator of the US merger-related regulation’s restrictiveness.
Table 2: The Summary of Federal Trade Commission Law Enforcement Cases
(2003 – 2008 and 2014 – 2015)
Enforcement Type for Competition Cases
2003 2004 2005 2006 2007 2008 2014 2015
Consent Agreements
25 13 19 25 19 20 51 51
Federal Injunctions
0 0 3 1 2 4 25 56
Administrative Complaints
5 1 3 0 2 4 5 7
Civil Penalties 0 2 1 0 2 1 2 3
The Sum of the Enforcement Cases
30
(21.9%)
16
(14.4%)
26
(22.2%)
26
(25.7%)
25
(26.6%)
29
(27.6%)
83
(45%)
117
(61.9%)
All Inspected Cases 137 111 117 101 94 105 184 189
Source: Cases and Proceedings of the Federal Trade Commission (2016)
As can be seen in Table 2, the most common method of addressing the uncompetitive behavior
by the Federal Trade Commission is a consent agreement (decree). This way, the Commission can
challenge unfair or deceptive practices and cooperation of companies through maintenance of an
administrative adjudication when it finds a reason to believe that the antitrust law was violated.
The consent decree is then a settlement resolving a dispute between the Commission and the
suspect company, without admitting guilt or liability, specifying the rules or regulation of the
firm’s future activities. Depending on the terms of a particular decree, the company signing the
agreement might be asked to e.g. submit pricing, product, marketing and other business plans to
the Commission for prior review and approval which might increase the probability that the firm
will not finalize the proposed deal that was suspect of causing an uncompetitive market
environment (Epstein, 2014).
18
If the suspect does not agree with the decision and charges issued by the Commission, the
company can make a formal administrative complaint. The Federal Trade Commission’s Complaint
Counsel then conducts the prosecution of the antitrust matter and with its decision it
recommends either entry of an order to cease or dismissal of the complaint. In Table 2, the
figures corresponding to the administrative complaints represent the amount of cases when the
Commission enforced their charges after the complaint trial proceeding.
When the Commission has a reason to believe that some companies or their combination are
violating a provision of the antitrust law, it may issue a preliminary or permanent injunctions not
only barring unlawful practices but also imposing various kinds of monetary remedies (such as
the refund of overcharges attributable to collusive price fixing) to redress past violations and
deter other companies from similar activities. As can be seen in Table 2, the amount of deals
subject to the federal injunction orders has recently increased compared to the cases examined
during the sixth merger wave (Federal Trade Commission, 2016).
Lastly, if any companies fail to comply with the provisions of the antitrust laws described above
(such as merging without observing the requirements of the Clayton Act), the Commission may
seek civil penalties which can be as high as USD 10,000 for each day during which the company
violated the law. Since civil penalties are usually also linked to some other enforcement methods
of the Commission (e.g. federal injunctions), the numbers presented in Table 2 for the civil
penalties represent the cases when the Commission ordered the violator to only pay certain
penalty without any further restrictions. If the respondent violates the final order, it is liable to
pay another fine up to USD 16,000 for each violation (Federal Trade Commission Act, Section
5(1), 15 U.S.C. Sec. 45(1)).
To summarize the previous paragraphs, it can be seen that the total amount of deals subject to
the Federal Trade Commission regulation and orders has recently noticeably increased as
compared to the figures for the last merger wave. In addition, by observing the data from 2003 to
2008, it can be noticed that towards the end of the sixth merger wave, there was a gradual
increase in the percentage of deals with further liabilities or requirements set by the US antitrust
authorities before the transaction could be finalized. This suggests that at the top of the wave,
more M&A deals are penalized or prohibited which is in line with Galli and Pelkmans (2000) who
claim that in the later stages of a merger wave, regulatory bodies tend to enforce the merger
control mechanisms more strictly because they learn their lesson from deterrent examples of
deals allowed at an earlier stage of the merger wave with an undesirable eventual outcome. Even
more significant growth trend can be noticed in the data for 2014 to 2015 with their peak at more
than 60% of all deals examined by the Commission being subject to orders and penalties issued
by the authority. This can be seen as a sign of the economy currently moving towards the top of
a potential seventh merger wave (Lam, 2016).
19
3.2 Merger Regulation in the EU
The original version of the European Merger Regulation came into force in September 1990,
introducing the first legal framework for the systematic review of M&A and other forms of
concentration into the EU Competition Law. After a series of amendments and wide-ranging
consultation exercise initiated in 2001, the EU Merger Regulation was replaced by the current
revised version (Council Regulation (EC) No 139/2004) which has been effective since May
2004. The new EU Merger Regulation has become the fundamental EU legislation for the
control of proposed M&A transactions and for its interpretation, notices and guidelines released
by the European Commission play an important role. The main purpose of the regulation is to
prohibit M&A deals which would significantly reduce competition in the EU market by e.g.
creating or strengthening dominant players that would likely harm consumers by raising prices
and deter competitors with less market power (European Commission, 2016).
3.2.1 Criteria for the EU Merger Regulation to Apply
In general, the EU Merger Regulation applies to any concentration (referring to mergers,
acquisitions of control and creation of full-functioning joint ventures) having, or being assumed
to have in the future, a so called EU dimension. For an M&A deal to have such dimension, it has
to reach certain thresholds which are in their nature purely jurisdictional. Since the thresholds are
applied to transactions regardless any specific competition issues, the nationality of the bidder or
the target, the country where the transaction takes place or the law applicable to the transaction,
the EU Merger Regulation can in fact apply in some cases to deals with little connection to the
EU (Slaughter and May, 2015).
There are two sets of criteria that to a certain point limit the EU Merger Regulation since at least
one of these has to be fulfilled for the deal to be found relevant and thus inspected by the
European Commission under the terms of the EU merger control. First, the original thresholds for
EU dimension (dating back to 1990 and still remaining in force) define three tests that have to be
met by the potentially examined deals:
(1) worldwide turnover test
(2) EU-wide turnover test
(3) two-thirds rule
From the worldwide perspective, the combined turnover of all companies involved in the
concentration has to be more than EUR 5,000 million while with respect to the EU market, each
of at least two of the companies concerned has to have an EU-wide turnover of more than EUR
250 million. Additionally, the deal is considered to have the EU dimension only if each of the
companies participating in the transaction achieved more than two thirds of its EU-wide turnover
in one and the same EU member country.
Second, deals that do not fulfill some of the original thresholds can still be assigned the EU
dimension status (and thus be inspected by the Commission) if they meet all of the alternative
thresholds for EU dimension created to extend the European Commission’s list of reviewed mergers.
This extension covers mainly the deals that would otherwise be subject to the merger control by
20
at least three National Competition Authorities (NCAs) in the EU. Thus, the alternative
thresholds consist of modified and additional tests as compared to the original ones. The criteria
needed to be met by the transactions are as follows:
(1) lower worldwide turnover test
(2) lower EU-wide turnover test
(3) additional three member states test
(4) two-thirds rule
In the case of the alternative thresholds, the requirement regarding the combined worldwide
turnover of all companies concerned is lowered to EUR 2,500 million and the minimum EU-
wide turnover of each of the parties has to be EUR 100 million. The two-third rule for EU
dimension stays the same for both the original and alternative thresholds. Regarding the “three
member states” test, two additional conditions have to be met for the deal to become subject to
the EU Merger Regulation. First, the combined national turnover of all companies involved in
the concentration has to be more than EUR 100 million in each of at least three EU member
countries, and second, each of at least two of the companies has to have national turnover higher
than EUR 25 million. The turnover of the companies considered in the criteria, regardless of the
set of thresholds used, is calculated from the sales of products and the provision of services
(according to the geographical location of the customer) after sales rebates, value added tax and
other taxes related directly to the turnover (Slaughter and May, 2015).
As the primary European legislation with respect to merger control, the EU Merger Regulation
sets conditions necessary for either the European Commission or the NCAs to have jurisdiction
over the proposed concentrations. In the vast majority of cases, the Commission investigates
larger deals having the EU dimension status while the NCAs are assigned to screen and examine
(in accordance with their national merger control rules) those smaller transactions not fulfilling
some of the criteria defined by either the original or alternative thresholds. However, there are
several procedures under which the involved companies can apply for reallocation of the
jurisdiction between the Commission and the NCAs under the terms of a pre- or post-
notification agreement with the authorities giving the companies, under certain limited
circumstances, the opportunity to choose the most appropriate authority and legislation applied
in their cases (European Commission, 2016).
A flowchart summarizing all the thresholds and criteria needed to be satisfied for the EU Merger
Regulation to apply can be found in Appendix A.
3.2.2 The EU Merger Regulation Notification, Investigation and Penalties
In principle, all companies are obliged to notify transactions falling under the EU Merger
Regulation to the Commission which has to approve the deal and declare that it is compatible
with the relevant market before it is allowed to be finalized and implemented. To make the
process easier and less time consuming for the companies, all the necessary requirements,
guidelines, prepared templates and forms needed to be completed while notifying a deal (based
on its complexity) are included in a single document, the Implementing Regulation, which is
publicly available on the European Commission websites along with a number of Notices
21
explaining the mechanisms and application of the Merger Regulation regime by the Commission.
In addition, all significant Merger Regulation notifications and decisions are published, in
conformity with the EU transparency objectives, providing valuable insights into the
Commission’s past decisions and enabling third parties to comment on the content (Slaughter
and May, 2015).
For the proposed M&A transactions of companies not operating in the same or related markets
or not exceeding certain market share thresholds, both the notification and the review of the deal
is usually done by a simplified procedure. The market share thresholds relevant for the EU
Merger Regulation state that the companies with combined market shares lower than 15% on the
market where they both compete (horizontally related) or with market share of less than 25% on
vertically related markets can make use of the simplified inquiry process. In the case of deals
between companies with combined market share above the mentioned thresholds, the
Commission runs full investigation which can consist in two phases. Historically, more than 90%
of all examined cases have been resolved during the Phase 1 investigation which gives the
Commission 25 days to properly analyze the transaction. Although generally the deals are cleared
without any remedies, some conditions or requests can be included in the Phase I review. These
are usually based on e.g. asking the companies to provide some additional information, or
clarifying the relevant market position and role of the companies involved in the proposed M&A.
If the Commission finds any competition concerns during their Phase I merger analysis, the
dealing companies can offer remedies, usually in a form of proposing certain modifications to the
proposed deal that would guarantee fair competition on the market. If the remedies are accepted
by the Commission, the merger is approved but the companies are obliged to comply with the
stated conditions (European Commission, 2016).
In addition to the remedies proposal and approval, there are two main conclusions of the Phase I
investigation, namely an unconditional clearance (if no impediment is found to an effective
competition potentially caused by the deal) or opening of a Phase II investigation. During the
Phase II analysis of the merger’s effects on competition and consumers, the Commission aims to
gather more extensive information (including companies’ internal documents and reports,
detailed questionnaires to market participants etc.) and further analyze the claimed efficiencies
potentially achieved by the companies after the deal would be finalized. If the merging parties can
prove that the efficiencies are merger specific (cannot be achieved by other means than by a
merger), verifiable (can be materialize and substantial enough) and passed-on to consumers, the
Commission may decide to clear the merger unconditionally. If, on the other hand, the
Commission concludes that the planned transaction would likely impede competition, it informs
the companies about its conclusions in a statement of objections which can result in either
conditional clearance (setting remedies necessary to be satisfied to correct the likely competition-
distortion effect of the deal before it is implemented) or final prohibition of the transaction if no
adequate remedies to the competition concerns are offered by the involved companies (European
Commission, 2016).
According to the wording of Article 14 of the EU Merger Regulation (2004), the parties
concerned in a proposed M&A deal may be charged a fine up to 1% of the aggregate turnover of
the companies if they intentionally or negligently supply incorrect, incomplete or misleading
information during the mandatory notification process or in response to any Commission’s
22
request. The same penalty applies for companies providing the requested records and other
documents in an incomplete form during the inspection and investigation conducted by the
Commission. In more severe cases, with respect to the EU Merger Regulation legislation, fines
not exceeding 10% of the overall turnover of the involved companies may be imposed – more
specifically, when the parties implement the proposed concentration without prior mandatory
notification (unless they are expressly authorized to do so) or in breach of the EU law; proceed
with a deal declared incompatible with the common market; or fail to comply with any measure,
condition or obligation ordered by the Commission’s decision. However, the size of the fine may
defer between cases regarding the nature, gravity and duration of the infringement. Based on the
Article 15 of the EU Merger Regulation (2004), additional penalty payments of up to 5% of the
average daily aggregate turnover of the companies concerned can be enforced by the
Commission for each day of delay mainly in order to compel them to provide complete and
correct information already requested by the authority, or comply any measure or obligation
imposed by the Commission’s decision.
3.2.3 The EU Merger Regulation Statistics
Since the implementation of the initial version of the EU Merger Regulation in 1990 until the end
of April 2016, the Commission has been notified about 6,163 transactions potentially harmful to
the relevant market competition and customer welfare. According to the European Commission
statistics (2016), only 127 of those deals (2.1%) were withdrawn by the companies concerned
after the Phase 1 investigation procedures run by the European Commission and 39 after the
Phase 2 (.6%). Regarding the number of conditional clearance cases, 376 proposed M&A
transactions (6.1%) have been allowed but subject to post-merger commitments, of which 259
were conditionally cleared after the first stage of the European Commission’s investigation and
117 based on the decision made after the further analysis during the Phase 2 procedure. Finally,
as little as 24 deals (.4%) have been prohibited over the more than 25 years of the EU Merger
Regulation being in force.
In Table 3, the data regarding the Commission’s decisions with respect to the merger control and
the EU common market competition objectives are summarized for the period of the sixth
merger wave compared to the current period of time (similarly to Table 2 for the US merger
regulation). For each year, the total amount of cases conditionally cleared by the authority (after
either Phase 1 or Phase 2 inspections) is provided as an indicator of the level of restrictiveness
applied by the EU Merger Regulation with respect to the corporate M&A activities. After such
clearance, the parties may proceed with the proposed deals but at the same time have to comply
with certain conditions (such as divesture of specific businesses after the merger completion or
committing to certain post-merger rules of their corporate behavior) which might limit their
future activities or go against their business strategy to such an extent that they would rather
withdraw the notification of the proposed concentration leading them to back out of the deal
(Slaughter and May, 2015).
Next, the sum of the M&A transactions not completed after the investigation run by the
European Commission is included in the table reflecting the effect of the EU regulation on the
pre-merger failure of certain deals. The reasons why the cases were not finalized consist of the

23
M&A notification withdrawal by the companies themselves (in reaction to the Phase 1 or Phase 2
Commission decision) and the concentration prohibition by the Commission because of the
competition disruption concerns connected to the deal. The amounts of cases with such
decisions can be found in Table 3 along with the total number of M&A cases notified by the
European Commission per each of the examined years. Additionally, the table contains the
percentage representation of each of the decision types within the total number of examined
deals.
Table 3: The Summary of the EU Merger Regulation Decisions
(2003 – 2008 and 2014 – 2015)
The Amount of Cases According to the Type of the EU Decision
2003 2004 2005 2006 2007 2008 2014 2015
Deal Conditional Clearance after Phase 1 or Phase 2 Investigation
17
(8.1%)
16
(6.5%)
18
(5.7%)
19
(5.5%)
22
(5.3%)
24
(6.9%)
17
(5.6%)
20
(5.9%)
Deal Withdrawal after Phase 1 or Phase 2 Investigation
0 6
(2.4%)
9
(2.8%)
9
(2.5%)
7
(1.7%)
13
(3.7%)
6
(2%)
8
(2.4%)
Deal Prohibited after Phase 1 or Phase 2 Investigation
0 1
(.4%) 0 0
1
(.2%) 0 0 0
Sum of the Deals Not Completed after the EU Investigation
0 7
(2.8%)
9
(2.8%)
9
(2.5%)
8
(1.9%)
13
(3.7%)
6
(2%)
8
(2.4%)
Sum of the Deals Penalized or Not Completed
17
(8.1%)
23
(9.3%)
27
(8.5%)
28
(8%)
30
(7.2%)
37
(10.6%)
23
(7.6%)
28
(8.3%)
All Notified Deals 211 247 318 356 402 348 303 337
Note: All the percentage values were .computed by the author.
Source: EU Merger Regulation Statistics of the European Commission (2016)
As can be seen in the summary of the EU Merger Regulation decisions, lower percentage of the
notified M&A deals were approved with additional commitments (certain post-merger rules of
24
the firms’ corporate behavior) towards the top of the sixth merger wave in Europe. While at the
beginning of the wave (in 2003) 8.1% of all the notified deals received such decision after the
Commission’s investigation, in the middle of the wave (in 2005 and 2006) the figure dropped to
5.6% on average. However, at the top of the sixth merger wave (in 2008), the number went up
again. Specifically, 6.9% of the total amount of deals were penalized or subject to compliance
with special requirements stated in a conditional clearance provision issued by the EU Merger
Regulation authorities. The data for the deals not completed (the sum of the deals withdrawn or
prohibited) in response to the EU investigation procedures exhibit a similar trend towards the
end of the sixth merger wave, ranging from 2.8% of the examined deals being not finalized in
2004 and 2005 to 3.7% in 2008. This implies that towards the top of a merger wave, more M&A
deals are further disciplined by the regulation authorities, as suggested by Galli and Pelkmans
(2000) and the US Federal Trade Commission’s merger control decisions.
3.3 Comparison of the EU and US Merger Control Mechanisms
This section of the paper serves as a summary of the key differences and similarities of the EU
Merger Regulation and the US antitrust laws applied to the merger control issues relevant for this
paper. Since the empirical analysis in Section 6 studies how the probability of pre-merger failure
of a deal is affected by the level of restrictiveness and nature of the M&A regulation along with
the changes in its enforcement corresponding to the course of a merger wave, the following
paragraphs are focused mainly on those differences between the two legislations which are
relevant for the econometric model.
First, comparing the US Federal Trade Commission and the European Commission decisions
concerning the antitrust and competition laws linked to the merger control, an opposite trend in
the regulation of the proposed deals during the global sixth merger wave can be observed in
Table 2 and Table 3. While in the EU, the percentage of the penalized or prohibited deals
decreased every year towards the top of the wave, in the US the figure increased annually.
However, the restrictiveness of the EU regulation (defined as the percentage of deals penalized
and prohibited) suddenly increased and reached its peak in 2008, the very top of the sixth merger
wave. Thus, the observations for both the US and EU transactions are in line with the studied
literature since Galli and Pelkmans (2000) claimed that towards the end of a merger wave, the
M&A regulation is expected to become stricter.
Second, it is important to note that, in contrast to the US antitrust laws, none of the decisions
and penalties enforced by the European Commission under the merger control mechanisms are
of a criminal law nature. Hence, they might be less deterrent for the companies planning an M&A
and lead to a lower amount of pre-merger deal withdrawals (Levy, 2004), and thus to a lower
probability of pre-merger failure analyzed in this paper.
Last but not least, as can be seen in Table 2 and Table 3, the percentage shares of penalized or
prohibited deals in all notified and examined cases are significantly different in the EU and the
USA within the whole studied period of time. More specifically, the highest share of such cases
exceeds 60% in the USA whereas in the EU it peaks at 10.6%. In addition, the fact that only 24
out of 6,163 notified deals were forbidden over the 25 years of the EU Merger Regulation can
25
make companies less concerned about the potential impact of the European Commission’s
investigation decision on the future of the proposed transaction. According to Phillips (2013), a
higher number of deterrent examples of prosecution and penalization related to the M&A
regulation may increase the amount of pre-merger deal withdrawals. Thus, according to the data
available, it is expected that the deals with a US target have a higher probability of pre-merger
failure than the European ones. In Section 6, the logit model analysis will examine this
relationship in detail.
26
4 Takeover Defense Tactics
The variety of legal takeover defense strategies available for companies’ managements to prevent
unwanted mergers or acquisitions differs between the American and European corporate culture
and governance systems. In this part of the paper, the basic characteristics and impacts of the six
most commonly used defense tactics are described. These include tools such as dual-class shares,
employee share ownership plans (ESOP), shareholder rights plans (poison pills), golden
parachute, staggered board of directors and greenmailing.
4.1 Dual-class Shares
A dual-class stock structure of a company’s shares refers to the issuance of two (or more) types
of shares differing in the voting rights and priority dividend payments connected to them. The
companies making use of such a stock structure usually distinguish between one class of shares
which is available publicly to all investors and the other share class that is offered to the company
founders, executive managers and other large stakeholders. The stock offered to general public
(usually called class A shares) has then fewer voting rights than the other one (usually referred to
as class B shares). Such a move can provide more power to certain individuals within the
company to keep the majority control over the firm helping them protect it from takeovers or
similar unwanted M&A activities of others (Magnan and Khalil, 2007).
As an example of the use of such a defense strategy in practice, it is argued by Smith et al. (2013)
that licensed firms have great incentives to protect themselves by the dual-class stock issuance. In
the industries highly regulated by the government license provisions, such as broadcasting and
cable industries, takeover of an existing company is often the only possible way to enter the
market. Thus, there is a relatively high amount of proposed M&A deals in these industries that
fail during the negotiation period due to the fact that the potential acquirers were not able to
obtain enough shares to gain control over the target company.
In the USA, the popularity of dual-class shares has noticeably increased within the last 15 years
after such activities were largely banned by the New York Stock Exchange (NYSE) from 1940
until 1980s and allowed again in 1988 when a lot of companies sought to shield themselves
during the hostile takeover era. Even though the Securities and Exchange Commission (SEC) has
adopted a rule prohibiting already listed companies to convert their single-class shares to the
dual-class ones, newly listed companies are allowed to freely use this defense tactics and they
commonly make use of this opportunity (Teen, 2015). On the contrary, the European corporate
governance and culture is rather not in favor of such a stock structure mostly because it is seen as
an unfair practice (with respect to public shareholders) which overly empowers the company’s
executives owning the privileged shares. In the Netherlands and other continental European
countries, the defense strategy has been legal but not used as often as in the USA. In the UK, the
tactics has been discouraged by institutional investors’ opposition almost to the point of total
disappearance (Smith et al., 2013).

27
4.2 ESOP (Employee Share Ownership Plans)
Employee share ownership plans are arrangements between a company’s managers and
employees based on trust. In case of a hostile takeover threat, the company’s managers can use
ESOP to allocate a certain amount of shares to the employees, who are considered to be a
friendly party, and thus prevent the company to be taken over. Often, the company’s stock
ownership is provided to the employees as part of their remuneration for work performance and
held in an ESOP trust until the employee retires or leaves the company. This way the company is
able to keep control over the certain number of shares provided to the employees and make it
more difficult for other parties to acquire sufficiently large stake in the firm (NCEO, 2016).
In the USA, ESOP has been by far the most popular form of corporate employee ownership. By
2014, more than 7 000 companies applied ESOP covering around 13.5 million employees
(NCEO, 2016). In the UK, employee share ownership has been promoted by the government
over the last 5 years and the popularity of this corporate ownership structure is currently
increasing (The Guardian, 2012). In the Netherlands, the number of companies providing their
employees with share ownership has grown as well over the last decade. For example, in 2007,
62.5% of companies listed on the Amsterdam stock exchange offered such programs as ESOP or
various kinds of employee financial participation schemes. The popularity of this defense strategy
in Europe is, however, not as high as in the USA (Wilke, 2014).
4.3 Poison Pills
Another practice adopted by managements of companies concerned about hostile takeover by
other firms is a shareholder rights plan, or so called poison pills, that represent wide range of
activities aiming to make it more difficult for a hostile bid to be successful. Such activities include
e.g. providing the existing target shareholders with a right to either subscribe at a heavy discount
to additional shares of the target or purchase shares of the acquirer at a discount after the merger;
and adding terms in the corporate directives that delay or set another barriers to the voting
process needed for change in management and corporate ownership structure (Sudarsanam,
2003).
In the UK, the use of poison pills as a defense strategy is not very popular and is constrained by a
number of factors. Especially an issuance of company’s shares or options to buy them at a
discount to impede unwanted M&A activities of other firms would not be regarded as a proper
use of corporate powers in the UK (Kastiel, 2014). Nevertheless, this is not the case in the
continental Europe (especially in the Netherlands) and the USA since such tactics are commonly
used in both of the regions. In the USA, poison pills occur mainly in the form of granting current
target shareholders an option to acquire preferred stock during the pre-merger period either at
the target (decreasing the amount of stock available for the bidder) or at the acquirer (diluting the
equity interest of existing acquirer shareholders who are not permitted to participate). However,
the inner mechanism of the Dutch type of poison pill is fundamentally different from the
American one. In the Netherlands, a Dutch foundation (stichting) is granted the option to
subscribe for preferred stock (at the price far below the market value) that typically holds the
voting power equivalent to the one of all target’s ordinary shares outstanding. Thus, the Dutch

28
poison pill usually leads to the failure of hostile bids “not by threatening them [the bidders] with
economic dilution, but by preventing them from acquiring voting control or electing allies to the
board” (UKSA, 2016).
4.4 Golden Parachute
This takeover defense strategy involves a large payment or any other financial compensation
guaranteed usually to a company’s executive if he or she should be dismissed as a result of a
merger or takeover. Thus, the tactics is used in order to make the acquisition of the target
company less attractive for the bidders once they find out that they would be obliged to pay
massive bonuses to the executive managers in order to achieve the desired post-takeover change
in control of the bought company (Sudarsanam, 2003). While in the USA, golden parachutes are
very common and generous (with respect to the executives and the amount of money paid to
them if their contract is terminated after the target company is taken over), the continental
European corporate culture has not adopted this kind of takeover defense in a large extent yet. In
the UK, several cases of merger-related windfalls for executives can be found but they are much
less popular than within the American companies (Bryant and Massoudi, 2015).
4.5 Staggered Board Amendments
Especially in the USA, staggered board amendments are a prominent practice in the corporate
law governing the leadership structure of a company. They refer to the situations when the terms
of the board of directors are set so that only a small part (usually one third), or at least less than
one half, of the directors may be elected during a period of one year. In practice, there are usually
several groups of directors which are each elected at a different time making it impossible for a
potential acquirer to change the whole board of directors within a short period time right after
the takeover (Sudarsanam, 2003). Once the majority of the company’s shareholders approve such
a rule affecting the dynamics of changes in the corporate structure and management, the
amendment can be implemented in the corporate bylaws and potentially used as a defense tactics
against undesirable takeover attempts by other companies.
As opposed to the American corporate structure, under the Dutch corporate law, it is common
to provide directors with four-year terms (in contrast to the one-year period typical for the US
companies) and unlike the US-style staggered boards, the directors of Dutch companies can be
removed by shareholder at any time for any reason within their term of office (Chazen and
Werdmuller, 2015). Similarly, company laws and corporate governance guidelines in the UK have
been preventing the occurrence of any type of staggered boards. Under the British guidelines, all
company directors must be reelected annually and fixing the composition of the board is not
possible in any way. Thus, the target board of directors has usually limited responsibilities in the
UK, performing mainly an advisory role, in contrast to the US-based gatekeeper role with respect
to any external M&A offers (Kastiel, 2014).
29
4.6 Greenmail
The last strategy discussed is a greenmail. This term stands for a defense against a hostile
takeover threat by an unfriendly party that holds a large stock in the target company. In such a
situation, the target is forced to repurchase its company’s shares from the so called corporate
raider (a company or an individual who owns the majority share in the target) in order to keep
control over its own company and halt the takeover bid. This repurchase is made at a substantial
premium (the greenmail payment) benefiting the threatening bidder. The target company can also
decide by itself to pursue the greenmail defense – to buy back a large amount of stock acquired
by a potential raider – in order to prevent any future takeover attempt. Ordinarily, the greenmail
payment is connected with an agreement that the raider will not initiate or continue in bidding for
control of the target (Sudarsanam, 2003).
In the USA, this tactics has been effectively reduced over the last two decades, mostly due to the
amendment to the US Internal Revenue Code which sets 50% tax on greenmail profits as a form
of punishment of such corporate behavior. The main reason for restriction of greenmail
payments was the fact that due to the high premium paid for the shares over the initial purchase
price, the target shareholders often lost out even if a hostile takeover was avoided (Huntsley,
2012). Regarding the UK corporate practice, the greenmail measure is still currently used by some
target companies (even though its popularity has declined since the 1990s) as some bidders
intentionally buy majority stakes of companies in order to achieve the greenmail payment and are
willing to proceed with a takeover attempt in case of not receiving it (Pearce and Robinson,
2004). In the Netherlands, there is a discussion on the matter whether such repurchase
transactions as greenmailing should be open or not to shareholders through a Dutch tender offer
or another buyback arrangement. In general, the investors engaging in such practices are
perceived as opportunistic and not genuine in their goal to act in shareholders’ interests. Hence,
greenmail has been rarely used as a defense strategy in the Netherlands over the last decade
(Noked, 2014).
4.7 Comparison of the US, UK and Dutch Defense Tactics
Table 4 summarizes the differences in the popularity and legality of the examined takeover
defenses between the three key players in the global M&A transactions – the USA, the UK and
the Netherlands – within the last approximately 13 years. Since there is not enough data regarding
the amounts of deals blocked by the specific corporate control strategies, a scale from 1 to 3 was
created in order to quantify the level of the use of the tactics in each of the regions. Rank 1
corresponds to illegal or rarely used defense strategies; rank 2 refers to legal but not very
frequently applied activities; and rank 3 stands for commonly used tactics. Such a basic
measurement scale allows us to generally compare the takeover defense systems in the countries
of interest.
As can be seen in the table, the USA scored the highest rank in every category except for one
(greenmail) and thus also the highest overall rank (sum of the ranks for each of the defenses)
suggesting (1) that the American corporate governance and legal systems allow companies to
defend themselves against undesirable M&A activities (mostly takeovers) and (2) that the US
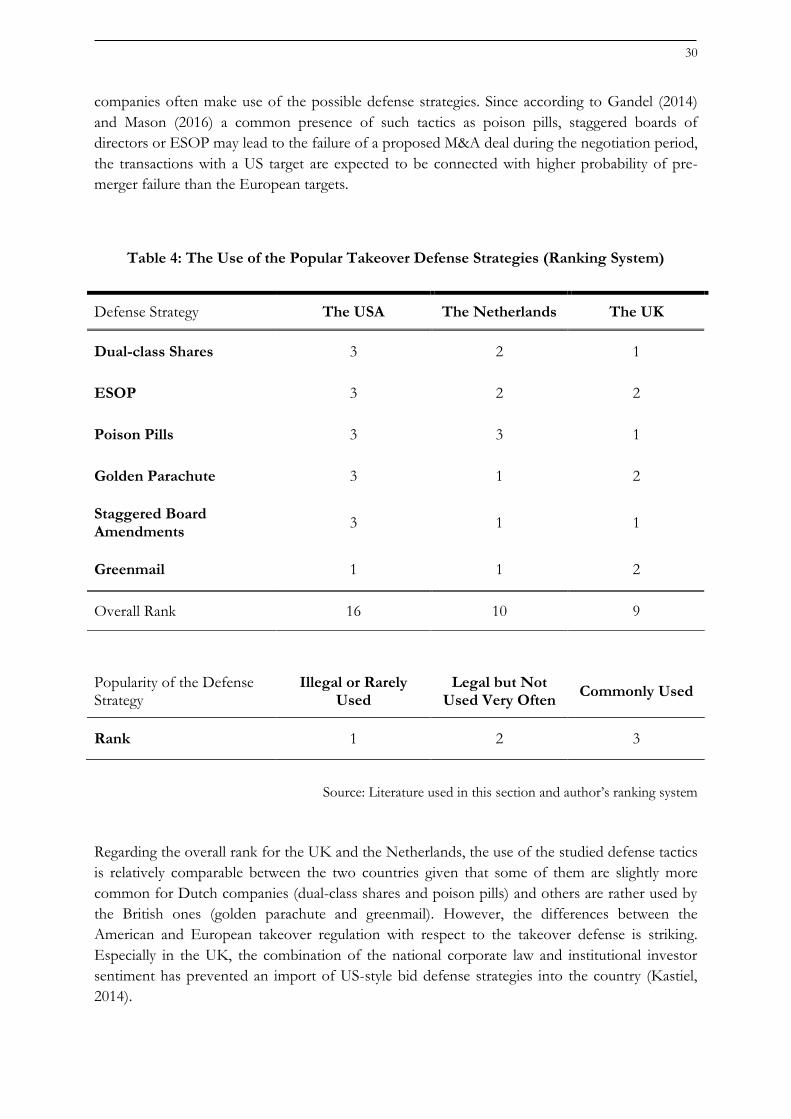
30
companies often make use of the possible defense strategies. Since according to Gandel (2014)
and Mason (2016) a common presence of such tactics as poison pills, staggered boards of
directors or ESOP may lead to the failure of a proposed M&A deal during the negotiation period,
the transactions with a US target are expected to be connected with higher probability of pre-
merger failure than the European targets.
Table 4: The Use of the Popular Takeover Defense Strategies (Ranking System)
Defense Strategy The USA The Netherlands The UK
Dual-class Shares 3 2 1
ESOP 3 2 2
Poison Pills 3 3 1
Golden Parachute 3 1 2
Staggered Board Amendments
3 1 1
Greenmail 1 1 2
Overall Rank 16 10 9
Popularity of the Defense Strategy
Illegal or Rarely Used
Legal but Not Used Very Often
Commonly Used
Rank 1 2 3
Source: Literature used in this section and author’s ranking system
Regarding the overall rank for the UK and the Netherlands, the use of the studied defense tactics
is relatively comparable between the two countries given that some of them are slightly more
common for Dutch companies (dual-class shares and poison pills) and others are rather used by
the British ones (golden parachute and greenmail). However, the differences between the
American and European takeover regulation with respect to the takeover defense is striking.
Especially in the UK, the combination of the national corporate law and institutional investor
sentiment has prevented an import of US-style bid defense strategies into the country (Kastiel,
2014).

31
5 Hypotheses Formulation
For the purpose of the empirical analysis in Section 6, three main hypotheses are stated in this
section. Based on the literature review in Section 2 and the theoretical Section 3 and Section 4,
the US nation of the target (represented by the dummy variable US described more in detail in
the following section) with its more restrictive and unclear merger-related legislative environment
is expected to be negatively associated with the probability of M&A deal completion (represented
by the dummy variable Completed which is also further discussed in the following section). In
other words, the M&A deals with US targets are expected to perform higher level of failure
during the pre-merger stage of the deal negotiation. This leads us to formulate the first
hypothesis for the empirical analysis in a following way:
H1: The coefficient β1 on the target nation dummy variable in the logistic model equation
below is expected to be lower than 1 since the US-targeted M&A deals are expected to have
lower probability of completion than the European ones.
𝑙𝑜𝑔𝑖𝑡(𝑃(𝐶𝑜𝑚𝑝𝑙𝑒𝑡𝑒𝑑 = 1|𝑈𝑆)) = 𝛽0 + 𝛽1𝑈𝑆
As addressed in Section 2, based on the availability of data regarding the country-specific merger-
related legislation and regulation systems, four main factors, namely the restrictiveness of merger
regulation, government effectiveness, number of procedures needed to enforce a contract
between two companies and time required to enforce such contract (described by the variables
Regulation, GovEffect, ProcToEnfor and TimeToEnfor, respectively) are included in the analysis and
expected to be the mediators of the relationship between the target nation and the probability of
completion. Thus, they are assumed to explain the causes of the examined relationship. This
leads us to formulate the second hypothesis for the empirical model as follows:
H2: The variables Regulation, GovEffect, ProcToEnfor and TimeToEnfor are expected to be
mediators of the relationship between the US target nation (represented by the variable US)
and the probability of deal completion (represented by the variable Completed). While higher
levels of Regulation, ProcToEnfor and TimeToEnfor are assumed to be associated negatively
with the deal completion, the opposite effect is expected for GovEffect.
Lastly, based on the literature reviewed in the previous sections regarding the effects of the
merger wave stage at which the transaction is negotiated on the probability of a deal completion,
the third hypothesis for the logistic regression model is formulated:
H3: The coefficient on the interaction term between the variables US and WaveTop
(US_WaveTop) is expected to be negative and lower than 1 in the equation below implying
that the variable WaveTop has a negative moderating effect on the examined relationship.
𝑙𝑜𝑔𝑖𝑡(𝑃(𝐶𝑜𝑚𝑝𝑙𝑒𝑡𝑒𝑑 = 1|𝑈𝑆)) = 𝛽0 + 𝛽1𝑈𝑆 + 𝛽2𝑈𝑆_𝑊𝑎𝑣𝑒𝑇𝑜𝑝

32
6 Logit Model Analysis
In order to analyze the influence of the M&A target’s nation and the time period when the
transaction is announced and negotiated on the probability that it would be either successfully
completed or it would fail during the pre-merger deal-making process, logistic regression (logit)
model analysis is conducted in this section of the paper. The methodology, along with the
gathered data and key variables, is described in the subsections below.
6.1 Methodology
The logit model approach was chosen for the purpose of the analysis since it is one of the most
suitable methods for prediction of a dichotomous outcome, or in other words, if there are only
two values that the dependent variable can obtain. The logistic regression models a logit-
transformed probability as a linear relationship between the dependent and independent variables
(Hosmer et al., 2013). More formally, for y being the binary outcome variable and P being the
probability that 𝑦 = 1 given the set of predictor variables x1 … xk, the logistic regression of y on
x1 … xk estimates the values of the parameters β0 … βk via maximum likelihood method of the
equation:
𝑙𝑜𝑔𝑖𝑡(𝑃(𝐶𝑜𝑚𝑝𝑙𝑒𝑡𝑒𝑑 = 1|𝑥1 … 𝑥𝑘)) = log (𝑃(𝐶𝑜𝑚𝑝𝑙𝑒𝑡𝑒𝑑 = 1|𝑥1 … 𝑥𝑘)
1 − 𝑃(𝐶𝑜𝑚𝑝𝑙𝑒𝑡𝑒𝑑 = 1|𝑥1 … 𝑥𝑘)) = 𝛽0 + 𝛽1𝑥1 + ⋯ + 𝛽𝑘𝑥𝑘 ,
where 𝑃(𝐶𝑜𝑚𝑝𝑙𝑒𝑡𝑒𝑑 = 1|𝑥1 … 𝑥𝑘)
1−𝑃(𝐶𝑜𝑚𝑝𝑙𝑒𝑡𝑒𝑑 = 1|𝑥1 … 𝑥𝑘) represents the odds ratio describing how likely the desired
outcome (the value of the dependent variable is equal to 1) is expected to occur with respect to
the alternative (dependent variable is equal to 0) with a unit increase in the explanatory variable.
As an example, if the odds ratio for the successful completion of the deal was equal to .25, the
probability of failure is expected to be 4 times higher than the one of success, or in other words,
there is 80% change that the transaction would fail and 20% chance that it would succeed.
𝑃(𝐶𝑜𝑚𝑝𝑙𝑒𝑡𝑒𝑑 = 1|𝑥1 … 𝑥𝑘)
1 − 𝑃(𝐶𝑜𝑚𝑝𝑙𝑒𝑡𝑒𝑑 = 1|𝑥1 … 𝑥𝑘)=
𝑃(𝐶𝑜𝑚𝑝𝑙𝑒𝑡𝑒𝑑 = 1|𝑥1 … 𝑥𝑘)
𝑃(𝐶𝑜𝑚𝑝𝑙𝑒𝑡𝑒𝑑 = 0|𝑥1 … 𝑥𝑘)=
. 2
. 8= .25
𝑃(𝐶𝑜𝑚𝑝𝑙𝑒𝑡𝑒𝑑 = 1|𝑥1 … 𝑥𝑘) = .2
𝑃(𝐶𝑜𝑚𝑝𝑙𝑒𝑡𝑒𝑑 = 0|𝑥1 … 𝑥𝑘) = .8
The most straightforward interpretation of the logistic regression coefficients is based on the
above described concept of the odds ratio. The standard logit model regression (logit command in
Stata) returns the coefficients on the independent variables in a form of a logarithm of the odds
ratio, log (𝑃(𝐶𝑜𝑚𝑝𝑙𝑒𝑡𝑒𝑑 = 1|𝑥1 … 𝑥𝑘)
1−𝑃(𝐶𝑜𝑚𝑝𝑙𝑒𝑡𝑒𝑑 = 1|𝑥1 … 𝑥𝑘)), ranging from negative to positive infinity. However, in
order to obtain the probability that a specific outcome occurs, ranging between 0 and 1, it is more
33
suitable to compute the odds ratio as it allows the researcher to interpret the probabilities in a
way described above (Hosmer et al., 2013). This transformation can be achieved either by using
an exponential of the log odds coefficients (logit command) or by the command logistic in Stata.
6.1.1 Basic Assumptions for the Logit Model
In contrast to the Ordinary Least Squares (OLS), the most commonly used econometric method
to estimate the outcome in a form of a continuous dependent variable, logistic regression does
not require fulfilment of the key assumptions linked to the linear models, particularly regarding
linearity, normality, and homoscedasticity. First, this approach applies a non-linear logarithmic
transformation to the predicted odds ratio and thus a linear relationship between the dependent
and independent variables is not needed. Second, with a binary dependent variable, the error
variances (residuals) are not assumed to be normally distributed as in the case of OLS regression.
Instead, they more likely follow a logistic distribution. Third, since logistic regression does not
require variances for each level of the independent variables to be equal, the assumption of
homoscedasticity does not have to be tested (Hosmer et al., 2013).
However, according to Long (1997), five basic conditions have to be satisfied when running
logistic regression:
(A.1) the dependent variable must be dichotomous and properly coded (value 1 for the
desired outcome, 0 otherwise),
(A.2) the observations are independent,
(A.3) the sample has to consist of at least 100 observations,
(A.4) only important and meaningful variables should be included in the model (to avoid
over-fitting of the model equation) and no important variables of interest should be
omitted (to prevent under-fitting),
(A.5) and the dependent variable is caused by or associated with the independent variables
which are determined by variables (effects) outside the model equation.
In Section 6.3, the above mentioned assumptions are discussed and tested with respect to the
model regression equation and variables.
6.2 Data Structure and Model Variables
The dataset for the empirical analysis is comprised of 1560 transactions with a Dutch acquirer (or
bidder) and one of the following three nations of M&A targets: British (UK), American (US), or
another Dutch (NL) company. The focus is put on transactions proposed by Dutch bidders since
the Netherlands is one of the most important players in the field with the world highest amount
of money invested in M&A relative to the country’s GDP. The nations of the targets were
chosen based on similar reasoning – the highest volume of deals has been currently made by the
three key players (US, UK, NL) and there is enough data regarding these transactions compared
to other countries.
34
The time period examined by the analysis spans from 2003 to 2015 in order to cover three
groups of data: (1) the sixth merger wave (2003 – 2008) which is expected to affect the pre-
merger deal failure according to the studied literature, (2) the most recent M&A activity (2014 –
2015) which is considered to be an upward-sloping part of a potential seventh merger wave (Lam,
2016), and (3) the years between these two periods as a reference period of time when deal-
making is not affected by any merger wave. The amount of examined deals was set so that for
each of the 13 years (2003 – 2015) and the 3 types of target nations (US, UK, NL), the same
number of transactions was included in the dataset. Since 40 was the lowest amount of deals
proposed within one year (namely 2013) with the US target companies, a random sample of 40
deals per year for each of the three countries was drawn in order for the dataset to be consistent
regarding the amount of analyzed transactions per year and target nation throughout the dataset.
This way the data for 1560 proposed M&A deals regarding their pre-merger failure (prohibition
or withdrawal) or completion were obtained.
In addition, for all transactions with respect to the year and target nation the dataset includes
information concerning (1) the restrictiveness of merger control mechanisms in each of the target
nations, (2) the ease of understanding and implementation of the target nation’s government
policies, (3) the time and (4) number of procedures needed for a company to enforce contracts in
each of the target countries, and (5) whether or not the transaction occurred during the end of a
merger wave. Based on the studied literature, these are the factors that should be the mediator
and moderator variables used in the logistic regression model to help us uncover and explain
some of the possible reasons why the relationship between the target nation and probability of
deal completion exists, or which factors can change the strength or direction of this relation.
6.2.1 The Dependent and Independent Variables
The dependent variable of the empirical model (Completed) is a binary variable with values either 0
(for transactions prohibited or withdrawn during the pre-merger deal-making period) or 1 (for
completed deals). It was chosen in order to indicate the probability of M&A completion
dependent on several country-specific factors while using the logistic regression analysis (logit
model). The data regarding the deal completion were retrieved from the Zephyr M&A database,
the most comprehensive database of deal information, the way described above (including 1560
transactions, three target nations and period of time spanning from 2003 to 2015).
The independent variable of the basic univariate logistic regression model is defined as the nation
of the target company of the proposed deal. Since there are three target nations (US, UK and
NL) in the dataset and the theoretical part suggested that there are little differences between the
UK and the Netherlands regarding the regulation-related factors potentially affecting the deal
completion (such as merger control mechanisms which are harmonized throughout the EU), the
target nation variable is defined as a dummy obtaining the value 1 when the target company is
located in the US and 0 when it is an EU firm (UK and NL). For the regression analysis, the
independent dummy variable is simply denoted as US.

35
Based on the literature review in Sections 2, 3 and 4, the US nation of the target is expected to be
negatively associated with the probability of M&A deal completion. The hypothesis describing
this relationship was stated in Section 5 in the following way:
H1: The coefficient β1 on the target nation dummy variable in the logistic model equation
below is expected to be lower than 1 since the US-targeted M&A deals are expected to have
lower probability of completion than the European ones.
𝑙𝑜𝑔𝑖𝑡(𝑃(𝐶𝑜𝑚𝑝𝑙𝑒𝑡𝑒𝑑 = 1|𝑈𝑆)) = 𝛽0 + 𝛽1𝑈𝑆
6.2.2 The Mediator Variables
The main variable of interest that is expected to partially explain why the relationship between
the target nation and the probability of pre-merger failure exists is called Regulation and is
designed to describe the restrictiveness of the merger control mechanisms which, based on the
reviewed literature, affects the pre-merger deal success. In order to indicate how restrictive the
M&A regulation in each of the examined regions is, the percentage amount of deals penalized,
withdrawn or prohibited (in response to the decisions and orders made by the merger regulation
authorities) is computed with respect to the total amount of deals notified or examined by the
regulatory authority. According to Phillips (2013), De Loecker et al. (2008) and Tsang (2015),
more severe regulation and potential penalties linked to it are expected to have a negative effect
on the M&A deal completion.
Figure 1: Comparison of the US and the EU Merger Regulation Restrictiveness
Source: European Commission (2016) and Federal Trade Commission (2016)
0.00%
10.00%
20.00%
30.00%
40.00%
50.00%
60.00%
70.00%
2003 2004 2005 2006 2007 2008 2009 2010 2011 2012 2013 2014 2015
US
EU
70%
60%
50%
40%
30%
20%
10%
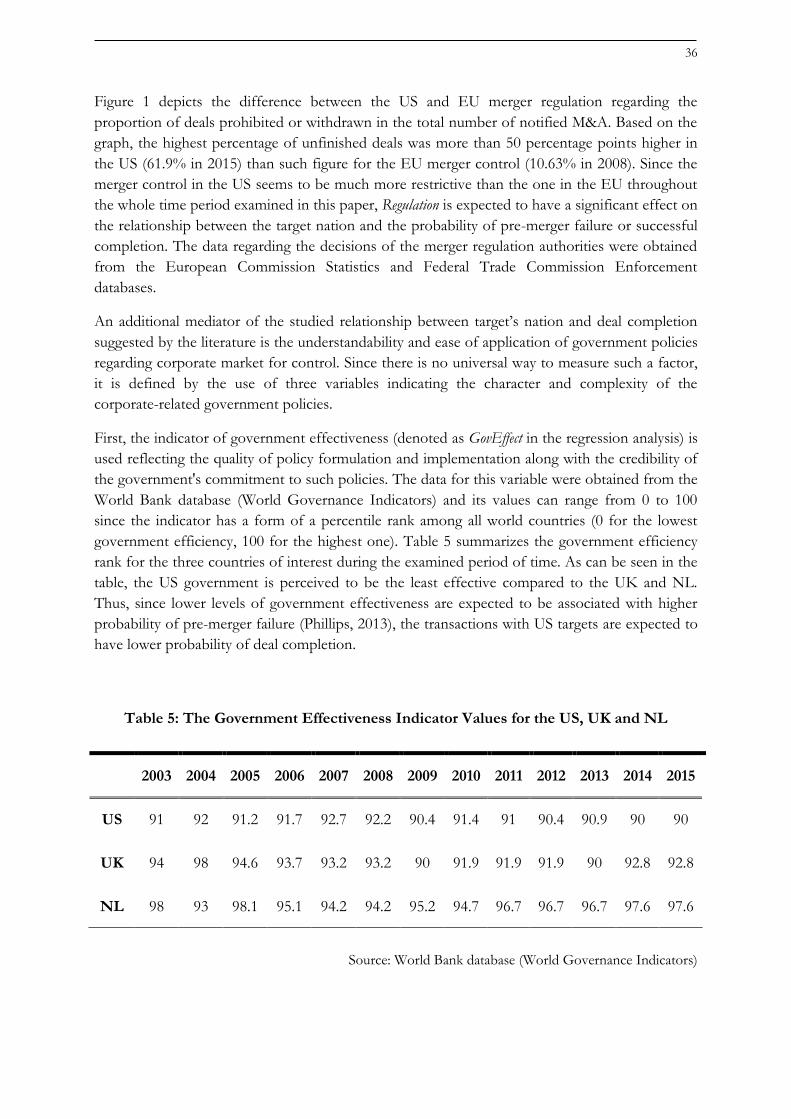
36
Figure 1 depicts the difference between the US and EU merger regulation regarding the
proportion of deals prohibited or withdrawn in the total number of notified M&A. Based on the
graph, the highest percentage of unfinished deals was more than 50 percentage points higher in
the US (61.9% in 2015) than such figure for the EU merger control (10.63% in 2008). Since the
merger control in the US seems to be much more restrictive than the one in the EU throughout
the whole time period examined in this paper, Regulation is expected to have a significant effect on
the relationship between the target nation and the probability of pre-merger failure or successful
completion. The data regarding the decisions of the merger regulation authorities were obtained
from the European Commission Statistics and Federal Trade Commission Enforcement
databases.
An additional mediator of the studied relationship between target’s nation and deal completion
suggested by the literature is the understandability and ease of application of government policies
regarding corporate market for control. Since there is no universal way to measure such a factor,
it is defined by the use of three variables indicating the character and complexity of the
corporate-related government policies.
First, the indicator of government effectiveness (denoted as GovEffect in the regression analysis) is
used reflecting the quality of policy formulation and implementation along with the credibility of
the government's commitment to such policies. The data for this variable were obtained from the
World Bank database (World Governance Indicators) and its values can range from 0 to 100
since the indicator has a form of a percentile rank among all world countries (0 for the lowest
government efficiency, 100 for the highest one). Table 5 summarizes the government efficiency
rank for the three countries of interest during the examined period of time. As can be seen in the
table, the US government is perceived to be the least effective compared to the UK and NL.
Thus, since lower levels of government effectiveness are expected to be associated with higher
probability of pre-merger failure (Phillips, 2013), the transactions with US targets are expected to
have lower probability of deal completion.
Table 5: The Government Effectiveness Indicator Values for the US, UK and NL
2003 2004 2005 2006 2007 2008 2009 2010 2011 2012 2013 2014 2015
US 91 92 91.2 91.7 92.7 92.2 90.4 91.4 91 90.4 90.9 90 90
UK 94 98 94.6 93.7 93.2 93.2 90 91.9 91.9 91.9 90 92.8 92.8
NL 98 93 98.1 95.1 94.2 94.2 95.2 94.7 96.7 96.7 96.7 97.6 97.6
Source: World Bank database (World Governance Indicators)
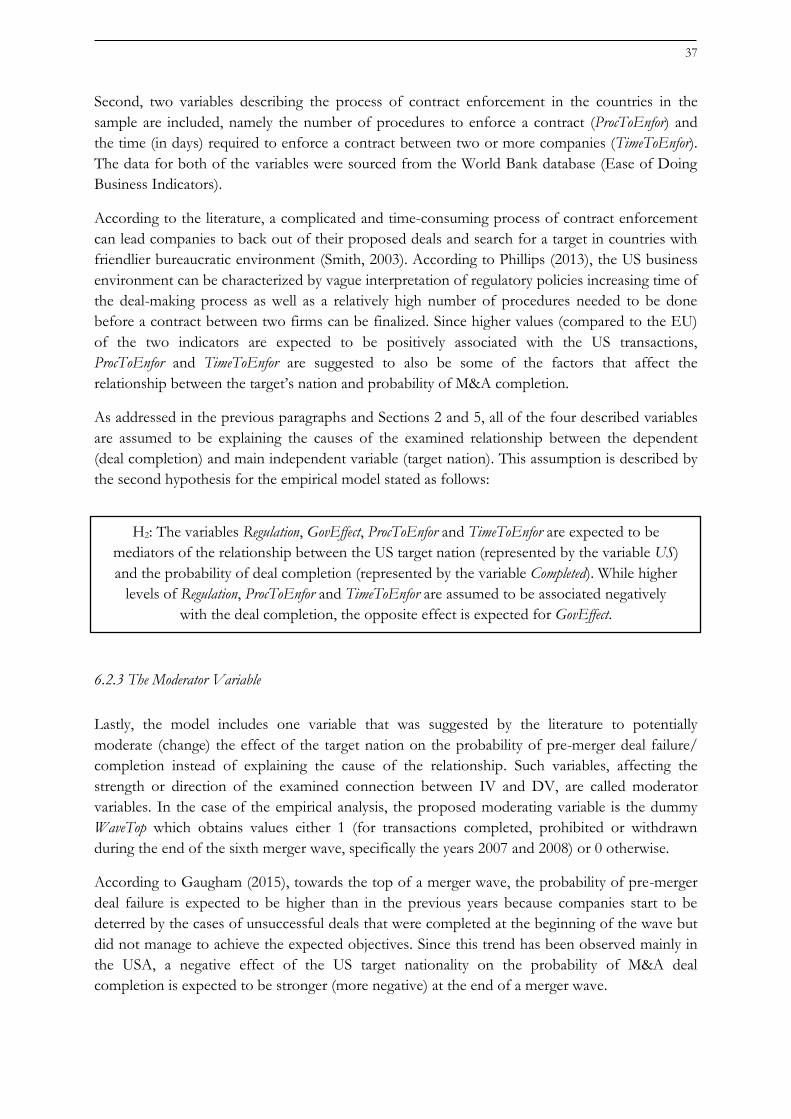
37
Second, two variables describing the process of contract enforcement in the countries in the
sample are included, namely the number of procedures to enforce a contract (ProcToEnfor) and
the time (in days) required to enforce a contract between two or more companies (TimeToEnfor).
The data for both of the variables were sourced from the World Bank database (Ease of Doing
Business Indicators).
According to the literature, a complicated and time-consuming process of contract enforcement
can lead companies to back out of their proposed deals and search for a target in countries with
friendlier bureaucratic environment (Smith, 2003). According to Phillips (2013), the US business
environment can be characterized by vague interpretation of regulatory policies increasing time of
the deal-making process as well as a relatively high number of procedures needed to be done
before a contract between two firms can be finalized. Since higher values (compared to the EU)
of the two indicators are expected to be positively associated with the US transactions,
ProcToEnfor and TimeToEnfor are suggested to also be some of the factors that affect the
relationship between the target’s nation and probability of M&A completion.
As addressed in the previous paragraphs and Sections 2 and 5, all of the four described variables
are assumed to be explaining the causes of the examined relationship between the dependent
(deal completion) and main independent variable (target nation). This assumption is described by
the second hypothesis for the empirical model stated as follows:
H2: The variables Regulation, GovEffect, ProcToEnfor and TimeToEnfor are expected to be
mediators of the relationship between the US target nation (represented by the variable US)
and the probability of deal completion (represented by the variable Completed). While higher
levels of Regulation, ProcToEnfor and TimeToEnfor are assumed to be associated negatively
with the deal completion, the opposite effect is expected for GovEffect.
6.2.3 The Moderator Variable
Lastly, the model includes one variable that was suggested by the literature to potentially
moderate (change) the effect of the target nation on the probability of pre-merger deal failure/
completion instead of explaining the cause of the relationship. Such variables, affecting the
strength or direction of the examined connection between IV and DV, are called moderator
variables. In the case of the empirical analysis, the proposed moderating variable is the dummy
WaveTop which obtains values either 1 (for transactions completed, prohibited or withdrawn
during the end of the sixth merger wave, specifically the years 2007 and 2008) or 0 otherwise.
According to Gaugham (2015), towards the top of a merger wave, the probability of pre-merger
deal failure is expected to be higher than in the previous years because companies start to be
deterred by the cases of unsuccessful deals that were completed at the beginning of the wave but
did not manage to achieve the expected objectives. Since this trend has been observed mainly in
the USA, a negative effect of the US target nationality on the probability of M&A deal
completion is expected to be stronger (more negative) at the end of a merger wave.
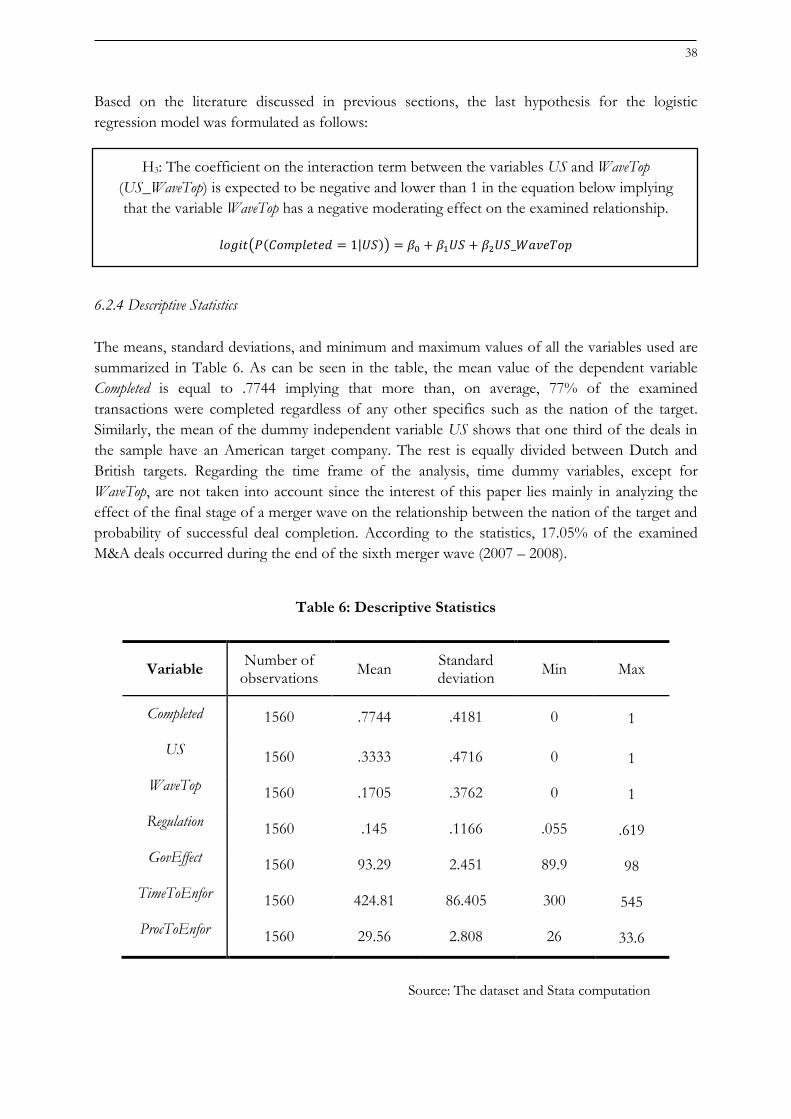
38
Based on the literature discussed in previous sections, the last hypothesis for the logistic
regression model was formulated as follows:
H3: The coefficient on the interaction term between the variables US and WaveTop
(US_WaveTop) is expected to be negative and lower than 1 in the equation below implying
that the variable WaveTop has a negative moderating effect on the examined relationship.
𝑙𝑜𝑔𝑖𝑡(𝑃(𝐶𝑜𝑚𝑝𝑙𝑒𝑡𝑒𝑑 = 1|𝑈𝑆)) = 𝛽0 + 𝛽1𝑈𝑆 + 𝛽2𝑈𝑆_𝑊𝑎𝑣𝑒𝑇𝑜𝑝
6.2.4 Descriptive Statistics
The means, standard deviations, and minimum and maximum values of all the variables used are
summarized in Table 6. As can be seen in the table, the mean value of the dependent variable
Completed is equal to .7744 implying that more than, on average, 77% of the examined
transactions were completed regardless of any other specifics such as the nation of the target.
Similarly, the mean of the dummy independent variable US shows that one third of the deals in
the sample have an American target company. The rest is equally divided between Dutch and
British targets. Regarding the time frame of the analysis, time dummy variables, except for
WaveTop, are not taken into account since the interest of this paper lies mainly in analyzing the
effect of the final stage of a merger wave on the relationship between the nation of the target and
probability of successful deal completion. According to the statistics, 17.05% of the examined
M&A deals occurred during the end of the sixth merger wave (2007 – 2008).
Table 6: Descriptive Statistics
Variable Number of
observations Mean
Standard deviation
Min Max
Completed 1560 .7744 .4181 0 1
US 1560 .3333 .4716 0 1
WaveTop 1560 .1705 .3762 0 1
Regulation 1560 .145 .1166 .055 .619
GovEffect 1560 93.29 2.451 89.9 98
TimeToEnfor 1560 424.81 86.405 300 545
ProcToEnfor 1560 29.56 2.808 26 33.6
Source: The dataset and Stata computation
39
Although the average level of merger regulation over the period of 13 years from 2003 to 2015,
considering both the US and the EU merger controls, was 14.5% (in terms of the percentage of
penalized or prohibited deals out of the total amount of notified M&A transactions), even the
highest figure for the EU (10.63% in 2008) was lower than this number and the lowest one for
the US was almost equal to this average (14.41% in 2004). This fact represents another reason, in
addition to the ones already discussed above, why the US merger regulation is assumed to be
more restrictive than the European legislation and that it affects the pre-merger failure rate.
Regarding the government efficiency indicator, the US received ranking below the overall average
of the three countries in the sample (93.29) every year of the studied time period (as can be also
seen in Table 5). Considering also the fact that the highest number of procedures needed to
enforce and finalize a contract between two companies (33.6) is linked to the US business
environment, the transactions with the American targets are expected to experience lower
probability of successful completion than the European ones, partly caused by these two factors.
On the contrary, the time needed to enforce contracts under the rules of the US legislation has
been below the average figure (425 days) every year, ranging from 300 to 420 days, which is not
in line with the literature reviewed above where the process of contract enforcement was
considered more time-consuming in the USA than in the EU.
6.3 Logistic Regression Analysis
The main objective of the empirical model is to examine the relationship between the nation of
the M&A target company and the probability of pre-merger successful completion or failure of
the proposed deal. Before the regressions testing the hypotheses formulated in Section 6.2 can be
run, it is necessary to check whether all the assumptions for the logit model analysis are met.
First, the dependent variable Completed is coded in such a way that the desired outcome, the
probability of pre-merger failure or deal completion, can be computed based on the binary range
of the variable’s values (0 and 1) and thus (A.1) can be considered satisfied. Second, a random
sample of 40 transactions for each of the 3 countries and 13 years included in the dataset has
been drawn and thus with the total amount of 1560 examined transactions, the conditions (A.2)
and (A.3) are met as well. In order to study the main relationship of interest, the variable US is
included as the independent variable reflecting the nation of the M&A target company. Lastly, for
the purpose of the logistic regression analysis, the target’s nation is described in terms of the four
above discussed variables (based on the literature review of the country-specific factors affecting
M&A deal completion):
(1) Regulation – the restrictiveness of merger control mechanisms in each of the target nations
(in percentage points),
(2) GovEffect – the quality and implementation of the target nation’s government policies (in a
percentile rank from 0 to 100 where 100 stands for the most effective governments),
(3) TimeToEnfor – the time needed for a company to enforce contracts in each of the target
countries (in days),
(4) and ProcToEnfor – the number of procedures needed for a company to enforce contracts
in each of the target countries.
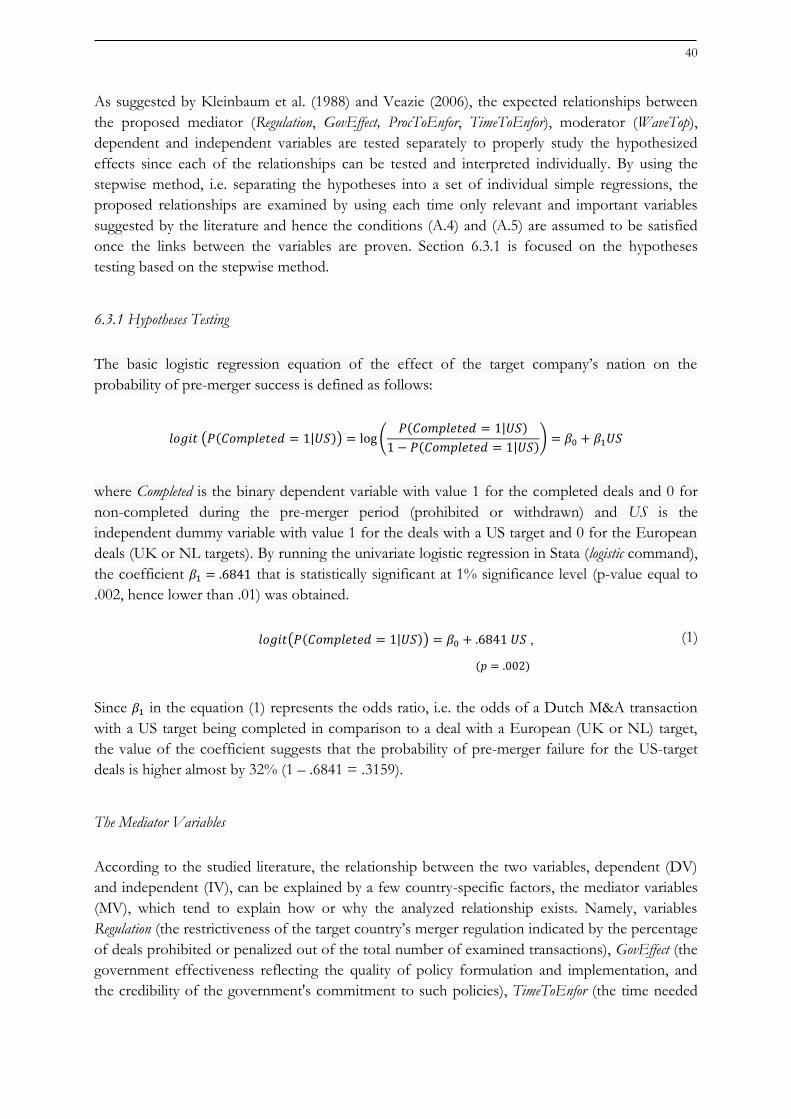
40
As suggested by Kleinbaum et al. (1988) and Veazie (2006), the expected relationships between
the proposed mediator (Regulation, GovEffect, ProcToEnfor, TimeToEnfor), moderator (WaveTop),
dependent and independent variables are tested separately to properly study the hypothesized
effects since each of the relationships can be tested and interpreted individually. By using the
stepwise method, i.e. separating the hypotheses into a set of individual simple regressions, the
proposed relationships are examined by using each time only relevant and important variables
suggested by the literature and hence the conditions (A.4) and (A.5) are assumed to be satisfied
once the links between the variables are proven. Section 6.3.1 is focused on the hypotheses
testing based on the stepwise method.
6.3.1 Hypotheses Testing
The basic logistic regression equation of the effect of the target company’s nation on the
probability of pre-merger success is defined as follows:
𝑙𝑜𝑔𝑖𝑡 (𝑃(𝐶𝑜𝑚𝑝𝑙𝑒𝑡𝑒𝑑 = 1|𝑈𝑆)) = log (𝑃(𝐶𝑜𝑚𝑝𝑙𝑒𝑡𝑒𝑑 = 1|𝑈𝑆)
1 − 𝑃(𝐶𝑜𝑚𝑝𝑙𝑒𝑡𝑒𝑑 = 1|𝑈𝑆)) = 𝛽0 + 𝛽1𝑈𝑆
where Completed is the binary dependent variable with value 1 for the completed deals and 0 for
non-completed during the pre-merger period (prohibited or withdrawn) and US is the
independent dummy variable with value 1 for the deals with a US target and 0 for the European
deals (UK or NL targets). By running the univariate logistic regression in Stata (logistic command),
the coefficient 𝛽1 = .6841 that is statistically significant at 1% significance level (p-value equal to
.002, hence lower than .01) was obtained.
𝑙𝑜𝑔𝑖𝑡(𝑃(𝐶𝑜𝑚𝑝𝑙𝑒𝑡𝑒𝑑 = 1|𝑈𝑆)) = 𝛽0 + .6841 𝑈𝑆 ,
(𝑝 = .002)
Since 𝛽1 in the equation (1) represents the odds ratio, i.e. the odds of a Dutch M&A transaction
with a US target being completed in comparison to a deal with a European (UK or NL) target,
the value of the coefficient suggests that the probability of pre-merger failure for the US-target
deals is higher almost by 32% (1 – .6841 = .3159).
The Mediator Variables
According to the studied literature, the relationship between the two variables, dependent (DV)
and independent (IV), can be explained by a few country-specific factors, the mediator variables
(MV), which tend to explain how or why the analyzed relationship exists. Namely, variables
Regulation (the restrictiveness of the target country’s merger regulation indicated by the percentage
of deals prohibited or penalized out of the total number of examined transactions), GovEffect (the
government effectiveness reflecting the quality of policy formulation and implementation, and
the credibility of the government's commitment to such policies), TimeToEnfor (the time needed
(1)

41
for a company to enforce a contract), and ProcToEnfor (the number of procedures required to be
done by a company in order to enforce a contract) are included.
For a variable to be a mediator, four conditions have to be satisfied (Hosmer et al., 2013):
(1) the variations in the IV (the variable US) account for the variations in the DV (the
variable Completed),
(2) the variations in the IV account for the variations in the MV (Regulation, GovEffect,
TimeToEnfor, or ProcToEnfor analyzed separately),
(3) the variations in the MV account for the variations in the DV,
(4) and when the MV is added to the model, the relationship between the IV and DV
decreases or it is even eliminated.
Figure 2 depicts these necessary conditions graphically along with the directions and possible
signs of the relationship between the three variables. The example of Regulation as the mediator
variable is used in the figure.
Figure 2: Necessary Conditions for a Variable to be a Mediator
Regulation
US Completed
Source: Hosmer et al. (2013) and Author’s Dataset
Empirically, the four assumptions can be tested by a set of simple regressions. First, the
relationship between the IV (US) and DV (Completed) was already analyzed by the equation (1).
Since the coefficient on the IV indicates the odds ratio of a deal completion for the US-target
transactions to the odds for the EU-target deals, any number lower than one implies a lower
probability of success for the US targets. Hence, with the coefficient equal to .6841 a negative
significant (p-value is lower than .01) relationship between the IV and DV can be observed. For
the Regulation to be a mediator as expected based on the literature review, a positive (resp.
negative) significant relationship between US and Regulation as well as a negative (resp. positive)
significant relationship between Regulation and Completed is assumed to be found. In order to test
these hypotheses, simple linear and logistic regressions are applied, respectively. The linear
regression for the effect of US on Regulation is used because for a continuous dependent variable
such as Regulation, the logit model analysis would not be suitable.
𝑅𝑒𝑔𝑢𝑙𝑎𝑡𝑖𝑜𝑛 = 𝛾0 + .1975 𝑈𝑆
(𝑝 = .000)
-
-/+ +/-
(2)
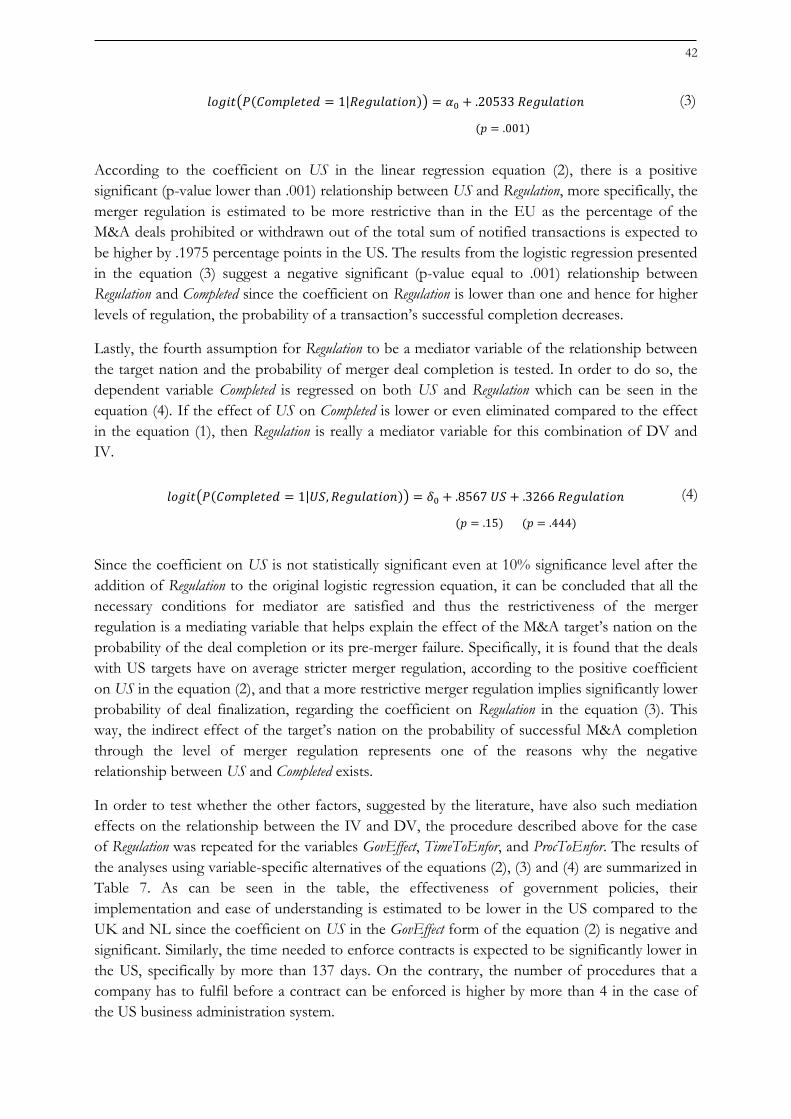
42
𝑙𝑜𝑔𝑖𝑡(𝑃(𝐶𝑜𝑚𝑝𝑙𝑒𝑡𝑒𝑑 = 1|𝑅𝑒𝑔𝑢𝑙𝑎𝑡𝑖𝑜𝑛)) = 𝛼0 + .20533 𝑅𝑒𝑔𝑢𝑙𝑎𝑡𝑖𝑜𝑛
(𝑝 = .001)
According to the coefficient on US in the linear regression equation (2), there is a positive
significant (p-value lower than .001) relationship between US and Regulation, more specifically, the
merger regulation is estimated to be more restrictive than in the EU as the percentage of the
M&A deals prohibited or withdrawn out of the total sum of notified transactions is expected to
be higher by .1975 percentage points in the US. The results from the logistic regression presented
in the equation (3) suggest a negative significant (p-value equal to .001) relationship between
Regulation and Completed since the coefficient on Regulation is lower than one and hence for higher
levels of regulation, the probability of a transaction’s successful completion decreases.
Lastly, the fourth assumption for Regulation to be a mediator variable of the relationship between
the target nation and the probability of merger deal completion is tested. In order to do so, the
dependent variable Completed is regressed on both US and Regulation which can be seen in the
equation (4). If the effect of US on Completed is lower or even eliminated compared to the effect
in the equation (1), then Regulation is really a mediator variable for this combination of DV and
IV.
𝑙𝑜𝑔𝑖𝑡(𝑃(𝐶𝑜𝑚𝑝𝑙𝑒𝑡𝑒𝑑 = 1|𝑈𝑆, 𝑅𝑒𝑔𝑢𝑙𝑎𝑡𝑖𝑜𝑛)) = 𝛿0 + .8567 𝑈𝑆 + .3266 𝑅𝑒𝑔𝑢𝑙𝑎𝑡𝑖𝑜𝑛
(𝑝 = .15) (𝑝 = .444)
Since the coefficient on US is not statistically significant even at 10% significance level after the
addition of Regulation to the original logistic regression equation, it can be concluded that all the
necessary conditions for mediator are satisfied and thus the restrictiveness of the merger
regulation is a mediating variable that helps explain the effect of the M&A target’s nation on the
probability of the deal completion or its pre-merger failure. Specifically, it is found that the deals
with US targets have on average stricter merger regulation, according to the positive coefficient
on US in the equation (2), and that a more restrictive merger regulation implies significantly lower
probability of deal finalization, regarding the coefficient on Regulation in the equation (3). This
way, the indirect effect of the target’s nation on the probability of successful M&A completion
through the level of merger regulation represents one of the reasons why the negative
relationship between US and Completed exists.
In order to test whether the other factors, suggested by the literature, have also such mediation
effects on the relationship between the IV and DV, the procedure described above for the case
of Regulation was repeated for the variables GovEffect, TimeToEnfor, and ProcToEnfor. The results of
the analyses using variable-specific alternatives of the equations (2), (3) and (4) are summarized in
Table 7. As can be seen in the table, the effectiveness of government policies, their
implementation and ease of understanding is estimated to be lower in the US compared to the
UK and NL since the coefficient on US in the GovEffect form of the equation (2) is negative and
significant. Similarly, the time needed to enforce contracts is expected to be significantly lower in
the US, specifically by more than 137 days. On the contrary, the number of procedures that a
company has to fulfil before a contract can be enforced is higher by more than 4 in the case of
the US business administration system.
(3)
(4)
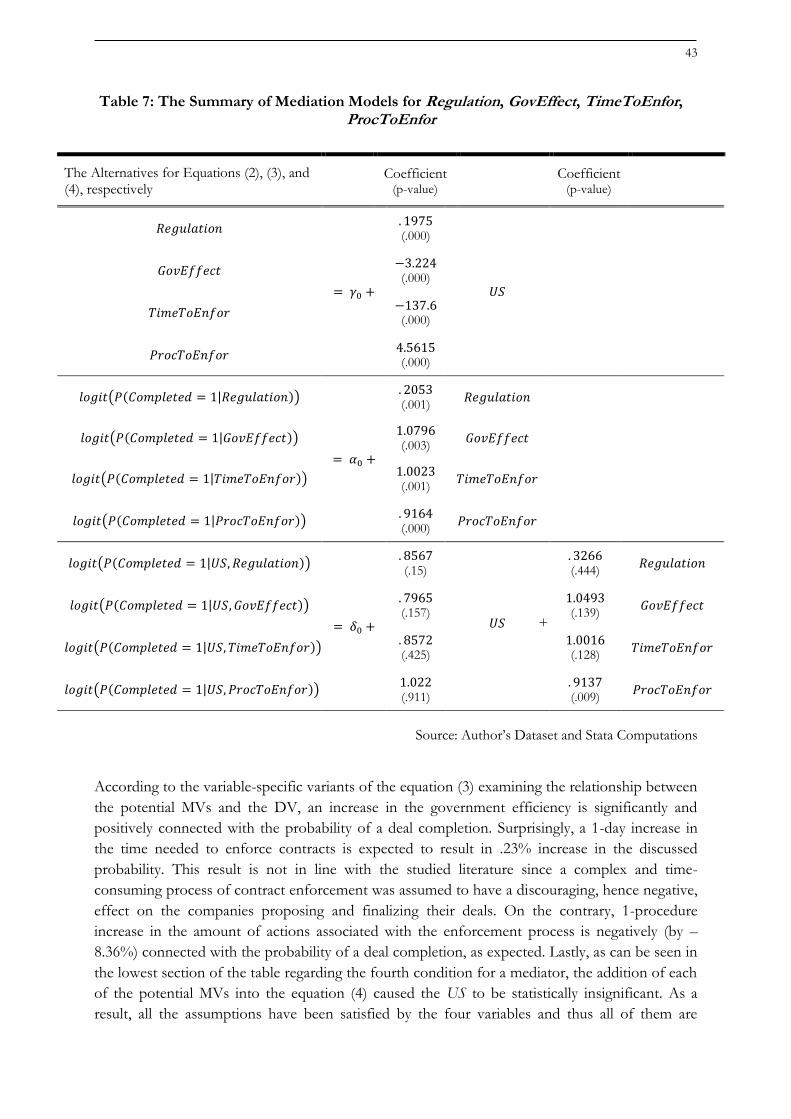
43
+
Table 7: The Summary of Mediation Models for Regulation, GovEffect, TimeToEnfor, ProcToEnfor
The Alternatives for Equations (2), (3), and (4), respectively
Coefficient
(p-value) Coefficient
(p-value)
𝑅𝑒𝑔𝑢𝑙𝑎𝑡𝑖𝑜𝑛
= 𝛾0 +
. 1975 (.000)
𝑈𝑆
𝐺𝑜𝑣𝐸𝑓𝑓𝑒𝑐𝑡 −3.224 (.000)
𝑇𝑖𝑚𝑒𝑇𝑜𝐸𝑛𝑓𝑜𝑟 −137.6 (.000)
𝑃𝑟𝑜𝑐𝑇𝑜𝐸𝑛𝑓𝑜𝑟 4.5615 (.000)
𝑙𝑜𝑔𝑖𝑡(𝑃(𝐶𝑜𝑚𝑝𝑙𝑒𝑡𝑒𝑑 = 1|𝑅𝑒𝑔𝑢𝑙𝑎𝑡𝑖𝑜𝑛))
= 𝛼0 +
. 2053 (.001)
𝑅𝑒𝑔𝑢𝑙𝑎𝑡𝑖𝑜𝑛
𝑙𝑜𝑔𝑖𝑡(𝑃(𝐶𝑜𝑚𝑝𝑙𝑒𝑡𝑒𝑑 = 1|𝐺𝑜𝑣𝐸𝑓𝑓𝑒𝑐𝑡)) 1.0796 (.003)
𝐺𝑜𝑣𝐸𝑓𝑓𝑒𝑐𝑡
𝑙𝑜𝑔𝑖𝑡(𝑃(𝐶𝑜𝑚𝑝𝑙𝑒𝑡𝑒𝑑 = 1|𝑇𝑖𝑚𝑒𝑇𝑜𝐸𝑛𝑓𝑜𝑟)) 1.0023 (.001)
𝑇𝑖𝑚𝑒𝑇𝑜𝐸𝑛𝑓𝑜𝑟
𝑙𝑜𝑔𝑖𝑡(𝑃(𝐶𝑜𝑚𝑝𝑙𝑒𝑡𝑒𝑑 = 1|𝑃𝑟𝑜𝑐𝑇𝑜𝐸𝑛𝑓𝑜𝑟)) . 9164 (.000)
𝑃𝑟𝑜𝑐𝑇𝑜𝐸𝑛𝑓𝑜𝑟
𝑙𝑜𝑔𝑖𝑡(𝑃(𝐶𝑜𝑚𝑝𝑙𝑒𝑡𝑒𝑑 = 1|𝑈𝑆, 𝑅𝑒𝑔𝑢𝑙𝑎𝑡𝑖𝑜𝑛))
= 𝛿0 +
. 8567 (.15)
𝑈𝑆
. 3266 (.444)
𝑅𝑒𝑔𝑢𝑙𝑎𝑡𝑖𝑜𝑛
𝑙𝑜𝑔𝑖𝑡(𝑃(𝐶𝑜𝑚𝑝𝑙𝑒𝑡𝑒𝑑 = 1|𝑈𝑆, 𝐺𝑜𝑣𝐸𝑓𝑓𝑒𝑐𝑡)) . 7965 (.157)
1.0493 (.139)
𝐺𝑜𝑣𝐸𝑓𝑓𝑒𝑐𝑡
𝑙𝑜𝑔𝑖𝑡(𝑃(𝐶𝑜𝑚𝑝𝑙𝑒𝑡𝑒𝑑 = 1|𝑈𝑆, 𝑇𝑖𝑚𝑒𝑇𝑜𝐸𝑛𝑓𝑜𝑟)) . 8572 (.425)
1.0016 (.128)
𝑇𝑖𝑚𝑒𝑇𝑜𝐸𝑛𝑓𝑜𝑟
𝑙𝑜𝑔𝑖𝑡(𝑃(𝐶𝑜𝑚𝑝𝑙𝑒𝑡𝑒𝑑 = 1|𝑈𝑆, 𝑃𝑟𝑜𝑐𝑇𝑜𝐸𝑛𝑓𝑜𝑟)) 1.022 (.911)
. 9137 (.009)
𝑃𝑟𝑜𝑐𝑇𝑜𝐸𝑛𝑓𝑜𝑟
Source: Author’s Dataset and Stata Computations
According to the variable-specific variants of the equation (3) examining the relationship between
the potential MVs and the DV, an increase in the government efficiency is significantly and
positively connected with the probability of a deal completion. Surprisingly, a 1-day increase in
the time needed to enforce contracts is expected to result in .23% increase in the discussed
probability. This result is not in line with the studied literature since a complex and time-
consuming process of contract enforcement was assumed to have a discouraging, hence negative,
effect on the companies proposing and finalizing their deals. On the contrary, 1-procedure
increase in the amount of actions associated with the enforcement process is negatively (by –
8.36%) connected with the probability of a deal completion, as expected. Lastly, as can be seen in
the lowest section of the table regarding the fourth condition for a mediator, the addition of each
of the potential MVs into the equation (4) caused the US to be statistically insignificant. As a
result, all the assumptions have been satisfied by the four variables and thus all of them are
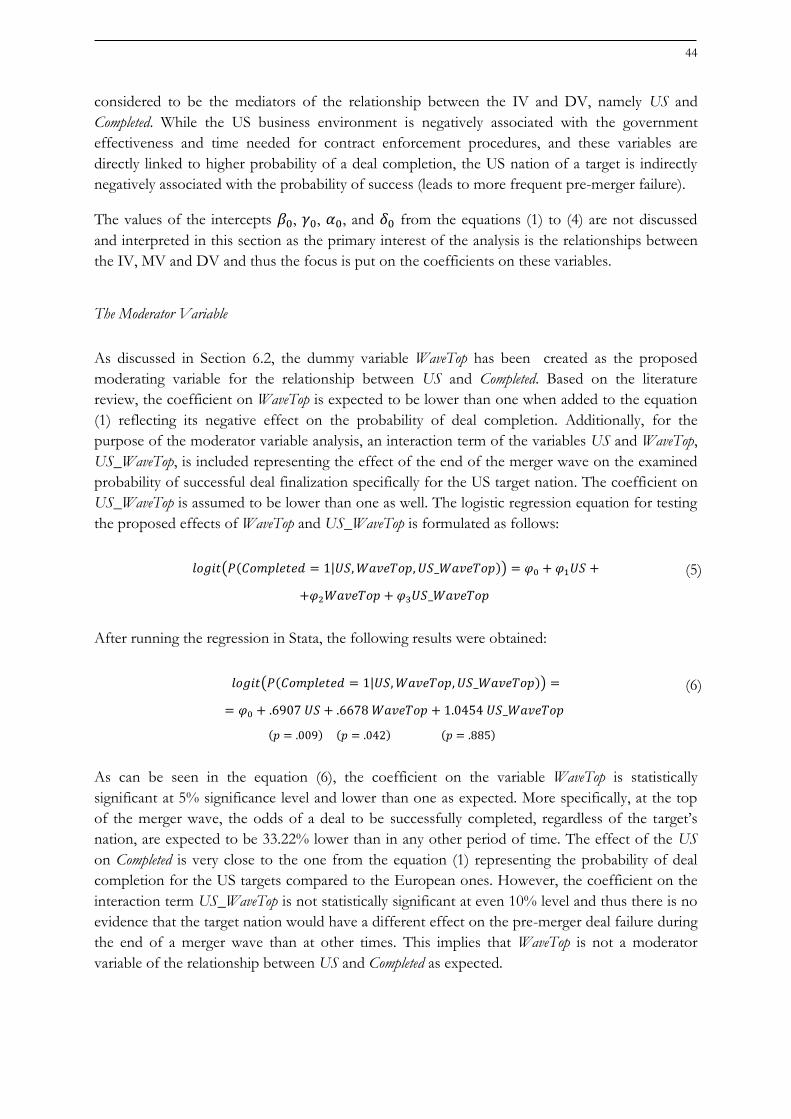
44
considered to be the mediators of the relationship between the IV and DV, namely US and
Completed. While the US business environment is negatively associated with the government
effectiveness and time needed for contract enforcement procedures, and these variables are
directly linked to higher probability of a deal completion, the US nation of a target is indirectly
negatively associated with the probability of success (leads to more frequent pre-merger failure).
The values of the intercepts 𝛽0, 𝛾0, 𝛼0, and 𝛿0 from the equations (1) to (4) are not discussed
and interpreted in this section as the primary interest of the analysis is the relationships between
the IV, MV and DV and thus the focus is put on the coefficients on these variables.
The Moderator Variable
As discussed in Section 6.2, the dummy variable WaveTop has been created as the proposed
moderating variable for the relationship between US and Completed. Based on the literature
review, the coefficient on WaveTop is expected to be lower than one when added to the equation
(1) reflecting its negative effect on the probability of deal completion. Additionally, for the
purpose of the moderator variable analysis, an interaction term of the variables US and WaveTop,
US_WaveTop, is included representing the effect of the end of the merger wave on the examined
probability of successful deal finalization specifically for the US target nation. The coefficient on
US_WaveTop is assumed to be lower than one as well. The logistic regression equation for testing
the proposed effects of WaveTop and US_WaveTop is formulated as follows:
𝑙𝑜𝑔𝑖𝑡(𝑃(𝐶𝑜𝑚𝑝𝑙𝑒𝑡𝑒𝑑 = 1|𝑈𝑆, 𝑊𝑎𝑣𝑒𝑇𝑜𝑝, 𝑈𝑆_𝑊𝑎𝑣𝑒𝑇𝑜𝑝)) = 𝜑0 + 𝜑1𝑈𝑆 +
+𝜑2𝑊𝑎𝑣𝑒𝑇𝑜𝑝 + 𝜑3𝑈𝑆_𝑊𝑎𝑣𝑒𝑇𝑜𝑝
After running the regression in Stata, the following results were obtained:
𝑙𝑜𝑔𝑖𝑡(𝑃(𝐶𝑜𝑚𝑝𝑙𝑒𝑡𝑒𝑑 = 1|𝑈𝑆, 𝑊𝑎𝑣𝑒𝑇𝑜𝑝, 𝑈𝑆_𝑊𝑎𝑣𝑒𝑇𝑜𝑝)) =
= 𝜑0 + .6907 𝑈𝑆 + .6678 𝑊𝑎𝑣𝑒𝑇𝑜𝑝 + 1.0454 𝑈𝑆_𝑊𝑎𝑣𝑒𝑇𝑜𝑝
(𝑝 = .009) (𝑝 = .042) (𝑝 = .885)
As can be seen in the equation (6), the coefficient on the variable WaveTop is statistically
significant at 5% significance level and lower than one as expected. More specifically, at the top
of the merger wave, the odds of a deal to be successfully completed, regardless of the target’s
nation, are expected to be 33.22% lower than in any other period of time. The effect of the US
on Completed is very close to the one from the equation (1) representing the probability of deal
completion for the US targets compared to the European ones. However, the coefficient on the
interaction term US_WaveTop is not statistically significant at even 10% level and thus there is no
evidence that the target nation would have a different effect on the pre-merger deal failure during
the end of a merger wave than at other times. This implies that WaveTop is not a moderator
variable of the relationship between US and Completed as expected.
(5)
(6)
45
(7)
(8)
(9)
7 Robustness Test: Probit Model Analysis
In order to test whether the results of the analysis do not depend on the chosen method, the
logit-based coefficient estimates are compared with the ones obtained by using the probit
approach. In principal, the two methods are very similar. More specifically, the same basic
assumptions as stated for the logit model in Section 6.1 have to be satisfied in the case of probit
model regression (Long, 1997). Since the choice of the dependent variable along with the
procedure of drawing a random sample of M&A deals do not change in comparison to the
logistic regression analysis, the assumptions (A.1) to (A.3) are met in the case of the probit model
as well. Similarly, the independent variable is described by the same factors as in Section 6.3 and
the expected relationships between the proposed mediator, moderator, dependent and
independent variables are tested using the same stepwise method of separating the hypotheses
into individual regressions. Thus, the assumptions (A.4) and (A.5) are assumed to be fulfilled
once the proposed links between the variables are proven.
However, logit and probit models differ in the way how they define the function transforming a
linear model to yield a nonlinear relationship. In other words, the linear regression predictor �̂�
from the equation (7) is predicted by using either the cumulative distribution function of the
logistic distribution in case of the logit model (equation (8)) or the cumulative distribution
function of the standard normal distribution in the case of probit (equation (9)):
�̂� = 𝛼 + 𝛽𝑥
𝑙𝑜𝑔𝑖𝑡(𝑃(𝑦 = 1|𝑥)) = log (𝑃(𝑦 = 1|𝑥)
1−𝑃(𝑦 = 1|𝑥)) = 𝛼 + 𝛽𝑥
𝑝𝑟𝑜𝑏𝑖𝑡(𝑃(𝑦 = 1|𝑥)) = ∫ 2𝜋−1/2∞
−∞∗ exp (−
(𝛼+𝛽𝑥)2
2) 𝑑𝑥 = 𝛼 + 𝛽𝑥
Since both functions rescale any value of 𝛼 + 𝛽𝑥 to the range between 0 and 1, both logit and
probit transformation lead to a predicted probability of the desired outcome. Nevertheless, the
coefficients on the independent variables may significantly differ. If they do not, the logit (resp.
probit) analysis can be considered robust (Hosmer et al., 2013).
In order to compare the two estimation methods, both logit and probit regressions are run in
Stata and the logit coefficients are divided by 1.6, as suggested by Gelman and Hill (2007) who
chose this factor by trial and error to make the transformed logistic approximate follow the
standard normal distribution. This way the logistic latent variable (error term) can be standardized
to have a mean equal to zero and variance equal to one, and thus the interpretation of the
coefficients is the same for both methods. Even though in Section 6.3 the odds ratio is used for
the logit regression because of its easier interpretation, for the purpose of the logit-probit
coefficient comparison the log odds are used. The empirical results for the equations representing
the relationship between the dependent, independent, moderator and mediator variables of the
model are presented in Table 8 for both of the methods discussed.
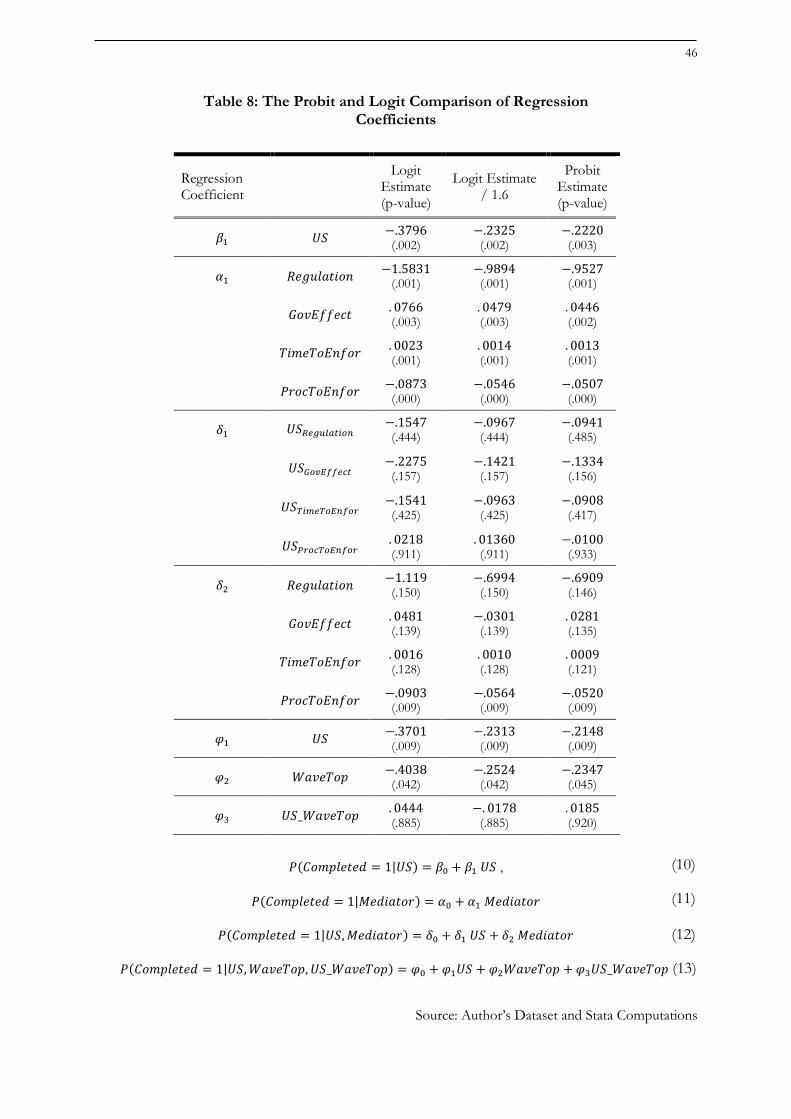
46
Table 8: The Probit and Logit Comparison of Regression Coefficients
Regression Coefficient
Logit
Estimate (p-value)
Logit Estimate / 1.6
Probit Estimate (p-value)
𝛽1 𝑈𝑆 −.3796 (.002)
−.2325 (.002)
−.2220 (.003)
𝛼1 𝑅𝑒𝑔𝑢𝑙𝑎𝑡𝑖𝑜𝑛 −1.5831
(.001) −.9894 (.001)
−.9527 (.001)
𝐺𝑜𝑣𝐸𝑓𝑓𝑒𝑐𝑡 . 0766 (.003)
. 0479 (.003)
. 0446 (.002)
𝑇𝑖𝑚𝑒𝑇𝑜𝐸𝑛𝑓𝑜𝑟 . 0023 (.001)
. 0014 (.001)
. 0013 (.001)
𝑃𝑟𝑜𝑐𝑇𝑜𝐸𝑛𝑓𝑜𝑟 −.0873 (.000)
−.0546 (.000)
−.0507 (.000)
𝛿1 𝑈𝑆𝑅𝑒𝑔𝑢𝑙𝑎𝑡𝑖𝑜𝑛 −.1547 (.444)
−.0967 (.444)
−.0941 (.485)
𝑈𝑆𝐺𝑜𝑣𝐸𝑓𝑓𝑒𝑐𝑡 −.2275 (.157)
−.1421 (.157)
−.1334 (.156)
𝑈𝑆𝑇𝑖𝑚𝑒𝑇𝑜𝐸𝑛𝑓𝑜𝑟 −.1541 (.425)
−.0963 (.425)
−.0908 (.417)
𝑈𝑆𝑃𝑟𝑜𝑐𝑇𝑜𝐸𝑛𝑓𝑜𝑟 . 0218 (.911)
. 01360 (.911)
−.0100 (.933)
𝛿2 𝑅𝑒𝑔𝑢𝑙𝑎𝑡𝑖𝑜𝑛 −1.119 (.150)
−.6994 (.150)
−.6909 (.146)
𝐺𝑜𝑣𝐸𝑓𝑓𝑒𝑐𝑡 . 0481 (.139)
−.0301 (.139)
. 0281 (.135)
𝑇𝑖𝑚𝑒𝑇𝑜𝐸𝑛𝑓𝑜𝑟 . 0016 (.128)
. 0010 (.128)
. 0009 (.121)
𝑃𝑟𝑜𝑐𝑇𝑜𝐸𝑛𝑓𝑜𝑟 −.0903 (.009)
−.0564 (.009)
−.0520 (.009)
𝜑1 𝑈𝑆 −.3701 (.009)
−.2313 (.009)
−.2148 (.009)
𝜑2 𝑊𝑎𝑣𝑒𝑇𝑜𝑝 −.4038 (.042)
−.2524 (.042)
−.2347 (.045)
𝜑3 𝑈𝑆_𝑊𝑎𝑣𝑒𝑇𝑜𝑝 . 0444 (.885)
−. 0178 (.885)
. 0185 (.920)
𝑃(𝐶𝑜𝑚𝑝𝑙𝑒𝑡𝑒𝑑 = 1|𝑈𝑆) = 𝛽0 + 𝛽1 𝑈𝑆 ,
𝑃(𝐶𝑜𝑚𝑝𝑙𝑒𝑡𝑒𝑑 = 1|𝑀𝑒𝑑𝑖𝑎𝑡𝑜𝑟) = 𝛼0 + 𝛼1 𝑀𝑒𝑑𝑖𝑎𝑡𝑜𝑟
𝑃(𝐶𝑜𝑚𝑝𝑙𝑒𝑡𝑒𝑑 = 1|𝑈𝑆, 𝑀𝑒𝑑𝑖𝑎𝑡𝑜𝑟) = 𝛿0 + 𝛿1 𝑈𝑆 + 𝛿2 𝑀𝑒𝑑𝑖𝑎𝑡𝑜𝑟
𝑃(𝐶𝑜𝑚𝑝𝑙𝑒𝑡𝑒𝑑 = 1|𝑈𝑆, 𝑊𝑎𝑣𝑒𝑇𝑜𝑝, 𝑈𝑆_𝑊𝑎𝑣𝑒𝑇𝑜𝑝) = 𝜑0 + 𝜑1𝑈𝑆 + 𝜑2𝑊𝑎𝑣𝑒𝑇𝑜𝑝 + 𝜑3𝑈𝑆_𝑊𝑎𝑣𝑒𝑇𝑜𝑝
Source: Author’s Dataset and Stata Computations
(10)
(13)
(11)
(12)
47
As can be seen in Table 8, the coefficients obtained by running a probit regression of the
equations (10) to (13) corresponding to the main relationships of interest studied in Section 6 are
generally very close to the logistic estimates adjusted to the standard normal distribution of errors
by using the factor 1.6. Since the signs, significance and sizes of the estimated coefficients are
almost the same for both of the studied methods it is concluded that the results of the conducted
analysis presented in Section 6 can be considered robust and not affected by the choice of the
approach used.
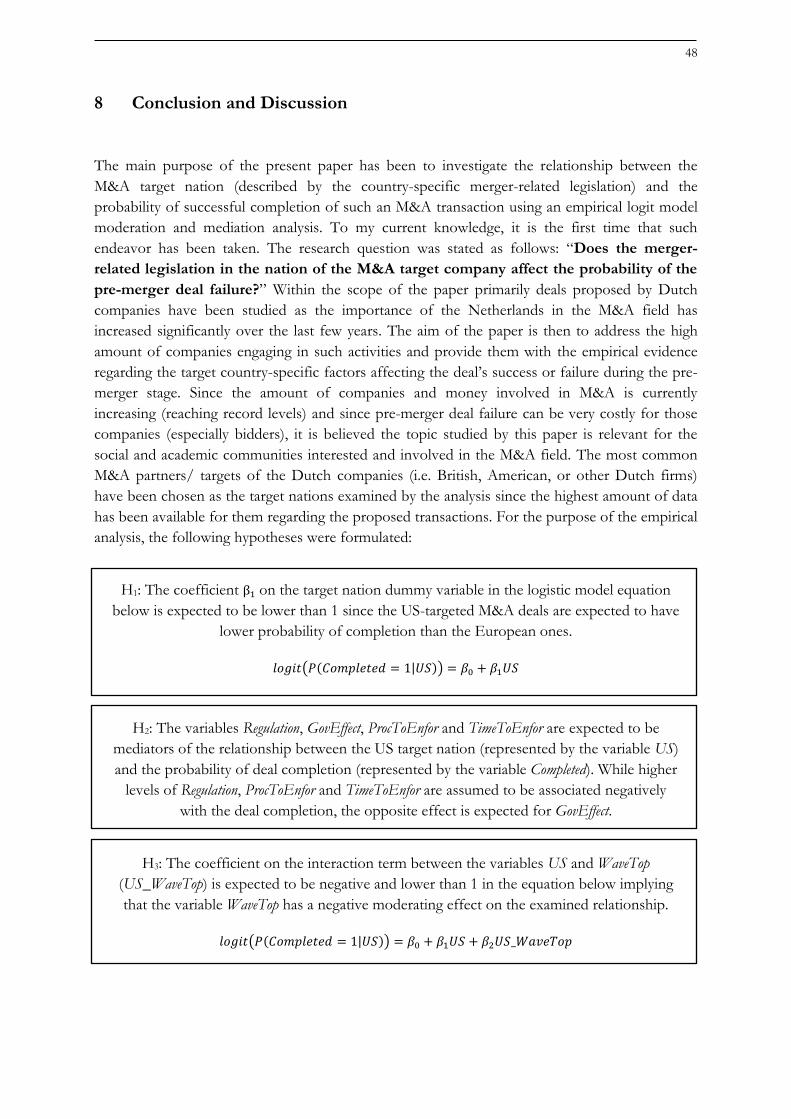
48
8 Conclusion and Discussion
The main purpose of the present paper has been to investigate the relationship between the
M&A target nation (described by the country-specific merger-related legislation) and the
probability of successful completion of such an M&A transaction using an empirical logit model
moderation and mediation analysis. To my current knowledge, it is the first time that such
endeavor has been taken. The research question was stated as follows: “Does the merger-
related legislation in the nation of the M&A target company affect the probability of the
pre-merger deal failure?” Within the scope of the paper primarily deals proposed by Dutch
companies have been studied as the importance of the Netherlands in the M&A field has
increased significantly over the last few years. The aim of the paper is then to address the high
amount of companies engaging in such activities and provide them with the empirical evidence
regarding the target country-specific factors affecting the deal’s success or failure during the pre-
merger stage. Since the amount of companies and money involved in M&A is currently
increasing (reaching record levels) and since pre-merger deal failure can be very costly for those
companies (especially bidders), it is believed the topic studied by this paper is relevant for the
social and academic communities interested and involved in the M&A field. The most common
M&A partners/ targets of the Dutch companies (i.e. British, American, or other Dutch firms)
have been chosen as the target nations examined by the analysis since the highest amount of data
has been available for them regarding the proposed transactions. For the purpose of the empirical
analysis, the following hypotheses were formulated:
H1: The coefficient β1 on the target nation dummy variable in the logistic model equation
below is expected to be lower than 1 since the US-targeted M&A deals are expected to have
lower probability of completion than the European ones.
𝑙𝑜𝑔𝑖𝑡(𝑃(𝐶𝑜𝑚𝑝𝑙𝑒𝑡𝑒𝑑 = 1|𝑈𝑆)) = 𝛽0 + 𝛽1𝑈𝑆
H2: The variables Regulation, GovEffect, ProcToEnfor and TimeToEnfor are expected to be
mediators of the relationship between the US target nation (represented by the variable US)
and the probability of deal completion (represented by the variable Completed). While higher
levels of Regulation, ProcToEnfor and TimeToEnfor are assumed to be associated negatively
with the deal completion, the opposite effect is expected for GovEffect.
H3: The coefficient on the interaction term between the variables US and WaveTop
(US_WaveTop) is expected to be negative and lower than 1 in the equation below implying
that the variable WaveTop has a negative moderating effect on the examined relationship.
𝑙𝑜𝑔𝑖𝑡(𝑃(𝐶𝑜𝑚𝑝𝑙𝑒𝑡𝑒𝑑 = 1|𝑈𝑆)) = 𝛽0 + 𝛽1𝑈𝑆 + 𝛽2𝑈𝑆_𝑊𝑎𝑣𝑒𝑇𝑜𝑝
49
The results of the logit model regression presented in Section 6 suggest that, in the data sample
used, the US-targeted deals have significantly higher probability of pre-merger failure than the
ones with a European (UK or NL) target. It implies that the first hypothesis tested by the
empirical model can be accepted. In the second hypothesis, the studied relationship between the
target nation and deal completion has been expected to be caused by several factors, among
others, linked to the target nation’s merger regulation mechanisms and corporate-related
legislation. By a mediation analysis of four specific factors (namely the restrictiveness of the
merger regulation, government effectiveness and the number of procedures and time needed for
a contract enforcement) it was found that all of the variables Regulation, GovEffect, ProcToEnfor and
TimeToEnfor satisfied the necessary conditions to be the mediators of the examined relationship.
More specifically, the US transactions were associated with more restrictive merger control (in
terms of the percentage of deals prohibited or withdrawn by the regulation authorities in the total
amount of transactions notified) and higher number of procedures needed in order to finalize
and enforce a contract between two or more companies which in turn is instrumental in the
negative relationship between the deals with US targets and the probability of successful
completion. Similarly, less effective corporate-related government policies (e.g. in a form of
unclear interpretation and implementation of the legislation) were found to characterize the US
deal-making environment, as compared to the EU, which also contributed to the higher
probability of pre-merger failure performed by the US targets. These relationships were expected
by the reviewed literature and proved by the empirical analysis. However, the last mediator
variable, the time needed to enforce a contract, was negatively associated with the US targets (i.e.
the contract enforcement is expected to be faster in the US) but, surprisingly, positively affecting
the probability of the M&A deal completion, or in other words, longer time needed for
finalization and enforcement of a contract between companies is estimated to result in a higher
chance that the transaction would be completed. Although such relationship is not in line with
the literature discussed in this paper, one of the possible explanations of the found relationship
might be that the longer time needed for a deal finalization provides the companies with an
opportunity to negotiate and adapt the deal conditions in a way that it can be successfully
completed afterwards. Uncovering the relationship between the contract enforcement and the
probability of deal completion in detail might be an interesting area for a further research.
In addition, the effect of a merger wave stage in which the deal is being negotiated on the pre-
merger failure was examined by the empirical analysis. As suggested by the studied literature, it
was found that during the end of the sixth merger wave the percentage amount of the
transactions not completed was significantly higher than in the other periods of time. However,
in contrast to the reviewed studies, the presumption that the final stage of a merger wave has a
negative moderating effect on the relationship between the US-targeted deals and the probability
of completion was not proven by the results. Thus, the third hypothesis of the empirical model
could not be accepted.
As already mentioned above, the focus has been put on the analysis of M&A activities conducted
by Dutch companies with their three most common nations of the targets and the comparison of
the US and EU merger regulation and corporate-related legislation. Although it can make the
paper relevant and useful especially for the Dutch bidders planning to engage in an M&A with
American targets, it also poses several limitations for the model, e.g. the results of the empirical
50
analysis suggest that the US-targeted transactions are expected to be less likely finalized than the
UK or Dutch-targeted ones but the effects of the alternative target nations (such as South
American, Asian or European countries other than UK and NL) on the deal completion is not
studied. In order to provide the companies with broader comparison of the potential target
nations and the factors affecting the probability of deal completion there, a larger dataset
including wider choice of target nations would be needed. However, since there is a relatively low
amount of deals made by Dutch companies and targets excluding US, UK and NL, the bidder’s
nation would probably have to be chosen differently (e.g. the USA). Such an extension of the
analysis provided in this paper by its application on different datasets can be considered one of
the potential directions for further research on this topic. Another limitation of the analysis
conducted in this paper is the simplicity of the initial regression equation testing the relationship
between the (US) target nation and the deal completion itself. In order to see whether the
relations found in this paper hold also for another empirical methods, more advanced analysis
could be conducted by a study following the present paper. In addition, due to the lack of data
connected to the country-specific merger-related regulatory factors, only four mediator variables
were used for the purpose of the paper what considerably limits the analysis conducted. A further
research could focus on another country-specific factors affecting the probability of pre-merger
deal completion from a different than legislation-based perspective to uncover more factors
relevant for this topic and make a broader overview of what characteristics of target countries can
lead to a more probable pre-merger deal failure.
Since the volume of M&A deals is expected to remain record high for the upcoming years, it is
believed that this field of study will become noticeably more important and relevant for current
deal- and policy-makers mainly due to the enormous amounts of money involved in the
transactions affecting the whole global economy. Additionally, the topic itself and the analysis
provided in this paper are considered relevant for the field of business economics and specifically
M&A since the study can be used as a basis for a further research uncovering and describing
more factors affecting the pre-merger deal failure rate and this way helping companies avoid the
costly pre-merger deal cancelation process.
51
Bibliography
Baigorri, M. (2016): “2015 Was Best-Ever Year for M&A; This Year Looks Good Too.”
Retrieved from http://www.bloomberg.com/news/articles/2016-01-05/2015-was-best-ever-
year-for-m-a-this-year-looks-pretty-good-too on 15/04/2016.
Becker, R.W./ Kirtland, M.H. (2003): “Extraterritorial Application of U.S. Antitrust Law:
What Is a Direct, Substantial, and Reasonable Foreseeable Effect Under the Foreign Trade
Antitrust Improvements Act.” Texas International Law Journal, vol.38:11, pp. 12 – 25.
Bryant, C./ Massoudi, A. (2015): “Golden Parachutes are Lead Balloon for Investors.”
Financial Times. Retrieved from http://www.ft.com/intl/cms/s/0/c860cde4-97e2-11e4-b4be-
00144feabdc0.html#axzz47PauMh1J on 02/05/2016.
Chazen, L./ Werdmuller, P. (2015): “The Dutch Poison Pill: How Is It Different from an
American Rights Plan?” Harvard Law School Forum. Retrieved from
https://corpgov.law.harvard.edu/2015/12/01/the-dutch-poison-pill-how-is-it-different-from-
an-american-rights-plan/ on 30/04/2016.
Coate, M.B./ Kleit, N. (1996): “The Economics of the Antitrust Process.” Boston: Kluwer
Academic. ISBN 0792397312, pp. 100 – 255.
Corte L./ Horbach M. (2015): “The Newfound Attractiveness of European M&A.” Retrieved
from https://www.skadden.com/insights/newfound-attractiveness-european-ma on
15/04/2016.
De Loecker J./ Konings, J./ Van Cayseele, P. (2008): “Merger Review: How Much of
Industry is Affected in an International Perspective?” J Ind Compet Trade, vol.8, pp. 1 – 19.
Epstein, R.A. (2014): “Antitrust Consent Decrees in Theory and Practice.” The AEI Press.
ISBN 9780844742502, pp. 1 – 20.
EU Merger Regulation: Council Regulation (EC) No 139/2004 (2004): “Council Regulation
on the Control of Concentrations between Undertakings.” Retrieved from http://eur-
lex.europa.eu/legal-content/en/TXT/?uri=CELEX:32004R0139 on 02/05/2016.
European Commission (2016): “Competition, Mergers and Overview of Legislation.” Retrieved
from http://ec.europa.eu/competition/mergers/overview_en.html on 03/05/2016.
European Commission (2016): “Competition, Mergers and Procedures.” Retrieved from
http://ec.europa.eu/competition/mergers/procedures_en.html on 02/05/2016.
European Commission (2016): “EU Merger Regulation Statistics.” Retrieved from
http://ec.europa.eu/competition/mergers/statistics.pdf on 02/05/2016.
Federal Trade Commission (2016): “The Antitrust Laws.” Retrieved from
https://www.ftc.gov/tips-advice/competition-guidance/guide-antitrust-laws/antitrust-laws on
20/04/2016.
Federal Trade Commission (2016): “Cases and Proceedings.” Retrieved from
https://www.ftc.gov/enforcement/cases-proceedings on 24/04/2016.
52
Federal Trade Commission (2016): “Enforcement Authority.” Retrieved from
https://www.ftc.gov/about-ftc/what-we-do/enforcement-authority on 28/04/2016.
Galli, G./ Pelkmans J. (2000): “Regulatory Reform and Competitiveness in Europe: Horizontal
Issues.” Edward Elgar Publishing, ISBN 9781782541806, pp. 120 – 163.
Gandel, S. (2014): “Did Bill Ackman Just Kill the Poison Pill?” Retrieved from
http://fortune.com/2014/11/06/bill-ackman-kill-poison-pill/ on 30/04/2016.
Gaugham, P.A. (2015): “Mergers, Acquisitions, and Corporate Restructurings.” John Wiley and
Sons, ISBN 1119063353, pp. 16 – 35.
Gelman A./ Hill, J. (2007): “Data Analysis Using Regression and Multilevel/Hierarchical
Models.” Cambridge University Press, ISBN 978-0521686891, pp. 80 – 156.
Huntsley, I. (2012): “Corporate Takeover Defense: A Shareholder’s Perspective.” Retrieved
from http://www.investopedia.com/articles/stocks/08/corporate-takeover-defense.asp on
02/05/2016.
Hosmer, D.W./ Lemeshow, S./ Sturdivant, R.X. (2013): “Applied Logistic Regression, 3rd
Edition.” Wiley. ISBN 9780470582473, pp. 210 – 450.
Kastiel, K. (2014): “To-may-to To-mah-to: 10 Surprises for a US Bidder on a UK Takeover.”
Harvard Law School Forum. Retrieved from https://corpgov.law.harvard.edu/2014/04/04/to-
may-to-to-mah-to-10-surprises-for-a-us-bidder-on-a-uk-takeover/ on 01/05/2016.
Kleinbaum, D./ Kupper , L.L./ Muller, K.E. (1988): “Applied Regression Analysis and
Other Multivariable Methods.” PWS-Kent, 2nd edition, pp. 85 – 160.
KPMG (2016): “The Seventh Wave of M&A.” Retrieved from
http://www.kpmg.com/za/en/issuesandinsights/articlespublications/transactions-
restructuring/pages/seventh-wave-of-ma.aspx on 16/04/2016.
Lam, B. (2016): “2015: A Merger Bonanza.” The Atlantic Journal. Retrieved from
http://www.theatlantic.com/business/archive/2016/01/2015-mergers-acquisitions/423096/ on
10/05/2016.
Legal Information Institute (2016): “The Sherman Act.” Retrieved from
https://www.law.cornell.edu/uscode/text/15/1 on 25/04/2016.
Legal Information Institute (2016): “The Federal Trade Commission Act.” Retrieved from
https://www.law.cornell.edu/uscode/text/15 on 29/04/2016.
Levy, N. (2004): “EU Merger Control: A Brief History.” Retrieved from
https://www.clearygottlieb.com/~/media/cgsh/files/publication-pdfs/eu-merger-control---a-
brief-history.pdf on 02/05/2016.
Lin, P./ Raj, B./ Sandfort, M./ Slottje, D. (2000): “The Antitrust System and Recent Trends
in Antitrust Enforcement.” Journal of Economic Surveys, vol.14/3, pp. 255 – 300.
Long, J.S. (1997): “Regression Models for Categorical and Limited Dependent Variables.” Sage
Publications: Advanced Quantitative Techniques in the Social Sciences, vol.7., pp. 34 – 83.
Magnan, M./ Khalil, S. (2007): “Dual-class Shares. Governance, Risks, and Rewards.” Ivey
Business Journal, Issue May/June, pp. 2 – 6.
53
Manchin, M. (2004): “Determinants of European Cross-Border Mergers and Acquisitions.”
European Commission Directorate-General for Economic and Financial Affairs. ISSN 1725-
3187, pp. 3 – 35.
Mason, M.K. (2016): “Corporate Takeovers and Defense Tactics.” Retrieved from
http://www.moyak.com/papers/canada-business-corporations-act.html on 06/05/2016.
McMorris, E. (2015): “Why Do up to 90% of Mergers and Acquisitions Fail?” Retrieved from
http://www.businessrevieweurope.eu/finance/390/Why-do-up-to-90-of-Mergers-and-
Acquisitions-Fail on 01/05/2016.
Motis, J. (2007): “Mergers and Acquisitions Motives.” Retrieved from
https://economics.soc.uoc.gr/wpa/docs/paper2mottis.pdf on 03/05/2016.
NCEO: National Center for Employee Ownership (2016): “How an Employee Stock
Ownership Plan Works.” Retrieved from https://www.nceo.org/articles/esop-employee-stock-
ownership-plan on 29/04/2016.
Noked, N. (2014): “Greenmail Makes a Comeback.” Harvard Law School Forum. Retrieved
from https://corpgov.law.harvard.edu/2014/01/22/greenmail-makes-a-comeback/ on
02/05/2016.
Pearce II, J. A./ Robinson Jr., R. B. (2004): “Hostile Takeover Defences That Maximize
Shareholders Wealth.” Business Horizons, vol. 47/5, Issue September/October, pp. 15 – 24.
Peitz, M./ Spiegel, Y. (2014): “The Analysis of Competition Policy and Sectoral Regulation.”
World Scientific. ISBN 9789814616379, pp. 440 – 485.
Phillips, H. (2013): “Vague FTC Pharma Regulations Could Deter Deals, Experts Say.”
Retrieved from http://globalcompetitionreview.com/news/article/34531/vague-ftc-pharma-
merger-regulations-deter-deals-experts-say/ on 20/04/2016.
Porzio, M. (2015): “Favorable M&A Conditions Are Here, But for How Long?” Retrieved from
http://blogs.intralinks.com/dealcloser/2015/08/favorable-ma-conditions-long/ on 25/04/2016.
Reis, N.R./ Ferreira, M.P./ Santos, J.C. (2013): “Institutional Distance and Cross-Border
Mergers and Acquisitions Completion: A Conceptual Framework.” Retrieved from
http://www3.eeg.uminho.pt/economia/nipe/iibc2013/4.2.pdf on 10/05/2016.
Slaughter and May (2015): “The EU Merger Regulation: An Overview of the European Merger
Control Rules.” Retrieved from https://www.slaughterandmay.com/media/64572/the-eu-
merger-regulation.pdf on 03/05/2016.
Smith, A./ Davies, P.J./ Foley, S. (2013): “Exchanges Divided by Dual-class Shares.”
Retrieved from http://www.ft.com/intl/cms/s/0/e18a6138-2b49-11e3-a1b7-
00144feab7de.html#axzz47PauMh1J on 01/05/2016.
Smith, T. (2003): “Convergence: A Call to Arms.” Retrieved from
http://www.kirkland.com/siteFiles/kirkexp/publications/2492/Document1/Euromoney.pdf on
06/05/2016.
Sudarsanam, S. (2003): “Creating Value from Mergers and Acquisitions: The Challenges.”
Pearson Education Limited. ISBN 0201721503, pp. 194 – 524.
54
Sundaramurthy, C. (2000): “Antitakeover Provisions and Shareholder Value Implications: A
Revie and a Contingency Framework.” Journal of Management, vol. 26, Issue 5, pp. 1005 – 1030.
Teen, M.Y. (2015): “Say No to Dual-class Shares.” Retrieved from
http://governanceforstakeholders.com/2015/11/28/say-no-to-dual-class-shares/ on
01/05/2016.
The Guardian (2012): “Employee Share Ownership: What You Need to Know.” Retrieved from
http://www.theguardian.com/social-enterprise-network/2012/dec/03/employee-share-
ownership-business-model on 02/05/2016.
Tsang, A. (2015): “Morning Agenda: Regulations Create Obstacles for Railway Mergers.”
Retrieved from http://news.blogs.nytimes.com/2015/12/21/morning-agenda-regulations-
create-obstacles-for-railway-mergers/?_r=2 on 05/05/2016.
UKSA: UK Shareholders’ Association (2016): “UKSA Policy: Mergers, Takeovers, Poison Pills
and Competition Law.” Retrieved from http://www.uksa.org.uk/policy_mergers_takeovers on
02/05/2016.
US General Accounting Office (1990): “Changes in Antitrust Enforcement Policies and
Activities.” Retrieved from https://searchworks.stanford.edu/view/1837336 on 29/04/2016.
Veazie, P.J. (2006): “When to Combine Hypotheses and Adjust for Multiple Tests.” Health
Services Research, vol.43/3, pp. 804 – 818.
Wilke, P. (2014): “Country Reports on Financial Participation in Europe.” Retrieved from
http://www.worker-participation.eu/National-Industrial-
Relations/Countries/Netherlands/Financial-Participation/Basic-Data-on-Profit-Sharing-
Employee-Share-Ownership on 30/04/2016.
Yoon, E. (2015): “2016 Outlook: Health Care.” Retrieved from
https://www.fidelity.com/viewpoints/investing-ideas/2016-outlook-healthcare on 22/04/2016.
Zuhairy, H.E./ Taher, A./ Shafei, I. (2015): “Post-Mergers and Acquisitions: The Motives,
Success Factors and Key Success Indicators.” Eurasian Journal of Business and Management,
vol.3, Issue 2, pp. 1 – 11.
Zephyr (2016): “Comprehensive M&A Database.” Retrieved from
https://zephyr.bvdinfo.com/version-2016511/Home.serv?product=zephyrneo on 25/04/2016.
World Bank Database (2016): “Ease of Doing Business Indicators.” Retrieved from
http://www.doingbusiness.org/rankings on 24/04/2016.
World Bank Database (2016): “World Governance Indicators.” Retrieved from
http://info.worldbank.org/governance/wgi/index.aspx#home on 25/04/2016.
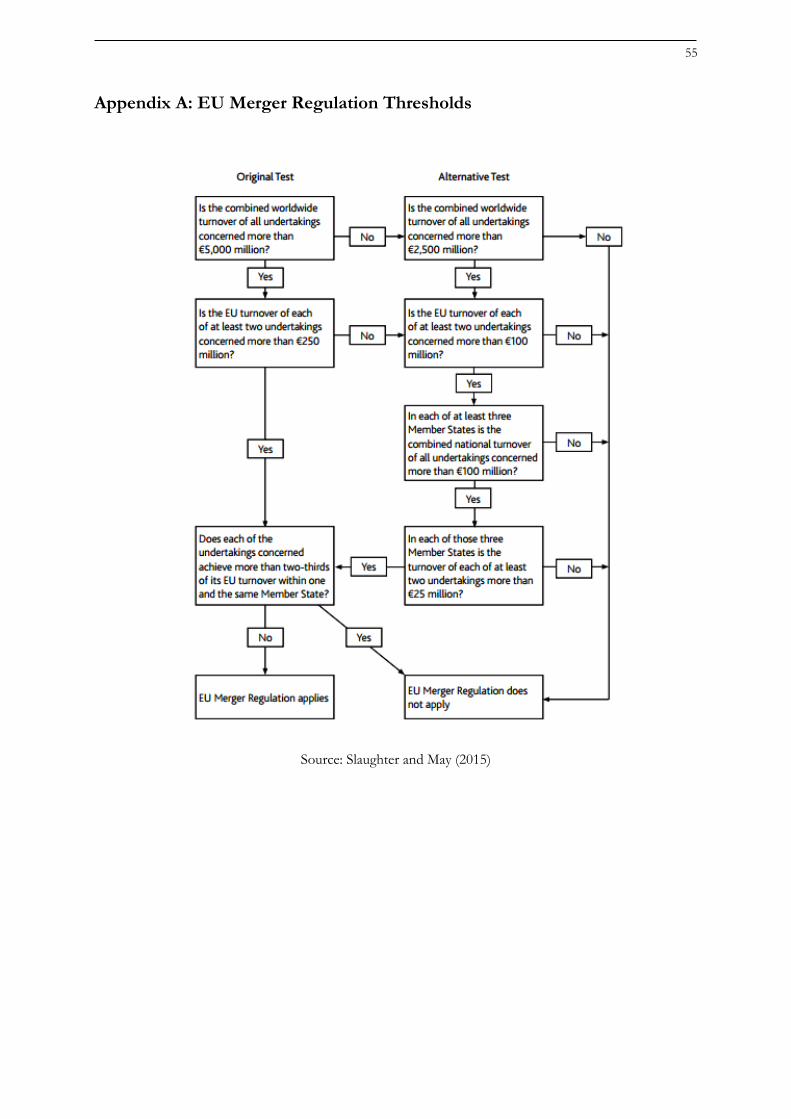
55
Appendix A: EU Merger Regulation Thresholds
Source: Slaughter and May (2015)


![CECH EXTENSIONS OF CONTRAVARIANT FUNCTORSC) · Eilenberg and Steenrod [7], for proofs of the axioms for the classical Cech coho-mology theory carry over to our general Cech functor](https://img.dokumen.tips/doc/110x75/5eda9e0809f66a09130ba343/cech-extensions-of-contravariant-functorsc-eilenberg-and-steenrod-7-for-proofs.jpg)