Embed Size (px)
Citation preview
1
In partnership with with the support of
Harnessing Potential
T H E A S I A - P A C I F I C A L T E R N A T I V E F I N A N C EB E N C H M A R K I N G R E P O R T
Bryan Zhang Luke Deer
Robert Wardrop Andrew Grant Kieran Garvey
Susan Thorp Tania Ziegler
Kong Ying Zheng Xinwei
Eva Huang John Burton
Hung-Yi Chen Alexis Lui
Yvonne Gray
March 2016

ContentsExecutive Summary 18Introduction 21The Size and Growth of the Online Asia-Pacific Alternative Finance Market 25The Geographic Distribution of Alternative Finance in the Asia-Pacific Region 27The Dynamics of the Asia-Pacific Online Alternative Finance Market 30The Diversity of the Asia-Pacific Online Alternative Finance Industry 32Online Alternative Business Finance in the Asia-Pacific 41Asia-Pacific Online Alternative Finance Market Fundamentals 43Regulatory Development and Industry Perceptions of Regulations 58
Market Development by Country and Region 63Mainland China 64East Asia 67
Japan 69South Korea 71 Hong Kong 73Taiwan 74
Oceania 75Australia 75New Zealand 77
South Asia 79India 80
South-East Asia 82Singapore 84Malaysia 86Indonesia 87Thailand 87The Philippines 87
Conclusion 88Acknowledgements 90Endnotes 92
4
Research Team
Bryan ZhangBryan Zhang is a Director of the Cambridge Centre for Alternative Finance and a Research Fellow at the Cambridge Judge Business School. He has co-authored six industry reports on alternative finance.
Luke DeerLuke Deer is a Post-doctoral Research Associate at The University of Sydney and a Research Associate with the Cambridge Centre for Alternative Finance, Cambridge Judge Business School. He researches on alternative finance in China and the Asia-Pacific.
Robert WardropRobert Wardrop is the Executive Director of the Cambridge Centre for Alternative Finance and a Research Fellow at the Cambridge Judge Business School.
Andrew GrantAndrew Grant is a Senior Lecturer in the Discipline of Finance at The University of Sydney Business School. He researches behavioural finance and decision making processes by retail and institutional investors in financial and betting markets.
Kieran GarveyKieran Garvey, Policy Programme Manager, Cambridge Centre for Alternative Finance, Cambridge Judge Business School. His research interests include the application of alternative finance within developing countries, renewable energy and early stage ventures.
Susan ThorpSusan Thorp is a Professor in the Discipline of Finance at The University of Sydney Business School. Susan researches life cycle finance, particularly individual financial decision making, and financial market integration.
Tania ZieglerTania Ziegler is the Research Programme Manager, Cambridge Centre for Alternative Finance, Cambridge Judge Business School. Her research interests include small business economics and SME utilization of alternative funding models.
5
Harnessing Potential — March 2016
Research Team
Kong YingKong Ying is a Professor and the Dean of Social Sciences and Management at the Tsinghua University Graduate School at Shenzhen.
Zheng XinweiZheng Xinwei is an Assistant Professor at the Tsinghua University Graduate School at Shenzhen.
Eva HuangEva Huang is a Lecturer in Business Law at The University of Sydney Business School. Eva researches China's taxation policies, laws and Internet finance.
John BurtonJohn Burton is a Research Associate at the Cambridge Centre for Alternative Finance. He achieved his PhD in astronomy and has been working in large-scale data analysis and modelling for over 10 years. He built his own crowdfunding platform for charitable causes.
Hung-Yi ChenHung-Yi Chen is an Assistant Research Fellow at the Centre for Internet Finance Law Innovation, Shanghai Jiao Tong University and a PhD Candidate at the Graduate School of Law, Nagoya University.
Alexis LuiAlexis Lui is a researcher at the Cambridge Centre for Alternative Finance, Cambridge Judge Business School. His research interests include the e�ciencies and advantages of alternative finance models, particularly the evolution of credit analytics.
Yvonne GrayYvonne Gray is a Research Assistant at the University of Sydney Business School. She has worked for university research centres and industry bodies in the finance sector for more than 20 years.
6
Forewords
Robert WardropExecutive Director, Cambridge Centre for Alternative Finance
This research report is the first of what we at the Cambridge Centre for Alternative Finance hope will be annual reports analysing online alternative finance activity across the Asia-Pacific region, and it follows similar studies we have conducted for the UK, Europe, and the Americas (forthcoming). This project has been our most challenging to date, and could not have succeeded without the collaboration of our many research partners located across the region. In contrast with the other markets we have analysed, the Asia Pacific region stands out as a model of extreme variation, containing both the country having the world’s largest and fastest growing market for online alternative finance and countries that have barely observable levels of this activity. Our title for year’s report, Harnessing Potential, reflects the common challenge that all countries in the region face regardless of the state of alternative finance development: the challenge of harnessing, or taking control and making use of, alternative channels of finance to enable innovation, creativity and inclusion in their respective economies. We hope the findings contained in this report will assist those addressing that challenge.
Professor Greg WhitwellDean of The University of Sydney Business School
In a world in which much of the rhetoric of business and government leaders is about the importance of innovation and the challenges and opportunities provided by digital disruption and new business models, online alternative finance is a perfect symbol of the transformation of the global economy by digital means. It is a form of innovation that is helping borrowers and fundraisers to do innovative things. We know that online alternative finance has grown quickly but until now we have been largely ignorant of its dimensions. For the first time we can now speak with some confidence about the nature and size of online alternative finance in the Asia-Pacific region. We can better understand its multiple forms, its complexity and its innovative characteristics, and appreciate, for the first time, the relative importance of women as funders and borrowers. In some cases, innovation is stifled by regulation and in others, innovation is driven by a desire to escape regulation. This report will inform the inevitable debates about the way in which alternative finance is and should be regulated. It will hopefully lead to a more cogent discussion about what can and should be done. I see this study as a prime example of the way research should be conducted: in partnership with a variety of organizations around the world, each sharing knowledge and resources and working together to better understand the way in which the business environment is being transformed locally, regionally and globally. We are proud to be part of this important initiative.
7
Harnessing Potential — March 2016
Professor Kong YingDean of Social Sciences and Management at the Tsinghua University Graduate School at Shenzhen
Many new and innovative financial services, such as crowdfunding, online payments, web-based credit analytics and peer-to-peer lending, are expanding their reach and permeation into all business sectors.
These alternative forms of finance are still in their infancy and are not properly understood. This report provides us with a helpful starting point to objectively and quantitatively examine this industry here in China and more widely in the Asia-Pacific region, in turn, contributing to regulatory and academic research. As with the development of any new business model, the alternative finance industry will also need to go through a period of transition to reach maturity. Alternative forms of finance need to develop within many constraints and grow with purposes, including serving the mainstream economy, adhering to regulatory requirements, promoting financial stability, protecting consumer rights, ensuring fair competition and emphasising the importance of self-discipline. This report provides authoritative information and useful reference for regulators, academics, practitioners in the industry and also the public. We hope this annual report will be a useful reference point to fill the gaps in current knowledge and to contribute to the healthy and sustainable growth of the alternative finance industry.
8
Forewords
Ian PollariPartner, Global Co-lead of Fintech, KPMG
Alternative finance is one of the fastest-growing sectors of the global financial services industry, with 2015 witnessing an unprecedented level of funding. Asian fintech start-ups had a record year for investment activity, raising a total of USD$4.5 billion.
As the first comprehensive study of the Asia-Pacific online alternative finance market, this research contributes to the growing body of data supporting the region’s potential. The report highlights China’s position as the world’s largest online alternative finance market and details the broad-based ascent of the sector across the rest of the Asia-Pacific region.
2016 is predicted to be the year where ‘alternative’ financial options finally join the ranks of the mainstream. We foresee continued growth in awareness amongst Asian consumers and businesses of the viable funding options alternative finance platforms can provide. We also anticipate greater levels of collaboration between incumbent financial organisations and alternative finance platforms, following the trend observed in the US and UK markets.
With five of the world’s top 10 countries based on smartphone ownership coming from the region and observing higher rates of female participation in alternative finance markets, Asia has the potential to create world-leading online lending and funding platforms. KPMG is proud to partner with the University of Cambridge, Tsinghua University and The University of Sydney on this important initiative and we look forward to engaging key stakeholders in the Asia-Pacific alternative finance eco-system over the coming months.
9
Harnessing Potential — March 2016
Rosana MirkovicHead of SME Policy, ACCA Global
Innovation is one of ACCA’s core values – and few people know more about financing business than our members. Alternative finance is a deliberately broad term – it covers both commercial and social enterprise, both established financial products delivered in new ways as well as products and services that have never existed before. All are connected by the conviction that there must be better ways of getting funding to where it is needed, if only we are willing to cross briefly into uncharted territory. These days, it is arguably no longer the US and the UK that are leading the race for innovation in financial services and this study recognises the need for reliable data on the development of the sector in Asia-Pacific. We are therefore extremely pleased to support this regional insight on the sector, look forward to its continued growth, and want accountants - businesses’ most trusted advisers - to be part of this dynamic financial services industry.
Rumi MoralesExecutive Director, CME Ventures, CME Group
The world of banking and financial services is changing swiftly and dramatically, with alternatives to traditional products and services being introduced daily, significantly impacting the way people and institutions use money. Previously, financial technology could be regarded as applications of traditional financial services upon existing technologies, but today, we are witnessing truly novel inventions with participation from previously untapped markets. Crowdfunding and peer-to-peer lending are just a few examples where new participants are accessing technological innovations to create new marketplaces.
To this end, this report could not be more important or timely. The size and growth of the online alternative finance market, new entrants and partnerships, and the impacts on regulation and tax incentives, have the potential to transform the global economy. But this transformation can be best achieved only with thoughtful analysis and a thorough understanding of the alternative finance landscape. CME Group, as the world’s leading and most diverse derivatives marketplace, is proud to support the publication of this report through its Foundation. We believe that it is with informed view of the possible future, we can work to achieve new opportunities and economic prosperity through financial innovation.
10
We would like to acknowledge the generous support received from the following research partners
11
Harnessing Potential — March 2016
Business Loans Funded By You and Me
We would like to thank the following platforms for their contribution
Startup Funding Made Easy
Startup Funding Made Easy
12
Platforms
13
Harnessing Potential — March 2016
14
Platforms
15
Harnessing Potential — March 2016
16
Platforms
17
Harnessing Potential — March 2016
Executive SummaryOnline alternative finance is developing rapidly in the Asia-Pacific region. It is characterised by innovative financial instruments and channels that fall outside the traditional avenues of capital raising and financial intermediation. From reward-based crowdfunding to peer-to-peer consumer and business lending (i.e. marketplace lending), to invoice trading and equity-based crowdfunding, these online alternative finance activities are directly connecting lenders to consumer and small business borrowers, raising venture capital for start-ups, funding the creative industries and creating new ways for individuals and institutions to choose how and to whom money is distributed, lent and invested.
19
Harnessing Potential — March 2016
This benchmarking research is the first comprehensive study of the Asia-Pacific online alternative finance market. It has been conducted by an international research team from the Cambridge Centre for Alternative Finance at Cambridge Judge Business School, the Tsinghua University Graduate School at Shenzhen and The University of Sydney Business School, in partnership with KPMG and with the support of the ACCA and CME Group Foundation. Working with over 20 industry research partners, together we have systematically collected survey data from 503 leading alternative finance platforms operating in 17 Asia-Pacific countries and regions, out of which, 376 were from mainland China.
Our definition of online alternative finance focuses on the provision of finance to individuals and businesses through alternative channels via online marketplaces outside of the banking system. It excludes activities such as peer-to-peer insurance, online money market funds or third-party payments. The report captures an estimated 70% of the visible market, and estimates that the total Asia-Pacific online alternative finance market grew 323% year-on-year to reach $102.81 billion USD in 2015.
Market Size and Growth
China is the world’s largest online alternative finance market by transaction volume, registering $101.7 billion (or RMB 638.79 billion) in 2015.1 This constitutes almost 99% of the total volume in the Asia-Pacific region. In comparison, the total size of the UK online alternative finance market was $4.5 billion (or £3.2 billion) in 2015.2 The Chinese online alternative finance market grew from a relatively low base of $5.56 billion in 2013 to reach $24.30 billion in 2014 and then went on to reach $101.7 billion in 2015 – an average growth rate of 328% between 2013 and 2015. Marketplace/peer-to-peer consumer lending is the largest market segment in China with $52.44 billion lent, followed by marketplace/peer-to-peer business lending ($39.63 billion) and real estate lending ($5.51 billion). Online invoice trading reached $1.46 billion, equity-based crowdfunding recorded $948.26m and reward-based crowdfunding rose to $829.52m in 2015.
Excluding mainland China, the rest of the Asia-Pacific region recorded a volume of USD $1.12 billion in 2015 with a 313% year-on-year growth rate from the $271.94 million raised in 2014. Japan’s online alternative finance market accrued $360.23m in 2015, followed by $348.37m originated in Australia, $267.77m in New Zealand, $41.18m in South Korea, $39.91m in India and $39.76m in Singapore. However, New Zealand has the highest alternative finance volume on a per capita basis outside of China with $59.37 per capita, followed by Australia ($14.83), Singapore ($7.27), Japan ($2.83) and Hong Kong ($1.28). China’s alternative finance market volume per capita stands at $74.54 in 2015.
In terms of prevailing market segments outside of China, marketplace/peer-to-peer business lending was the largest with $355.51m, followed by market/peer-to-peer consumer lending ($326.22m), balance sheet business lending ($120.62m), invoice trading ($116.95m), reward-based crowdfunding ($81.22m) and equity-based crowdfunding ($64.13m).
20
Executive Summary
Alternative Business Financing and Institutional Funding
Business financing accounted for 44% of total online alternative finance activity in China with a total of $45 billion in 2015. Outside of China, the total volume of online alternative business funding reached $686 million in the Asia-Pacific region in 2015, growing from $103 million in 2013 to $191 million in 2014, with an average growth rate of 172% per annum over the period 2013 to 2015.
The level of institutional funding in online alternative finance is notably higher in the wider Asia-Pacific region than it is in mainland China. Institutional investors funded 63% of the financing for marketplace/peer-to-peer consumer lending in the Asia-Pacific region outside of China, for example, versus just 10% of the marketplace/peer-to-peer consumer lending volume in China. While the funding side of the Chinese online alternative finance market appears to be dominated by individual investors, there is a high level of institutional ownership of alternative finance platforms in China. Approximately 23% of surveyed Chinese platforms indicated that either a traditional financial institution (i.e. a bank) or other types of institution investor owned a majority interest in the platform - a much higher level than the rest of the Asia-Pacific region (6%). A further 15% of surveyed Chinese platforms stated that a major corporation, such as an e-commerce company, is a majority shareholder.
Funders and Fundraisers
The Asia-Pacific region appears to have relatively high rates of female participation in the online alternative finance markets. According to our survey responses, in the Asia-Pacific countries (excluding China), 33% of the borrowers on marketplace/peer-to-peer consumer lending platforms are women, and 23% and 13% of fundraisers/entrepreneurs in rewards and equity-based crowdfunding are also women. In China, the female market participation rate is also high, with around 40% of the lenders on marketplace/peer-to-peer consumer and business lending platforms being women. Approximately 19% of the borrowers on marketplace/peer-to-peer business lending platforms and over 10% of the fundraisers on equity-based crowdfunding platforms are women as well.
Regulation and Industry Perception
The regulatory environment for alternative finance across the Asia-Pacific is diverse and rapidly changing. Whilst some countries such as Singapore and Thailand have opted to regulate alternative finance within pre-existing regulatory frameworks, others, such as Malaysia, New Zealand and recently South Korea, have created bespoke regulation to govern equity and debt-based alternative finance activities. In general, the surveyed platforms in New Zealand and Malaysia felt their existing and proposed regulation is adequate and appropriate, while platforms operating in Japan and South Korea were more concerned that the regulation in their respective jurisdictions is too strict and excessive. In China, across alternative finance models, more than half of surveyed platforms (with the exception of equity-based crowdfunding) deemed the existing regulation to be either inadequate and too relaxed, or recognised the need for specific regulation to be implemented.
Harnessing Potential
This report has demonstrated that the Asia-Pacific online alternative finance market is fluid, diverse, increasingly complex and growing at a rapid pace. The opportunities for the world's most populous region to harness the potential of alternative finance for innovation, economic growth, market e�ciency, and creativity are abundant. The present challenge is how to best nurture the alternative finance industry, grow the market in a sustainable manner and develop an appropriate and proportionate regulatory regime that strikes the right balance between encouraging financial innovation and protecting the interests of consumers and investors.
IntroductionThis is the first comprehensive study of online alternative finance activities in the Asia-Pacific region. The key source of data is primary data we collected from a survey of online alternative finance platforms across China, Oceania, and East, South-East & South Asia. Our analysis characterises the size, model and development of this nascent and exciting area of finance and conveys some views held by the platforms on regulation. We believe this report will be of interest to regulators, policymakers, alternative finance industry, academics, business communities and the general public.
22
The Need for Research
The rise of new online alternative finance platforms has gained international attention in developed English-speaking markets - particularly in the United States and United Kingdom. Though there have been studies of the alternative finance industries in the UK3 , Europe4 and China, there have been no comprehensive, academically-rigorous studies of alternative finance across the entire Asia-Pacific region.
With a quickly growing Asia-Pacific alternative finance industry, it is becoming increasingly important to understand the growth and development of the sector to inform policy making, business practice, to raise public awareness and to contribute to academic research in order to harness the potential of alternative finance. The Asia-Pacific region includes China’s online alternative finance market, which makes up the bulk of the region’s activity. China’s alternative finance market has attracted recent international attention due to its large size, but also due to perceived inherent risks in its high rate of growth. While there have been several industry reports published by Chinese companies, this is the first study to attempt to benchmark the Chinese market with a set of comparable international standards.
The diversity, innovation and intricacy of the various emerging alternative finance models in the Asia-Pacific region deserve critical examination and closer scrutiny. There is an urgent policy need to study the Asia-Pacific alternative finance market, given that it is largely unregulated with many countries currently developing their respective regulatory frameworks. New and proposed regulations are being debated in many countries, including Australia, Singapore, South Korea and China. Given the rapid development of the sector, it is crucial that policies and regulation are informed by up-to-date and rigorous studies to facilitate data-driven, evidence-based approaches in order to best harness the sector’s potential.
An Asia-Pacific Area Study
The Asia-Pacific region is vast, both in terms of geography and population, as well as being one of the most culturally diverse regions in the world. It spans mainland China, East Asia, Oceania, South East Asia and South Asia. The region encompasses capital-rich developed markets including Japan, South Korea, Australia, New Zealand, Singapore and Hong Kong. It also includes many of the most populous and fastest growing developing countries in the world - including China, India, Indonesia, Malaysia, the Philippines and Thailand. Our benchmarking research has gathered validated survey responses from 17 countries in the region.
A Collaborative Research Strategy
The challenge of identifying and conducting a primary survey across such a wide range of countries, cultures and languages could only be achieved through a collaborative research approach. In the first instance, this involved a partnership between three main university research institutions: the Cambridge Centre for Alternative Finance at the University of Cambridge Judge Business School, The University of Sydney Business School and the Tsinghua Graduate School in Shenzhen in mainland China. Our core research team also expanded to include researchers from Nagoya University in Japan, Ahmedabad University in India and the University of Amsterdam in the Netherlands. The Shanghai Jiaotong University Centre for Internet Finance Law Innovation in Shanghai also participated in the research project once the survey was underway.
Over 20 industry research partners also joined the project. The survey is supported by KPMG, the ACCA, CME Group Foundation and 20 leading alternative finance industry and academic research partners across Asia-Pacific and beyond. These include: Crowdfunding Institute of Australia, LendIt, Crowdfund China Society, Hong Kong Crowdfunding Association, Wangdaizhijia, New Zealand Crowdfunding Society, Japan Crowdfunding Council, Crowdfund Asia Association, Korean FinTech Forum, Shenzhen Crowdfunding Association, Change Fusion Thailand,
Introduction
23
Harnessing Potential — March 2016
World Crowdfunding Conference, Crowdsourcing Week, Crowdfund Vibe, FinTech Hong Kong, Asian Venture Philanthropy Network, China UnionPay Smart Big Data Centre, Crowdfund Insider and Thomson Reuters.
Online Questionnaire
To ensure the consistency and validity of this benchmarking exercise, the research team sought to collect aggregate-level market data directly from alternative finance platforms via a secure web-based questionnaire. The survey aimed to capture the size and type of alternative finance activity across models in the Asia-Pacific region between 2013 and 2015. The survey was written and distributed in English and translated and distributed in Chinese (simplified and traditional), Japanese and Korean. The survey included a platform-model taxonomy which was derived from our previous benchmarking exercises in the UK and Europe, and this taxonomy was further refined to reflect model developments observed in the course of our recent Americas benchmarking study. A consistent taxonomy allows for comparative global research, which is defined later in the report. All crowdfunding, marketplace/peer-to-peer lending and other alternative finance platforms operating in the Asia-Pacific region were invited to contribute to the survey, which remained open for 3 months from November 12th 2015 until February 10th 2016. An intensive programme of work was carried out by a large research team in order to engage with platforms individually across the 17 countries and regions surveyed.
Survey Responses, Data Verification and Analysis
A total of 503 platforms based in the Asia-Pacific region completed the primary survey. Of these, 376 came from mainland China and 127 from the rest of the Asia-Pacific region. As this study relies primarily upon self-reported data, individual survey responses were anonymised and then aggregated by model to produce the reported data. We estimate that for Asia-Pacific countries excluding China, we captured approximately 85% of the total market volume in the region, with only a handful of platforms operating at significant scale unable to participate in our benchmarking survey.
For mainland China, in addition to the 376 primary survey responses, we were able to draw on data from our research partners Wangdaizhijia and the Shanghai Jiaotong Centre for Internet Finance Law Innovation for the top 100 leading alternative finance platforms, measured by market volume in mainland China. The rapidly developing scale, fragmentation and unregulated nature of online alternative finance in China means that there is no verifiable, publicly available database that details the volume and permeation of online alternative finance activity in the country. However, we are confident that the data collected during the course of this study is the most reliable data set currently available.
We sought to verify the Asia-Pacific region survey data and the mainland China survey data in two ways. For platforms in Asia-Pacific countries outside of China, we checked the primary reported survey data against the online reporting by platforms themselves for both volume and financing model type. Where there were discrepancies, or the data had not been broken down by model type, for instance marketplace/peer-to-peer consumer and business lending, or mixed crowdfunding models, we sought to directly verify the data and financing breakdown with the platforms by phone or email. For mainland China, we conducted online checks of all of the platforms which had reported mixed financial models, which accounted for over one third of those surveyed, to verify the specific types of financing models. Our research partner Wangdaizhijia also cross-checked the total reported financing volume for each platform with their
24
Introduction
own data where available in 2013, 2014 and 2015. Where there were large di¯erences in the reported survey volume for a platform versus Wangdaizhijia’s data, we revised the reported survey data downward to a level more in line with Wangdaizhijia’s estimates. Wangdaizhijia is an online data provider which tracks Internet finance in China and whose data gathering is based upon direct telephone surveys and online scraping of platforms operating within mainland China.
One of the challenges of collecting and verifying data in China is accurately classifying the nature of many Internet finance platforms. Platforms may describe themselves as facilitating marketplace or peer-to-peer lending in China, but in reality are operating wealth management companies and unregulated shadow banks. These companies advertise online products o¯ering a certain ‘expected return’, but aside from checking the reported volume, we have no way of verifying their real financial models and activities. We discuss these questions in more detail in our mainland China section of the report. With this caveat in mind, we estimate that our survey captured 70% of the visible online alternative finance market in China.
Furthermore, in order to obtain the most up-to-date alternative finance volumes available, some platforms were scraped for data to complement the surveys distributed. This was achieved through the use of python scripting and widely-used web-scraping methodologies. We then verified this data by matching it against platform published figures for the past 6 years before adding this platform data to the primary data set.
After the data verification stage, all individual alternative finance platform-specific data was anonymised and analysed in aggregate, by model, region and country. For these reasons, our results can be viewed as a relatively robust and cautious measure of the sector.
25
Harnessing Potential — March 2016
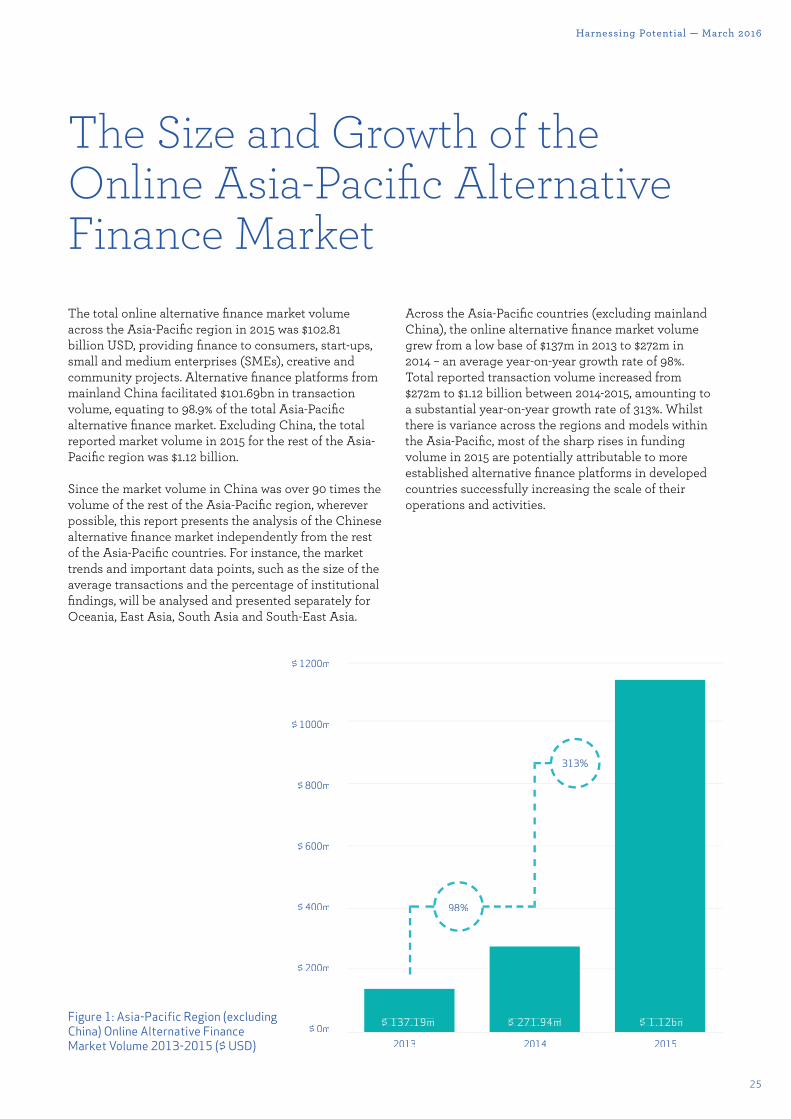
The Size and Growth of the Online Asia-Pacific Alternative Finance MarketThe total online alternative finance market volume across the Asia-Pacific region in 2015 was $102.81 billion USD, providing finance to consumers, start-ups, small and medium enterprises (SMEs), creative and community projects. Alternative finance platforms from mainland China facilitated $101.69bn in transaction volume, equating to 98.9% of the total Asia-Pacific alternative finance market. Excluding China, the total reported market volume in 2015 for the rest of the Asia-Pacific region was $1.12 billion.
Since the market volume in China was over 90 times the volume of the rest of the Asia-Pacific region, wherever possible, this report presents the analysis of the Chinese alternative finance market independently from the rest of the Asia-Pacific countries. For instance, the market trends and important data points, such as the size of the average transactions and the percentage of institutional findings, will be analysed and presented separately for Oceania, East Asia, South Asia and South-East Asia.
Across the Asia-Pacific countries (excluding mainland China), the online alternative finance market volume grew from a low base of $137m in 2013 to $272m in 2014 – an average year-on-year growth rate of 98%. Total reported transaction volume increased from $272m to $1.12 billion between 2014-2015, amounting to a substantial year-on-year growth rate of 313%. Whilst there is variance across the regions and models within the Asia-Pacific, most of the sharp rises in funding volume in 2015 are potentially attributable to more established alternative finance platforms in developed countries successfully increasing the scale of their operations and activities.
2013 2014 2015
$ 137.19m $ 271.94m $ 1.12bn
313%
98%
$ 1200m
$ 1000m
$ 800m
$ 600m
$ 400m
$ 200m
$ 0mFigure 1: Asia-Pacific Region (excluding China) Online Alternative Finance Market Volume 2013-2015 ($ USD)
26
The Size and Growth of the Online Asia-Pacific Alternative Finance Market
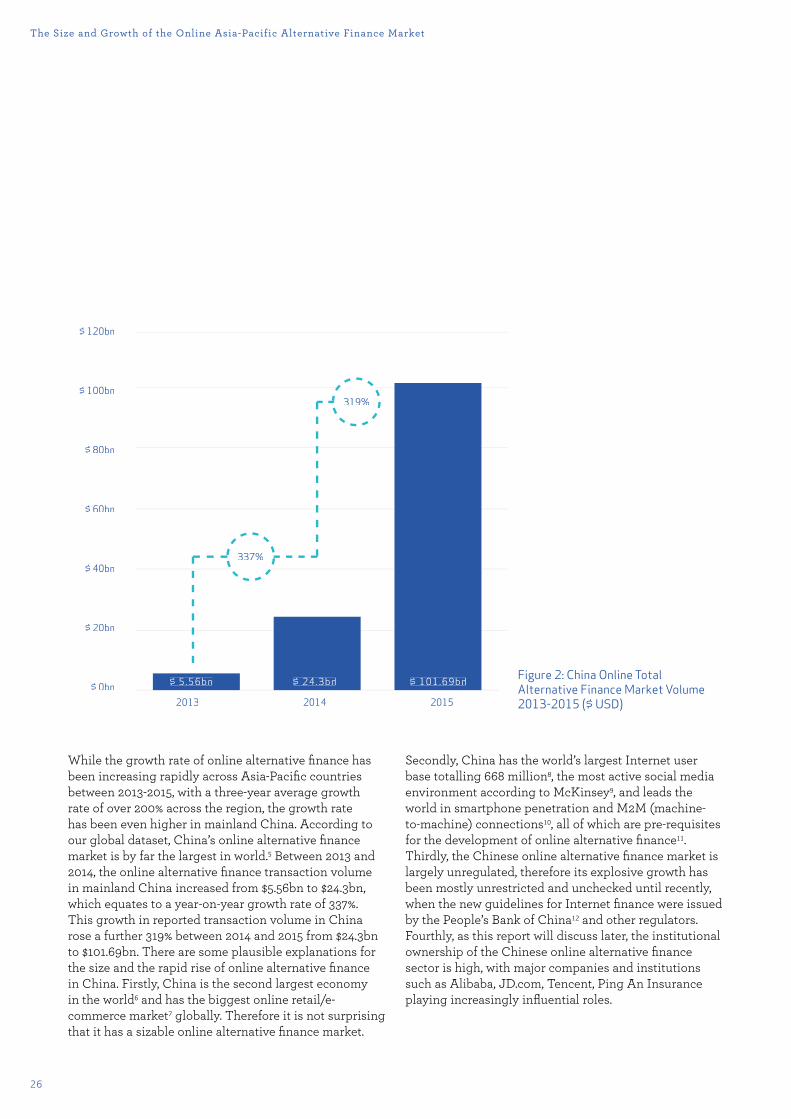
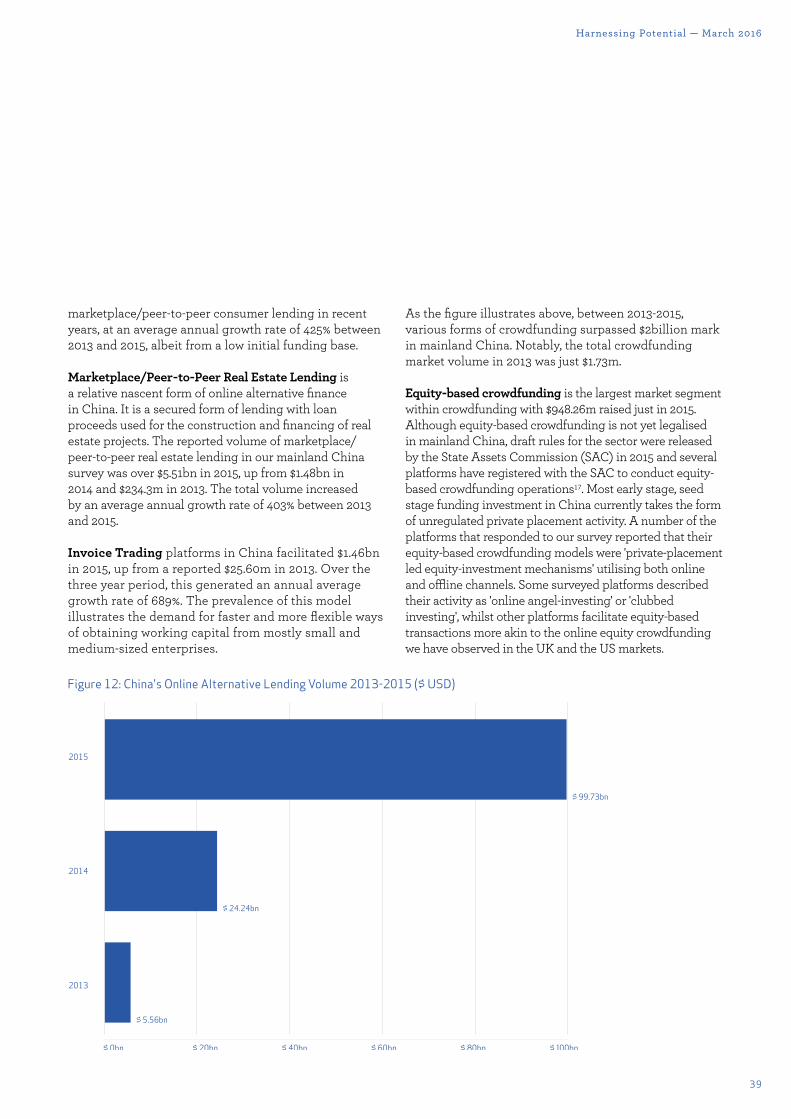
While the growth rate of online alternative finance has been increasing rapidly across Asia-Pacific countries between 2013-2015, with a three-year average growth rate of over 200% across the region, the growth rate has been even higher in mainland China. According to our global dataset, China’s online alternative finance market is by far the largest in world.5 Between 2013 and 2014, the online alternative finance transaction volume in mainland China increased from $5.56bn to $24.3bn, which equates to a year-on-year growth rate of 337%. This growth in reported transaction volume in China rose a further 319% between 2014 and 2015 from $24.3bn to $101.69bn. There are some plausible explanations for the size and the rapid rise of online alternative finance in China. Firstly, China is the second largest economy in the world6 and has the biggest online retail/e-commerce market7 globally. Therefore it is not surprising that it has a sizable online alternative finance market.
Secondly, China has the world’s largest Internet user base totalling 668 million8, the most active social media environment according to McKinsey9, and leads the world in smartphone penetration and M2M (machine-to-machine) connections10, all of which are pre-requisites for the development of online alternative finance11. Thirdly, the Chinese online alternative finance market is largely unregulated, therefore its explosive growth has been mostly unrestricted and unchecked until recently, when the new guidelines for Internet finance were issued by the People’s Bank of China12 and other regulators. Fourthly, as this report will discuss later, the institutional ownership of the Chinese online alternative finance sector is high, with major companies and institutions such as Alibaba, JD.com, Tencent, Ping An Insurance playing increasingly influential roles.
Figure 2: China Online Total Alternative Finance Market Volume 2013-2015 ($ USD)2013 2014 2015
$ 5.56bn $ 24.3bn $ 101.69bn
$ 120bn
$ 100bn
$ 80bn
$ 60bn
$ 40bn
$ 20bn
$ 0bn
319%
337%
27
Harnessing Potential — March 2016
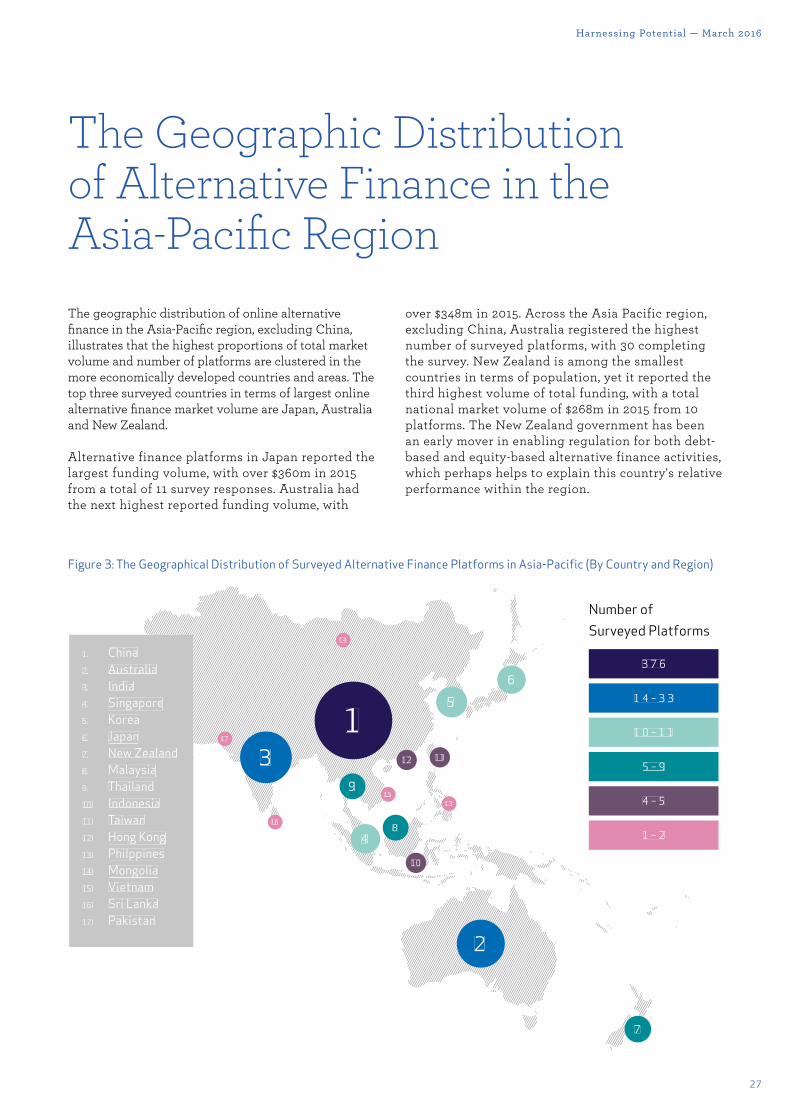
The Geographic Distribution of Alternative Finance in the Asia-Pacific Region The geographic distribution of online alternative finance in the Asia-Pacific region, excluding China, illustrates that the highest proportions of total market volume and number of platforms are clustered in the more economically developed countries and areas. The top three surveyed countries in terms of largest online alternative finance market volume are Japan, Australia and New Zealand.
Alternative finance platforms in Japan reported the largest funding volume, with over $360m in 2015 from a total of 11 survey responses. Australia had the next highest reported funding volume, with
over $348m in 2015. Across the Asia Pacific region, excluding China, Australia registered the highest number of surveyed platforms, with 30 completing the survey. New Zealand is among the smallest countries in terms of population, yet it reported the third highest volume of total funding, with a total national market volume of $268m in 2015 from 10 platforms. The New Zealand government has been an early mover in enabling regulation for both debt-based and equity-based alternative finance activities, which perhaps helps to explain this country's relative performance within the region.
1. China2. Australia3. India4. Singapore5. Korea6. Japan7. New Zealand8. Malaysia9. Thailand10. Indonesia11. Taiwan12. Hong Kong13. Philppines14. Mongolia15. Vietnam16. Sri Lanka17. Pakistan
1
14
13
17
16
15
5
12
8
10
9
4
11
6
2
7
3
Number of Surveyed Platforms
3 7 6
1 4 – 3 3
1 0 – 1 1
5 – 9
4 – 5
1 – 2
Figure 3: The Geographical Distribution of Surveyed Alternative Finance Platforms in Asia-Pacific (By Country and Region)
28
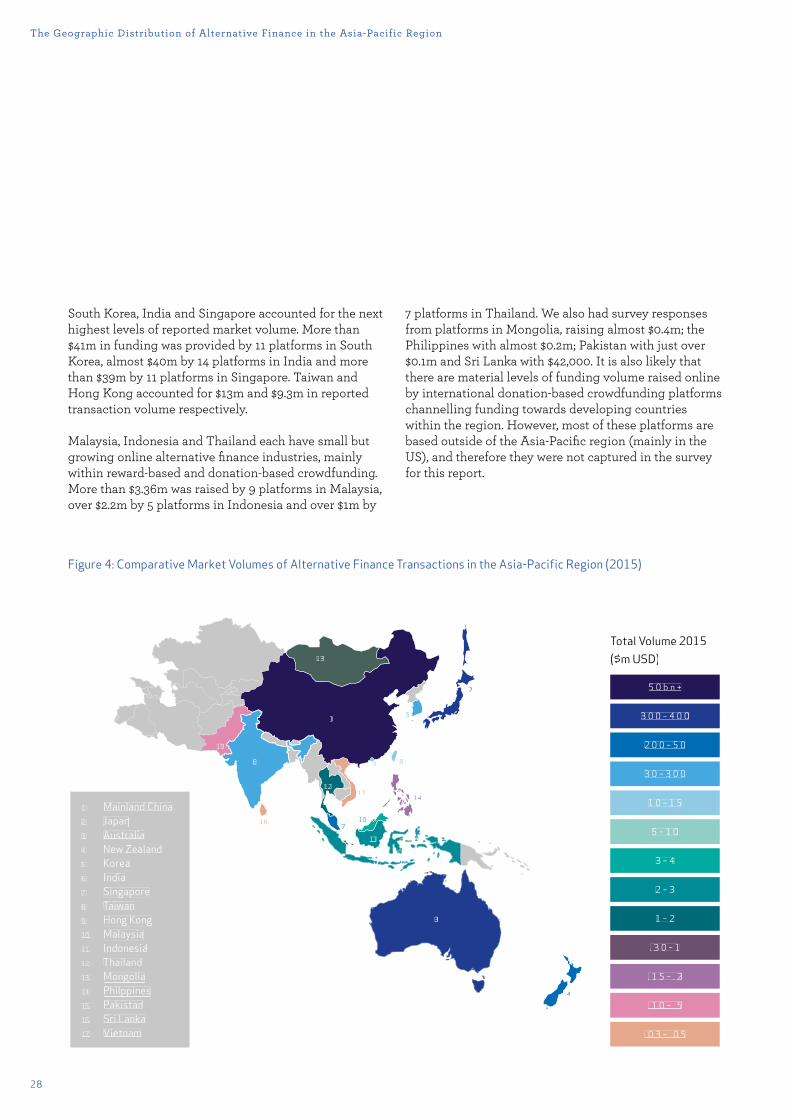
South Korea, India and Singapore accounted for the next highest levels of reported market volume. More than $41m in funding was provided by 11 platforms in South Korea, almost $40m by 14 platforms in India and more than $39m by 11 platforms in Singapore. Taiwan and Hong Kong accounted for $13m and $9.3m in reported transaction volume respectively.
Malaysia, Indonesia and Thailand each have small but growing online alternative finance industries, mainly within reward-based and donation-based crowdfunding. More than $3.36m was raised by 9 platforms in Malaysia, over $2.2m by 5 platforms in Indonesia and over $1m by
7 platforms in Thailand. We also had survey responses from platforms in Mongolia, raising almost $0.4m; the Philippines with almost $0.2m; Pakistan with just over $0.1m and Sri Lanka with $42,000. It is also likely that there are material levels of funding volume raised online by international donation-based crowdfunding platforms channelling funding towards developing countries within the region. However, most of these platforms are based outside of the Asia-Pacific region (mainly in the US), and therefore they were not captured in the survey for this report.
The Geographic Distribution of Alternative Finance in the Asia-Pacific Region
Figure 4: Comparative Market Volumes of Alternative Finance Transactions in the Asia-Pacific Region (2015)
1. Mainland China2. Japan3. Australia4. New Zealand5. Korea6. India7. Singapore8. Taiwan9. Hong Kong10. Malaysia11. Indonesia12. Thailand13. Mongolia14. Philppines15. Pakistan16. Sri Lanka17. Vietnam
1
13
14
15
16
17
5
9
10
11
12
7
8
2
3
4
6
Total Volume 2015 ($m USD)
5 0 b n +
3 0 0 – 4 0 0
2 0 0 – 5 0
3 0 – 3 0 0
1 0 – 1 5
5 – 1 0
3 – 4
2 – 3
1 – 2
. 3 0 – 1
. 1 5 – . 2
. 1 0 – . 5
. 0 3 – . 0 5
29
Harnessing Potential — March 2016
Geographic Distribution of Surveyed Platforms in Mainland China
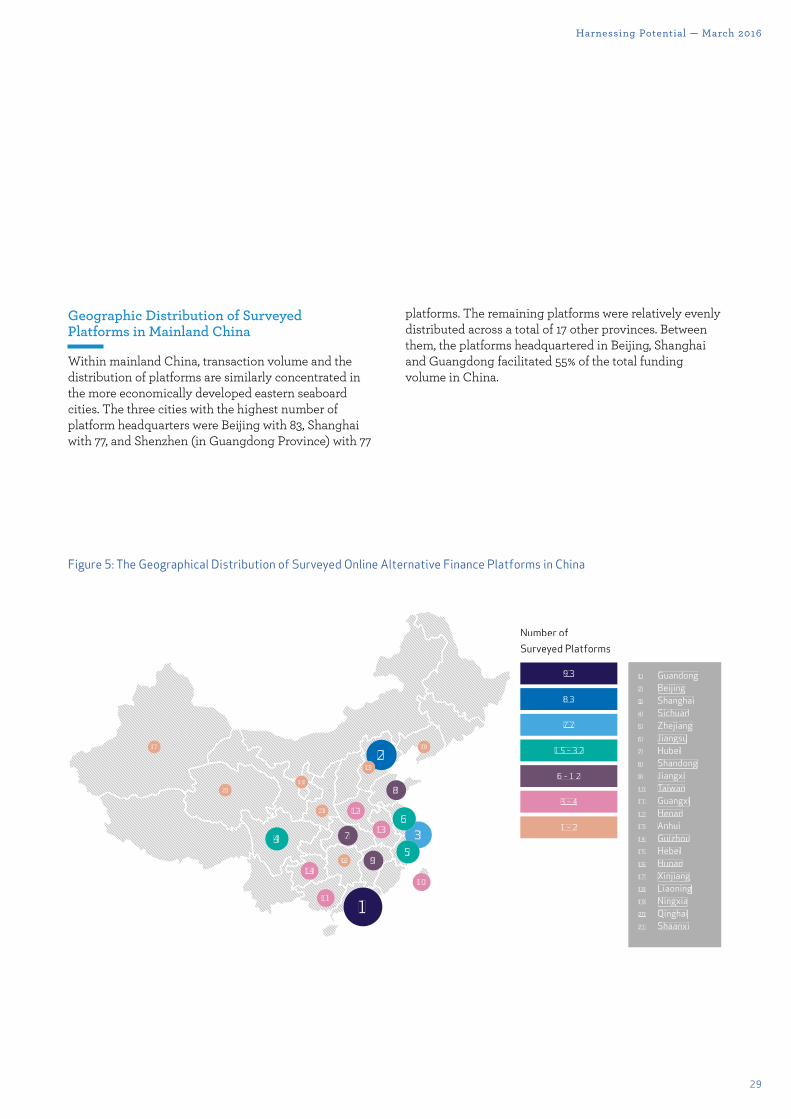
Within mainland China, transaction volume and the distribution of platforms are similarly concentrated in the more economically developed eastern seaboard cities. The three cities with the highest number of platform headquarters were Beijing with 83, Shanghai with 77, and Shenzhen (in Guangdong Province) with 77
platforms. The remaining platforms were relatively evenly distributed across a total of 17 other provinces. Between them, the platforms headquartered in Beijing, Shanghai and Guangdong facilitated 55% of the total funding volume in China.
Figure 5: The Geographical Distribution of Surveyed Online Alternative Finance Platforms in China
21
2019
1817
16
14
13
12
10
11
9
8
74 3
2
1
6
5
15
Number of Surveyed Platforms
9 3
8 3
7 7
1 5 – 3 2
6 – 1 2
3 – 4
1 – 2
1. Guandong2. Beijing3. Shanghai4. Sichuan5. Zhejiang6. Jiangsu7. Hubei8. Shandong9. Jiangxi10. Taiwan11. Guangxi12. Henan13. Anhui14. Guizhou15. Hebei16. Hunan17. Xinjiang18. Liaoning19. Ningxia20. Qinghai21. Shaanxi
30
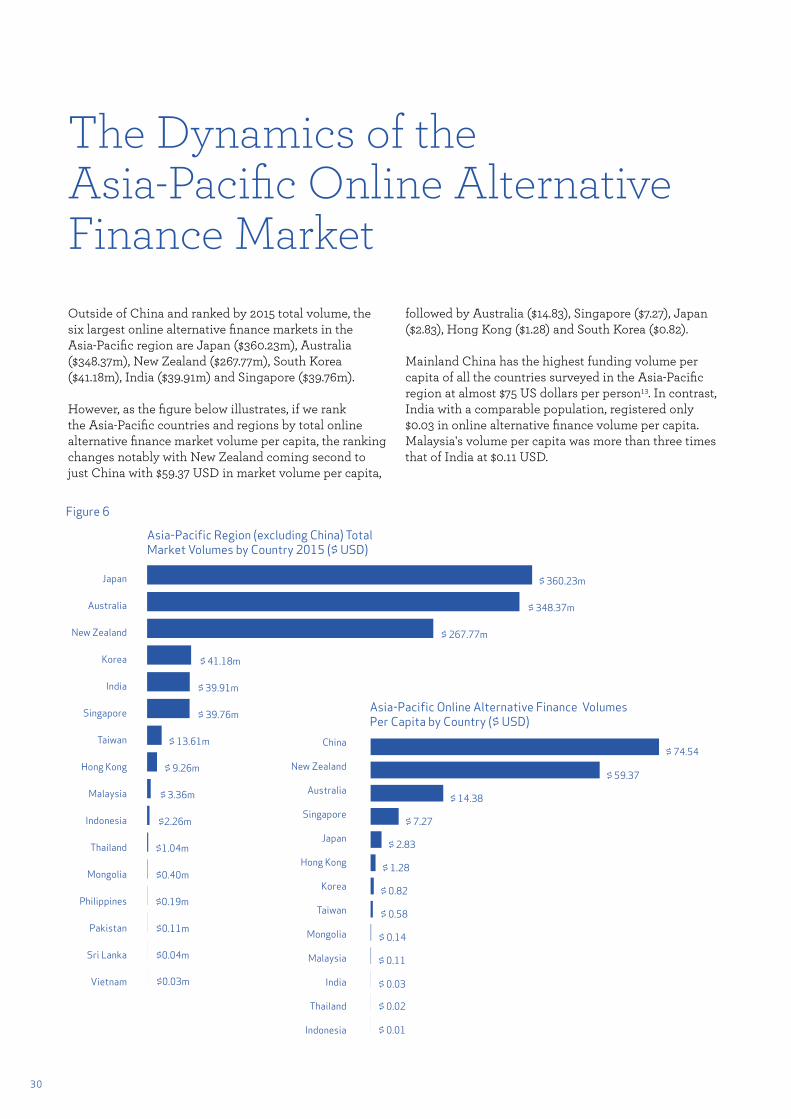
The Dynamics of the Asia-Pacific Online Alternative Finance MarketOutside of China and ranked by 2015 total volume, the six largest online alternative finance markets in the Asia-Pacific region are Japan ($360.23m), Australia ($348.37m), New Zealand ($267.77m), South Korea ($41.18m), India ($39.91m) and Singapore ($39.76m).
However, as the figure below illustrates, if we rank the Asia-Pacific countries and regions by total online alternative finance market volume per capita, the ranking changes notably with New Zealand coming second to just China with $59.37 USD in market volume per capita,
followed by Australia ($14.83), Singapore ($7.27), Japan ($2.83), Hong Kong ($1.28) and South Korea ($0.82).
Mainland China has the highest funding volume per capita of all the countries surveyed in the Asia-Pacific region at almost $75 US dollars per person13. In contrast, India with a comparable population, registered only $0.03 in online alternative finance volume per capita. Malaysia's volume per capita was more than three times that of India at $0.11 USD.
Fig. 6
Japan
Australia
New Zealand
Korea
India
Singapore
Taiwan
Hong Kong
Malaysia
Indonesia
Thailand
Mongolia
Philippines
Pakistan
Sri Lanka
Vietnam
$ 360.23m
$ 348.37m
$ 267.77m
$ 41.18m
$ 39.91m
$ 39.76m
$ 13.61m
$ 9.26m
$ 3.36m
$2.26m
$1.04m
$0.40m
$0.19m
$0.11m
$0.04m
$0.03m
$ 74.54
$ 14.38
$ 7.27
$ 2.83
$ 1.28
$ 0.82
$ 0.58
$ 0.14
$ 0.11
$ 0.03
$ 0.02
$ 0.01
China
New Zealand
Australia
Singapore
Japan
Hong Kong
Korea
Taiwan
Mongolia
Malaysia
India
Thailand
Indonesia
$ 59.37
Figure 6
Asia-Pacific Online Alternative Finance Volumes Per Capita by Country ($ USD)
Asia-Pacific Region (excluding China) Total Market Volumes by Country 2015 ($ USD)
31
Harnessing Potential — March 2016
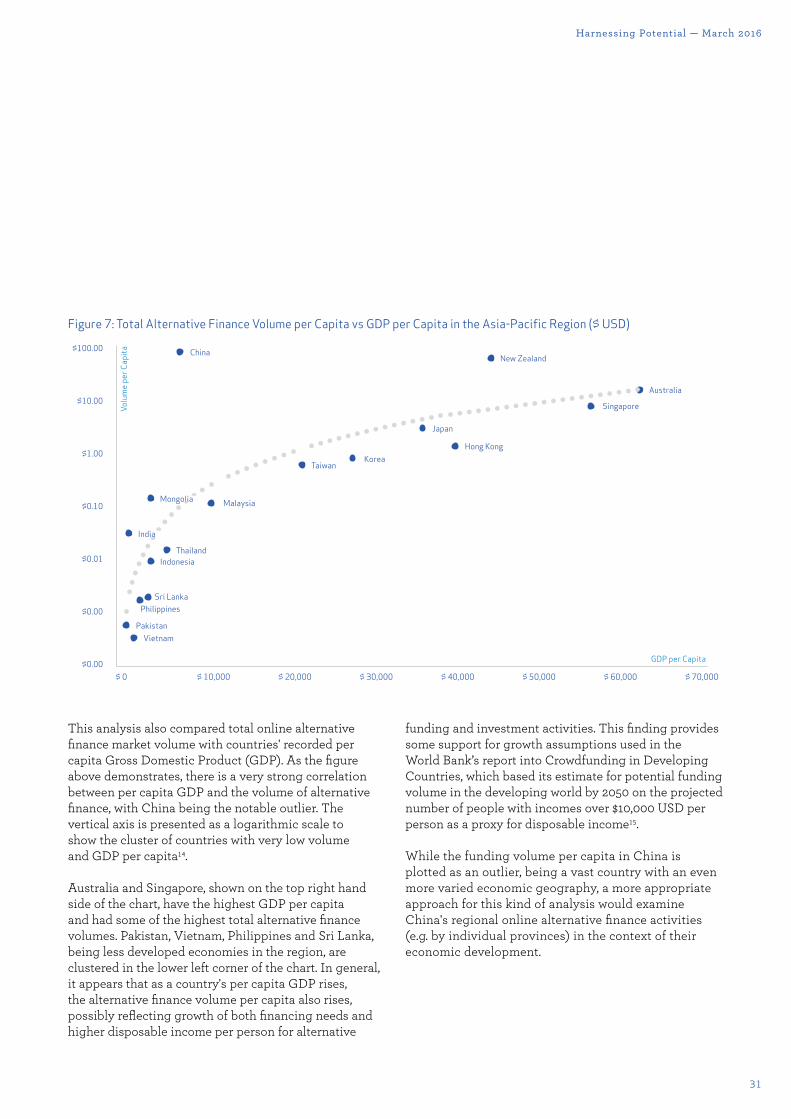
This analysis also compared total online alternative finance market volume with countries' recorded per capita Gross Domestic Product (GDP). As the figure above demonstrates, there is a very strong correlation between per capita GDP and the volume of alternative finance, with China being the notable outlier. The vertical axis is presented as a logarithmic scale to show the cluster of countries with very low volume and GDP per capita14.
Australia and Singapore, shown on the top right hand side of the chart, have the highest GDP per capita and had some of the highest total alternative finance volumes. Pakistan, Vietnam, Philippines and Sri Lanka, being less developed economies in the region, are clustered in the lower left corner of the chart. In general, it appears that as a country's per capita GDP rises, the alternative finance volume per capita also rises, possibly reflecting growth of both financing needs and higher disposable income per person for alternative
funding and investment activities. This finding provides some support for growth assumptions used in the World Bank’s report into Crowdfunding in Developing Countries, which based its estimate for potential funding volume in the developing world by 2050 on the projected number of people with incomes over $10,000 USD per person as a proxy for disposable income15.
While the funding volume per capita in China is plotted as an outlier, being a vast country with an even more varied economic geography, a more appropriate approach for this kind of analysis would examine China's regional online alternative finance activities (e.g. by individual provinces) in the context of their economic development.
Fig. 7
China
Mongolia Malaysia
Taiwan
GDP per Capita
Korea
Japan
Hong Kong
New Zealand
Singapore
Australia
VietnamPakistan
PhilippinesSri Lanka
ThailandIndonesia
India
$ 0 $ 10,000 $ 20,000 $ 30,000 $ 40,000 $ 50,000 $ 60,000 $ 70,000
$100.00
$10.00
$1.00
$0.10
$0.01
$0.00
$0.00
Volu
me
per C
apita
Figure 7: Total Alternative Finance Volume per Capita vs GDP per Capita in the Asia-Pacific Region ($ USD)
32
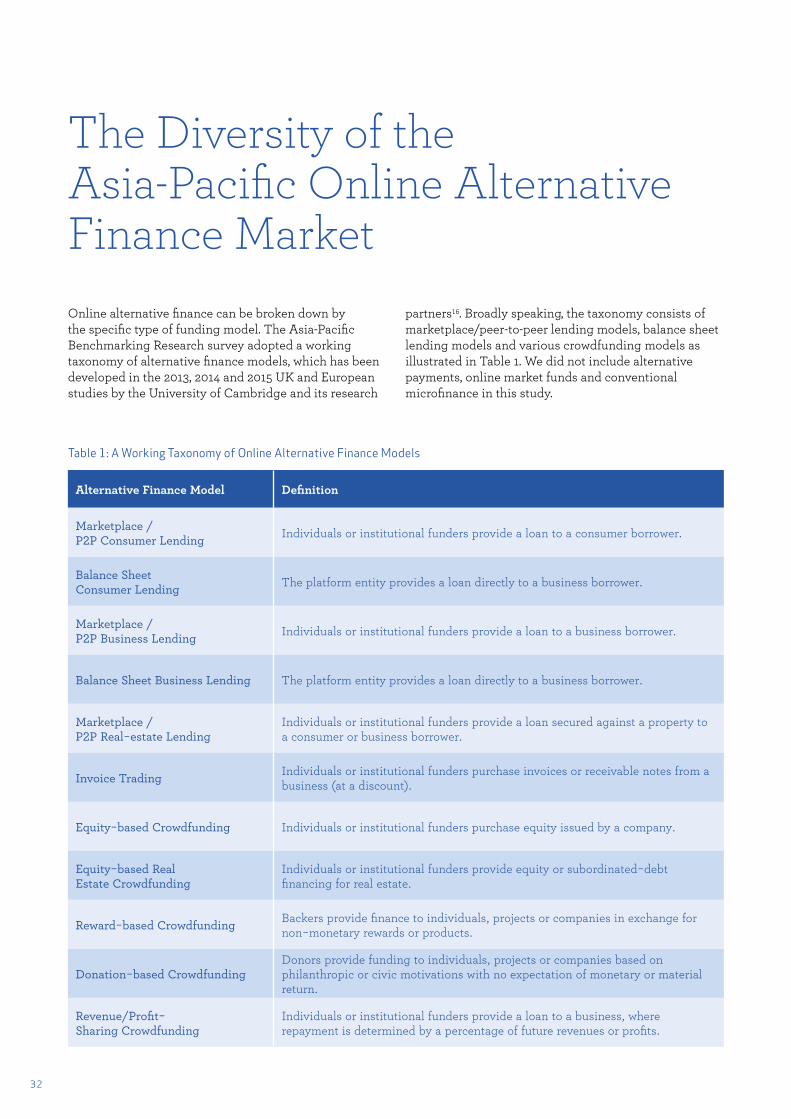
The Diversity of the Asia-Pacific Online Alternative Finance Market Online alternative finance can be broken down by the specific type of funding model. The Asia-Pacific Benchmarking Research survey adopted a working taxonomy of alternative finance models, which has been developed in the 2013, 2014 and 2015 UK and European studies by the University of Cambridge and its research
partners16. Broadly speaking, the taxonomy consists of marketplace/peer-to-peer lending models, balance sheet lending models and various crowdfunding models as illustrated in Table 1. We did not include alternative payments, online market funds and conventional microfinance in this study.
Table 1: A Working Taxonomy of Online Alternative Finance Models
Alternative Finance Model Definition
Marketplace / P2P Consumer Lending Individuals or institutional funders provide a loan to a consumer borrower.
Balance Sheet Consumer Lending The platform entity provides a loan directly to a business borrower.
Marketplace / P2P Business Lending Individuals or institutional funders provide a loan to a business borrower.
Balance Sheet Business Lending The platform entity provides a loan directly to a business borrower.
Marketplace / P2P Real−estate Lending
Individuals or institutional funders provide a loan secured against a property to a consumer or business borrower.
Invoice Trading Individuals or institutional funders purchase invoices or receivable notes from a business (at a discount).
Equity−based Crowdfunding Individuals or institutional funders purchase equity issued by a company.
Equity−based Real Estate Crowdfunding
Individuals or institutional funders provide equity or subordinated−debt financing for real estate.
Reward−based Crowdfunding Backers provide finance to individuals, projects or companies in exchange for non−monetary rewards or products.
Donation−based CrowdfundingDonors provide funding to individuals, projects or companies based on philanthropic or civic motivations with no expectation of monetary or material return.
Revenue/Profit− Sharing Crowdfunding
Individuals or institutional funders provide a loan to a business, where repayment is determined by a percentage of future revenues or profits.
33
Harnessing Potential — March 2016
The main di¯erence in this report from earlier reports is the inclusion of balance sheet lending as a category separate and distinct from marketplace/peer-to-peer lending. The orthodox alternative finance lending model is commonly referred to as peer-to-peer (P2P) or marketplace lending, where the platform allows individual and institutional lenders to invest directly or indirectly into loan instruments issued by the borrowers raising finance on a platform. In this model, the platform may manage an investor’s funds based upon the investor’s credit risk appetite and lending criteria, but the platform does not use its own balance sheet to underwrite a loan. Balance sheet lending platforms are fundamentally di¯erent in that the loan is underwritten directly from the platform's own balance sheet and does not rely upon a marketplace (of individuals or institutions) to provide funds to the borrower.
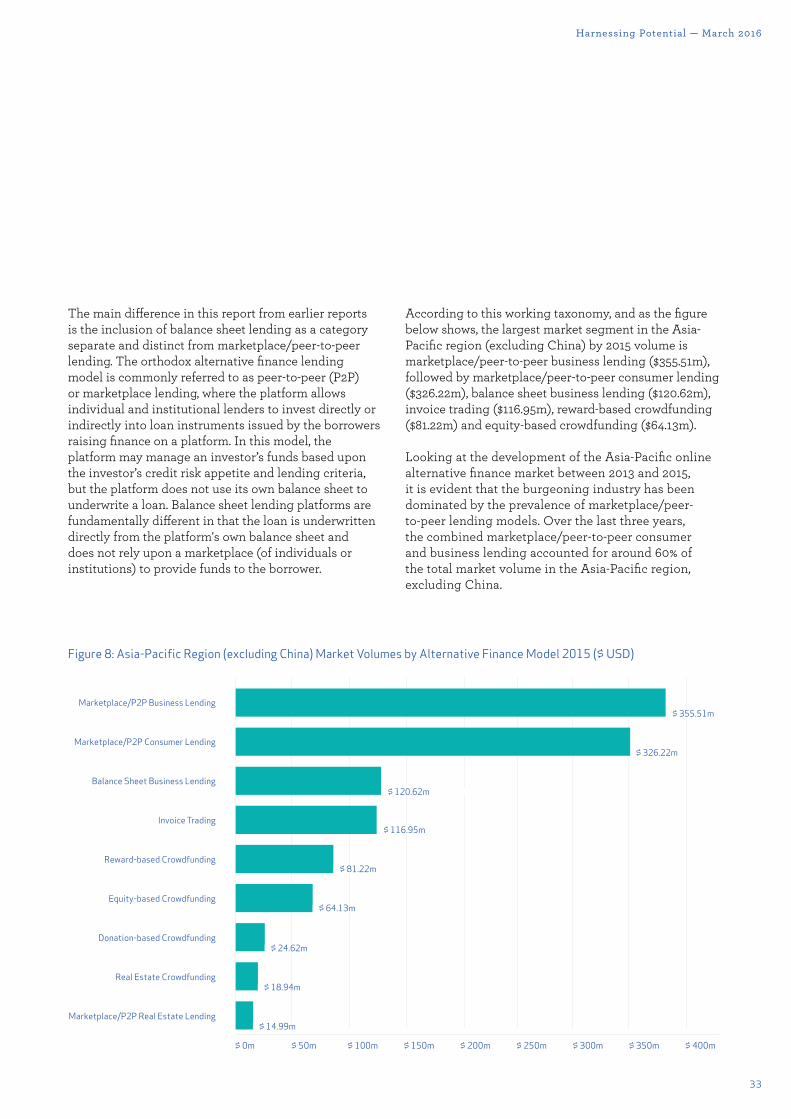
According to this working taxonomy, and as the figure below shows, the largest market segment in the Asia-Pacific region (excluding China) by 2015 volume is marketplace/peer-to-peer business lending ($355.51m), followed by marketplace/peer-to-peer consumer lending ($326.22m), balance sheet business lending ($120.62m), invoice trading ($116.95m), reward-based crowdfunding ($81.22m) and equity-based crowdfunding ($64.13m).
Looking at the development of the Asia-Pacific online alternative finance market between 2013 and 2015, it is evident that the burgeoning industry has been dominated by the prevalence of marketplace/peer-to-peer lending models. Over the last three years, the combined marketplace/peer-to-peer consumer and business lending accounted for around 60% of the total market volume in the Asia-Pacific region, excluding China.
Fig. 8
$ 0m $ 50m $ 100m $ 150m $ 200m $ 250m $ 300m $ 350m $ 400m
Marketplace/P2P Business Lending
Marketplace/P2P Consumer Lending
Balance Sheet Business Lending
Invoice Trading
Reward-based Crowdfunding
Equity-based Crowdfunding
Donation-based Crowdfunding
Real Estate Crowdfunding
Marketplace/P2P Real Estate Lending
$ 355.51m
$ 326.22m
$ 120.62m
$ 24.62m
$ 116.95m
$ 81.22m
$ 64.13m
$ 18.94m
$ 14.99m
Figure 8: Asia-Pacific Region (excluding China) Market Volumes by Alternative Finance Model 2015 ($ USD)
34
The Diversity of the Asia-Pacific Online Alternative Finance Market
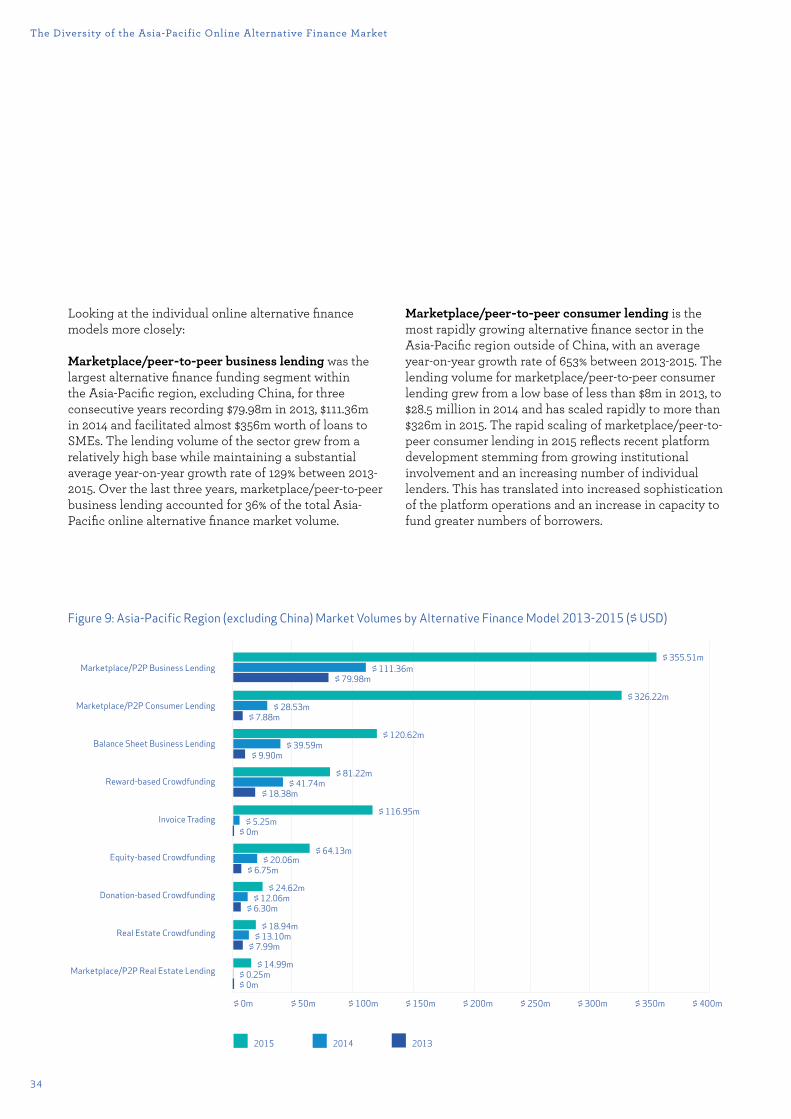
Looking at the individual online alternative finance models more closely:
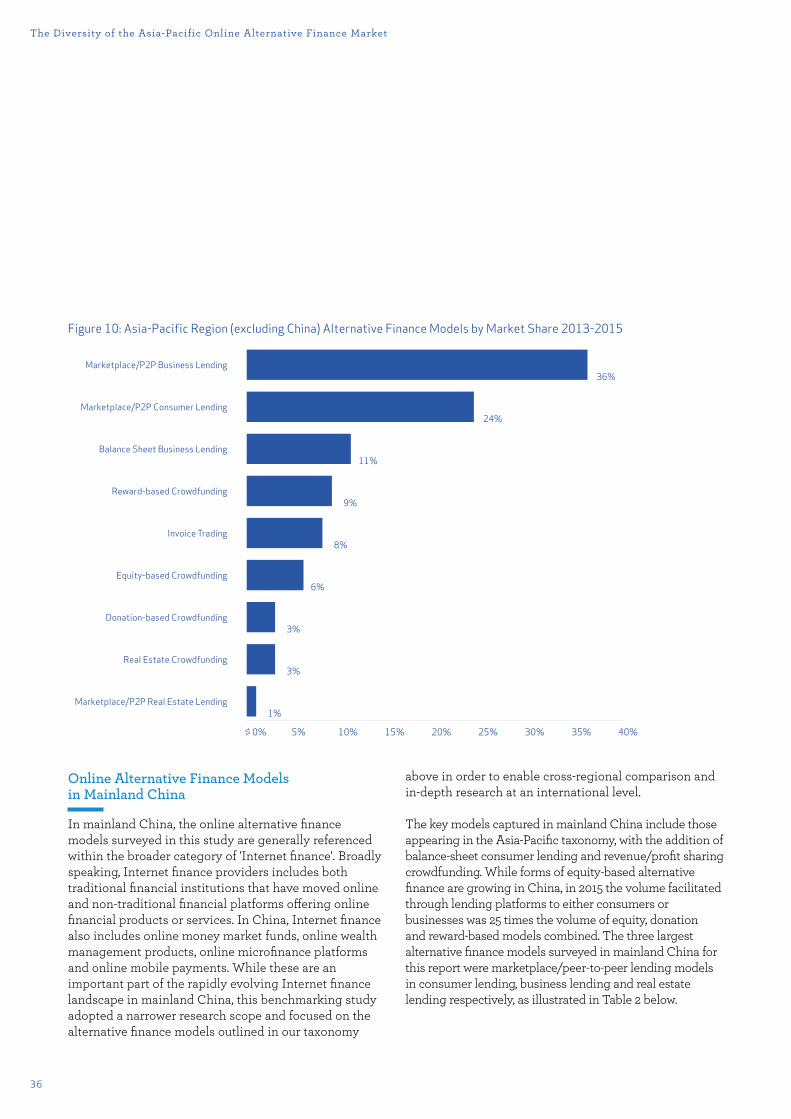
Marketplace/peer-to-peer business lending was the largest alternative finance funding segment within the Asia-Pacific region, excluding China, for three consecutive years recording $79.98m in 2013, $111.36m in 2014 and facilitated almost $356m worth of loans to SMEs. The lending volume of the sector grew from a relatively high base while maintaining a substantial average year-on-year growth rate of 129% between 2013-2015. Over the last three years, marketplace/peer-to-peer business lending accounted for 36% of the total Asia-Pacific online alternative finance market volume.
Marketplace/peer-to-peer consumer lending is the most rapidly growing alternative finance sector in the Asia-Pacific region outside of China, with an average year-on-year growth rate of 653% between 2013-2015. The lending volume for marketplace/peer-to-peer consumer lending grew from a low base of less than $8m in 2013, to $28.5 million in 2014 and has scaled rapidly to more than $326m in 2015. The rapid scaling of marketplace/peer-to-peer consumer lending in 2015 reflects recent platform development stemming from growing institutional involvement and an increasing number of individual lenders. This has translated into increased sophistication of the platform operations and an increase in capacity to fund greater numbers of borrowers.
Fig. 9
20142015 2013
$ 0m $ 50m $ 100m $ 150m $ 200m $ 250m $ 300m $ 350m $ 400m
Marketplace/P2P Business Lending
Marketplace/P2P Consumer Lending
Balance Sheet Business Lending
Reward-based Crowdfunding
Invoice Trading
Equity-based Crowdfunding
Donation-based Crowdfunding
Real Estate Crowdfunding
Marketplace/P2P Real Estate Lending
$ 111.36m$ 355.51m
$ 326.22m$ 28.53m
$ 39.59m$ 120.62m
$ 81.22m
$ 116.95m
$ 64.13m
$ 24.62m
$ 18.94m
$ 14.99m
$ 12.06m
$ 13.10m
$ 0.25m
$ 6.30m
$ 7.99m
$ 0m
$ 20.06m$ 6.75m
$ 5.25m$ 0m
$ 41.74m$ 18.38m
$ 7.88m
$ 9.90m
$ 79.98m
Figure 9: Asia-Pacific Region (excluding China) Market Volumes by Alternative Finance Model 2013-2015 ($ USD)
35
Harnessing Potential — March 2016
Balance sheet business lending was the third largest segment of the online alternative finance market in Asia-Pacific countries outside of China, with almost $121m being lent in 2015, up from $40m in 2014, and from $10m in 2013. Balance sheet business lenders target small businesses. It must be noted that all of the balance sheet lenders identified in the survey were based in Australia and lend to the Australian domestic market with an average growth rate of over 252% between 2013 and 2015.
Invoice trading enables businesses to sell their invoices or receivables at discount for mostly working capital, usually to a pool of primarily high-net worth individuals or institutional investors. From a negligible volume base in 2013, invoice trading volume grew by an average year-on-year growth rate of 1064% between 2013 and 2015 to almost $117m in 2015.
Reward-based crowdfunding is the largest non-financial return based alternative finance model by volume within the Asia-Pacific region, outside of China. Reward-based crowdfunding platforms in key countries within the region are well established to provide finance to creative industries - particularly film, music, art and other forms of cultural production – as well as for technology projects and ventures. Excluding China, the total reward-based crowdfunding volume within the Asia-Pacific region in 2015 was more than $81m, almost double the $41.7m raised in 2014 which, in turn, was more than double the 2013 volume of $18.4m.
Equity-based crowdfunding raised over $64m in the Asia-Pacific countries in 2015. This model involves the sale of equity (or equity-like) securities, mostly issued by early stage firms, to 'qualified' individuals (e.g. sophisticated investors or high-net worth individuals) and institutional investors. Where regulation permits, retail investors may also participate in the model. The volume of equity-based crowdfunding has been restricted across most countries in the Asia-Pacific region because most countries have no regulatory framework that allows for retail investor participation through general solicitation and advertising. Equity-based crowdfunding in the Asia-Pacific countries, therefore, typically consists
of small online private placements or angel investing for early stage venture investment.
Donation-based crowdfunding is growing across the Asia-Pacific region, as it allows individuals to give directly to community projects, social enterprises and individual cause-based philanthropic projects. From the platforms surveyed, donation-based crowdfunding raised almost $25m across Asia-Pacific countries in 2015, up from $12m in 2014 and $6.3m in 2013. These donations were reported by locally-based platform in the Asia-Pacific countries who completed the survey. The actual volume for donation-based crowdfunding between 2013 and 2015 is likely to be substantially higher than this as we were unable to capture all donation-based crowdfunding data for projects funded by US-based platforms.
Equity-based real estate crowdfunding usually takes the form of direct investment into a property by individuals or institutional investors, usually through the sale of an equity instrument issued by a special purpose vehicle (SPV) established to facilitate the financing for a single project. The total surveyed funding volume for equity-based real estate investment in 2015 was almost $19m - over half of which originated from platforms in Singapore.
Marketplace/peer-to-peer real-estate lending takes the form of property-secured lending transactions between individuals or institutions to businesses, most of which are property developers. The volume of marketplace/peer-to-peer real estate lending reported by surveyed platforms has risen from negligible volume in 2013 to approximately $15m in 2015.
36
The Diversity of the Asia-Pacific Online Alternative Finance Market
Online Alternative Finance Models in Mainland China
In mainland China, the online alternative finance models surveyed in this study are generally referenced within the broader category of 'Internet finance'. Broadly speaking, Internet finance providers includes both traditional financial institutions that have moved online and non-traditional financial platforms o¯ering online financial products or services. In China, Internet finance also includes online money market funds, online wealth management products, online microfinance platforms and online mobile payments. While these are an important part of the rapidly evolving Internet finance landscape in mainland China, this benchmarking study adopted a narrower research scope and focused on the alternative finance models outlined in our taxonomy
above in order to enable cross-regional comparison and in-depth research at an international level.
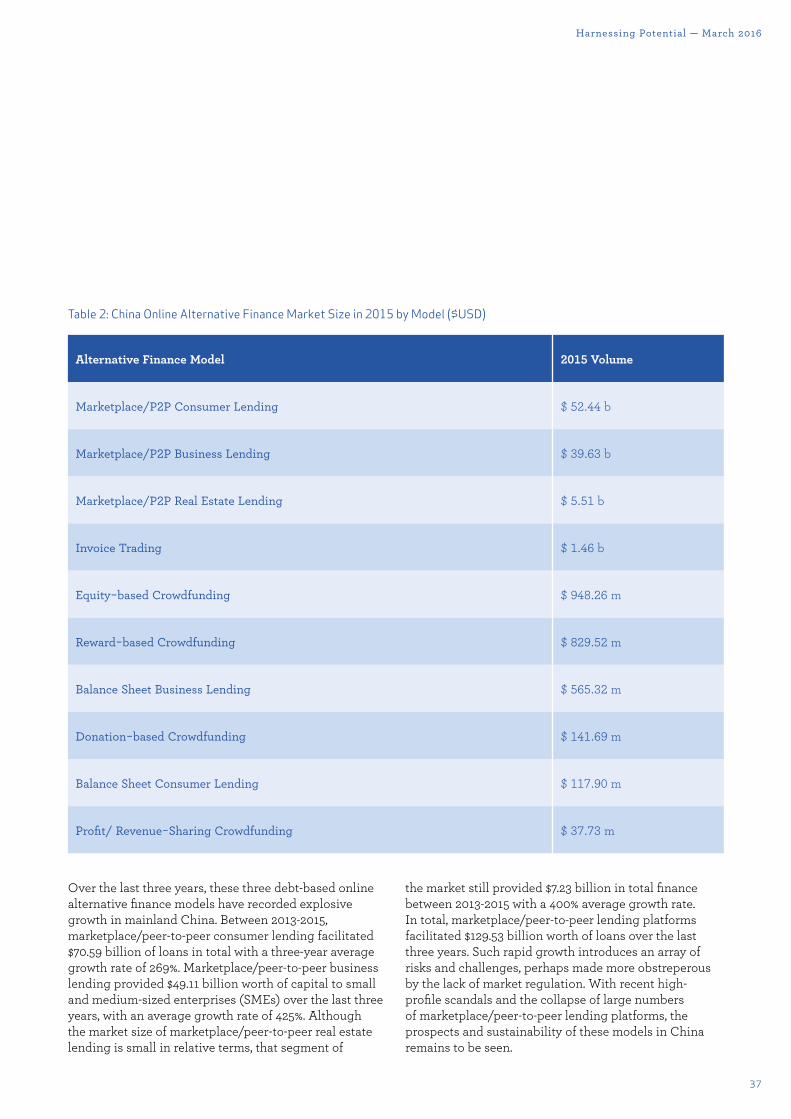
The key models captured in mainland China include those appearing in the Asia-Pacific taxonomy, with the addition of balance-sheet consumer lending and revenue/profit sharing crowdfunding. While forms of equity-based alternative finance are growing in China, in 2015 the volume facilitated through lending platforms to either consumers or businesses was 25 times the volume of equity, donation and reward-based models combined. The three largest alternative finance models surveyed in mainland China for this report were marketplace/peer-to-peer lending models in consumer lending, business lending and real estate lending respectively, as illustrated in Table 2 below.
Fig. 10
Marketplace/P2P Business Lending
Marketplace/P2P Consumer Lending
Balance Sheet Business Lending
Reward-based Crowdfunding
Invoice Trading
Equity-based Crowdfunding
Donation-based Crowdfunding
Real Estate Crowdfunding
Marketplace/P2P Real Estate Lending
36%
24%
11%
9%
8%
6%
3%
3%
1%
$ 0% 5% 10% 15% 20% 25% 30% 35% 40%
Figure 10: Asia-Pacific Region (excluding China) Alternative Finance Models by Market Share 2013-2015
37
Harnessing Potential — March 2016
Table 2: China Online Alternative Finance Market Size in 2015 by Model ($USD)
Alternative Finance Model 2015 Volume
Marketplace/P2P Consumer Lending $ 52.44 b
Marketplace/P2P Business Lending $ 39.63 b
Marketplace/P2P Real Estate Lending $ 5.51 b
Invoice Trading $ 1.46 b
Equity−based Crowdfunding $ 948.26 m
Reward−based Crowdfunding $ 829.52 m
Balance Sheet Business Lending $ 565.32 m
Donation−based Crowdfunding $ 141.69 m
Balance Sheet Consumer Lending $ 117.90 m
Profit/ Revenue−Sharing Crowdfunding $ 37.73 m
Over the last three years, these three debt-based online alternative finance models have recorded explosive growth in mainland China. Between 2013-2015, marketplace/peer-to-peer consumer lending facilitated $70.59 billion of loans in total with a three-year average growth rate of 269%. Marketplace/peer-to-peer business lending provided $49.11 billion worth of capital to small and medium-sized enterprises (SMEs) over the last three years, with an average growth rate of 425%. Although the market size of marketplace/peer-to-peer real estate lending is small in relative terms, that segment of
the market still provided $7.23 billion in total finance between 2013-2015 with a 400% average growth rate. In total, marketplace/peer-to-peer lending platforms facilitated $129.53 billion worth of loans over the last three years. Such rapid growth introduces an array of risks and challenges, perhaps made more obstreperous by the lack of market regulation. With recent high-profile scandals and the collapse of large numbers of marketplace/peer-to-peer lending platforms, the prospects and sustainability of these models in China remains to be seen.
38
The Diversity of the Asia-Pacific Online Alternative Finance Market
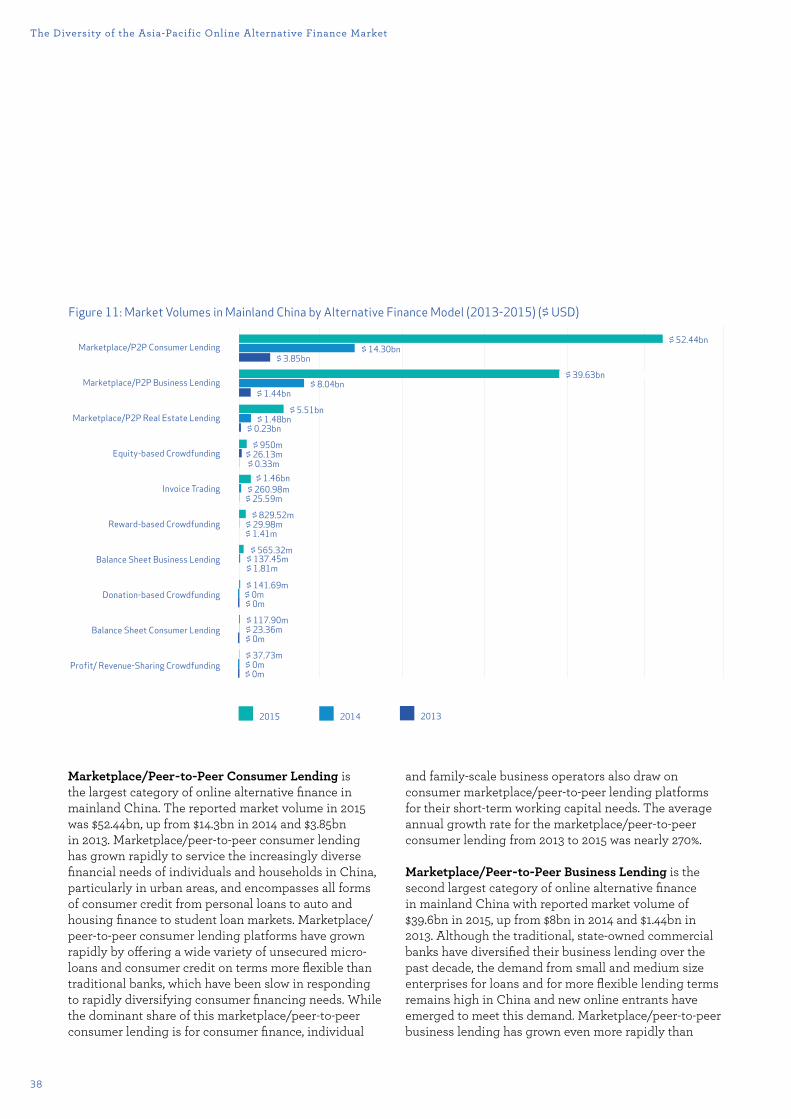
Marketplace/Peer-to-Peer Consumer Lending is the largest category of online alternative finance in mainland China. The reported market volume in 2015 was $52.44bn, up from $14.3bn in 2014 and $3.85bn in 2013. Marketplace/peer-to-peer consumer lending has grown rapidly to service the increasingly diverse financial needs of individuals and households in China, particularly in urban areas, and encompasses all forms of consumer credit from personal loans to auto and housing finance to student loan markets. Marketplace/peer-to-peer consumer lending platforms have grown rapidly by o¯ering a wide variety of unsecured micro-loans and consumer credit on terms more flexible than traditional banks, which have been slow in responding to rapidly diversifying consumer financing needs. While the dominant share of this marketplace/peer-to-peer consumer lending is for consumer finance, individual
and family-scale business operators also draw on consumer marketplace/peer-to-peer lending platforms for their short-term working capital needs. The average annual growth rate for the marketplace/peer-to-peer consumer lending from 2013 to 2015 was nearly 270%.
Marketplace/Peer-to-Peer Business Lending is the second largest category of online alternative finance in mainland China with reported market volume of $39.6bn in 2015, up from $8bn in 2014 and $1.44bn in 2013. Although the traditional, state-owned commercial banks have diversified their business lending over the past decade, the demand from small and medium size enterprises for loans and for more flexible lending terms remains high in China and new online entrants have emerged to meet this demand. Marketplace/peer-to-peer business lending has grown even more rapidly than
Figure 11: Market Volumes in Mainland China by Alternative Finance Model (2013-2015) ($ USD)
Fig. 11
Marketplace/P2P Consumer Lending
Marketplace/P2P Business Lending
Marketplace/P2P Real Estate Lending
Equity-based Crowdfunding
Invoice Trading
Reward-based Crowdfunding
Balance Sheet Business Lending
Donation-based Crowdfunding
Balance Sheet Consumer Lending
Profit/ Revenue-Sharing Crowdfunding
20142015 2013
$ 52.44bn
$ 39.63bn
$ 14.30bn
$ 8.04bn$ 1.44bn
$ 5.51bn
$ 950m
$ 1.46bn$ 260.98m
$ 25.59m
$ 829.52m
$ 565.32m
$ 141.69m
$ 117.90m
$ 37.73m
$ 29.98m
$ 137.45m
$ 0m
$ 23.36m
$ 0m
$ 1.41m
$ 1.81m
$ 0m
$ 0m
$ 0m
$ 26.13m$ 0.33m
$ 1.48bn$ 0.23bn
$ 3.85bn
39
Harnessing Potential — March 2016
marketplace/peer-to-peer consumer lending in recent years, at an average annual growth rate of 425% between 2013 and 2015, albeit from a low initial funding base.
Marketplace/Peer-to-Peer Real Estate Lending is a relative nascent form of online alternative finance in China. It is a secured form of lending with loan proceeds used for the construction and financing of real estate projects. The reported volume of marketplace/peer-to-peer real estate lending in our mainland China survey was over $5.51bn in 2015, up from $1.48bn in 2014 and $234.3m in 2013. The total volume increased by an average annual growth rate of 403% between 2013 and 2015.
Invoice Trading platforms in China facilitated $1.46bn in 2015, up from a reported $25.60m in 2013. Over the three year period, this generated an annual average growth rate of 689%. The prevalence of this model illustrates the demand for faster and more flexible ways of obtaining working capital from mostly small and medium-sized enterprises.
As the figure illustrates above, between 2013-2015, various forms of crowdfunding surpassed $2billion mark in mainland China. Notably, the total crowdfunding market volume in 2013 was just $1.73m.
Equity-based crowdfunding is the largest market segment within crowdfunding with $948.26m raised just in 2015. Although equity-based crowdfunding is not yet legalised in mainland China, draft rules for the sector were released by the State Assets Commission (SAC) in 2015 and several platforms have registered with the SAC to conduct equity-based crowdfunding operations17. Most early stage, seed stage funding investment in China currently takes the form of unregulated private placement activity. A number of the platforms that responded to our survey reported that their equity-based crowdfunding models were 'private-placement led equity-investment mechanisms' utilising both online and oÀine channels. Some surveyed platforms described their activity as 'online angel-investing' or 'clubbed investing', whilst other platforms facilitate equity-based transactions more akin to the online equity crowdfunding we have observed in the UK and the US markets.
Figure 12: China's Online Alternative Lending Volume 2013-2015 ($ USD)
Fig. 12
$ 0bn $ 20bn $ 40bn $ 60bn $ 80bn $ 100bn
2015
2014
2013
$ 5.56bn
$ 24.24bn
$ 99.73bn
40
The Diversity of the Asia-Pacific Online Alternative Finance Market
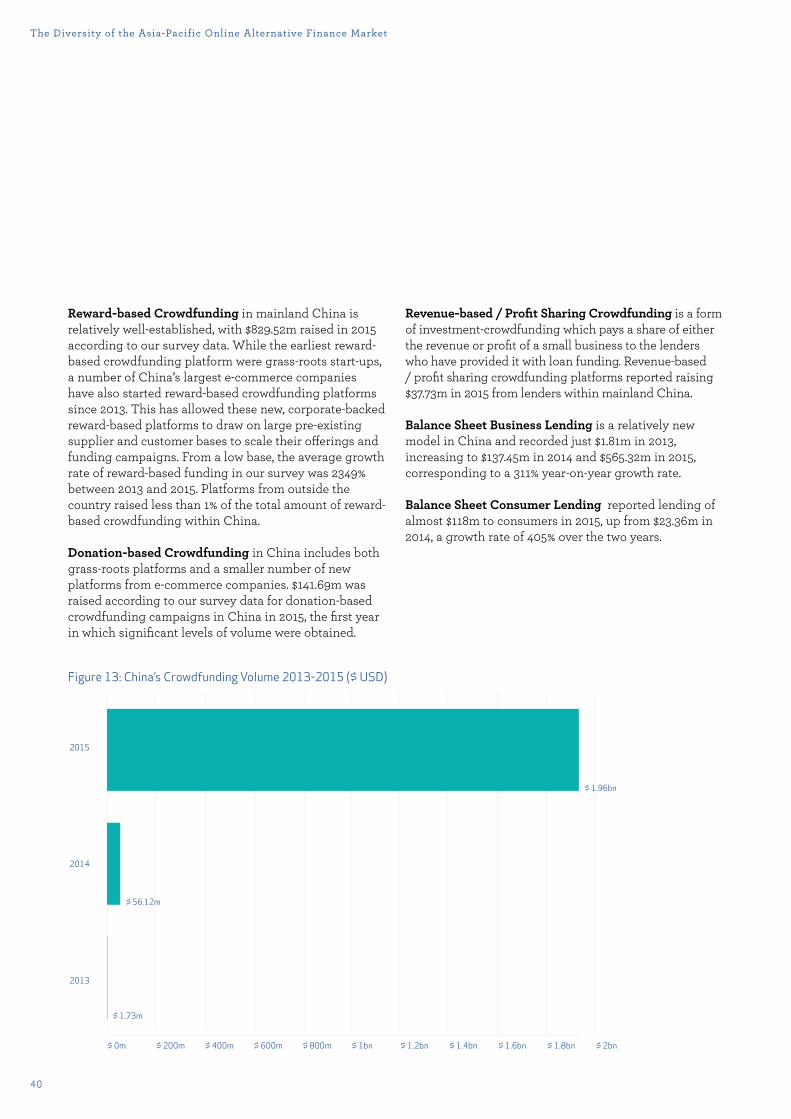
Reward-based Crowdfunding in mainland China is relatively well-established, with $829.52m raised in 2015 according to our survey data. While the earliest reward-based crowdfunding platform were grass-roots start-ups, a number of China’s largest e-commerce companies have also started reward-based crowdfunding platforms since 2013. This has allowed these new, corporate-backed reward-based platforms to draw on large pre-existing supplier and customer bases to scale their o¯erings and funding campaigns. From a low base, the average growth rate of reward-based funding in our survey was 2349% between 2013 and 2015. Platforms from outside the country raised less than 1% of the total amount of reward-based crowdfunding within China.
Donation-based Crowdfunding in China includes both grass-roots platforms and a smaller number of new platforms from e-commerce companies. $141.69m was raised according to our survey data for donation-based crowdfunding campaigns in China in 2015, the first year in which significant levels of volume were obtained.
Revenue-based / Profit Sharing Crowdfunding is a form of investment-crowdfunding which pays a share of either the revenue or profit of a small business to the lenders who have provided it with loan funding. Revenue-based / profit sharing crowdfunding platforms reported raising $37.73m in 2015 from lenders within mainland China.
Balance Sheet Business Lending is a relatively new model in China and recorded just $1.81m in 2013, increasing to $137.45m in 2014 and $565.32m in 2015, corresponding to a 311% year-on-year growth rate.
Balance Sheet Consumer Lending reported lending of almost $118m to consumers in 2015, up from $23.36m in 2014, a growth rate of 405% over the two years.
Figure 13: China’s Crowdfunding Volume 2013-2015 ($ USD)
Fig. 13
$ 0m $ 200m $ 400m $ 600m $ 800m $ 1bn $ 1.2bn $ 1.4bn $ 1.6bn $ 1.8bn $ 2bn
2015
2014
2013
$ 56.12m
$ 1.96bn
$ 1.73m
41
Harnessing Potential — March 2016
Online Alternative Business Finance in the Asia-Pacific region
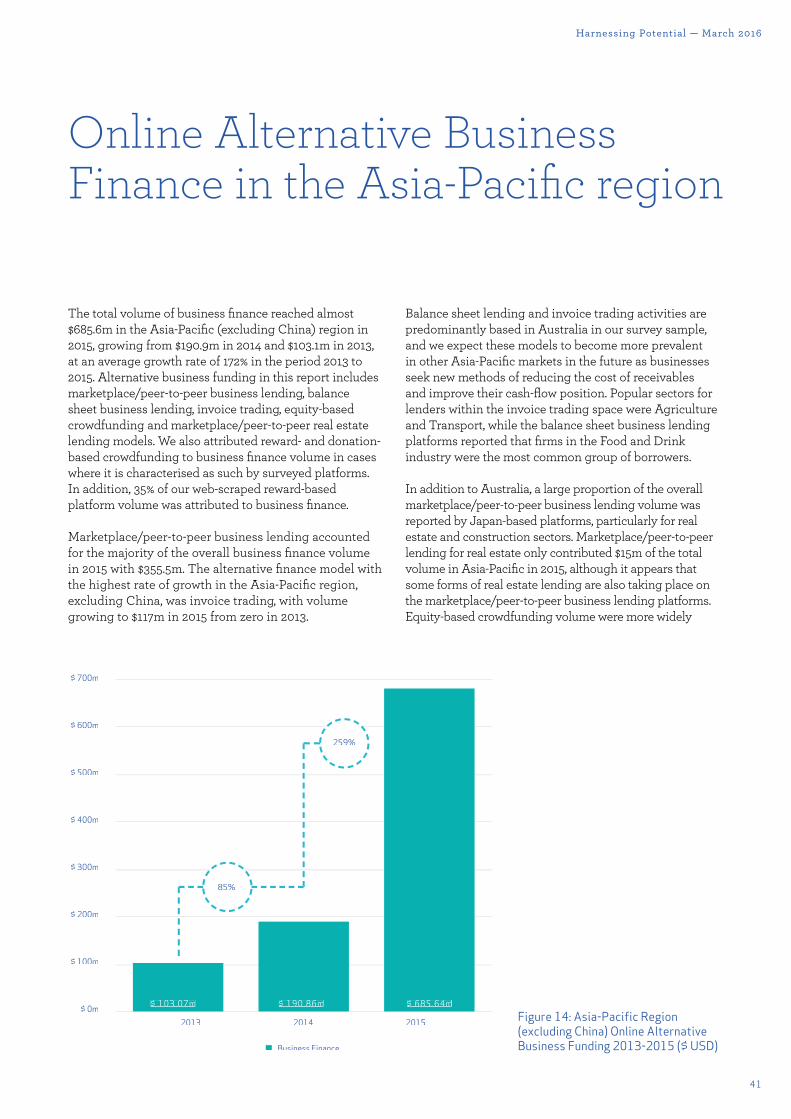
The total volume of business finance reached almost $685.6m in the Asia-Pacific (excluding China) region in 2015, growing from $190.9m in 2014 and $103.1m in 2013, at an average growth rate of 172% in the period 2013 to 2015. Alternative business funding in this report includes marketplace/peer-to-peer business lending, balance sheet business lending, invoice trading, equity-based crowdfunding and marketplace/peer-to-peer real estate lending models. We also attributed reward- and donation-based crowdfunding to business finance volume in cases where it is characterised as such by surveyed platforms. In addition, 35% of our web-scraped reward-based platform volume was attributed to business finance.
Marketplace/peer-to-peer business lending accounted for the majority of the overall business finance volume in 2015 with $355.5m. The alternative finance model with the highest rate of growth in the Asia-Pacific region, excluding China, was invoice trading, with volume growing to $117m in 2015 from zero in 2013.
Balance sheet lending and invoice trading activities are predominantly based in Australia in our survey sample, and we expect these models to become more prevalent in other Asia-Pacific markets in the future as businesses seek new methods of reducing the cost of receivables and improve their cash-flow position. Popular sectors for lenders within the invoice trading space were Agriculture and Transport, while the balance sheet business lending platforms reported that firms in the Food and Drink industry were the most common group of borrowers.
In addition to Australia, a large proportion of the overall marketplace/peer-to-peer business lending volume was reported by Japan-based platforms, particularly for real estate and construction sectors. Marketplace/peer-to-peer lending for real estate only contributed $15m of the total volume in Asia-Pacific in 2015, although it appears that some forms of real estate lending are also taking place on the marketplace/peer-to-peer business lending platforms. Equity-based crowdfunding volume were more widely
Figure 14: Asia-Pacific Region (excluding China) Online Alternative Business Funding 2013-2015 ($ USD)
$ 700m
$ 600m
$ 500m
$ 400m
$ 300m
$ 200m
$ 100m
$ 0m2013 2014 2015
85%
259%
$ 103.07m $ 190.86m $ 685.64m
Business Finance
42
Online Alternative Business Finance in the Asia-Pacific region
geographically distributed within the Asia-Pacific region (excluding China), with a high number of e-commerce and technology firms utilising this form of alternative finance. With the introduction of regulation in a number of countries, equity-based crowdfunding is likely to grow in the Asia-Pacific region and provide venture capital to seed and early-stage companies.
By way of comparison, non-business finance grew at a rate of 289% over the 2013-2015 period, mainly driven by the sharp increase in marketplace/peer-to-peer consumer lending. We note, however, that it can be di�cult to draw a clear distinction between business and non-business finance among certain online alternative finance models (for example, sole traders may apply for funding through marketplace/peer-to-peer consumer lending platforms).
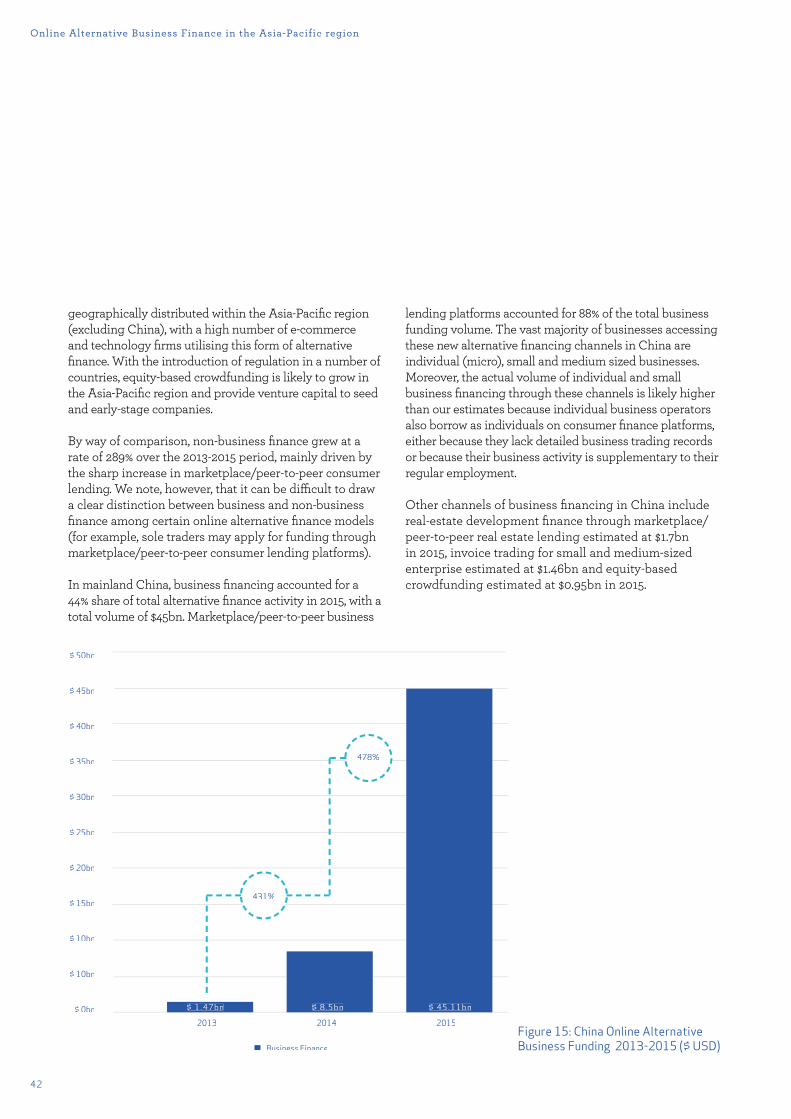
In mainland China, business financing accounted for a 44% share of total alternative finance activity in 2015, with a total volume of $45bn. Marketplace/peer-to-peer business
lending platforms accounted for 88% of the total business funding volume. The vast majority of businesses accessing these new alternative financing channels in China are individual (micro), small and medium sized businesses. Moreover, the actual volume of individual and small business financing through these channels is likely higher than our estimates because individual business operators also borrow as individuals on consumer finance platforms, either because they lack detailed business trading records or because their business activity is supplementary to their regular employment.
Other channels of business financing in China include real-estate development finance through marketplace/peer-to-peer real estate lending estimated at $1.7bn in 2015, invoice trading for small and medium-sized enterprise estimated at $1.46bn and equity-based crowdfunding estimated at $0.95bn in 2015.
Figure 15: China Online Alternative Business Funding 2013-2015 ($ USD)
$ 50bn
$ 45bn
$ 40bn
$ 35bn
$ 30bn
$ 25bn
$ 20bn
$ 15bn
$ 10bn
$ 10bn
$ 0bn2013 2014 2015
478%
431%
$ 1.47bn $ 8.5bn $ 45.11bn
Business Finance
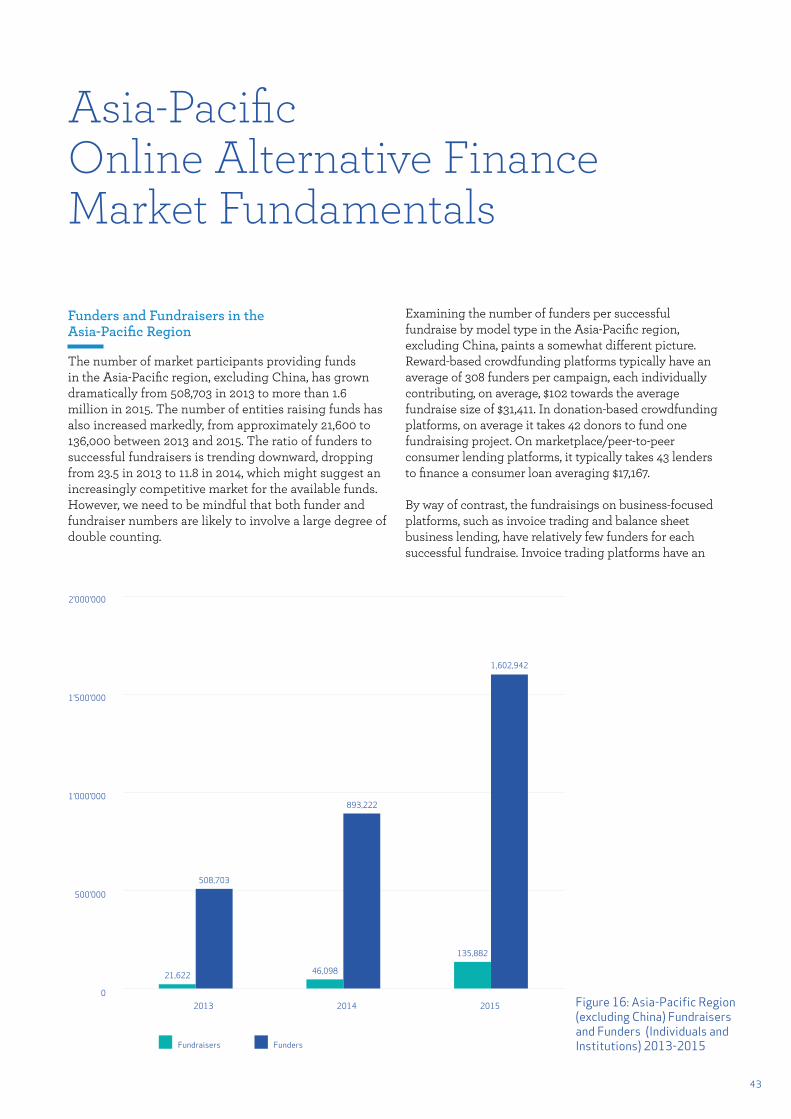
Fig. 16
2’000’000
1’500’000
1’000’000
500’000
02013 2014 2015
21,622
508,703
46,098
893,222
135,882
1,602,942
Fundraisers Funders
Asia-Pacific Online Alternative Finance Market Fundamentals
Funders and Fundraisers in the Asia-Pacific Region
The number of market participants providing funds in the Asia-Pacific region, excluding China, has grown dramatically from 508,703 in 2013 to more than 1.6 million in 2015. The number of entities raising funds has also increased markedly, from approximately 21,600 to 136,000 between 2013 and 2015. The ratio of funders to successful fundraisers is trending downward, dropping from 23.5 in 2013 to 11.8 in 2014, which might suggest an increasingly competitive market for the available funds. However, we need to be mindful that both funder and fundraiser numbers are likely to involve a large degree of double counting.
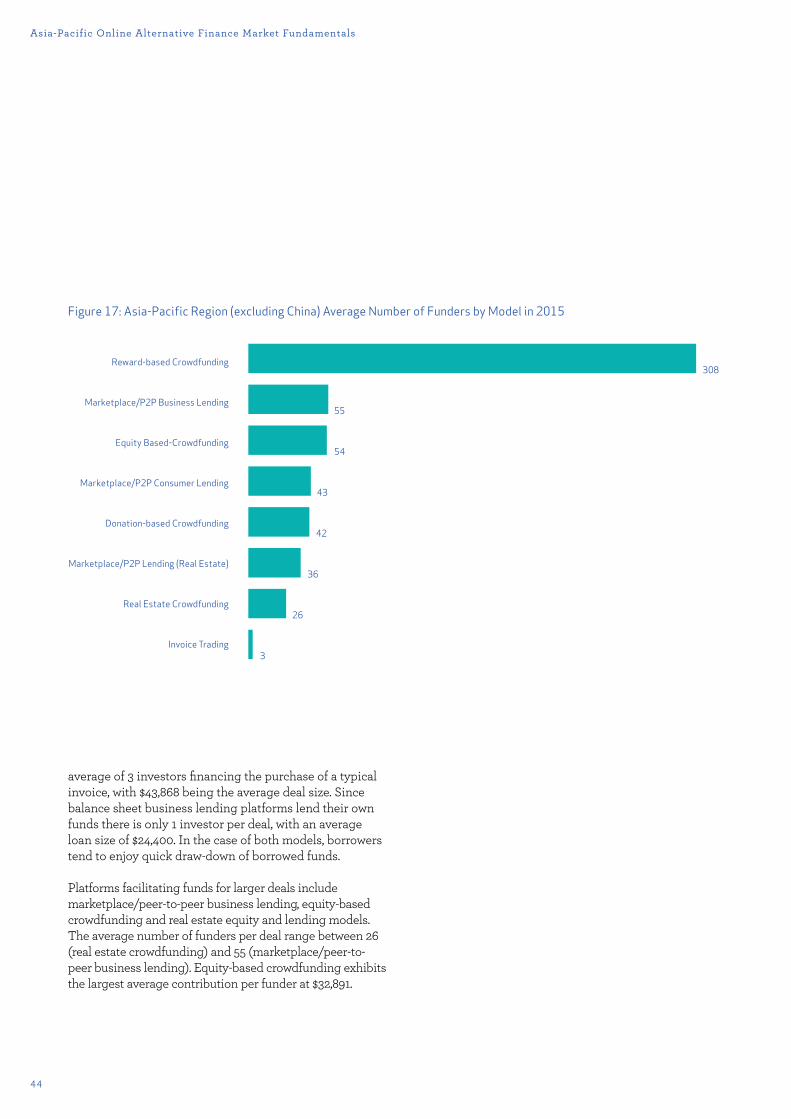
Examining the number of funders per successful fundraise by model type in the Asia-Pacific region, excluding China, paints a somewhat di¯erent picture. Reward-based crowdfunding platforms typically have an average of 308 funders per campaign, each individually contributing, on average, $102 towards the average fundraise size of $31,411. In donation-based crowdfunding platforms, on average it takes 42 donors to fund one fundraising project. On marketplace/peer-to-peer consumer lending platforms, it typically takes 43 lenders to finance a consumer loan averaging $17,167.
By way of contrast, the fundraisings on business-focused platforms, such as invoice trading and balance sheet business lending, have relatively few funders for each successful fundraise. Invoice trading platforms have an
Figure 16: Asia-Pacific Region (excluding China) Fundraisers and Funders (Individuals and Institutions) 2013-2015
43
44
Asia-Pacific Online Alternative Finance Market Fundamentals
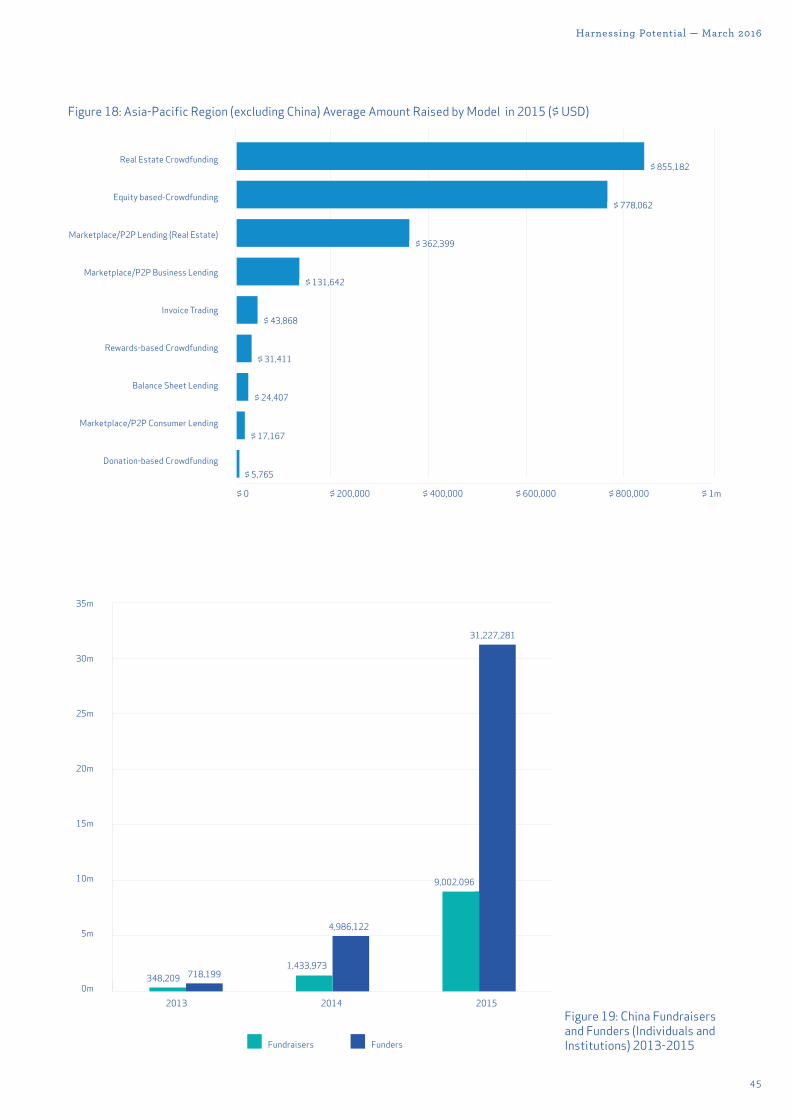
average of 3 investors financing the purchase of a typical invoice, with $43,868 being the average deal size. Since balance sheet business lending platforms lend their own funds there is only 1 investor per deal, with an average loan size of $24,400. In the case of both models, borrowers tend to enjoy quick draw-down of borrowed funds.
Platforms facilitating funds for larger deals include marketplace/peer-to-peer business lending, equity-based crowdfunding and real estate equity and lending models. The average number of funders per deal range between 26 (real estate crowdfunding) and 55 (marketplace/peer-to-peer business lending). Equity-based crowdfunding exhibits the largest average contribution per funder at $32,891.
Fig. 17
Reward-based Crowdfunding
Marketplace/P2P Business Lending
Equity Based-Crowdfunding
Marketplace/P2P Consumer Lending
Donation-based Crowdfunding
Marketplace/P2P Lending (Real Estate)
Real Estate Crowdfunding
Invoice Trading
308
55
43
54
42
36
26
3
Figure 17: Asia-Pacific Region (excluding China) Average Number of Funders by Model in 2015
45
Harnessing Potential — March 2016
Fig. 18
Real Estate Crowdfunding
Equity based-Crowdfunding
Marketplace/P2P Lending (Real Estate)
Marketplace/P2P Business Lending
Invoice Trading
Rewards-based Crowdfunding
Balance Sheet Lending
Marketplace/P2P Consumer Lending
Donation-based Crowdfunding
$ 855,182
$ 778,062
$ 362,399
$ 131,642
$ 43,868
$ 31,411
$ 24,407
$ 17,167
$ 5,765
$ 0 $ 200,000 $ 400,000 $ 600,000 $ 800,000 $ 1m
Figure 18: Asia-Pacific Region (excluding China) Average Amount Raised by Model in 2015 ($ USD)
Figure 19: China Fundraisers and Funders (Individuals and Institutions) 2013-2015
Fig. 19
35m
30m
25m
20m
15m
10m
5m
0m
Fundraisers Funders
2013 2014 2015
348,209 718,1991,433,973
4,986,122
9,002,096
31,227,281
46
Asia-Pacific Online Alternative Finance Market Fundamentals
Popular Sectors for Donation- and Reward-based Crowdfunding
Donation- and reward-based crowdfunding platforms reported funding a diverse range of sectors, with donation-based models, unsurprisingly, reporting Charity & Philanthropy as the most popular sector for funding purposes, followed by Health & Social Work and Community & Social Enterprise. Reward-based crowdfunding platforms were popularly used to fund Art, Music & Design projects, with Technology and Community & Social Enterprise campaigns also featuring prominently. The results of the survey make it apparent that the reward-based and donation-based platforms operate in spaces that are distinctly di¯erent from the marketplace/peer-to-peer lenders and other financial return-based models.
The majority of the business lending was to the Manufacturing & Engineering sector, followed by Agriculture, and Business & Professional Services sectors. Balance sheet business lending and invoice trading also report a large proportion of their funding being allocated to the Manufacturing & Engineering sector. Companies in the Technology sector are the dominant reward-based fundraisers in China.
Funders and Fundraisers in China
The rapid growth of online alternative finance in China has primarily been underpinned by strong demand for more flexible credit from individuals and small and medium size businesses and by an increasing supply of funding from retail investors who are seeking returns well above China’s prevailing bank deposit rates.
The total number of fundraisers (individuals and entities) reported by platforms to our survey rose from 348,209 in 2013, to more than 1.4 million in 2014 and more than 9 million in 2015. On the funding side, the number of reported funders (individuals and entities) rose from over 718,199 in 2013, to almost 5 million in 2014 and over 31.2 million in 2015. Again, double counting is likely to be a significant factor as funders may finance multiple loans or projects on multiple platforms and fundraisers may fundraise repeatedly within and across models.
The number of funders varies by sector and model. The largest average number of funders per fundraise is in marketplace/peer-to-peer consumer lending, where according to our survey, it takes an average number of 670 individuals or entities to finance a typical consumer loan. Marketplace/peer-to-peer business lending had an average of 383 lenders per loan, marketplace/peer-to-peer real estate lending had an average of 130 lenders per loan and equity-based crowdfunding and invoice trading both had an average of 121 investors per deal.
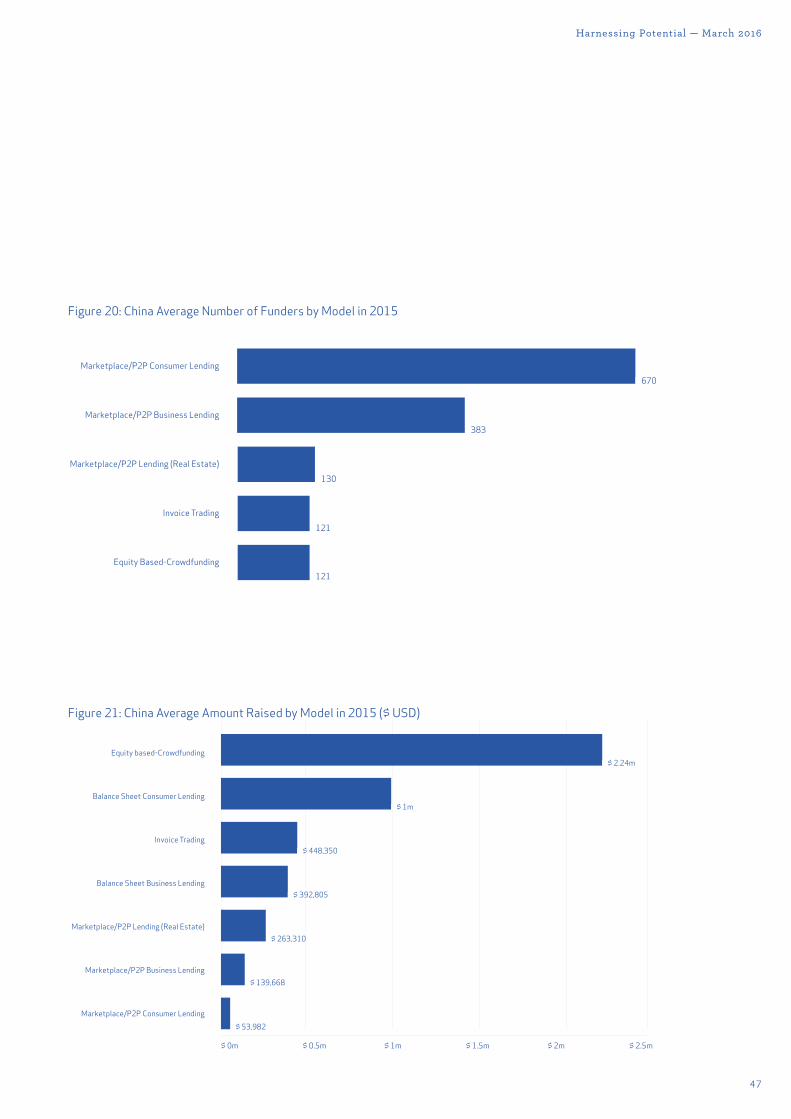
47
Harnessing Potential — March 2016
Fig. 20
Marketplace/P2P Consumer Lending
Marketplace/P2P Business Lending
Marketplace/P2P Lending (Real Estate)
Invoice Trading
Equity Based-Crowdfunding
670
383
130
121
121
Figure 20: China Average Number of Funders by Model in 2015Fig. 21
$ 0m $ 0.5m $ 1m $ 1.5m $ 2m $ 2.5m
$ 53,982
$ 139,668
$ 263,310
$ 392,805
$ 448,350
$ 1m
$ 2.24mEquity based-Crowdfunding
Balance Sheet Consumer Lending
Invoice Trading
Balance Sheet Business Lending
Marketplace/P2P Lending (Real Estate)
Marketplace/P2P Business Lending
Marketplace/P2P Consumer Lending
Figure 21: China Average Amount Raised by Model in 2015 ($ USD)
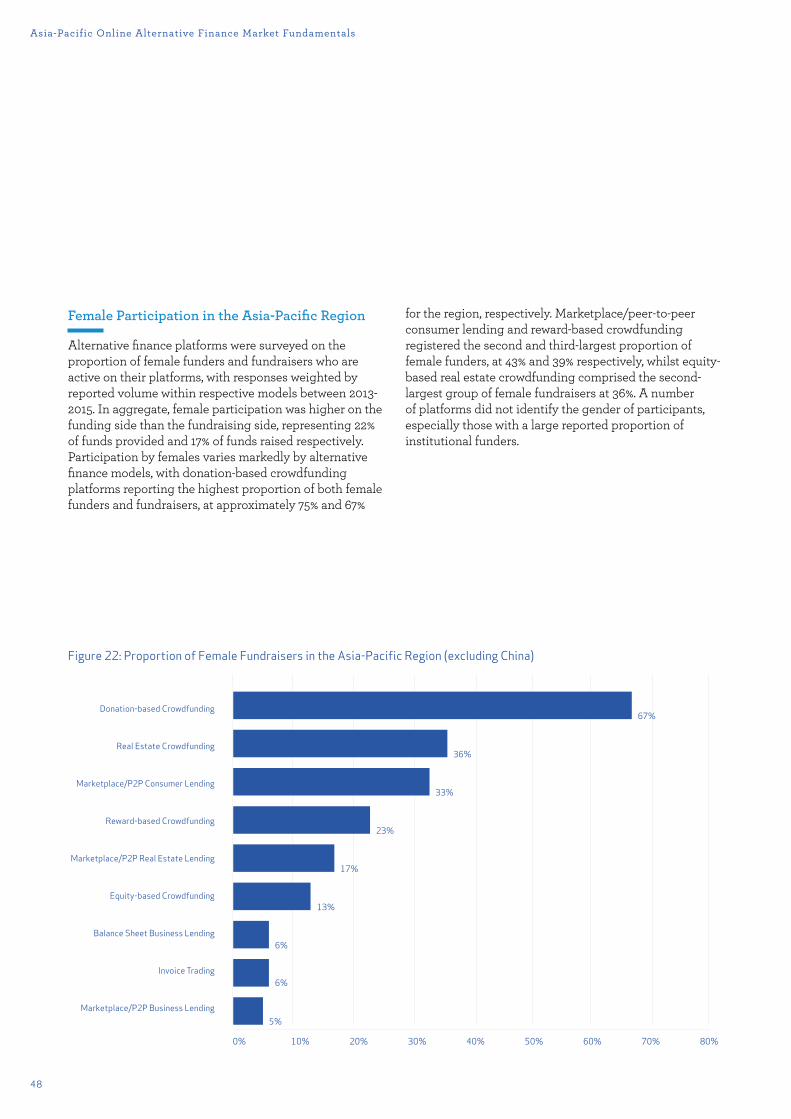
48
Asia-Pacific Online Alternative Finance Market Fundamentals
Fig. 22
Donation-based Crowdfunding
Real Estate Crowdfunding
Marketplace/P2P Consumer Lending
Reward-based Crowdfunding
Marketplace/P2P Real Estate Lending
Equity-based Crowdfunding
Balance Sheet Business Lending
Invoice Trading
Marketplace/P2P Business Lending
0% 10% 20% 30% 40% 50% 60% 70% 80%
67%
36%
33%
23%
17%
13%
6%
6%
5%
Figure 22: Proportion of Female Fundraisers in the Asia-Pacific Region (excluding China)
Female Participation in the Asia-Pacific Region
Alternative finance platforms were surveyed on the proportion of female funders and fundraisers who are active on their platforms, with responses weighted by reported volume within respective models between 2013-2015. In aggregate, female participation was higher on the funding side than the fundraising side, representing 22% of funds provided and 17% of funds raised respectively. Participation by females varies markedly by alternative finance models, with donation-based crowdfunding platforms reporting the highest proportion of both female funders and fundraisers, at approximately 75% and 67%
for the region, respectively. Marketplace/peer-to-peer consumer lending and reward-based crowdfunding registered the second and third-largest proportion of female funders, at 43% and 39% respectively, whilst equity-based real estate crowdfunding comprised the second-largest group of female fundraisers at 36%. A number of platforms did not identify the gender of participants, especially those with a large reported proportion of institutional funders.
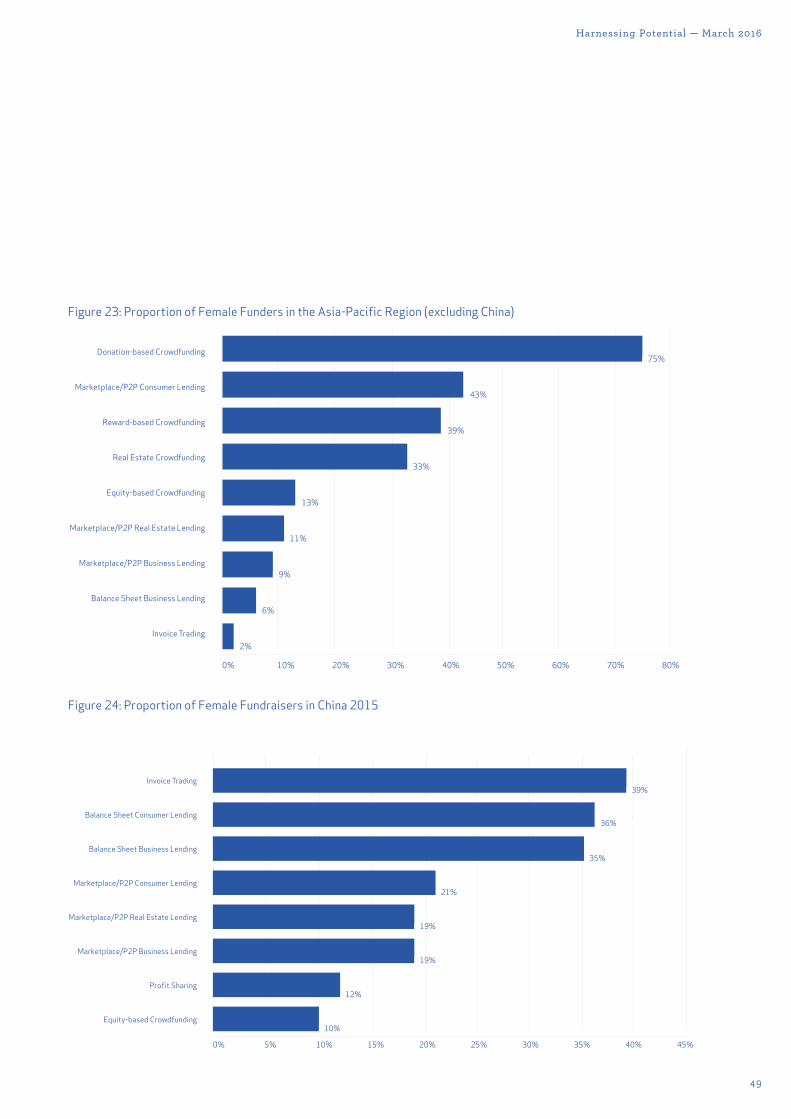
49
Harnessing Potential — March 2016
Figure 23: Proportion of Female Funders in the Asia-Pacific Region (excluding China)
Figure 24: Proportion of Female Fundraisers in China 2015
Fig. 23
Donation-based Crowdfunding
Marketplace/P2P Consumer Lending
Reward-based Crowdfunding
Real Estate Crowdfunding
Equity-based Crowdfunding
Marketplace/P2P Real Estate Lending
Marketplace/P2P Business Lending
Balance Sheet Business Lending
Invoice Trading
0% 10% 20% 30% 40% 50% 60% 70% 80%
2%
6%
9%
11%
13%
33%
43%
75%
39%
Fig. 24
Invoice Trading
Balance Sheet Consumer Lending
Balance Sheet Business Lending
Marketplace/P2P Consumer Lending
Marketplace/P2P Real Estate Lending
Marketplace/P2P Business Lending
Profit Sharing
Equity-based Crowdfunding
0% 5% 10% 15% 20% 25% 30% 35% 40% 45%
39%
36%
35%
21%
12%
10%
19%
19%
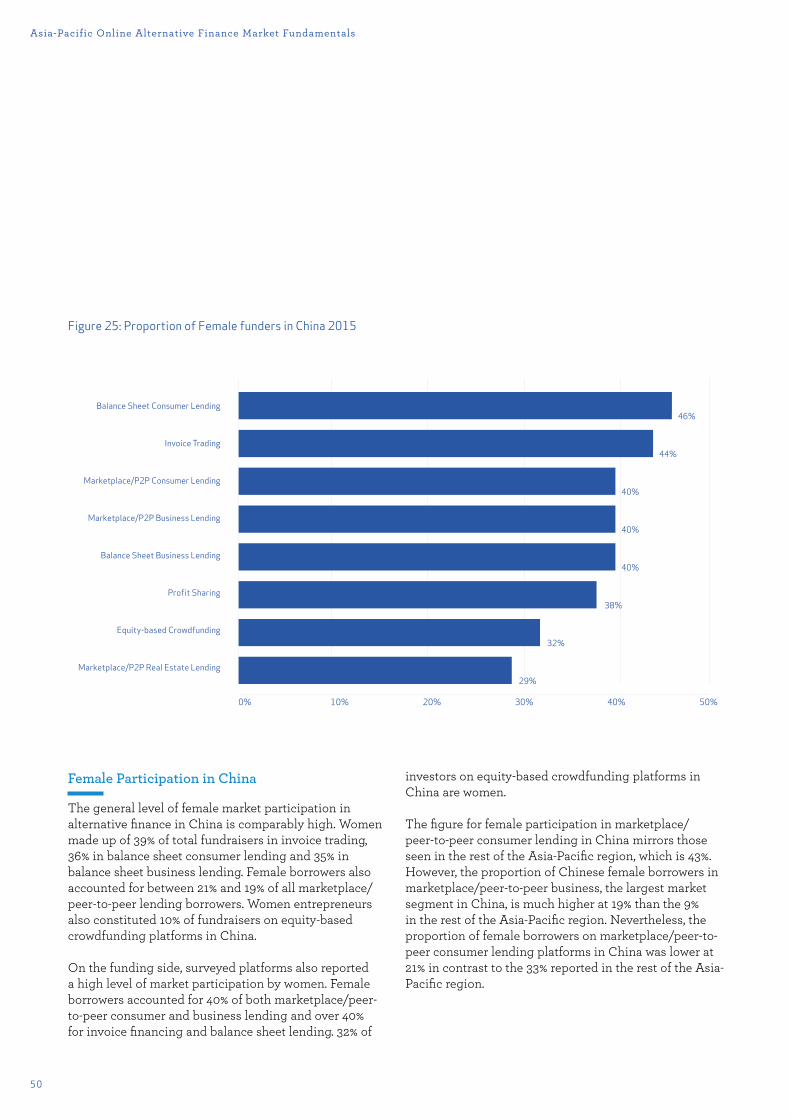
50
Asia-Pacific Online Alternative Finance Market Fundamentals
Female Participation in China
The general level of female market participation in alternative finance in China is comparably high. Women made up of 39% of total fundraisers in invoice trading, 36% in balance sheet consumer lending and 35% in balance sheet business lending. Female borrowers also accounted for between 21% and 19% of all marketplace/peer-to-peer lending borrowers. Women entrepreneurs also constituted 10% of fundraisers on equity-based crowdfunding platforms in China.
On the funding side, surveyed platforms also reported a high level of market participation by women. Female borrowers accounted for 40% of both marketplace/peer-to-peer consumer and business lending and over 40% for invoice financing and balance sheet lending. 32% of
investors on equity-based crowdfunding platforms in China are women.
The figure for female participation in marketplace/peer-to-peer consumer lending in China mirrors those seen in the rest of the Asia-Pacific region, which is 43%. However, the proportion of Chinese female borrowers in marketplace/peer-to-peer business, the largest market segment in China, is much higher at 19% than the 9% in the rest of the Asia-Pacific region. Nevertheless, the proportion of female borrowers on marketplace/peer-to-peer consumer lending platforms in China was lower at 21% in contrast to the 33% reported in the rest of the Asia-Pacific region.
Fig. 25
Balance Sheet Consumer Lending
Invoice Trading
Marketplace/P2P Consumer Lending
Marketplace/P2P Business Lending
Balance Sheet Business Lending
Profit Sharing
Equity-based Crowdfunding
Marketplace/P2P Real Estate Lending
0% 10% 20% 30% 40% 50%
29%
32%
38%
40%
40%
40%
44%
46%
Figure 25: Proportion of Female funders in China 2015
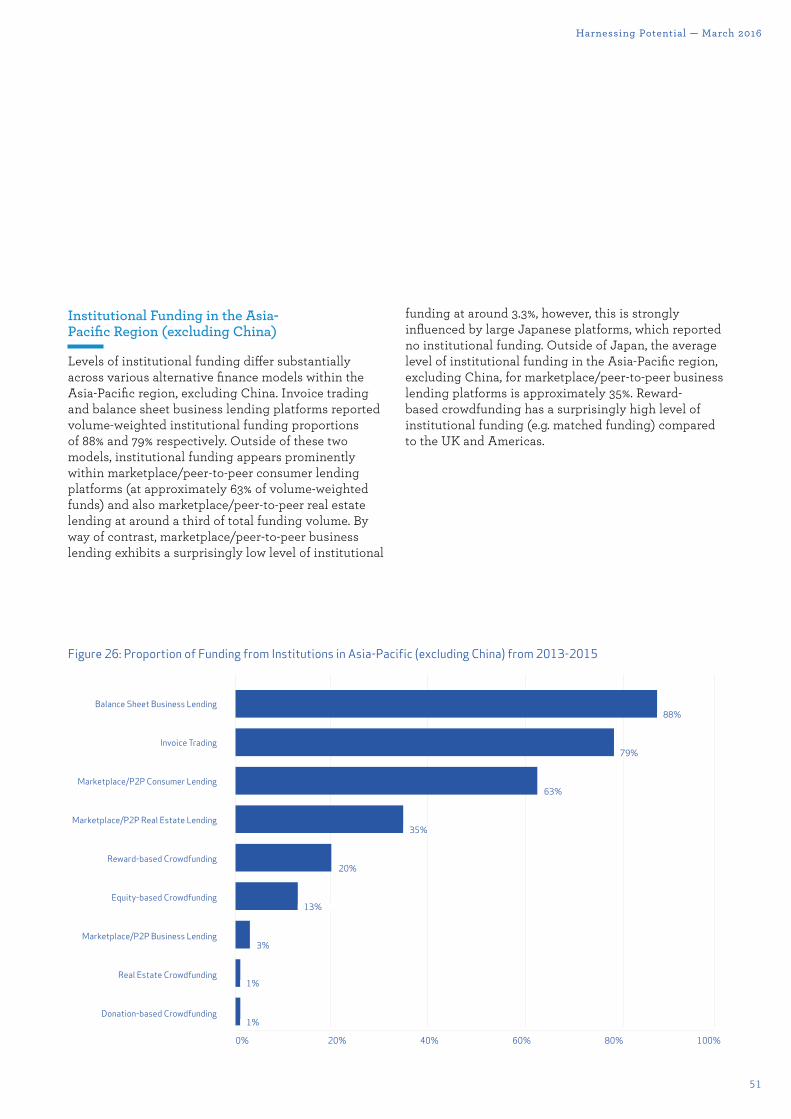
51
Harnessing Potential — March 2016
Institutional Funding in the Asia-Pacific Region (excluding China)
Levels of institutional funding di¯er substantially across various alternative finance models within the Asia-Pacific region, excluding China. Invoice trading and balance sheet business lending platforms reported volume-weighted institutional funding proportions of 88% and 79% respectively. Outside of these two models, institutional funding appears prominently within marketplace/peer-to-peer consumer lending platforms (at approximately 63% of volume-weighted funds) and also marketplace/peer-to-peer real estate lending at around a third of total funding volume. By way of contrast, marketplace/peer-to-peer business lending exhibits a surprisingly low level of institutional
funding at around 3.3%, however, this is strongly influenced by large Japanese platforms, which reported no institutional funding. Outside of Japan, the average level of institutional funding in the Asia-Pacific region, excluding China, for marketplace/peer-to-peer business lending platforms is approximately 35%. Reward-based crowdfunding has a surprisingly high level of institutional funding (e.g. matched funding) compared to the UK and Americas.
Fig. 26
Balance Sheet Business Lending
Invoice Trading
Marketplace/P2P Consumer Lending
Marketplace/P2P Real Estate Lending
Reward-based Crowdfunding
Equity-based Crowdfunding
Marketplace/P2P Business Lending
Real Estate Crowdfunding
Donation-based Crowdfunding
0% 20% 40% 60% 80% 100%
88%
79%
63%
35%
20%
13%
3%
1%
1%
Figure 26: Proportion of Funding from Institutions in Asia-Pacific (excluding China) from 2013-2015
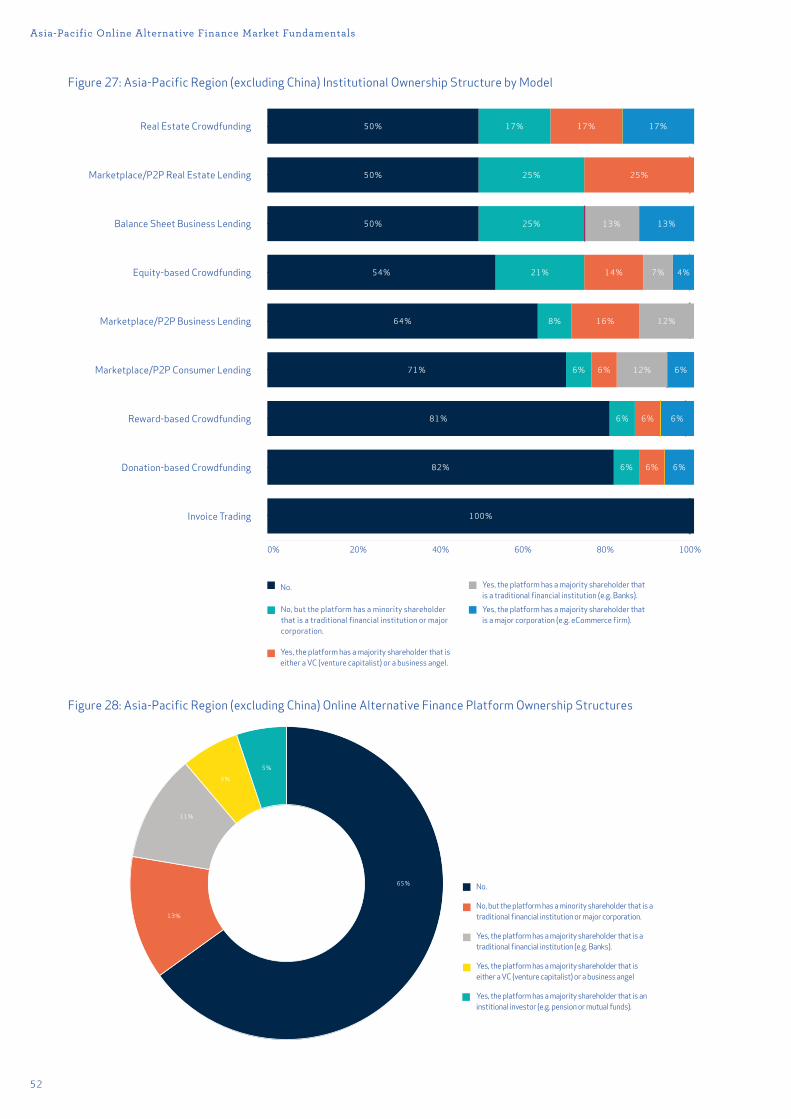
52
Fig. 27
17%
13%
4%
6%
6%
6%
13%
7%
12%
12%
17%
25%
14%
16%
6%
6%
6%
17%
25%
25%
21%
8%
6%
6%
6%
50%
50%
50%
54%
64%
71%
81%
82%
100%
Real Estate Crowdfunding
Marketplace/P2P Real Estate Lending
Balance Sheet Business Lending
Equity-based Crowdfunding
Marketplace/P2P Business Lending
Marketplace/P2P Consumer Lending
Reward-based Crowdfunding
Donation-based Crowdfunding
Invoice Trading
0% 20% 40% 60% 80% 100%
No.
No, but the platform has a minority shareholder that is a traditional financial institution or major corporation.
Yes, the platform has a majority shareholder that is a traditional financial institution (e.g. Banks).Yes, the platform has a majority shareholder that is a major corporation (e.g. eCommerce firm).
Yes, the platform has a majority shareholder that is either a VC (venture capitalist) or a business angel.
Figure 27: Asia-Pacific Region (excluding China) Institutional Ownership Structure by Model
Fig. 28
65%
13%
11%
6%
5%
No.
No, but the platform has a minority shareholder that is a traditional financial institution or major corporation.
Yes, the platform has a majority shareholder that is a traditional financial institution (e.g. Banks).
Yes, the platform has a majority shareholder that is either a VC (venture capitalist) or a business angel
Yes, the platform has a majority shareholder that is an institional investor (e.g. pension or mutual funds).
Figure 28: Asia-Pacific Region (excluding China) Online Alternative Finance Platform Ownership Structures
Asia-Pacific Online Alternative Finance Market Fundamentals
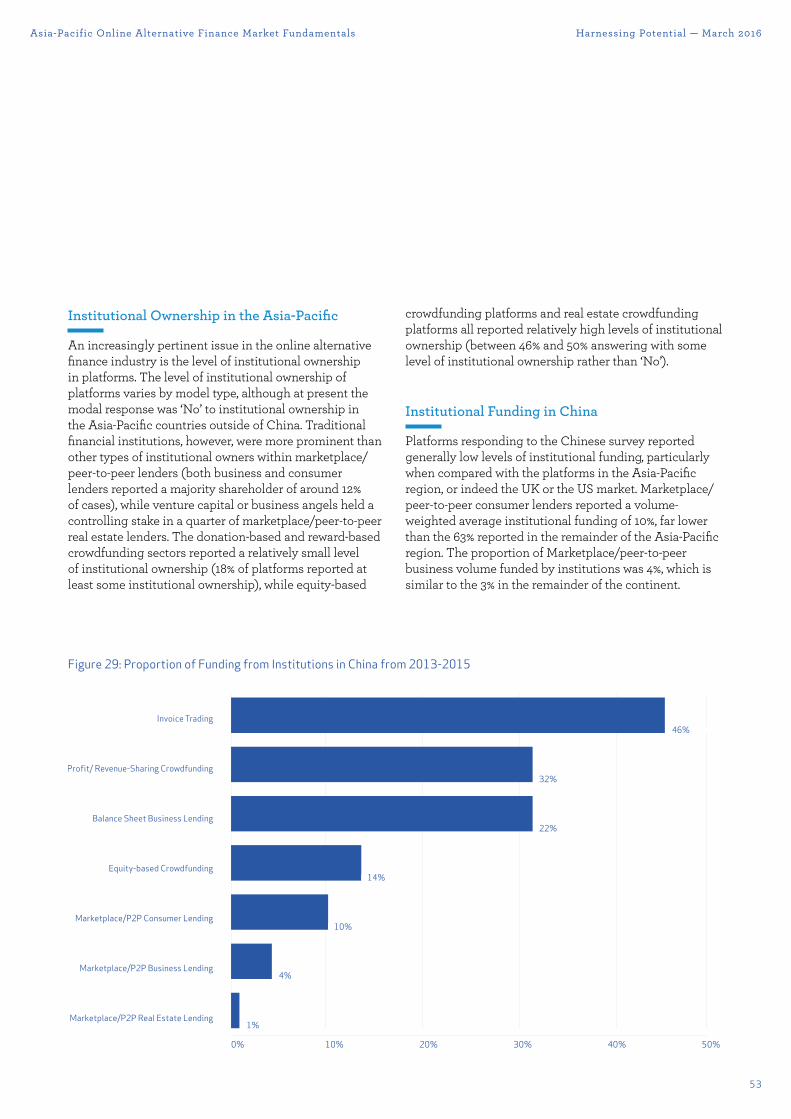
53
Harnessing Potential — March 2016
Institutional Ownership in the Asia-Pacific
An increasingly pertinent issue in the online alternative finance industry is the level of institutional ownership in platforms. The level of institutional ownership of platforms varies by model type, although at present the modal response was ‘No’ to institutional ownership in the Asia-Pacific countries outside of China. Traditional financial institutions, however, were more prominent than other types of institutional owners within marketplace/peer-to-peer lenders (both business and consumer lenders reported a majority shareholder of around 12% of cases), while venture capital or business angels held a controlling stake in a quarter of marketplace/peer-to-peer real estate lenders. The donation-based and reward-based crowdfunding sectors reported a relatively small level of institutional ownership (18% of platforms reported at least some institutional ownership), while equity-based
crowdfunding platforms and real estate crowdfunding platforms all reported relatively high levels of institutional ownership (between 46% and 50% answering with some level of institutional ownership rather than ‘No’).
Institutional Funding in China
Platforms responding to the Chinese survey reported generally low levels of institutional funding, particularly when compared with the platforms in the Asia-Pacific region, or indeed the UK or the US market. Marketplace/peer-to-peer consumer lenders reported a volume-weighted average institutional funding of 10%, far lower than the 63% reported in the remainder of the Asia-Pacific region. The proportion of Marketplace/peer-to-peer business volume funded by institutions was 4%, which is similar to the 3% in the remainder of the continent.
Asia-Pacific Online Alternative Finance Market Fundamentals
Fig. 29
Invoice Trading
Profit/ Revenue-Sharing Crowdfunding
Balance Sheet Business Lending
Equity-based Crowdfunding
Marketplace/P2P Consumer Lending
Marketplace/P2P Business Lending
Marketplace/P2P Real Estate Lending
0% 10% 20% 30% 40% 50%
46%
32%
22%
14%
4%
10%
1%
Figure 29: Proportion of Funding from Institutions in China from 2013-2015
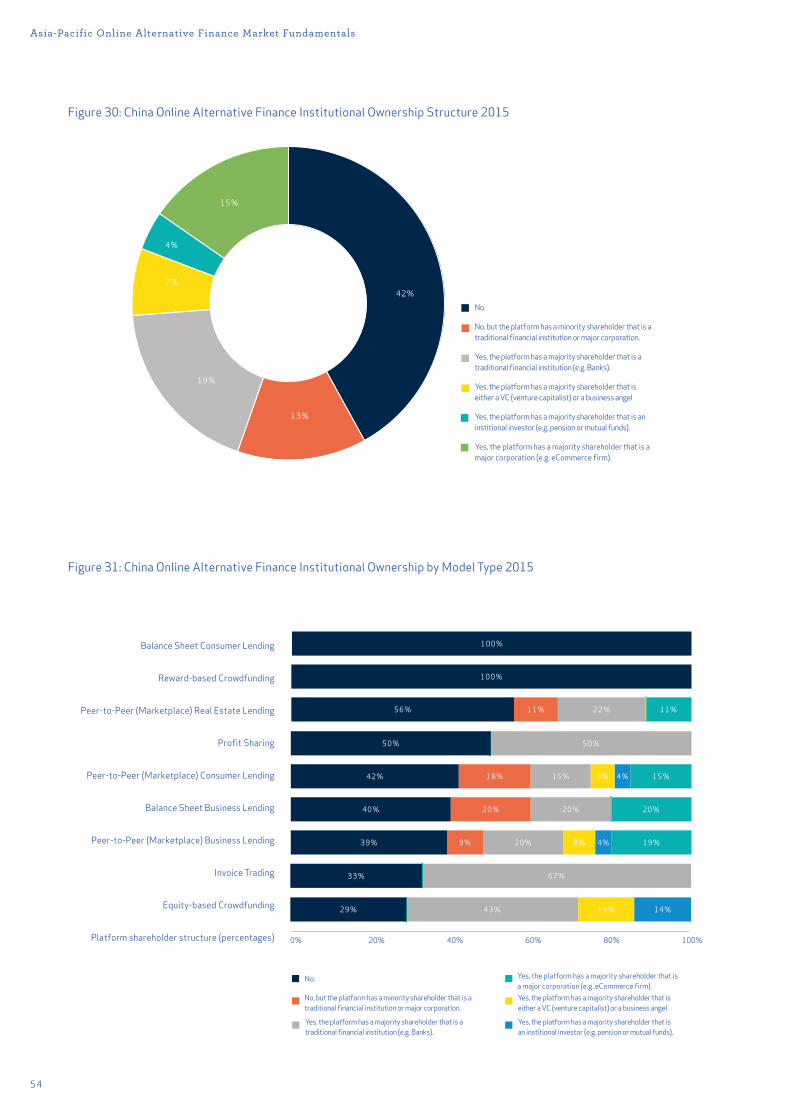
54
Fig. 30
42%
13%
19%
7%
4%
15%
No.
No, but the platform has a minority shareholder that is a traditional financial institution or major corporation.
Yes, the platform has a majority shareholder that is a traditional financial institution (e.g. Banks).
Yes, the platform has a majority shareholder that is either a VC (venture capitalist) or a business angel
Yes, the platform has a majority shareholder that is an institional investor (e.g. pension or mutual funds).
Yes, the platform has a majority shareholder that is a major corporation (e.g. eCommerce firm).
Fig. 31
No. Yes, the platform has a majority shareholder that is a major corporation (e.g. eCommerce firm).Yes, the platform has a majority shareholder that is either a VC (venture capitalist) or a business angel
Yes, the platform has a majority shareholder that is a traditional financial institution (e.g. Banks).
Yes, the platform has a majority shareholder that is an institional investor (e.g. pension or mutual funds).
No, but the platform has a minority shareholder that is a traditional financial institution or major corporation.
Balance Sheet Consumer Lending
Reward-based Crowdfunding
Peer-to-Peer (Marketplace) Real Estate Lending
Profit Sharing
Peer-to-Peer (Marketplace) Consumer Lending
Balance Sheet Business Lending
Peer-to-Peer (Marketplace) Business Lending
Invoice Trading
Equity-based Crowdfunding
Platform shareholder structure (percentages)
20%
11%
19%
15%
14%
4%
4%
14%
8%
6%
50%
20%
67%
43%
22%
20%
15%
20%
11%
9%
18%
50%
100%
100%
40%
33%
29%
56%
39%
42%
0% 20% 40% 60% 80% 100%
Figure 30: China Online Alternative Finance Institutional Ownership Structure 2015
Figure 31: China Online Alternative Finance Institutional Ownership by Model Type 2015
Asia-Pacific Online Alternative Finance Market Fundamentals
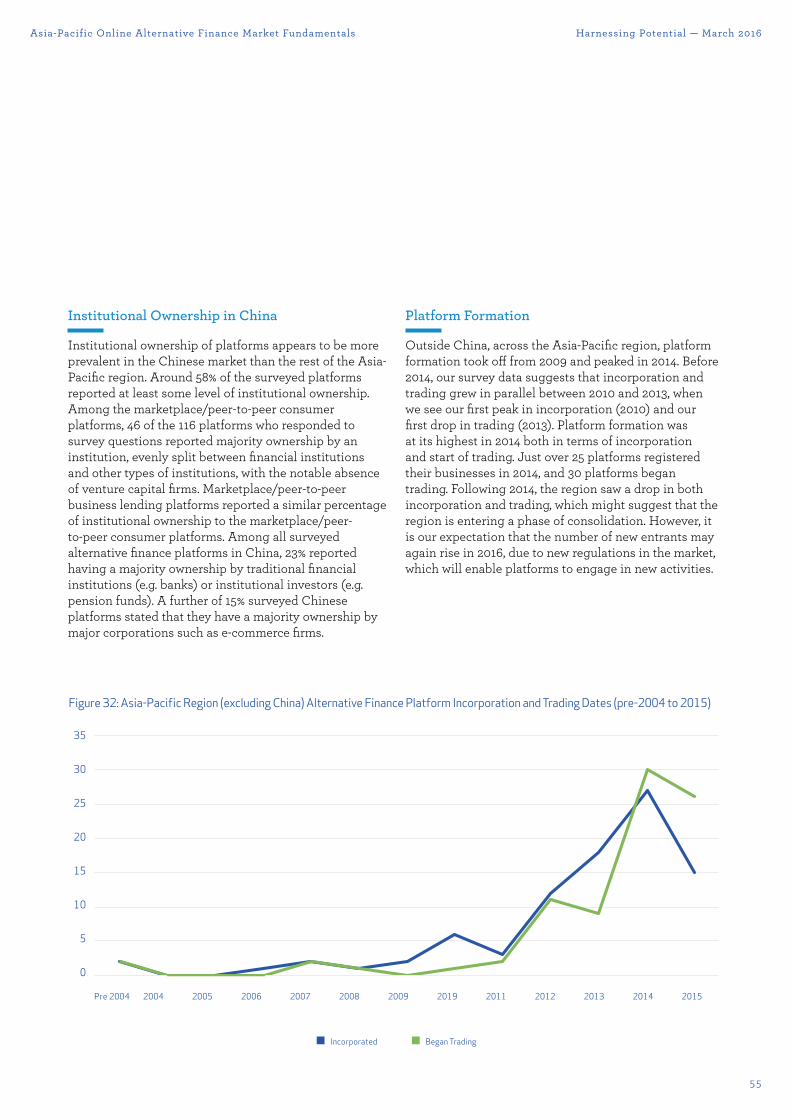
55
Harnessing Potential — March 2016
Institutional Ownership in China
Institutional ownership of platforms appears to be more prevalent in the Chinese market than the rest of the Asia-Pacific region. Around 58% of the surveyed platforms reported at least some level of institutional ownership. Among the marketplace/peer-to-peer consumer platforms, 46 of the 116 platforms who responded to survey questions reported majority ownership by an institution, evenly split between financial institutions and other types of institutions, with the notable absence of venture capital firms. Marketplace/peer-to-peer business lending platforms reported a similar percentage of institutional ownership to the marketplace/peer-to-peer consumer platforms. Among all surveyed alternative finance platforms in China, 23% reported having a majority ownership by traditional financial institutions (e.g. banks) or institutional investors (e.g. pension funds). A further of 15% surveyed Chinese platforms stated that they have a majority ownership by major corporations such as e-commerce firms.
Platform Formation
Outside China, across the Asia-Pacific region, platform formation took o¯ from 2009 and peaked in 2014. Before 2014, our survey data suggests that incorporation and trading grew in parallel between 2010 and 2013, when we see our first peak in incorporation (2010) and our first drop in trading (2013). Platform formation was at its highest in 2014 both in terms of incorporation and start of trading. Just over 25 platforms registered their businesses in 2014, and 30 platforms began trading. Following 2014, the region saw a drop in both incorporation and trading, which might suggest that the region is entering a phase of consolidation. However, it is our expectation that the number of new entrants may again rise in 2016, due to new regulations in the market, which will enable platforms to engage in new activities.
Asia-Pacific Online Alternative Finance Market Fundamentals
Fig. 32
Pre 2004 2004 2005 2006 2007 2008 2009 2019 2011 2012 2013 2014 2015
35
30
25
20
15
10
5
0
Began TradingIncorporated
Figure 32: Asia-Pacific Region (excluding China) Alternative Finance Platform Incorporation and Trading Dates (pre-2004 to 2015)
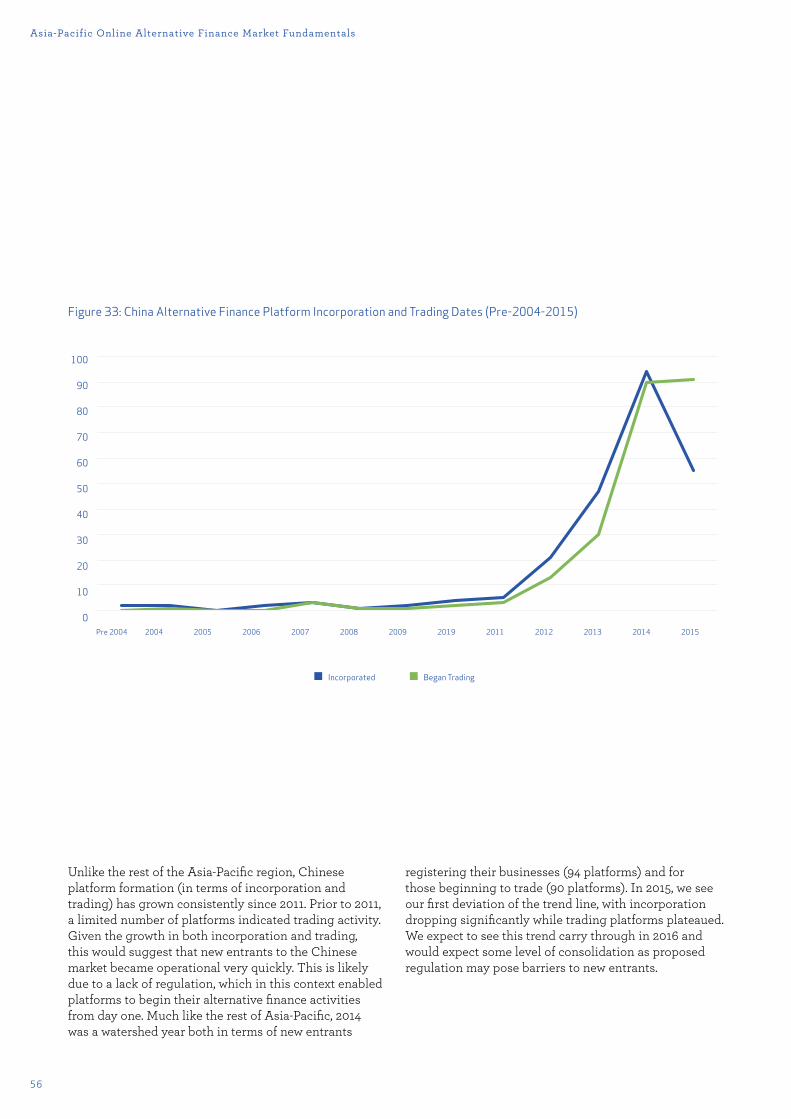
56
Asia-Pacific Online Alternative Finance Market Fundamentals
Unlike the rest of the Asia-Pacific region, Chinese platform formation (in terms of incorporation and trading) has grown consistently since 2011. Prior to 2011, a limited number of platforms indicated trading activity. Given the growth in both incorporation and trading, this would suggest that new entrants to the Chinese market became operational very quickly. This is likely due to a lack of regulation, which in this context enabled platforms to begin their alternative finance activities from day one. Much like the rest of Asia-Pacific, 2014 was a watershed year both in terms of new entrants
registering their businesses (94 platforms) and for those beginning to trade (90 platforms). In 2015, we see our first deviation of the trend line, with incorporation dropping significantly while trading platforms plateaued. We expect to see this trend carry through in 2016 and would expect some level of consolidation as proposed regulation may pose barriers to new entrants.
Fig. 33
Pre 2004 2004 2005 2006 2007 2008 2009 2019 2011 2012 2013 2014 2015
100
90
80
70
60
50
40
30
20
10
0
Began TradingIncorporated
Figure 33: China Alternative Finance Platform Incorporation and Trading Dates (Pre-2004-2015)

57
Harnessing Potential — March 2016
Funding Inflow / Funding Outflow
Excluding China, cross-border transactions are relatively small in the Asia-Pacific region, and vary across the area. Survey respondents were asked for the percentage of funds that were provided by, and raised for, o¯shore participants. Around 10% of the overall capital was raised from other countries across the Asia-Pacific region, with the highest level occurring in South-East Asia (mainly due to donation-based crowdfunding in developing countries). Capital outflows were generally smaller, suggesting that entities preferred to raise funds within
their respective national jurisdictions. As the market consolidates in the future, it will be vitally important to track the development of cross-border capital flows.
Fig. 34
33% 19% 12% 15% 9% 3% 3% 3%
50% 3% 5% 13% 8% 3% 8% 3% 3% 5% 3%
0% 10% 20% 30% 40% 50% 60% 70% 80% 90% 100%
0%
1-5%
6-10%
11-20% 51-60%
61-70%
71-80%
81-90%
91-100%
21-30%
31-40%
41-50%
1%1%
Outfl ow
Infl ow
Figure 34: Asia-Pacific (excluding China) Funding Inflow and Outflow for 2015
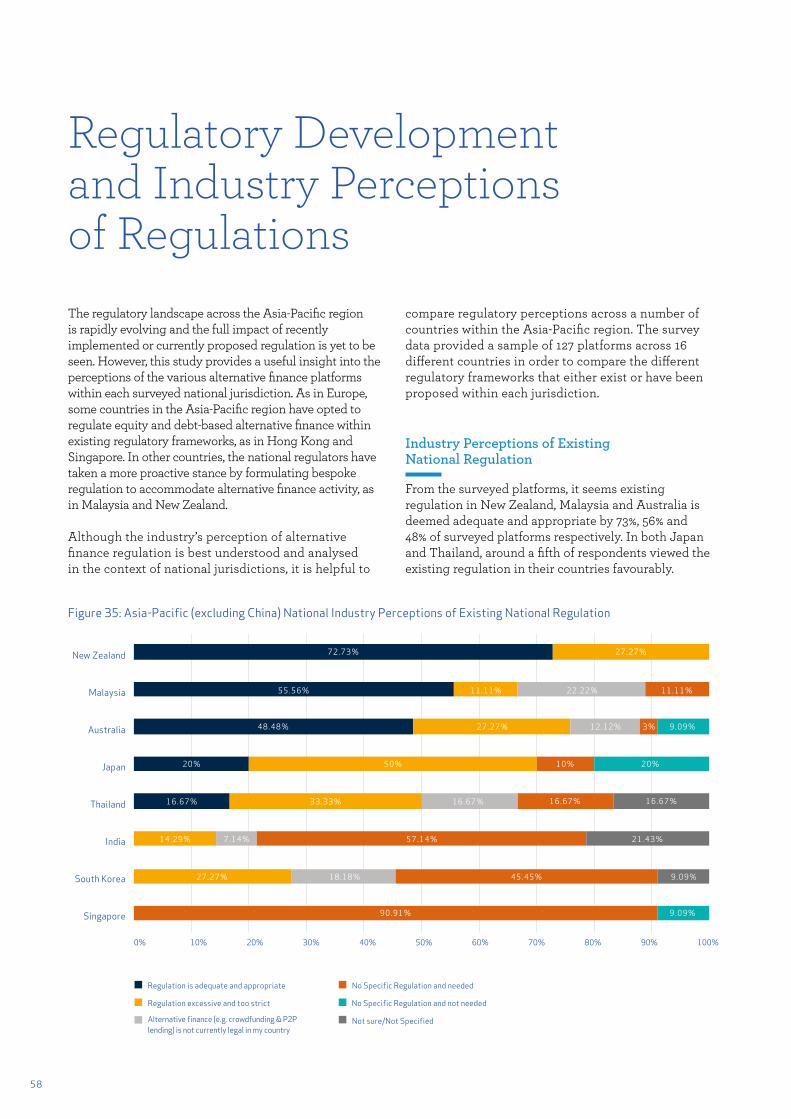
58
Regulatory Development and Industry Perceptions of Regulations The regulatory landscape across the Asia-Pacific region is rapidly evolving and the full impact of recently implemented or currently proposed regulation is yet to be seen. However, this study provides a useful insight into the perceptions of the various alternative finance platforms within each surveyed national jurisdiction. As in Europe, some countries in the Asia-Pacific region have opted to regulate equity and debt-based alternative finance within existing regulatory frameworks, as in Hong Kong and Singapore. In other countries, the national regulators have taken a more proactive stance by formulating bespoke regulation to accommodate alternative finance activity, as in Malaysia and New Zealand.
Although the industry’s perception of alternative finance regulation is best understood and analysed in the context of national jurisdictions, it is helpful to
compare regulatory perceptions across a number of countries within the Asia-Pacific region. The survey data provided a sample of 127 platforms across 16 di¯erent countries in order to compare the di¯erent regulatory frameworks that either exist or have been proposed within each jurisdiction.
Industry Perceptions of Existing National Regulation
From the surveyed platforms, it seems existing regulation in New Zealand, Malaysia and Australia is deemed adequate and appropriate by 73%, 56% and 48% of surveyed platforms respectively. In both Japan and Thailand, around a fifth of respondents viewed the existing regulation in their countries favourably.
Fig. 35
48.48%
Regulation is adequate and appropriate
Regulation excessive and too strict
Alternative fi nance (e.g. crowdfunding & P2P lending) is not currently legal in my country
No Specifi c Regulation and needed
No Specifi c Regulation and not needed
Not sure/Not Specifi ed
0% 10% 20% 30% 40% 50% 60% 70% 80% 90% 100%
New Zealand
Malaysia
Australia
Japan
Thailand
India
South Korea
Singapore
72.73%
55.56%
20%
16.67%
14.29%
27.27%
90.91%
18.18% 45.45%
7.14%
33.33%
50%
27.27%
11.11% 11.11%
3% 9.09%
20%10%
16.67% 16.67% 16.67%
21.43%
9.09%
9.09%
57.14%
27.27%
22.22%
12.12%
Figure 35: Asia-Pacific (excluding China) National Industry Perceptions of Existing National Regulation
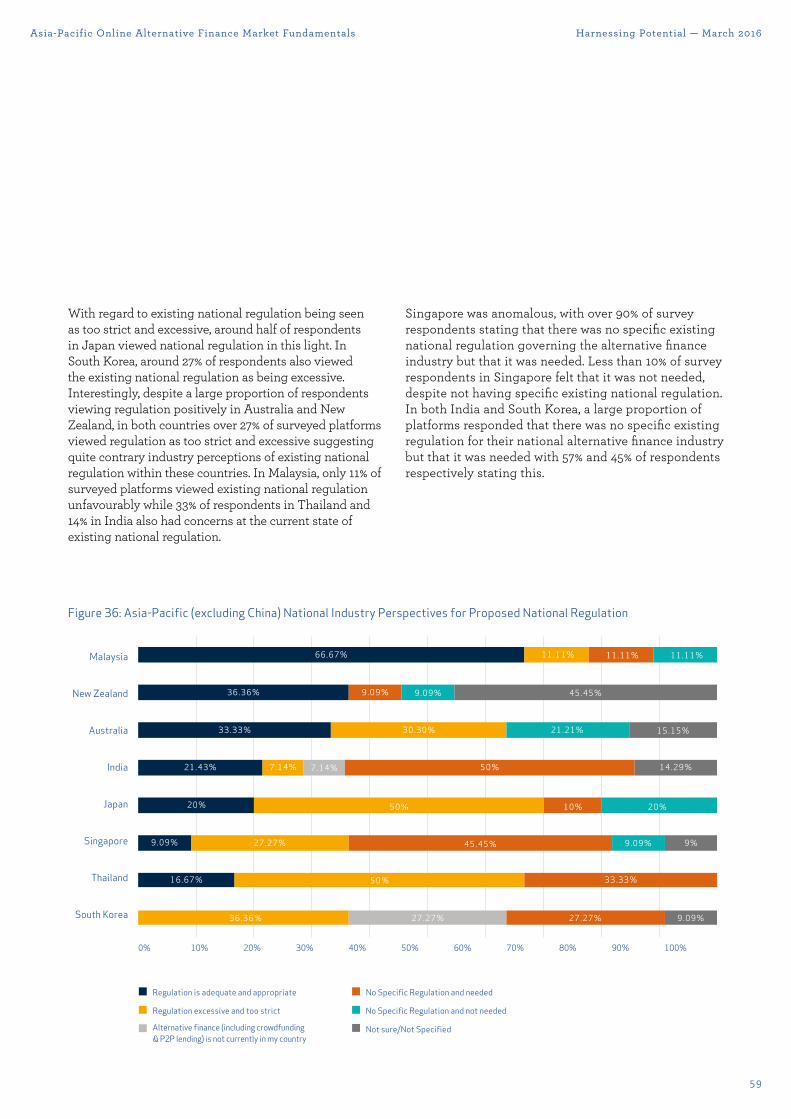
59
Harnessing Potential — March 2016Asia-Pacific Online Alternative Finance Market Fundamentals
With regard to existing national regulation being seen as too strict and excessive, around half of respondents in Japan viewed national regulation in this light. In South Korea, around 27% of respondents also viewed the existing national regulation as being excessive. Interestingly, despite a large proportion of respondents viewing regulation positively in Australia and New Zealand, in both countries over 27% of surveyed platforms viewed regulation as too strict and excessive suggesting quite contrary industry perceptions of existing national regulation within these countries. In Malaysia, only 11% of surveyed platforms viewed existing national regulation unfavourably while 33% of respondents in Thailand and 14% in India also had concerns at the current state of existing national regulation.
Singapore was anomalous, with over 90% of survey respondents stating that there was no specific existing national regulation governing the alternative finance industry but that it was needed. Less than 10% of survey respondents in Singapore felt that it was not needed, despite not having specific existing national regulation. In both India and South Korea, a large proportion of platforms responded that there was no specific existing regulation for their national alternative finance industry but that it was needed with 57% and 45% of respondents respectively stating this.
Fig. 36
0% 10% 20% 30% 40% 50% 60% 70% 80% 90% 100%
Malaysia
New Zealand
Australia
India
Japan
Singapore
Thailand
South Korea
Regulation is adequate and appropriate
Regulation excessive and too strict
Alternative finance (including crowdfunding & P2P lending) is not currently in my country
No Specific Regulation and needed
No Specific Regulation and not needed
Not sure/Not Specified
66.67%
36.36%
33.33%
21.43%
20%
9.09%
16.67%
36.36%
50%
27.27%
50%
45.45%
33.33%
27.27% 27.27%
50%7.14%
30.30%
9.09%
11.11% 11.11% 11.11%
9.09%
9.09% 9%
9.09%
21.21% 15.15%
14.29%
10% 20%
7.14%
45.45%
Figure 36: Asia-Pacific (excluding China) National Industry Perspectives for Proposed National Regulation
60
Regulatory Development and Industry Perceptions of Regulations
National Industry Perspectives for Proposed National Regulation
In a number of countries across the Asia-Pacific region, the national regulators are currently preparing their approach to regulating various alternative finance models, or are in the process of implementing new legislation. Regarding industry perceptions for the anticipated regulatory changes being imminently implemented, Malaysia seems to have a very positive industry perception, with two thirds of the survey respondents deeming the proposed national regulation as being adequate and appropriate. Similarly, in New Zealand and Australia, approximately one third of survey respondents see proposed national regulation positively as being adequate and appropriate. In both India and Japan, approximately a fifth of respondents also reacted similarly to the proposed regulation.
In terms of the industry perceptions of proposed regulation being excessive or strict, both Japan and South Korea raised these concerns with 50% and 36% of the survey respondents stating this respectively. In Australia, despite a large proportion of industry respondents viewing proposed regulation positively, approximately 30% view it as being excessive and strict. Likewise, in Singapore around 27% of surveyed platforms also view the proposals as too strict. In India (50%), Singapore (45%) and South Korea (27%), large proportions of surveyed platforms perceive a lack of proposed national regulation yet see it as being needed.
China’s Industry Perceptions of Alternative Finance Regulation
China is currently experiencing rapid development of various di¯erent alternative finance models. With these developments come substantial challenges for the national regulators in order to ameliorate against potential risks, protect consumers and investors while also harnessing the powerful potential of online alternative finance.
In order to gauge the industry’s perception of national regulation in China, 307 alternative finance platforms responded to the survey questions relating to their perceptions of existing national regulation and proposed regulations. Given this sample size, we have been able to assess the regulatory perceptions for six di¯erent alternative finance models which provides some useful points of comparison. The six models are marketplace/peer-to-peer consumer and business lending, marketplace/peer-to-peer real estate lending, equity-based crowdfunding, invoice trading and balance sheet business lending.
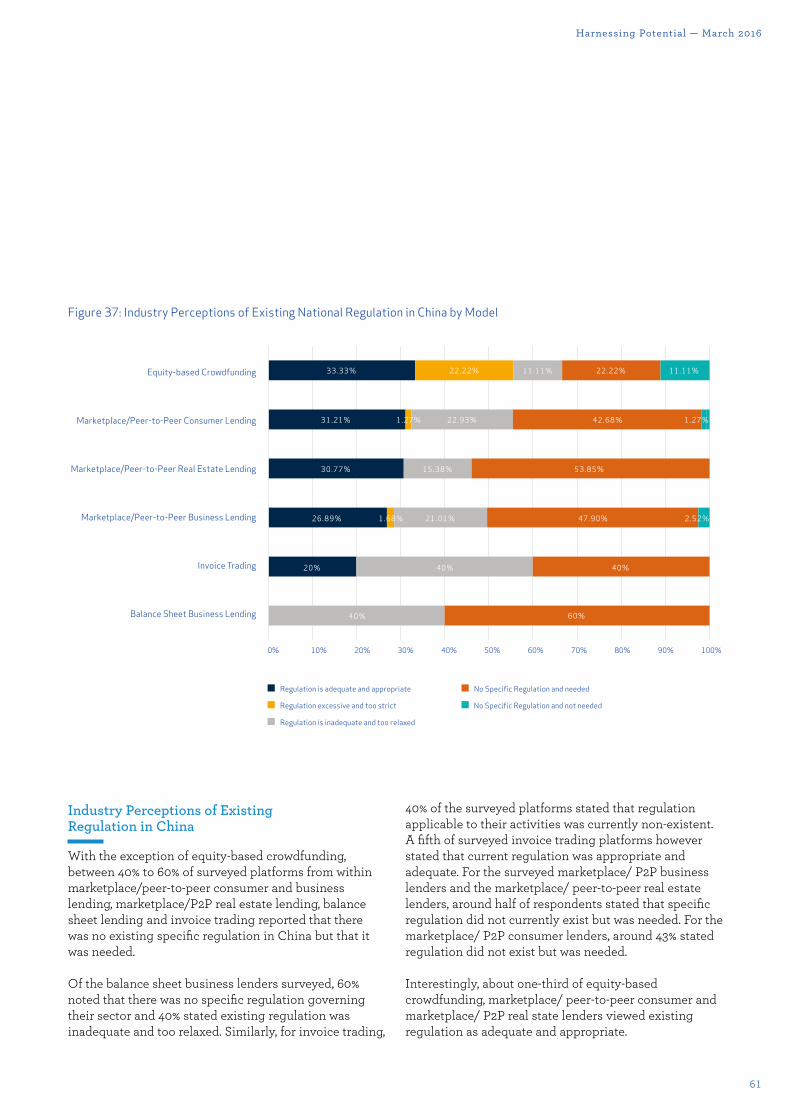
61
Harnessing Potential — March 2016
Industry Perceptions of Existing Regulation in China
With the exception of equity-based crowdfunding, between 40% to 60% of surveyed platforms from within marketplace/peer-to-peer consumer and business lending, marketplace/P2P real estate lending, balance sheet lending and invoice trading reported that there was no existing specific regulation in China but that it was needed.
Of the balance sheet business lenders surveyed, 60% noted that there was no specific regulation governing their sector and 40% stated existing regulation was inadequate and too relaxed. Similarly, for invoice trading,
40% of the surveyed platforms stated that regulation applicable to their activities was currently non-existent. A fifth of surveyed invoice trading platforms however stated that current regulation was appropriate and adequate. For the surveyed marketplace/ P2P business lenders and the marketplace/ peer-to-peer real estate lenders, around half of respondents stated that specific regulation did not currently exist but was needed. For the marketplace/ P2P consumer lenders, around 43% stated regulation did not exist but was needed.
Interestingly, about one-third of equity-based crowdfunding, marketplace/ peer-to-peer consumer and marketplace/ P2P real state lenders viewed existing regulation as adequate and appropriate.
Fig. 37
0% 10% 20% 30% 40% 50% 60% 70% 80% 90% 100%
Equity-based Crowdfunding
Marketplace/Peer-to-Peer Consumer Lending
Marketplace/Peer-to-Peer Real Estate Lending
Marketplace/Peer-to-Peer Business Lending
Invoice Trading
Balance Sheet Business Lending
Regulation is adequate and appropriate
Regulation excessive and too strict
Regulation is inadequate and too relaxed
No Specific Regulation and needed
No Specific Regulation and not needed
33.33%
31.21%
30.77%
26.89%
20%
40%
40% 40%
60%
21.01%
15.38%
22.93%
11.11% 11.11%22.22% 22.22%
42.68%
53.85%
47.90%
1.27%
1.68% 2.52%
1.27%
Figure 37: Industry Perceptions of Existing National Regulation in China by Model
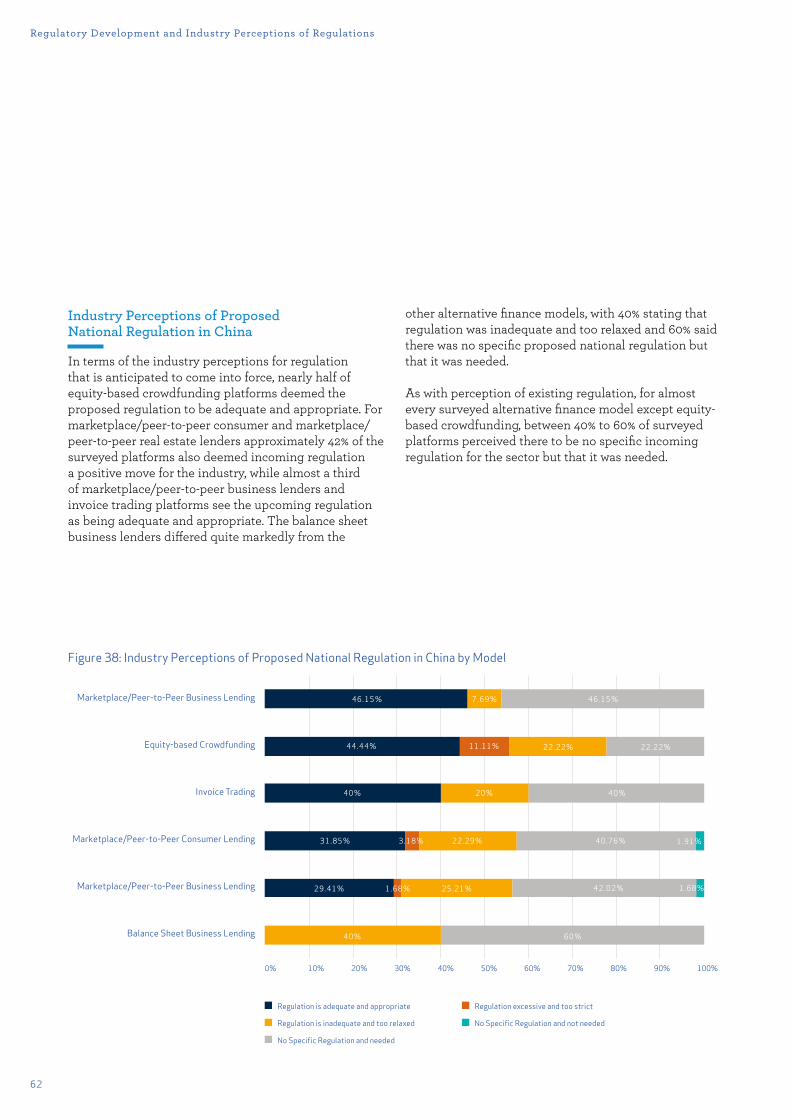
62
Regulatory Development and Industry Perceptions of Regulations
Industry Perceptions of Proposed National Regulation in China
In terms of the industry perceptions for regulation that is anticipated to come into force, nearly half of equity-based crowdfunding platforms deemed the proposed regulation to be adequate and appropriate. For marketplace/peer-to-peer consumer and marketplace/peer-to-peer real estate lenders approximately 42% of the surveyed platforms also deemed incoming regulation a positive move for the industry, while almost a third of marketplace/peer-to-peer business lenders and invoice trading platforms see the upcoming regulation as being adequate and appropriate. The balance sheet business lenders di¯ered quite markedly from the
other alternative finance models, with 40% stating that regulation was inadequate and too relaxed and 60% said there was no specific proposed national regulation but that it was needed.
As with perception of existing regulation, for almost every surveyed alternative finance model except equity-based crowdfunding, between 40% to 60% of surveyed platforms perceived there to be no specific incoming regulation for the sector but that it was needed.
Figure 38: Industry Perceptions of Proposed National Regulation in China by Model
Fig. 38
0% 10% 20% 30% 40% 50% 60% 70% 80% 90% 100%
Marketplace/Peer-to-Peer Business Lending
Equity-based Crowdfunding
Invoice Trading
Marketplace/Peer-to-Peer Consumer Lending
Marketplace/Peer-to-Peer Business Lending
Balance Sheet Business Lending
Regulation is adequate and appropriate Regulation excessive and too strict
Regulation is inadequate and too relaxed
No Specific Regulation and needed
No Specific Regulation and not needed
46.15%
44.44%
40%
31.85%
29.41%
40% 60%
42.02%
40.76%
40%
46.15%
25.21%
22.29%
20%
22.22% 22.22%
7.69%
11.11%
3.18%
1.68% 1.68%
1.91%
Market Development by Country and Region The Asia-Pacific region is very diverse and includes both developing and developed countries. The following sections examine the evolution of new online alternative finance by both region and key countries, based on the volume of online alternative finance. The key regions are Mainland China, East Asia, Oceania, South East Asia & South Asia. As discussed earlier in the report, the total volume of online alternative finance transactions in China was $101.69bn in 2015. This was over 90 times the volume of the rest of the Asia-Pacific region combined. Outside of mainland China, Oceania - which includes Australia and New Zealand - accounts for both the largest combined share and fastest growth in volume of online alternative finance transactions in the Asia-Pacific region, totalling more than $621m in 2015. The volume of alternative finance across East Asia (Japan, South Korea, Taiwan and Hong Kong) has also grown rapidly, from $123m in 2014 to $412m in 2015. South East Asia (including Singapore, Malaysia, Thailand and Indonesia) accounted for $47m in transactions in 2015. Across the South Asian countries surveyed (India, Sri Lanka and Pakistan) - online alternative finance transaction volume totalled $40m in 2015.
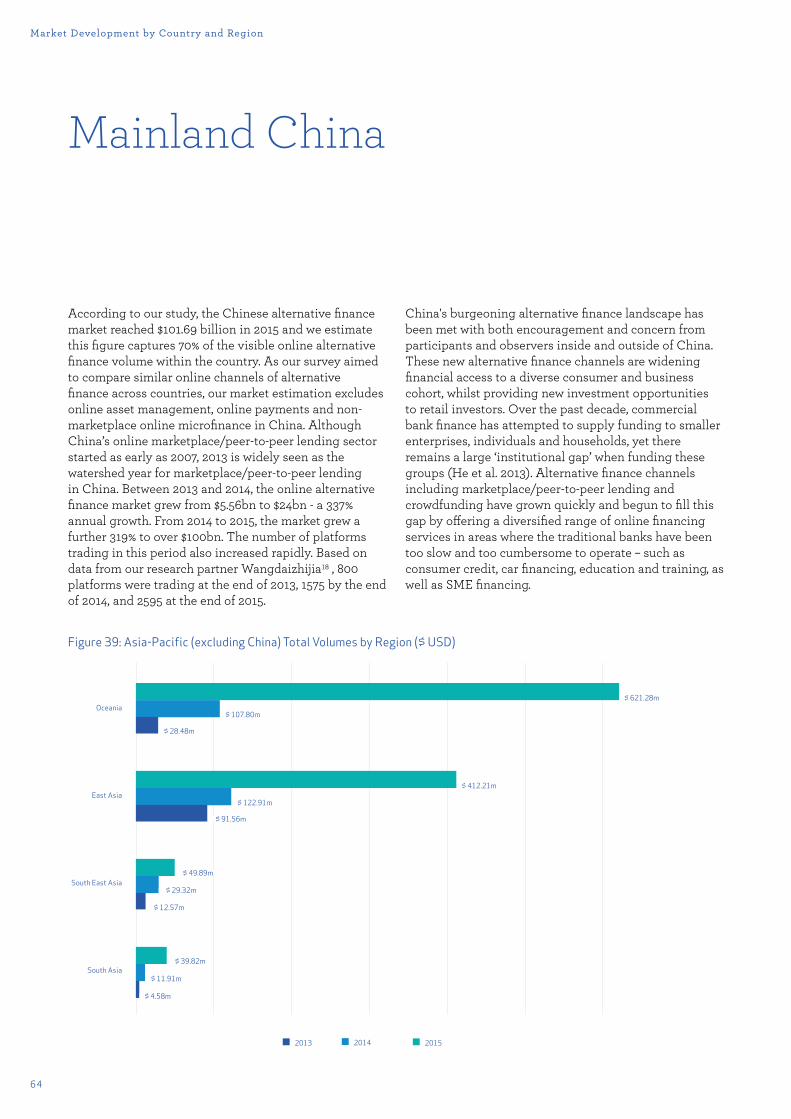
Fig. 39
Oceania
East Asia
South East Asia
South Asia
$ 107.80m
$ 122.91m
$ 91.56m
$ 49.89m
$ 29.32m
$ 12.57m
$ 39.82m
$ 11.91m
$ 4.58m
$ 621.28m
$ 412.21m
$ 28.48m
2014 20152013
Figure 39: Asia-Pacific (excluding China) Total Volumes by Region ($ USD)
Mainland China
According to our study, the Chinese alternative finance market reached $101.69 billion in 2015 and we estimate this figure captures 70% of the visible online alternative finance volume within the country. As our survey aimed to compare similar online channels of alternative finance across countries, our market estimation excludes online asset management, online payments and non-marketplace online microfinance in China. Although China’s online marketplace/peer-to-peer lending sector started as early as 2007, 2013 is widely seen as the watershed year for marketplace/peer-to-peer lending in China. Between 2013 and 2014, the online alternative finance market grew from $5.56bn to $24bn - a 337% annual growth. From 2014 to 2015, the market grew a further 319% to over $100bn. The number of platforms trading in this period also increased rapidly. Based on data from our research partner Wangdaizhijia18 , 800 platforms were trading at the end of 2013, 1575 by the end of 2014, and 2595 at the end of 2015.
China's burgeoning alternative finance landscape has been met with both encouragement and concern from participants and observers inside and outside of China. These new alternative finance channels are widening financial access to a diverse consumer and business cohort, whilst providing new investment opportunities to retail investors. Over the past decade, commercial bank finance has attempted to supply funding to smaller enterprises, individuals and households, yet there remains a large ‘institutional gap’ when funding these groups (He et al. 2013). Alternative finance channels including marketplace/peer-to-peer lending and crowdfunding have grown quickly and begun to fill this gap by o¯ering a diversified range of online financing services in areas where the traditional banks have been too slow and too cumbersome to operate – such as consumer credit, car financing, education and training, as well as SME financing.
64
Market Development by Country and Region
65
Harnessing Potential — March 2016
While government regulation is very clear on the illegality of unlicensed private fundraising, the challenge for regulators and new retail investors is that it is often di�cult to verify the underlying finance model and the capability of platforms in terms of due diligence, underwriting and credit risk control. Increasing credit and investor risk, exacerbated by inexperienced management teams in some cases, greed and outright fraud in other cases, has led to a large number of ‘incidents’ and platform collapses. According to Wangdaizhijia’s data, the reported number of problem ‘incidents’ rose from 92 in 2013, to 367 in 2014 to 1263 in 201519. Although there are many genuine marketplace/peer-to-peer lending platforms in China facilitating access to consumer and business credit, following the best business practices and have robust credit risk modelling and management capabilities, the existence of fraudulent platforms magnify the underlying challenges to the sector. Most recently, peer-to-peer lending platform E’zu Bao collapsed after its executives were exposed for syphoning $7.3bn from over 900,000 investors in a short-lived Ponzi scheme20. E’zu Bao had o¯ered a financial leasing product with ‘guaranteed returns’ to retail investors - a practice which is commonplace in China’s online wealth management sector21. Many of these wealth management companies are new or old informal shadow banks that have moved online in recent years, to o¯er a vast range of ‘expected return’ wealth management products.
To address some of these issues, China’s government has adopted a twofold approach to regulate the sector. The Chinese government is taking a broad policy position in support of Internet finance and the development of new platforms across lending, asset management and insurance, whilst introducing ‘moderately loose regulatory policies’ (PBOC 2015a)22. The logic of this position is that by opening up new channels of private financing, the platforms can also be formalised and regulated. Under the new Internet finance guidance policy framework, marketplace/peer-to-peer lending platform must now hold borrower and lender funds in custodian accounts with ‘registered financial institutions’23. This means customer funds for both borrowers and lenders must be kept with a registered financial institution, rather than by the alternative finance platform itself. The custodian account acts as the fund transfer mechanism between lenders and borrowers, and serves as an escrow account for all transactions between both sides24. This requirement may result in increased barriers to entry for newly established platforms. If it is e¯ectively implemented, it will likely lead to the consolidation of a number of operating platforms.
The China Banking Regulatory Commission o�cials have also repeatedly drawn a number of policy ‘red lines’ for the marketplace/peer-to-peer lending sector (Hexun 2014). This includes potentially ending the practice of platforms o¯ering loan guarantees on the principal of the loan. There are also broader issues relating to underlying credit and investor risks. Both regulators and the industry are seeking to deal with these through leveraging e-commerce, online payments and marketplace/peer-to-peer lending platform data to build and integrate online credit systems. Platforms may also be required to implement investor education and diversification requirements25.
66
Market Development by Country and Region
While China’s marketplace/peer-to-peer lending market is undergoing rapid growth, it remains very small compared to the total volume of bank lending in China. To put this into perspective, the total Chinese household deposits at the end of 2015 was equivalent to $8.8 trillion USD as reported by the National Bureau of Statistics of the PRC, which provides an estimate of potential retail investable assets26. In 2015, consumer lending by registered banks in China was approximately $3 trillion USD, which is 57 times greater than the $52.4bn volume reported by marketplace/peer-to-peer consumer lenders. Arguably, a more appropriate comparison for marketplace/peer-to-peer consumer lending is the value of short-term consumer loans made by banks, which at $652bn in 2015, is 12 times the value of the reported volume of consumer lending in our survey. The marketplace/peer-to-peer lending market is likely to continue playing a more and more substantial role in China’s lending markets as the sector continues its rapid growth.
Equity-based crowdfunding is another potential area for growth within online alternative finance in China. The reported equity-based crowdfunding volume in our survey was almost $0.95bn in 2015, yet the scale of China’s wider informal market for private investment is certainly larger. Draft rules for equity-based investment have been released by the Securities Association of China (SAC) in 2015 and at least 8 platforms have registered with the SAC to operate equity-based crowdfunding platforms27. At present, the draft regulatory framework would restrict participation to only accredited investors who possess net assets of RMB 10 million or who possess financial assets of RMB 3 million and have had an annual income of at least RMB 500,000 for the past 3 years. These restrictions would e¯ectively prevent the participation of a wider pool of retail investors and would likely result in the continuation of private placement activity remaining oÀine. Should equity-based crowdfunding regulation in China allow for retail investment, this may result in widening the pool of early stage company seed funding and provide a more open market for testing start-up business potential28.
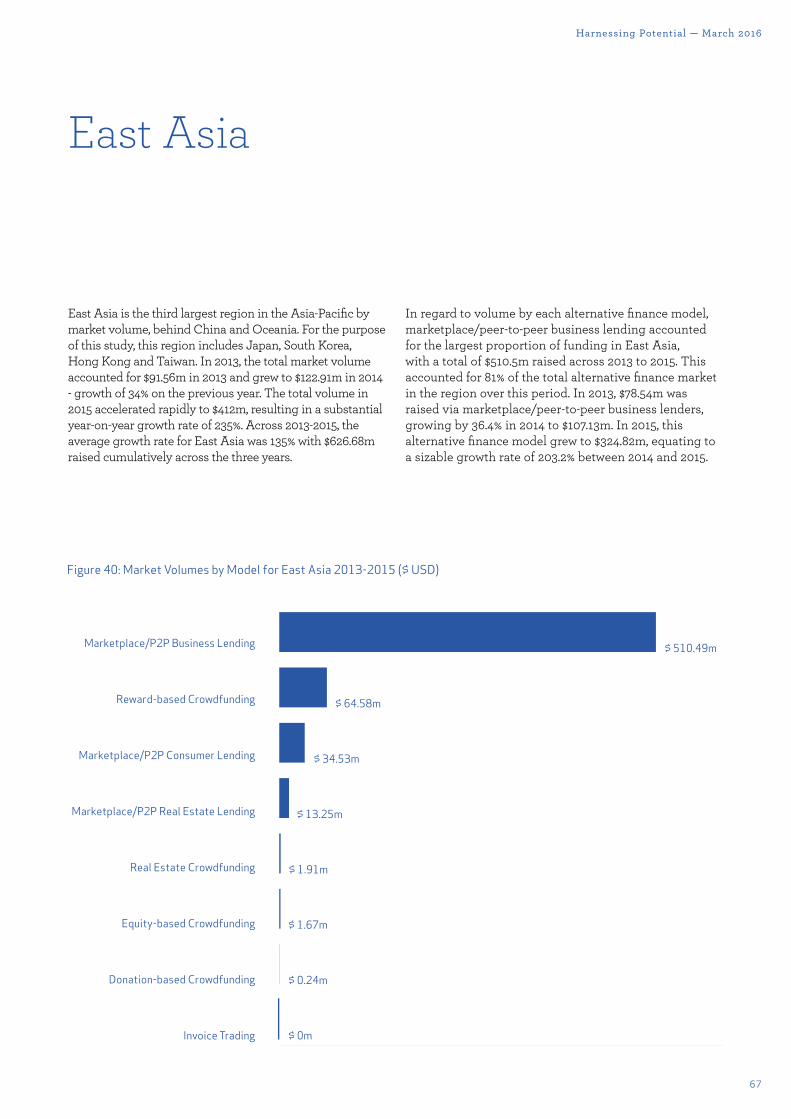
67
Harnessing Potential — March 2016
East Asia
East Asia is the third largest region in the Asia-Pacific by market volume, behind China and Oceania. For the purpose of this study, this region includes Japan, South Korea, Hong Kong and Taiwan. In 2013, the total market volume accounted for $91.56m in 2013 and grew to $122.91m in 2014 - growth of 34% on the previous year. The total volume in 2015 accelerated rapidly to $412m, resulting in a substantial year-on-year growth rate of 235%. Across 2013-2015, the average growth rate for East Asia was 135% with $626.68m raised cumulatively across the three years.
In regard to volume by each alternative finance model, marketplace/peer-to-peer business lending accounted for the largest proportion of funding in East Asia, with a total of $510.5m raised across 2013 to 2015. This accounted for 81% of the total alternative finance market in the region over this period. In 2013, $78.54m was raised via marketplace/peer-to-peer business lenders, growing by 36.4% in 2014 to $107.13m. In 2015, this alternative finance model grew to $324.82m, equating to a sizable growth rate of 203.2% between 2014 and 2015.
Fig. 40
$ 510.49m
$ 64.58m
$ 34.53m
$ 13.25m
$ 1.91m
$ 1.67m
$ 0.24m
$ 0m
Marketplace/P2P Business Lending
Reward-based Crowdfunding
Marketplace/P2P Consumer Lending
Marketplace/P2P Real Estate Lending
Real Estate Crowdfunding
Equity-based Crowdfunding
Donation-based Crowdfunding
Invoice Trading
Figure 40: Market Volumes by Model for East Asia 2013-2015 ($ USD)
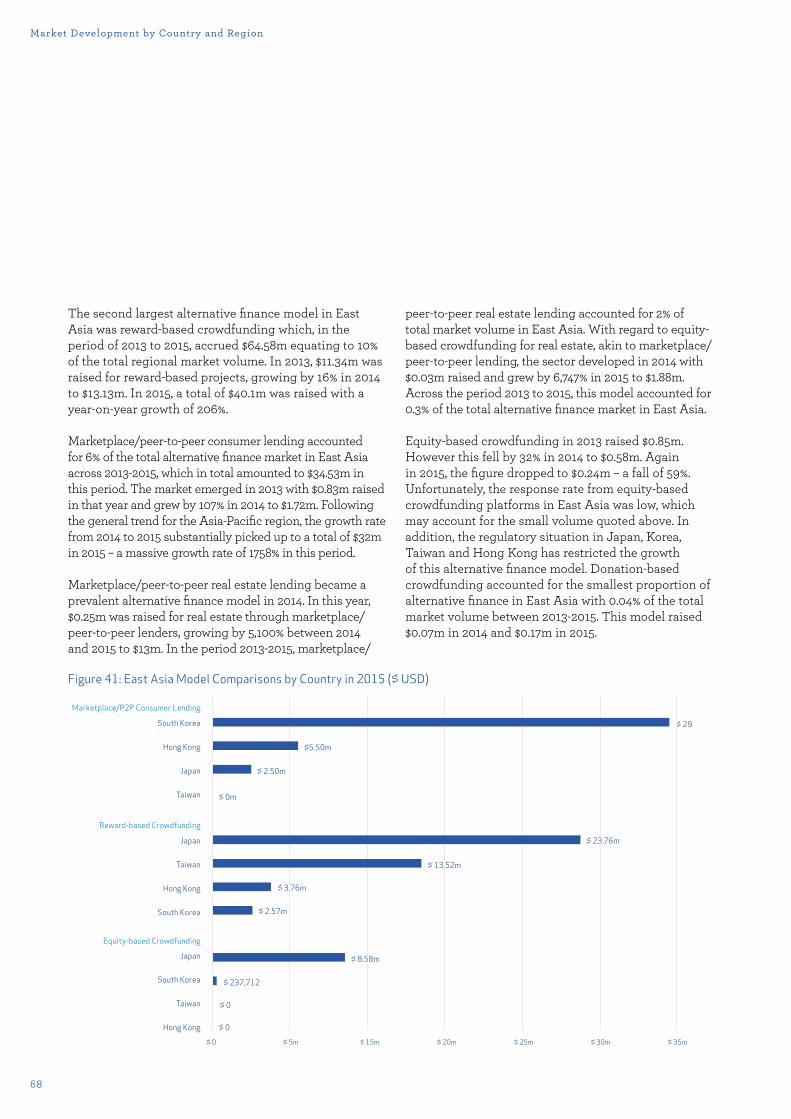
68
The second largest alternative finance model in East Asia was reward-based crowdfunding which, in the period of 2013 to 2015, accrued $64.58m equating to 10% of the total regional market volume. In 2013, $11.34m was raised for reward-based projects, growing by 16% in 2014 to $13.13m. In 2015, a total of $40.1m was raised with a year-on-year growth of 206%.
Marketplace/peer-to-peer consumer lending accounted for 6% of the total alternative finance market in East Asia across 2013-2015, which in total amounted to $34.53m in this period. The market emerged in 2013 with $0.83m raised in that year and grew by 107% in 2014 to $1.72m. Following the general trend for the Asia-Pacific region, the growth rate from 2014 to 2015 substantially picked up to a total of $32m in 2015 – a massive growth rate of 1758% in this period.
Marketplace/peer-to-peer real estate lending became a prevalent alternative finance model in 2014. In this year, $0.25m was raised for real estate through marketplace/peer-to-peer lenders, growing by 5,100% between 2014 and 2015 to $13m. In the period 2013-2015, marketplace/
peer-to-peer real estate lending accounted for 2% of total market volume in East Asia. With regard to equity-based crowdfunding for real estate, akin to marketplace/peer-to-peer lending, the sector developed in 2014 with $0.03m raised and grew by 6,747% in 2015 to $1.88m. Across the period 2013 to 2015, this model accounted for 0.3% of the total alternative finance market in East Asia.
Equity-based crowdfunding in 2013 raised $0.85m. However this fell by 32% in 2014 to $0.58m. Again in 2015, the figure dropped to $0.24m – a fall of 59%. Unfortunately, the response rate from equity-based crowdfunding platforms in East Asia was low, which may account for the small volume quoted above. In addition, the regulatory situation in Japan, Korea, Taiwan and Hong Kong has restricted the growth of this alternative finance model. Donation-based crowdfunding accounted for the smallest proportion of alternative finance in East Asia with 0.04% of the total market volume between 2013-2015. This model raised $0.07m in 2014 and $0.17m in 2015.
Fig. 41
Marketplace/P2P Consumer Lending
Reward-based Crowdfunding
Equity-based Crowdfunding
$ 0 $ 5m $ 15m $ 20m $ 25m $ 30m $ 35m
South Korea
Hong Kong
Japan
Taiwan
Japan
Taiwan
Hong Kong
South Korea
Japan
South Korea
Taiwan
Hong Kong
$ 29.48m
$ 23.76m
$ 13.52m
$ 3.76m
$ 2.57m
$ 8.58m
$ 237,712
$ 0
$ 0
$5.50m
$ 2.50m
$ 0m
Figure 41: East Asia Model Comparisons by Country in 2015 ($ USD)
Market Development by Country and Region
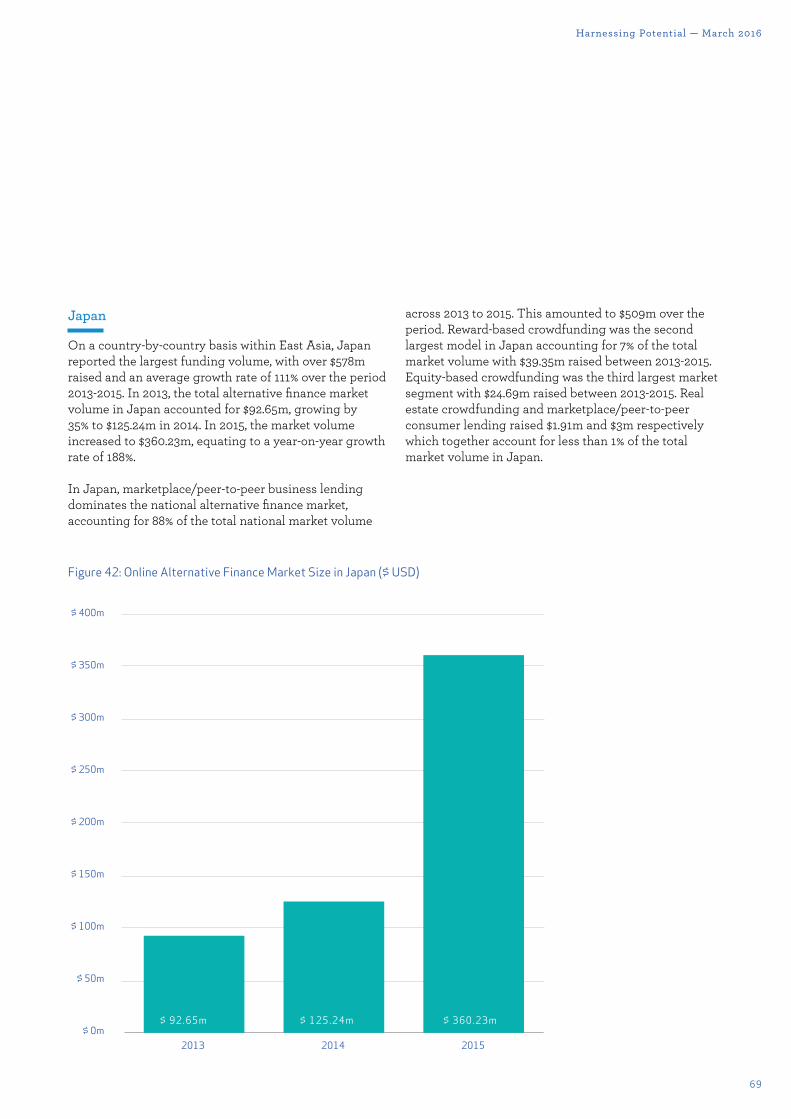
69
Harnessing Potential — March 2016
Japan
On a country-by-country basis within East Asia, Japan reported the largest funding volume, with over $578m raised and an average growth rate of 111% over the period 2013-2015. In 2013, the total alternative finance market volume in Japan accounted for $92.65m, growing by 35% to $125.24m in 2014. In 2015, the market volume increased to $360.23m, equating to a year-on-year growth rate of 188%.
In Japan, marketplace/peer-to-peer business lending dominates the national alternative finance market, accounting for 88% of the total national market volume
across 2013 to 2015. This amounted to $509m over the period. Reward-based crowdfunding was the second largest model in Japan accounting for 7% of the total market volume with $39.35m raised between 2013-2015. Equity-based crowdfunding was the third largest market segment with $24.69m raised between 2013-2015. Real estate crowdfunding and marketplace/peer-to-peer consumer lending raised $1.91m and $3m respectively which together account for less than 1% of the total market volume in Japan.
Figure 42: Online Alternative Finance Market Size in Japan ($ USD)
Fig. 42
$ 400m
$ 350m
$ 300m
$ 250m
$ 200m
$ 150m
$ 100m
$ 50m
$ 0m2013 2014 2015
$ 92.65m $ 125.24m $ 360.23m
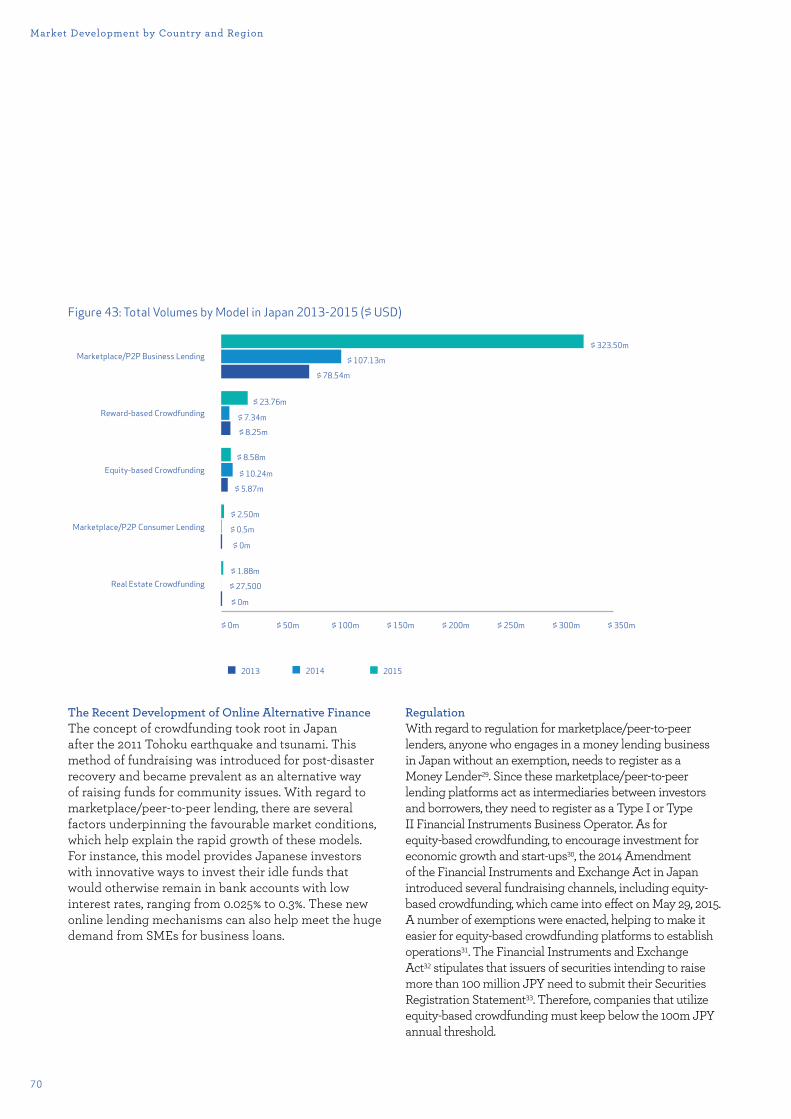
70
Market Development by Country and Region
Fig. 43
2014 20152013
$ 0m $ 50m $ 100m $ 150m $ 200m $ 250m $ 300m $ 350m
Marketplace/P2P Business Lending
Reward-based Crowdfunding
Equity-based Crowdfunding
Marketplace/P2P Consumer Lending
Real Estate Crowdfunding
$ 107.13m
$ 78.54m
$ 23.76m
$ 8.58m
$ 10.24m
$ 5.87m
$ 2.50m
$ 1.88m
$ 0m
$ 27,500
$ 0.5m
$ 7.34m
$ 8.25m
$ 323.50m
$ 0m
Figure 43: Total Volumes by Model in Japan 2013-2015 ($ USD)
The Recent Development of Online Alternative FinanceThe concept of crowdfunding took root in Japan after the 2011 Tohoku earthquake and tsunami. This method of fundraising was introduced for post-disaster recovery and became prevalent as an alternative way of raising funds for community issues. With regard to marketplace/peer-to-peer lending, there are several factors underpinning the favourable market conditions, which help explain the rapid growth of these models. For instance, this model provides Japanese investors with innovative ways to invest their idle funds that would otherwise remain in bank accounts with low interest rates, ranging from 0.025% to 0.3%. These new online lending mechanisms can also help meet the huge demand from SMEs for business loans.
RegulationWith regard to regulation for marketplace/peer-to-peer lenders, anyone who engages in a money lending business in Japan without an exemption, needs to register as a Money Lender29. Since these marketplace/peer-to-peer lending platforms act as intermediaries between investors and borrowers, they need to register as a Type I or Type II Financial Instruments Business Operator. As for equity-based crowdfunding, to encourage investment for economic growth and start-ups30, the 2014 Amendment of the Financial Instruments and Exchange Act in Japan introduced several fundraising channels, including equity-based crowdfunding, which came into e¯ect on May 29, 2015. A number of exemptions were enacted, helping to make it easier for equity-based crowdfunding platforms to establish operations31. The Financial Instruments and Exchange Act32 stipulates that issuers of securities intending to raise more than 100 million JPY need to submit their Securities Registration Statement33. Therefore, companies that utilize equity-based crowdfunding must keep below the 100m JPY annual threshold.
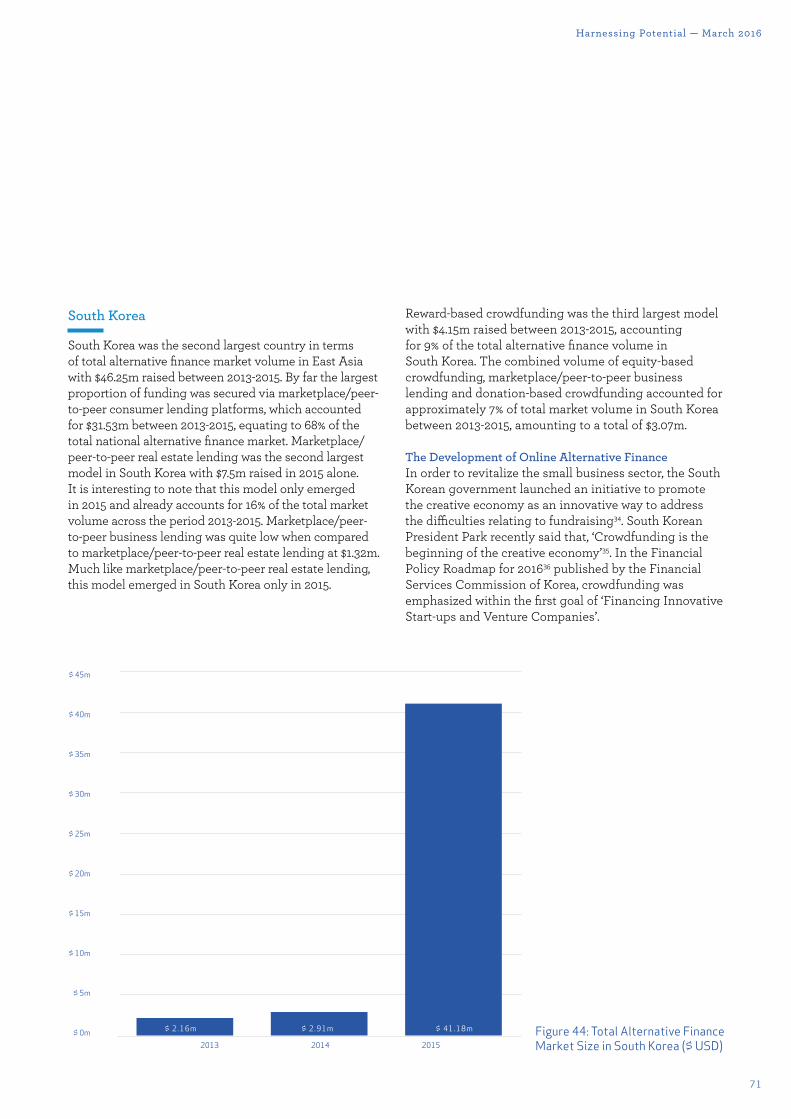
71
Harnessing Potential — March 2016
South Korea
South Korea was the second largest country in terms of total alternative finance market volume in East Asia with $46.25m raised between 2013-2015. By far the largest proportion of funding was secured via marketplace/peer-to-peer consumer lending platforms, which accounted for $31.53m between 2013-2015, equating to 68% of the total national alternative finance market. Marketplace/peer-to-peer real estate lending was the second largest model in South Korea with $7.5m raised in 2015 alone. It is interesting to note that this model only emerged in 2015 and already accounts for 16% of the total market volume across the period 2013-2015. Marketplace/peer-to-peer business lending was quite low when compared to marketplace/peer-to-peer real estate lending at $1.32m. Much like marketplace/peer-to-peer real estate lending, this model emerged in South Korea only in 2015.
Reward-based crowdfunding was the third largest model with $4.15m raised between 2013-2015, accounting for 9% of the total alternative finance volume in South Korea. The combined volume of equity-based crowdfunding, marketplace/peer-to-peer business lending and donation-based crowdfunding accounted for approximately 7% of total market volume in South Korea between 2013-2015, amounting to a total of $3.07m.
The Development of Online Alternative FinanceIn order to revitalize the small business sector, the South Korean government launched an initiative to promote the creative economy as an innovative way to address the di�culties relating to fundraising34. South Korean President Park recently said that, ‘Crowdfunding is the beginning of the creative economy’35. In the Financial Policy Roadmap for 201636 published by the Financial Services Commission of Korea, crowdfunding was emphasized within the first goal of ‘Financing Innovative Start-ups and Venture Companies’.
Figure 44: Total Alternative Finance Market Size in South Korea ($ USD)
Fig. 44
$ 45m
$ 40m
$ 35m
$ 30m
$ 25m
$ 20m
$ 15m
$ 10m
$ 5m
$ 0m2013 2014 2015
$ 2.16m $ 2.91m $ 41.18m
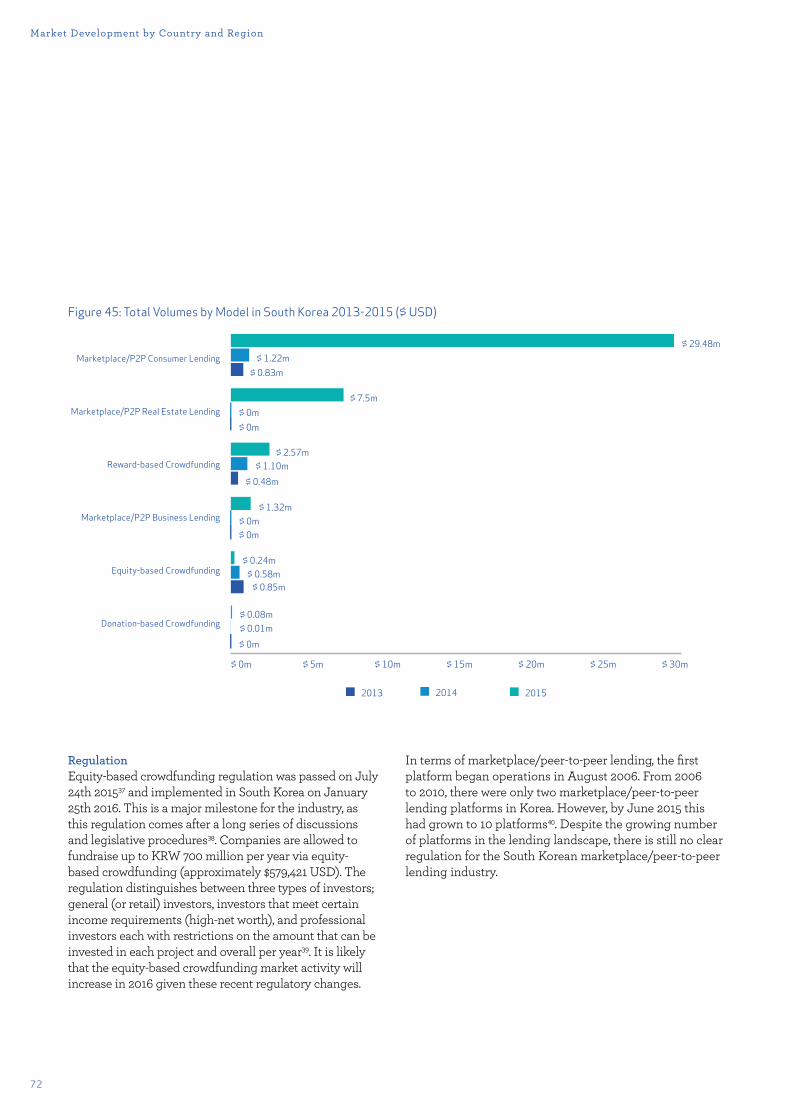
72
Market Development by Country and Region
Fig. 45
2014 20152013
Marketplace/P2P Consumer Lending
Marketplace/P2P Real Estate Lending
Reward-based Crowdfunding
Marketplace/P2P Business Lending
Equity-based Crowdfunding
Donation-based Crowdfunding
$ 0m $ 5m $ 10m $ 15m $ 20m $ 25m $ 30m
$ 29.48m$ 1.22m
$ 0.83m
$ 7.5m$ 0m$ 0m
$ 2.57m$ 1.10m
$ 0.48m
$ 1.32m$ 0m$ 0m
$ 0.24m$ 0.58m
$ 0.85m
$ 0.08m$ 0.01m$ 0m
Figure 45: Total Volumes by Model in South Korea 2013-2015 ($ USD)
RegulationEquity-based crowdfunding regulation was passed on July 24th 201537 and implemented in South Korea on January 25th 2016. This is a major milestone for the industry, as this regulation comes after a long series of discussions and legislative procedures38. Companies are allowed to fundraise up to KRW 700 million per year via equity-based crowdfunding (approximately $579,421 USD). The regulation distinguishes between three types of investors; general (or retail) investors, investors that meet certain income requirements (high-net worth), and professional investors each with restrictions on the amount that can be invested in each project and overall per year39. It is likely that the equity-based crowdfunding market activity will increase in 2016 given these recent regulatory changes.
In terms of marketplace/peer-to-peer lending, the first platform began operations in August 2006. From 2006 to 2010, there were only two marketplace/peer-to-peer lending platforms in Korea. However, by June 2015 this had grown to 10 platforms40. Despite the growing number of platforms in the lending landscape, there is still no clear regulation for the South Korean marketplace/peer-to-peer lending industry.
73
Harnessing Potential — March 2016
Hong Kong
Alternative finance activity in Hong Kong is dominated by reward-based crowdfunding and marketplace/peer-to-peer consumer lending. During the period 2013-2015, approximately $13.3m was raised across the national alternative finance industry. $0.66m was raised in 2013, which grew by 407% in 2014 to $3.37m. By 2015, a total of $9.26m was raised, which equates to a yearly growth rate of 175%. This amounts to an average growth rate of 291% across 2013-2015.
In terms of model analysis, the bulk of market activity took place within reward-based crowdfunding, with almost 57% of the total Hong Kong market, and over $7.5m raised in the period 2013-2015. Marketplace/peer-to-peer consumer lending emerged in 2014 with $0.25m raised and then accelerated markedly in 2015 to $5.5m. Based on these figures, it is reasonable to expect that marketplace/peer-to-peer consumer lending will come to be the largest alternative finance model in Hong Kong in 2016.
The Development of Online Alternative FinanceIn order to enhance the development of start-ups in Hong Kong, financial technologies are being promoted by the Hong Kong Monetary Authority41. However, compared to other jurisdictions in the Asia-Pacific region, which have less burdensome entry requirements to encourage non-bank finance, the requirements for financial technology companies in Hong Kong are particularly challenging. This is supported by the fact that our survey did not capture responses from equity-based crowdfunding platforms in Hong Kong.
RegulationOn May 7th, 2014, Hong Kong's financial authority42 issued a notice43 regarding crowdfunding and its risks and issues relating to legal compliance. The Chief Executive O�cer of the Securities and Futures Commission warned that, ‘Parties seeking to engage in crowd-funding activities should be aware that a breach of the relevant laws could lead to serious consequences including criminal liability.’ Furthermore, with regard to marketplace/peer-to-peer lending ‘no person shall carry out business as a money lender without a license44.’
As for equity-based crowdfunding specifically, the Securities and Futures Commission (SFC), which is responsible for regulating Hong Kong's securities and futures markets, issued a notice regarding crowdfunding. Based on this notice45, there are several financial regulations that may be relevant to equity-based crowdfunding platforms, including the provisions of the Securities and Futures Ordinance and the Companies (Winding Up and Miscellaneous Provisions) Ordinance. Under the Securities and Futures Ordinance (SFO)46, without authorization from the SFC or an exemption, it is forbidden to issue an advertisement, invitation or document which contains an invitation to the public of Hong Kong for investing in collective investment schemes (CIS)47. Currently, there is no equity-based crowdfunding for retail investors and also no specific financial regulation for lightening the cost of legal compliance for start-ups operating equity-based crowdfunding platforms.
74
Market Development by Country and Region
Taiwan
In 2013-2015, a total of more than $20.5m was raised in Taiwan. In 2013 $2.2m was raised, while over $4.7m was raised in 2014, equating to a growth rate of 115%. In 2015, a total of $13.6m was raised, which shows an accelerating growth rate of 188%. In the period of 2013- 2015 there was an average year-on-year growth rate of 151%. The vast majority of activity took place within reward-based crowdfunding, accounting for 99% of Taiwan's market activity, which di¯erentiates Taiwan quite markedly from Japan and South Korea. Donation-based crowdfunding raised $0.156m over the period 2013-2015.
The Recent Development of Online Alternative FinanceIn order to encourage the development of financial innovation, the regulation of online stored payments by non-banks48 was implemented in January 2015 after almost two years of discussions and debates between the financial authority and platforms. However, the marketplace/peer-to-peer Lending model is currently forbidden due to a conflict with The Banking Act49 in Taiwan. The Taiwanese financial authorities are currently evaluating their approach to the sector by recently establishing a project team within the Financial Supervisory Commission (FSC)50.
To encourage the development of start-ups and small businesses, the FSC provided a regulatory structure for equity-based crowdfunding51 enacted at the end of April 2015. Since the Security Act in Taiwan requires very high standards for securities broker, it was di�cult
for securities-based crowdfunding platforms to operate in Taiwan. However, the situation changed after new exemptions were enacted. Following discussions with practitioners, academics, and government o�cials, the Taiwanese financial authority provided an exemption for securities brokers that are active within the crowdfunding space. Accordingly, equity-based crowdfunding securities have a minimum capital requirement of 50 million TWD (approximately $1.6m), compared with the capital amount of conventional securities broker, which is 200 million TWD (approximately $6.4m). This may lower the cost of legal compliance for equity-based crowdfunding platforms to start up their business. However, the extent of the impact on equity-based crowdfunding in Taiwan remains to be seen, and should be monitored over the course of 2016 to review the impact of the impending amendments and exemptions.
Companies wanting to raise capital on equity-based crowdfunding platforms in Taiwan are limited to raising below 30 million TWD (approximately $0.98m) and the amount that can be raised across various rounds is limited to below 15 million TWD (approximately $0.49m). However, these constraints are currently being amended as the fundraising limits are currently low, thereby restricting equity-base crowdfunding activity. These amendments from January 8th 2016 will be finalized and implemented within 6 months. In January 2016, there were 6 companies that were issued equity-based crowdfunding licenses, and 3 of them have commenced operations.
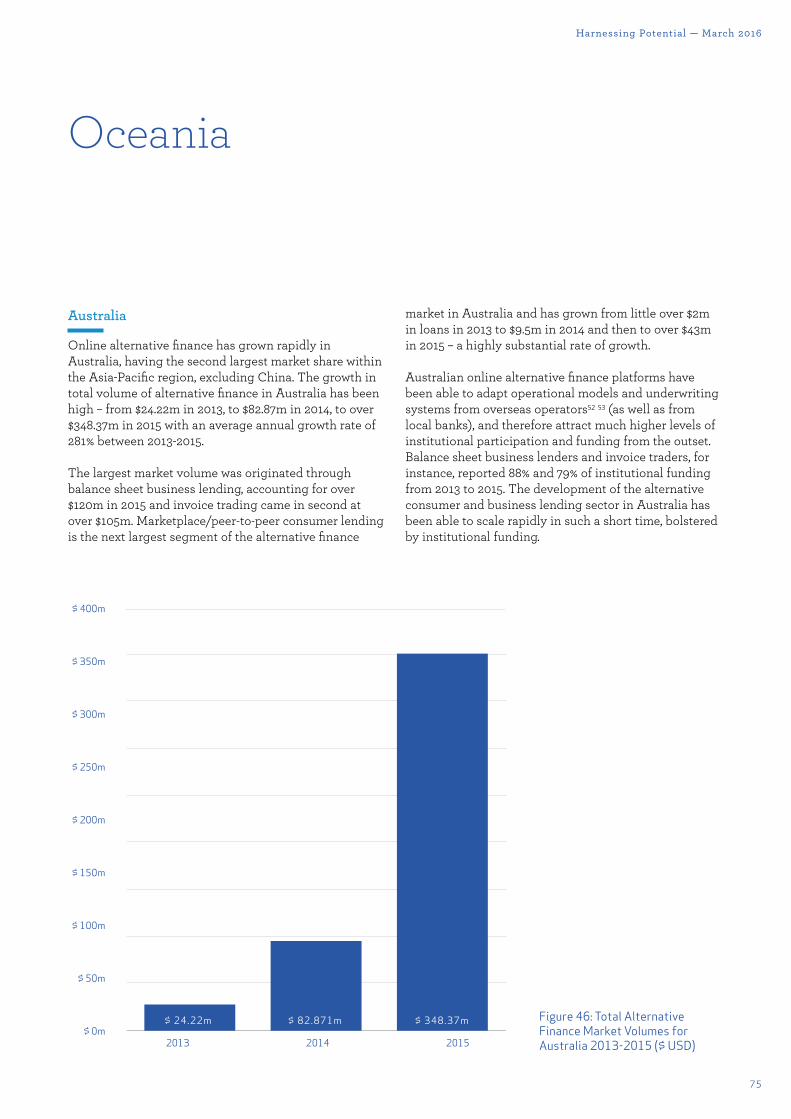
75
Harnessing Potential — March 2016
Oceania
Australia
Online alternative finance has grown rapidly in Australia, having the second largest market share within the Asia-Pacific region, excluding China. The growth in total volume of alternative finance in Australia has been high – from $24.22m in 2013, to $82.87m in 2014, to over $348.37m in 2015 with an average annual growth rate of 281% between 2013-2015.
The largest market volume was originated through balance sheet business lending, accounting for over $120m in 2015 and invoice trading came in second at over $105m. Marketplace/peer-to-peer consumer lending is the next largest segment of the alternative finance
market in Australia and has grown from little over $2m in loans in 2013 to $9.5m in 2014 and then to over $43m in 2015 – a highly substantial rate of growth.
Australian online alternative finance platforms have been able to adapt operational models and underwriting systems from overseas operators52 53 (as well as from local banks), and therefore attract much higher levels of institutional participation and funding from the outset. Balance sheet business lenders and invoice traders, for instance, reported 88% and 79% of institutional funding from 2013 to 2015. The development of the alternative consumer and business lending sector in Australia has been able to scale rapidly in such a short time, bolstered by institutional funding.
Figure 46: Total Alternative Finance Market Volumes for Australia 2013-2015 ($ USD)
Fig. 46
2013 2014 2015
$ 24.22m $ 82.871m $ 348.37m
$ 400m
$ 350m
$ 300m
$ 250m
$ 200m
$ 150m
$ 100m
$ 50m
$ 0m
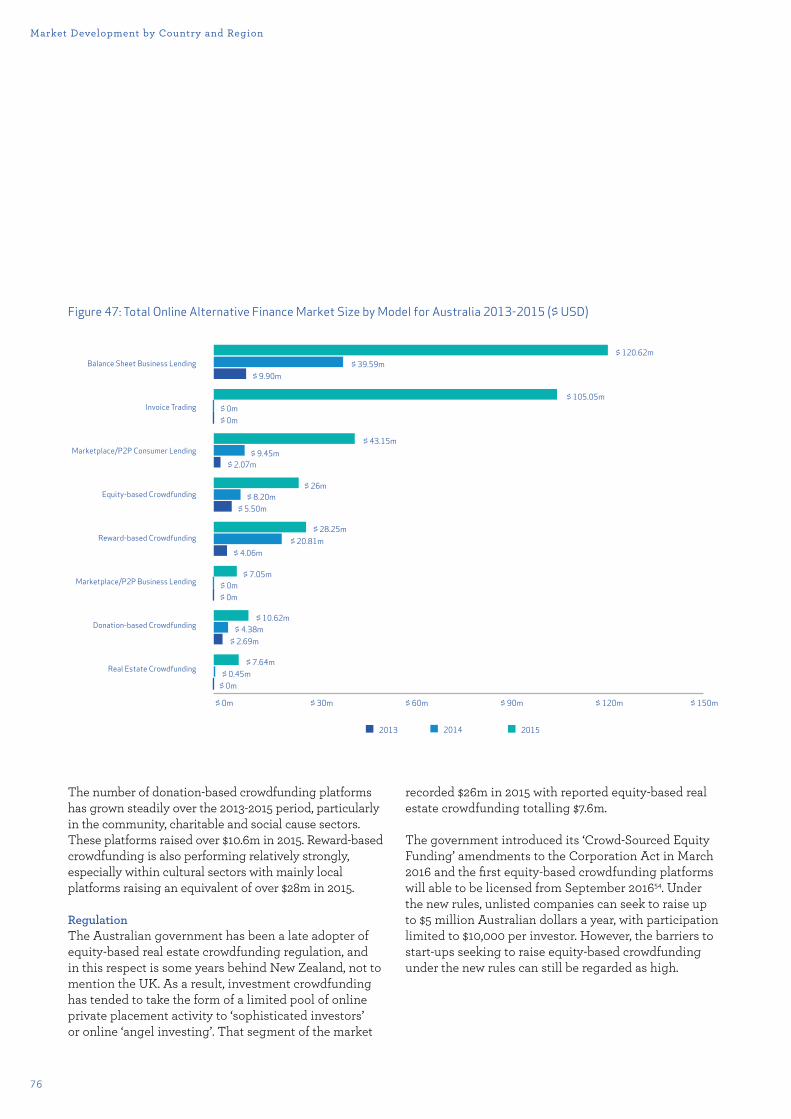
76
Market Development by Country and Region
The number of donation-based crowdfunding platforms has grown steadily over the 2013-2015 period, particularly in the community, charitable and social cause sectors. These platforms raised over $10.6m in 2015. Reward-based crowdfunding is also performing relatively strongly, especially within cultural sectors with mainly local platforms raising an equivalent of over $28m in 2015.
RegulationThe Australian government has been a late adopter of equity-based real estate crowdfunding regulation, and in this respect is some years behind New Zealand, not to mention the UK. As a result, investment crowdfunding has tended to take the form of a limited pool of online private placement activity to ‘sophisticated investors’ or online ‘angel investing’. That segment of the market
recorded $26m in 2015 with reported equity-based real estate crowdfunding totalling $7.6m.
The government introduced its ‘Crowd-Sourced Equity Funding’ amendments to the Corporation Act in March 2016 and the first equity-based crowdfunding platforms will able to be licensed from September 201654. Under the new rules, unlisted companies can seek to raise up to $5 million Australian dollars a year, with participation limited to $10,000 per investor. However, the barriers to start-ups seeking to raise equity-based crowdfunding under the new rules can still be regarded as high.
Fig. 47
2014 20152013
Balance Sheet Business Lending
Invoice Trading
Marketplace/P2P Consumer Lending
Equity-based Crowdfunding
Reward-based Crowdfunding
Marketplace/P2P Business Lending
Donation-based Crowdfunding
Real Estate Crowdfunding
$ 0m $ 30m $ 60m $ 90m $ 120m $ 150m
$ 0m
$ 0m$ 0m
$ 0m$ 0.45m
$ 7.64m
$ 2.69m$ 4.38m
$ 10.62m
$ 20.81m
$ 5.50m
$ 2.07m$ 9.45m
$ 9.90m
$ 43.15m
$ 39.59m
$ 105.05m
$ 120.62m
$ 8.20m$ 26m
$ 28.25m
$ 7.05m
$ 4.06m
$ 0m
Figure 47: Total Online Alternative Finance Market Size by Model for Australia 2013-2015 ($ USD)
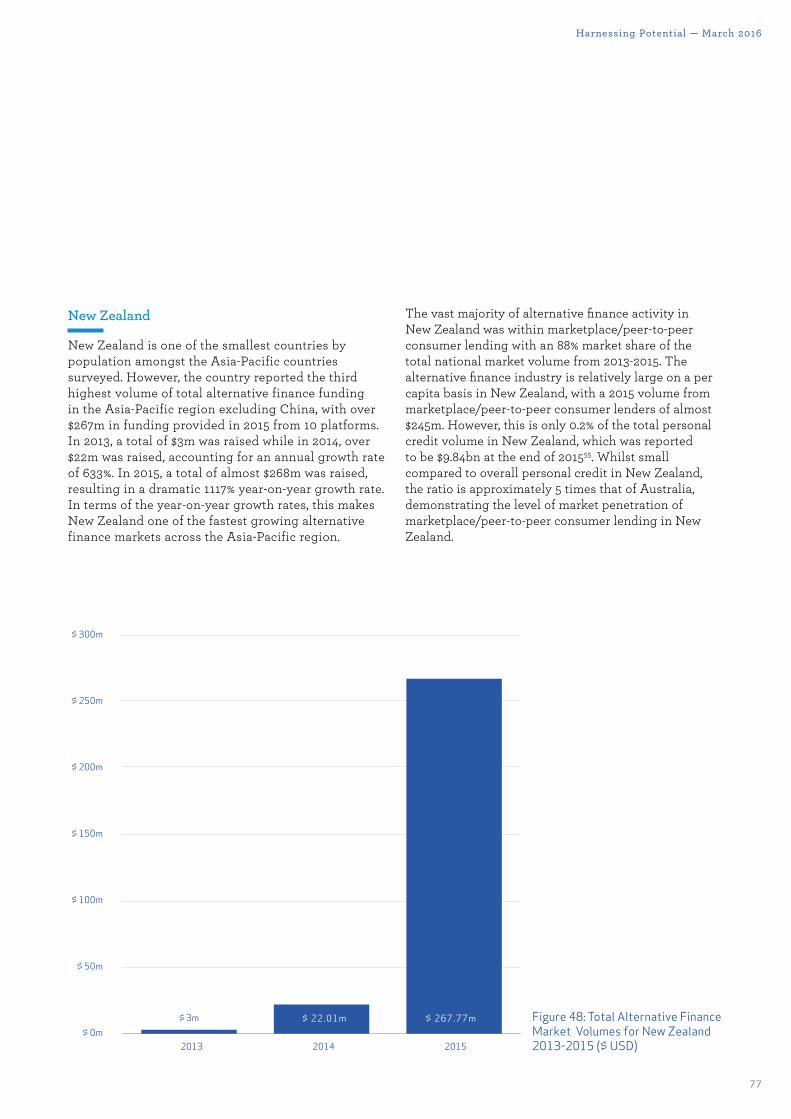
77
Harnessing Potential — March 2016
New Zealand
New Zealand is one of the smallest countries by population amongst the Asia-Pacific countries surveyed. However, the country reported the third highest volume of total alternative finance funding in the Asia-Pacific region excluding China, with over $267m in funding provided in 2015 from 10 platforms. In 2013, a total of $3m was raised while in 2014, over $22m was raised, accounting for an annual growth rate of 633%. In 2015, a total of almost $268m was raised, resulting in a dramatic 1117% year-on-year growth rate. In terms of the year-on-year growth rates, this makes New Zealand one of the fastest growing alternative finance markets across the Asia-Pacific region.
The vast majority of alternative finance activity in New Zealand was within marketplace/peer-to-peer consumer lending with an 88% market share of the total national market volume from 2013-2015. The alternative finance industry is relatively large on a per capita basis in New Zealand, with a 2015 volume from marketplace/peer-to-peer consumer lenders of almost $245m. However, this is only 0.2% of the total personal credit volume in New Zealand, which was reported to be $9.84bn at the end of 201555. Whilst small compared to overall personal credit in New Zealand, the ratio is approximately 5 times that of Australia, demonstrating the level of market penetration of marketplace/peer-to-peer consumer lending in New Zealand.
Fig. 48
2013 2014 2015
$ 300m
$ 250m
$ 200m
$ 150m
$ 100m
$ 50m
$ 0m$ 24.22m $ 22.01m $ 267.77m$ 3m Figure 48: Total Alternative Finance
Market Volumes for New Zealand 2013-2015 ($ USD)
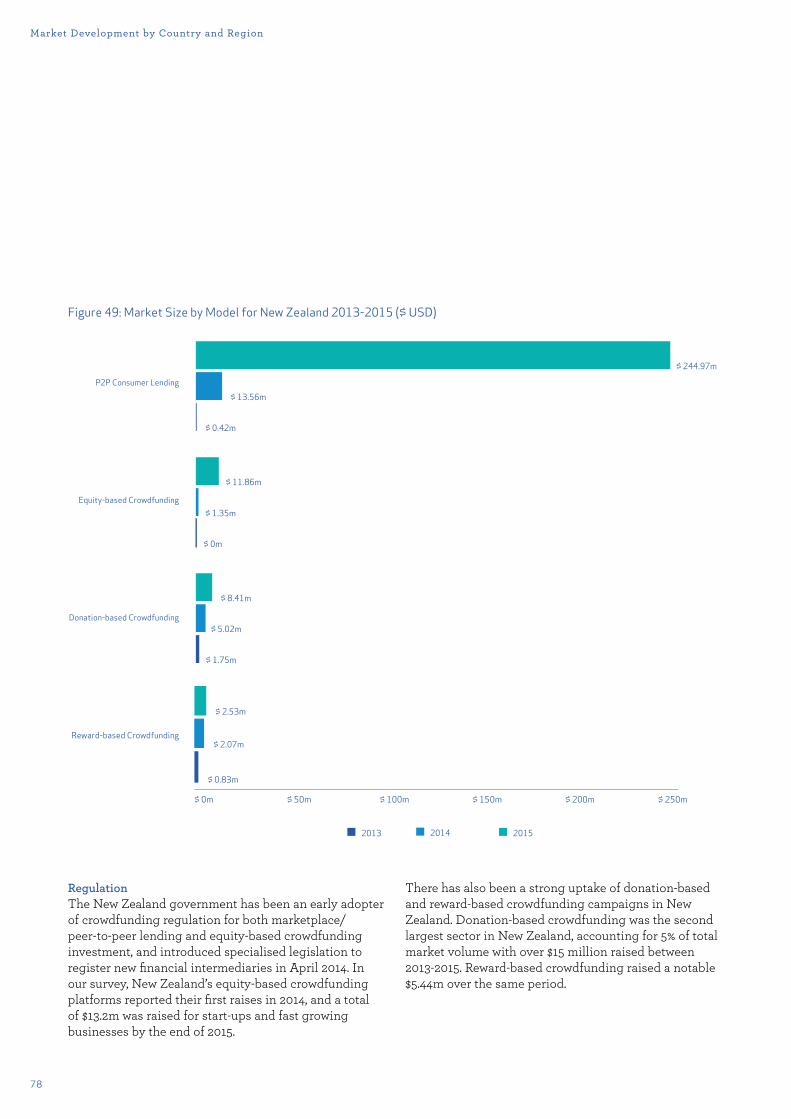
78
Market Development by Country and Region
RegulationThe New Zealand government has been an early adopter of crowdfunding regulation for both marketplace/peer-to-peer lending and equity-based crowdfunding investment, and introduced specialised legislation to register new financial intermediaries in April 2014. In our survey, New Zealand’s equity-based crowdfunding platforms reported their first raises in 2014, and a total of $13.2m was raised for start-ups and fast growing businesses by the end of 2015.
There has also been a strong uptake of donation-based and reward-based crowdfunding campaigns in New Zealand. Donation-based crowdfunding was the second largest sector in New Zealand, accounting for 5% of total market volume with over $15 million raised between 2013-2015. Reward-based crowdfunding raised a notable $5.44m over the same period.
Fig. 49
P2P Consumer Lending
Equity-based Crowdfunding
Donation-based Crowdfunding
Reward-based Crowdfunding
2014 20152013
$ 0m $ 50m $ 100m $ 150m $ 200m $ 250m
$ 244.97m
$ 13.56m
$ 11.86m
$ 8.41m
$ 2.53m
$ 2.07m
$ 0.83m
$ 5.02m
$ 1.75m
$ 1.35m
$ 0m
$ 0.42m
Figure 49: Market Size by Model for New Zealand 2013-2015 ($ USD)
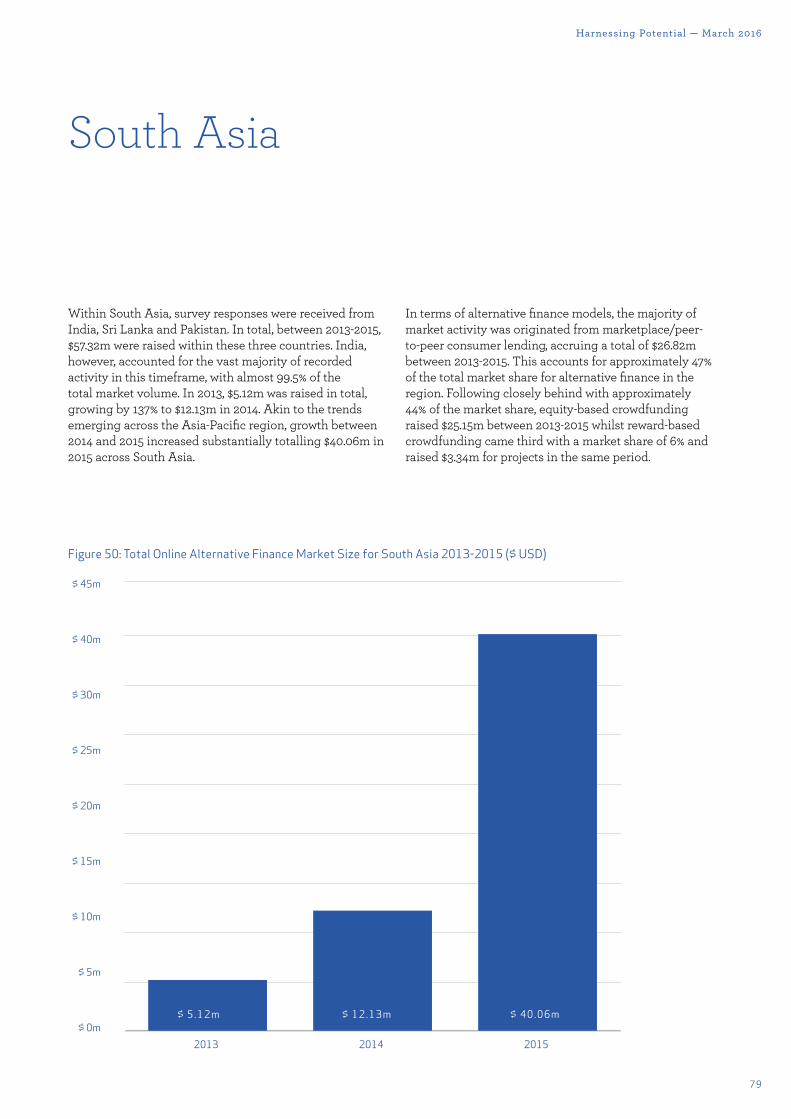
79
Harnessing Potential — March 2016
South Asia
Within South Asia, survey responses were received from India, Sri Lanka and Pakistan. In total, between 2013-2015, $57.32m were raised within these three countries. India, however, accounted for the vast majority of recorded activity in this timeframe, with almost 99.5% of the total market volume. In 2013, $5.12m was raised in total, growing by 137% to $12.13m in 2014. Akin to the trends emerging across the Asia-Pacific region, growth between 2014 and 2015 increased substantially totalling $40.06m in 2015 across South Asia.
In terms of alternative finance models, the majority of market activity was originated from marketplace/peer-to-peer consumer lending, accruing a total of $26.82m between 2013-2015. This accounts for approximately 47% of the total market share for alternative finance in the region. Following closely behind with approximately 44% of the market share, equity-based crowdfunding raised $25.15m between 2013-2015 whilst reward-based crowdfunding came third with a market share of 6% and raised $3.34m for projects in the same period.
Figure 50: Total Online Alternative Finance Market Size for South Asia 2013-2015 ($ USD)
Fig. 50
$ 45m
$ 40m
$ 30m
$ 25m
$ 20m
$ 15m
$ 10m
$ 5m
$ 0m2013 2014 2015
$ 5.12m $ 12.13m $ 40.06m
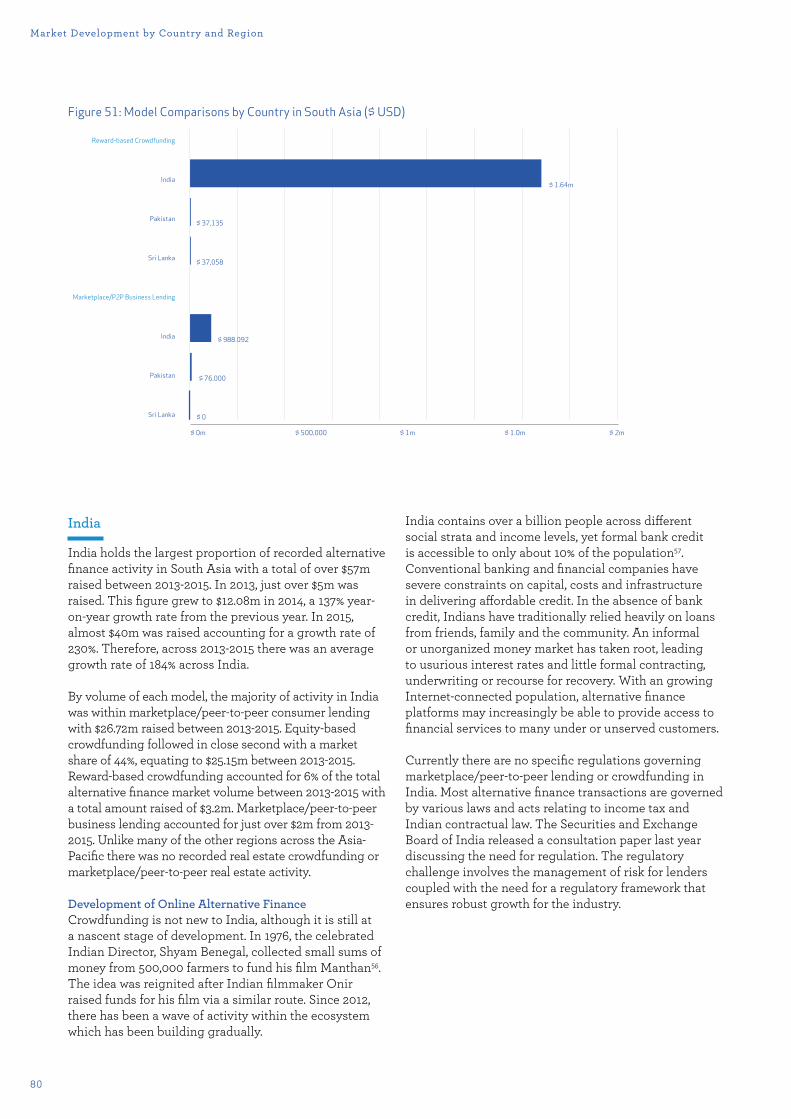
80
Market Development by Country and Region
India
India holds the largest proportion of recorded alternative finance activity in South Asia with a total of over $57m raised between 2013-2015. In 2013, just over $5m was raised. This figure grew to $12.08m in 2014, a 137% year-on-year growth rate from the previous year. In 2015, almost $40m was raised accounting for a growth rate of 230%. Therefore, across 2013-2015 there was an average growth rate of 184% across India.
By volume of each model, the majority of activity in India was within marketplace/peer-to-peer consumer lending with $26.72m raised between 2013-2015. Equity-based crowdfunding followed in close second with a market share of 44%, equating to $25.15m between 2013-2015. Reward-based crowdfunding accounted for 6% of the total alternative finance market volume between 2013-2015 with a total amount raised of $3.2m. Marketplace/peer-to-peer business lending accounted for just over $2m from 2013-2015. Unlike many of the other regions across the Asia-Pacific there was no recorded real estate crowdfunding or marketplace/peer-to-peer real estate activity.
Development of Online Alternative FinanceCrowdfunding is not new to India, although it is still at a nascent stage of development. In 1976, the celebrated Indian Director, Shyam Benegal, collected small sums of money from 500,000 farmers to fund his film Manthan56. The idea was reignited after Indian filmmaker Onir raised funds for his film via a similar route. Since 2012, there has been a wave of activity within the ecosystem which has been building gradually.
India contains over a billion people across di¯erent social strata and income levels, yet formal bank credit is accessible to only about 10% of the population57. Conventional banking and financial companies have severe constraints on capital, costs and infrastructure in delivering a¯ordable credit. In the absence of bank credit, Indians have traditionally relied heavily on loans from friends, family and the community. An informal or unorganized money market has taken root, leading to usurious interest rates and little formal contracting, underwriting or recourse for recovery. With an growing Internet-connected population, alternative finance platforms may increasingly be able to provide access to financial services to many under or unserved customers.
Currently there are no specific regulations governing marketplace/peer-to-peer lending or crowdfunding in India. Most alternative finance transactions are governed by various laws and acts relating to income tax and Indian contractual law. The Securities and Exchange Board of India released a consultation paper last year discussing the need for regulation. The regulatory challenge involves the management of risk for lenders coupled with the need for a regulatory framework that ensures robust growth for the industry.
Fig. 51
Reward-based Crowdfunding
India
Pakistan
Sri Lanka
Marketplace/P2P Business Lending
India
Pakistan
Sri Lanka
$ 0m $ 500,000 $ 1m $ 1.0m $ 2m
$ 1.64m
$ 37,135
$ 37,058
$ 988.092
$ 76.000
$ 0
Figure 51: Model Comparisons by Country in South Asia ($ USD)
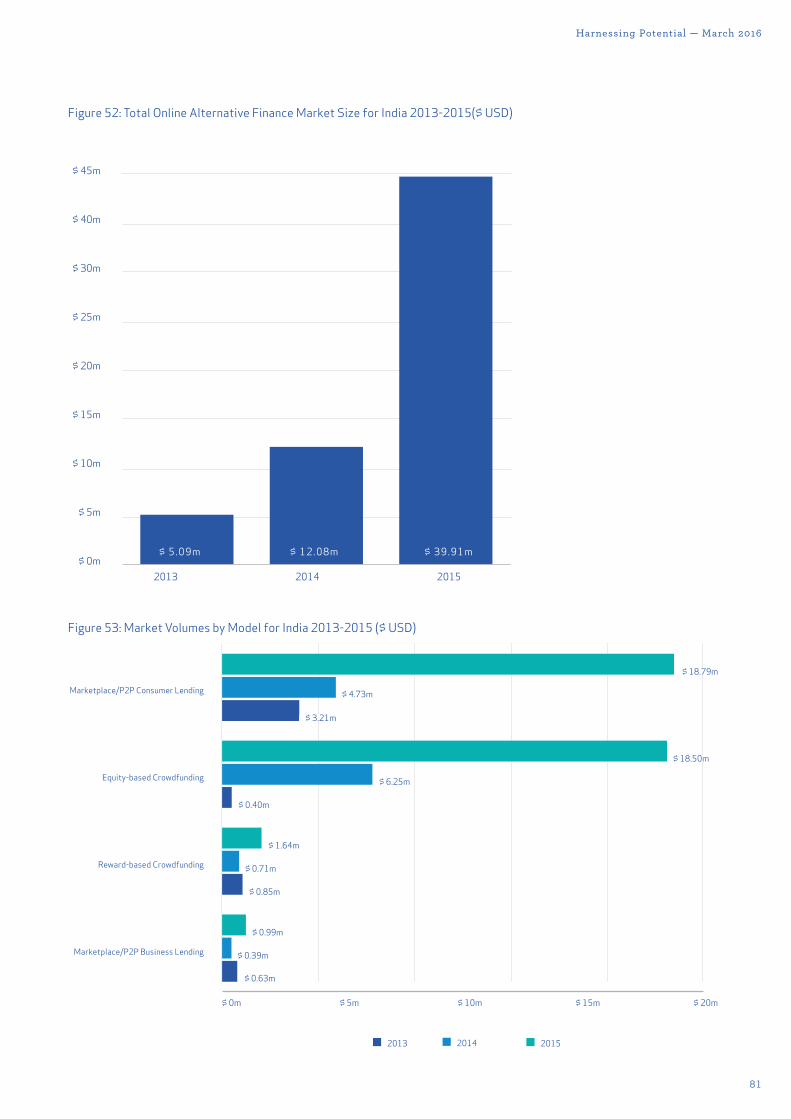
81
Harnessing Potential — March 2016
Figure 52: Total Online Alternative Finance Market Size for India 2013-2015($ USD)
Fig. 52
2013 2014 2015
$ 5.09m $ 12.08m $ 39.91m
$ 45m
$ 40m
$ 30m
$ 25m
$ 20m
$ 15m
$ 10m
$ 5m
$ 0m
Fig. 53
Marketplace/P2P Consumer Lending
Equity-based Crowdfunding
Reward-based Crowdfunding
Marketplace/P2P Business Lending
$ 0m $ 5m $ 10m $ 15m $ 20m
$ 18.79m
$ 4.73m
$ 6.25m
$ 0.40m
$ 1.64m
$ 0.71m
$ 0.85m
$ 0.99m
$ 0.39m
$ 0.63m
$ 18.50m
$ 3.21m
2014 20152013
Figure 53: Market Volumes by Model for India 2013-2015 ($ USD)
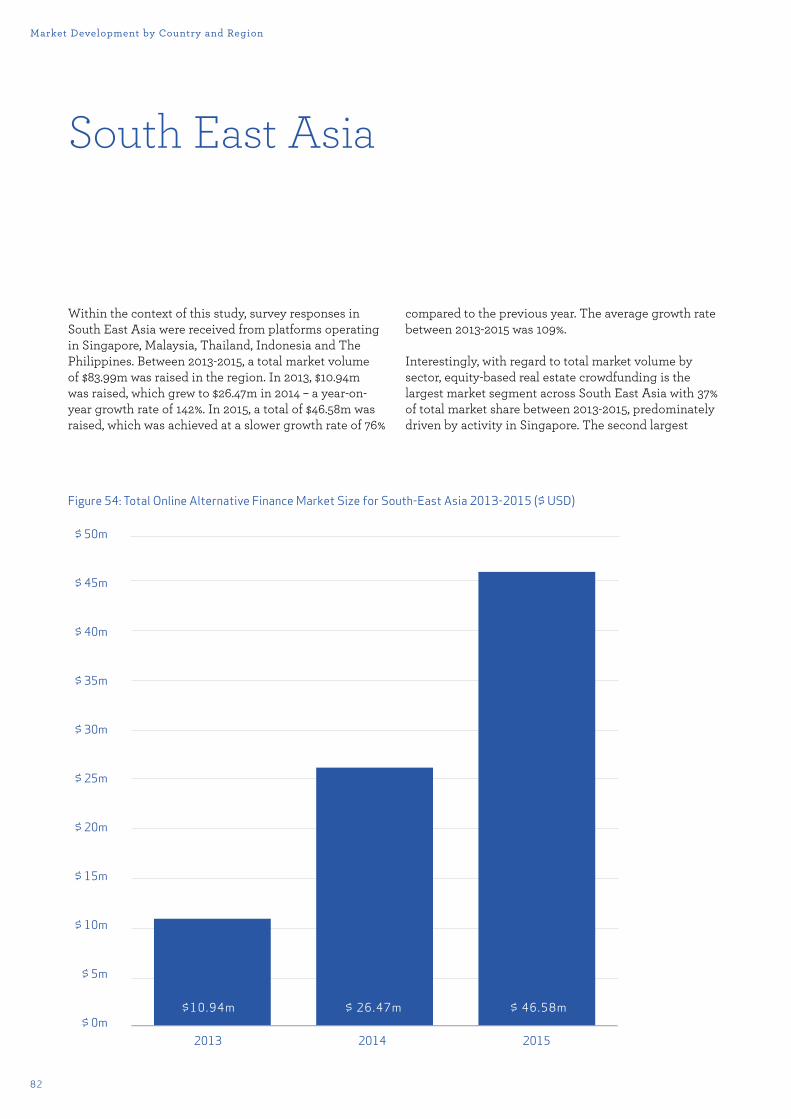
82
Market Development by Country and Region
South East Asia
Within the context of this study, survey responses in South East Asia were received from platforms operating in Singapore, Malaysia, Thailand, Indonesia and The Philippines. Between 2013-2015, a total market volume of $83.99m was raised in the region. In 2013, $10.94m was raised, which grew to $26.47m in 2014 – a year-on-year growth rate of 142%. In 2015, a total of $46.58m was raised, which was achieved at a slower growth rate of 76%
compared to the previous year. The average growth rate between 2013-2015 was 109%.
Interestingly, with regard to total market volume by sector, equity-based real estate crowdfunding is the largest market segment across South East Asia with 37% of total market share between 2013-2015, predominately driven by activity in Singapore. The second largest
Figure 54: Total Online Alternative Finance Market Size for South-East Asia 2013-2015 ($ USD)
Fig. 54
2013 2014 2015
$10.94m $ 26.47m $ 46.58m
$ 50m
$ 45m
$ 40m
$ 35m
$ 30m
$ 25m
$ 20m
$ 15m
$ 10m
$ 5m
$ 0m
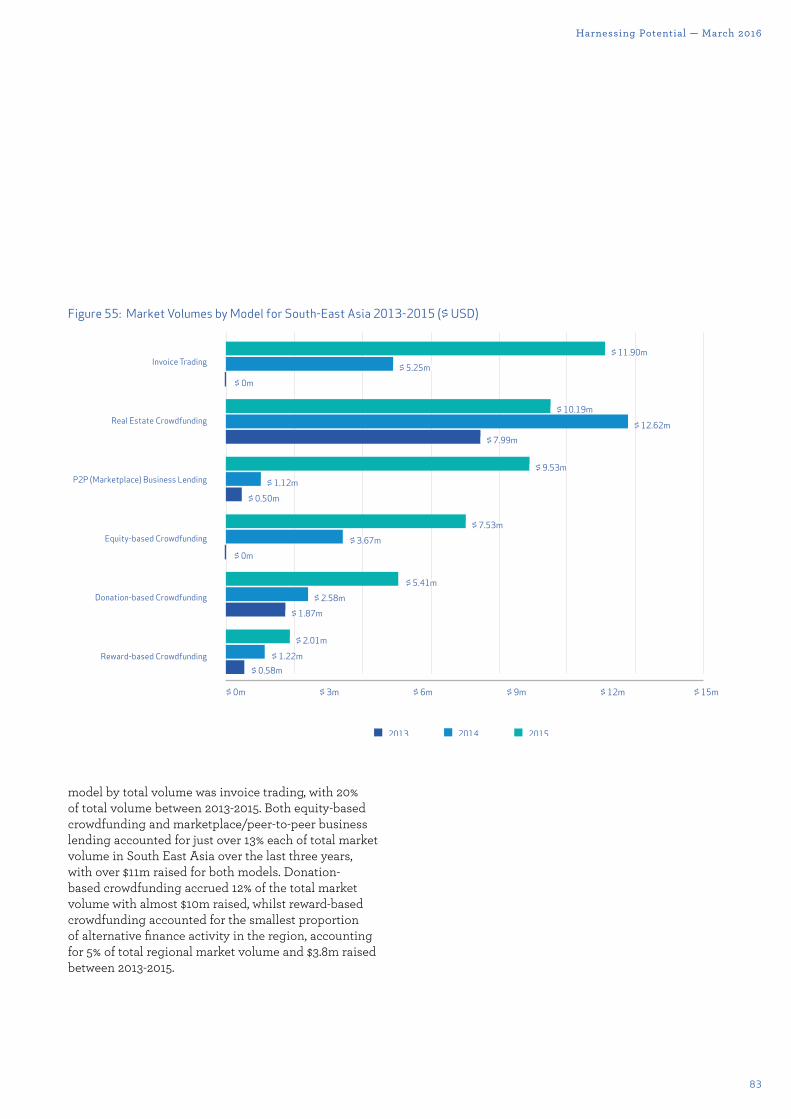
83
Harnessing Potential — March 2016
model by total volume was invoice trading, with 20% of total volume between 2013-2015. Both equity-based crowdfunding and marketplace/peer-to-peer business lending accounted for just over 13% each of total market volume in South East Asia over the last three years, with over $11m raised for both models. Donation-based crowdfunding accrued 12% of the total market volume with almost $10m raised, whilst reward-based crowdfunding accounted for the smallest proportion of alternative finance activity in the region, accounting for 5% of total regional market volume and $3.8m raised between 2013-2015.
Fig. 55
Invoice Trading
Real Estate Crowdfunding
P2P (Marketplace) Business Lending
Equity-based Crowdfunding
Donation-based Crowdfunding
Reward-based Crowdfunding
$ 0m $ 3m $ 6m $ 9m $ 12m $ 15m
$ 11.90m$ 5.25m
$ 10.19m
$ 12.62m$ 7.99m
$ 9.53m$ 1.12m
$ 0.50m
$ 7.53m$ 3.67m
$ 0m
$ 5.41m$ 2.58m
$ 1.87m
$ 2.01m
$ 1.22m$ 0.58m
$ 0m
2014 20152013
Figure 55: Market Volumes by Model for South-East Asia 2013-2015 ($ USD)
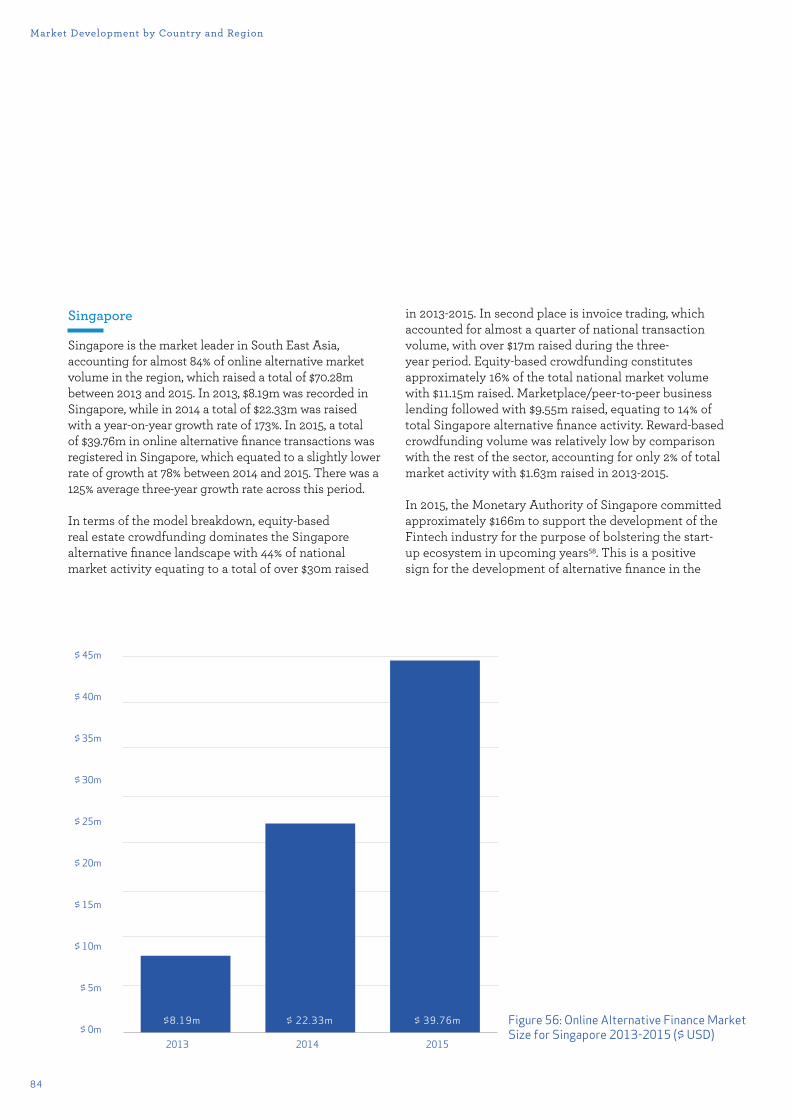
84
Market Development by Country and Region
Singapore
Singapore is the market leader in South East Asia, accounting for almost 84% of online alternative market volume in the region, which raised a total of $70.28m between 2013 and 2015. In 2013, $8.19m was recorded in Singapore, while in 2014 a total of $22.33m was raised with a year-on-year growth rate of 173%. In 2015, a total of $39.76m in online alternative finance transactions was registered in Singapore, which equated to a slightly lower rate of growth at 78% between 2014 and 2015. There was a 125% average three-year growth rate across this period.
In terms of the model breakdown, equity-based real estate crowdfunding dominates the Singapore alternative finance landscape with 44% of national market activity equating to a total of over $30m raised
in 2013-2015. In second place is invoice trading, which accounted for almost a quarter of national transaction volume, with over $17m raised during the three-year period. Equity-based crowdfunding constitutes approximately 16% of the total national market volume with $11.15m raised. Marketplace/peer-to-peer business lending followed with $9.55m raised, equating to 14% of total Singapore alternative finance activity. Reward-based crowdfunding volume was relatively low by comparison with the rest of the sector, accounting for only 2% of total market activity with $1.63m raised in 2013-2015.
In 2015, the Monetary Authority of Singapore committed approximately $166m to support the development of the Fintech industry for the purpose of bolstering the start-up ecosystem in upcoming years58. This is a positive sign for the development of alternative finance in the
Fig. 56
$ 45m
$ 40m
$ 35m
$ 30m
$ 25m
$ 20m
$ 15m
$ 10m
$ 5m
$ 0m2013 2014 2015
$8.19m $ 22.33m $ 39.76m Figure 56: Online Alternative Finance Market Size for Singapore 2013-2015 ($ USD)
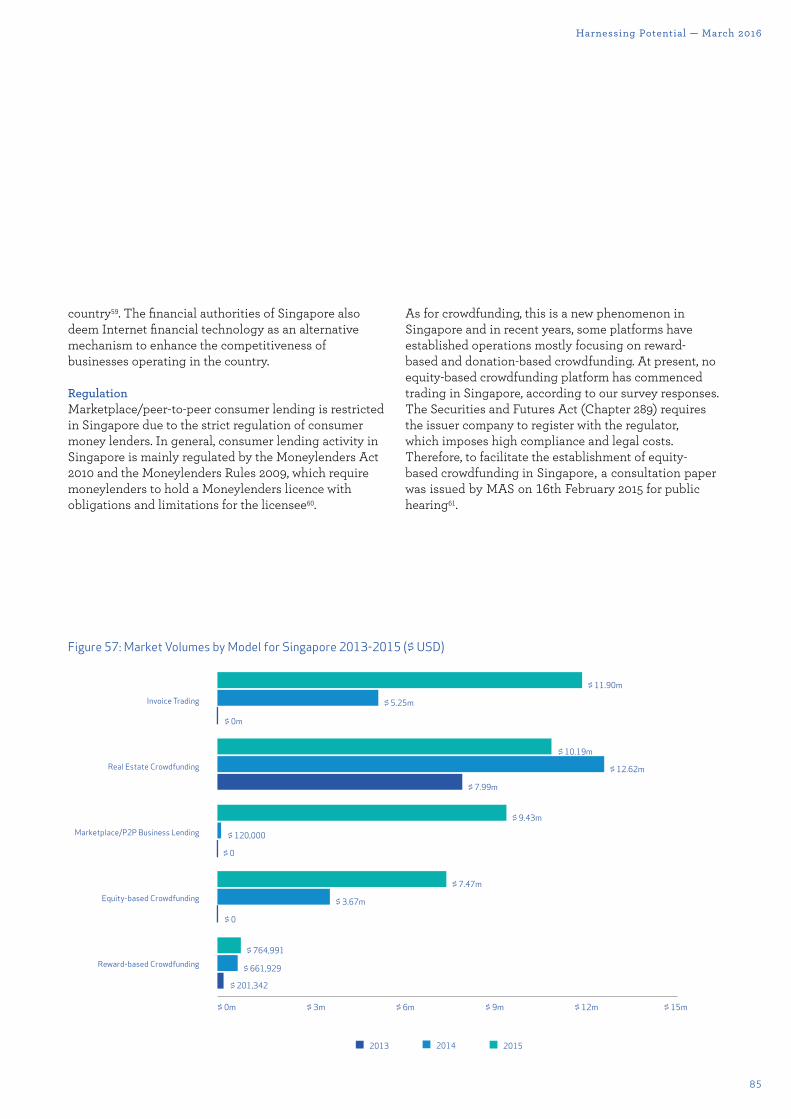
85
Harnessing Potential — March 2016
country59. The financial authorities of Singapore also deem Internet financial technology as an alternative mechanism to enhance the competitiveness of businesses operating in the country.
RegulationMarketplace/peer-to-peer consumer lending is restricted in Singapore due to the strict regulation of consumer money lenders. In general, consumer lending activity in Singapore is mainly regulated by the Moneylenders Act 2010 and the Moneylenders Rules 2009, which require moneylenders to hold a Moneylenders licence with obligations and limitations for the licensee60.
As for crowdfunding, this is a new phenomenon in Singapore and in recent years, some platforms have established operations mostly focusing on reward-based and donation-based crowdfunding. At present, no equity-based crowdfunding platform has commenced trading in Singapore, according to our survey responses. The Securities and Futures Act (Chapter 289) requires the issuer company to register with the regulator, which imposes high compliance and legal costs. Therefore, to facilitate the establishment of equity-based crowdfunding in Singapore, a consultation paper was issued by MAS on 16th February 2015 for public hearing61.
Figure 57: Market Volumes by Model for Singapore 2013-2015 ($ USD)
Fig. 57
Invoice Trading
Real Estate Crowdfunding
Marketplace/P2P Business Lending
Equity-based Crowdfunding
Reward-based Crowdfunding
$ 0m $ 3m $ 6m $ 9m $ 12m $ 15m
$ 11.90m
$ 10.19m
$ 12.62m
$ 7.99m
$ 9.43m
$ 120,000
$ 0
$ 3.67m
$ 7.47m
$ 0
$ 764,991
$ 661,929
$ 201,342
$ 5.25m
$ 0m
2014 20152013
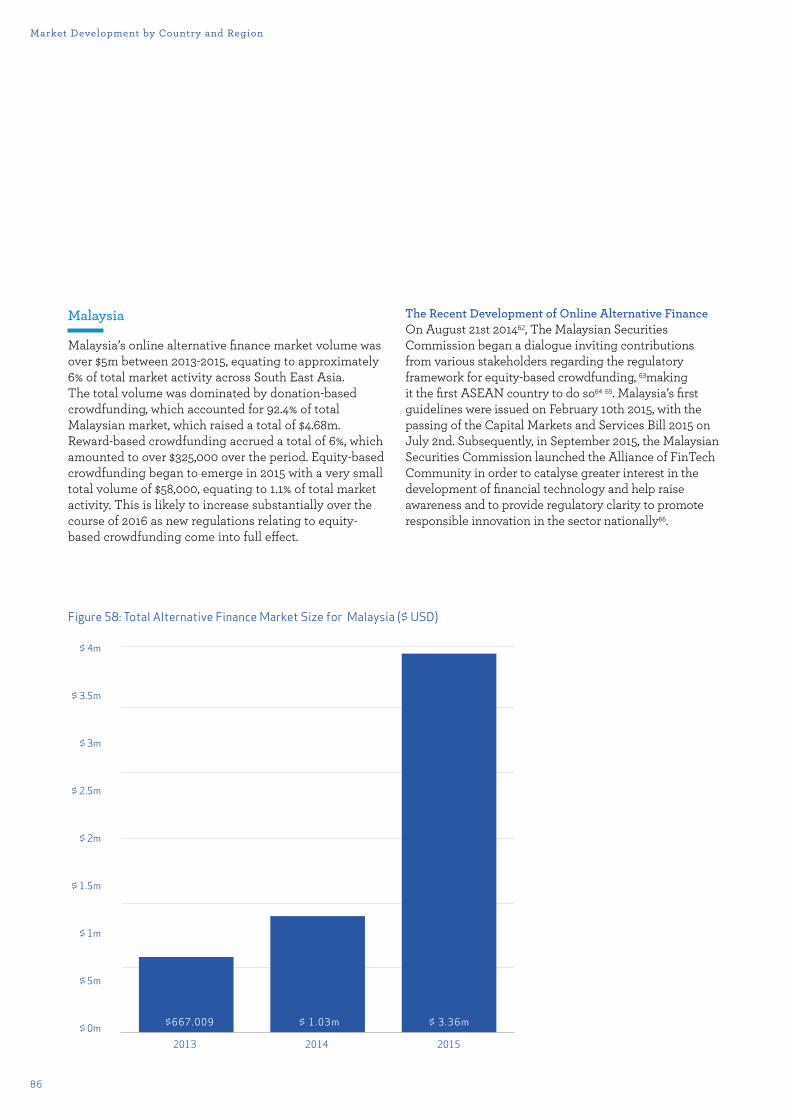
86
Figure 58: Total Alternative Finance Market Size for Malaysia ($ USD)
Fig. 58
$ 4m
$ 3.5m
$ 3m
$ 2.5m
$ 2m
$ 1.5m
$ 1m
$ 5m
$ 0m2013 2014 2015
$667.009 $ 1.03m $ 3.36m
Malaysia
Malaysia’s online alternative finance market volume was over $5m between 2013-2015, equating to approximately 6% of total market activity across South East Asia. The total volume was dominated by donation-based crowdfunding, which accounted for 92.4% of total Malaysian market, which raised a total of $4.68m. Reward-based crowdfunding accrued a total of 6%, which amounted to over $325,000 over the period. Equity-based crowdfunding began to emerge in 2015 with a very small total volume of $58,000, equating to 1.1% of total market activity. This is likely to increase substantially over the course of 2016 as new regulations relating to equity-based crowdfunding come into full e¯ect.
The Recent Development of Online Alternative FinanceOn August 21st 201462, The Malaysian Securities Commission began a dialogue inviting contributions from various stakeholders regarding the regulatory framework for equity-based crowdfunding, 63making it the first ASEAN country to do so64 65. Malaysia’s first guidelines were issued on February 10th 2015, with the passing of the Capital Markets and Services Bill 2015 on July 2nd. Subsequently, in September 2015, the Malaysian Securities Commission launched the Alliance of FinTech Community in order to catalyse greater interest in the development of financial technology and help raise awareness and to provide regulatory clarity to promote responsible innovation in the sector nationally66.
Market Development by Country and Region
87
Harnessing Potential — March 2016
RegulationIn September 2014, the Malaysian Securities Commission released its public response paper on the proposed equity-based crowdfunding regulation. Section 34 of the Capital Markets and Services Act 2015,67 which regulates equity-based crowdfunding, came into e¯ect in 2015. Six equity-based crowdfunding operators were given permission to operate as alternative funding platforms for small businesses and entrepreneurs.68 With regard to restrictions on the amount that companies can raise, this can be up to $715,000 within a 12-month period and cannot exceed an aggregate amount of ~$1.2M. In terms of investor restrictions, issuers will be able to tap into investments from retail, sophisticated, as well as angel investors, subject to investment limits. Retail investors may only invest a maximum of ~$1,200 (RM5,000) per issuer with total amount of investment not exceeding ~$12,000 in a year69.
In terms of marketplace/peer-to-peer lending, the Securities Commission is currently developing their approach to regulating debt-based crowdfunding activities, which is anticipated to enact within 2016 and is subject to a ministerial order - as was the case with equity-based crowdfunding in 2015. The Malaysian Securities Commission has been relatively proactive in its approach to regulating the alternative finance industry. It will be interesting to see the impact of this over the coming years as the sector develops.
Indonesia
In Indonesia, a total of $6.7m was raised between 2013-2015, accounting for approximately 8% of total alternative finance market volume in South East Asia. What makes Indonesia quite distinct from the rest of South East Asia, and indeed the rest of the Asia-Pacific region, is that donation-based crowdfunding accounts for the largest proportion of total national alternative finance activity, standing at approximately 68% of total national volume with $4.59m raised over the last three years. Marketplace/peer-to-peer business lending accounted for around 24% of market, with approximately $1.6m raised via this model. Reward-based crowdfunding raised approximately $0.5m with an 8% national market share.
Thailand
A total of nearly $1.5m was raised in Thailand during 2013-2015. This was quite low when compared to Singapore and Malaysia. The vast majority of activity took place within reward-based and donation-based crowdfunding models, which typically have smaller sized fundraises compared to financial return-based models. Nonetheless, reward-based crowdfunding was responsible for approximately two thirds of alternative finance market volume in the country, with almost $1m raised in the three-year period. Donation-based crowdfunding accounted for just over a third of national market activity, with $0.5m raised.
The Philippines
The Philippines alternative finance market accounted for approximately 0.6% of total market activity in South East Asia, with almost $0.5m raised across the country in 2013-2015. As with Thailand, only reward-based and donation-based crowdfunding models reported levels of market activity. The vast majority of fundraising came via reward-based crowdfunding platforms totalling 86% of national market volume with $0.4m raised between 2013-2015. Donation-based crowdfunding models raised just over $70,000, equating to just under 14% of the total market volume.

88
Running head
Conclusion
89
Harnessing Potential — March 2016
We hope this study has shed some light on the emergence and development of online alternative finance within the Asia-Pacific region. As our research has demonstrated, the alternative finance market in the region is as diverse and dynamic as the countries that make up the Asia-Pacific. Wherever we can, this study has sought to understand the rapid rise of a nascent industry, uncover patterns of development, compare the dominance of various alternative finance models and make sense of the fast evolving regulatory landscape in such a vast geographic region.
Inevitably, however, this benchmarking research invites more questions than it can provide answers to. For instance, as a key enabling factor, how will proposed regulations impact the growth trajectory of alternative finance in the Asia-Pacific region? Will bespoke regulatory regimes fare better or are existing frameworks likely to o¯er more stability and robustness? Another key determining factor for market growth is the level of awareness of alternative finance amongst individuals and businesses. How does the level of awareness among businesses vary across countries and regions in the Asia-Pacific? What measures can be adopted to increase levels of awareness among individual investors and consumers?
It will also be interesting to profile the stakeholders of alternative finance models to understand their motivations and key driving factors when selecting and utilising the various alternative finance channels and instruments available across the Asia-Pacific. Are individual or business borrowers using marketplace/peer-to-peer lending because they have failed to obtain finance from banks, or in fact do they prefer the speed, flexibility and services o¯ered by the alternative finance platforms? Do businesses that raise finance via an alternative finance platform perform better in terms of profitability, revenue and job creation against businesses that rely on traditional funding channels? How might we measure the socio-economic impact of raising capital through alternative finance?
From a credit analytics perspective, how are alternative finance platforms using new forms of data to ascertain the creditworthiness of borrowers? Are platform credit risk modelling and underwriting facilities su�ciently robust - particularly in comparison with traditional finance providers? In terms of equity-based crowdfunding, are platforms doing enough due diligence and assigning realistic valuations to the businesses utilising their services? What is the impact of equity-based crowdfunding on angel investing and the venture capital industry? Are they complementary or in competition?
Will the institutionalisation of the funding continue in countries such as Australia, or become more prevalent throughout the Asia-Pacific? Can alternative finance eliminate some of the geographic, gender and racial biases that exist in the current financial system? In the context of the Asia-Pacific, what is the potential for alternative finance to be harnessed to tackle chronic poverty, combat climate change and promote entrepreneurship and sustainable development?
These are big and important questions and we do not yet have answers. As academic researchers, we hope that there will be opportunities for us to work with policymakers, regulators and key stakeholders in the Asia-Pacific region to carry out more empirically-based studies, and further an in-depth and comprehensive research agenda for alternative finance for years to come. This, we hope, will help to realise and harness the full potential of alternative finance across the Asia-Pacific region.
90
Acknowledgements
The research team would like to thank Raghavendra Rau and Mia Gray for their guidance and feedback throughout the study.
We are also grateful for the help and support of Ian Pollari and his team at KPMG in Australia, James Mckeogh and his team at KPMG Hong Kong and Beijing, Rosana Mirkovic at ACCA Global in London and for the support of Professor Greg Whitwell, Dean of The Sydney University Business School.
We could not have completed the study without the work of Zhu Yijie, Karishma Dalal, Ahn Sang Uk, Kim Jin Young, Pawee Jenweeranon, Taisuke Amano, Zhao Liang, Berryl Li who were instrumental in conducting the survey. Thanks also to Shumi Akhtar, Byoung-kyu Min, Peilin Cai and William Shu who also contributed to the survey work and to Juan Yao and Xue Wu who led the China survey data checking. Thanks to Sean Anthonisz for his feedback and support throughout the study and for his comments on the report draft. Eva Huang, Angel Huang, Owen Xu, Ziyuan (Louie) Bai, Youming Liu and Mengtao Mao did a fantastic job of translating the report into Chinese. Di Hu and Jin Zou from the University of Cambridge also helped greatly during the translation process.
The Cambridge Centre for Alternative Finance would like to thank Charles Goldsmith, Tracey Horn, Nia Robinson, Kate Belger, Nathalie Walker, Peter Barry and Tom Poslett for their contribution towards the research and launch event organisation. We are also indebted to Jessica Rose and the rest of team in CUDAR and Cambridge in America for their valuable advice and assistance in raising the funding needed to undertake this research.
Eddie Anderson, Graham Partington, Suk-Joong Kim, Trevor Watson, Jamie Alcock, David Chaikin, Reuben Sagara, and Eliza Wu at the University of Sydney Business School all contributed valuable support to the project.
At the Tsinghua Graduate School of Shenzhen we would also like to thank the research survey team including Lin Jianwu, Dong Yuhan, He Jun, and the research survey team Huang Qiyang, Hao Xin, Zhao Fangyuan, Xiang Haitao, He Ting, Xia Ruiyang, Zhang Chao, Hu Nantao, Zhou Jiyuan, Chen Tao, Zheng Huan, Wan Qianhui, Du Yiyan, Jin Siyang, Xi Jun, Zhang Ying, Zhang Jing, He Yu, Yang Xue, Zhou Ran, Wang Boya, Ran Yuanjin, Li Yiman, Sun Xinyu, Liu Han, Cao Xue, Lin Zhesi, Zhang Liu, Ge Jie, Ma Haifeng, Li Junxia, Zhang Shasha, Zhou Min, Pan Rou, Liu Ruining, Feng Shiheng, Zhang Yue, Wei Zhiyuan, Han Jingyi, Wu Yingman, Zhang Teng, Zhan Xin, Deng Fugai, Ouyang Ji.
At Shanghai Jiaotong University, Xu Duoqi, Adam Chen, Jin Shan, Zhang Li, Xu Hai Ning, Zhan Wei Jie, Jiang Gao Hui, Wang Ting Ting, Yang Bo Yuan, Li Dong, Wang Xu, Wang Yu Song and Miao Jing Yu provided invaluable support for the survey.
91
Harnessing Potential — March 2016
We are also extremely grateful to Shi Pengfeng, Ma Jun, Huang Shiqiao, Xu Hao, Liu Yang and their team at Wangdaizhijia for their work in fielding the survey in China and for verifying the China platform survey data.
We would like to thank Anna Cui (CNTV & Guiyang Exchange) and Min Duan (Phoenix TV) and their media organisations in China for their support for the study.
We would also like to thank our research partners from organisations in China who disseminated the survey, including: Alex Lin (Crowdfund China Society), Si Fangbo (Innovi), Tharon Smith (Lendit China), Sun Fei Fei (Shenzhen Crowdfunding Association), Xu Boyan (Innovi), Ye Mengzhen (Innovi), Xiaochen Zhang (Crowdfund China Society), Zhu Gaofeng (Union Pay Smart Data Centre). We would like to thank our research partners from organisations across the Asia-Pacific region (and internationally): Janos Barberis (Fintech Hong Kong), Jason Best (Crowdfund Capital Advisors), Ehon Chan (MaGIC), Joanna Cheung (Fintech Hong) Simon Clegg (Crowdfund Vibe, New Zealand Crowdfunding Association), Stacey Chou (AVPN), Andrew Dix (Crowdfund Insider), Andrew Ho (Hong Kong Crowdfunding Association), Oscar Jofre (KoreConX), Grace Harvey (Thomson Reuters),Guo Yong Ki (Korea Crowdfunding Platforms), Chitpong Kittinaradorn (ChangeFusion), HongSin Kwek (Crowdfunding Asia), Johnathan Lee (MaGIC), Allan Leung (Hong Kong Crowdfunding Association), Silke Marsh and Hanna Helin (Thomson Reuters), Satoru Miyamoto (Japan Crowdfunding Council), Paul Niederer (Crowdsourcing Week), So-yeong Park (Korea Fintech Forum), Matthew Pinter (Crowdfunding Institute of Australia), Peter Renton (Lendit, Lend Academy), Sunit Shrestha (ChangeFusion), Nora Steinman (Lendit), Brian Tang (ACMI), Joseph Tse (Hong Kong Crowdfunding Association), Yan Zhao (APPI FS).
We would also like to thank Stephanie Arrowsmith, Andrea Franke, Andrew Macpherson, Dan Marom, Conor Roche, Ahn Sang Uk for all disseminating the survey and Christopher Aston, Kosta Sinelnikov, Karmei Tang who helped with our research and data queries. We would also like to thank Raja Adamullah Fahdullah Shah, Ching Yin Goh at the Malaysian Securities Commission for taking time to share with us their insights into crowdfunding securities regulatory development in Malaysia.
The Cambridge Centre for Alternative Finance wishes to thank CME Group Foundation and DFC Global for their generous multi-year donations towards our research endeavours.
92
Endnotes1. According to Cambridge Centre for Al-
ternative Finance’s upcoming research in the Americas and Europe
2. (Zhang, B.Z., Baeck, P., Ziegler, T., Bone, J. and Garvey, K. 2016) Pushing Boundaries UK Alternative Finance Report https://www.jbs.cam.ac.uk/faculty-research/centres/alterna-tive-finance/publications/push-ing-boundaries/#.Vts-6-tx0zk
3. (Zhang, B.Z., Wardrop, B., Rau, R. and Gray, M. 2015) Moving Mainstream the European Alternative Finance Benchmarking Report https://www.jbs.cam.ac.uk/fileadmin/user_upload/research/centres/alternative-finance/downloads/2014-uk-alternative-fi-nance-benchmarking-report.pdf
4. https://www.jbs.cam.ac.uk/faculty-re-search/centres/alternative-finance/publications/moving-mainstream/#.Vts_2utx0zk
5. According to Cambridge Centre for Al-ternative Finance’s upcoming research in the Americas and Europe
6. http://www.worldbank.org/en/coun-try/china/overview
7. http://techcrunch.com/2015/02/04/china-1trillion-ecommerce/
8. http://wearesocial.com/uk/spe-cial-reports/digital-social-mobile-chi-na-2015
9. http://www.mckinsey.com/busi-ness-functions/marketing-and-sales/our-insights/understanding-so-cial-media-in-china
10. http://www.mobileworld-live.com/mwcs15articles/chi-na-leads-way-smartphone-penetra-tion-m2m-connections-gsma/
11. http://www.infodev.org/infodev-files/wb_crowdfundingreport-v12.pdf
12. http://www.pbc.gov.cn13. By comparison the US alternative
financing volume is $97 dollars per person and the UK volume is $49 per person.
14. GDP Per Capita: http://data.world-bank.org/indicator/NY.GDP.PCAP.CD
15. World Bank (2013), Crowdfunding’s Potential for the Developing World, info Dev, http://www.infodev.org/crowdfunding
16. (Zhang, B.Z., Wardrop, B., Rau, R. and Gray, M. 2015) Moving Mainstream: The European Alternative Finance Benchmarking Report (University of Cambridge and EY), http://www.jbs.cam.ac.uk/index.php?id=6481#.Vghid-vmqpBc
17. http://www.sac.net.cn/tzgg/201412/t20141218_113326.html
18. http://www.wdzj.com19. http://www.wdzj.com/20. http://www.reuters.com/article/chi-
na-finance-fraud-idUSL3N15T02W21. http://www.wsj.com/articles/china-
calls-lending-platform-ezubo-a-7-6-billion-ponzi-scheme-1454313780
22. PBOC (People’s Bank of China) (2015a), Guiding Opinions on Pro-moting the Healthy Development of Internet Finance (关于促进互联网金融健康发展的指导意见), People’s Bank of China and 10 other Ministries and Commissions, (2015) No. 221, http://www.pbc.gov.cn/publish/goutongjiaol iu/524/2015/20150718104243894831567/20150718104243894831567_.html
23. (2015b), ‘Non-bank Payment Insti-tutions Online Payment Business Management Approach’ (draft) (非银行支付机构网络支付业务管理办法, 征求意见稿, People’s Bank of China) http://www.pbc.gov.cn/rmyh/105208/2905111/index.html
24. He S., Yan G., and Chen K. (2013), Mi-crofinance Theory and Practice (微型金融: 理论与实践), (Zhejiang: Zhejiang University Press).
25. Xicai (2014), ‘The CBRC’s P2P Clear Four Red Lines: No Capital Pooling’, 13 November 2014.
26. http://www.csai.cn/if/743921.html27. Authors’ estimates based on China
National Bureau of Statistics bank data available from: http://www.stats.gov.cn/tjsj/zxfb/201602/t20160229_1323991.html
28. http://www.crowdfundinsider.com/2015/02/62055-china-draft-regulations-published-for-equity-crowdfunding-as-sharein-partners-with-bop-to-expand/
29. http://www.accaglobal.com/us/en/discover/news/2015/12/peertop-eer-china.html
30. Article 2, Article 3, and Article 11 of Money Lending Business Act in Japan (Act No. 32 of May 13, 1983).
31. 2014 Amendment of Financial Instru-ments and Exchange Act, etc. (Act No.44 of 2014) Briefing Materials, Financial Services Agency, Japan, http://www.fsa.go.jp/en/refer/legis-lation/20140314/01.pdf (last visited February 14, 2016).
32. For example Following discussions with practitioners, academics, and government officials, the Financial Services Agency of Japan provided exemptions for ‘Financial Instruments Business Operators’ that only focus on equity-based crowdfunding reducing minimum capital requirements to 10 million JPY (approximately $88,318 USD), compared with the conventional Type I Financial Instruments Business Operator, which is 50 million JPY (ap-proximately $441,594 USD).
33. Article 4 and 534. Understanding Equity-based crowd-
funding (よくわかる 投資型クラウドファンディング), 小谷融, P.18-19
35. President Park’s “Crowdfunding is the Beginning of the Creative Econ-omy”, Korea IT Times, http://www.koreaittimes.com/story/33705/pres-ident-park’s-“crowdfunding-begin-ning-creative-economy” (last visited February 14, 2016).
36. As above.37. Financial Policy Roadmap for 2016,
Financial Services Commission (Ko-rea), http://www.fsc.go.kr/downMan-ager?bbsid=BBS0048&no=103355 (last visited February 14, 2016).
38. FSC chairman vows new funding sys-tem for small businesses, Korea Joon-gAng Daily, http://koreajoongangdaily.joins.com/news/article/article.aspx-?aid=2969604 (last visited February 14, 2016).
39. The maximum investment per compa-ny are (1) 2 million KRW, (2) 10 million KRW, and (3) no cap respectively. The maximum investment per year for these three classes of investors are (1) 5 million KRW, (2) 20 million KRW, and (3) no cap respectively.
40. Analysis of Peer-to-Peer Lending Market (P2P 대출시장 분석 및 시사점), Korea Institute of Finance, http://
93
Harnessing Potential — March 2016
www.kif.re.kr/kif2/publication/viewer.aspx?filetype=1&control-no=187252&ic=tkp&ismail=1 (last visited February 14, 2016).
41. Budget Speech (The 2015-16 Budget), Financial Services and the Treas-ury Bureau, http://www.budget.gov.hk/2015/eng/budget10.html (last vis-ited February 17, 2016).
42. Securities and Futures Commission.43. Notice on Potential Regulations Ap-
plicable to, and Risks of, Crowd-fund-ing Activities, Securities and Futures Commission, http://www.sfc.hk/web/EN/files/ER/PDF/Notice%20on%20Crowdfunding.pdf (last visited Febru-ary 17, 2016).
44. Section 7, Money Lenders Ordinance (Hong Kong).
45. SFC outlines risks of crowd-fund-ing and potential regulatory issues, Securities and Futures Commission, https://www.sfc.hk/edistributionWeb/gateway/EN/news-and-announce-ments/news/doc?refNo=14PR51 (last visited February 17, 2016).
46. Section 103 of the Securities and Fu-tures Ordinance (SFO)
47. Part IV of the Securities and Futures Ordinance on Offers of Investments, Securities and Futures Commission, http://www.sfc.hk/web/doc/EN/faqs/products/Frequently%20Asked%20Questions_3.6.09.pdf (last visited February 17, 2016).
48. The Act Governing Electronic Payment Institutions (Taiwan).
49. Section 5-1, 29, and 29-1 of The Bank-ing Act (Taiwan).
50. The second conference of Fintech (Chinese version), Financial Su-pervisory Commission (Taiwan), http://www.fsc.gov.tw/ch/home.jsp?id=96&parentpath=0,2&m-customize=news_view.jsp&data-serno=201512310011&aplistd-n=ou=news,ou=multisite,ou=chi-nese,ou=ap_root,o=fsc,c=tw&tools-flag=Y&dtable=News (last visited February 18, 2016).
51. Taipei Exchange Regulations Govern-ing the Conduct of Equity Crowdfund-ing by Securities Firms (Taiwan).
52. http://www.smh.com.au/busi-ness/ratesetter-targets-australi-
an-savers-with-new-lending-web-site-20141111-11kf2m.html
53. http://www.crowdfundinsider.com/2015/11/77694-thincats-aus-tralia-nears-2-million-in-lending-af-ter-one-year-of-operations/
54. http://www.treasury.gov.au/Con-sultationsandReviews/Consulta-tions/2015/Crowd-sourced-equi-ty-funding
55. Authors’ estimates based on Reserve Bank of New Zealand Lending and Credit Statistics available at: http://www.rbnz.govt.nz/statistics/
56. https://www.ketto.org/blog/a-pio-neer-of-crowdfunding-in-films-shy-am-benegal-on-gathering-funds-for-his-1976-film-manthan/
57. https://www.rbi.org.in/scripts/BS_SpeechesView.aspx?Id=862
58. The Future of FinTech A Paradigm Shift in Small Business Finance, World Economic Forum, http://www3.weforum.org/docs/IP/2015/FS/GAC15_The_Future_of_FinTech_Paradigm_Shift_Small_Business_Fi-nance_report_2015.pdf (last visited Feb.18, 2016).
59. How this Fintech Startup is plugging the SME Funding Gap, CNBC,http://www.cnbc.com/2015/07/30/how-this-fintech-startup-is-plugging-the-sme-funding-gap.html (last visited Feb.18, 2016).
60. Moneylenders Act 2010 of Singapore, sec. 5(1).
61. Consultation Paper : Facilitating Secu-rities-Based Crowdfunding, Monetary Authority of Singapore, http://www.mas.gov.sg/~/media/MAS/News%20and%20Publications/Consulta-tion%20Papers/Facilitating%20Se-curities%20Based%20Crowdfunding.pdf (last visited Feb.18, 2016).
62. http://www.wongpartners.com/files/Uploads/Documents/Type%202/WP/al_wp_equitycrowdfunding_mar15.pdf
63. http://www.wongpartners.com/files/Uploads/Documents/Type%202/WP/al_wp_equitycrowdfunding_mar15.pdf
64. http://www.tmf-group.com/en/me-dia-centre/news-and-insights/de-cember-2015/malaysia-first-equi-ty-crowdfunding-laws
65. http://www.sc.com.my/wp-content/up-loads/eng/html/consultation/140821_PublicConsultation_2.pdf
66. http://www.sc.com.my/post_archive/sc-launches-afinitysc-at-world-capi-tal-markets-symposium-2015/
67. http://www.tmf-group.com/en/me-dia-centre/news-and-insights/de-cember-2015/malaysia-first-equi-ty-crowdfunding-laws
68. http://www.dealstreetasia.com/sto-ries/sc-announces-6-equity-crowd-funding-operators-for-malay-sia-7680/
69. http://www.mahwengkwai.com/equi-ty-crowdfunding-in-malaysia-an-alter-native-fund-raising-mechanism/


Designed by Cultureshock Mediawww.cultureshockmedia.co.uk

96
Running head