Embed Size (px)
Citation preview
Calibration of a Fragmentation Model for a New Mining Operation
María Rocha, Split Engineering Chile &
John Kemeny, Split Engineering, University of Arizona &
Tom BoBo, Split Engineering &
Cristian Rodriguez, Split Engineering Chile
Abstract
Blast fragmentation depends on many factors. First of all, it depends on the specific blast design, which includes the amount and type of explosive, the blasting pattern, the timing and sequencing, and other parameters. Secondly, it depends on the properties of the rock mass, including the uniaxial compressive strength (UCS), the rock mass elastic modulus (E), the rock discontinuity characteristics (as reflected in the GSI or RMR), and the rock density. Several fragmentation models have been proposed to predict blast fragmentation based on the blast design and the properties of the rock. These models include the Kuz-Ram model and variations of this model, as well as recent models by Kim and Kemeny (2011) and others. Fragmentation models are validated and calibrated by comparing the predicted fragmentation with actual post-blast fragmentation from image processing monitoring systems.
In this study, the Kuz-Ram fragmentation model has been modified and calibrated for a new open-pit mine in South America. The mine has several different lithology with varying rock properties, and the model is being used to determine the optimum blast design in different parts of the pit. The calibration was conducted by initially gathering detailed rock data for the different lithology, including UCS, GSI, elastic modulus and density. Secondly, blasting trials with measured fragmentation were conducted in two rock types to determine the influence of the different rock properties on the resulting fragmentation. In this step, nonlinear regression was used to develop a modified Kuz-Ram model that explicitly takes into account the different rock properties. Finally, the calibrated fragmentation model was used to estimate bounds on post-blast fragmentation based on expected blasting practices in the mine in the next 5-10 years. It is expected that the fragmentation model can be further refined as mining progresses and additional data is collected.

Introduction The results presented in this paper were requested by geo-metallurgical personnel from a new open-pit copper (Cu) and molybdenum (Mo) mine in South America. It compliments a metallurgical project conducted at the mine that included sampling, geological characterization, test blasting and post-blast fragmentation measurement. The goal of the project is to be able to predict the blast fragmentation in the mine’s main rock types during the first 5 years of production. The estimated fragmentation will then be used to optimize the flotation characteristics and the Cu and Mo recovery of each lithology. Blast fragmentation depends on many factors. First of all, it depends on the specific blast design, which includes the amount and type of explosive, the blasting pattern, the timing and sequencing, and other parameters. Secondly, it depends on the properties of the rock mass, including the uniaxial compressive strength (UCS), the rock mass elastic modulus (E), the rock discontinuity characteristics (as reflected in the GSI or RMR), and the rock density. Several fragmentation models have been proposed to predict blast fragmentation based on the blast design and the properties of the rock. These models include the Kuz-Ram model and variations of this model (Cunningham, 2005), as well as recent models by Kim and Kemeny (2011) and others. Fragmentation models are validated and calibrated by comparing the predicted fragmentation with actual post-blast fragmentation from imaging systems.
In this paper, post-blast fragmentation prediction is based on the Kuz-Ram model. Details of the Kuz-Ram model are given in the Appendix. The Kuz-Ram model takes into account details of the mine design such as burden, spacing, charge length, and amount of explosive per unit volume. It also takes into account the geologic properties of the rock mass through the “rock factor”. Since the mine plans to use the JKSimBlast blast management software (Soft-Blast, 2013), the procedure for predicting the post-blast fragmentation utilizes the Kuz-Ram predictions within this software package. In particular, given a blasting design and geologic properties, the JKSimBlast software will predict the resulting fragmentation. The results presented in this paper are used to determine the correct rock factor for the Kuz-Ram model to be used within the JKSimBlast software or other software, based on calibration with actual fragmentation data. Because the predicted fragmentation is calibrated against actually fragmentation data, this overcomes some shortcomings of the Kuz-Ram model that have been previously described in the literature (Spathis, 2004). The approach developed in this paper could also be applied to other blast fragmentation models, such as the model developed by Kim and Kemeny (2011). The calculation of the rock factor for a given set of rock properties is based on a calibration that was conducted using data from two test blasts. Prior to the test blasts, geologic characterization was conducted and a number of intact and rock mass properties were measured, including the unconfined compressive strength (UCS), Young’s modulus (E), density, joint spacing, and other parameters. After the blasting the fragmentation was measured using an image based system. A rock factor model was then developed based on two commonly measured rock properties, the Point Load Index (PLI), and the Geologic Strength Index (GSI) (Hoek, 2000). Both the point load index and the GSI are widely used intact strength and rock mass strength parameters and provide a solid rock mechanics basis for fragmentation prediction. These are also important rock properties for the mine and properties that they will be continually collecting as mining progresses. Details on the calibration are described later. Since the calibration was conducted with a limited amount of data, it is of interest to the mine to update and improve the calibration as mining progresses. Therefore another goal of the project is to develop a procedure for ongoing calibration of the fragmentation prediction. This procedure should be of interest
to all mines interested in fragmentation prediction, and is not dependent on the blast design software that is used. Motivation and Methodology Often it is the case that blast fragmentation prediction or mine-to-mill optimization occurs after a significant amount of mining has taken place at a mine site. In the case study presented in this paper, on the other hand, the mine is a green-field project. In this case, it is of interest to the mine to make future predictions associated with blasting in the first 5 years of production, starting from day one. They are interested in utilizing a predictive model such as Kuz-Ram, so long as the Kuz-Ram model can accurately represent the site fragmentation characteristics for decision-making and operational control purposes. As has been noted in the literature (Cunningham, 2005), the Kuz-Ram model often needs to be calibrated to accurately predict the fragmentation for a given geologic site, and calibration is often conducted by adjusting the rock factor. However, in many cases a single calibrated rock factor is determined for a whole mine site, even though there may be significant geologic variation. Therefore, for the project described in this paper, a calibrated rock factor is determined that accounts for geologic variation within the mine site. The methodology for developing and continually updating the fragmentation model for the mine is shown in Figure 1, and consists of five steps. The first step involves the collection of data, including geological data, details on the blast design, and post-blast fragmentation measurement. The second and third steps involve simulating the blasting using the blast design and simulation software and predicting the fragmentation using the Kuz-Ram model. The fourth step involves a mathematical adjustment of the Kuz-Ram model based on a comparison of actual and predicted post-blast fragmentation. This results in step 5, which is an updated fragmentation model for the mine. This is an ongoing process, and Step 5 leads back to step 1 as more data is collected. Initially, the Kuz-Ram model predictions in Step 3 and the mathematical adjustments in Step 4 will be based on test blasts since production blasting has not started, and that is what is described in this paper. As mining progresses, Steps 3 and 4 will take into account actual production blasting in different parts of the mine.
Figure 1. Methodology for developing and continually updating the fragmentation model.
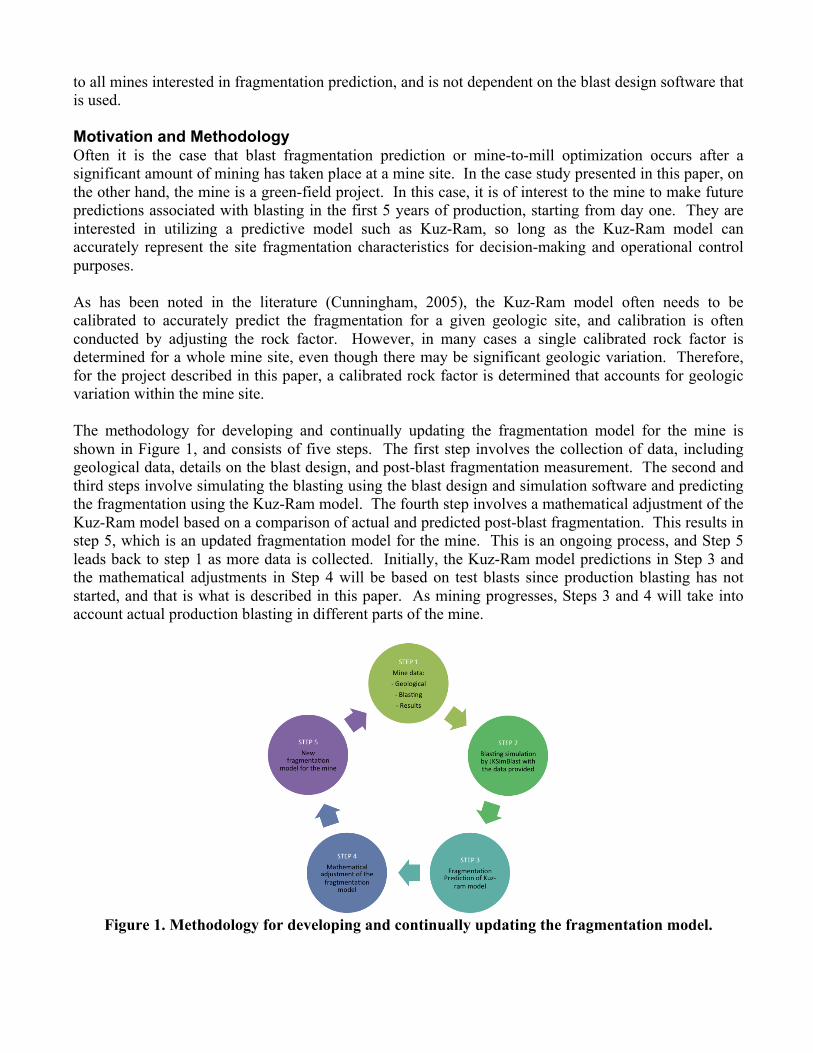
Step 1 - Data Collection Two test blasts were conducted, one in sedimentary rock (SDM) and one in porphyry (POR). These two rock types represent the dominant lithologies in the mine. Each of the test blasts consisted of an area of roughly 20 by 5 meters and a depth of about 5 meters. For the purpose of geologic characterization and fragmentation measurement, each blast was subdivided into five sections. Of the ten sections, only four sections had both geological characterization information and post-blast fragmentation information, and the development of the calibrated model is based on the results in these four sections, referred to as Samples 1-4. Geologic data collected for these four samples include geology and hardness, specific gravity, uniaxial compressive strength (UCS), Young’s modulus, and rock discontinuity information (spacing and block size). This data is shown in Table 1.
Table 1. Geologic data associated with the two test blasts
Material Lithology Block Size m (inch) Density
Young´s modulus
(GPa)
UCS (MPa)
GSI min
GSI max
PLI (MPa)
Sample 1 SDM 0.2 (7.8) 2.95 31.68 54.98 40 55 2.29
Sample2 SDM 0.2 (7.8) 2.98 12.75 39.5 40 55 1.46
Sample3 POR 0.5 (19.6) 2.64 28.46 87.95 45 65 4.37
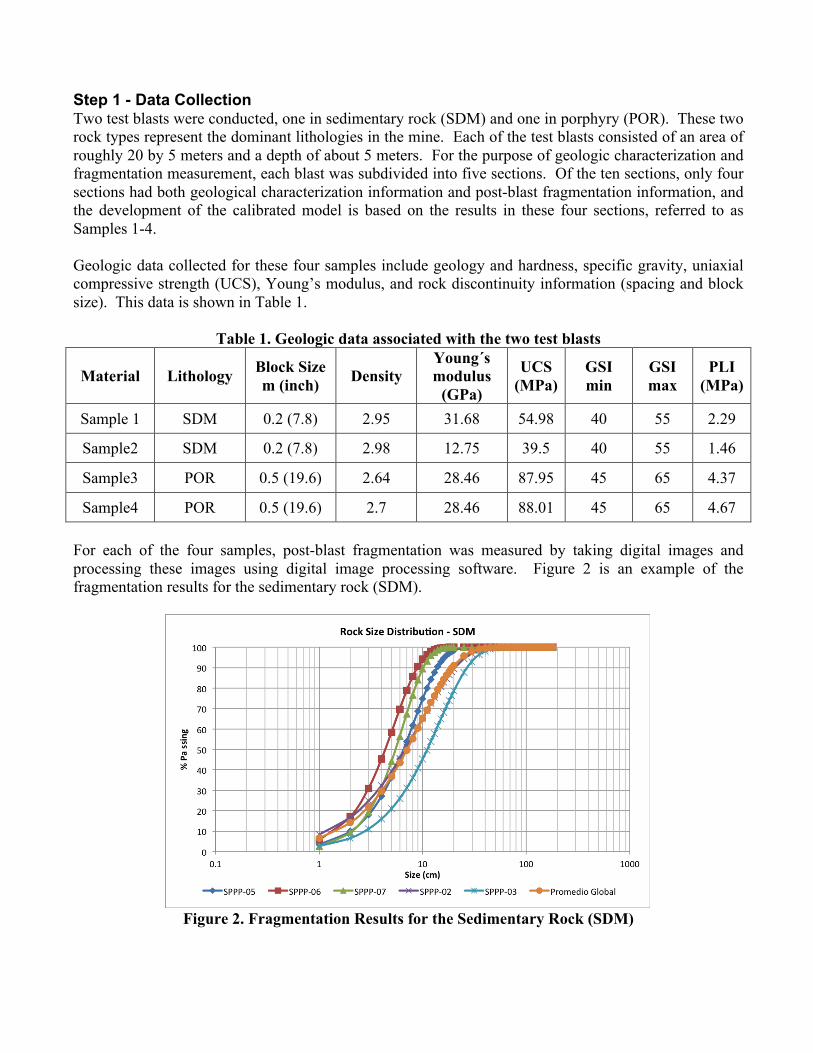
Sample4 POR 0.5 (19.6) 2.7 28.46 88.01 45 65 4.67 For each of the four samples, post-blast fragmentation was measured by taking digital images and processing these images using digital image processing software. Figure 2 is an example of the fragmentation results for the sedimentary rock (SDM).
Figure 2. Fragmentation Results for the Sedimentary Rock (SDM)
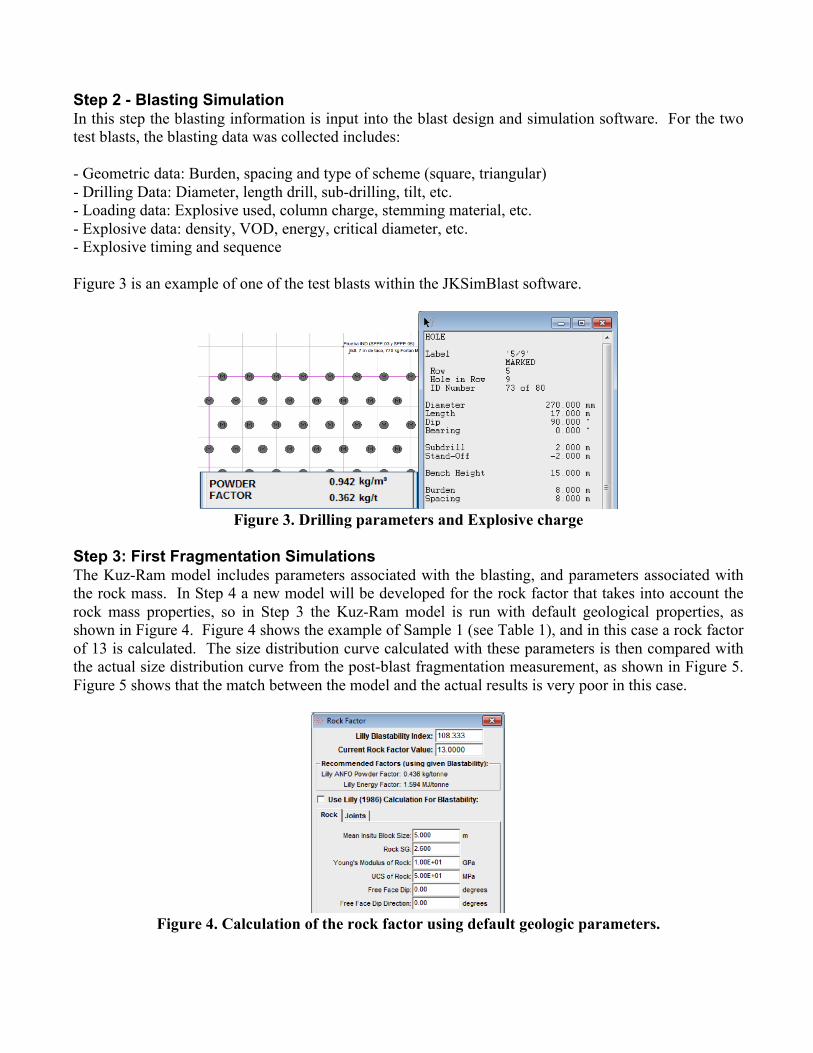
Step 2 - Blasting Simulation In this step the blasting information is input into the blast design and simulation software. For the two test blasts, the blasting data was collected includes: - Geometric data: Burden, spacing and type of scheme (square, triangular) - Drilling Data: Diameter, length drill, sub-drilling, tilt, etc. - Loading data: Explosive used, column charge, stemming material, etc. - Explosive data: density, VOD, energy, critical diameter, etc. - Explosive timing and sequence Figure 3 is an example of one of the test blasts within the JKSimBlast software.
Figure 3. Drilling parameters and Explosive charge
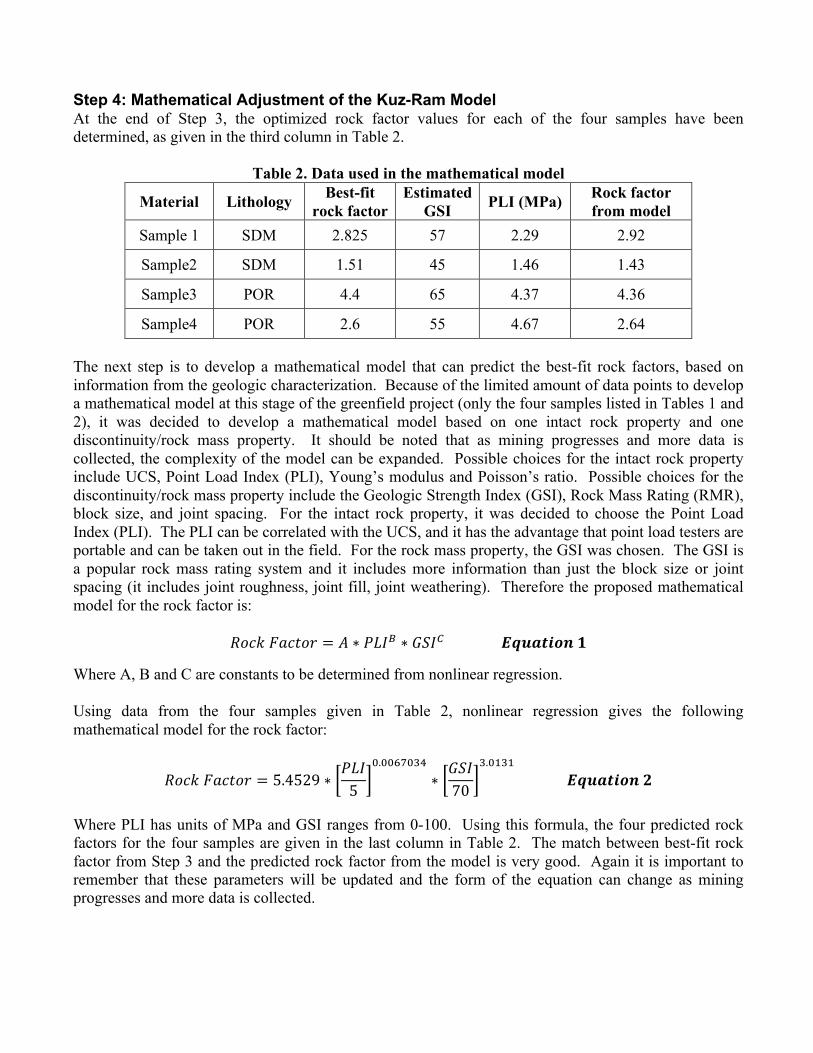
Step 3: First Fragmentation Simulations The Kuz-Ram model includes parameters associated with the blasting, and parameters associated with the rock mass. In Step 4 a new model will be developed for the rock factor that takes into account the rock mass properties, so in Step 3 the Kuz-Ram model is run with default geological properties, as shown in Figure 4. Figure 4 shows the example of Sample 1 (see Table 1), and in this case a rock factor of 13 is calculated. The size distribution curve calculated with these parameters is then compared with the actual size distribution curve from the post-blast fragmentation measurement, as shown in Figure 5. Figure 5 shows that the match between the model and the actual results is very poor in this case.
Figure 4. Calculation of the rock factor using default geologic parameters.
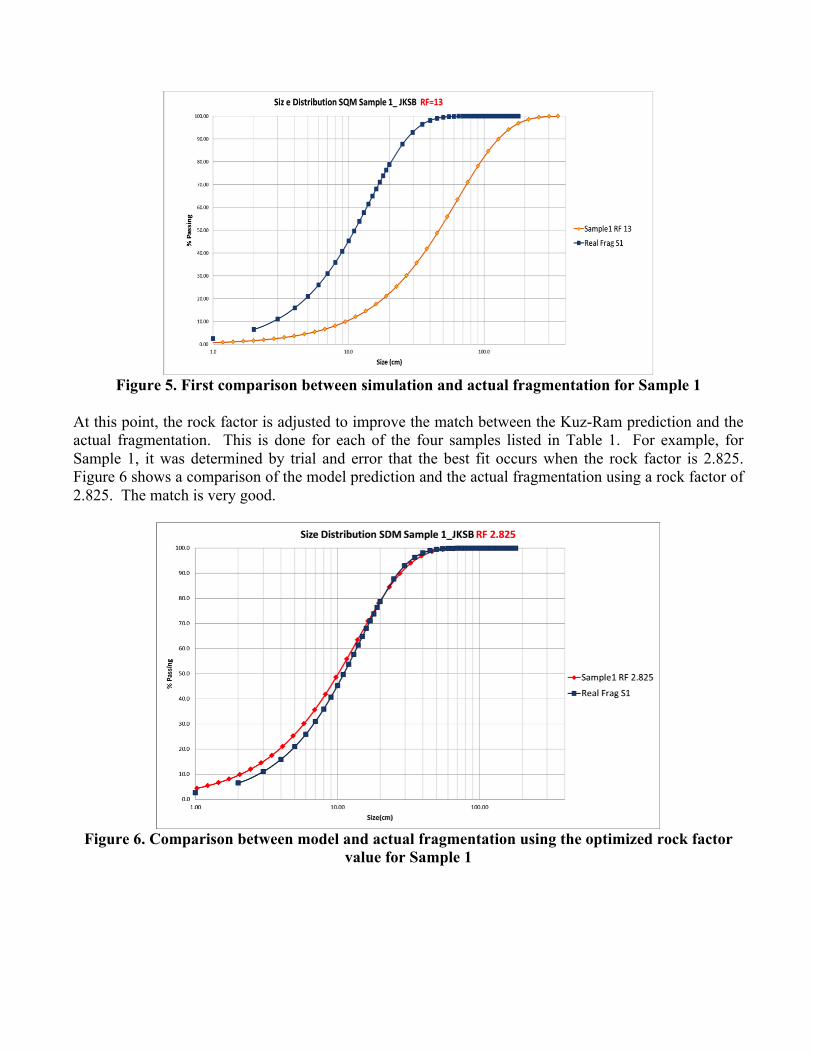
Figure 5. First comparison between simulation and actual fragmentation for Sample 1
At this point, the rock factor is adjusted to improve the match between the Kuz-Ram prediction and the actual fragmentation. This is done for each of the four samples listed in Table 1. For example, for Sample 1, it was determined by trial and error that the best fit occurs when the rock factor is 2.825. Figure 6 shows a comparison of the model prediction and the actual fragmentation using a rock factor of 2.825. The match is very good.
Figure 6. Comparison between model and actual fragmentation using the optimized rock factor
value for Sample 1
Step 4: Mathematical Adjustment of the Kuz-Ram Model At the end of Step 3, the optimized rock factor values for each of the four samples have been determined, as given in the third column in Table 2.
Table 2. Data used in the mathematical model
Material Lithology Best-fit rock factor
Estimated GSI PLI (MPa) Rock factor
from model Sample 1 SDM 2.825 57 2.29 2.92
Sample2 SDM 1.51 45 1.46 1.43
Sample3 POR 4.4 65 4.37 4.36
Sample4 POR 2.6 55 4.67 2.64 The next step is to develop a mathematical model that can predict the best-fit rock factors, based on information from the geologic characterization. Because of the limited amount of data points to develop a mathematical model at this stage of the greenfield project (only the four samples listed in Tables 1 and 2), it was decided to develop a mathematical model based on one intact rock property and one discontinuity/rock mass property. It should be noted that as mining progresses and more data is collected, the complexity of the model can be expanded. Possible choices for the intact rock property include UCS, Point Load Index (PLI), Young’s modulus and Poisson’s ratio. Possible choices for the discontinuity/rock mass property include the Geologic Strength Index (GSI), Rock Mass Rating (RMR), block size, and joint spacing. For the intact rock property, it was decided to choose the Point Load Index (PLI). The PLI can be correlated with the UCS, and it has the advantage that point load testers are portable and can be taken out in the field. For the rock mass property, the GSI was chosen. The GSI is a popular rock mass rating system and it includes more information than just the block size or joint spacing (it includes joint roughness, joint fill, joint weathering). Therefore the proposed mathematical model for the rock factor is:
𝑅𝑜𝑐𝑘 𝐹𝑎𝑐𝑡𝑜𝑟 = 𝐴 ∗ 𝑃𝐿𝐼! ∗ 𝐺𝑆𝐼! 𝑬𝒒𝒖𝒂𝒕𝒊𝒐𝒏 𝟏
Where A, B and C are constants to be determined from nonlinear regression. Using data from the four samples given in Table 2, nonlinear regression gives the following mathematical model for the rock factor:
𝑅𝑜𝑐𝑘 𝐹𝑎𝑐𝑡𝑜𝑟 = 5.4529 ∗𝑃𝐿𝐼5
!.!!"#!$%
∗𝐺𝑆𝐼70
!.!"#"
𝑬𝒒𝒖𝒂𝒕𝒊𝒐𝒏 𝟐 Where PLI has units of MPa and GSI ranges from 0-100. Using this formula, the four predicted rock factors for the four samples are given in the last column in Table 2. The match between best-fit rock factor from Step 3 and the predicted rock factor from the model is very good. Again it is important to remember that these parameters will be updated and the form of the equation can change as mining progresses and more data is collected.
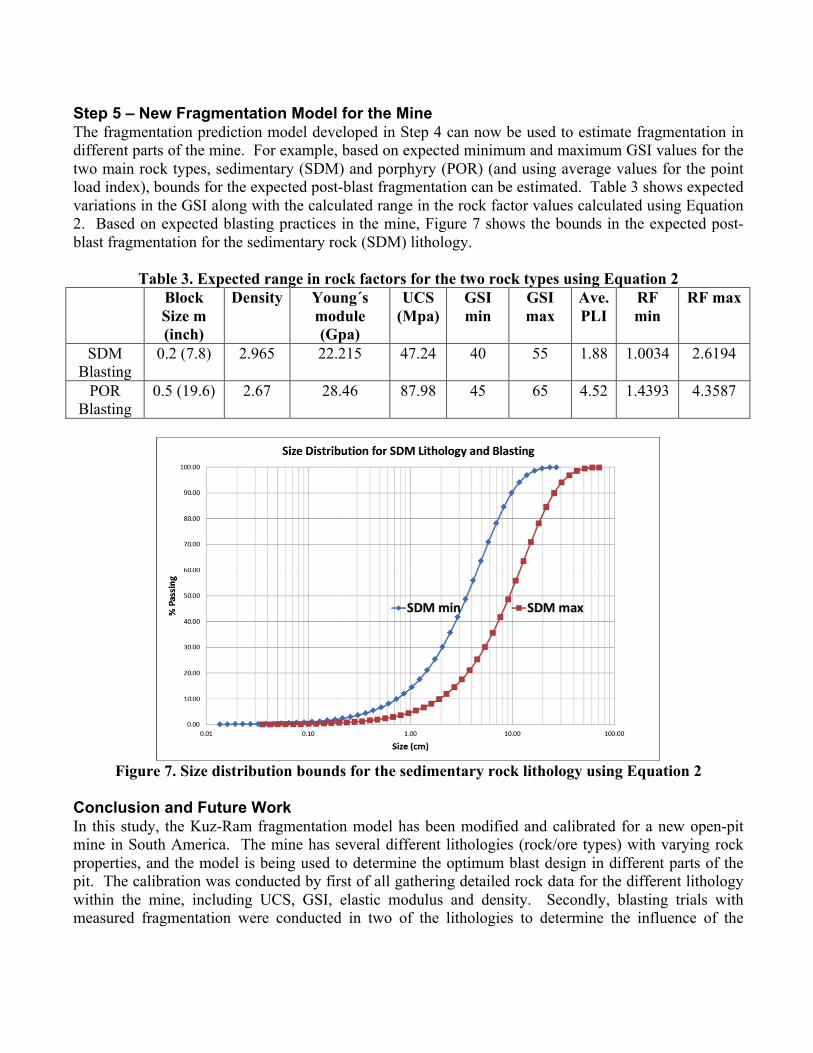
Step 5 – New Fragmentation Model for the Mine The fragmentation prediction model developed in Step 4 can now be used to estimate fragmentation in different parts of the mine. For example, based on expected minimum and maximum GSI values for the two main rock types, sedimentary (SDM) and porphyry (POR) (and using average values for the point load index), bounds for the expected post-blast fragmentation can be estimated. Table 3 shows expected variations in the GSI along with the calculated range in the rock factor values calculated using Equation 2. Based on expected blasting practices in the mine, Figure 7 shows the bounds in the expected post-blast fragmentation for the sedimentary rock (SDM) lithology.
Table 3. Expected range in rock factors for the two rock types using Equation 2 Block
Size m (inch)
Density Young´s module (Gpa)
UCS (Mpa)
GSI min
GSI max
Ave. PLI
RF min
RF max
SDM Blasting
0.2 (7.8) 2.965 22.215 47.24 40 55 1.88 1.0034 2.6194
POR Blasting
0.5 (19.6) 2.67 28.46 87.98 45 65 4.52 1.4393 4.3587
Figure 7. Size distribution bounds for the sedimentary rock lithology using Equation 2
Conclusion and Future Work In this study, the Kuz-Ram fragmentation model has been modified and calibrated for a new open-pit mine in South America. The mine has several different lithologies (rock/ore types) with varying rock properties, and the model is being used to determine the optimum blast design in different parts of the pit. The calibration was conducted by first of all gathering detailed rock data for the different lithology within the mine, including UCS, GSI, elastic modulus and density. Secondly, blasting trials with measured fragmentation were conducted in two of the lithologies to determine the influence of the
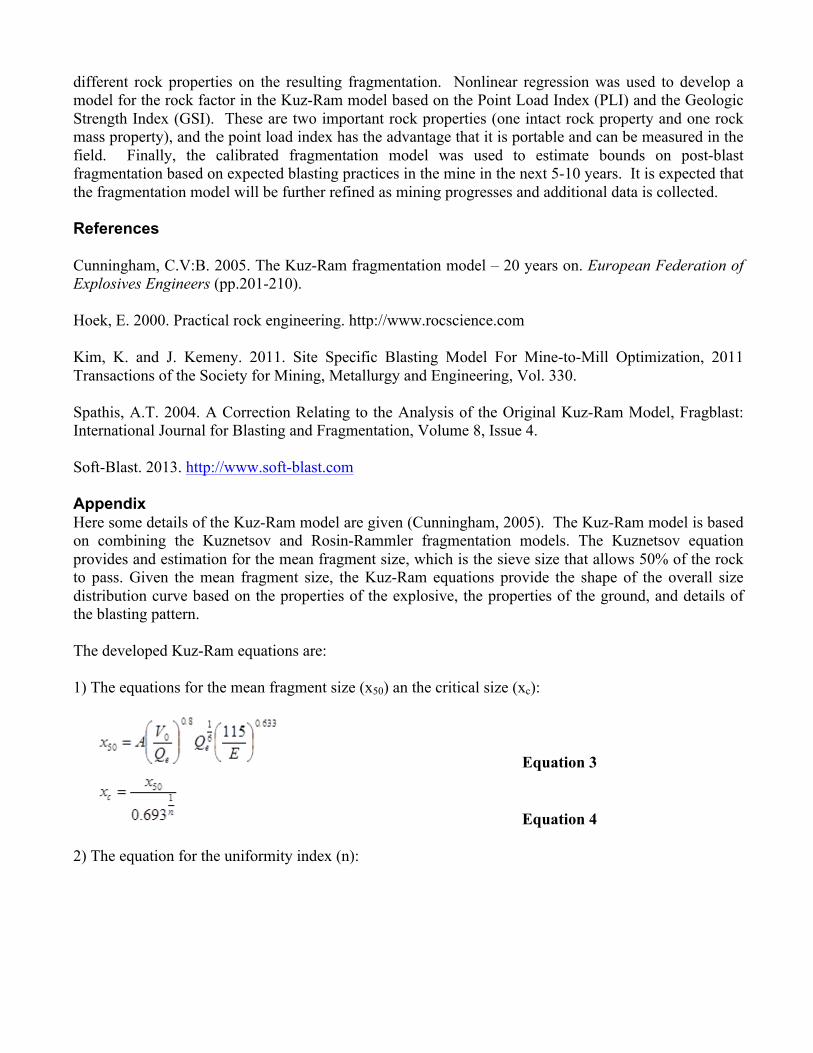
different rock properties on the resulting fragmentation. Nonlinear regression was used to develop a model for the rock factor in the Kuz-Ram model based on the Point Load Index (PLI) and the Geologic Strength Index (GSI). These are two important rock properties (one intact rock property and one rock mass property), and the point load index has the advantage that it is portable and can be measured in the field. Finally, the calibrated fragmentation model was used to estimate bounds on post-blast fragmentation based on expected blasting practices in the mine in the next 5-10 years. It is expected that the fragmentation model will be further refined as mining progresses and additional data is collected. References Cunningham, C.V:B. 2005. The Kuz-Ram fragmentation model – 20 years on. European Federation of Explosives Engineers (pp.201-210). Hoek, E. 2000. Practical rock engineering. http://www.rocscience.com Kim, K. and J. Kemeny. 2011. Site Specific Blasting Model For Mine-to-Mill Optimization, 2011 Transactions of the Society for Mining, Metallurgy and Engineering, Vol. 330. Spathis, A.T. 2004. A Correction Relating to the Analysis of the Original Kuz-Ram Model, Fragblast: International Journal for Blasting and Fragmentation, Volume 8, Issue 4. Soft-Blast. 2013. http://www.soft-blast.com Appendix Here some details of the Kuz-Ram model are given (Cunningham, 2005). The Kuz-Ram model is based on combining the Kuznetsov and Rosin-Rammler fragmentation models. The Kuznetsov equation provides and estimation for the mean fragment size, which is the sieve size that allows 50% of the rock to pass. Given the mean fragment size, the Kuz-Ram equations provide the shape of the overall size distribution curve based on the properties of the explosive, the properties of the ground, and details of the blasting pattern. The developed Kuz-Ram equations are: 1) The equations for the mean fragment size (x50) an the critical size (xc):
Equation 3
Equation 4 2) The equation for the uniformity index (n):

Equation 5 3) The equation for the size distribution curve, where R is the mass fraction retained from a screen size x:
Equation 6 and where: V0/Qe = the inverse of the powder factor (m3/kg). Qe = explosive/hole(Kg). E = weight strength relative to ANFO (%). W = Standar deviation of the drilling accurate (m) d = hole diameter (mm). A = rock factor L0 = deck length over the bench floor (m). H = bench height. B = burden (m) BCL = downhole deck length (m) CCL = column deck length (m) Lt = total deck length (CLL + BCL) (m)