Embed Size (px)
Citation preview

Mapping Australianhigher education2014-15Andrew Norton
October 2014

Mapping Australian higher education, 2014-15
Grattan Institute 2014 2
Grattan Institute Support
Grattan Institute Report No. 2014-11, October 2014 This report was written by Andrew Norton, Grattan Institute Higher Education Program Director and Ittima Cherastidtham, Grattan Associate. Nicholas Robinson and Beni Cakitaki made substantial contributions to revising and updating this edition.
We would particularly like to thank Mike Teece, Peter Bentley, Ian Li and an anonymous reviewer for their advice and input. Members of Grattan Institute’s higher education reference group, reviewers of previous editions of this report and others have all helped improve this publication. The opinions in this report are those of the authors and do not necessarily represent the views of any of the people acknowledged above or Grattan Institute founding members, affiliates, individual board members. Any errors or omissions are the authors’ responsibility.
Grattan Institute is an independent think-tank focused on Australian public policy. Our work is independent, practical and rigorous. We aim to improve policy outcomes by engaging with both decision-makers and the community.
This paper uses unit record data from the Household, Income and Labour Dynamics in Australia (HILDA) Survey. The HILDA Project was initiated and is funded by the Australian Government Department of Social Services (DSS) and is managed by the Melbourne Institute of Applied Economic and Social Research (Melbourne Institute). The findings and views reported in this paper, however, are those of the author and should not be attributed to either DSS or the Melbourne Institute.
Data from the Department of Education is copyright, Commonwealth of Australia, reproduced by permission.
Andrew Norton’s higher education reports are notified via Twitter, @andrewjnorton, and through the Grattan Institute’s mailing list. To join it, please go to: http://www.grattan.edu.au/
This report may be cited as: Norton, A., & Cherastidtham, I., (2014) Mapping Australian higher education, 2014-15, Grattan Institute
ISBN: 978-1-925015-62-1
Material published or otherwise created by Grattan Institute is licensed under a Creative Commons Attribution-NonCommercial-ShareAlike 3.0 Unported License. Data sourced from other organisations can only be reproduced subject to their copyright arrangements.
Founding members Program supportHigher Education Program
Affiliate PartnersGoogle
Origin Foundation
Senior AffiliatesEY
PwC
The Scanlon Foundation
Wesfarmers
AffiliatesJacobs
Mercy Health
Urbis
Westpac

Mapping Australian higher education, 2014-15
Grattan Institute 2014 3
Overview For people new to higher education and higher education policy, the field can seem bewildering. Basic facts are surprisingly difficult to find and interpret. Funding entitlements reflect the sector’s history more than consistent policy principles. Proposed radical changes to higher education policy add to the complexity.
Mapping Australian higher education, 2014-15, the third report in an annual series, puts key facts and their context in one place.
Australia has 40 full universities, and around 130 other higher education providers. Their revenues in 2012 exceeded $26 billion, making higher education a significant industry. Enrolments are growing strongly. In 2014, domestic enrolments should exceed 1 million for the first time. International enrolments are recovering from a downturn, with China the single largest source of students.
Online enrolments have grown rapidly in recent years, but the distinctions between online and on-campus are blurring. Almost all students use online technologies, while some universities have established study centres for their off-campus students.
The higher education workforce is increasing, with more than 50,000 people holding academic jobs. They are supported by a larger number of casually-employed tutors and lecturers.
As well as teaching more students, Australian academics have increased their research output, particularly through journal articles. Student satisfaction with teaching is slowly but steadily increasing, but subject pass rates are declining. As entry requirements are eased, more students struggle academically.
Recent graduates are finding it increasingly difficult to find full-time work. Despite slower transitions from university to career, graduates still earn significantly more than people finishing their education at Year 12.
This report includes new research showing that graduates of sandstone universities and of technology universities earn about six per cent more than graduates of other universities over a 40-year career.
Yet field of study is a greater driver of income differences among graduates than is university attended. For example, a graduate who chose engineering at any university over science is likely to earn more than a graduate who chose science at a sandstone university.
Although Australian universities have increased their private income since the 1980s, they still rely on government. About 60 per cent of their cash flow is government grants or loans.
The single largest government higher education program pays tuition subsidies for students. It will cost taxpayers $6.4 billion in 2014. Subsidies to the student loan scheme, HELP, are also going up.
The Government plans to bring students at non-university higher education providers into the public funding system, to remove regulations setting maximum fees, and to charge real interest on student debt. If passed, these changes will have big implications for higher education providers and their students.

Mapping Australian higher education, 2014-15
Grattan Institute 2014 4
Table of ContentsOverview ................................................................................................................................................................................... 3
Introduction ............................................................................................................................................................................... 8
1. Higher education providers in Australia ............................................................................................................................. 9
2. Higher education students in Australia ............................................................................................................................ 20
3. The Australian higher education workforce ..................................................................................................................... 32
4. Research in Australian higher education institutions ....................................................................................................... 37
5. Higher education finance – the macro picture ................................................................................................................. 41
6. Higher education finance – the micro picture .................................................................................................................. 54
7. Higher education policymaking ........................................................................................................................................ 61
8. How well is the higher education system doing? Benefits for employers and the public ................................................. 66
9. How well is the higher education system doing? Benefits for students ............................................................................ 72
Glossary ................................................................................................................................................................................. 91
Appendix A – Higher education providers with HELP eligibility .............................................................................................. 93
Appendix B – Higher education providers without HELP eligibility ......................................................................................... 95
References ............................................................................................................................................................................. 96

Mapping Australian higher education, 2014-15
Grattan Institute 2014 5
Figures
Figure 1: Higher education enrolments, 1950-2013 ........... 20
Figure 2: Enrolment share by level of study, 1980-2013.... 21
Figure 3: Domestic higher education students, 1988-2013 21
Figure 4: Domestic higher education participation rates, 17–19 and 20–29 year olds ..................................................... 22
Figure 5: Domestic bachelor-degree enrolments for arts and science, as a percentage of total enrolments .................... 23
Figure 6: Domestic enrolment share by field of education, 2001 and 2013 ................................................................... 23
Figure 7: International students enrolled in Australian higher education, 1988–2013 ....................................................... 24
Figure 8: Proportion of domestic students enrolled full-time, 2001-2013 ......................................................................... 25
Figure 9: Proportion of students studying off campus, 1950-2013 ................................................................................... 26
Figure 10: Proportion of enrolments by gender (domestic students), 1950-2013 ......................................................... 27
Figure 11: Unique applicants and offers, 2010-2013 ......... 29
Figure 12: Number of permanent and fixed-term staff in universities, 1996-2013 ...................................................... 32
Figure 13: Staff by area of university, 2012 ........................ 33
Figure 14: Casual employment as a share of the full-time equivalent academic workforce, 1990-2012 ....................... 35
Figure 15: Numbers of teaching and research, and research only staff, 1992-2013 .......................................................... 37
Figure 16: Enrolments in research degrees, 1979-2013 .... 38
Figure 17: Research spending by type, 1992-2012 ............ 39
Figure 18: Research publications, 1997-2012 .................... 40
Figure 19: Core teaching grant funding, 1989-2014 ........... 44
Figure 20: HELP debt (including fair value), 1989-2013 ..... 45
Figure 21: Annual cost of HELP, 1993-2014 ...................... 46
Figure 22: ARC and NHMRC grants to universities, 2000-2013 ................................................................................... 49
Figure 23: Proportion of universities’ revenue paid by students, 1997-2012 .......................................................... 52

Mapping Australian higher education, 2014-15
Grattan Institute 2014 6
Figure 24: Public and private spending shares of universities, 1939-2012 ...................................................... 53
Figure 25: International student bachelor degree fees, 2014........................................................................................... 56
Figure 26: Field of study offer rates, 2009 & 2013 ............. 60
Figure 27: Lifetime higher education attainment in 2011, by year when turned 18 .......................................................... 66
Figure 28: Proportion of public who have a ‘great deal’ or ‘quite a lot’ of confidence in universities, 2001-2014.......... 71
Figure 29: Literacy and numeracy levels of graduates, 2011-12 ....................................................................................... 72
Figure 30: Subject pass rates for domestic and international students, 2001-2013 .......................................................... 74
Figure 31: Mean student satisfaction with teaching, 1995-2013 ................................................................................... 75
Figure 32: Under- and unemployment for recent graduates, 1979-2013 ......................................................................... 77
Figure 33: Rates of professional and managerial employment by bachelor degree, 2011 .............................. 78
Figure 34: Median net earnings of bachelor-degree graduates compared to Year 12, 2011 ............................... 79
Figure 35: Fees for commerce students, by university group ........................................................................................... 82
Figure 36: ATARs of business and commerce students, by university ............................................................................ 83
Figure 37: Median full-time starting salaries by field of education............................................................................ 86
Figure 38: Career earnings by university groups ................ 87
Figure 39: Expected lifetime earnings by field of education (bachelor degree graduates of Other universities) ............. 89
Figure 40: Choice of field of education compared to choice of university ........................................................................ 90

Mapping Australian higher education, 2014-15
Grattan Institute 2014 7
TablesTable 1: Australian Qualifications Framework .............................................................................................................................. 10
Table 2: Top ten international student source countries, 2001/2013 ............................................................................................ 25
Table 3: Level of highest education enrolment or attainment for 20-24 year olds, by parent’s occupation .................................. 28
Table 4: Academic pay ranges, 2014 ........................................................................................................................................... 36
Table 5: Research spending, research student and undergraduate student enrolments by broad discipline ............................... 39
Table 6: Overview of public higher education subsidies, 2013-14 ................................................................................................ 42
Table 7: Overview of funding eligibility .......................................................................................................................................... 43
Table 8: Contributions for a 2014 Commonwealth-supported place (student taking out HELP loan) ........................................... 55
Table 9: Skills shortages by occupation, 2004-2013..................................................................................................................... 68
Table 10: Excellence in Research for Australia, 2012 .................................................................................................................. 70
Table 11: Top nine Australian universities, Shanghai Jiao Tong university rankings, 2014 .......................................................... 70
Table 12: Employment levels by qualification, 2013 ..................................................................................................................... 77

Mapping Australian higher education, 2014-15
Grattan Institute 2014 8
Introduction In 2014 higher education policy is on the political agenda. Government reform plans touch most areas of higher education policy. A proposal to deregulate fees is attracting most attention, but funding levels and entitlements, the student loan scheme and the quality regulator also face major changes.
Mapping Australian higher education, 2014-15 puts what could happen in higher education into the context of what has happened. Since its first edition in early 2012, the report has established itself as a widely-used one-stop source of information on higher education.
Chapter 1 explains how higher education is defined in Australia, the different types of higher education providers, and what makes universities distinctive among higher education providers.
Chapter 2 reports on student trends including enrolment numbers, courses chosen, and the mix of students on campus. It also discusses how students enter the higher education system.
Chapter 3, new to the 2014-15 edition, looks at the higher education workforce, including why people become academics, their employment arrangements, and their pay.
Chapter 4 looks at research in Australian universities, including what topics are researched.
Chapter 5 provides information on how higher education is funded, including overall levels of funding, the income-contingent HELP student loan scheme and research funding.
Chapter 6 outlines how per student funding levels are determined, and how student places are distributed between higher education providers.
Chapter 7 describes the expanding scope of the Commonwealth Government in higher education, the key government departments and the higher education interest groups.
Chapter 8 examines higher education’s social outcomes, including whether the disciplines studied meet economic needs, the quality of university research and public satisfaction with Australian universities.
Chapter 9 covers outcomes for students, including academic standards, student satisfaction with teaching, and graduate employment and earnings. In a new section for the 2014-15 edition, chapter 9 also investigates the effect on graduate earnings of what type of university a student attends and the course they study.
Overall, Mapping Australian higher education 2014-15 shows that the higher education system is performing reasonably well.

Mapping Australian higher education, 2014-15
Grattan Institute 2014 9
1. Higher education providers in Australia
What is higher education? The answer is surprisingly complex. This opening chapter explores the issue by examining the activities of universities, non-university higher education providers and other entities in the higher education industry.
1.1 What is higher education?
For many people, ‘higher education’ and ‘universities’ are synonyms. But universities are a particular kind of institution that delivers higher education. While universities educate most higher education students, they are a minority of higher education providers in Australia – 43 of the 172 operating in mid-2014. This includes 40 universities, one specialist university and two overseas universities.1 The other providers are a range of colleges, institutes, and schools that are authorised to offer higher education qualifications.
Before offering higher education qualifications, higher education institutions must be registered by the Tertiary Education Quality and Standards Agency (TEQSA – discussed in more detail in section 7.2.3). TEQSA ensures that all institutions meet conditions set by government. They are expected to support free intellectual inquiry, offer teaching and learning that engages with advanced knowledge and inquiry, employ academic staff who are active in scholarship, and issue qualifications that in Australia
1 Torrens University Australia took its first students in 2014 and is not yet fully compliant with the legal requirements of a university. Appendix A and appendix B have a full listing of higher education providers.
must comply with the Australian Qualifications Framework (AQF).2 The power to issue particular types of qualifications is the most important defining feature of a higher education provider. Free intellectual inquiry, engagement with advanced knowledge, and scholarship all occur outside the higher education sector, as well as within it. For these aspects of higher education no government permission is required: the market of ideas assesses value. It is the licence to issue AQF-recognised higher education qualifications, to certify individuals as having acquired knowledge and skills, that makes higher education providers distinctive.
Qualifications are differentiated according to the knowledge and skills required for their successful completion. Table 1 shows the AQF qualifications, ranked from 1 to 10. Generally certificates I to IV (levels 1 to 4) are classified as vocational, while associate degrees through doctoral degrees (levels 6 to 10) are classified as higher education. Level 5 diplomas and level 6 advanced diplomas can be vocational or higher education, though in practice most are taught in the vocational education sector.
2 DIICCSRTE (2013b)

Mapping Australian higher education, 2014-15
Grattan Institute 2014 10
Table 1: Australian Qualifications Framework
Level Qualification
1 Certificate I
2 Certificate II
3 Certificate III
4 Certificate IV
5 Diploma
6 Advanced Diploma; Associate Degree
7 Bachelor Degree
8 Bachelor Honours Degree; Graduate Certificate; Graduate Diploma
9 Masters Degree
10 Doctoral Degree
Source: AQF (2013)
Key differences between the qualifications include the level of theoretical knowledge required, and the student’s capacity to analyse information, make independent judgments and devise solutions to problems. Certificate I or II holders are expected to apply technical skills to routine tasks or predictable problems, while doctoral degree graduates are expected to be able to create new knowledge. In the middle classifications there are sometimes
subtle distinctions. A certificate IV holder is expected to analyse information to complete a range of activities, while a bachelor degree holder is expected to analyse and evaluate the information. A certificate IV holder is expected to provide solutions to sometimes complex problems, while a bachelor degree holder is expected to generate solutions to problems that are sometimes complex and unpredictable. The AQF encourages pathways between the qualifications, including full credit towards bachelor degrees for time spent acquiring diplomas, advanced diplomas, and associate degrees.
As there is a continuum of knowledge and skills rather than sharp dividing lines between the AQF levels, the distinctions between vocational and higher education are partly a matter of convention. The terminology should not be taken to imply that one sector is concerned with the world of work and the other is not. Most higher education students are seeking vocational outcomes. When the Australian Bureau of Statistics asked people who had completed qualifications in the past year about their main reason for undertaking learning, three-quarters of those completing higher education qualifications gave a job-related reason. For people completing certificate III and IV qualifications, 85 per cent gave a job-related reason.3
Vocational and higher education providers also overlap. The public-sector vocational education providers, the TAFEs, are adding degrees to their course programs; ten had done so by mid-2014. Especially in Victoria, a number of universities are ‘dual sector’, with substantial TAFE operations. Other universities offer a smaller range of vocational education courses. In the private 3 ABS (2010), table 5

Mapping Australian higher education, 2014-15
Grattan Institute 2014 11
sector, many institutions offer both higher education and vocational education courses. All up, 87 institutions offer both higher and vocational education courses.
1.2 Non-university higher education providers
Public awareness of non-university higher education providers (NUHEPs) is low, but they are a significant part of Australian higher education. In mid-2014, 129 NUHEPs (listed in Appendix A and Appendix B) were registered with TEQSA. Some are public institutions: the Australian Film, Television and Radio School, the Australian Institute of Police Management, and the various TAFEs now offering degrees, for example. Some are hard to classify on a public-private spectrum, as they are for-profit colleges owned by public universities. But most (106) are clearly in the private sector. A 1999 survey identified 78 private NUHEPs, indicating growth of more than a third to 2014.4
We cannot say for sure how many students are taught in NUHEPs. Until recently, there was no public reporting of enrolment data for NUHEPs that did not receive government funding.5 Where public universities outsource teaching (section 1.4) the students are counted in the university rather than the teaching institution. However, by combining publicly-reported numbers with material provided directly by a NUHEP, it is clear that in 2013 these providers enrolled the equivalent of at least 54,000 full-time equivalent students – less than six per cent of the total number of reported higher education students in that year
4 Watson (2000). There is also significant turnover in NUHEPs, including closures and takeovers. 5 The published data for these providers is from 2012: TEQSA (2014c)
(see section 2.1 for more detail on enrolments).6 It is a big increase on the slightly less than 15,000 full-time equivalent students in 1999.
One reason for this growth is that higher education can be profitable. At least two Australian stock market listed companies, Navitas Limited and SEEK Limited, are in the higher education business. According to its 2013-14 annual report, Navitas had higher education revenues of $499 million, with profits of $122 million, from operations in many countries.7 SEEK has sold its accredited higher education provider, but remains in the higher education services industry. Its education profits (including vocational education) in 2013-14 were $47 million.8 Two large American for-profit higher education companies, Kaplan and Laureate Universities International, also operate in the Australian market.
The non-university higher education sector is quite diverse, so most generalisations have exceptions. However, NUHEPs are specialised compared to universities (discussed in section 1.3). For most, teaching is their only major education function. They often use staff and facilities for revenue-generating teaching for longer periods of the year than universities do. Students can also finish their courses more quickly, studying for three trimesters a year rather than the two semesters offered by most universities.
6 Calculated from Department of Education (2014e), EFTSL data. 7 Navitas (2014) 8 SEEK (2014), p 5. All profit figures before interest, taxation, depreciation and amortisation (EBITDA).

Mapping Australian higher education, 2014-15
Grattan Institute 2014 12
Within their teaching function, NUHEPs often specialise in particular course levels. Very few offer the full range of AQF qualifications through to PhD. Fourteen institutions known as pathway colleges specialise in diploma-level courses. Their purpose is to prepare students for entry into the second year of a university course. Typically, they have a relationship with a particular university, and the diploma curriculum will match that taught in the target university’s first year. For example, students who successfully complete a Diploma of Commerce at the Melbourne Institute of Business and Technology can enter the second year of a Deakin University Bachelor of Commerce. By contrast, the College of Law offers entirely postgraduate courses as it prepares law graduates for practice or gives lawyers additional specialist skills.
The NUHEPs also tend to specialise in what they teach. Many include a specific field of study, industry or occupation in their title, for example: Chifley Business School, International College of Hotel Management, and the Australian College of Nursing. Subject specialisation can build brand reputations in particular niche areas.
An analysis of course offerings shows that business-related courses are most common in the non-university higher education sector. These include some delivered by professional associations such as the Institute of Chartered Accountants. There are also a significant number (23) of institutions with a religious affiliation. Some are theological colleges, but others offer a wider range of courses.
Health, and particularly alternative health, is also a common field in the non-university higher education sector. Fourteen providers
have a health-related subject in their titles. Another 11 colleges specialise in various kinds of creative arts.
Some NUHEPs are primarily focused on the international student market. Of those that have published enrolment data, one in five report that three-quarters or more of their students are from overseas.
In most cases, accreditation for NUHEP courses must be sought from TEQSA.9 The accreditation process includes examining course content, assessment methods, and staff qualifications. Course content needs to be comparable to courses at the same level in similar fields at other Australian higher education providers. There is provision for NUHEPs with appropriate quality assurance systems and a track record of re-accreditation to become self-accrediting – to have a legal right to approve their own courses. However, most NUHEPs are not self-accrediting.10
On top of these licence-to-operate requirements, some NUHEPs seek other third-party approval or endorsement of their courses. For example, NUHEPs offering accounting courses have them recognised by CPA Australia, so their graduates can become members of that accounting professional association. Some courses at the Australian College of Applied Psychology are approved by the Psychotherapy and Counselling Federation of Australia, a professional body.
9 TEQSA (2014b) 10 The self-accrediting NUHEPs are noted in Appendix A.

Mapping Australian higher education, 2014-15
Grattan Institute 2014 13
1.3 What is distinctive about universities?
‘University’ is a regulated term in Australia. No educational organisation can operate as an Australian university without meeting criteria set out in law. Commonwealth Government Provider Category Standards enforced by TEQSA regulate which institutions can operate as universities.11 Overseas universities can offer their home country qualifications in Australia if they are approved by a higher education accrediting authority acceptable to TEQSA.12
1.3.1 Research
The most important distinctive aspect of universities as higher education institutions is their combination of research and teaching. Research is defined as original work conducted to produce new knowledge. To be a full Australian university, a higher education provider must be active in research across at least three broad fields of study: disciplines such as health, engineering, education, or science.13 Higher education institutions with research activity in only one or two fields can apply to be a specialist university. Under this provision, the Melbourne College of Divinity became the University of Divinity.
While the idea that universities must be research active is widely accepted in Australia today, it is a recent idea. The original 11 DIICCSRTE (2012a); TEQSA (2013). A list of universities is in Appendix A. Most universities also have their own founding legislation, usually from a state government. 12 Carnegie Mellon University and University College London are the current overseas universities. 13 A detailed categorisation of disciplines can be found in ABS (2001).
Australian universities established in the mid-19th century were to be places of scholarship – expertise in existing knowledge rather than original research. Though universities were conducting some research by the latter part of the 19th century, PhD degrees were not offered until the 1940s.14 In the late 1980s and early 1990s, predominantly teaching-focused colleges of advanced education and other government-funded higher education institutions were turned into or merged with universities, substantially diluting the university sector’s research orientation. The universities that were created as a result are still sometimes referred to as “Dawkins universities” (after the minister behind the policy, John Dawkins).15 The description was partly intended to distinguish them from pre-1988 universities. Yet only 10 years later, research became a defining legal feature of a university.16
The research requirement has made it difficult for new universities to start. University research typically is not self-financing. Public research funding is primarily awarded according to past research performance, which makes it hard for new universities to build research output. So after a period in the 1980s and 1990s, when many new universities were created, no new full Australian universities were established in the decade after the three fields of study rule came into effect in 2000.
In October 2011, the first new university to be established under the three fields of study rule was announced. Torrens University 14 Starting with the University of Melbourne in 1945: Forsyth (2014), p 27 15 The ‘universities created during the Dawkins years are noted in the list of universities in Appendix A. For a more detailed history see Croucher, et al. (2013). 16 Through agreements between education ministers: MCEETYA (2000), later replaced by MCEETYA (2007).

Mapping Australian higher education, 2014-15
Grattan Institute 2014 14
Australia is owned by the American for-profit university conglomerate, Laureate Universities International. It took its first students in 2014 and has until 2015 to become fully compliant with the research requirements.
Most universities aim to integrate teaching and research, but reports of the Australian Universities Quality Agency (a pre-TEQSA audit body) suggest that this goal is often not well translated into practice.17 In many courses the curriculum is constrained by professional admission requirements and/or core disciplinary content that differs little between higher education providers. These factors limit opportunities for incorporating research findings into undergraduate courses.
Teaching and research also compete for limited academic time, attention and resources. Australian academics have a low preference for teaching compared to research.18 A Grattan Institute report analysed student surveys on teaching to see whether research activity levels made a difference. While it identified some differences between high and low research departments, overall no consistent positive or negative effect of research on teaching was found.19 Both research output and student satisfaction with teaching have improved in the last 15 years (sections 4.3 and 9.2), suggesting that there is no inherent trade-off between the two.
17 Brew (2010) 18 Coates, et al. (2009) esp. p 21-22; Strachan, et al. (2012), p. 37 19 Cherastidtham, et al. (2013)
1.3.2 Comprehensiveness
While many NUHEPs are specialised in what they teach (section 1.2), full Australian universities must offer courses in at least three broad fields of study, as classified by the Australian Bureau of Statistics.20 Most offer more. They are often described as being “comprehensive” in the range of courses they offer. A quarter of universities have students in all ten major broad fields of study, and a majority have students in at least nine major fields of study.
While many students specialise in their university studies, the comprehensive nature of Australian universities creates opportunities for studying more than one field. Australian universities offer many combined qualifications, such as arts/law or commerce/science, so that students graduate with two degrees. Nearly 10 per cent of completing students have combined or double degrees.21 Many students also take units from faculties other than the one they are principally enrolled in. For example, an arts student may do a mathematics unit taught by a science faculty.
Comprehensiveness also extends to the range of qualifications offered. All full universities offer courses from bachelor through to PhD (section 1.1). Some also offer diploma, associate degree and vocational education qualifications.
20 ABS (2001) 21 GCA (2014b), table 19

Mapping Australian higher education, 2014-15
Grattan Institute 2014 15
1.3.3 Self-accreditation
Unlike other higher education institutions, Australian universities automatically have the right to accredit their own courses. University academic boards approve their university’s courses, within a framework established by government regulation.22 Self-accreditation is an aspect of academic freedom (section 1.3.4). In developing courses, academics in self-accrediting universities are free to include material without seeking a government agency’s approval. They are instead regulated by their fellow academics.
The self-accreditation power was, however, diluted in the TEQSA reforms that took effect in early 2012. Prior to TEQSA, universities had their self-accrediting powers in perpetuity. Under TEQSA, universities must be periodically re-registered, with the potential for their self-accreditation power to be removed or qualified.
Though universities self-accredit, they also seek external accreditation or recognition. Often this is necessary for their graduates to be admitted to professional practice. They sometimes also secure international recognition. For example, 12 universities have had their business schools accredited by the international Association to Advance Collegiate Schools of Business (AACSB).
1.3.4 Academic freedom
The institutional freedom of self-accreditation has its individual equivalent in the idea of academic freedom. As one American study put it, “academic freedom establishes the liberty necessary
22 For a description of how academic boards operate see Group of Eight (2014).
to advance knowledge, which is the liberty to practise the scholarly profession.”23 Generally, academics see themselves as having considerable autonomy in the three main areas of university activity: research, teaching and community engagement (section 1.3.6 for more on engagement). Surveys of academics show that freedom to pursue their own research interests is a major part of what attracts them to universities.24 For research and teaching, academics self-regulate their individual freedoms: academic research is subject to peer review (review by other academic experts) and course content is approved by academic boards. This formal academic self-regulation is absent for community engagement. University administrations sometimes try to perform this role, and dismiss or discipline academics who make controversial or embarrassing public statements.25 Such actions almost always attract strong criticism, as academics do not see this as a legitimate role for managers (see further in section 1.3.5 below).
Technically, a “commitment to and support for free intellectual inquiry” is a legally-required feature of all higher education providers.26 In practice, a strong culture of academic freedom is more a feature of universities than higher education providers generally. Free intellectual inquiry is necessary for advancing knowledge, but not to delivering higher education qualifications.
23 Finkin and Post (2009), p 39 24 Bexley, et al. (2011), p 66 25 For examples and some background, see Jackson (2005). From 2012, allowing academics to make public comment on issues within their area of expertise is a condition of being registered as a higher education provider: DIICCSRTE (2013b). 26 DIICCSRTE (2013b)

Mapping Australian higher education, 2014-15
Grattan Institute 2014 16
Some higher education providers have narrower purposes, focusing on teaching knowledge and skills developed elsewhere.
1.3.5 Self-governing communities
One reason universities are sensitive about their self-accreditation status is that they see themselves as self-governing communities. Universities are subject to many regulations, but their legal structure reflects this self-governance. Though most universities were established by government, none are government instrumentalities. Four universities have no government appointments on their governing bodies, commonly called councils or senates.27 For the other universities, governments appoint a minority of senate or council members. Education ministers have no direct operational control. Partly for historical constitutional reasons, much government regulation of universities is via conditions on grants (section 7.1). In practice, universities invariably accept government money and its conditions, but in principle both could be refused.
Within universities, academics see themselves as members of the university community and not just as employees.28 They expect inclusion in collective decisions, a decision-making process known as collegiality. Traditionally academics have elected members to university senates and councils (Victoria has abolished elected positions on university councils). Academic critiques of university administrators often complain about what
27 They are Australian Catholic University, University of Notre Dame, Bond University and Torrens University Australia. 28 See the discussion in Forsyth (2014), especially chapters 7 & 8.
they call managerialism, seen as an ideological rival to collegiality.
Student groups also seek representation in university decision making, often through student associations officially recognised by the university. Traditionally this was granted; regulations now require it.29 The role and funding of official student organisations is the subject of a long-running political dispute between the Liberal Party on one side, and official student organisations, universities, and the Labor Party on the other.30
Despite complaints about the power of university management, university organisational structures are highly decentralised compared to for-profit corporations, with large amounts of consultation and decision-by-committee. Combined with change-resistant attitudes by academics and staff unions, these decision-making processes can make reforming universities difficult.
1.3.6 Broad social responsibilities
As well as being a community in themselves, universities are expected to contribute to the broader community. Community engagement is sometimes referred to as the third stream of university activity, after teaching and research. It can include universities working with or for local communities, government, industry, not-for-profits, and the media. The latest standards for registration as a university elevate some of these activities from desirable to necessary, requiring demonstrated engagement with
29 DIICCSRTE (2013c); DIICCSRTE (2013b) 30 Norton (2005)

Mapping Australian higher education, 2014-15
Grattan Institute 2014 17
local and regional communities, and a commitment to “social responsibility” in their activities.31
Community engagement is so diverse that it is hard to measure. One input indicator comes from academic time use surveys. The latest, from 2007, found that academics spent on average 4.4 hours a week on community service, out of an average 50.6 hours of work.32 Another survey of academics found that more than half believed that community service should be rewarded in promotions, though only 15 per cent said that it was rewarded.33 Community service is an important part of university culture and practice, but unlike teaching and research it does not dominate.
While community engagement is a significant university activity, it is not always appreciated by others. In The Poor Relation, a history of the social sciences in Australia, Stuart Macintyre observes that through the post-war decades social scientists repeatedly claimed that they could improve policy, while governments repeatedly found the work of academics to be ill-informed and impractical.34 Peter Shergold, a Secretary of the Department of Prime Minister and Cabinet under Prime Minister John Howard, commented that academics working on subjects of public policy used to “shuffle uncomfortably when I asked them exactly what policy changes they would introduce to address the problems they have so carefully analysed.” There was a large
31 DIICCSRTE (2012a) 32 Coates, et al. (2009) 33 Bexley, et al. (2011) 34 Macintyre (2010), p 24
gap, Shergold concluded, between the culture and incentives of academia and the input policymakers required.35
1.3.7 Multiple missions
Though the term ‘university’ has a formal legal definition, no single feature makes universities distinct as higher education providers. Some NUHEPs conduct research, self-accredit, give their academic staff freedom, operate as a community, and engage with the broader community. But few do all of these things, and most have limited functions beyond teaching. Contemporary Australian universities are characterised by their combination of activities more than by any one feature.
The multi-faceted nature of universities has advantages. The different characteristics of contemporary universities – research, teaching and community engagement – all inform each other. Yet there may also be disadvantages to this model. The multiple missions of universities inevitably compete for the same limited resources of time and money. Where in most industries gains in quality and productivity come through specialisation, in universities potential gains from specialisation are limited by the model of a generalist practitioner. Most academics are expected to be good at research, teaching, and community engagement; many are also expected to be good administrators as well. The skills needed for the generalist academic’s four tasks are not the same.
35 Shergold (2011); See also Moran (2011).

Mapping Australian higher education, 2014-15
Grattan Institute 2014 18
1.4 Higher education service providers
Although only higher education providers have a licence to issue higher education qualifications, other organisations support higher education providers or deliver related higher education services.
While universities do their own marketing, intermediary organisations help co-ordinate the matching of students with courses and institutions. The most important intermediaries are the state-based tertiary admissions centres, which handle most school-leaver applications for university (section 2.7). Commercial organisations are also involved in student recruitment.
Open Universities Australia (OUA) does not deliver education or award degrees. It sells online units and courses offered by its seven shareholder universities and other higher education providers. It is unusual in promoting not-for-degree units; selling just knowledge without a credential (though students may apply to individual universities for credit towards a degree for OUA units completed). Similarly, SEEK Learning is an education broker advising prospective students on their course options. Owned by the same company as the SEEK job advertisement site, SEEK Learning services the overlapping markets of people looking for better jobs and an upgrade of their qualifications. In the international student market, IDP Education (half owned by SEEK) helps match international students with universities in Australia and elsewhere.
Organisations such as Blackboard and Moodle help universities co-ordinate teaching-related activities through software known as learning management systems. These store course content and are used to submit work, run student forums, record assessment
results, and do other administrative tasks. New firms are emerging selling educational software innovations such as ‘adaptive learning’, where online course materials adapt to the student. These include Knewton in the United States, and Smart Sparrow in Australia.
The largest educational services company is Pearson Education, which operates in more than 70 countries, including Australia. It publishes textbooks and offers a wide range of online educational services. One of these is Smarthinking, a 24/7 online tutorial service that is used by some Australian universities.
Universities also outsource campus-based course delivery, usually to NUHEPs. Navitas operates Curtin University’s ‘Curtin Sydney’ campus. Students study a Curtin University curriculum and are awarded a Curtin University degree. Holmesglen Institute, a Melbourne TAFE and higher education provider, now offers University of Canberra degrees. There are increasing numbers of similar arrangements around Australia.
These relationships may become more common in higher education. As higher education becomes more competitive (section 6.2) partnerships can give universities access to new markets and technologies. Higher education service providers can build economies of scale by supporting many universities, lowering the cost of education.

Mapping Australian higher education, 2014-15
Grattan Institute 2014 19
Box 1: MOOCs
In 2012, the big higher education topic was massive open online courses (MOOCs). The key characteristic of MOOCs is that online course materials are made available to students for free.
A number of Australian universities have joined the major American MOOC providers, edX and Coursera, or the British provider FutureLearn. They aim to build their international profiles and gain experience of online education. Other universities created their own MOOCs.
Large numbers of people have enrolled in MOOC courses. But the initial hype about MOOCs challenging existing higher education business models has faded away. For students, content knowledge is only one of the outcomes they hope to achieve through higher education.36 Most crucially, MOOCS do not offer degree qualifications.
MOOC providers may find a place in the higher education services industry, but they are very unlikely to replace universities.
Consistent with this conclusion, American research finds that most MOOC students already have degrees.37 MOOCs help satisfy curiosity, and are valuable for that reason. But free courses complement rather than replace university education.
36 See Norton, et al. (2013), especially chapter 2 37 Ho, et al. (2014)

Mapping Australian higher education, 2014-15
Grattan Institute 2014 20
2. Higher education students in Australia
In this chapter we examine how many people are studying a higher education course, how they are chosen, what they are studying, and some of their social characteristics.
2.1 What is the overall trend in enrolments?
Australian higher education student numbers have grown rapidly since the 1960s, as Figure 1 shows. In 2013, total domestic and international student enrolments exceeded 1.3 million.
Although undergraduate numbers increased by the largest absolute number over the last 30 years, postgraduate coursework has doubled its share of total enrolments from 11 to 22 per cent. Figure 2 shows the trend.
Figure 1: Higher education enrolments, 1950-2013 Millions of students
Notes: Figures from 2001 onwards are based on full year enrolments, prior years are based on enrolments as at 31st March. Due to students commencing mid-year and at other times, pre-2001 enrolments are under-stated. Sources: DEEWR (2000); Department of Education (2014h)
0.0
0.2
0.4
0.6
0.8
1.0
1.2
1.4
1950 1957 1964 1971 1978 1985 1992 1999 2006 2013

Mapping Australian higher education, 2014-15
Grattan Institute 2014 21
Figure 2: Enrolment share by level of study, 1980-2013 Proportion of enrolments
Note: Doctorate by coursework is classified as postgraduate coursework. Sources: DEEWR (2000); Department of Education (2014h)
2.2 Domestic students
Around three-quarters of students enrolled in Australian higher education institutions are Australian citizens or permanent residents. Occasional years of slow growth or small declines in student numbers only interrupt the long-term trend towards more students (Figure 3). Controls on undergraduate student numbers in public universities were eased and then largely removed in the years leading up to 2012 (section 6.2). This policy change
triggered rapid enrolment increases. In 2013, there were 985,000 domestic students. On recent growth rates, in 2014 domestic enrolments will exceed 1 million for the first time.
Figure 3: Domestic higher education students, 1988-2013 Millions of students
Note: Figures from 2001 onwards are based on full year enrolments, prior years are based on enrolments as at 31st March. Sources: DEEWR (2000); Department of Education (2014h)
0%
10%
20%
30%
40%
50%
60%
70%
80%
90%
100%
1980 1984 1988 1992 1996 2000 2004 2008 2012
Undergraduate
Postgraduate-coursework
Postgraduate-research
Updated by BC 16/07/14
0.0
0.1
0.2
0.3
0.4
0.5
0.6
0.7
0.8
0.9
1.0
1988 1993 1998 2003 2008 2013
Updated by BC on 16/7/14

Mapping Australian higher education, 2014-15
Grattan Institute 2014 22
Australia’s population has also been growing in this period. Participation rates adjust for this by showing the proportion of people enrolled in higher education. Figure 4 reports higher education participation rates for school leavers aged between 17 and 19 years, and for people in their twenties. In both cases, participation rates more than doubled between 1982 and 2012.
Figure 4: Domestic higher education participation rates, 17–19 and 20–29 year olds Proportion of population enrolled
Note: Onshore international students have been removed from the population figures for 2002 and 2012. Sources: DEET (1993); DEST (2002) ABS (2008); ABS (2013a); Department of Education (2013d)
2.2.1 What courses do students take?
Australian universities have mixed general and professional education from their earliest days. Though more professions require degrees for admission than in the past, with consequent increases in university enrolments in related fields, general interest courses have retained their domestic undergraduate enrolment share. Precise comparisons over time are complicated by changes in how higher education statistics are collected, and the rise of new fields of education, but Figure 5 shows broad stability in arts and science domestic undergraduate enrolment shares over 50 years. Combined qualifications (section 1.3.2) let students mix vocational and general interests in their studies.
0%
5%
10%
15%
20%
25%
30%
1982 1992 2002 2012
17-19 y/o
20-29 y/o

Mapping Australian higher education, 2014-15
Grattan Institute 2014 23
Figure 5: Domestic bachelor-degree enrolments for arts and science, as a percentage of total enrolments
Note: * 2013 Arts includes the ABS categories ‘Society and Culture’ (minus sub-categories law and economics);; and ‘Creative Arts’, ** 2013 Science includes IT. Sources: Macmillan (1968) measured by faculty, Department of Education (2014h) measured by EFTSL. The resilience of general interest courses still shows when postgraduate courses are included (Figure 6). Science has been particularly strong since 2009, making up for some earlier weakness. Courses linked to specific careers or industries show more volatility than general interest courses. Since the start of the century, business-related and information technology courses have lost enrolment share, while health courses have boomed.
Figure 6: Domestic enrolment share by field of education, 2001 and 2013 Broad field of education
Notes: Shows enrolments in undergraduate and postgraduate non-research courses. ‘Agriculture’ includes environmental courses. ‘Society and culture’ includes law, economics and social work as well as humanities, languages and social sciences. Source: Department of Education (2014h)
29.1%
16.4%
29.3%
17.8%
0%
5%
10%
15%
20%
25%
30%
35%
Arts* Science**
1962 2013
1962 2013
Updated by BC 21/7/14
0% 10% 20% 30%
Architecture and Building
Agriculture
Creative Arts
Engineering
Information Technology
Natural and Physical Sciences
Education
Health
Management and Commerce
Society and Culture
20012013

Mapping Australian higher education, 2014-15
Grattan Institute 2014 24
2.3 International students
International students have long studied at Australian universities, but their numbers were small until the 1990s. Before then, international enrolments were often part of Australia’s overseas aid, wholly or partly subsidised by the Commonwealth.38 From 1986, universities were allowed to take international students at fees they set and kept. Double-digit growth rates quickly became the norm, promoted at times by migration policies favouring former international students. Australian universities have also established branch campuses in other countries.39
In 2013, 328,402 international students were enrolled with Australian higher education providers, including 84,785 enrolled in offshore campuses (Figure 7). Counting only onshore students, around one in five students in Australian universities is an international student. Half of all international students are enrolled in courses within the management and commerce field of education. Other major fields include engineering (10 per cent) and eight per cent for each of society and culture, health and information technology.
Australian universities enrol students from most countries, but the largest numbers come from Asian countries (Table 2). Over the last decade, enrolments from China have grown more than ten-fold. They now make up more than a quarter of all international students in Australian higher education.
38 Meadows (2011). A limited number of international students from developing countries still receive scholarships to study in Australia. 39 Lawton and Katsomitros (2012)
Figure 7: International students enrolled in Australian higher education, 1988–2013 Thousands
Note: Figures from 2001 onwards are based on full year enrolments, prior years are based on enrolments as at 31st March. Sources: Department of Education (2014h); DEEWR (2000)
0
50
100
150
200
250
300
350
400
1988 1993 1998 2003 2008 2013

Mapping Australian higher education, 2014-15
Grattan Institute 2014 25
International student numbers are down on their 2010 peak, but remain high by historical standards. Changes to migration policy, a high dollar, negative publicity on student safety, and increased competition from universities overseas are among the possible causes of reduced numbers. Visa applications show a recovery in demand from international students during 2013.40 Changes to migration rules for international students, which may have contributed to this increase, are discussed in section 7.2.6.
Table 2: Top ten international student source countries, 2001/2013
2001 2013 Singapore 18,277 China 94,085 Malaysia 16,344 Singapore 35,157 Hong Kong 15,719 Malaysia 29,698 Indonesia 9,619 Vietnam 19,237 China 8,018 India 17,003 India 5,485 Hong Kong 14,075 United States 3,548 Indonesia 11,497 Thailand 3,259 Nepal 7,245 Taiwan 2,687 South Korea 6,967 Norway 2,527 United States 6,844
Sources: Department of Education (2014e) and predecessor publication.
2.4 Full and part-time enrolment
Most undergraduate students are enrolled full-time. Since 2001 the proportion of undergraduates studying full-time has trended up, to 77 per cent in recent years (Figure 8). Postgraduate
40 DIBP (2014), p 18
students are much less likely to study full-time, but an upward trend is also apparent for them, reaching 36 per cent in 2013. Eighty-three per cent of international students study full-time, partly reflecting visa requirements for onshore students.
Figure 8: Proportion of domestic students enrolled full-time, 2001-2013
Note: Full-time enrolment is defined as 75 per cent or more of a normal study load. Source: Department of Education (2014h)
2.5 The rise of off-campus study
Studying off-campus is not a new thing in Australia. Originally carried out by correspondence, distance education has never fallen below five per cent of total enrolments. As Figure 9 shows,
0%
10%
20%
30%
40%
50%
60%
70%
80%
90%
2001 2004 2007 2010 2013
Updated by BC 21/7/14Undergraduate
Postgraduate

Mapping Australian higher education, 2014-15
Grattan Institute 2014 26
the proportion of students studying off-campus has increased since the early 1990s to 18 per cent in 2013 (the drop from 2000 was due largely to declining international student off-campus enrolments). Since 2001, students whose enrolment mixes on and off-campus study have been included in a separate ‘multi-modal’ classification. By 2013, nine per cent of students were enrolled on a multi-modal basis. Combined with external enrolments, more than a quarter of students study off-campus.
Figure 9: Proportion of students studying off campus, 1950-2013 Proportion of students studying off campus
Notes: Multimodal students not included; Open Universities Australia included. Dip from mid-1960s caused by the incorporation of non-university institutions into the statistical series; dip from mid-1980s influenced by moving nursing courses from hospitals to universities; 1994-2000 headcount discounted by 3.7 per cent to reduce the effect of possible double counting of OUA students. Sources: DEEWR (2000); Department of Education (2014h); e), including predecessor publications.
Several factors are likely to be behind this trend. Improved educational technology via the internet has made off-campus study easier for students, avoiding long delays as work is sent and returned via mail. This technological change coincided with increased demand for postgraduate study, often from people with
0%
2%
4%
6%
8%
10%
12%
14%
16%
18%
1950 1957 1964 1971 1978 1985 1992 1999 2006 2013
Change in data collection

Mapping Australian higher education, 2014-15
Grattan Institute 2014 27
significant work and family responsibilities. Not having to travel to campus makes study easier for this group. In comparison, school leavers generally prefer to undertake their course through face-to-face tuition.41 Funding policy changes have made it easier for public universities to offer more undergraduate online courses.42
Although there is a real trend towards off-campus enrolment, the distinctions between on- and off-campus study are blurred. On-campus students can do much of their study online, and some universities provide physical study centres for online students.
2.6 Who is studying?
Universities used to be places mainly for men. In the 1950s, only about one in five university students was female. But in 1958, women started a remarkable run of consistent annual gains in enrolment share. This run was only broken in 2010, when male students made a tiny gain in their proportion of total enrolments compared to 2009. Women have been a majority of university students since 1987 (Figure 10).
There are many reasons why this has happened: the overall social position of women has improved; entry into occupations dominated by women (teaching and nursing) now requires higher education qualifications; girls outperform boys at school; and young men have better-paying vocational education options than young women.
41 Norton, et al. (2013), p 16-18 42 Kemp and Norton (2014), p 47
Figure 10: Proportion of enrolments by gender (domestic students), 1950-2013
Sources: DEEWR (2000); Department of Education (2014h)
Despite their long-standing majority status in higher education, women are still regarded as an official ‘equity’ group in ‘non-traditional’ areas, such as engineering and information technology. Other equity groups include students with disabilities, Indigenous students, regional and remote students, non-English speaking background students who arrived in the last decade and low socio-economic status (SES) students.
0%
10%
20%
30%
40%
50%
60%
70%
80%
90%
1950 1957 1964 1971 1978 1985 1992 1999 2006 2013
Males
Females
Updated on 21/07/14 by BC

Mapping Australian higher education, 2014-15
Grattan Institute 2014 28
Table 3 reports educational participation or attainment of people aged 20-24, classified according to their parents’ occupational status. It shows that 15 per cent of the children of machinery operators, drivers and labourers are in higher education or have a degree. By contrast, 49 per cent of the children of managers and professionals are enrolled in or have completed higher education. Despite many exceptions, children tend to follow their parents. Their educational paths lead them to similar occupational outcomes.
Table 3: Level of highest education enrolment or attainment for 20-24 year olds, by parent’s occupation
Parent occupation
Highest qualification or enrolment of children (20-24)
Managers & professionals
Technicians & trade workers
Community, clerical & sales workers
Machinery operators, drivers & labourers
Bachelor degree or above 49% 23% 28% 15%
Certificate III - Advanced diploma 31% 42% 33% 31%
Year 12 12% 16% 18% 29%
Below Year 12 7% 19% 21% 27%
Note: Where parents had different occupations, the occupation requiring the highest skill level was used. Source: Based on ABS (2011)
Over the long term, higher education attainment has increased across all SES groups, high and low. For example, by 2001 the children of manual workers born in the 1970s had nearly five times the higher education attainment of the children of manual workers born in the 1950s. The higher education attainment level of children of ‘upper service’ workers increased by around two-thirds in the same time period.43 Rising demand for higher education has been experienced by all SES groups.
43 Marks and Macmillan (2007)

Mapping Australian higher education, 2014-15
Grattan Institute 2014 29
2.7 How are students chosen?
Every child has a right to a place at a public school. But universities do not accept everyone who wants to attend. Successful school completion is generally the minimum requirement. In the early 1950s, any school completer who applied to a university was accepted.44 As student demand grew more quickly than university funding, university places had to be restricted. Although the gap between demand and supply has narrowed in recent years (Figure 11), demand significantly exceeds supply for many institutions and courses. A system of rationing is needed.
Typically, places in over-subscribed courses are allocated based on prior academic performance. The better an applicant’s past academic results, the better their chance of being awarded a place. Several ideas lie behind the practice of academic ranking: that student places should be given to those most likely to complete; that student places should be given to those most likely to get high marks; that academic performance is a fair way of distinguishing between otherwise similar applicants; and that an admission system should minimise complexity and expense for both applicants and universities. These ideas do not always lead to the same conclusions about how to choose students.
44 Poynter and Rasmussen (1996), p 184-185
Figure 11: Unique applicants and offers, 2010-2013 Thousands of offers and applicants
Notes: This data counts applicants rather than applications. The same person can apply in more than one state, and both through tertiary admissions centres and direct to a higher education provider Source: Kemp and Norton (2014) .
0
100
200
300
400
2010 2011 2012 2013
Applicants
Offers

Mapping Australian higher education, 2014-15
Grattan Institute 2014 30
The most frequently used source of information on past academic performance is school results. Most domestic school leavers are admitted to university principally on their Australian Tertiary Admission Rank (ATAR).45 The ATAR ranks school leavers in their age cohort between 0 and 99.95. For example, an ATAR of 80 means that the student did better in year 12 than 80 per cent of their age cohort, including people who did not finish school. ATARs below 30 are just reported as ‘less than 30’. There is a strong relationship between ATAR and eventual completion of a course.46 ATAR is less successful at identifying which applicants will get high marks.47 Many students get higher marks at university than their school results would suggest, while many others get lower marks. For a given ATAR, students from non-selective government schools tend to get better university grades than students from private schools or government selective schools.48 School and university grades are influenced by many factors other than underlying academic ability. It is therefore not surprising that ATAR is an imperfect guide to university prospects.
The limitations of ATAR-based admissions are well-known in the higher education sector. In practice, higher education providers use ATARs in a flexible way. Where ATAR is used for selection there is typically a published ‘cut off’ or ‘clearly in’ rank above which every applicant receives an offer. However, many applicants are admitted below this rank. Some universities award 45 Formerly called ENTER in Victoria, UAI in NSW, and TER in other jurisdictions except Queensland, which kept its OP system. OP can be converted to ATAR. 46 Department of Education (2014b) 47 James, et al. (2009); Palmer, et al. (2011). 48 James, et al. (2009), chapter 3
‘bonus’ ATAR points for characteristics such as social background. Applicants can receive special consideration for personal circumstances such as health issues that may affect school results. At some universities, an undergraduate general admission test for school leavers, UniTest, supplements rather than replaces school result-based admission systems. Mature-age applicants can sit the Specialised Tertiary Admissions Test (STAT).49
About a quarter of commencing bachelor-degree students apply based on previous higher education study. These include students who attended pathway colleges that award undergraduate diplomas, students switching courses or universities, or students returning for a second degree. More than 10 per cent of applicants are admitted based on their vocational education qualifications or experience.50
For international students, universities set admission requirements based on home country school systems or international qualifications such as the International Baccalaureate.51 International students must also sit tests of English language proficiency.52
Most potential domestic students apply through centralised state tertiary admissions centres. About 55 per cent of these applications in the main summer applications period come from 49 For a study of STAT’s predictive value see Coates and Friedman (2010). 50 Kemp and Norton (2014), p 15 51 International students also enter university from Australian schools or after other preparatory study. 52 In the International English Language Testing System (IELTS), students need ratings described as ‘competent user’ or ‘good user’.

Mapping Australian higher education, 2014-15
Grattan Institute 2014 31
Year 12 students. Tertiary admission centre applicants list the courses they would like to do in order of their preferences. In effect, applicants simultaneously apply to multiple higher education providers and/or for multiple courses at the same provider. If the applicant does not receive their first preference course, they can still receive an offer for their second or a lower preference course. Across Australia in 2013, 52 per cent of all applicants received an offer for their first-preference course.53
A large number of people, more than 90,000 in 2013, apply directly to higher education providers.54 In recent years, direct applications to universities have grown more quickly than applications through tertiary admissions centres. This may reflect greater use of guaranteed pathways from other courses, and early admission opportunities that bypass the tertiary admission centres.55
University admission processes are sometimes criticised for overly emphasising academic factors. Higher education providers are academic institutions, but also gatekeepers to the professions. Content knowledge is important to being a successful professional, but there are also many other relevant aptitudes and attributes. As section 8.2.2 explains, employers often use non-academic criteria to select staff. Specialised admissions tests may help identify which applicants have the desired non-academic attributes. An example is the UMAT (Undergraduate Medicine and Health Sciences Admission Test) used by students applying for medicine at some universities. In
53 Department of Education (2013e), p 19 54 Ibid., p 45. 55 Norton (2014), p 17-18
other countries, interviews and personal essays are also widely used to assess applicants in a more broad-ranging way. This is not common for Australian undergraduate courses.
For applicants with high ATARs, it is unlikely that ATAR will be abandoned as a key selection tool any time soon. At these higher levels, ATAR successfully identifies applicants with a good chance of completing a course in a reasonable timeframe. By re-using school results, it is efficient for both universities and applicants. No alternative or additional selection tool has yet been found to more reliably predict future outcomes in a cost-effective way.
However, for applicants with low ATARs the issues are more complex. Significant proportions of people who enrol do not complete. These non-completion risks create dilemmas for universities. They want to create opportunities for higher education. However, taking students with poor completion prospects could be unethical, if there is high risk that the student will not benefit from their enrolment.56
56 These risks and possible policy responses are discussed in Kemp and Norton (2014), p 13-19.

Mapping Australian higher education, 2014-15
Grattan Institute 2014 32
3. The Australian higher education workforce
The Australian higher education workforce is growing. Although employment in higher education remains attractive to many people, finding long-term secure work can be difficult.
3.1 People employed in higher education
Australia’s universities employed just under 116,000 people on a permanent or fixed-term contract basis in 2013. Of these, 51,400 had academic job classifications and 64,400 non-academic job classifications. These statistics do not include casually employed staff. In 2010 an estimated 67,000 people were employed as casual academics.57 In the non-university higher education sector, 1,400 people had permanent or fixed term contract academic positions in 2013. Non-university higher education provider (NUHEP) casual academic staff numbers are not reported, but in 2012 they were nearly half the workforce on a full-time equivalent basis.58 In both NUHEPs and universities, more than half of all teachers are employed casually.
The total number of university employees has increased steadily since the late 1990s, as Figure 12 shows. Student numbers have grown more quickly, leading to more students per staff member.
57Department of Education (2013c), table 2.2; May (2011). This study used superannuation records to estimate numbers. The official statistics contain only full-time equivalent numbers of casual staff. 58 TEQSA (2014c), p 14-15
Figure 12: Number of permanent and fixed-term staff in universities, 1996-2013 Thousands of university staff
Source: Department of Education (2013c)
0
20
40
60
80
100
120
140
1996 1998 2000 2002 2004 2006 2008 2010 2012

Mapping Australian higher education, 2014-15
Grattan Institute 2014 33
On a full-time equivalent basis, just under half of university staff – 47 per cent – are employed in academic roles, teaching, researching or both (Figure 13 has staff numbers). Twenty per cent of university employees are faculty support staff, 19 per cent work in central administration (which includes building and grounds maintenance), nine per cent are in learning support services (such as libraries and computing centres), and three per cent work in student welfare services (such as health and counselling).
There is a common belief that non-academic staff are growing as a share of the university workforce.59 For on-going and fixed-term contract employees, non-academics’ share of the total workforce has been stable at around 57 per cent for the last 30 years.60 These statistics may not fully capture the effects of people with academic titles in primarily managerial roles.
59 Forsyth (2014), chapter 7 60 DEET (1993), p 137; Department of Education (2013c), table 1.2
Figure 13: Staff by area of university, 2012 Thousands of FTE staff
Notes: 2012 data used because it includes a count of casual staff. Most data is based on staff employed by area of the university. However data on staff functions has been used to calculate the number of non-academic staff in faculties and departments. Around 1,500 staff with academic classifications are employed in non-academic areas of universities. An unknown number of staff with academic classifications in faculties and departments are performing significant administrative roles, such as deans or heads of department. Depending on organisational structures, roles performed by ‘faculty support staff’ could be the same as those in other non-academic categories. Source: Department of Education (2013c); (2014h)
0
10
20
30
40
50
60
Aca
dem
ics
Facu
lty s
uppo
rt st
aff
Cen
tral a
dmin
istra
tion
Lear
ning
sup
port
staf
f
Stu
dent
wel
fare
se
rvic
es
Pub
lic s
ervi
ces

Mapping Australian higher education, 2014-15
Grattan Institute 2014 34
3.2 Entry into the academic workforce
Unsurprisingly, the main motivations for seeking academic work are intellectual. In a 2010 survey of Australian academics, more than 90 per cent agreed that opportunities for intellectually stimulating work, genuine passion for a field of study, and the opportunity to contribute to developing new knowledge drew them to academia.61 A survey of research students in the same year had similar findings. Developing knowledge and the interest and challenge of academic work were rated most highly as reasons to choose academic over other types of work.62
Over time, the PhD has become the most common qualification for an academic. In 1991, fewer than half of all academics had a PhD.63 By 2013 more than 70 per cent of academics had a PhD, and another 13 per cent had a masters degrees.64 Some academic staff are enrolled in but yet to complete research qualifications.65 More than 60 per cent of research students aspire to an academic job, although fewer see this as a realistic goal.66 Annual PhD completions reached 7,800 in 2013, compared to a net increase of only 1,000 on-going or fixed term contract academic jobs.67
61 Bexley, et al. (2011), p 13 62 Edwards, et al. (2011), p 39 63 DEET (1993), p 149 64 Department of Education (2013c) 65 Bexley, et al. (2011), p 41 66 Edwards, et al. (2011), p 22 67 Department of Education (2014a); Department of Education (2014h). Resignations and retirements mean that more than 1,000 academic jobs became vacant in 2013.
The legal standards universities must meet support the practice of preferring higher qualifications. Teaching staff must have a PhD or a qualification level above the course they are teaching, or equivalent professional experience.68 The latter exception recognises the subject matter expertise of people working outside universities, along with the insights professional practice can bring to teaching.
3.3 Short term academic work
Temporary academic jobs have become more common over time. The proportion of academics employed casually increased substantially in the 1990s, stabilised, and then started growing again (Figure 14). On a full-time equivalent basis, casual staff are a little over 20 per cent of the university academic workforce. Most academic casuals are teachers rather than researchers.
Casual academic employment has benefits. For students, casual teaching staff can offer expertise – often from professional practice – that full-time academics lack. About a quarter of casual academic staff are primarily oriented to work outside the university sector.69 For aspiring academics studying for a PhD, casual teaching work helps them financially and gives them experience relevant to their future careers. About half of casually employed academics are also students, mostly in PhD programs.70
68 DIICCSRTE (2013b), p 16 69 May, et al. (2013), p 264 70 Bexley, et al. (2011), p 38; Strachan, et al. (2012), p 59

Mapping Australian higher education, 2014-15
Grattan Institute 2014 35
Although casual academic employment has benefits, for aspiring academics low pay and job insecurity can produce frustration. Some academics have been employed casually for long periods of time. Of casual staff who responded to a 2010 survey, more than a quarter had been in their position for five years or more.71 A 2011 survey found that 21 per cent of casual teaching staff taught at more than one higher education institution.72 In part, casualisation reflects the unusual structure of universities. While some universities teach for most of the year (using trimester systems), most operate two main semesters. Their main teaching period runs for six months a year, with around two more months for exams.73 It is cheaper to hire teaching staff for actual teaching periods, rather than all year round.
71 Bexley, et al. (2011), p 38 72 Strachan, et al. (2012), p 61 73 It is common for summer or winter school subjects to be offered outside main semester periods, but the range is usually limited. Universities are able to charge full fees for these subjects, so they can be expensive for students.
Figure 14: Casual employment as a share of the full-time equivalent academic workforce, 1990-2012
Sources: May et al. (2013), DETYA (1999); (2000); Department of Education (2014h)
Universities extensively use fixed-term contracts for staff with regular hours. Across the system, 40 per cent of these staff were on fixed-term contracts in 2013.74 In part, this is because the major research agencies – the Australian Research Council and the National Health and Medical Research Council (section 5.2.4) – award project funding of only a few years.
74 Department of Education (2013c). A 2011 survey of academic staff found that 44 per cent were on a fixed-term contract: Strachan, et al. (2012), p 33
0%
5%
10%
15%
20%
25%
1990 1996 1998 2000 2002 2004 2006 2008 2010 2012
Updated by BC on 27/08/2014

Mapping Australian higher education, 2014-15
Grattan Institute 2014 36
Within universities, permanent academic appointments on a teaching and research or research only basis are seen as the ideal. But the way universities are organised and funded does not support this ideal. Chapter 5 explores funding issues in detail.
3.4 Pay and job satisfaction
For research students, pay is one of the few aspects of work life that they believe will be worse in academia compared to alternative careers.75 Academic salary ranges in 2014 are reported in Table 4. In practice, loadings are sometimes paid on top of these rates to make universities more competitive in the labour market. In a 2011 survey, 15 per cent of female and 22 percent of male academics reported receiving a loading.76
Table 4: Academic pay ranges, 2014
Rank Minimum Maximum Professor $154,000 $178,000 Reader/Associate Professor $119,000 $152,000 Senior Lecturer $99,000 $132,000 Lecturer $81,000 $111,000 Associate Lecturer $57,000 $89,000
Notes: There are ranges of salary associated with each rank as well as differences between universities. This helps explain why salaries for different levels can overlap. For associate lecturers (‘level A’) completion of a PhD leads to pay at a higher increment. Note: Employer superannuation contributions of 17 per cent are common. Source: University enterprise agreements
75 Edwards, et al. (2011) 76 Strachan, et al. (2012), p 56
Various surveys of academics since the early 1990s have shown issues with academic job satisfaction.77 In some surveys as few as half of academics are satisfied with their jobs. The most recent surveys found 58 per cent and 69 per cent satisfaction (curiously, 78 per cent of casual academic staff were satisfied).78 A 2013 survey of the general population found 75 per cent job satisfaction.79 Australian academics appeared less satisfied with their jobs than their peers in other countries.80
In Australia, statistical analysis of a 2007 survey of academics found that poor student quality was one factor contributing to low job satisfaction. Satisfaction with administration processes, institutional resources, and available research time all contributed positively to overall job satisfaction.81 Academics do not necessarily have greater problems with bureaucracy, resource constraints, and time pressures than other professionals. But they do expect to be allowed to pursue their own interests. The gap between that expectation and reality may contribute to low job satisfaction.
77 Bentley, et al. (2013b), p 30 78 Bexley, et al. (2011), p 68; Strachan, et al. (2012), p 39, p 63 79 Roy Morgan Research (2013) 80 Bentley, et al. (2013a), p 247 81 Bentley, et al. (2013b) , p 38-43

Mapping Australian higher education, 2014-15
Grattan Institute 2014 37
4. Research in Australian higher education institutions
Research is a key activity of universities. Without it, they could not use the ‘university’ title (section 1.3.1). The research workforce and research output have both increased significantly over the last 20 years. Research can be about advancing knowledge as an end in itself, aimed at particular problems or practical goals, or a mix of both.
4.1 How many researchers are there?
In 2013, 50,578 academics had a research or teaching and research function (figure 15). Since 2000, the number of researchers has grown every year, but with stronger growth among research-only academic staff compared to those with teaching and research responsibilities. Research-only staff made up 21 per cent of the academic workforce in 1992, increasing to 34 per cent by 2013.
The same period has seen a substantial increase in research students (Figure 16), who in effect make up a large proportion of the research workforce. Including overseas students, there were 62,471 research students in 2013. In that year, 7,787 PhDs were completed, along with 1,422 masters by research degrees.
Figure 15: Numbers of teaching and research, and research only staff, 1992-2013 Thousands of academic staff by responsibilities
Sources: Department of Education (2013c) and predecessor publications
0
5
10
15
20
25
30
35
1993 1995 1997 1999 2001 2003 2005 2007 2009 2011 2013
Teaching and research
Research only
Updated by NR
on 29/01/14

Mapping Australian higher education, 2014-15
Grattan Institute 2014 38
Figure 16: Enrolments in research degrees, 1979-2013
Thousands of students
Sources: DEEWR (2000); Department of Education (2014e) and predecessor publications
4.2 What is being researched?
Research spending is strongly skewed towards scientific disciplines, and medical science in particular. Medical and health research accounted for 29 per cent of higher education research spending in 2012, with other sciences together responsible for a
similar share of expenditure. About 11 per cent of research spending is on the humanities and social sciences.82
The sciences are also strong in research student enrolments. Twenty-two per cent of research students are enrolled in the natural and physical sciences, compared to only 13 per cent of undergraduate students. By contrast, only seven per cent of research students are enrolled in management and commerce, compared to 18 per cent of undergraduates. Data for these and other disciplines can be seen in Table 5.
Research is classified using OECD categories according to its approach to knowledge as well as its field. As Figure 18 shows, ‘pure basic research’, which is the pursuit of knowledge without looking for long-term benefits other than advancing knowledge, has declined as a proportion of all research spending since 1992. In twenty years it went from nearly 40 per cent of all research expenditure to 24 per cent. With total university research spending tripling in this period to $9.6 billion, however, basic research spending increased in real terms.83 The shift has been to applied research, a category covering research aimed at finding possible uses for basic research or new ways of achieving specific and predetermined objectives.
82 Based on sub-categories of the society and culture and creative arts fields. 83 ABS (2014b). Adjusted to 2012 dollars.
0
10
20
30
40
50
60
70
1979 1983 1987 1991 1995 1999 2003 2007 2011

Mapping Australian higher education, 2014-15
Grattan Institute 2014 39
Table 5: Research spending, research student and undergraduate student enrolments by broad discipline
Discipline Research spending (2012)
Research students (2013)
Undergraduate students (2013)
Natural and physical sciences 20% 22% 13%
Information technology 3% 4% 4% Engineering and related technologies 12% 14% 7%
Architecture and building 1% 2% 2% Agriculture, environmental 8% 4% 1%
Health 29% 14% 14% Education 4% 6% 7% Management and commerce 4% 7% 18%
Society and culture 15% 21% 25% Creative arts 4% 6% 9% Note: Spending based on field of research, students based on field of education (EFTSL) Sources: Based on ABS (2014b); Department of Education (2014h)
.
Figure 17: Research spending by type, 1992-2012
Source: Based on ABS (2014b)
4.3 What do research academics produce?
The growth in applied research activity shows in statistics on commercialisation activities by universities. ‘Invention disclosures’ – a notification of a novel and useful device, material or method to a university’s technology transfer office – increased by 192 per cent to nearly 1,300 between 2000 and 2011. The number of legally enforceable plant and breeder rights issued increased by a similar percentage, to 613. Yet the absolute numbers remain low, and the increase in potential commercial outputs has not
0%
20%
40%
60%
80%
100%
1992 1996 2000 2004 2008 2012
Experimental development
Applied research
Strategic basic research
Pure basic research

Mapping Australian higher education, 2014-15
Grattan Institute 2014 40
translated into clear long-term gains in financial returns. University revenue from licensing has averaged less than $100 million a year over the last decade. Revenue from consultancies and contracts was just over $1 billion in 2012, although it is not clear how much of this is related to research.84
The main research output is publications. Figure 18 shows there have been substantial increases in published books, articles and papers since the mid-1990s. Though increasing numbers of staff (Figure 15) and particularly research-only staff account for some of the increase, there has also been an increase in research paper productivity (section 8.3). How much money universities receive from government depends in part on how many publications their academics produce (see also section 5.2.4). Consequently, academics are under pressure to increase their publications. This ‘publish or perish’ system has been criticised for encouraging quantity over quality. Quality issues are discussed further in section 8.3.
Researchers receive substantial government support to produce these publications, yet their findings have rarely been accessible to taxpayers. Since 1 January 2013, researchers must submit all Australian Research Council (ARC) and National Health and Medical Research Council (NHMRC) supported research to an open access ‘institutional repository’ within twelve months of its publication.85 These changes are intended to maximise the benefits from research by disseminating it as broadly as possible.
84 Larkins (2011), p 218, DIISRTE (2011); Department of Education (2013b) 85 Links to the various institutional repositories can be found here: http://aoasg.org.au/open-access-repositories-at-australian-institutions/
Figure 18: Research publications, 1997-2012 Thousands of publications
Sources: Universities Australia (1995-2008); Department of Education (2014c)
0
5
10
15
20
25
30
35
40
45
1997 2000 2003 2006 2009 2012
Books
Refereed conference papers
Book chapters
Journal articles

Mapping Australian higher education, 2014-15
Grattan Institute 2014 41
5. Higher education finance – the macro picture
This section discusses the various sources of finance in the higher education sector, and the relationships between them. These include funding for teaching (both from government and from students), for research (competitive and performance-based), and income support for students.
5.1 Higher education as an industry
As participation in higher education has increased, it has become a more economically significant industry. In 2012, universities had revenue of $25.4 billion.86 This includes income from teaching, research and other sources. The total revenue of NUHEPs in 2012 was around $2.4 billion, but only $1.1 billion of this was from higher education.87 NUHEPs often have other business, including vocational education and English language courses.
Over the last twenty years, higher education has become a significant export industry. Publicly-funded universities earned around $4.1 billion from international students in 2012.88 The ABS reports revenue of $5.1 billion in 2013, including from private higher education providers.89 International students also contribute to other industries, through spending on living and other expenses while in Australia.
86 Bond University (2013); Department of Education (2013b) 87 TEQSA (2014c), p 19 88 Department of Education (2013b) 89 ABS (2014a), table 11.1
5.2 Public spending on higher education
Public spending on higher education takes four main forms:
x Direct grants to higher education institutions, primarily for teaching;
x Student loans which are taken out by students but paid to higher education institutions on students’ behalf;;
x Student income support payments, which are paid direct to students; and
x Direct grants to higher education institutions primarily for research.
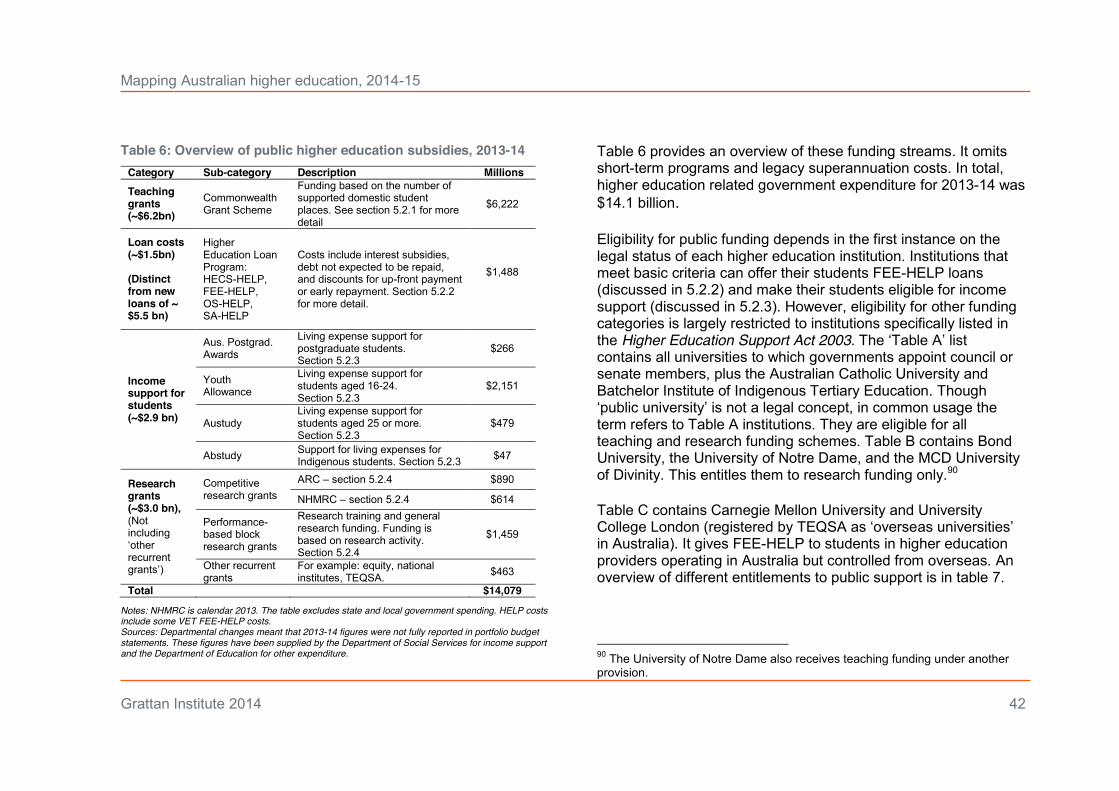
Mapping Australian higher education, 2014-15
Grattan Institute 2014 42
Table 6: Overview of public higher education subsidies, 2013-14 Category Sub-category Description Millions Teaching grants (~$6.2bn)
Commonwealth Grant Scheme
Funding based on the number of supported domestic student places. See section 5.2.1 for more detail
$6,222
Loan costs (~$1.5bn) (Distinct from new loans of ~ $5.5 bn)
Higher Education Loan Program: HECS-HELP, FEE-HELP, OS-HELP, SA-HELP
Costs include interest subsidies, debt not expected to be repaid, and discounts for up-front payment or early repayment. Section 5.2.2 for more detail.
$1,488
Income support for students (~$2.9 bn)
Aus. Postgrad. Awards
Living expense support for postgraduate students. Section 5.2.3
$266
Youth Allowance
Living expense support for students aged 16-24. Section 5.2.3
$2,151
Austudy Living expense support for students aged 25 or more. Section 5.2.3
$479
Abstudy Support for living expenses for Indigenous students. Section 5.2.3 $47
Research grants (~$3.0 bn), (Not including ‘other recurrent grants’)
Competitive research grants
ARC – section 5.2.4 $890
NHMRC – section 5.2.4 $614
Performance-based block research grants
Research training and general research funding. Funding is based on research activity. Section 5.2.4
$1,459
Other recurrent grants
For example: equity, national institutes, TEQSA. $463
Total $14,079 Notes: NHMRC is calendar 2013. The table excludes state and local government spending. HELP costs include some VET FEE-HELP costs. Sources: Departmental changes meant that 2013-14 figures were not fully reported in portfolio budget statements. These figures have been supplied by the Department of Social Services for income support and the Department of Education for other expenditure.
Table 6 provides an overview of these funding streams. It omits short-term programs and legacy superannuation costs. In total, higher education related government expenditure for 2013-14 was $14.1 billion. Eligibility for public funding depends in the first instance on the legal status of each higher education institution. Institutions that meet basic criteria can offer their students FEE-HELP loans (discussed in 5.2.2) and make their students eligible for income support (discussed in 5.2.3). However, eligibility for other funding categories is largely restricted to institutions specifically listed in the Higher Education Support Act 2003. The ‘Table A’ list contains all universities to which governments appoint council or senate members, plus the Australian Catholic University and Batchelor Institute of Indigenous Tertiary Education. Though ‘public university’ is not a legal concept, in common usage the term refers to Table A institutions. They are eligible for all teaching and research funding schemes. Table B contains Bond University, the University of Notre Dame, and the MCD University of Divinity. This entitles them to research funding only.90 Table C contains Carnegie Mellon University and University College London (registered by TEQSA as ‘overseas universities’ in Australia). It gives FEE-HELP to students in higher education providers operating in Australia but controlled from overseas. An overview of different entitlements to public support is in table 7.
90 The University of Notre Dame also receives teaching funding under another provision.

Mapping Australian higher education, 2014-15
Grattan Institute 2014 43
Table 7: Overview of funding eligibility
Funding Type Table A Table B Table C Other HE providers OUA^
FEE-HELP loans 9 9 9 9 9
Commonwealth supported places and HECS-HELP loans
9
9 (provided the place is in a ‘national priority’
category’)*
9 (provided the place is in a
‘national priority’ category’)* [none
in 2014]
9 (provided the place is in a ‘national priority’
category’)*
~ Indirectly
via universities delivering
award programs
Research block grants 9 9 8 8 8
Research training places 9 9 8 8 8
ARC competitive grants
9 9 8 8 8
NHMRC grants 9 9 9 8 8
Student income support 9 9 9 9 9
Notes:^Open Universities Australia; *Based on ministerial decision. Though NHMRC guidelines would permit Table C institutions to receive grants, none do. Access to Tables A, B or C is largely a matter of history and politics. There are no rules determining which institutions are on these lists. There is no application process. Inquiries and reform proposals over the last twenty years have repeatedly said it should be replaced with a system based on clear public policy
principles. This recommendation was made again in the recent review of the demand driven funding system by Andrew Norton (author of this report) and David Kemp.91 The government has accepted this recommendation, but as of October 2014 it is not clear whether it will receive Senate support. 5.2.1 Teaching grants for higher education institutions
The single largest source of public funds for higher education is the Commonwealth Grant Scheme (CGS). $6.4 billion was distributed through the CGS in 2014. As can be seen in table 7, public universities and their students have the main entitlements to CGS funding. The CGS is principally calculated according to the number of Commonwealth-supported places. One ‘place’ is equivalent to number of subjects normally taken by a full-time student. Equivalent full-time student load (EFTSL) has the same meaning as a place.
All disciplines are divided into eight funding ‘clusters’, each of which has its own Commonwealth funding rate (these rates and the separate student contribution rates are discussed in section 6.1). For each cluster, the number of Commonwealth-supported student places is multiplied by its funding rate. The total of these calculations for each funding cluster is the core CGS funding for higher education providers. Loadings paid out of the CGS can add to the total, but these are a small part of total spending.
The number of student places is therefore a key driver of total spending, in total and on each eligible higher education provider. Before 2012, the Government capped the number of 91 Kemp and Norton (2014)

Mapping Australian higher education, 2014-15
Grattan Institute 2014 44
Commonwealth-supported student places it would fund. From 2012, the number of bachelor-degree undergraduate Commonwealth-supported places is largely uncapped (section 6.2.1). This has had a significant effect on total CGS spending. These increases represent a substantial reversal of government policy. Between 1995 and 2003 operating grant funding (the CGS predecessor) dropped in real terms almost every year, as seen in Figure 19.
Though nominal total funding per student place, including both public and private contributions, was never cut, three factors explain these figures. Some public funding was replaced with private funding, via increases to HECS; from 1997, some places were cut, especially for postgraduate coursework; and an indexation system introduced in 1995 delivered funding increases that were below inflation levels.
Seemingly arcane matters like indexation are important for university finances. Small annual real cuts through the indexation system have a major cumulative effect on university income. In 2012, a new indexation system linked to inflation and labour costs was introduced. However, its positive effects on university finances could be brief. The Government proposes to replace the labour costs component with the usually lower consumer price index, and to impose a series of ‘efficiency dividend’ cuts.92
92 Commonwealth of Australia (2014), p 7; Higher Education Support Amendment (Savings and Other Measures) Bill 2013
Figure 19: Core teaching grant funding, 1989-2014 $2014 billion
Notes: Operating grant figures are used prior to 2005, less HECS charges. From 2005, the figures report total cash paid to universities. Due to reconciliations for over- or under-payments for the previous year’s enrolments, the annual payments in respect of each year may be slightly different to those shown here. Source: Data provided by the Department of Education.
5.2.2 Lending to students
Since 1989, the Commonwealth Government has lent higher education students money to pay for their courses. The loans are called income contingent because repayments depend on income levels. Students or former students who earn more than $53,345 pay a share of their income through the tax system each year until
0
1
2
3
4
5
6
7
1989 1994 1999 2004 2009 2014

Mapping Australian higher education, 2014-15
Grattan Institute 2014 45
the debt is fully paid off. The share is between 4 per cent and 8 per cent of their income, depending on how much they earn.93 A 2014-15 Budget proposal would reduce the initial threshold from 2016-17 to $50,638, requiring a repayment of 2 per cent of the debtor’s income.
The scheme was initially known as HECS (Higher Education Contribution Scheme). Since then, income-contingent loan schemes have proliferated, from 2005 named HELP (Higher Education Loan Program). The most direct descendant of the original scheme, HECS-HELP, lends money to pay student contributions – the student share of a Commonwealth-supported place.
The FEE-HELP scheme lends money to domestic full-fee students. OS-HELP helps finance overseas study by Australian students. SA-HELP supports a separate charge for student amenities. There is also a VET FEE-HELP scheme for upper-level qualifications in the vocational sector. All the money borrowed is consolidated into a single HELP debt managed by the Australian Taxation Office.
Income-contingent loans are an interesting solution to an old education finance problem. Most of the education industry has a client group – young people – without the means to pay for their own education. In some cases, their parents also lack the means to pay. Banks rarely lend on risky education investments – knowledge and skills cannot be repossessed – and charge high interest rates when they do. In all developed countries, governments have responded by subsidising education. 93 ATO (2014)
State-supported lending is an alternative to direct subsidy. Income-contingent loan schemes assume that most students have a cash flow problem, not a long-term affordability problem. These loan schemes differ fundamentally from commercial loan schemes because the repayments adjust to the debtor’s financial circumstances. Otherwise, they are conceptually similar to bank loans, spreading over time the cost of large expenses.
Figure 20: HELP debt (including fair value), 1989-2013 $2012 billion
Note: Deflated using CPI Sources: DIICCSRTE (2013a) and preceding publications.
0
5
10
15
20
25
30
35
1989 1993 1997 2001 2005 2009 2013
Total debt
Fair value

Mapping Australian higher education, 2014-15
Grattan Institute 2014 46
As Figure 20 shows, the amount of HELP debt outstanding has increased more than a hundred-fold since 1989. This reflects both more debtors and higher average debts. At 30 June 2013, HELP debtors owed the Commonwealth Government $30 billion. Over the last few years, the Government has published the HELP debt’s ‘fair’ value (shown in Figure 20). This is an estimate of how much the HELP debt is worth to the Government. At 30 June 2013, the HELP debt’s fair value was $21.7 billion, about $8.5 billion less than its nominal value.94 One reason for this write-down is that HELP debtors are subsidised by the Government. The Government borrows money in the bond markets, and re-lends it to students at the typically lower CPI inflation rate. The difference between the two numbers is a cost incurred by taxpayers. For 2013-14 this net interest bill is an estimated $250 million.95 Grattan has estimated the annual net interest bill on the HELP debt each year since 1994 (Figure 21). The interest cost is low for 2013-14 as the CPI is above its long-term average and the 10-year bond rate is well below its long-term average. The HELP debt’s fair value incorporates a write-down of $1.4 billion reflecting future interest costs before debt is repaid.
In the 2014-15 Budget, the Government proposed replacing CPI interest with its 10 year bond rate, capped at 6 per cent. This plan faces significant Senate obstacles.
94 DIICCSRTE (2013a), p 245 95 This figure is an estimate because the government does not specifically borrow for HELP. The notes to Figure 21 explain the assumptions behind this estimate.
Figure 21: Annual cost of HELP, 1993-2014 $2014 billion
Notes: Addition to doubtful debt calculations is the increase in doubtful debt since the previous year. Interest cost is calculated as the difference between ten-year Commonwealth bond rate and the indexation rate, multiplied by the level of outstanding debt. Loan fees include both FEE-HELP and VET-FEE-HELP, based on estimates of loan fee-liable lending. Deflated using CPI. Sources: Based on DEEWR (2012), annual reports for portfolios responsible for higher education, information supplied by the Department of Education.
The major reason for the debt write-down is debt not expected to be repaid, estimated at $7 billion at 30 June 2013. This is due to HELP debtors who die or move overseas before their debt is repaid. The proportion of the debt not expected to be repaid has
HELP costs
-$1
$0
$1
$2
1993 1996 1999 2002 2005 2008 2011 2014e
Addition to doubtful debts Interest costs
Up-front discount
Early payment bonus
Billions of dollars (FY$2014)
Loan fees

Mapping Australian higher education, 2014-15
Grattan Institute 2014 47
moved up and down over the years, reflecting varying actuarial estimates of future repayments. Figure 21 shows annual increases in doubtful debt as part of the cost of running HELP. For 2012 the Government assumed that 17 per cent of new HELP debt issued during 2012-13 would not be repaid.96 The Budget papers suggest that 23 per cent of new HELP debt will be doubtful in 2017-18. 97 The actual amounts written off each year are still small, but the anticipated long-term costs are high and rising.
As student numbers and fees increase, doubtful debt will become a more important issue. In 2014, a Grattan Institute report found that doubtful debt could be substantially reduced by recovering HELP debt from deceased estates valued at more than $100,000. Many lower-income HELP debtors are in affluent households because their partner’s income is high. This means that they are likely to have asset wealth despite low personal annual earned income. Ending the deceased estate write-off could reduce doubtful debt by up to two-thirds.98
HELP has become complex as new income-contingent loan schemes have been added. Most full-fee undergraduates – principally at NUHEPs – must pay a 25 per cent loan fee if they take out a FEE-HELP loan. For example, if a full-fee undergraduate student borrowed $10,000 the Government would record a debt of $12,500. The loan fee is a growing source of revenue for HELP (Figure 21). For undergraduate students receiving Commonwealth subsidies there is a 10 per cent
96 DIISRTE (2012a), p 64 97 Department of Education (2014d), p 76 98 Norton and Cherastidtham (2014)
discount for paying up-front, which converts to an 11 per cent charge for deferring.99 The Government compensates universities for the discount, which is expected to cost $27 million in 2014-15. The government plans to abolish both the loan fee and the discount for paying up-front. It also wants to end a 5 per cent bonus for early repayment. For example, if a HELP debtor repays $10,000 the ATO reduces outstanding debt by $10,500. A real interest rate would remove the need for a loan fee, and provide an incentive for paying up-front or early.
FEE-HELP borrowers have a lifetime limit on how much they can borrow (for 2014, $120,002 for medicine, dentistry and veterinary science; $96,000 for all other courses). The SA-HELP loan scheme for student amenities has a maximum annual loan of $281 in 2014 (the price limit on the student amenities fee). How much students can borrow under OS-HELP depends on circumstances, but is up to $8,500 for a six month period. Students can borrow twice under OS-HELP. There is no maximum loan under HECS-HELP.100 In the 2014-15 Budget, the Government proposed subsuming FEE-HELP into HECS-HELP and abolishing the maximum loan amount. As with other aspects of the Budget, its Senate fate is unclear as of October 2014.
5.2.3 Direct grants to students
Tuition subsidies and loans to students are paid direct to higher education providers on their behalf. For their living expenses, 99 For example, if a course costs $10,000 a year a 10 per cent discount would be $1,000, bringing the price down to $9,000. However, another way of looking at this is that the real price is $9,000, and that anyone who defers pays an extra $1,000, or 11 per cent more. 100 Department of Education (2014f)

Mapping Australian higher education, 2014-15
Grattan Institute 2014 48
some students receive additional government support. The biggest student income support scheme is Youth Allowance. On average about 170,900 higher education students received Youth Allowance in 2013-14, at a cost of around $2.1 billion.101
Students whose parents earn $48,837 a year (2012-13) or less are entitled to the full at-home Youth Allowance rate of $272.80 a fortnight. The fortnightly payment reduces as parents earn more than $48,837, or if the student earns more than $415 a fortnight. There are also twice yearly $1,025 lump sum payments to assist with textbooks and similar costs, and for relocation expenses for students who must leave home to study. The Government wants to convert the $1,025 lump sum payments to loans.
Youth Allowance recipients are not subject to the parental income test if they meet various criteria indicating independence from their parents or they turn 22. This makes students in high-income households eligible Youth Allowance, so long as their personal income is low.
Along with Youth Allowance, there are two other smaller income support programs. Austudy is for students aged 25 or older, and in 2013-14 cost an estimated $479 million for 31,800 students. Abstudy is for Indigenous students, and in 2013-14 cost an estimated $47 million for 4,200 students.
As well as these generally needs-based income support schemes, Australian Postgraduate Awards are merit-based scholarships for research students. They are funded by the Commonwealth Government but allocated by universities. In
101 Table 6 and Department of Social Services (2014), p 86
2013-14 the APA program will cost approximately $260 million, with up to 3,500 new scholarships awarded each year.
5.2.4 Grants for research
Universities receive two broad types of research grant. Project-based funding is awarded on a competitive basis. The money awarded needs to be spent on that project. Performance-based block research grants are driven by formulae including output indicators. ‘Block’ funding means that universities have discretion on its precise use, within the broad parameters of the funding scheme. Arguably, there is a third category of non-performance based block grant, discussed below. Though all universities are entitled to research grants, the Group of Eight or sandstone universities receive most research funding.
Competitive project grants
The Australian Research Council (ARC) and the National Health and Medical Research Council (NHMRC) are the main sources of competitive project funding. Eligibly for ARC grants is largely restricted to universities. Eligibility for NHMRC grants is broader, including medical research institutes and hospitals, but universities are the main recipients. Trends in ARC and NHMRC university funding are shown in Figure 22.
For universities, the significance of these competitive grants goes beyond the money they receive – especially as this never covers the full cost of the project. Their level of grant income contributes to their performance-based block research funding (see next section), both directly through block grant funding formulae and indirectly through increased research outputs. For academics and

Mapping Australian higher education, 2014-15
Grattan Institute 2014 49
their institutions, prestige as well as money is attached to winning competitive grants.
Figure 22: ARC and NHMRC grants to universities, 2000-2013 $2013 million
Sources: Department of Industry (2013) and predecessor publications, NHMRC (2013) and predecessor publication, communication from Department of Education.
Winning an ARC grant is difficult. Projects are assessed by academic experts in the relevant field, so that only the highest quality projects are supported. For Discovery Project grants, aimed at supporting excellent basic and applied research, about 20 per cent of the 3,534 applications for funding in 2014 were
approved.102 Funded projects receive between $30,000 and $500,000 a year for up to five years. Discovery grant criteria include the applying researchers’ track record in research publications and the research proposal’s quality, including whether it addresses a significant problem and will advance knowledge. Research topics covered by Strategic Research Priorities are favoured.103 Group of Eight universities won nearly 70 per cent of new Discovery Project money for 2014.
Linkage Projects seek to encourage collaboration between higher education providers and other organisations, including industry. The partner organisations are required to contribute to the project. Linkage grants reflect a Government emphasis on useful knowledge and universities contributing towards a ‘national innovation system’. These grants are one reason why research activity has shifted towards applied research (section 4.2). However, academics prefer less applied research topics. Many fewer apply for Linkage grants (fewer than 700 in 2014) than Discovery grants, despite their higher success rate – 36 per cent in 2014. Group of Eight universities also dominate this pool, securing about 60 per cent of new funding for 2014.104
For project grants, the largest pool of money administered by the NHMRC, the 2013 success rate of 17 per cent was lower than in previous years. The main criteria for assessing projects are scientific quality, significance and/or innovation, and the researchers’ track record in research output and impact. There is
102 ARC (2013) 103ARC (2014a). With a change of government in 2013, the status of these priorities is not clear. 104 ARC (2014b)
0
100
200
300
400
500
600
700
800
900
1,000
2000 2002 2004 2006 2008 2010 2012
ARC
NHMRC

Mapping Australian higher education, 2014-15
Grattan Institute 2014 50
no maximum amount of project funding, and projects can be funded for up to five years. The NHMRC also offers program funding for broad areas of health research expected to “contribute new knowledge at a leading international level”. As in other competitive grant areas, the Group of Eight universities dominate. They secured more than 80 per cent of grant payments in 2013.105
Performance-based block grants
Competitive research grants have been part of the Australian research funding system for a long time. An ARC predecessor was founded in the mid-1960s, and the NHRMC has antecedents going back to the 1920s. The long-term trend is towards allocating funding on a competitive basis. However policymakers have always seen block grants as an integral part of the research funding system. The two ways of funding research reinforce each other in ways that promote overall research performance.
Block grants help sustain research capacity for the competitive grant system. They provide indirect support for competitive grants, by helping to fund general research infrastructure such as laboratories and libraries that can be used in many different research projects. This encourages universities to invest in infrastructure with multiple uses. Block funding also permits a practice of not funding 100 per cent of any funding application, on the assumption that part of the cost will be met from block grants.
105 NHMRC (2013)
Block grants are widely regarded as too low to cover all the indirect costs associated with competitive grants.106
Block grants can also help build the future research workforce. Though the ARC and NHMRC have schemes for early-career researchers, proven track records of quality research are a major factor in awarding the main project funds. Research funds untied to particular projects let universities invest in researchers with potential but without a substantial track record. As well as developing research careers, unrestricted research funding gives universities scope to develop their own research direction and priorities. They can advance ideas or fields that the competitive funding bodies won’t support. At the same time, the hope of winning future competitive research grants means that universities are most likely to back proposals that have a prospect of eventually receiving competitive funding.
The most flexible block research grant is the Joint Research Engagement Program, which dispersed $332 million in 2013-14.107 It can be used to support any activity related to research. Its performance drivers are research student load, publications and research income, excluding money from competitive grants.
The Sustainable Research Excellence (SRE) program supports the indirect research costs associated with competitive grants. In 2013-14, it provided $170 million. It has a complex funding formula including competitive grant income and performance in the Excellence in Research for Australia (ERA) assessment (there is more detail on ERA outcomes at section 8.3).
106 Larkins (2011), p 263-267 107 Block grant spending for 2013-14 provided by the Department of Education.

Mapping Australian higher education, 2014-15
Grattan Institute 2014 51
Research infrastructure is supported by the Research Infrastructure Block Grant scheme (RIBG), which received $224 million in 2013-14. Institutional funding levels are determined by their share of competitive research grant income.
Entry into a research career typically requires a PhD, and the Research Training Scheme (RTS) is the major block funding supporting domestic research students. In 2013-14, it provided $672 million to support domestic students enrolled in doctorates and masters degrees by research. The major performance driver of institutional funding (50 per cent) is research qualification completions, reflecting policy concerns about high attrition rates from research degrees. As with most research performance measures, completions tend to support the status quo – institutions with large numbers of research students are likely to have large numbers of completions. The other RTS performance drivers are research publication and income, indicators of the general research environment at the university.108
In the 2014-15 Budget, the Government announced cuts to the RTS, while giving universities the option to charge price-capped fees to research students. Currently, RTS students do not pay for their courses. As of October 2014, it is not clear whether this policy change will secure Senate approval.
Non-performance based research funding
Until the Commonwealth Grant Scheme began in 2005, funding for teaching was explicitly intended to also cover some research costs. CGS payments are based on student numbers, but the
108 DIISRTE (2012b)
legislation does not specify how the money is to be used. In practice some CGS money is spent on research. The 2011 final report of the higher education base funding review suggested that 6-10 per cent of teaching-driven funding should be “associated” with maintaining research capability.109
Non-performance based research grants are an important issue in Australian higher education policy design. Most permanent academic staff are employed to teach and to research (section 4.1), but the combined teaching-research staffing model is not supported by funding policy. Teaching staff requirements reflect student choices by institution and field of study. Yet the main research funding schemes are awarded on criteria that are unrelated to undergraduate student numbers. Funding policy drives teaching and research in divergent directions. One consequence of this is the increase in teaching staff employed on a casual basis (section 3.3).
In the 2014-15 Budget, the Government proposed funding non-university higher education providers at 70 per cent of the Commonwealth contribution rate (discussed in section 6.1.1). This discount was to reflect the fact that NUHEPs do not have legal research and community engagement obligations. No rationale was given for the size of the discount.
5.3 Private spending by students
Private higher education spending by students has increased its share of total university revenue since the mid-1990s, although it has trended down over the last few years (Figure 23).
109 Lomax-Smith, et al. (2011), p 258-267

Mapping Australian higher education, 2014-15
Grattan Institute 2014 52
Direct fee payments and student contributions, mainly from international students, were 13 per cent of total public university revenue in 1997 of $12.9 billion, but 21 per cent in 2012, out of a total of $25.4 billion.110 For the public universities, HELP income increased from 12 per cent to 14.5 per cent of university revenue between 1997 and 2012. In 2012 dollar terms, HELP income more than tripled over the period 1996-2012, to $3.7 billion. As explained in section 5.2.2, subsidies to the loan scheme mean that not all HELP lending should be counted as private expenditure.
The Government has proposed reducing public subsidies and allowing universities to set their own student contributions. These are discussed in the next chapter. If enacted, these would substantially increase the proportion of university revenues coming from students.
110 Department of Education (2013b)
Figure 23: Proportion of universities’ revenue paid by students, 1997-2012
Note: Does not include ‘other fees and charges’ Source: Department of Education (2013b), various years
0%
5%
10%
15%
20%
25%
30%
35%
40%
1997 2000 2003 2006 2009 2012
Up-front fees & contributions (domestic)
Student loans
Up-front fees (international)

Mapping Australian higher education, 2014-15
Grattan Institute 2014 53
5.4 Public and private spending over the long run
Over the long run, total public spending on higher education has increased in most years. From the perspective of universities, it has two distinct phases over the last 70 years, as seen in Figure 24. Up until the late 1980s public funding complemented and then replaced income from students. From that period private funding grew more quickly, due to the introduction of HECS and full-fee courses, especially for international students. Despite the growth of private funding, universities remain reliant on government. In recent years, around 60 per cent of university cash flow – counting both grants and HECS or HELP revenue – has come from government. The government share is trending up as domestic student numbers increase and revenue growth from international students slows.
Figure 24: Public and private spending shares of universities, 1939-2012
Note: Upfront student payments include fees and HECS or student contribution payments. Sources: DEET (1993); Department of Education (various years)
0%
20%
40%
60%
80%
100%
1939 1951 1961 1971 1981 1990 1995 2000 2005 2010 2012 Other income Investments, donations Upfront student payments State Government Commonwealth Government HELP/HECS loans Commonwealth Government grants

Mapping Australian higher education, 2014-15
Grattan Institute 2014 54
6. Higher education finance – the micro picture
This chapter investigates the financing arrangements at the micro level of how resources are allocated to students. It discusses how policy and history influence funding levels for Commonwealth-supported student places. It explains how student places are distributed between higher education providers.
6.1 Funding per student
6.1.1 Commonwealth-supported students
A ‘Commonwealth-supported student’ is somebody who receives a tuition subsidy under the Commonwealth Grant Scheme (section 5.2.1). They must also be charged a student contribution amount. The student can pay their student contribution directly to their university or borrow it under the HECS-HELP scheme (section 5.2.2). If students borrow under HECS-HELP, the Commonwealth Government pays the money to the university on their behalf.
Commonwealth and student contributions are both based on the unit of study, or subject. They differ according to field of study. There are eight Commonwealth contribution amounts and four student contribution amounts. Table 8 lists fields of study and their funding levels, expressed as the rate for a full year of study.
These rates reflect history and political compromises. A study of higher education expenditure from the late 1980s is the single biggest influence on the total per student amount. Its purpose was to adjust funding rates in a new ‘unified’ system after higher
education colleges became universities (section 1.3.1). A ‘relative funding model’ was devised, with disciplines funded by a ratio from a base. For example, a nursing place was funded at 1.6 times the base of accounting and law.111 Though these funding relativities were intended to be a transitional measure, they were brought back in 2005. Whether costs had changed in the intervening 15 years was not initially investigated, though after a limited university expenditure study by an economic consultancy,112 some disciplines received increased government funding in 2008.
In 2005, universities were also given the power to set student contributions, up to a legislated maximum. They could keep the money (previously, HECS went to the government). For most disciplines, the maximum was 25 per cent more than the previous HECS rates (for new students enrolling from 2005). There was no science to this particular percentage; it was a political compromise to get the higher education reform bills through the Senate. With little student price sensitivity evident in applications or enrolments, the maximum student contributions quickly became a standard price charged by all universities.
111 For the background, see DEEWR (2010) p 24-26. 112 Access Economics (2007)

Mapping Australian higher education, 2014-15
Grattan Institute 2014 55
Table 8: Contributions for a 2014 Commonwealth-supported place (student taking out HELP loan)
Discipline Commonwealth Student Total Law, business, economics $1,990 $10,085 $12,075 Humanities $5,530 $6,044 $11,574 Mathematics, statistics $9,782 $8,613 $18,395 Computing, other health $9,782 $8,613 $18,395 Behavioural sciences $9,782 $6,044 $15,826 Journalism $12,031 $6,044 $18,075 Social studies $9,782 $6,044 $15,826 Built environment $9,782 $8,613 $18,395 Education $10,178 $6,044 $16,222 Clinical psychology, foreign languages $12,031 $6,044 $18,075 Visual and performing arts $12,031 $6,044 $18,075 Allied health $12,031 $8,613 $20,644 Nursing $13,432 $6,044 $19,476 Engineering, science, surveying $17,104 $8,613 $25,717 Dentistry, medicine, veterinary medicine $21,707 $10,085 $31,792 Agriculture $21,707 $8,613 $30,320
Notes: If students pay their student contribution up-front they get a 10 per cent discount. The government pays the value of the discount to the student’s university. In these cases, the government’s share of total contributions is larger than shown in this table. Legislation to remove the discount has as at September 2014 failed to pass the Parliament. The student contributions listed in the table are the maximum that universities can charge, as legislated in the Higher Education Support Act 2003. They may charge less than this amount if they choose, but in practice this rarely occurs. There is legislation before the Parliament to reduce the Commonwealth contributions by an efficiency dividend. This has as at September 2014 failed to pass the Parliament.

Mapping Australian higher education, 2014-15
Grattan Institute 2014 56
In the May 2014 Budget, the Government proposed significant changes to the system of funding Commonwealth-supported places. On average, it would reduce Commonwealth contributions by 20 per cent. However, some disciplines would be cut by more than this, while others would be increased. The new rates were to align funding for disciplines with similar teaching methods. Humanities, social science and journalism courses were allocated to the same rate, instead of the current very different rates (see Table 8). Most universities oppose these changes.
The government also announced that it would remove the maximum student contribution amounts. This proposal is also facing significant political opposition.
6.1.2 Full-fee paying students
In contrast to Commonwealth-supported students, full-fee paying students are lightly regulated. There is a floor price for international students, intended to ensure that they pay their own way. However, there is no legal ceiling on the fees universities can charge international students or domestic students in full-fee markets. Only market forces regulate maximum fees.
Figure 25 shows average fees charged to international students taking bachelor degrees in 2014, along with the maximum and minimum fee charged. As can be seen, students can pay twice as much to attend the most expensive university. Generally, universities earn more from an international student than a domestic student. However, some universities set fees for international students that are below the combined Commonwealth and student contributions reported in Table 8.
Figure 25: International student bachelor degree fees, 2014 $
Notes: Course fees were based on comparing similar courses at different universities. Fees are indicative. Source: University websites 6.1.3 Spending per student
Although we can identify most revenue coming to public universities from teaching (sections 5.2.1, 5.2.2, and 5.3), spending on students is not easily calculated. There are inherent difficulties in making these calculations. The same staff and facilities are used to produce teaching, research and community engagement. Time and facility use surveys can allocate some
0
5,000
10,000
15,000
20,000
25,000
30,000
35,000
40,000
45,000
Edu
catio
n
Arts
Com
mer
ce
IT
Nur
sing
Law
Sci
ence
Eng
inee
ring
Arc
hite
ctur
e
Agr
icul
ture
Average

Mapping Australian higher education, 2014-15
Grattan Institute 2014 57
costs among activities, but not all expenditures can be neatly classified in this way. Assumptions need to be made, which may inflate or deflate teaching costs.
The 2011 Higher Education Base Funding Review: Final Report published some data on costs per student place relative to funding. The review panel found that median undergraduate teaching and scholarship costs were below funding rates in eight of ten broad fields of study (though at least one university had costs above funding in each of the ten). The average cost on this basis was around $15,000 per EFTSL. However, if research costs are included then total costs exceed revenue in nine of ten broad fields of study. The average cost including research was around $19,600 per EFSTL.113
The observed behaviour of public universities suggests that average funding for Commonwealth-supported places is sufficient, at least on a teaching-only cost basis. Public universities voluntarily enrolled an additional 100,000 Commonwealth-supported students between 2009 and 2012.114 However, universities need to avoid taking on significant research expenses to ensure costs stay within revenues. As noted in section 3.3, casual employment has become common in academia. Casual and short-term teaching-only jobs are much cheaper for universities than full-time teaching-research positions.
113 Lomax-Smith, et al. (2011), p 48-50. Research costs were research not funded by a specific source of research funding, such as the grants described in section 5.2.4. 114 Kemp and Norton (2014), p 34
Another factor explaining additional enrolments may be low marginal costs. This is the cost of an extra student. The marginal cost could be modest when students can be placed in existing infrastructure and classes that are being offered in any case. However, the marginal cost can be high when the additional student requires more teaching staff or significant new infrastructure.
Universities always claim to be under-funded, but it is difficult to evaluate whether this is true, and if so by how much. The problems are partly conceptual – to what extent should research be funded through teaching, and what standard of course delivery is acceptable? And the problems are partly evidential – how should costs be calculated, and what assumptions should be made about reasonable costs?
6.1.4 Internal allocation of funding
Universities are not obliged to spend teaching revenues in the disciplines or departments that earned them. The funding rates reported in table 8 above are not recommended internal funding rates. At least until the demand-driven funding system discussed in section 6.2.1 below, these rates were essentially used to calculate a block grant, a total sum of money paid to each university. With a block grant, universities can design internal funding systems reflecting their own costs and priorities. The federal funding system has no capacity to adjust per-student rates to institutional differences, but it can and does permit universities to make those adjustments in how they spend their money.
Despite weaknesses in the way funding rates for Commonwealth-supported students are derived, universities tend to use these

Mapping Australian higher education, 2014-15
Grattan Institute 2014 58
rates in their own internal budgets. Some disciplines or departments are allocated more money than they earn for the university. But when this occurs, they are typically described as losing money or receiving cross-subsidies from profitable parts of the university. If costs cannot be contained or other revenues found, ‘loss-making’ areas risk closure. So in practice Commonwealth-funding rates can drive university behaviour more than policymakers originally intended.
6.2 Distributing student places
A higher education system needs a system of distributing student places. Places have to be allocated to higher education providers, disciplines and students. The two broad theoretical models are central allocation and market distribution.
In a central allocation model, the government determines priorities and allocates the student places it funds accordingly. Priorities could be for particular disciplines, particular higher education providers, or particular types of students. While students cannot be forced to take the places created under government-priority setting, the system limits their opportunities. People who want a university place eventually have to take what is available. Priority setting can be supported by student incentives, such as scholarships or lower fees.
In a market distribution model, the government does not set priorities. Higher education providers decide what courses they will offer students, and students decide whether or not to purchase the courses at the fees charged. This is the model that largely applies for international students, for much of the domestic postgraduate market, and among the non-university higher
education providers (NUHEPs – see chapter 2).
Compared to a system of central allocation of student places, a market system gives students much more power. Higher education institutions have stronger incentives to respond to student preferences, and to concentrate on the quality of teaching. However, market systems depend on students paying full fees. This may reduce total demand for higher education, especially from lower-income households. It could also mean students do not choose courses that have low private benefits but provide broad social or economic benefits.115
A higher education ‘voucher’ scheme combines market mechanisms and public subsidies. Under this model, the government broadly steers the higher education market, using subsidies to make higher education generally or particular disciplines more financially attractive. However, higher education providers still have to compete for students. Voucher schemes may have literal vouchers – documents sent to prospective students that they can redeem at higher education providers. However, eligible students can usually be identified through alternative means, such as citizenship or prior academic results.
6.2.1 Distributing Commonwealth-supported places
Historically, Australia used a version of the central allocation system. From the mid-1970s, the Commonwealth Government distributed student places among public higher education providers. The government was not usually an activist central planner. Within overall target enrolment levels and funding
115 See Norton (2012a) for a detailed discussion of this argument.

Mapping Australian higher education, 2014-15
Grattan Institute 2014 59
envelopes, universities had the most influence over what courses were offered. The government’s main mechanism for steering the system was through funding new higher education places. The allocation of new places was sometimes very prescriptive, down to specific courses and campuses. However, new places were only ever a small percentage of total Commonwealth-supported places.
Central allocation meant that universities could plan around predictable public funding levels. This gave the system stability, but weakened competitive pressures. Universities had few financial incentives to attract additional students. For a few years in the mid-2000s, universities were penalised if they exceeded enrolment targets set out in funding agreements with the Goverment by more than 5 per cent. With demand exceeding the supply of student places, each publicly-funded university had a virtually guaranteed share of total enrolments.
In 2009, the Government announced that it would phase in a ‘demand-driven’ funding system. For 2010 and 2011, universities would be paid Commonwealth contributions up to 10 per cent more than the amount specified in the funding agreements (section 6.1.1 for per-student funding rates). For all additional Commonwealth-supported students, universities would be paid the student contribution amount. This policy change encouraged universities to enrol more domestic students. By 2011, some universities had enrolments exceeding their funding agreement target by more than 20 per cent.
In 2012 the new ‘demand-driven’ funding system commenced. It represented a major shift away from the central allocation model to the voucher model. Most caps on the number of
Commonwealth-supported bachelor-degree places at public universities were lifted, with the exception of medical places. The enrolments in each public university, along with the system as a whole, could now move up and down in line with student demand.
The demand-driven system is not a full voucher system. Commonwealth supported medical places, postgraduate places, and sub-bachelor places (diploma, advanced diploma, associate degree – see section 1.1) are still allocated centrally. Nevertheless, the publicly-funded university system is now much more competitive. Student choices have real and major financial consequences for universities.
6.2.2 Operation of the demand-driven system
A demand-driven system should increase responsiveness to student preferences. At the field of study level, Australia has long had imbalances between demand and supply. Health places have been chronically under-supplied relative to student demand, particularly in medicine. By contrast, places in science courses have been chronically over-supplied relative to demand.
Since 2009 supply has moved closer to demand. The proportion of applicants receiving an offer increased from 77 per cent in 2009 to 82 per cent in 2013. In most fields of education, applicants became more likely to receive an offer (Figure 26), although offer rates are still low in high-prestige health courses. The proportion of applicants receiving an offer for their highest preference course has changed little, at 52 per cent in 2013. This number is lower than Figure 26 might suggest, because of second or lower preference offers. For example, someone whose first preference was engineering at one university could be offered an

Mapping Australian higher education, 2014-15
Grattan Institute 2014 60
engineering course at another university. This person is matched by field of education but not by university.
6.3 Reform of the demand driven system
In November 2013, Andrew Norton (author of this report) and David Kemp were appointed by the Government to review the demand driven system. They recommended the inclusion of sub-bachelor courses in the system. They also recommended that private universities and NUHEPs become eligible for demand driven funding.116 Both these recommendations have been accepted by the Government, although as with other Budget measures it is not clear whether they will receive Senate support.
116 Kemp and Norton (2014)
Figure 26: Field of study offer rates, 2009 & 2013
Note: Offer rates can exceed 100 per cent as applicants may receive offers for a second or lower preference. Sources: DEEWR (2009); Department of Education (2013e)
0% 50% 100%
Medical studies Veterinary
Dental Health
Architecture and building Creative arts
Nursing Education
Health other Engineering
Management & commerce Information technology
Society and culture Ag. and related studies
Natural and physical sciences
2009 2013

Mapping Australian higher education, 2014-15
Grattan Institute 2014 61
7. Higher education policymaking
Higher education policymaking has become increasingly centralised in Canberra. This chapter reviews the major higher education policymakers and the interest groups that try to influence policy.
7.1 The rise of Commonwealth authority
Australian higher education began as a state responsibility. Except in its territories, the Commonwealth Government had no constitutional power to establish a higher education institution. Prior to the Australian National University Act in 1946, this power had never been exercised. All other universities except one were created by state legislation (the Australian Catholic University was established under company law). There was no federal minister for education until 1966.
While the states had full responsibility for education in Australia’s early decades, after World War II the Commonwealth slowly increased its policy involvement in higher education.117 A 1946 amendment to the Australian Constitution authorised the Federal Government to make laws with respect to ‘benefits to students’. This remains the only reference in the Australian Constitution to education, albeit an indirect one. The main constitutional vehicle for funding higher education was through conditional grants to the states. This was replaced in 1993 with direct grants to universities.
117 See Forsyth (2014), especially chapter 3.
The Commonwealth’s control of money gave it significant power in higher education, but in law it was a limited power. The rules it imposed were conditions of grants, not laws that had to be followed. Until recently the private higher education sector received no money from the Commonwealth, and so was free of Commonwealth control, other than general laws applying to all. The public universities could, in theory, decline a Commonwealth grant and its associated conditions. In practice, universities have generally accepted whatever funding conditions the Federal Government set. This willingness by universities to accept conditions attached to grants allowed the Commonwealth to leverage its limited legal position into extensive control.
From the 1950s to the 2000s the Commonwealth bought power over existing higher education providers through conditional grants. However, it could not regulate the establishment of new higher education providers or the accreditation of courses. That remained a matter for the states. However, in the 2006 WorkChoices case the High Court took an expansive view of the Australian Constitution’s corporations power. As higher education is largely delivered by organisations, including universities, that are legally corporations (as opposed to state government instrumentalities or partnerships), the Federal Government has now used the corporations power to take higher education accreditation and quality control from the states. The Tertiary

Mapping Australian higher education, 2014-15
Grattan Institute 2014 62
Education Quality and Standards Agency (TEQSA) replaced the state higher education accreditation bodies in 2012.118
The states still have university establishment acts on their statute books, and impose various reporting and accountability requirements on universities. The states still have a legal right to be consulted about new higher education providers in their jurisdictions. They are still expected to fund special projects at universities within their borders. However, on the key higher education policy matters the states have a minimal role.
TEQSA is the first sign of a new higher education policymaking paradigm. The Commonwealth can now mandate rather than buy compliance. It exposes all higher education institutions to Government control of their core academic activities. Private as well as public higher education institutions could find their fees regulated. Centralisation offers new efficiencies, but also new risks.
With all important aspects of higher education policy now set by the Commonwealth Government, the relevant ministers and departments are more critical than ever to the success of Australian higher education.
7.2 Commonwealth departments and agencies
7.2.1 The Department of Education
Higher education is primarily the responsibility of the Department of Education. It has responsibility for the major teaching and
118 For more detail on the legal issues see Williams and Pillai (2011).
research block grant funding schemes described in chapters 5 and 6. It also has over-arching policy responsibility for tertiary education standards (discussed below).
The Minister for Education since September 2013 is Christopher Pyne. As noted in earlier chapters, he is pursuing a major reform agenda in higher education. The Labor shadow minister is Senator Kim Carr.
7.2.2 Higher Education Standards Panel
Under the TEQSA legislation the higher education minister performs the key policy making function, setting threshold standards applying to higher education providers under the Higher Education Standards Framework. These key threshold standards cover higher education provider registration, course accreditation, and qualifications. These need to be met to offer courses leading to higher education awards.
A Higher Education Standards Panel appointed by the minister is responsible for developing and advising the minister on the content of the standards. Before making a standard, the minister needs to consult state education ministers and TEQSA. As of September 2014, the Higher Education Standards Panel is well advanced in a review of the standards.
The concentration of power to set standards in the Commonwealth education minster is unprecedented in Australia. This education minister has more power over universities than any state education minister had prior to the TEQSA legislation, and without the jurisdictional constraints of the federal system.

Mapping Australian higher education, 2014-15
Grattan Institute 2014 63
7.2.3 Tertiary Education Quality and Standards Agency
TEQSA began operations in early 2012. Its main task is to apply and enforce the TEQSA legislation and the Higher Education Standards Framework. The legislation states that in exercising its powers TEQSA should comply with the principle of regulatory necessity, should reflect the risks involved, and regulate proportionately to the risks. These principles were intended to acknowledge the history of university autonomy, which were otherwise substantially diminished by the legislation.
TEQSA registers higher education providers and approves courses offered by non-self-accrediting institutions (chapter 1). It uses a range of risk indicators to monitor higher education providers, in addition to the specific processes around the registration or re-registration of a higher education provider or the accreditation of re-accreditation of a course. As well as ensuring that minimum standards are met, TEQSA can conduct quality assessments. These can be used to provide guidance on good practice.
TEQSA has substantial operational independence from the minister. This protects against political favours or disfavours to particular higher education providers. In that respect, it avoids the perceptions of unfair treatment of particular higher education providers and their students created by funding policy (section 5.2).
The way TEQSA went about its job during its first eighteen months attracted considerable criticism. It required more information from higher education providers than they thought necessary, given the original intention to focus attention on the
areas of highest risk. These concerns led the previous Labor government to commission a review.119 Its recommendations informed the current Liberal government’s TEQSA reform legislation. Among other changes, the amending legislation aims to focus TEQSA on standards compliance rather than quality development. The Government also plans a substantial reduction in TEQSA’s funding.
As of September 2014, the TEQSA reform legislation was still contentious and had not been passed.120
7.2.4 The research grant agencies
The two main competitive grant research agencies are the Australian Research Council (ARC) and the National Health and Medical Research Council (NHMRC) (section 5.2.4). They report to the education minister Christopher Pyne, and the health minister, Peter Dutton, respectively.
The ARC and NHMRC both work within broad policy frameworks established by the Government, with priorities set by the relevant ministers. However, specific research grants are awarded independently of the minister. The ARC and NHMRC both use systems of peer review to determine which applications are successful. This respects the culture of universities (section 1.3).
The media sometimes question ARC-funded projects with seemingly obscure, trivial or politicised topics. Academics sometimes claim that the peer view process leads to favouritism
119 Lee Dow and Braithwaite (2013) 120 Senate (2014)

Mapping Australian higher education, 2014-15
Grattan Institute 2014 64
(to the detriment of the complainant’s application). Yet overall the ARC and NHMRC enjoy high esteem. The most widespread criticism is that given low application success rates, resources are wasted preparing and assessing applications that are rejected.
7.2.5 The Chief Scientist
The Chief Scientist for Australia advises the Prime Minister and other ministers on science, technology and innovation. The current Chief Scientist, Professor Ian Chubb, has given the office new profile and influence.
7.2.6 Department of Immigration and Border Protection
The Department of Immigration and Border Protection has a major influence on Australian higher education. It controls eligibility for student visas, and the post-study temporary and permanent migration programs that attract international students to Australia. The current minister is Scott Morrison.
In 2009 several changes to student visa requirements and to post-study migration rights contributed to weakening demand from international students for Australian higher education. The rules were changed again in 2012. Students who applied for a visa after 5 November 2011 have an automatic right to work for a period following completion of their degree. This ranges from two to four years depending on the qualification.121 Before this period ends, they must apply for a further visa such as an independent
121 Department of Immigration and Border Protection (2014b)
skilled migration visa or employer sponsorship visa if they wish to remain in Australia.122
These changes have contributed to an increase in demand for higher education from international students, as measured by visa applications and grants.123
7.3 Higher education interest groups
There are higher education interest groups representing universities, private higher education providers, higher education staff, and students.
7.3.1 University interest groups
The oldest university interest group is Universities Australia, formerly known as the Australian Vice-Chancellors’ Committee (AVCC). All 37 public universities, along with Bond University and the University of Notre Dame, are members of Universities Australia. In the 1990s, the AVCC struggled to represent the diverging interests of its members, especially on research policy and fees for domestic students. A number of new university organisations have been formed since 1999 to give voice to the different perspectives within the university sector. These include the Australian Technology Network which includes all the universities of technology except Swinburne; the Group of Eight,
122 Examples of sponsored visas are the Temporary Work (Skilled) visa (subclass 457), Employer Nomination Scheme (subclass 186) or Regional Sponsored Migration Scheme visa (subclass 187). Without sponsorship’ means not sponsored by an employer, state or territory, or a family member. For example a Skilled Independent (subclass 189) visa. 123 Department of Immigration and Border Protection (2014a), p 20, 30

Mapping Australian higher education, 2014-15
Grattan Institute 2014 65
representing the eight most research-intensive universities; Innovative Research Universities, mostly made up of suburban research-intensive universities founded in the 1960s and 1970s; and the Regional Universities Network, which represents six regional universities. Full membership lists of the university interest groups are in Appendix A.
7.3.2 Private higher education interest groups
The largest private higher education interest group is the Australian Council for Private Education and Training. Its members are involved in all levels of post-compulsory education. The smaller Council of Private Higher Education represents only higher education providers. Both organisations have lobbied for more equal treatment of public and private higher education provision. The Government’s decision to pursue this policy is a significant shift for these interest groups.
7.3.3 Staff and student interest groups
The major union representing university staff, the National Tertiary Education Union (NTEU), has about 28,000 members, equivalent to about a quarter of university staff.124 It has been a consistent advocate for public funding of higher education.
The National Union of Students (NUS) is a peak body for other student organisations. It had a significant victory when student amenities fees were reinstated in 2012, after they had been abolished by the previous Liberal government. There are also now legal obligations on universities to provide student services
124 Some non-academic staff are not eligible to join the NTEU.
and consult with student groups.125 The Council of Australian Postgraduate Associations (CAPA) is another student peak body, representing campus-based postgraduate organisations. The student groups have been consistent advocates of public funding of higher education.
The Council of International Students Australia (CISA) represents international students across the post-compulsory school sector. It was formed in 2010 after the collapse of an earlier body representing international students. Unlike other higher education interest groups, it is active on state-level issues including public transport concessions, violence against international students, and access to public hospitals.
125 DIICCSRTE (2013c)

Mapping Australian higher education, 2014-15
Grattan Institute 2014 66
8. How well is the higher education system doing? Benefits for employers and the public
This chapter looks at how well the higher education system meets the needs of the country. Is the population becoming more educated? Are employers’ skills needs met? Is university research output meeting expectations? How does the public perceive our higher education sector?
8.1 Providing a more educated population
As the enrolment figures in chapter 2 suggest, higher education attainment in Australia has increased over time. Figure 27 uses the 2011 census to show the proportion of people with a higher education qualification, by the year they turned 18. Growth in attainment stalled after 1974 when higher education was free for students. HECS from 1989 helped finance a growth in places and completions. Attainment then declined for people who turned 18 in the early years of this century, although more of this cohort will earn degrees as mature age students.
While the higher education system has increased education levels, Figure 27 highlights a limitation before 2012. As described in section 6.2, the Government allocated university places. Enrolments expanded in the 1970s, but only just kept pace with demand from the 1950s baby boom generation. In the early 2000s the Government, citing quality concerns, introduced penalties for ‘over-enrolments’ (enrolments above a university’s government target). This meant that there were fewer higher education opportunities for people leaving school at that time.
The demand driven funding system introduced in 2012 should
avoid a recurrence of these problems. Higher education providers are now largely free to meet increases in demand. With another baby boom population finishing school in the early 2020s, the system is better designed to cope than it was in the past.
Figure 27: Lifetime higher education attainment in 2011, by year when turned 18
Note: Citizens only. Source: ABS Census 2011, using ABS TableBuilder
0%
5%
10%
15%
20%
25%
30%
35%
1959 1968 1977 1986 1995 2004
Free education, 1974
Introduction of HECS, 1989
Fewer student places, 2003

Mapping Australian higher education, 2014-15
Grattan Institute 2014 67
8.2 Meeting skills needs
8.2.1 Occupational skills
Although the higher education system is expected to meet skills needs, these have not been a systematic focus of higher education policy. In the pre-2012 system Commonwealth-supported places were sometimes allocated in response to employer complaints about shortages of particular skills (see section 6.2). Similarly, prices of Commonwealth-supported places have sometimes been set to promote demand – for example nursing and teaching between 2005 and 2009, and science and maths between 2009 and 2012. But these were ad hoc measures, with the bulk of university places distributed according to historical allocations, rather than student or labour market demand.
Predicting future skills needs is inherently difficult. Labour market demand predictions by economic modellers can be hopelessly wrong.126 Labour supply is also hard to forecast. Graduates enter and leave Australia, change careers from the one they originally trained for, exit the labour force temporarily or permanently, and work varying numbers of hours per week. Even a higher education system that had skills needs as a priority could probably not avoid all skills shortages.
The main available measure of skills shortages is an employer survey conducted by the Department of Employment. An occupation is deemed to be in skills shortages if employers cannot fill vacancies, or have considerable difficulty filling vacancies, at current pay and condition levels, in reasonably
126 For examples, see Norton (2009), p 22.
accessible locations. This is not necessarily an absolute skills shortage; appropriately-skilled people may exist but prefer other work. The education system is not responsible for the unwillingness of employers to offer jobs at wages that attract suitable applicants.
The Department of Employment has published a skills shortage list since 1986. Fifty managerial or professional occupations, of the type typically regarded by the ABS as requiring a university qualification of equivalent experience, have had reported skills shortages at some time. In the latest ABS occupational list, there are just over 400 different managerial and professional occupations. In the vast majority of professional and managerial occupations we have always had enough graduates.
Over the decade to 2013, 30 occupations, mostly in the health professions or linked to the mining industry, have experienced shortages for 5 years or more (Table 9).127 These shortages are now easing. Only six occupations reported shortages in 2013. The demand driven funding system gives universities new freedom to respond to skills shortages. To the extent that applications for university entry shift in the direction of skills shortages, it also creates an incentive for universities to meet this demand. The review of the demand driven system looked at whether this was occurring. In twelve of the fourteen skills shortage occupations that could be investigated given the available data, the system had responded positively.128 In the two that had not, there may have been problems with funding the
127 There were also shortages of specialist secondary teachers in life sciences 2004-10 and maths 2004-11. 128 Kemp and Norton (2014), chapter 3

Mapping Australian higher education, 2014-15
Grattan Institute 2014 68
relevant courses. This is one vulnerability of the demand driven system: if the total revenue per place is too low, universities lack a financial incentive to offer additional places.
Table 9: Skills shortages by occupation, 2004-2013 04 05 06 07 08 09 10 11 12 13
Dental specialist z z z z z z Dentist z z z z z z z z
Hospital pharmacist z z z z z Retail pharmacist z z z z z Med. diagnostic radiographer z z z z z z z
Midwife z z z z z z z z z
Occupational therapist z z z z z z z
Optometrist z z z z z z
Physiotherapist z z z z z z z z z z
Podiatrist z z z z z z z z
Registered nurse z z z z z z z z z
Sonographer z z z z z z z z z z
Speech pathologist z z z z z z z Clinical psychologist z z z z z
Audiologists z z z z z z z z
Chemical engineer z z z z z z z
Civil engineer z z z z z z z z z
Geologist z z z z z z z z
Mining engineer z z z z z z z z z
Petroleum engineer z z z z
Engineering manager z z z z z
Mining production manager z z z z z z
Quantity surveyor z z z z z z
Surveyor z z z z z z z
Accountant z z z z z Agricultural scientist z z z z z
Agricultural consultant z z z z z
Child care centre manager z z z z z z z z z
z Indicates that employers reported skills shortages Source: Department of Employment (2014)

Mapping Australian higher education, 2014-15
Grattan Institute 2014 69
8.2.2 Graduate soft skills
For some occupations, skills shortages exist alongside a pool of relevantly-qualified graduates struggling to find full-time work. Some graduates may lack what are sometimes called soft skills: personal attributes that help them work effectively.
Each year, Graduate Careers Australia surveys graduate employers about their recruitment intentions and the quality of graduate applicants. In these surveys, ‘poor or inappropriate academic qualifications or results’ consistently ranks low as an issue in graduate hiring (in 2013, eighth of nine possible reasons). The biggest issues for employers are interpersonal and communication skills, attitude and work ethic, and motivation. In 2013, around 22 per cent of employers reported that they would have recruited more graduates had a larger number of better candidates been available.129 Universities often have lists of graduate attributes that include non-academic personal traits attractive to employers. It is not clear how actively universities develop these traits through their courses or other aspects of university life.
8.3 Research performance
As shown in section 4.3, the absolute quantity of research outputs, especially publications, from Australian universities has increased over time. A measure of research productivity is the average number of annual academic publications per academic. This nearly doubled to 1.4 a year between 1997 and 2012, although growth is less rapid if the increasing numbers of
129 GCA (2014c), p 6, 30
research-only staff are taken into consideration.130 However, this is not a measure of research quality or significance. Because publication numbers contribute to academics’ promotion prospects and to university research funding, some people claim that the system encourages quantity over impact or quality.
While impact indicators are still in development, extensive work has been done on measuring research quality. In late 2012, the results of the second national Australian research quality assessment were released. In the Excellence in Research for Australia (ERA) exercise, quality was assessed by field of research. Quality indicators included citations (a measure of whether other academics find the research relevant), peer review (other academics assessing the quality of work) and the level of grant income derived from a peer review process. The ERA also looked at indicators of research volume and activity, indicators of research application (such as patents) and indicators of recognition (for example, a fellowship in a learned academy or editing a prestigious journal).
Each field of research in each university that met a minimum threshold of outputs was rated from one to five. Ratings one and two indicated that research performance in that field was ‘below world standard’. Rating three indicated average performance at world standard. Rating four was above world standard, and rating five was well above world standard. The results are shown in table 10. On this measure, most research-active departments in
130 Weighting teaching and research staff at 0.4 of a full-time staff member to account for teaching work and research staff as 1 gives an increase from 1.3 to 2.3 publications a year: calculated from Department of Education (2013c) and Department of Education (2013a).

Mapping Australian higher education, 2014-15
Grattan Institute 2014 70
Australian universities are at least at world standard. The proportion of research departments rated as below world standard dropped from 35 per cent in the 2010 ERA to 22 per cent in the 2012 ERA.
Table 10: Excellence in Research for Australia, 2012
Rating Units of evaluation Percentage
1 +2 (low) 518 22%
3 820 35%
4 594 26%
5 (high) 391 17%
Total 2,323 100% Source: ARC (2012) The ERA can also be used to identify disciplinary areas of national strength and weakness. Reflecting the large investment in health research (section 4.2), nearly a third of medical and health science disciplines were rated as well above world standard. More than a third of the smaller earth sciences field were also well above world standard. Research in education and in business and management was mostly rated as below world standard. ERA results suggest that universities are finding ways to minimise the number of below world standard areas.
In recent years, international university rankings have attracted a lot of attention. One of these, the Shanghai Jiao Tong Academic Ranking of World Universities, focuses exclusively on research performance. Indicators include papers published in certain high-prestige journals, numbers of high-citation researchers, and winners of Nobel Prizes and Fields Medals (a prestigious
mathematics award). The most recent ranks for Australian universities are shown in table 11. Four Australian universities are in the top 100 universities in the world, up from two in the first year of the Shanghai Jiao Tong ranking, 2003. American universities dominate the top fifty. Nineteen Australian universities are in the top 500 universities in the Shanghai Jiao Tong ranking.131
Table 11: Top nine Australian universities, Shanghai Jiao Tong university rankings, 2014
University of Melbourne 44 Australian National University 74 University of Queensland 85 University of Western Australia 88 Monash University 101-150 University of New South Wales 101-150 University of Sydney 101-150 University of Adelaide 151-200 Macquarie University 201-300
Note: A further nine Australian universities are without specific rank in the 301-400 range. Source: ARWU (2014)
131 For some of the background to the ERA and rankings, see Coaldrake and Stedman (2013), chapter 6.

Mapping Australian higher education, 2014-15
Grattan Institute 2014 71
8.4 Public perceptions
Various social surveys have asked Australians about their confidence in social institutions, including universities. Universities enjoy high levels of public confidence. In 2014, 74 per cent of respondents who expressed a view said that they had either a ‘great deal’ of confidence in universities (24 per cent), or ‘quite of lot of confidence’ (50 per cent) (Figure 28). Although confidence levels are lower than in recent years, universities rated third highest of the nine institutions included in the 2014 survey. Only the defence forces and the police enjoyed higher levels of public confidence.
Figure 28: Proportion of public who have a ‘great deal’ or ‘quite a lot’ of confidence in universities, 2001-2014
Sources: McAllister et al. (2001-2010); Wilson et al. (2003); (2005); McAllister et al. (2011); McAllister and Pietsch (2012); McAllister (2014)
73% 70% 69%
82% 80% 80% 74%
0%
20%
40%
60%
80%
100%
2001 2003 2005 2008 2010 2012 2014

Mapping Australian higher education, 2014-15
Grattan Institute 2014 72
9. How well is the higher education system doing? Benefits for students
This chapter examines how well the higher education system is serving the needs of students. What is the academic quality of their courses? Are they satisfied with teaching? Do they get good employment outcomes?
9.1 The educational experience
9.1.1 Academic standards
Many academics believe that academic standards are in decline – that courses are being ‘dumbed down’, or that it is becoming easier to pass or get high grades. In a survey, just under half of academics surveyed agreed with the proposition that “academic standards at my university aren’t what they used to be”.132 Falling admission standards, poor English-language skills among international students, and students not putting in the necessary work are among the reasons given by academics for this perceived decline.133 Some graduates report that challenging students to achieve high academic standards is an area in which universities could do better.134
Evidence on academic standards is largely anecdotal. In schools, published curricula and more recently national and international tests track what students are taught, and how well they have learnt it. Higher education is much more decentralised than school education, leaving us without key information needed to 132 Bexley, et al. (2011), p 30 133 For example, Economic Society of Australia (2004) 134 Coates and Edwards (2009), p 52
assess trends in academic standards, or to compare them between institutions.
Figure 29: Literacy and numeracy levels of graduates, 2011-12
Source: ABS (2013d)
An adult competencies survey provides some information on the literary and numeracy levels of graduates. Respondents were graded at five levels, with one being the lowest. As can be seen in Figure 29, most graduates achieved level 3 or above for both
0%
5%
10%
15%
20%
25%
30%
35%
40%
45%
50%
Literacy Numeracy
Level 1 Level 2 Level 3 Level 4/5

Mapping Australian higher education, 2014-15
Grattan Institute 2014 73
literacy and numeracy.135 Substantial minorities of graduates, however, have lower levels of literacy and especial numeracy. The survey includes graduates in Australia of overseas universities, but is consistent with the conclusion that Australian universities usually but not always ensure graduates have these basic generic skills.
The OECD-backed Assessment of Higher Education Learning Outcomes (AHELO) project is aimed at providing comparable international higher education test results. A feasibility study including 17 countries has incorporated tests of generic skills, along with specific tests for engineering and economics students. Australian universities participated in the engineering component.136 One obstacle to AHELO’s success will be testing a sufficient number of students to make valid cross-country comparisons. If implementation problems are overcome, AHELO could provide information about how Australian higher education institutions compare over time, with each other, and with other countries.
Until then, we need to use proxy indicators to examine academic standards.
Figure 30 shows pass rates for commencing domestic and international students. If academic standards were dropping significantly across the higher education sector, all other things being equal we would expect to see pass rates going up. Easier courses or softer marking would both make failing less likely.
135 An explanation of the skill levels associated with the different levels is in the ‘Scores and skills levels’ appendix of ABS (2013d). 136 Tremblay, et al. (2012)
For domestic commencing students pass rates are declining. In 2013, 83 per cent of subjects attempted were passed, down from 87 per cent in 2004. Pass rate trends are associated with the size of the commencing student intake. When commencing student numbers fell between 2002 and 2004, the pass rate went up. As commencing enrolments recovered in the late 2000s, pass rates went down. 2009 is the main exception to the pattern; it was the start of an enrolment boom but the pass rate increased.137 This exception aside, the pattern is consistent with the prior academic ability of commencing students explaining fluctuations in pass rates. When they take more students, universities reduce entry requirements. These weaker students are more likely to fail, and so reduce the pass rate.138
While the domestic commencing student pass rates provide no evidence that subjects are getting easier or marking is getting softer, shows a steep increase in pass rates for international students from 2005. In 2010, international commencing students were for the first time more likely to pass their subjects than domestic students.
We know that international students work harder than domestic students, which provides one explanation for superior academic performance.139 However, this factor is unlikely to explain a trend. Examining the pass rate data in more detail shows stable rates at most universities, but large increases at others, including some
137 Over 2002-12, there is a correlation of close to -0.9 between the number of commencing domestic undergraduate students and the pass rate. 138 See Kemp and Norton (2014) p 15-16 for enrolment numbers and attrition rates by ATAR. 139 Edwards (2008)

Mapping Australian higher education, 2014-15
Grattan Institute 2014 74
that previously had very low pass rates.140 Possibly, English-language requirements for incoming international students have increased at those universities, lifting pass rates Figure 30: Subject pass rates for domestic and international students, 2001-2013
Source: Department of Education (2014e)
140 DIICCSRTE (2012b)
9.2 Student satisfaction with teaching
Since the early 1990s, a course experience questionnaire (CEQ) has been sent to completing students at Australian universities. Core questions cover teaching, generic skills and overall satisfaction. In later years, universities could choose to ask their students questions on goals and standards, workload, assessment, intellectual motivation, student support, graduate qualities, learning resources, and the learning community. As the survey is conducted after the course is finished it is an overview that combines views of many different subjects. Universities have their own surveys of individual subjects.
The initial CEQ surveys revealed low levels of satisfaction with teaching. However, by the mid-1990s a positive trend had started. In a slow but steady way, each year more completing students indicated satisfaction with elements of university teaching (defined as choosing one of the top two points on a five-point scale). The surveyed elements included the level and helpfulness of feedback, teaching staff effort and effectiveness, whether students were motivated by teaching staff, and whether teaching staff made an effort to understand difficulties students were having. Figure 31 shows average responses to these questions from completing bachelor-degree students combined into a ‘good teaching scale’. Though the trend is consistently towards more satisfaction, it was not until 2007 that a majority of completing students were satisfied. In 2010, the good teaching scale result jumped from 52 per cent to 62 per cent, though a change in the response options is likely to be a major factor explaining this
80%
81%
82%
83%
84%
85%
86%
87%
88%
89%
90%
2001 2003 2005 2007 2009 2011 2013
International students
Domestic students

Mapping Australian higher education, 2014-15
Grattan Institute 2014 75
increase.141 Results from the good teaching scale continued their upward trend between 2010 and 2013.
Figure 31: Mean student satisfaction with teaching, 1995-2013
Source: GCA (1995-2014) 141 A mid-point in a five-point scale, which had previously been unlabelled, was described as ‘neither agree nor disagree’ with the proposition being offered (for example, ‘the staff put a lot of time into commenting on my work’.) Possibly this means that satisfaction using the top two point definition was understated for previous years. However, CEQ respondents may have interpreted ‘neither agree nor disagree’ as meaning ‘I have no opinion’, while they could have interpreted the unmarked mid-point as representing a view, such as ‘middling’ or ‘mediocre’ but not unsatisfactory.
The CEQ results suggest that satisfaction with teaching is improving, but that there is room for improvement. Substantial minorities of students are still negative or unenthusiastic about their interaction with teaching staff. However, overall satisfaction as measured by responses to the proposition ‘overall I was satisfied with the quality of this course’ has consistently been higher than the good teaching scale. It was 83 per cent in 2013.
The Government has now committed to a national survey of first and later year students, currently called the University Experience Survey (UES), although it may be renamed to include non-university higher education providers. Changes in the UES survey methodology between its 2012 and 2013 versions may invalidate comparisons, but on most teaching-related questions students reported less satisfaction in 2013.142
The CEQ questions graduates shortly after course completion. The 2008 Graduate Pathways Survey recorded longer-term perceptions of teaching quality by contacting graduates five years after completion. This survey lets us examine how graduates perceive their time at university after applying what they learnt in work or further study. It asked several questions related to learning, including acquiring job or work-related skills and knowledge, thinking skills, and analysing quantitative problems. On a 0 to 100 scale, the average score was 61.143 This is consistent with the CEQ’s findings. The educational performance of Australian universities is broadly satisfactory, but well short of outstanding. The Graduate Pathways Survey also asked about specific areas for improvement. The top areas were related to
142 Graduate Careers Australia/Social Research Centre (2014), p 28 143 Coates and Edwards (2009), p 45
0%
10%
20%
30%
40%
50%
60%
70%
80%
1995 1997 1999 2001 2003 2005 2007 2009 2011 2013
Change in answer format

Mapping Australian higher education, 2014-15
Grattan Institute 2014 76
better preparing students for life after study, including use of real-life case studies, more placements and internships, and ensuring staff have current workplace knowledge and experience.
9.3 Employment outcomes
For students, employment is one indicator of the success of their higher education study. While universities help prepare their students for the labour market, broader economic trends and conditions are the main shorter-term influences on outcomes.
For most students, employment is a factor in their decision to enrol in a higher education course. For bachelor-degree students, about three-quarters give a job-related consideration as the main reason for study.144 Of course this means that around a quarter of students enrol for some other main reason.
The short term graduate labour market, at around 4 months after completion, has been deteriorating for some years, as seen in Figure 32. In early 2013, the proportion of bachelor-degree graduates looking for full-time work, including those with part-time or casual work, was 29 per cent. This is only just below the worst employment outcome to date during the early 1990s recession.
These numbers improve with time. In 2010, 24 per cent of graduates were still looking for work 4 months out. By 2013, the Beyond Graduation survey, taken three years after completion, showed that this number had dropped to 10 per cent. Five per cent of 2010’s graduates were unemployed, and another five per
144 ABS (2010), table 5
cent were in part-time or casual work and looking for full-time work.145
Although graduate un- or under-employment rates decline in the months and years after course completion, all graduate surveys show that outcomes are getting worse. Employment rates are declining three years after graduation in the Beyond Graduation Survey, and for people with new postgraduate qualifications.146
145 GCA (2014a), p 3 146 Guthrie and Bryant (2014), especially appendix table E.

Mapping Australian higher education, 2014-15
Grattan Institute 2014 77
Figure 32: Under- and unemployment for recent graduates, 1979-2013 Per cent
Source: GCA (1979-2014)
This trend is unlikely to reverse anytime soon. The national employment market is weak while annual course completions are increasing. Although graduates’ employment prospects are worse than in the past, these need to be compared against their realistic alternatives. In the longer run, a university degree continues to provide good insurance against unemployment (Table 12). However, people with diploma and certificate III/IV qualifications
also have good employment outcomes.
Table 12: Employment levels by qualification, 2013
Graduate Diploma Cert III/IV No qualification
Unemployment rate 3.3% 3.8% 4.7% 7.8% Not in labour force 12.9% 15.8% 13.8% 34.2%
Note: Graduate includes bachelor degree and above. Source: ABS (2013b), table 10
Being able to get any job is insurance against very low income. But university education also promises access to jobs requiring higher levels of cognitive and, sometimes, technical skills. The Australian Bureau of Statistics (ABS) classifies most managerial and professional jobs as requiring a “level of skill commensurate with a bachelor degree or higher qualification”.147 In 2013, 73 per cent of university graduates in work had jobs classified as managerial or professional.148 The 2011 census shows that that the proportion of graduates in these jobs varies significantly between disciplines (Figure 33). People with bachelor degrees in health fields, in education and in law all have rates of professional and managerial employment above 80 per cent. People with bachelor degrees in humanities, science, creative arts, management and commerce or agriculture all have professional or managerial employment rates below two-thirds.
147 ABS (2006) 148ABS (2013b), table 11
0
5
10
15
20
25
30
35
1979 1982 1985 1988 1991 1994 1997 2000 2003 2006 2009 2012

Mapping Australian higher education, 2014-15
Grattan Institute 2014 78
Figure 33: Rates of professional and managerial employment by bachelor degree, 2011
Note: Excludes graduates not in work and graduates currently enrolled in education. Source: Grattan calculations from 2011 Census using ABS TableBuilder
It can take graduates time to find jobs matching their skills. The 2011 census shows that about 60 per cent of employed 22-year old graduates are in managerial and professional jobs, with the 72 per cent mark reached by age 29. Comparison with the 2006 census shows a small decrease in professional and managerial employment rates for graduates in their twenties.149
Comparing graduate employment outcomes over time is complicated. Occupations change in the level of skill and qualifications required. Partly as a result, ABS job classification systems also change. Labour market and educational data are collected and classified differently from the past. With these caveats, the boom in university education seems to have largely been matched by changes in the labour market. In 1981, 8 per cent of all employed persons had university degrees, and 77 per cent of them were in jobs described as ‘professional, technical etc’ or ‘administrative, executive and managerial’.150 Despite the share of the workforce with university qualifications having more than tripled to 27 per cent by 2011, the proportion of graduates in matched jobs declined only slightly in 30 years.151
9.4 Income from university education
Every study of graduate incomes finds that, on average, graduates earn more than non-graduates. This is partly because graduates are more likely to have jobs, and partly because the jobs they have tend to be high-paying. Higher education itself
149 Grattan analysis based on ABS TableBuilder application. Analysis was restricted to bachelor-degree graduates not currently enrolled in education. 150 ABS (1982) 151 Kemp and Norton (2014), p 27
0% 20% 40% 60% 80% 100%
Humanities
Agriculture/Environment
Creative arts
Science other than maths
Management & commerce
Mathematics
Information technology
Architecture
Engineering
Dentistry
Education
Nursing
Medicine

Mapping Australian higher education, 2014-15
Grattan Institute 2014 79
does not necessarily cause these income differences. Universities typically select students based on prior academic achievement, which in turn reflects their intelligence, their school education, and personal characteristics such as effort and persistence. Employers tend to reward these attributes with or without higher education.152 Cultural norms, political pressures and market forces also influence pay, independently of any changes in the initial ability of graduates or the quality of their higher education.
One method of analysing higher education’s financial benefits is to calculate a ‘graduate premium’. The graduate premium tells us how much more graduates earn compared to some other group. This can be done at a single point in time, or estimated over time.153 Over a career, higher pay and labour force participation contribute to substantial earnings differences between graduates and non-graduates.
According to Grattan Institute analysis of the 2011 Australian census, the median male bachelor-degree holder has lifetime additional earnings of $1.4 million, compared to the median male who did no further education after Year 12. For women, the estimated lifetime earnings premium is just under $1 million, compared to the median female who undertook no further education after Year 12.
The differences narrow if we deduct the costs of education and income tax to $900,000 for men and $700,000 for women (figure 34). Both male and female graduates increased their lifetime
152 See the useful discussion of ability bias in Leigh (2008). 153 A point in time as of 2009, based on ABS (2010), was reported in Norton (2012), p 69.
earnings by about $80,000 between 2006 and 2011. This analysis has no adjustment for ability other than restricting the comparison to people who finished school. It is therefore likely to be an upper estimate of the private financial benefits caused by higher education.
Figure 34: Median net earnings of bachelor-degree graduates compared to Year 12, 2011 $ million
Notes: Lifetime earnings are calculated by ‘aging’ people through the census from age 18 to 65. For example, someone aged 25 at the time of the 2011 census is assumed to earn at age 30 what a 30 year old earned in 2011. Net earnings are calculated by deducting student contribution repayments, direct study costs, income tax, and the Medicare levy. No discount for ability. Source: Grattan calculations based on ABS Census.
0
1
2
3
Male Female
Graduate Yr 12 completer
To be updated?

Mapping Australian higher education, 2014-15
Grattan Institute 2014 80
9.5 Income for university types and courses
Section 9.4 shows that graduates earn more than people with school education. But incomes differ significantly among graduates: some earn very high salaries, while others have low-paying jobs. This section explores two reasons why incomes might differ: the type of university a student attends and the course taken.
9.5.1 University groupings in Australia
With about 40 universities and 130 higher education providers, Australian students have a range of higher education options (Chapter 1). The significance of these choices will increase if fees for domestic undergraduate students are deregulated, as the Government intends. Prospective students will need to decide whether universities charging premium fees offer value for money.
There is no survey that can reliably tell us whether graduates of specific universities do better than others over the long run. But one of Australia’s most important social surveys, the Household, Income and Labour Dynamics in Australia Survey (HILDA), recently added a question on university attended. By grouping together bachelor-degree graduates from similar universities we can use HILDA to analyse the financial benefit of attending a certain type of university.
This section supplements HILDA with two surveys that look at graduates at the beginning of their careers. One is the Longitudinal Survey of Australian Youth (LSAY), which tracks young people from age 15 to their mid-20s. The section also reports on research by others based on the Graduate Starting
Salaries survey (GSS), which is sent to all people completing a course at an Australian university.
This section’s analysis of graduate earnings divides Australian universities into four groupings: the Group of Eight, the Australian Technology Network plus Swinburne University (technology universities), the Innovative Research Universities group (IRU), and other universities. Due to the smaller number of their graduates in HILDA, members of the Regional Universities Network are included with other universities in the statistical analysis and described as ‘Other’.
A full list of universities and their groups is in Appendix A.
Our categories largely correspond to the lobby groups that represent groups of universities: (section 7.3.1). These lobby groups formed because their member institutions share similar histories and priorities that differ from other universities. Both these characteristics and how others perceive them could influence graduate outcomes.
The universities represented by the Group of Eight lobby group include the oldest mainland universities. They receive most government research funding (section 5.2.4).
The technology universities were transformed from institutes of technology in the 1980s and 1990s, and still have a strong orientation towards industry. All bar Swinburne University are members of the Australian Technology Network.

Mapping Australian higher education, 2014-15
Grattan Institute 2014 81
Universities in the Innovative Research Universities group were generally established in suburban areas in the 1960s and 1970s, meeting growing demand for university education at that time. They have always had a research orientation.
9.5.2 University prestige in Australia
Prestige is a signal of standing; a prestige good or service is often seen as the best of its type. The concept of prestige is particularly influential in higher education, where quality is hard to measure. It reflects perceptions, justified or not, about where the highest quality is to be found. Students looking for the best courses and employers looking for the best graduates are likely to use university prestige to help make their choices. University prestige is associated with higher graduate earnings in the United States and to a lesser extent the United Kingdom.154 There are four main reasons why university prestige might matter:155
x Human capital effect: graduates of prestigious universities may receive higher quality education due to factors such as better teachers and greater resources;
x Signalling effect: employers cannot directly evaluate the skills of graduates, so they may rely on university prestige as a signal of a job candidate’s potential;;
x Social capital effect: those who attend prestigious institutions may leave with more valuable professional networks;
154 Thomas (2000); Zhang (2007); Hussain, et al. (2009) 155 Lindahl and Regner (2005); Gerber and Cheung (2008)
x Selection effect: factors such as cognitive ability and social background which increase the probability of attending a prestigious university and also increase subsequent earnings.
Prestige is a subjective measure, revealed by the value that people place on a good or service with a particular brand. Our study uses three metrics to assess university prestige. These are fees, ATARs and international rankings.
Fees
Prestige is associated with high prices, so one prestige indicator is how much students pay for their courses. Fees for international students and most domestic postgraduates are already deregulated, giving us a guide to the market value of different universities. Figure 35 shows annual fees for domestic and international students in a master of commerce.
Both markets have the same hierarchy of fees charged. The Group of Eight universities charge the highest median fee in each case, and regional universities charge the lowest fee in each case. The same is true in most other fields of study.
Although median fees rank in the same order in both markets, high prestige universities, particularly Group of Eight, charge more of a premium for international undergraduates than domestic full-fee students. With more local knowledge, Australian students may see less of a difference between technology and Group of Eight universities.

Mapping Australian higher education, 2014-15
Grattan Institute 2014 82
Figure 35: Fees for commerce students, by university group $2014, annual fee
Source: Grattan data collection from university websites
ATAR
ATAR ranks school students by their academic performance (section 2.7), creating a potential measure of academic prestige. Figure 36 shows the range of ATARs for bachelor of business or commerce courses by university. Unlike the published cut-offs that report the lowest ATAR for normal admission, Figure 36 shows the range of ATARs of enrolled commerce students. Group of Eight universities generally have higher ATARs than other university groups. This pattern holds for most other courses.156
Although Group of Eight universities usually have the highest median ATARs, universities in the different groupings enrol students with overlapping ATAR ranges. This implies that some students who could attend a Group of Eight university choose to enrol somewhere else.
156 The exceptions are teaching and nursing, where median ATARs for Group of Eight and technology universities are more similar than for other disciplines. Not all Group of Eight universities have undergraduate courses in these fields.
Go8 Tech IRU Regional 0
10000
20000
30000
40000
Go8 Tech IRU Regional
Postgraduate Domestic full-fee
Postgraduate International
Median
Maximum
Minimum

Mapping Australian higher education, 2014-15
Grattan Institute 2014 83
Figure 36: ATARs of business and commerce students, by university
Notes: ATAR data is classified in terms of field of education. Business and Management is used except for the University of Adelaide where Other Management and Commerce is used and for the University of Western Australia where Management and Commerce is used. The data excludes universities that do not have their main campus within metro areas. Source: Data provided by the Department of Education
International rankings
International rankings of universities have become important indicators of prestige over the last decade. They receive wide publicity, and universities promote their own position in the
rankings when they do well.
The different international rankings vary in what they measure. The Shanghai Jiao Tong Academic Ranking of World Universities focuses exclusively on research performance. The Times Higher Education and QS World University Rankings cover research performance as well as indicators of teaching quality and graduate employability.157
The ranking measure of university prestige does not show the overlaps between the Group of Eight and other groups evident in the fee and ATAR data. Across all three rankings, Group of Eight universities outperform other groups. Four Australian universities, all of them in the Group of Eight, make the top 100 Shanghai Jiao Tong World Universities. The other four Group of Eight institutions are ranked within the top 200 universities. Group of Eight universities have consistently outperformed other groups over time.158
The relative rankings of technology and IRU universities are not clear. More IRU institutions than technology universities are in the Shanghai Jiao Tong ranking, but technology universities outnumber IRU members in the Times Higher Education rankings, and typically do better in the QS rankings.
157 ARWU (2014); Quacquarelli Symonds (2014); Times Higher Education (2014-15). There are many critiques of the statistics and methodologies of the rankings, especially for non-research indicators. See for example Marginson (2014). 158 The data is collected from 2009 to 2014 for the Shanghai Jiao Tong, Times Higher Education, and QS World University Rankings.
0 10 20 30 40 50 60 70 80 90 100
The University of Sydney The University of Melbourne
University of New South Wales Monash University
The University of Western Australia University of Adelaide
The University of Queensland The Australian National University University of Technology, Sydney
Queensland University of Technology Curtin University of Technology
RMIT University University of South Australia
Swinburne University of Technology James Cook University
Charles Darwin University Flinders University of South Australia
Griffith University Murdoch University La Trobe University
University of Newcastle University of New England
University of Southern Queensland University of the Sunshine Coast
Southern Cross University Federation University Australia
Macquarie University University of Wollongong
Deakin University Edith Cowan University University of Canberra
Charles Sturt University University of Tasmania
University of Western Sydney Australian Catholic University
Victoria University
Go8
Tech
IRU
Other
u Median ATAR 10th - 90th percentile
Regional

Mapping Australian higher education, 2014-15
Grattan Institute 2014 84
Overall relativities
On all three prestige metrics, Group of Eight universities outperform the other university groups. As a result, our study assumes Group of Eight institutions are the prestigious Australian universities
The hierarchy below the Group of Eight is less clear. The technology universities on average have the second highest median ATAR and fees, but there is overlap between their member institutions and those in the IRU. The two groupings each have mixed results in the international rankings.
9.5.3 Does attending a prestigious university improve employment prospects?
In general, a higher education qualification improves employment prospects (section 9.3). University prestige is not necessary for getting a job. HILDA shows that Group of Eight graduates are only marginally more likely to be employed than graduates from Other universities. Group of Eight and technology university graduates have similarly high employment prospects, after controlling for other factors that influence employment.
Whether graduates work full or part-time has a large impact on their earnings. In 2011, Australian full-time workers had average earnings of $75,504 per year, 2.6 times more than average part-time pay.159 Graduates from Group of Eight universities are
159 ABS (2013c)
equally likely to have a full-time job compared to graduates of other universities with comparable individual characteristics.160
For Australian graduates, field of study affects full-time job prospects more than type of university attended. Compared to science graduates, graduates with education degrees are marginally less likely to find themselves unemployed, but graduates with society and culture or creative arts qualifications are about 2.5 times more likely to be unemployed.161
All these results take into account factors other than course taken that might affect employment outcomes. These include age, gender, children in the household, location, and whether English is spoken at home.
9.5.4 Does attending a prestigious university increase starting salaries?
The first salaries graduates receive can help examine whether university prestige affects graduate income. Since employers cannot easily assess the actual skills of job applicants, they may instead use a proxy measure such as university attended. This would be a signalling effect. Starting salaries may also reflect
160 Given Group of Eight graduates have a similar likelihood of being in full-time employment, but are less likely to be unemployed, this implies that Group of Eight graduates are more likely to be in part-time employment on average. Based on analysis of the HILDA survey, this difference is because Group of Eight graduates are more likely to prefer part-time work or to be working part-time because they are doing additional study. 161 ‘Society and culture’ is a category that includes the humanities and social sciences.

Mapping Australian higher education, 2014-15
Grattan Institute 2014 85
actual or assumed human capital acquired at university, rather than the effects of subsequent training and experience.162
Using the Longitudinal Survey of Australian Youth (LSAY), we estimate the impact of prestige on full-time starting salaries.163 Comparing the earnings of Group of Eight with other graduates, we find no significant difference in their full-time starting salaries. Additional analysis compares the starting salaries of each university group: Group of Eight, technology universities, IRU institutions and Other universities. Graduating from a Group of Eight university has no impact on starting salaries compared to any other university group.164
Since the signalling effects of prestige should be most prominent in graduates’ first jobs, this suggests signalling has a weak impact on first full-time earnings. Other researchers, however, report that Group of Eight graduates are more likely to be in jobs matching their qualifications, a finding we return to in the next section.165
The salary results are consistent with previous Australian research, which finds that university attended has no or little impact on graduates’ starting salaries.166 Where earnings differences are found, Australian Technology Network (ATN) 162 Miller and Volker (1982) 163 2003 cohort 164 The analysis adjusts for differences in graduates’ characteristics, including individual background and job characteristics. See ‘Statistical report on financial returns to attending a prestige university’ for more details. 165 Li and Miller (2013) find that Group of Eight graduates are more likely to be in a job that requires their qualifications and Lee (2014) finds Group of Eight male graduates are more likely to find prestigious jobs. Job prestige is highly correlated with field of study and this may bias the result. 166 Birch, et al. (2009); Li and Miller (2013); Lee (2014)
universities performed better than Group of Eight universities, according to a study using data from the Graduate Starting Salaries survey. The largest starting salary premium identified in Australian studies is approximately 3.5 per cent for ATN and 1.9 per cent for Group of Eight universities over Other universities.167
Two Australian studies estimate full-time starting salaries for individual universities.168 Larger earning premiums are found for individual, rather than groups of, universities. One found that starting salaries between two Group of Eight universities can vary by up to 13 per cent. The difference may be more due to locational than university factors, but grouping universities may conceal important differences between them. Unfortunately, we cannot conduct our analysis by individual university, due to the small number of people in LSAY and HILDA.
Field of education has a greater impact on full-time starting salaries than prestige. Figure 37 shows median starting salaries of comparable graduates from different disciplines. Graduating with an engineering degree can improve a graduate’s starting salary by about 15 per cent compared to a science degree. Graduating from commerce, humanities or creative arts rather than science typically reduces a graduate’s earnings. The median annual full-time starting salary for a science graduate was $55,000 in 2012; if a similar graduate had chosen engineering, he or she could earn about $8,000 more. But if a similar graduate
167 Li and Miller (2013). In the Li and Miller analysis, Swinburne University is in the Other group. 168 Birch, et al. (2009); Li and Miller (2013)

Mapping Australian higher education, 2014-15
Grattan Institute 2014 86
had chosen commerce or humanities, he or she could earn about $3,000 or $4,500 less 169
Figure 37: Median full-time starting salaries by field of education $2012 per year
Notes: Humanities is a subset of society and culture. Due to how the data is classified it also includes economics. Only statistically significant results at 90 per cent are shown. A median graduate from physical sciences is the baseline. The data only includes bachelor degree graduates. Sources: Grattan analysis of LSAY (2003 cohort) and GCA (2013a)
169 GCA (2013b) using physical sciences.
9.5.5 Does attending a prestigious university increase lifetime earnings?
Although university prestige effects are hard to see in starting salary data, these could emerge over time. Possibly graduates have human capital advantages employers cannot observe during the initial hiring process, but which they recognise and reward financially as graduates’ careers progress. The social capital acquired at a prestigious university may also take time to show benefits.
In the HILDA survey, Group of Eight bachelor-degree graduates employed full-time earn 10 per cent more than non-Group of Eight graduates who are employed full-time.170 Not all of this is due to human or social capital differences. Prestigious universities on average admit people with higher academic ability, as can be seen in Figure 36 on university ATARs. Compared to other higher education institutions, prestigious universities also enrol more students who attended private schools, and whose parents are more likely to have degrees and high-status jobs than the general population.
Using HILDA, we can directly adjust the results to take account of social background but not prior academic ability. As a result, it is possible that our analysis over-states the advantages in going to a Group of Eight university, as opposed to just having high academic ability.171 However, school results are indirectly taken 170 The data includes full-time salaries of bachelor degree graduates from their first full-time job until the age of 67. The survey was conducted from 2001 to 2012. 171 Group of Eight graduates are more likely to go on to postgraduate study than graduates from other university groups (Beyond Graduation Survey 2012). This
0
10,000
20,000
30,000
40,000
50,000
60,000
70,000
Eng
inee
ring
Sci
ence
Com
mer
ce
Hum
aniti
es
Cre
ativ
e ar
ts

Mapping Australian higher education, 2014-15
Grattan Institute 2014 87
into account because of their link with socioeconomic status. Once these selection effects are factored in, the Group of Eight income premium drops by about four percentage points. In other words, Group of Eight universities get good results partly because they take students who would do well wherever they studied.
We can extend the analysis by dividing the non-Group of Eight group into technology universities, the IRU and Other universities. Using Other universities as the baseline group, Figure 38 shows the impact on full-time earnings over a career. Graduates from technology and Groups of Eight universities earn about 6 per cent more than the graduates of universities in the Other category. Graduates of IRU universities earn about 2 per cent more.
To demonstrate the impact of the earnings premium, a typical science graduate from a non-Group of Eight, technology or IRU university who works full-time earns $75,000 a year. If she went to a technology or Group of Eight university, she could expect to earn $4,900 more a year. Over a 40-year career the difference in lifetime earnings would be nearly $200,000.
The earnings premium may be partly due to the initial job-matching process. Ian Li and Paul Miller find that, shortly after course completion, Group of Eight and ATN graduates are more likely to have jobs that require their qualifications.172 When graduates rate their qualification’s job relevance, Group of Eight graduates are more likely than graduates of Other universities to
is likely to remove some of the most academically able Group of Eight students from our bachelor-degree based analysis, reducing ability bias in the data. 172 Li and Miller (2013)
say their qualification is a formal job requirement. Technology university graduates are more likely to rate their qualification as a formal requirement or as important to their job.173 Possibly Group of Eight and technology graduates have more opportunities to use and develop their human capital, leading to higher lifetime earnings.
Figure 38: Career earnings by university groups $2012 million
Notes: Assumes a 40-year full-time working career. The data only includes bachelor degree graduates. Source: Grattan analysis of HILDA (2012) 173 Grattan analysis using Graduate Destination Survey 2010.
$0
$1
$2
$3
$4
Go8 Tech IRU Other

Mapping Australian higher education, 2014-15
Grattan Institute 2014 88
The starting salaries and career earnings results both suggest that research-based prestige is not particularly important in the Australian labour market, at least for bachelor degrees. The technology universities either do not rate or get low ratings in the research-driven international rankings, but their graduates earn as much as those from Group of Eight universities, which dominate research funding and rankings.
Earnings differences among graduates of Australian universities are much smaller than in the US. Some American studies estimate that the earnings premium for attending a prestigious private university is over 20 per cent, more than triple our Australian finding.174 Possibly this is due to the large differences among American universities and colleges compared to Australia.175
Group of Eight universities take nearly a quarter of Australian bachelor-degree students, so they are not highly selective compared to the top American universities. For example, Harvard University has fewer than 7,000 undergraduates in an American undergraduate population of nearly 10.6 million, less than 1 in 1,500. Australia’s top-ranked University of Melbourne has 24,000 of Australia’s 700,000 bachelor-degree students, or about 1 in 30.
The high fees and large endowments of elite American universities enable much higher per student spending than in Australia. This may help their students acquire more human
174 Behrman, et al. (1996); Brewer, et al. (1999) 175 For discussion of the US system see: Behrman, et al. (1996); Hoxby (1997); Brewer, et al. (1999); Heckman (1999); Thomas (2003); Black, et al. (2005); Zhang (2005)
capital while at university. By contrast, Australia’s public university funding system narrows resource differences between universities.

Mapping Australian higher education, 2014-15
Grattan Institute 2014 89
9.5.6 Lifetime earnings by field of education
As with starting salaries, a graduate’s field of study affects his or her lifetime earnings more than institutional prestige. An engineering graduate earns about 11 per cent more than a science graduate with otherwise similar personal characteristics. Graduating from humanities or creative arts is estimated to reduce graduate’s full-time earnings by 11 and 33 per cent respectively compared to science.
To demonstrate the impact of a student’s choice of discipline, Figure 39 shows expected lifetime earnings for a median graduate of a university in the Other category. Using the same science graduate as the earlier example, her lifetime earnings are about $3 million.176 If instead of science she chose to study law, she could expect to earn about $400,000 more in her lifetime. If she chose engineering instead of science, she could expect to earn $300,000 more. But if she chose education, humanities or creative arts instead of science, she could expect to earn around $200,000, $300,000, or $1 million respectively less over her lifetime.
176 Assuming a 40-year full-time working life.
Figure 39: Expected lifetime earnings by field of education (bachelor degree graduates of Other universities) $2012 million
Notes: Humanities is a subset of society and culture. Due to how the data is classified it also includes economics. The estimate assumes 40 years of working full-time. The calculation is based on a median science graduate who attended a non-Group of Eight, technology or IRU university. The data only includes bachelor degree graduates. Sources: Grattan analysis of HILDA (2012) The choice of field of education generally matters more to lifetime earnings than the choice of university. For example, Figure 40 looks at the choices of a hypothetical prospective science student. If she took her science course at a Group of Eight rather than an Other university, it would increase her income by about $200,000.
$0
$1
$2
$3
$4
Cre
ativ
e ar
ts
Hum
aniti
es
Edu
catio
n
Sci
ence
Com
mer
ce
Eng
inee
ring
Law
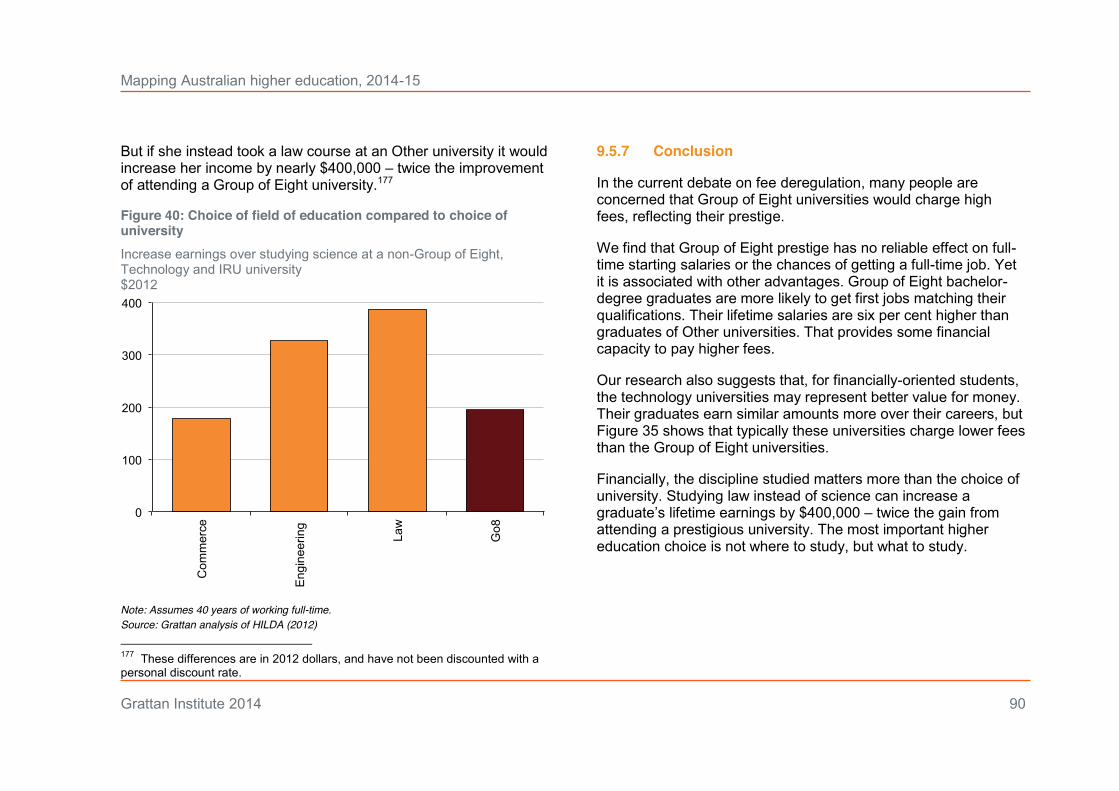
Mapping Australian higher education, 2014-15
Grattan Institute 2014 90
But if she instead took a law course at an Other university it would increase her income by nearly $400,000 – twice the improvement of attending a Group of Eight university.177
Figure 40: Choice of field of education compared to choice of university Increase earnings over studying science at a non-Group of Eight, Technology and IRU university $2012
Note: Assumes 40 years of working full-time. Source: Grattan analysis of HILDA (2012)
177 These differences are in 2012 dollars, and have not been discounted with a personal discount rate.
9.5.7 Conclusion
In the current debate on fee deregulation, many people are concerned that Group of Eight universities would charge high fees, reflecting their prestige.
We find that Group of Eight prestige has no reliable effect on full-time starting salaries or the chances of getting a full-time job. Yet it is associated with other advantages. Group of Eight bachelor-degree graduates are more likely to get first jobs matching their qualifications. Their lifetime salaries are six per cent higher than graduates of Other universities. That provides some financial capacity to pay higher fees.
Our research also suggests that, for financially-oriented students, the technology universities may represent better value for money. Their graduates earn similar amounts more over their careers, but Figure 35 shows that typically these universities charge lower fees than the Group of Eight universities.
Financially, the discipline studied matters more than the choice of university. Studying law instead of science can increase a graduate’s lifetime earnings by $400,000 – twice the gain from attending a prestigious university. The most important higher education choice is not where to study, but what to study.
0
100
200
300
400
Com
mer
ce
Eng
inee
ring
Law
Go8

Mapping Australian higher education, 2014-15
Grattan Institute 2014 91
Glossary
ABS Australian Bureau of Statistics
ACER Australian Council for Educational Research
ACPET Australian Council for Private Education and Training
Applied research Research undertaken primarily to acquire new knowledge with a specific application in view.
AQF Australian Qualifications Framework
ARC Australian Research Council
ARWU Academic Ranking of World Universities
ATAR Australian Tertiary Admission Rank
ATN Australian Technology Network
ATO Australian Taxation Office
CGS Commonwealth Grant Scheme
Commonwealth contribution The Federal Government’s tuition subsidy
COPHE Council of Private Higher Education
CPI Consumer Price Index
DEET Australian Department of
Employment, Education and Training
DEEWR Australian Department of Education, Employment and Workplace Relations
DEST Australian Department of Education, Science and Training
DIAC Australian Department of Immigration and Citizenship
DIISR Australian Department of Innovation, Industry, Science and Research
DIISRTE Australian Department of Industry, Innovation, Science, Research and Tertiary Education
Doubtful debt HELP debt not expected to be repaid
EFTSL Equivalent full-time student load
ERA Excellence in Research for Australia
Experimental development research Research using existing knowledge gained from research or practical experience, which is directed to producing new materials, products, devices, policies, behaviours or outlooks.
FEE-HELP HELP for full-fee students

Mapping Australian higher education, 2014-15
Grattan Institute 2014 92
FTE Full-time equivalent
GCA Graduate Careers Australia
Group of Eight Coalition of Australia’s ‘sandstone’ universities
HECS Higher Education Contribution Scheme
HECS-HELP HELP for Commonwealth-supported students
HELP Higher Education Loan Program
HEP Higher Education Provider
HILDA Household, Income and Labour Dynamics in Australia Survey
IRU Innovative Research Universities
LSAY Longitudinal Survey of Australian Youth
NCVER National Centre for Vocational Education Research
NHMRC National Health and Medical Research Council
NUHEP Non-university higher education provider
OUA Open Universities Australia
Pathway college Institution specialising in diploma level courses aimed at facilitating entry to university courses.
Pure basic research Research to acquire new knowledge without looking for long term benefits other than the advancement of knowledge.
RUN Regional Universities Network
SA-HELP HELP for the student amenities fee
SES Socio-economic status
Strategic basic research Research directed into specified broad areas in the expectation of practical discoveries.
Student contribution The amount paid by a student in a Commonwealth-supported place
TAFE Technical and further education
TEQSA Tertiary Education Quality and Standards Agency

Mapping Australian higher education, 2014-15
Grattan Institute 2014 93
Appendix A – Higher education providers with HELP eligibility Universities NUHEPs eligible for FEE-HELP
Group of Eight Regional Universities Network Academy of Design Australia Australian National University^ Central Queensland University* Academy of Information Technology Monash University^ Southern Cross University* Academy of Music and Performing Arts The University of Adelaide^ Federation University Australia* Adelaide Central School of Art The University of New South Wales^ The University of New England Adelaide College of Divinity The University of Melbourne^ University of Southern Queensland* Alphacrucis College The University of Sydney^ University of the Sunshine Coast Australian College of Physical Education The University of Queensland^ Australian College of Theology ° The University of Western Australia Other universities Australian Film, Television and Radio School° Australian Catholic University* Australian Guild of Music Education
Australian Technology Network of Universities Charles Sturt University* Australian Institute of Management SA Curtin University of Technology Bond University Australian Institute of Music Queensland University of Technology* Deakin University^ Australian Institute of Professional Counsellors RMIT University* Edith Cowan University* Australian Institute of Professional Education University of South Australia* Macquarie University^ Australian School of Management University of Technology, Sydney* University of Divinity Avondale College Swinburne University of Technology*^ Batchelor Institute of Indigenous Education°
Innovative Research Universities Torrens University Australia Blue Mountains International Hotel Management School Charles Darwin University* University of Canberra* Box Hill Institute Flinders University University of Notre Dame, Australia Cairnmillar Institute Griffith University^ University of Tasmania^ Campion Institute James Cook University^ University of Wollongong Canberra Institute of Technology La Trobe University^ University of Western Sydney* Chifley Business School Murdoch University Victoria University* Chisholm Institute The University of Newcastle^ Christian Heritage College Overseas universities College of Law Carnegie Mellon University Curtin College University College London Educational Enterprises Australia

Mapping Australian higher education, 2014-15
Grattan Institute 2014 94
* Established or given university status as a result of the John Dawkins education reforms ^ Amalgamated with other providers during the John Dawkins education reforms ° Self-accrediting NUHEP Notes: Charles Darwin University was the Northern Territory University until 2004. Federation University Australia was the University of Ballarat until 2014. The University of the Sunshine Coast was established in 1998. The Australian Technology Network (ATN) universities teach over 200,000 students and emphasise research in collaboration with industry. The Innovative Research Universities of Australia (IRU) teach over 180,000 students. It is mostly comprised of research universities founded in the 1960s and 1970s. The Group of Eight (Group of Eight) teaches over 325,000 students. Its members are the most research-intensive universities in Australia. The six members of the Regional Universities Network (RUN) teach over 100,000 students. It was founded in 2011 to enhance the contribution its members make to their regions.
NUHEPs eligible for FEE-HELP (Continued) Endeavour College of Natural Health Marcus Oldham College Queensland Institute of Business and Technology
Gestalt Therapy Brisbane Melbourne Institute for Experiential and Creative Arts Raffles College
Group Colleges Australia Melbourne Institute of Business and Technology SAE Institute
Harvest Bible College Melbourne Institute of Technology South Australian Institute of Business and Technology
Harvest West Bible College Monash College Stotts Colleges
Holmes Institute Moore Theological College° Study Group Australia
Holmesglen Institute Morling College Sydney College of Divinity
Insearch Nan Tien Institute Sydney Institute of Business and Technology
International College of Hotel Management National Art School Tabor College (VIC, NSW, SA, TAS, WA)
International College of Management National Institute of Dramatic Art TAFE NSW
Investment Banking Institute Business School Navitas Bundoora TAFE Queensland
Jazz Music Institute Navitas College of Public Safety TAFE SA
JMC Academy Navitas Professional Institute Think Colleges
John Paul II Institute for Marriage and Family Northern Melbourne Institute of TAFE TOP Education Group
Kaplan Business School Paramount College of Natural Medicine UOW College
Kaplan Higher Education Perth Bible College Vose College of Higher Education
Kent Institute of Business and Technology Perth Institute of Business and Technology Wesley Institute
Le Cordon Bleu Australia Phoenix Institute of Australia West Coast Institute Leo Cussen Institute Photography Studies College Whitehouse Institute Macleay College Polytechnic West William Angliss Institute of TAFE

Mapping Australian higher education, 2014-15
Grattan Institute 2014 95
Appendix B – Higher education providers without HELP eligibility
Sources: Department of Education (2014g); TEQSA (2014a)
HEPs not eligible for FEE-HELP Academies Australasia Polytechnic Equip Training Mayfield Education
ACER Institute Governance Institute of Australia Montessori World Educational Institute
Adelaide College of Ministries Institute for Emotionally Focused Therapy Newcastle International College
Asia Pacific International College Institute of Chartered Accountants in Australia NSW Institute of Psychiatry
Australasian College of Health and Wellness Institute of Internal Auditors OASES Community Learning
Australian College of Nursing Centre for Pavement Engineering Education S P Jain School of Global Management
Australian Institute for Relationship Studies International Institute of Business and Technology Swinburne College
Australian Institute of Higher Education Investment Banking Institute Business School Sydney Institute of Traditional Chinese Medicine
Australian Institute of Management (QLD, NT, VIC, TAS) King’s Own Institute Turning Point Alcohol & Drug Centre
Australian Institute of Police Management Kollel Academy of Advanced Jewish Education Wentworth Institute
Cambridge International College Law Society of South Australia Worldview Centre for Intercultural Studies
Central Institute of Technology

Mapping Australian higher education, 2014-15
Grattan Institute 2014 96
References
ABS (1982) The labour force: educational attainment, Australia, February 1981, Cat. 6235.0, Australian Bureau of Statistics
ABS (2001) Australian standard classification of education (ASCED), Cat 1272.0, Australian Bureau of Statistics
ABS (2006) Australia and New Zealand standard classification of occupations (ANZSCO), Cat. 1220.0, First Edition, Revision 1, Australian Bureau of Statistics
ABS (2008) Australian historical population statistics, Cat. 3105.0.65.001, Australian Bureau of Statistics
ABS (2010) Education and training experience 2009, Cat. 6278.0, Australian Bureau of Statistics
ABS (2011) Perspectives on education and training: social inclusion, 2009, Cat. 4250.0.55.001, Australian Bureau of Statistics
ABS (2013a) Australian Demographic Statistics 2013, Cat. 3101.0, Australian Bureau of Statistics
ABS (2013b) Education and work 2013, Cat. 6227.0, Australian Bureau of Statistics
ABS (2013c) Labour force, Australia, Cat. 6202.0, Australian Bureau of Statistics
ABS (2013d) Programme for the International Assessment of Adult Competences, Australia, 2011-12, Cat. 4228.0, Australian Bureau of Statistics
ABS (2014a) International trade in services by country, by state and detailed services category, Cat. 5368.055.004, Australian Bureau of Statistics
ABS (2014b) Research and experimental development, higher education organisations, Australia, 2012, Cat. 8111.0, Australian Bureau of Statistics
Access Economics (2007) Higher education: cost relativities and pipeline, Commissioned by Department of Education, Science and Training
AQF (2013) Australian Qualifications Framework, Second Edition, from
http://www.aqf.edu.au/Portals/0/Documents/2013%20docs/AQF%202nd%20Edition%20January%202013.pdf
ARC (2012) Excellence in Research for Australia: 2012 Report, Australian Research Council
ARC (2013) 'Discovery Projects: Selection report for funding commencing in 2014', from http://www.arc.gov.au/pdf/DP14/DP14_Selection_Report.pdf
ARC (2014a) Funding rules for schemes under the Discovery Program for the years 2014 and 2015, Australian Research Council
ARC (2014b) Linkage projects: selection report for funding commencing in 2014, Australian Research Council
ARWU (2014) 'Academic Ranking of World Universities', accessed 24 August 2014, from http://www.shanghairanking.com/World-University-Rankings-2014/Australia.html
ATO (2014) 'HELP repayment threshold and rates', accessed 22 August 2014, from https://www.ato.gov.au/rates/help-repayment-thresholds-and-rates/
Behrman, J., Rosenzweig, M. and Taubman, P. (1996) 'College choice and wages: estimates using data on female twins', Review of Economics & Statistics, 78, p 672-785
Bentley, P. J., Coates, H., Dobson, I. R., Goedegebuure, L. and Meek, V. L. (2013a) 'Academic Job Satisfaction from an International Comparative Perspective: Factors Associated with Satisfaction Across 12 Countries', in Job Satisfaction around the Academic World, P J Bentley, H Coates, I R Dobson, L Goedegebuure and V. L. Meek, Eds., Springer Netherlands
Bentley, P. J., Coates, H., Dobson, I. R., Goedegebuure, L. and Meek, V. L. (2013b) 'Factors associated with job satisfaction amongst Australian university academics and future workforce implications', in Job Satisfaction around the Academic World, P J Bentley, H Coates, I R Dobson, L Goedegebuure and V. L. Meek, Eds., Springer Netherlands

Mapping Australian higher education, 2014-15
Grattan Institute 2014 97
Bexley, E., James, R. and Arkoudis, S. (2011) The Australian academic profession in transition, Centre for the Study of Higher Education, The University of Melbourne
Birch, E., Li, I. W. and Miller, P. (2009) 'The influences of institution attended and field of study on graduates' starting salaries', Australian Economic Review, 42, p 42-63
Black, D. A., Kermit, D. and Smith, J. A. (2005) 'College quality and wages in the United States', German Economic Review, 6(3), p 415-443
Bond University (2013) Bond University annual report 2012, Bond University
Brew, A. (2010) 'Imperatives and challenges in integrating teaching and research', Higher Education Research and Development, 29(2), p 139-150
Brewer, D., Eide, E. and Ehrenberg, R. (1999) 'Does it pay to attend an elite private college?', Journal of Human Resources, 34(1), p 104-123
Cherastidtham, I., Sonnemann, J. and Norton, A. (2013) The teaching-research nexus in higher education: Background paper supporting the Taking university teaching seriously report, Grattan Institute from http://grattan.edu.au/wp-content/uploads/2013/07/191a_background_teaching-research_nexus_in_higher_education.pdf
Coaldrake, P. and Stedman, L. (2013) Raising the stakes: Gambling with the future of universities, University of Queensland Press
Coates, H., Dobson, I., Edwards, D., Friedman, T., Goedegebuure, L. and Meek, L. (2009) The attractiveness of the Australian academic profession: A comparative analysis, LH Martin Institute, Australian Council for Educational Research
Coates, H. and Edwards, D. (2009) The 2008 Graduate Pathways Survey: Graduate education and employment outcomes five years after completion of a bachelor degree at an Australian university, Australian Council for Educational Research
Coates, H. and Friedman, T. (2010) 'Evaluation of the Special Tertiary Admissions Test (STAT)', Journal of Higher Education Policy,
32(2), p 117-126 Commonwealth of Australia (2014) Budget 2014-15: Higher Education
Department of Education from http://www.budget.gov.au/2014-15/content/glossy/education/html/index.htm
Croucher, G., Marginson, S., Norton, A. and Wells, J., Eds., (2013) The Dawkins revolution 25 years on, Melbourne University Press
DEET (1993) National Report on Australia's Higher Education Sector, Department of Employment, Education and Training
DEEWR (2000) Higher education students time series tables, 2000: selected higher education statistics, Department of Education, Employment and Workplace Relations
DEEWR (2009) Undergraduate applications, offers and acceptances 2009, Department of Education, Employment and Workplace Relations
DEEWR (2010) The higher education base funding review: background paper, Department of Education, Employment and Workplace Relations
DEEWR (2012) Higher education report 2010, Department of Education, Employment and Workplace Relations
Department of Education (2013a) 2012 Research income and publications data by sub-category, Department of Education from https://docs.education.gov.au/node/34561
Department of Education (2013b) Finance 2012: financial reports of higher education providers, Department of Education
Department of Education (2013c) Staff: Selected higher education statistics 2013, Department of Education
Department of Education (2013d) Students: Selected higher education statistics 2012, Department of Education
Department of Education (2013e) Undergraduate applications, offers and acceptances, 2013, Department of Education
Department of Education (2014a) Award course completions 2013, Department of Education from https://docs.education.gov.au/node/35987
Department of Education (2014b) Completion rates of domestic bachelor degree students: a cohort analysis, Department of Education

Mapping Australian higher education, 2014-15
Grattan Institute 2014 98
Department of Education (2014c) Higher education research data collection, Department of Education from https://education.gov.au/data-used-research-block-grant-rbg-funding-formulae
Department of Education (2014d) Portfolio budget statements 2014-15, Education portfolio, Department of Education
Department of Education (2014e) Students: Selected higher education statistics 2013, Department of Education
Department of Education (2014f) Study Assist website, Department of Education from http://studyassist.gov.au/sites/StudyAssist/
Department of Education (2014g) Study Assist website, univeristies and other higher education providers offering Commonwealth assistance, Department of Education from http://studyassist.gov.au/sites/studyassist/mytertiarystudyoptions/providers-that-offer-commonwealth-assistance/pages/universities-and-other-higher-education-providers
Department of Education (2014h) uCube - Higher education statistics, Department of Educationfrom http://highereducationstatistics.education.gov.au/
Department of Education (various years) Finance: Selected higher education statistics, Department of Education
Department of Employment (2014) Skill shortage ratings - 1986 to 2013, Department of Employment from https://employment.gov.au/skill-shortages
Department of Immigration and Border Protection (2014a) Student visa and temporary graduate visa programme quarterly report, quarter ending at 30 June 2014, Department of Immigration and Border Protection
Department of Immigration and Border Protection (2014b) Temporary graduate visa (subclass 485), accessed 23 August 2014, from https://www.immi.gov.au/Visas/Pages/485.aspx
Department of Industry (2013) 2013-14 Science, Research and Innovation Budget Tables, Department of Industry
Department of Social Services (2014) Portfolio budget statements, social
services portfolio, Department of Social Services DEST (2002) Students: Selected higher education statistics 2001,
Australian Department of Education, Science and Training DETYA (1999) Selected higher education staff statistics, 1998,
Department of Training, Education and Youth Affairs DETYA (2000) Staff: Selected higher education statistics, Department of
Education, Training and Youth Affairs DIBP (2014) Student visa programme quarterly report: quarter ending at
31 December 2013, Department of Immigration and Border Protection
DIICCSRTE (2012a) Higher education standards framework (threshold standards) 2011, Department of Industry, Innovation, Science, Research and Tertiary Education
DIICCSRTE (2012b) Students: Selected higher education statistics 2011, Department of Industry, Innovation, Climate Change, Science, Research and Tertiary Education
DIICCSRTE (2013a) Annual Report 2012-13, Department of Industry, Innovation, Climate Change, Science, Research and Tertiary Education
DIICCSRTE (2013b) Higher education standards framework (threshold standards) 2011, Department of Industry, Innovation, Science, Research and Tertiary Education
DIICCSRTE (2013c) Student services, amenities, representation and advocacy guidelines, Department of Industry, Innovation, Climate Change, Science, Research and Tertiary Education from http://www.comlaw.gov.au/Details/F2013C00519/Download
DIISRTE (2011) National survey of research commercialisation 2008 and 2009, Department of Industry, Innovation, Science, Research and Tertiary Education, accessed 18/12/12, from http://www.innovation.gov.au/INNOVATION/REPORTSANDSTUDIES/Pages/NationalSurveyofResearchCommercialisation.aspx
DIISRTE (2012a) Annual Report 2011-12 Department of Industry, Innovation, Science, Research and Tertiary Education
DIISRTE (2012b) 'Resarch Block Grants - Calculation Methodology', accessed 20/12/12, from

Mapping Australian higher education, 2014-15
Grattan Institute 2014 99
http://www.innovation.gov.au/RESEARCH/RESEARCHBLOCKGRANTS/Pages/CalculationMethodology.aspx#RTS
Economic Society of Australia (2004) A survey of student standards in economics in Australian universities, 2003, Economic Society of Australia
Edwards, D. (2008) International engagements: the characteristics of international students' engagement with university, Australian Council for Educational Research
Edwards, D., Bexley, E. and Richardson, S. (2011) Regenerating the academic workforce: The careers, intentions and motivations of higher degree research students in Australia: Findings of the National Research Student Survey (NRSS), Australian Council for Educational Research
Finkin, M. W. and Post, R. (2009) For the common good: principles of American academic freedom, Yale University Press
Forsyth, H. (2014) A history of the modern Australian university, NewSouth Publishing
GCA (1979-2014) Graduate Destination Survey, Graduate Careers Australia
GCA (1995-2014) Graduate course experience questionnaire report, Graduate Careers Australia
GCA (2013a) GradStats: employment and salary outcomes for recent higher education graduates 2013, Graduate Careers Australia
GCA (2013b) Graduate Salaries 2013, Graduate Careers Australia from http://www.graduatecareers.com.au/wp-content/uploads/2014/07/AGS_reports/GCA_Graduate_Salaries_2013/GCA_Graduate_Salaries_2013.pdf
GCA (2014a) Beyond Graduation 2013: the report of the beyond graduation survey, Graduate Careers Australia
GCA (2014b) Graduate Destinations 2013: A report on the work and study outcomes of recent higher education graduates, Graduate Careers Australia
GCA (2014c) Graduate outlook 2013: The report of the graduate outlook survey: employers' perspectives on graduate recruitment, Graduate Careers Australia
Gerber, T. P. and Cheung, S. Y. (2008) 'Horizonal stratification in postsecondary education', The Annual Review of Sociology, 34, p 299-318
Graduate Careers Australia/Social Research Centre (2014) 2013 University Experience Survey National Report, Graduate Careers Australia/Social Research Centre
Group of Eight (2014) Policy note: courses and quality assurance in Australian higher education, Group of Eight
Guthrie, B. and Bryant, G. (2014) Postgraduate destinations 2013: A report on the work and study outcomes of recent higher education graduates, Graduate Careers Australia
Heckman, J. (1999) Policies to foster human capital, NBER Working Paper Series, No. 7288
HILDA (2012) Household, Income and Labour Dynamics in Australia Survey, Melbourne Institute of Applied Economic and Social Research, University of Melbourne
Ho, A., Reich, J., Nesterko, S., Seaton, D., Mullaney, T., Waldo, J. and Chuang, I. (2014) HarvardX and MITx: The first year of open online courses, Harvard and MIT Working Paper No. 1
Hoxby, C. (1997) How the changing market structure of US higher education explains college tuition, NBER Working Paper Series, No. 6323
Hussain, I., McNally, S. and Telhaj, S. (2009) University quality and graduate wages in the UK, CEE Discussion Papers, London School of Economics
Jackson, H. (2005) 'Express rights to academic freedom in Australian public university employment', Southern Cross University Law Review, 9, p 107-145
James, R., Bexley, E. and Shearer, M. (2009) Improving Selection for Tertiary Education Places in Victoria, Centre for the Study of Higher Education, University of Melbourne
Kemp, D. and Norton, A. (2014) Review of the demand driven system: final report, Department of Education
Larkins, F. (2011) Australian higher education research policies and performance 1987-2010, Melbourne University Press

Mapping Australian higher education, 2014-15
Grattan Institute 2014 100
Lawton, W. and Katsomitros, A. (2012) International branch campuses: Data and developments, The Observatory on Borderless Higher Education
Lee Dow, K. and Braithwaite, V. (2013) Review of higher education regulation report, Australian Government
Lee, J. (2014) 'The attainablity of university degrees and their labour market benefits for young Australians', Higher Education, 68(3), p 449-469
Leigh, A. (2008) 'Returns to education in Australia', Economic Papers, 27(3), p 233-249
Li, I. W. and Miller, P. (2013) 'The absorption of recent graduates into the Australian labour market: variations by university attended and field of study', Australian Economic Review, 46(1), p 14-30
Lindahl, L. and Regner, H. (2005) 'College choice and subsequent earnings: Results using Swedish sibling data', The Scandinavian Journal of Economics, 107(3), p 437-457
Lomax-Smith, J., Watson, L. and Webster, B. (2011) Higher education base funding review, final report, Department of Education, Employment and Workplace Relations
Macintyre, S. (2010) The poor relation: A history of the social sciences in Australia, Melbourne University Press
Macmillan, D. (1968) Australian Universities, Sydney University Press Marginson, S. (2014) 'University rankings and social science', European
Journal of Education, 49(1), p 45-59 Marks, G. and Macmillan, J. (2007) 'Australia: Changes in
socioeconomic inequalities in university participation', in Stratification in higher education: A comparative study, Y. Shavit, R. Arum and A. Gamoran, Eds., Stanford University Press
May, R. (2011) 'Casualisation; here to stay? The modern university and its divided workforce', Association of Industrial Relations Academics of Australia and New Zealand 2011 Annual Conference, accessed 19/12/2012, from http://www.nteu.org.au/article/Casualisation%3A-here-to-stay%3F-The-modern-university-and-its-divided-workforce-
11182 May, R., Peetz, D. and Strachan, G. (2013) 'The casual academic
workforce and labour segementation in Australia', Labour and Industry, 23(3), p 258-275
McAllister, I. (2014) ANU-SRC Poll: Changing views of goverannce, results from ANU Poll 2008 and 2014 (report no. 14), Australian National University
McAllister, I. and Pietsch, J. (2012) World values survey Australia, 2012, Australian Data Archive, Australian National University
McAllister, I., Pietsch, J., Bean, C. and Gibson, R. (2001-2010) Australian election study, Australian Data Archive, Australian National University
McAllister, I., Pietsch, J., Bean, C. and Gibson, R. (2011) Australian Election Study 2010, Australia Data Archive, Australian National University, from http://www.ada.edu.au/social-science/01228
MCEETYA (2000) National protocols for higher education approval processes, Ministerial Council on Education, Employment and Youth Affairs
MCEETYA (2007) National protocols for higher education approval processes, Ministerial Council on Education, Employment and Youth Affairs
Meadows, E. (2011) 'From aid to industry: A history of international education in Australia', in Making a difference: Australian international education D. Davis and B. Mackintosh, Eds., UNSW Press
Miller, P. and Volker, P. (1982) Starting salaries and destinations of graduates in Australia, Centre for Economic Policy Research, Australian National University, paper no. 56
Moran, T. (2011) 'Opening up policy development for knowledge exchanges', 22 March, accessed, from http://www.chass.org.au/speeches/SPE20110322TM.php
Navitas (2014) Investing for success: full year results for the year ended 30 June 2014, Navitas Ltd, accessed 5 August 2014, from http://www.navitas.com/corporate/investors
NHMRC (2013) NHMRC grants funding 2004-2013, National Health and
Mapping Australian higher education, 2014-15
Grattan Institute 2014 101
Medical Research Council Norton, A. (2005) The free market case against voluntary student
unionism, Issue Analysis paper no. 62, Centre for Independent Studies
Norton, A. (2009) 'Markets and central planning in meeting labour market needs: lessons from higher education', in Competition in the training market, T. Karmel, F. Beddie and S. Dawe, Eds., National Centre for Vocational Education Research
Norton, A. (2012) Mapping Australian higher education, Grattan Institute Norton, A. (2012a) Graduate Winners: Assessing the public and private
benefits of higher education, Grattan Institute Norton, A. (2014) Unleashing student demand by ending number
controls in Australia: An incomplete experiment, Higher Education Policy Institute
Norton, A. and Cherastidtham, I. (2014) Doubtful debt: the rising cost of student loans, Grattan Institute
Norton, A., Sonnemann, J. and McGannon, C. (2013) The online evolution: When technology meets tradition in higher education, Grattan Institute
Palmer, N., Bexley, E. and James, R. (2011) Selection and participation in higher education: University selection in support of student success and diversity of participation, Prepared for the Group of Eight, Centre for the Study of Higher Education, accessed 3 January 2013, from http://www.go8.edu.au/__documents/go8-policy-analysis/2011/selection_and_participation_in_higher_education.pdf
Poynter, J. and Rasmussen, C. (1996) A Place Apart: The University of Melbourne, Decades of Challenge, Melbourne University Press
Quacquarelli Symonds (2014) 'QS World University Rankings 2014-15', from http://www.topuniversities.com/
Roy Morgan Research (2013) Happy days: job satisfaction in Australia, Article 5308
SEEK (2014) SEEK 2013-14 statutory accounts, SEEK Limited Senate (2014) Tertiary Education Quality and Standards Agency
Amendment Bill 2014, Education and Employment Legislation Committee
Shergold, P. (2011) 'Seen but not heard', The Australian, 4 May, Strachan, G., Troup, C., Peetz, D., Whitehouse, G., Broadbent, K. and
Bailey, J. (2012) Work and careers in Australian universities: Report on employee survey, Centre for Work, Organisation and Wellbeing, Griffith University
TEQSA (2013) Application guide: application for registration as a higher education provider, version 2.2, Tertiary Education Quality and Standards Agency
TEQSA (2014a) National Register of Higher Education Providers, Tertiary Education Quality and Standards Agency from http://www.teqsa.gov.au/national-register
TEQSA (2014b) Process guide: accreditation of a new higher education course of study (June 2014), Tertiary Education Quality and Standards Agency
TEQSA (2014c) Statistics report on TEQSA registered higher education providers, Tertiary Education Quality and Standards Agency
Thomas, S. L. (2000) 'Deferred costs and economic returns to college major, quality, and performance', Research in Higher Education, 41(3), p 281
Thomas, S. L. (2003) 'Longer-term economic effects of college selectivity and control', Research in Higher Education, 44(3),
Times Higher Education (2014-15) 'Times Higher Education World University Rankings', from http://www.timeshighereducation.co.uk/world-university-rankings/
Tremblay, K., Lalancette, D. and Roseveare, D. (2012) Assessment of higher education learning outcomes: Feasibility study report, volume 1 design and implementation, OECD
Universities Australia (1995-2008) Higher education research data collection, http://www.universitiesaustralia.edu.au/page/australia-s-universities/key-facts---data/research-activities/, Universities Australia

Mapping Australian higher education, 2014-15
Grattan Institute 2014 102
Watson, L. (2000) Survey of private providers in Australian higher education, 1999, Department of Education, Training and Youth Affairs
Williams, G. and Pillai, S. (2011) 'Commonwealth power over higher education', University of Queensland Law Journal, 30(2), p 287-303
Wilson, S., Meagher, G., Gibson, R., Denemark, D. and Western, M. (2003) Australian social attitudes, Australian Data Archive, Australian National University
Wilson, S., Meagher, G., Gibson, R., Denemark, D. and Western, M. (2005) Australian social attitudes, Australian Data Archive, Australian National University
Zhang, L. (2005) 'Do measures of college quality matter? The effect of college quality on graduates' earnings', The Review of Higher Education, 28(4), p 2005
Zhang, L. (2007) 'The way to wealth and the way to leisure: The impact of college education on graduates' earnings and hours work', Research in Higher Education 49(3), p 199-213