Embed Size (px)
Citation preview
MAPCHANGE 2010
604 738 8080 | getmapchange.com | Suite 204, 1650 Duranleau Street, Granville Island, Vancouver, BC, Canada
MAPCHANGE 2010
TABLE OF CONTENTS
1. MapChange 4
2. Methodology 5
3. Complete MapChange Report & Brand Scores 6-25
a. Food & Beverage Sector 6-7
b. Apparel Sector 8-9
c. Household Sector 10-11
d. Internet/Software/Media Sector 12-13
e. Electronics Sector 14-15
f. Airlines Sector 16-17
g. Hotels Sector 18-19
h. Food Services Sector 20-21
i. Consumer Shipping Sector 22-23
j. Banks Sector 24-25
MAPCHANGE 2010
604 738 8080 | getmapchange.com | Suite 204, 1650 Duranleau Street, Granville Island, Vancouver, BC, Canada
MAPCHANGE 2010
TABLE OF CONTENTS
4. Insights 26
5. The 5 C’s of Sustainability Branding 27
6. About Change 28
7. About Climate Counts 29
8. About Angus Reid Public Opinion 29
9. The Story of MapChange – The Interview 30-31
Appendix 1: Climate Counts Scorecard 32
Appendix 2: Survey Methodology 33-34
Appendix 3: Limitations 35
Contact Us 36
MAPCHANGE 2010
604 738 8080 | getmapchange.com | Suite 204, 1650 Duranleau Street, Granville Island, Vancouver, BC, Canada
4
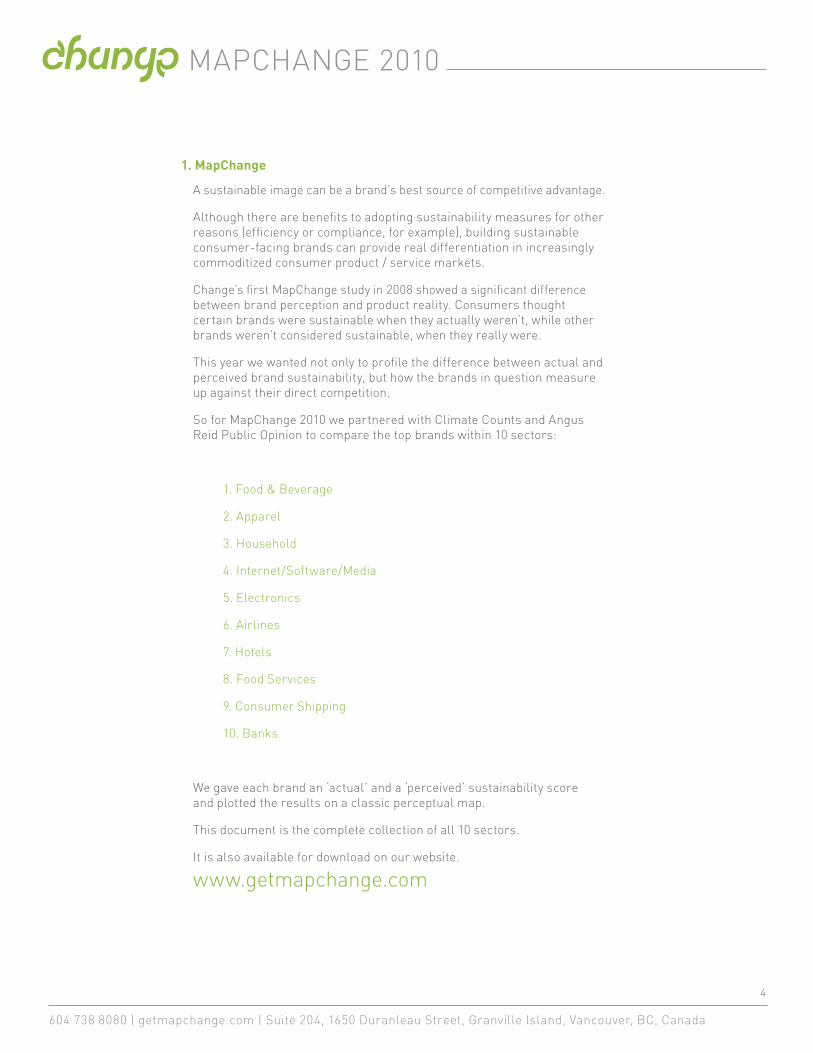
1. MapChange
A sustainable image can be a brand’s best source of competitive advantage.
Although there are benefits to adopting sustainability measures for other reasons (efficiency or compliance, for example), building sustainable consumer-facing brands can provide real differentiation in increasingly commoditized consumer product / service markets.
Change’s first MapChange study in 2008 showed a significant difference between brand perception and product reality. Consumers thought certain brands were sustainable when they actually weren’t, while other brands weren’t considered sustainable, when they really were.
This year we wanted not only to profile the difference between actual and perceived brand sustainability, but how the brands in question measure up against their direct competition.
So for MapChange 2010 we partnered with Climate Counts and Angus Reid Public Opinion to compare the top brands within 10 sectors:
1. Food & Beverage
2. Apparel
3. Household
4. Internet/Software/Media
5. Electronics
6. Airlines
7. Hotels
8. Food Services
9. Consumer Shipping
10. Banks
We gave each brand an ‘actual’ and a ‘perceived’ sustainability score and plotted the results on a classic perceptual map.
This document is the complete collection of all 10 sectors.
It is also available for download on our website.
www.getmapchange.com
MAPCHANGE 2010
604 738 8080 | getmapchange.com | Suite 204, 1650 Duranleau Street, Granville Island, Vancouver, BC, Canada
5
2. Methodology
We used two distinct methods to calculate actual and perceived leadership in addressing climate change.
Actual Sustainability
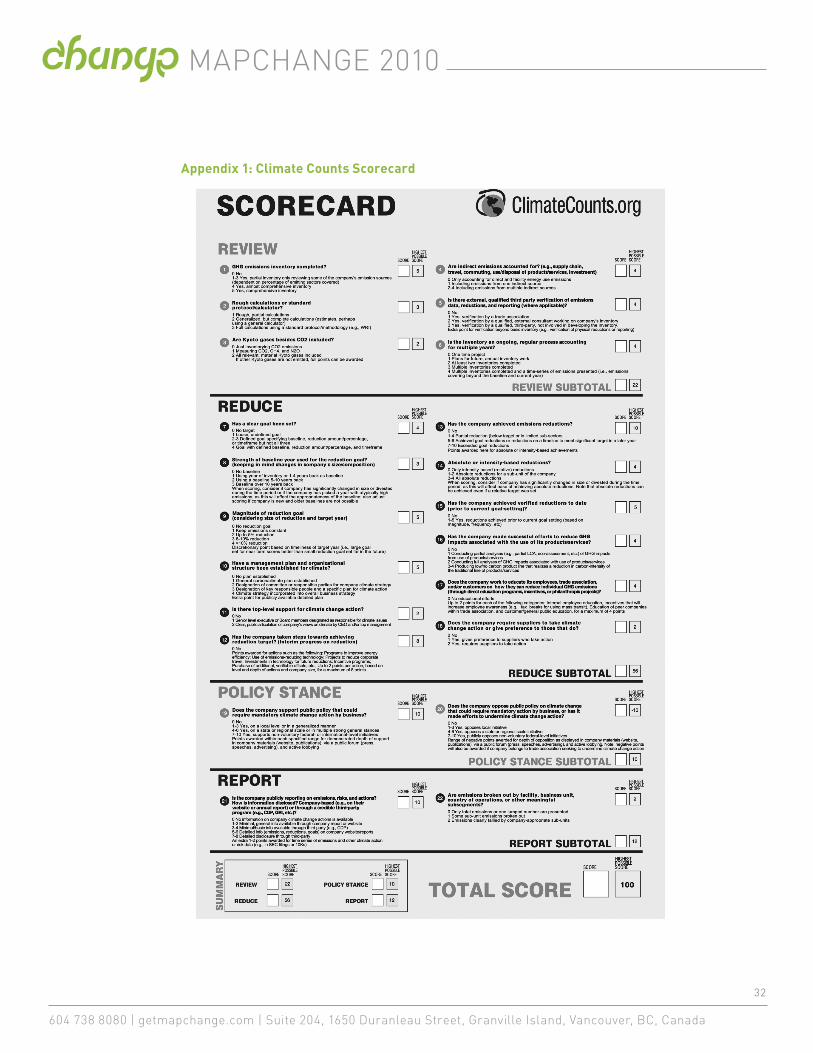
To measure actual brand sustainability we used Climate Counts newly released 2010 corporate climate scores. For the past three years, Climate Counts has audited the brands within all 10 sectors using a scorecard that tracks corporate climate action in four key areas: measurement of impact, reduction of impact, engagement on public policy related to climate change and openness and transparency with consumers on corporate climate activities.
Climate Counts Scorecard
Climate Counts uses a 0-to-100 point scale and 22 criteria to determine if companies have:
• MEASURED their climate “footprint”
• REDUCED their impact on global warming
• SUPPORTED (or suggest intent to block) progressiveclimate legislation
• DISCLOSED (publicly) their climate actions clearlyand comprehensively
The full scorecard can be found in Appendix 1.
Perceived Sustainability
To measure consumer brand perception, Angus Reid Public Opinion conducted an online survey of 2,032 American adults. The results were weighted to ensure a random sample that was representative of the en-tire adult American population.
A ‘maxdiff’ methodology was used to assist the respondents in evaluat-ing the 97 companies represented across 10 different sectors meaning that respondents were asked to “choose the best and worst company in terms of their leadership in addressing climate change” out of a random group of 3-6 companies (dependent on the number of companies in each sector). The survey was divided into two parts, with five sectors in each, to mitigate respondent fatigue and ensure the quality of the data.
The complete survey methodology can be found in Appendix 2.

MAPCHANGE 2010
604 738 8080 | getmapchange.com | Suite 204, 1650 Duranleau Street, Granville Island, Vancouver, BC, Canada
6
AC
TU
AL
PERCEIVED
0 100
010
0
* Stonyfield Farm is a principal funder of Climate Counts and has been scored annually by the organization in the spirit of transparency.
Data Source Climate Counts / Angus Reid Public Opinion
3. Complete MapChange Report & Brand Scores a. Food & Beverage Sector Map
MAPCHANGE 2010
604 738 8080 | getmapchange.com | Suite 204, 1650 Duranleau Street, Granville Island, Vancouver, BC, Canada
7
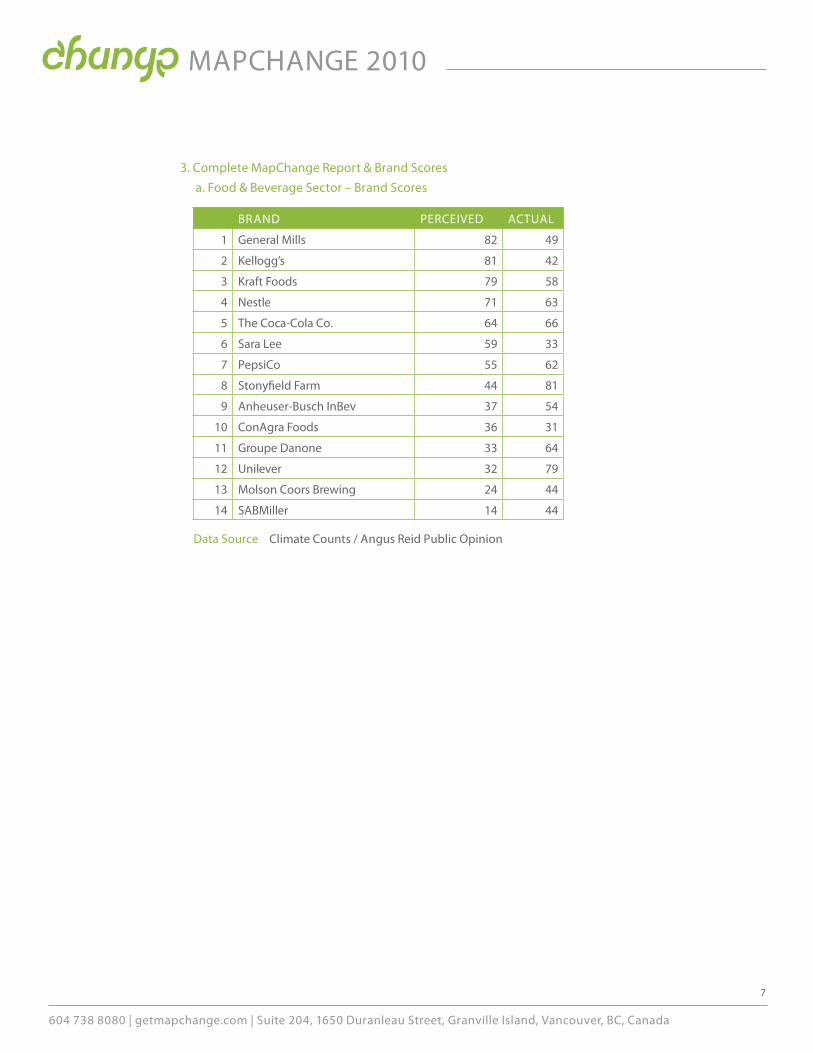
BRAND PERCEIVED ACTUAL
1 General Mills 82 49
2 Kellogg’s 81 42
3 Kraft Foods 79 58
4 Nestle 71 63
5 The Coca-Cola Co. 64 66
6 Sara Lee 59 33
7 PepsiCo 55 62
8 Stonyfield Farm 44 81
9 Anheuser-Busch InBev 37 54
10 ConAgra Foods 36 31
11 Groupe Danone 33 64
12 Unilever 32 79
13 Molson Coors Brewing 24 44
14 SABMiller 14 44
Data Source Climate Counts / Angus Reid Public Opinion
3. Complete MapChange Report & Brand Scores a. Food & Beverage Sector – Brand Scores
MAPCHANGE 2010
604 738 8080 | getmapchange.com | Suite 204, 1650 Duranleau Street, Granville Island, Vancouver, BC, Canada
8
AC
TU
AL
PERCEIVED
0 100
010
0
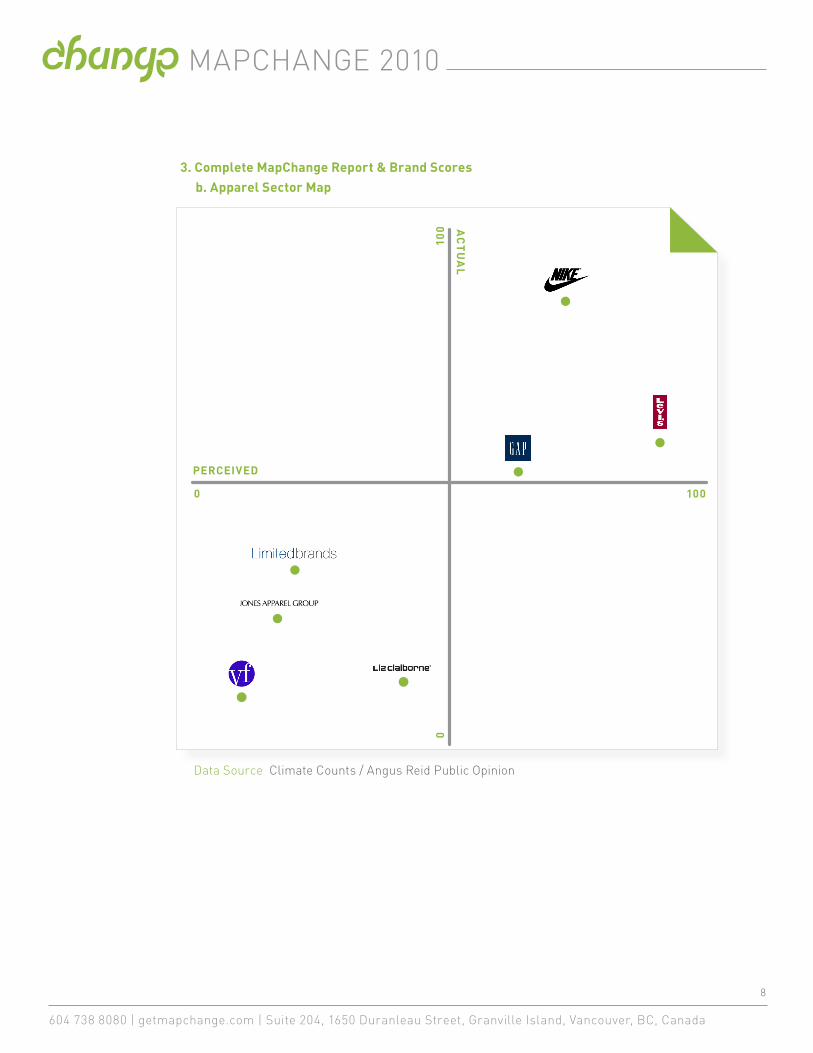
3. Complete MapChange Report & Brand Scores b. Apparel Sector Map
Data Source Climate Counts / Angus Reid Public Opinion
AC
TU
AL
PERCEIVED
0 100
010
0

MAPCHANGE 2010
604 738 8080 | getmapchange.com | Suite 204, 1650 Duranleau Street, Granville Island, Vancouver, BC, Canada
9
BRAND PERCEIVED ACTUAL
1 Levi Strauss 86 58
2 Nike 73 83
3 Gap Inc. 62 52
4 Liz Claiborne 42 7
5 Limited Brands 24 35
6 Jones Apparel Group 22 20
7 VF Corporation 14 6
3. Complete MapChange Report & Brand Scores b. Apparel Sector – Brand Scores
Data Source Climate Counts / Angus Reid Public Opinion
MAPCHANGE 2010
604 738 8080 | getmapchange.com | Suite 204, 1650 Duranleau Street, Granville Island, Vancouver, BC, Canada
10
AC
TU
AL
PERCEIVED
0 100
010
0
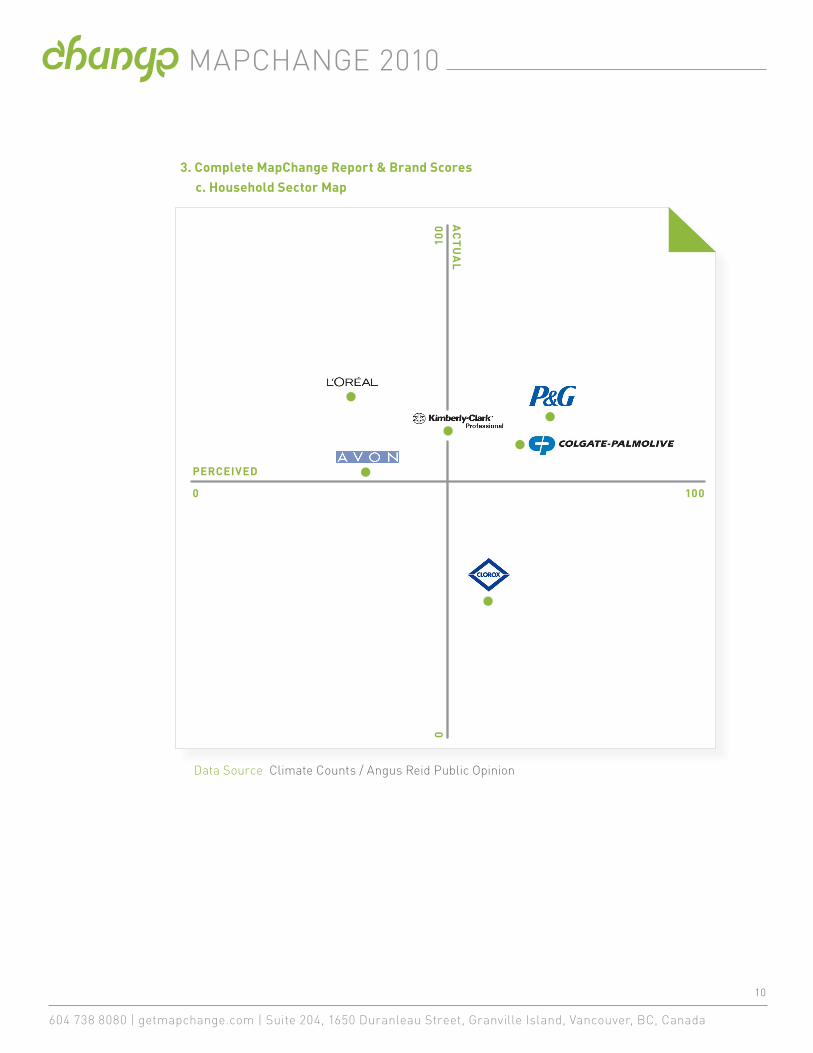
3. Complete MapChange Report & Brand Scores c. Household Sector Map
Data Source Climate Counts / Angus Reid Public Opinion

MAPCHANGE 2010
604 738 8080 | getmapchange.com | Suite 204, 1650 Duranleau Street, Granville Island, Vancouver, BC, Canada
11
BRAND PERCEIVED ACTUAL
1 Procter & Gamble 70 63
2 Colgate-Palmolive 64 59
3 Clorox 56 27
4 Kimberly-Clark 50 59
5 Avon 34 51
6 L’Oreal 33 67
3. Complete MapChange Report & Brand Scores c. Household Sector - Brand Scores
Data Source Climate Counts / Angus Reid Public Opinion
MAPCHANGE 2010
604 738 8080 | getmapchange.com | Suite 204, 1650 Duranleau Street, Granville Island, Vancouver, BC, Canada
12
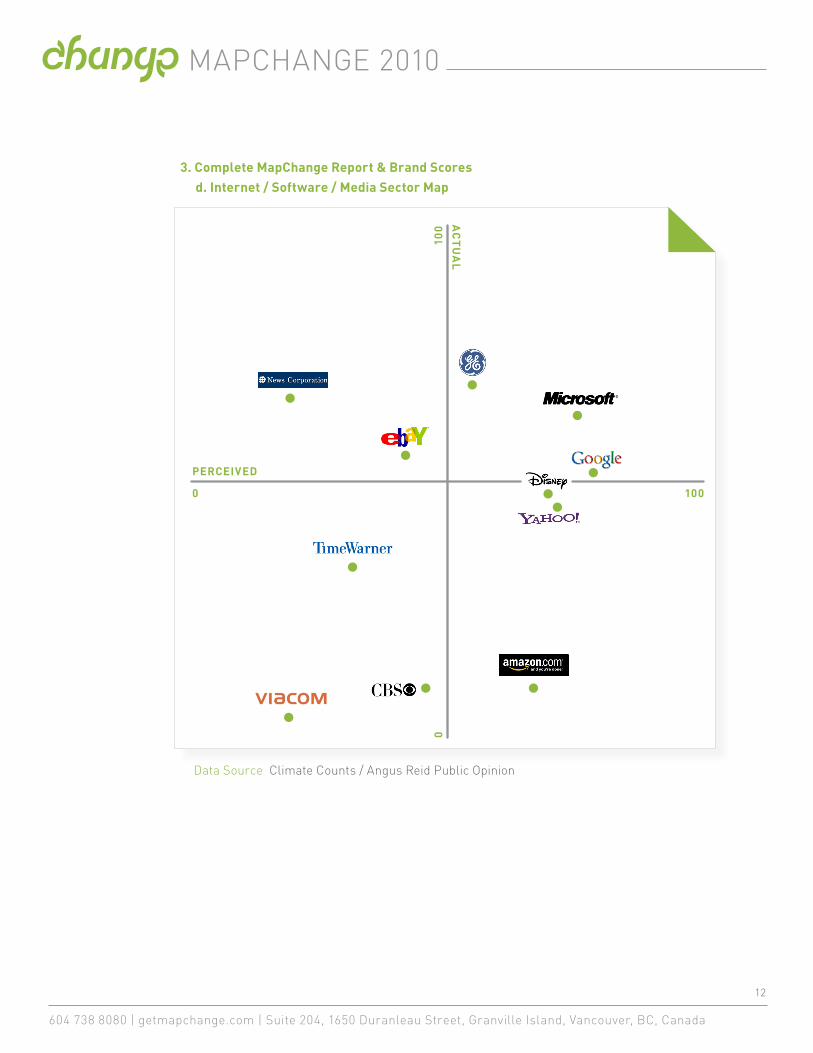
3. Complete MapChange Report & Brand Scores d. Internet / Software / Media Sector Map
Data Source Climate Counts / Angus Reid Public Opinion
AC
TU
AL
PERCEIVED
0 100
010
0

MAPCHANGE 2010
604 738 8080 | getmapchange.com | Suite 204, 1650 Duranleau Street, Granville Island, Vancouver, BC, Canada
13
BRAND PERCEIVED ACTUAL
1 Google 77 52
2 Microsoft 76 61
3 Yahoo 64 45
4 Disney 63 47
5 Amazon.com 60 14
6 General Electric 55 74
7 CBS 45 13
8 eBay 40 53
9 Time Warner 30 36
10 Viacom 17 3
11 News Corp. 16 68
3. Complete MapChange Report & Brand Scores d. Internet / Software / Media Sector – Brand Scores
Data Source Climate Counts / Angus Reid Public Opinion
MAPCHANGE 2010
604 738 8080 | getmapchange.com | Suite 204, 1650 Duranleau Street, Granville Island, Vancouver, BC, Canada
14
0 100
010
0
AC
TU
AL
PERCEIVED
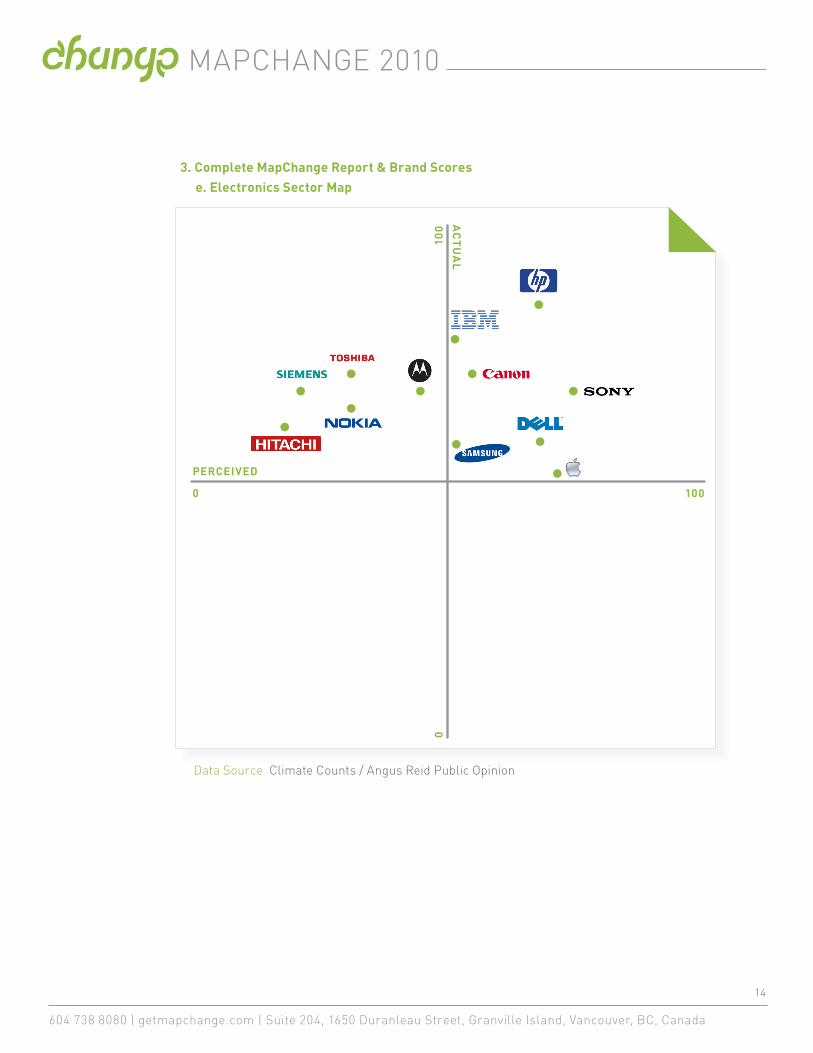
3. Complete MapChange Report & Brand Scores e. Electronics Sector Map
Data Source Climate Counts / Angus Reid Public Opinion
MAPCHANGE 2010
604 738 8080 | getmapchange.com | Suite 204, 1650 Duranleau Street, Granville Island, Vancouver, BC, Canada
15
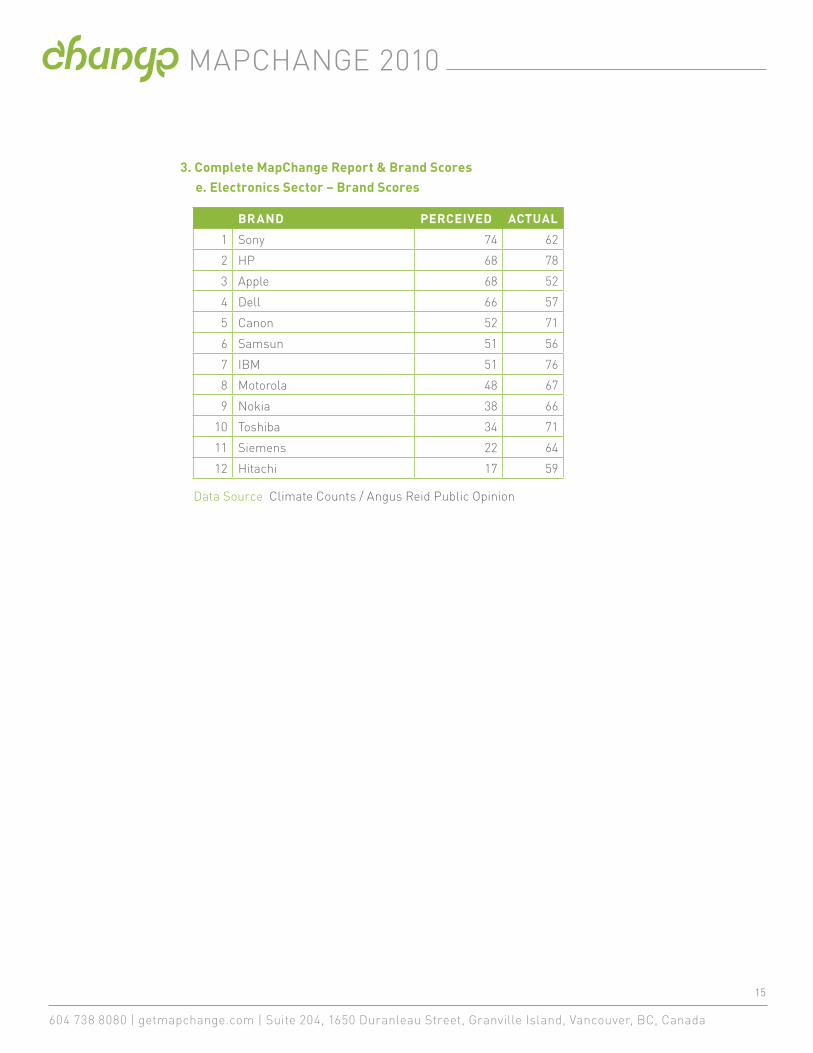
BRAND PERCEIVED ACTUAL
1 Sony 74 62
2 HP 68 78
3 Apple 68 52
4 Dell 66 57
5 Canon 52 71
6 Samsun 51 56
7 IBM 51 76
8 Motorola 48 67
9 Nokia 38 66
10 Toshiba 34 71
11 Siemens 22 64
12 Hitachi 17 59
3. Complete MapChange Report & Brand Scores e. Electronics Sector – Brand Scores
Data Source Climate Counts / Angus Reid Public Opinion
MAPCHANGE 2010
604 738 8080 | getmapchange.com | Suite 204, 1650 Duranleau Street, Granville Island, Vancouver, BC, Canada
16
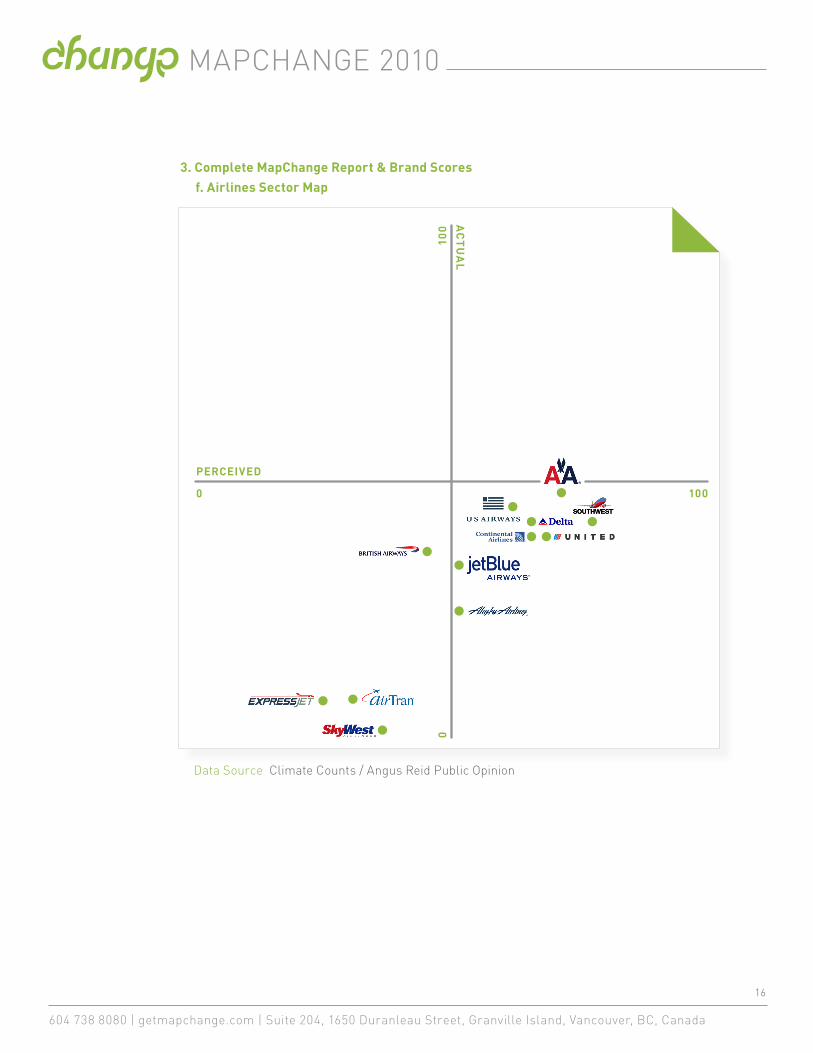
3. Complete MapChange Report & Brand Scores f. Airlines Sector Map
Data Source Climate Counts / Angus Reid Public Opinion
AC
TU
AL
PERCEIVED
0 100
010
0
MAPCHANGE 2010
604 738 8080 | getmapchange.com | Suite 204, 1650 Duranleau Street, Granville Island, Vancouver, BC, Canada
17
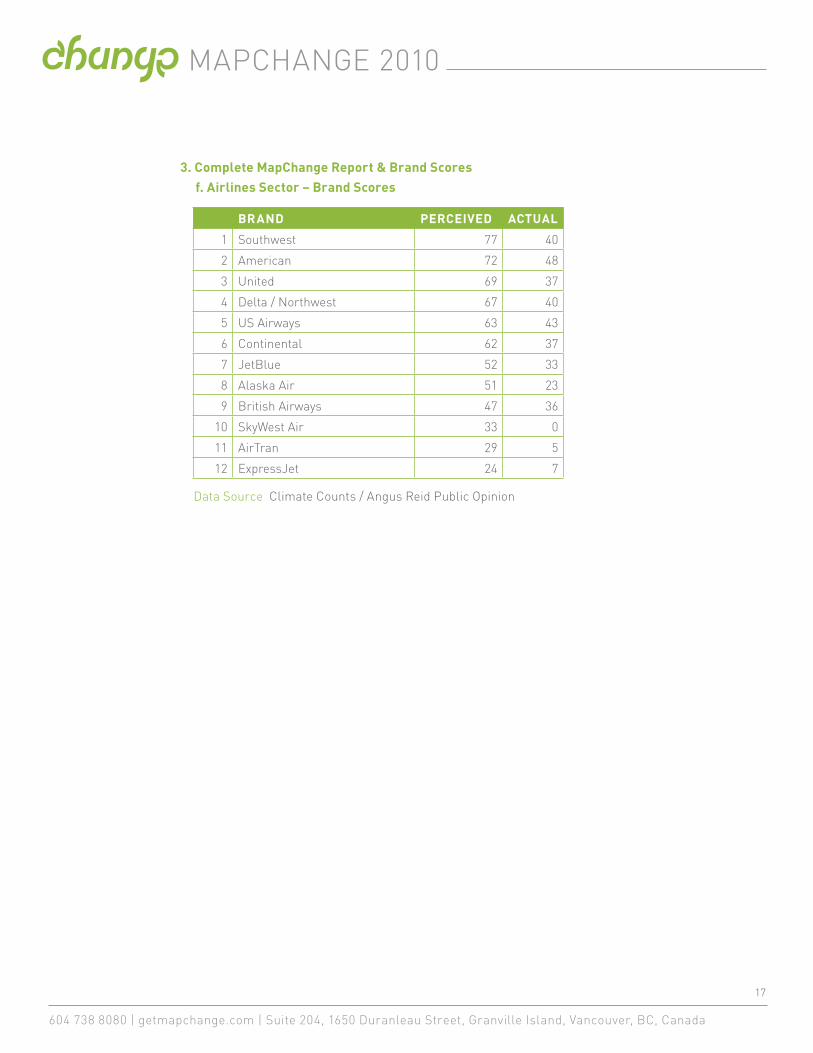
BRAND PERCEIVED ACTUAL
1 Southwest 77 40
2 American 72 48
3 United 69 37
4 Delta / Northwest 67 40
5 US Airways 63 43
6 Continental 62 37
7 JetBlue 52 33
8 Alaska Air 51 23
9 British Airways 47 36
10 SkyWest Air 33 0
11 AirTran 29 5
12 ExpressJet 24 7
3. Complete MapChange Report & Brand Scores f. Airlines Sector – Brand Scores
Data Source Climate Counts / Angus Reid Public Opinion
MAPCHANGE 2010
604 738 8080 | getmapchange.com | Suite 204, 1650 Duranleau Street, Granville Island, Vancouver, BC, Canada
18
AC
TU
AL
PERCEIVED
0 100
010
0
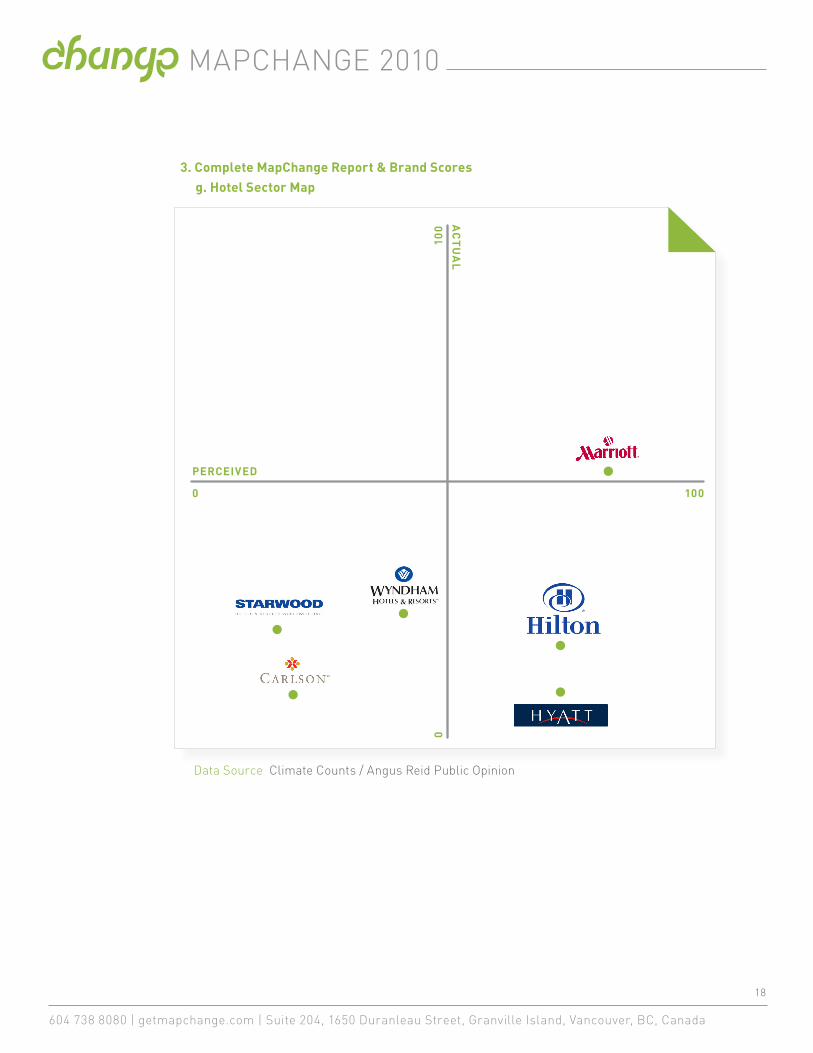
3. Complete MapChange Report & Brand Scores g. Hotel Sector Map
Data Source Climate Counts / Angus Reid Public Opinion
MAPCHANGE 2010
604 738 8080 | getmapchange.com | Suite 204, 1650 Duranleau Street, Granville Island, Vancouver, BC, Canada
19
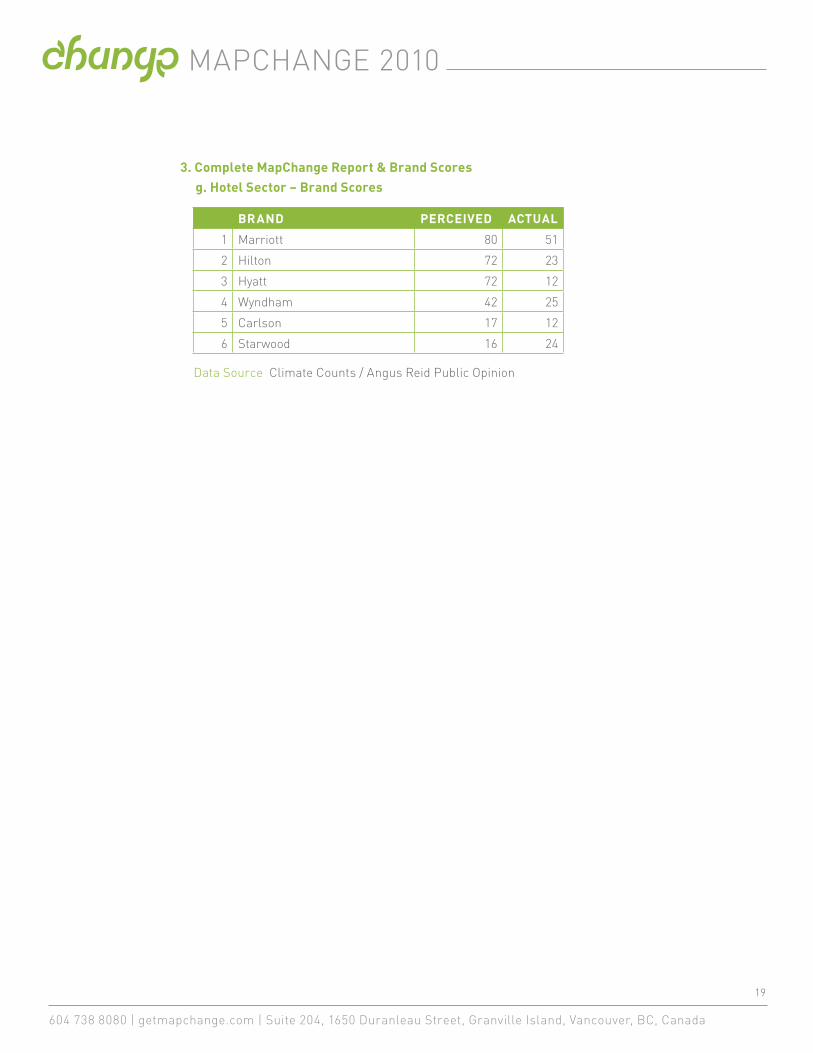
BRAND PERCEIVED ACTUAL
1 Marriott 80 51
2 Hilton 72 23
3 Hyatt 72 12
4 Wyndham 42 25
5 Carlson 17 12
6 Starwood 16 24
3. Complete MapChange Report & Brand Scores g. Hotel Sector – Brand Scores
Data Source Climate Counts / Angus Reid Public Opinion
MAPCHANGE 2010
604 738 8080 | getmapchange.com | Suite 204, 1650 Duranleau Street, Granville Island, Vancouver, BC, Canada
20
AC
TU
AL
PERCEIVED
0 100
010
0
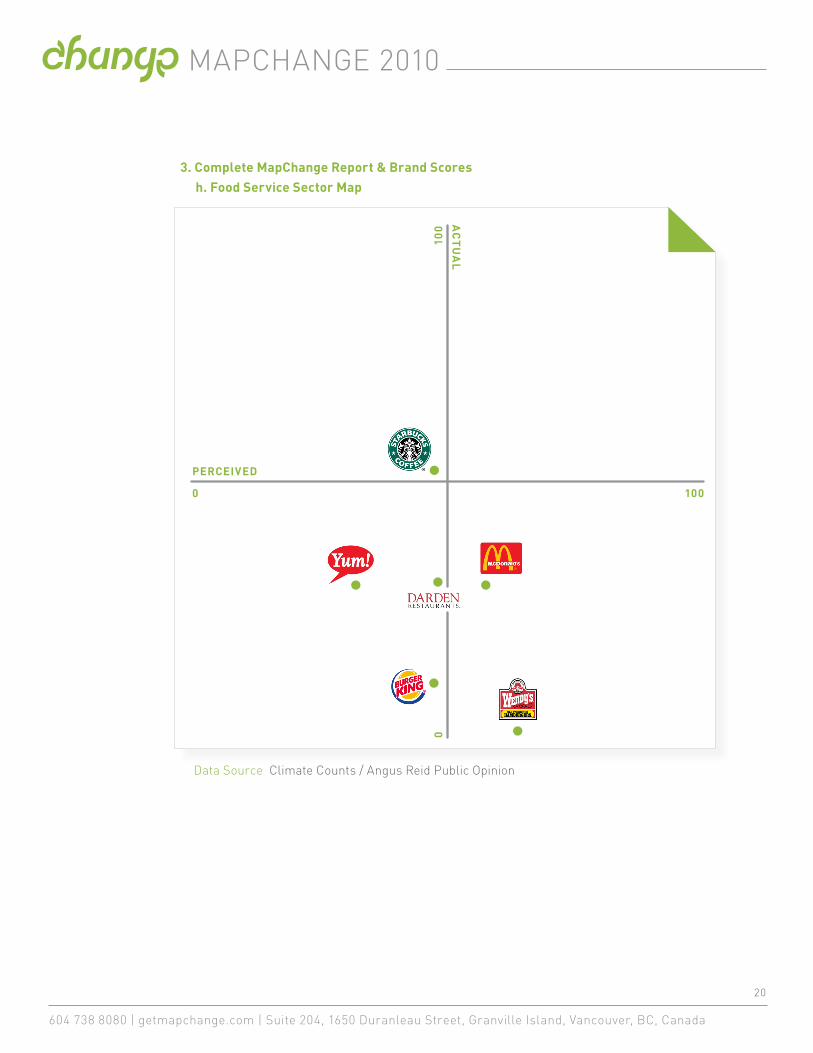
3. Complete MapChange Report & Brand Scores h. Food Service Sector Map
Data Source Climate Counts / Angus Reid Public Opinion
MAPCHANGE 2010
604 738 8080 | getmapchange.com | Suite 204, 1650 Duranleau Street, Granville Island, Vancouver, BC, Canada
21
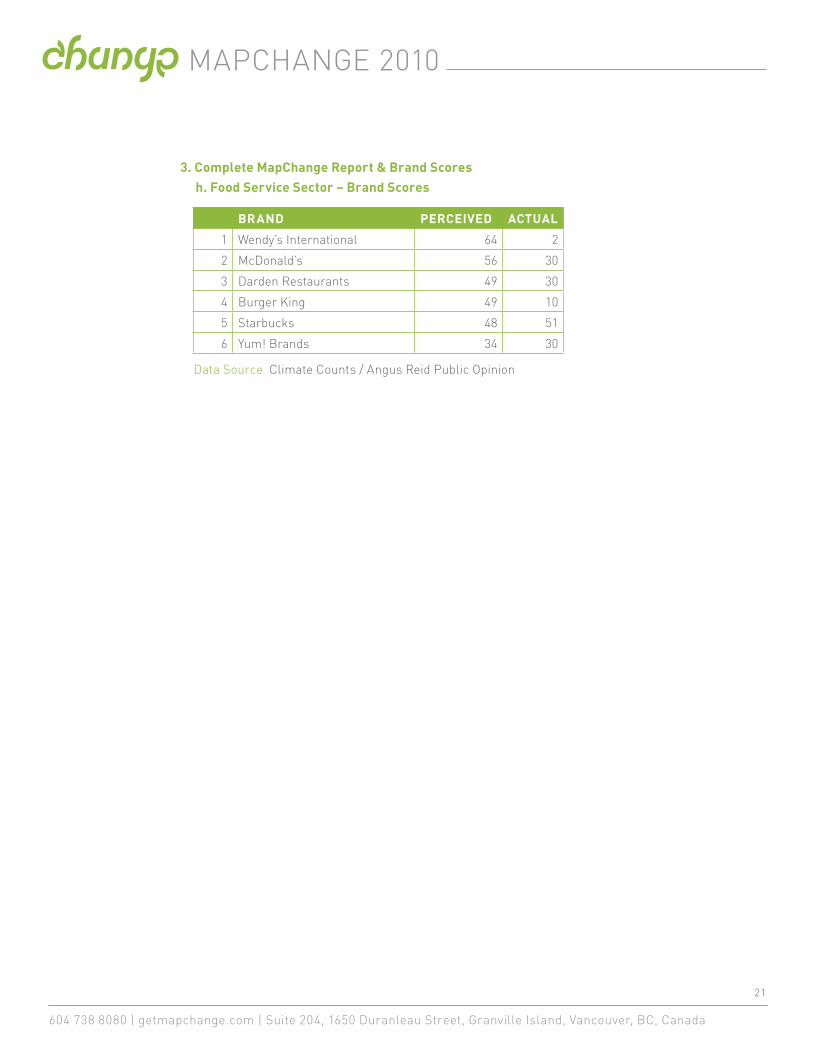
BRAND PERCEIVED ACTUAL
1 Wendy’s International 64 2
2 McDonald’s 56 30
3 Darden Restaurants 49 30
4 Burger King 49 10
5 Starbucks 48 51
6 Yum! Brands 34 30
3. Complete MapChange Report & Brand Scores h. Food Service Sector – Brand Scores
Data Source Climate Counts / Angus Reid Public Opinion
MAPCHANGE 2010
604 738 8080 | getmapchange.com | Suite 204, 1650 Duranleau Street, Granville Island, Vancouver, BC, Canada
22
AC
TU
AL
PERCEIVED
0 100
010
0
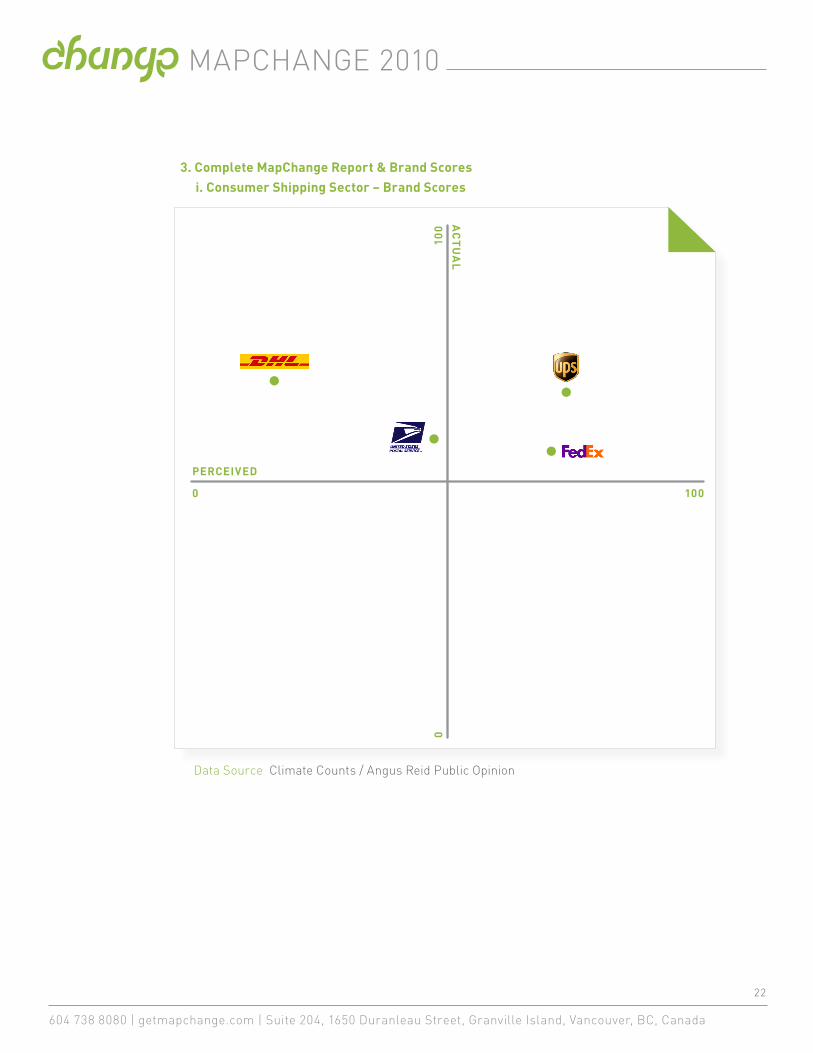
3. Complete MapChange Report & Brand Scores i. Consumer Shipping Sector – Brand Scores
Data Source Climate Counts / Angus Reid Public Opinion

MAPCHANGE 2010
604 738 8080 | getmapchange.com | Suite 204, 1650 Duranleau Street, Granville Island, Vancouver, BC, Canada
23
BRAND PERCEIVED ACTUAL
1 UPS 76 69
2 FedEx 71 55
3 US Postal Service 49 56
4 Deutsche Post / DHL World Net
16 68
Data Source Climate Counts / Angus Reid Public Opinion
3. Complete MapChange Report & Brand Scores i. Consumer Shipping Sector – Brand Scores
MAPCHANGE 2010
604 738 8080 | getmapchange.com | Suite 204, 1650 Duranleau Street, Granville Island, Vancouver, BC, Canada
24
0 100
010
0
AC
TU
AL
PERCEIVED
Data Source Climate Counts / Angus Reid Public Opinion
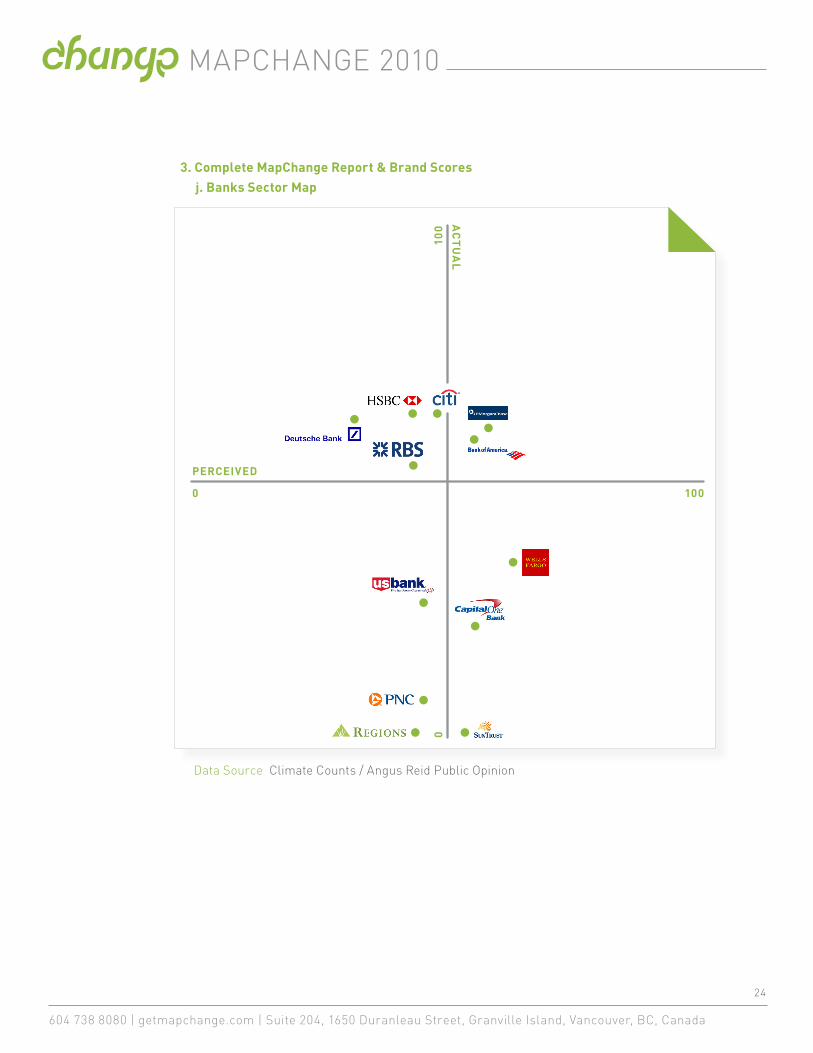
3. Complete MapChange Report & Brand Scores j. Banks Sector Map

MAPCHANGE 2010
604 738 8080 | getmapchange.com | Suite 204, 1650 Duranleau Street, Granville Island, Vancouver, BC, Canada
25
BRAND PERCEIVED ACTUAL
1 Wells Fargo 66 27
2 JP Morgan Chase 61 63
3 Capital One 57 12
4 Bank of America 57 60
5 SunTrust 51 2
6 CitiGroup 49 67
7 HSBC 46 67
8 US Bancorp 45 25
9 National City 44 3
10 Regions 42 1
11 Royal Bank of Scotland 42 55
12 Deutsche Bank 37 66
3. Complete MapChange Report & Brand Scores j. Banks Sector Map – Brand Scores
Data Source Climate Counts / Angus Reid Public Opinion
MAPCHANGE 2010
604 738 8080 | getmapchange.com | Suite 204, 1650 Duranleau Street, Granville Island, Vancouver, BC, Canada
26
4. Insights
• Across every sector, MapChange shows a disparity exists between the actual sustainable activity of brands, and consumers’ percep-tion of sustainable activity of those brands.
• Some sectors emerged as sustainability leaders and others, as laggards. For example, the Consumer Shipping brands all scored above 55, whereas the Airline brands all scored below 50.
• This year, most of the brands had much higher ‘perceived sustainability’ ratings than they did last year.
• This increase in ‘perceived’ sustainability could be due to:
a. Improved/increased brand communications about sustainability initiatives
b. Increased consumer-facing sustainable products
c. Heightened consumer and media interest in sustainable brands
• To compete, brands need to generate sustainable innovation quickly and communicate it effectively.
• In some sectors, brands with high perception scores actually had average actual scores. This suggests that the overall positive perception of these popular brands has a positive ‘halo’ effect on their perceived sustainability. In some cases it could be linked to the trend of large master brands buying smaller brands known for their emphasis on sustainability. The smaller brands imbue the larger master brand with a halo of sustainability.
• On the other hand, brands with the highest actual scores some-times had relatively low perception scores. This suggests that the corporation’s sustainability activity might not be consumer-facing, or that the activity might be focussed in areas outside of the prod-ucts / services being produced.
• This represents an opportunity to improve perception through increased consumer-facing sustainable product innovations and improved communications.
• On the flip side, brands already benefiting from a positive consumer perception have an opportunity to strengthen this position through increased sustainability efforts and continuing to innovate new, consumer-facing sustainable products.
Note These insights are necessarily general, given the broad spectrum of sectors studied. We would be happy to discuss more specific insights pertaining to individual sector maps. To arrange a conversation, please leave your contact information at [email protected].

MAPCHANGE 2010
604 738 8080 | getmapchange.com | Suite 204, 1650 Duranleau Street, Granville Island, Vancouver, BC, Canada
27
5. The 5 C’s of Sustainability Branding
From our MapChange study research and five years experience building green brands we’ve created ‘The 5 C’s of Sustainability Branding’ – a tool that outlines the 5 things brand sustainability must be in order to succeed:
1. COMPETITIVE To compete, brands must innovate – and the best new innovations
tend to be sustainable. All other things being equal (price & quality = value), sustainability differentiates and provides durable competitive advantage.
2. CONSUMER-FACING Not sure what to do first? Get the most benefit out of new sustainability
initiatives by making them something the consumer will see. There are plenty of ways to improve corporate sustainability, but consumer-fac-ing changes will have the most immediate impact on public perception and, potentially, financial performance.
3. CORE Tying sustainability to a brand’s core business is another way to ensure
it resonates with consumers. If a brand sells hamburgers, its sustain-ability has to be about hamburgers ie. organic beef, recycled wrapper etc. Car brands must focus on making more fuel-efficient, cleaner cars, not saving the rainforest. Don’t do something that is unrelated to what people know you for, or they won’t reward your efforts and you could be seen as greenwashing.
4. CONVERSATIONAL Sustainability branding is more effective as a two-way conversa-
tion rather than one-way communication. Honesty and transparency will go a long way with consumers. Disclosing what you’re doing well and what you could be doing better will instill trust. And trust breeds loyalty. Inviting consumers to participate in a conversation about your process will further strengthen the brand-consumer relationship.
5. CREDIBLE Sustainability strengthens brands. But, greenwashing, even if unin-
tended, damages them. The good news is that it is easily avoidable and the key is sequence. As long as sustainability efforts are in place, func-tioning and measurable before being announced, they will be viewed as credible. And, proven, objective credibility paired with innovation and communication is the key to sustainable brand success.
MAPCHANGE 2010
604 738 8080 | getmapchange.com | Suite 204, 1650 Duranleau Street, Granville Island, Vancouver, BC, Canada
28
6. About Change
Change is an innovation brand agency specializing in green innova-
tion. Clients include multinationals like Unilever, key regionals like
TransLink, and innovation-driven companies like Powertech. With
‘outside the jar’ thinking and a simple, flexible process, Change
helps companies incorporate brand innovations that provide
competitive advantage, then helps communicate those brand
innovations in a way consumers can understand, appreciate and
reward. Change is structured like a hub – key strategists and
creative thinkers at the core, and trusted specialists in research,
analysis, design, social media and production in an ‘on call’ net-
work. Change’s work has won over 20 international design awards,
and has been profiled in international journals, newspapers and
books. The organization’s founder, Marc Stoiber, is also an expert
speaker on green brand innovation, with engagements that include
the TED conference and Strategy’s Cause and Effect Conference.
MAPCHANGE 2010
604 738 8080 | getmapchange.com | Suite 204, 1650 Duranleau Street, Granville Island, Vancouver, BC, Canada
29
7. About Climate Counts
Climate Counts is a non-profit campaign that scores companies annu-
ally on the basis of their voluntary action to reverse climate change. The
Climate Counts Company Scorecard—launched in June 2007—helps
people vote with their dollars by making climate-conscious purchasing
and investing choices that put pressure on the world’s most well-known
companies to take the issue of climate change seriously. Launched by
organics pioneer Stonyfield Farm, Climate Counts believes everyday
consumers can be the most important activists in the fight against global
warming. Climate Counts has currently evaluated nearly 150 compa-
nies—representing over 3000 brands—in sixteen major consumer sec-
tors. Climate Counts’ work has appeared in many of the world’s leading
media outlets, among them the New York Times, National Public Radio,
The Economist, BBC World Service, the Wall Street Journal, Newsweek,
The Huffington Post, and the Harvard Business Review. The organization
will launch its iPhone app and its Climate Counts Industry Innovators (I2)
program in early 2010.
8. About Angus Reid Public Opinion
Angus Reid Public Opinion is the public affairs practice of Vision Critical –
a global research and technology company specializing in custom online
panels, private communities, and innovative online methods. Vision
Critical is a leader in the use of the Internet and rich media technology
to collect high-quality, in-depth insights for a wide array of clients.
Dr. Angus Reid and the Angus Reid Strategies team are pioneers in online
research methodologies, and have been conducting online surveys since
1995. Vision Critical is now one of the largest market research enter-
prises in the world. In addition to its five offices in Canada—located in
Vancouver, Calgary, Regina, Toronto, and Montreal—the firm also has
offices in San Francisco, Chicago, New York, London, Paris and Sydney.
Its team of specialists provides solutions across every type and sector of
research, and currently serves over 200 international clients.

MAPCHANGE 2010
604 738 8080 | getmapchange.com | Suite 204, 1650 Duranleau Street, Granville Island, Vancouver, BC, Canada
30
9. The Story of MapChange Interview with Founder of Change, Marc Stoiber.
In January 2010 Change, Angus Reid Public Opinion and Climate Counts release the findings from the second MapChange study.
The original study was conducted in 2008. The new study is over 10 times larger, and cov-ers virtually every sector in North American consumer goods and services.
In the following interview, Change founder Marc Stoiber explains the origins of the study, what it was meant to answer, and how it has evolved.
INTERVIEWER (I): Tell us about how MapChange started.
MARC STOIBER (MS): In 2008, Change was still a relatively new com-pany, helping companies build green innovation into their brands. The only problem was, big companies didn’t believe they needed us, or green brands. They were all building green into their operations, and thought that was enough.
I: What was your pitch to them?
MS: We told them that building green into your operations was great,but the real win was building green into the things they made and sold…their brands.
I: And the response was?
MS: They told us to take a hike.
I: So MapChange was the door opener?
MS: Actually, MapChange was the result of us sitting around, thinking about how we could convince these big companies that we were right and they were wrong!
We thought the best way to do this was to show how companies that ‘did’ green didn’t necessarily get credit for it. And companies that didn’t ‘do’ green often ended up with more credit than they deserved. Our thinking was, that if a good company could see they were getting short shrift from consumers, that would make them sit up and smell the organic coffee.
I: What was the structure of the first study?
MS: It was simple. We developed a scorecard that could measure the de-clared – that is online or publicly reported – green actions of a company. Then we developed a questionnaire that would enable us to probe con-sumers on what they thought of those companies and their green actions. Then we picked 20 top brands in Canada, and did the study. When we had the numbers, we mapped out the brands on a perception / reality chart.
MAPCHANGE 2010
604 738 8080 | getmapchange.com | Suite 204, 1650 Duranleau Street, Granville Island, Vancouver, BC, Canada
31
I: Did the numbers surprise you?
MS: To put it mildly, yes. They revealed that most of the companies en-gaged in green actions did not get their due in the court of public opinion. And a few companies that did virtually nothing to fight climate change were getting undeserved credit.
I: What happened when you went back to the companies in the study?
MS: Molson hired us! (laughs) Actually, we managed to use the study as a good door opener with a few companies. I was surprised that more of them didn’t at least take a closer look. And yes, Molson did turn around and hire us because of their results in the study.
I: Fast forward to 2010. What makes the new study better?
MS: Depth and breadth. First, we asked Climate Counts in the US to provide us with much more thorough information on the climate change actions of companies. They’re experts at this, and gave us incredible info – much deeper and more insightful than the info we’d gathered in the first study.
Second, breadth. In our first study, we measured 20 companies. Now we’re measuring over 100, in 10 different sectors across North America.
There’s also a greater breadth in the consumer questionnaire. Our partners at Angus Reid actually quizzed over 2000 Americans for their perspectives on the companies in the study.
I: How will this study help further the green agenda?
MS: I believe it will make companies less reticent about greening the things they make and sell. Consumers want to buy green. They want green brands. And if we can sell green brands instead of non-green brands, the world might be a bit better for it. So I believe that the green agenda will be served by convincing companies to take green outside their own 4 walls, and into the world of their consumer-facing brands.
TO SEE THE NEW MAPCHANGE STUDY, GO TO
WWW.GETMAPCHANGE.COM
MAPCHANGE 2010
604 738 8080 | getmapchange.com | Suite 204, 1650 Duranleau Street, Granville Island, Vancouver, BC, Canada
32
Appendix 1: Climate Counts Scorecard
MAPCHANGE 2010
604 738 8080 | getmapchange.com | Suite 204, 1650 Duranleau Street, Granville Island, Vancouver, BC, Canada
33
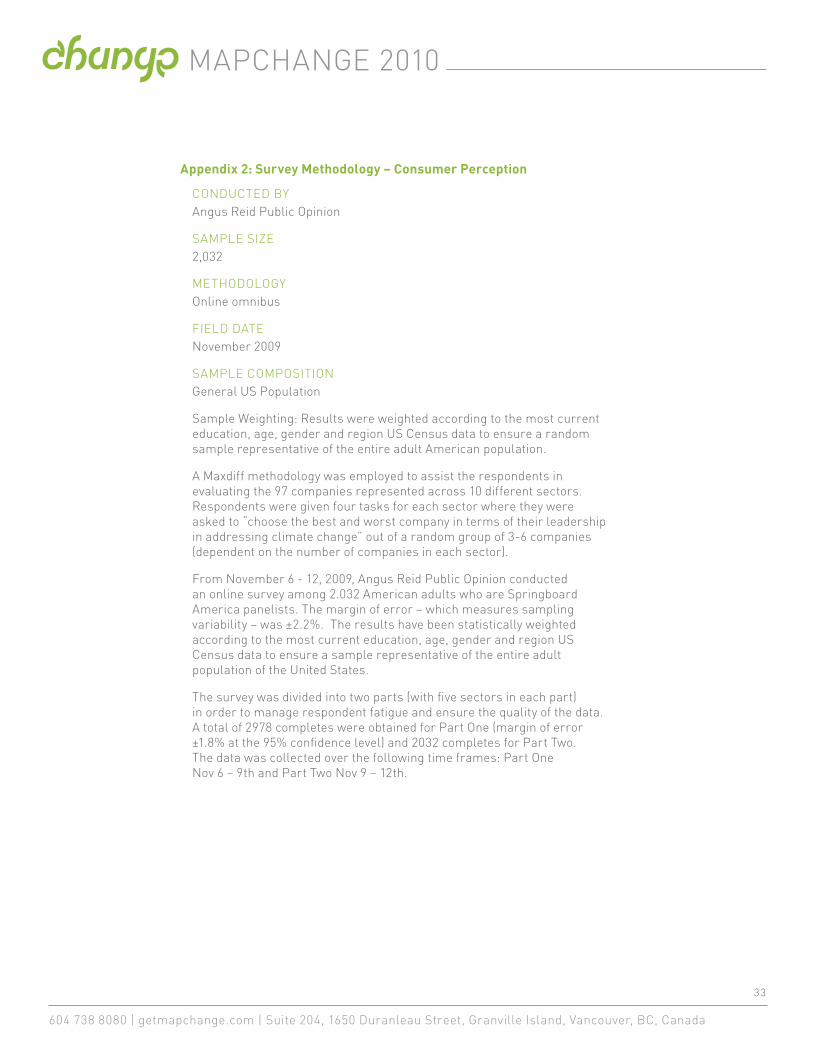
Appendix 2: Survey Methodology – Consumer Perception
CONDUCTED BY Angus Reid Public Opinion
SAMPLE SIZE 2,032
METHODOLOGY Online omnibus
FIELD DATE November 2009
SAMPLE COMPOSITION General US Population
Sample Weighting: Results were weighted according to the most current education, age, gender and region US Census data to ensure a random sample representative of the entire adult American population.
A Maxdiff methodology was employed to assist the respondents in evaluating the 97 companies represented across 10 different sectors. Respondents were given four tasks for each sector where they were asked to “choose the best and worst company in terms of their leadership in addressing climate change” out of a random group of 3-6 companies (dependent on the number of companies in each sector).
From November 6 - 12, 2009, Angus Reid Public Opinion conducted an online survey among 2.032 American adults who are Springboard America panelists. The margin of error – which measures sampling variability – was ±2.2%. The results have been statistically weighted according to the most current education, age, gender and region US Census data to ensure a sample representative of the entire adult population of the United States.
The survey was divided into two parts (with five sectors in each part) in order to manage respondent fatigue and ensure the quality of the data. A total of 2978 completes were obtained for Part One (margin of error ±1.8% at the 95% confidence level) and 2032 completes for Part Two. The data was collected over the following time frames: Part One Nov 6 – 9th and Part Two Nov 9 – 12th.
MAPCHANGE 2010
604 738 8080 | getmapchange.com | Suite 204, 1650 Duranleau Street, Granville Island, Vancouver, BC, Canada
34
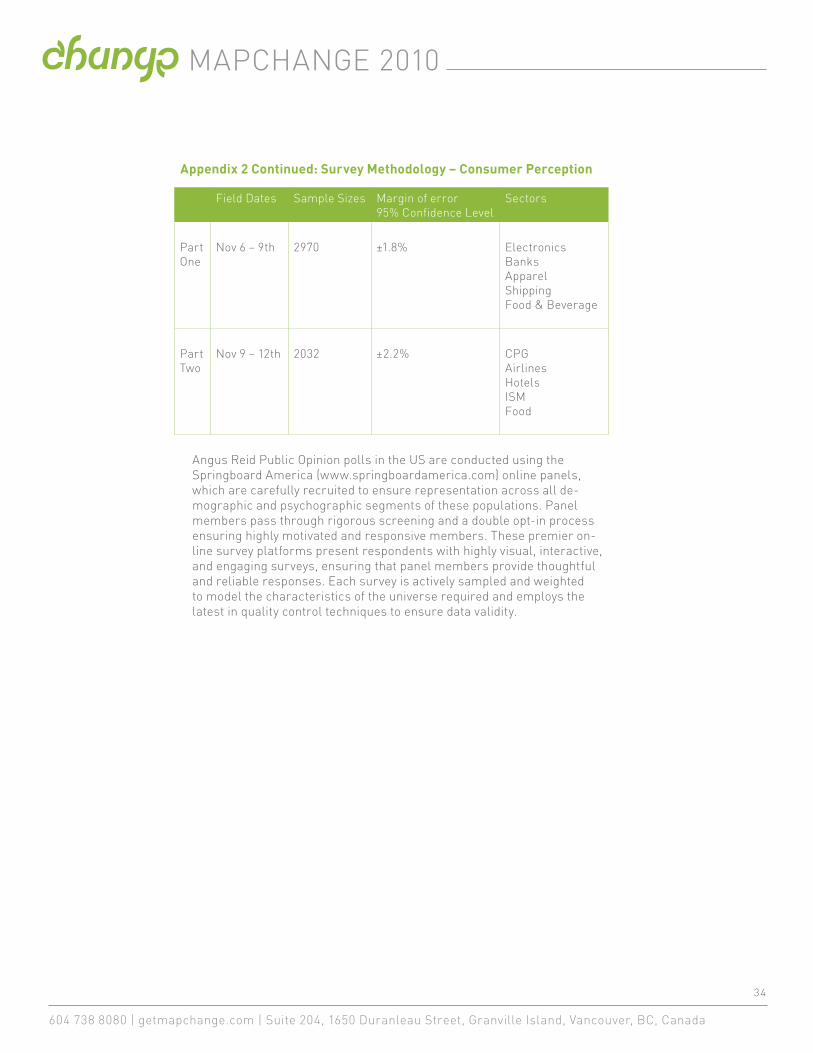
Field Dates Sample Sizes Margin of error95% Confidence Level
Sectors
Part One
Nov 6 – 9th 2970 ±1.8% ElectronicsBanksApparelShippingFood & Beverage
Part Two
Nov 9 – 12th 2032 ±2.2% CPGAirlinesHotelsISMFood
Angus Reid Public Opinion polls in the US are conducted using the Springboard America (www.springboardamerica.com) online panels, which are carefully recruited to ensure representation across all de-mographic and psychographic segments of these populations. Panel members pass through rigorous screening and a double opt-in process ensuring highly motivated and responsive members. These premier on-line survey platforms present respondents with highly visual, interactive, and engaging surveys, ensuring that panel members provide thoughtful and reliable responses. Each survey is actively sampled and weighted to model the characteristics of the universe required and employs the latest in quality control techniques to ensure data validity.
Appendix 2 Continued: Survey Methodology – Consumer Perception
MAPCHANGE 2010
604 738 8080 | getmapchange.com | Suite 204, 1650 Duranleau Street, Granville Island, Vancouver, BC, Canada
35
Appendix 3: Limitations
Choosing climate change leadership as our measure of ‘actual’ sustain-ability necessitated the exclusion of certain other factors like community, charity and fair trade and ethical sourcing initiatives.
For the perception measure, we could not avoid the fact that some brands were less well known to consumers than others and acknowledge that the low perception scores of some of these lesser-known brands could be attributed to low awareness rather than negative consumer perception.
We believe we need to clarify the use of the word “brand”. MapChange uses the term to reference the corporate brand (Kellogg’s, Nestle, etc.) while Climate Counts generally uses “brand” to refer to the actual products (Pop Tarts, etc.). MapChange profiles the corporate brand’s sustainability perceptions (which inevitably are linked to consumer perceptions of a corporation’s sub-brands).
The scorecards could also have influenced the general increase in ‘perceived sustainability’ of this year over last. 2008’s scorecard, created by Change (actual) and Environics (perceived), was a broader, more general measure of overall sustainability, whereas this year’s, created by Climate Counts (actual) and Angus Reid Public Opinion (perceived), focused solely on climate change.
Lastly, in order to coordinate brand perception scores with Climate Counts’ actual scores, consumers were asked to rate their perception of company brands, not sub brands. In other words, respondents were asked to make a decision about the company, and not the individual brands in its roster.
To avoid confusion we provided respondents with the full list of the sub brands under each corporate brand.
MAPCHANGE 2010
604 738 8080 | getmapchange.com | Suite 204, 1650 Duranleau Street, Granville Island, Vancouver, BC, Canada
36
Contact Us
For more information on the study or to obtain the map for your sector, please contact us:
MARC STOIBER President Change 604.738.8080 [email protected]
WOOD TURNER Executive Director Climatecounts.org 603.216.3788 [email protected]
MONIQUE MORDEN Executive Vice President Vision Critical 604.647.1988 [email protected]