Embed Size (px)
Citation preview

UNITED NATIONS CONFERENCE ON TRADE AND DEVELOPMENTCONFÉRENCE DES NATIONS UNIES SUR LE COMMERCE ET LE DÉVELOPPEMENT
MANUELDE STATISTIQUES
DE LA CNUCED
UNCTADHANDBOOK
OF STATISTICS
UNITED NATIONSNew York and Geneva
NATIONS UNIESNew York et Genève
NOTE
Symbols of United Nations documents are composed of capital letters combined with figures. Mention of such a symbol indicates a reference to a United Nations document.
General disclaimer
The designations employed and the presentation of the material in this publication do not imply the expression of any opinion whatsoever on the part of the secretariat of the United Nations concerning the legal status of any country, territory, city or area, or of its authorities, or concerning the delimitation of its frontiers or boundaries.
Where the designations "economy" or “country or area” appear in tables, they cover countries, territories, cities and areas.
The designations “developed”, “in transition” and “developing” are intended for statistical convenience and do not necessarily express a judgement about the stage reached by a particular country or area in the development process.
Material in this publication may be freely quoted or reprinted, but acknowledgement is obligatory, together with a reference to the document number (TD/STAT.33). A copy of the publication containing the quotation or reprint should be sent to the UNCTAD secretariat.
** *
La cote des documents de l'Organisation des Nations Unies se compose de lettres majuscules et de chiffres. La mention d'une telle cote indique qu'il est fait référence à un document de l'Organisation.
Déni de responsabilité
Les appellations employées dans cette publication et la présentation des données qui y figurent n'impliquent, de la part du secrétariat de l'Organisation des Nations Unies, aucune prise de position quant au statut juridique des pays, territoires, villes ou zones, ou de leurs autorités, ni quant au tracé de leurs frontières ou limites.
Les appellations «économie» ou «pays ou zone» figurant dans certaines rubriques des tableaux désignent des pays, des territoires, des villes ou des zones.
Les termes «développés», «en transition» et «en développement» sont utilisés pour plus de commodité dans la présentation des statistiques et n'impliquent pas nécessairement un jugement quant au stade de développement atteint par un pays ou une zone donnée.
Le contenu de la présente publication peut être cité ou reproduit sans autorisation, sous réserve qu'il soit fait mention de ladite publication et de sa cote (TD/STAT.33) et qu'un justificatif soit adressé au secrétariat de la CNUCED.
TD/STAT. 33
UNITED NATIONS PUBLICATION
Sales number / Numéro de vente : E/F.08.II.D.18
ISBN 978-92-1-012069-2 ISSN 0251-9461
ii
FOREWORD INTRODUCTION
The UNCTAD Handbook of Statistics provides essential data for analysing world trade, investment, international financial flows and development. Reliable statistical information is often the first step when preparing recommendations or taking decisions that will commit countries for many years as they strive to integrate into the world economy and improve the living standards of their citizens. Whether it be for research, consultation or technical cooperation, UNCTAD requires comparable, often detailed economic, demographic and social data, available if possible over several decades and for as many countries as possible.
In addition to collecting and checking data and calculating related indicators that facilitate the work of the secretariat's economists, the UNCTAD Handbook of Statistics provides an opportunity to share a rich statistical database with decision-makers and research specialists – academics, officials from national Governments or international organizations, executive managers or members of NGOs from developing, transition or developed countries. The Handbook further offers journalists comprehensive information in a presentation that meets their needs.
In order to provide maximum benefit to all users, the publication is available in three complementary formats: printed copy, DVD and online (www.unctad.org/statistics/handbook).
Particular acknowledgement is due to the Statistics Division of the Department of Economic and Social Affairs of the United Nations, as well as to other international organizations, for their help in preparing this publication.
Le but du Manuel de statistiques de la CNUCED est de fournir les données statistiques essentielles à l’analyse du commerce mondial, de l’investissement, des flux financiers internationaux et du développement. Une information statistique fiable est souvent le préalable à la formulation de recommandations et à la prise de décisions qui engageront les pays pour de longues années dans leur processus d’intégration dans l’économie mondiale et l’amélioration des conditions de leurs peuples. Que ce soit pour la recherche, la concertation ou la coopération technique, la CNUCED a besoin de données économiques, démographiques et sociales comparables et souvent détaillées, disponibles si possible sur plusieurs décennies et sur un maximum de pays.
Au-delà de la mobilisation et de la vérification des données, du calcul d’indicateurs dérivés qui alimentent les travaux des économistes du secrétariat, le Manuel de statistiques de la CNUCED est l’occasion de partager une base statistique riche les décideurs et les chercheurs, qu’ils soient universitaires, fonctionnaires d’administrations nationales ou d’organisations internationales, cadres d’entreprises ou membres d’organisations non gouvernementales de pays en développement, en transition ou développés. Les journalistes trouvent aussi dans ce manuel une information synthétique dans une présentation bien adaptée à leurs préoccupations.
La publication est disponible dans trois formats complémentaires, l’édition imprimée, le DVD et la version en ligne (www.unctad.org/statistics/handbook), pour que chaque utilisateur, où qu’il soit, puisse en tirer le meilleur avantage.
Le secrétariat de la CNUCED tient à remercier la Division de statistique, Département des affaires économiques et sociales de l'ONU, et diverses organisations internationales du concours qu'elles ont apporté à la préparation de cette publication.
iii
TABLE OF CONTENTS TABLE DES MATIÈRES
www.unctad.org/statistics/handbook www.unctad.org/statistics/handbook
Note……………………………………………………………. ii Note……………………………………………………………………. ii
Introduction……………………………………………………………. iii
Table of contents…………………………………………….. iv Table des matières…………………………………………………… iv
viii Notes générales………………………………………………………. xxii
Distribution of countries and territories…………………….. xi Répartition des pays et territoires…………………………………... xxv
Distribution of developing economies by geographical region………………………………………….. xii
Répartition des économies en développement par régions géographiques………………………………………………. xxvi
Distribution of economies in transition and developed economies by geographical region……………. xiv
Répartition des économies en transition et des économies développées par régions géographiques…………….. xxviii
Distribution of developing economies by economic grouping…………………………………………… xv
Répartition des économies en développement par groupements économiques…………………………………………. xxix
Répartition des économies par groupements commerciaux…….. xxxii
xxi Abréviations et acronymes………………………………………….. xxxv
PART ONE PREMIÈRE PARTIE
International merchandise trade Commerce international des marchandises
1.1.1 Exports and imports of countries and geographical regions
- Share……………………………………………….. 2
10
1.1.1 Exportations et importations des pays et des régions géographiques - Valeur……………………………………………………...- Part………………………………………………………...
210
1.1.2 Exports and imports of economic groupings
- Share……………………………………………….. 1820
1.1.2 Exportations et importations des groupements économiques- Valeur……………………………………………………...- Part………………………………………………………...
1820
1.1.3 Exports and imports of trade groups
- Share……………………………………………….. 2224
1.1.3 Exportations et importations des groupements commerciaux- Valeur……………………………………………………...- Part………………………………………………………...
2224
1.2.1 Annual average growth rates of exports and imports of countries and geographical regions….. 26
1.2.1 Taux d'évolution annuels moyens des exportations et importations des pays et des régions géographiques… 26
1.2.2 Annual average growth rates of exports and 34
1.2.2 Taux d'évolution annuels moyens des exportations et importations des groupements économiques……….. 34
1.2.3 Annual average growth rates of exports and 36
1.2.3 Taux d'évolution annuels moyens des exportations et importations des groupements commerciaux……….. 36
1.3.1 Value of trade balance, and as percentage of imports of countries and geographical regions….. 38
1.3.1 Valeur de la balance commerciale et sa part dans les 38
1.3.2 Value of trade balance, and as percentage of 46
1.3.2 Valeur de la balance commerciale et sa part dans 46
1.4 48 1.4 Commerce interne des groupements commerciaux…... 48
iv
..
xxxviClassification des produits pour le commerce international...........
General notes………………………………………………....
Foreword………………………………………………...….… iii
Distribution of economies by trade group………………..... xviii
Abbreviations and acronyms…………………………...……
Product classification for international trade………………. xxxvi
- Value……………………………………………......
- Value……………………………………...………...
- Value……………………………………...………...
imports of economic groupings……………...…….
imports of trade groups………………….……..…..
imports of economic groupings…………………....
Intra-trade of trade groups……………….…………
importations des pays et des régions géographiques....
les importations des groupements économiques…....…
TABLE OF CONTENTS TABLE DES MATIÈRES
PART TWO DEUXIÈME PARTIE
International merchandise trade by region Commerce international des marchandises par régions
2.1 Country trade structure by partner: 5262
2.1 Structure du commerce des pays par partenaires : - Exportations par principales régions de destination…. - Importations par principales régions d'origine………...
5262
2.2 Export and import structure by partner and product group of:
2.2 Structure des exportations et importations par partenaires et groupes de produits de :
72 A. Monde…………………………………………………… 72
76 76
80 C. Économies en transition………………………………. 80
84 84
88 E. Économies en développement : Afrique…………….. 88
92 F. Économies en développement : Amérique………….. 92
96 96H. Developing economies: Eastern, Southern H. Économies en développement : Asie orientale,
I. Économies en développement : Asie occidentale….. 104
J. Économies en développement : Océanie……………. 108K. Developing economies: Major petroleum K. Économies en développement : Principaux
exportateurs de pétrole……………………………….. 112L. Developing economies: Major exporters of L. Économies en développement : Principaux
PART THREE
International merchandise trade by product
TROISIÈME PARTIE
Commerce international des marchandises par produits
3.1 Country trade structure by product group:
3.1 Structure du commerce des pays par groupes de produits :
- Importations…………………………….......................... 122133
3.2 Export structure by product of: 3.2 Structure des exportations par produits de :
144 A. Monde…………………………………………………… 144
148 148
152 C. Économies en développement……………………….. 152
156 D. Pays et territoires individuels…………………………. 156
E. Major exporters for leading products among 174
E. Principaux exportateurs de produits majeurs parmi les économies en développement…………….. 174
3.3 Concentration and structural change indices of product markets:
183187
3.3 Indices de concentration et de changement structurel des marchés de produits :
- Importations………………………………………………. 187
PART FOUR
International merchandise trade indicators
QUATRIÈME PARTIE
Indicateurs du commerce international des marchandises
4.1.1 Export and import concentration and diversification indices of countries and
194
4.1.1 Indices de concentration et de diversification des exportations et importations des pays et des régions
194
4.1.2 Export and import concentration and diversification indices of economic
202
4.1.2 Indices de concentration et de diversification des exportations et importations des groupements
202
4.2.1 International merchandise trade indices ofcountries and geographical regions:
- Unit value indices of exports
- Terms of trade indices and purchasing
204
212
4.2.1 Indices du commerce international des marchandises des pays et des régions géographiques : - Indices du volume des exportations et importations….- Indices de la valeur unitaire des exportations et
- Indices des termes de l'échange et du pouvoir d'achat des exportations…………………………………
204
208
212
v
- Exports by main region of destination.................- Imports by main region of origin..........................
D. Économies en développement………………………..
B. Developed economies…………………………..
C. Economies in transition……………………........
A. World…………………………………..................
D. Developing economies…………………….........
E. Developing economies: Africa…………...……..
G. Developing economies: Asia…………………...
exporters………………………………................ 112
manufactured goods…………………………..… 116
F. Developing economies: America…………….....
and South-Eastern Asia………………….......... 100
J. Developing economies: Oceania………………. 108
I. Developing economies: Western Asia……….... 104
- Exports…………………………………………..… 122
A. World…………………………………………...…
- Imports……………………………………..……… 133
B. Developed economies……………………….....
C. Developing economies…………….......……….
developing economies……………………..……
D. Individual countries and territories………........
- Exports…………………………………………..… - Imports………………………………………..……
geographical regions………………………..……..
groupings…………………………………..………..
- Volume indices of exports and imports……..….
and imports……………………………………...… 208
power indices of exports…………………….......
B. Économies développées………………………….……
G. Économies en développement : Asie…………….…..
méridionale et du Sud-Est………………………….…. 100
exportateurs d'articles manufacturés…………….…… 116
- Exportations………………………………………….……
B. Économies développées……………….………………
- Exportations…………………………….………………… 183
géographiques………………………………………….…..
économiques………………………………………….…….
importations………………………………………….……
TABLE OF CONTENTS TABLE DES MATIÈRES
4.2.2 International merchandise trade indices of economic groupings: - Volume indices of exports
- Unit value indices of exports
- Terms of trade indices and purchasing
216
218
220
4.2.2 Indices du commerce international des marchandises des groupements économiques : - Indices du volume des exportations et des importations……………………………………………….- Indices de la valeur unitaire des exportations et importations……………………………………………….- Indices des termes de l'échange et du pouvoir d'achat des exportations…………………………………
216
218
220
4.3 Average applied import MFN tariff rates on non-agricultural and non-fuel products……………………………………. 222
4.3 Droits de douane moyens NPF appliqués à l'importation des produits non-agricoles et non-pétroliers……………………………………………………. 222
PART FIVE CINQUIÈME PARTIE
International trade in services Commerce international des services
5.1.1 Value of exports and imports of services of 242
5.1.1 Valeur des exportations et importations de services des pays et des régions géographiques………………... 242
5.1.2 Value of exports and imports of services of 250
5.1.2 Valeur des exportations et importations de services des groupements économiques…………………………. 250
5.1.3 Value of exports and imports of services of trade groups…………………………………………. 252
5.1.3 Valeur des exportations et importations de services des groupements commerciaux…………………………. 252
5.2 Trade in services by category : - Leading exporters among developing economies…………………………………………..- Leading importers among developing economies…………………………………………..
254
258
5.2 Commerce des services par catégories : - Principaux exportateurs parmi les économies en développement……………………………………………- Principaux importateurs parmi les économies en développement……………………………………………
254
258
5.3 Tourism indicators…………………………………... 262 5.3 Indicateurs du tourisme…………………………………… 262
5.4 World merchant fleet by flag of registration and type of ship of countries and geographical regions……………………………………………….. 280
5.4 Flotte marchande mondiale par pavillons d'immatriculation et par types de navires des
PART SIX SIXIÈME PARTIE
Commodities Produits de base
6.1 Annual and quarterly indices of free-market prices of selected primary commodities………….. 296
6.1 Indices annuels et trimestriels des prix d'une sélection de produits de base sur le marché libre……... 296
6.2 Instability indices and trends in free market prices for selected primary commodities…………. 302
6.2 Indices d'instabilité et tendances des prix sur le marché libre d'une sélection de produits de base……... 302
6.3 Production and consumption of aluminium and copper of countries and geographical regions…… 304
6.3 Production et consommation d'aluminium et de cuivre des pays et des régions géographiques………… 304
PART SEVEN SEPTIÈME PARTIE
International finance Finance internationale
7.1 Balance of payments: current account summaries………………………… 314
7.1 Balance des paiements : sommaires des comptesdes transactions courantes………………………………. 314
7.2 Balance of payments: capital and financial account summaries…………………………………. 327
7.2 Balance des paiements : sommaires des comptesde capital et d'opérations financières…………………… 327
7.3.1 Foreign direct investment: inward and outward flows of countries and geographical regions……... 340
7.3.1 Investissement étranger direct : flux entrants et sortants des pays et des régions géographiques……… 340
7.3.2 Foreign direct investment: inward and outward flows of economic groupings………………………. 348
7.3.2 Investissement étranger direct : flux entrants et sortants des groupements économiques……………….. 348
7.3.3 Foreign direct investment: inward and outward flows of trade groups……………………………….. 350
7.3.3 Investissement étranger direct : flux entrants et sortants des groupements commerciaux……………….. 350
7.4 Workers’ remittances:- Receipts…………………………………………….. - Payments……………………………………………
352353
7.4 Envois de fonds des travailleurs :
- Paiements…………………………………………………352353
vi
power indices of exports…………….……………
and imports………………………………….………
and imports……………………………….…………
countries and geographical regions………..………
economic groupings…………………………………
pays et des régions géographiques……………...……... 280
- Recettes………………………………………………......
TABLE OF CONTENTS TABLE DES MATIÈRES
7.5.1 International reserves of developing economies by country and geographical region………………. 354
7.5.1 Réserves internationales des économies en développement par pays et régions géographiques…... 354
7.5.2 International reserves of developing economies by economic grouping………………………………. 360
7.5.2 Réserves internationales des économies en développement par groupements économiques………. 360
7.6.1 Official financial flows from bilateral and multilateral sources to developing economies by country and geographical region………………. 362
7.6.1 Flux financiers publics bilatéraux et multilatéraux à destination des économies en développement par pays et régions géographiques……………………… 362
7.6.2 Official financial flows from bilateral and multilateral sources to developing economies by economic grouping………………………………. 375
7.6.2 Flux financiers publics bilatéraux et multilatéraux à destination des économies en développement par groupements économiques………………………….. 375
7.7 External long-term debt by lending source: 7.7 Dette extérieure à long terme par catégories de prêt des :
A. Developing economies………………………….. 379 A. Économies en développement……………………….. 379B. Developing economies: Africa………………….. 380 B. Économies en développement : Afrique…………….. 380C. Developing economies: America………………. 381 C. Économies en développement : Amérique………….. 381D. Developing economies: Asia…………………… 382 D. Économies en développement : Asie………………... 382E. Developing economies: Oceania………………. 383 E. Économies en développement : Océanie…………… 383F. Developing economies: Major petroleum exporters………………………………………….. 384
F. Économies en développement : Principaux exportateurs de pétrole………………………………… 384
G. Developing economies: Major exporters of manufactured goods……………………………... 385
G. Économies en développement : Principaux exportateurs d'articles manufacturés………………… 385
PART EIGHT HUITIÈME PARTIE
Development indicators Indicateurs du développement
8.1.1 Nominal gross domestic product: Total and per capita of countries and geographical regions……. 388
8.1.1 Produit intérieur brut nominal : Total et par habitant des pays et des régions géographiques………………... 388
8.1.2 Nominal gross domestic product: Total and per capita of economic groupings……………………… 396
8.1.2 Produit intérieur brut nominal : Total et par habitant des groupements économiques…………………………. 396
8.2.1 Annual average growth rates of total and per capita real gross domestic product of countries and geographical regions………………………….. 398
8.2.1 Taux de croissance annuels moyens du produit intérieur brut réel total et par habitant des pays et des régions géographiques…………………………… 398
8.2.2 Annual average growth rates of total and per capita real gross domestic product of economic groupings…………………………………………….. 406
8.2.2 Taux de croissance annuels moyens du produit intérieur brut réel total et par habitant des groupements économiques………………………………. 406
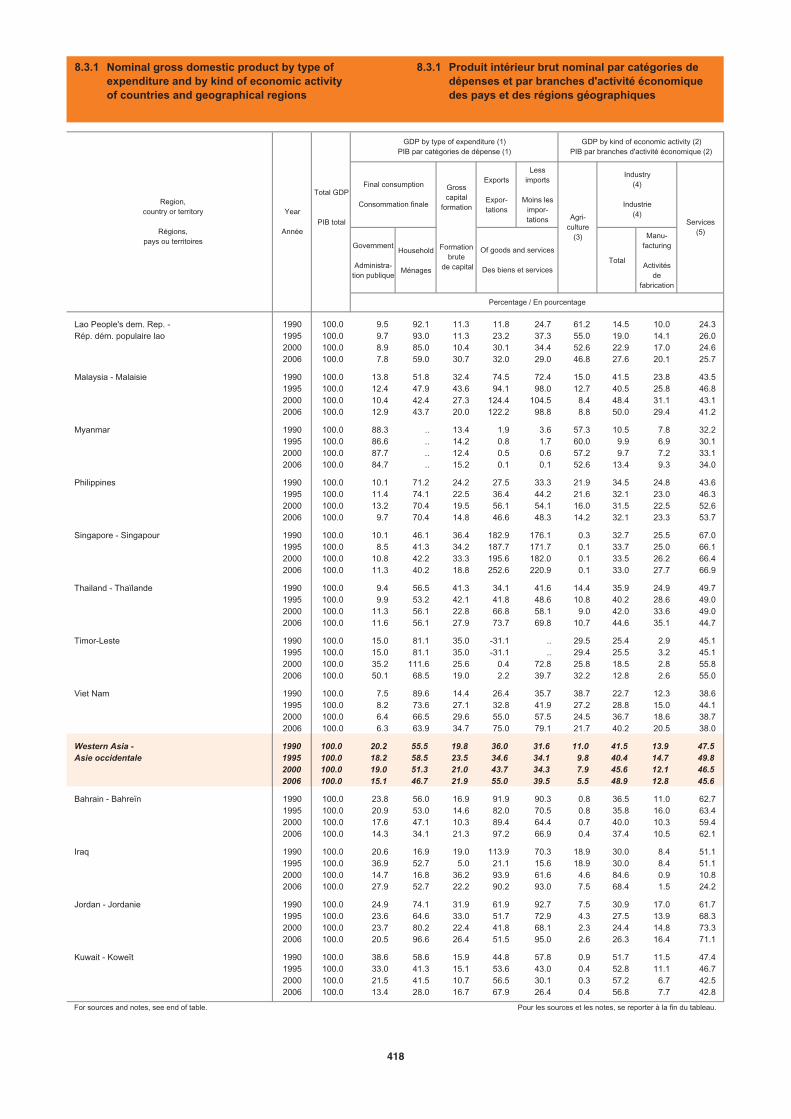
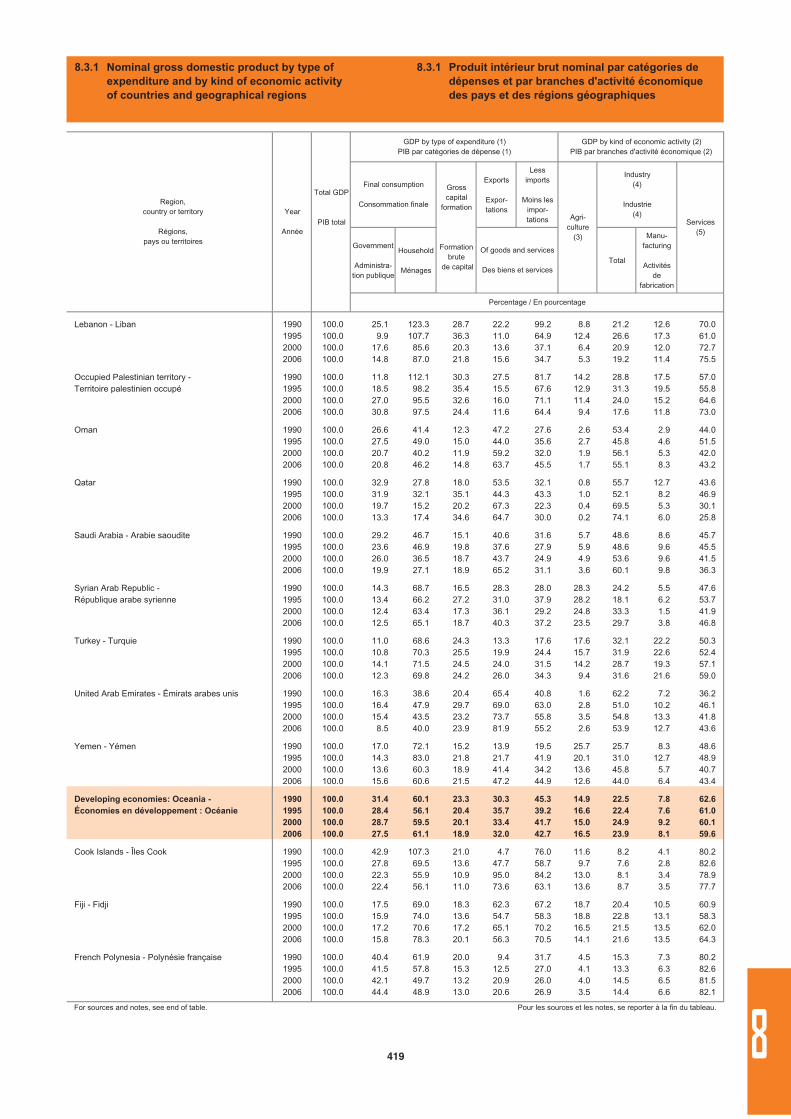
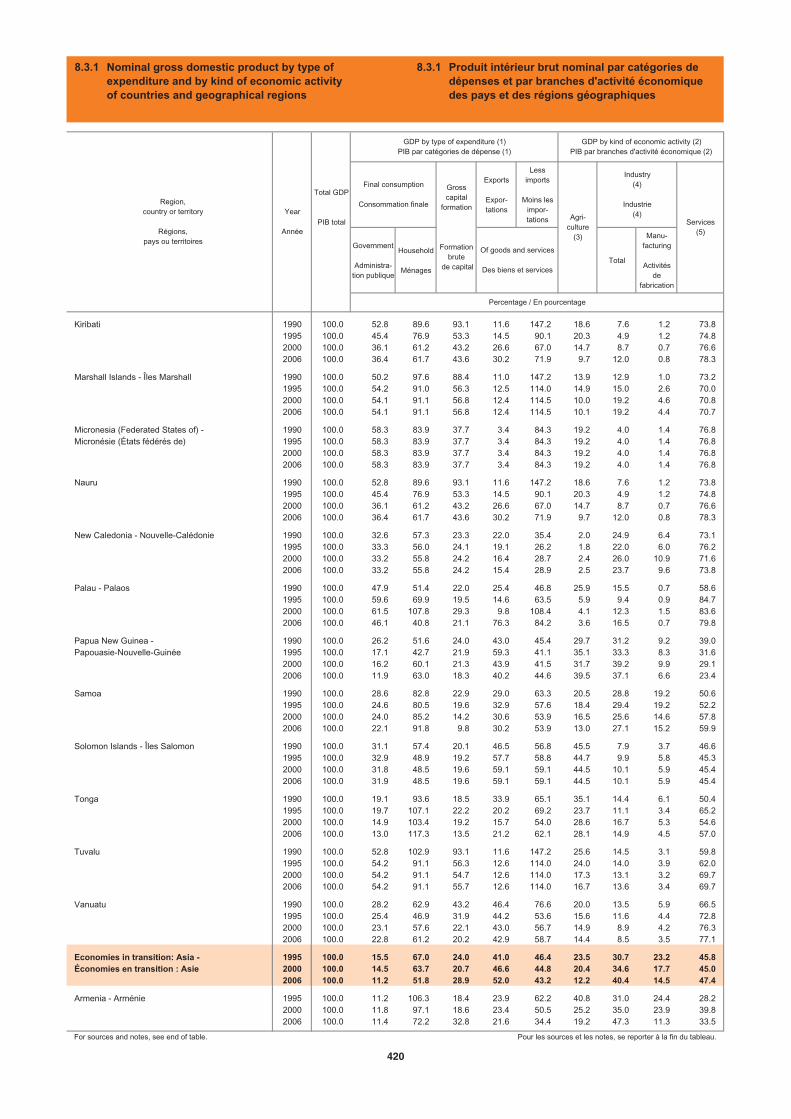
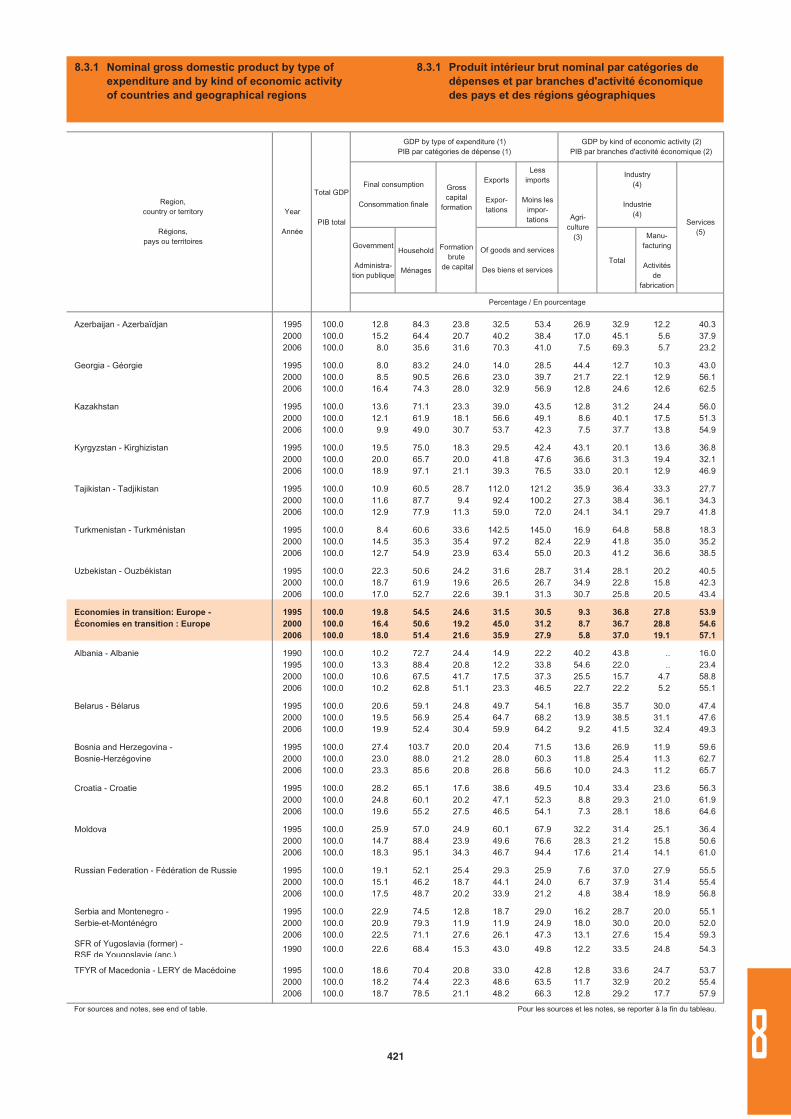
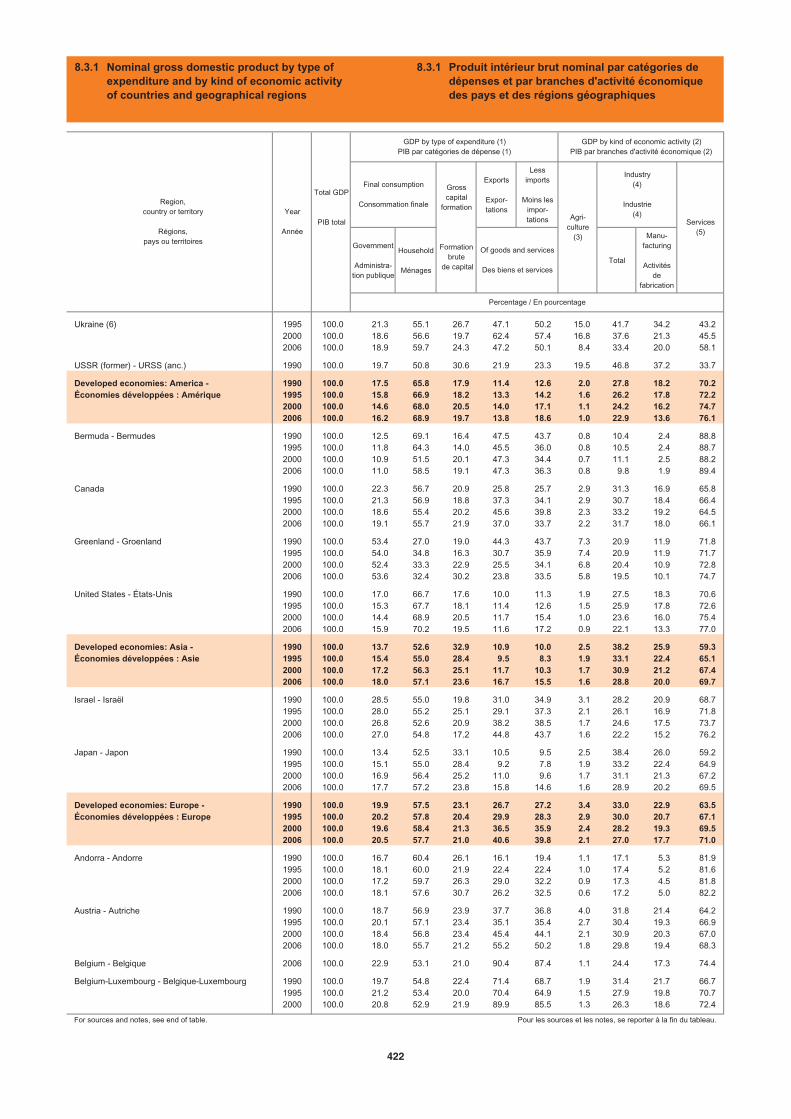
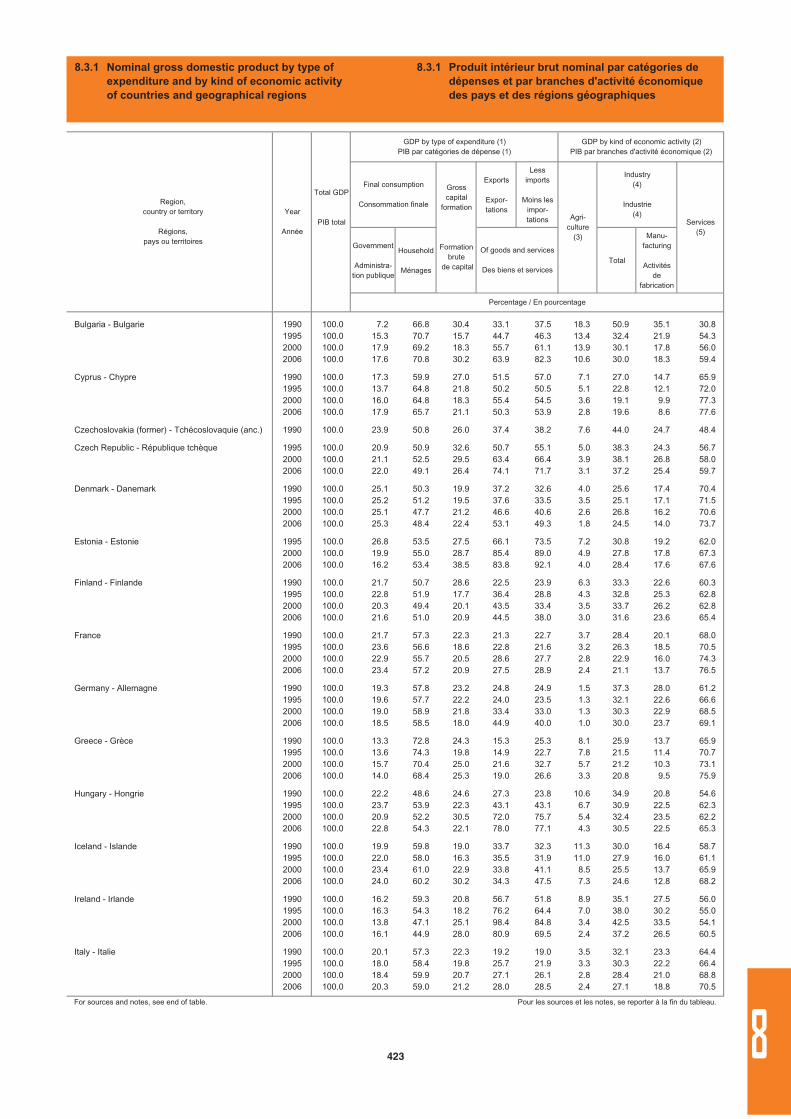
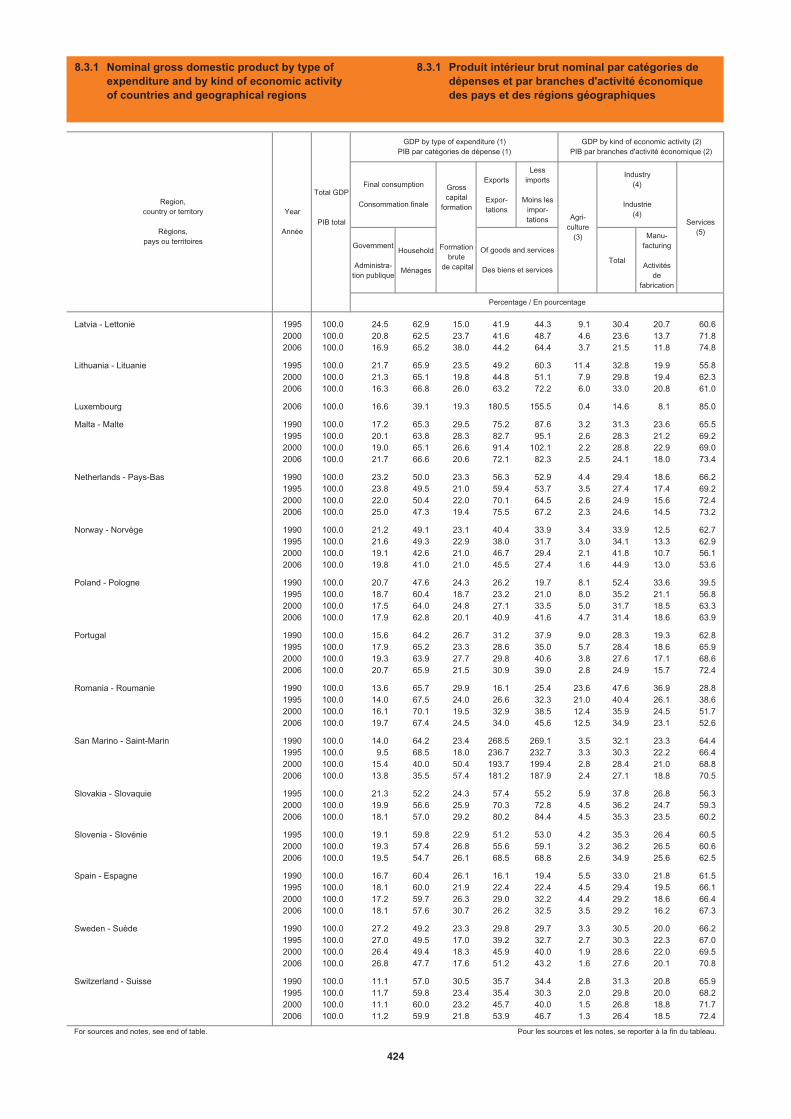
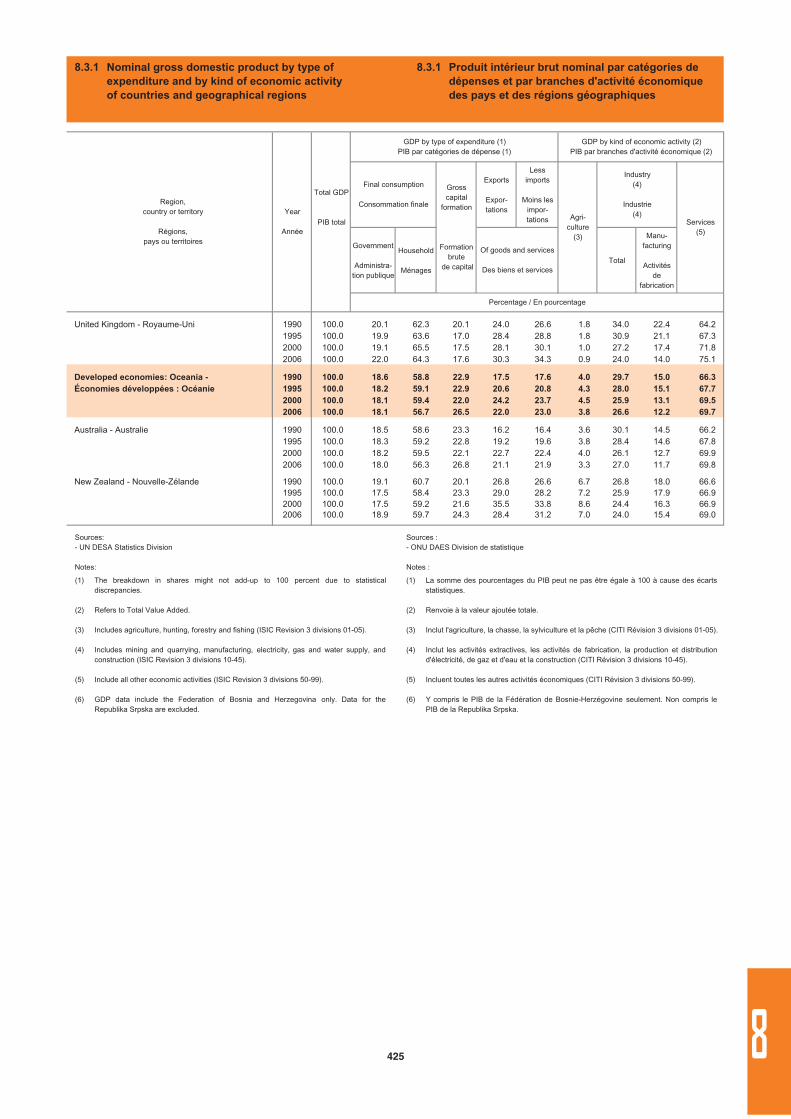
8.3.1 Nominal gross domestic product by type of expenditure and by kind of economic activity of countries and geographical regions………………. 408
8.3.1 Produit intérieur brut nominal par catégories de dépenses et par branches d'activité économique des pays et des régions géographiques………………... 408
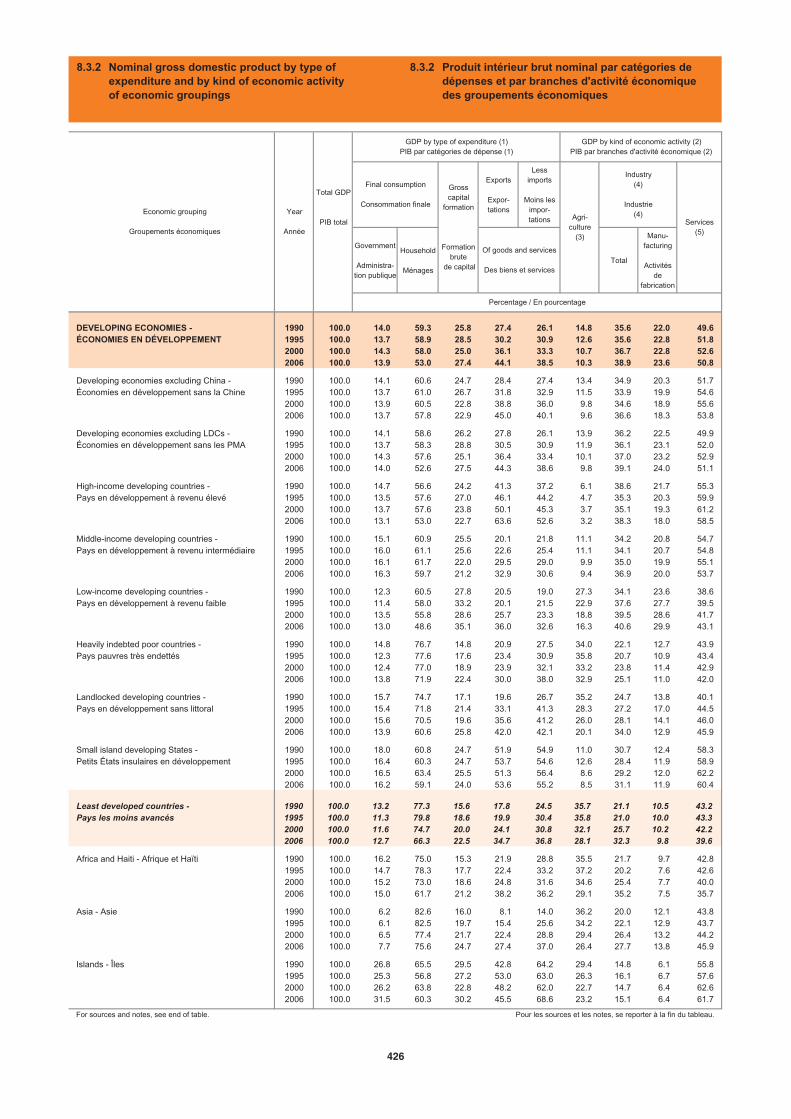
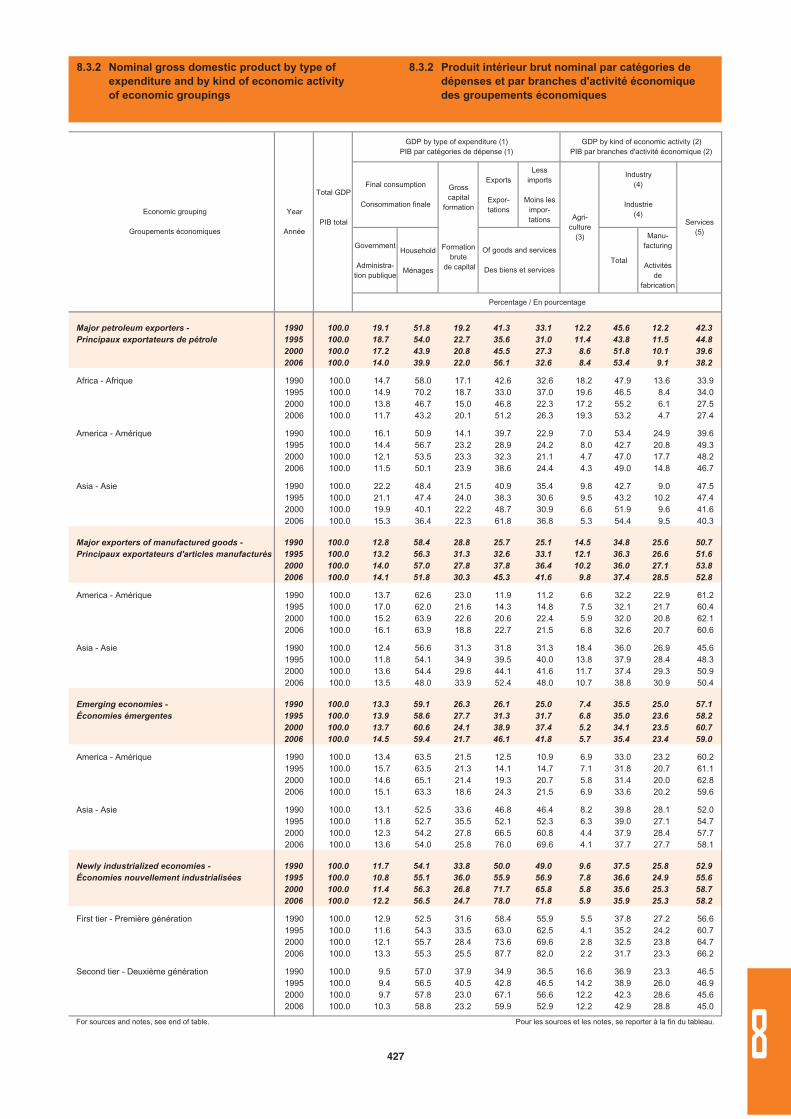
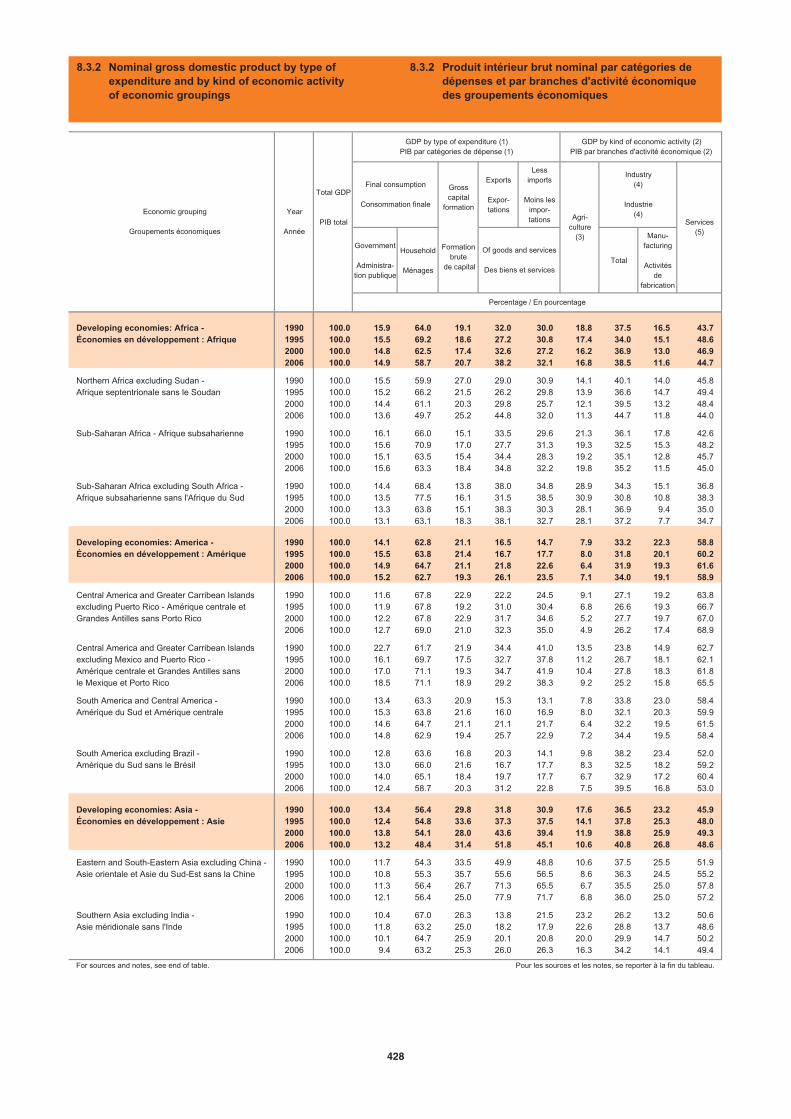
8.3.2 Nominal gross domestic product by type of expenditure and by kind of economic activity of economic groupings………………………………… 426
8.3.2 Produit intérieur brut nominal par catégories de dépenses et par branches d'activité économique des groupements économiques…………………………. 426
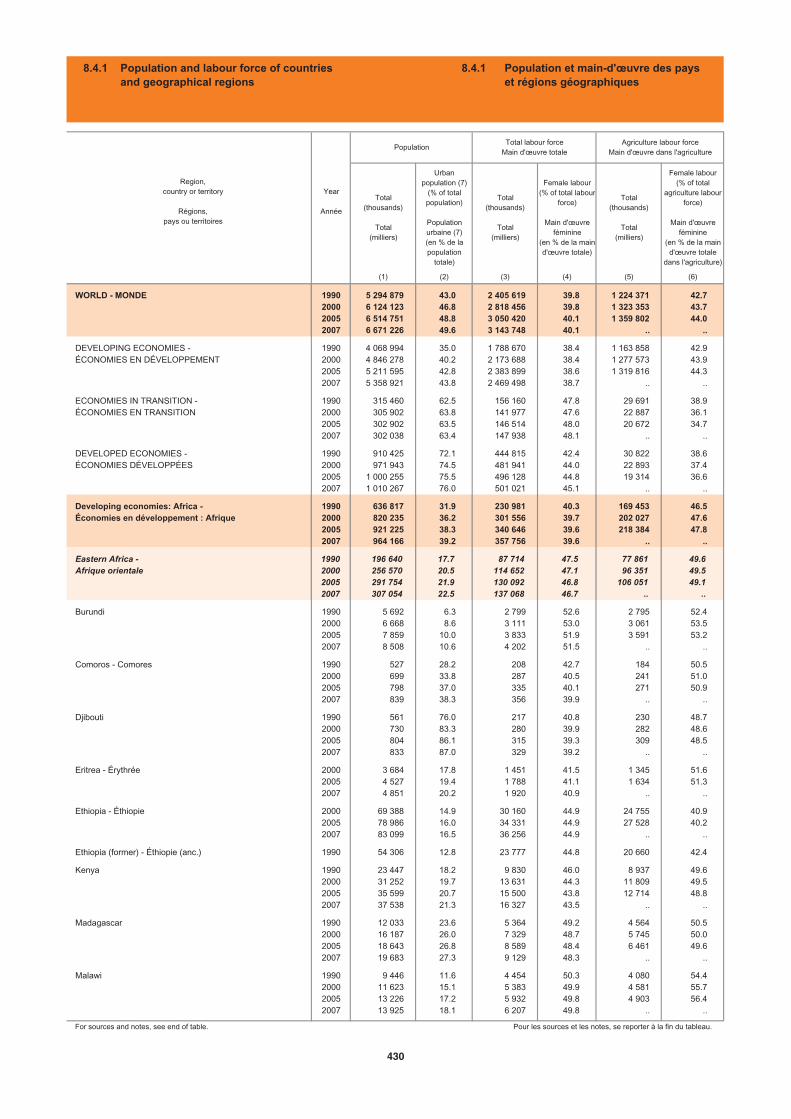
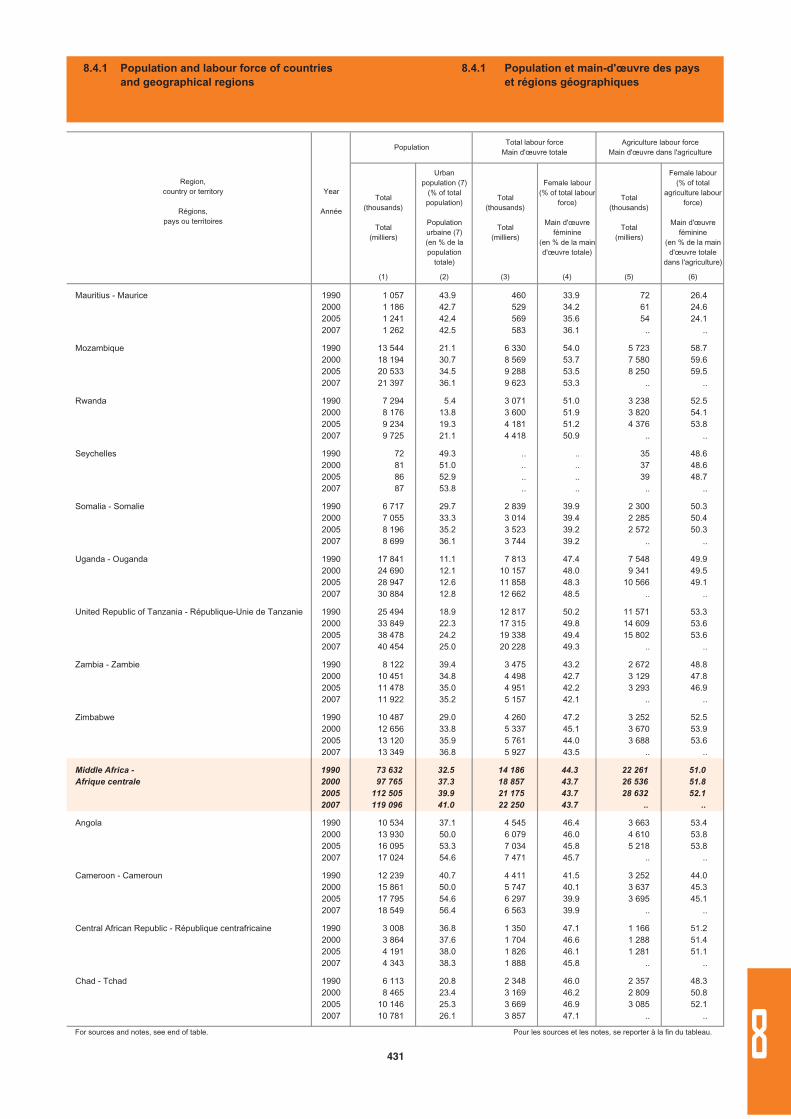
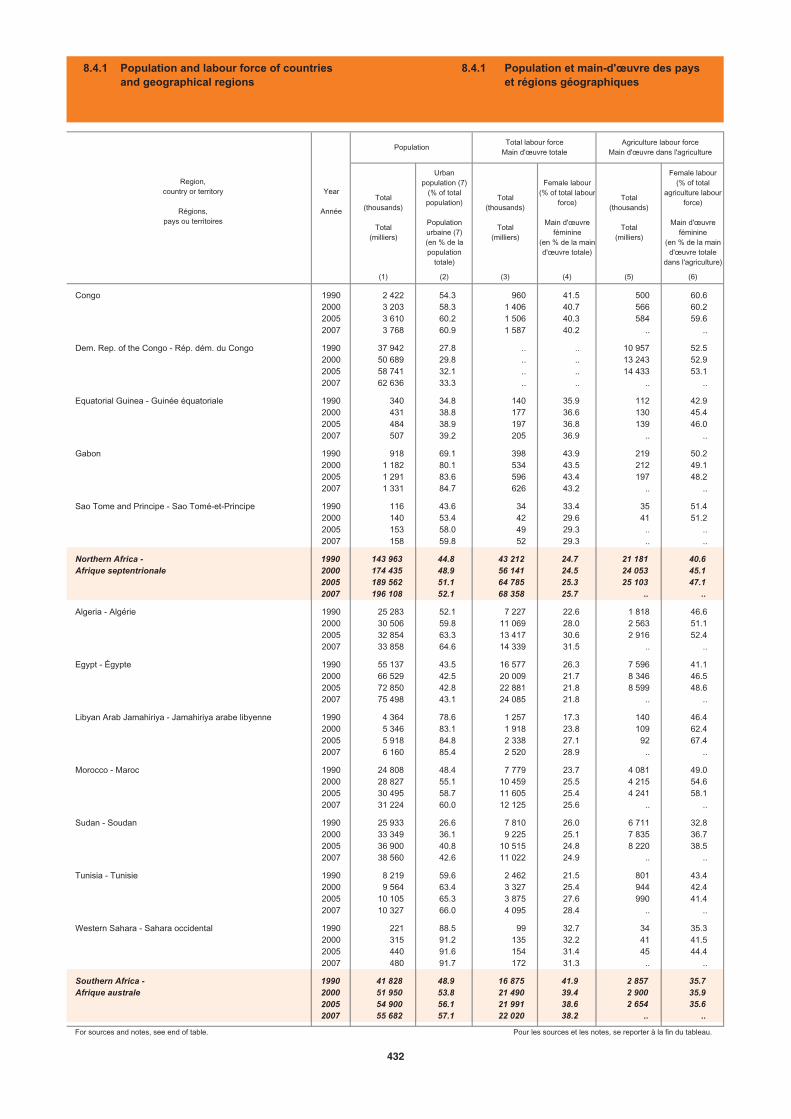
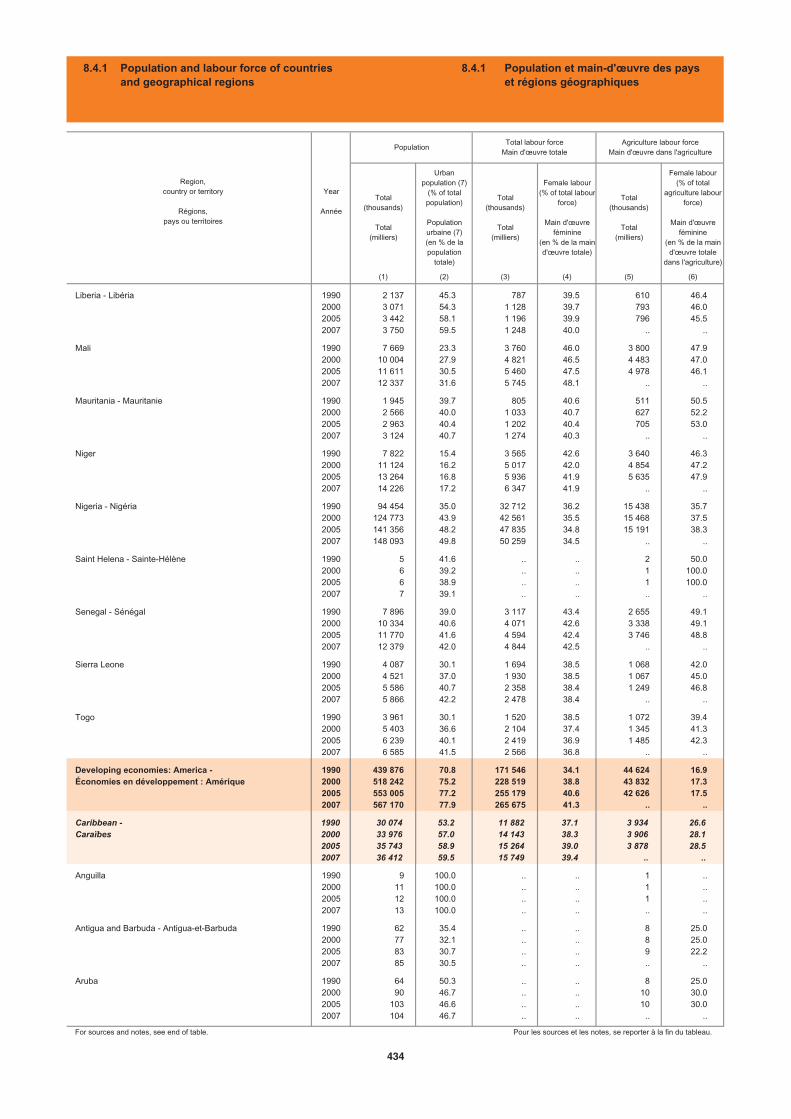
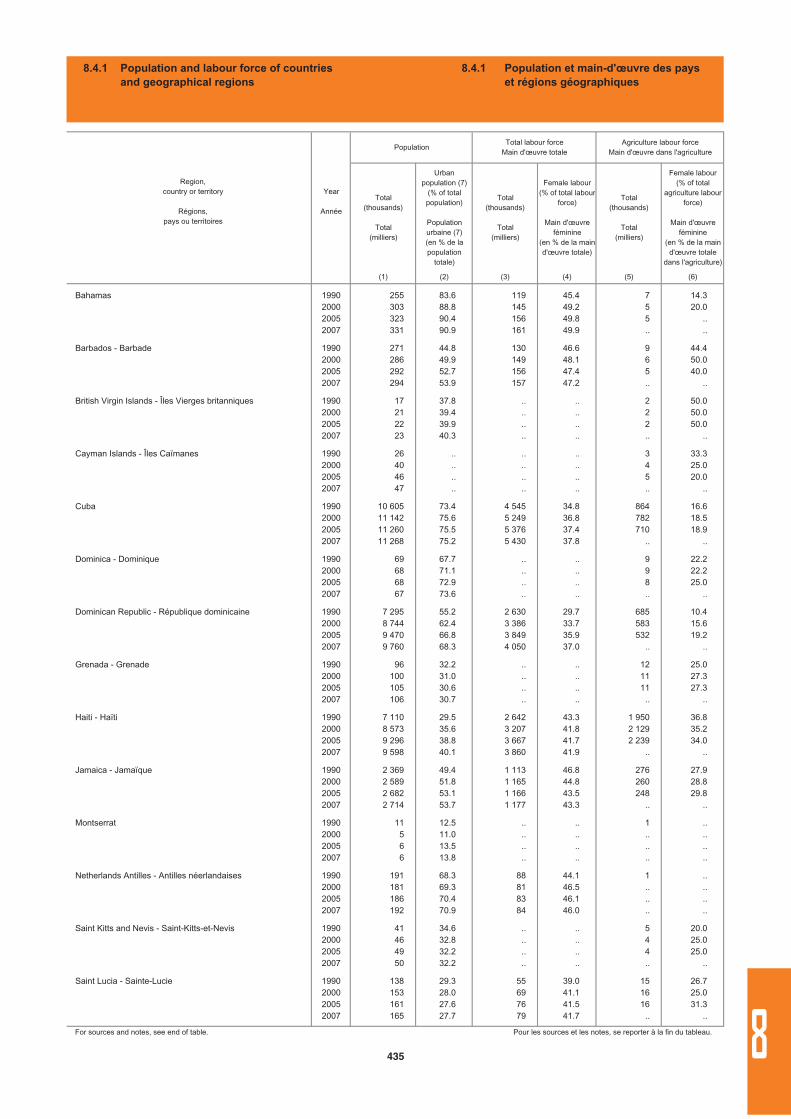
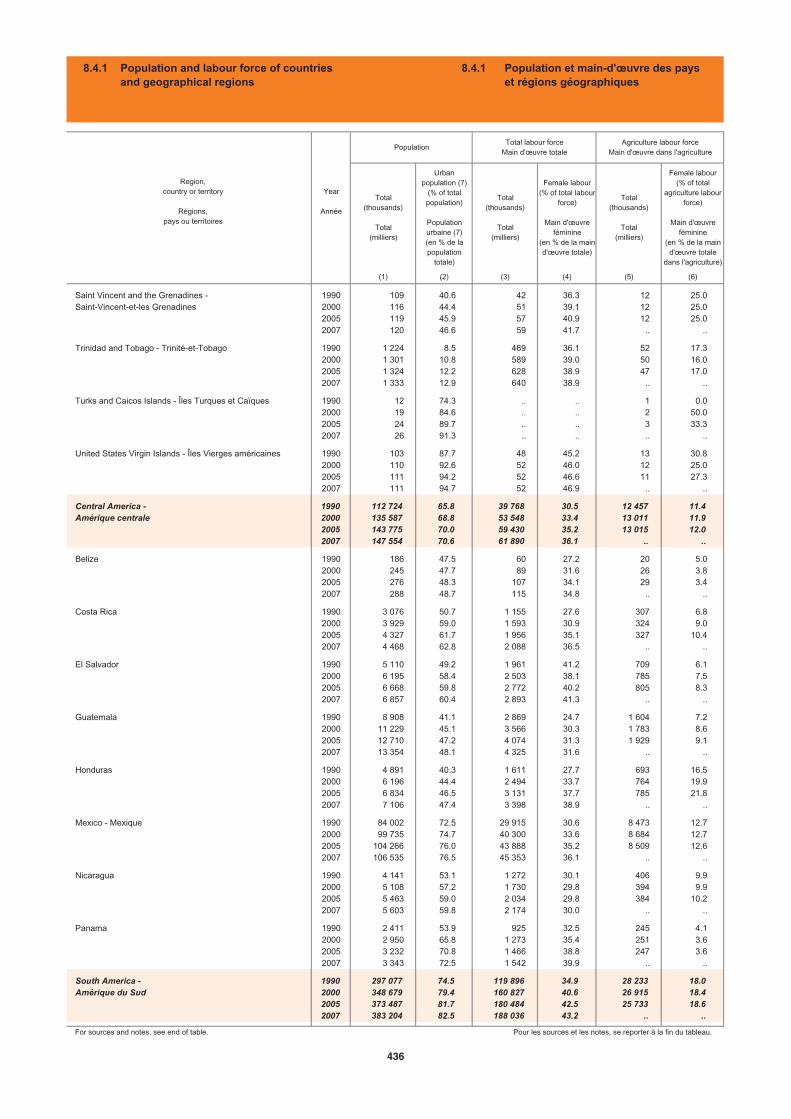
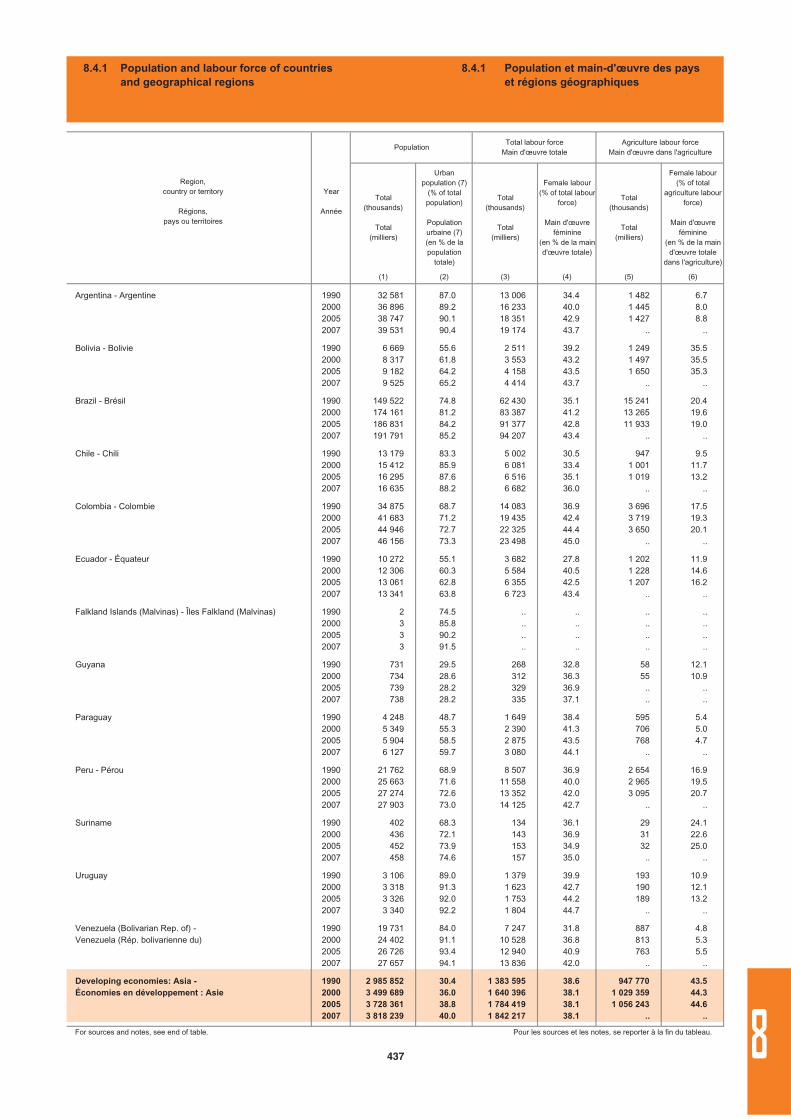
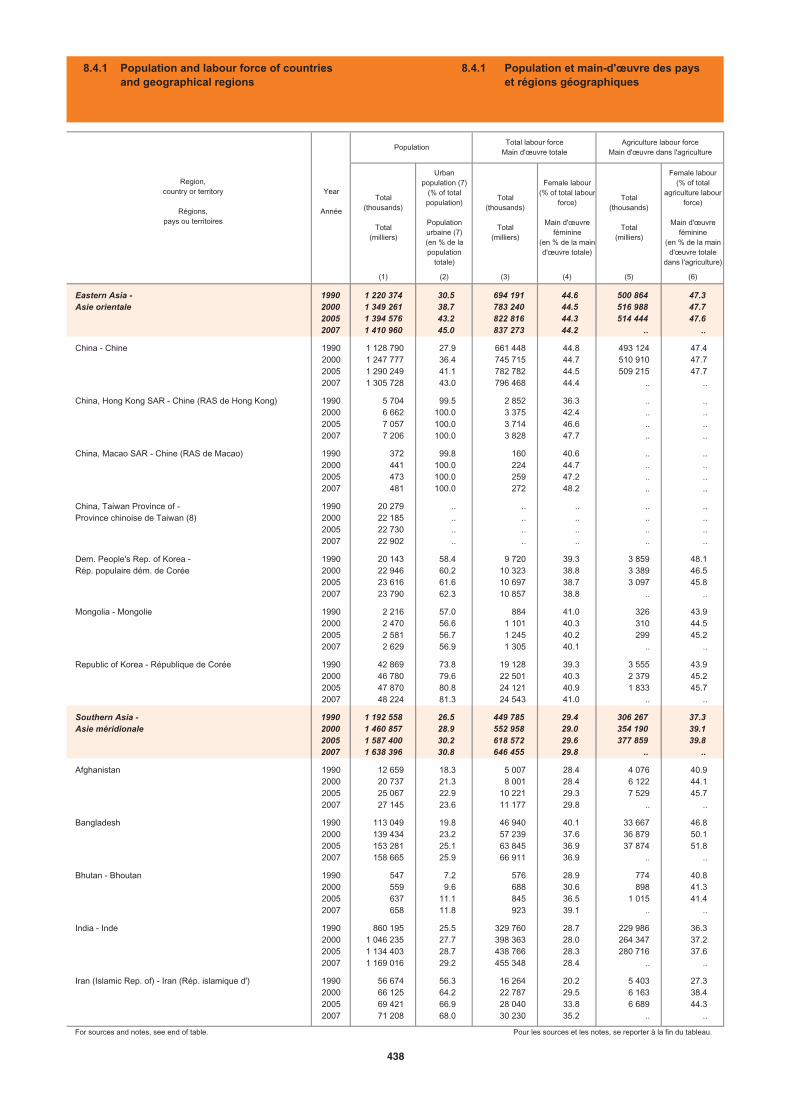
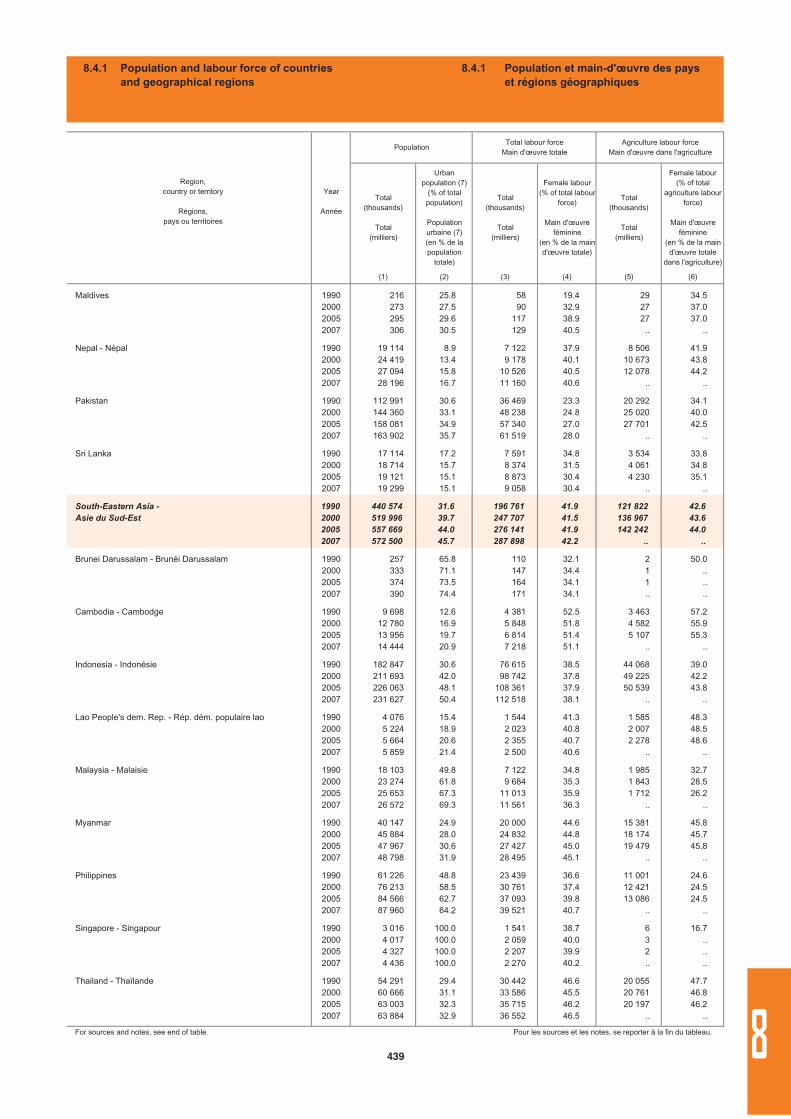
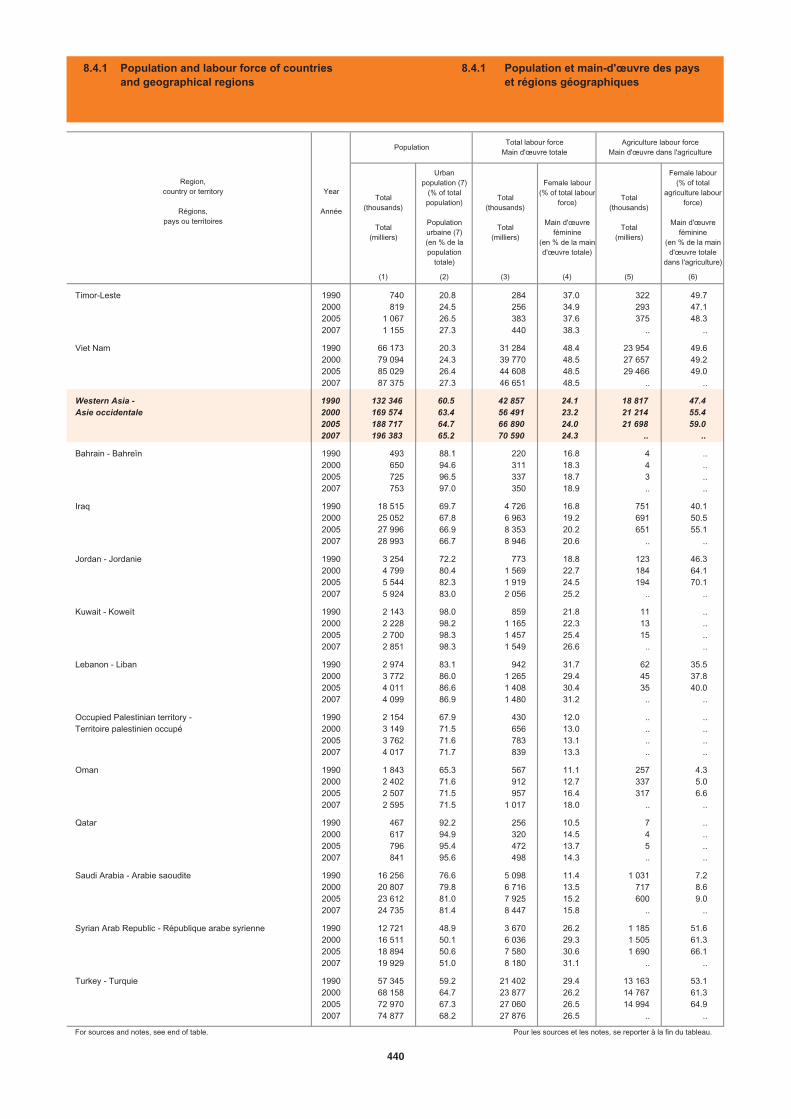
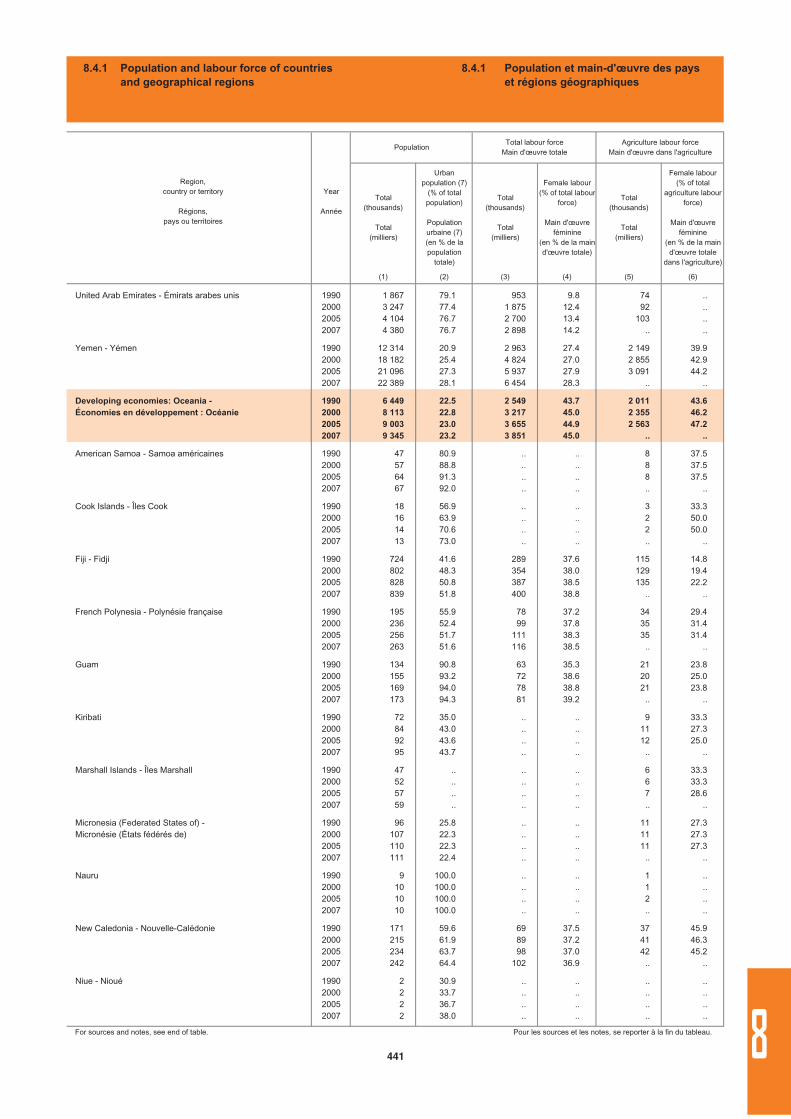
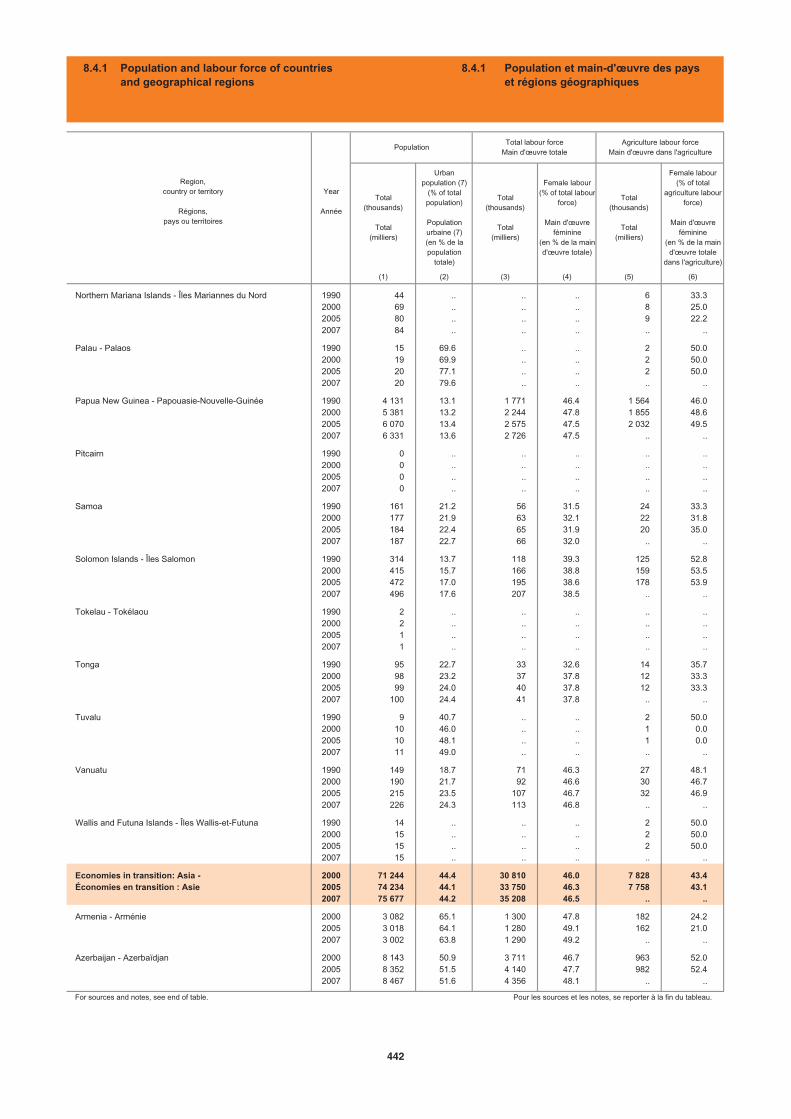
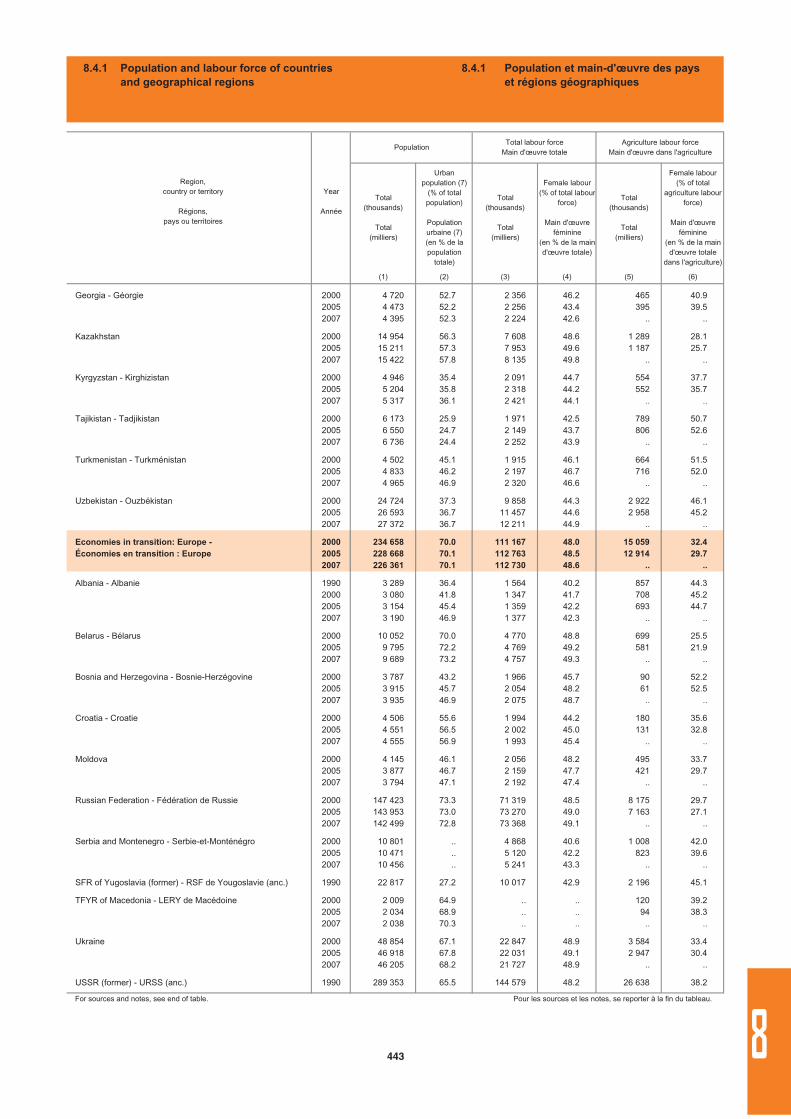
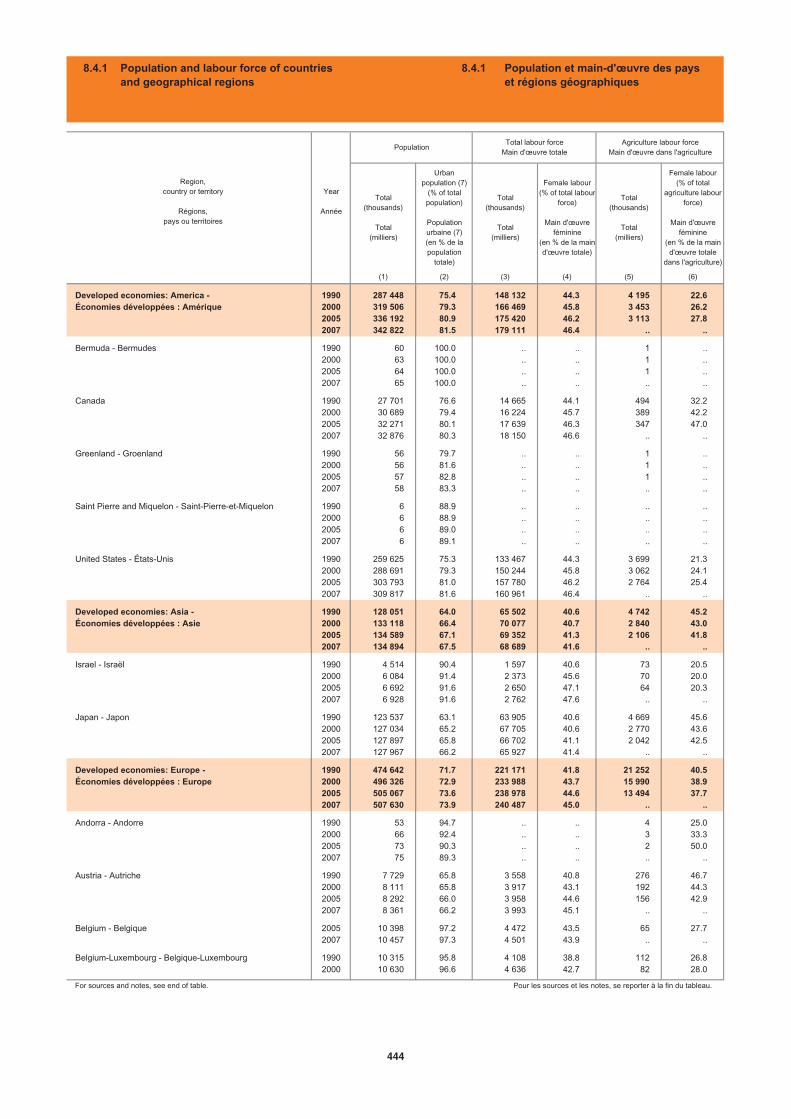
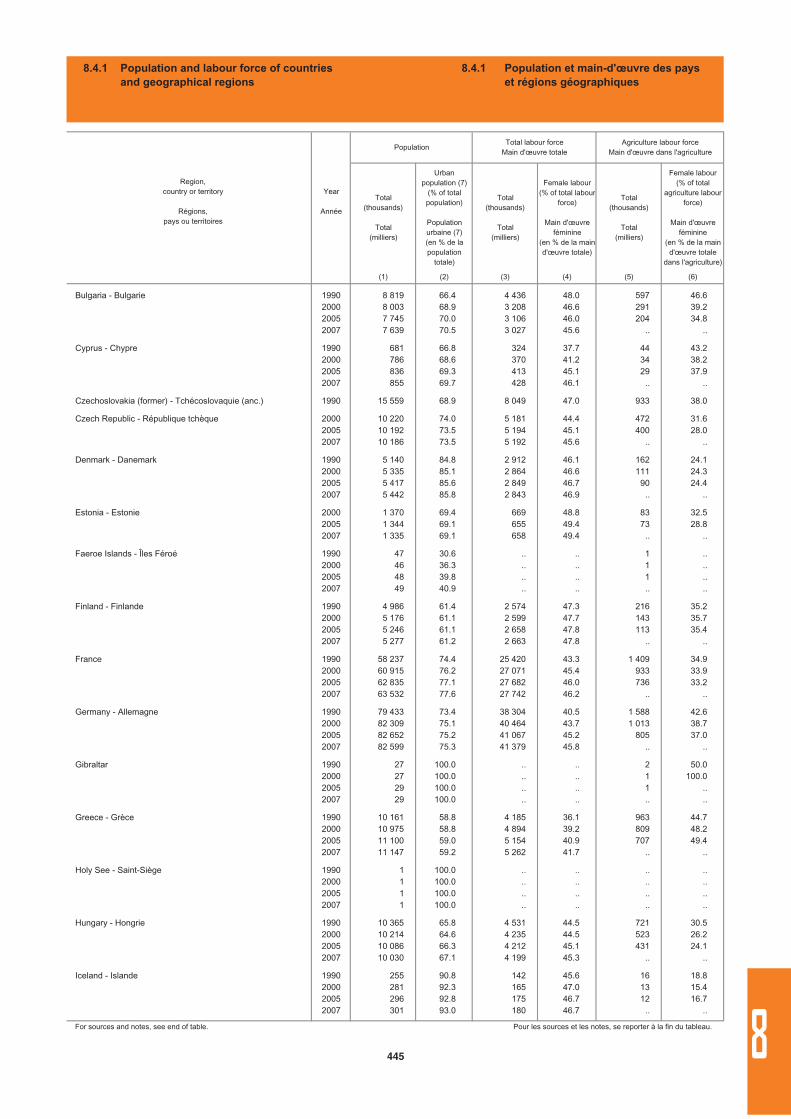
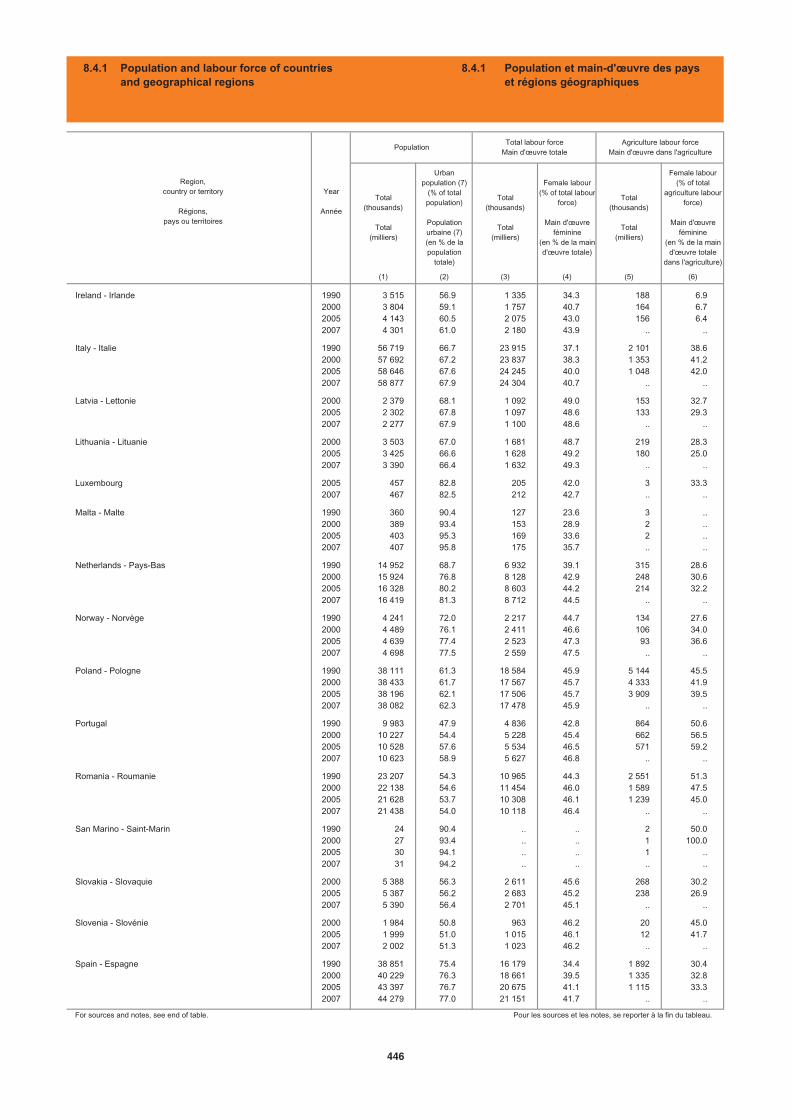
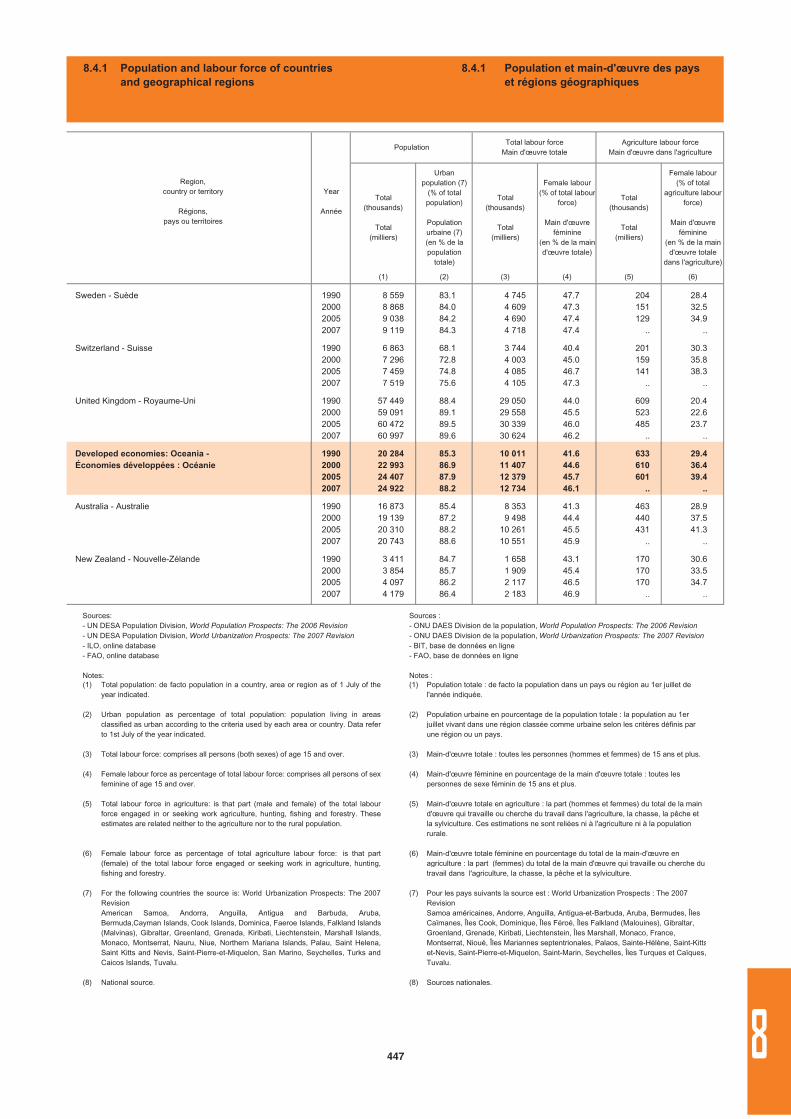
8.4.1 Population and labour force of countries and geographical regions……………………………….. 430
8.4.1 Population et main-d'œuvre des pays et des régions géographiques…………………………………… 430
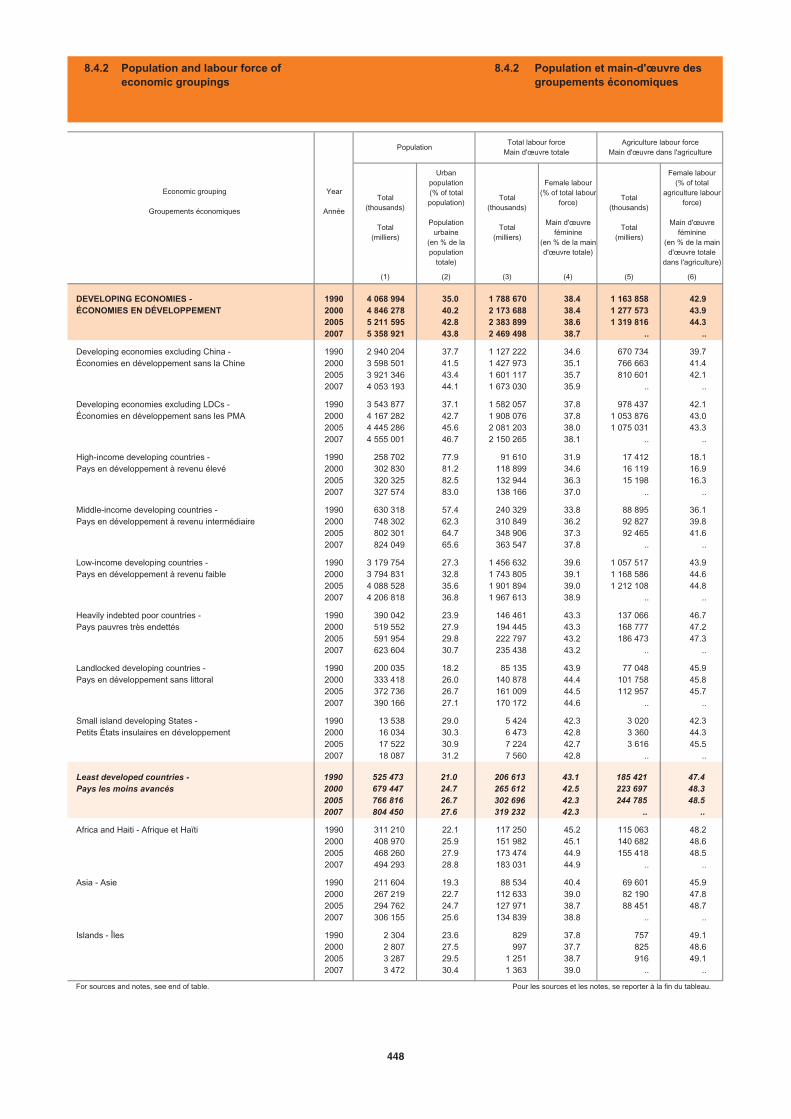
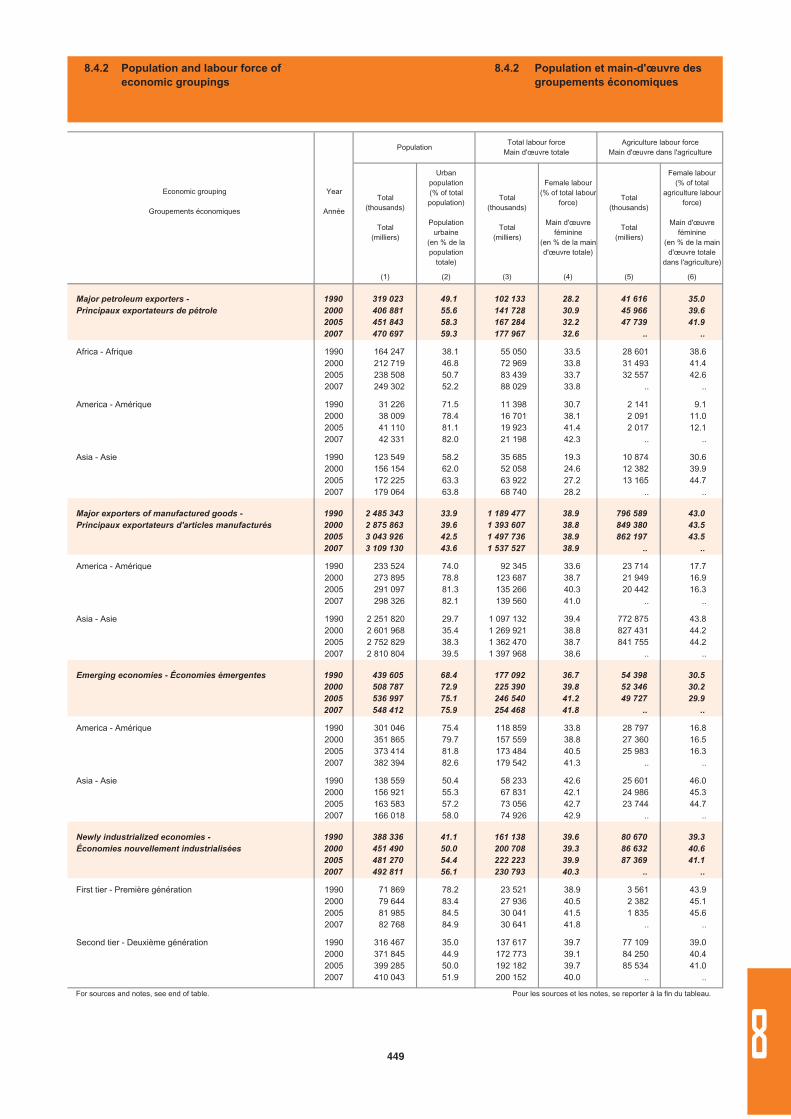
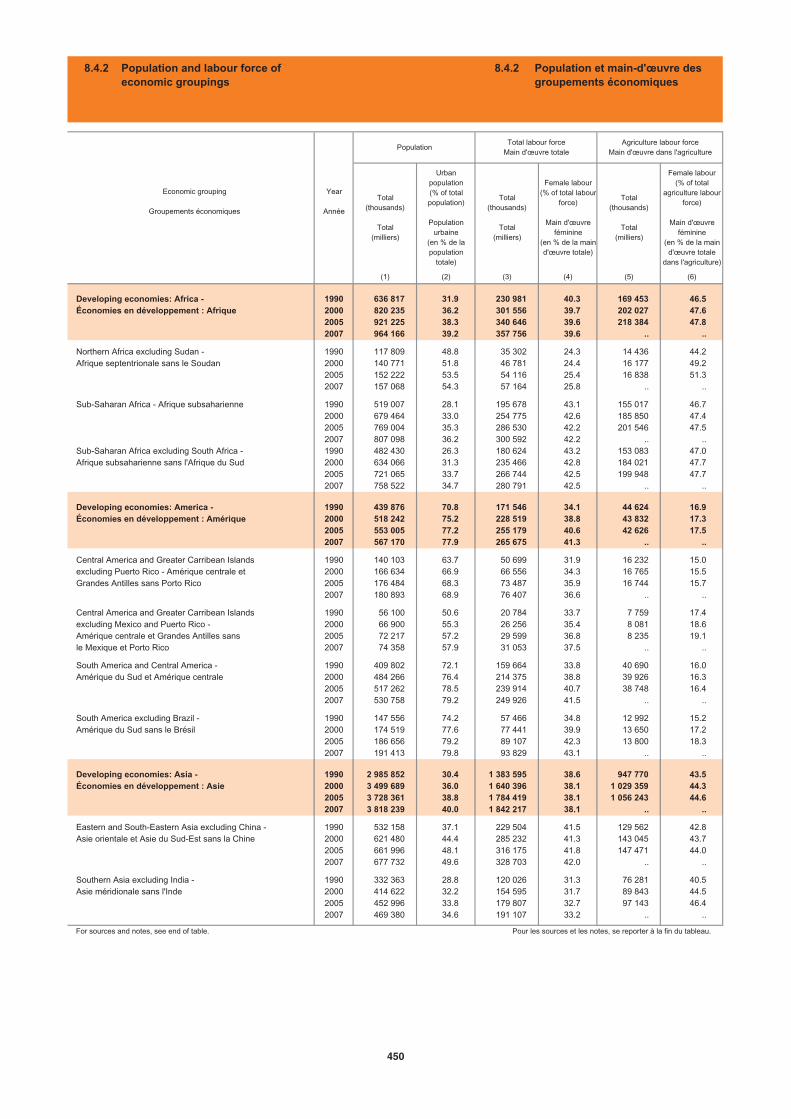
8.4.2 Population and labour force of economic groupings…………………………………………….. 448
8.4.2 Population et main-d'œuvre des groupements économiques………………………………………………. 448
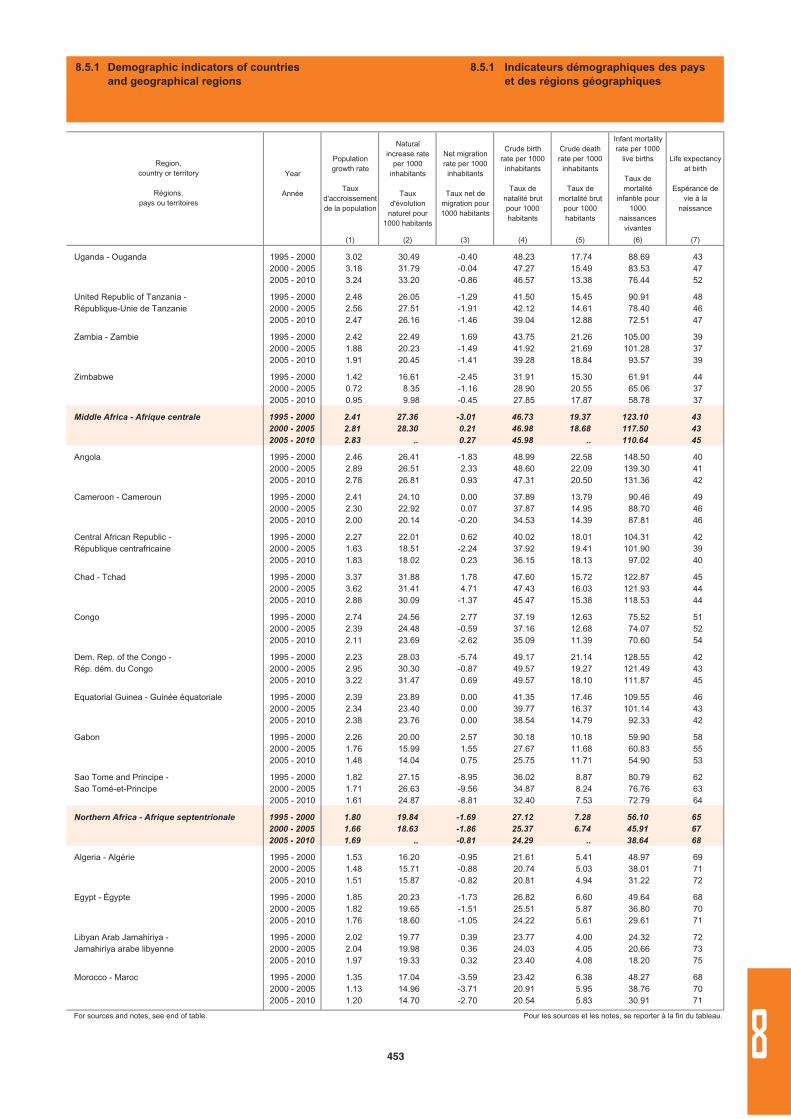
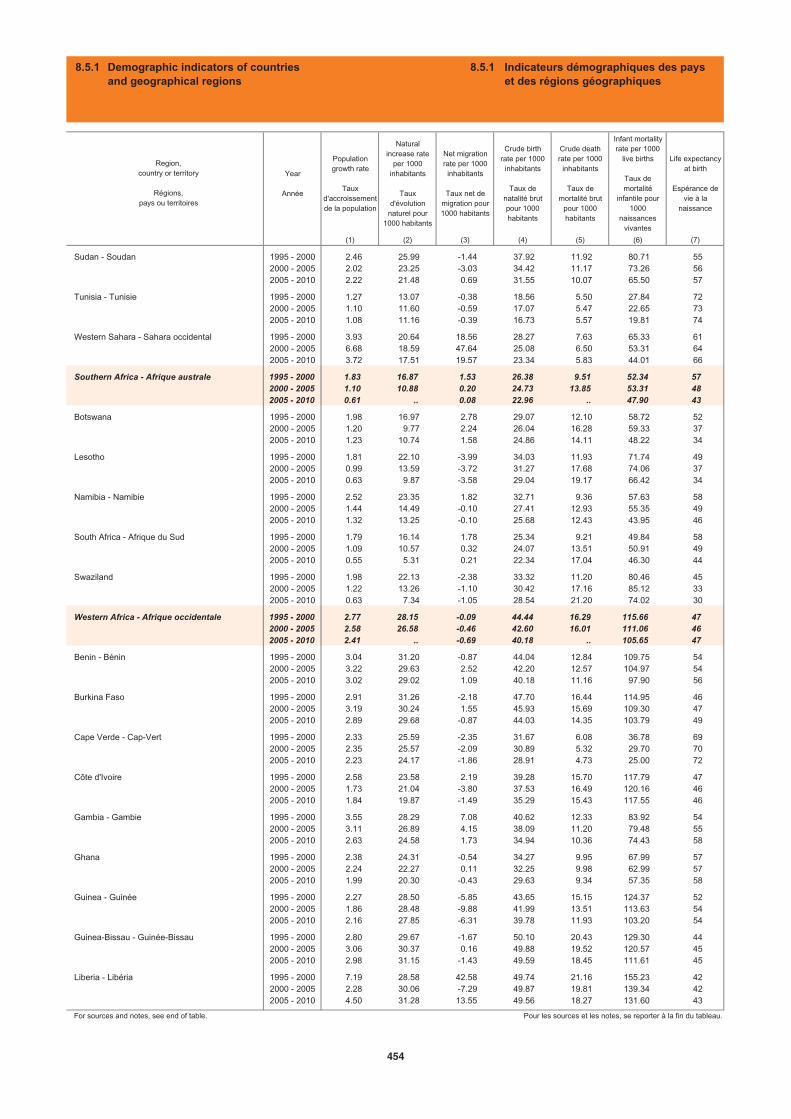
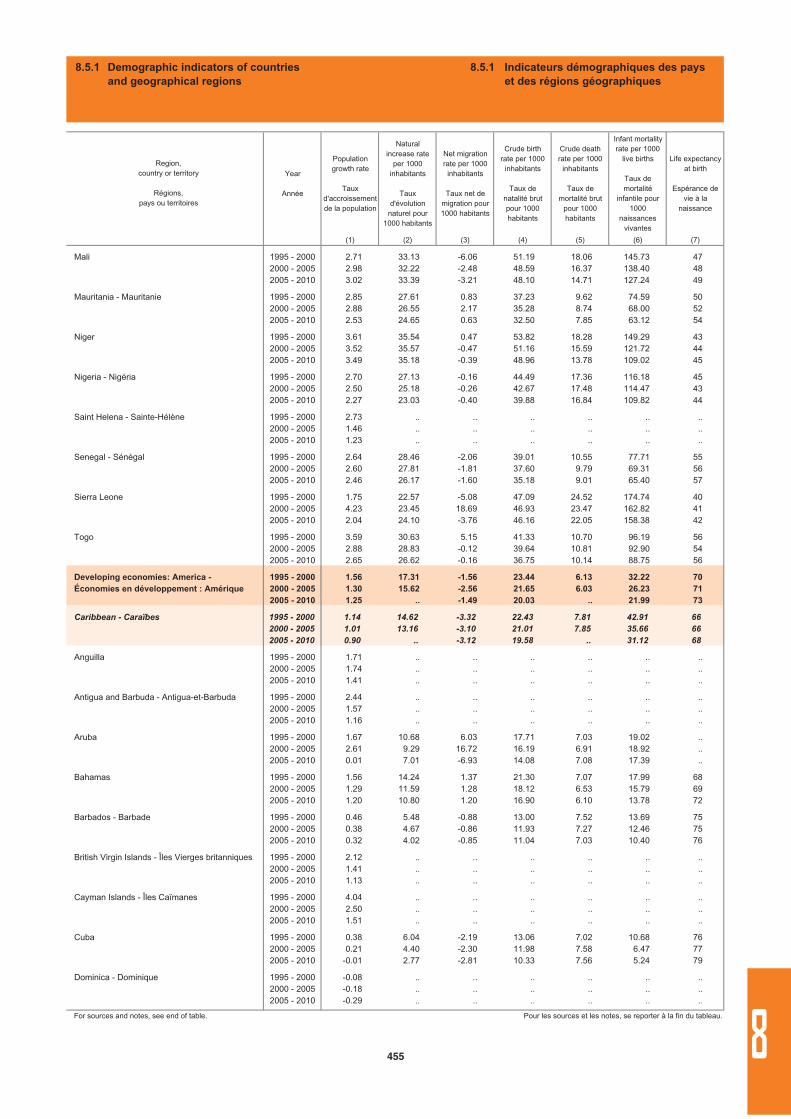
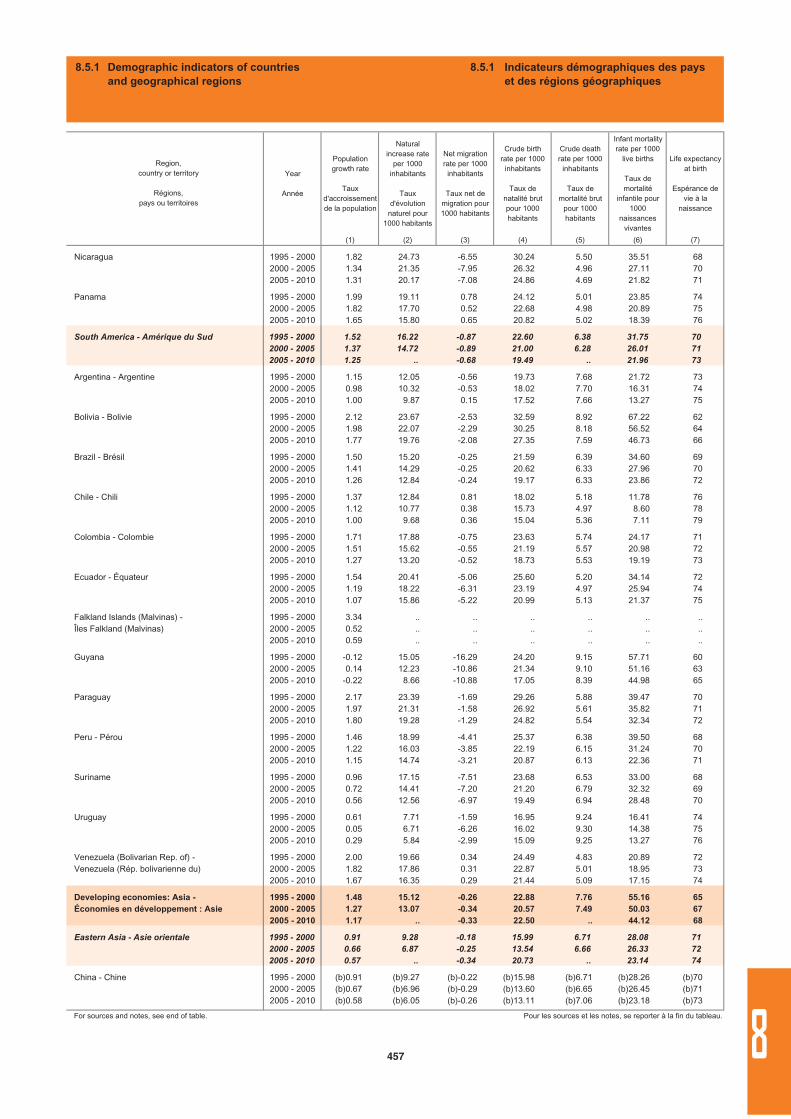
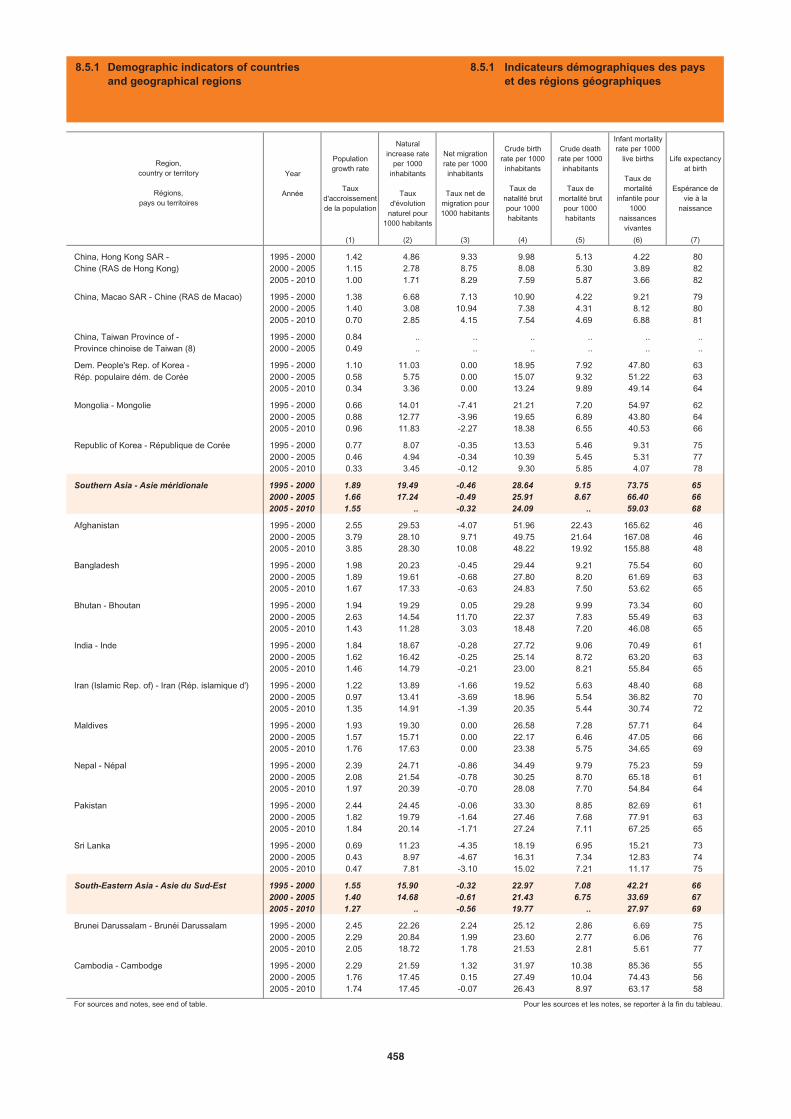
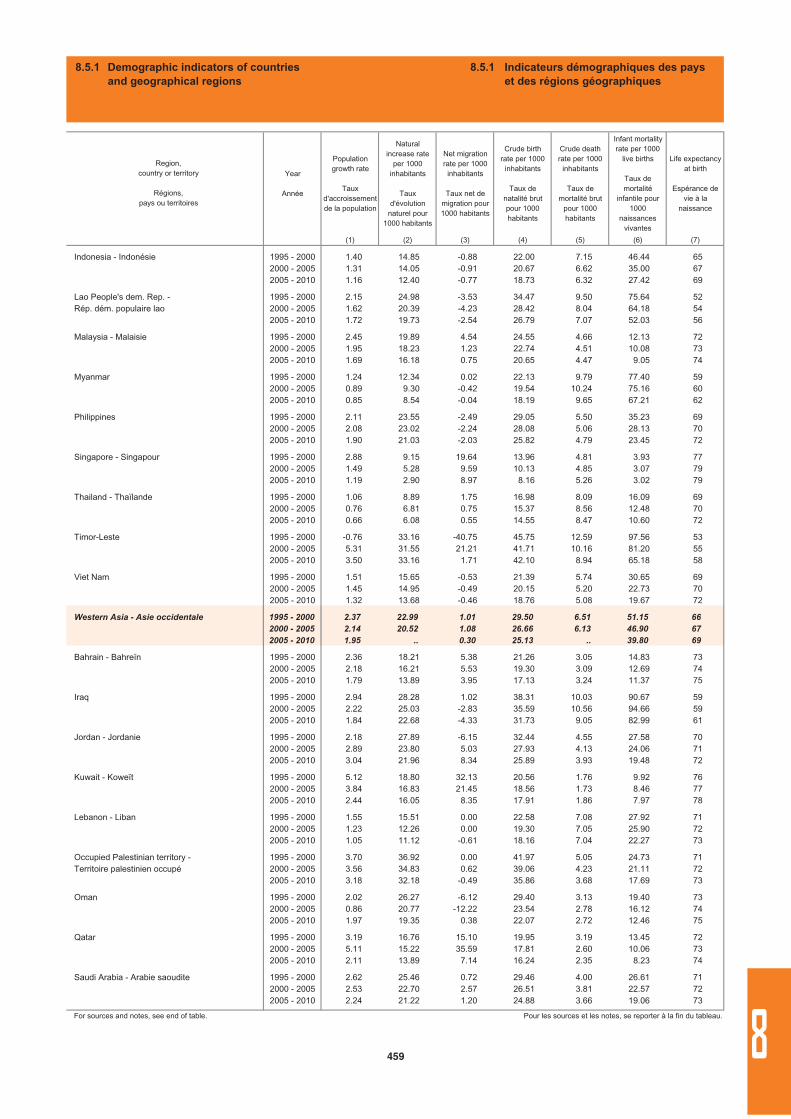
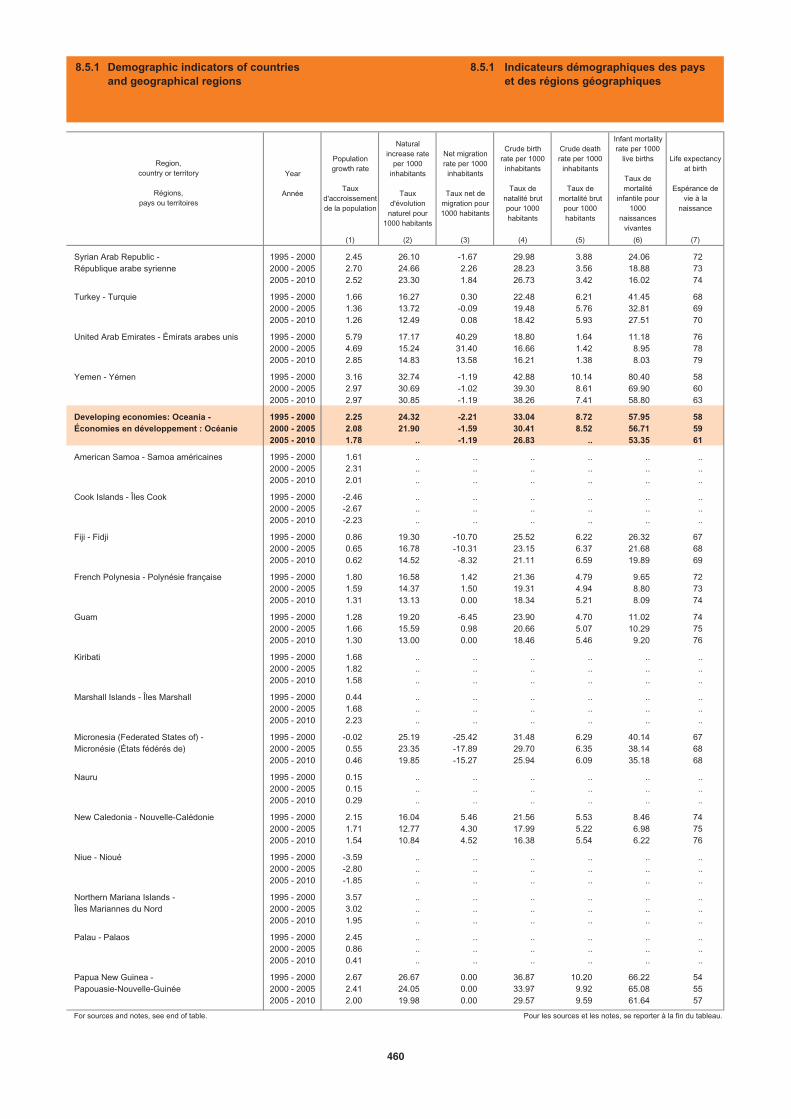
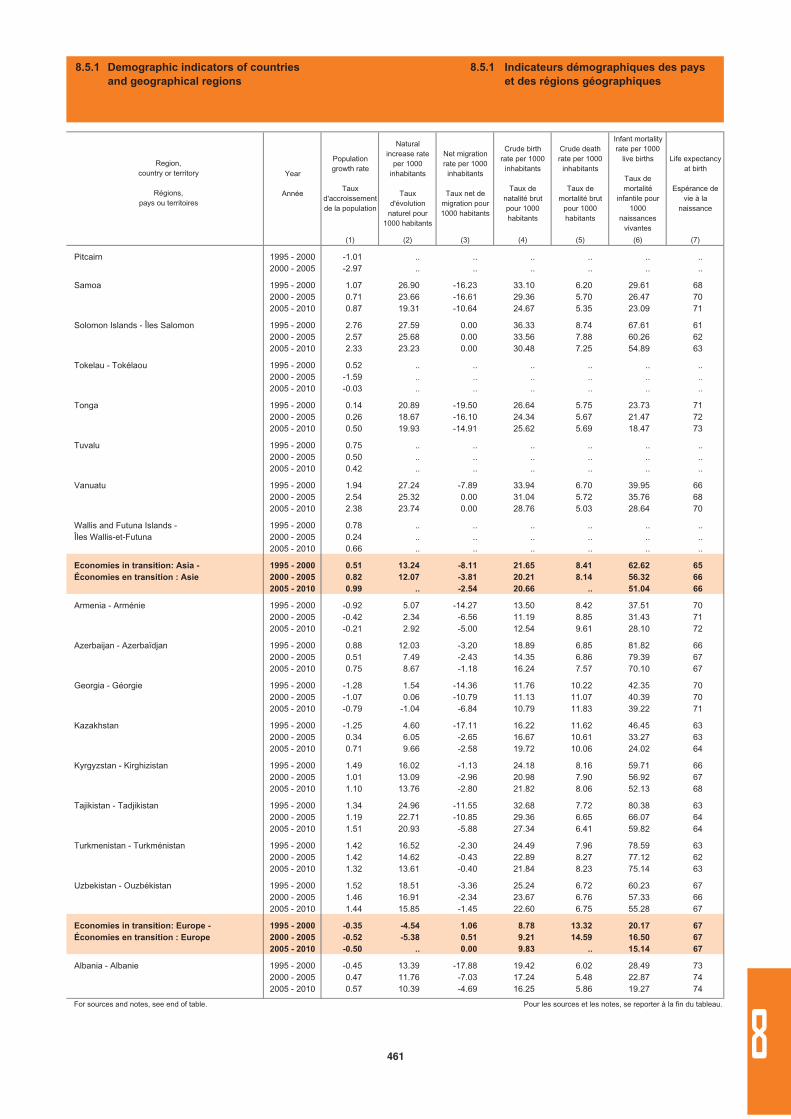
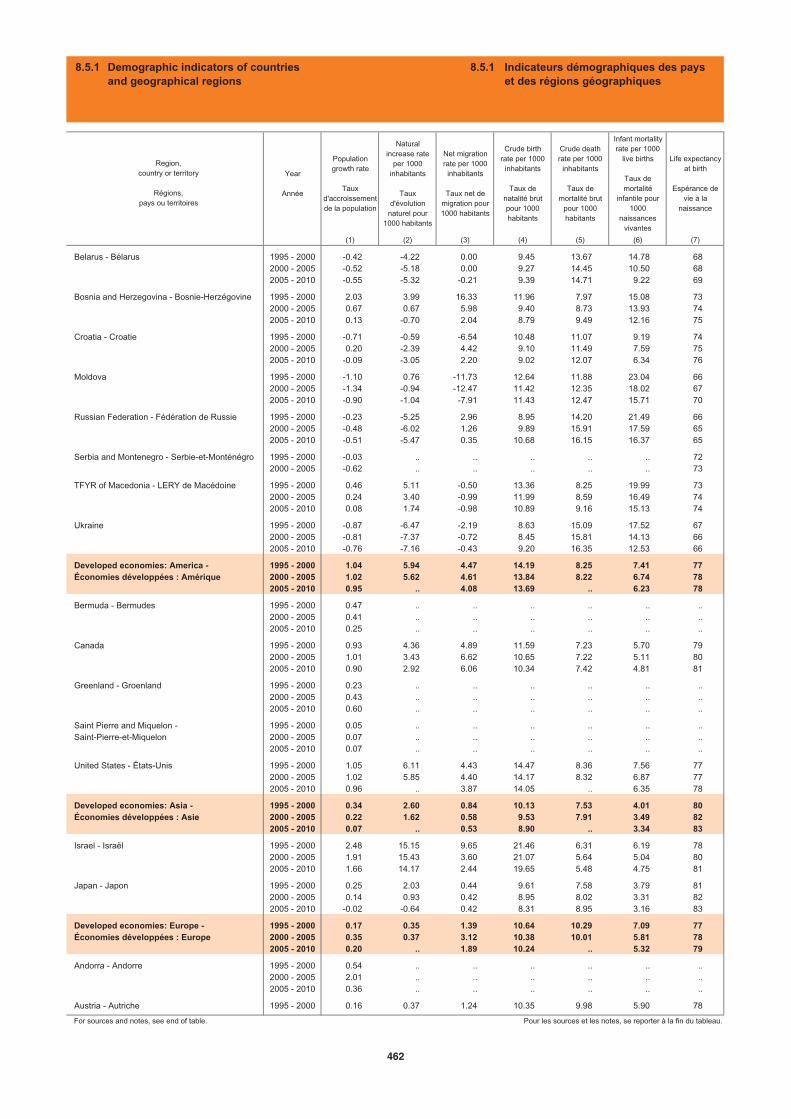
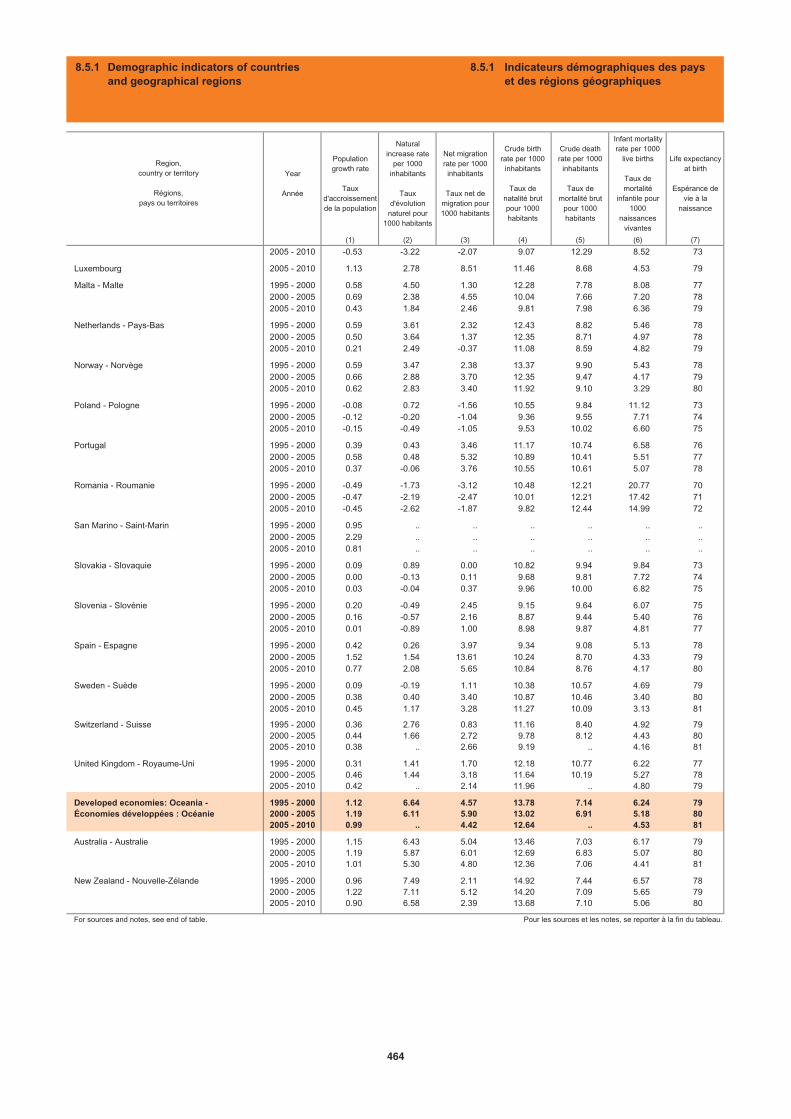
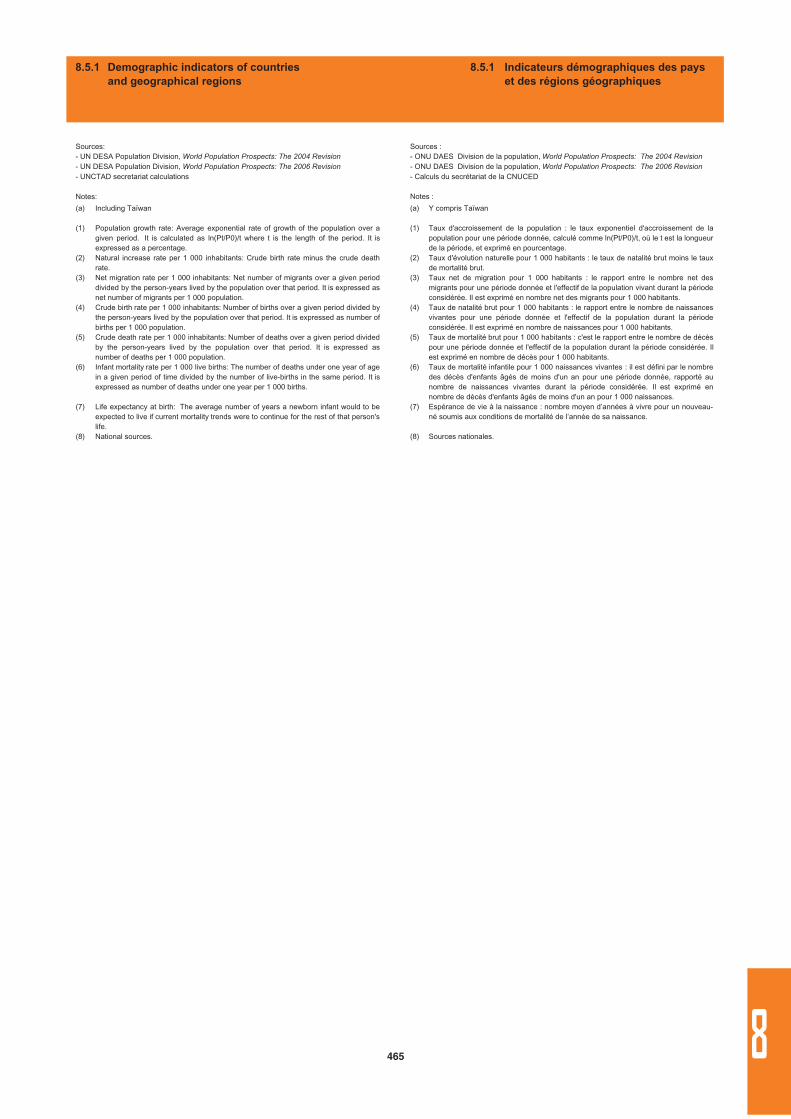
8.5.1 Demographic indicators of countries and geographical regions……………………………….. 452
8.5.1 Indicateurs démographiques des pays et des régions géographiques…………………………………… 452
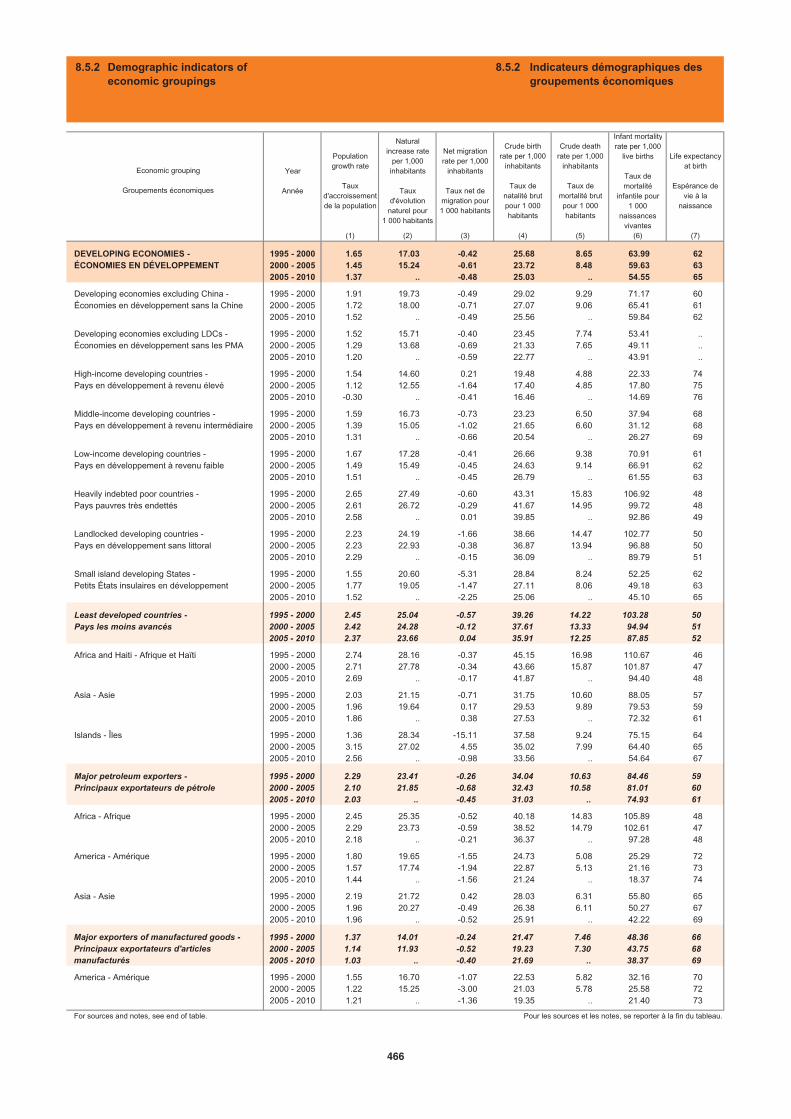
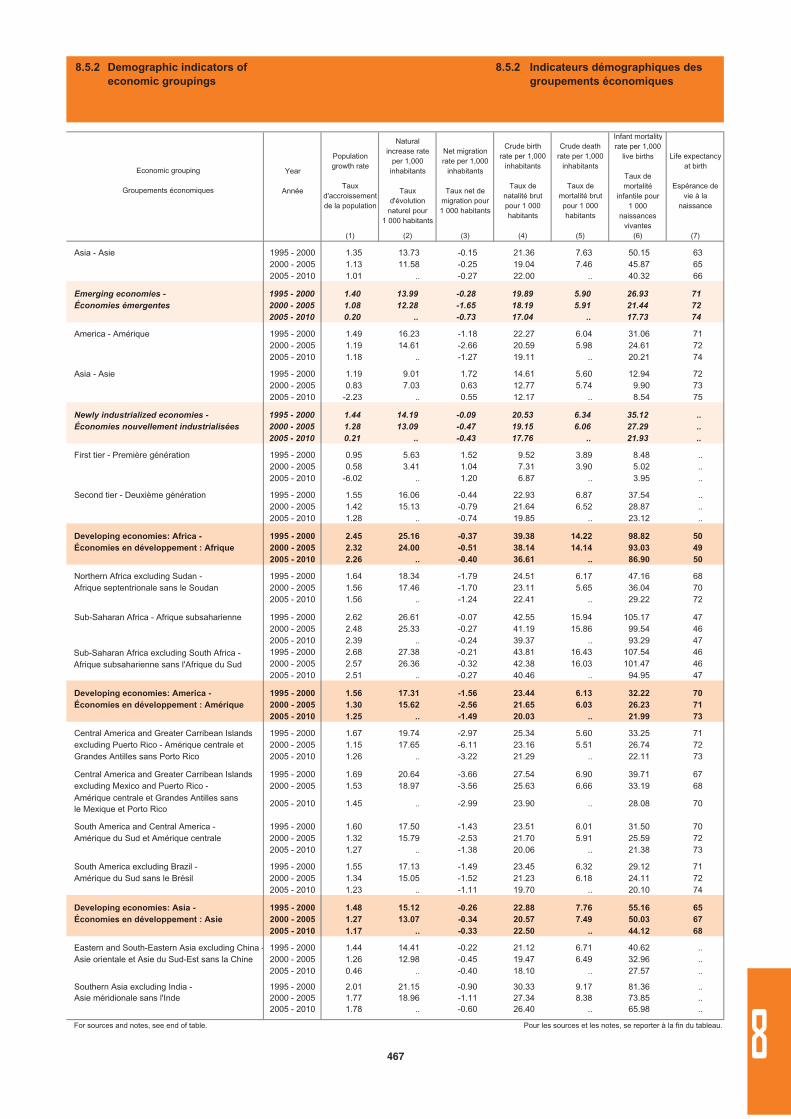
8.5.2 Demographic indicators of economic groupings…………………………………………….. 466
8.5.2 Indicateurs démographiques des groupements économiques ……………………………………………… 466
vii
GENERAL NOTES
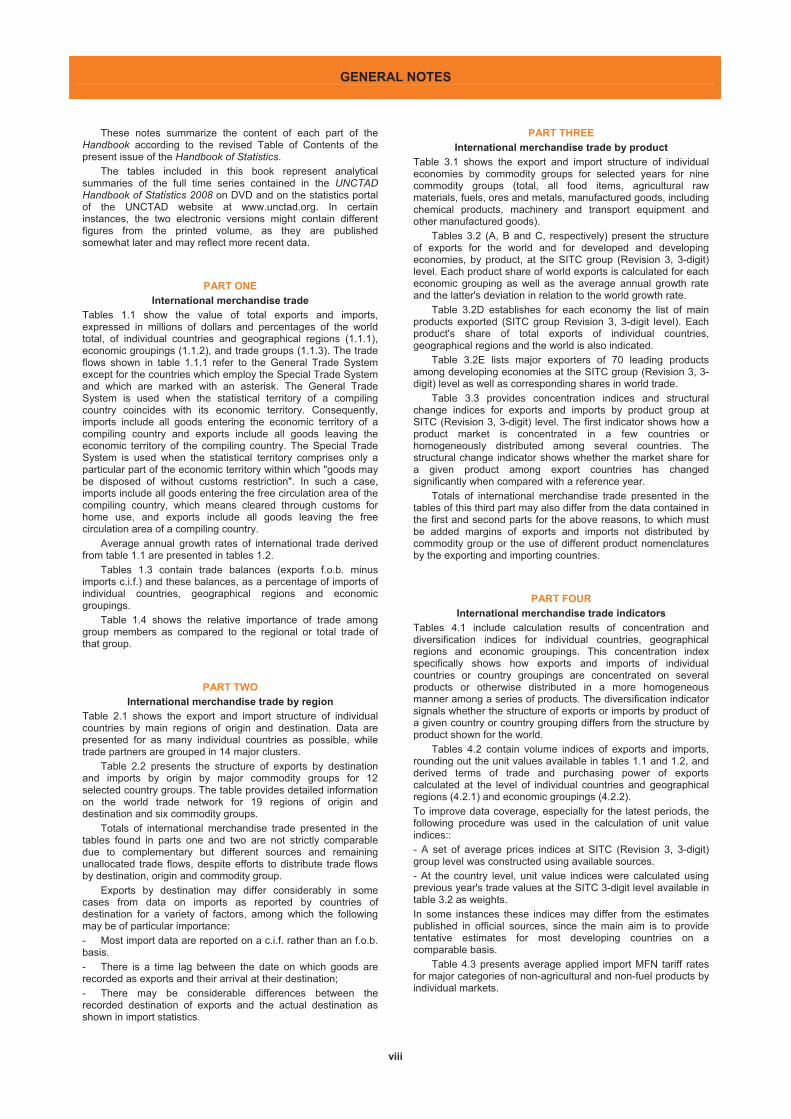
These notes summarize the content of each part of the Handbook according to the revised Table of Contents of the present issue of the Handbook of Statistics.
The tables included in this book represent analytical summaries of the full time series contained in the UNCTADHandbook of Statistics 2008 on DVD and on the statistics portal of the UNCTAD website at www.unctad.org. In certain instances, the two electronic versions might contain different figures from the printed volume, as they are published somewhat later and may reflect more recent data.
PART ONE International merchandise trade
Tables 1.1 show the value of total exports and imports, expressed in millions of dollars and percentages of the world total, of individual countries and geographical regions (1.1.1), economic groupings (1.1.2), and trade groups (1.1.3). The trade flows shown in table 1.1.1 refer to the General Trade System except for the countries which employ the Special Trade System and which are marked with an asterisk. The General Trade System is used when the statistical territory of a compiling country coincides with its economic territory. Consequently, imports include all goods entering the economic territory of a compiling country and exports include all goods leaving the economic territory of the compiling country. The Special Trade System is used when the statistical territory comprises only a particular part of the economic territory within which "goods may be disposed of without customs restriction". In such a case, imports include all goods entering the free circulation area of the compiling country, which means cleared through customs for home use, and exports include all goods leaving the free circulation area of a compiling country.
Average annual growth rates of international trade derived from table 1.1 are presented in tables 1.2.
Tables 1.3 contain trade balances (exports f.o.b. minus imports c.i.f.) and these balances, as a percentage of imports of individual countries, geographical regions and economic groupings.
Table 1.4 shows the relative importance of trade among group members as compared to the regional or total trade of that group.
PART TWOInternational merchandise trade by region
Table 2.1 shows the export and import structure of individual countries by main regions of origin and destination. Data are presented for as many individual countries as possible, while trade partners are grouped in 14 major clusters.
Table 2.2 presents the structure of exports by destination and imports by origin by major commodity groups for 12 selected country groups. The table provides detailed information on the world trade network for 19 regions of origin and destination and six commodity groups.
Totals of international merchandise trade presented in the tables found in parts one and two are not strictly comparable due to complementary but different sources and remaining unallocated trade flows, despite efforts to distribute trade flows by destination, origin and commodity group.
Exports by destination may differ considerably in some cases from data on imports as reported by countries of destination for a variety of factors, among which the following may be of particular importance:
- Most import data are reported on a c.i.f. rather than an f.o.b. basis.
- There is a time lag between the date on which goods are recorded as exports and their arrival at their destination;
- There may be considerable differences between the recorded destination of exports and the actual destination as shown in import statistics.
PART THREEInternational merchandise trade by product
Table 3.1 shows the export and import structure of individual economies by commodity groups for selected years for nine commodity groups (total, all food items, agricultural raw materials, fuels, ores and metals, manufactured goods, including chemical products, machinery and transport equipment and other manufactured goods).
Tables 3.2 (A, B and C, respectively) present the structure of exports for the world and for developed and developing economies, by product, at the SITC group (Revision 3, 3-digit) level. Each product share of world exports is calculated for each economic grouping as well as the average annual growth rate and the latter's deviation in relation to the world growth rate.
Table 3.2D establishes for each economy the list of main products exported (SITC group Revision 3, 3-digit level). Each product's share of total exports of individual countries, geographical regions and the world is also indicated.
Table 3.2E lists major exporters of 70 leading products among developing economies at the SITC group (Revision 3, 3-digit) level as well as corresponding shares in world trade.
Table 3.3 provides concentration indices and structural change indices for exports and imports by product group at SITC (Revision 3, 3-digit) level. The first indicator shows how a product market is concentrated in a few countries or homogeneously distributed among several countries. The structural change indicator shows whether the market share for a given product among export countries has changed significantly when compared with a reference year.
Totals of international merchandise trade presented in the tables of this third part may also differ from the data contained in the first and second parts for the above reasons, to which must be added margins of exports and imports not distributed by commodity group or the use of different product nomenclatures by the exporting and importing countries.
PART FOURInternational merchandise trade indicators
Tables 4.1 include calculation results of concentration and diversification indices for individual countries, geographical regions and economic groupings. This concentration index specifically shows how exports and imports of individual countries or country groupings are concentrated on several products or otherwise distributed in a more homogeneous manner among a series of products. The diversification indicator signals whether the structure of exports or imports by product of a given country or country grouping differs from the structure by product shown for the world.
Tables 4.2 contain volume indices of exports and imports, rounding out the unit values available in tables 1.1 and 1.2, and derived terms of trade and purchasing power of exports calculated at the level of individual countries and geographical regions (4.2.1) and economic groupings (4.2.2).
To improve data coverage, especially for the latest periods, the following procedure was used in the calculation of unit value indices::
- A set of average prices indices at SITC (Revision 3, 3-digit) group level was constructed using available sources.
- At the country level, unit value indices were calculated using previous year's trade values at the SITC 3-digit level available in table 3.2 as weights.
In some instances these indices may differ from the estimates published in official sources, since the main aim is to provide tentative estimates for most developing countries on a comparable basis.
Table 4.3 presents average applied import MFN tariff rates for major categories of non-agricultural and non-fuel products by individual markets.
viii
PART FIVEInternational trade in services
Tables 5.1.1, 5.1.2, and 5.1.3 present the value of total trade in services by individual country, geographical region, economic grouping and trade group. The tables show values of exports (credits) and imports (debits) of services that were derived from statistics on international service transactions as presented in the IMF’s Balance of Payments Statistics. Services are defined as the economic output of intangible commodities that may be produced, transferred and consumed at the same time. However, services cover a heterogeneous range of intangible products and activities that are difficult to capture within a single definition and are sometimes hard to separate from goods. Services are outputs produced to order, and they typically include changes in the condition of the consumers realized through the activities of the producers at the demand of customers. By the time production of a service is completed, it must have been provided to a consumer.
Services figures shown here comprise 11 principal services categories according to the concepts and definitions of the IMF Balance of Payments Manual (BPM5, 1993). These categories cover transport; travel; communications; construction; insurance; financial services; computer and information services; royalties and license fees; other business services; personal, cultural and recreational services; and government services n.i.e. Given the general difficulties involved in statistically capturing certain aspects of the trade in services, the balance-of-payments figures presented here may be somewhat downward-biased as compared with the actual value of the international trade in services. The aggregate data from tables 5.1 include the UNCTAD secretariat’s estimates of missing values that are not shown separately.
Table 5.2 indicates 20 major exporters and importers, among developing economies, for each of the 10 principal services sectors as defined in the IMF Balance of Payments Manual (BPM5, 1993), which are transport; travel; communication; construction; computer and information services; insurance; financial services; royalties and licence fees; other business services; and personal, cultural and recreational services. Government services n.i.e. are not included.
Table 5.3 focuses on tourism services in individual countries in recent years. It presents the following statistics: value of total expenditure of visitors, value of visitors' expenditure excluding transportation, number of tourists' overnight stays, and number of arrivals of visitors. All figures refer to non-resident visitors (inbound tourism). The international (non-resident) visitor is an international traveller travelling to a place other than her/his usual environment for a stay of less than 12 months and whose main purpose of a trip is other than exercise an activity remunerated from within the place visited. This includes all persons who arrive in a particular economy to stay for less than a year for business purposes or personal reasons. Tourists are those who stay at least one night in a collective or private accommodation in the country visited. Same-day visitors are persons who do not stay overnight in a country visited.
Table 5.4 concerns international maritime transport. It contains data on the world merchant fleet by flag of registration and by type of ship by region and economy, highlighting the group of major open-registry countries. A ship owner who registers his or her vessel in an open-registry country does not need to have any connection with a country of registry. The number of open-registry countries has varied over the years. In order to better show their relevance, the group of "major open- and international-registry countries" now includes a higher number of countries (10 in total) than the one described in the previous versions of the Handbook. Table 5.4 contains consolidated time series from various issues of the UNCTAD Review of Maritime Transport. It reports on the worldwide evolution of shipping, ports and multimodal transport related to the major traffics of liquid bulk, dry bulk and containers.
PART SIXCommodities
Table 6.1 includes aggregated price indices for primary commodity groups such as food, tropical beverages, vegetable oilseeds and oils, agricultural raw materials and minerals, ores and metals, as well as an all groups price index in current US dollars. Also included are the annual and quarterly free-market price indices for selected commodities exported by developing economies. The weight of price indices for the above mentioned commodity groups (2000=100) are based on the value of exports of developing countries from 1999 to 2001. The table is based on data from the UNCTAD Commodity Price Statisticsdatabase, available on the statistics portal of the UNCTAD website.
Table 6.2 presents instability indices and trends in free-market prices for selected primary commodities that are of particular interest to developing economies.
Table 6.3 presents information on the production of aluminium and copper at different processing stages and consumption by individual country and by geographical region. Figures for the production of bauxite are expressed at gross volume, while those for copper ore production are shown in metal content.
PART SEVENInternational finance
Table 7.1 presents summaries of the current account of the balance of payments for individual countries and territories. Balance-of-payments current account data cover all transactions between residents and non-residents of a reporting economy, involving economic values and mainly concerning goods, services, income and current transfers. Data on these principal categories, with an additional detail on direct investment income, are covered in the table. For information about the concepts regarding the categories mentioned, please see the IMF Balance of Payments Manual (BPM5, 1993).
Table 7.2 contains summaries of the capital and financial account of the balance of payments for individual economies. Capital and financial account figures cover transactions in foreign assets and liabilities. Assets represent claims on non-residents, while liabilities are indebtedness to non-residents of the reporting economy. No valuation changes or other non-transaction modifications of net foreign assets are reflected in these accounts. Capital account includes capital transfers and acquisition and disposal of non-produced, non-financial assets. Financial account covers investments (direct, portfolio and other) and reserve assets (comprised of monetary gold, SDRs, foreign exchange and others). Statistics on these principal categories of the capital and financial account are included in the Handbook. Detailed notes with explanations of categories and terminology used are provided after the table. For more information, see the IMF Balance of Payments Manual (BPM5, 1993).
Tables 7.3.1, 7.3.2 and 7.3.3 contain information on foreign direct investment (FDI) inflows and outflows by individual country, geographical region, economic grouping and trade group. These figures correspond to the Statistical Annexes of the UNCTAD World Investment Report 2006: FDI from Developing and Transition Economies: Implications for Development. Foreign direct investment (FDI) is defined as an investment involving a long-term relationship and reflecting a lasting interest in and control by a resident entity in one economy (foreign direct investor or parent enterprise) of an enterprise resident in a different economy (FDI enterprise or affiliate enterprise or foreign affiliate). Such investment involves both the initial transaction between the two entities and all subsequent transactions between them and among foreign affiliates. A direct investment enterprise is defined as an incorporated or unincorporated enterprise in which the direct investor, resident in another economy, owns 10 percent or more of the ordinary shares or voting power (or the equivalent).
ix
GENERAL NOTES
in order to present a clearer picture of the flows that enter or exit economies via transfers by migrant or non-resident workers. Table 7.5 presents data on international reserves (total reserves minus gold) of developing economies by country, region and economic grouping. Other calculations included show months of imports that these reserves could finance at current import levels, as well as the annual change in total reserves. According to the IMF definition, total reserves minus gold consist of the sum of the country's foreign exchange, its reserve position in the IMF and the US dollar value of SDR holdings by its monetary authorities.
Table 7.6 gives a summary of official financial flows to developing economies by type of flow, country, geographical region and economic grouping. Flows from bilateral and multilateral sources are shown as recorded by the Development Assistance Committee (DAC – OECD).
Table 7.7 presents time series on the external long-term indebtedness of developing economies for major economic groupings. It also provides a detailed breakdown of public and publicly guaranteed debt by source of lending. External debt data in this table are based on the Debtor Reporting System (DRS) maintained by the World Bank.
PART EIGHTDevelopment indicators
Tables 8.1 provide information on total and per capita nominal GDP by individual country, geographical region and economic grouping. The GDP figures in dollars are derived from GDP data provided in national currencies. The prevailing annual average market exchange rates, as reported by IMF, have been used for the conversion from national currencies to dollars for most countries.
Tables 8.2 contain annual average growth rates of total and per capita real GDP by individual country, geographical region and economic grouping. The growth rates are based on GDP in constant 1990 dollars.
Tables 8.3 provide data on GDP by type of expenditure and kind of economic activity, by individual country, geographical region and economic grouping.
Tables 8.4 provide data on population and labour force: total population, urban population as a percentage of total population, total labour force, female labour force as a percentage of total labour force, total agriculture labour force and female labour force as a percentage of total agriculture labour force.
Basic population and labour data are rounded out by the demographic indicators in table 8.5: population growth rate, natural increase rate per 1,000 inhabitants, net migration rate per 1,000 inhabitants, crude birth and death rate per 1,000 inhabitants, infant mortality rate per 1,000 live births and life expectancy at birth.
OTHER NOTES Unless otherwise specified, country aggregates are the sums of the relevant country data by group. Calculations of aggregates may in some cases include data estimated by the UNCTAD secretariat that are not necessarily all reported separately. Because of rounding, details and percentages in tables do not necessarily add up to totals. Data were collected and checked to ensure that they matched the geographical coverage of the countries, as described at the beginning of the Handbook. However, some gaps could not be avoided due to data unavailability and are described in the notes at the end tables. Unless otherwise stated, dollars ($) refer to US dollars and data in dollars are expressed in current US dollars of the year to which they refer. Average annual growth rates are defined as the coefficient bin the exponential trend function y = aebt where t stands for time. This method takes all observations in a period into account. Therefore, the resulting growth rates reflect trends that are not unduly influenced by exceptional values.
EXPLANATION OF SYMBOLS
0 Zero means that the amount is nil or negligible.
_ The symbol underscore indicates that the item is not applicable.
.. Two dots indicate that the data are not available or are not separately reported.
- Use of a hyphen between years (e.g. 1985-1990) signifies the full period involved, including the initial and final years.
(e) Estimate
(p) Provisional data
(r) Revised data
Some exceptions are indicated in footnotes.
x
Table 7.4 presents values of receipts and payments of workers’ remittances for individual economies. It also shows workers’ remittances as a percentage of international trade (exports and imports, balance-of-payments data). According to the definition of the IMF Balance of Payments Manual (BPM5, 1993), workers' remittances are goods and financial instruments transferred by migrants living and working (considered to be residents) in a new economy to residents of the economy in which the migrants formerly resided. A migrant must live and work in the new economy for more than one year to be considered a resident there. The BPM5 classifies workers' remittances separately from compensation of employees. Table 7.4 includes the sum of the two categories in the values shown,
GENERAL NOTES
DISTRIBUTION OF COUNTRIES AND TERRITORIES
The country distributions presented are for statistical convenience only and follow those used by the Statistics Division, Department of Economic and Social Affairs (DESA), of the United Nations. They are grouped by economic criteria or by adhesion to commercial agreements for the purpose of statistical analysis and research.
The term "economies", as used in this publication, refers to regions, countries and territories.
Country-level data are included where statistics have been reported or where it was possible to make an estimate.
1. Geographical regions, countries and territories
This section includes countries and territories divided into three major categories: developing countries, economies in transition and developed economies. Each category is further divided by geographical regions.
Developing economies:
Economies in transition:
The economies in transition are subdivided between Asia andEurope.
Developed economies:
This category is subdivided into 4 geographical regions: America, Asia, Europe, and Oceania.
2. Economic groupings of developing countries
The Handbook provides numerous and varied groups ofcountries and territories in order to provide easy access to the statistics necessary for socio-economic analysis and development research.
Developing economies are presented at three levels of aggregation: the total group, the group excluding China (referringto continental China) and the group excluding the leastdeveloped countries.
The developing economies are also categorized into threesubgroups according to their per capita GDP in 2000: high-income, middle-income and low-income. This breakdown is based on GDP and population data available in 2004 and wasnot revised in order to maintain the composition of the groups forseveral editions of the Handbook of Statistics.
The category of heavily indebted poor countries (thoseeconomies benefiting from the HIPC debt reduction initiative of the World Bank and the International Monetary Fund) includes 40countries.
Least developed countries and landlocked developing countries are recognized by the United Nations as categories thatrequire special attention from the international community.
Since 1994, the United Nations recognizes the particularproblems of the Small Island Developing States (SIDS), eventhough the criteria for drawing up an official list of SIDS have notyet been determined. The unofficial list is used by UNCTAD foranalytical purposes only.
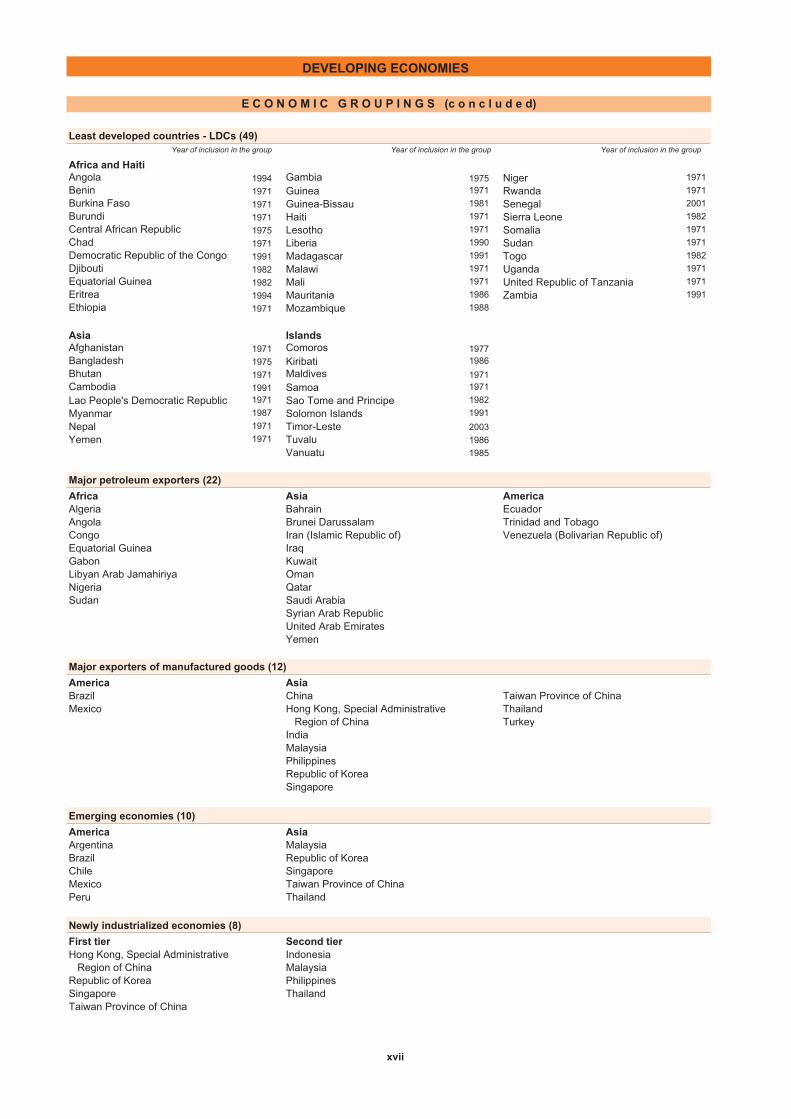
The group of major petroleum exporters consists of countries whose share of petroleum and petroleum products was not less than 50 per cent of their total exports, and whose exports of these products amounted to a minimum average of US$ 2 billion for the period 2003–2005. This group is divided into three geographical zones: Africa, America and Asia.
The group of major exporters of manufactured goods, divided into two geographical zones, America and Asia, consists of economies whose share of manufactured products was not less than 50 per cent of their total exports, and whose exports of these products amounted to a minimum average of US$ 22 billion for the period 2003–2005.
The composition of the groups of emerging economies (in America and Asia) and newly industrialized economies (composed of first and second tier) corresponds to UNCTAD's Trade and Development Report.
The different geographical regions are also presented at various levels of aggregation:
- Africa: Northern Africa excluding Sudan, sub-Saharan Africa, including Sudan, including and excluding South Africa.
- America: Central America and Greater Caribbean Islands excluding Puerto Rico, including and excluding Mexico, South America and Central America, and South America excluding Brazil.
- Asia: Eastern and South-Eastern Asia excluding China, and Southern Asia excluding India.
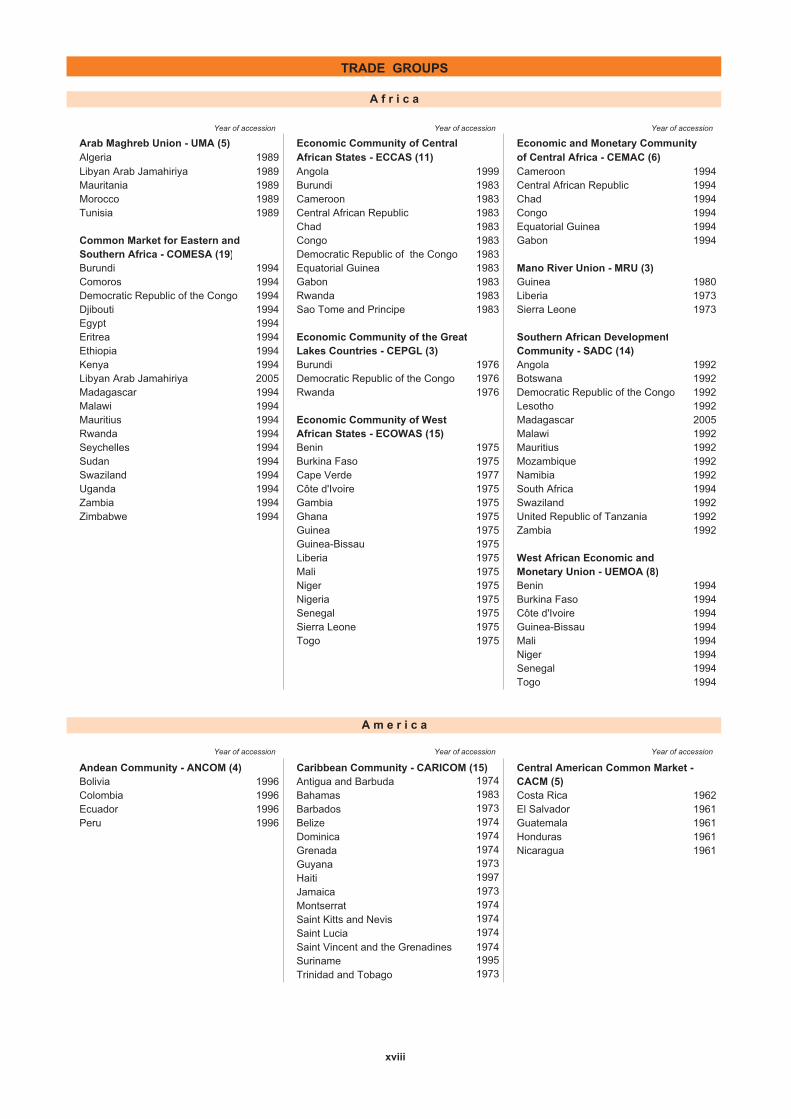
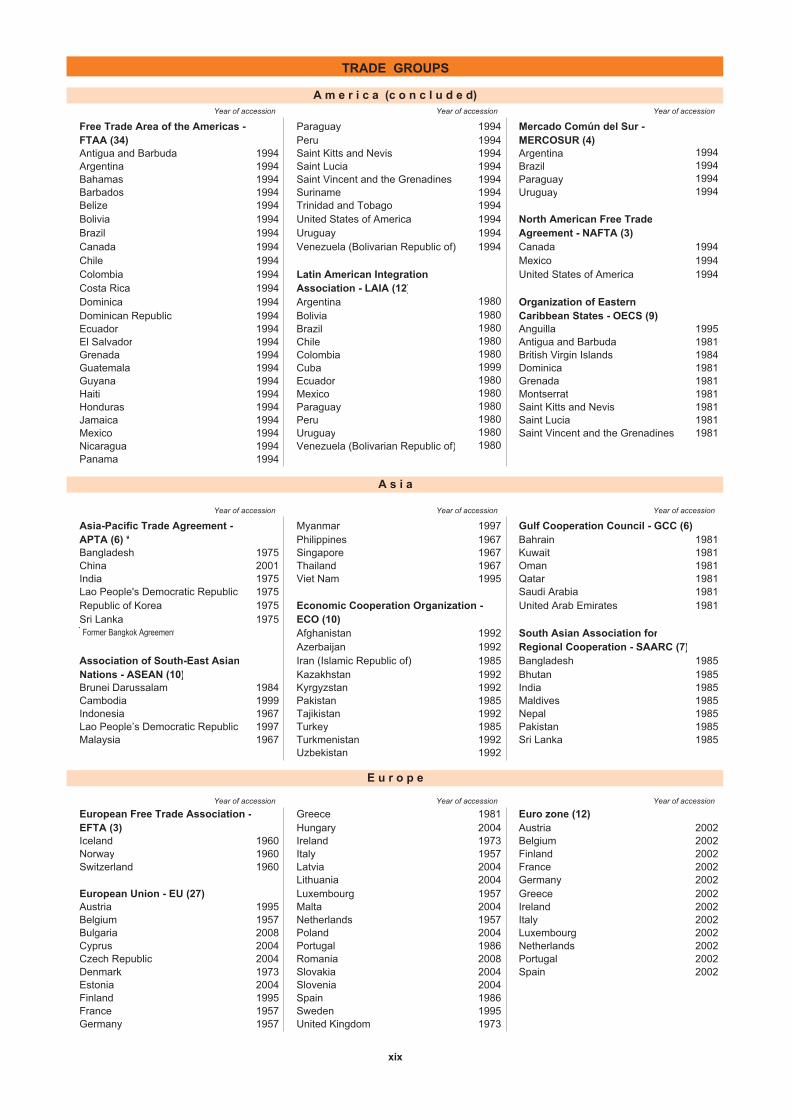
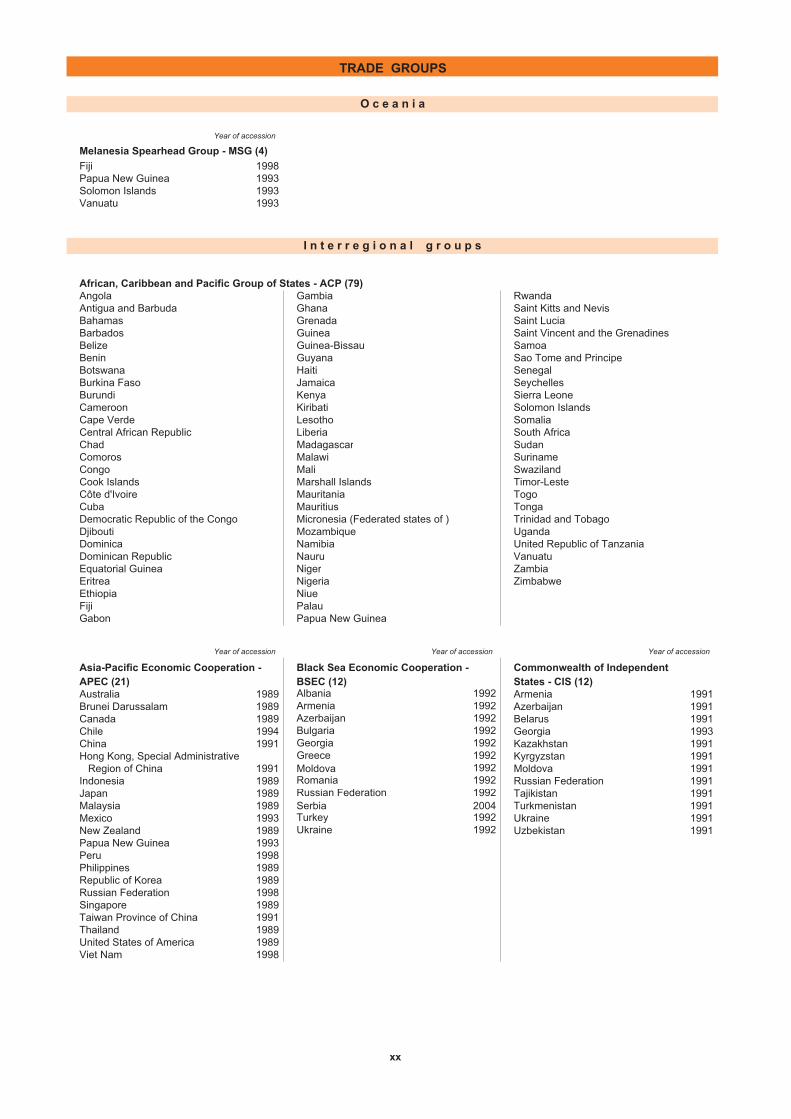
3. Trade groups and interregional groups
Statistics of trade groups with special analytic interest are presented according to their pertinence. These groupings include all relevant economies and are subclassified by geographical regions, with the exception of following interregional groups: African, Caribbean and Pacific Group of States (ACP); Asia–Pacific Economic Cooperation (APEC); Black Sea Economic Cooperation (BSEC); and Commonwealth of Independent States (CIS).
xi
This category includes countries and territories in America, Africa, Asia and Oceania not specified below. The geographical regions are further subdivided into subregions in order to present more detailed statistics. Exceptions are specified in table footnotes.
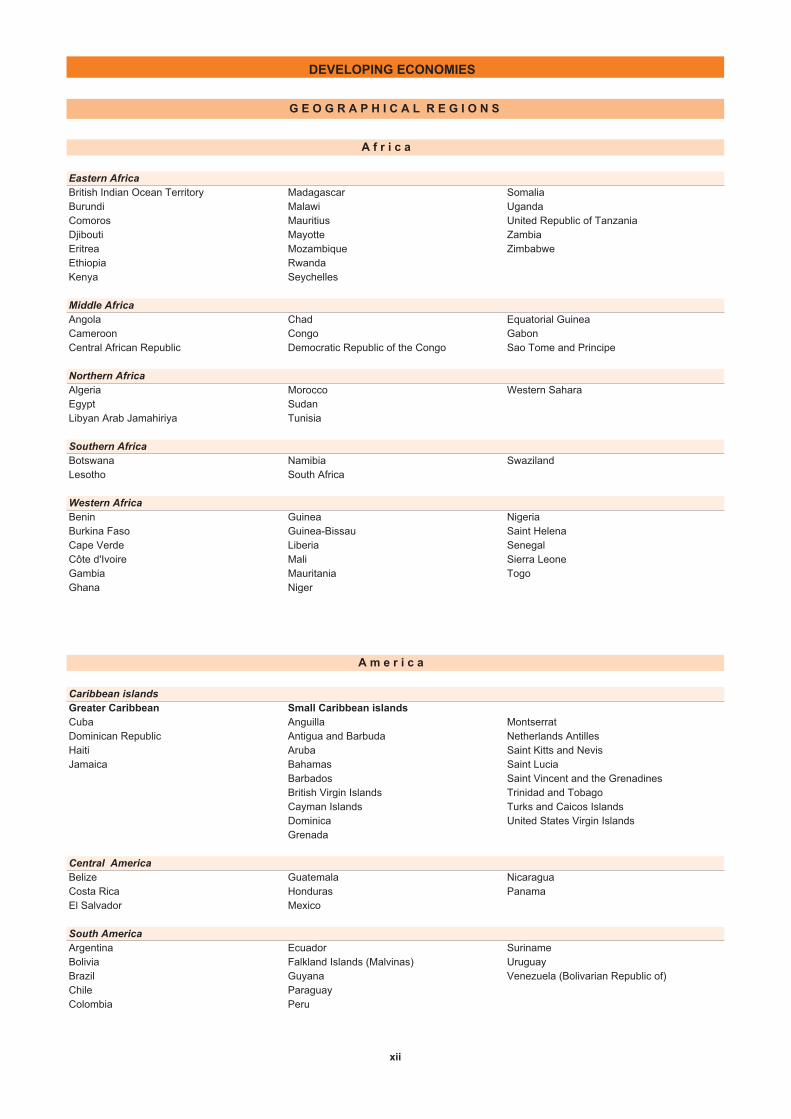
British Indian Ocean Territory Madagascar SomaliaBurundi Malawi UgandaComoros Mauritius United Republic of TanzaniaDjibouti Mayotte ZambiaEritrea Mozambique ZimbabweEthiopia RwandaKenya Seychelles
Angola Chad Equatorial GuineaCameroon Congo GabonCentral African Republic Democratic Republic of the Congo Sao Tome and Principe
Algeria Morocco Western SaharaEgypt Sudan Libyan Arab Jamahiriya Tunisia
Botswana Namibia SwazilandLesotho South Africa
Benin Guinea NigeriaBurkina Faso Guinea-Bissau Saint HelenaCape Verde Liberia SenegalCôte d'Ivoire Mali Sierra LeoneGambia Mauritania TogoGhana Niger
Greater Caribbean Small Caribbean islandsCuba Anguilla MontserratDominican Republic Antigua and Barbuda Netherlands AntillesHaiti Aruba Saint Kitts and NevisJamaica Bahamas Saint Lucia
Barbados Saint Vincent and the GrenadinesBritish Virgin Islands Trinidad and TobagoCayman Islands Turks and Caicos IslandsDominica United States Virgin IslandsGrenada
Belize Guatemala NicaraguaCosta Rica Honduras PanamaEl Salvador Mexico
Argentina Ecuador SurinameBolivia Falkland Islands (Malvinas) UruguayBrazil Guyana Venezuela (Bolivarian Republic of)Chile ParaguayColombia Peru
A f r i c a
Northern Africa
DEVELOPING ECONOMIES
A m e r i c a
Southern Africa
Western Africa
G E O G R A P H I C A L R E G I O N S
South America
Central America
Caribbean islands
Eastern Africa
Middle Africa
xii
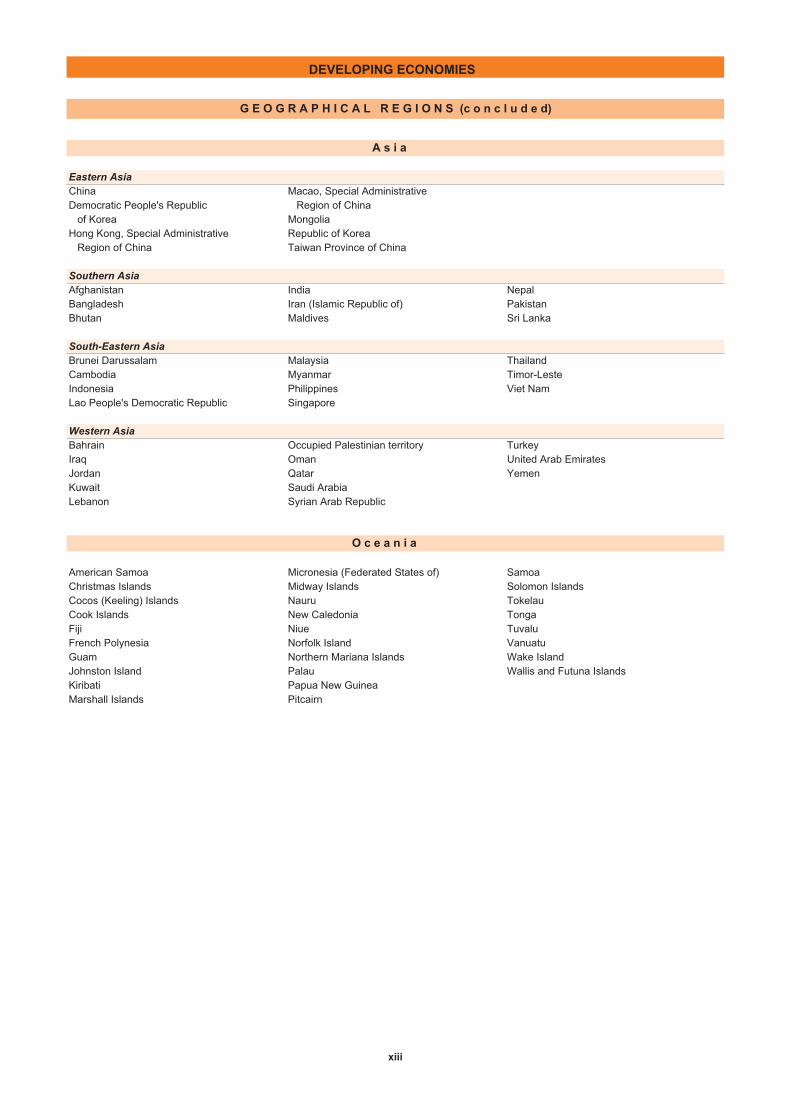
DEVELOPING ECONOMIES
G E O G R A P H I C A L R E G I O N S (c o n c l u d e d)
A s i a
Eastern AsiaChina Macao, Special AdministrativeDemocratic People's Republic Region of China of Korea MongoliaHong Kong, Special Administrative Republic of Korea Region of China Taiwan Province of China
Southern AsiaAfghanistan India NepalBangladesh Iran (Islamic Republic of) PakistanBhutan Maldives Sri Lanka
South-Eastern AsiaBrunei Darussalam Malaysia ThailandCambodia Myanmar Timor-LesteIndonesia Philippines Viet NamLao People's Democratic Republic Singapore
Western AsiaBahrain Occupied Palestinian territory TurkeyIraq Oman United Arab EmiratesJordan Qatar YemenKuwait Saudi ArabiaLebanon Syrian Arab Republic
O c e a n i a
American Samoa Micronesia (Federated States of) SamoaChristmas Islands Midway Islands Solomon IslandsCocos (Keeling) Islands Nauru TokelauCook Islands New Caledonia TongaFiji Niue TuvaluFrench Polynesia Norfolk Island VanuatuGuam Northern Mariana Islands Wake IslandJohnston Island Palau Wallis and Futuna IslandsKiribati Papua New GuineaMarshall Islands Pitcairn
xiii
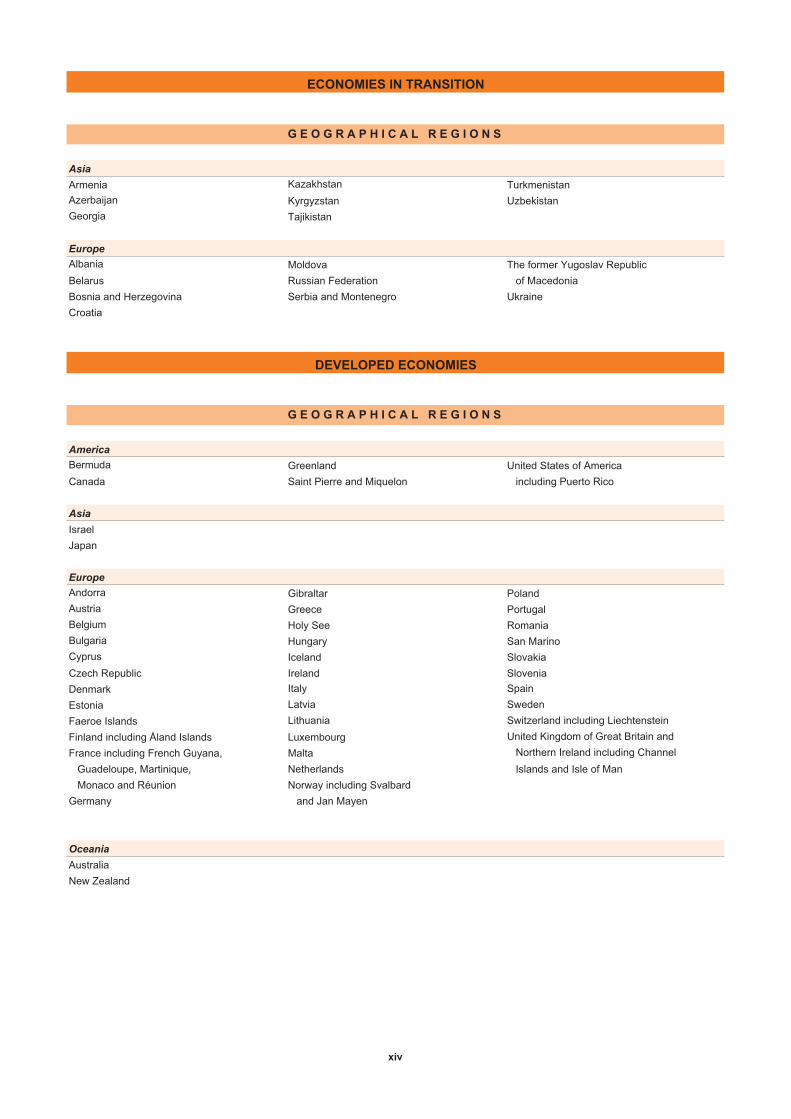
ECONOMIES IN TRANSITION
G E O G R A P H I C A L R E G I O N S
Asia
Armenia Kazakhstan Turkmenistan
Azerbaijan Kyrgyzstan Uzbekistan
Georgia Tajikistan
Europe
Albania Moldova The former Yugoslav Republic
Belarus Russian Federation of Macedonia
Bosnia and Herzegovina Serbia and Montenegro Ukraine
Croatia
DEVELOPED ECONOMIES
G E O G R A P H I C A L R E G I O N S
America
Bermuda Greenland United States of America
Canada Saint Pierre and Miquelon including Puerto Rico
Asia
Israel
Japan
Europe
Andorra Gibraltar Poland
Austria Greece Portugal
Belgium Holy See Romania
Bulgaria Hungary San Marino
Cyprus Iceland Slovakia
Czech Republic Ireland Slovenia
Denmark Italy Spain
Estonia Latvia Sweden
Faeroe Islands Lithuania Switzerland including Liechtenstein
Finland including Åland Islands Luxembourg United Kingdom of Great Britain and
France including French Guyana, Malta Northern Ireland including Channel
Guadeloupe, Martinique, Netherlands Islands and Isle of Man
Monaco and Réunion Norway including Svalbard
Germany and Jan Mayen
Oceania
Australia
New Zealand
xiv
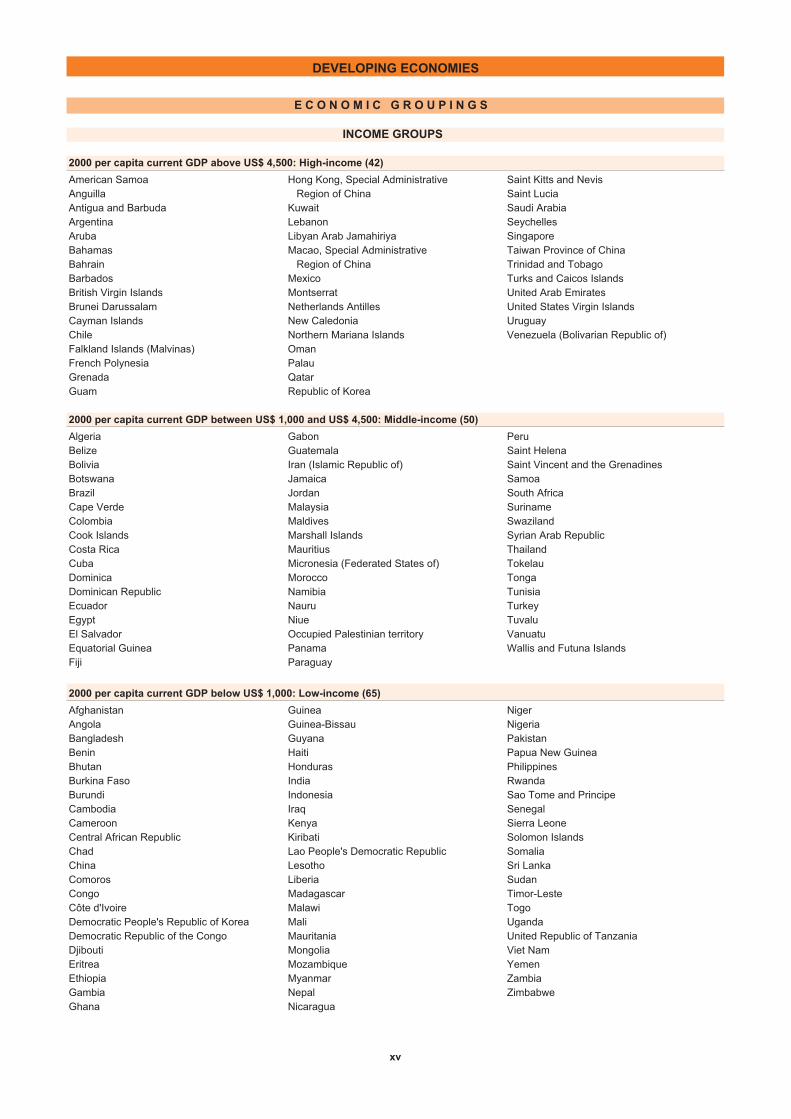
DEVELOPING ECONOMIES
E C O N O M I C G R O U P I N G S
INCOME GROUPS
2000 per capita current GDP above US$ 4,500: High-income (42)
American Samoa Hong Kong, Special Administrative Saint Kitts and NevisAnguilla Region of China Saint LuciaAntigua and Barbuda Kuwait Saudi ArabiaArgentina Lebanon SeychellesAruba Libyan Arab Jamahiriya SingaporeBahamas Macao, Special Administrative Taiwan Province of ChinaBahrain Region of China Trinidad and TobagoBarbados Mexico Turks and Caicos IslandsBritish Virgin Islands Montserrat United Arab EmiratesBrunei Darussalam Netherlands Antilles United States Virgin IslandsCayman Islands New Caledonia UruguayChile Northern Mariana Islands Venezuela (Bolivarian Republic of)Falkland Islands (Malvinas) OmanFrench Polynesia PalauGrenada QatarGuam Republic of Korea
2000 per capita current GDP between US$ 1,000 and US$ 4,500: Middle-income (50)
Algeria Gabon PeruBelize Guatemala Saint HelenaBolivia Iran (Islamic Republic of) Saint Vincent and the GrenadinesBotswana Jamaica SamoaBrazil Jordan South AfricaCape Verde Malaysia SurinameColombia Maldives SwazilandCook Islands Marshall Islands Syrian Arab RepublicCosta Rica Mauritius ThailandCuba Micronesia (Federated States of) TokelauDominica Morocco TongaDominican Republic Namibia TunisiaEcuador Nauru TurkeyEgypt Niue TuvaluEl Salvador Occupied Palestinian territory VanuatuEquatorial Guinea Panama Wallis and Futuna IslandsFiji Paraguay
2000 per capita current GDP below US$ 1,000: Low-income (65)
Afghanistan Guinea NigerAngola Guinea-Bissau NigeriaBangladesh Guyana PakistanBenin Haiti Papua New GuineaBhutan Honduras PhilippinesBurkina Faso India RwandaBurundi Indonesia Sao Tome and PrincipeCambodia Iraq SenegalCameroon Kenya Sierra LeoneCentral African Republic Kiribati Solomon IslandsChad Lao People's Democratic Republic SomaliaChina Lesotho Sri LankaComoros Liberia SudanCongo Madagascar Timor-LesteCôte d'Ivoire Malawi TogoDemocratic People's Republic of Korea Mali UgandaDemocratic Republic of the Congo Mauritania United Republic of TanzaniaDjibouti Mongolia Viet NamEritrea Mozambique YemenEthiopia Myanmar ZambiaGambia Nepal ZimbabweGhana Nicaragua
xv
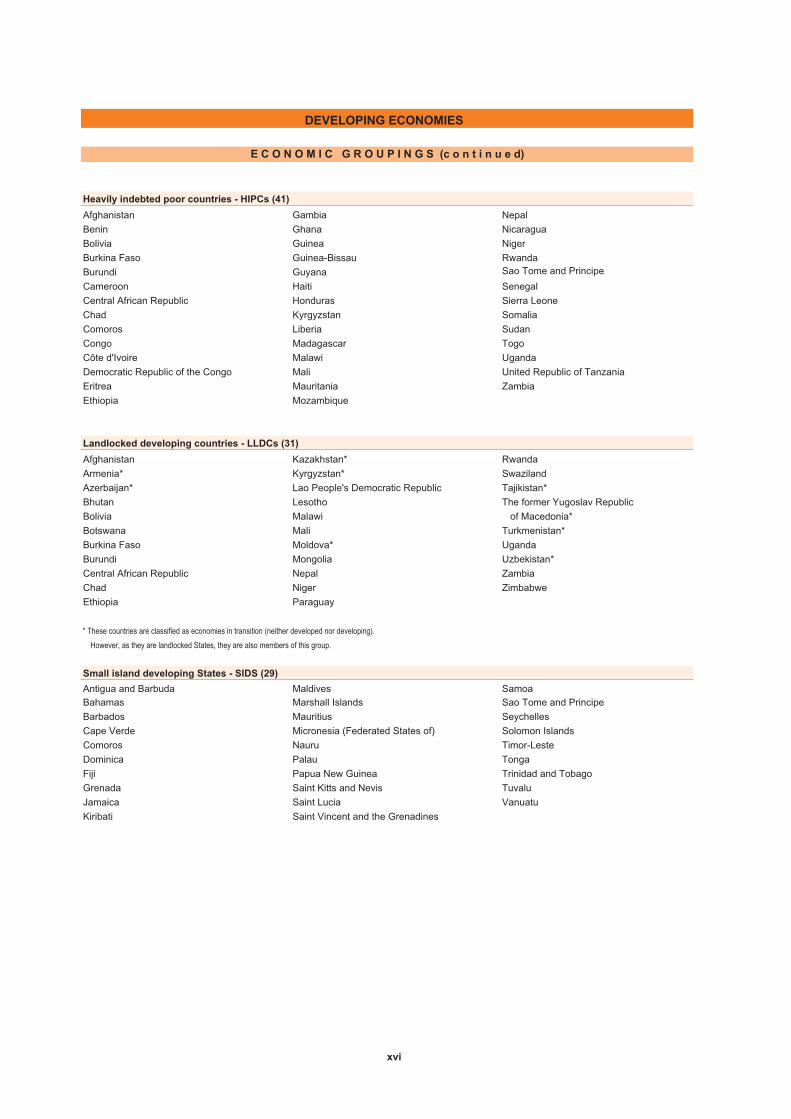
DEVELOPING ECONOMIES
E C O N O M I C G R O U P I N G S (c o n t i n u e d)
Heavily indebted poor countries - HIPCs (41)
Afghanistan Gambia Nepal
Benin Ghana Nicaragua
Bolivia Guinea Niger
Burkina Faso Guinea-Bissau Rwanda
Burundi Guyana Sao Tome and Principe
Cameroon Haiti Senegal
Central African Republic Honduras Sierra Leone
Chad Kyrgyzstan Somalia
Comoros Liberia Sudan
Congo Madagascar Togo
Côte d'Ivoire Malawi Uganda
Democratic Republic of the Congo Mali United Republic of Tanzania
Eritrea Mauritania Zambia
Ethiopia Mozambique
Landlocked developing countries - LLDCs (31)
Afghanistan Kazakhstan* Rwanda
Armenia* Kyrgyzstan* Swaziland
Azerbaijan* Lao People's Democratic Republic Tajikistan*
Bhutan Lesotho The former Yugoslav Republic
Bolivia Malawi of Macedonia*
Botswana Mali Turkmenistan*
Burkina Faso Moldova* Uganda
Burundi Mongolia Uzbekistan*
Central African Republic Nepal Zambia
Chad Niger Zimbabwe
Ethiopia Paraguay
* These countries are classified as economies in transition (neither developed nor developing).
However, as they are landlocked States, they are also members of this group.
Small island developing States - SIDS (29)
Antigua and Barbuda Maldives Samoa
Bahamas Marshall Islands Sao Tome and Principe
Barbados Mauritius Seychelles
Cape Verde Micronesia (Federated States of) Solomon Islands
Comoros Nauru Timor-Leste
Dominica Palau Tonga
Fiji Papua New Guinea Trinidad and Tobago
Grenada Saint Kitts and Nevis Tuvalu
Jamaica Saint Lucia Vanuatu
Kiribati Saint Vincent and the Grenadines
xvi
DEVELOPING ECONOMIES
E C O N O M I C G R O U P I N G S (c o n c l u d e d)
Least developed countries - LDCs (49)Year of inclusion in the group Year of inclusion in the group Year of inclusion in the group
Africa and HaitiAngola 1994 Gambia 1975 Niger 1971
Benin 1971 Guinea 1971 Rwanda 1971
Burkina Faso 1971 Guinea-Bissau 1981 Senegal 2001
Burundi 1971 Haiti 1971 Sierra Leone 1982
Central African Republic 1975 Lesotho 1971 Somalia 1971
Chad 1971 Liberia 1990 Sudan 1971
Democratic Republic of the Congo 1991 Madagascar 1991 Togo 1982
Djibouti 1982 Malawi 1971 Uganda 1971
Equatorial Guinea 1982 Mali 1971 United Republic of Tanzania 1971
Eritrea 1994 Mauritania 1986 Zambia 1991
Ethiopia 1971 Mozambique 1988
Asia IslandsAfghanistan 1971 Comoros 1977Bangladesh 1975 Kiribati 1986
Bhutan 1971 Maldives 1971Cambodia 1991 Samoa 1971
Lao People's Democratic Republic 1971 Sao Tome and Principe 1982
Myanmar 1987 Solomon Islands 1991
Nepal 1971 Timor-Leste 2003
Yemen 1971 Tuvalu 1986
Vanuatu 1985
Major petroleum exporters (22)
Africa Asia AmericaAlgeria Bahrain EcuadorAngola Brunei Darussalam Trinidad and TobagoCongo Iran (Islamic Republic of) Venezuela (Bolivarian Republic of)Equatorial Guinea IraqGabon KuwaitLibyan Arab Jamahiriya OmanNigeria QatarSudan Saudi Arabia
Syrian Arab RepublicUnited Arab EmiratesYemen
Major exporters of manufactured goods (12)
America AsiaBrazil China Taiwan Province of ChinaMexico Hong Kong, Special Administrative Thailand
Region of China TurkeyIndiaMalaysiaPhilippinesRepublic of KoreaSingapore
Emerging economies (10)
America AsiaArgentina MalaysiaBrazil Republic of KoreaChile SingaporeMexico Taiwan Province of ChinaPeru Thailand
Newly industrialized economies (8)
First tier Second tierHong Kong, Special Administrative Indonesia Region of China MalaysiaRepublic of Korea PhilippinesSingapore ThailandTaiwan Province of China
xvii
Arab Maghreb Union - UMA (5) Economic Community of Central Economic and Monetary Community Algeria 1989 African States - ECCAS (11) of Central Africa - CEMAC (6)Libyan Arab Jamahiriya 1989 Angola 1999 Cameroon 1994Mauritania 1989 Burundi 1983 Central African Republic 1994Morocco 1989 Cameroon 1983 Chad 1994Tunisia 1989 Central African Republic 1983 Congo 1994
Chad 1983 Equatorial Guinea 1994Common Market for Eastern and Congo 1983 Gabon 1994Southern Africa - COMESA (19) Democratic Republic of the Congo 1983Burundi 1994 Equatorial Guinea 1983 Mano River Union - MRU (3)Comoros 1994 Gabon 1983 Guinea 1980Democratic Republic of the Congo 1994 Rwanda 1983 Liberia 1973Djibouti 1994 Sao Tome and Principe 1983 Sierra Leone 1973Egypt 1994Eritrea 1994 Economic Community of the Great Southern African DevelopmentEthiopia 1994 Lakes Countries - CEPGL (3) Community - SADC (14) Kenya 1994 Burundi 1976 Angola 1992Libyan Arab Jamahiriya 2005 Democratic Republic of the Congo 1976 Botswana 1992Madagascar 1994 Rwanda 1976 Democratic Republic of the Congo 1992Malawi 1994 Lesotho 1992Mauritius 1994 Economic Community of West Madagascar 2005Rwanda 1994 African States - ECOWAS (15) Malawi 1992Seychelles 1994 Benin 1975 Mauritius 1992Sudan 1994 Burkina Faso 1975 Mozambique 1992Swaziland 1994 Cape Verde 1977 Namibia 1992Uganda 1994 Côte d'Ivoire 1975 South Africa 1994Zambia 1994 Gambia 1975 Swaziland 1992Zimbabwe 1994 Ghana 1975 United Republic of Tanzania 1992
Guinea 1975 Zambia 1992Guinea-Bissau 1975 Liberia 1975 West African Economic andMali 1975 Monetary Union - UEMOA (8)Niger 1975 Benin 1994Nigeria 1975 Burkina Faso 1994Senegal 1975 Côte d'Ivoire 1994Sierra Leone 1975 Guinea-Bissau 1994Togo 1975 Mali 1994
Niger 1994Senegal 1994Togo 1994
Andean Community - ANCOM (4) Caribbean Community - CARICOM (15) Central American Common Market -Bolivia 1996 Antigua and Barbuda 1974 CACM (5)Colombia 1996 Bahamas 1983 Costa Rica 1962Ecuador 1996 Barbados 1973 El Salvador 1961Peru 1996 Belize 1974 Guatemala 1961
Dominica 1974 Honduras 1961 Grenada 1974 Nicaragua 1961
Guyana 1973
Haiti 1997
Jamaica 1973
Montserrat 1974
Saint Kitts and Nevis 1974
Saint Lucia 1974
Saint Vincent and the Grenadines 1974Suriname 1995
Trinidad and Tobago 1973
Year of accession Year of accession Year of accession
TRADE GROUPS
A m e r i c a
A f r i c a
Year of accession Year of accession Year of accession
xviii
TRADE GROUPS
A m e r i c a (c o n c l u d e d) Year of accession Year of accession Year of accession
Free Trade Area of the Americas - Paraguay 1994 Mercado Común del Sur - FTAA (34) Peru 1994 MERCOSUR (4)Antigua and Barbuda 1994 Saint Kitts and Nevis 1994 Argentina 1994Argentina 1994 Saint Lucia 1994 Brazil 1994Bahamas 1994 Saint Vincent and the Grenadines 1994 Paraguay 1994Barbados 1994 Suriname 1994 Uruguay 1994Belize 1994 Trinidad and Tobago 1994Bolivia 1994 United States of America 1994 North American Free TradeBrazil 1994 Uruguay 1994 Agreement - NAFTA (3) Canada 1994 Venezuela (Bolivarian Republic of) 1994 Canada 1994Chile 1994 Mexico 1994Colombia 1994 Latin American Integration United States of America 1994Costa Rica 1994 Association - LAIA (12)Dominica 1994 Argentina 1980 Organization of Eastern Dominican Republic 1994 Bolivia 1980 Caribbean States - OECS (9)Ecuador 1994 Brazil 1980 Anguilla 1995El Salvador 1994 Chile 1980 Antigua and Barbuda 1981Grenada 1994 Colombia 1980 British Virgin Islands 1984Guatemala 1994 Cuba 1999 Dominica 1981Guyana 1994 Ecuador 1980 Grenada 1981Haiti 1994 Mexico 1980 Montserrat 1981Honduras 1994 Paraguay 1980 Saint Kitts and Nevis 1981Jamaica 1994 Peru 1980 Saint Lucia 1981Mexico 1994 Uruguay 1980 Saint Vincent and the Grenadines 1981Nicaragua 1994 Venezuela (Bolivarian Republic of) 1980Panama 1994
A s i a
Year of accession Year of accession Year of accession
Asia-Pacific Trade Agreement - Myanmar 1997 Gulf Cooperation Council - GCC (6)APTA (6) * Philippines 1967 Bahrain 1981Bangladesh 1975 Singapore 1967 Kuwait 1981China 2001 Thailand 1967 Oman 1981India 1975 Viet Nam 1995 Qatar 1981Lao People's Democratic Republic 1975 Saudi Arabia 1981Republic of Korea 1975 Economic Cooperation Organization - United Arab Emirates 1981Sri Lanka 1975 ECO (10)* Former Bangkok Agreement Afghanistan 1992 South Asian Association for
Azerbaijan 1992 Regional Cooperation - SAARC (7)Association of South-East Asian Iran (Islamic Republic of) 1985 Bangladesh 1985Nations - ASEAN (10) Kazakhstan 1992 Bhutan 1985Brunei Darussalam 1984 Kyrgyzstan 1992 India 1985Cambodia 1999 Pakistan 1985 Maldives 1985Indonesia 1967 Tajikistan 1992 Nepal 1985Lao People’s Democratic Republic 1997 Turkey 1985 Pakistan 1985Malaysia 1967 Turkmenistan 1992 Sri Lanka 1985
Uzbekistan 1992
E u r o p e
Year of accession Year of accession Year of accession
European Free Trade Association - Greece 1981 Euro zone (12)EFTA (3) Hungary 2004 Austria 2002Iceland 1960 Ireland 1973 Belgium 2002Norway 1960 Italy 1957 Finland 2002Switzerland 1960 Latvia 2004 France 2002
Lithuania 2004 Germany 2002European Union - EU (27) Luxembourg 1957 Greece 2002Austria 1995 Malta 2004 Ireland 2002Belgium 1957 Netherlands 1957 Italy 2002Bulgaria 2008 Poland 2004 Luxembourg 2002Cyprus 2004 Portugal 1986 Netherlands 2002Czech Republic 2004 Romania 2008 Portugal 2002Denmark 1973 Slovakia 2004 Spain 2002Estonia 2004 Slovenia 2004Finland 1995 Spain 1986France 1957 Sweden 1995Germany 1957 United Kingdom 1973
xix
Melanesia Spearhead Group - MSG (4)
Fiji 1998Papua New Guinea 1993Solomon Islands 1993Vanuatu 1993
Angola Gambia RwandaAntigua and Barbuda Ghana Saint Kitts and NevisBahamas Grenada Saint LuciaBarbados Guinea Saint Vincent and the GrenadinesBelize Guinea-Bissau SamoaBenin Guyana Sao Tome and PrincipeBotswana Haiti SenegalBurkina Faso Jamaica SeychellesBurundi Kenya Sierra LeoneCameroon Kiribati Solomon IslandsCape Verde Lesotho SomaliaCentral African Republic Liberia South AfricaChad Madagascar SudanComoros Malawi SurinameCongo Mali SwazilandCook Islands Marshall Islands Timor-LesteCôte d'Ivoire Mauritania TogoCuba Mauritius TongaDemocratic Republic of the Congo Micronesia (Federated states of ) Trinidad and TobagoDjibouti Mozambique UgandaDominica Namibia United Republic of TanzaniaDominican Republic Nauru VanuatuEquatorial Guinea Niger ZambiaEritrea Nigeria ZimbabweEthiopia NiueFiji PalauGabon Papua New Guinea
Asia-Pacific Economic Cooperation - Black Sea Economic Cooperation - Commonwealth of IndependentAPEC (21) BSEC (12) States - CIS (12) Australia 1989 Albania 1992 Armenia 1991Brunei Darussalam 1989 Armenia 1992 Azerbaijan 1991Canada 1989 Azerbaijan 1992 Belarus 1991Chile 1994 Bulgaria 1992 Georgia 1993China 1991 Georgia 1992 Kazakhstan 1991Hong Kong, Special Administrative Greece 1992 Kyrgyzstan 1991 Region of China 1991 Moldova 1992 Moldova 1991Indonesia 1989 Romania 1992 Russian Federation 1991Japan 1989 Russian Federation 1992 Tajikistan 1991Malaysia 1989 Serbia 2004 Turkmenistan 1991Mexico 1993 Turkey 1992 Ukraine 1991New Zealand 1989 Ukraine 1992 Uzbekistan 1991Papua New Guinea 1993Peru 1998Philippines 1989Republic of Korea 1989Russian Federation 1998Singapore 1989Taiwan Province of China 1991Thailand 1989United States of America 1989Viet Nam 1998
I n t e r r e g i o n a l g r o u p s
TRADE GROUPS
O c e a n i a
Year of accession
African, Caribbean and Pacific Group of States - ACP (79)
Year of accession Year of accession Year of accession
xx
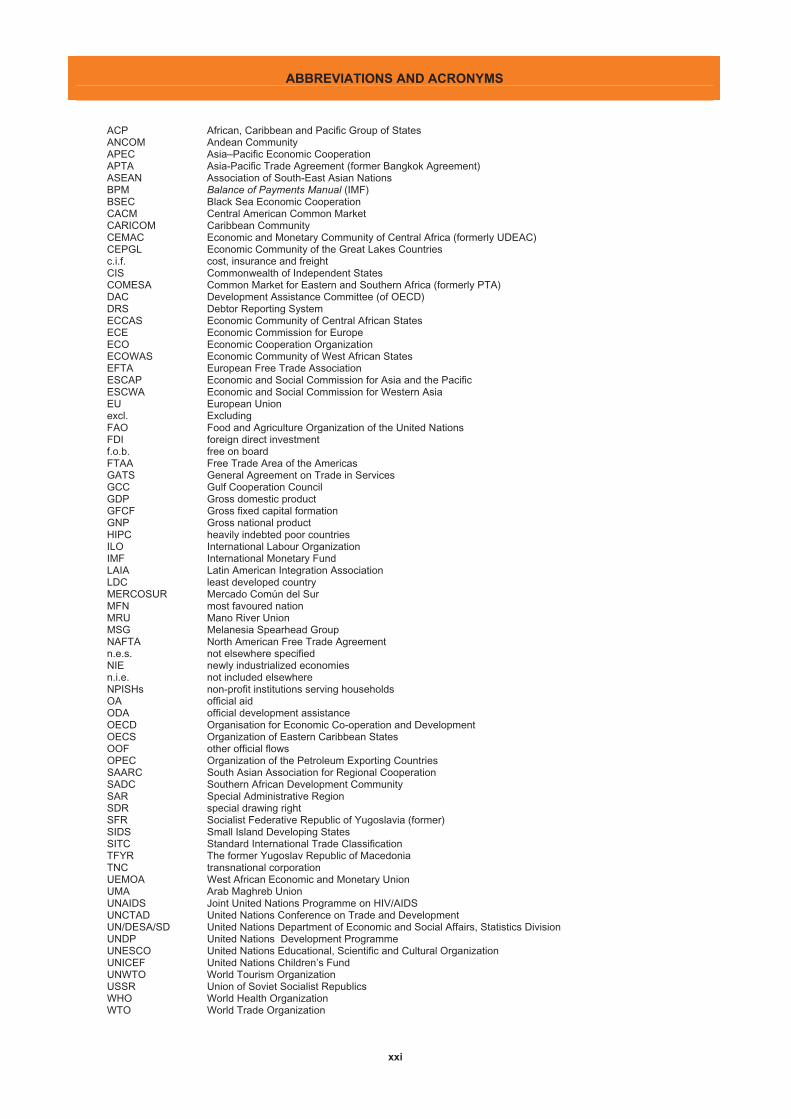
ABBREVIATIONS AND ACRONYMS
ACP African, Caribbean and Pacific Group of States ANCOM Andean Community APEC Asia–Pacific Economic Cooperation APTA Asia-Pacific Trade Agreement (former Bangkok Agreement) ASEAN Association of South-East Asian Nations BPM Balance of Payments Manual (IMF) BSEC Black Sea Economic Cooperation CACM Central American Common Market CARICOM Caribbean Community CEMAC Economic and Monetary Community of Central Africa (formerly UDEAC) CEPGL Economic Community of the Great Lakes Countries c.i.f. cost, insurance and freight CIS Commonwealth of Independent States COMESA Common Market for Eastern and Southern Africa (formerly PTA) DAC Development Assistance Committee (of OECD) DRS Debtor Reporting System ECCAS Economic Community of Central African States ECE Economic Commission for Europe ECO Economic Cooperation Organization ECOWAS Economic Community of West African States EFTA European Free Trade Association ESCAP Economic and Social Commission for Asia and the Pacific ESCWA Economic and Social Commission for Western Asia EU European Union excl. ExcludingFAO Food and Agriculture Organization of the United Nations FDI foreign direct investment f.o.b. free on board FTAA Free Trade Area of the Americas GATS General Agreement on Trade in Services GCC Gulf Cooperation Council GDP Gross domestic product GFCF Gross fixed capital formation GNP Gross national product HIPC heavily indebted poor countries ILO International Labour Organization IMF International Monetary Fund LAIA Latin American Integration Association LDC least developed country MERCOSUR Mercado Común del Sur MFN most favoured nation MRU Mano River Union MSG Melanesia Spearhead Group NAFTA North American Free Trade Agreement n.e.s. not elsewhere specified NIE newly industrialized economies n.i.e. not included elsewhere NPISHs non-profit institutions serving households OA official aidODA official development assistance OECD Organisation for Economic Co-operation and Development OECS Organization of Eastern Caribbean States OOF other official flows OPEC Organization of the Petroleum Exporting Countries SAARC South Asian Association for Regional Cooperation SADC Southern African Development Community SAR Special Administrative Region SDRSFR
special drawing right Socialist Federative Republic of Yugoslavia (former)
SIDS Small Island Developing States SITC Standard International Trade Classification TFYR The former Yugoslav Republic of Macedonia TNC transnational corporation UEMOA West African Economic and Monetary Union UMA Arab Maghreb Union UNAIDS Joint United Nations Programme on HIV/AIDS UNCTAD United Nations Conference on Trade and Development UN/DESA/SD United Nations Department of Economic and Social Affairs, Statistics Division UNDP United Nations Development Programme UNESCO United Nations Educational, Scientific and Cultural Organization UNICEF United Nations Children’s Fund UNWTO World Tourism Organization USSR Union of Soviet Socialist Republics WHO World Health Organization WTO World Trade Organization
xxi
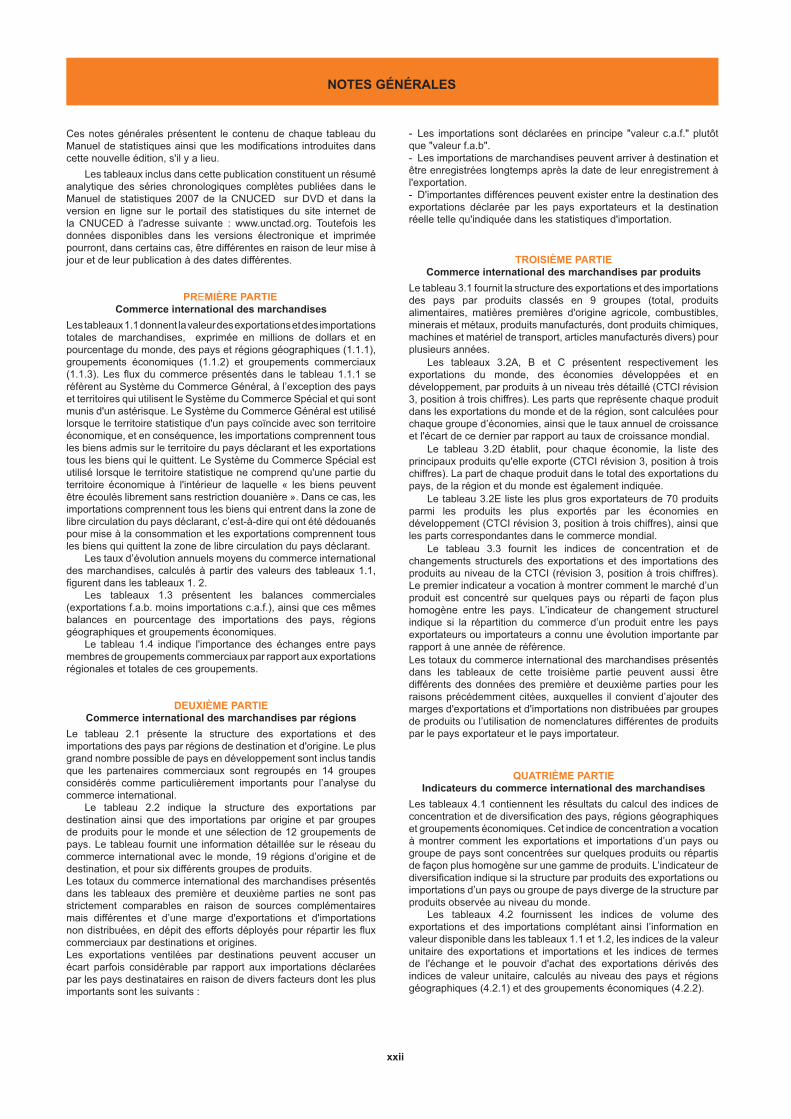
Ces notes générales présentent le contenu de chaque tableau du Manuel de statistiques ainsi que les modifications introduites dans cette nouvelle édition, s'il y a lieu.
Les tableaux inclus dans cette publication constituent un résumé analytique des séries chronologiques complètes publiées dans le Manuel de statistiques 2007 de la CNUCED sur DVD et dans la version en ligne sur le portail des statistiques du site internet de la CNUCED à l'adresse suivante : www.unctad.org. Toutefois les données disponibles dans les versions électronique et imprimée pourront, dans certains cas, être différentes en raison de leur mise à jour et de leur publication à des dates différentes.
PREMIÈRE PARTIECommerce international des marchandises
Les tableaux 1.1 donnent la valeur des exportations et des importations totales de marchandises, exprimée en millions de dollars et en pourcentage du monde, des pays et régions géographiques (1.1.1), groupements économiques (1.1.2) et groupements commerciaux (1.1.3). Les flux du commerce présentés dans le tableau 1.1.1 se réfèrent au Système du Commerce Général, à l’exception des pays et territoires qui utilisent le Système du Commerce Spécial et qui sont munis d'un astérisque. Le Système du Commerce Général est utilisé lorsque le territoire statistique d'un pays coïncide avec son territoire économique, et en conséquence, les importations comprennent tous les biens admis sur le territoire du pays déclarant et les exportations tous les biens qui le quittent. Le Système du Commerce Spécial est utilisé lorsque le territoire statistique ne comprend qu'une partie du territoire économique à l'intérieur de laquelle « les biens peuvent être écoulés librement sans restriction douanière ». Dans ce cas, les importations comprennent tous les biens qui entrent dans la zone de libre circulation du pays déclarant, c’est-à-dire qui ont été dédouanés pour mise à la consommation et les exportations comprennent tous les biens qui quittent la zone de libre circulation du pays déclarant.
Les taux d’évolution annuels moyens du commerce international des marchandises, calculés à partir des valeurs des tableaux 1.1, figurent dans les tableaux 1. 2.
Les tableaux 1.3 présentent les balances commerciales (exportations f.a.b. moins importations c.a.f.), ainsi que ces mêmes balances en pourcentage des importations des pays, régions géographiques et groupements économiques.
Le tableau 1.4 indique l'importance des échanges entre pays membres de groupements commerciaux par rapport aux exportations régionales et totales de ces groupements.
DEUXIÈME PARTIECommerce international des marchandises par régions
Le tableau 2.1 présente la structure des exportations et des importations des pays par régions de destination et d'origine. Le plus grand nombre possible de pays en développement sont inclus tandis que les partenaires commerciaux sont regroupés en 14 groupes considérés comme particulièrement importants pour l’analyse du commerce international.
Le tableau 2.2 indique la structure des exportations par destination ainsi que des importations par origine et par groupes de produits pour le monde et une sélection de 12 groupements de pays. Le tableau fournit une information détaillée sur le réseau du commerce international avec le monde, 19 régions d’origine et de destination, et pour six différents groupes de produits. Les totaux du commerce international des marchandises présentés dans les tableaux des première et deuxième parties ne sont pas strictement comparables en raison de sources complémentaires mais différentes et d’une marge d'exportations et d'importations non distribuées, en dépit des efforts déployés pour répartir les flux commerciaux par destinations et origines.Les exportations ventilées par destinations peuvent accuser un écart parfois considérable par rapport aux importations déclarées par les pays destinataires en raison de divers facteurs dont les plus importants sont les suivants :
- Les importations sont déclarées en principe "valeur c.a.f." plutôt que "valeur f.a.b". - Les importations de marchandises peuvent arriver à destination et être enregistrées longtemps après la date de leur enregistrement à l'exportation.- D'importantes différences peuvent exister entre la destination des exportations déclarée par les pays exportateurs et la destination réelle telle qu'indiquée dans les statistiques d'importation.
TROISIÈME PARTIECommerce international des marchandises par produits
Le tableau 3.1 fournit la structure des exportations et des importations des pays par produits classés en 9 groupes (total, produits alimentaires, matières premières d'origine agricole, combustibles, minerais et métaux, produits manufacturés, dont produits chimiques, machines et matériel de transport, articles manufacturés divers) pour plusieurs années.
Les tableaux 3.2A, B et C présentent respectivement les exportations du monde, des économies développées et en développement, par produits à un niveau très détaillé (CTCI révision 3, position à trois chiffres). Les parts que représente chaque produit dans les exportations du monde et de la région, sont calculées pour chaque groupe d’économies, ainsi que le taux annuel de croissance et l'écart de ce dernier par rapport au taux de croissance mondial.
Le tableau 3.2D établit, pour chaque économie, la liste des principaux produits qu'elle exporte (CTCI révision 3, position à trois chiffres). La part de chaque produit dans le total des exportations du pays, de la région et du monde est également indiquée.
Le tableau 3.2E liste les plus gros exportateurs de 70 produits parmi les produits les plus exportés par les économies en développement (CTCI révision 3, position à trois chiffres), ainsi que les parts correspondantes dans le commerce mondial.
Le tableau 3.3 fournit les indices de concentration et de changements structurels des exportations et des importations des produits au niveau de la CTCI (révision 3, position à trois chiffres). Le premier indicateur a vocation à montrer comment le marché d’un produit est concentré sur quelques pays ou réparti de façon plus homogène entre les pays. L’indicateur de changement structurel indique si la répartition du commerce d’un produit entre les pays exportateurs ou importateurs a connu une évolution importante par rapport à une année de référence.Les totaux du commerce international des marchandises présentés dans les tableaux de cette troisième partie peuvent aussi être différents des données des première et deuxième parties pour les raisons précédemment citées, auxquelles il convient d’ajouter des marges d'exportations et d'importations non distribuées par groupes de produits ou l’utilisation de nomenclatures différentes de produits par le pays exportateur et le pays importateur.
QUATRIÈME PARTIEIndicateurs du commerce international des marchandises
Les tableaux 4.1 contiennent les résultats du calcul des indices de concentration et de diversification des pays, régions géographiques et groupements économiques. Cet indice de concentration a vocation à montrer comment les exportations et importations d’un pays ou groupe de pays sont concentrées sur quelques produits ou répartis de façon plus homogène sur une gamme de produits. L’indicateur de diversification indique si la structure par produits des exportations ou importations d’un pays ou groupe de pays diverge de la structure par produits observée au niveau du monde.
Les tableaux 4.2 fournissent les indices de volume des exportations et des importations complétant ainsi l’information en valeur disponible dans les tableaux 1.1 et 1.2, les indices de la valeur unitaire des exportations et importations et les indices de termes de l'échange et le pouvoir d'achat des exportations dérivés des indices de valeur unitaire, calculés au niveau des pays et régions géographiques (4.2.1) et des groupements économiques (4.2.2).
NOTES GÉNÉRALES
xxii
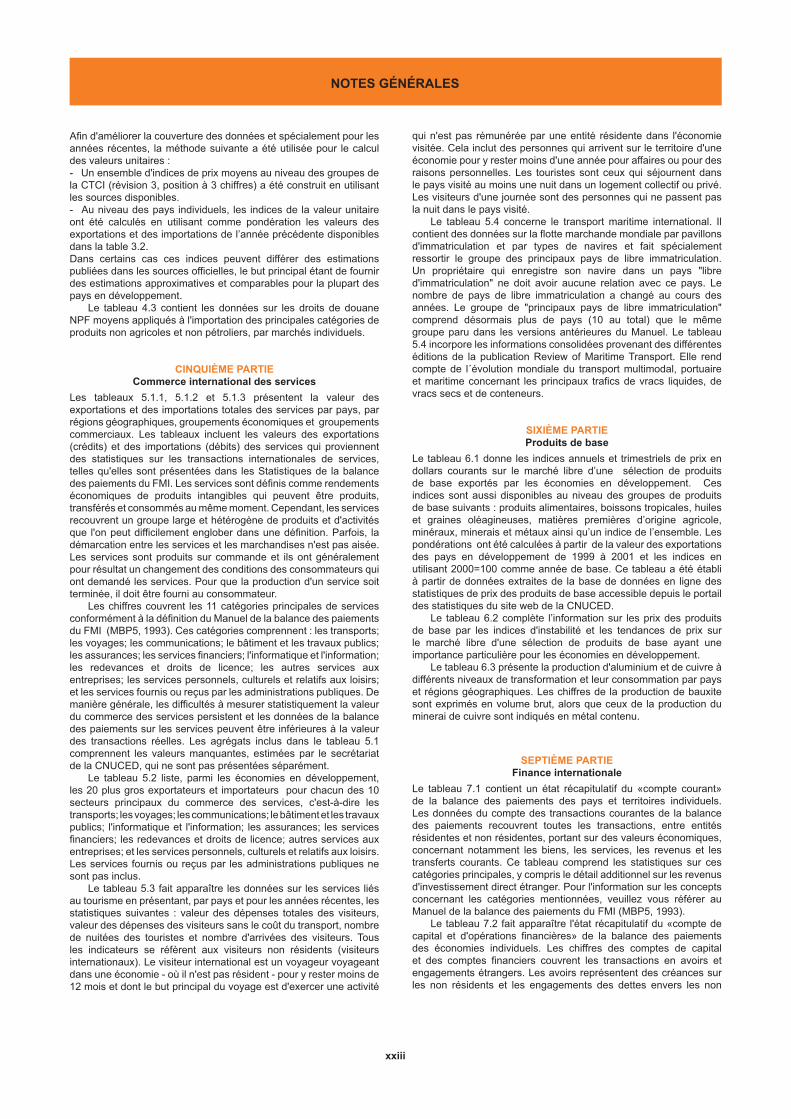
Afin d'améliorer la couverture des données et spécialement pour les années récentes, la méthode suivante a été utilisée pour le calcul des valeurs unitaires :- Un ensemble d'indices de prix moyens au niveau des groupes de la CTCI (révision 3, position à 3 chiffres) a été construit en utilisant les sources disponibles.- Au niveau des pays individuels, les indices de la valeur unitaire ont été calculés en utilisant comme pondération les valeurs des exportations et des importations de l’année précédente disponibles dans la table 3.2.Dans certains cas ces indices peuvent différer des estimations publiées dans les sources officielles, le but principal étant de fournir des estimations approximatives et comparables pour la plupart des pays en développement.
Le tableau 4.3 contient les données sur les droits de douane NPF moyens appliqués à l'importation des principales catégories de produits non agricoles et non pétroliers, par marchés individuels.
CINQUIÈME PARTIECommerce international des services
Les tableaux 5.1.1, 5.1.2 et 5.1.3 présentent la valeur des exportations et des importations totales des services par pays, par régions géographiques, groupements économiques et groupements commerciaux. Les tableaux incluent les valeurs des exportations (crédits) et des importations (débits) des services qui proviennent des statistiques sur les transactions internationales de services, telles qu'elles sont présentées dans les Statistiques de la balance des paiements du FMI. Les services sont définis comme rendements économiques de produits intangibles qui peuvent être produits, transférés et consommés au même moment. Cependant, les services recouvrent un groupe large et hétérogène de produits et d'activités que l'on peut difficilement englober dans une définition. Parfois, la démarcation entre les services et les marchandises n'est pas aisée. Les services sont produits sur commande et ils ont généralement pour résultat un changement des conditions des consommateurs qui ont demandé les services. Pour que la production d'un service soit terminée, il doit être fourni au consommateur.
Les chiffres couvrent les 11 catégories principales de services conformément à la définition du Manuel de la balance des paiements du FMI (MBP5, 1993). Ces catégories comprennent : les transports; les voyages; les communications; le bâtiment et les travaux publics; les assurances; les services financiers; l'informatique et l'information; les redevances et droits de licence; les autres services aux entreprises; les services personnels, culturels et relatifs aux loisirs; et les services fournis ou reçus par les administrations publiques. De manière générale, les difficultés à mesurer statistiquement la valeur du commerce des services persistent et les données de la balance des paiements sur les services peuvent être inférieures à la valeur des transactions réelles. Les agrégats inclus dans le tableau 5.1 comprennent les valeurs manquantes, estimées par le secrétariat de la CNUCED, qui ne sont pas présentées séparément.
Le tableau 5.2 liste, parmi les économies en développement, les 20 plus gros exportateurs et importateurs pour chacun des 10 secteurs principaux du commerce des services, c'est-à-dire les transports; les voyages; les communications; le bâtiment et les travaux publics; l'informatique et l'information; les assurances; les services financiers; les redevances et droits de licence; autres services aux entreprises; et les services personnels, culturels et relatifs aux loisirs. Les services fournis ou reçus par les administrations publiques ne sont pas inclus.
Le tableau 5.3 fait apparaître les données sur les services liés au tourisme en présentant, par pays et pour les années récentes, les statistiques suivantes : valeur des dépenses totales des visiteurs, valeur des dépenses des visiteurs sans le coût du transport, nombre de nuitées des touristes et nombre d'arrivées des visiteurs. Tous les indicateurs se réfèrent aux visiteurs non résidents (visiteurs internationaux). Le visiteur international est un voyageur voyageant dans une économie - où il n'est pas résident - pour y rester moins de 12 mois et dont le but principal du voyage est d'exercer une activité
qui n'est pas rémunérée par une entité résidente dans l'économie visitée. Cela inclut des personnes qui arrivent sur le territoire d'une économie pour y rester moins d'une année pour affaires ou pour des raisons personnelles. Les touristes sont ceux qui séjournent dans le pays visité au moins une nuit dans un logement collectif ou privé. Les visiteurs d'une journée sont des personnes qui ne passent pas la nuit dans le pays visité.
Le tableau 5.4 concerne le transport maritime international. Il contient des données sur la flotte marchande mondiale par pavillons d'immatriculation et par types de navires et fait spécialement ressortir le groupe des principaux pays de libre immatriculation. Un propriétaire qui enregistre son navire dans un pays "libre d'immatriculation" ne doit avoir aucune relation avec ce pays. Le nombre de pays de libre immatriculation a changé au cours des années. Le groupe de "principaux pays de libre immatriculation" comprend désormais plus de pays (10 au total) que le même groupe paru dans les versions antérieures du Manuel. Le tableau 5.4 incorpore les informations consolidées provenant des différentes éditions de la publication Review of Maritime Transport. Elle rend compte de l´évolution mondiale du transport multimodal, portuaire et maritime concernant les principaux trafics de vracs liquides, de vracs secs et de conteneurs.
SIXIÈME PARTIEProduits de base
Le tableau 6.1 donne les indices annuels et trimestriels de prix en dollars courants sur le marché libre d’une sélection de produits de base exportés par les économies en développement. Ces indices sont aussi disponibles au niveau des groupes de produits de base suivants : produits alimentaires, boissons tropicales, huiles et graines oléagineuses, matières premières d’origine agricole, minéraux, minerais et métaux ainsi qu’un indice de l’ensemble. Les pondérations ont été calculées à partir de la valeur des exportations des pays en développement de 1999 à 2001 et les indices en utilisant 2000=100 comme année de base. Ce tableau a été établi à partir de données extraites de la base de données en ligne des statistiques de prix des produits de base accessible depuis le portail des statistiques du site web de la CNUCED.
Le tableau 6.2 complète l’information sur les prix des produits de base par les indices d'instabilité et les tendances de prix sur le marché libre d'une sélection de produits de base ayant une importance particulière pour les économies en développement.
Le tableau 6.3 présente la production d'aluminium et de cuivre à différents niveaux de transformation et leur consommation par pays et régions géographiques. Les chiffres de la production de bauxite sont exprimés en volume brut, alors que ceux de la production du minerai de cuivre sont indiqués en métal contenu.
SEPTIÈME PARTIEFinance internationale
Le tableau 7.1 contient un état récapitulatif du «compte courant» de la balance des paiements des pays et territoires individuels. Les données du compte des transactions courantes de la balance des paiements recouvrent toutes les transactions, entre entités résidentes et non résidentes, portant sur des valeurs économiques, concernant notamment les biens, les services, les revenus et les transferts courants. Ce tableau comprend les statistiques sur ces catégories principales, y compris le détail additionnel sur les revenus d'investissement direct étranger. Pour l'information sur les concepts concernant les catégories mentionnées, veuillez vous référer au Manuel de la balance des paiements du FMI (MBP5, 1993).
Le tableau 7.2 fait apparaître l'état récapitulatif du «compte de capital et d'opérations financières» de la balance des paiements des économies individuels. Les chiffres des comptes de capital et des comptes financiers couvrent les transactions en avoirs et engagements étrangers. Les avoirs représentent des créances sur les non résidents et les engagements des dettes envers les non
NOTES GÉNÉRALES
xxiii
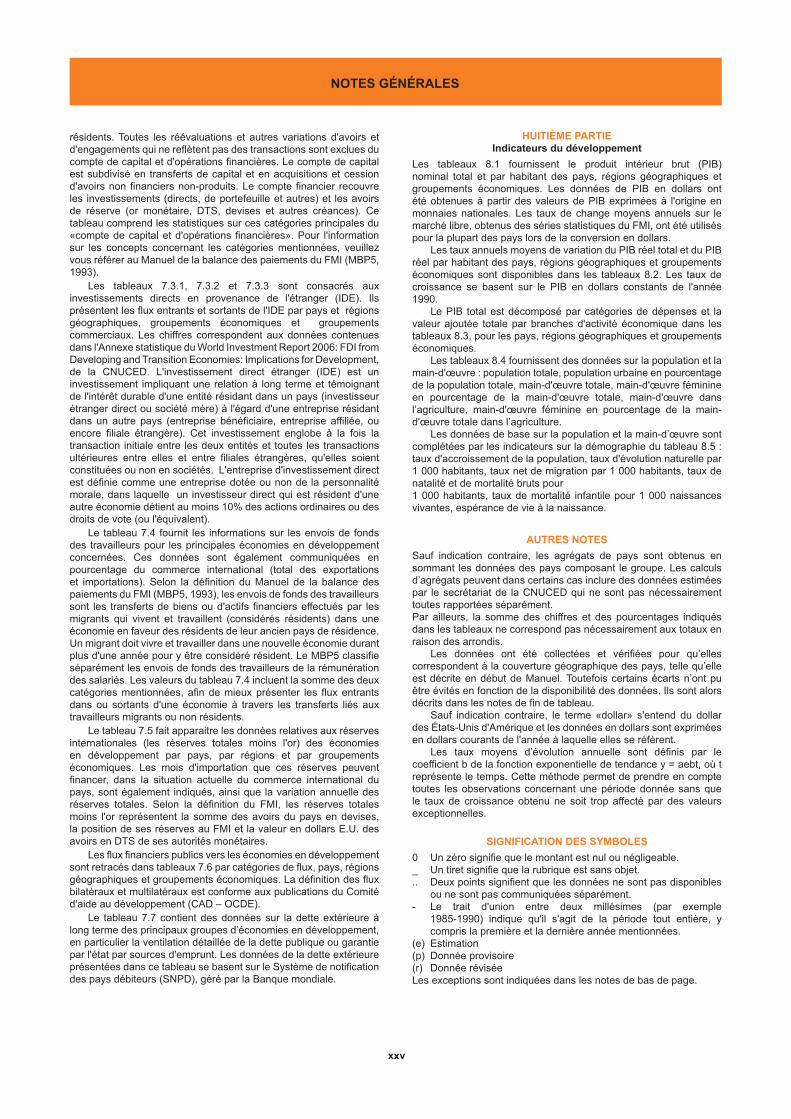
résidents. Toutes les réévaluations et autres variations d'avoirs et d'engagements qui ne reflètent pas des transactions sont exclues du compte de capital et d'opérations financières. Le compte de capital est subdivisé en transferts de capital et en acquisitions et cession d'avoirs non financiers non-produits. Le compte financier recouvre les investissements (directs, de portefeuille et autres) et les avoirs de réserve (or monétaire, DTS, devises et autres créances). Ce tableau comprend les statistiques sur ces catégories principales du «compte de capital et d'opérations financières». Pour l'information sur les concepts concernant les catégories mentionnées, veuillez vous référer au Manuel de la balance des paiements du FMI (MBP5, 1993).
Les tableaux 7.3.1, 7.3.2 et 7.3.3 sont consacrés aux investissements directs en provenance de l'étranger (IDE). Ils présentent les flux entrants et sortants de l'IDE par pays et régions géographiques, groupements économiques et groupements commerciaux. Les chiffres correspondent aux données contenues dans l'Annexe statistique du World Investment Report 2006: FDI from Developing and Transition Economies: Implications for Development, de la CNUCED. L'investissement direct étranger (IDE) est un investissement impliquant une relation à long terme et témoignant de l'intérêt durable d'une entité résidant dans un pays (investisseur étranger direct ou société mère) à l'égard d'une entreprise résidant dans un autre pays (entreprise bénéficiaire, entreprise affiliée, ou encore filiale étrangère). Cet investissement englobe à la fois la transaction initiale entre les deux entités et toutes les transactions ultérieures entre elles et entre filiales étrangères, qu'elles soient constituées ou non en sociétés. L'entreprise d'investissement direct est définie comme une entreprise dotée ou non de la personnalité morale, dans laquelle un investisseur direct qui est résident d'une autre économie détient au moins 10% des actions ordinaires ou des droits de vote (ou l'équivalent).
Le tableau 7.4 fournit les informations sur les envois de fonds des travailleurs pour les principales économies en développement concernées. Ces données sont également communiquées en pourcentage du commerce international (total des exportations et importations). Selon la définition du Manuel de la balance des paiements du FMI (MBP5, 1993), les envois de fonds des travailleurs sont les transferts de biens ou d'actifs financiers effectués par les migrants qui vivent et travaillent (considérés résidents) dans une économie en faveur des résidents de leur ancien pays de résidence. Un migrant doit vivre et travailler dans une nouvelle économie durant plus d'une année pour y être considéré résident. Le MBP5 classifie séparément les envois de fonds des travailleurs de la rémunération des salariés. Les valeurs du tableau 7.4 incluent la somme des deux catégories mentionnées, afin de mieux présenter les flux entrants dans ou sortants d'une économie à travers les transferts liés aux travailleurs migrants ou non résidents.
Le tableau 7.5 fait apparaitre les données relatives aux réserves internationales (les réserves totales moins l'or) des économies en développement par pays, par régions et par groupements économiques. Les mois d'importation que ces réserves peuvent financer, dans la situation actuelle du commerce international du pays, sont également indiqués, ainsi que la variation annuelle des réserves totales. Selon la définition du FMI, les réserves totales moins l'or représentent la somme des avoirs du pays en devises, la position de ses réserves au FMI et la valeur en dollars E.U. des avoirs en DTS de ses autorités monétaires.
Les flux financiers publics vers les économies en développement sont retracés dans tableaux 7.6 par catégories de flux, pays, régions géographiques et groupements économiques. La définition des flux bilatéraux et multilatéraux est conforme aux publications du Comité d'aide au développement (CAD – OCDE).
Le tableau 7.7 contient des données sur la dette extérieure à long terme des principaux groupes d’économies en développement, en particulier la ventilation détaillée de la dette publique ou garantie par l'état par sources d'emprunt. Les données de la dette extérieure présentées dans ce tableau se basent sur le Système de notification des pays débiteurs (SNPD), géré par la Banque mondiale.
HUITIÈME PARTIEIndicateurs du développement
Les tableaux 8.1 fournissent le produit intérieur brut (PIB) nominal total et par habitant des pays, régions géographiques et groupements économiques. Les données de PIB en dollars ont été obtenues à partir des valeurs de PIB exprimées à l'origine en monnaies nationales. Les taux de change moyens annuels sur le marché libre, obtenus des séries statistiques du FMI, ont été utilisés pour la plupart des pays lors de la conversion en dollars.
Les taux annuels moyens de variation du PIB réel total et du PIB réel par habitant des pays, régions géographiques et groupements économiques sont disponibles dans les tableaux 8.2. Les taux de croissance se basent sur le PIB en dollars constants de l'année 1990.
Le PIB total est décomposé par catégories de dépenses et la valeur ajoutée totale par branches d'activité économique dans les tableaux 8.3, pour les pays, régions géographiques et groupements économiques.
Les tableaux 8.4 fournissent des données sur la population et la main-d'œuvre : population totale, population urbaine en pourcentage de la population totale, main-d'œuvre totale, main-d'œuvre féminine en pourcentage de la main-d'œuvre totale, main-d'œuvre dans l’agriculture, main-d'œuvre féminine en pourcentage de la main-d'œuvre totale dans l’agriculture.
Les données de base sur la population et la main-d’œuvre sont complétées par les indicateurs sur la démographie du tableau 8.5 : taux d'accroissement de la population, taux d'évolution naturelle par 1 000 habitants, taux net de migration par 1 000 habitants, taux de natalité et de mortalité bruts pour 1 000 habitants, taux de mortalité infantile pour 1 000 naissances vivantes, espérance de vie à la naissance.
AUTRES NOTES
Sauf indication contraire, les agrégats de pays sont obtenus en sommant les données des pays composant le groupe. Les calculs d’agrégats peuvent dans certains cas inclure des données estimées par le secrétariat de la CNUCED qui ne sont pas nécessairement toutes rapportées séparément.Par ailleurs, la somme des chiffres et des pourcentages indiqués dans les tableaux ne correspond pas nécessairement aux totaux en raison des arrondis.
Les données ont été collectées et vérifiées pour qu’elles correspondent à la couverture géographique des pays, telle qu’elle est décrite en début de Manuel. Toutefois certains écarts n’ont pu être évités en fonction de la disponibilité des données. Ils sont alors décrits dans les notes de fin de tableau.
Sauf indication contraire, le terme «dollar» s'entend du dollar des États-Unis d'Amérique et les données en dollars sont exprimées en dollars courants de l'année à laquelle elles se réfèrent.
Les taux moyens d’évolution annuelle sont définis par le coefficient b de la fonction exponentielle de tendance y = aebt, où t représente le temps. Cette méthode permet de prendre en compte toutes les observations concernant une période donnée sans que le taux de croissance obtenu ne soit trop affecté par des valeurs exceptionnelles.
SIGNIFICATION DES SYMBOLES
0 Un zéro signifie que le montant est nul ou négligeable._ Un tiret signifie que la rubrique est sans objet... Deux points signifient que les données ne sont pas disponibles
ou ne sont pas communiquées séparément.- Le trait d'union entre deux millésimes (par exemple
1985-1990) indique qu'il s'agit de la période tout entière, y compris la première et la dernière année mentionnées.
(e) Estimation(p) Donnée provisoire(r) Donnée réviséeLes exceptions sont indiquées dans les notes de bas de page.
NOTES GÉNÉRALES
xxv
RÉPARTITION DES PAYS ET TERRITOIRES
Les pays et territoires sont présentés suivant des critères géographiques conformes à ceux de la Division de statistique, Département des affaires économiques et sociales (DAES) de l'ONU. Les pays et territoires sont aussi regroupés suivant des critères économiques ou d’adhésion à des accords commerciaux à des fins d'analyse statistique et de recherche.
Dans cette publication, le terme «économie» couvre les régions, les pays et les territoires.
Les pays sont montrés dans les tableaux s’ils ont communiqué des données ou si des estimations ont pu être calculées.
1. Régions géographiques, pays et territoires
Les pays et territoires sont répartis en trois grandes catégories, les économies en développement, les économies en transition et les économies développées, elles-mêmes subdivisées suivant des critères géographiques.
1) Économies en développement :
Ces économies sont réparties entre quatre grandes régions géographiques : Amérique, Afrique, Asie et Océanie elles-mêmes subdivisées en sous-régions pour permettre la présentation de statistiques plus détaillées. Les exceptions à ce classement que l'on retrouve dans certains tableaux sont indiquées dans des notes.
2) Économies en transition :
Ces économies sont réparties entre deux grandes régions géographiques : Asie et Europe.
3) Économies développées : Ces économies sont réparties entre quatre grandes régions géographiques : Amérique, Asie, Europe et Océanie.
2. Groupements économiques des économies en développement
Dans le Manuel de statistiques de la CNUCED, les regroupements des pays et territoires en développement sont nombreux et variés afin de disposer facilement des données statistiques nécessaires à l’analyse socio-économique et aux recherches sur le développement.
Les économies en développement sont présentées à trois niveaux d'agrégation : le groupe dans son intégralité, puis sans la Chine continentale et enfin sans les pays les moins avancés.
Les économies en développement sont également réparties en trois groupes de revenu en fonction du PIB par habitant en 2000 : revenu élevé, revenu intermédiaire et revenu faible. Cette répartition est basée sur les données de PIB et de population qui étaient disponibles en 2004 et elle n’a pas été révisée afin de maintenir la composition des groupes durant plusieurs éditions du Manuel de statistiques.
Le groupe des pays pauvres très endettés (PPTE) inclut 40 pays. Ces pays bénéficient de l'initiative de désendettement de la Banque mondiale et du Fonds monétaire international.
Les pays les moins avancés (PMA) et les pays en développement sans littoral sont des groupes de pays qui requièrent une attention particulière de la communauté internationale. Les PMA sont présentés aux niveaux d'agrégation suivants : Afrique et Haïti, Asie et les îles.
Depuis 1994, les Nations Unies ont également pris en compte les problèmes particuliers des petits États insulaires en développement mais n'ont pas établi de liste officielle de ces États. La liste présentée dans le Manuel de statistiques estutilisée par la CNUCED à des fins analytiques uniquement.
Le groupement des principaux exportateurs de pétrolecomprend les pays dont la part du pétrole et des produits pétroliers ne représentait pas moins de 50 % de leurs exportations totales, et les exportations de ces produits s’élevaient à au moins 2 milliards de dollars en 2003-2005 en moyenne. Les pays composant ce groupement sont répartis en trois zones géographiques : Afrique, Amérique et Asie.
Le groupement des principaux exportateurs d’articles manufacturés, répartis entre Amérique et Asie, comprend les économies dont la part d’articles manufacturés ne représentait pas moins de 50 % de leurs exportations totales, et leurs exportations d’articles manufacturés avaient une valeur moyenne d’au moins 22 milliards de dollars en 2003-2005.
La composition des groupements des économies émergentes (réparties entre Amérique et Asie) et des économies nouvellement industrialisées (première et deuxième génération) correspond à celle utilisée dans le Rapport sur le commerce et le développement de la CNUCED.
Les différentes régions géographiques sont également présentées à différents niveaux d'agrégation :
- Afrique : Afrique septentrionale sans le Soudan, Afrique subsaharienne, Soudan compris, avec et sans l'Afrique du Sud.
- Amérique : Amérique centrale et Grandes Antilles sans Porto Rico, avec et sans le Mexique, Amérique du Sud et centrale, Amérique du Sud sans le Brésil.
- Asie : Asie orientale et du Sud-Est sans la Chine et Asie méridionale sans l'Inde.
3. Groupements commerciaux et interrégionaux
Les statistiques des groupements commerciaux sont présentées dès lors qu'elles sont pertinentes et présentent un intérêt analytique. Ces groupements englobent toutes les économies concernées et sont classés selon les grandes régions géographiques utilisées précédemment, à l'exception des groupements interrégionaux suivants : le groupe des États d'Afrique, des Caraïbes et du Pacifique (ACP), le groupe de Coopération économique de l'Asie et du Pacifique (CEAP), le groupe de Coopération économique de la mer Noire (CEMN) et la Communauté des États indépendants (CEI).
xxv
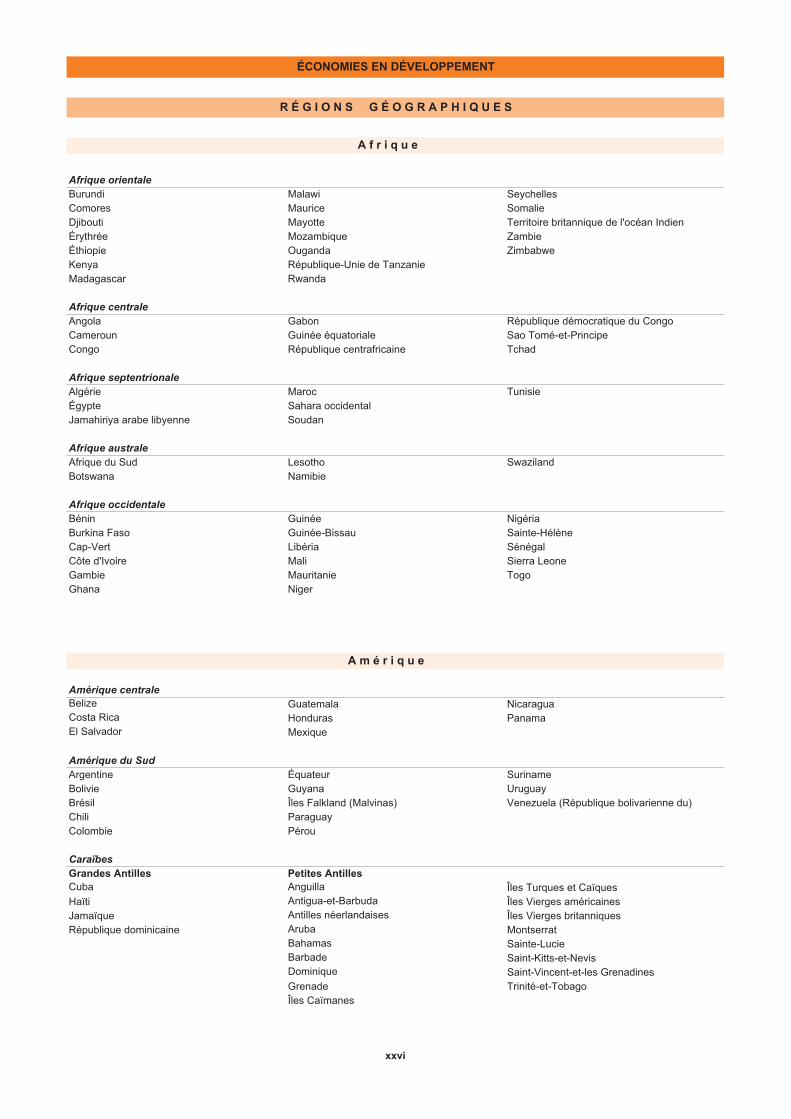
Burundi Malawi SeychellesComores Maurice SomalieDjibouti Mayotte Territoire britannique de l'océan IndienÉrythrée Mozambique ZambieÉthiopie Ouganda ZimbabweKenya République-Unie de TanzanieMadagascar Rwanda
Afrique centraleAngola Gabon République démocratique du CongoCameroun Guinée équatoriale Sao Tomé-et-PrincipeCongo République centrafricaine Tchad
Algérie Maroc TunisieÉgypte Sahara occidentalJamahiriya arabe libyenne Soudan
Afrique australeAfrique du Sud Lesotho SwazilandBotswana Namibie
Afrique occidentaleBénin Guinée NigériaBurkina Faso Guinée-Bissau Sainte-HélèneCap-Vert Libéria SénégalCôte d'Ivoire Mali Sierra LeoneGambie Mauritanie TogoGhana Niger
Belize Guatemala NicaraguaCosta Rica Honduras PanamaEl Salvador Mexique
Argentine Équateur SurinameBolivie Guyana UruguayBrésil Îles Falkland (Malvinas) Venezuela (République bolivarienne du)Chili ParaguayColombie Pérou
Grandes Antilles Petites AntillesCuba Anguilla Îles Turques et CaïquesHaïti Antigua-et-Barbuda Îles Vierges américainesJamaïque Antilles néerlandaises Îles Vierges britanniquesRépublique dominicaine Aruba Montserrat
Bahamas Sainte-LucieBarbade Saint-Kitts-et-NevisDominique Saint-Vincent-et-les GrenadinesGrenade Trinité-et-TobagoÎles Caïmanes
Caraïbes
Afrique orientale
ÉCONOMIES EN DÉVELOPPEMENT
A m é r i q u e
Amérique du Sud
Amérique centrale
A f r i q u e
Afrique septentrionale
R É G I O N S G É O G R A P H I Q U E S
xxvi
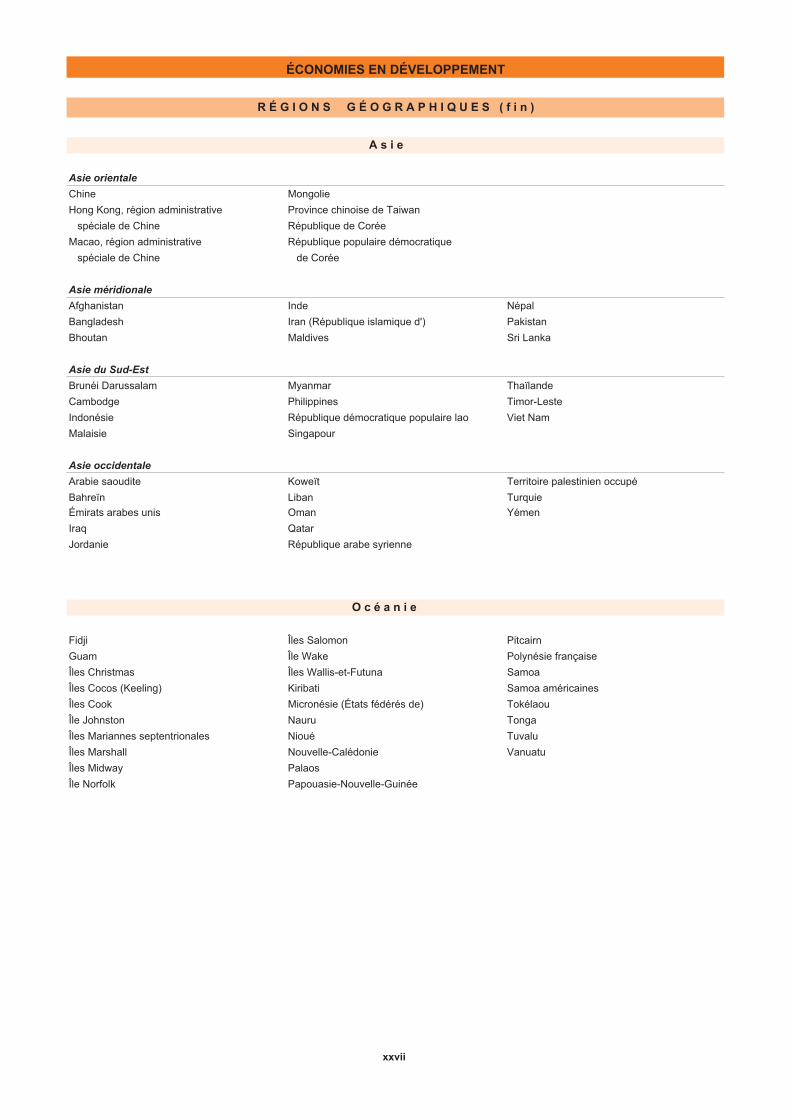
ÉCONOMIES EN DÉVELOPPEMENT
R É G I O N S G É O G R A P H I Q U E S ( f i n )
A s i e
Asie orientale
Chine Mongolie
Hong Kong, région administrative Province chinoise de Taiwan
spéciale de Chine République de Corée
Macao, région administrative République populaire démocratique
spéciale de Chine de Corée
Asie méridionale
Afghanistan Inde Népal
Bangladesh Iran (République islamique d') Pakistan
Bhoutan Maldives Sri Lanka
Asie du Sud-Est
Brunéi Darussalam Myanmar Thaïlande
Cambodge Philippines Timor-Leste
Indonésie République démocratique populaire lao Viet Nam
Malaisie Singapour
Asie occidentale
Arabie saoudite Koweït Territoire palestinien occupé
Bahreïn Liban Turquie
Émirats arabes unis Oman Yémen
Iraq Qatar
Jordanie République arabe syrienne
O c é a n i e
Fidji Îles Salomon Pitcairn
Guam Île Wake Polynésie française
Îles Christmas Îles Wallis-et-Futuna Samoa
Îles Cocos (Keeling) Kiribati Samoa américaines
Îles Cook Micronésie (États fédérés de) Tokélaou
Île Johnston Nauru Tonga
Îles Mariannes septentrionales Nioué Tuvalu
Îles Marshall Nouvelle-Calédonie Vanuatu
Îles Midway Palaos
Île Norfolk Papouasie-Nouvelle-Guinée
xxvii
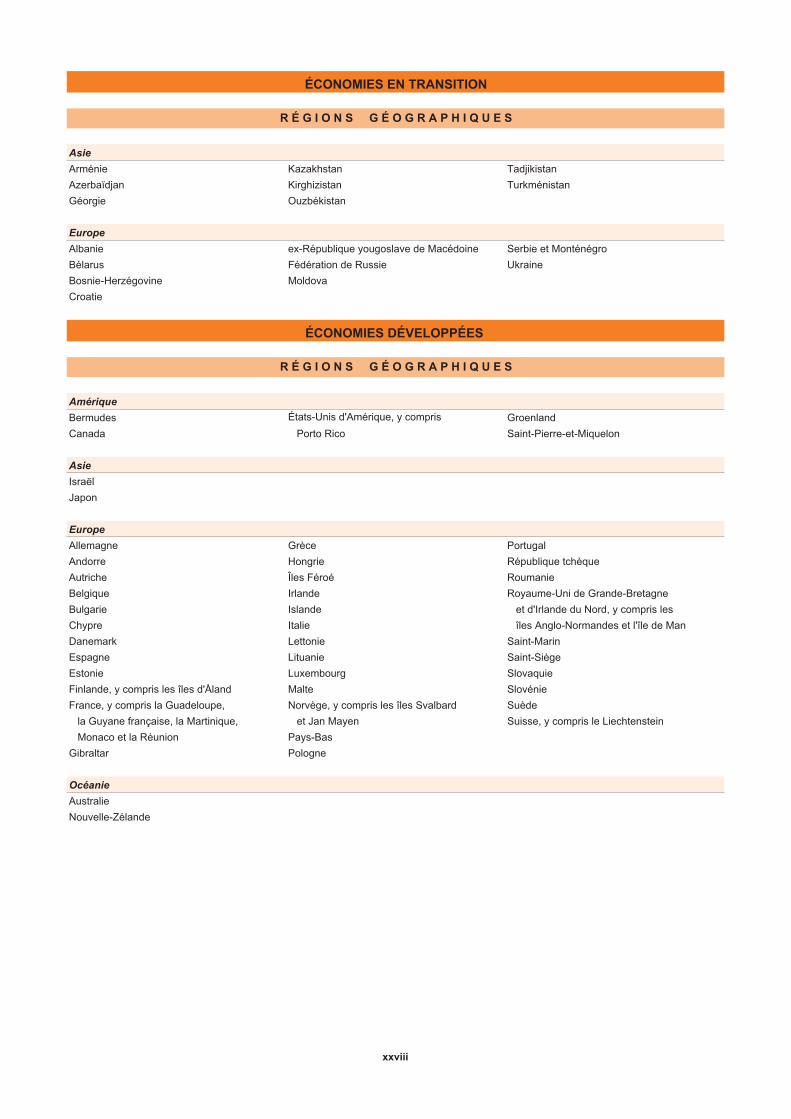
ÉCONOMIES EN TRANSITION
R É G I O N S G É O G R A P H I Q U E S
Asie
Arménie Kazakhstan Tadjikistan
Azerbaïdjan Kirghizistan Turkménistan
Géorgie Ouzbékistan
Europe
Albanie ex-République yougoslave de Macédoine Serbie et Monténégro
Bélarus Fédération de Russie Ukraine
Bosnie-Herzégovine Moldova
Croatie
ÉCONOMIES DÉVELOPPÉES
R É G I O N S G É O G R A P H I Q U E S
Amérique
Bermudes États-Unis d'Amérique, y compris Groenland
Canada Porto Rico Saint-Pierre-et-Miquelon
Asie
Israël
Japon
Europe
Allemagne Grèce Portugal
Andorre Hongrie République tchèque
Autriche Îles Féroé Roumanie
Belgique Irlande Royaume-Uni de Grande-Bretagne
Bulgarie Islande et d'Irlande du Nord, y compris les
Chypre Italie îles Anglo-Normandes et l'île de Man
Danemark Lettonie Saint-Marin
Espagne Lituanie Saint-Siège
Estonie Luxembourg Slovaquie
Finlande, y compris les îles d'Åland Malte Slovénie
France, y compris la Guadeloupe, Norvège, y compris les îles Svalbard Suède
la Guyane française, la Martinique, et Jan Mayen Suisse, y compris le Liechtenstein
Monaco et la Réunion Pays-Bas
Gibraltar Pologne
Océanie
Australie
Nouvelle-Zélande
xxviii
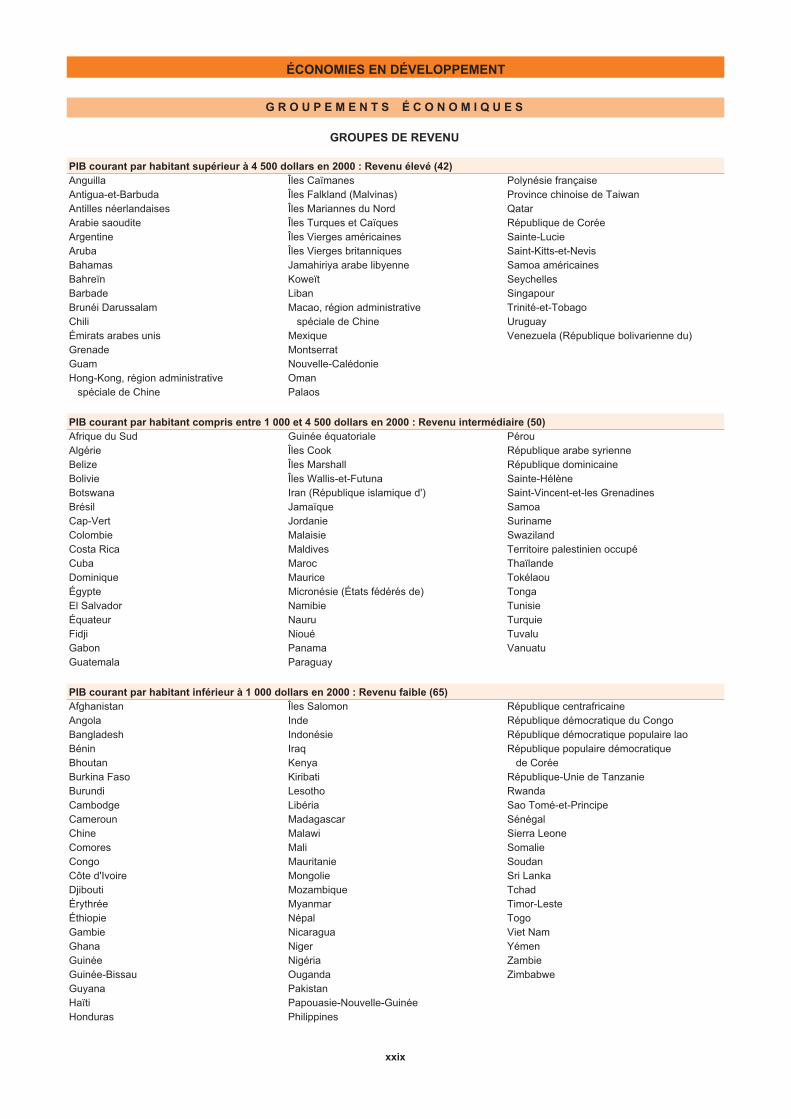
ÉCONOMIES EN DÉVELOPPEMENT
G R O U P E M E N T S É C O N O M I Q U E S
GROUPES DE REVENU
PIB courant par habitant supérieur à 4 500 dollars en 2000 : Revenu élevé (42) Anguilla Îles Caïmanes Polynésie françaiseAntigua-et-Barbuda Îles Falkland (Malvinas) Province chinoise de TaiwanAntilles néerlandaises Îles Mariannes du Nord QatarArabie saoudite Îles Turques et Caïques République de CoréeArgentine Îles Vierges américaines Sainte-LucieAruba Îles Vierges britanniques Saint-Kitts-et-NevisBahamas Jamahiriya arabe libyenne Samoa américainesBahreïn Koweït SeychellesBarbade Liban SingapourBrunéi Darussalam Macao, région administrative Trinité-et-TobagoChili spéciale de Chine UruguayÉmirats arabes unis Mexique Venezuela (République bolivarienne du)Grenade MontserratGuam Nouvelle-CalédonieHong-Kong, région administrative Oman spéciale de Chine Palaos
PIB courant par habitant compris entre 1 000 et 4 500 dollars en 2000 : Revenu intermédiaire (50)Afrique du Sud Guinée équatoriale PérouAlgérie Îles Cook République arabe syrienneBelize Îles Marshall République dominicaineBolivie Îles Wallis-et-Futuna Sainte-HélèneBotswana Iran (République islamique d') Saint-Vincent-et-les GrenadinesBrésil Jamaïque SamoaCap-Vert Jordanie SurinameColombie Malaisie SwazilandCosta Rica Maldives Territoire palestinien occupéCuba Maroc ThaïlandeDominique Maurice TokélaouÉgypte Micronésie (États fédérés de) TongaEl Salvador Namibie TunisieÉquateur Nauru TurquieFidji Nioué TuvaluGabon Panama VanuatuGuatemala Paraguay
PIB courant par habitant inférieur à 1 000 dollars en 2000 : Revenu faible (65)Afghanistan Îles Salomon République centrafricaineAngola Inde République démocratique du CongoBangladesh Indonésie République démocratique populaire laoBénin Iraq République populaire démocratiqueBhoutan Kenya de CoréeBurkina Faso Kiribati République-Unie de TanzanieBurundi Lesotho RwandaCambodge Libéria Sao Tomé-et-PrincipeCameroun Madagascar SénégalChine Malawi Sierra LeoneComores Mali SomalieCongo Mauritanie SoudanCôte d'Ivoire Mongolie Sri LankaDjibouti Mozambique TchadÉrythrée Myanmar Timor-LesteÉthiopie Népal TogoGambie Nicaragua Viet NamGhana Niger YémenGuinée Nigéria ZambieGuinée-Bissau Ouganda ZimbabweGuyana PakistanHaïti Papouasie-Nouvelle-GuinéeHonduras Philippines
xxix
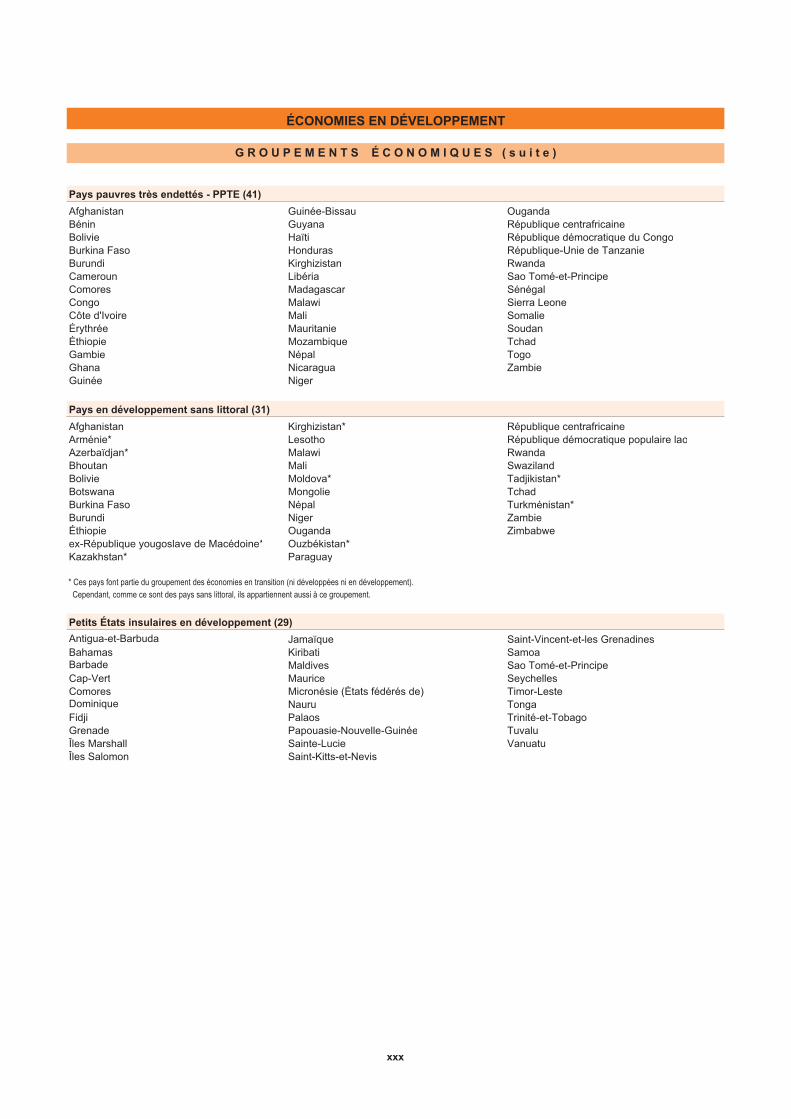
ÉCONOMIES EN DÉVELOPPEMENT
G R O U P E M E N T S É C O N O M I Q U E S ( s u i t e )
Pays pauvres très endettés - PPTE (41)
Afghanistan Guinée-Bissau OugandaBénin Guyana République centrafricaineBolivie Haïti République démocratique du CongoBurkina Faso Honduras République-Unie de TanzanieBurundi Kirghizistan RwandaCameroun Libéria Sao Tomé-et-PrincipeComores Madagascar SénégalCongo Malawi Sierra LeoneCôte d'Ivoire Mali SomalieÉrythrée Mauritanie SoudanÉthiopie Mozambique TchadGambie Népal TogoGhana Nicaragua ZambieGuinée Niger
Pays en développement sans littoral (31)
Afghanistan Kirghizistan* République centrafricaineArménie* Lesotho République démocratique populaire laoAzerbaïdjan* Malawi RwandaBhoutan Mali SwazilandBolivie Moldova* Tadjikistan*Botswana Mongolie TchadBurkina Faso Népal Turkménistan*Burundi Niger ZambieÉthiopie Ouganda Zimbabweex-République yougoslave de Macédoine* Ouzbékistan*Kazakhstan* Paraguay
* Ces pays font partie du groupement des économies en transition (ni développées ni en développement).
Cependant, comme ce sont des pays sans littoral, ils appartiennent aussi à ce groupement.
Petits États insulaires en développement (29)
Antigua-et-Barbuda Jamaïque Saint-Vincent-et-les GrenadinesBahamas Kiribati SamoaBarbade Maldives Sao Tomé-et-PrincipeCap-Vert Maurice SeychellesComores Micronésie (États fédérés de) Timor-LesteDominique Nauru TongaFidji Palaos Trinité-et-TobagoGrenade Papouasie-Nouvelle-Guinée TuvaluÎles Marshall Sainte-Lucie VanuatuÎles Salomon Saint-Kitts-et-Nevis
xxx
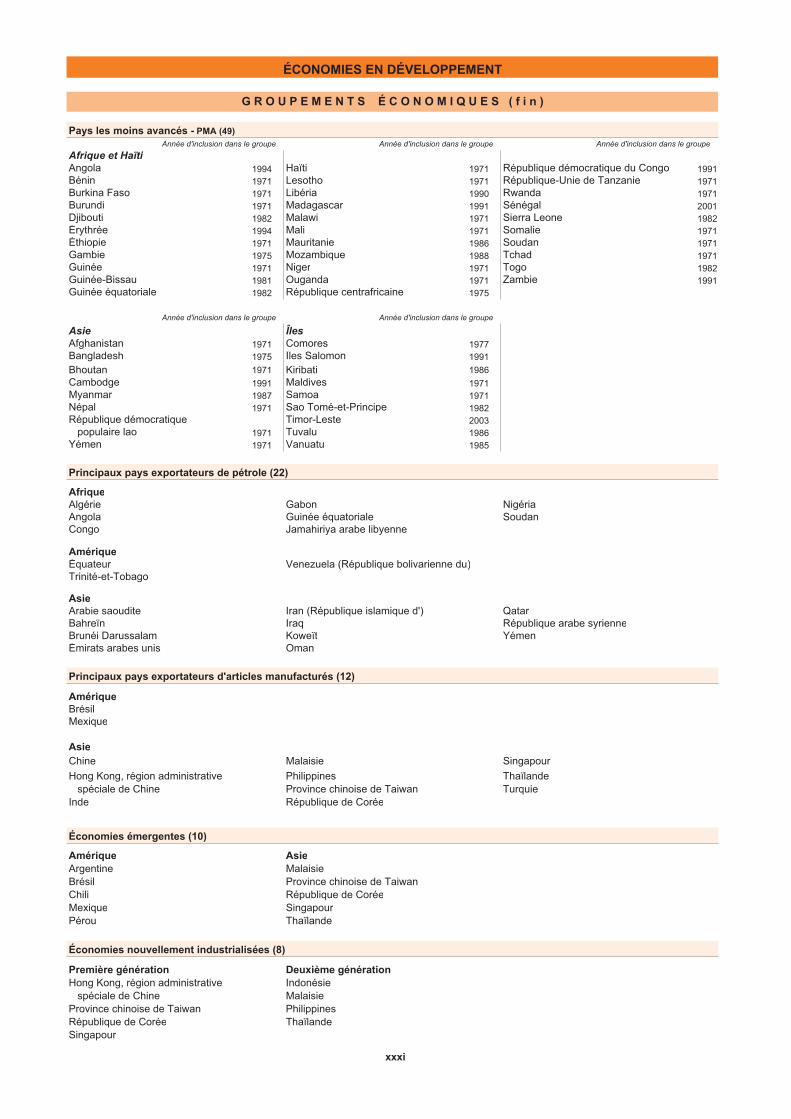
Afrique et HaïtiAngola 1994 Haïti 1971 République démocratique du Congo 1991Bénin 1971 Lesotho 1971 République-Unie de Tanzanie 1971Burkina Faso 1971 Libéria 1990 Rwanda 1971Burundi 1971 Madagascar 1991 Sénégal 2001Djibouti 1982 Malawi 1971 Sierra Leone 1982Érythrée 1994 Mali 1971 Somalie 1971Éthiopie 1971 Mauritanie 1986 Soudan 1971Gambie 1975 Mozambique 1988 Tchad 1971Guinée 1971 Niger 1971 Togo 1982Guinée-Bissau 1981 Ouganda 1971 Zambie 1991Guinée équatoriale 1982 République centrafricaine 1975
Asie ÎlesAfghanistan 1971 Comores 1977Bangladesh 1975 Îles Salomon 1991
Bhoutan 1971 Kiribati 1986
Cambodge 1991 Maldives 1971Myanmar 1987 Samoa 1971Népal 1971 Sao Tomé-et-Principe 1982République démocratique Timor-Leste 2003 populaire lao 1971 Tuvalu 1986Yémen 1971 Vanuatu 1985
AfriqueAlgérie Gabon NigériaAngola Guinée équatoriale SoudanCongo Jamahiriya arabe libyenne
AmériqueÉquateur Venezuela (République bolivarienne du)Trinité-et-Tobago
AsieArabie saoudite Iran (République islamique d') QatarBahreïn Iraq République arabe syrienneBrunéi Darussalam Koweït YémenÉmirats arabes unis Oman
AmériqueBrésilMexique
AsieChine Malaisie Singapour
Hong Kong, région administrative Philippines Thaïlande spéciale de Chine Province chinoise de Taiwan TurquieInde République de Corée
Amérique AsieArgentine MalaisieBrésil Province chinoise de TaiwanChili République de CoréeMexique SingapourPérou Thaïlande
Première génération Deuxième générationHong Kong, région administrative Indonésie spéciale de Chine MalaisieProvince chinoise de Taiwan PhilippinesRépublique de Corée ThaïlandeSingapour
ÉCONOMIES EN DÉVELOPPEMENT
G R O U P E M E N T S É C O N O M I Q U E S ( f i n )
Année d'inclusion dans le groupe Année d'inclusion dans le groupe
Pays les moins avancés - PMA (49)Année d'inclusion dans le groupe
Principaux pays exportateurs d'articles manufacturés (12)
Année d'inclusion dans le groupe
Économies nouvellement industrialisées (8)
Principaux pays exportateurs de pétrole (22)
Année d'inclusion dans le groupe
Économies émergentes (10)
xxxi
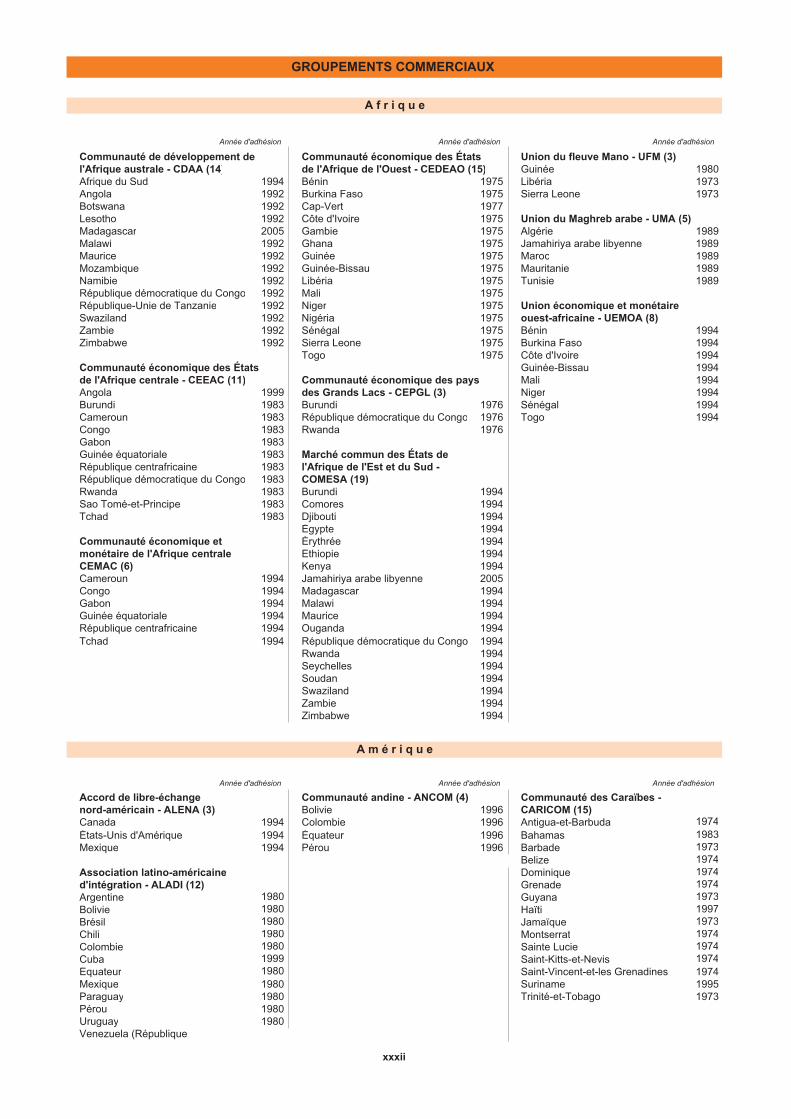
Communauté de développement de Communauté économique des États Union du fleuve Mano - UFM (3)l'Afrique australe - CDAA (14) de l'Afrique de l'Ouest - CEDEAO (15) Guinée 1980Afrique du Sud 1994 Bénin 1975 Libéria 1973Angola 1992 Burkina Faso 1975 Sierra Leone 1973Botswana 1992 Cap-Vert 1977Lesotho 1992 Côte d'Ivoire 1975 Union du Maghreb arabe - UMA (5)Madagascar 2005 Gambie 1975 Algérie 1989Malawi 1992 Ghana 1975 Jamahiriya arabe libyenne 1989Maurice 1992 Guinée 1975 Maroc 1989Mozambique 1992 Guinée-Bissau 1975 Mauritanie 1989Namibie 1992 Libéria 1975 Tunisie 1989République démocratique du Congo 1992 Mali 1975République-Unie de Tanzanie 1992 Niger 1975 Union économique et monétaireSwaziland 1992 Nigéria 1975 ouest-africaine - UEMOA (8) Zambie 1992 Sénégal 1975 Bénin 1994Zimbabwe 1992 Sierra Leone 1975 Burkina Faso 1994
Togo 1975 Côte d'Ivoire 1994Guinée-Bissau 1994
de l'Afrique centrale - CEEAC (11) Communauté économique des pays Mali 1994Angola 1999 des Grands Lacs - CEPGL (3) Niger 1994Burundi 1983 Burundi 1976 Sénégal 1994Cameroun 1983 République démocratique du Congo 1976 Togo 1994Congo 1983 1976Gabon 1983Guinée équatoriale 1983République centrafricaine 1983 l'Afrique de l'Est et du Sud - République démocratique du Congo 1983 COMESA (19)Rwanda 1983 Burundi 1994Sao Tomé-et-Principe 1983 Comores 1994Tchad 1983 Djibouti 1994
Égypte 1994Communauté économique et Érythrée 1994monétaire de l'Afrique centrale Éthiopie 1994CEMAC (6) Kenya 1994Cameroun 1994 Jamahiriya arabe libyenne 2005Congo 1994 Madagascar 1994Gabon 1994 Malawi 1994Guinée équatoriale 1994 Maurice 1994République centrafricaine 1994 Ouganda 1994Tchad 1994 République démocratique du Congo 1994 Rwanda 1994
Seychelles 1994Soudan 1994Swaziland 1994Zambie 1994Zimbabwe 1994
Accord de libre-échange Communauté andine - ANCOM (4) Communauté des Caraïbes -nord-américain - ALENA (3) Bolivie 1996 CARICOM (15) Canada 1994 Colombie 1996 Antigua-et-Barbuda 1974États-Unis d'Amérique 1994 Équateur 1996 Bahamas 1983Mexique 1994 Pérou 1996 Barbade 1973
Belize 1974Association latino-américaine Dominique 1974d'intégration - ALADI (12) Grenade 1974Argentine 1980 Guyana 1973Bolivie 1980 Haïti 1997Brésil 1980 Jamaïque 1973Chili 1980 Montserrat 1974Colombie 1980 Sainte Lucie 1974Cuba 1999 Saint-Kitts-et-Nevis 1974Équateur 1980 Saint-Vincent-et-les Grenadines 1974Mexique 1980 Suriname 1995Paraguay 1980 Trinité-et-Tobago 1973Pérou 1980Uruguay 1980Venezuela (République
A m é r i q u e
Année d'adhésion Année d'adhésion Année d'adhésion
GROUPEMENTS COMMERCIAUX
A f r i q u e
Année d'adhésion Année d'adhésion Année d'adhésion
xxxii
Rwanda
Communauté économique des États
Marché commun des États de

Marché commun d'Amérique Zone de libre-échange descentrale - MCAC (5) Amériques - ZLEA (34) Costa Rica 1962 Antigua-et-Barbuda 1994 Paraguay 1994El Salvador 1961 Argentine 1994 Pérou 1994Guatemala 1961 Bahamas 1994 République dominicaine 1994Honduras 1961 Barbade 1994 Sainte-Lucie 1994Nicaragua 1961 Belize 1994 Saint-Kitts-et-Nevis 1994
Bolivie 1994 Saint-Vincent-et-les Grenadines 1994Marché commun sud-américain - Brésil 1994 Suriname 1994MERCOSUR (4) Canada 1994 Trinité-et-Tobago 1994Argentine 1994 Chili 1994 Uruguay 1994Brésil 1994 Colombie 1994 Venezuela (République Paraguay 1994 Costa Rica 1994 bolivarienne du) 1994Uruguay 1994 Dominique 1994
El Salvador 1994Organisation des États des Équateur 1994Caraïbes orientales - OECO (9) États-Unis d'Amérique 1994Anguilla 1995 Grenade 1994Antigua-et-Barbuda 1981 Guatemala 1994Dominique 1981 Guyana 1994Grenade 1981 Haïti 1994Îles Vierges britanniques 1984 Honduras 1994Montserrat 1981 Jamaïque 1994Sainte-Lucie 1981 Mexique 1994Saint-Kitts-et-Nevis 1981 Nicaragua 1994Saint-Vincent-et-les Grenadines 1981 Panama 1994
Accord commercial de l'Asie et du Association des nations de l'Asie du Conseil de coopération du Golfe -Pacifique - ACAP (6) * Sud-Est - ANASE (10) CCG (6)Bangladesh 1975 Brunéi Darussalam 1984 Arabie saoudite 1981Chine 2001 Cambodge 1999 Bahreïn 1981Inde 1975 Indonésie 1967 Émirats arabes unis 1981
République de Corée 1975 Malaisie 1967 Koweït 1981République démocratique Myanmar 1997 Oman 1981 populaire lao 1975 Philippines 1967 Qatar 1981Sri Lanka 1975 République démocratique * ex-Accord de Bangkok populaire lao 1997 Organisation de coopération
Singapour 1967 économique - OCE (10) Association de l'Asie du Sud pour Thaïlande 1967 Afghanistan 1992la coopération régionale - SAARC (7) Viet Nam 1995 Azerbaïdjan 1992Bangladesh 1985 Iran (République islamique d') 1985Bhoutan 1985 Kazakhstan 1992Inde 1985 Kirghizistan 1992Maldives 1985 Ouzbékistan 1992Népal 1985 Pakistan 1985Pakistan 1985 Tadjikistan 1992Sri Lanka 1985 Turkménistan 1992
Turquie 1985
Association européenne de Grèce 1981 Zone euro (12)libre-échange - AELE (3) Hongrie 2004 Allemagne 2002Islande 1960 Irlande 1973 Autriche 2002Norvège 1960 Italie 1957 Belgique 2002Suisse 1960 Lettonie 2004 Espagne 2002
Lituanie 2004 Finlande 2002Union européenne - UE (27) Luxembourg 1957 France 2002Allemagne 1957 Malte 2004 Grèce 2002Autriche 1995 Pays-Bas 1957 Irlande 2002Belgique 1957 Pologne 2004 Italie 2002Bulgarie 2008 Portugal 1986 Luxembourg 2002Chypre 2004 République tchèque 2004 Pays-Bas 2002Danemark 1973 Roumanie 2008 Portugal 2002Espagne 1986 Royaume-Uni 1973Estonie 2004 Slovaquie 2004Finlande 1995 Slovénie 2004
GROUPEMENTS COMMERCIAUX
Année d'adhésion Année d'adhésion
A m é r i q u e (f i n)
A s i e
Année d'adhésion
Année d'adhésion Année d'adhésion Année d'adhésion
Année d'adhésion Année d'adhésion Année d'adhésion
E u r o p e
xxxiii
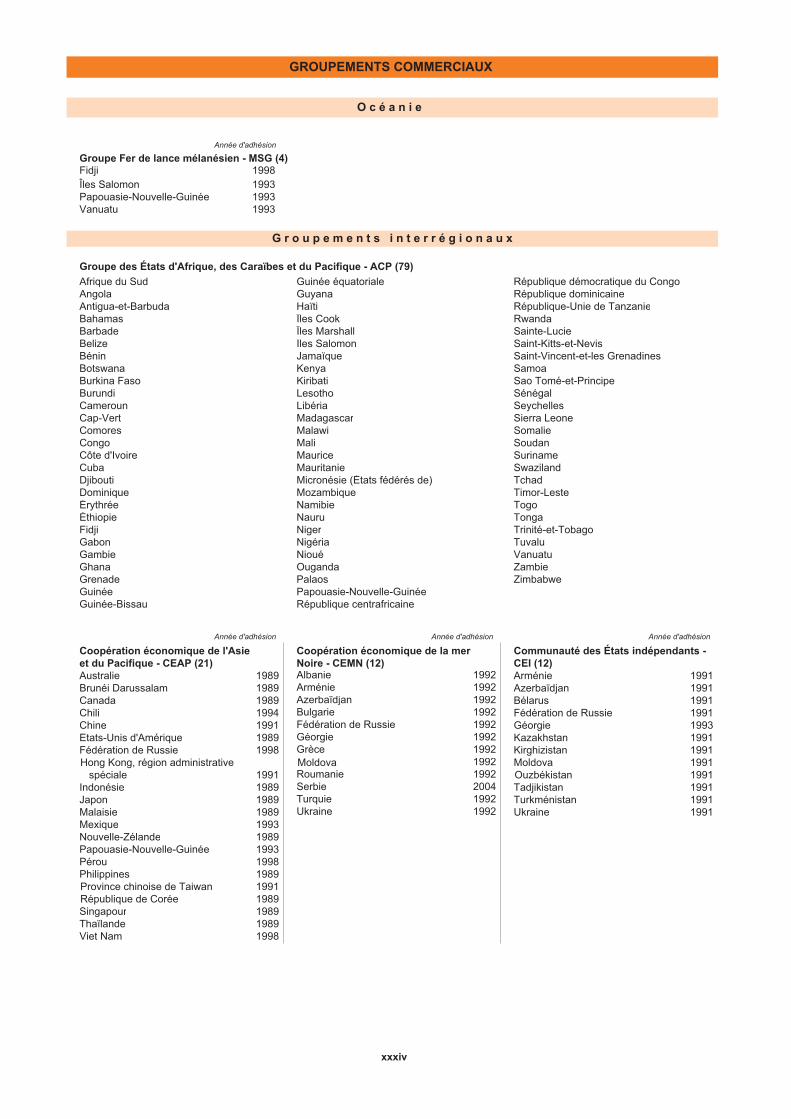
Groupe Fer de lance mélanésien - MSG (4)Fidji 1998Îles Salomon 1993Papouasie-Nouvelle-Guinée 1993Vanuatu 1993
Groupe des États d'Afrique, des Caraïbes et du Pacifique - ACP (79)
Afrique du Sud Guinée équatoriale République démocratique du CongoAngola Guyana République dominicaineAntigua-et-Barbuda Haïti République-Unie de TanzanieBahamas Îles Cook RwandaBarbade Îles Marshall Sainte-LucieBelize Îles Salomon Saint-Kitts-et-NevisBénin Jamaïque Saint-Vincent-et-les GrenadinesBotswana Kenya SamoaBurkina Faso Kiribati Sao Tomé-et-PrincipeBurundi Lesotho SénégalCameroun Libéria SeychellesCap-Vert Madagascar Sierra LeoneComores Malawi SomalieCongo Mali SoudanCôte d'Ivoire Maurice SurinameCuba Mauritanie SwazilandDjibouti Micronésie (États fédérés de) TchadDominique Mozambique Timor-LesteÉrythrée Namibie TogoÉthiopie Nauru TongaFidji Niger Trinité-et-TobagoGabon Nigéria TuvaluGambie Nioué VanuatuGhana Ouganda ZambieGrenade Palaos ZimbabweGuinée Papouasie-Nouvelle-GuinéeGuinée-Bissau République centrafricaine
Coopération économique de l'Asie Coopération économique de la mer Communauté des États indépendants - et du Pacifique - CEAP (21) Noire - CEMN (12) CEI (12) Australie 1989 Albanie 1992 Arménie 1991Brunéi Darussalam 1989 Arménie 1992 Azerbaïdjan 1991Canada 1989 Azerbaïdjan 1992 Bélarus 1991Chili 1994 Bulgarie 1992 Fédération de Russie 1991Chine 1991 Fédération de Russie 1992 Géorgie 1993États-Unis d'Amérique 1989 Géorgie 1992 Kazakhstan 1991Fédération de Russie 1998 Grèce 1992 Kirghizistan 1991
Hong Kong, région administrative Moldova 1992 Moldova 1991 spéciale 1991 Roumanie 1992 Ouzbékistan 1991
Indonésie 1989 Serbie 2004 Tadjikistan 1991Japon 1989 Turquie 1992 Turkménistan 1991Malaisie 1989 Ukraine 1992 Ukraine 1991Mexique 1993Nouvelle-Zélande 1989Papouasie-Nouvelle-Guinée 1993Pérou 1998Philippines 1989
Province chinoise de Taiwan 1991 République de Corée 1989
Singapour 1989Thaïlande 1989Viet Nam 1998
GROUPEMENTS COMMERCIAUX
Année d'adhésion
O c é a n i e
Année d'adhésion Année d'adhésion Année d'adhésion
G r o u p e m e n t s i n t e r r é g i o n a u x
xxxiv
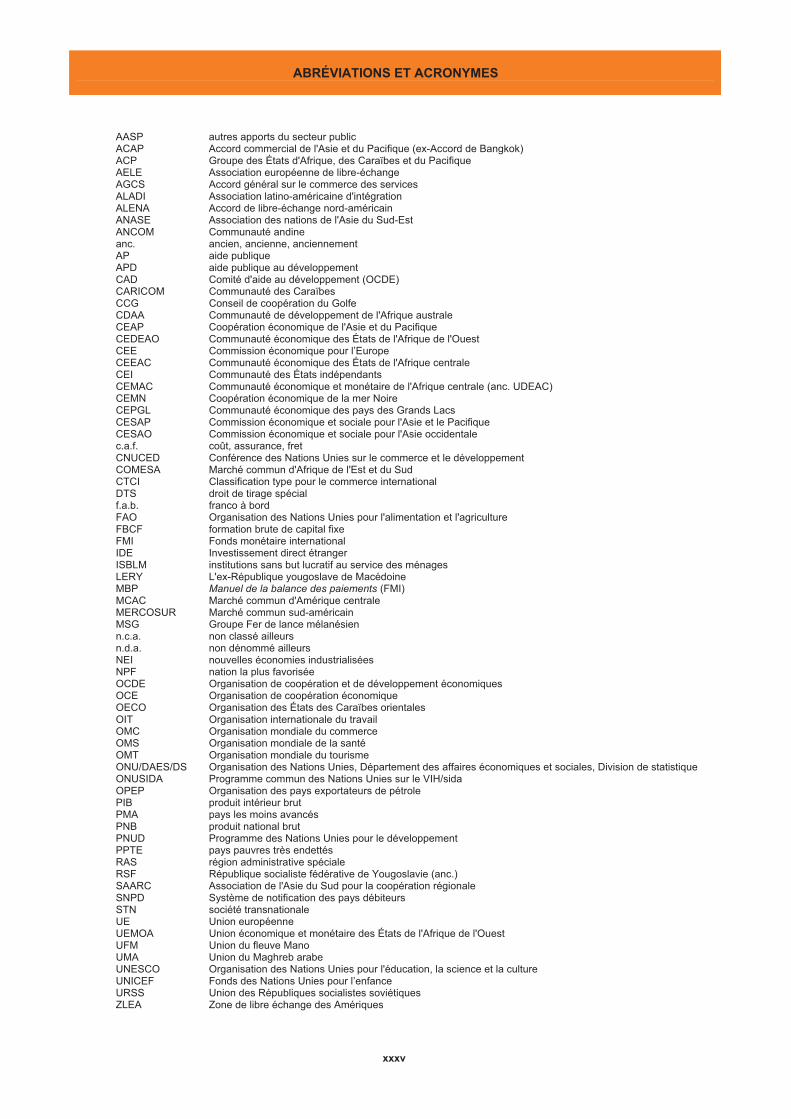
ABRÉVIATIONS ET ACRONYMES
AASP autres apports du secteur public ACAP Accord commercial de l'Asie et du Pacifique (ex-Accord de Bangkok) ACP Groupe des États d'Afrique, des Caraïbes et du Pacifique AELE Association européenne de libre-échange AGCS Accord général sur le commerce des services ALADI Association latino-américaine d'intégration ALENA Accord de libre-échange nord-américain ANASE Association des nations de l'Asie du Sud-Est ANCOM Communauté andine anc. ancien, ancienne, anciennement AP aide publiqueAPD aide publique au développement CAD Comité d'aide au développement (OCDE) CARICOM Communauté des Caraïbes CCG Conseil de coopération du Golfe CDAA Communauté de développement de l'Afrique australe CEAP Coopération économique de l'Asie et du Pacifique CEDEAO Communauté économique des États de l'Afrique de l'Ouest CEE Commission économique pour l’Europe CEEAC Communauté économique des États de l'Afrique centrale CEI Communauté des États indépendants CEMAC Communauté économique et monétaire de l'Afrique centrale (anc. UDEAC) CEMN Coopération économique de la mer Noire CEPGL Communauté économique des pays des Grands Lacs CESAP Commission économique et sociale pour l'Asie et le Pacifique CESAO Commission économique et sociale pour l'Asie occidentale c.a.f. coût, assurance, fret CNUCED Conférence des Nations Unies sur le commerce et le développementCOMESA Marché commun d'Afrique de l'Est et du Sud CTCI Classification type pour le commerce international DTS droit de tirage spécial f.a.b. franco à bord FAO Organisation des Nations Unies pour l'alimentation et l'agriculture FBCF formation brute de capital fixe FMI Fonds monétaire international IDE Investissement direct étranger ISBLM institutions sans but lucratif au service des ménages LERY L'ex-République yougoslave de Macédoine MBP Manuel de la balance des paiements (FMI) MCAC Marché commun d'Amérique centrale MERCOSUR Marché commun sud-américain MSG Groupe Fer de lance mélanésien n.c.a. non classé ailleurs n.d.a. non dénommé ailleursNEI nouvelles économies industrialisées NPF nation la plus favorisée OCDE Organisation de coopération et de développement économiques OCE Organisation de coopération économique OECO Organisation des États des Caraïbes orientales OIT Organisation internationale du travail OMC Organisation mondiale du commerce OMS Organisation mondiale de la santé OMT Organisation mondiale du tourisme ONU/DAES/DS Organisation des Nations Unies, Département des affaires économiques et sociales, Division de statistique ONUSIDA Programme commun des Nations Unies sur le VIH/sida OPEP Organisation des pays exportateurs de pétrole PIB produit intérieur brutPMA pays les moins avancés PNB produit national brut PNUD Programme des Nations Unies pour le développement PPTE pays pauvres très endettés RAS région administrative spéciale RSF République socialiste fédérative de Yougoslavie (anc.) SAARC Association de l'Asie du Sud pour la coopération régionale SNPD Système de notification des pays débiteurs STN société transnationaleUE Union européenne UEMOA Union économique et monétaire des États de l'Afrique de l'Ouest UFM Union du fleuve Mano UMA Union du Maghreb arabeUNESCO Organisation des Nations Unies pour l'éducation, la science et la culture UNICEF Fonds des Nations Unies pour l’enfance URSS Union des Républiques socialistes soviétiques ZLEA Zone de libre échange des Amériques
xxxv
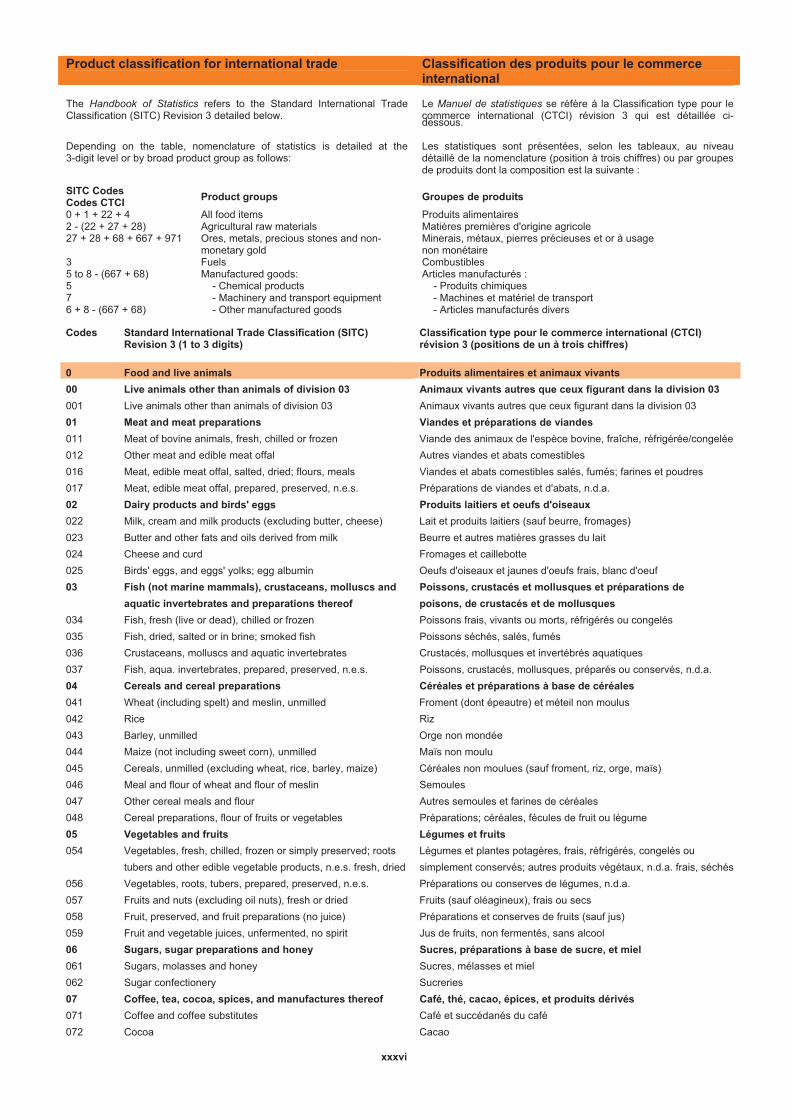
Product classification for international trade Classification des produits pour le commerce international
The Handbook of Statistics refers to the Standard International Trade Classification (SITC) Revision 3 detailed below.
Depending on the table, nomenclature of statistics is detailed at the 3-digit level or by broad product group as follows:
Le Manuel de statistiques se réfère à la Classification type pour le commerce international (CTCI) révision 3 qui est détaillée ci-dessous.
Les statistiques sont présentées, selon les tableaux, au niveau détaillé de la nomenclature (position à trois chiffres) ou par groupes de produits dont la composition est la suivante :
SITC Codes Codes CTCI
Product groups Groupes de produits
0 + 1 + 22 + 4 All food items Produits alimentaires 2 - (22 + 27 + 28) Agricultural raw materials Matières premières d'origine agricole 27 + 28 + 68 + 667 + 971 Ores, metals, precious stones and non-
monetary gold Minerais, métaux, pierres précieuses et or à usage non monétaire
3 Fuels Combustibles5 to 8 - (667 + 68) Manufactured goods: Articles manufacturés : 5 - Chemical products - Produits chimiques 7 - Machinery and transport equipment - Machines et matériel de transport 6 + 8 - (667 + 68) - Other manufactured goods - Articles manufacturés divers
Codes Standard International Trade Classification (SITC) Revision 3 (1 to 3 digits)
Classification type pour le commerce international (CTCI) révision 3 (positions de un à trois chiffres)
0 Food and live animals Produits alimentaires et animaux vivants
00 Live animals other than animals of division 03 Animaux vivants autres que ceux figurant dans la division 03
001 Live animals other than animals of division 03 Animaux vivants autres que ceux figurant dans la division 03
01 Meat and meat preparations Viandes et préparations de viandes
011 Meat of bovine animals, fresh, chilled or frozen Viande des animaux de l'espèce bovine, fraîche, réfrigérée/congelée
012 Other meat and edible meat offal Autres viandes et abats comestibles
016 Meat, edible meat offal, salted, dried; flours, meals Viandes et abats comestibles salés, fumés; farines et poudres
017 Meat, edible meat offal, prepared, preserved, n.e.s. Préparations de viandes et d'abats, n.d.a.
02 Dairy products and birds' eggs Produits laitiers et oeufs d'oiseaux
022 Milk, cream and milk products (excluding butter, cheese) Lait et produits laitiers (sauf beurre, fromages)
023 Butter and other fats and oils derived from milk Beurre et autres matières grasses du lait
024 Cheese and curd Fromages et caillebotte
025 Birds' eggs, and eggs' yolks; egg albumin Oeufs d'oiseaux et jaunes d'oeufs frais, blanc d'oeuf
03 Fish (not marine mammals), crustaceans, molluscs and Poissons, crustacés et mollusques et préparations de
aquatic invertebrates and preparations thereof poisons, de crustacés et de mollusques
034 Fish, fresh (live or dead), chilled or frozen Poissons frais, vivants ou morts, réfrigérés ou congelés
035 Fish, dried, salted or in brine; smoked fish Poissons séchés, salés, fumés
036 Crustaceans, molluscs and aquatic invertebrates Crustacés, mollusques et invertébrés aquatiques
037 Fish, aqua. invertebrates, prepared, preserved, n.e.s. Poissons, crustacés, mollusques, préparés ou conservés, n.d.a.
04 Cereals and cereal preparations Céréales et préparations à base de céréales
041 Wheat (including spelt) and meslin, unmilled Froment (dont épeautre) et méteil non moulus
042 Rice Riz
043 Barley, unmilled Orge non mondée
044 Maize (not including sweet corn), unmilled Maïs non moulu
045 Cereals, unmilled (excluding wheat, rice, barley, maize) Céréales non moulues (sauf froment, riz, orge, maïs)
046 Meal and flour of wheat and flour of meslin Semoules
047 Other cereal meals and flour Autres semoules et farines de céréales
048 Cereal preparations, flour of fruits or vegetables Préparations; céréales, fécules de fruit ou légume
05 Vegetables and fruits Légumes et fruits
054 Vegetables, fresh, chilled, frozen or simply preserved; roots Légumes et plantes potagères, frais, réfrigérés, congelés ou
tubers and other edible vegetable products, n.e.s. fresh, dried simplement conservés; autres produits végétaux, n.d.a. frais, séchés
056 Vegetables, roots, tubers, prepared, preserved, n.e.s. Préparations ou conserves de légumes, n.d.a.
057 Fruits and nuts (excluding oil nuts), fresh or dried Fruits (sauf oléagineux), frais ou secs
058 Fruit, preserved, and fruit preparations (no juice) Préparations et conserves de fruits (sauf jus)
059 Fruit and vegetable juices, unfermented, no spirit Jus de fruits, non fermentés, sans alcool
06 Sugars, sugar preparations and honey Sucres, préparations à base de sucre, et miel
061 Sugars, molasses and honey Sucres, mélasses et miel
062 Sugar confectionery Sucreries
07 Coffee, tea, cocoa, spices, and manufactures thereof Café, thé, cacao, épices, et produits dérivés
071 Coffee and coffee substitutes Café et succédanés du café
072 Cocoa Cacao
xxxvi
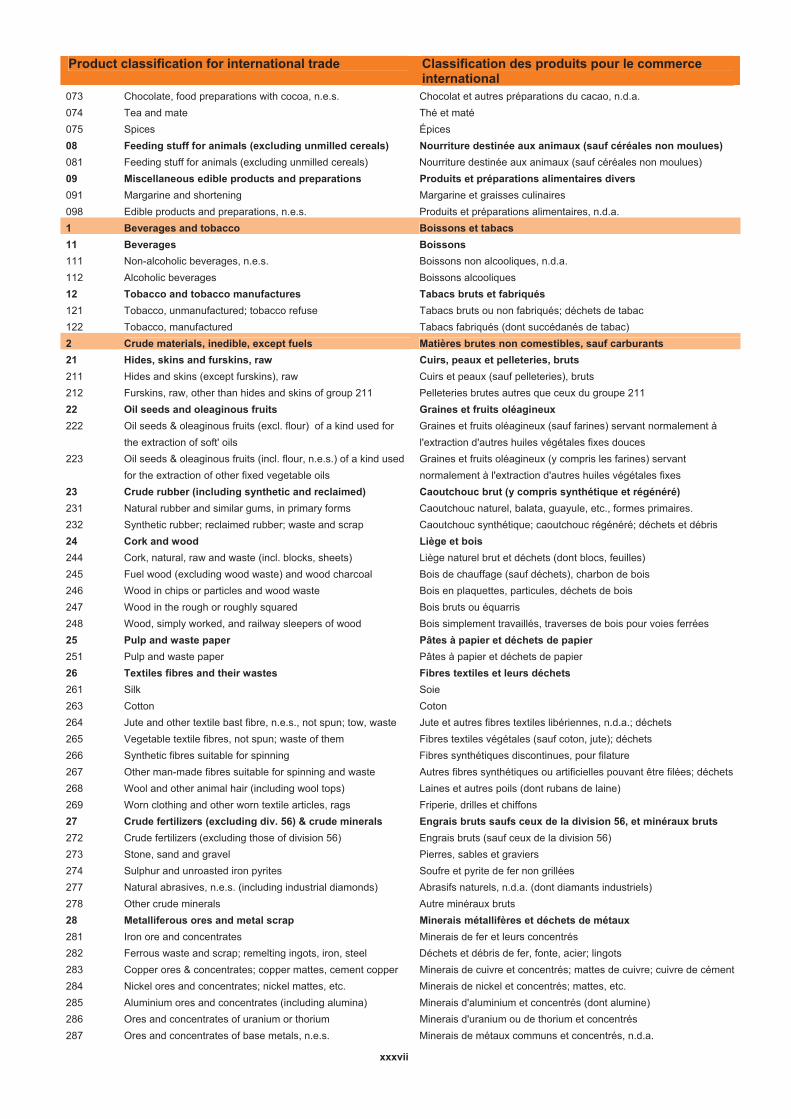
Product classification for international trade Classification des produits pour le commerce international
073 Chocolate, food preparations with cocoa, n.e.s. Chocolat et autres préparations du cacao, n.d.a.
074 Tea and mate Thé et maté
075 Spices Épices
08 Feeding stuff for animals (excluding unmilled cereals) Nourriture destinée aux animaux (sauf céréales non moulues)
081 Feeding stuff for animals (excluding unmilled cereals) Nourriture destinée aux animaux (sauf céréales non moulues)
09 Miscellaneous edible products and preparations Produits et préparations alimentaires divers
091 Margarine and shortening Margarine et graisses culinaires
098 Edible products and preparations, n.e.s. Produits et préparations alimentaires, n.d.a.
1 Beverages and tobacco Boissons et tabacs
11 Beverages Boissons
111 Non-alcoholic beverages, n.e.s. Boissons non alcooliques, n.d.a.
112 Alcoholic beverages Boissons alcooliques
12 Tobacco and tobacco manufactures Tabacs bruts et fabriqués
121 Tobacco, unmanufactured; tobacco refuse Tabacs bruts ou non fabriqués; déchets de tabac
122 Tobacco, manufactured Tabacs fabriqués (dont succédanés de tabac)
2 Crude materials, inedible, except fuels Matières brutes non comestibles, sauf carburants
21 Hides, skins and furskins, raw Cuirs, peaux et pelleteries, bruts
211 Hides and skins (except furskins), raw Cuirs et peaux (sauf pelleteries), bruts
212 Furskins, raw, other than hides and skins of group 211 Pelleteries brutes autres que ceux du groupe 211
22 Oil seeds and oleaginous fruits Graines et fruits oléagineux
222 Oil seeds & oleaginous fruits (excl. flour) of a kind used for Graines et fruits oléagineux (sauf farines) servant normalement à
the extraction of soft' oils l'extraction d'autres huiles végétales fixes douces
223 Oil seeds & oleaginous fruits (incl. flour, n.e.s.) of a kind used Graines et fruits oléagineux (y compris les farines) servant
for the extraction of other fixed vegetable oils normalement à l'extraction d'autres huiles végétales fixes
23 Crude rubber (including synthetic and reclaimed) Caoutchouc brut (y compris synthétique et régénéré)
231 Natural rubber and similar gums, in primary forms Caoutchouc naturel, balata, guayule, etc., formes primaires.
232 Synthetic rubber; reclaimed rubber; waste and scrap Caoutchouc synthétique; caoutchouc régénéré; déchets et débris
24 Cork and wood Liège et bois
244 Cork, natural, raw and waste (incl. blocks, sheets) Liège naturel brut et déchets (dont blocs, feuilles)
245 Fuel wood (excluding wood waste) and wood charcoal Bois de chauffage (sauf déchets), charbon de bois
246 Wood in chips or particles and wood waste Bois en plaquettes, particules, déchets de bois
247 Wood in the rough or roughly squared Bois bruts ou équarris
248 Wood, simply worked, and railway sleepers of wood Bois simplement travaillés, traverses de bois pour voies ferrées
25 Pulp and waste paper Pâtes à papier et déchets de papier
251 Pulp and waste paper Pâtes à papier et déchets de papier
26 Textiles fibres and their wastes Fibres textiles et leurs déchets
261 Silk Soie
263 Cotton Coton
264 Jute and other textile bast fibre, n.e.s., not spun; tow, waste Jute et autres fibres textiles libériennes, n.d.a.; déchets
265 Vegetable textile fibres, not spun; waste of them Fibres textiles végétales (sauf coton, jute); déchets
266 Synthetic fibres suitable for spinning Fibres synthétiques discontinues, pour filature
267 Other man-made fibres suitable for spinning and waste Autres fibres synthétiques ou artificielles pouvant être filées; déchets
268 Wool and other animal hair (including wool tops) Laines et autres poils (dont rubans de laine)
269 Worn clothing and other worn textile articles, rags Friperie, drilles et chiffons
27 Crude fertilizers (excluding div. 56) & crude minerals Engrais bruts saufs ceux de la division 56, et minéraux bruts
272 Crude fertilizers (excluding those of division 56) Engrais bruts (sauf ceux de la division 56)
273 Stone, sand and gravel Pierres, sables et graviers
274 Sulphur and unroasted iron pyrites Soufre et pyrite de fer non grillées
277 Natural abrasives, n.e.s. (including industrial diamonds) Abrasifs naturels, n.d.a. (dont diamants industriels)
278 Other crude minerals Autre minéraux bruts
28 Metalliferous ores and metal scrap Minerais métallifères et déchets de métaux
281 Iron ore and concentrates Minerais de fer et leurs concentrés
282 Ferrous waste and scrap; remelting ingots, iron, steel Déchets et débris de fer, fonte, acier; lingots
283 Copper ores & concentrates; copper mattes, cement copper Minerais de cuivre et concentrés; mattes de cuivre; cuivre de cément
284 Nickel ores and concentrates; nickel mattes, etc. Minerais de nickel et concentrés; mattes, etc.
285 Aluminium ores and concentrates (including alumina) Minerais d'aluminium et concentrés (dont alumine)
286 Ores and concentrates of uranium or thorium Minerais d'uranium ou de thorium et concentrés
287 Ores and concentrates of base metals, n.e.s. Minerais de métaux communs et concentrés, n.d.a.
xxxvii
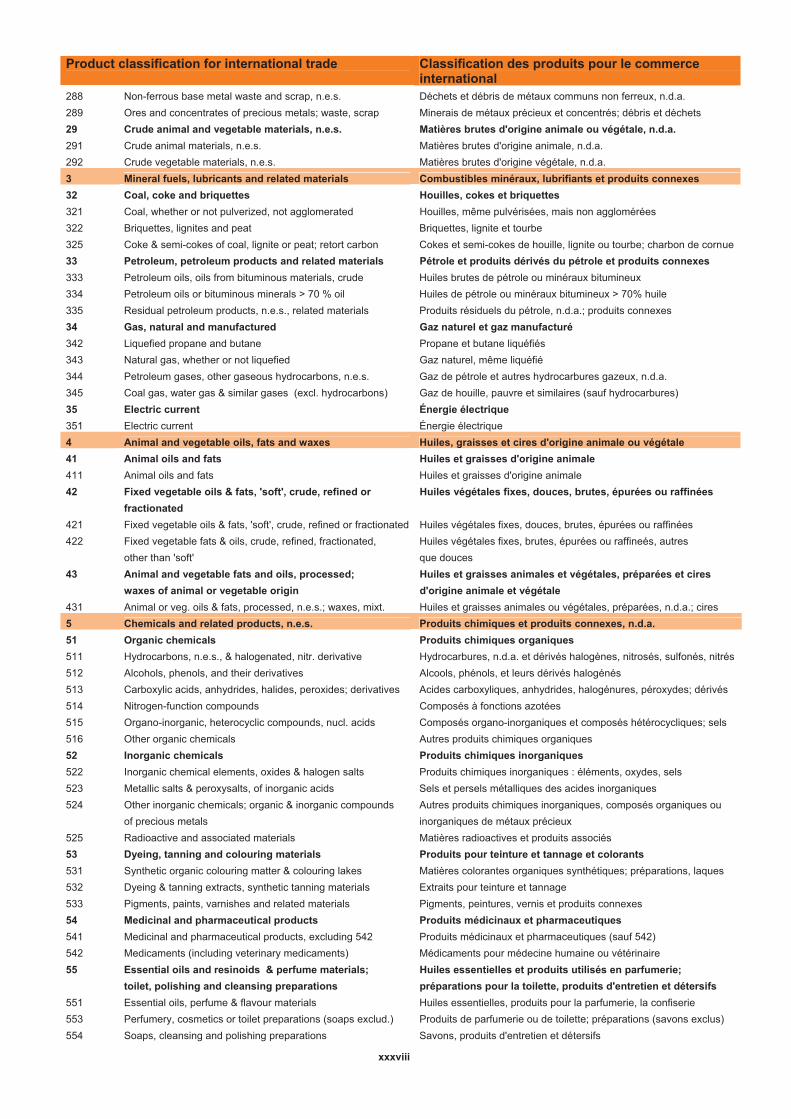
Product classification for international trade Classification des produits pour le commerce international
288 Non-ferrous base metal waste and scrap, n.e.s. Déchets et débris de métaux communs non ferreux, n.d.a.
289 Ores and concentrates of precious metals; waste, scrap Minerais de métaux précieux et concentrés; débris et déchets
29 Crude animal and vegetable materials, n.e.s. Matières brutes d'origine animale ou végétale, n.d.a.
291 Crude animal materials, n.e.s. Matières brutes d'origine animale, n.d.a.
292 Crude vegetable materials, n.e.s. Matières brutes d'origine végétale, n.d.a.
3 Mineral fuels, lubricants and related materials Combustibles minéraux, lubrifiants et produits connexes
32 Coal, coke and briquettes Houilles, cokes et briquettes
321 Coal, whether or not pulverized, not agglomerated Houilles, même pulvérisées, mais non agglomérées
322 Briquettes, lignites and peat Briquettes, lignite et tourbe
325 Coke & semi-cokes of coal, lignite or peat; retort carbon Cokes et semi-cokes de houille, lignite ou tourbe; charbon de cornue
33 Petroleum, petroleum products and related materials Pétrole et produits dérivés du pétrole et produits connexes
333 Petroleum oils, oils from bituminous materials, crude Huiles brutes de pétrole ou minéraux bitumineux
334 Petroleum oils or bituminous minerals > 70 % oil Huiles de pétrole ou minéraux bitumineux > 70% huile
335 Residual petroleum products, n.e.s., related materials Produits résiduels du pétrole, n.d.a.; produits connexes
34 Gas, natural and manufactured Gaz naturel et gaz manufacturé
342 Liquefied propane and butane Propane et butane liquéfiés
343 Natural gas, whether or not liquefied Gaz naturel, même liquéfié
344 Petroleum gases, other gaseous hydrocarbons, n.e.s. Gaz de pétrole et autres hydrocarbures gazeux, n.d.a.
345 Coal gas, water gas & similar gases (excl. hydrocarbons) Gaz de houille, pauvre et similaires (sauf hydrocarbures)
35 Electric current Énergie électrique
351 Electric current Énergie électrique
4 Animal and vegetable oils, fats and waxes Huiles, graisses et cires d'origine animale ou végétale
41 Animal oils and fats Huiles et graisses d'origine animale
411 Animal oils and fats Huiles et graisses d'origine animale
42 Fixed vegetable oils & fats, 'soft', crude, refined or Huiles végétales fixes, douces, brutes, épurées ou raffinées
fractionated
421 Fixed vegetable oils & fats, 'soft', crude, refined or fractionated Huiles végétales fixes, douces, brutes, épurées ou raffinées
422 Fixed vegetable fats & oils, crude, refined, fractionated, Huiles végétales fixes, brutes, épurées ou raffineés, autres
other than 'soft' que douces
43 Animal and vegetable fats and oils, processed; Huiles et graisses animales et végétales, préparées et cires
waxes of animal or vegetable origin d'origine animale et végétale
431 Animal or veg. oils & fats, processed, n.e.s.; waxes, mixt. Huiles et graisses animales ou végétales, préparées, n.d.a.; cires
5 Chemicals and related products, n.e.s. Produits chimiques et produits connexes, n.d.a.
51 Organic chemicals Produits chimiques organiques
511 Hydrocarbons, n.e.s., & halogenated, nitr. derivative Hydrocarbures, n.d.a. et dérivés halogènes, nitrosés, sulfonés, nitrés
512 Alcohols, phenols, and their derivatives Alcools, phénols, et leurs dérivés halogénés
513 Carboxylic acids, anhydrides, halides, peroxides; derivatives Acides carboxyliques, anhydrides, halogénures, péroxydes; dérivés
514 Nitrogen-function compounds Composés à fonctions azotées
515 Organo-inorganic, heterocyclic compounds, nucl. acids Composés organo-inorganiques et composés hétérocycliques; sels
516 Other organic chemicals Autres produits chimiques organiques
52 Inorganic chemicals Produits chimiques inorganiques
522 Inorganic chemical elements, oxides & halogen salts Produits chimiques inorganiques : éléments, oxydes, sels
523 Metallic salts & peroxysalts, of inorganic acids Sels et persels métalliques des acides inorganiques
524 Other inorganic chemicals; organic & inorganic compounds Autres produits chimiques inorganiques, composés organiques ou
of precious metals inorganiques de métaux précieux
525 Radioactive and associated materials Matières radioactives et produits associés
53 Dyeing, tanning and colouring materials Produits pour teinture et tannage et colorants
531 Synthetic organic colouring matter & colouring lakes Matières colorantes organiques synthétiques; préparations, laques
532 Dyeing & tanning extracts, synthetic tanning materials Extraits pour teinture et tannage
533 Pigments, paints, varnishes and related materials Pigments, peintures, vernis et produits connexes
54 Medicinal and pharmaceutical products Produits médicinaux et pharmaceutiques
541 Medicinal and pharmaceutical products, excluding 542 Produits médicinaux et pharmaceutiques (sauf 542)
542 Medicaments (including veterinary medicaments) Médicaments pour médecine humaine ou vétérinaire
55 Essential oils and resinoids & perfume materials; Huiles essentielles et produits utilisés en parfumerie;
toilet, polishing and cleansing preparations préparations pour la toilette, produits d'entretien et détersifs
551 Essential oils, perfume & flavour materials Huiles essentielles, produits pour la parfumerie, la confiserie
553 Perfumery, cosmetics or toilet preparations (soaps exclud.) Produits de parfumerie ou de toilette; préparations (savons exclus)
554 Soaps, cleansing and polishing preparations Savons, produits d'entretien et détersifs
xxxviii
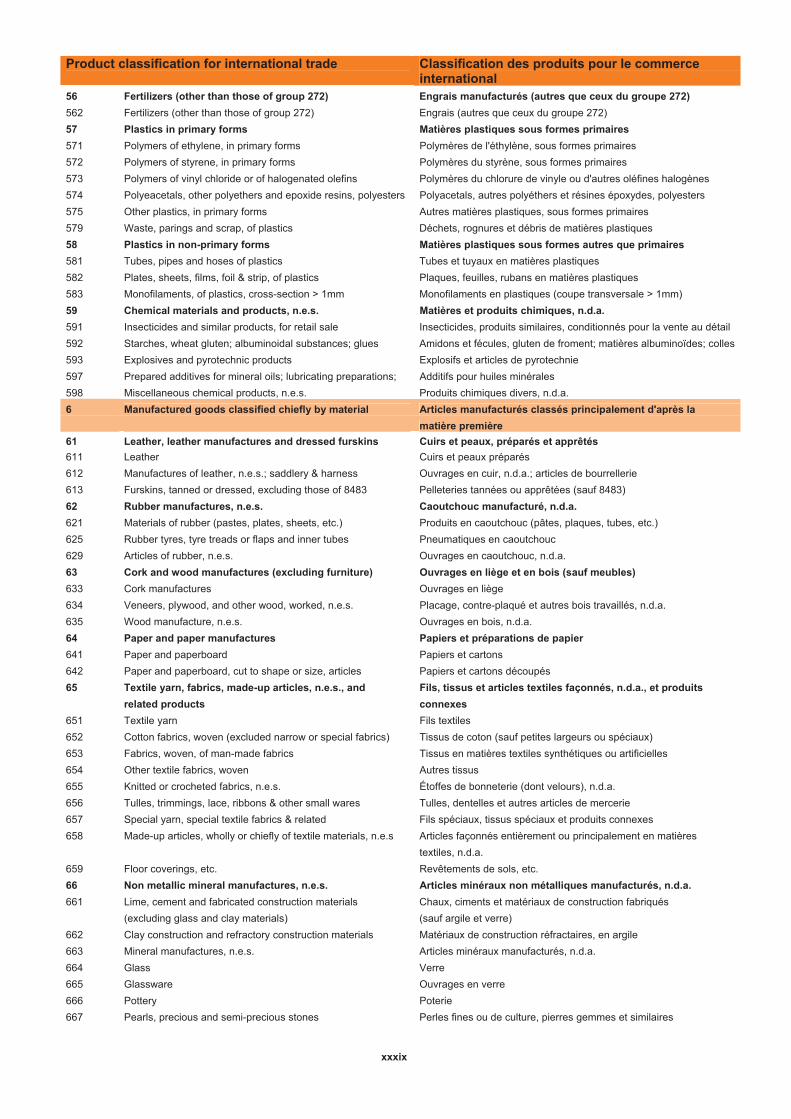
Product classification for international trade Classification des produits pour le commerce international
56 Fertilizers (other than those of group 272) Engrais manufacturés (autres que ceux du groupe 272)
562 Fertilizers (other than those of group 272) Engrais (autres que ceux du groupe 272)
57 Plastics in primary forms Matières plastiques sous formes primaires
571 Polymers of ethylene, in primary forms Polymères de l'éthylène, sous formes primaires
572 Polymers of styrene, in primary forms Polymères du styrène, sous formes primaires
573 Polymers of vinyl chloride or of halogenated olefins Polymères du chlorure de vinyle ou d'autres oléfines halogènes
574 Polyeacetals, other polyethers and epoxide resins, polyesters Polyacetals, autres polyéthers et résines époxydes, polyesters
575 Other plastics, in primary forms Autres matières plastiques, sous formes primaires
579 Waste, parings and scrap, of plastics Déchets, rognures et débris de matières plastiques
58 Plastics in non-primary forms Matières plastiques sous formes autres que primaires
581 Tubes, pipes and hoses of plastics Tubes et tuyaux en matières plastiques
582 Plates, sheets, films, foil & strip, of plastics Plaques, feuilles, rubans en matières plastiques
583 Monofilaments, of plastics, cross-section > 1mm Monofilaments en plastiques (coupe transversale > 1mm)
59 Chemical materials and products, n.e.s. Matières et produits chimiques, n.d.a.
591 Insecticides and similar products, for retail sale Insecticides, produits similaires, conditionnés pour la vente au détail
592 Starches, wheat gluten; albuminoidal substances; glues Amidons et fécules, gluten de froment; matières albuminoïdes; colles
593 Explosives and pyrotechnic products Explosifs et articles de pyrotechnie
597 Prepared additives for mineral oils; lubricating preparations; Additifs pour huiles minérales
598 Miscellaneous chemical products, n.e.s. Produits chimiques divers, n.d.a.
6 Manufactured goods classified chiefly by material Articles manufacturés classés principalement d'après la
matière première
61 Leather, leather manufactures and dressed furskins Cuirs et peaux, préparés et apprêtés
611 Leather Cuirs et peaux préparés
612 Manufactures of leather, n.e.s.; saddlery & harness Ouvrages en cuir, n.d.a.; articles de bourrellerie
613 Furskins, tanned or dressed, excluding those of 8483 Pelleteries tannées ou apprêtées (sauf 8483)
62 Rubber manufactures, n.e.s. Caoutchouc manufacturé, n.d.a.
621 Materials of rubber (pastes, plates, sheets, etc.) Produits en caoutchouc (pâtes, plaques, tubes, etc.)
625 Rubber tyres, tyre treads or flaps and inner tubes Pneumatiques en caoutchouc
629 Articles of rubber, n.e.s. Ouvrages en caoutchouc, n.d.a.
63 Cork and wood manufactures (excluding furniture) Ouvrages en liège et en bois (sauf meubles)
633 Cork manufactures Ouvrages en liège
634 Veneers, plywood, and other wood, worked, n.e.s. Placage, contre-plaqué et autres bois travaillés, n.d.a.
635 Wood manufacture, n.e.s. Ouvrages en bois, n.d.a.
64 Paper and paper manufactures Papiers et préparations de papier
641 Paper and paperboard Papiers et cartons
642 Paper and paperboard, cut to shape or size, articles Papiers et cartons découpés
65 Textile yarn, fabrics, made-up articles, n.e.s., and Fils, tissus et articles textiles façonnés, n.d.a., et produits
related products connexes
651 Textile yarn Fils textiles
652 Cotton fabrics, woven (excluded narrow or special fabrics) Tissus de coton (sauf petites largeurs ou spéciaux)
653 Fabrics, woven, of man-made fabrics Tissus en matières textiles synthétiques ou artificielles
654 Other textile fabrics, woven Autres tissus
655 Knitted or crocheted fabrics, n.e.s. Étoffes de bonneterie (dont velours), n.d.a.
656 Tulles, trimmings, lace, ribbons & other small wares Tulles, dentelles et autres articles de mercerie
657 Special yarn, special textile fabrics & related Fils spéciaux, tissus spéciaux et produits connexes
658 Made-up articles, wholly or chiefly of textile materials, n.e.s Articles façonnés entièrement ou principalement en matières
textiles, n.d.a.
659 Floor coverings, etc. Revêtements de sols, etc.
66 Non metallic mineral manufactures, n.e.s. Articles minéraux non métalliques manufacturés, n.d.a.
661 Lime, cement and fabricated construction materials Chaux, ciments et matériaux de construction fabriqués
(excluding glass and clay materials) (sauf argile et verre)
662 Clay construction and refractory construction materials Matériaux de construction réfractaires, en argile
663 Mineral manufactures, n.e.s. Articles minéraux manufacturés, n.d.a.
664 Glass Verre
665 Glassware Ouvrages en verre
666 Pottery Poterie
667 Pearls, precious and semi-precious stones Perles fines ou de culture, pierres gemmes et similaires
xxxix
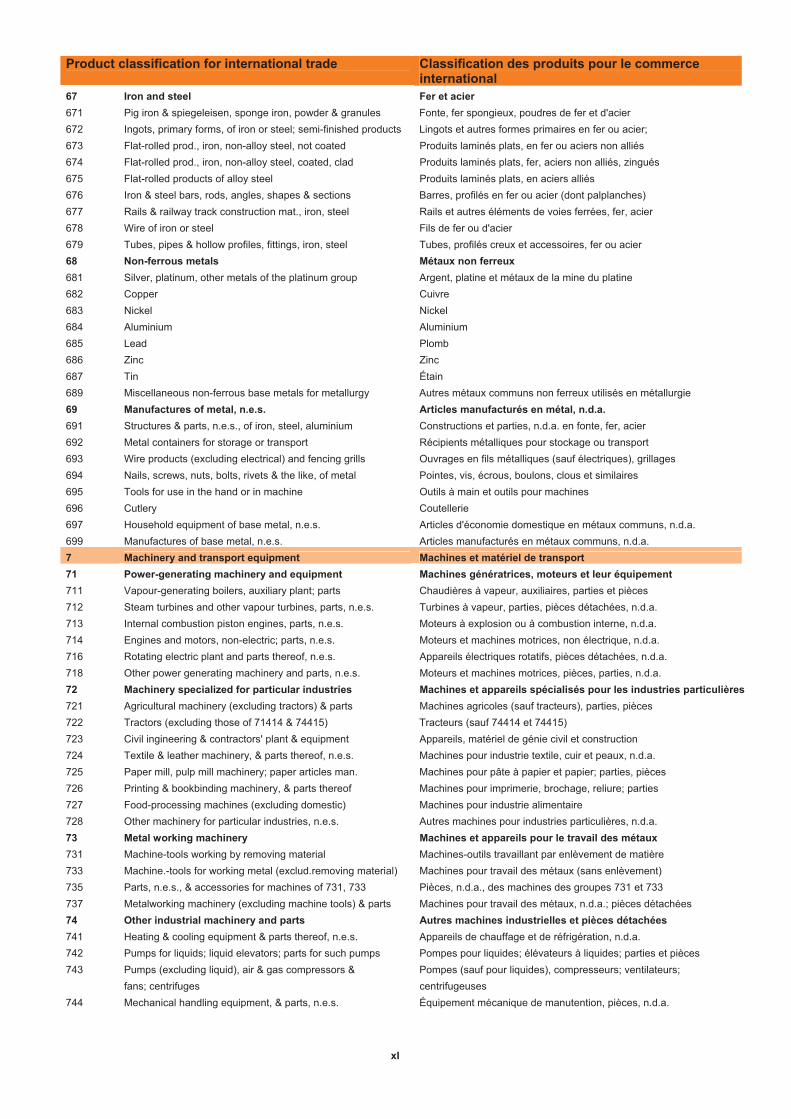
Product classification for international trade Classification des produits pour le commerce international
67 Iron and steel Fer et acier
671 Pig iron & spiegeleisen, sponge iron, powder & granules Fonte, fer spongieux, poudres de fer et d'acier
672 Ingots, primary forms, of iron or steel; semi-finished products Lingots et autres formes primaires en fer ou acier;
673 Flat-rolled prod., iron, non-alloy steel, not coated Produits laminés plats, en fer ou aciers non alliés
674 Flat-rolled prod., iron, non-alloy steel, coated, clad Produits laminés plats, fer, aciers non alliés, zingués
675 Flat-rolled products of alloy steel Produits laminés plats, en aciers alliés
676 Iron & steel bars, rods, angles, shapes & sections Barres, profilés en fer ou acier (dont palplanches)
677 Rails & railway track construction mat., iron, steel Rails et autres éléments de voies ferrées, fer, acier
678 Wire of iron or steel Fils de fer ou d'acier
679 Tubes, pipes & hollow profiles, fittings, iron, steel Tubes, profilés creux et accessoires, fer ou acier
68 Non-ferrous metals Métaux non ferreux
681 Silver, platinum, other metals of the platinum group Argent, platine et métaux de la mine du platine
682 Copper Cuivre
683 Nickel Nickel
684 Aluminium Aluminium
685 Lead Plomb
686 Zinc Zinc
687 Tin Étain
689 Miscellaneous non-ferrous base metals for metallurgy Autres métaux communs non ferreux utilisés en métallurgie
69 Manufactures of metal, n.e.s. Articles manufacturés en métal, n.d.a.
691 Structures & parts, n.e.s., of iron, steel, aluminium Constructions et parties, n.d.a. en fonte, fer, acier
692 Metal containers for storage or transport Récipients métalliques pour stockage ou transport
693 Wire products (excluding electrical) and fencing grills Ouvrages en fils métalliques (sauf électriques), grillages
694 Nails, screws, nuts, bolts, rivets & the like, of metal Pointes, vis, écrous, boulons, clous et similaires
695 Tools for use in the hand or in machine Outils à main et outils pour machines
696 Cutlery Coutellerie
697 Household equipment of base metal, n.e.s. Articles d'économie domestique en métaux communs, n.d.a.
699 Manufactures of base metal, n.e.s. Articles manufacturés en métaux communs, n.d.a.
7 Machinery and transport equipment Machines et matériel de transport
71 Power-generating machinery and equipment Machines génératrices, moteurs et leur équipement
711 Vapour-generating boilers, auxiliary plant; parts Chaudières à vapeur, auxiliaires, parties et pièces
712 Steam turbines and other vapour turbines, parts, n.e.s. Turbines à vapeur, parties, pièces détachées, n.d.a.
713 Internal combustion piston engines, parts, n.e.s. Moteurs à explosion ou à combustion interne, n.d.a.
714 Engines and motors, non-electric; parts, n.e.s. Moteurs et machines motrices, non électrique, n.d.a.
716 Rotating electric plant and parts thereof, n.e.s. Appareils électriques rotatifs, pièces détachées, n.d.a.
718 Other power generating machinery and parts, n.e.s. Moteurs et machines motrices, pièces, parties, n.d.a.
72 Machinery specialized for particular industries Machines et appareils spécialisés pour les industries particulières
721 Agricultural machinery (excluding tractors) & parts Machines agricoles (sauf tracteurs), parties, pièces
722 Tractors (excluding those of 71414 & 74415) Tracteurs (sauf 74414 et 74415)
723 Civil ingineering & contractors' plant & equipment Appareils, matériel de génie civil et construction
724 Textile & leather machinery, & parts thereof, n.e.s. Machines pour industrie textile, cuir et peaux, n.d.a.
725 Paper mill, pulp mill machinery; paper articles man. Machines pour pâte à papier et papier; parties, pièces
726 Printing & bookbinding machinery, & parts thereof Machines pour imprimerie, brochage, reliure; parties
727 Food-processing machines (excluding domestic) Machines pour industrie alimentaire
728 Other machinery for particular industries, n.e.s. Autres machines pour industries particulières, n.d.a.
73 Metal working machinery Machines et appareils pour le travail des métaux
731 Machine-tools working by removing material Machines-outils travaillant par enlèvement de matière
733 Machine.-tools for working metal (exclud.removing material) Machines pour travail des métaux (sans enlèvement)
735 Parts, n.e.s., & accessories for machines of 731, 733 Pièces, n.d.a., des machines des groupes 731 et 733
737 Metalworking machinery (excluding machine tools) & parts Machines pour travail des métaux, n.d.a.; pièces détachées
74 Other industrial machinery and parts Autres machines industrielles et pièces détachées
741 Heating & cooling equipment & parts thereof, n.e.s. Appareils de chauffage et de réfrigération, n.d.a.
742 Pumps for liquids; liquid elevators; parts for such pumps Pompes pour liquides; élévateurs à liquides; parties et pièces
743 Pumps (excluding liquid), air & gas compressors & Pompes (sauf pour liquides), compresseurs; ventilateurs;
fans; centrifuges centrifugeuses
744 Mechanical handling equipment, & parts, n.e.s. Équipement mécanique de manutention, pièces, n.d.a.
xI

Product classification for international trade Classification des produits pour le commerce international
745 Other non-electrical machinery, tools and mechanical Appareils et outils non électriques, pièces, n.d.a.
apparatus, and parts thereof
746 Ball or roller bearings Roulements à billes, galets, rouleaux ou aiguilles
747 Appliances for pipes, boiler shells, tanks, vats, etc. Articles de robinetterie, tuyauterie et similaires
748 Transmission shafts and cranks; bearings housings; gears Arbres de transmission et manivelles; engrenages et roues de
and gearing; flywheels and pulleys; clutches, shaft couplings friction; volants et poulies; embrayages, organes d'accouplement
749 Non-electric parts & accessories. of machinery, n.e.s. Parties, non électriques d'appareils mécaniques, n.d.a.
75 Office machines and automatic data processing Machines et appareils de bureau ou pour le traitement
machines automatique de l'information
751 Office machines Machines et appareils de bureau
752 Automatic data processing machines, n.e.s. Machines automatiques de traitement de l'information, n.d.a.
759 Parts, accessories for machines of groups 751, 752 Parties et pièces détachées pour groupes 751, 752
76 Telecommunications and sound recording apparatus Appareils et équipements de télécommunications et pour
and reproducing apparatus and equipment l'enregistrement et la reproduction du son
761 Television receivers, whether or not combined Téléviseurs, même combinés à d'autres appareils
762 Radio-broadcast receivers, whether or not combined Appareils de radiodiffusion, même combinés à d'autres appareils
763 Sound recorders or reproducers; television image and sound Appareils d'enregistrement ou de reproduction du son; appareils
recorders or reproducers, prepared unrecorded media d'enregistrement ou de reproduction de l'image et du son en télévision
764 Telecommunication equipment, n.e.s.; & parts, n.e.s. Équipements de télécommunication, n.d.a. et parties
77 Electrical machinery, apparatus and appliances, n.e.s. Machines et appareils électriques, n.d.a.
771 Electric power machinery, and parts thereof Appareils pour production, transformation de l'énergie
772 Apparatus for electrical circuits; switchboard, control panels Appareils pour circuits électriques; tableaux de commande et parties
773 Equipment for distributing electricity, n.e.s. Équipement pour distribution d'électricité, n.d.a.
774 Electro-diagnostic apparatus for medical or veterinary Appareils d'électrodiagnostic à usage médical ou vétérinaire et
sciences and radiological apparatus Appareils de radiologie
775 Household type equipment, electrical or not, n.e.s. Machines et appareils, à usage domestique, n.d.a.
776 Thermionic, cold cathode or photo-cathode valves & tubes; Lampes, tubes, valves électroniques à cathode chaude, froide ou à
diodes, transistors and similar; photocathode; diodes, transistors et dispositifs similaires
778 Electrical machinery & apparatus, n.e.s. Machines et appareils électriques, n.d.a.
78 Road vehicles Véhicules routiers
781 Motor vehicles for the transport of persons Véhicules automobiles pour transport de personnes
782 Motor vehicles for the transport of goods and special Véhicules automobiles pour le transport de marchandises et pour
purposes usages spéciaux
783 Road motor vehicles, n.e.s. Véhicules routiers, n.d.a.
784 Parts & accessories of vehicles of 722, 781, 782, 783 Parties, pièces détachées des groupes 722, 781, 782, 783
785 Motorcycles and cycles, motorized or not; invalid carriages Motocycles et cycles, avec ou sans moteur; fauteuils roulants
786 Trailers and semi-trailers; other vehicles, not mechanically Remorques et semi-remorques; autres véhicules non automobiles;
propelled; specially designed & equiped transport containers cadres et conteneurs conçus et équipés pour le transport
79 Other transport equipment Autres matériels de transport
791 Railway vehicles and associated equipment Véhicules et matériel pour chemin de fer
792 Aircraft and associated equipment; spacecraft and Aéronefs et matériels connexes; véhicules spatiaux et leurs
spacecraft launch vehicles, parts thereof véhicules lanceurs; leurs parties et pièces détachées
793 Ships, boats and floating structures Navires, bateaux et engins flottants
8 Miscellaneous manufactured articles Articles manufacturés divers
81 Prefabricated buildings, sanitary, heating and lighting Constructions préfabriquées, appareils sanitaires de
fixtures, n.e.s. chauffage et d'éclairage, n.d.a.
811 Prefabricated buildings Constructions préfabriquées
812 Sanitary, plumbing, heating fixtures, fittings, n.e.s. Appareils sanitaires, plomberie, chauffage, n.d.a.
813 Lighting fixtures and fittings, n.e.s. Appareillages d'éclairage, n.d.a.
82 Furniture and parts thereof Meubles et leurs parties et pièces détachées
821 Furniture and parts thereof Meubles et leurs parties et pièces détachées
83 Travel goods, handbags and similar containers Articles de voyage, sacs à mains et contenants similaires
831 Travel goods, handbags and similar containers Articles de voyage, sacs à mains et contenants similaires
84 Articles of apparel, and clothing accessories Vêtements et accessoires du vêtement
841 Men's clothing of textile fabrics, not knitted Articles d'habillement en matières textiles pour hommes
842 Women's clothing, of textile fabrics Articles d'habillement en matières textiles pour femmes
843 Men's or boy's clothing, of textile, knitted, crocheted Articles d'habillement, en bonneterie pour hommes
xIi
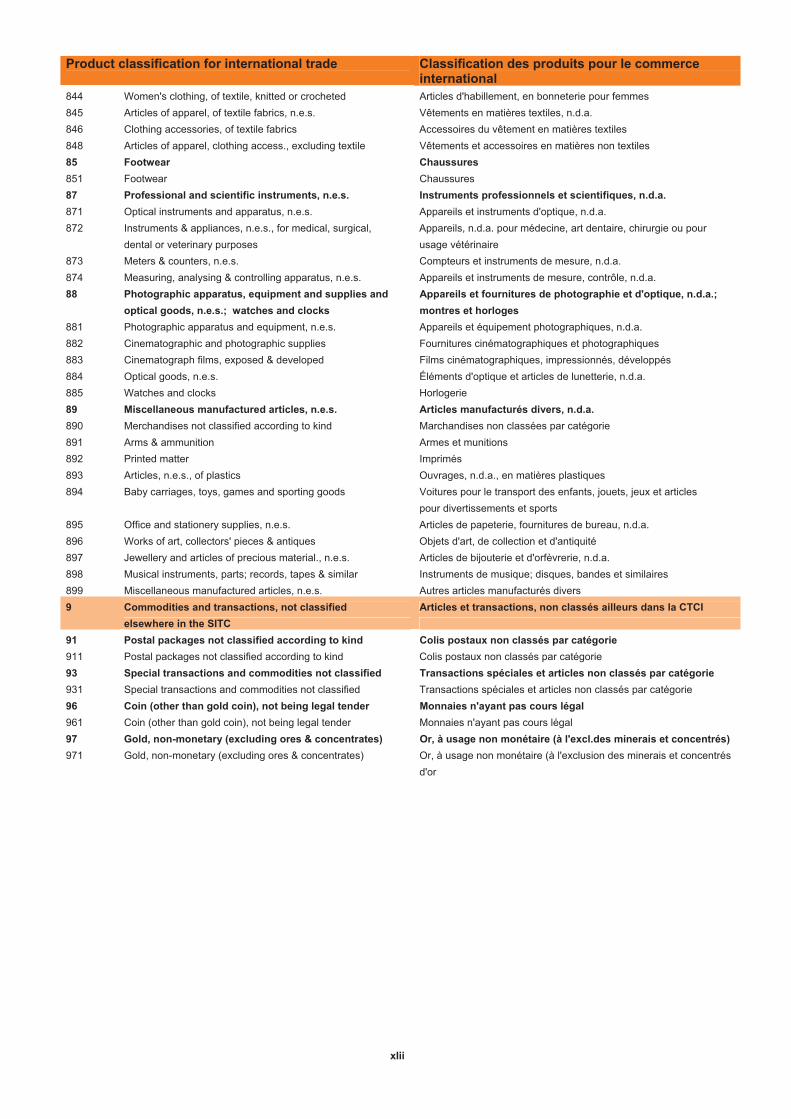
Product classification for international trade Classification des produits pour le commerce international
844 Women's clothing, of textile, knitted or crocheted Articles d'habillement, en bonneterie pour femmes
845 Articles of apparel, of textile fabrics, n.e.s. Vêtements en matières textiles, n.d.a.
846 Clothing accessories, of textile fabrics Accessoires du vêtement en matières textiles
848 Articles of apparel, clothing access., excluding textile Vêtements et accessoires en matières non textiles
85 Footwear Chaussures
851 Footwear Chaussures
87 Professional and scientific instruments, n.e.s. Instruments professionnels et scientifiques, n.d.a.
871 Optical instruments and apparatus, n.e.s. Appareils et instruments d'optique, n.d.a.
872 Instruments & appliances, n.e.s., for medical, surgical, Appareils, n.d.a. pour médecine, art dentaire, chirurgie ou pour
dental or veterinary purposes usage vétérinaire
873 Meters & counters, n.e.s. Compteurs et instruments de mesure, n.d.a.
874 Measuring, analysing & controlling apparatus, n.e.s. Appareils et instruments de mesure, contrôle, n.d.a.
88 Photographic apparatus, equipment and supplies and Appareils et fournitures de photographie et d'optique, n.d.a.;
optical goods, n.e.s.; watches and clocks montres et horloges
881 Photographic apparatus and equipment, n.e.s. Appareils et équipement photographiques, n.d.a.
882 Cinematographic and photographic supplies Fournitures cinématographiques et photographiques
883 Cinematograph films, exposed & developed Films cinématographiques, impressionnés, développés
884 Optical goods, n.e.s. Éléments d'optique et articles de lunetterie, n.d.a.
885 Watches and clocks Horlogerie
89 Miscellaneous manufactured articles, n.e.s. Articles manufacturés divers, n.d.a.
890 Merchandises not classified according to kind Marchandises non classées par catégorie
891 Arms & ammunition Armes et munitions
892 Printed matter Imprimés
893 Articles, n.e.s., of plastics Ouvrages, n.d.a., en matières plastiques
894 Baby carriages, toys, games and sporting goods Voitures pour le transport des enfants, jouets, jeux et articles
pour divertissements et sports
895 Office and stationery supplies, n.e.s. Articles de papeterie, fournitures de bureau, n.d.a.
896 Works of art, collectors' pieces & antiques Objets d'art, de collection et d'antiquité
897 Jewellery and articles of precious material., n.e.s. Articles de bijouterie et d'orfèvrerie, n.d.a.
898 Musical instruments, parts; records, tapes & similar Instruments de musique; disques, bandes et similaires
899 Miscellaneous manufactured articles, n.e.s. Autres articles manufacturés divers
9 Commodities and transactions, not classified Articles et transactions, non classés ailleurs dans la CTCI
elsewhere in the SITC
91 Postal packages not classified according to kind Colis postaux non classés par catégorie
911 Postal packages not classified according to kind Colis postaux non classés par catégorie
93 Special transactions and commodities not classified Transactions spéciales et articles non classés par catégorie
931 Special transactions and commodities not classified Transactions spéciales et articles non classés par catégorie
96 Coin (other than gold coin), not being legal tender Monnaies n'ayant pas cours légal
961 Coin (other than gold coin), not being legal tender Monnaies n'ayant pas cours légal
97 Gold, non-monetary (excluding ores & concentrates) Or, à usage non monétaire (à l'excl.des minerais et concentrés)
971 Gold, non-monetary (excluding ores & concentrates) Or, à usage non monétaire (à l'exclusion des minerais et concentrés
d'or
xIii
MARCHANDISES
MERCHANDISE
1
2
3
4
5
6
7
8
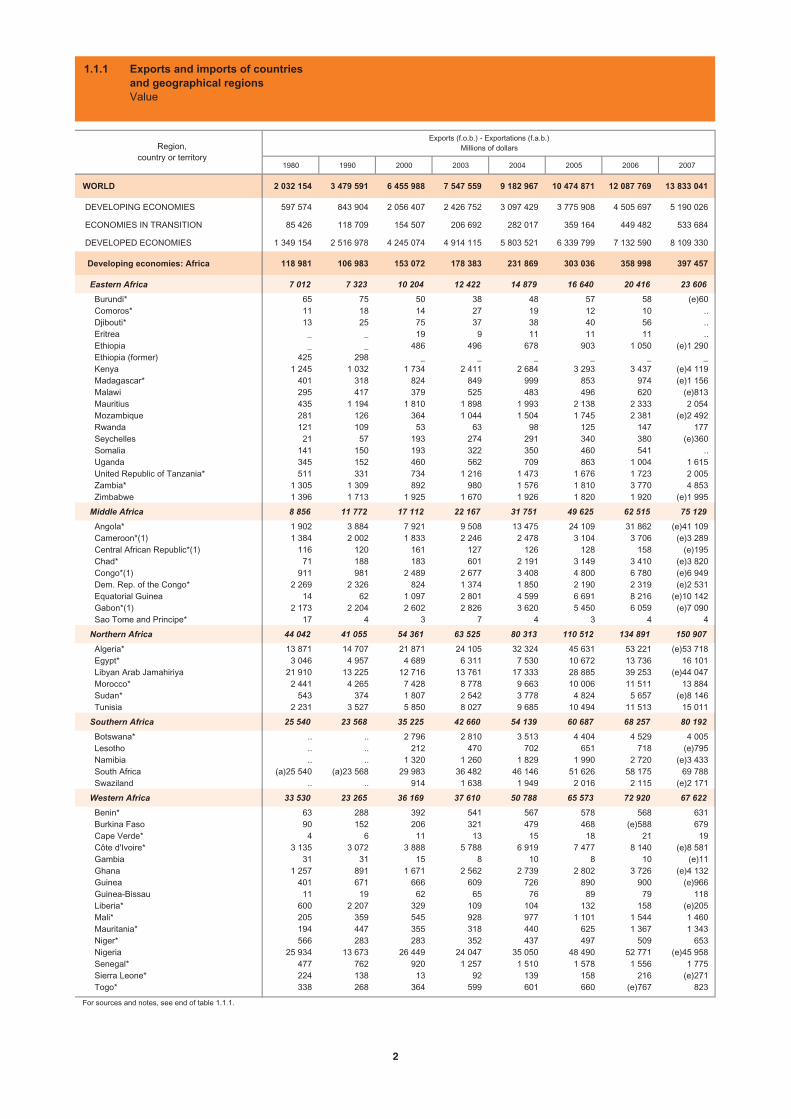
1980 1990 2000 2003 2004 2005 2006 2007
WORLD 2 032 154 3 479 591 6 455 988 7 547 559 9 182 967 10 474 871 12 087 769 13 833 041
DEVELOPING ECONOMIES 597 574 843 904 2 056 407 2 426 752 3 097 429 3 775 908 4 505 697 5 190 026
ECONOMIES IN TRANSITION 85 426 118 709 154 507 206 692 282 017 359 164 449 482 533 684
DEVELOPED ECONOMIES 1 349 154 2 516 978 4 245 074 4 914 115 5 803 521 6 339 799 7 132 590 8 109 330
Developing economies: Africa 118 981 106 983 153 072 178 383 231 869 303 036 358 998 397 457
Eastern Africa 7 012 7 323 10 204 12 422 14 879 16 640 20 416 23 606
Burundi* 65 75 50 38 48 57 58 (e)60 Comoros* 11 18 14 27 19 12 10 .. Djibouti* 13 25 75 37 38 40 56 .. Eritrea _ _ 19 9 11 11 11 .. Ethiopia _ _ 486 496 678 903 1 050 (e)1 290 Ethiopia (former) 425 298 _ _ _ _ _ _ Kenya 1 245 1 032 1 734 2 411 2 684 3 293 3 437 (e)4 119 Madagascar* 401 318 824 849 999 853 974 (e)1 156 Malawi 295 417 379 525 483 496 620 (e)813 Mauritius 435 1 194 1 810 1 898 1 993 2 138 2 333 2 054 Mozambique 281 126 364 1 044 1 504 1 745 2 381 (e)2 492 Rwanda 121 109 53 63 98 125 147 177 Seychelles 21 57 193 274 291 340 380 (e)360 Somalia 141 150 193 322 350 460 541 .. Uganda 345 152 460 562 709 863 1 004 1 615 United Republic of Tanzania* 511 331 734 1 216 1 473 1 676 1 723 2 005 Zambia* 1 305 1 309 892 980 1 576 1 810 3 770 4 853 Zimbabwe 1 396 1 713 1 925 1 670 1 926 1 820 1 920 (e)1 995
Middle Africa 8 856 11 772 17 112 22 167 31 751 49 625 62 515 75 129
Angola* 1 902 3 884 7 921 9 508 13 475 24 109 31 862 (e)41 109 Cameroon*(1) 1 384 2 002 1 833 2 246 2 478 3 104 3 706 (e)3 289 Central African Republic*(1) 116 120 161 127 126 128 158 (e)195 Chad* 71 188 183 601 2 191 3 149 3 410 (e)3 820 Congo*(1) 911 981 2 489 2 677 3 408 4 800 6 780 (e)6 949 Dem. Rep. of the Congo* 2 269 2 326 824 1 374 1 850 2 190 2 319 (e)2 531 Equatorial Guinea 14 62 1 097 2 801 4 599 6 691 8 216 (e)10 142 Gabon*(1) 2 173 2 204 2 602 2 826 3 620 5 450 6 059 (e)7 090 Sao Tome and Principe* 17 4 3 7 4 3 4 4
Northern Africa 44 042 41 055 54 361 63 525 80 313 110 512 134 891 150 907
Algeria* 13 871 14 707 21 871 24 105 32 324 45 631 53 221 (e)53 718 Egypt* 3 046 4 957 4 689 6 311 7 530 10 672 13 736 16 101 Libyan Arab Jamahiriya 21 910 13 225 12 716 13 761 17 333 28 885 39 253 (e)44 047 Morocco* 2 441 4 265 7 428 8 778 9 663 10 006 11 511 13 884 Sudan* 543 374 1 807 2 542 3 778 4 824 5 657 (e)8 146 Tunisia 2 231 3 527 5 850 8 027 9 685 10 494 11 513 15 011
Southern Africa 25 540 23 568 35 225 42 660 54 139 60 687 68 257 80 192
Botswana* .. .. 2 796 2 810 3 513 4 404 4 529 4 005 Lesotho .. .. 212 470 702 651 718 (e)795 Namibia .. .. 1 320 1 260 1 829 1 990 2 720 (e)3 433 South Africa (a)25 540 (a)23 568 29 983 36 482 46 146 51 626 58 175 69 788 Swaziland .. .. 914 1 638 1 949 2 016 2 115 (e)2 171
Western Africa 33 530 23 265 36 169 37 610 50 788 65 573 72 920 67 622
Benin* 63 288 392 541 567 578 568 631 Burkina Faso 90 152 206 321 479 468 (e)588 679 Cape Verde* 4 6 11 13 15 18 21 19 Côte d'Ivoire* 3 135 3 072 3 888 5 788 6 919 7 477 8 140 (e)8 581 Gambia 31 31 15 8 10 8 10 (e)11 Ghana 1 257 891 1 671 2 562 2 739 2 802 3 726 (e)4 132 Guinea 401 671 666 609 726 890 900 (e)966 Guinea-Bissau 11 19 62 65 76 89 79 118 Liberia* 600 2 207 329 109 104 132 158 (e)205 Mali* 205 359 545 928 977 1 101 1 544 1 460 Mauritania* 194 447 355 318 440 625 1 367 1 343 Niger* 566 283 283 352 437 497 509 653 Nigeria 25 934 13 673 26 449 24 047 35 050 48 490 52 771 (e)45 958 Senegal* 477 762 920 1 257 1 510 1 578 1 556 1 775 Sierra Leone* 224 138 13 92 139 158 216 (e)271 Togo* 338 268 364 599 601 660 (e)767 823
For sources and notes, see end of table 1.1.1.
Exports (f.o.b.) - Exportations (f.a.b.)Millions of dollarsRegion,
country or territory
1.1.1 Exports and imports of countriesand geographical regionsValue
2
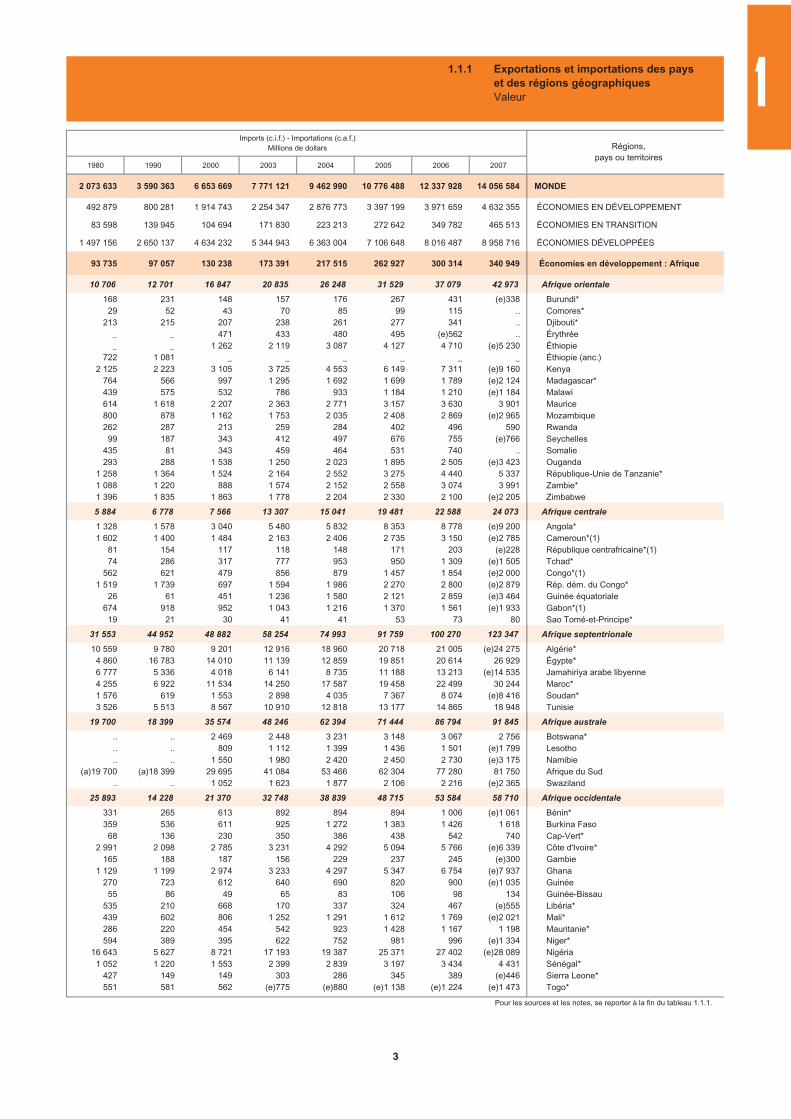
1980 1990 2000 2003 2004 2005 2006 2007
2 073 633 3 590 363 6 653 669 7 771 121 9 462 990 10 776 488 12 337 928 14 056 584 MONDE
492 879 800 281 1 914 743 2 254 347 2 876 773 3 397 199 3 971 659 4 632 355 ÉCONOMIES EN DÉVELOPPEMENT
83 598 139 945 104 694 171 830 223 213 272 642 349 782 465 513 ÉCONOMIES EN TRANSITION
1 497 156 2 650 137 4 634 232 5 344 943 6 363 004 7 106 648 8 016 487 8 958 716 ÉCONOMIES DÉVELOPPÉES
93 735 97 057 130 238 173 391 217 515 262 927 300 314 340 949 Économies en développement : Afrique
10 706 12 701 16 847 20 835 26 248 31 529 37 079 42 973 Afrique orientale
168 231 148 157 176 267 431 (e)338 Burundi*29 52 43 70 85 99 115 .. Comores*
213 215 207 238 261 277 341 .. Djibouti*_ _ 471 433 480 495 (e)562 .. Érythrée_ _ 1 262 2 119 3 087 4 127 4 710 (e)5 230 Éthiopie
722 1 081 _ _ _ _ _ _ Éthiopie (anc.)2 125 2 223 3 105 3 725 4 553 6 149 7 311 (e)9 160 Kenya
764 566 997 1 295 1 692 1 699 1 789 (e)2 124 Madagascar*439 575 532 786 933 1 184 1 210 (e)1 184 Malawi614 1 618 2 207 2 363 2 771 3 157 3 630 3 901 Maurice800 878 1 162 1 753 2 035 2 408 2 869 (e)2 965 Mozambique262 287 213 259 284 402 496 590 Rwanda
99 187 343 412 497 676 755 (e)766 Seychelles435 81 343 459 464 531 740 .. Somalie293 288 1 538 1 250 2 023 1 895 2 505 (e)3 423 Ouganda
1 258 1 364 1 524 2 164 2 552 3 275 4 440 5 337 République-Unie de Tanzanie*1 088 1 220 888 1 574 2 152 2 558 3 074 3 991 Zambie*1 396 1 835 1 863 1 778 2 204 2 330 2 100 (e)2 205 Zimbabwe
5 884 6 778 7 566 13 307 15 041 19 481 22 588 24 073 Afrique centrale
1 328 1 578 3 040 5 480 5 832 8 353 8 778 (e)9 200 Angola*1 602 1 400 1 484 2 163 2 406 2 735 3 150 (e)2 785 Cameroun*(1)
81 154 117 118 148 171 203 (e)228 République centrafricaine*(1)74 286 317 777 953 950 1 309 (e)1 505 Tchad*
562 621 479 856 879 1 457 1 854 (e)2 000 Congo*(1)1 519 1 739 697 1 594 1 986 2 270 2 800 (e)2 879 Rép. dém. du Congo*
26 61 451 1 236 1 580 2 121 2 859 (e)3 464 Guinée équatoriale674 918 952 1 043 1 216 1 370 1 561 (e)1 933 Gabon*(1)
19 21 30 41 41 53 73 80 Sao Tomé-et-Principe*
31 553 44 952 48 882 58 254 74 993 91 759 100 270 123 347 Afrique septentrionale
10 559 9 780 9 201 12 916 18 960 20 718 21 005 (e)24 275 Algérie*4 860 16 783 14 010 11 139 12 859 19 851 20 614 26 929 Égypte*6 777 5 336 4 018 6 141 8 735 11 188 13 213 (e)14 535 Jamahiriya arabe libyenne4 255 6 922 11 534 14 250 17 587 19 458 22 499 30 244 Maroc*1 576 619 1 553 2 898 4 035 7 367 8 074 (e)8 416 Soudan*3 526 5 513 8 567 10 910 12 818 13 177 14 865 18 948 Tunisie
19 700 18 399 35 574 48 246 62 394 71 444 86 794 91 845 Afrique australe
.. .. 2 469 2 448 3 231 3 148 3 067 2 756 Botswana*
.. .. 809 1 112 1 399 1 436 1 501 (e)1 799 Lesotho
.. .. 1 550 1 980 2 420 2 450 2 730 (e)3 175 Namibie(a)19 700 (a)18 399 29 695 41 084 53 466 62 304 77 280 81 750 Afrique du Sud
.. .. 1 052 1 623 1 877 2 106 2 216 (e)2 365 Swaziland
25 893 14 228 21 370 32 748 38 839 48 715 53 584 58 710 Afrique occidentale
331 265 613 892 894 894 1 006 (e)1 061 Bénin*359 536 611 925 1 272 1 383 1 426 1 618 Burkina Faso
68 136 230 350 386 438 542 740 Cap-Vert*2 991 2 098 2 785 3 231 4 292 5 094 5 766 (e)6 339 Côte d'Ivoire*
165 188 187 156 229 237 245 (e)300 Gambie1 129 1 199 2 974 3 233 4 297 5 347 6 754 (e)7 937 Ghana
270 723 612 640 690 820 900 (e)1 035 Guinée55 86 49 65 83 106 98 134 Guinée-Bissau
535 210 668 170 337 324 467 (e)555 Libéria*439 602 806 1 252 1 291 1 612 1 769 (e)2 021 Mali*286 220 454 542 923 1 428 1 167 1 198 Mauritanie*594 389 395 622 752 981 996 (e)1 334 Niger*
16 643 5 627 8 721 17 193 19 387 25 371 27 402 (e)28 089 Nigéria1 052 1 220 1 553 2 399 2 839 3 197 3 434 4 431 Sénégal*
427 149 149 303 286 345 389 (e)446 Sierra Leone*551 581 562 (e)775 (e)880 (e)1 138 (e)1 224 (e)1 473 Togo*
Pour les sources et les notes, se reporter à la fin du tableau 1.1.1.
Régions,pays ou territoires
Imports (c.i.f.) - Importations (c.a.f.)Millions de dollars
1.1.1 Exportations et importations des payset des régions géographiquesValeur 1
3
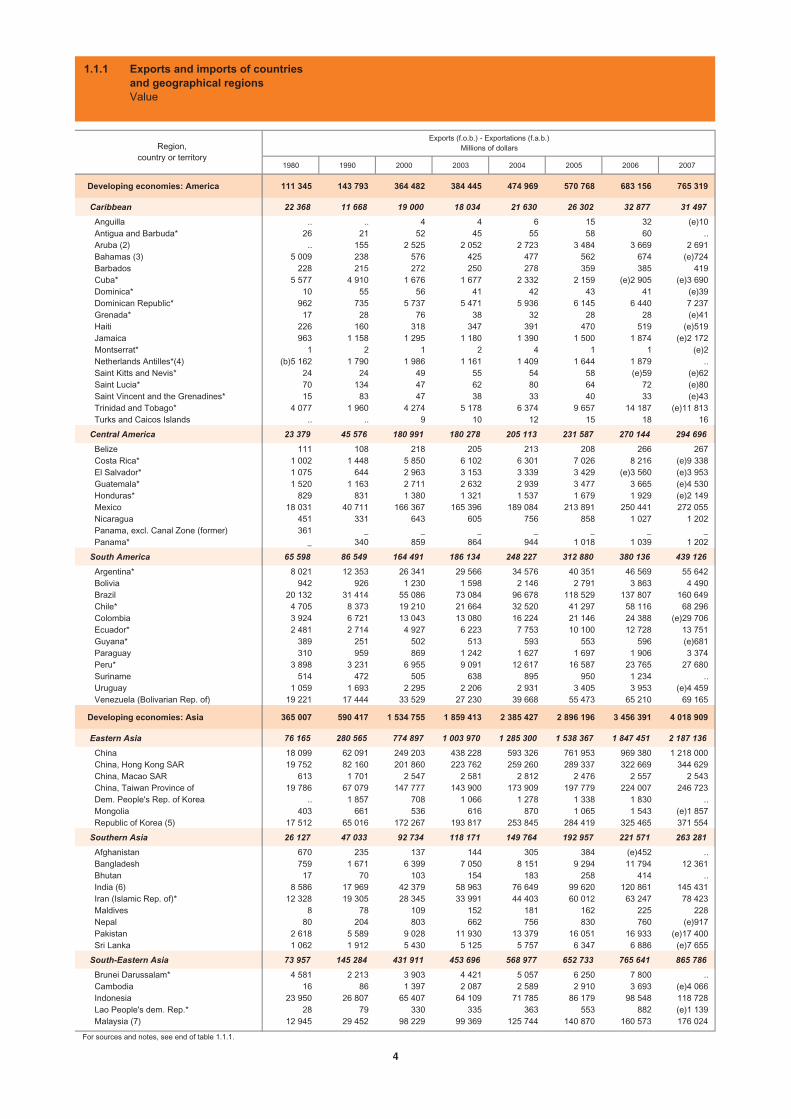
1980 1990 2000 2003 2004 2005 2006 2007
Developing economies: America 111 345 143 793 364 482 384 445 474 969 570 768 683 156 765 319
Caribbean 22 368 11 668 19 000 18 034 21 630 26 302 32 877 31 497
Anguilla .. .. 4 4 6 15 32 (e)10 Antigua and Barbuda* 26 21 52 45 55 58 60 .. Aruba (2) .. 155 2 525 2 052 2 723 3 484 3 669 2 691 Bahamas (3) 5 009 238 576 425 477 562 674 (e)724 Barbados 228 215 272 250 278 359 385 419 Cuba* 5 577 4 910 1 676 1 677 2 332 2 159 (e)2 905 (e)3 690 Dominica* 10 55 56 41 42 43 41 (e)39 Dominican Republic* 962 735 5 737 5 471 5 936 6 145 6 440 7 237 Grenada* 17 28 76 38 32 28 28 (e)41 Haiti 226 160 318 347 391 470 519 (e)519 Jamaica 963 1 158 1 295 1 180 1 390 1 500 1 874 (e)2 172 Montserrat* 1 2 1 2 4 1 1 (e)2 Netherlands Antilles*(4) (b)5 162 1 790 1 986 1 161 1 409 1 644 1 879 .. Saint Kitts and Nevis* 24 24 49 55 54 58 (e)59 (e)62 Saint Lucia* 70 134 47 62 80 64 72 (e)80 Saint Vincent and the Grenadines* 15 83 47 38 33 40 33 (e)43 Trinidad and Tobago* 4 077 1 960 4 274 5 178 6 374 9 657 14 187 (e)11 813 Turks and Caicos Islands .. .. 9 10 12 15 18 16
Central America 23 379 45 576 180 991 180 278 205 113 231 587 270 144 294 696
Belize 111 108 218 205 213 208 266 267 Costa Rica* 1 002 1 448 5 850 6 102 6 301 7 026 8 216 (e)9 338 El Salvador* 1 075 644 2 963 3 153 3 339 3 429 (e)3 560 (e)3 953 Guatemala* 1 520 1 163 2 711 2 632 2 939 3 477 3 665 (e)4 530 Honduras* 829 831 1 380 1 321 1 537 1 679 1 929 (e)2 149 Mexico 18 031 40 711 166 367 165 396 189 084 213 891 250 441 272 055 Nicaragua 451 331 643 605 756 858 1 027 1 202 Panama, excl. Canal Zone (former) 361 _ _ _ _ _ _ _ Panama* _ 340 859 864 944 1 018 1 039 1 202
South America 65 598 86 549 164 491 186 134 248 227 312 880 380 136 439 126
Argentina* 8 021 12 353 26 341 29 566 34 576 40 351 46 569 55 642 Bolivia 942 926 1 230 1 598 2 146 2 791 3 863 4 490 Brazil 20 132 31 414 55 086 73 084 96 678 118 529 137 807 160 649 Chile* 4 705 8 373 19 210 21 664 32 520 41 297 58 116 68 296 Colombia 3 924 6 721 13 043 13 080 16 224 21 146 24 388 (e)29 706 Ecuador* 2 481 2 714 4 927 6 223 7 753 10 100 12 728 13 751 Guyana* 389 251 502 513 593 553 596 (e)681 Paraguay 310 959 869 1 242 1 627 1 697 1 906 3 374 Peru* 3 898 3 231 6 955 9 091 12 617 16 587 23 765 27 680 Suriname 514 472 505 638 895 950 1 234 .. Uruguay 1 059 1 693 2 295 2 206 2 931 3 405 3 953 (e)4 459 Venezuela (Bolivarian Rep. of) 19 221 17 444 33 529 27 230 39 668 55 473 65 210 69 165
Developing economies: Asia 365 007 590 417 1 534 755 1 859 413 2 385 427 2 896 196 3 456 391 4 018 909
Eastern Asia 76 165 280 565 774 897 1 003 970 1 285 300 1 538 367 1 847 451 2 187 136
China 18 099 62 091 249 203 438 228 593 326 761 953 969 380 1 218 000 China, Hong Kong SAR 19 752 82 160 201 860 223 762 259 260 289 337 322 669 344 629 China, Macao SAR 613 1 701 2 547 2 581 2 812 2 476 2 557 2 543 China, Taiwan Province of 19 786 67 079 147 777 143 900 173 909 197 779 224 007 246 723 Dem. People's Rep. of Korea .. 1 857 708 1 066 1 278 1 338 1 830 .. Mongolia 403 661 536 616 870 1 065 1 543 (e)1 857 Republic of Korea (5) 17 512 65 016 172 267 193 817 253 845 284 419 325 465 371 554
Southern Asia 26 127 47 033 92 734 118 171 149 764 192 957 221 571 263 281
Afghanistan 670 235 137 144 305 384 (e)452 .. Bangladesh 759 1 671 6 399 7 050 8 151 9 294 11 794 12 361 Bhutan 17 70 103 154 183 258 414 .. India (6) 8 586 17 969 42 379 58 963 76 649 99 620 120 861 145 431 Iran (Islamic Rep. of)* 12 328 19 305 28 345 33 991 44 403 60 012 63 247 78 423 Maldives 8 78 109 152 181 162 225 228 Nepal 80 204 803 662 756 830 760 (e)917 Pakistan 2 618 5 589 9 028 11 930 13 379 16 051 16 933 (e)17 400 Sri Lanka 1 062 1 912 5 430 5 125 5 757 6 347 6 886 (e)7 655
South-Eastern Asia 73 957 145 284 431 911 453 696 568 977 652 733 765 641 865 786
Brunei Darussalam* 4 581 2 213 3 903 4 421 5 057 6 250 7 800 .. Cambodia 16 86 1 397 2 087 2 589 2 910 3 693 (e)4 066 Indonesia 23 950 26 807 65 407 64 109 71 785 86 179 98 548 118 728 Lao People's dem. Rep.* 28 79 330 335 363 553 882 (e)1 139 Malaysia (7) 12 945 29 452 98 229 99 369 125 744 140 870 160 573 176 024
For sources and notes, see end of table 1.1.1.
Region,country or territory
Exports (f.o.b.) - Exportations (f.a.b.)Millions of dollars
1.1.1 Exports and imports of countriesand geographical regionsValue
4
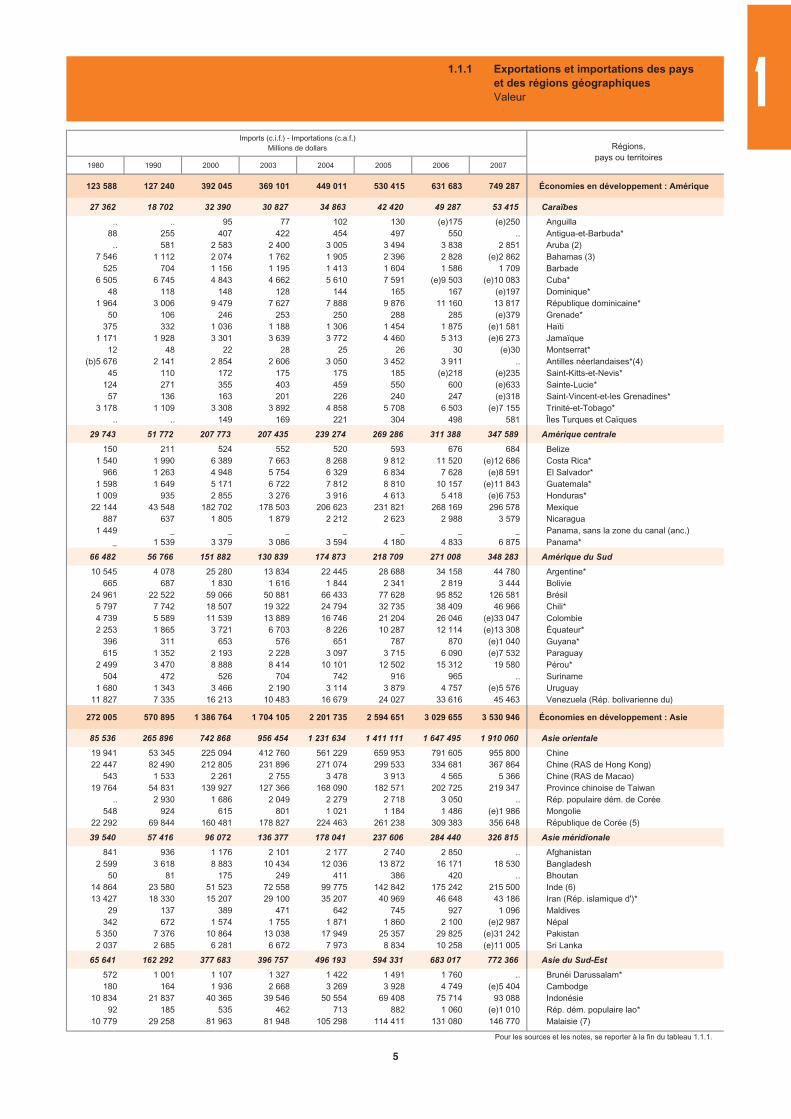
1980 1990 2000 2003 2004 2005 2006 2007
123 588 127 240 392 045 369 101 449 011 530 415 631 683 749 287 Économies en développement : Amérique
27 362 18 702 32 390 30 827 34 863 42 420 49 287 53 415 Caraïbes
.. .. 95 77 102 130 (e)175 (e)250 Anguilla88 255 407 422 454 497 550 .. Antigua-et-Barbuda*
.. 581 2 583 2 400 3 005 3 494 3 838 2 851 Aruba (2)7 546 1 112 2 074 1 762 1 905 2 396 2 828 (e)2 862 Bahamas (3)
525 704 1 156 1 195 1 413 1 604 1 586 1 709 Barbade6 505 6 745 4 843 4 662 5 610 7 591 (e)9 503 (e)10 083 Cuba*
48 118 148 128 144 165 167 (e)197 Dominique*1 964 3 006 9 479 7 627 7 888 9 876 11 160 13 817 République dominicaine*
50 106 246 253 250 288 285 (e)379 Grenade*375 332 1 036 1 188 1 306 1 454 1 875 (e)1 581 Haïti
1 171 1 928 3 301 3 639 3 772 4 460 5 313 (e)6 273 Jamaïque12 48 22 28 25 26 30 (e)30 Montserrat*
(b)5 676 2 141 2 854 2 606 3 050 3 452 3 911 .. Antilles néerlandaises*(4)45 110 172 175 175 185 (e)218 (e)235 Saint-Kitts-et-Nevis*
124 271 355 403 459 550 600 (e)633 Sainte-Lucie*57 136 163 201 226 240 247 (e)318 Saint-Vincent-et-les Grenadines*
3 178 1 109 3 308 3 892 4 858 5 708 6 503 (e)7 155 Trinité-et-Tobago*.. .. 149 169 221 304 498 581 Îles Turques et Caïques
29 743 51 772 207 773 207 435 239 274 269 286 311 388 347 589 Amérique centrale
150 211 524 552 520 593 676 684 Belize1 540 1 990 6 389 7 663 8 268 9 812 11 520 (e)12 686 Costa Rica*
966 1 263 4 948 5 754 6 329 6 834 7 628 (e)8 591 El Salvador*1 598 1 649 5 171 6 722 7 812 8 810 10 157 (e)11 843 Guatemala*1 009 935 2 855 3 276 3 916 4 613 5 418 (e)6 753 Honduras*
22 144 43 548 182 702 178 503 206 623 231 821 268 169 296 578 Mexique887 637 1 805 1 879 2 212 2 623 2 988 3 579 Nicaragua
1 449 _ _ _ _ _ _ _ Panama, sans la zone du canal (anc.)_ 1 539 3 379 3 086 3 594 4 180 4 833 6 875 Panama*
66 482 56 766 151 882 130 839 174 873 218 709 271 008 348 283 Amérique du Sud
10 545 4 078 25 280 13 834 22 445 28 688 34 158 44 780 Argentine*665 687 1 830 1 616 1 844 2 341 2 819 3 444 Bolivie
24 961 22 522 59 066 50 881 66 433 77 628 95 852 126 581 Brésil5 797 7 742 18 507 19 322 24 794 32 735 38 409 46 966 Chili*4 739 5 589 11 539 13 889 16 746 21 204 26 046 (e)33 047 Colombie2 253 1 865 3 721 6 703 8 226 10 287 12 114 (e)13 308 Équateur*
396 311 653 576 651 787 870 (e)1 040 Guyana*615 1 352 2 193 2 228 3 097 3 715 6 090 (e)7 532 Paraguay
2 499 3 470 8 888 8 414 10 101 12 502 15 312 19 580 Pérou*504 472 526 704 742 916 965 .. Suriname
1 680 1 343 3 466 2 190 3 114 3 879 4 757 (e)5 576 Uruguay11 827 7 335 16 213 10 483 16 679 24 027 33 616 45 463 Venezuela (Rép. bolivarienne du)
272 005 570 895 1 386 764 1 704 105 2 201 735 2 594 651 3 029 655 3 530 946 Économies en développement : Asie
85 536 265 896 742 868 956 454 1 231 634 1 411 111 1 647 495 1 910 060 Asie orientale
19 941 53 345 225 094 412 760 561 229 659 953 791 605 955 800 Chine22 447 82 490 212 805 231 896 271 074 299 533 334 681 367 864 Chine (RAS de Hong Kong)
543 1 533 2 261 2 755 3 478 3 913 4 565 5 366 Chine (RAS de Macao)19 764 54 831 139 927 127 366 168 090 182 571 202 725 219 347 Province chinoise de Taiwan
.. 2 930 1 686 2 049 2 279 2 718 3 050 .. Rép. populaire dém. de Corée548 924 615 801 1 021 1 184 1 486 (e)1 986 Mongolie
22 292 69 844 160 481 178 827 224 463 261 238 309 383 356 648 République de Corée (5)
39 540 57 416 96 072 136 377 178 041 237 606 284 440 326 815 Asie méridionale
841 936 1 176 2 101 2 177 2 740 2 850 .. Afghanistan2 599 3 618 8 883 10 434 12 036 13 872 16 171 18 530 Bangladesh
50 81 175 249 411 386 420 .. Bhoutan14 864 23 580 51 523 72 558 99 775 142 842 175 242 215 500 Inde (6)13 427 18 330 15 207 29 100 35 207 40 969 46 648 43 186 Iran (Rép. islamique d')*
29 137 389 471 642 745 927 1 096 Maldives342 672 1 574 1 755 1 871 1 860 2 100 (e)2 987 Népal
5 350 7 376 10 864 13 038 17 949 25 357 29 825 (e)31 242 Pakistan2 037 2 685 6 281 6 672 7 973 8 834 10 258 (e)11 005 Sri Lanka
65 641 162 292 377 683 396 757 496 193 594 331 683 017 772 366 Asie du Sud-Est
572 1 001 1 107 1 327 1 422 1 491 1 760 .. Brunéi Darussalam*180 164 1 936 2 668 3 269 3 928 4 749 (e)5 404 Cambodge
10 834 21 837 40 365 39 546 50 554 69 408 75 714 93 088 Indonésie92 185 535 462 713 882 1 060 (e)1 010 Rép. dém. populaire lao*
10 779 29 258 81 963 81 948 105 298 114 411 131 080 146 770 Malaisie (7)
Pour les sources et les notes, se reporter à la fin du tableau 1.1.1.
Imports (c.i.f.) - Importations (c.a.f.)Millions de dollars Régions,
pays ou territoires
1.1.1 Exportations et importations des payset des régions géographiquesValeur 1
5
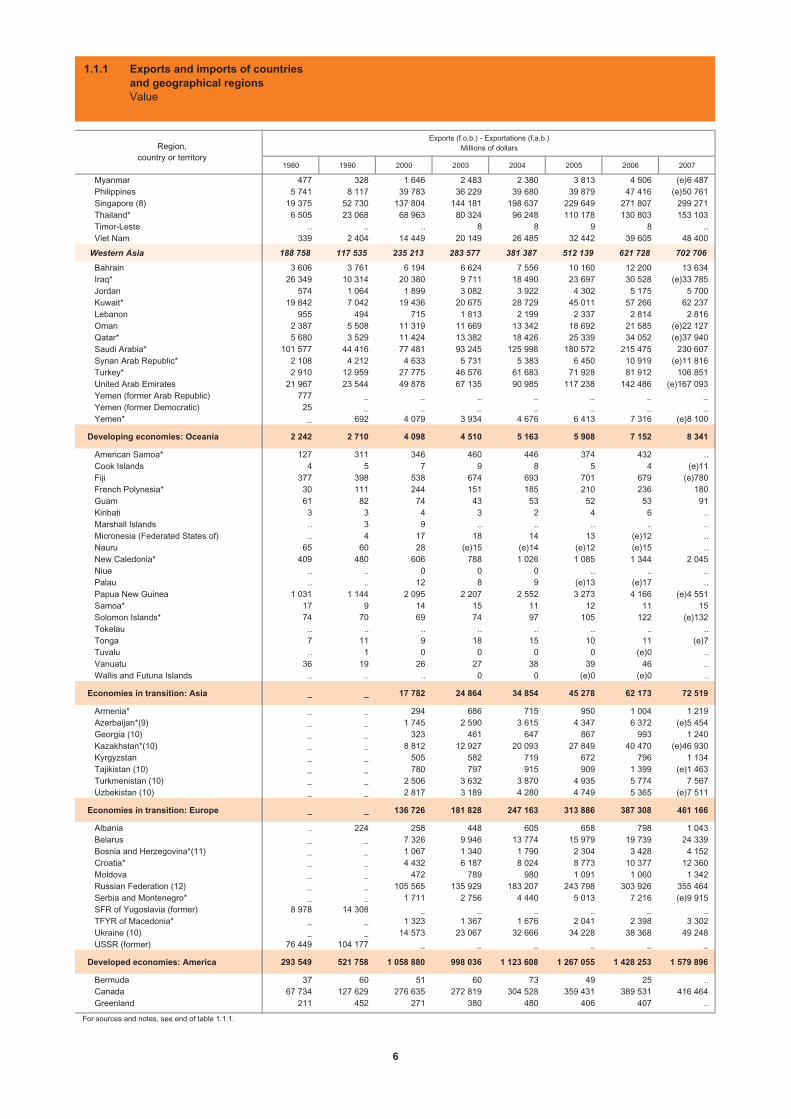
1980 1990 2000 2003 2004 2005 2006 2007
Myanmar 477 328 1 646 2 483 2 380 3 813 4 506 (e)6 487 Philippines 5 741 8 117 39 783 36 229 39 680 39 879 47 416 (e)50 761 Singapore (8) 19 375 52 730 137 804 144 181 198 637 229 649 271 807 299 271 Thailand* 6 505 23 068 68 963 80 324 96 248 110 178 130 803 153 103 Timor-Leste .. .. .. 8 8 9 8 .. Viet Nam 339 2 404 14 449 20 149 26 485 32 442 39 605 48 400
Western Asia 188 758 117 535 235 213 283 577 381 387 512 139 621 728 702 706
Bahrain 3 606 3 761 6 194 6 624 7 556 10 160 12 200 13 634 Iraq* 26 349 10 314 20 380 9 711 18 490 23 697 30 528 (e)33 785 Jordan 574 1 064 1 899 3 082 3 922 4 302 5 175 5 700 Kuwait* 19 842 7 042 19 436 20 675 28 729 45 011 57 266 62 237 Lebanon 955 494 715 1 813 2 199 2 337 2 814 2 816 Oman 2 387 5 508 11 319 11 669 13 342 18 692 21 585 (e)22 127 Qatar* 5 680 3 529 11 424 13 382 18 426 25 339 34 052 (e)37 940 Saudi Arabia* 101 577 44 416 77 481 93 245 125 998 180 572 215 475 230 607 Syrian Arab Republic* 2 108 4 212 4 633 5 731 5 383 6 450 10 919 (e)11 816 Turkey* 2 910 12 959 27 775 46 576 61 683 71 928 81 912 106 851 United Arab Emirates 21 967 23 544 49 878 67 135 90 985 117 238 142 486 (e)167 093 Yemen (former Arab Republic) 777 _ _ _ _ _ _ _ Yemen (former Democratic) 25 _ _ _ _ _ _ _ Yemen* _ 692 4 079 3 934 4 676 6 413 7 316 (e)8 100
Developing economies: Oceania 2 242 2 710 4 098 4 510 5 163 5 908 7 152 8 341
American Samoa* 127 311 346 460 446 374 432 .. Cook Islands 4 5 7 9 8 5 4 (e)11 Fiji 377 398 538 674 693 701 679 (e)780 French Polynesia* 30 111 244 151 185 210 236 180 Guam 61 82 74 43 53 52 53 91 Kiribati 3 3 4 3 2 4 6 .. Marshall Islands .. 3 9 .. .. .. .. .. Micronesia (Federated States of) .. 4 17 18 14 13 (e)12 .. Nauru 65 60 28 (e)15 (e)14 (e)12 (e)15 .. New Caledonia* 409 480 606 788 1 026 1 085 1 344 2 045 Niue .. .. 0 0 0 .. .. .. Palau .. .. 12 8 9 (e)13 (e)17 .. Papua New Guinea 1 031 1 144 2 095 2 207 2 552 3 273 4 166 (e)4 551 Samoa* 17 9 14 15 11 12 11 15 Solomon Islands* 74 70 69 74 97 105 122 (e)132 Tokelau .. .. .. .. .. .. .. .. Tonga 7 11 9 18 15 10 11 (e)7 Tuvalu .. 1 0 0 0 0 (e)0 .. Vanuatu 36 19 26 27 38 39 46 .. Wallis and Futuna Islands .. .. .. 0 0 (e)0 (e)0 ..
Economies in transition: Asia _ _ 17 782 24 864 34 854 45 278 62 173 72 519
Armenia* _ _ 294 686 715 950 1 004 1 219 Azerbaijan*(9) _ _ 1 745 2 590 3 615 4 347 6 372 (e)5 454 Georgia (10) _ _ 323 461 647 867 993 1 240 Kazakhstan*(10) _ _ 8 812 12 927 20 093 27 849 40 470 (e)46 930 Kyrgyzstan _ _ 505 582 719 672 796 1 134 Tajikistan (10) _ _ 780 797 915 909 1 399 (e)1 463 Turkmenistan (10) _ _ 2 506 3 632 3 870 4 935 5 774 7 567 Uzbekistan (10) _ _ 2 817 3 189 4 280 4 749 5 365 (e)7 511
Economies in transition: Europe _ _ 136 726 181 828 247 163 313 886 387 308 461 166
Albania .. 224 258 448 605 658 798 1 043 Belarus _ _ 7 326 9 946 13 774 15 979 19 739 24 339 Bosnia and Herzegovina*(11) _ _ 1 067 1 340 1 790 2 304 3 428 4 152 Croatia* _ _ 4 432 6 187 8 024 8 773 10 377 12 360 Moldova _ _ 472 789 980 1 091 1 060 1 342 Russian Federation (12) _ _ 105 565 135 929 183 207 243 798 303 926 355 464 Serbia and Montenegro* _ _ 1 711 2 756 4 440 5 013 7 216 (e)9 915 SFR of Yugoslavia (former) 8 978 14 308 _ _ _ _ _ _ TFYR of Macedonia* _ _ 1 323 1 367 1 676 2 041 2 398 3 302 Ukraine (10) _ _ 14 573 23 067 32 666 34 228 38 368 49 248 USSR (former) 76 449 104 177 _ _ _ _ _ _
Developed economies: America 293 549 521 758 1 058 880 998 036 1 123 608 1 267 055 1 428 253 1 579 896
Bermuda 37 60 51 60 73 49 25 .. Canada 67 734 127 629 276 635 272 819 304 528 359 431 389 531 416 464 Greenland 211 452 271 380 480 406 407 ..
For sources and notes, see end of table 1.1.1.
Region,country or territory
Exports (f.o.b.) - Exportations (f.a.b.)Millions of dollars
1.1.1 Exports and imports of countriesand geographical regionsValue
6
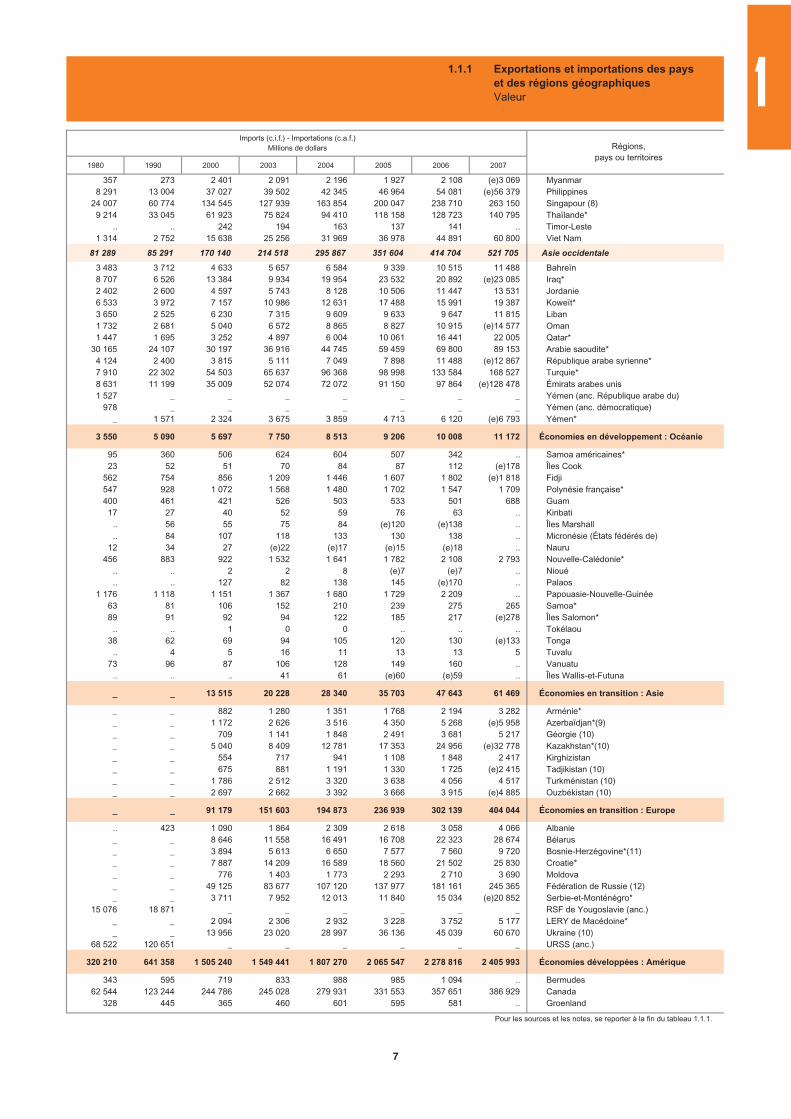
1980 1990 2000 2003 2004 2005 2006 2007
357 273 2 401 2 091 2 196 1 927 2 108 (e)3 069 Myanmar8 291 13 004 37 027 39 502 42 345 46 964 54 081 (e)56 379 Philippines
24 007 60 774 134 545 127 939 163 854 200 047 238 710 263 150 Singapour (8)9 214 33 045 61 923 75 824 94 410 118 158 128 723 140 795 Thaïlande*
.. .. 242 194 163 137 141 .. Timor-Leste1 314 2 752 15 638 25 256 31 969 36 978 44 891 60 800 Viet Nam
81 289 85 291 170 140 214 518 295 867 351 604 414 704 521 705 Asie occidentale
3 483 3 712 4 633 5 657 6 584 9 339 10 515 11 488 Bahreïn8 707 6 526 13 384 9 934 19 954 23 532 20 892 (e)23 085 Iraq*2 402 2 600 4 597 5 743 8 128 10 506 11 447 13 531 Jordanie6 533 3 972 7 157 10 986 12 631 17 488 15 991 19 387 Koweït*3 650 2 525 6 230 7 315 9 609 9 633 9 647 11 815 Liban1 732 2 681 5 040 6 572 8 865 8 827 10 915 (e)14 577 Oman1 447 1 695 3 252 4 897 6 004 10 061 16 441 22 005 Qatar*
30 165 24 107 30 197 36 916 44 745 59 459 69 800 89 153 Arabie saoudite*4 124 2 400 3 815 5 111 7 049 7 898 11 488 (e)12 867 République arabe syrienne*7 910 22 302 54 503 65 637 96 368 98 998 133 584 168 527 Turquie*8 631 11 199 35 009 52 074 72 072 91 150 97 864 (e)128 478 Émirats arabes unis1 527 _ _ _ _ _ _ _ Yémen (anc. République arabe du)
978 _ _ _ _ _ _ _ Yémen (anc. démocratique)_ 1 571 2 324 3 675 3 859 4 713 6 120 (e)6 793 Yémen*
3 550 5 090 5 697 7 750 8 513 9 206 10 008 11 172 Économies en développement : Océanie
95 360 506 624 604 507 342 .. Samoa américaines*23 52 51 70 84 87 112 (e)178 Îles Cook
562 754 856 1 209 1 446 1 607 1 802 (e)1 818 Fidji547 928 1 072 1 568 1 480 1 702 1 547 1 709 Polynésie française*400 461 421 526 503 533 501 688 Guam
17 27 40 52 59 76 63 .. Kiribati.. 56 55 75 84 (e)120 (e)138 .. Îles Marshall.. 84 107 118 133 130 138 .. Micronésie (États fédérés de)
12 34 27 (e)22 (e)17 (e)15 (e)18 .. Nauru456 883 922 1 532 1 641 1 782 2 108 2 793 Nouvelle-Calédonie*
.. .. 2 2 8 (e)7 (e)7 .. Nioué
.. .. 127 82 138 145 (e)170 .. Palaos1 176 1 118 1 151 1 367 1 680 1 729 2 209 .. Papouasie-Nouvelle-Guinée
63 81 106 152 210 239 275 265 Samoa*89 91 92 94 122 185 217 (e)278 Îles Salomon*
.. .. 1 0 0 .. .. .. Tokélaou38 62 69 94 105 120 130 (e)133 Tonga
.. 4 5 16 11 13 13 5 Tuvalu73 96 87 106 128 149 160 .. Vanuatu
.. .. .. 41 61 (e)60 (e)59 .. Îles Wallis-et-Futuna
_ _ 13 515 20 228 28 340 35 703 47 643 61 469 Économies en transition : Asie
_ _ 882 1 280 1 351 1 768 2 194 3 282 Arménie*_ _ 1 172 2 626 3 516 4 350 5 268 (e)5 958 Azerbaïdjan*(9)_ _ 709 1 141 1 848 2 491 3 681 5 217 Géorgie (10)_ _ 5 040 8 409 12 781 17 353 24 956 (e)32 778 Kazakhstan*(10)_ _ 554 717 941 1 108 1 848 2 417 Kirghizistan_ _ 675 881 1 191 1 330 1 725 (e)2 415 Tadjikistan (10)_ _ 1 786 2 512 3 320 3 638 4 056 4 517 Turkménistan (10)_ _ 2 697 2 662 3 392 3 666 3 915 (e)4 885 Ouzbékistan (10)
_ _ 91 179 151 603 194 873 236 939 302 139 404 044 Économies en transition : Europe
.. 423 1 090 1 864 2 309 2 618 3 058 4 066 Albanie_ _ 8 646 11 558 16 491 16 708 22 323 28 674 Bélarus_ _ 3 894 5 613 6 650 7 577 7 560 9 720 Bosnie-Herzégovine*(11)_ _ 7 887 14 209 16 589 18 560 21 502 25 830 Croatie*_ _ 776 1 403 1 773 2 293 2 710 3 690 Moldova_ _ 49 125 83 677 107 120 137 977 181 161 245 365 Fédération de Russie (12)_ _ 3 711 7 952 12 013 11 840 15 034 (e)20 852 Serbie-et-Monténégro*
15 076 18 871 _ _ _ _ _ _ RSF de Yougoslavie (anc.)_ _ 2 094 2 306 2 932 3 228 3 752 5 177 LERY de Macédoine*_ _ 13 956 23 020 28 997 36 136 45 039 60 670 Ukraine (10)
68 522 120 651 _ _ _ _ _ _ URSS (anc.)
320 210 641 358 1 505 240 1 549 441 1 807 270 2 065 547 2 278 816 2 405 993 Économies développées : Amérique
343 595 719 833 988 985 1 094 .. Bermudes62 544 123 244 244 786 245 028 279 931 331 553 357 651 386 929 Canada
328 445 365 460 601 595 581 .. Groenland
Pour les sources et les notes, se reporter à la fin du tableau 1.1.1.
Imports (c.i.f.) - Importations (c.a.f.)Millions de dollars Régions,
pays ou territoires
1.1.1 Exportations et importations des payset des régions géographiquesValeur 1
7
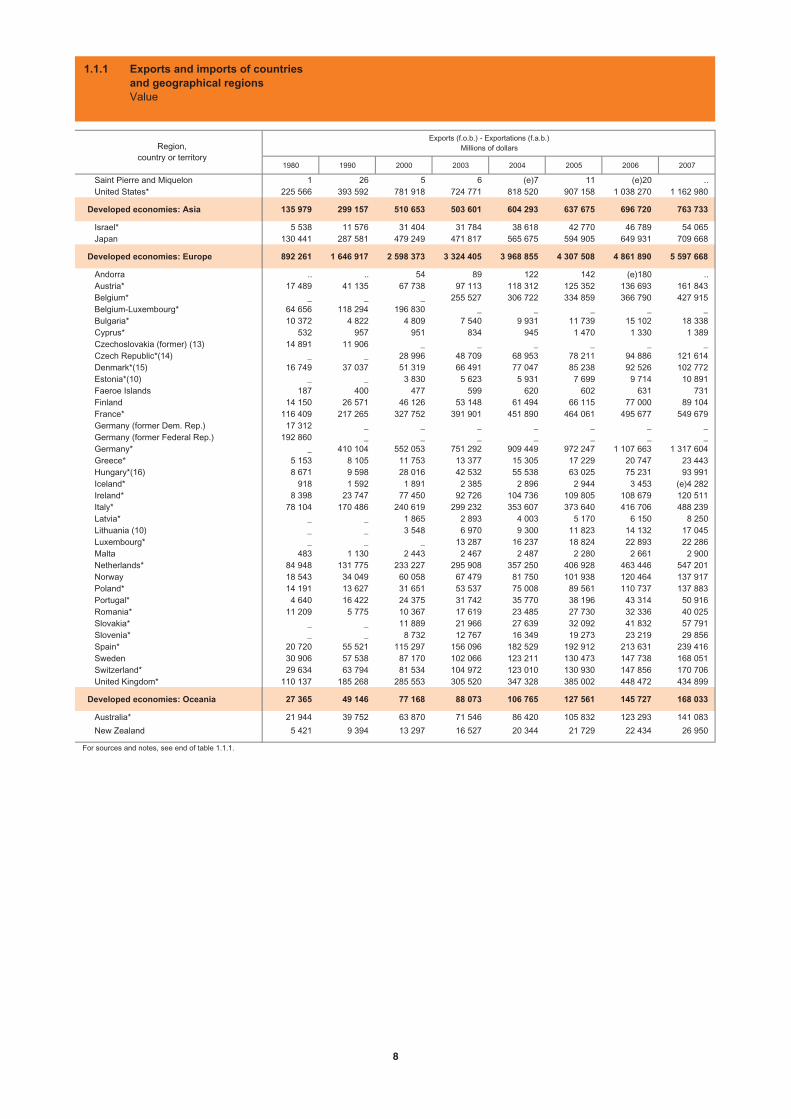
1980 1990 2000 2003 2004 2005 2006 2007
Saint Pierre and Miquelon 1 26 5 6 (e)7 11 (e)20 .. United States* 225 566 393 592 781 918 724 771 818 520 907 158 1 038 270 1 162 980
Developed economies: Asia 135 979 299 157 510 653 503 601 604 293 637 675 696 720 763 733
Israel* 5 538 11 576 31 404 31 784 38 618 42 770 46 789 54 065 Japan 130 441 287 581 479 249 471 817 565 675 594 905 649 931 709 668
Developed economies: Europe 892 261 1 646 917 2 598 373 3 324 405 3 968 855 4 307 508 4 861 890 5 597 668
Andorra .. .. 54 89 122 142 (e)180 .. Austria* 17 489 41 135 67 738 97 113 118 312 125 352 136 693 161 843 Belgium* _ _ _ 255 527 306 722 334 859 366 790 427 915 Belgium-Luxembourg* 64 656 118 294 196 830 _ _ _ _ _ Bulgaria* 10 372 4 822 4 809 7 540 9 931 11 739 15 102 18 338 Cyprus* 532 957 951 834 945 1 470 1 330 1 389 Czechoslovakia (former) (13) 14 891 11 906 _ _ _ _ _ _ Czech Republic*(14) _ _ 28 996 48 709 68 953 78 211 94 886 121 614 Denmark*(15) 16 749 37 037 51 319 66 491 77 047 85 238 92 526 102 772 Estonia*(10) _ _ 3 830 5 623 5 931 7 699 9 714 10 891 Faeroe Islands 187 400 477 599 620 602 631 731 Finland 14 150 26 571 46 126 53 148 61 494 66 115 77 000 89 104 France* 116 409 217 265 327 752 391 901 451 890 464 061 495 677 549 679 Germany (former Dem. Rep.) 17 312 _ _ _ _ _ _ _ Germany (former Federal Rep.) 192 860 _ _ _ _ _ _ _ Germany* _ 410 104 552 053 751 292 909 449 972 247 1 107 663 1 317 604 Greece* 5 153 8 105 11 753 13 377 15 305 17 229 20 747 23 443 Hungary*(16) 8 671 9 598 28 016 42 532 55 538 63 025 75 231 93 991 Iceland* 918 1 592 1 891 2 385 2 896 2 944 3 453 (e)4 282 Ireland* 8 398 23 747 77 450 92 726 104 736 109 805 108 679 120 511 Italy* 78 104 170 486 240 619 299 232 353 607 373 640 416 706 488 239 Latvia* _ _ 1 865 2 893 4 003 5 170 6 150 8 250 Lithuania (10) _ _ 3 548 6 970 9 300 11 823 14 132 17 045 Luxembourg* _ _ _ 13 287 16 237 18 824 22 893 22 286 Malta 483 1 130 2 443 2 467 2 487 2 280 2 661 2 900 Netherlands* 84 948 131 775 233 227 295 908 357 250 406 928 463 446 547 201 Norway 18 543 34 049 60 058 67 479 81 750 101 938 120 464 137 917 Poland* 14 191 13 627 31 651 53 537 75 008 89 561 110 737 137 883 Portugal* 4 640 16 422 24 375 31 742 35 770 38 196 43 314 50 916 Romania* 11 209 5 775 10 367 17 619 23 485 27 730 32 336 40 025 Slovakia* _ _ 11 889 21 966 27 639 32 092 41 832 57 791 Slovenia* _ _ 8 732 12 767 16 349 19 273 23 219 29 856 Spain* 20 720 55 521 115 297 156 096 182 529 192 912 213 631 239 416 Sweden 30 906 57 538 87 170 102 066 123 211 130 473 147 738 168 051 Switzerland* 29 634 63 794 81 534 104 972 123 010 130 930 147 856 170 706 United Kingdom* 110 137 185 268 285 553 305 520 347 328 385 002 448 472 434 899
Developed economies: Oceania 27 365 49 146 77 168 88 073 106 765 127 561 145 727 168 033
Australia* 21 944 39 752 63 870 71 546 86 420 105 832 123 293 141 083
New Zealand 5 421 9 394 13 297 16 527 20 344 21 729 22 434 26 950
For sources and notes, see end of table 1.1.1.
Region,country or territory
Exports (f.o.b.) - Exportations (f.a.b.)Millions of dollars
1.1.1 Exports and imports of countriesand geographical regionsValue
8
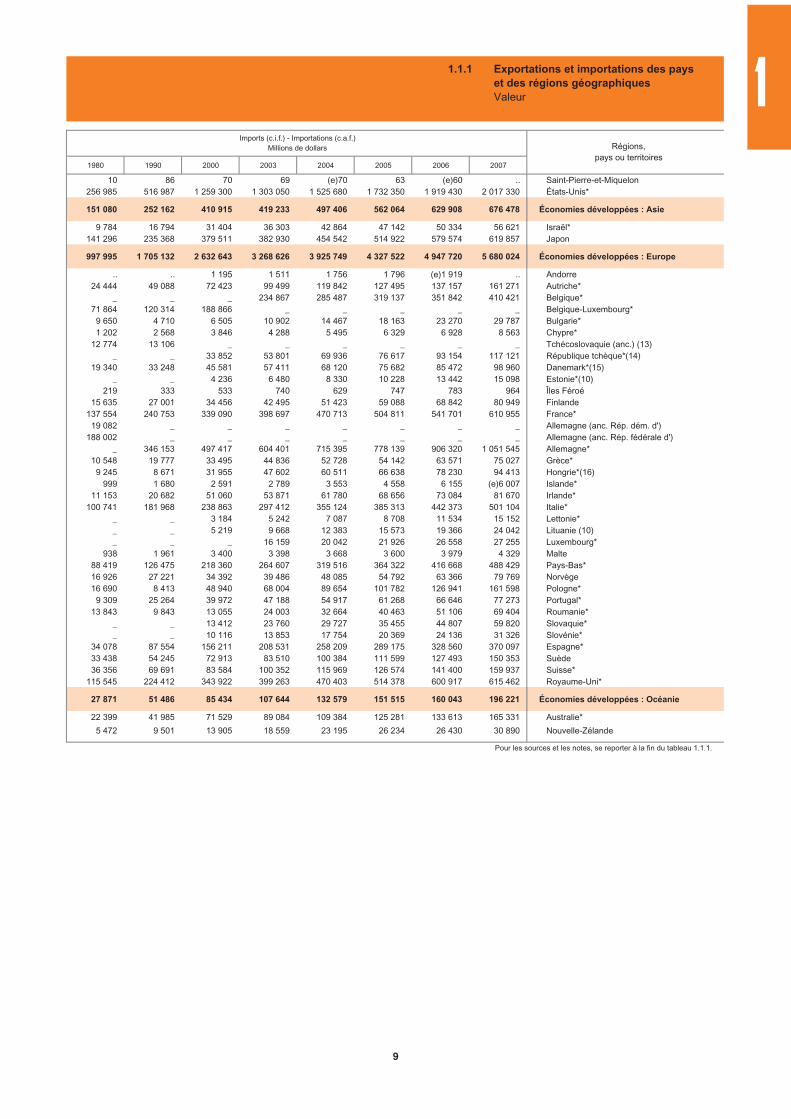
1980 1990 2000 2003 2004 2005 2006 2007
10 86 70 69 (e)70 63 (e)60 .. Saint-Pierre-et-Miquelon256 985 516 987 1 259 300 1 303 050 1 525 680 1 732 350 1 919 430 2 017 330 États-Unis*
151 080 252 162 410 915 419 233 497 406 562 064 629 908 676 478 Économies développées : Asie
9 784 16 794 31 404 36 303 42 864 47 142 50 334 56 621 Israël*141 296 235 368 379 511 382 930 454 542 514 922 579 574 619 857 Japon
997 995 1 705 132 2 632 643 3 268 626 3 925 749 4 327 522 4 947 720 5 680 024 Économies développées : Europe
.. .. 1 195 1 511 1 756 1 796 (e)1 919 .. Andorre24 444 49 088 72 423 99 499 119 842 127 495 137 157 161 271 Autriche*
_ _ _ 234 867 285 487 319 137 351 842 410 421 Belgique*71 864 120 314 188 866 _ _ _ _ _ Belgique-Luxembourg*
9 650 4 710 6 505 10 902 14 467 18 163 23 270 29 787 Bulgarie*1 202 2 568 3 846 4 288 5 495 6 329 6 928 8 563 Chypre*
12 774 13 106 _ _ _ _ _ _ Tchécoslovaquie (anc.) (13)_ _ 33 852 53 801 69 936 76 617 93 154 117 121 République tchèque*(14)
19 340 33 248 45 581 57 411 68 120 75 682 85 472 98 960 Danemark*(15)_ _ 4 236 6 480 8 330 10 228 13 442 15 098 Estonie*(10)
219 333 533 740 629 747 783 964 Îles Féroé15 635 27 001 34 456 42 495 51 423 59 088 68 842 80 949 Finlande
137 554 240 753 339 090 398 697 470 713 504 811 541 701 610 955 France*19 082 _ _ _ _ _ _ _ Allemagne (anc. Rép. dém. d')
188 002 _ _ _ _ _ _ _ Allemagne (anc. Rép. fédérale d')_ 346 153 497 417 604 401 715 395 778 139 906 320 1 051 545 Allemagne*
10 548 19 777 33 495 44 836 52 728 54 142 63 571 75 027 Grèce*9 245 8 671 31 955 47 602 60 511 66 638 78 230 94 413 Hongrie*(16)
999 1 680 2 591 2 789 3 553 4 558 6 155 (e)6 007 Islande*11 153 20 682 51 060 53 871 61 780 68 656 73 084 81 670 Irlande*
100 741 181 968 238 863 297 412 355 124 385 313 442 373 501 104 Italie*_ _ 3 184 5 242 7 087 8 708 11 534 15 152 Lettonie*_ _ 5 219 9 668 12 383 15 573 19 366 24 042 Lituanie (10)_ _ _ 16 159 20 042 21 926 26 558 27 255 Luxembourg*
938 1 961 3 400 3 398 3 668 3 600 3 979 4 329 Malte88 419 126 475 218 360 264 607 319 516 364 322 416 668 488 429 Pays-Bas*16 926 27 221 34 392 39 486 48 085 54 792 63 366 79 769 Norvège16 690 8 413 48 940 68 004 89 654 101 782 126 941 161 598 Pologne*
9 309 25 264 39 972 47 188 54 917 61 268 66 646 77 273 Portugal*13 843 9 843 13 055 24 003 32 664 40 463 51 106 69 404 Roumanie*
_ _ 13 412 23 760 29 727 35 455 44 807 59 820 Slovaquie*_ _ 10 116 13 853 17 754 20 369 24 136 31 326 Slovénie*
34 078 87 554 156 211 208 531 258 209 289 175 328 560 370 097 Espagne*33 438 54 245 72 913 83 510 100 384 111 599 127 493 150 353 Suède36 356 69 691 83 584 100 352 115 969 126 574 141 400 159 937 Suisse*
115 545 224 412 343 922 399 263 470 403 514 378 600 917 615 462 Royaume-Uni*
27 871 51 486 85 434 107 644 132 579 151 515 160 043 196 221 Économies développées : Océanie
22 399 41 985 71 529 89 084 109 384 125 281 133 613 165 331 Australie*
5 472 9 501 13 905 18 559 23 195 26 234 26 430 30 890 Nouvelle-Zélande
Pour les sources et les notes, se reporter à la fin du tableau 1.1.1.
Imports (c.i.f.) - Importations (c.a.f.)Millions de dollars Régions,
pays ou territoires
1.1.1 Exportations et importations des payset des régions géographiquesValeur 1
9
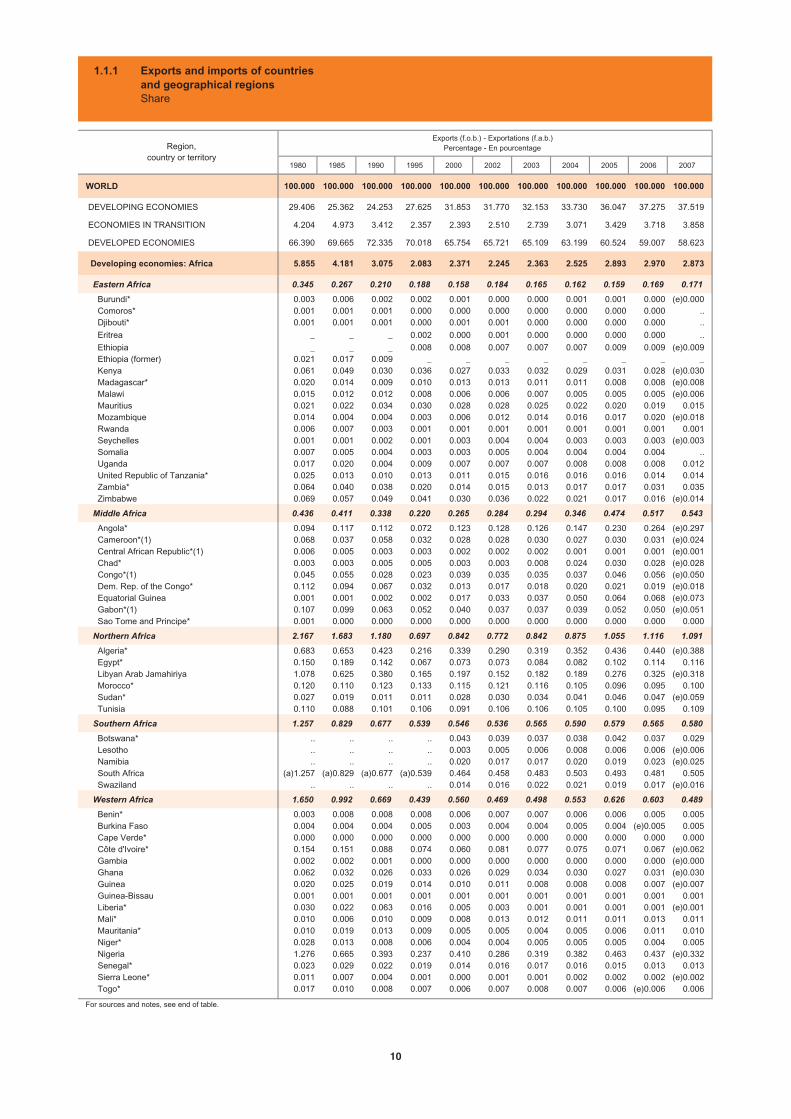
1980 1985 1990 1995 2000 2002 2003 2004 2005 2006 2007
WORLD 100.000 100.000 100.000 100.000 100.000 100.000 100.000 100.000 100.000 100.000 100.000
DEVELOPING ECONOMIES 29.406 25.362 24.253 27.625 31.853 31.770 32.153 33.730 36.047 37.275 37.519
ECONOMIES IN TRANSITION 4.204 4.973 3.412 2.357 2.393 2.510 2.739 3.071 3.429 3.718 3.858
DEVELOPED ECONOMIES 66.390 69.665 72.335 70.018 65.754 65.721 65.109 63.199 60.524 59.007 58.623
Developing economies: Africa 5.855 4.181 3.075 2.083 2.371 2.245 2.363 2.525 2.893 2.970 2.873
Eastern Africa 0.345 0.267 0.210 0.188 0.158 0.184 0.165 0.162 0.159 0.169 0.171
Burundi* 0.003 0.006 0.002 0.002 0.001 0.000 0.000 0.001 0.001 0.000 (e)0.000 Comoros* 0.001 0.001 0.001 0.000 0.000 0.000 0.000 0.000 0.000 0.000 .. Djibouti* 0.001 0.001 0.001 0.000 0.001 0.001 0.000 0.000 0.000 0.000 ..
Eritrea _ _ _ 0.002 0.000 0.001 0.000 0.000 0.000 0.000 .. Ethiopia _ _ _ 0.008 0.008 0.007 0.007 0.007 0.009 0.009 (e)0.009 Ethiopia (former) 0.021 0.017 0.009 _ _ _ _ _ _ _ _ Kenya 0.061 0.049 0.030 0.036 0.027 0.033 0.032 0.029 0.031 0.028 (e)0.030 Madagascar* 0.020 0.014 0.009 0.010 0.013 0.013 0.011 0.011 0.008 0.008 (e)0.008 Malawi 0.015 0.012 0.012 0.008 0.006 0.006 0.007 0.005 0.005 0.005 (e)0.006 Mauritius 0.021 0.022 0.034 0.030 0.028 0.028 0.025 0.022 0.020 0.019 0.015 Mozambique 0.014 0.004 0.004 0.003 0.006 0.012 0.014 0.016 0.017 0.020 (e)0.018 Rwanda 0.006 0.007 0.003 0.001 0.001 0.001 0.001 0.001 0.001 0.001 0.001 Seychelles 0.001 0.001 0.002 0.001 0.003 0.004 0.004 0.003 0.003 0.003 (e)0.003 Somalia 0.007 0.005 0.004 0.003 0.003 0.005 0.004 0.004 0.004 0.004 .. Uganda 0.017 0.020 0.004 0.009 0.007 0.007 0.007 0.008 0.008 0.008 0.012 United Republic of Tanzania* 0.025 0.013 0.010 0.013 0.011 0.015 0.016 0.016 0.016 0.014 0.014 Zambia* 0.064 0.040 0.038 0.020 0.014 0.015 0.013 0.017 0.017 0.031 0.035 Zimbabwe 0.069 0.057 0.049 0.041 0.030 0.036 0.022 0.021 0.017 0.016 (e)0.014
Middle Africa 0.436 0.411 0.338 0.220 0.265 0.284 0.294 0.346 0.474 0.517 0.543
Angola* 0.094 0.117 0.112 0.072 0.123 0.128 0.126 0.147 0.230 0.264 (e)0.297 Cameroon*(1) 0.068 0.037 0.058 0.032 0.028 0.028 0.030 0.027 0.030 0.031 (e)0.024 Central African Republic*(1) 0.006 0.005 0.003 0.003 0.002 0.002 0.002 0.001 0.001 0.001 (e)0.001 Chad* 0.003 0.003 0.005 0.005 0.003 0.003 0.008 0.024 0.030 0.028 (e)0.028 Congo*(1) 0.045 0.055 0.028 0.023 0.039 0.035 0.035 0.037 0.046 0.056 (e)0.050 Dem. Rep. of the Congo* 0.112 0.094 0.067 0.032 0.013 0.017 0.018 0.020 0.021 0.019 (e)0.018 Equatorial Guinea 0.001 0.001 0.002 0.002 0.017 0.033 0.037 0.050 0.064 0.068 (e)0.073 Gabon*(1) 0.107 0.099 0.063 0.052 0.040 0.037 0.037 0.039 0.052 0.050 (e)0.051 Sao Tome and Principe* 0.001 0.000 0.000 0.000 0.000 0.000 0.000 0.000 0.000 0.000 0.000
Northern Africa 2.167 1.683 1.180 0.697 0.842 0.772 0.842 0.875 1.055 1.116 1.091
Algeria* 0.683 0.653 0.423 0.216 0.339 0.290 0.319 0.352 0.436 0.440 (e)0.388 Egypt* 0.150 0.189 0.142 0.067 0.073 0.073 0.084 0.082 0.102 0.114 0.116 Libyan Arab Jamahiriya 1.078 0.625 0.380 0.165 0.197 0.152 0.182 0.189 0.276 0.325 (e)0.318 Morocco* 0.120 0.110 0.123 0.133 0.115 0.121 0.116 0.105 0.096 0.095 0.100 Sudan* 0.027 0.019 0.011 0.011 0.028 0.030 0.034 0.041 0.046 0.047 (e)0.059 Tunisia 0.110 0.088 0.101 0.106 0.091 0.106 0.106 0.105 0.100 0.095 0.109
Southern Africa 1.257 0.829 0.677 0.539 0.546 0.536 0.565 0.590 0.579 0.565 0.580
Botswana* .. .. .. .. 0.043 0.039 0.037 0.038 0.042 0.037 0.029 Lesotho .. .. .. .. 0.003 0.005 0.006 0.008 0.006 0.006 (e)0.006 Namibia .. .. .. .. 0.020 0.017 0.017 0.020 0.019 0.023 (e)0.025 South Africa (a)1.257 (a)0.829 (a)0.677 (a)0.539 0.464 0.458 0.483 0.503 0.493 0.481 0.505 Swaziland .. .. .. .. 0.014 0.016 0.022 0.021 0.019 0.017 (e)0.016
Western Africa 1.650 0.992 0.669 0.439 0.560 0.469 0.498 0.553 0.626 0.603 0.489
Benin* 0.003 0.008 0.008 0.008 0.006 0.007 0.007 0.006 0.006 0.005 0.005 Burkina Faso 0.004 0.004 0.004 0.005 0.003 0.004 0.004 0.005 0.004 (e)0.005 0.005 Cape Verde* 0.000 0.000 0.000 0.000 0.000 0.000 0.000 0.000 0.000 0.000 0.000 Côte d'Ivoire* 0.154 0.151 0.088 0.074 0.060 0.081 0.077 0.075 0.071 0.067 (e)0.062 Gambia 0.002 0.002 0.001 0.000 0.000 0.000 0.000 0.000 0.000 0.000 (e)0.000 Ghana 0.062 0.032 0.026 0.033 0.026 0.029 0.034 0.030 0.027 0.031 (e)0.030 Guinea 0.020 0.025 0.019 0.014 0.010 0.011 0.008 0.008 0.008 0.007 (e)0.007 Guinea-Bissau 0.001 0.001 0.001 0.001 0.001 0.001 0.001 0.001 0.001 0.001 0.001 Liberia* 0.030 0.022 0.063 0.016 0.005 0.003 0.001 0.001 0.001 0.001 (e)0.001 Mali* 0.010 0.006 0.010 0.009 0.008 0.013 0.012 0.011 0.011 0.013 0.011 Mauritania* 0.010 0.019 0.013 0.009 0.005 0.005 0.004 0.005 0.006 0.011 0.010 Niger* 0.028 0.013 0.008 0.006 0.004 0.004 0.005 0.005 0.005 0.004 0.005 Nigeria 1.276 0.665 0.393 0.237 0.410 0.286 0.319 0.382 0.463 0.437 (e)0.332 Senegal* 0.023 0.029 0.022 0.019 0.014 0.016 0.017 0.016 0.015 0.013 0.013 Sierra Leone* 0.011 0.007 0.004 0.001 0.000 0.001 0.001 0.002 0.002 0.002 (e)0.002 Togo* 0.017 0.010 0.008 0.007 0.006 0.007 0.008 0.007 0.006 (e)0.006 0.006
For sources and notes, see end of table.
Exports (f.o.b.) - Exportations (f.a.b.)Percentage - En pourcentageRegion,
country or territory
1.1.1 Exports and imports of countriesand geographical regionsShare
10
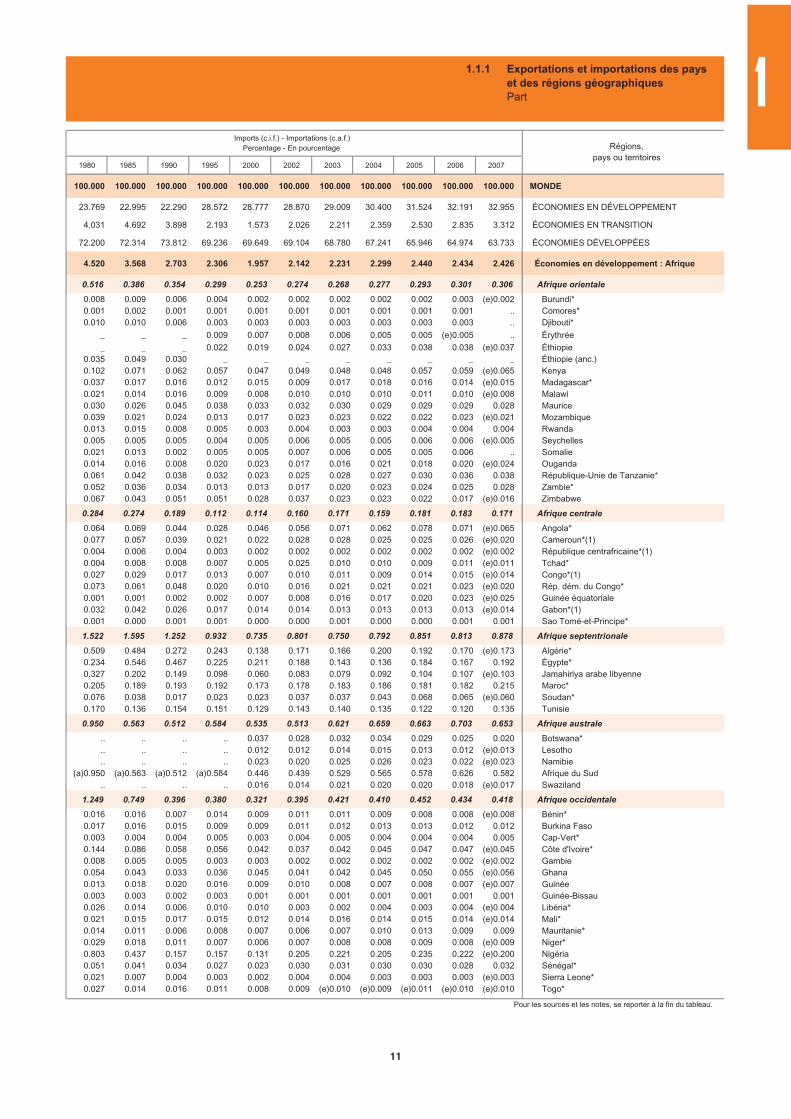
1980 1985 1990 1995 2000 2002 2003 2004 2005 2006 2007
100.000 100.000 100.000 100.000 100.000 100.000 100.000 100.000 100.000 100.000 100.000 MONDE
23.769 22.995 22.290 28.572 28.777 28.870 29.009 30.400 31.524 32.191 32.955 ÉCONOMIES EN DÉVELOPPEMENT
4.031 4.692 3.898 2.193 1.573 2.026 2.211 2.359 2.530 2.835 3.312 ÉCONOMIES EN TRANSITION
72.200 72.314 73.812 69.236 69.649 69.104 68.780 67.241 65.946 64.974 63.733 ÉCONOMIES DÉVELOPPÉES
4.520 3.568 2.703 2.306 1.957 2.142 2.231 2.299 2.440 2.434 2.426 Économies en développement : Afrique
0.516 0.386 0.354 0.299 0.253 0.274 0.268 0.277 0.293 0.301 0.306 Afrique orientale
0.008 0.009 0.006 0.004 0.002 0.002 0.002 0.002 0.002 0.003 (e)0.002 Burundi*0.001 0.002 0.001 0.001 0.001 0.001 0.001 0.001 0.001 0.001 .. Comores*0.010 0.010 0.006 0.003 0.003 0.003 0.003 0.003 0.003 0.003 .. Djibouti*
_ _ _ 0.009 0.007 0.008 0.006 0.005 0.005 (e)0.005 .. Érythrée_ _ _ 0.022 0.019 0.024 0.027 0.033 0.038 0.038 (e)0.037 Éthiopie
0.035 0.049 0.030 _ _ _ _ _ _ _ _ Éthiopie (anc.)0.102 0.071 0.062 0.057 0.047 0.049 0.048 0.048 0.057 0.059 (e)0.065 Kenya0.037 0.017 0.016 0.012 0.015 0.009 0.017 0.018 0.016 0.014 (e)0.015 Madagascar*0.021 0.014 0.016 0.009 0.008 0.010 0.010 0.010 0.011 0.010 (e)0.008 Malawi0.030 0.026 0.045 0.038 0.033 0.032 0.030 0.029 0.029 0.029 0.028 Maurice0.039 0.021 0.024 0.013 0.017 0.023 0.023 0.022 0.022 0.023 (e)0.021 Mozambique0.013 0.015 0.008 0.005 0.003 0.004 0.003 0.003 0.004 0.004 0.004 Rwanda0.005 0.005 0.005 0.004 0.005 0.006 0.005 0.005 0.006 0.006 (e)0.005 Seychelles0.021 0.013 0.002 0.005 0.005 0.007 0.006 0.005 0.005 0.006 .. Somalie0.014 0.016 0.008 0.020 0.023 0.017 0.016 0.021 0.018 0.020 (e)0.024 Ouganda0.061 0.042 0.038 0.032 0.023 0.025 0.028 0.027 0.030 0.036 0.038 République-Unie de Tanzanie*0.052 0.036 0.034 0.013 0.013 0.017 0.020 0.023 0.024 0.025 0.028 Zambie*0.067 0.043 0.051 0.051 0.028 0.037 0.023 0.023 0.022 0.017 (e)0.016 Zimbabwe
0.284 0.274 0.189 0.112 0.114 0.160 0.171 0.159 0.181 0.183 0.171 Afrique centrale
0.064 0.069 0.044 0.028 0.046 0.056 0.071 0.062 0.078 0.071 (e)0.065 Angola*0.077 0.057 0.039 0.021 0.022 0.028 0.028 0.025 0.025 0.026 (e)0.020 Cameroun*(1)0.004 0.006 0.004 0.003 0.002 0.002 0.002 0.002 0.002 0.002 (e)0.002 République centrafricaine*(1)0.004 0.008 0.008 0.007 0.005 0.025 0.010 0.010 0.009 0.011 (e)0.011 Tchad*0.027 0.029 0.017 0.013 0.007 0.010 0.011 0.009 0.014 0.015 (e)0.014 Congo*(1)0.073 0.061 0.048 0.020 0.010 0.016 0.021 0.021 0.021 0.023 (e)0.020 Rép. dém. du Congo*0.001 0.001 0.002 0.002 0.007 0.008 0.016 0.017 0.020 0.023 (e)0.025 Guinée équatoriale0.032 0.042 0.026 0.017 0.014 0.014 0.013 0.013 0.013 0.013 (e)0.014 Gabon*(1)0.001 0.000 0.001 0.001 0.000 0.000 0.001 0.000 0.000 0.001 0.001 Sao Tomé-et-Principe*
1.522 1.595 1.252 0.932 0.735 0.801 0.750 0.792 0.851 0.813 0.878 Afrique septentrionale
0.509 0.484 0.272 0.243 0.138 0.171 0.166 0.200 0.192 0.170 (e)0.173 Algérie*0.234 0.546 0.467 0.225 0.211 0.188 0.143 0.136 0.184 0.167 0.192 Égypte*0.327 0.202 0.149 0.098 0.060 0.083 0.079 0.092 0.104 0.107 (e)0.103 Jamahiriya arabe libyenne0.205 0.189 0.193 0.192 0.173 0.178 0.183 0.186 0.181 0.182 0.215 Maroc*0.076 0.038 0.017 0.023 0.023 0.037 0.037 0.043 0.068 0.065 (e)0.060 Soudan*0.170 0.136 0.154 0.151 0.129 0.143 0.140 0.135 0.122 0.120 0.135 Tunisie
0.950 0.563 0.512 0.584 0.535 0.513 0.621 0.659 0.663 0.703 0.653 Afrique australe
.. .. .. .. 0.037 0.028 0.032 0.034 0.029 0.025 0.020 Botswana*
.. .. .. .. 0.012 0.012 0.014 0.015 0.013 0.012 (e)0.013 Lesotho
.. .. .. .. 0.023 0.020 0.025 0.026 0.023 0.022 (e)0.023 Namibie(a)0.950 (a)0.563 (a)0.512 (a)0.584 0.446 0.439 0.529 0.565 0.578 0.626 0.582 Afrique du Sud
.. .. .. .. 0.016 0.014 0.021 0.020 0.020 0.018 (e)0.017 Swaziland
1.249 0.749 0.396 0.380 0.321 0.395 0.421 0.410 0.452 0.434 0.418 Afrique occidentale
0.016 0.016 0.007 0.014 0.009 0.011 0.011 0.009 0.008 0.008 (e)0.008 Bénin*0.017 0.016 0.015 0.009 0.009 0.011 0.012 0.013 0.013 0.012 0.012 Burkina Faso0.003 0.004 0.004 0.005 0.003 0.004 0.005 0.004 0.004 0.004 0.005 Cap-Vert*0.144 0.086 0.058 0.056 0.042 0.037 0.042 0.045 0.047 0.047 (e)0.045 Côte d'Ivoire*0.008 0.005 0.005 0.003 0.003 0.002 0.002 0.002 0.002 0.002 (e)0.002 Gambie0.054 0.043 0.033 0.036 0.045 0.041 0.042 0.045 0.050 0.055 (e)0.056 Ghana0.013 0.018 0.020 0.016 0.009 0.010 0.008 0.007 0.008 0.007 (e)0.007 Guinée0.003 0.003 0.002 0.003 0.001 0.001 0.001 0.001 0.001 0.001 0.001 Guinée-Bissau0.026 0.014 0.006 0.010 0.010 0.003 0.002 0.004 0.003 0.004 (e)0.004 Libéria*0.021 0.015 0.017 0.015 0.012 0.014 0.016 0.014 0.015 0.014 (e)0.014 Mali*0.014 0.011 0.006 0.008 0.007 0.006 0.007 0.010 0.013 0.009 0.009 Mauritanie*0.029 0.018 0.011 0.007 0.006 0.007 0.008 0.008 0.009 0.008 (e)0.009 Niger*0.803 0.437 0.157 0.157 0.131 0.205 0.221 0.205 0.235 0.222 (e)0.200 Nigéria0.051 0.041 0.034 0.027 0.023 0.030 0.031 0.030 0.030 0.028 0.032 Sénégal*0.021 0.007 0.004 0.003 0.002 0.004 0.004 0.003 0.003 0.003 (e)0.003 Sierra Leone*0.027 0.014 0.016 0.011 0.008 0.009 (e)0.010 (e)0.009 (e)0.011 (e)0.010 (e)0.010 Togo*
Pour les sources et les notes, se reporter à la fin du tableau.
Régions,pays ou territoires
Imports (c.i.f.) - Importations (c.a.f.)Percentage - En pourcentage
1.1.1 Exportations et importations des payset des régions géographiquesPart 1
11
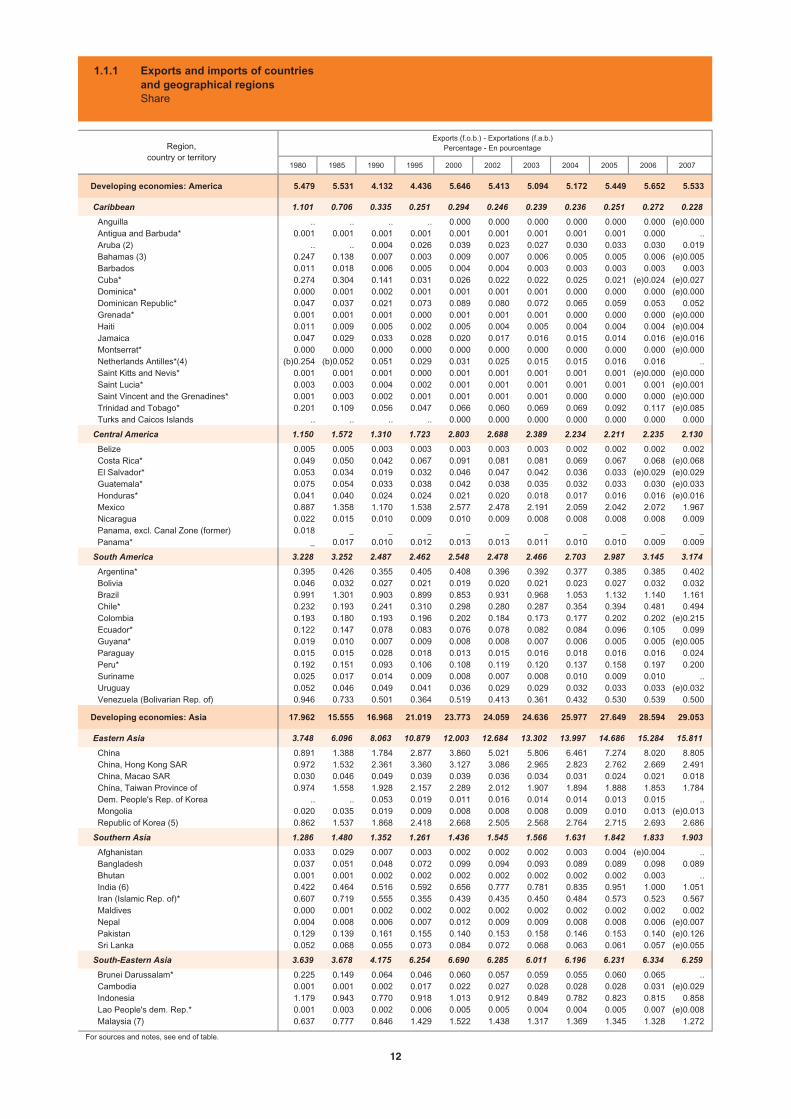
1980 1985 1990 1995 2000 2002 2003 2004 2005 2006 2007
Developing economies: America 5.479 5.531 4.132 4.436 5.646 5.413 5.094 5.172 5.449 5.652 5.533
Caribbean 1.101 0.706 0.335 0.251 0.294 0.246 0.239 0.236 0.251 0.272 0.228
Anguilla .. .. .. .. 0.000 0.000 0.000 0.000 0.000 0.000 (e)0.000 Antigua and Barbuda* 0.001 0.001 0.001 0.001 0.001 0.001 0.001 0.001 0.001 0.000 .. Aruba (2) .. .. 0.004 0.026 0.039 0.023 0.027 0.030 0.033 0.030 0.019 Bahamas (3) 0.247 0.138 0.007 0.003 0.009 0.007 0.006 0.005 0.005 0.006 (e)0.005 Barbados 0.011 0.018 0.006 0.005 0.004 0.004 0.003 0.003 0.003 0.003 0.003 Cuba* 0.274 0.304 0.141 0.031 0.026 0.022 0.022 0.025 0.021 (e)0.024 (e)0.027 Dominica* 0.000 0.001 0.002 0.001 0.001 0.001 0.001 0.000 0.000 0.000 (e)0.000 Dominican Republic* 0.047 0.037 0.021 0.073 0.089 0.080 0.072 0.065 0.059 0.053 0.052 Grenada* 0.001 0.001 0.001 0.000 0.001 0.001 0.001 0.000 0.000 0.000 (e)0.000 Haiti 0.011 0.009 0.005 0.002 0.005 0.004 0.005 0.004 0.004 0.004 (e)0.004 Jamaica 0.047 0.029 0.033 0.028 0.020 0.017 0.016 0.015 0.014 0.016 (e)0.016 Montserrat* 0.000 0.000 0.000 0.000 0.000 0.000 0.000 0.000 0.000 0.000 (e)0.000 Netherlands Antilles*(4) (b)0.254 (b)0.052 0.051 0.029 0.031 0.025 0.015 0.015 0.016 0.016 .. Saint Kitts and Nevis* 0.001 0.001 0.001 0.000 0.001 0.001 0.001 0.001 0.001 (e)0.000 (e)0.000 Saint Lucia* 0.003 0.003 0.004 0.002 0.001 0.001 0.001 0.001 0.001 0.001 (e)0.001 Saint Vincent and the Grenadines* 0.001 0.003 0.002 0.001 0.001 0.001 0.001 0.000 0.000 0.000 (e)0.000 Trinidad and Tobago* 0.201 0.109 0.056 0.047 0.066 0.060 0.069 0.069 0.092 0.117 (e)0.085 Turks and Caicos Islands .. .. .. .. 0.000 0.000 0.000 0.000 0.000 0.000 0.000
Central America 1.150 1.572 1.310 1.723 2.803 2.688 2.389 2.234 2.211 2.235 2.130
Belize 0.005 0.005 0.003 0.003 0.003 0.003 0.003 0.002 0.002 0.002 0.002 Costa Rica* 0.049 0.050 0.042 0.067 0.091 0.081 0.081 0.069 0.067 0.068 (e)0.068 El Salvador* 0.053 0.034 0.019 0.032 0.046 0.047 0.042 0.036 0.033 (e)0.029 (e)0.029 Guatemala* 0.075 0.054 0.033 0.038 0.042 0.038 0.035 0.032 0.033 0.030 (e)0.033 Honduras* 0.041 0.040 0.024 0.024 0.021 0.020 0.018 0.017 0.016 0.016 (e)0.016 Mexico 0.887 1.358 1.170 1.538 2.577 2.478 2.191 2.059 2.042 2.072 1.967 Nicaragua 0.022 0.015 0.010 0.009 0.010 0.009 0.008 0.008 0.008 0.008 0.009 Panama, excl. Canal Zone (former) 0.018 _ _ _ _ _ _ _ _ _ _ Panama* _ 0.017 0.010 0.012 0.013 0.013 0.011 0.010 0.010 0.009 0.009
South America 3.228 3.252 2.487 2.462 2.548 2.478 2.466 2.703 2.987 3.145 3.174
Argentina* 0.395 0.426 0.355 0.405 0.408 0.396 0.392 0.377 0.385 0.385 0.402 Bolivia 0.046 0.032 0.027 0.021 0.019 0.020 0.021 0.023 0.027 0.032 0.032 Brazil 0.991 1.301 0.903 0.899 0.853 0.931 0.968 1.053 1.132 1.140 1.161 Chile* 0.232 0.193 0.241 0.310 0.298 0.280 0.287 0.354 0.394 0.481 0.494 Colombia 0.193 0.180 0.193 0.196 0.202 0.184 0.173 0.177 0.202 0.202 (e)0.215 Ecuador* 0.122 0.147 0.078 0.083 0.076 0.078 0.082 0.084 0.096 0.105 0.099 Guyana* 0.019 0.010 0.007 0.009 0.008 0.008 0.007 0.006 0.005 0.005 (e)0.005 Paraguay 0.015 0.015 0.028 0.018 0.013 0.015 0.016 0.018 0.016 0.016 0.024 Peru* 0.192 0.151 0.093 0.106 0.108 0.119 0.120 0.137 0.158 0.197 0.200 Suriname 0.025 0.017 0.014 0.009 0.008 0.007 0.008 0.010 0.009 0.010 .. Uruguay 0.052 0.046 0.049 0.041 0.036 0.029 0.029 0.032 0.033 0.033 (e)0.032 Venezuela (Bolivarian Rep. of) 0.946 0.733 0.501 0.364 0.519 0.413 0.361 0.432 0.530 0.539 0.500
Developing economies: Asia 17.962 15.555 16.968 21.019 23.773 24.059 24.636 25.977 27.649 28.594 29.053
Eastern Asia 3.748 6.096 8.063 10.879 12.003 12.684 13.302 13.997 14.686 15.284 15.811
China 0.891 1.388 1.784 2.877 3.860 5.021 5.806 6.461 7.274 8.020 8.805 China, Hong Kong SAR 0.972 1.532 2.361 3.360 3.127 3.086 2.965 2.823 2.762 2.669 2.491 China, Macao SAR 0.030 0.046 0.049 0.039 0.039 0.036 0.034 0.031 0.024 0.021 0.018 China, Taiwan Province of 0.974 1.558 1.928 2.157 2.289 2.012 1.907 1.894 1.888 1.853 1.784 Dem. People's Rep. of Korea .. .. 0.053 0.019 0.011 0.016 0.014 0.014 0.013 0.015 .. Mongolia 0.020 0.035 0.019 0.009 0.008 0.008 0.008 0.009 0.010 0.013 (e)0.013 Republic of Korea (5) 0.862 1.537 1.868 2.418 2.668 2.505 2.568 2.764 2.715 2.693 2.686
Southern Asia 1.286 1.480 1.352 1.261 1.436 1.545 1.566 1.631 1.842 1.833 1.903
Afghanistan 0.033 0.029 0.007 0.003 0.002 0.002 0.002 0.003 0.004 (e)0.004 .. Bangladesh 0.037 0.051 0.048 0.072 0.099 0.094 0.093 0.089 0.089 0.098 0.089 Bhutan 0.001 0.001 0.002 0.002 0.002 0.002 0.002 0.002 0.002 0.003 .. India (6) 0.422 0.464 0.516 0.592 0.656 0.777 0.781 0.835 0.951 1.000 1.051 Iran (Islamic Rep. of)* 0.607 0.719 0.555 0.355 0.439 0.435 0.450 0.484 0.573 0.523 0.567 Maldives 0.000 0.001 0.002 0.002 0.002 0.002 0.002 0.002 0.002 0.002 0.002 Nepal 0.004 0.008 0.006 0.007 0.012 0.009 0.009 0.008 0.008 0.006 (e)0.007 Pakistan 0.129 0.139 0.161 0.155 0.140 0.153 0.158 0.146 0.153 0.140 (e)0.126 Sri Lanka 0.052 0.068 0.055 0.073 0.084 0.072 0.068 0.063 0.061 0.057 (e)0.055
South-Eastern Asia 3.639 3.678 4.175 6.254 6.690 6.285 6.011 6.196 6.231 6.334 6.259
Brunei Darussalam* 0.225 0.149 0.064 0.046 0.060 0.057 0.059 0.055 0.060 0.065 .. Cambodia 0.001 0.001 0.002 0.017 0.022 0.027 0.028 0.028 0.028 0.031 (e)0.029 Indonesia 1.179 0.943 0.770 0.918 1.013 0.912 0.849 0.782 0.823 0.815 0.858 Lao People's dem. Rep.* 0.001 0.003 0.002 0.006 0.005 0.005 0.004 0.004 0.005 0.007 (e)0.008 Malaysia (7) 0.637 0.777 0.846 1.429 1.522 1.438 1.317 1.369 1.345 1.328 1.272
For sources and notes, see end of table.
Region,country or territory
Exports (f.o.b.) - Exportations (f.a.b.)Percentage - En pourcentage
1.1.1 Exports and imports of countriesand geographical regionsShare
12
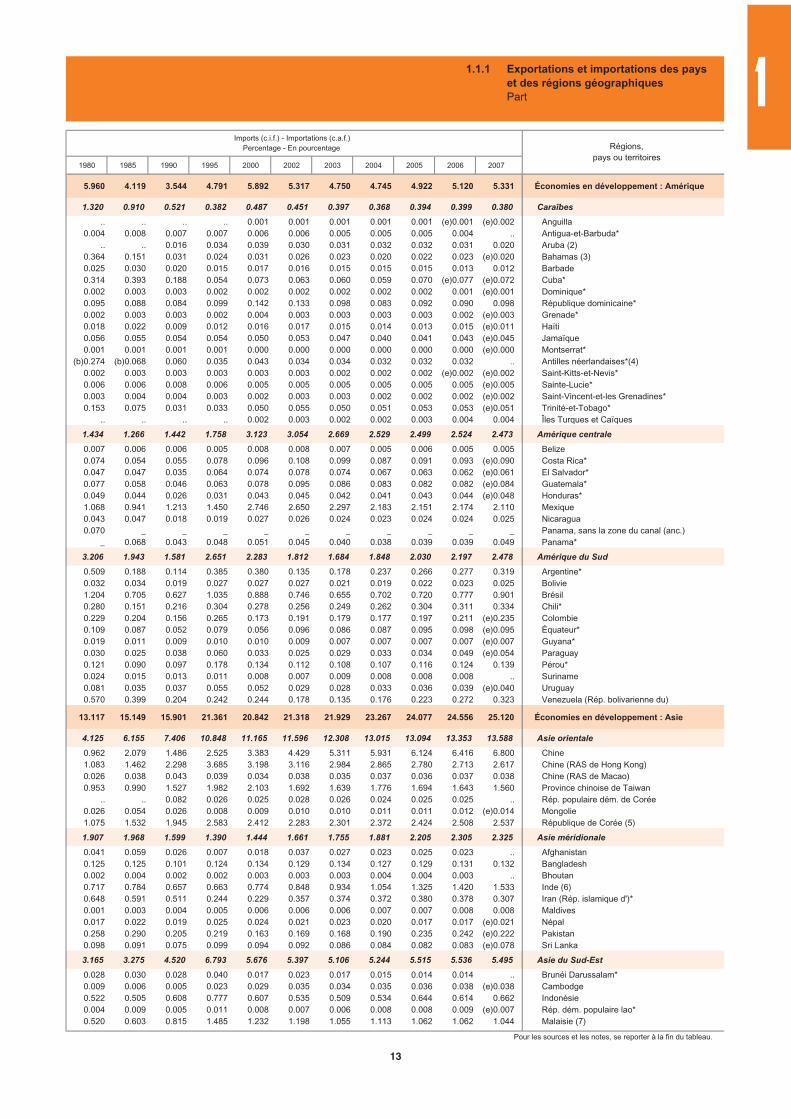
1980 1985 1990 1995 2000 2002 2003 2004 2005 2006 2007
5.960 4.119 3.544 4.791 5.892 5.317 4.750 4.745 4.922 5.120 5.331 Économies en développement : Amérique
1.320 0.910 0.521 0.382 0.487 0.451 0.397 0.368 0.394 0.399 0.380 Caraïbes
.. .. .. .. 0.001 0.001 0.001 0.001 0.001 (e)0.001 (e)0.002 Anguilla0.004 0.008 0.007 0.007 0.006 0.006 0.005 0.005 0.005 0.004 .. Antigua-et-Barbuda*
.. .. 0.016 0.034 0.039 0.030 0.031 0.032 0.032 0.031 0.020 Aruba (2)0.364 0.151 0.031 0.024 0.031 0.026 0.023 0.020 0.022 0.023 (e)0.020 Bahamas (3)0.025 0.030 0.020 0.015 0.017 0.016 0.015 0.015 0.015 0.013 0.012 Barbade0.314 0.393 0.188 0.054 0.073 0.063 0.060 0.059 0.070 (e)0.077 (e)0.072 Cuba*0.002 0.003 0.003 0.002 0.002 0.002 0.002 0.002 0.002 0.001 (e)0.001 Dominique*0.095 0.088 0.084 0.099 0.142 0.133 0.098 0.083 0.092 0.090 0.098 République dominicaine*0.002 0.003 0.003 0.002 0.004 0.003 0.003 0.003 0.003 0.002 (e)0.003 Grenade*0.018 0.022 0.009 0.012 0.016 0.017 0.015 0.014 0.013 0.015 (e)0.011 Haïti0.056 0.055 0.054 0.054 0.050 0.053 0.047 0.040 0.041 0.043 (e)0.045 Jamaïque0.001 0.001 0.001 0.001 0.000 0.000 0.000 0.000 0.000 0.000 (e)0.000 Montserrat*
(b)0.274 (b)0.068 0.060 0.035 0.043 0.034 0.034 0.032 0.032 0.032 .. Antilles néerlandaises*(4)0.002 0.003 0.003 0.003 0.003 0.003 0.002 0.002 0.002 (e)0.002 (e)0.002 Saint-Kitts-et-Nevis*0.006 0.006 0.008 0.006 0.005 0.005 0.005 0.005 0.005 0.005 (e)0.005 Sainte-Lucie*0.003 0.004 0.004 0.003 0.002 0.003 0.003 0.002 0.002 0.002 (e)0.002 Saint-Vincent-et-les Grenadines*0.153 0.075 0.031 0.033 0.050 0.055 0.050 0.051 0.053 0.053 (e)0.051 Trinité-et-Tobago*
.. .. .. .. 0.002 0.003 0.002 0.002 0.003 0.004 0.004 Îles Turques et Caïques
1.434 1.266 1.442 1.758 3.123 3.054 2.669 2.529 2.499 2.524 2.473 Amérique centrale
0.007 0.006 0.006 0.005 0.008 0.008 0.007 0.005 0.006 0.005 0.005 Belize0.074 0.054 0.055 0.078 0.096 0.108 0.099 0.087 0.091 0.093 (e)0.090 Costa Rica*0.047 0.047 0.035 0.064 0.074 0.078 0.074 0.067 0.063 0.062 (e)0.061 El Salvador*0.077 0.058 0.046 0.063 0.078 0.095 0.086 0.083 0.082 0.082 (e)0.084 Guatemala*0.049 0.044 0.026 0.031 0.043 0.045 0.042 0.041 0.043 0.044 (e)0.048 Honduras*1.068 0.941 1.213 1.450 2.746 2.650 2.297 2.183 2.151 2.174 2.110 Mexique0.043 0.047 0.018 0.019 0.027 0.026 0.024 0.023 0.024 0.024 0.025 Nicaragua0.070 _ _ _ _ _ _ _ _ _ _ Panama, sans la zone du canal (anc.)
_ 0.068 0.043 0.048 0.051 0.045 0.040 0.038 0.039 0.039 0.049 Panama*
3.206 1.943 1.581 2.651 2.283 1.812 1.684 1.848 2.030 2.197 2.478 Amérique du Sud
0.509 0.188 0.114 0.385 0.380 0.135 0.178 0.237 0.266 0.277 0.319 Argentine*0.032 0.034 0.019 0.027 0.027 0.027 0.021 0.019 0.022 0.023 0.025 Bolivie1.204 0.705 0.627 1.035 0.888 0.746 0.655 0.702 0.720 0.777 0.901 Brésil0.280 0.151 0.216 0.304 0.278 0.256 0.249 0.262 0.304 0.311 0.334 Chili*0.229 0.204 0.156 0.265 0.173 0.191 0.179 0.177 0.197 0.211 (e)0.235 Colombie0.109 0.087 0.052 0.079 0.056 0.096 0.086 0.087 0.095 0.098 (e)0.095 Équateur*0.019 0.011 0.009 0.010 0.010 0.009 0.007 0.007 0.007 0.007 (e)0.007 Guyana*0.030 0.025 0.038 0.060 0.033 0.025 0.029 0.033 0.034 0.049 (e)0.054 Paraguay0.121 0.090 0.097 0.178 0.134 0.112 0.108 0.107 0.116 0.124 0.139 Pérou*0.024 0.015 0.013 0.011 0.008 0.007 0.009 0.008 0.008 0.008 .. Suriname0.081 0.035 0.037 0.055 0.052 0.029 0.028 0.033 0.036 0.039 (e)0.040 Uruguay0.570 0.399 0.204 0.242 0.244 0.178 0.135 0.176 0.223 0.272 0.323 Venezuela (Rép. bolivarienne du)
13.117 15.149 15.901 21.361 20.842 21.318 21.929 23.267 24.077 24.556 25.120 Économies en développement : Asie
4.125 6.155 7.406 10.848 11.165 11.596 12.308 13.015 13.094 13.353 13.588 Asie orientale
0.962 2.079 1.486 2.525 3.383 4.429 5.311 5.931 6.124 6.416 6.800 Chine1.083 1.462 2.298 3.685 3.198 3.116 2.984 2.865 2.780 2.713 2.617 Chine (RAS de Hong Kong)0.026 0.038 0.043 0.039 0.034 0.038 0.035 0.037 0.036 0.037 0.038 Chine (RAS de Macao)0.953 0.990 1.527 1.982 2.103 1.692 1.639 1.776 1.694 1.643 1.560 Province chinoise de Taiwan
.. .. 0.082 0.026 0.025 0.028 0.026 0.024 0.025 0.025 .. Rép. populaire dém. de Corée0.026 0.054 0.026 0.008 0.009 0.010 0.010 0.011 0.011 0.012 (e)0.014 Mongolie1.075 1.532 1.945 2.583 2.412 2.283 2.301 2.372 2.424 2.508 2.537 République de Corée (5)
1.907 1.968 1.599 1.390 1.444 1.661 1.755 1.881 2.205 2.305 2.325 Asie méridionale
0.041 0.059 0.026 0.007 0.018 0.037 0.027 0.023 0.025 0.023 .. Afghanistan0.125 0.125 0.101 0.124 0.134 0.129 0.134 0.127 0.129 0.131 0.132 Bangladesh0.002 0.004 0.002 0.002 0.003 0.003 0.003 0.004 0.004 0.003 .. Bhoutan0.717 0.784 0.657 0.663 0.774 0.848 0.934 1.054 1.325 1.420 1.533 Inde (6)0.648 0.591 0.511 0.244 0.229 0.357 0.374 0.372 0.380 0.378 0.307 Iran (Rép. islamique d')*0.001 0.003 0.004 0.005 0.006 0.006 0.006 0.007 0.007 0.008 0.008 Maldives0.017 0.022 0.019 0.025 0.024 0.021 0.023 0.020 0.017 0.017 (e)0.021 Népal0.258 0.290 0.205 0.219 0.163 0.169 0.168 0.190 0.235 0.242 (e)0.222 Pakistan0.098 0.091 0.075 0.099 0.094 0.092 0.086 0.084 0.082 0.083 (e)0.078 Sri Lanka
3.165 3.275 4.520 6.793 5.676 5.397 5.106 5.244 5.515 5.536 5.495 Asie du Sud-Est
0.028 0.030 0.028 0.040 0.017 0.023 0.017 0.015 0.014 0.014 .. Brunéi Darussalam*0.009 0.006 0.005 0.023 0.029 0.035 0.034 0.035 0.036 0.038 (e)0.038 Cambodge0.522 0.505 0.608 0.777 0.607 0.535 0.509 0.534 0.644 0.614 0.662 Indonésie0.004 0.009 0.005 0.011 0.008 0.007 0.006 0.008 0.008 0.009 (e)0.007 Rép. dém. populaire lao*0.520 0.603 0.815 1.485 1.232 1.198 1.055 1.113 1.062 1.062 1.044 Malaisie (7)
Pour les sources et les notes, se reporter à la fin du tableau.
Imports (c.i.f.) - Importations (c.a.f.)Percentage - En pourcentage Régions,
pays ou territoires
1.1.1 Exportations et importations des payset des régions géographiquesPart 1
13
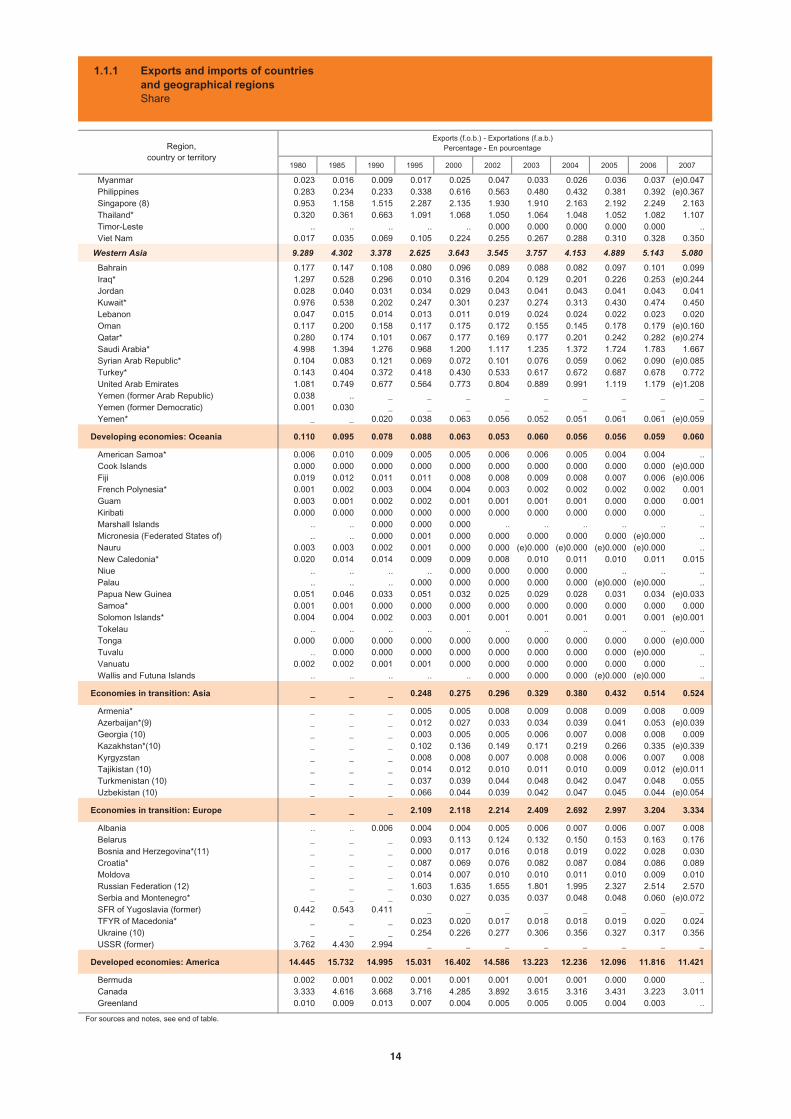
1980 1985 1990 1995 2000 2002 2003 2004 2005 2006 2007
Myanmar 0.023 0.016 0.009 0.017 0.025 0.047 0.033 0.026 0.036 0.037 (e)0.047 Philippines 0.283 0.234 0.233 0.338 0.616 0.563 0.480 0.432 0.381 0.392 (e)0.367 Singapore (8) 0.953 1.158 1.515 2.287 2.135 1.930 1.910 2.163 2.192 2.249 2.163 Thailand* 0.320 0.361 0.663 1.091 1.068 1.050 1.064 1.048 1.052 1.082 1.107 Timor-Leste .. .. .. .. .. 0.000 0.000 0.000 0.000 0.000 .. Viet Nam 0.017 0.035 0.069 0.105 0.224 0.255 0.267 0.288 0.310 0.328 0.350
Western Asia 9.289 4.302 3.378 2.625 3.643 3.545 3.757 4.153 4.889 5.143 5.080
Bahrain 0.177 0.147 0.108 0.080 0.096 0.089 0.088 0.082 0.097 0.101 0.099 Iraq* 1.297 0.528 0.296 0.010 0.316 0.204 0.129 0.201 0.226 0.253 (e)0.244 Jordan 0.028 0.040 0.031 0.034 0.029 0.043 0.041 0.043 0.041 0.043 0.041 Kuwait* 0.976 0.538 0.202 0.247 0.301 0.237 0.274 0.313 0.430 0.474 0.450 Lebanon 0.047 0.015 0.014 0.013 0.011 0.019 0.024 0.024 0.022 0.023 0.020 Oman 0.117 0.200 0.158 0.117 0.175 0.172 0.155 0.145 0.178 0.179 (e)0.160 Qatar* 0.280 0.174 0.101 0.067 0.177 0.169 0.177 0.201 0.242 0.282 (e)0.274 Saudi Arabia* 4.998 1.394 1.276 0.968 1.200 1.117 1.235 1.372 1.724 1.783 1.667 Syrian Arab Republic* 0.104 0.083 0.121 0.069 0.072 0.101 0.076 0.059 0.062 0.090 (e)0.085 Turkey* 0.143 0.404 0.372 0.418 0.430 0.533 0.617 0.672 0.687 0.678 0.772 United Arab Emirates 1.081 0.749 0.677 0.564 0.773 0.804 0.889 0.991 1.119 1.179 (e)1.208 Yemen (former Arab Republic) 0.038 .. _ _ _ _ _ _ _ _ _ Yemen (former Democratic) 0.001 0.030 _ _ _ _ _ _ _ _ _ Yemen* _ _ 0.020 0.038 0.063 0.056 0.052 0.051 0.061 0.061 (e)0.059
Developing economies: Oceania 0.110 0.095 0.078 0.088 0.063 0.053 0.060 0.056 0.056 0.059 0.060
American Samoa* 0.006 0.010 0.009 0.005 0.005 0.006 0.006 0.005 0.004 0.004 .. Cook Islands 0.000 0.000 0.000 0.000 0.000 0.000 0.000 0.000 0.000 0.000 (e)0.000 Fiji 0.019 0.012 0.011 0.011 0.008 0.008 0.009 0.008 0.007 0.006 (e)0.006 French Polynesia* 0.001 0.002 0.003 0.004 0.004 0.003 0.002 0.002 0.002 0.002 0.001 Guam 0.003 0.001 0.002 0.002 0.001 0.001 0.001 0.001 0.000 0.000 0.001 Kiribati 0.000 0.000 0.000 0.000 0.000 0.000 0.000 0.000 0.000 0.000 .. Marshall Islands .. .. 0.000 0.000 0.000 .. .. .. .. .. .. Micronesia (Federated States of) .. .. 0.000 0.001 0.000 0.000 0.000 0.000 0.000 (e)0.000 .. Nauru 0.003 0.003 0.002 0.001 0.000 0.000 (e)0.000 (e)0.000 (e)0.000 (e)0.000 .. New Caledonia* 0.020 0.014 0.014 0.009 0.009 0.008 0.010 0.011 0.010 0.011 0.015 Niue .. .. .. .. 0.000 0.000 0.000 0.000 .. .. .. Palau .. .. .. 0.000 0.000 0.000 0.000 0.000 (e)0.000 (e)0.000 .. Papua New Guinea 0.051 0.046 0.033 0.051 0.032 0.025 0.029 0.028 0.031 0.034 (e)0.033 Samoa* 0.001 0.001 0.000 0.000 0.000 0.000 0.000 0.000 0.000 0.000 0.000 Solomon Islands* 0.004 0.004 0.002 0.003 0.001 0.001 0.001 0.001 0.001 0.001 (e)0.001 Tokelau .. .. .. .. .. .. .. .. .. .. .. Tonga 0.000 0.000 0.000 0.000 0.000 0.000 0.000 0.000 0.000 0.000 (e)0.000 Tuvalu .. 0.000 0.000 0.000 0.000 0.000 0.000 0.000 0.000 (e)0.000 .. Vanuatu 0.002 0.002 0.001 0.001 0.000 0.000 0.000 0.000 0.000 0.000 .. Wallis and Futuna Islands .. .. .. .. .. 0.000 0.000 0.000 (e)0.000 (e)0.000 ..
Economies in transition: Asia _ _ _ 0.248 0.275 0.296 0.329 0.380 0.432 0.514 0.524
Armenia* _ _ _ 0.005 0.005 0.008 0.009 0.008 0.009 0.008 0.009 Azerbaijan*(9) _ _ _ 0.012 0.027 0.033 0.034 0.039 0.041 0.053 (e)0.039 Georgia (10) _ _ _ 0.003 0.005 0.005 0.006 0.007 0.008 0.008 0.009 Kazakhstan*(10) _ _ _ 0.102 0.136 0.149 0.171 0.219 0.266 0.335 (e)0.339 Kyrgyzstan _ _ _ 0.008 0.008 0.007 0.008 0.008 0.006 0.007 0.008 Tajikistan (10) _ _ _ 0.014 0.012 0.010 0.011 0.010 0.009 0.012 (e)0.011 Turkmenistan (10) _ _ _ 0.037 0.039 0.044 0.048 0.042 0.047 0.048 0.055 Uzbekistan (10) _ _ _ 0.066 0.044 0.039 0.042 0.047 0.045 0.044 (e)0.054
Economies in transition: Europe _ _ _ 2.109 2.118 2.214 2.409 2.692 2.997 3.204 3.334
Albania .. .. 0.006 0.004 0.004 0.005 0.006 0.007 0.006 0.007 0.008 Belarus _ _ _ 0.093 0.113 0.124 0.132 0.150 0.153 0.163 0.176 Bosnia and Herzegovina*(11) _ _ _ 0.000 0.017 0.016 0.018 0.019 0.022 0.028 0.030 Croatia* _ _ _ 0.087 0.069 0.076 0.082 0.087 0.084 0.086 0.089 Moldova _ _ _ 0.014 0.007 0.010 0.010 0.011 0.010 0.009 0.010 Russian Federation (12) _ _ _ 1.603 1.635 1.655 1.801 1.995 2.327 2.514 2.570 Serbia and Montenegro* _ _ _ 0.030 0.027 0.035 0.037 0.048 0.048 0.060 (e)0.072 SFR of Yugoslavia (former) 0.442 0.543 0.411 _ _ _ _ _ _ _ _ TFYR of Macedonia* _ _ _ 0.023 0.020 0.017 0.018 0.018 0.019 0.020 0.024 Ukraine (10) _ _ _ 0.254 0.226 0.277 0.306 0.356 0.327 0.317 0.356 USSR (former) 3.762 4.430 2.994 _ _ _ _ _ _ _ _
Developed economies: America 14.445 15.732 14.995 15.031 16.402 14.586 13.223 12.236 12.096 11.816 11.421
Bermuda 0.002 0.001 0.002 0.001 0.001 0.001 0.001 0.001 0.000 0.000 .. Canada 3.333 4.616 3.668 3.716 4.285 3.892 3.615 3.316 3.431 3.223 3.011 Greenland 0.010 0.009 0.013 0.007 0.004 0.005 0.005 0.005 0.004 0.003 ..
For sources and notes, see end of table.
Region,country or territory
Exports (f.o.b.) - Exportations (f.a.b.)Percentage - En pourcentage
1.1.1 Exports and imports of countriesand geographical regionsShare
14
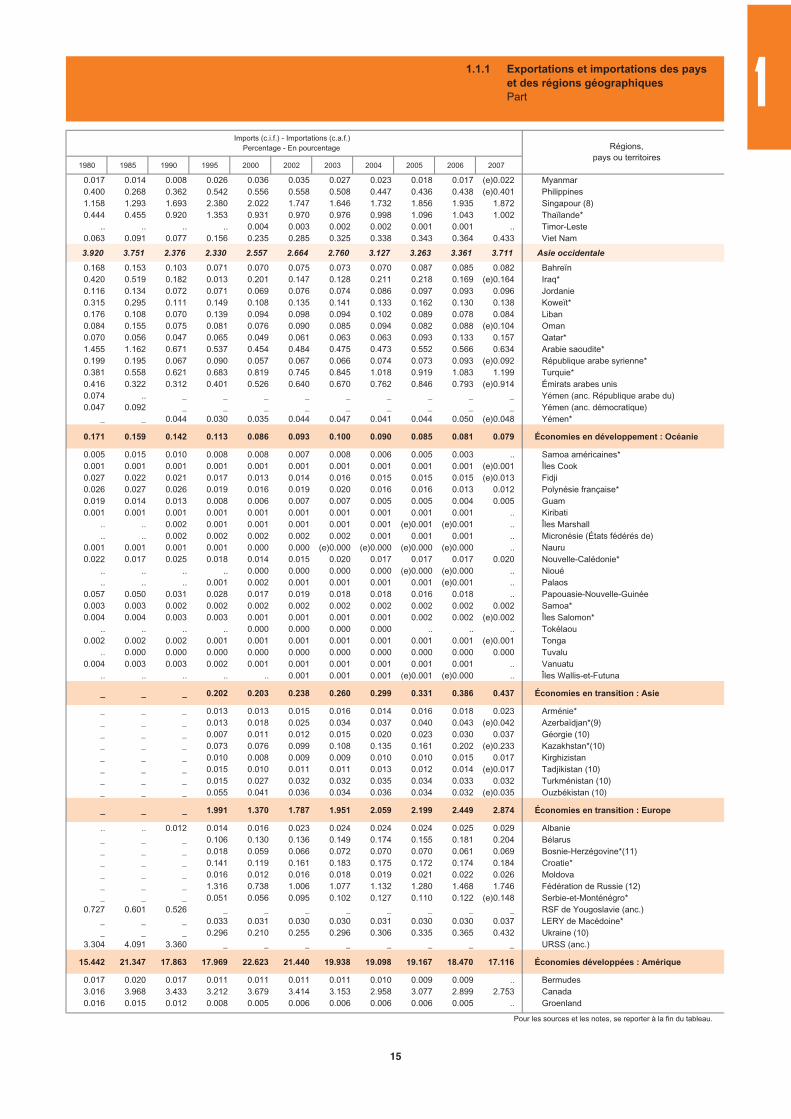
1980 1985 1990 1995 2000 2002 2003 2004 2005 2006 2007
0.017 0.014 0.008 0.026 0.036 0.035 0.027 0.023 0.018 0.017 (e)0.022 Myanmar0.400 0.268 0.362 0.542 0.556 0.558 0.508 0.447 0.436 0.438 (e)0.401 Philippines1.158 1.293 1.693 2.380 2.022 1.747 1.646 1.732 1.856 1.935 1.872 Singapour (8)0.444 0.455 0.920 1.353 0.931 0.970 0.976 0.998 1.096 1.043 1.002 Thaïlande*
.. .. .. .. 0.004 0.003 0.002 0.002 0.001 0.001 .. Timor-Leste0.063 0.091 0.077 0.156 0.235 0.285 0.325 0.338 0.343 0.364 0.433 Viet Nam
3.920 3.751 2.376 2.330 2.557 2.664 2.760 3.127 3.263 3.361 3.711 Asie occidentale
0.168 0.153 0.103 0.071 0.070 0.075 0.073 0.070 0.087 0.085 0.082 Bahreïn0.420 0.519 0.182 0.013 0.201 0.147 0.128 0.211 0.218 0.169 (e)0.164 Iraq*0.116 0.134 0.072 0.071 0.069 0.076 0.074 0.086 0.097 0.093 0.096 Jordanie0.315 0.295 0.111 0.149 0.108 0.135 0.141 0.133 0.162 0.130 0.138 Koweït*0.176 0.108 0.070 0.139 0.094 0.098 0.094 0.102 0.089 0.078 0.084 Liban0.084 0.155 0.075 0.081 0.076 0.090 0.085 0.094 0.082 0.088 (e)0.104 Oman0.070 0.056 0.047 0.065 0.049 0.061 0.063 0.063 0.093 0.133 0.157 Qatar*1.455 1.162 0.671 0.537 0.454 0.484 0.475 0.473 0.552 0.566 0.634 Arabie saoudite*0.199 0.195 0.067 0.090 0.057 0.067 0.066 0.074 0.073 0.093 (e)0.092 République arabe syrienne*0.381 0.558 0.621 0.683 0.819 0.745 0.845 1.018 0.919 1.083 1.199 Turquie*0.416 0.322 0.312 0.401 0.526 0.640 0.670 0.762 0.846 0.793 (e)0.914 Émirats arabes unis0.074 .. _ _ _ _ _ _ _ _ _ Yémen (anc. République arabe du)0.047 0.092 _ _ _ _ _ _ _ _ _ Yémen (anc. démocratique)
_ _ 0.044 0.030 0.035 0.044 0.047 0.041 0.044 0.050 (e)0.048 Yémen*
0.171 0.159 0.142 0.113 0.086 0.093 0.100 0.090 0.085 0.081 0.079 Économies en développement : Océanie
0.005 0.015 0.010 0.008 0.008 0.007 0.008 0.006 0.005 0.003 .. Samoa américaines*0.001 0.001 0.001 0.001 0.001 0.001 0.001 0.001 0.001 0.001 (e)0.001 Îles Cook0.027 0.022 0.021 0.017 0.013 0.014 0.016 0.015 0.015 0.015 (e)0.013 Fidji0.026 0.027 0.026 0.019 0.016 0.019 0.020 0.016 0.016 0.013 0.012 Polynésie française*0.019 0.014 0.013 0.008 0.006 0.007 0.007 0.005 0.005 0.004 0.005 Guam0.001 0.001 0.001 0.001 0.001 0.001 0.001 0.001 0.001 0.001 .. Kiribati
.. .. 0.002 0.001 0.001 0.001 0.001 0.001 (e)0.001 (e)0.001 .. Îles Marshall
.. .. 0.002 0.002 0.002 0.002 0.002 0.001 0.001 0.001 .. Micronésie (États fédérés de)0.001 0.001 0.001 0.001 0.000 0.000 (e)0.000 (e)0.000 (e)0.000 (e)0.000 .. Nauru0.022 0.017 0.025 0.018 0.014 0.015 0.020 0.017 0.017 0.017 0.020 Nouvelle-Calédonie*
.. .. .. .. 0.000 0.000 0.000 0.000 (e)0.000 (e)0.000 .. Nioué
.. .. .. 0.001 0.002 0.001 0.001 0.001 0.001 (e)0.001 .. Palaos0.057 0.050 0.031 0.028 0.017 0.019 0.018 0.018 0.016 0.018 .. Papouasie-Nouvelle-Guinée0.003 0.003 0.002 0.002 0.002 0.002 0.002 0.002 0.002 0.002 0.002 Samoa*0.004 0.004 0.003 0.003 0.001 0.001 0.001 0.001 0.002 0.002 (e)0.002 Îles Salomon*
.. .. .. .. 0.000 0.000 0.000 0.000 .. .. .. Tokélaou0.002 0.002 0.002 0.001 0.001 0.001 0.001 0.001 0.001 0.001 (e)0.001 Tonga
.. 0.000 0.000 0.000 0.000 0.000 0.000 0.000 0.000 0.000 0.000 Tuvalu0.004 0.003 0.003 0.002 0.001 0.001 0.001 0.001 0.001 0.001 .. Vanuatu
.. .. .. .. .. 0.001 0.001 0.001 (e)0.001 (e)0.000 .. Îles Wallis-et-Futuna
_ _ _ 0.202 0.203 0.238 0.260 0.299 0.331 0.386 0.437 Économies en transition : Asie
_ _ _ 0.013 0.013 0.015 0.016 0.014 0.016 0.018 0.023 Arménie*_ _ _ 0.013 0.018 0.025 0.034 0.037 0.040 0.043 (e)0.042 Azerbaïdjan*(9)_ _ _ 0.007 0.011 0.012 0.015 0.020 0.023 0.030 0.037 Géorgie (10)_ _ _ 0.073 0.076 0.099 0.108 0.135 0.161 0.202 (e)0.233 Kazakhstan*(10)_ _ _ 0.010 0.008 0.009 0.009 0.010 0.010 0.015 0.017 Kirghizistan_ _ _ 0.015 0.010 0.011 0.011 0.013 0.012 0.014 (e)0.017 Tadjikistan (10)_ _ _ 0.015 0.027 0.032 0.032 0.035 0.034 0.033 0.032 Turkménistan (10)_ _ _ 0.055 0.041 0.036 0.034 0.036 0.034 0.032 (e)0.035 Ouzbékistan (10)
_ _ _ 1.991 1.370 1.787 1.951 2.059 2.199 2.449 2.874 Économies en transition : Europe
.. .. 0.012 0.014 0.016 0.023 0.024 0.024 0.024 0.025 0.029 Albanie_ _ _ 0.106 0.130 0.136 0.149 0.174 0.155 0.181 0.204 Bélarus_ _ _ 0.018 0.059 0.066 0.072 0.070 0.070 0.061 0.069 Bosnie-Herzégovine*(11)_ _ _ 0.141 0.119 0.161 0.183 0.175 0.172 0.174 0.184 Croatie*_ _ _ 0.016 0.012 0.016 0.018 0.019 0.021 0.022 0.026 Moldova_ _ _ 1.316 0.738 1.006 1.077 1.132 1.280 1.468 1.746 Fédération de Russie (12)_ _ _ 0.051 0.056 0.095 0.102 0.127 0.110 0.122 (e)0.148 Serbie-et-Monténégro*
0.727 0.601 0.526 _ _ _ _ _ _ _ _ RSF de Yougoslavie (anc.)_ _ _ 0.033 0.031 0.030 0.030 0.031 0.030 0.030 0.037 LERY de Macédoine*_ _ _ 0.296 0.210 0.255 0.296 0.306 0.335 0.365 0.432 Ukraine (10)
3.304 4.091 3.360 _ _ _ _ _ _ _ _ URSS (anc.)
15.442 21.347 17.863 17.969 22.623 21.440 19.938 19.098 19.167 18.470 17.116 Économies développées : Amérique
0.017 0.020 0.017 0.011 0.011 0.011 0.011 0.010 0.009 0.009 .. Bermudes3.016 3.968 3.433 3.212 3.679 3.414 3.153 2.958 3.077 2.899 2.753 Canada0.016 0.015 0.012 0.008 0.005 0.006 0.006 0.006 0.006 0.005 .. Groenland
Pour les sources et les notes, se reporter à la fin du tableau.
Imports (c.i.f.) - Importations (c.a.f.)Percentage - En pourcentage Régions,
pays ou territoires
1.1.1 Exportations et importations des payset des régions géographiquesPart 1
15
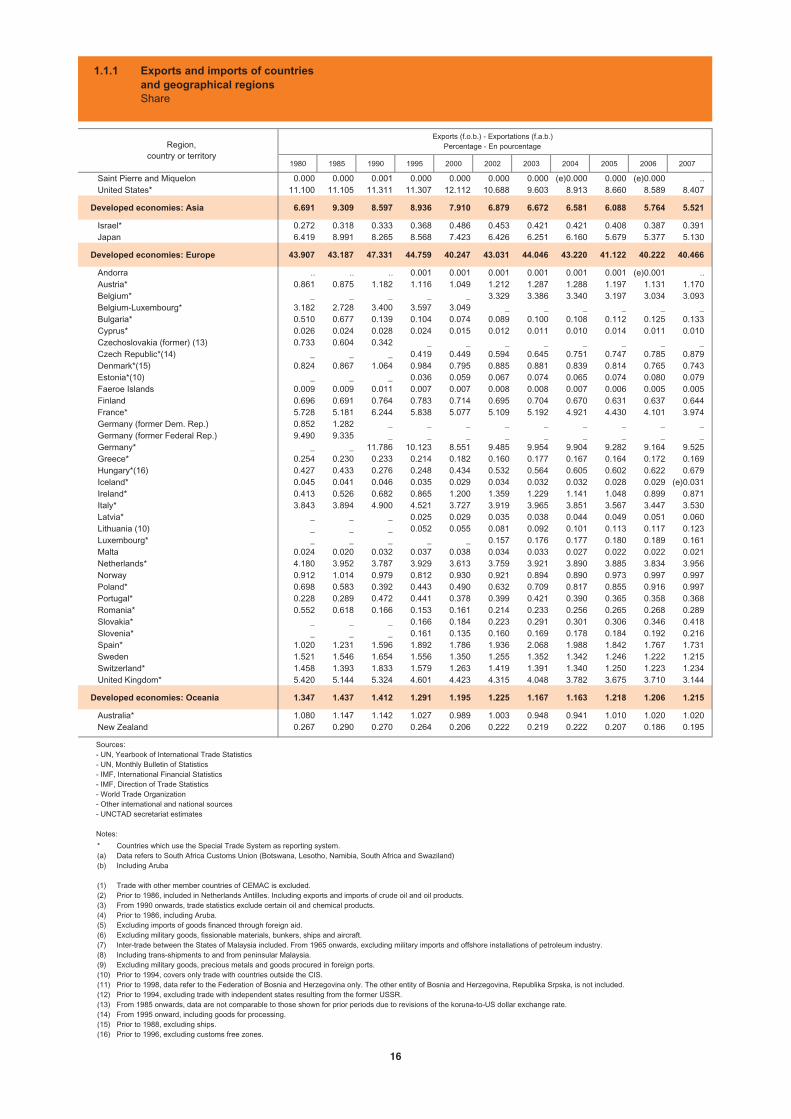
1980 1985 1990 1995 2000 2002 2003 2004 2005 2006 2007
Saint Pierre and Miquelon 0.000 0.000 0.001 0.000 0.000 0.000 0.000 (e)0.000 0.000 (e)0.000 .. United States* 11.100 11.105 11.311 11.307 12.112 10.688 9.603 8.913 8.660 8.589 8.407
Developed economies: Asia 6.691 9.309 8.597 8.936 7.910 6.879 6.672 6.581 6.088 5.764 5.521
Israel* 0.272 0.318 0.333 0.368 0.486 0.453 0.421 0.421 0.408 0.387 0.391 Japan 6.419 8.991 8.265 8.568 7.423 6.426 6.251 6.160 5.679 5.377 5.130
Developed economies: Europe 43.907 43.187 47.331 44.759 40.247 43.031 44.046 43.220 41.122 40.222 40.466
Andorra .. .. .. 0.001 0.001 0.001 0.001 0.001 0.001 (e)0.001 .. Austria* 0.861 0.875 1.182 1.116 1.049 1.212 1.287 1.288 1.197 1.131 1.170 Belgium* _ _ _ _ _ 3.329 3.386 3.340 3.197 3.034 3.093 Belgium-Luxembourg* 3.182 2.728 3.400 3.597 3.049 _ _ _ _ _ _ Bulgaria* 0.510 0.677 0.139 0.104 0.074 0.089 0.100 0.108 0.112 0.125 0.133 Cyprus* 0.026 0.024 0.028 0.024 0.015 0.012 0.011 0.010 0.014 0.011 0.010 Czechoslovakia (former) (13) 0.733 0.604 0.342 _ _ _ _ _ _ _ _ Czech Republic*(14) _ _ _ 0.419 0.449 0.594 0.645 0.751 0.747 0.785 0.879 Denmark*(15) 0.824 0.867 1.064 0.984 0.795 0.885 0.881 0.839 0.814 0.765 0.743 Estonia*(10) _ _ _ 0.036 0.059 0.067 0.074 0.065 0.074 0.080 0.079 Faeroe Islands 0.009 0.009 0.011 0.007 0.007 0.008 0.008 0.007 0.006 0.005 0.005 Finland 0.696 0.691 0.764 0.783 0.714 0.695 0.704 0.670 0.631 0.637 0.644 France* 5.728 5.181 6.244 5.838 5.077 5.109 5.192 4.921 4.430 4.101 3.974 Germany (former Dem. Rep.) 0.852 1.282 _ _ _ _ _ _ _ _ _ Germany (former Federal Rep.) 9.490 9.335 _ _ _ _ _ _ _ _ _ Germany* _ _ 11.786 10.123 8.551 9.485 9.954 9.904 9.282 9.164 9.525 Greece* 0.254 0.230 0.233 0.214 0.182 0.160 0.177 0.167 0.164 0.172 0.169 Hungary*(16) 0.427 0.433 0.276 0.248 0.434 0.532 0.564 0.605 0.602 0.622 0.679 Iceland* 0.045 0.041 0.046 0.035 0.029 0.034 0.032 0.032 0.028 0.029 (e)0.031 Ireland* 0.413 0.526 0.682 0.865 1.200 1.359 1.229 1.141 1.048 0.899 0.871 Italy* 3.843 3.894 4.900 4.521 3.727 3.919 3.965 3.851 3.567 3.447 3.530 Latvia* _ _ _ 0.025 0.029 0.035 0.038 0.044 0.049 0.051 0.060 Lithuania (10) _ _ _ 0.052 0.055 0.081 0.092 0.101 0.113 0.117 0.123 Luxembourg* _ _ _ _ _ 0.157 0.176 0.177 0.180 0.189 0.161 Malta 0.024 0.020 0.032 0.037 0.038 0.034 0.033 0.027 0.022 0.022 0.021 Netherlands* 4.180 3.952 3.787 3.929 3.613 3.759 3.921 3.890 3.885 3.834 3.956 Norway 0.912 1.014 0.979 0.812 0.930 0.921 0.894 0.890 0.973 0.997 0.997 Poland* 0.698 0.583 0.392 0.443 0.490 0.632 0.709 0.817 0.855 0.916 0.997 Portugal* 0.228 0.289 0.472 0.441 0.378 0.399 0.421 0.390 0.365 0.358 0.368 Romania* 0.552 0.618 0.166 0.153 0.161 0.214 0.233 0.256 0.265 0.268 0.289 Slovakia* _ _ _ 0.166 0.184 0.223 0.291 0.301 0.306 0.346 0.418 Slovenia* _ _ _ 0.161 0.135 0.160 0.169 0.178 0.184 0.192 0.216 Spain* 1.020 1.231 1.596 1.892 1.786 1.936 2.068 1.988 1.842 1.767 1.731 Sweden 1.521 1.546 1.654 1.556 1.350 1.255 1.352 1.342 1.246 1.222 1.215 Switzerland* 1.458 1.393 1.833 1.579 1.263 1.419 1.391 1.340 1.250 1.223 1.234 United Kingdom* 5.420 5.144 5.324 4.601 4.423 4.315 4.048 3.782 3.675 3.710 3.144
Developed economies: Oceania 1.347 1.437 1.412 1.291 1.195 1.225 1.167 1.163 1.218 1.206 1.215
Australia* 1.080 1.147 1.142 1.027 0.989 1.003 0.948 0.941 1.010 1.020 1.020 New Zealand 0.267 0.290 0.270 0.264 0.206 0.222 0.219 0.222 0.207 0.186 0.195
Region,country or territory
Exports (f.o.b.) - Exportations (f.a.b.)Percentage - En pourcentage
1.1.1 Exports and imports of countriesand geographical regionsShare
*(a)(b)
(1)(2)(3)(4)(5)(6)(7)(8)(9)(10)(11)(12)(13)(14)(15)(16)
Countries which use the Special Trade System as reporting system.Data refers to South Africa Customs Union (Botswana, Lesotho, Namibia, South Africa and Swaziland)Including Aruba
Trade with other member countries of CEMAC is excluded.Prior to 1986, included in Netherlands Antilles. Including exports and imports of crude oil and oil products. From 1990 onwards, trade statistics exclude certain oil and chemical products.Prior to 1986, including Aruba.Excluding imports of goods financed through foreign aid. Excluding military goods, fissionable materials, bunkers, ships and aircraft.Inter-trade between the States of Malaysia included. From 1965 onwards, excluding military imports and offshore installations of petroleum industry. Including trans-shipments to and from peninsular Malaysia.Excluding military goods, precious metals and goods procured in foreign ports.Prior to 1994, covers only trade with countries outside the CIS. Prior to 1998, data refer to the Federation of Bosnia and Herzegovina only. The other entity of Bosnia and Herzegovina, Republika Srpska, is not included. Prior to 1994, excluding trade with independent states resulting from the former USSR.From 1985 onwards, data are not comparable to those shown for prior periods due to revisions of the koruna-to-US dollar exchange rate. From 1995 onward, including goods for processing.Prior to 1988, excluding ships.Prior to 1996, excluding customs free zones.
Sources:- UN, Yearbook of International Trade Statistics- UN, Monthly Bulletin of Statistics- IMF, International Financial Statistics- IMF, Direction of Trade Statistics- World Trade Organization- Other international and national sources - UNCTAD secretariat estimates
Notes:
16
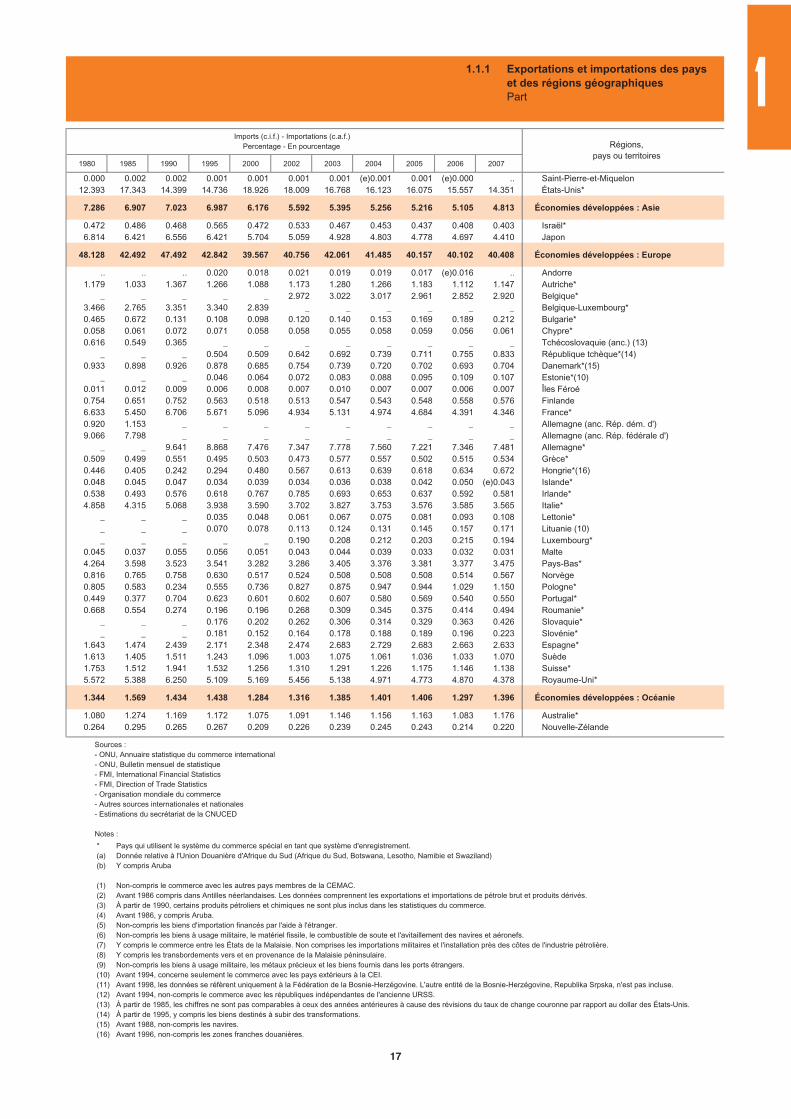
1980 1985 1990 1995 2000 2002 2003 2004 2005 2006 2007
0.000 0.002 0.002 0.001 0.001 0.001 0.001 (e)0.001 0.001 (e)0.000 .. Saint-Pierre-et-Miquelon12.393 17.343 14.399 14.736 18.926 18.009 16.768 16.123 16.075 15.557 14.351 États-Unis*
7.286 6.907 7.023 6.987 6.176 5.592 5.395 5.256 5.216 5.105 4.813 Économies développées : Asie
0.472 0.486 0.468 0.565 0.472 0.533 0.467 0.453 0.437 0.408 0.403 Israël*6.814 6.421 6.556 6.421 5.704 5.059 4.928 4.803 4.778 4.697 4.410 Japon
48.128 42.492 47.492 42.842 39.567 40.756 42.061 41.485 40.157 40.102 40.408 Économies développées : Europe
.. .. .. 0.020 0.018 0.021 0.019 0.019 0.017 (e)0.016 .. Andorre1.179 1.033 1.367 1.266 1.088 1.173 1.280 1.266 1.183 1.112 1.147 Autriche*
_ _ _ _ _ 2.972 3.022 3.017 2.961 2.852 2.920 Belgique*3.466 2.765 3.351 3.340 2.839 _ _ _ _ _ _ Belgique-Luxembourg*0.465 0.672 0.131 0.108 0.098 0.120 0.140 0.153 0.169 0.189 0.212 Bulgarie*0.058 0.061 0.072 0.071 0.058 0.058 0.055 0.058 0.059 0.056 0.061 Chypre*0.616 0.549 0.365 _ _ _ _ _ _ _ _ Tchécoslovaquie (anc.) (13)
_ _ _ 0.504 0.509 0.642 0.692 0.739 0.711 0.755 0.833 République tchèque*(14)0.933 0.898 0.926 0.878 0.685 0.754 0.739 0.720 0.702 0.693 0.704 Danemark*(15)
_ _ _ 0.046 0.064 0.072 0.083 0.088 0.095 0.109 0.107 Estonie*(10)0.011 0.012 0.009 0.006 0.008 0.007 0.010 0.007 0.007 0.006 0.007 Îles Féroé0.754 0.651 0.752 0.563 0.518 0.513 0.547 0.543 0.548 0.558 0.576 Finlande6.633 5.450 6.706 5.671 5.096 4.934 5.131 4.974 4.684 4.391 4.346 France*0.920 1.153 _ _ _ _ _ _ _ _ _ Allemagne (anc. Rép. dém. d')9.066 7.798 _ _ _ _ _ _ _ _ _ Allemagne (anc. Rép. fédérale d')
_ _ 9.641 8.868 7.476 7.347 7.778 7.560 7.221 7.346 7.481 Allemagne*0.509 0.499 0.551 0.495 0.503 0.473 0.577 0.557 0.502 0.515 0.534 Grèce*0.446 0.405 0.242 0.294 0.480 0.567 0.613 0.639 0.618 0.634 0.672 Hongrie*(16)0.048 0.045 0.047 0.034 0.039 0.034 0.036 0.038 0.042 0.050 (e)0.043 Islande*0.538 0.493 0.576 0.618 0.767 0.785 0.693 0.653 0.637 0.592 0.581 Irlande*4.858 4.315 5.068 3.938 3.590 3.702 3.827 3.753 3.576 3.585 3.565 Italie*
_ _ _ 0.035 0.048 0.061 0.067 0.075 0.081 0.093 0.108 Lettonie*_ _ _ 0.070 0.078 0.113 0.124 0.131 0.145 0.157 0.171 Lituanie (10)_ _ _ _ _ 0.190 0.208 0.212 0.203 0.215 0.194 Luxembourg*
0.045 0.037 0.055 0.056 0.051 0.043 0.044 0.039 0.033 0.032 0.031 Malte4.264 3.598 3.523 3.541 3.282 3.286 3.405 3.376 3.381 3.377 3.475 Pays-Bas*0.816 0.765 0.758 0.630 0.517 0.524 0.508 0.508 0.508 0.514 0.567 Norvège0.805 0.583 0.234 0.555 0.736 0.827 0.875 0.947 0.944 1.029 1.150 Pologne*0.449 0.377 0.704 0.623 0.601 0.602 0.607 0.580 0.569 0.540 0.550 Portugal*0.668 0.554 0.274 0.196 0.196 0.268 0.309 0.345 0.375 0.414 0.494 Roumanie*
_ _ _ 0.176 0.202 0.262 0.306 0.314 0.329 0.363 0.426 Slovaquie*_ _ _ 0.181 0.152 0.164 0.178 0.188 0.189 0.196 0.223 Slovénie*
1.643 1.474 2.439 2.171 2.348 2.474 2.683 2.729 2.683 2.663 2.633 Espagne*1.613 1.405 1.511 1.243 1.096 1.003 1.075 1.061 1.036 1.033 1.070 Suède1.753 1.512 1.941 1.532 1.256 1.310 1.291 1.226 1.175 1.146 1.138 Suisse*5.572 5.388 6.250 5.109 5.169 5.456 5.138 4.971 4.773 4.870 4.378 Royaume-Uni*
1.344 1.569 1.434 1.438 1.284 1.316 1.385 1.401 1.406 1.297 1.396 Économies développées : Océanie
1.080 1.274 1.169 1.172 1.075 1.091 1.146 1.156 1.163 1.083 1.176 Australie*0.264 0.295 0.265 0.267 0.209 0.226 0.239 0.245 0.243 0.214 0.220 Nouvelle-Zélande
Imports (c.i.f.) - Importations (c.a.f.)Percentage - En pourcentage Régions,
pays ou territoires
1.1.1 Exportations et importations des payset des régions géographiquesPart
*(a)(b)
(1)(2)(3)(4)(5)(6)(7)(8)(9)(10)(11)(12)(13)(14)(15)(16)
Pays qui utilisent le système du commerce spécial en tant que système d'enregistrement.Donnée relative à l'Union Douanière d'Afrique du Sud (Afrique du Sud, Botswana, Lesotho, Namibie et Swaziland)Y compris Aruba
Non-compris le commerce avec les autres pays membres de la CEMAC.Avant 1986 compris dans Antilles néerlandaises. Les données comprennent les exportations et importations de pétrole brut et produits dérivés.À partir de 1990, certains produits pétroliers et chimiques ne sont plus inclus dans les statistiques du commerce. Avant 1986, y compris Aruba.Non-compris les biens d'importation financés par l'aide à l'étranger. Non-compris les biens à usage militaire, le matériel fissile, le combustible de soute et l'avitaillement des navires et aéronefs.Y compris le commerce entre les États de la Malaisie. Non comprises les importations militaires et l'installation près des côtes de l'industrie pétrolière. Y compris les transbordements vers et en provenance de la Malaisie péninsulaire. Non-compris les biens à usage militaire, les métaux précieux et les biens fournis dans les ports étrangers.Avant 1994, concerne seulement le commerce avec les pays extérieurs à la CEI. Avant 1998, les données se réfèrent uniquement à la Fédération de la Bosnie-Herzégovine. L'autre entité de la Bosnie-Herzégovine, Republika Srpska, n'est pas incluse. Avant 1994, non-compris le commerce avec les républiques indépendantes de l'ancienne URSS.À partir de 1985, les chiffres ne sont pas comparables à ceux des années antérieures à cause des révisions du taux de change couronne par rapport au dollar des États-Unis. À partir de 1995, y compris les biens destinés à subir des transformations.Avant 1988, non-compris les navires.Avant 1996, non-compris les zones franches douanières.
Sources : - ONU, Annuaire statistique du commerce international- ONU, Bulletin mensuel de statistique- FMI, International Financial Statistics- FMI, Direction of Trade Statistics- Organisation mondiale du commerce- Autres sources internationales et nationales- Estimations du secrétariat de la CNUCED
Notes :
1
17
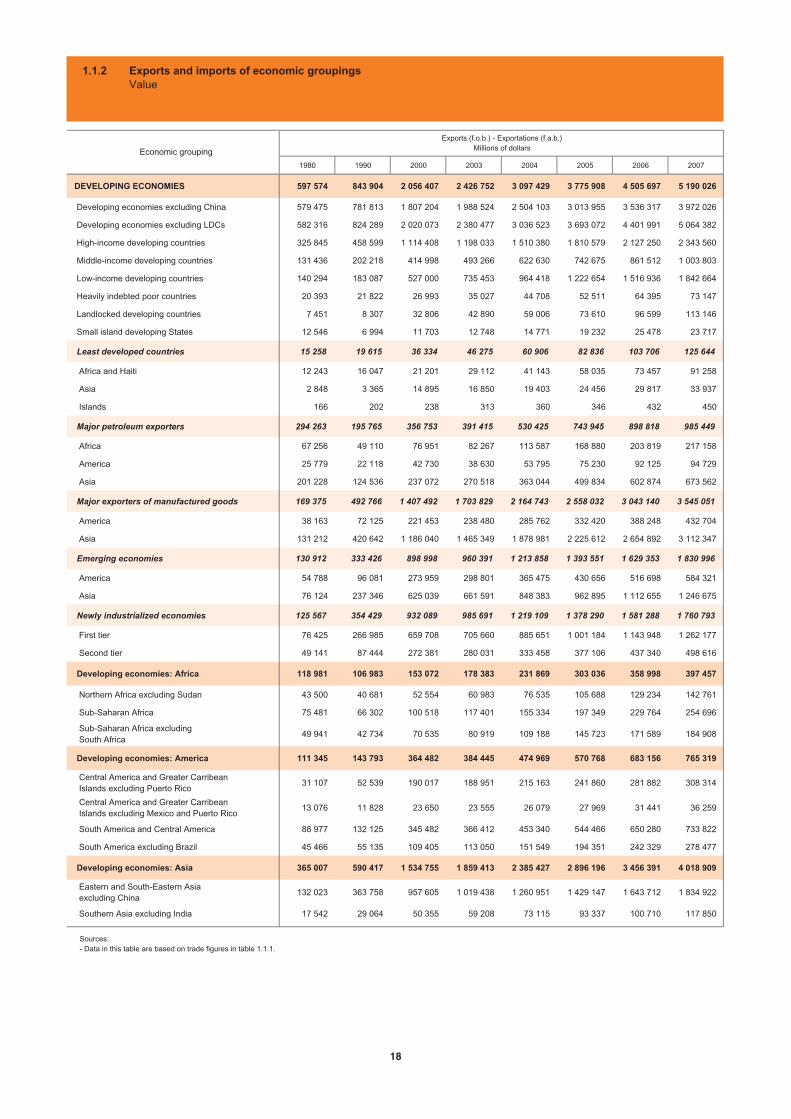
1980 1990 2000 2003 2004 2005 2006 2007
DEVELOPING ECONOMIES 597 574 843 904 2 056 407 2 426 752 3 097 429 3 775 908 4 505 697 5 190 026
Developing economies excluding China 579 475 781 813 1 807 204 1 988 524 2 504 103 3 013 955 3 536 317 3 972 026
Developing economies excluding LDCs 582 316 824 289 2 020 073 2 380 477 3 036 523 3 693 072 4 401 991 5 064 382
High-income developing countries 325 845 458 599 1 114 408 1 198 033 1 510 380 1 810 579 2 127 250 2 343 560
Middle-income developing countries 131 436 202 218 414 998 493 266 622 630 742 675 861 512 1 003 803
Low-income developing countries 140 294 183 087 527 000 735 453 964 418 1 222 654 1 516 936 1 842 664
Heavily indebted poor countries 20 393 21 822 26 993 35 027 44 708 52 511 64 395 73 147
Landlocked developing countries 7 451 8 307 32 806 42 890 59 006 73 610 96 599 113 146
Small island developing States 12 546 6 994 11 703 12 748 14 771 19 232 25 478 23 717
Least developed countries 15 258 19 615 36 334 46 275 60 906 82 836 103 706 125 644
Africa and Haiti 12 243 16 047 21 201 29 112 41 143 58 035 73 457 91 258
Asia 2 848 3 365 14 895 16 850 19 403 24 456 29 817 33 937
Islands 166 202 238 313 360 346 432 450
Major petroleum exporters 294 263 195 765 356 753 391 415 530 425 743 945 898 818 985 449
Africa 67 256 49 110 76 951 82 267 113 587 168 880 203 819 217 158
America 25 779 22 118 42 730 38 630 53 795 75 230 92 125 94 729
Asia 201 228 124 536 237 072 270 518 363 044 499 834 602 874 673 562
Major exporters of manufactured goods 169 375 492 766 1 407 492 1 703 829 2 164 743 2 558 032 3 043 140 3 545 051
America 38 163 72 125 221 453 238 480 285 762 332 420 388 248 432 704
Asia 131 212 420 642 1 186 040 1 465 349 1 878 981 2 225 612 2 654 892 3 112 347
Emerging economies 130 912 333 426 898 998 960 391 1 213 858 1 393 551 1 629 353 1 830 996
America 54 788 96 081 273 959 298 801 365 475 430 656 516 698 584 321
Asia 76 124 237 346 625 039 661 591 848 383 962 895 1 112 655 1 246 675
Newly industrialized economies 125 567 354 429 932 089 985 691 1 219 109 1 378 290 1 581 288 1 760 793
First tier 76 425 266 985 659 708 705 660 885 651 1 001 184 1 143 948 1 262 177
Second tier 49 141 87 444 272 381 280 031 333 458 377 106 437 340 498 616
Developing economies: Africa 118 981 106 983 153 072 178 383 231 869 303 036 358 998 397 457
Northern Africa excluding Sudan 43 500 40 681 52 554 60 983 76 535 105 688 129 234 142 761
Sub-Saharan Africa 75 481 66 302 100 518 117 401 155 334 197 349 229 764 254 696
Sub-Saharan Africa excluding South Africa
49 941 42 734 70 535 80 919 109 188 145 723 171 589 184 908
Developing economies: America 111 345 143 793 364 482 384 445 474 969 570 768 683 156 765 319
Central America and Greater Carribean Islands excluding Puerto Rico
31 107 52 539 190 017 188 951 215 163 241 860 281 882 308 314
Central America and Greater Carribean Islands excluding Mexico and Puerto Rico
13 076 11 828 23 650 23 555 26 079 27 969 31 441 36 259
South America and Central America 88 977 132 125 345 482 366 412 453 340 544 466 650 280 733 822
South America excluding Brazil 45 466 55 135 109 405 113 050 151 549 194 351 242 329 278 477
Developing economies: Asia 365 007 590 417 1 534 755 1 859 413 2 385 427 2 896 196 3 456 391 4 018 909
Eastern and South-Eastern Asia excluding China
132 023 363 758 957 605 1 019 438 1 260 951 1 429 147 1 643 712 1 834 922
Southern Asia excluding India 17 542 29 064 50 355 59 208 73 115 93 337 100 710 117 850
Exports (f.o.b.) - Exportations (f.a.b.)Millions of dollarsEconomic grouping
1.1.2 Exports and imports of economic groupingsValue
Sources:- Data in this table are based on trade figures in table 1.1.1.
18

1980 1990 2000 2003 2004 2005 2006 2007
492 879 800 281 1 914 743 2 254 347 2 876 773 3 397 199 3 971 659 4 632 355 ÉCONOMIES EN DÉVELOPPEMENT
472 937 746 936 1 689 649 1 841 587 2 315 544 2 737 246 3 180 054 3 676 555 Économies en développement sans la Chine
469 110 775 548 1 870 742 2 194 090 2 804 925 3 309 490 3 870 413 4 517 586 Économies en développement sans les PMA
222 876 399 001 1 009 641 1 043 128 1 296 061 1 511 066 1 741 764 1 992 549 Pays en développement à revenu élevé
144 621 223 964 431 786 491 549 629 911 725 685 860 016 1 005 997 Pays en développement à revenu intermédiaire
125 382 177 316 473 317 719 670 950 802 1 160 448 1 369 880 1 633 809 Pays en développement à revenu faible
25 390 24 438 37 700 49 076 60 396 74 375 86 813 99 025 Pays pauvres très endettés
9 068 12 322 36 793 48 804 64 113 76 392 94 259 115 935 Pays en développement sans littoral
15 717 10 405 17 536 19 357 22 374 25 927 29 813 32 547 Petits États insulaires en développement
23 769 24 733 44 001 60 257 71 848 87 710 101 246 114 769 Pays les moins avancés
16 485 16 723 23 964 35 629 43 854 55 705 63 686 71 503 Afrique et Haïti
6 966 7 501 19 004 23 434 26 532 30 308 35 577 41 062 Asie
318 509 1 033 1 193 1 462 1 696 1 984 2 204 Îles
136 728 112 043 172 780 235 089 308 778 392 894 445 412 530 615 Principaux exportateurs de pétrole
38 144 24 540 28 414 47 762 60 623 77 945 84 746 91 911 Afrique
17 258 10 309 23 242 21 078 29 764 40 022 52 233 65 926 Amérique
81 326 77 194 121 124 166 250 218 391 274 927 308 434 372 777 Asie
206 615 508 542 1 401 559 1 643 641 2 099 962 2 434 164 2 863 835 3 313 939Principaux exportateurs d'articlesmanufacturés
47 105 66 071 241 768 229 384 273 056 309 449 364 021 423 159 Amérique
159 510 442 471 1 159 791 1 414 257 1 826 905 2 124 715 2 499 814 2 890 780 Asie
152 003 329 111 873 282 862 858 1 086 511 1 259 799 1 462 521 1 661 195 Économies émergentes
65 947 81 360 294 443 270 954 330 396 383 374 451 900 534 485 Amérique
86 056 247 751 578 839 591 904 756 115 876 425 1 010 621 1 126 710 Asie
127 629 365 082 869 037 902 848 1 120 087 1 292 330 1 475 097 1 644 041 Économies nouvellement industrialisées
88 511 267 938 647 758 666 028 827 481 943 389 1 085 499 1 207 009 Première génération
39 118 97 144 221 279 236 820 292 606 348 941 389 598 437 032 Deuxième génération
93 735 97 057 130 238 173 391 217 515 262 927 300 314 340 949 Économies en développement : Afrique
29 977 44 333 47 329 55 357 70 958 84 392 92 196 114 931 Afrique septentrionale sans le Soudan
63 759 52 724 82 909 118 034 146 557 178 535 208 118 226 018 Afrique subsaharienne
44 059 34 325 53 214 76 951 93 091 116 231 130 838 144 268 Afrique subsaharienne sans l'Afrique du Sud
123 588 127 240 392 045 369 101 449 011 530 415 631 683 749 287 Économies en développement : Amérique
39 759 63 783 226 433 224 550 257 850 292 667 339 240 379 343 Amérique centrale et Grandes Antilles sans Porto Rico
17 615 20 234 43 731 46 047 51 227 60 846 71 071 82 765 Amérique centrale et Grandes Antilles sans le Mexique et Porto Rico
96 226 108 537 359 654 338 274 414 147 487 995 582 396 695 873 Amérique du Sud et Amérique centrale
41 521 34 244 92 816 79 958 108 440 141 081 175 156 221 702 Amérique du Sud sans le Brésil
272 005 570 895 1 386 764 1 704 105 2 201 735 2 594 651 3 029 655 3 530 946 Économies en développement : Asie
131 235 374 843 895 457 940 451 1 166 598 1 345 488 1 538 907 1 726 626 Asie orientale et Asie du Sud-Est sans la Chine
24 675 33 836 44 549 63 819 78 265 94 764 109 198 111 315 Asie méridionale sans l'Inde
Groupements économiques
Imports (c.i.f.) - Importations (c.a.f.)Millions de dollars
1.1.2 Exportations et importations des groupements économiquesValeur
Sources : - Les données dans ce tableau ont été calculées d'après les chiffres du tableau 1.1.1.
1
19
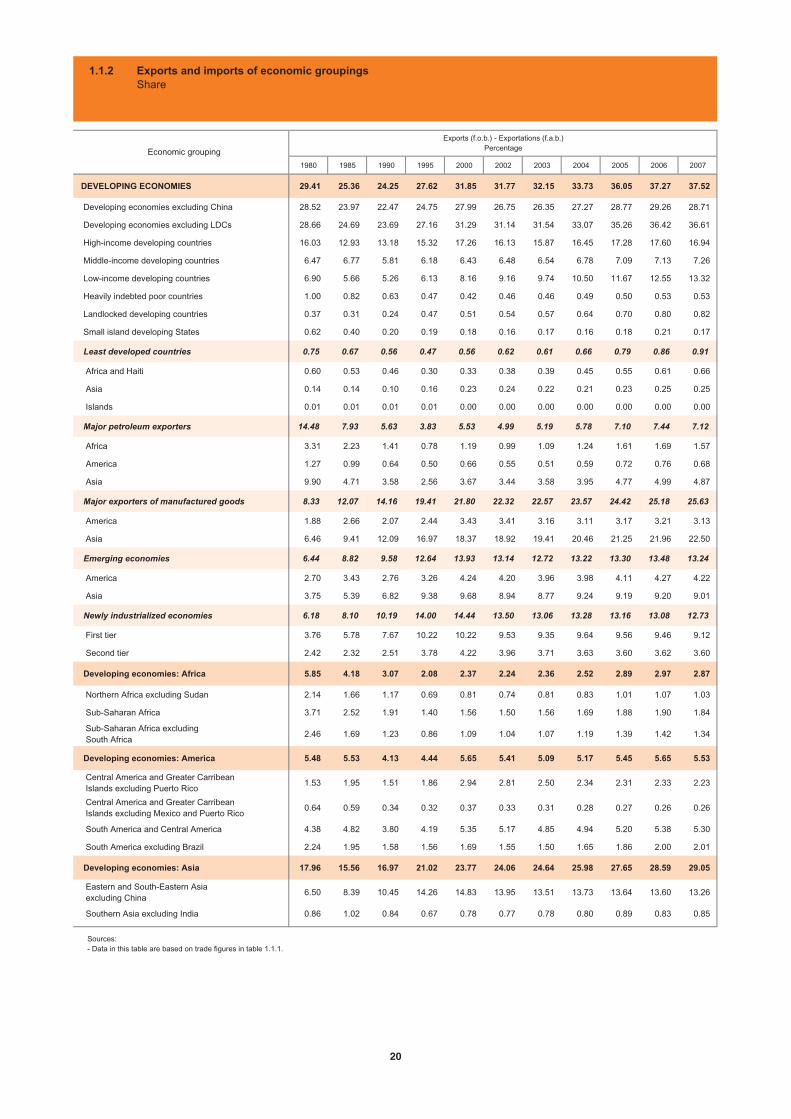
1980 1985 1990 1995 2000 2002 2003 2004 2005 2006 2007
DEVELOPING ECONOMIES 29.41 25.36 24.25 27.62 31.85 31.77 32.15 33.73 36.05 37.27 37.52
Developing economies excluding China 28.52 23.97 22.47 24.75 27.99 26.75 26.35 27.27 28.77 29.26 28.71
Developing economies excluding LDCs 28.66 24.69 23.69 27.16 31.29 31.14 31.54 33.07 35.26 36.42 36.61
High-income developing countries 16.03 12.93 13.18 15.32 17.26 16.13 15.87 16.45 17.28 17.60 16.94
Middle-income developing countries 6.47 6.77 5.81 6.18 6.43 6.48 6.54 6.78 7.09 7.13 7.26
Low-income developing countries 6.90 5.66 5.26 6.13 8.16 9.16 9.74 10.50 11.67 12.55 13.32
Heavily indebted poor countries 1.00 0.82 0.63 0.47 0.42 0.46 0.46 0.49 0.50 0.53 0.53
Landlocked developing countries 0.37 0.31 0.24 0.47 0.51 0.54 0.57 0.64 0.70 0.80 0.82
Small island developing States 0.62 0.40 0.20 0.19 0.18 0.16 0.17 0.16 0.18 0.21 0.17
Least developed countries 0.75 0.67 0.56 0.47 0.56 0.62 0.61 0.66 0.79 0.86 0.91
Africa and Haiti 0.60 0.53 0.46 0.30 0.33 0.38 0.39 0.45 0.55 0.61 0.66
Asia 0.14 0.14 0.10 0.16 0.23 0.24 0.22 0.21 0.23 0.25 0.25
Islands 0.01 0.01 0.01 0.01 0.00 0.00 0.00 0.00 0.00 0.00 0.00
Major petroleum exporters 14.48 7.93 5.63 3.83 5.53 4.99 5.19 5.78 7.10 7.44 7.12
Africa 3.31 2.23 1.41 0.78 1.19 0.99 1.09 1.24 1.61 1.69 1.57
America 1.27 0.99 0.64 0.50 0.66 0.55 0.51 0.59 0.72 0.76 0.68
Asia 9.90 4.71 3.58 2.56 3.67 3.44 3.58 3.95 4.77 4.99 4.87
Major exporters of manufactured goods 8.33 12.07 14.16 19.41 21.80 22.32 22.57 23.57 24.42 25.18 25.63
America 1.88 2.66 2.07 2.44 3.43 3.41 3.16 3.11 3.17 3.21 3.13
Asia 6.46 9.41 12.09 16.97 18.37 18.92 19.41 20.46 21.25 21.96 22.50
Emerging economies 6.44 8.82 9.58 12.64 13.93 13.14 12.72 13.22 13.30 13.48 13.24
America 2.70 3.43 2.76 3.26 4.24 4.20 3.96 3.98 4.11 4.27 4.22
Asia 3.75 5.39 6.82 9.38 9.68 8.94 8.77 9.24 9.19 9.20 9.01
Newly industrialized economies 6.18 8.10 10.19 14.00 14.44 13.50 13.06 13.28 13.16 13.08 12.73
First tier 3.76 5.78 7.67 10.22 10.22 9.53 9.35 9.64 9.56 9.46 9.12
Second tier 2.42 2.32 2.51 3.78 4.22 3.96 3.71 3.63 3.60 3.62 3.60
Developing economies: Africa 5.85 4.18 3.07 2.08 2.37 2.24 2.36 2.52 2.89 2.97 2.87
Northern Africa excluding Sudan 2.14 1.66 1.17 0.69 0.81 0.74 0.81 0.83 1.01 1.07 1.03
Sub-Saharan Africa 3.71 2.52 1.91 1.40 1.56 1.50 1.56 1.69 1.88 1.90 1.84
Sub-Saharan Africa excluding South Africa
2.46 1.69 1.23 0.86 1.09 1.04 1.07 1.19 1.39 1.42 1.34
Developing economies: America 5.48 5.53 4.13 4.44 5.65 5.41 5.09 5.17 5.45 5.65 5.53
Central America and Greater Carribean Islands excluding Puerto Rico
1.53 1.95 1.51 1.86 2.94 2.81 2.50 2.34 2.31 2.33 2.23
Central America and Greater Carribean Islands excluding Mexico and Puerto Rico
0.64 0.59 0.34 0.32 0.37 0.33 0.31 0.28 0.27 0.26 0.26
South America and Central America 4.38 4.82 3.80 4.19 5.35 5.17 4.85 4.94 5.20 5.38 5.30
South America excluding Brazil 2.24 1.95 1.58 1.56 1.69 1.55 1.50 1.65 1.86 2.00 2.01
Developing economies: Asia 17.96 15.56 16.97 21.02 23.77 24.06 24.64 25.98 27.65 28.59 29.05
Eastern and South-Eastern Asia excluding China
6.50 8.39 10.45 14.26 14.83 13.95 13.51 13.73 13.64 13.60 13.26
Southern Asia excluding India 0.86 1.02 0.84 0.67 0.78 0.77 0.78 0.80 0.89 0.83 0.85
Economic grouping
Exports (f.o.b.) - Exportations (f.a.b.)Percentage
1.1.2 Exports and imports of economic groupingsShare
Sources:- Data in this table are based on trade figures in table 1.1.1.
20
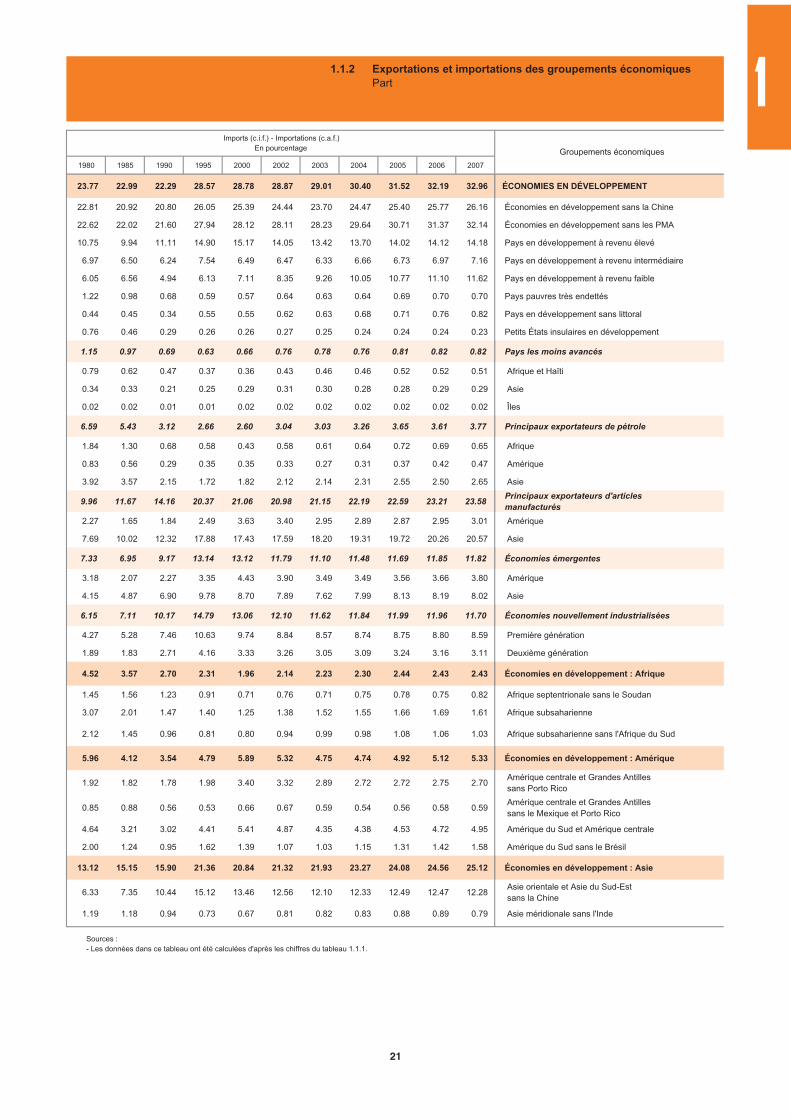
1980 1985 1990 1995 2000 2002 2003 2004 2005 2006 2007
23.77 22.99 22.29 28.57 28.78 28.87 29.01 30.40 31.52 32.19 32.96 ÉCONOMIES EN DÉVELOPPEMENT
22.81 20.92 20.80 26.05 25.39 24.44 23.70 24.47 25.40 25.77 26.16 Économies en développement sans la Chine
22.62 22.02 21.60 27.94 28.12 28.11 28.23 29.64 30.71 31.37 32.14 Économies en développement sans les PMA
10.75 9.94 11.11 14.90 15.17 14.05 13.42 13.70 14.02 14.12 14.18 Pays en développement à revenu élevé
6.97 6.50 6.24 7.54 6.49 6.47 6.33 6.66 6.73 6.97 7.16 Pays en développement à revenu intermédiaire
6.05 6.56 4.94 6.13 7.11 8.35 9.26 10.05 10.77 11.10 11.62 Pays en développement à revenu faible
1.22 0.98 0.68 0.59 0.57 0.64 0.63 0.64 0.69 0.70 0.70 Pays pauvres très endettés
0.44 0.45 0.34 0.55 0.55 0.62 0.63 0.68 0.71 0.76 0.82 Pays en développement sans littoral
0.76 0.46 0.29 0.26 0.26 0.27 0.25 0.24 0.24 0.24 0.23 Petits États insulaires en développement
1.15 0.97 0.69 0.63 0.66 0.76 0.78 0.76 0.81 0.82 0.82 Pays les moins avancés
0.79 0.62 0.47 0.37 0.36 0.43 0.46 0.46 0.52 0.52 0.51 Afrique et Haïti
0.34 0.33 0.21 0.25 0.29 0.31 0.30 0.28 0.28 0.29 0.29 Asie
0.02 0.02 0.01 0.01 0.02 0.02 0.02 0.02 0.02 0.02 0.02 Îles
6.59 5.43 3.12 2.66 2.60 3.04 3.03 3.26 3.65 3.61 3.77 Principaux exportateurs de pétrole
1.84 1.30 0.68 0.58 0.43 0.58 0.61 0.64 0.72 0.69 0.65 Afrique
0.83 0.56 0.29 0.35 0.35 0.33 0.27 0.31 0.37 0.42 0.47 Amérique
3.92 3.57 2.15 1.72 1.82 2.12 2.14 2.31 2.55 2.50 2.65 Asie
9.96 11.67 14.16 20.37 21.06 20.98 21.15 22.19 22.59 23.21 23.58Principaux exportateurs d'articlesmanufacturés
2.27 1.65 1.84 2.49 3.63 3.40 2.95 2.89 2.87 2.95 3.01 Amérique
7.69 10.02 12.32 17.88 17.43 17.59 18.20 19.31 19.72 20.26 20.57 Asie
7.33 6.95 9.17 13.14 13.12 11.79 11.10 11.48 11.69 11.85 11.82 Économies émergentes
3.18 2.07 2.27 3.35 4.43 3.90 3.49 3.49 3.56 3.66 3.80 Amérique
4.15 4.87 6.90 9.78 8.70 7.89 7.62 7.99 8.13 8.19 8.02 Asie
6.15 7.11 10.17 14.79 13.06 12.10 11.62 11.84 11.99 11.96 11.70 Économies nouvellement industrialisées
4.27 5.28 7.46 10.63 9.74 8.84 8.57 8.74 8.75 8.80 8.59 Première génération
1.89 1.83 2.71 4.16 3.33 3.26 3.05 3.09 3.24 3.16 3.11 Deuxième génération
4.52 3.57 2.70 2.31 1.96 2.14 2.23 2.30 2.44 2.43 2.43 Économies en développement : Afrique
1.45 1.56 1.23 0.91 0.71 0.76 0.71 0.75 0.78 0.75 0.82 Afrique septentrionale sans le Soudan
3.07 2.01 1.47 1.40 1.25 1.38 1.52 1.55 1.66 1.69 1.61 Afrique subsaharienne
2.12 1.45 0.96 0.81 0.80 0.94 0.99 0.98 1.08 1.06 1.03 Afrique subsaharienne sans l'Afrique du Sud
5.96 4.12 3.54 4.79 5.89 5.32 4.75 4.74 4.92 5.12 5.33 Économies en développement : Amérique
1.92 1.82 1.78 1.98 3.40 3.32 2.89 2.72 2.72 2.75 2.70 Amérique centrale et Grandes Antilles sans Porto Rico
0.85 0.88 0.56 0.53 0.66 0.67 0.59 0.54 0.56 0.58 0.59 Amérique centrale et Grandes Antilles sans le Mexique et Porto Rico
4.64 3.21 3.02 4.41 5.41 4.87 4.35 4.38 4.53 4.72 4.95 Amérique du Sud et Amérique centrale
2.00 1.24 0.95 1.62 1.39 1.07 1.03 1.15 1.31 1.42 1.58 Amérique du Sud sans le Brésil
13.12 15.15 15.90 21.36 20.84 21.32 21.93 23.27 24.08 24.56 25.12 Économies en développement : Asie
6.33 7.35 10.44 15.12 13.46 12.56 12.10 12.33 12.49 12.47 12.28 Asie orientale et Asie du Sud-Est sans la Chine
1.19 1.18 0.94 0.73 0.67 0.81 0.82 0.83 0.88 0.89 0.79 Asie méridionale sans l'Inde
Imports (c.i.f.) - Importations (c.a.f.)En pourcentage Groupements économiques
1.1.2 Exportations et importations des groupements économiquesPart
Sources : - Les données dans ce tableau ont été calculées d'après les chiffres du tableau 1.1.1.
1
21
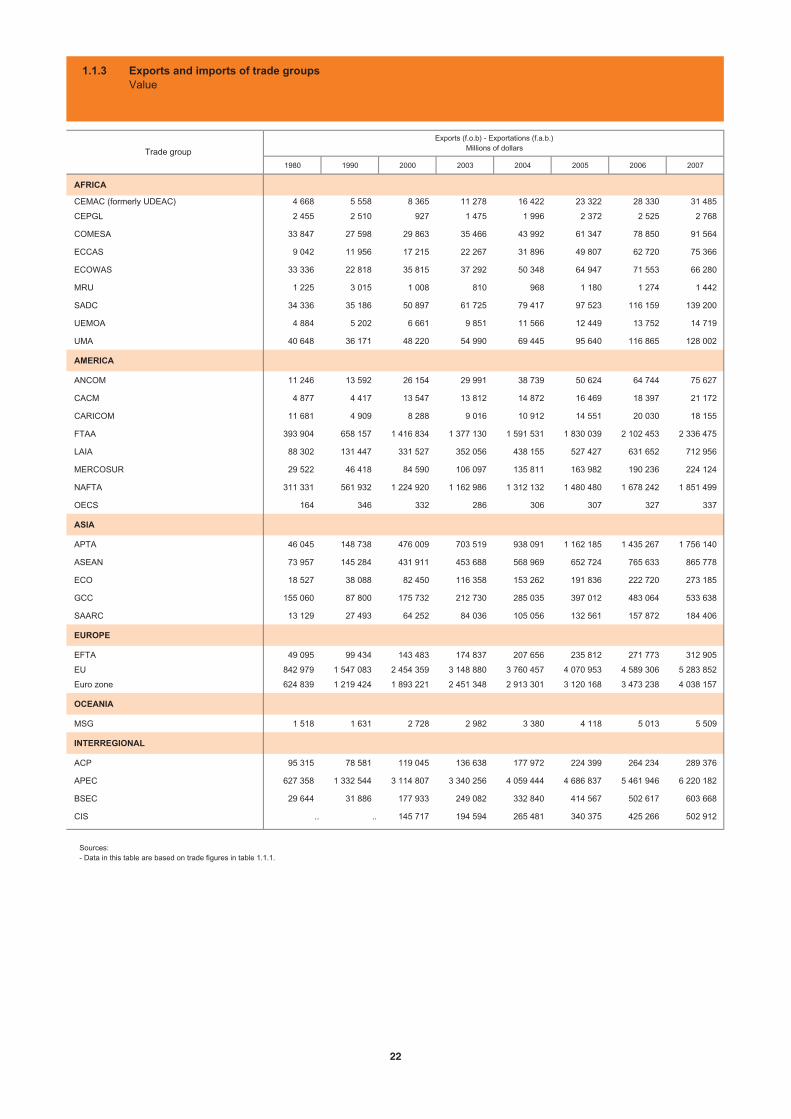
1980 1990 2000 2003 2004 2005 2006 2007
AFRICA
CEMAC (formerly UDEAC) 4 668 5 558 8 365 11 278 16 422 23 322 28 330 31 485
CEPGL 2 455 2 510 927 1 475 1 996 2 372 2 525 2 768
COMESA 33 847 27 598 29 863 35 466 43 992 61 347 78 850 91 564
ECCAS 9 042 11 956 17 215 22 267 31 896 49 807 62 720 75 366
ECOWAS 33 336 22 818 35 815 37 292 50 348 64 947 71 553 66 280
MRU 1 225 3 015 1 008 810 968 1 180 1 274 1 442
SADC 34 336 35 186 50 897 61 725 79 417 97 523 116 159 139 200
UEMOA 4 884 5 202 6 661 9 851 11 566 12 449 13 752 14 719
UMA 40 648 36 171 48 220 54 990 69 445 95 640 116 865 128 002
AMERICA
ANCOM 11 246 13 592 26 154 29 991 38 739 50 624 64 744 75 627
CACM 4 877 4 417 13 547 13 812 14 872 16 469 18 397 21 172
CARICOM 11 681 4 909 8 288 9 016 10 912 14 551 20 030 18 155
FTAA 393 904 658 157 1 416 834 1 377 130 1 591 531 1 830 039 2 102 453 2 336 475
LAIA 88 302 131 447 331 527 352 056 438 155 527 427 631 652 712 956
MERCOSUR 29 522 46 418 84 590 106 097 135 811 163 982 190 236 224 124
NAFTA 311 331 561 932 1 224 920 1 162 986 1 312 132 1 480 480 1 678 242 1 851 499
OECS 164 346 332 286 306 307 327 337
ASIA
APTA 46 045 148 738 476 009 703 519 938 091 1 162 185 1 435 267 1 756 140
ASEAN 73 957 145 284 431 911 453 688 568 969 652 724 765 633 865 778
ECO 18 527 38 088 82 450 116 358 153 262 191 836 222 720 273 185
GCC 155 060 87 800 175 732 212 730 285 035 397 012 483 064 533 638
SAARC 13 129 27 493 64 252 84 036 105 056 132 561 157 872 184 406
EUROPE
EFTA 49 095 99 434 143 483 174 837 207 656 235 812 271 773 312 905
EU 842 979 1 547 083 2 454 359 3 148 880 3 760 457 4 070 953 4 589 306 5 283 852
Euro zone 624 839 1 219 424 1 893 221 2 451 348 2 913 301 3 120 168 3 473 238 4 038 157
OCEANIA
MSG 1 518 1 631 2 728 2 982 3 380 4 118 5 013 5 509
INTERREGIONAL
ACP 95 315 78 581 119 045 136 638 177 972 224 399 264 234 289 376
APEC 627 358 1 332 544 3 114 807 3 340 256 4 059 444 4 686 837 5 461 946 6 220 182
BSEC 29 644 31 886 177 933 249 082 332 840 414 567 502 617 603 668
CIS .. .. 145 717 194 594 265 481 340 375 425 266 502 912
Exports (f.o.b) - Exportations (f.a.b.)Millions of dollarsTrade group
1.1.3 Exports and imports of trade groups Value
Sources:- Data in this table are based on trade figures in table 1.1.1.
22
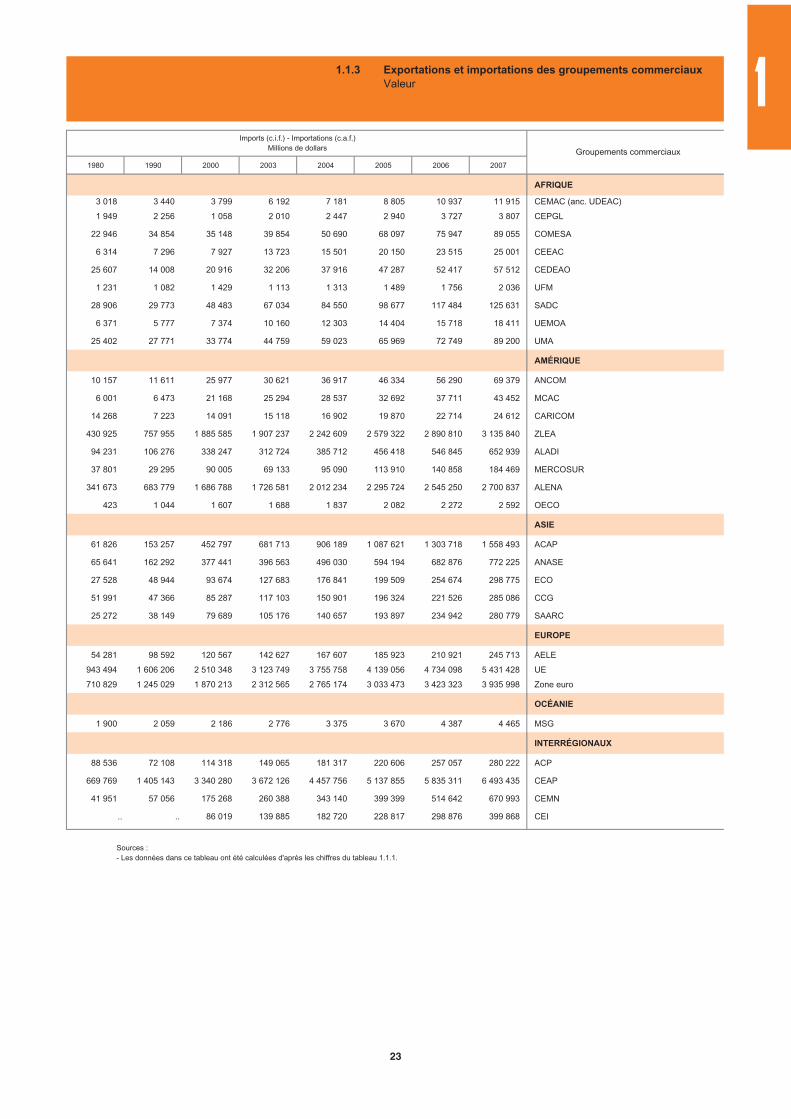
1980 1990 2000 2003 2004 2005 2006 2007
AFRIQUE
3 018 3 440 3 799 6 192 7 181 8 805 10 937 11 915 CEMAC (anc. UDEAC)
1 949 2 256 1 058 2 010 2 447 2 940 3 727 3 807 CEPGL
22 946 34 854 35 148 39 854 50 690 68 097 75 947 89 055 COMESA
6 314 7 296 7 927 13 723 15 501 20 150 23 515 25 001 CEEAC
25 607 14 008 20 916 32 206 37 916 47 287 52 417 57 512 CEDEAO
1 231 1 082 1 429 1 113 1 313 1 489 1 756 2 036 UFM
28 906 29 773 48 483 67 034 84 550 98 677 117 484 125 631 SADC
6 371 5 777 7 374 10 160 12 303 14 404 15 718 18 411 UEMOA
25 402 27 771 33 774 44 759 59 023 65 969 72 749 89 200 UMA
AMÉRIQUE
10 157 11 611 25 977 30 621 36 917 46 334 56 290 69 379 ANCOM
6 001 6 473 21 168 25 294 28 537 32 692 37 711 43 452 MCAC
14 268 7 223 14 091 15 118 16 902 19 870 22 714 24 612 CARICOM
430 925 757 955 1 885 585 1 907 237 2 242 609 2 579 322 2 890 810 3 135 840 ZLEA
94 231 106 276 338 247 312 724 385 712 456 418 546 845 652 939 ALADI
37 801 29 295 90 005 69 133 95 090 113 910 140 858 184 469 MERCOSUR
341 673 683 779 1 686 788 1 726 581 2 012 234 2 295 724 2 545 250 2 700 837 ALENA
423 1 044 1 607 1 688 1 837 2 082 2 272 2 592 OECO
ASIE
61 826 153 257 452 797 681 713 906 189 1 087 621 1 303 718 1 558 493 ACAP
65 641 162 292 377 441 396 563 496 030 594 194 682 876 772 225 ANASE
27 528 48 944 93 674 127 683 176 841 199 509 254 674 298 775 ECO
51 991 47 366 85 287 117 103 150 901 196 324 221 526 285 086 CCG
25 272 38 149 79 689 105 176 140 657 193 897 234 942 280 779 SAARC
EUROPE
54 281 98 592 120 567 142 627 167 607 185 923 210 921 245 713 AELE
943 494 1 606 206 2 510 348 3 123 749 3 755 758 4 139 056 4 734 098 5 431 428 UE
710 829 1 245 029 1 870 213 2 312 565 2 765 174 3 033 473 3 423 323 3 935 998 Zone euro
OCÉANIE
1 900 2 059 2 186 2 776 3 375 3 670 4 387 4 465 MSG
INTERRÉGIONAUX
88 536 72 108 114 318 149 065 181 317 220 606 257 057 280 222 ACP
669 769 1 405 143 3 340 280 3 672 126 4 457 756 5 137 855 5 835 311 6 493 435 CEAP
41 951 57 056 175 268 260 388 343 140 399 399 514 642 670 993 CEMN
.. .. 86 019 139 885 182 720 228 817 298 876 399 868 CEI
Groupements commerciaux
Imports (c.i.f.) - Importations (c.a.f.)Millions de dollars
1.1.3 Exportations et importations des groupements commerciaux Valeur
Sources : - Les données dans ce tableau ont été calculées d'après les chiffres du tableau 1.1.1.
1
23

1980 1985 1990 1995 2000 2002 2003 2004 2005 2006 2007
AFRICA
CEMAC (formerly UDEAC) 0.23 0.20 0.16 0.12 0.13 0.14 0.15 0.18 0.22 0.23 0.23
CEPGL 0.12 0.11 0.07 0.03 0.01 0.02 0.02 0.02 0.02 0.02 0.02
COMESA 1.67 1.17 0.79 0.44 0.46 0.44 0.47 0.48 0.59 0.65 0.66
ECCAS 0.44 0.42 0.34 0.22 0.27 0.29 0.30 0.35 0.48 0.52 0.54
ECOWAS 1.64 0.97 0.66 0.43 0.55 0.46 0.49 0.55 0.62 0.59 0.48
MRU 0.06 0.05 0.09 0.03 0.02 0.01 0.01 0.01 0.01 0.01 0.01
SADC 1.69 1.20 1.01 0.77 0.79 0.81 0.82 0.86 0.93 0.96 1.01
UEMOA 0.24 0.22 0.15 0.13 0.10 0.13 0.13 0.13 0.12 0.11 0.11
UMA 2.00 1.49 1.04 0.63 0.75 0.67 0.73 0.76 0.91 0.97 0.93
AMERICA
ANCOM 0.55 0.51 0.39 0.41 0.41 0.40 0.40 0.42 0.48 0.54 0.55
CACM 0.24 0.19 0.13 0.17 0.21 0.19 0.18 0.16 0.16 0.15 0.15
CARICOM 0.57 0.34 0.14 0.11 0.13 0.11 0.12 0.12 0.14 0.17 0.13
FTAA 19.38 20.90 18.91 19.37 21.95 19.92 18.25 17.33 17.47 17.39 16.89
LAIA 4.35 4.89 3.78 4.01 5.14 4.96 4.66 4.77 5.04 5.23 5.15
MERCOSUR 1.45 1.79 1.33 1.36 1.31 1.37 1.41 1.48 1.57 1.57 1.62
NAFTA 15.32 17.08 16.15 16.56 18.97 17.06 15.41 14.29 14.13 13.88 13.38
OECS 0.01 0.01 0.01 0.01 0.01 0.00 0.00 0.00 0.00 0.00 0.00
ASIA
APTA 2.27 3.51 4.27 6.04 7.37 8.47 9.32 10.22 11.09 11.87 12.70
ASEAN 3.64 3.68 4.18 6.25 6.69 6.29 6.01 6.20 6.23 6.33 6.26
ECO 0.91 1.29 1.09 1.17 1.28 1.40 1.54 1.67 1.83 1.84 1.97
GCC 7.63 3.20 2.52 2.04 2.72 2.59 2.82 3.10 3.79 4.00 3.86
SAARC 0.65 0.73 0.79 0.90 1.00 1.11 1.11 1.14 1.27 1.31 1.33
EUROPE
EFTA 2.42 2.45 2.86 2.43 2.22 2.37 2.32 2.26 2.25 2.25 2.26
EU 41.48 40.73 44.46 42.33 38.02 40.65 41.72 40.95 38.86 37.97 38.20
Euro zone 30.75 30.21 35.05 33.32 29.33 31.52 32.48 31.73 29.79 28.73 29.19
OCEANIA
MSG 0.07 0.06 0.05 0.07 0.04 0.03 0.04 0.04 0.04 0.04 0.04
INTERREGIONAL
ACP 4.69 3.27 2.26 1.68 1.84 1.75 1.81 1.94 2.14 2.19 2.09
APEC 30.87 37.57 38.30 45.52 48.25 45.62 44.26 44.21 44.74 45.19 44.97
BSEC 1.46 1.93 0.92 2.78 2.76 2.99 3.30 3.62 3.96 4.16 4.36
CIS .. .. .. 2.21 2.26 2.36 2.58 2.89 3.25 3.52 3.64
Exports (f.o.b) - Exportations (f.a.b.)PercentageTrade group
1.1.3 Exports and imports of trade groups Share
Sources:- Data in this table are based on trade figures in table 1.1.1.
24
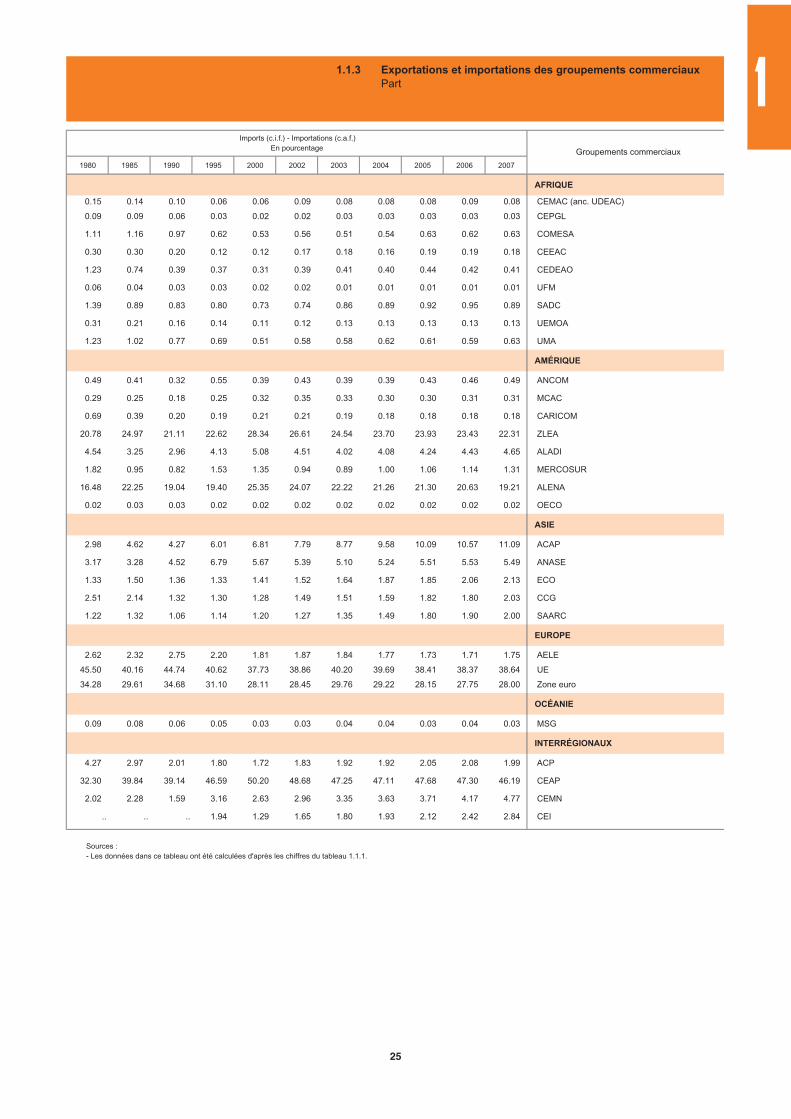
1980 1985 1990 1995 2000 2002 2003 2004 2005 2006 2007
AFRIQUE
0.15 0.14 0.10 0.06 0.06 0.09 0.08 0.08 0.08 0.09 0.08 CEMAC (anc. UDEAC)
0.09 0.09 0.06 0.03 0.02 0.02 0.03 0.03 0.03 0.03 0.03 CEPGL
1.11 1.16 0.97 0.62 0.53 0.56 0.51 0.54 0.63 0.62 0.63 COMESA
0.30 0.30 0.20 0.12 0.12 0.17 0.18 0.16 0.19 0.19 0.18 CEEAC
1.23 0.74 0.39 0.37 0.31 0.39 0.41 0.40 0.44 0.42 0.41 CEDEAO
0.06 0.04 0.03 0.03 0.02 0.02 0.01 0.01 0.01 0.01 0.01 UFM
1.39 0.89 0.83 0.80 0.73 0.74 0.86 0.89 0.92 0.95 0.89 SADC
0.31 0.21 0.16 0.14 0.11 0.12 0.13 0.13 0.13 0.13 0.13 UEMOA
1.23 1.02 0.77 0.69 0.51 0.58 0.58 0.62 0.61 0.59 0.63 UMA
AMÉRIQUE
0.49 0.41 0.32 0.55 0.39 0.43 0.39 0.39 0.43 0.46 0.49 ANCOM
0.29 0.25 0.18 0.25 0.32 0.35 0.33 0.30 0.30 0.31 0.31 MCAC
0.69 0.39 0.20 0.19 0.21 0.21 0.19 0.18 0.18 0.18 0.18 CARICOM
20.78 24.97 21.11 22.62 28.34 26.61 24.54 23.70 23.93 23.43 22.31 ZLEA
4.54 3.25 2.96 4.13 5.08 4.51 4.02 4.08 4.24 4.43 4.65 ALADI
1.82 0.95 0.82 1.53 1.35 0.94 0.89 1.00 1.06 1.14 1.31 MERCOSUR
16.48 22.25 19.04 19.40 25.35 24.07 22.22 21.26 21.30 20.63 19.21 ALENA
0.02 0.03 0.03 0.02 0.02 0.02 0.02 0.02 0.02 0.02 0.02 OECO
ASIE
2.98 4.62 4.27 6.01 6.81 7.79 8.77 9.58 10.09 10.57 11.09 ACAP
3.17 3.28 4.52 6.79 5.67 5.39 5.10 5.24 5.51 5.53 5.49 ANASE
1.33 1.50 1.36 1.33 1.41 1.52 1.64 1.87 1.85 2.06 2.13 ECO
2.51 2.14 1.32 1.30 1.28 1.49 1.51 1.59 1.82 1.80 2.03 CCG
1.22 1.32 1.06 1.14 1.20 1.27 1.35 1.49 1.80 1.90 2.00 SAARC
EUROPE
2.62 2.32 2.75 2.20 1.81 1.87 1.84 1.77 1.73 1.71 1.75 AELE
45.50 40.16 44.74 40.62 37.73 38.86 40.20 39.69 38.41 38.37 38.64 UE
34.28 29.61 34.68 31.10 28.11 28.45 29.76 29.22 28.15 27.75 28.00 Zone euro
OCÉANIE
0.09 0.08 0.06 0.05 0.03 0.03 0.04 0.04 0.03 0.04 0.03 MSG
INTERRÉGIONAUX
4.27 2.97 2.01 1.80 1.72 1.83 1.92 1.92 2.05 2.08 1.99 ACP
32.30 39.84 39.14 46.59 50.20 48.68 47.25 47.11 47.68 47.30 46.19 CEAP
2.02 2.28 1.59 3.16 2.63 2.96 3.35 3.63 3.71 4.17 4.77 CEMN
.. .. .. 1.94 1.29 1.65 1.80 1.93 2.12 2.42 2.84 CEI
Groupements commerciaux
Imports (c.i.f.) - Importations (c.a.f.)En pourcentage
1.1.3 Exportations et importations des groupements commerciaux Part
Sources : - Les données dans ce tableau ont été calculées d'après les chiffres du tableau 1.1.1.
1
25
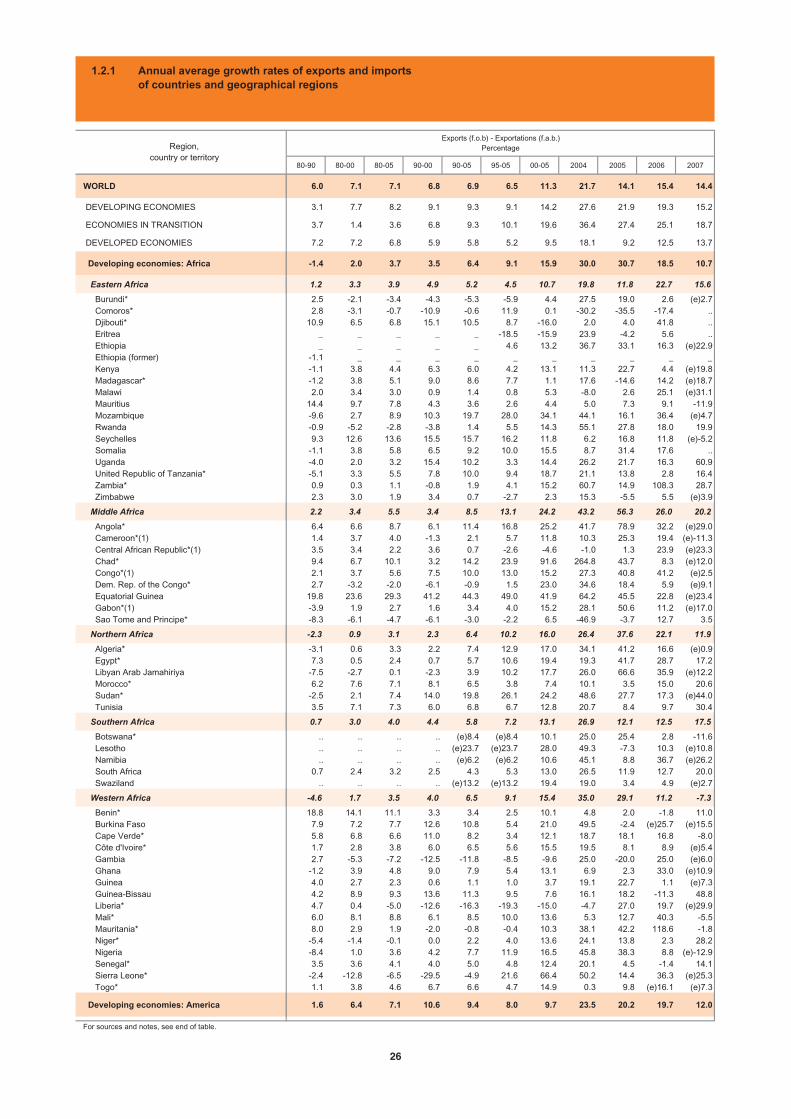
80-90 80-00 80-05 90-00 90-05 95-05 00-05 2004 2005 2006 2007
WORLD 6.0 7.1 7.1 6.8 6.9 6.5 11.3 21.7 14.1 15.4 14.4
DEVELOPING ECONOMIES 3.1 7.7 8.2 9.1 9.3 9.1 14.2 27.6 21.9 19.3 15.2
ECONOMIES IN TRANSITION 3.7 1.4 3.6 6.8 9.3 10.1 19.6 36.4 27.4 25.1 18.7
DEVELOPED ECONOMIES 7.2 7.2 6.8 5.9 5.8 5.2 9.5 18.1 9.2 12.5 13.7
Developing economies: Africa -1.4 2.0 3.7 3.5 6.4 9.1 15.9 30.0 30.7 18.5 10.7
Eastern Africa 1.2 3.3 3.9 4.9 5.2 4.5 10.7 19.8 11.8 22.7 15.6
Burundi* 2.5 -2.1 -3.4 -4.3 -5.3 -5.9 4.4 27.5 19.0 2.6 (e)2.7 Comoros* 2.8 -3.1 -0.7 -10.9 -0.6 11.9 0.1 -30.2 -35.5 -17.4 .. Djibouti* 10.9 6.5 6.8 15.1 10.5 8.7 -16.0 2.0 4.0 41.8 .. Eritrea _ _ _ _ _ -18.5 -15.9 23.9 -4.2 5.6 .. Ethiopia _ _ _ _ _ 4.6 13.2 36.7 33.1 16.3 (e)22.9 Ethiopia (former) -1.1 _ _ _ _ _ _ _ _ _ _ Kenya -1.1 3.8 4.4 6.3 6.0 4.2 13.1 11.3 22.7 4.4 (e)19.8 Madagascar* -1.2 3.8 5.1 9.0 8.6 7.7 1.1 17.6 -14.6 14.2 (e)18.7 Malawi 2.0 3.4 3.0 0.9 1.4 0.8 5.3 -8.0 2.6 25.1 (e)31.1 Mauritius 14.4 9.7 7.8 4.3 3.6 2.6 4.4 5.0 7.3 9.1 -11.9 Mozambique -9.6 2.7 8.9 10.3 19.7 28.0 34.1 44.1 16.1 36.4 (e)4.7 Rwanda -0.9 -5.2 -2.8 -3.8 1.4 5.5 14.3 55.1 27.8 18.0 19.9 Seychelles 9.3 12.6 13.6 15.5 15.7 16.2 11.8 6.2 16.8 11.8 (e)-5.2 Somalia -1.1 3.8 5.8 6.5 9.2 10.0 15.5 8.7 31.4 17.6 .. Uganda -4.0 2.0 3.2 15.4 10.2 3.3 14.4 26.2 21.7 16.3 60.9 United Republic of Tanzania* -5.1 3.3 5.5 7.8 10.0 9.4 18.7 21.1 13.8 2.8 16.4 Zambia* 0.9 0.3 1.1 -0.8 1.9 4.1 15.2 60.7 14.9 108.3 28.7 Zimbabwe 2.3 3.0 1.9 3.4 0.7 -2.7 2.3 15.3 -5.5 5.5 (e)3.9
Middle Africa 2.2 3.4 5.5 3.4 8.5 13.1 24.2 43.2 56.3 26.0 20.2
Angola* 6.4 6.6 8.7 6.1 11.4 16.8 25.2 41.7 78.9 32.2 (e)29.0 Cameroon*(1) 1.4 3.7 4.0 -1.3 2.1 5.7 11.8 10.3 25.3 19.4 (e)-11.3 Central African Republic*(1) 3.5 3.4 2.2 3.6 0.7 -2.6 -4.6 -1.0 1.3 23.9 (e)23.3 Chad* 9.4 6.7 10.1 3.2 14.2 23.9 91.6 264.8 43.7 8.3 (e)12.0 Congo*(1) 2.1 3.7 5.6 7.5 10.0 13.0 15.2 27.3 40.8 41.2 (e)2.5 Dem. Rep. of the Congo* 2.7 -3.2 -2.0 -6.1 -0.9 1.5 23.0 34.6 18.4 5.9 (e)9.1 Equatorial Guinea 19.8 23.6 29.3 41.2 44.3 49.0 41.9 64.2 45.5 22.8 (e)23.4 Gabon*(1) -3.9 1.9 2.7 1.6 3.4 4.0 15.2 28.1 50.6 11.2 (e)17.0 Sao Tome and Principe* -8.3 -6.1 -4.7 -6.1 -3.0 -2.2 6.5 -46.9 -3.7 12.7 3.5
Northern Africa -2.3 0.9 3.1 2.3 6.4 10.2 16.0 26.4 37.6 22.1 11.9
Algeria* -3.1 0.6 3.3 2.2 7.4 12.9 17.0 34.1 41.2 16.6 (e)0.9 Egypt* 7.3 0.5 2.4 0.7 5.7 10.6 19.4 19.3 41.7 28.7 17.2 Libyan Arab Jamahiriya -7.5 -2.7 0.1 -2.3 3.9 10.2 17.7 26.0 66.6 35.9 (e)12.2 Morocco* 6.2 7.6 7.1 8.1 6.5 3.8 7.4 10.1 3.5 15.0 20.6 Sudan* -2.5 2.1 7.4 14.0 19.8 26.1 24.2 48.6 27.7 17.3 (e)44.0 Tunisia 3.5 7.1 7.3 6.0 6.8 6.7 12.8 20.7 8.4 9.7 30.4
Southern Africa 0.7 3.0 4.0 4.4 5.8 7.2 13.1 26.9 12.1 12.5 17.5
Botswana* .. .. .. .. (e)8.4 (e)8.4 10.1 25.0 25.4 2.8 -11.6 Lesotho .. .. .. .. (e)23.7 (e)23.7 28.0 49.3 -7.3 10.3 (e)10.8 Namibia .. .. .. .. (e)6.2 (e)6.2 10.6 45.1 8.8 36.7 (e)26.2 South Africa 0.7 2.4 3.2 2.5 4.3 5.3 13.0 26.5 11.9 12.7 20.0 Swaziland .. .. .. .. (e)13.2 (e)13.2 19.4 19.0 3.4 4.9 (e)2.7
Western Africa -4.6 1.7 3.5 4.0 6.5 9.1 15.4 35.0 29.1 11.2 -7.3
Benin* 18.8 14.1 11.1 3.3 3.4 2.5 10.1 4.8 2.0 -1.8 11.0 Burkina Faso 7.9 7.2 7.7 12.6 10.8 5.4 21.0 49.5 -2.4 (e)25.7 (e)15.5 Cape Verde* 5.8 6.8 6.6 11.0 8.2 3.4 12.1 18.7 18.1 16.8 -8.0 Côte d'Ivoire* 1.7 2.8 3.8 6.0 6.5 5.6 15.5 19.5 8.1 8.9 (e)5.4 Gambia 2.7 -5.3 -7.2 -12.5 -11.8 -8.5 -9.6 25.0 -20.0 25.0 (e)6.0 Ghana -1.2 3.9 4.8 9.0 7.9 5.4 13.1 6.9 2.3 33.0 (e)10.9 Guinea 4.0 2.7 2.3 0.6 1.1 1.0 3.7 19.1 22.7 1.1 (e)7.3 Guinea-Bissau 4.2 8.9 9.3 13.6 11.3 9.5 7.6 16.1 18.2 -11.3 48.8 Liberia* 4.7 0.4 -5.0 -12.6 -16.3 -19.3 -15.0 -4.7 27.0 19.7 (e)29.9 Mali* 6.0 8.1 8.8 6.1 8.5 10.0 13.6 5.3 12.7 40.3 -5.5 Mauritania* 8.0 2.9 1.9 -2.0 -0.8 -0.4 10.3 38.1 42.2 118.6 -1.8 Niger* -5.4 -1.4 -0.1 0.0 2.2 4.0 13.6 24.1 13.8 2.3 28.2 Nigeria -8.4 1.0 3.6 4.2 7.7 11.9 16.5 45.8 38.3 8.8 (e)-12.9 Senegal* 3.5 3.6 4.1 4.0 5.0 4.8 12.4 20.1 4.5 -1.4 14.1 Sierra Leone* -2.4 -12.8 -6.5 -29.5 -4.9 21.6 66.4 50.2 14.4 36.3 (e)25.3 Togo* 1.1 3.8 4.6 6.7 6.6 4.7 14.9 0.3 9.8 (e)16.1 (e)7.3
Developing economies: America 1.6 6.4 7.1 10.6 9.4 8.0 9.7 23.5 20.2 19.7 12.0
For sources and notes, see end of table.
Exports (f.o.b) - Exportations (f.a.b.)PercentageRegion,
country or territory
1.2.1 Annual average growth rates of exports and importsof countries and geographical regions
26
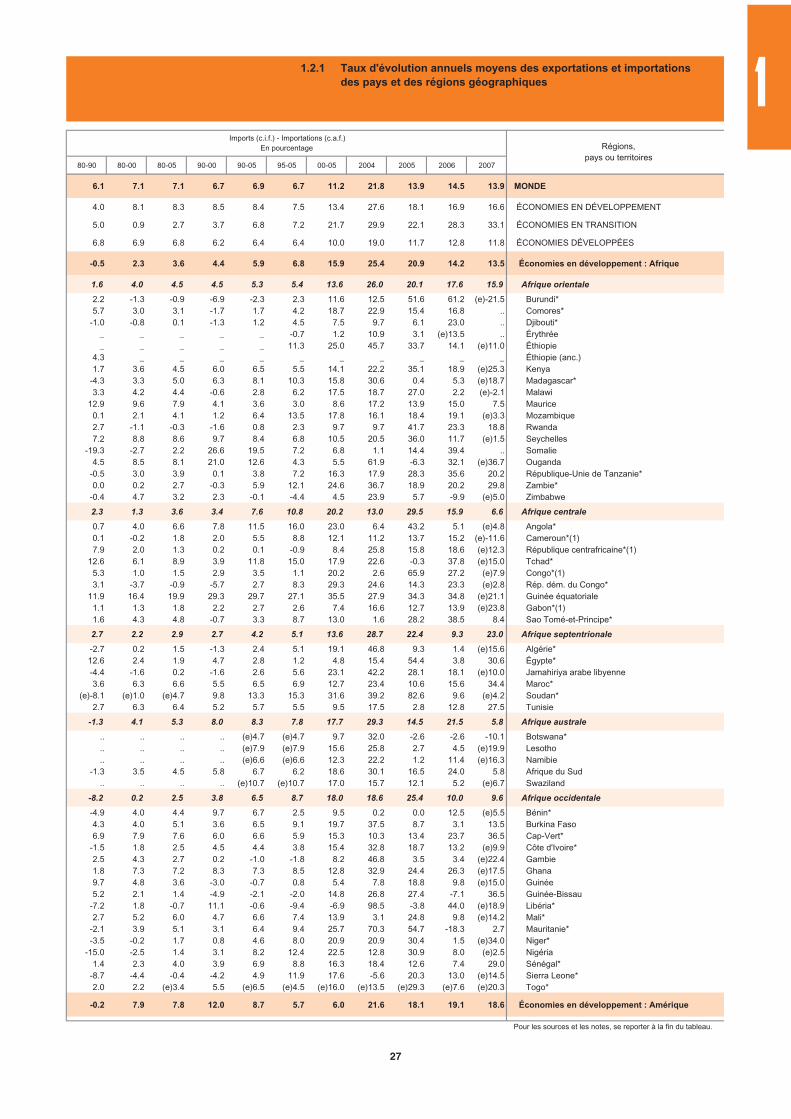
80-90 80-00 80-05 90-00 90-05 95-05 00-05 2004 2005 2006 2007
6.1 7.1 7.1 6.7 6.9 6.7 11.2 21.8 13.9 14.5 13.9 MONDE
4.0 8.1 8.3 8.5 8.4 7.5 13.4 27.6 18.1 16.9 16.6 ÉCONOMIES EN DÉVELOPPEMENT
5.0 0.9 2.7 3.7 6.8 7.2 21.7 29.9 22.1 28.3 33.1 ÉCONOMIES EN TRANSITION
6.8 6.9 6.8 6.2 6.4 6.4 10.0 19.0 11.7 12.8 11.8 ÉCONOMIES DÉVELOPPÉES
-0.5 2.3 3.6 4.4 5.9 6.8 15.9 25.4 20.9 14.2 13.5 Économies en développement : Afrique
1.6 4.0 4.5 4.5 5.3 5.4 13.6 26.0 20.1 17.6 15.9 Afrique orientale
2.2 -1.3 -0.9 -6.9 -2.3 2.3 11.6 12.5 51.6 61.2 (e)-21.5 Burundi*5.7 3.0 3.1 -1.7 1.7 4.2 18.7 22.9 15.4 16.8 .. Comores*
-1.0 -0.8 0.1 -1.3 1.2 4.5 7.5 9.7 6.1 23.0 .. Djibouti*_ _ _ _ _ -0.7 1.2 10.9 3.1 (e)13.5 .. Érythrée_ _ _ _ _ 11.3 25.0 45.7 33.7 14.1 (e)11.0 Éthiopie
4.3 _ _ _ _ _ _ _ _ _ _ Éthiopie (anc.)1.7 3.6 4.5 6.0 6.5 5.5 14.1 22.2 35.1 18.9 (e)25.3 Kenya
-4.3 3.3 5.0 6.3 8.1 10.3 15.8 30.6 0.4 5.3 (e)18.7 Madagascar*3.3 4.2 4.4 -0.6 2.8 6.2 17.5 18.7 27.0 2.2 (e)-2.1 Malawi
12.9 9.6 7.9 4.1 3.6 3.0 8.6 17.2 13.9 15.0 7.5 Maurice0.1 2.1 4.1 1.2 6.4 13.5 17.8 16.1 18.4 19.1 (e)3.3 Mozambique2.7 -1.1 -0.3 -1.6 0.8 2.3 9.7 9.7 41.7 23.3 18.8 Rwanda7.2 8.8 8.6 9.7 8.4 6.8 10.5 20.5 36.0 11.7 (e)1.5 Seychelles
-19.3 -2.7 2.2 26.6 19.5 7.2 6.8 1.1 14.4 39.4 .. Somalie4.5 8.5 8.1 21.0 12.6 4.3 5.5 61.9 -6.3 32.1 (e)36.7 Ouganda
-0.5 3.0 3.9 0.1 3.8 7.2 16.3 17.9 28.3 35.6 20.2 République-Unie de Tanzanie*0.0 0.2 2.7 -0.3 5.9 12.1 24.6 36.7 18.9 20.2 29.8 Zambie*
-0.4 4.7 3.2 2.3 -0.1 -4.4 4.5 23.9 5.7 -9.9 (e)5.0 Zimbabwe
2.3 1.3 3.6 3.4 7.6 10.8 20.2 13.0 29.5 15.9 6.6 Afrique centrale
0.7 4.0 6.6 7.8 11.5 16.0 23.0 6.4 43.2 5.1 (e)4.8 Angola*0.1 -0.2 1.8 2.0 5.5 8.8 12.1 11.2 13.7 15.2 (e)-11.6 Cameroun*(1)7.9 2.0 1.3 0.2 0.1 -0.9 8.4 25.8 15.8 18.6 (e)12.3 République centrafricaine*(1)
12.6 6.1 8.9 3.9 11.8 15.0 17.9 22.6 -0.3 37.8 (e)15.0 Tchad*5.3 1.0 1.5 2.9 3.5 1.1 20.2 2.6 65.9 27.2 (e)7.9 Congo*(1)3.1 -3.7 -0.9 -5.7 2.7 8.3 29.3 24.6 14.3 23.3 (e)2.8 Rép. dém. du Congo*
11.9 16.4 19.9 29.3 29.7 27.1 35.5 27.9 34.3 34.8 (e)21.1 Guinée équatoriale1.1 1.3 1.8 2.2 2.7 2.6 7.4 16.6 12.7 13.9 (e)23.8 Gabon*(1)1.6 4.3 4.8 -0.7 3.3 8.7 13.0 1.6 28.2 38.5 8.4 Sao Tomé-et-Principe*
2.7 2.2 2.9 2.7 4.2 5.1 13.6 28.7 22.4 9.3 23.0 Afrique septentrionale
-2.7 0.2 1.5 -1.3 2.4 5.1 19.1 46.8 9.3 1.4 (e)15.6 Algérie*12.6 2.4 1.9 4.7 2.8 1.2 4.8 15.4 54.4 3.8 30.6 Égypte*-4.4 -1.6 0.2 -1.6 2.6 5.6 23.1 42.2 28.1 18.1 (e)10.0 Jamahiriya arabe libyenne3.6 6.3 6.6 5.5 6.5 6.9 12.7 23.4 10.6 15.6 34.4 Maroc*
(e)-8.1 (e)1.0 (e)4.7 9.8 13.3 15.3 31.6 39.2 82.6 9.6 (e)4.2 Soudan*2.7 6.3 6.4 5.2 5.7 5.5 9.5 17.5 2.8 12.8 27.5 Tunisie
-1.3 4.1 5.3 8.0 8.3 7.8 17.7 29.3 14.5 21.5 5.8 Afrique australe
.. .. .. .. (e)4.7 (e)4.7 9.7 32.0 -2.6 -2.6 -10.1 Botswana*
.. .. .. .. (e)7.9 (e)7.9 15.6 25.8 2.7 4.5 (e)19.9 Lesotho
.. .. .. .. (e)6.6 (e)6.6 12.3 22.2 1.2 11.4 (e)16.3 Namibie-1.3 3.5 4.5 5.8 6.7 6.2 18.6 30.1 16.5 24.0 5.8 Afrique du Sud
.. .. .. .. (e)10.7 (e)10.7 17.0 15.7 12.1 5.2 (e)6.7 Swaziland
-8.2 0.2 2.5 3.8 6.5 8.7 18.0 18.6 25.4 10.0 9.6 Afrique occidentale
-4.9 4.0 4.4 9.7 6.7 2.5 9.5 0.2 0.0 12.5 (e)5.5 Bénin*4.3 4.0 5.1 3.6 6.5 9.1 19.7 37.5 8.7 3.1 13.5 Burkina Faso6.9 7.9 7.6 6.0 6.6 5.9 15.3 10.3 13.4 23.7 36.5 Cap-Vert*
-1.5 1.8 2.5 4.5 4.4 3.8 15.4 32.8 18.7 13.2 (e)9.9 Côte d'Ivoire*2.5 4.3 2.7 0.2 -1.0 -1.8 8.2 46.8 3.5 3.4 (e)22.4 Gambie1.8 7.3 7.2 8.3 7.3 8.5 12.8 32.9 24.4 26.3 (e)17.5 Ghana9.7 4.8 3.6 -3.0 -0.7 0.8 5.4 7.8 18.8 9.8 (e)15.0 Guinée5.2 2.1 1.4 -4.9 -2.1 -2.0 14.8 26.8 27.4 -7.1 36.5 Guinée-Bissau
-7.2 1.8 -0.7 11.1 -0.6 -9.4 -6.9 98.5 -3.8 44.0 (e)18.9 Libéria*2.7 5.2 6.0 4.7 6.6 7.4 13.9 3.1 24.8 9.8 (e)14.2 Mali*
-2.1 3.9 5.1 3.1 6.4 9.4 25.7 70.3 54.7 -18.3 2.7 Mauritanie*-3.5 -0.2 1.7 0.8 4.6 8.0 20.9 20.9 30.4 1.5 (e)34.0 Niger*
-15.0 -2.5 1.4 3.1 8.2 12.4 22.5 12.8 30.9 8.0 (e)2.5 Nigéria1.4 2.3 4.0 3.9 6.9 8.8 16.3 18.4 12.6 7.4 29.0 Sénégal*
-8.7 -4.4 -0.4 -4.2 4.9 11.9 17.6 -5.6 20.3 13.0 (e)14.5 Sierra Leone*2.0 2.2 (e)3.4 5.5 (e)6.5 (e)4.5 (e)16.0 (e)13.5 (e)29.3 (e)7.6 (e)20.3 Togo*
-0.2 7.9 7.8 12.0 8.7 5.7 6.0 21.6 18.1 19.1 18.6 Économies en développement : Amérique
Pour les sources et les notes, se reporter à la fin du tableau.
Régions,pays ou territoires
Imports (c.i.f.) - Importations (c.a.f.)En pourcentage
1.2.1 Taux d'évolution annuels moyens des exportations et importationsdes pays et des régions géographiques 1
27
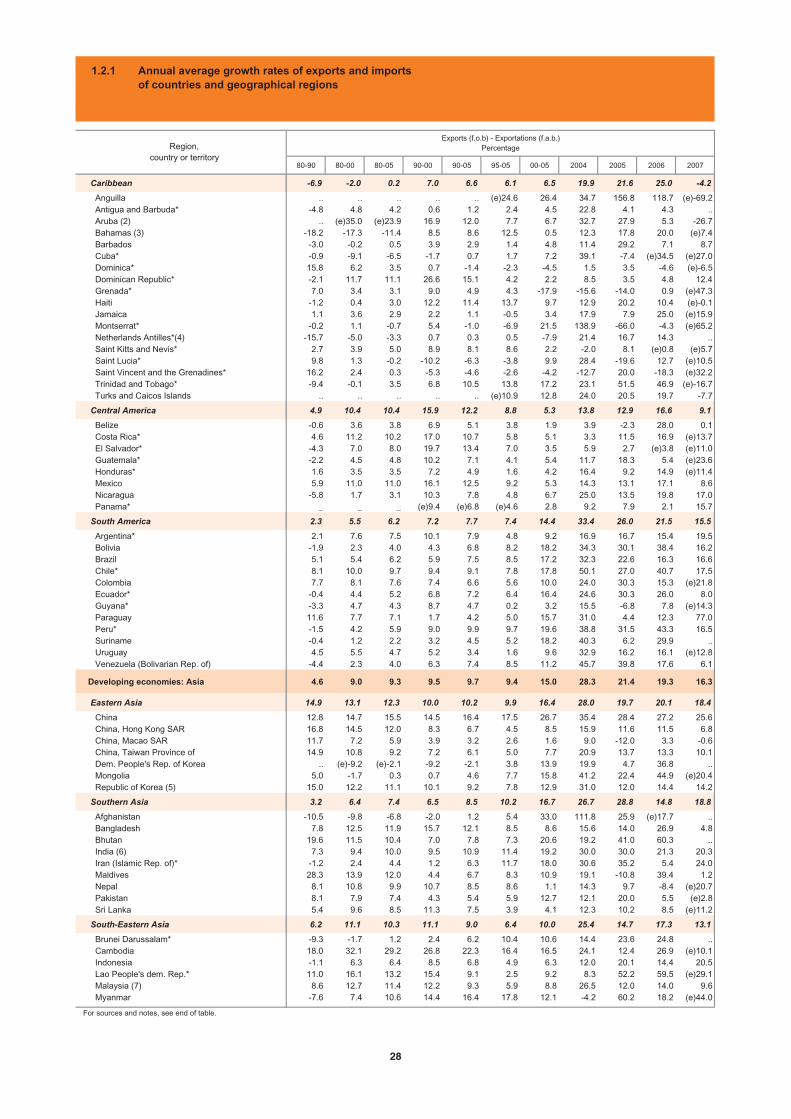
80-90 80-00 80-05 90-00 90-05 95-05 00-05 2004 2005 2006 2007
Caribbean -6.9 -2.0 0.2 7.0 6.6 6.1 6.5 19.9 21.6 25.0 -4.2
Anguilla .. .. .. .. .. (e)24.6 26.4 34.7 156.8 118.7 (e)-69.2 Antigua and Barbuda* -4.8 4.8 4.2 0.6 1.2 2.4 4.5 22.8 4.1 4.3 .. Aruba (2) .. (e)35.0 (e)23.9 16.9 12.0 7.7 6.7 32.7 27.9 5.3 -26.7 Bahamas (3) -18.2 -17.3 -11.4 8.5 8.6 12.5 0.5 12.3 17.8 20.0 (e)7.4 Barbados -3.0 -0.2 0.5 3.9 2.9 1.4 4.8 11.4 29.2 7.1 8.7 Cuba* -0.9 -9.1 -6.5 -1.7 0.7 1.7 7.2 39.1 -7.4 (e)34.5 (e)27.0 Dominica* 15.8 6.2 3.5 0.7 -1.4 -2.3 -4.5 1.5 3.5 -4.6 (e)-6.5 Dominican Republic* -2.1 11.7 11.1 26.6 15.1 4.2 2.2 8.5 3.5 4.8 12.4 Grenada* 7.0 3.4 3.1 9.0 4.9 4.3 -17.9 -15.6 -14.0 0.9 (e)47.3 Haiti -1.2 0.4 3.0 12.2 11.4 13.7 9.7 12.9 20.2 10.4 (e)-0.1 Jamaica 1.1 3.6 2.9 2.2 1.1 -0.5 3.4 17.9 7.9 25.0 (e)15.9 Montserrat* -0.2 1.1 -0.7 5.4 -1.0 -6.9 21.5 138.9 -66.0 -4.3 (e)65.2 Netherlands Antilles*(4) -15.7 -5.0 -3.3 0.7 0.3 0.5 -7.9 21.4 16.7 14.3 .. Saint Kitts and Nevis* 2.7 3.9 5.0 8.9 8.1 8.6 2.2 -2.0 8.1 (e)0.8 (e)5.7 Saint Lucia* 9.8 1.3 -0.2 -10.2 -6.3 -3.8 9.9 28.4 -19.6 12.7 (e)10.5 Saint Vincent and the Grenadines* 16.2 2.4 0.3 -5.3 -4.6 -2.6 -4.2 -12.7 20.0 -18.3 (e)32.2 Trinidad and Tobago* -9.4 -0.1 3.5 6.8 10.5 13.8 17.2 23.1 51.5 46.9 (e)-16.7 Turks and Caicos Islands .. .. .. .. .. (e)10.9 12.8 24.0 20.5 19.7 -7.7
Central America 4.9 10.4 10.4 15.9 12.2 8.8 5.3 13.8 12.9 16.6 9.1
Belize -0.6 3.6 3.8 6.9 5.1 3.8 1.9 3.9 -2.3 28.0 0.1 Costa Rica* 4.6 11.2 10.2 17.0 10.7 5.8 5.1 3.3 11.5 16.9 (e)13.7 El Salvador* -4.3 7.0 8.0 19.7 13.4 7.0 3.5 5.9 2.7 (e)3.8 (e)11.0 Guatemala* -2.2 4.5 4.8 10.2 7.1 4.1 5.4 11.7 18.3 5.4 (e)23.6 Honduras* 1.6 3.5 3.5 7.2 4.9 1.6 4.2 16.4 9.2 14.9 (e)11.4 Mexico 5.9 11.0 11.0 16.1 12.5 9.2 5.3 14.3 13.1 17.1 8.6 Nicaragua -5.8 1.7 3.1 10.3 7.8 4.8 6.7 25.0 13.5 19.8 17.0 Panama* _ _ _ (e)9.4 (e)6.8 (e)4.6 2.8 9.2 7.9 2.1 15.7
South America 2.3 5.5 6.2 7.2 7.7 7.4 14.4 33.4 26.0 21.5 15.5
Argentina* 2.1 7.6 7.5 10.1 7.9 4.8 9.2 16.9 16.7 15.4 19.5 Bolivia -1.9 2.3 4.0 4.3 6.8 8.2 18.2 34.3 30.1 38.4 16.2 Brazil 5.1 5.4 6.2 5.9 7.5 8.5 17.2 32.3 22.6 16.3 16.6 Chile* 8.1 10.0 9.7 9.4 9.1 7.8 17.8 50.1 27.0 40.7 17.5 Colombia 7.7 8.1 7.6 7.4 6.6 5.6 10.0 24.0 30.3 15.3 (e)21.8 Ecuador* -0.4 4.4 5.2 6.8 7.2 6.4 16.4 24.6 30.3 26.0 8.0 Guyana* -3.3 4.7 4.3 8.7 4.7 0.2 3.2 15.5 -6.8 7.8 (e)14.3 Paraguay 11.6 7.7 7.1 1.7 4.2 5.0 15.7 31.0 4.4 12.3 77.0 Peru* -1.5 4.2 5.9 9.0 9.9 9.7 19.6 38.8 31.5 43.3 16.5 Suriname -0.4 1.2 2.2 3.2 4.5 5.2 18.2 40.3 6.2 29.9 .. Uruguay 4.5 5.5 4.7 5.2 3.4 1.6 9.6 32.9 16.2 16.1 (e)12.8 Venezuela (Bolivarian Rep. of) -4.4 2.3 4.0 6.3 7.4 8.5 11.2 45.7 39.8 17.6 6.1
Developing economies: Asia 4.6 9.0 9.3 9.5 9.7 9.4 15.0 28.3 21.4 19.3 16.3
Eastern Asia 14.9 13.1 12.3 10.0 10.2 9.9 16.4 28.0 19.7 20.1 18.4
China 12.8 14.7 15.5 14.5 16.4 17.5 26.7 35.4 28.4 27.2 25.6 China, Hong Kong SAR 16.8 14.5 12.0 8.3 6.7 4.5 8.5 15.9 11.6 11.5 6.8 China, Macao SAR 11.7 7.2 5.9 3.9 3.2 2.6 1.6 9.0 -12.0 3.3 -0.6 China, Taiwan Province of 14.9 10.8 9.2 7.2 6.1 5.0 7.7 20.9 13.7 13.3 10.1 Dem. People's Rep. of Korea .. (e)-9.2 (e)-2.1 -9.2 -2.1 3.8 13.9 19.9 4.7 36.8 .. Mongolia 5.0 -1.7 0.3 0.7 4.6 7.7 15.8 41.2 22.4 44.9 (e)20.4 Republic of Korea (5) 15.0 12.2 11.1 10.1 9.2 7.8 12.9 31.0 12.0 14.4 14.2
Southern Asia 3.2 6.4 7.4 6.5 8.5 10.2 16.7 26.7 28.8 14.8 18.8
Afghanistan -10.5 -9.8 -6.8 -2.0 1.2 5.4 33.0 111.8 25.9 (e)17.7 .. Bangladesh 7.8 12.5 11.9 15.7 12.1 8.5 8.6 15.6 14.0 26.9 4.8 Bhutan 19.6 11.5 10.4 7.0 7.8 7.3 20.6 19.2 41.0 60.3 .. India (6) 7.3 9.4 10.0 9.5 10.9 11.4 19.2 30.0 30.0 21.3 20.3 Iran (Islamic Rep. of)* -1.2 2.4 4.4 1.2 6.3 11.7 18.0 30.6 35.2 5.4 24.0 Maldives 28.3 13.9 12.0 4.4 6.7 8.3 10.9 19.1 -10.8 39.4 1.2 Nepal 8.1 10.8 9.9 10.7 8.5 8.6 1.1 14.3 9.7 -8.4 (e)20.7 Pakistan 8.1 7.9 7.4 4.3 5.4 5.9 12.7 12.1 20.0 5.5 (e)2.8 Sri Lanka 5.4 9.6 8.5 11.3 7.5 3.9 4.1 12.3 10.2 8.5 (e)11.2
South-Eastern Asia 6.2 11.1 10.3 11.1 9.0 6.4 10.0 25.4 14.7 17.3 13.1
Brunei Darussalam* -9.3 -1.7 1.2 2.4 6.2 10.4 10.6 14.4 23.6 24.8 .. Cambodia 18.0 32.1 29.2 26.8 22.3 16.4 16.5 24.1 12.4 26.9 (e)10.1 Indonesia -1.1 6.3 6.4 8.5 6.8 4.9 6.3 12.0 20.1 14.4 20.5 Lao People's dem. Rep.* 11.0 16.1 13.2 15.4 9.1 2.5 9.2 8.3 52.2 59.5 (e)29.1 Malaysia (7) 8.6 12.7 11.4 12.2 9.3 5.9 8.8 26.5 12.0 14.0 9.6 Myanmar -7.6 7.4 10.6 14.4 16.4 17.8 12.1 -4.2 60.2 18.2 (e)44.0
For sources and notes, see end of table.
Region,country or territory
Exports (f.o.b) - Exportations (f.a.b.)Percentage
1.2.1 Annual average growth rates of exports and importsof countries and geographical regions
28
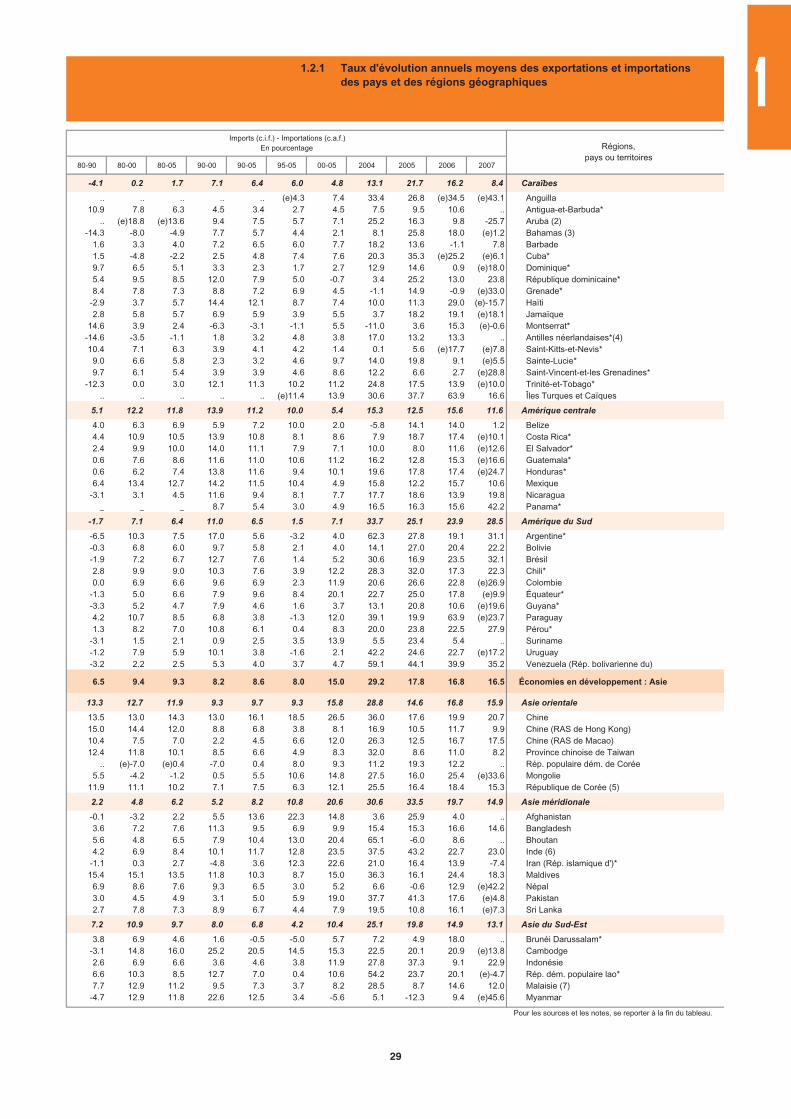
80-90 80-00 80-05 90-00 90-05 95-05 00-05 2004 2005 2006 2007
-4.1 0.2 1.7 7.1 6.4 6.0 4.8 13.1 21.7 16.2 8.4 Caraïbes
.. .. .. .. .. (e)4.3 7.4 33.4 26.8 (e)34.5 (e)43.1 Anguilla10.9 7.8 6.3 4.5 3.4 2.7 4.5 7.5 9.5 10.6 .. Antigua-et-Barbuda*
.. (e)18.8 (e)13.6 9.4 7.5 5.7 7.1 25.2 16.3 9.8 -25.7 Aruba (2)-14.3 -8.0 -4.9 7.7 5.7 4.4 2.1 8.1 25.8 18.0 (e)1.2 Bahamas (3)
1.6 3.3 4.0 7.2 6.5 6.0 7.7 18.2 13.6 -1.1 7.8 Barbade1.5 -4.8 -2.2 2.5 4.8 7.4 7.6 20.3 35.3 (e)25.2 (e)6.1 Cuba*9.7 6.5 5.1 3.3 2.3 1.7 2.7 12.9 14.6 0.9 (e)18.0 Dominique*5.4 9.5 8.5 12.0 7.9 5.0 -0.7 3.4 25.2 13.0 23.8 République dominicaine*8.4 7.8 7.3 8.8 7.2 6.9 4.5 -1.1 14.9 -0.9 (e)33.0 Grenade*
-2.9 3.7 5.7 14.4 12.1 8.7 7.4 10.0 11.3 29.0 (e)-15.7 Haïti2.8 5.8 5.7 6.9 5.9 3.9 5.5 3.7 18.2 19.1 (e)18.1 Jamaïque
14.6 3.9 2.4 -6.3 -3.1 -1.1 5.5 -11.0 3.6 15.3 (e)-0.6 Montserrat*-14.6 -3.5 -1.1 1.8 3.2 4.8 3.8 17.0 13.2 13.3 .. Antilles néerlandaises*(4)10.4 7.1 6.3 3.9 4.1 4.2 1.4 0.1 5.6 (e)17.7 (e)7.8 Saint-Kitts-et-Nevis*
9.0 6.6 5.8 2.3 3.2 4.6 9.7 14.0 19.8 9.1 (e)5.5 Sainte-Lucie*9.7 6.1 5.4 3.9 3.9 4.6 8.6 12.2 6.6 2.7 (e)28.8 Saint-Vincent-et-les Grenadines*
-12.3 0.0 3.0 12.1 11.3 10.2 11.2 24.8 17.5 13.9 (e)10.0 Trinité-et-Tobago*.. .. .. .. .. (e)11.4 13.9 30.6 37.7 63.9 16.6 Îles Turques et Caïques
5.1 12.2 11.8 13.9 11.2 10.0 5.4 15.3 12.5 15.6 11.6 Amérique centrale
4.0 6.3 6.9 5.9 7.2 10.0 2.0 -5.8 14.1 14.0 1.2 Belize4.4 10.9 10.5 13.9 10.8 8.1 8.6 7.9 18.7 17.4 (e)10.1 Costa Rica*2.4 9.9 10.0 14.0 11.1 7.9 7.1 10.0 8.0 11.6 (e)12.6 El Salvador*0.6 7.6 8.6 11.6 11.0 10.6 11.2 16.2 12.8 15.3 (e)16.6 Guatemala*0.6 6.2 7.4 13.8 11.6 9.4 10.1 19.6 17.8 17.4 (e)24.7 Honduras*6.4 13.4 12.7 14.2 11.5 10.4 4.9 15.8 12.2 15.7 10.6 Mexique
-3.1 3.1 4.5 11.6 9.4 8.1 7.7 17.7 18.6 13.9 19.8 Nicaragua_ _ _ 8.7 5.4 3.0 4.9 16.5 16.3 15.6 42.2 Panama*
-1.7 7.1 6.4 11.0 6.5 1.5 7.1 33.7 25.1 23.9 28.5 Amérique du Sud
-6.5 10.3 7.5 17.0 5.6 -3.2 4.0 62.3 27.8 19.1 31.1 Argentine*-0.3 6.8 6.0 9.7 5.8 2.1 4.0 14.1 27.0 20.4 22.2 Bolivie-1.9 7.2 6.7 12.7 7.6 1.4 5.2 30.6 16.9 23.5 32.1 Brésil2.8 9.9 9.0 10.3 7.6 3.9 12.2 28.3 32.0 17.3 22.3 Chili*0.0 6.9 6.6 9.6 6.9 2.3 11.9 20.6 26.6 22.8 (e)26.9 Colombie
-1.3 5.0 6.6 7.9 9.6 8.4 20.1 22.7 25.0 17.8 (e)9.9 Équateur*-3.3 5.2 4.7 7.9 4.6 1.6 3.7 13.1 20.8 10.6 (e)19.6 Guyana*4.2 10.7 8.5 6.8 3.8 -1.3 12.0 39.1 19.9 63.9 (e)23.7 Paraguay1.3 8.2 7.0 10.8 6.1 0.4 8.3 20.0 23.8 22.5 27.9 Pérou*
-3.1 1.5 2.1 0.9 2.5 3.5 13.9 5.5 23.4 5.4 .. Suriname-1.2 7.9 5.9 10.1 3.8 -1.6 2.1 42.2 24.6 22.7 (e)17.2 Uruguay-3.2 2.2 2.5 5.3 4.0 3.7 4.7 59.1 44.1 39.9 35.2 Venezuela (Rép. bolivarienne du)
6.5 9.4 9.3 8.2 8.6 8.0 15.0 29.2 17.8 16.8 16.5 Économies en développement : Asie
13.3 12.7 11.9 9.3 9.7 9.3 15.8 28.8 14.6 16.8 15.9 Asie orientale
13.5 13.0 14.3 13.0 16.1 18.5 26.5 36.0 17.6 19.9 20.7 Chine15.0 14.4 12.0 8.8 6.8 3.8 8.1 16.9 10.5 11.7 9.9 Chine (RAS de Hong Kong)10.4 7.5 7.0 2.2 4.5 6.6 12.0 26.3 12.5 16.7 17.5 Chine (RAS de Macao)12.4 11.8 10.1 8.5 6.6 4.9 8.3 32.0 8.6 11.0 8.2 Province chinoise de Taiwan
.. (e)-7.0 (e)0.4 -7.0 0.4 8.0 9.3 11.2 19.3 12.2 .. Rép. populaire dém. de Corée5.5 -4.2 -1.2 0.5 5.5 10.6 14.8 27.5 16.0 25.4 (e)33.6 Mongolie
11.9 11.1 10.2 7.1 7.5 6.3 12.1 25.5 16.4 18.4 15.3 République de Corée (5)
2.2 4.8 6.2 5.2 8.2 10.8 20.6 30.6 33.5 19.7 14.9 Asie méridionale
-0.1 -3.2 2.2 5.5 13.6 22.3 14.8 3.6 25.9 4.0 .. Afghanistan3.6 7.2 7.6 11.3 9.5 6.9 9.9 15.4 15.3 16.6 14.6 Bangladesh5.6 4.8 6.5 7.9 10.4 13.0 20.4 65.1 -6.0 8.6 .. Bhoutan4.2 6.9 8.4 10.1 11.7 12.8 23.5 37.5 43.2 22.7 23.0 Inde (6)
-1.1 0.3 2.7 -4.8 3.6 12.3 22.6 21.0 16.4 13.9 -7.4 Iran (Rép. islamique d')*15.4 15.1 13.5 11.8 10.3 8.7 15.0 36.3 16.1 24.4 18.3 Maldives
6.9 8.6 7.6 9.3 6.5 3.0 5.2 6.6 -0.6 12.9 (e)42.2 Népal3.0 4.5 4.9 3.1 5.0 5.9 19.0 37.7 41.3 17.6 (e)4.8 Pakistan2.7 7.8 7.3 8.9 6.7 4.4 7.9 19.5 10.8 16.1 (e)7.3 Sri Lanka
7.2 10.9 9.7 8.0 6.8 4.2 10.4 25.1 19.8 14.9 13.1 Asie du Sud-Est
3.8 6.9 4.6 1.6 -0.5 -5.0 5.7 7.2 4.9 18.0 .. Brunéi Darussalam*-3.1 14.8 16.0 25.2 20.5 14.5 15.3 22.5 20.1 20.9 (e)13.8 Cambodge2.6 6.9 6.6 3.6 4.6 3.8 11.9 27.8 37.3 9.1 22.9 Indonésie6.6 10.3 8.5 12.7 7.0 0.4 10.6 54.2 23.7 20.1 (e)-4.7 Rép. dém. populaire lao*7.7 12.9 11.2 9.5 7.3 3.7 8.2 28.5 8.7 14.6 12.0 Malaisie (7)
-4.7 12.9 11.8 22.6 12.5 3.4 -5.6 5.1 -12.3 9.4 (e)45.6 Myanmar
Pour les sources et les notes, se reporter à la fin du tableau.
Imports (c.i.f.) - Importations (c.a.f.)En pourcentage Régions,
pays ou territoires
1.2.1 Taux d'évolution annuels moyens des exportations et importationsdes pays et des régions géographiques 1
29
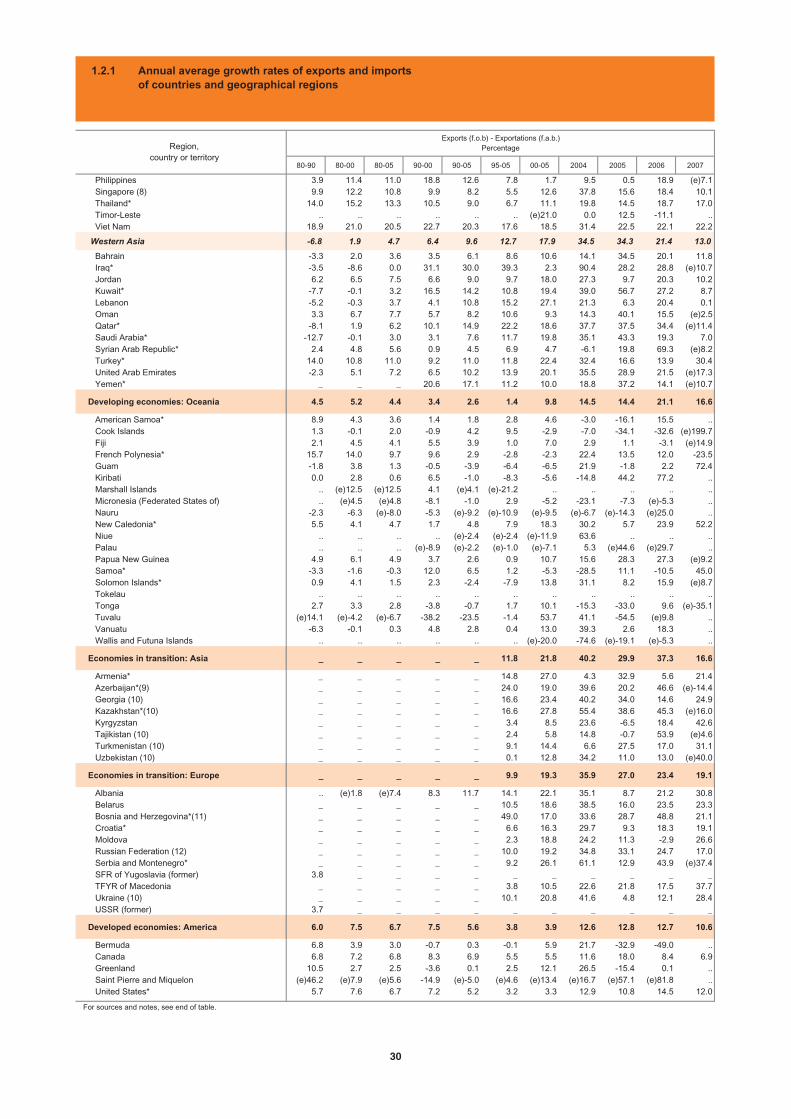
80-90 80-00 80-05 90-00 90-05 95-05 00-05 2004 2005 2006 2007
Philippines 3.9 11.4 11.0 18.8 12.6 7.8 1.7 9.5 0.5 18.9 (e)7.1 Singapore (8) 9.9 12.2 10.8 9.9 8.2 5.5 12.6 37.8 15.6 18.4 10.1 Thailand* 14.0 15.2 13.3 10.5 9.0 6.7 11.1 19.8 14.5 18.7 17.0 Timor-Leste .. .. .. .. .. .. (e)21.0 0.0 12.5 -11.1 .. Viet Nam 18.9 21.0 20.5 22.7 20.3 17.6 18.5 31.4 22.5 22.1 22.2
Western Asia -6.8 1.9 4.7 6.4 9.6 12.7 17.9 34.5 34.3 21.4 13.0
Bahrain -3.3 2.0 3.6 3.5 6.1 8.6 10.6 14.1 34.5 20.1 11.8 Iraq* -3.5 -8.6 0.0 31.1 30.0 39.3 2.3 90.4 28.2 28.8 (e)10.7 Jordan 6.2 6.5 7.5 6.6 9.0 9.7 18.0 27.3 9.7 20.3 10.2 Kuwait* -7.7 -0.1 3.2 16.5 14.2 10.8 19.4 39.0 56.7 27.2 8.7 Lebanon -5.2 -0.3 3.7 4.1 10.8 15.2 27.1 21.3 6.3 20.4 0.1 Oman 3.3 6.7 7.7 5.7 8.2 10.6 9.3 14.3 40.1 15.5 (e)2.5 Qatar* -8.1 1.9 6.2 10.1 14.9 22.2 18.6 37.7 37.5 34.4 (e)11.4 Saudi Arabia* -12.7 -0.1 3.0 3.1 7.6 11.7 19.8 35.1 43.3 19.3 7.0 Syrian Arab Republic* 2.4 4.8 5.6 0.9 4.5 6.9 4.7 -6.1 19.8 69.3 (e)8.2 Turkey* 14.0 10.8 11.0 9.2 11.0 11.8 22.4 32.4 16.6 13.9 30.4 United Arab Emirates -2.3 5.1 7.2 6.5 10.2 13.9 20.1 35.5 28.9 21.5 (e)17.3 Yemen* _ _ _ 20.6 17.1 11.2 10.0 18.8 37.2 14.1 (e)10.7
Developing economies: Oceania 4.5 5.2 4.4 3.4 2.6 1.4 9.8 14.5 14.4 21.1 16.6
American Samoa* 8.9 4.3 3.6 1.4 1.8 2.8 4.6 -3.0 -16.1 15.5 .. Cook Islands 1.3 -0.1 2.0 -0.9 4.2 9.5 -2.9 -7.0 -34.1 -32.6 (e)199.7 Fiji 2.1 4.5 4.1 5.5 3.9 1.0 7.0 2.9 1.1 -3.1 (e)14.9 French Polynesia* 15.7 14.0 9.7 9.6 2.9 -2.8 -2.3 22.4 13.5 12.0 -23.5 Guam -1.8 3.8 1.3 -0.5 -3.9 -6.4 -6.5 21.9 -1.8 2.2 72.4 Kiribati 0.0 2.8 0.6 6.5 -1.0 -8.3 -5.6 -14.8 44.2 77.2 .. Marshall Islands .. (e)12.5 (e)12.5 4.1 (e)4.1 (e)-21.2 .. .. .. .. .. Micronesia (Federated States of) .. (e)4.5 (e)4.8 -8.1 -1.0 2.9 -5.2 -23.1 -7.3 (e)-5.3 .. Nauru -2.3 -6.3 (e)-8.0 -5.3 (e)-9.2 (e)-10.9 (e)-9.5 (e)-6.7 (e)-14.3 (e)25.0 .. New Caledonia* 5.5 4.1 4.7 1.7 4.8 7.9 18.3 30.2 5.7 23.9 52.2 Niue .. .. .. .. (e)-2.4 (e)-2.4 (e)-11.9 63.6 .. .. .. Palau .. .. .. (e)-8.9 (e)-2.2 (e)-1.0 (e)-7.1 5.3 (e)44.6 (e)29.7 .. Papua New Guinea 4.9 6.1 4.9 3.7 2.6 0.9 10.7 15.6 28.3 27.3 (e)9.2 Samoa* -3.3 -1.6 -0.3 12.0 6.5 1.2 -5.3 -28.5 11.1 -10.5 45.0 Solomon Islands* 0.9 4.1 1.5 2.3 -2.4 -7.9 13.8 31.1 8.2 15.9 (e)8.7 Tokelau .. .. .. .. .. .. .. .. .. .. .. Tonga 2.7 3.3 2.8 -3.8 -0.7 1.7 10.1 -15.3 -33.0 9.6 (e)-35.1 Tuvalu (e)14.1 (e)-4.2 (e)-6.7 -38.2 -23.5 -1.4 53.7 41.1 -54.5 (e)9.8 .. Vanuatu -6.3 -0.1 0.3 4.8 2.8 0.4 13.0 39.3 2.6 18.3 .. Wallis and Futuna Islands .. .. .. .. .. .. (e)-20.0 -74.6 (e)-19.1 (e)-5.3 ..
Economies in transition: Asia _ _ _ _ _ 11.8 21.8 40.2 29.9 37.3 16.6
Armenia* _ _ _ _ _ 14.8 27.0 4.3 32.9 5.6 21.4 Azerbaijan*(9) _ _ _ _ _ 24.0 19.0 39.6 20.2 46.6 (e)-14.4 Georgia (10) _ _ _ _ _ 16.6 23.4 40.2 34.0 14.6 24.9 Kazakhstan*(10) _ _ _ _ _ 16.6 27.8 55.4 38.6 45.3 (e)16.0 Kyrgyzstan _ _ _ _ _ 3.4 8.5 23.6 -6.5 18.4 42.6 Tajikistan (10) _ _ _ _ _ 2.4 5.8 14.8 -0.7 53.9 (e)4.6 Turkmenistan (10) _ _ _ _ _ 9.1 14.4 6.6 27.5 17.0 31.1 Uzbekistan (10) _ _ _ _ _ 0.1 12.8 34.2 11.0 13.0 (e)40.0
Economies in transition: Europe _ _ _ _ _ 9.9 19.3 35.9 27.0 23.4 19.1
Albania .. (e)1.8 (e)7.4 8.3 11.7 14.1 22.1 35.1 8.7 21.2 30.8 Belarus _ _ _ _ _ 10.5 18.6 38.5 16.0 23.5 23.3 Bosnia and Herzegovina*(11) _ _ _ _ _ 49.0 17.0 33.6 28.7 48.8 21.1 Croatia* _ _ _ _ _ 6.6 16.3 29.7 9.3 18.3 19.1 Moldova _ _ _ _ _ 2.3 18.8 24.2 11.3 -2.9 26.6 Russian Federation (12) _ _ _ _ _ 10.0 19.2 34.8 33.1 24.7 17.0 Serbia and Montenegro* _ _ _ _ _ 9.2 26.1 61.1 12.9 43.9 (e)37.4 SFR of Yugoslavia (former) 3.8 _ _ _ _ _ _ _ _ _ _ TFYR of Macedonia _ _ _ _ _ 3.8 10.5 22.6 21.8 17.5 37.7 Ukraine (10) _ _ _ _ _ 10.1 20.8 41.6 4.8 12.1 28.4 USSR (former) 3.7 _ _ _ _ _ _ _ _ _ _
Developed economies: America 6.0 7.5 6.7 7.5 5.6 3.8 3.9 12.6 12.8 12.7 10.6
Bermuda 6.8 3.9 3.0 -0.7 0.3 -0.1 5.9 21.7 -32.9 -49.0 .. Canada 6.8 7.2 6.8 8.3 6.9 5.5 5.5 11.6 18.0 8.4 6.9 Greenland 10.5 2.7 2.5 -3.6 0.1 2.5 12.1 26.5 -15.4 0.1 .. Saint Pierre and Miquelon (e)46.2 (e)7.9 (e)5.6 -14.9 (e)-5.0 (e)4.6 (e)13.4 (e)16.7 (e)57.1 (e)81.8 .. United States* 5.7 7.6 6.7 7.2 5.2 3.2 3.3 12.9 10.8 14.5 12.0
For sources and notes, see end of table.
Region,country or territory
Exports (f.o.b) - Exportations (f.a.b.)Percentage
1.2.1 Annual average growth rates of exports and importsof countries and geographical regions
30
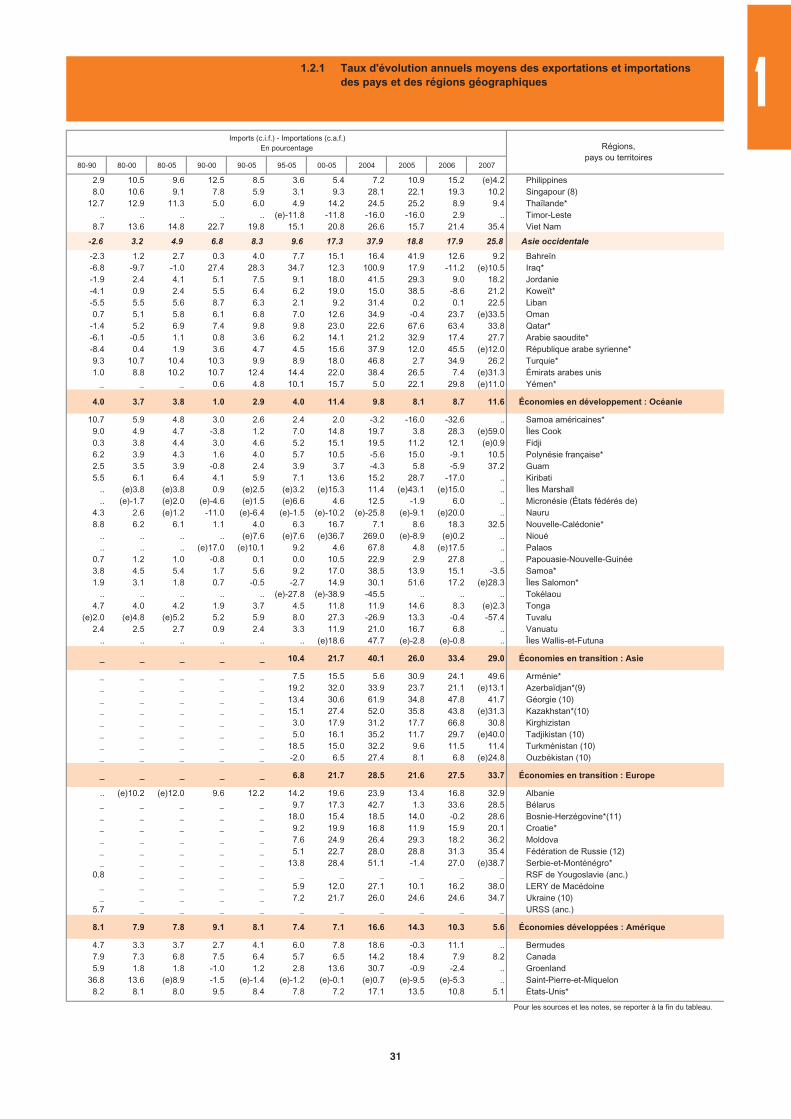
80-90 80-00 80-05 90-00 90-05 95-05 00-05 2004 2005 2006 2007
2.9 10.5 9.6 12.5 8.5 3.6 5.4 7.2 10.9 15.2 (e)4.2 Philippines8.0 10.6 9.1 7.8 5.9 3.1 9.3 28.1 22.1 19.3 10.2 Singapour (8)
12.7 12.9 11.3 5.0 6.0 4.9 14.2 24.5 25.2 8.9 9.4 Thaïlande*.. .. .. .. .. (e)-11.8 -11.8 -16.0 -16.0 2.9 .. Timor-Leste
8.7 13.6 14.8 22.7 19.8 15.1 20.8 26.6 15.7 21.4 35.4 Viet Nam
-2.6 3.2 4.9 6.8 8.3 9.6 17.3 37.9 18.8 17.9 25.8 Asie occidentale
-2.3 1.2 2.7 0.3 4.0 7.7 15.1 16.4 41.9 12.6 9.2 Bahreïn-6.8 -9.7 -1.0 27.4 28.3 34.7 12.3 100.9 17.9 -11.2 (e)10.5 Iraq*-1.9 2.4 4.1 5.1 7.5 9.1 18.0 41.5 29.3 9.0 18.2 Jordanie-4.1 0.9 2.4 5.5 6.4 6.2 19.0 15.0 38.5 -8.6 21.2 Koweït*-5.5 5.5 5.6 8.7 6.3 2.1 9.2 31.4 0.2 0.1 22.5 Liban0.7 5.1 5.8 6.1 6.8 7.0 12.6 34.9 -0.4 23.7 (e)33.5 Oman
-1.4 5.2 6.9 7.4 9.8 9.8 23.0 22.6 67.6 63.4 33.8 Qatar*-6.1 -0.5 1.1 0.8 3.6 6.2 14.1 21.2 32.9 17.4 27.7 Arabie saoudite*-8.4 0.4 1.9 3.6 4.7 4.5 15.6 37.9 12.0 45.5 (e)12.0 République arabe syrienne*9.3 10.7 10.4 10.3 9.9 8.9 18.0 46.8 2.7 34.9 26.2 Turquie*1.0 8.8 10.2 10.7 12.4 14.4 22.0 38.4 26.5 7.4 (e)31.3 Émirats arabes unis
_ _ _ 0.6 4.8 10.1 15.7 5.0 22.1 29.8 (e)11.0 Yémen*
4.0 3.7 3.8 1.0 2.9 4.0 11.4 9.8 8.1 8.7 11.6 Économies en développement : Océanie
10.7 5.9 4.8 3.0 2.6 2.4 2.0 -3.2 -16.0 -32.6 .. Samoa américaines*9.0 4.9 4.7 -3.8 1.2 7.0 14.8 19.7 3.8 28.3 (e)59.0 Îles Cook0.3 3.8 4.4 3.0 4.6 5.2 15.1 19.5 11.2 12.1 (e)0.9 Fidji6.2 3.9 4.3 1.6 4.0 5.7 10.5 -5.6 15.0 -9.1 10.5 Polynésie française*2.5 3.5 3.9 -0.8 2.4 3.9 3.7 -4.3 5.8 -5.9 37.2 Guam5.5 6.1 6.4 4.1 5.9 7.1 13.6 15.2 28.7 -17.0 .. Kiribati
.. (e)3.8 (e)3.8 0.9 (e)2.5 (e)3.2 (e)15.3 11.4 (e)43.1 (e)15.0 .. Îles Marshall
.. (e)-1.7 (e)2.0 (e)-4.6 (e)1.5 (e)6.6 4.6 12.5 -1.9 6.0 .. Micronésie (États fédérés de)4.3 2.6 (e)1.2 -11.0 (e)-6.4 (e)-1.5 (e)-10.2 (e)-25.8 (e)-9.1 (e)20.0 .. Nauru8.8 6.2 6.1 1.1 4.0 6.3 16.7 7.1 8.6 18.3 32.5 Nouvelle-Calédonie*
.. .. .. .. (e)7.6 (e)7.6 (e)36.7 269.0 (e)-8.9 (e)0.2 .. Nioué
.. .. .. (e)17.0 (e)10.1 9.2 4.6 67.8 4.8 (e)17.5 .. Palaos0.7 1.2 1.0 -0.8 0.1 0.0 10.5 22.9 2.9 27.8 .. Papouasie-Nouvelle-Guinée3.8 4.5 5.4 1.7 5.6 9.2 17.0 38.5 13.9 15.1 -3.5 Samoa*1.9 3.1 1.8 0.7 -0.5 -2.7 14.9 30.1 51.6 17.2 (e)28.3 Îles Salomon*
.. .. .. .. .. (e)-27.8 (e)-38.9 -45.5 .. .. .. Tokélaou4.7 4.0 4.2 1.9 3.7 4.5 11.8 11.9 14.6 8.3 (e)2.3 Tonga
(e)2.0 (e)4.8 (e)5.2 5.2 5.9 8.0 27.3 -26.9 13.3 -0.4 -57.4 Tuvalu2.4 2.5 2.7 0.9 2.4 3.3 11.9 21.0 16.7 6.8 .. Vanuatu
.. .. .. .. .. .. (e)18.6 47.7 (e)-2.8 (e)-0.8 .. Îles Wallis-et-Futuna
_ _ _ _ _ 10.4 21.7 40.1 26.0 33.4 29.0 Économies en transition : Asie
_ _ _ _ _ 7.5 15.5 5.6 30.9 24.1 49.6 Arménie*_ _ _ _ _ 19.2 32.0 33.9 23.7 21.1 (e)13.1 Azerbaïdjan*(9)_ _ _ _ _ 13.4 30.6 61.9 34.8 47.8 41.7 Géorgie (10)_ _ _ _ _ 15.1 27.4 52.0 35.8 43.8 (e)31.3 Kazakhstan*(10)_ _ _ _ _ 3.0 17.9 31.2 17.7 66.8 30.8 Kirghizistan_ _ _ _ _ 5.0 16.1 35.2 11.7 29.7 (e)40.0 Tadjikistan (10)_ _ _ _ _ 18.5 15.0 32.2 9.6 11.5 11.4 Turkménistan (10)_ _ _ _ _ -2.0 6.5 27.4 8.1 6.8 (e)24.8 Ouzbékistan (10)
_ _ _ _ _ 6.8 21.7 28.5 21.6 27.5 33.7 Économies en transition : Europe
.. (e)10.2 (e)12.0 9.6 12.2 14.2 19.6 23.9 13.4 16.8 32.9 Albanie_ _ _ _ _ 9.7 17.3 42.7 1.3 33.6 28.5 Bélarus_ _ _ _ _ 18.0 15.4 18.5 14.0 -0.2 28.6 Bosnie-Herzégovine*(11)_ _ _ _ _ 9.2 19.9 16.8 11.9 15.9 20.1 Croatie*_ _ _ _ _ 7.6 24.9 26.4 29.3 18.2 36.2 Moldova_ _ _ _ _ 5.1 22.7 28.0 28.8 31.3 35.4 Fédération de Russie (12)_ _ _ _ _ 13.8 28.4 51.1 -1.4 27.0 (e)38.7 Serbie-et-Monténégro*
0.8 _ _ _ _ _ _ _ _ _ _ RSF de Yougoslavie (anc.)_ _ _ _ _ 5.9 12.0 27.1 10.1 16.2 38.0 LERY de Macédoine_ _ _ _ _ 7.2 21.7 26.0 24.6 24.6 34.7 Ukraine (10)
5.7 _ _ _ _ _ _ _ _ _ _ URSS (anc.)
8.1 7.9 7.8 9.1 8.1 7.4 7.1 16.6 14.3 10.3 5.6 Économies développées : Amérique
4.7 3.3 3.7 2.7 4.1 6.0 7.8 18.6 -0.3 11.1 .. Bermudes7.9 7.3 6.8 7.5 6.4 5.7 6.5 14.2 18.4 7.9 8.2 Canada5.9 1.8 1.8 -1.0 1.2 2.8 13.6 30.7 -0.9 -2.4 .. Groenland
36.8 13.6 (e)8.9 -1.5 (e)-1.4 (e)-1.2 (e)-0.1 (e)0.7 (e)-9.5 (e)-5.3 .. Saint-Pierre-et-Miquelon8.2 8.1 8.0 9.5 8.4 7.8 7.2 17.1 13.5 10.8 5.1 États-Unis*
Pour les sources et les notes, se reporter à la fin du tableau.
Imports (c.i.f.) - Importations (c.a.f.)En pourcentage Régions,
pays ou territoires
1.2.1 Taux d'évolution annuels moyens des exportations et importationsdes pays et des régions géographiques 1
31
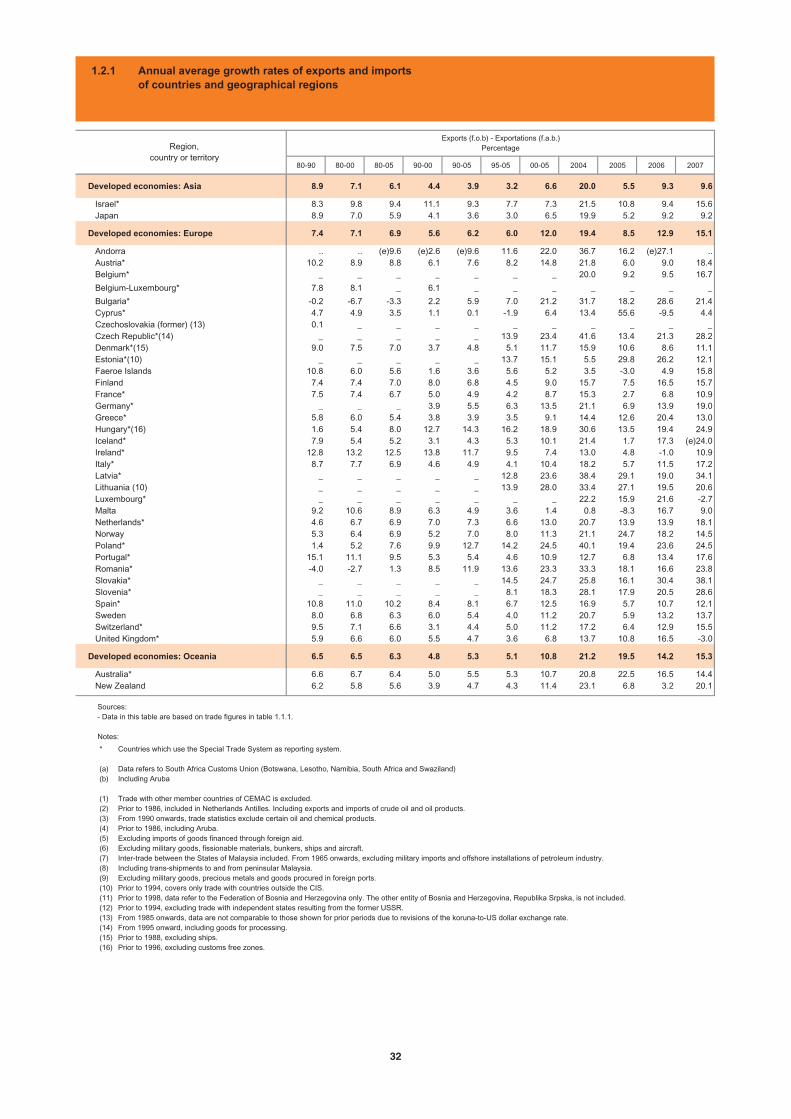
80-90 80-00 80-05 90-00 90-05 95-05 00-05 2004 2005 2006 2007
Developed economies: Asia 8.9 7.1 6.1 4.4 3.9 3.2 6.6 20.0 5.5 9.3 9.6
Israel* 8.3 9.8 9.4 11.1 9.3 7.7 7.3 21.5 10.8 9.4 15.6 Japan 8.9 7.0 5.9 4.1 3.6 3.0 6.5 19.9 5.2 9.2 9.2
Developed economies: Europe 7.4 7.1 6.9 5.6 6.2 6.0 12.0 19.4 8.5 12.9 15.1
Andorra .. .. (e)9.6 (e)2.6 (e)9.6 11.6 22.0 36.7 16.2 (e)27.1 .. Austria* 10.2 8.9 8.8 6.1 7.6 8.2 14.8 21.8 6.0 9.0 18.4 Belgium* _ _ _ _ _ _ _ 20.0 9.2 9.5 16.7
Belgium-Luxembourg* 7.8 8.1 _ 6.1 _ _ _ _ _ _ _
Bulgaria* -0.2 -6.7 -3.3 2.2 5.9 7.0 21.2 31.7 18.2 28.6 21.4 Cyprus* 4.7 4.9 3.5 1.1 0.1 -1.9 6.4 13.4 55.6 -9.5 4.4 Czechoslovakia (former) (13) 0.1 _ _ _ _ _ _ _ _ _ _ Czech Republic*(14) _ _ _ _ _ 13.9 23.4 41.6 13.4 21.3 28.2 Denmark*(15) 9.0 7.5 7.0 3.7 4.8 5.1 11.7 15.9 10.6 8.6 11.1 Estonia*(10) _ _ _ _ _ 13.7 15.1 5.5 29.8 26.2 12.1 Faeroe Islands 10.8 6.0 5.6 1.6 3.6 5.6 5.2 3.5 -3.0 4.9 15.8 Finland 7.4 7.4 7.0 8.0 6.8 4.5 9.0 15.7 7.5 16.5 15.7 France* 7.5 7.4 6.7 5.0 4.9 4.2 8.7 15.3 2.7 6.8 10.9 Germany* _ _ _ 3.9 5.5 6.3 13.5 21.1 6.9 13.9 19.0 Greece* 5.8 6.0 5.4 3.8 3.9 3.5 9.1 14.4 12.6 20.4 13.0 Hungary*(16) 1.6 5.4 8.0 12.7 14.3 16.2 18.9 30.6 13.5 19.4 24.9 Iceland* 7.9 5.4 5.2 3.1 4.3 5.3 10.1 21.4 1.7 17.3 (e)24.0 Ireland* 12.8 13.2 12.5 13.8 11.7 9.5 7.4 13.0 4.8 -1.0 10.9 Italy* 8.7 7.7 6.9 4.6 4.9 4.1 10.4 18.2 5.7 11.5 17.2 Latvia* _ _ _ _ _ 12.8 23.6 38.4 29.1 19.0 34.1 Lithuania (10) _ _ _ _ _ 13.9 28.0 33.4 27.1 19.5 20.6 Luxembourg* _ _ _ _ _ _ _ 22.2 15.9 21.6 -2.7 Malta 9.2 10.6 8.9 6.3 4.9 3.6 1.4 0.8 -8.3 16.7 9.0 Netherlands* 4.6 6.7 6.9 7.0 7.3 6.6 13.0 20.7 13.9 13.9 18.1 Norway 5.3 6.4 6.9 5.2 7.0 8.0 11.3 21.1 24.7 18.2 14.5 Poland* 1.4 5.2 7.6 9.9 12.7 14.2 24.5 40.1 19.4 23.6 24.5 Portugal* 15.1 11.1 9.5 5.3 5.4 4.6 10.9 12.7 6.8 13.4 17.6 Romania* -4.0 -2.7 1.3 8.5 11.9 13.6 23.3 33.3 18.1 16.6 23.8 Slovakia* _ _ _ _ _ 14.5 24.7 25.8 16.1 30.4 38.1 Slovenia* _ _ _ _ _ 8.1 18.3 28.1 17.9 20.5 28.6 Spain* 10.8 11.0 10.2 8.4 8.1 6.7 12.5 16.9 5.7 10.7 12.1 Sweden 8.0 6.8 6.3 6.0 5.4 4.0 11.2 20.7 5.9 13.2 13.7 Switzerland* 9.5 7.1 6.6 3.1 4.4 5.0 11.2 17.2 6.4 12.9 15.5 United Kingdom* 5.9 6.6 6.0 5.5 4.7 3.6 6.8 13.7 10.8 16.5 -3.0
Developed economies: Oceania 6.5 6.5 6.3 4.8 5.3 5.1 10.8 21.2 19.5 14.2 15.3
Australia* 6.6 6.7 6.4 5.0 5.5 5.3 10.7 20.8 22.5 16.5 14.4 New Zealand 6.2 5.8 5.6 3.9 4.7 4.3 11.4 23.1 6.8 3.2 20.1
Region,country or territory
Exports (f.o.b) - Exportations (f.a.b.)Percentage
1.2.1 Annual average growth rates of exports and importsof countries and geographical regions
Sources:- Data in this table are based on trade figures in table 1.1.1.
Notes:
*
(a)(b)
(1)(2)(3)(4)(5)(6)(7)(8)(9)(10)(11)(12)(13)(14)(15)(16)
Countries which use the Special Trade System as reporting system.
Data refers to South Africa Customs Union (Botswana, Lesotho, Namibia, South Africa and Swaziland)Including Aruba
Trade with other member countries of CEMAC is excluded.Prior to 1986, included in Netherlands Antilles. Including exports and imports of crude oil and oil products. From 1990 onwards, trade statistics exclude certain oil and chemical products.Prior to 1986, including Aruba.Excluding imports of goods financed through foreign aid. Excluding military goods, fissionable materials, bunkers, ships and aircraft.Inter-trade between the States of Malaysia included. From 1965 onwards, excluding military imports and offshore installations of petroleum industry. Including trans-shipments to and from peninsular Malaysia.Excluding military goods, precious metals and goods procured in foreign ports.Prior to 1994, covers only trade with countries outside the CIS. Prior to 1998, data refer to the Federation of Bosnia and Herzegovina only. The other entity of Bosnia and Herzegovina, Republika Srpska, is not included. Prior to 1994, excluding trade with independent states resulting from the former USSR.From 1985 onwards, data are not comparable to those shown for prior periods due to revisions of the koruna-to-US dollar exchange rate. From 1995 onward, including goods for processing.Prior to 1988, excluding ships.Prior to 1996, excluding customs free zones.
32
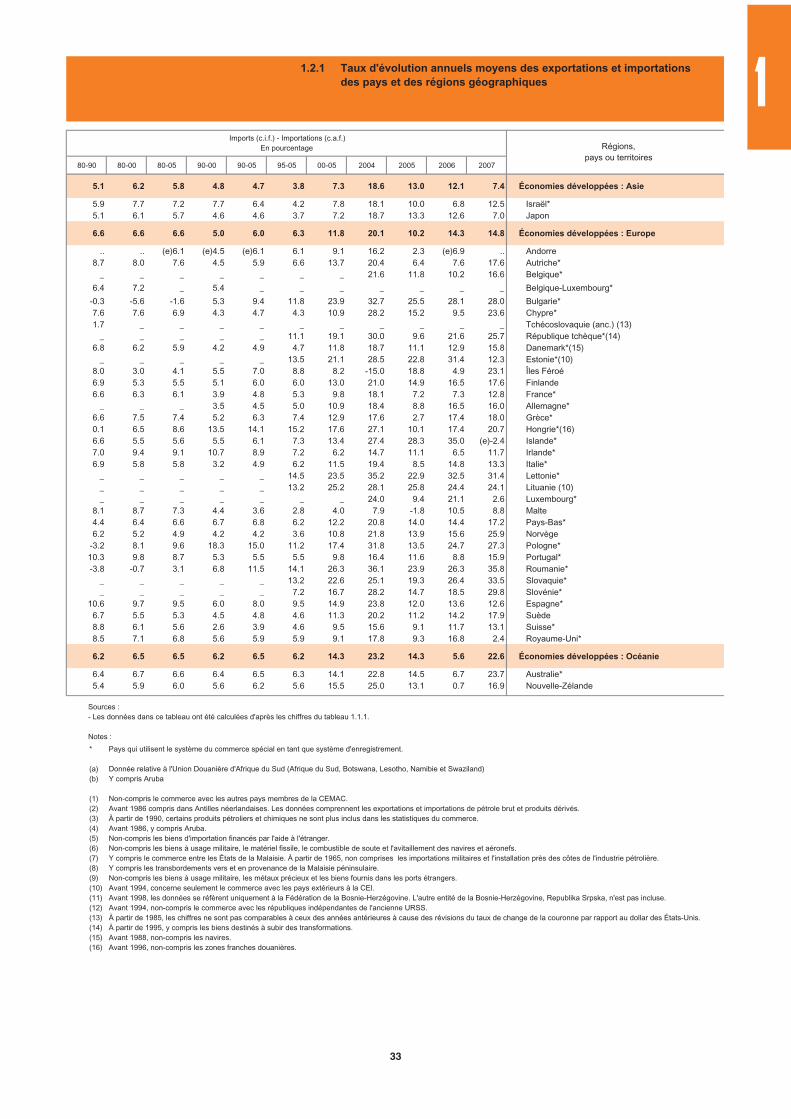
80-90 80-00 80-05 90-00 90-05 95-05 00-05 2004 2005 2006 2007
5.1 6.2 5.8 4.8 4.7 3.8 7.3 18.6 13.0 12.1 7.4 Économies développées : Asie
5.9 7.7 7.2 7.7 6.4 4.2 7.8 18.1 10.0 6.8 12.5 Israël*5.1 6.1 5.7 4.6 4.6 3.7 7.2 18.7 13.3 12.6 7.0 Japon
6.6 6.6 6.6 5.0 6.0 6.3 11.8 20.1 10.2 14.3 14.8 Économies développées : Europe
.. .. (e)6.1 (e)4.5 (e)6.1 6.1 9.1 16.2 2.3 (e)6.9 .. Andorre8.7 8.0 7.6 4.5 5.9 6.6 13.7 20.4 6.4 7.6 17.6 Autriche*
_ _ _ _ _ _ _ 21.6 11.8 10.2 16.6 Belgique*
6.4 7.2 _ 5.4 _ _ _ _ _ _ _ Belgique-Luxembourg*
-0.3 -5.6 -1.6 5.3 9.4 11.8 23.9 32.7 25.5 28.1 28.0 Bulgarie*7.6 7.6 6.9 4.3 4.7 4.3 10.9 28.2 15.2 9.5 23.6 Chypre*1.7 _ _ _ _ _ _ _ _ _ _ Tchécoslovaquie (anc.) (13)
_ _ _ _ _ 11.1 19.1 30.0 9.6 21.6 25.7 République tchèque*(14)6.8 6.2 5.9 4.2 4.9 4.7 11.8 18.7 11.1 12.9 15.8 Danemark*(15)
_ _ _ _ _ 13.5 21.1 28.5 22.8 31.4 12.3 Estonie*(10)8.0 3.0 4.1 5.5 7.0 8.8 8.2 -15.0 18.8 4.9 23.1 Îles Féroé6.9 5.3 5.5 5.1 6.0 6.0 13.0 21.0 14.9 16.5 17.6 Finlande6.6 6.3 6.1 3.9 4.8 5.3 9.8 18.1 7.2 7.3 12.8 France*
_ _ _ 3.5 4.5 5.0 10.9 18.4 8.8 16.5 16.0 Allemagne*6.6 7.5 7.4 5.2 6.3 7.4 12.9 17.6 2.7 17.4 18.0 Grèce*0.1 6.5 8.6 13.5 14.1 15.2 17.6 27.1 10.1 17.4 20.7 Hongrie*(16)6.6 5.5 5.6 5.5 6.1 7.3 13.4 27.4 28.3 35.0 (e)-2.4 Islande*7.0 9.4 9.1 10.7 8.9 7.2 6.2 14.7 11.1 6.5 11.7 Irlande*6.9 5.8 5.8 3.2 4.9 6.2 11.5 19.4 8.5 14.8 13.3 Italie*
_ _ _ _ _ 14.5 23.5 35.2 22.9 32.5 31.4 Lettonie*_ _ _ _ _ 13.2 25.2 28.1 25.8 24.4 24.1 Lituanie (10)_ _ _ _ _ _ _ 24.0 9.4 21.1 2.6 Luxembourg*
8.1 8.7 7.3 4.4 3.6 2.8 4.0 7.9 -1.8 10.5 8.8 Malte4.4 6.4 6.6 6.7 6.8 6.2 12.2 20.8 14.0 14.4 17.2 Pays-Bas*6.2 5.2 4.9 4.2 4.2 3.6 10.8 21.8 13.9 15.6 25.9 Norvège
-3.2 8.1 9.6 18.3 15.0 11.2 17.4 31.8 13.5 24.7 27.3 Pologne*10.3 9.8 8.7 5.3 5.5 5.5 9.8 16.4 11.6 8.8 15.9 Portugal*-3.8 -0.7 3.1 6.8 11.5 14.1 26.3 36.1 23.9 26.3 35.8 Roumanie*
_ _ _ _ _ 13.2 22.6 25.1 19.3 26.4 33.5 Slovaquie*_ _ _ _ _ 7.2 16.7 28.2 14.7 18.5 29.8 Slovénie*
10.6 9.7 9.5 6.0 8.0 9.5 14.9 23.8 12.0 13.6 12.6 Espagne*6.7 5.5 5.3 4.5 4.8 4.6 11.3 20.2 11.2 14.2 17.9 Suède8.8 6.1 5.6 2.6 3.9 4.6 9.5 15.6 9.1 11.7 13.1 Suisse*8.5 7.1 6.8 5.6 5.9 5.9 9.1 17.8 9.3 16.8 2.4 Royaume-Uni*
6.2 6.5 6.5 6.2 6.5 6.2 14.3 23.2 14.3 5.6 22.6 Économies développées : Océanie
6.4 6.7 6.6 6.4 6.5 6.3 14.1 22.8 14.5 6.7 23.7 Australie*5.4 5.9 6.0 5.6 6.2 5.6 15.5 25.0 13.1 0.7 16.9 Nouvelle-Zélande
Imports (c.i.f.) - Importations (c.a.f.)En pourcentage Régions,
pays ou territoires
1.2.1 Taux d'évolution annuels moyens des exportations et importationsdes pays et des régions géographiques
Sources : - Les données dans ce tableau ont été calculées d'après les chiffres du tableau 1.1.1.
Notes :
*
(a)(b)
(1)(2)(3)(4)(5)(6)(7)(8)(9)(10)(11)(12)(13)(14)(15)(16)
Pays qui utilisent le système du commerce spécial en tant que système d'enregistrement.
Donnée relative à l'Union Douanière d'Afrique du Sud (Afrique du Sud, Botswana, Lesotho, Namibie et Swaziland)Y compris Aruba
Non-compris le commerce avec les autres pays membres de la CEMAC.Avant 1986 compris dans Antilles néerlandaises. Les données comprennent les exportations et importations de pétrole brut et produits dérivés.À partir de 1990, certains produits pétroliers et chimiques ne sont plus inclus dans les statistiques du commerce. Avant 1986, y compris Aruba.Non-compris les biens d'importation financés par l'aide à l'étranger. Non-compris les biens à usage militaire, le matériel fissile, le combustible de soute et l'avitaillement des navires et aéronefs.Y compris le commerce entre les États de la Malaisie. À partir de 1965, non comprises les importations militaires et l'installation près des côtes de l'industrie pétrolière. Y compris les transbordements vers et en provenance de la Malaisie péninsulaire. Non-compris les biens à usage militaire, les métaux précieux et les biens fournis dans les ports étrangers.Avant 1994, concerne seulement le commerce avec les pays extérieurs à la CEI. Avant 1998, les données se réfèrent uniquement à la Fédération de la Bosnie-Herzégovine. L'autre entité de la Bosnie-Herzégovine, Republika Srpska, n'est pas incluse. Avant 1994, non-compris le commerce avec les républiques indépendantes de l'ancienne URSS.À partir de 1985, les chiffres ne sont pas comparables à ceux des années antérieures à cause des révisions du taux de change de la couronne par rapport au dollar des États-Unis. À partir de 1995, y compris les biens destinés à subir des transformations.Avant 1988, non-compris les navires.Avant 1996, non-compris les zones franches douanières.
1
33
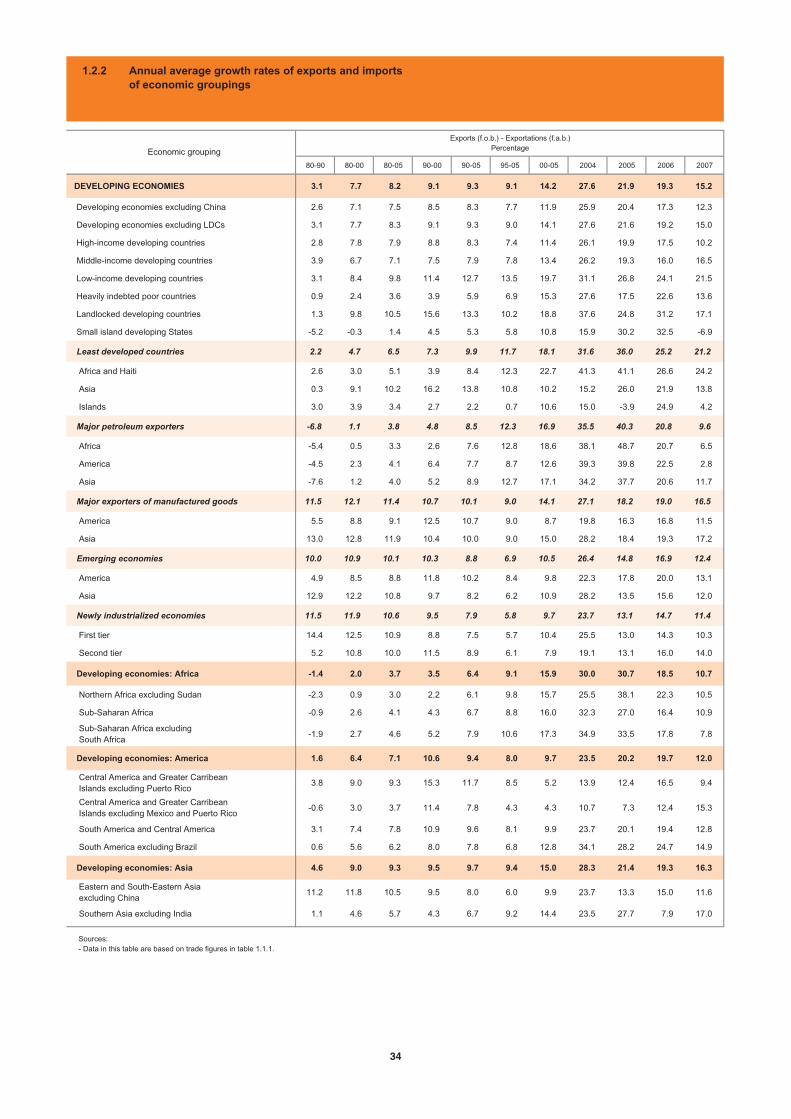
80-90 80-00 80-05 90-00 90-05 95-05 00-05 2004 2005 2006 2007
DEVELOPING ECONOMIES 3.1 7.7 8.2 9.1 9.3 9.1 14.2 27.6 21.9 19.3 15.2
Developing economies excluding China 2.6 7.1 7.5 8.5 8.3 7.7 11.9 25.9 20.4 17.3 12.3
Developing economies excluding LDCs 3.1 7.7 8.3 9.1 9.3 9.0 14.1 27.6 21.6 19.2 15.0
High-income developing countries 2.8 7.8 7.9 8.8 8.3 7.4 11.4 26.1 19.9 17.5 10.2
Middle-income developing countries 3.9 6.7 7.1 7.5 7.9 7.8 13.4 26.2 19.3 16.0 16.5
Low-income developing countries 3.1 8.4 9.8 11.4 12.7 13.5 19.7 31.1 26.8 24.1 21.5
Heavily indebted poor countries 0.9 2.4 3.6 3.9 5.9 6.9 15.3 27.6 17.5 22.6 13.6
Landlocked developing countries 1.3 9.8 10.5 15.6 13.3 10.2 18.8 37.6 24.8 31.2 17.1
Small island developing States -5.2 -0.3 1.4 4.5 5.3 5.8 10.8 15.9 30.2 32.5 -6.9
Least developed countries 2.2 4.7 6.5 7.3 9.9 11.7 18.1 31.6 36.0 25.2 21.2
Africa and Haiti 2.6 3.0 5.1 3.9 8.4 12.3 22.7 41.3 41.1 26.6 24.2
Asia 0.3 9.1 10.2 16.2 13.8 10.8 10.2 15.2 26.0 21.9 13.8
Islands 3.0 3.9 3.4 2.7 2.2 0.7 10.6 15.0 -3.9 24.9 4.2
Major petroleum exporters -6.8 1.1 3.8 4.8 8.5 12.3 16.9 35.5 40.3 20.8 9.6
Africa -5.4 0.5 3.3 2.6 7.6 12.8 18.6 38.1 48.7 20.7 6.5
America -4.5 2.3 4.1 6.4 7.7 8.7 12.6 39.3 39.8 22.5 2.8
Asia -7.6 1.2 4.0 5.2 8.9 12.7 17.1 34.2 37.7 20.6 11.7
Major exporters of manufactured goods 11.5 12.1 11.4 10.7 10.1 9.0 14.1 27.1 18.2 19.0 16.5
America 5.5 8.8 9.1 12.5 10.7 9.0 8.7 19.8 16.3 16.8 11.5
Asia 13.0 12.8 11.9 10.4 10.0 9.0 15.0 28.2 18.4 19.3 17.2
Emerging economies 10.0 10.9 10.1 10.3 8.8 6.9 10.5 26.4 14.8 16.9 12.4
America 4.9 8.5 8.8 11.8 10.2 8.4 9.8 22.3 17.8 20.0 13.1
Asia 12.9 12.2 10.8 9.7 8.2 6.2 10.9 28.2 13.5 15.6 12.0
Newly industrialized economies 11.5 11.9 10.6 9.5 7.9 5.8 9.7 23.7 13.1 14.7 11.4
First tier 14.4 12.5 10.9 8.8 7.5 5.7 10.4 25.5 13.0 14.3 10.3
Second tier 5.2 10.8 10.0 11.5 8.9 6.1 7.9 19.1 13.1 16.0 14.0
Developing economies: Africa -1.4 2.0 3.7 3.5 6.4 9.1 15.9 30.0 30.7 18.5 10.7
Northern Africa excluding Sudan -2.3 0.9 3.0 2.2 6.1 9.8 15.7 25.5 38.1 22.3 10.5
Sub-Saharan Africa -0.9 2.6 4.1 4.3 6.7 8.8 16.0 32.3 27.0 16.4 10.9
Sub-Saharan Africa excluding South Africa
-1.9 2.7 4.6 5.2 7.9 10.6 17.3 34.9 33.5 17.8 7.8
Developing economies: America 1.6 6.4 7.1 10.6 9.4 8.0 9.7 23.5 20.2 19.7 12.0
Central America and Greater Carribean Islands excluding Puerto Rico
3.8 9.0 9.3 15.3 11.7 8.5 5.2 13.9 12.4 16.5 9.4
Central America and Greater Carribean Islands excluding Mexico and Puerto Rico
-0.6 3.0 3.7 11.4 7.8 4.3 4.3 10.7 7.3 12.4 15.3
South America and Central America 3.1 7.4 7.8 10.9 9.6 8.1 9.9 23.7 20.1 19.4 12.8
South America excluding Brazil 0.6 5.6 6.2 8.0 7.8 6.8 12.8 34.1 28.2 24.7 14.9
Developing economies: Asia 4.6 9.0 9.3 9.5 9.7 9.4 15.0 28.3 21.4 19.3 16.3
Eastern and South-Eastern Asia excluding China
11.2 11.8 10.5 9.5 8.0 6.0 9.9 23.7 13.3 15.0 11.6
Southern Asia excluding India 1.1 4.6 5.7 4.3 6.7 9.2 14.4 23.5 27.7 7.9 17.0
Exports (f.o.b.) - Exportations (f.a.b.)PercentageEconomic grouping
1.2.2 Annual average growth rates of exports and importsof economic groupings
Sources:- Data in this table are based on trade figures in table 1.1.1.
34
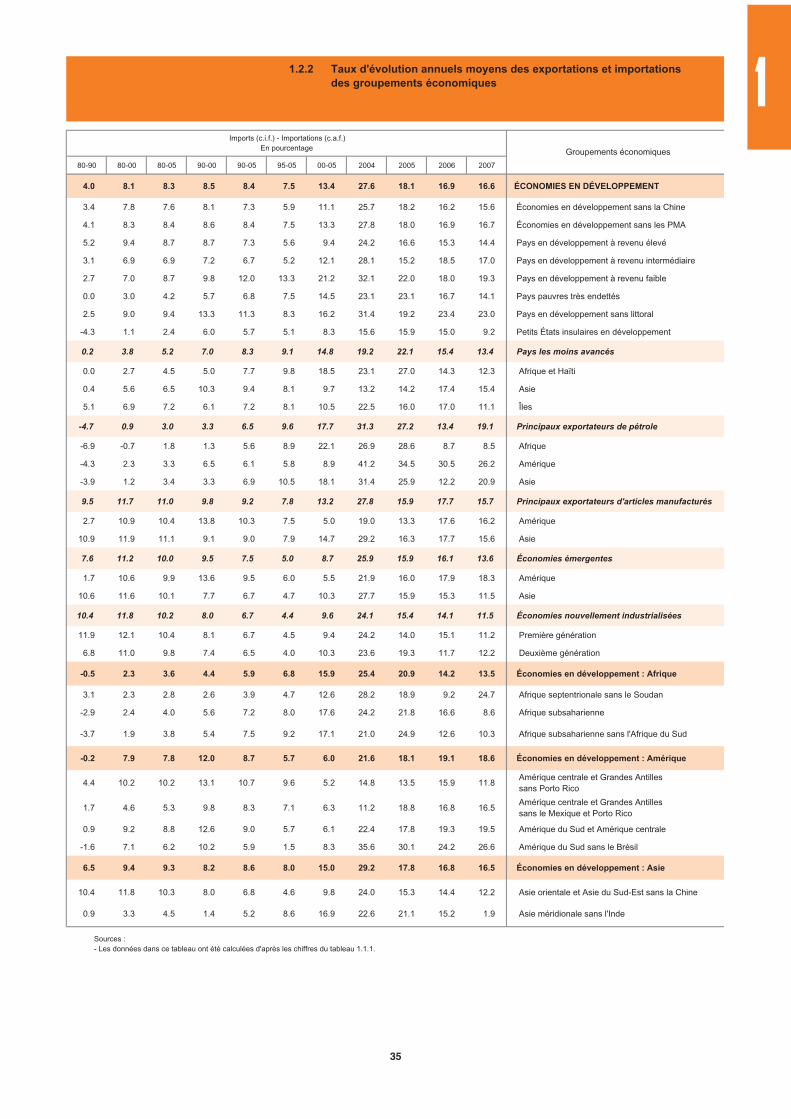
80-90 80-00 80-05 90-00 90-05 95-05 00-05 2004 2005 2006 2007
4.0 8.1 8.3 8.5 8.4 7.5 13.4 27.6 18.1 16.9 16.6 ÉCONOMIES EN DÉVELOPPEMENT
3.4 7.8 7.6 8.1 7.3 5.9 11.1 25.7 18.2 16.2 15.6 Économies en développement sans la Chine
4.1 8.3 8.4 8.6 8.4 7.5 13.3 27.8 18.0 16.9 16.7 Économies en développement sans les PMA
5.2 9.4 8.7 8.7 7.3 5.6 9.4 24.2 16.6 15.3 14.4 Pays en développement à revenu élevé
3.1 6.9 6.9 7.2 6.7 5.2 12.1 28.1 15.2 18.5 17.0 Pays en développement à revenu intermédiaire
2.7 7.0 8.7 9.8 12.0 13.3 21.2 32.1 22.0 18.0 19.3 Pays en développement à revenu faible
0.0 3.0 4.2 5.7 6.8 7.5 14.5 23.1 23.1 16.7 14.1 Pays pauvres très endettés
2.5 9.0 9.4 13.3 11.3 8.3 16.2 31.4 19.2 23.4 23.0 Pays en développement sans littoral
-4.3 1.1 2.4 6.0 5.7 5.1 8.3 15.6 15.9 15.0 9.2 Petits États insulaires en développement
0.2 3.8 5.2 7.0 8.3 9.1 14.8 19.2 22.1 15.4 13.4 Pays les moins avancés
0.0 2.7 4.5 5.0 7.7 9.8 18.5 23.1 27.0 14.3 12.3 Afrique et Haïti
0.4 5.6 6.5 10.3 9.4 8.1 9.7 13.2 14.2 17.4 15.4 Asie
5.1 6.9 7.2 6.1 7.2 8.1 10.5 22.5 16.0 17.0 11.1 Îles
-4.7 0.9 3.0 3.3 6.5 9.6 17.7 31.3 27.2 13.4 19.1 Principaux exportateurs de pétrole
-6.9 -0.7 1.8 1.3 5.6 8.9 22.1 26.9 28.6 8.7 8.5 Afrique
-4.3 2.3 3.3 6.5 6.1 5.8 8.9 41.2 34.5 30.5 26.2 Amérique
-3.9 1.2 3.4 3.3 6.9 10.5 18.1 31.4 25.9 12.2 20.9 Asie
9.5 11.7 11.0 9.8 9.2 7.8 13.2 27.8 15.9 17.7 15.7 Principaux exportateurs d'articles manufacturés
2.7 10.9 10.4 13.8 10.3 7.5 5.0 19.0 13.3 17.6 16.2 Amérique
10.9 11.9 11.1 9.1 9.0 7.9 14.7 29.2 16.3 17.7 15.6 Asie
7.6 11.2 10.0 9.5 7.5 5.0 8.7 25.9 15.9 16.1 13.6 Économies émergentes
1.7 10.6 9.9 13.6 9.5 6.0 5.5 21.9 16.0 17.9 18.3 Amérique
10.6 11.6 10.1 7.7 6.7 4.7 10.3 27.7 15.9 15.3 11.5 Asie
10.4 11.8 10.2 8.0 6.7 4.4 9.6 24.1 15.4 14.1 11.5 Économies nouvellement industrialisées
11.9 12.1 10.4 8.1 6.7 4.5 9.4 24.2 14.0 15.1 11.2 Première génération
6.8 11.0 9.8 7.4 6.5 4.0 10.3 23.6 19.3 11.7 12.2 Deuxième génération
-0.5 2.3 3.6 4.4 5.9 6.8 15.9 25.4 20.9 14.2 13.5 Économies en développement : Afrique
3.1 2.3 2.8 2.6 3.9 4.7 12.6 28.2 18.9 9.2 24.7 Afrique septentrionale sans le Soudan
-2.9 2.4 4.0 5.6 7.2 8.0 17.6 24.2 21.8 16.6 8.6 Afrique subsaharienne
-3.7 1.9 3.8 5.4 7.5 9.2 17.1 21.0 24.9 12.6 10.3 Afrique subsaharienne sans l'Afrique du Sud
-0.2 7.9 7.8 12.0 8.7 5.7 6.0 21.6 18.1 19.1 18.6 Économies en développement : Amérique
4.4 10.2 10.2 13.1 10.7 9.6 5.2 14.8 13.5 15.9 11.8 Amérique centrale et Grandes Antilles sans Porto Rico
1.7 4.6 5.3 9.8 8.3 7.1 6.3 11.2 18.8 16.8 16.5 Amérique centrale et Grandes Antilles sans le Mexique et Porto Rico
0.9 9.2 8.8 12.6 9.0 5.7 6.1 22.4 17.8 19.3 19.5 Amérique du Sud et Amérique centrale
-1.6 7.1 6.2 10.2 5.9 1.5 8.3 35.6 30.1 24.2 26.6 Amérique du Sud sans le Brésil
6.5 9.4 9.3 8.2 8.6 8.0 15.0 29.2 17.8 16.8 16.5 Économies en développement : Asie
10.4 11.8 10.3 8.0 6.8 4.6 9.8 24.0 15.3 14.4 12.2 Asie orientale et Asie du Sud-Est sans la Chine
0.9 3.3 4.5 1.4 5.2 8.6 16.9 22.6 21.1 15.2 1.9 Asie méridionale sans l'Inde
Groupements économiques
Imports (c.i.f.) - Importations (c.a.f.)En pourcentage
1.2.2 Taux d'évolution annuels moyens des exportations et importations des groupements économiques
Sources : - Les données dans ce tableau ont été calculées d'après les chiffres du tableau 1.1.1.
1
35
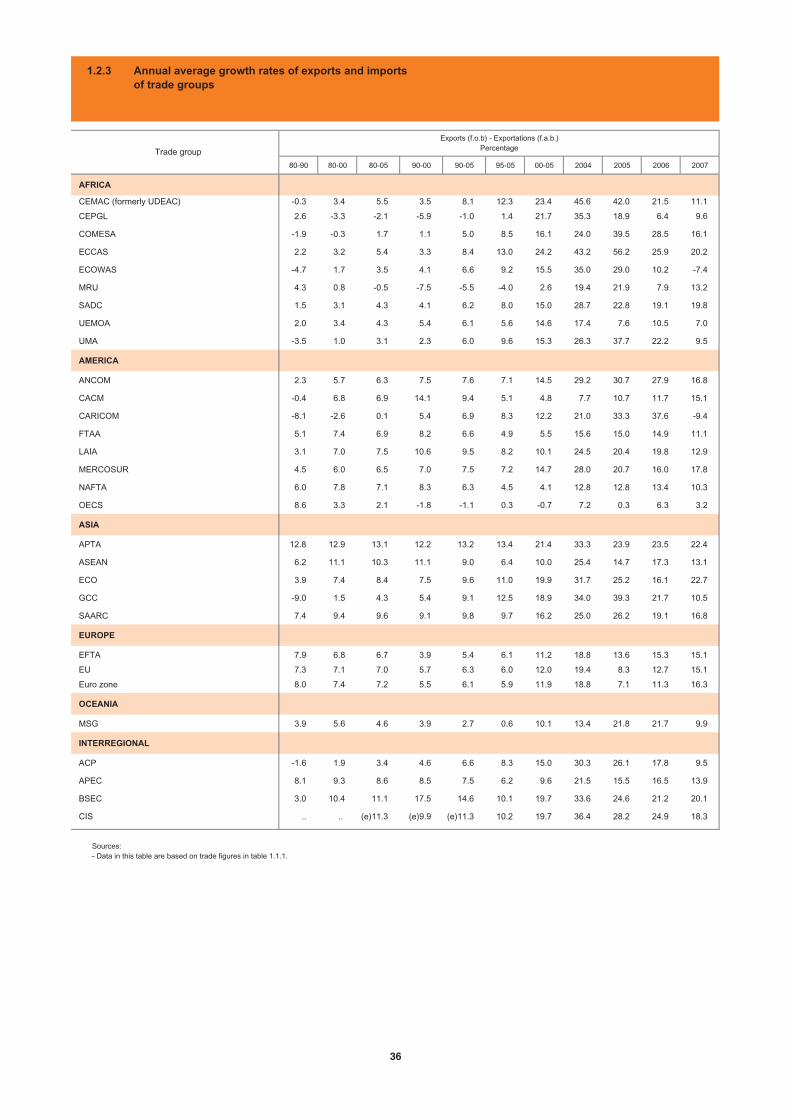
80-90 80-00 80-05 90-00 90-05 95-05 00-05 2004 2005 2006 2007
AFRICA
CEMAC (formerly UDEAC) -0.3 3.4 5.5 3.5 8.1 12.3 23.4 45.6 42.0 21.5 11.1
CEPGL 2.6 -3.3 -2.1 -5.9 -1.0 1.4 21.7 35.3 18.9 6.4 9.6
COMESA -1.9 -0.3 1.7 1.1 5.0 8.5 16.1 24.0 39.5 28.5 16.1
ECCAS 2.2 3.2 5.4 3.3 8.4 13.0 24.2 43.2 56.2 25.9 20.2
ECOWAS -4.7 1.7 3.5 4.1 6.6 9.2 15.5 35.0 29.0 10.2 -7.4
MRU 4.3 0.8 -0.5 -7.5 -5.5 -4.0 2.6 19.4 21.9 7.9 13.2
SADC 1.5 3.1 4.3 4.1 6.2 8.0 15.0 28.7 22.8 19.1 19.8
UEMOA 2.0 3.4 4.3 5.4 6.1 5.6 14.6 17.4 7.6 10.5 7.0
UMA -3.5 1.0 3.1 2.3 6.0 9.6 15.3 26.3 37.7 22.2 9.5
AMERICA
ANCOM 2.3 5.7 6.3 7.5 7.6 7.1 14.5 29.2 30.7 27.9 16.8
CACM -0.4 6.8 6.9 14.1 9.4 5.1 4.8 7.7 10.7 11.7 15.1
CARICOM -8.1 -2.6 0.1 5.4 6.9 8.3 12.2 21.0 33.3 37.6 -9.4
FTAA 5.1 7.4 6.9 8.2 6.6 4.9 5.5 15.6 15.0 14.9 11.1
LAIA 3.1 7.0 7.5 10.6 9.5 8.2 10.1 24.5 20.4 19.8 12.9
MERCOSUR 4.5 6.0 6.5 7.0 7.5 7.2 14.7 28.0 20.7 16.0 17.8
NAFTA 6.0 7.8 7.1 8.3 6.3 4.5 4.1 12.8 12.8 13.4 10.3
OECS 8.6 3.3 2.1 -1.8 -1.1 0.3 -0.7 7.2 0.3 6.3 3.2
ASIA
APTA 12.8 12.9 13.1 12.2 13.2 13.4 21.4 33.3 23.9 23.5 22.4
ASEAN 6.2 11.1 10.3 11.1 9.0 6.4 10.0 25.4 14.7 17.3 13.1
ECO 3.9 7.4 8.4 7.5 9.6 11.0 19.9 31.7 25.2 16.1 22.7
GCC -9.0 1.5 4.3 5.4 9.1 12.5 18.9 34.0 39.3 21.7 10.5
SAARC 7.4 9.4 9.6 9.1 9.8 9.7 16.2 25.0 26.2 19.1 16.8
EUROPE
EFTA 7.9 6.8 6.7 3.9 5.4 6.1 11.2 18.8 13.6 15.3 15.1
EU 7.3 7.1 7.0 5.7 6.3 6.0 12.0 19.4 8.3 12.7 15.1
Euro zone 8.0 7.4 7.2 5.5 6.1 5.9 11.9 18.8 7.1 11.3 16.3
OCEANIA
MSG 3.9 5.6 4.6 3.9 2.7 0.6 10.1 13.4 21.8 21.7 9.9
INTERREGIONAL
ACP -1.6 1.9 3.4 4.6 6.6 8.3 15.0 30.3 26.1 17.8 9.5
APEC 8.1 9.3 8.6 8.5 7.5 6.2 9.6 21.5 15.5 16.5 13.9
BSEC 3.0 10.4 11.1 17.5 14.6 10.1 19.7 33.6 24.6 21.2 20.1
CIS .. .. (e)11.3 (e)9.9 (e)11.3 10.2 19.7 36.4 28.2 24.9 18.3
Exports (f.o.b) - Exportations (f.a.b.)PercentageTrade group
1.2.3 Annual average growth rates of exports and importsof trade groups
Sources:- Data in this table are based on trade figures in table 1.1.1.
36
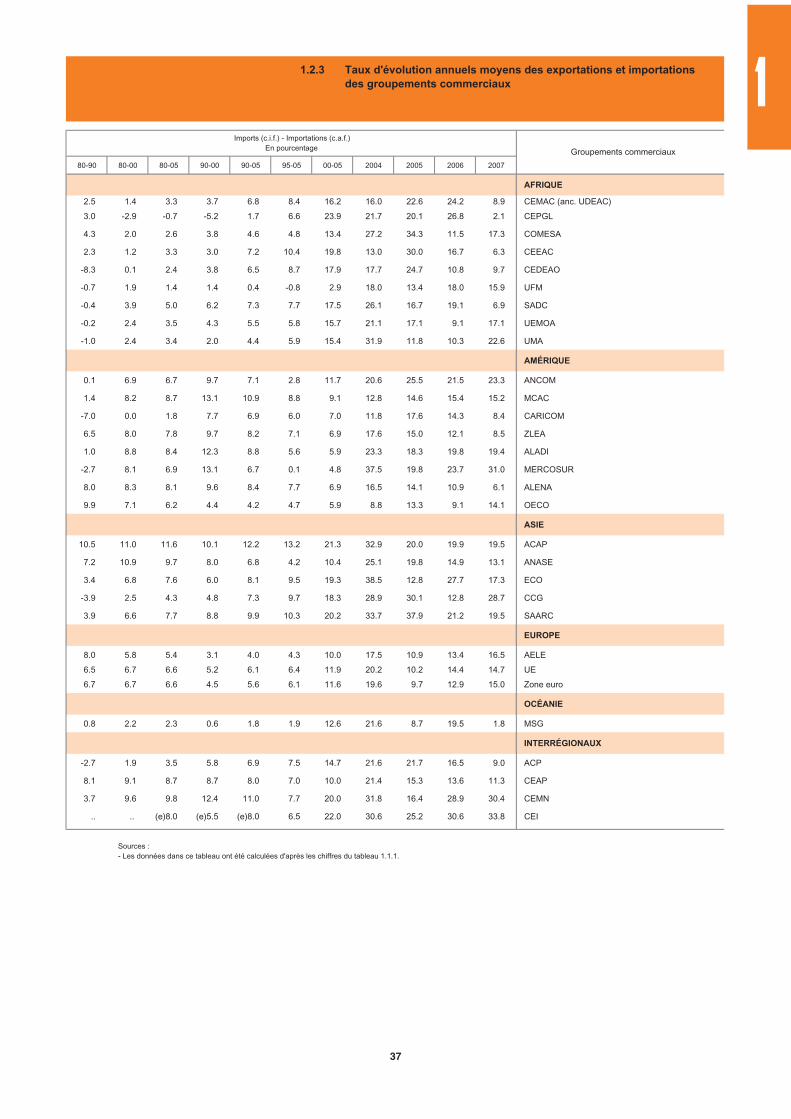
80-90 80-00 80-05 90-00 90-05 95-05 00-05 2004 2005 2006 2007
AFRIQUE
2.5 1.4 3.3 3.7 6.8 8.4 16.2 16.0 22.6 24.2 8.9 CEMAC (anc. UDEAC)
3.0 -2.9 -0.7 -5.2 1.7 6.6 23.9 21.7 20.1 26.8 2.1 CEPGL
4.3 2.0 2.6 3.8 4.6 4.8 13.4 27.2 34.3 11.5 17.3 COMESA
2.3 1.2 3.3 3.0 7.2 10.4 19.8 13.0 30.0 16.7 6.3 CEEAC
-8.3 0.1 2.4 3.8 6.5 8.7 17.9 17.7 24.7 10.8 9.7 CEDEAO
-0.7 1.9 1.4 1.4 0.4 -0.8 2.9 18.0 13.4 18.0 15.9 UFM
-0.4 3.9 5.0 6.2 7.3 7.7 17.5 26.1 16.7 19.1 6.9 SADC
-0.2 2.4 3.5 4.3 5.5 5.8 15.7 21.1 17.1 9.1 17.1 UEMOA
-1.0 2.4 3.4 2.0 4.4 5.9 15.4 31.9 11.8 10.3 22.6 UMA
AMÉRIQUE
0.1 6.9 6.7 9.7 7.1 2.8 11.7 20.6 25.5 21.5 23.3 ANCOM
1.4 8.2 8.7 13.1 10.9 8.8 9.1 12.8 14.6 15.4 15.2 MCAC
-7.0 0.0 1.8 7.7 6.9 6.0 7.0 11.8 17.6 14.3 8.4 CARICOM
6.5 8.0 7.8 9.7 8.2 7.1 6.9 17.6 15.0 12.1 8.5 ZLEA
1.0 8.8 8.4 12.3 8.8 5.6 5.9 23.3 18.3 19.8 19.4 ALADI
-2.7 8.1 6.9 13.1 6.7 0.1 4.8 37.5 19.8 23.7 31.0 MERCOSUR
8.0 8.3 8.1 9.6 8.4 7.7 6.9 16.5 14.1 10.9 6.1 ALENA
9.9 7.1 6.2 4.4 4.2 4.7 5.9 8.8 13.3 9.1 14.1 OECO
ASIE
10.5 11.0 11.6 10.1 12.2 13.2 21.3 32.9 20.0 19.9 19.5 ACAP
7.2 10.9 9.7 8.0 6.8 4.2 10.4 25.1 19.8 14.9 13.1 ANASE
3.4 6.8 7.6 6.0 8.1 9.5 19.3 38.5 12.8 27.7 17.3 ECO
-3.9 2.5 4.3 4.8 7.3 9.7 18.3 28.9 30.1 12.8 28.7 CCG
3.9 6.6 7.7 8.8 9.9 10.3 20.2 33.7 37.9 21.2 19.5 SAARC
EUROPE
8.0 5.8 5.4 3.1 4.0 4.3 10.0 17.5 10.9 13.4 16.5 AELE
6.5 6.7 6.6 5.2 6.1 6.4 11.9 20.2 10.2 14.4 14.7 UE
6.7 6.7 6.6 4.5 5.6 6.1 11.6 19.6 9.7 12.9 15.0 Zone euro
OCÉANIE
0.8 2.2 2.3 0.6 1.8 1.9 12.6 21.6 8.7 19.5 1.8 MSG
INTERRÉGIONAUX
-2.7 1.9 3.5 5.8 6.9 7.5 14.7 21.6 21.7 16.5 9.0 ACP
8.1 9.1 8.7 8.7 8.0 7.0 10.0 21.4 15.3 13.6 11.3 CEAP
3.7 9.6 9.8 12.4 11.0 7.7 20.0 31.8 16.4 28.9 30.4 CEMN
.. .. (e)8.0 (e)5.5 (e)8.0 6.5 22.0 30.6 25.2 30.6 33.8 CEI
Groupements commerciaux
Imports (c.i.f.) - Importations (c.a.f.)En pourcentage
1.2.3 Taux d'évolution annuels moyens des exportations et importationsdes groupements commerciaux
Sources : - Les données dans ce tableau ont été calculées d'après les chiffres du tableau 1.1.1.
1
37
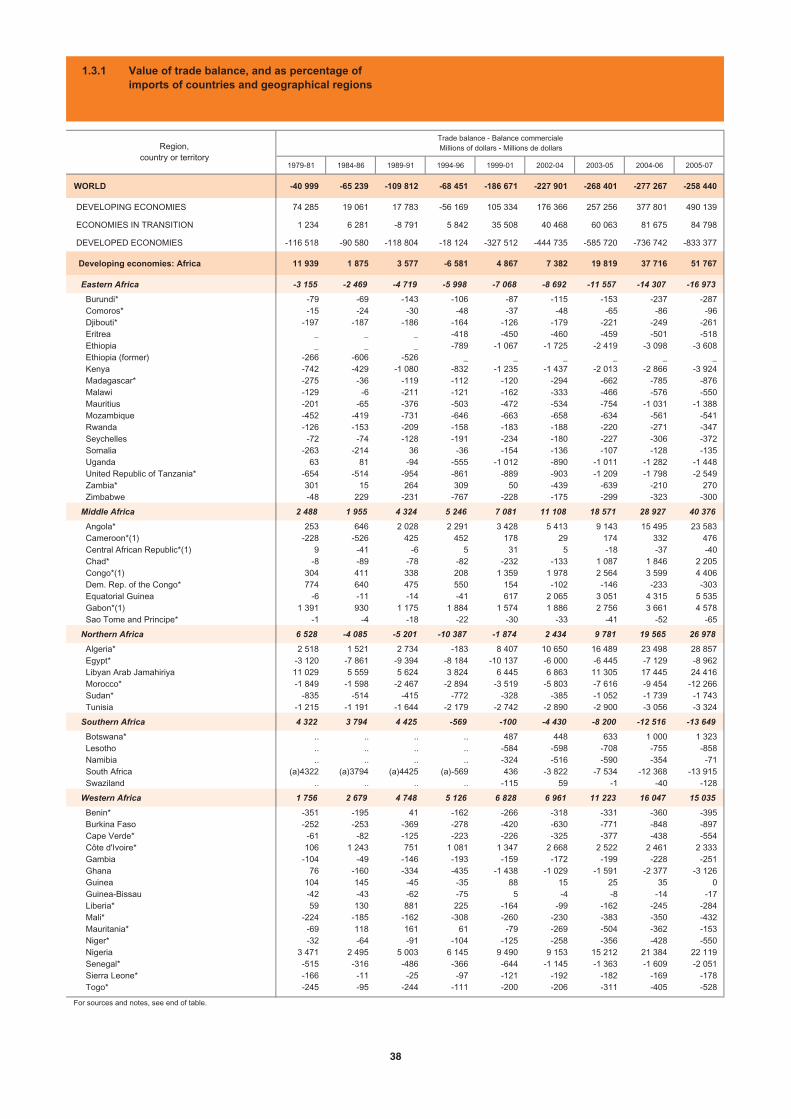
1979-81 1984-86 1989-91 1994-96 1999-01 2002-04 2003-05 2004-06 2005-07
WORLD -40 999 -65 239 -109 812 -68 451 -186 671 -227 901 -268 401 -277 267 -258 440
DEVELOPING ECONOMIES 74 285 19 061 17 783 -56 169 105 334 176 366 257 256 377 801 490 139
ECONOMIES IN TRANSITION 1 234 6 281 -8 791 5 842 35 508 40 468 60 063 81 675 84 798
DEVELOPED ECONOMIES -116 518 -90 580 -118 804 -18 124 -327 512 -444 735 -585 720 -736 742 -833 377
Developing economies: Africa 11 939 1 875 3 577 -6 581 4 867 7 382 19 819 37 716 51 767
Eastern Africa -3 155 -2 469 -4 719 -5 998 -7 068 -8 692 -11 557 -14 307 -16 973
Burundi* -79 -69 -143 -106 -87 -115 -153 -237 -287 Comoros* -15 -24 -30 -48 -37 -48 -65 -86 -96 Djibouti* -197 -187 -186 -164 -126 -179 -221 -249 -261 Eritrea _ _ _ -418 -450 -460 -459 -501 -518 Ethiopia _ _ _ -789 -1 067 -1 725 -2 419 -3 098 -3 608 Ethiopia (former) -266 -606 -526 _ _ _ _ _ _ Kenya -742 -429 -1 080 -832 -1 235 -1 437 -2 013 -2 866 -3 924 Madagascar* -275 -36 -119 -112 -120 -294 -662 -785 -876 Malawi -129 -6 -211 -121 -162 -333 -466 -576 -550 Mauritius -201 -65 -376 -503 -472 -534 -754 -1 031 -1 388 Mozambique -452 -419 -731 -646 -663 -658 -634 -561 -541 Rwanda -126 -153 -209 -158 -183 -188 -220 -271 -347 Seychelles -72 -74 -128 -191 -234 -180 -227 -306 -372 Somalia -263 -214 36 -36 -154 -136 -107 -128 -135 Uganda 63 81 -94 -555 -1 012 -890 -1 011 -1 282 -1 448 United Republic of Tanzania* -654 -514 -954 -861 -889 -903 -1 209 -1 798 -2 549 Zambia* 301 15 264 309 50 -439 -639 -210 270 Zimbabwe -48 229 -231 -767 -228 -175 -299 -323 -300
Middle Africa 2 488 1 955 4 324 5 246 7 081 11 108 18 571 28 927 40 376
Angola* 253 646 2 028 2 291 3 428 5 413 9 143 15 495 23 583 Cameroon*(1) -228 -526 425 452 178 29 174 332 476 Central African Republic*(1) 9 -41 -6 5 31 5 -18 -37 -40 Chad* -8 -89 -78 -82 -232 -133 1 087 1 846 2 205 Congo*(1) 304 411 338 208 1 359 1 978 2 564 3 599 4 406 Dem. Rep. of the Congo* 774 640 475 550 154 -102 -146 -233 -303 Equatorial Guinea -6 -11 -14 -41 617 2 065 3 051 4 315 5 535 Gabon*(1) 1 391 930 1 175 1 884 1 574 1 886 2 756 3 661 4 578 Sao Tome and Principe* -1 -4 -18 -22 -30 -33 -41 -52 -65
Northern Africa 6 528 -4 085 -5 201 -10 387 -1 874 2 434 9 781 19 565 26 978
Algeria* 2 518 1 521 2 734 -183 8 407 10 650 16 489 23 498 28 857 Egypt* -3 120 -7 861 -9 394 -8 184 -10 137 -6 000 -6 445 -7 129 -8 962 Libyan Arab Jamahiriya 11 029 5 559 5 624 3 824 6 445 6 863 11 305 17 445 24 416 Morocco* -1 849 -1 598 -2 467 -2 894 -3 519 -5 803 -7 616 -9 454 -12 266 Sudan* -835 -514 -415 -772 -328 -385 -1 052 -1 739 -1 743 Tunisia -1 215 -1 191 -1 644 -2 179 -2 742 -2 890 -2 900 -3 056 -3 324
Southern Africa 4 322 3 794 4 425 -569 -100 -4 430 -8 200 -12 516 -13 649
Botswana* .. .. .. .. 487 448 633 1 000 1 323 Lesotho .. .. .. .. -584 -598 -708 -755 -858 Namibia .. .. .. .. -324 -516 -590 -354 -71 South Africa (a)4322 (a)3794 (a)4425 (a)-569 436 -3 822 -7 534 -12 368 -13 915 Swaziland .. .. .. .. -115 59 -1 -40 -128
Western Africa 1 756 2 679 4 748 5 126 6 828 6 961 11 223 16 047 15 035
Benin* -351 -195 41 -162 -266 -318 -331 -360 -395 Burkina Faso -252 -253 -369 -278 -420 -630 -771 -848 -897 Cape Verde* -61 -82 -125 -223 -226 -325 -377 -438 -554 Côte d'Ivoire* 106 1 243 751 1 081 1 347 2 668 2 522 2 461 2 333 Gambia -104 -49 -146 -193 -159 -172 -199 -228 -251 Ghana 76 -160 -334 -435 -1 438 -1 029 -1 591 -2 377 -3 126 Guinea 104 145 -45 -35 88 15 25 35 0 Guinea-Bissau -42 -43 -62 -75 5 -4 -8 -14 -17 Liberia* 59 130 881 225 -164 -99 -162 -245 -284 Mali* -224 -185 -162 -308 -260 -230 -383 -350 -432 Mauritania* -69 118 161 61 -79 -269 -504 -362 -153 Niger* -32 -64 -91 -104 -125 -258 -356 -428 -550 Nigeria 3 471 2 495 5 003 6 145 9 490 9 153 15 212 21 384 22 119 Senegal* -515 -316 -486 -366 -644 -1 145 -1 363 -1 609 -2 051 Sierra Leone* -166 -11 -25 -97 -121 -192 -182 -169 -178 Togo* -245 -95 -244 -111 -200 -206 -311 -405 -528
For sources and notes, see end of table.
Trade balance - Balance commercialeMillions of dollars - Millions de dollarsRegion,
country or territory
1.3.1 Value of trade balance, and as percentage ofimports of countries and geographical regions
38
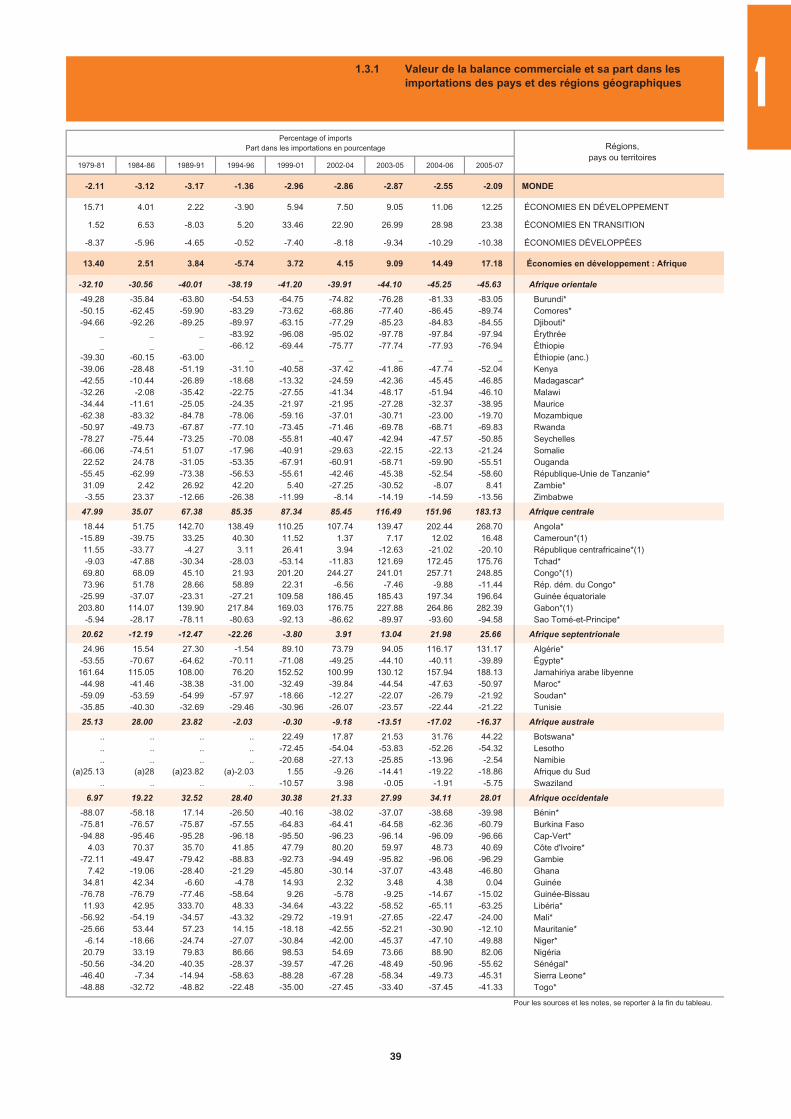
1979-81 1984-86 1989-91 1994-96 1999-01 2002-04 2003-05 2004-06 2005-07
-2.11 -3.12 -3.17 -1.36 -2.96 -2.86 -2.87 -2.55 -2.09 MONDE
15.71 4.01 2.22 -3.90 5.94 7.50 9.05 11.06 12.25 ÉCONOMIES EN DÉVELOPPEMENT
1.52 6.53 -8.03 5.20 33.46 22.90 26.99 28.98 23.38 ÉCONOMIES EN TRANSITION
-8.37 -5.96 -4.65 -0.52 -7.40 -8.18 -9.34 -10.29 -10.38 ÉCONOMIES DÉVELOPPÉES
13.40 2.51 3.84 -5.74 3.72 4.15 9.09 14.49 17.18 Économies en développement : Afrique
-32.10 -30.56 -40.01 -38.19 -41.20 -39.91 -44.10 -45.25 -45.63 Afrique orientale
-49.28 -35.84 -63.80 -54.53 -64.75 -74.82 -76.28 -81.33 -83.05 Burundi*-50.15 -62.45 -59.90 -83.29 -73.62 -68.86 -77.40 -86.45 -89.74 Comores*-94.66 -92.26 -89.25 -89.97 -63.15 -77.29 -85.23 -84.83 -84.55 Djibouti*
_ _ _ -83.92 -96.08 -95.02 -97.78 -97.84 -97.94 Érythrée_ _ _ -66.12 -69.44 -75.77 -77.74 -77.93 -76.94 Éthiopie
-39.30 -60.15 -63.00 _ _ _ _ _ _ Éthiopie (anc.)-39.06 -28.48 -51.19 -31.10 -40.58 -37.42 -41.86 -47.74 -52.04 Kenya-42.55 -10.44 -26.89 -18.68 -13.32 -24.59 -42.36 -45.45 -46.85 Madagascar*-32.26 -2.08 -35.42 -22.75 -27.55 -41.34 -48.17 -51.94 -46.10 Malawi-34.44 -11.61 -25.05 -24.35 -21.97 -21.95 -27.28 -32.37 -38.95 Maurice-62.38 -83.32 -84.78 -78.06 -59.16 -37.01 -30.71 -23.00 -19.70 Mozambique-50.97 -49.73 -67.87 -77.10 -73.45 -71.46 -69.78 -68.71 -69.83 Rwanda-78.27 -75.44 -73.25 -70.08 -55.81 -40.47 -42.94 -47.57 -50.85 Seychelles-66.06 -74.51 51.07 -17.96 -40.91 -29.63 -22.15 -22.13 -21.24 Somalie22.52 24.78 -31.05 -53.35 -67.91 -60.91 -58.71 -59.90 -55.51 Ouganda
-55.45 -62.99 -73.38 -56.53 -55.61 -42.46 -45.38 -52.54 -58.60 République-Unie de Tanzanie*31.09 2.42 26.92 42.20 5.40 -27.25 -30.52 -8.07 8.41 Zambie*-3.55 23.37 -12.66 -26.38 -11.99 -8.14 -14.19 -14.59 -13.56 Zimbabwe
47.99 35.07 67.38 85.35 87.34 85.45 116.49 151.96 183.13 Afrique centrale
18.44 51.75 142.70 138.49 110.25 107.74 139.47 202.44 268.70 Angola*-15.89 -39.75 33.25 40.30 11.52 1.37 7.17 12.02 16.48 Cameroun*(1)11.55 -33.77 -4.27 3.11 26.41 3.94 -12.63 -21.02 -20.10 République centrafricaine*(1)-9.03 -47.88 -30.34 -28.03 -53.14 -11.83 121.69 172.45 175.76 Tchad*69.80 68.09 45.10 21.93 201.20 244.27 241.01 257.71 248.85 Congo*(1)73.96 51.78 28.66 58.89 22.31 -6.56 -7.46 -9.88 -11.44 Rép. dém. du Congo*
-25.99 -37.07 -23.31 -27.21 109.58 186.45 185.43 197.34 196.64 Guinée équatoriale203.80 114.07 139.90 217.84 169.03 176.75 227.88 264.86 282.39 Gabon*(1)
-5.94 -28.17 -78.11 -80.63 -92.13 -86.62 -89.97 -93.60 -94.58 Sao Tomé-et-Principe*
20.62 -12.19 -12.47 -22.26 -3.80 3.91 13.04 21.98 25.66 Afrique septentrionale
24.96 15.54 27.30 -1.54 89.10 73.79 94.05 116.17 131.17 Algérie*-53.55 -70.67 -64.62 -70.11 -71.08 -49.25 -44.10 -40.11 -39.89 Égypte*161.64 115.05 108.00 76.20 152.52 100.99 130.12 157.94 188.13 Jamahiriya arabe libyenne-44.98 -41.46 -38.38 -31.00 -32.49 -39.84 -44.54 -47.63 -50.97 Maroc*-59.09 -53.59 -54.99 -57.97 -18.66 -12.27 -22.07 -26.79 -21.92 Soudan*-35.85 -40.30 -32.69 -29.46 -30.96 -26.07 -23.57 -22.44 -21.22 Tunisie
25.13 28.00 23.82 -2.03 -0.30 -9.18 -13.51 -17.02 -16.37 Afrique australe
.. .. .. .. 22.49 17.87 21.53 31.76 44.22 Botswana*
.. .. .. .. -72.45 -54.04 -53.83 -52.26 -54.32 Lesotho
.. .. .. .. -20.68 -27.13 -25.85 -13.96 -2.54 Namibie(a)25.13 (a)28 (a)23.82 (a)-2.03 1.55 -9.26 -14.41 -19.22 -18.86 Afrique du Sud
.. .. .. .. -10.57 3.98 -0.05 -1.91 -5.75 Swaziland
6.97 19.22 32.52 28.40 30.38 21.33 27.99 34.11 28.01 Afrique occidentale
-88.07 -58.18 17.14 -26.50 -40.16 -38.02 -37.07 -38.68 -39.98 Bénin*-75.81 -76.57 -75.87 -57.55 -64.83 -64.41 -64.58 -62.36 -60.79 Burkina Faso-94.88 -95.46 -95.28 -96.18 -95.50 -96.23 -96.14 -96.09 -96.66 Cap-Vert*
4.03 70.37 35.70 41.85 47.79 80.20 59.97 48.73 40.69 Côte d'Ivoire*-72.11 -49.47 -79.42 -88.83 -92.73 -94.49 -95.82 -96.06 -96.29 Gambie
7.42 -19.06 -28.40 -21.29 -45.80 -30.14 -37.07 -43.48 -46.80 Ghana34.81 42.34 -6.60 -4.78 14.93 2.32 3.48 4.38 0.04 Guinée
-76.78 -76.79 -77.46 -58.64 9.26 -5.78 -9.25 -14.67 -15.02 Guinée-Bissau11.93 42.95 333.70 48.33 -34.64 -43.22 -58.52 -65.11 -63.25 Libéria*
-56.92 -54.19 -34.57 -43.32 -29.72 -19.91 -27.65 -22.47 -24.00 Mali*-25.66 53.44 57.23 14.15 -18.18 -42.55 -52.21 -30.90 -12.10 Mauritanie*
-6.14 -18.66 -24.74 -27.07 -30.84 -42.00 -45.37 -47.10 -49.88 Niger*20.79 33.19 79.83 86.66 98.53 54.69 73.66 88.90 82.06 Nigéria
-50.56 -34.20 -40.35 -28.37 -39.57 -47.26 -48.49 -50.96 -55.62 Sénégal*-46.40 -7.34 -14.94 -58.63 -88.28 -67.28 -58.34 -49.73 -45.31 Sierra Leone*-48.88 -32.72 -48.82 -22.48 -35.00 -27.45 -33.40 -37.45 -41.33 Togo*
Pour les sources et les notes, se reporter à la fin du tableau.
Régions,pays ou territoires
Percentage of importsPart dans les importations en pourcentage
1.3.1 Valeur de la balance commerciale et sa part dans lesimportations des pays et des régions géographiques 1
39
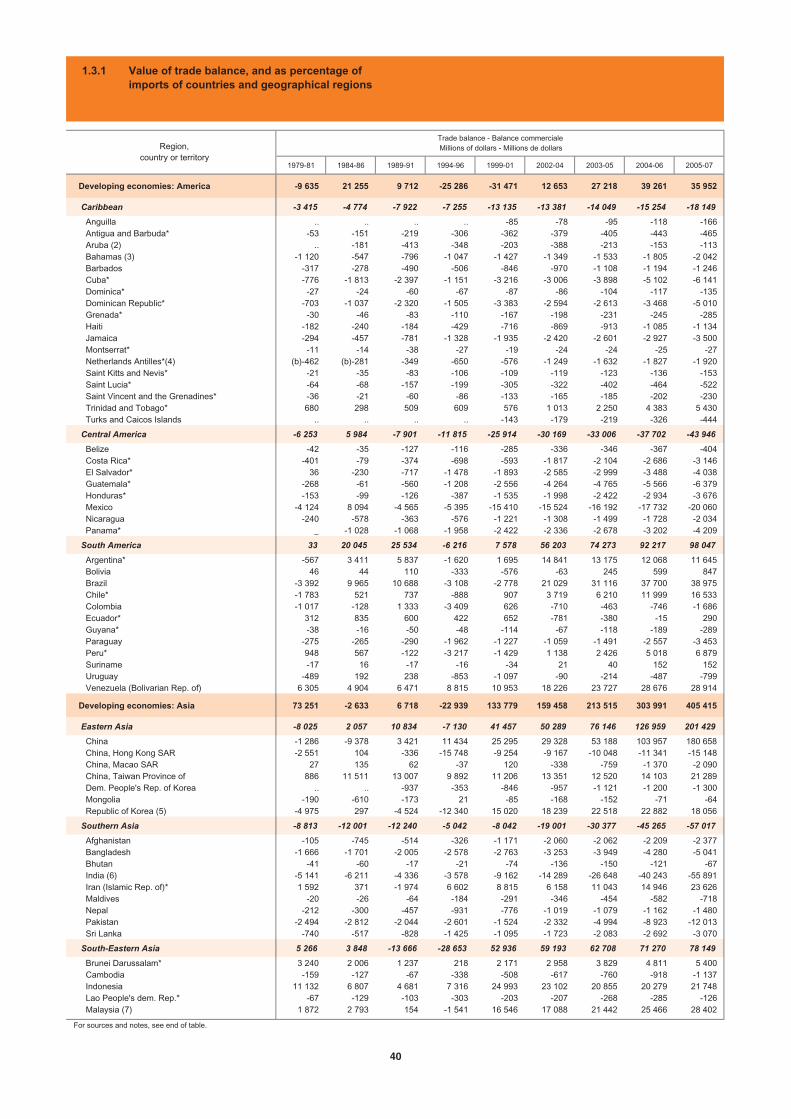
1979-81 1984-86 1989-91 1994-96 1999-01 2002-04 2003-05 2004-06 2005-07
Developing economies: America -9 635 21 255 9 712 -25 286 -31 471 12 653 27 218 39 261 35 952
Caribbean -3 415 -4 774 -7 922 -7 255 -13 135 -13 381 -14 049 -15 254 -18 149
Anguilla .. .. .. .. -85 -78 -95 -118 -166 Antigua and Barbuda* -53 -151 -219 -306 -362 -379 -405 -443 -465 Aruba (2) .. -181 -413 -348 -203 -388 -213 -153 -113 Bahamas (3) -1 120 -547 -796 -1 047 -1 427 -1 349 -1 533 -1 805 -2 042 Barbados -317 -278 -490 -506 -846 -970 -1 108 -1 194 -1 246 Cuba* -776 -1 813 -2 397 -1 151 -3 216 -3 006 -3 898 -5 102 -6 141 Dominica* -27 -24 -60 -67 -87 -86 -104 -117 -135 Dominican Republic* -703 -1 037 -2 320 -1 505 -3 383 -2 594 -2 613 -3 468 -5 010 Grenada* -30 -46 -83 -110 -167 -198 -231 -245 -285 Haiti -182 -240 -184 -429 -716 -869 -913 -1 085 -1 134 Jamaica -294 -457 -781 -1 328 -1 935 -2 420 -2 601 -2 927 -3 500 Montserrat* -11 -14 -38 -27 -19 -24 -24 -25 -27 Netherlands Antilles*(4) (b)-462 (b)-281 -349 -650 -576 -1 249 -1 632 -1 827 -1 920 Saint Kitts and Nevis* -21 -35 -83 -106 -109 -119 -123 -136 -153 Saint Lucia* -64 -68 -157 -199 -305 -322 -402 -464 -522 Saint Vincent and the Grenadines* -36 -21 -60 -86 -133 -165 -185 -202 -230 Trinidad and Tobago* 680 298 509 609 576 1 013 2 250 4 383 5 430 Turks and Caicos Islands .. .. .. .. -143 -179 -219 -326 -444
Central America -6 253 5 984 -7 901 -11 815 -25 914 -30 169 -33 006 -37 702 -43 946
Belize -42 -35 -127 -116 -285 -336 -346 -367 -404 Costa Rica* -401 -79 -374 -698 -593 -1 817 -2 104 -2 686 -3 146 El Salvador* 36 -230 -717 -1 478 -1 893 -2 585 -2 999 -3 488 -4 038 Guatemala* -268 -61 -560 -1 208 -2 556 -4 264 -4 765 -5 566 -6 379 Honduras* -153 -99 -126 -387 -1 535 -1 998 -2 422 -2 934 -3 676 Mexico -4 124 8 094 -4 565 -5 395 -15 410 -15 524 -16 192 -17 732 -20 060 Nicaragua -240 -578 -363 -576 -1 221 -1 308 -1 499 -1 728 -2 034 Panama* _ -1 028 -1 068 -1 958 -2 422 -2 336 -2 678 -3 202 -4 209
South America 33 20 045 25 534 -6 216 7 578 56 203 74 273 92 217 98 047
Argentina* -567 3 411 5 837 -1 620 1 695 14 841 13 175 12 068 11 645 Bolivia 46 44 110 -333 -576 -63 245 599 847 Brazil -3 392 9 965 10 688 -3 108 -2 778 21 029 31 116 37 700 38 975 Chile* -1 783 521 737 -888 907 3 719 6 210 11 999 16 533 Colombia -1 017 -128 1 333 -3 409 626 -710 -463 -746 -1 686 Ecuador* 312 835 600 422 652 -781 -380 -15 290 Guyana* -38 -16 -50 -48 -114 -67 -118 -189 -289 Paraguay -275 -265 -290 -1 962 -1 227 -1 059 -1 491 -2 557 -3 453 Peru* 948 567 -122 -3 217 -1 429 1 138 2 426 5 018 6 879 Suriname -17 16 -17 -16 -34 21 40 152 152 Uruguay -489 192 238 -853 -1 097 -90 -214 -487 -799 Venezuela (Bolivarian Rep. of) 6 305 4 904 6 471 8 815 10 953 18 226 23 727 28 676 28 914
Developing economies: Asia 73 251 -2 633 6 718 -22 939 133 779 159 458 213 515 303 991 405 415
Eastern Asia -8 025 2 057 10 834 -7 130 41 457 50 289 76 146 126 959 201 429
China -1 286 -9 378 3 421 11 434 25 295 29 328 53 188 103 957 180 658 China, Hong Kong SAR -2 551 104 -336 -15 748 -9 254 -9 167 -10 048 -11 341 -15 148 China, Macao SAR 27 135 62 -37 120 -338 -759 -1 370 -2 090 China, Taiwan Province of 886 11 511 13 007 9 892 11 206 13 351 12 520 14 103 21 289 Dem. People's Rep. of Korea .. .. -937 -353 -846 -957 -1 121 -1 200 -1 300 Mongolia -190 -610 -173 21 -85 -168 -152 -71 -64 Republic of Korea (5) -4 975 297 -4 524 -12 340 15 020 18 239 22 518 22 882 18 056
Southern Asia -8 813 -12 001 -12 240 -5 042 -8 042 -19 001 -30 377 -45 265 -57 017
Afghanistan -105 -745 -514 -326 -1 171 -2 060 -2 062 -2 209 -2 377 Bangladesh -1 666 -1 701 -2 005 -2 578 -2 763 -3 253 -3 949 -4 280 -5 041 Bhutan -41 -60 -17 -21 -74 -136 -150 -121 -67 India (6) -5 141 -6 211 -4 336 -3 578 -9 162 -14 289 -26 648 -40 243 -55 891 Iran (Islamic Rep. of)* 1 592 371 -1 974 6 602 8 815 6 158 11 043 14 946 23 626 Maldives -20 -26 -64 -184 -291 -346 -454 -582 -718 Nepal -212 -300 -457 -931 -776 -1 019 -1 079 -1 162 -1 480 Pakistan -2 494 -2 812 -2 044 -2 601 -1 524 -2 332 -4 994 -8 923 -12 013 Sri Lanka -740 -517 -828 -1 425 -1 095 -1 723 -2 083 -2 692 -3 070
South-Eastern Asia 5 266 3 848 -13 666 -28 653 52 936 59 193 62 708 71 270 78 149
Brunei Darussalam* 3 240 2 006 1 237 218 2 171 2 958 3 829 4 811 5 400 Cambodia -159 -127 -67 -338 -508 -617 -760 -918 -1 137 Indonesia 11 132 6 807 4 681 7 316 24 993 23 102 20 855 20 279 21 748 Lao People's dem. Rep.* -67 -129 -103 -303 -203 -207 -268 -285 -126 Malaysia (7) 1 872 2 793 154 -1 541 16 546 17 088 21 442 25 466 28 402
For sources and notes, see end of table.
Region,country or territory
Trade balance - Balance commercialeMillions of dollars - Millions de dollars
1.3.1 Value of trade balance, and as percentage ofimports of countries and geographical regions
40
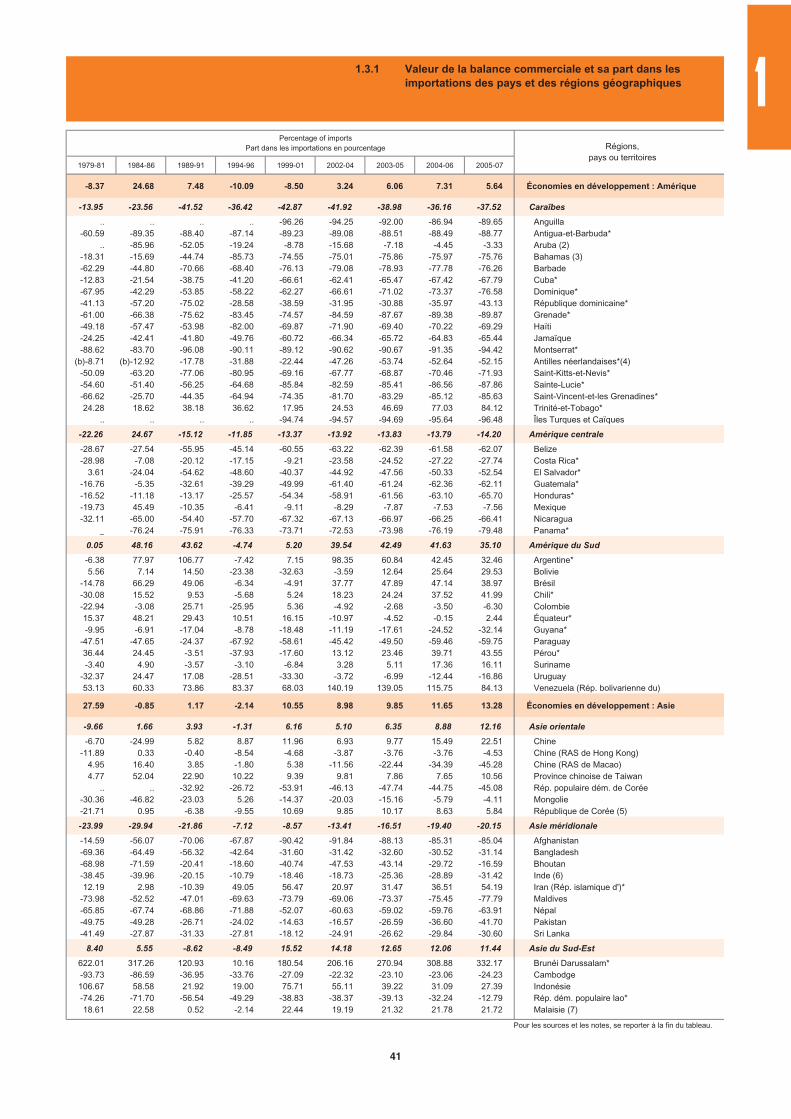
1979-81 1984-86 1989-91 1994-96 1999-01 2002-04 2003-05 2004-06 2005-07
-8.37 24.68 7.48 -10.09 -8.50 3.24 6.06 7.31 5.64 Économies en développement : Amérique
-13.95 -23.56 -41.52 -36.42 -42.87 -41.92 -38.98 -36.16 -37.52 Caraïbes
.. .. .. .. -96.26 -94.25 -92.00 -86.94 -89.65 Anguilla-60.59 -89.35 -88.40 -87.14 -89.23 -89.08 -88.51 -88.49 -88.77 Antigua-et-Barbuda*
.. -85.96 -52.05 -19.24 -8.78 -15.68 -7.18 -4.45 -3.33 Aruba (2)-18.31 -15.69 -44.74 -85.73 -74.55 -75.01 -75.86 -75.97 -75.76 Bahamas (3)-62.29 -44.80 -70.66 -68.40 -76.13 -79.08 -78.93 -77.78 -76.26 Barbade-12.83 -21.54 -38.75 -41.20 -66.61 -62.41 -65.47 -67.42 -67.79 Cuba*-67.95 -42.29 -53.85 -58.22 -62.27 -66.61 -71.02 -73.37 -76.58 Dominique*-41.13 -57.20 -75.02 -28.58 -38.59 -31.95 -30.88 -35.97 -43.13 République dominicaine*-61.00 -66.38 -75.62 -83.45 -74.57 -84.59 -87.67 -89.38 -89.87 Grenade*-49.18 -57.47 -53.98 -82.00 -69.87 -71.90 -69.40 -70.22 -69.29 Haïti-24.25 -42.41 -41.80 -49.76 -60.72 -66.34 -65.72 -64.83 -65.44 Jamaïque-88.62 -83.70 -96.08 -90.11 -89.12 -90.62 -90.67 -91.35 -94.42 Montserrat*
(b)-8.71 (b)-12.92 -17.78 -31.88 -22.44 -47.26 -53.74 -52.64 -52.15 Antilles néerlandaises*(4)-50.09 -63.20 -77.06 -80.95 -69.16 -67.77 -68.87 -70.46 -71.93 Saint-Kitts-et-Nevis*-54.60 -51.40 -56.25 -64.68 -85.84 -82.59 -85.41 -86.56 -87.86 Sainte-Lucie*-66.62 -25.70 -44.35 -64.94 -74.35 -81.70 -83.29 -85.12 -85.63 Saint-Vincent-et-les Grenadines*24.28 18.62 38.18 36.62 17.95 24.53 46.69 77.03 84.12 Trinité-et-Tobago*
.. .. .. .. -94.74 -94.57 -94.69 -95.64 -96.48 Îles Turques et Caïques
-22.26 24.67 -15.12 -11.85 -13.37 -13.92 -13.83 -13.79 -14.20 Amérique centrale
-28.67 -27.54 -55.95 -45.14 -60.55 -63.22 -62.39 -61.58 -62.07 Belize-28.98 -7.08 -20.12 -17.15 -9.21 -23.58 -24.52 -27.22 -27.74 Costa Rica*
3.61 -24.04 -54.62 -48.60 -40.37 -44.92 -47.56 -50.33 -52.54 El Salvador*-16.76 -5.35 -32.61 -39.29 -49.99 -61.40 -61.24 -62.36 -62.11 Guatemala*-16.52 -11.18 -13.17 -25.57 -54.34 -58.91 -61.56 -63.10 -65.70 Honduras*-19.73 45.49 -10.35 -6.41 -9.11 -8.29 -7.87 -7.53 -7.56 Mexique-32.11 -65.00 -54.40 -57.70 -67.32 -67.13 -66.97 -66.25 -66.41 Nicaragua
_ -76.24 -75.91 -76.33 -73.71 -72.53 -73.98 -76.19 -79.48 Panama*
0.05 48.16 43.62 -4.74 5.20 39.54 42.49 41.63 35.10 Amérique du Sud
-6.38 77.97 106.77 -7.42 7.15 98.35 60.84 42.45 32.46 Argentine*5.56 7.14 14.50 -23.38 -32.63 -3.59 12.64 25.64 29.53 Bolivie
-14.78 66.29 49.06 -6.34 -4.91 37.77 47.89 47.14 38.97 Brésil-30.08 15.52 9.53 -5.68 5.24 18.23 24.24 37.52 41.99 Chili*-22.94 -3.08 25.71 -25.95 5.36 -4.92 -2.68 -3.50 -6.30 Colombie15.37 48.21 29.43 10.51 16.15 -10.97 -4.52 -0.15 2.44 Équateur*-9.95 -6.91 -17.04 -8.78 -18.48 -11.19 -17.61 -24.52 -32.14 Guyana*
-47.51 -47.65 -24.37 -67.92 -58.61 -45.42 -49.50 -59.46 -59.75 Paraguay36.44 24.45 -3.51 -37.93 -17.60 13.12 23.46 39.71 43.55 Pérou*-3.40 4.90 -3.57 -3.10 -6.84 3.28 5.11 17.36 16.11 Suriname
-32.37 24.47 17.08 -28.51 -33.30 -3.72 -6.99 -12.44 -16.86 Uruguay53.13 60.33 73.86 83.37 68.03 140.19 139.05 115.75 84.13 Venezuela (Rép. bolivarienne du)
27.59 -0.85 1.17 -2.14 10.55 8.98 9.85 11.65 13.28 Économies en développement : Asie
-9.66 1.66 3.93 -1.31 6.16 5.10 6.35 8.88 12.16 Asie orientale
-6.70 -24.99 5.82 8.87 11.96 6.93 9.77 15.49 22.51 Chine-11.89 0.33 -0.40 -8.54 -4.68 -3.87 -3.76 -3.76 -4.53 Chine (RAS de Hong Kong)
4.95 16.40 3.85 -1.80 5.38 -11.56 -22.44 -34.39 -45.28 Chine (RAS de Macao)4.77 52.04 22.90 10.22 9.39 9.81 7.86 7.65 10.56 Province chinoise de Taiwan
.. .. -32.92 -26.72 -53.91 -46.13 -47.74 -44.75 -45.08 Rép. populaire dém. de Corée-30.36 -46.82 -23.03 5.26 -14.37 -20.03 -15.16 -5.79 -4.11 Mongolie-21.71 0.95 -6.38 -9.55 10.69 9.85 10.17 8.63 5.84 République de Corée (5)
-23.99 -29.94 -21.86 -7.12 -8.57 -13.41 -16.51 -19.40 -20.15 Asie méridionale
-14.59 -56.07 -70.06 -67.87 -90.42 -91.84 -88.13 -85.31 -85.04 Afghanistan-69.36 -64.49 -56.32 -42.64 -31.60 -31.42 -32.60 -30.52 -31.14 Bangladesh-68.98 -71.59 -20.41 -18.60 -40.74 -47.53 -43.14 -29.72 -16.59 Bhoutan-38.45 -39.96 -20.15 -10.79 -18.46 -18.73 -25.36 -28.89 -31.42 Inde (6)12.19 2.98 -10.39 49.05 56.47 20.97 31.47 36.51 54.19 Iran (Rép. islamique d')*
-73.98 -52.52 -47.01 -69.63 -73.79 -69.06 -73.37 -75.45 -77.79 Maldives-65.85 -67.74 -68.86 -71.88 -52.07 -60.63 -59.02 -59.76 -63.91 Népal-49.75 -49.28 -26.71 -24.02 -14.63 -16.57 -26.59 -36.60 -41.70 Pakistan-41.49 -27.87 -31.33 -27.81 -18.12 -24.91 -26.62 -29.84 -30.60 Sri Lanka
8.40 5.55 -8.62 -8.49 15.52 14.18 12.65 12.06 11.44 Asie du Sud-Est
622.01 317.26 120.93 10.16 180.54 206.16 270.94 308.88 332.17 Brunéi Darussalam*-93.73 -86.59 -36.95 -33.76 -27.09 -22.32 -23.10 -23.06 -24.23 Cambodge106.67 58.58 21.92 19.00 75.71 55.11 39.22 31.09 27.39 Indonésie-74.26 -71.70 -56.54 -49.29 -38.83 -38.37 -39.13 -32.24 -12.79 Rép. dém. populaire lao*18.61 22.58 0.52 -2.14 22.44 19.19 21.32 21.78 21.72 Malaisie (7)
Pour les sources et les notes, se reporter à la fin du tableau.
Percentage of importsPart dans les importations en pourcentage Régions,
pays ou territoires
1.3.1 Valeur de la balance commerciale et sa part dans lesimportations des pays et des régions géographiques 1
41
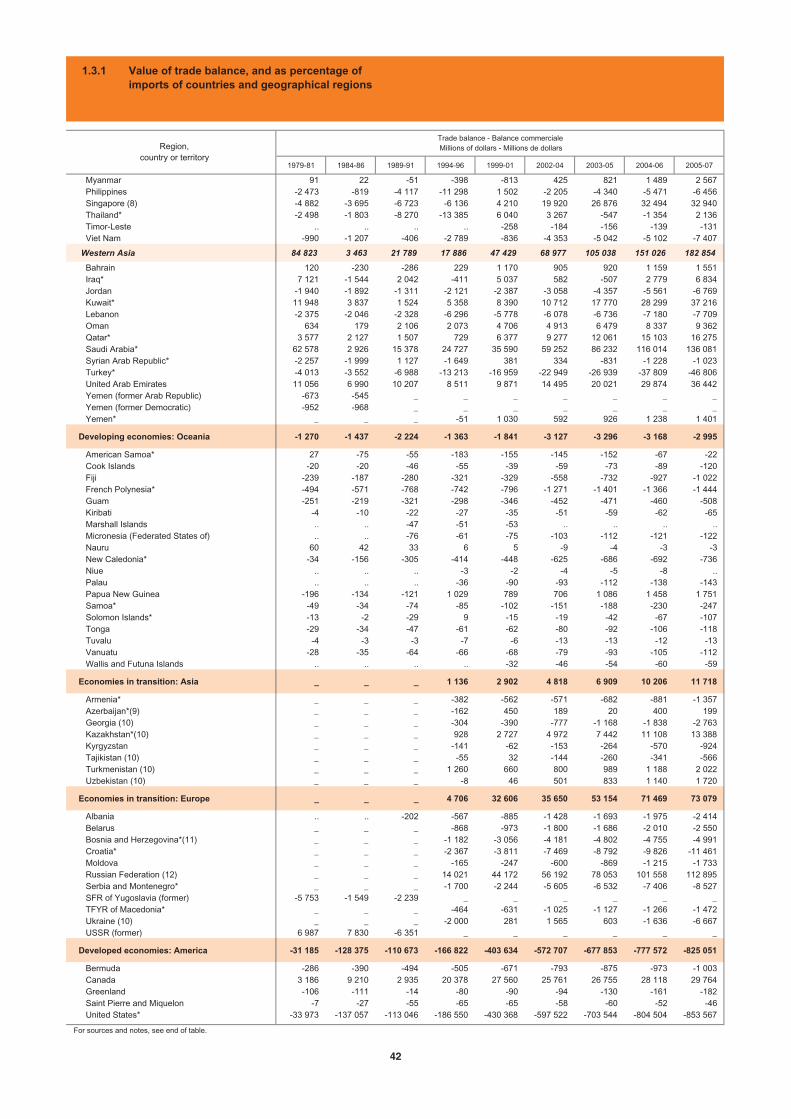
1979-81 1984-86 1989-91 1994-96 1999-01 2002-04 2003-05 2004-06 2005-07
Myanmar 91 22 -51 -398 -813 425 821 1 489 2 567 Philippines -2 473 -819 -4 117 -11 298 1 502 -2 205 -4 340 -5 471 -6 456 Singapore (8) -4 882 -3 695 -6 723 -6 136 4 210 19 920 26 876 32 494 32 940 Thailand* -2 498 -1 803 -8 270 -13 385 6 040 3 267 -547 -1 354 2 136 Timor-Leste .. .. .. .. -258 -184 -156 -139 -131 Viet Nam -990 -1 207 -406 -2 789 -836 -4 353 -5 042 -5 102 -7 407
Western Asia 84 823 3 463 21 789 17 886 47 429 68 977 105 038 151 026 182 854
Bahrain 120 -230 -286 229 1 170 905 920 1 159 1 551 Iraq* 7 121 -1 544 2 042 -411 5 037 582 -507 2 779 6 834 Jordan -1 940 -1 892 -1 311 -2 121 -2 387 -3 058 -4 357 -5 561 -6 769 Kuwait* 11 948 3 837 1 524 5 358 8 390 10 712 17 770 28 299 37 216 Lebanon -2 375 -2 046 -2 328 -6 296 -5 778 -6 078 -6 736 -7 180 -7 709 Oman 634 179 2 106 2 073 4 706 4 913 6 479 8 337 9 362 Qatar* 3 577 2 127 1 507 729 6 377 9 277 12 061 15 103 16 275 Saudi Arabia* 62 578 2 926 15 378 24 727 35 590 59 252 86 232 116 014 136 081 Syrian Arab Republic* -2 257 -1 999 1 127 -1 649 381 334 -831 -1 228 -1 023 Turkey* -4 013 -3 552 -6 988 -13 213 -16 959 -22 949 -26 939 -37 809 -46 806 United Arab Emirates 11 056 6 990 10 207 8 511 9 871 14 495 20 021 29 874 36 442 Yemen (former Arab Republic) -673 -545 _ _ _ _ _ _ _ Yemen (former Democratic) -952 -968 _ _ _ _ _ _ _ Yemen* _ _ _ -51 1 030 592 926 1 238 1 401
Developing economies: Oceania -1 270 -1 437 -2 224 -1 363 -1 841 -3 127 -3 296 -3 168 -2 995
American Samoa* 27 -75 -55 -183 -155 -145 -152 -67 -22 Cook Islands -20 -20 -46 -55 -39 -59 -73 -89 -120 Fiji -239 -187 -280 -321 -329 -558 -732 -927 -1 022 French Polynesia* -494 -571 -768 -742 -796 -1 271 -1 401 -1 366 -1 444 Guam -251 -219 -321 -298 -346 -452 -471 -460 -508 Kiribati -4 -10 -22 -27 -35 -51 -59 -62 -65 Marshall Islands .. .. -47 -51 -53 .. .. .. .. Micronesia (Federated States of) .. .. -76 -61 -75 -103 -112 -121 -122 Nauru 60 42 33 6 5 -9 -4 -3 -3 New Caledonia* -34 -156 -305 -414 -448 -625 -686 -692 -736 Niue .. .. .. -3 -2 -4 -5 -8 .. Palau .. .. .. -36 -90 -93 -112 -138 -143 Papua New Guinea -196 -134 -121 1 029 789 706 1 086 1 458 1 751 Samoa* -49 -34 -74 -85 -102 -151 -188 -230 -247 Solomon Islands* -13 -2 -29 9 -15 -19 -42 -67 -107 Tonga -29 -34 -47 -61 -62 -80 -92 -106 -118 Tuvalu -4 -3 -3 -7 -6 -13 -13 -12 -13 Vanuatu -28 -35 -64 -66 -68 -79 -93 -105 -112 Wallis and Futuna Islands .. .. .. .. -32 -46 -54 -60 -59
Economies in transition: Asia _ _ _ 1 136 2 902 4 818 6 909 10 206 11 718
Armenia* _ _ _ -382 -562 -571 -682 -881 -1 357 Azerbaijan*(9) _ _ _ -162 450 189 20 400 199 Georgia (10) _ _ _ -304 -390 -777 -1 168 -1 838 -2 763 Kazakhstan*(10) _ _ _ 928 2 727 4 972 7 442 11 108 13 388 Kyrgyzstan _ _ _ -141 -62 -153 -264 -570 -924 Tajikistan (10) _ _ _ -55 32 -144 -260 -341 -566 Turkmenistan (10) _ _ _ 1 260 660 800 989 1 188 2 022 Uzbekistan (10) _ _ _ -8 46 501 833 1 140 1 720
Economies in transition: Europe _ _ _ 4 706 32 606 35 650 53 154 71 469 73 079
Albania .. .. -202 -567 -885 -1 428 -1 693 -1 975 -2 414 Belarus _ _ _ -868 -973 -1 800 -1 686 -2 010 -2 550 Bosnia and Herzegovina*(11) _ _ _ -1 182 -3 056 -4 181 -4 802 -4 755 -4 991 Croatia* _ _ _ -2 367 -3 811 -7 469 -8 792 -9 826 -11 461 Moldova _ _ _ -165 -247 -600 -869 -1 215 -1 733 Russian Federation (12) _ _ _ 14 021 44 172 56 192 78 053 101 558 112 895 Serbia and Montenegro* _ _ _ -1 700 -2 244 -5 605 -6 532 -7 406 -8 527 SFR of Yugoslavia (former) -5 753 -1 549 -2 239 _ _ _ _ _ _ TFYR of Macedonia* _ _ _ -464 -631 -1 025 -1 127 -1 266 -1 472 Ukraine (10) _ _ _ -2 000 281 1 565 603 -1 636 -6 667 USSR (former) 6 987 7 830 -6 351 _ _ _ _ _ _
Developed economies: America -31 185 -128 375 -110 673 -166 822 -403 634 -572 707 -677 853 -777 572 -825 051
Bermuda -286 -390 -494 -505 -671 -793 -875 -973 -1 003 Canada 3 186 9 210 2 935 20 378 27 560 25 761 26 755 28 118 29 764 Greenland -106 -111 -14 -80 -90 -94 -130 -161 -182 Saint Pierre and Miquelon -7 -27 -55 -65 -65 -58 -60 -52 -46 United States* -33 973 -137 057 -113 046 -186 550 -430 368 -597 522 -703 544 -804 504 -853 567
For sources and notes, see end of table.
Region,country or territory
Trade balance - Balance commercialeMillions of dollars - Millions de dollars
1.3.1 Value of trade balance, and as percentage ofimports of countries and geographical regions
42
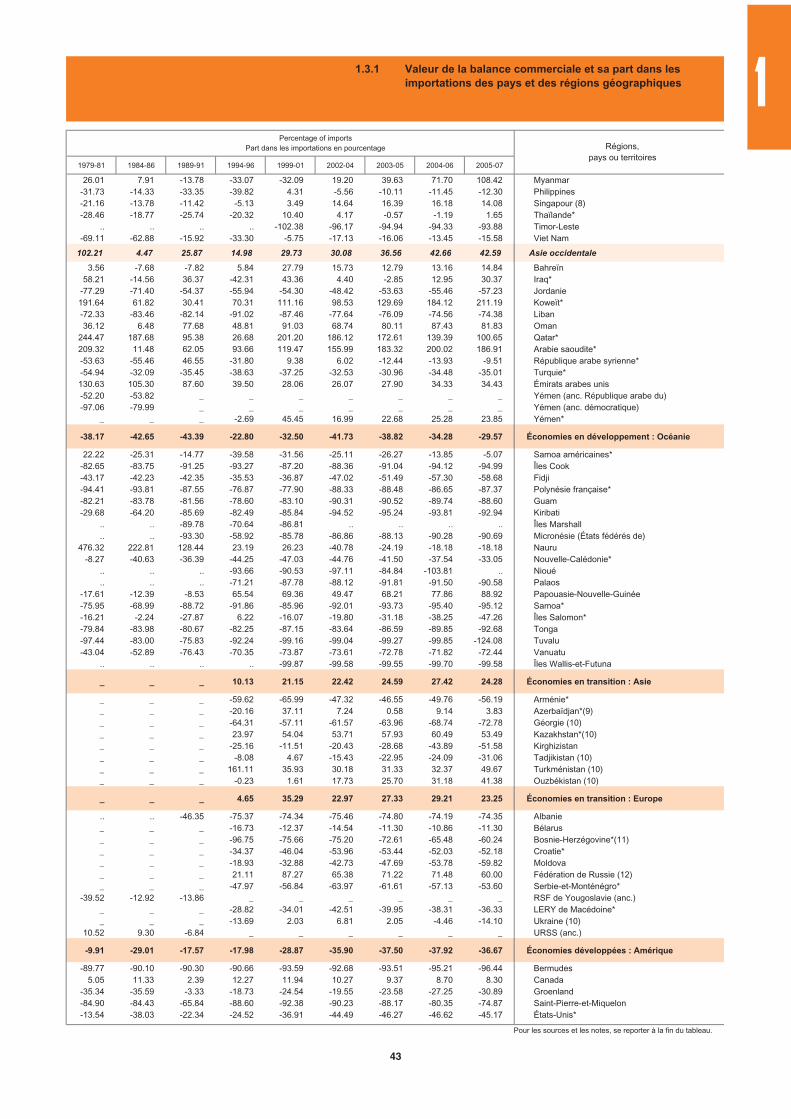
1979-81 1984-86 1989-91 1994-96 1999-01 2002-04 2003-05 2004-06 2005-07
26.01 7.91 -13.78 -33.07 -32.09 19.20 39.63 71.70 108.42 Myanmar-31.73 -14.33 -33.35 -39.82 4.31 -5.56 -10.11 -11.45 -12.30 Philippines-21.16 -13.78 -11.42 -5.13 3.49 14.64 16.39 16.18 14.08 Singapour (8)-28.46 -18.77 -25.74 -20.32 10.40 4.17 -0.57 -1.19 1.65 Thaïlande*
.. .. .. .. -102.38 -96.17 -94.94 -94.33 -93.88 Timor-Leste-69.11 -62.88 -15.92 -33.30 -5.75 -17.13 -16.06 -13.45 -15.58 Viet Nam
102.21 4.47 25.87 14.98 29.73 30.08 36.56 42.66 42.59 Asie occidentale
3.56 -7.68 -7.82 5.84 27.79 15.73 12.79 13.16 14.84 Bahreïn58.21 -14.56 36.37 -42.31 43.36 4.40 -2.85 12.95 30.37 Iraq*
-77.29 -71.40 -54.37 -55.94 -54.30 -48.42 -53.63 -55.46 -57.23 Jordanie191.64 61.82 30.41 70.31 111.16 98.53 129.69 184.12 211.19 Koweït*-72.33 -83.46 -82.14 -91.02 -87.46 -77.64 -76.09 -74.56 -74.38 Liban36.12 6.48 77.68 48.81 91.03 68.74 80.11 87.43 81.83 Oman
244.47 187.68 95.38 26.68 201.20 186.12 172.61 139.39 100.65 Qatar*209.32 11.48 62.05 93.66 119.47 155.99 183.32 200.02 186.91 Arabie saoudite*-53.63 -55.46 46.55 -31.80 9.38 6.02 -12.44 -13.93 -9.51 République arabe syrienne*-54.94 -32.09 -35.45 -38.63 -37.25 -32.53 -30.96 -34.48 -35.01 Turquie*130.63 105.30 87.60 39.50 28.06 26.07 27.90 34.33 34.43 Émirats arabes unis-52.20 -53.82 _ _ _ _ _ _ _ Yémen (anc. République arabe du)-97.06 -79.99 _ _ _ _ _ _ _ Yémen (anc. démocratique)
_ _ _ -2.69 45.45 16.99 22.68 25.28 23.85 Yémen*
-38.17 -42.65 -43.39 -22.80 -32.50 -41.73 -38.82 -34.28 -29.57 Économies en développement : Océanie
22.22 -25.31 -14.77 -39.58 -31.56 -25.11 -26.27 -13.85 -5.07 Samoa américaines*-82.65 -83.75 -91.25 -93.27 -87.20 -88.36 -91.04 -94.12 -94.99 Îles Cook-43.17 -42.23 -42.35 -35.53 -36.87 -47.02 -51.49 -57.30 -58.68 Fidji-94.41 -93.81 -87.55 -76.87 -77.90 -88.33 -88.48 -86.65 -87.37 Polynésie française*-82.21 -83.78 -81.56 -78.60 -83.10 -90.31 -90.52 -89.74 -88.60 Guam-29.68 -64.20 -85.69 -82.49 -85.84 -94.52 -95.24 -93.81 -92.94 Kiribati
.. .. -89.78 -70.64 -86.81 .. .. .. .. Îles Marshall
.. .. -93.30 -58.92 -85.78 -86.86 -88.13 -90.28 -90.69 Micronésie (États fédérés de)476.32 222.81 128.44 23.19 26.23 -40.78 -24.19 -18.18 -18.18 Nauru
-8.27 -40.63 -36.39 -44.25 -47.03 -44.76 -41.50 -37.54 -33.05 Nouvelle-Calédonie*.. .. .. -93.66 -90.53 -97.11 -84.84 -103.81 .. Nioué.. .. .. -71.21 -87.78 -88.12 -91.81 -91.50 -90.58 Palaos
-17.61 -12.39 -8.53 65.54 69.36 49.47 68.21 77.86 88.92 Papouasie-Nouvelle-Guinée-75.95 -68.99 -88.72 -91.86 -85.96 -92.01 -93.73 -95.40 -95.12 Samoa*-16.21 -2.24 -27.87 6.22 -16.07 -19.80 -31.18 -38.25 -47.26 Îles Salomon*-79.84 -83.98 -80.67 -82.25 -87.15 -83.64 -86.59 -89.85 -92.68 Tonga-97.44 -83.00 -75.83 -92.24 -99.16 -99.04 -99.27 -99.85 -124.08 Tuvalu-43.04 -52.89 -76.43 -70.35 -73.87 -73.61 -72.78 -71.82 -72.44 Vanuatu
.. .. .. .. -99.87 -99.58 -99.55 -99.70 -99.58 Îles Wallis-et-Futuna
_ _ _ 10.13 21.15 22.42 24.59 27.42 24.28 Économies en transition : Asie
_ _ _ -59.62 -65.99 -47.32 -46.55 -49.76 -56.19 Arménie*_ _ _ -20.16 37.11 7.24 0.58 9.14 3.83 Azerbaïdjan*(9)_ _ _ -64.31 -57.11 -61.57 -63.96 -68.74 -72.78 Géorgie (10)_ _ _ 23.97 54.04 53.71 57.93 60.49 53.49 Kazakhstan*(10)_ _ _ -25.16 -11.51 -20.43 -28.68 -43.89 -51.58 Kirghizistan_ _ _ -8.08 4.67 -15.43 -22.95 -24.09 -31.06 Tadjikistan (10)_ _ _ 161.11 35.93 30.18 31.33 32.37 49.67 Turkménistan (10)_ _ _ -0.23 1.61 17.73 25.70 31.18 41.38 Ouzbékistan (10)
_ _ _ 4.65 35.29 22.97 27.33 29.21 23.25 Économies en transition : Europe
.. .. -46.35 -75.37 -74.34 -75.46 -74.80 -74.19 -74.35 Albanie_ _ _ -16.73 -12.37 -14.54 -11.30 -10.86 -11.30 Bélarus_ _ _ -96.75 -75.66 -75.20 -72.61 -65.48 -60.24 Bosnie-Herzégovine*(11)_ _ _ -34.37 -46.04 -53.96 -53.44 -52.03 -52.18 Croatie*_ _ _ -18.93 -32.88 -42.73 -47.69 -53.78 -59.82 Moldova_ _ _ 21.11 87.27 65.38 71.22 71.48 60.00 Fédération de Russie (12)_ _ _ -47.97 -56.84 -63.97 -61.61 -57.13 -53.60 Serbie-et-Monténégro*
-39.52 -12.92 -13.86 _ _ _ _ _ _ RSF de Yougoslavie (anc.)_ _ _ -28.82 -34.01 -42.51 -39.95 -38.31 -36.33 LERY de Macédoine*_ _ _ -13.69 2.03 6.81 2.05 -4.46 -14.10 Ukraine (10)
10.52 9.30 -6.84 _ _ _ _ _ _ URSS (anc.)
-9.91 -29.01 -17.57 -17.98 -28.87 -35.90 -37.50 -37.92 -36.67 Économies développées : Amérique
-89.77 -90.10 -90.30 -90.66 -93.59 -92.68 -93.51 -95.21 -96.44 Bermudes5.05 11.33 2.39 12.27 11.94 10.27 9.37 8.70 8.30 Canada
-35.34 -35.59 -3.33 -18.73 -24.54 -19.55 -23.58 -27.25 -30.89 Groenland-84.90 -84.43 -65.84 -88.60 -92.38 -90.23 -88.17 -80.35 -74.87 Saint-Pierre-et-Miquelon-13.54 -38.03 -22.34 -24.52 -36.91 -44.49 -46.27 -46.62 -45.17 États-Unis*
Pour les sources et les notes, se reporter à la fin du tableau.
Percentage of importsPart dans les importations en pourcentage Régions,
pays ou territoires
1.3.1 Valeur de la balance commerciale et sa part dans lesimportations des pays et des régions géographiques 1
43
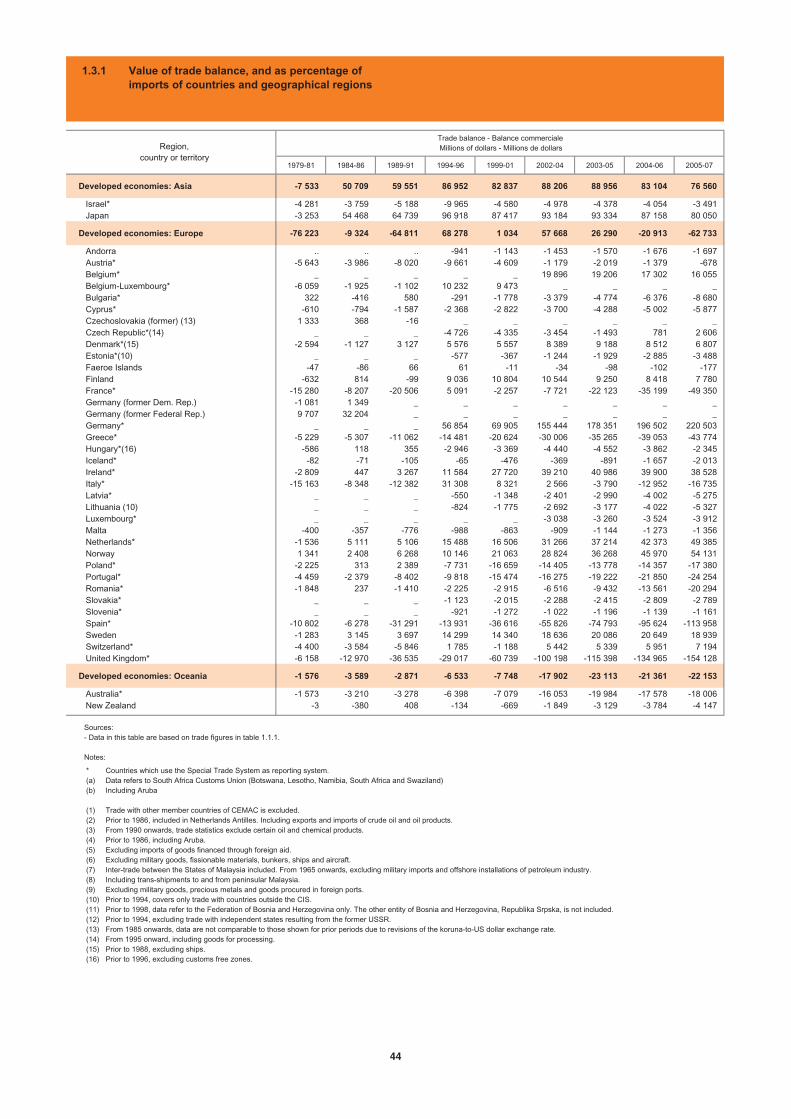
1979-81 1984-86 1989-91 1994-96 1999-01 2002-04 2003-05 2004-06 2005-07
Developed economies: Asia -7 533 50 709 59 551 86 952 82 837 88 206 88 956 83 104 76 560
Israel* -4 281 -3 759 -5 188 -9 965 -4 580 -4 978 -4 378 -4 054 -3 491 Japan -3 253 54 468 64 739 96 918 87 417 93 184 93 334 87 158 80 050
Developed economies: Europe -76 223 -9 324 -64 811 68 278 1 034 57 668 26 290 -20 913 -62 733
Andorra .. .. .. -941 -1 143 -1 453 -1 570 -1 676 -1 697 Austria* -5 643 -3 986 -8 020 -9 661 -4 609 -1 179 -2 019 -1 379 -678 Belgium* _ _ _ _ _ 19 896 19 206 17 302 16 055 Belgium-Luxembourg* -6 059 -1 925 -1 102 10 232 9 473 _ _ _ _ Bulgaria* 322 -416 580 -291 -1 778 -3 379 -4 774 -6 376 -8 680 Cyprus* -610 -794 -1 587 -2 368 -2 822 -3 700 -4 288 -5 002 -5 877 Czechoslovakia (former) (13) 1 333 368 -16 _ _ _ _ _ _ Czech Republic*(14) _ _ _ -4 726 -4 335 -3 454 -1 493 781 2 606 Denmark*(15) -2 594 -1 127 3 127 5 576 5 557 8 389 9 188 8 512 6 807 Estonia*(10) _ _ _ -577 -367 -1 244 -1 929 -2 885 -3 488 Faeroe Islands -47 -86 66 61 -11 -34 -98 -102 -177 Finland -632 814 -99 9 036 10 804 10 544 9 250 8 418 7 780 France* -15 280 -8 207 -20 506 5 091 -2 257 -7 721 -22 123 -35 199 -49 350 Germany (former Dem. Rep.) -1 081 1 349 _ _ _ _ _ _ _ Germany (former Federal Rep.) 9 707 32 204 _ _ _ _ _ _ _ Germany* _ _ _ 56 854 69 905 155 444 178 351 196 502 220 503 Greece* -5 229 -5 307 -11 062 -14 481 -20 624 -30 006 -35 265 -39 053 -43 774 Hungary*(16) -586 118 355 -2 946 -3 369 -4 440 -4 552 -3 862 -2 345 Iceland* -82 -71 -105 -65 -476 -369 -891 -1 657 -2 013 Ireland* -2 809 447 3 267 11 584 27 720 39 210 40 986 39 900 38 528 Italy* -15 163 -8 348 -12 382 31 308 8 321 2 566 -3 790 -12 952 -16 735 Latvia* _ _ _ -550 -1 348 -2 401 -2 990 -4 002 -5 275 Lithuania (10) _ _ _ -824 -1 775 -2 692 -3 177 -4 022 -5 327 Luxembourg* _ _ _ _ _ -3 038 -3 260 -3 524 -3 912 Malta -400 -357 -776 -988 -863 -909 -1 144 -1 273 -1 356 Netherlands* -1 536 5 111 5 106 15 488 16 506 31 266 37 214 42 373 49 385 Norway 1 341 2 408 6 268 10 146 21 063 28 824 36 268 45 970 54 131 Poland* -2 225 313 2 389 -7 731 -16 659 -14 405 -13 778 -14 357 -17 380 Portugal* -4 459 -2 379 -8 402 -9 818 -15 474 -16 275 -19 222 -21 850 -24 254 Romania* -1 848 237 -1 410 -2 225 -2 915 -6 516 -9 432 -13 561 -20 294 Slovakia* _ _ _ -1 123 -2 015 -2 288 -2 415 -2 809 -2 789 Slovenia* _ _ _ -921 -1 272 -1 022 -1 196 -1 139 -1 161 Spain* -10 802 -6 278 -31 291 -13 931 -36 616 -55 826 -74 793 -95 624 -113 958 Sweden -1 283 3 145 3 697 14 299 14 340 18 636 20 086 20 649 18 939 Switzerland* -4 400 -3 584 -5 846 1 785 -1 188 5 442 5 339 5 951 7 194 United Kingdom* -6 158 -12 970 -36 535 -29 017 -60 739 -100 198 -115 398 -134 965 -154 128
Developed economies: Oceania -1 576 -3 589 -2 871 -6 533 -7 748 -17 902 -23 113 -21 361 -22 153
Australia* -1 573 -3 210 -3 278 -6 398 -7 079 -16 053 -19 984 -17 578 -18 006 New Zealand -3 -380 408 -134 -669 -1 849 -3 129 -3 784 -4 147
Region,country or territory
Trade balance - Balance commercialeMillions of dollars - Millions de dollars
1.3.1 Value of trade balance, and as percentage ofimports of countries and geographical regions
Sources:- Data in this table are based on trade figures in table 1.1.1.
Notes:
*(a)(b)
(1)(2)(3)(4)(5)(6)(7)(8)(9)(10)(11)(12)(13)(14)(15)(16)
Countries which use the Special Trade System as reporting system.Data refers to South Africa Customs Union (Botswana, Lesotho, Namibia, South Africa and Swaziland)Including Aruba
Trade with other member countries of CEMAC is excluded.Prior to 1986, included in Netherlands Antilles. Including exports and imports of crude oil and oil products. From 1990 onwards, trade statistics exclude certain oil and chemical products.Prior to 1986, including Aruba.Excluding imports of goods financed through foreign aid. Excluding military goods, fissionable materials, bunkers, ships and aircraft.Inter-trade between the States of Malaysia included. From 1965 onwards, excluding military imports and offshore installations of petroleum industry. Including trans-shipments to and from peninsular Malaysia.Excluding military goods, precious metals and goods procured in foreign ports.Prior to 1994, covers only trade with countries outside the CIS. Prior to 1998, data refer to the Federation of Bosnia and Herzegovina only. The other entity of Bosnia and Herzegovina, Republika Srpska, is not included. Prior to 1994, excluding trade with independent states resulting from the former USSR.From 1985 onwards, data are not comparable to those shown for prior periods due to revisions of the koruna-to-US dollar exchange rate. From 1995 onward, including goods for processing.Prior to 1988, excluding ships.Prior to 1996, excluding customs free zones.
44
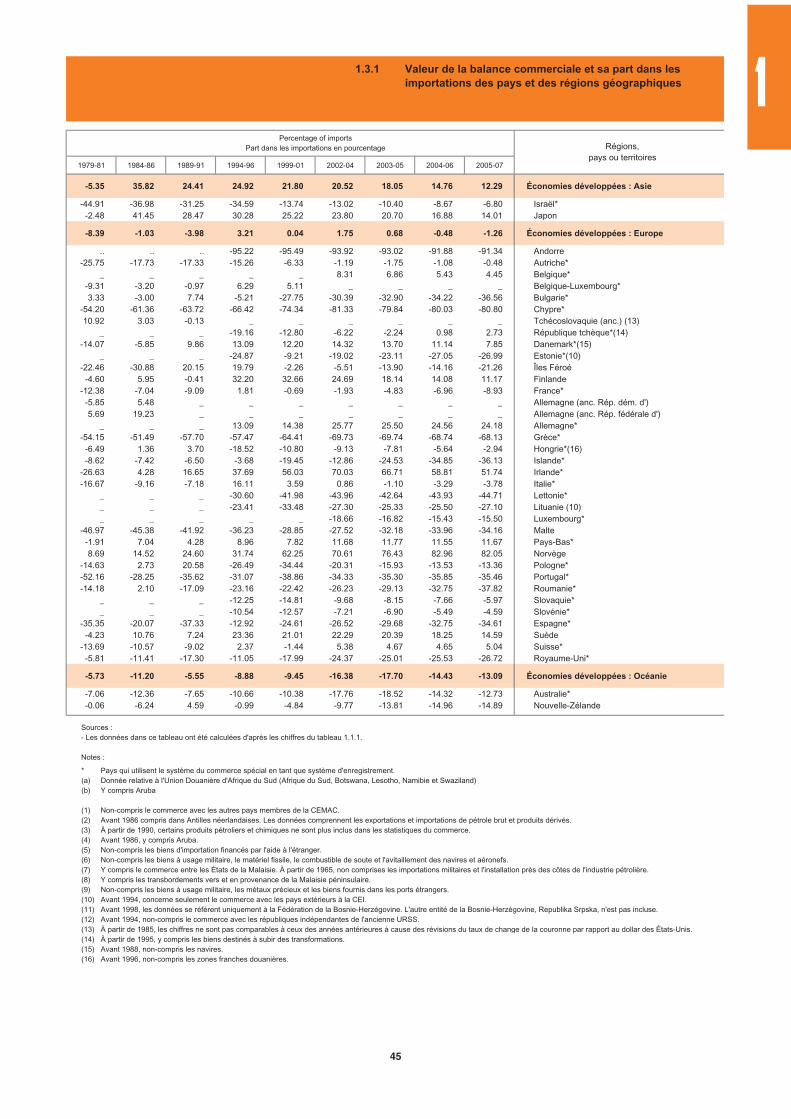
1979-81 1984-86 1989-91 1994-96 1999-01 2002-04 2003-05 2004-06 2005-07
-5.35 35.82 24.41 24.92 21.80 20.52 18.05 14.76 12.29 Économies développées : Asie
-44.91 -36.98 -31.25 -34.59 -13.74 -13.02 -10.40 -8.67 -6.80 Israël*-2.48 41.45 28.47 30.28 25.22 23.80 20.70 16.88 14.01 Japon
-8.39 -1.03 -3.98 3.21 0.04 1.75 0.68 -0.48 -1.26 Économies développées : Europe
.. .. .. -95.22 -95.49 -93.92 -93.02 -91.88 -91.34 Andorre-25.75 -17.73 -17.33 -15.26 -6.33 -1.19 -1.75 -1.08 -0.48 Autriche*
_ _ _ _ _ 8.31 6.86 5.43 4.45 Belgique*-9.31 -3.20 -0.97 6.29 5.11 _ _ _ _ Belgique-Luxembourg*3.33 -3.00 7.74 -5.21 -27.75 -30.39 -32.90 -34.22 -36.56 Bulgarie*
-54.20 -61.36 -63.72 -66.42 -74.34 -81.33 -79.84 -80.03 -80.80 Chypre*10.92 3.03 -0.13 _ _ _ _ _ _ Tchécoslovaquie (anc.) (13)
_ _ _ -19.16 -12.80 -6.22 -2.24 0.98 2.73 République tchèque*(14)-14.07 -5.85 9.86 13.09 12.20 14.32 13.70 11.14 7.85 Danemark*(15)
_ _ _ -24.87 -9.21 -19.02 -23.11 -27.05 -26.99 Estonie*(10)-22.46 -30.88 20.15 19.79 -2.26 -5.51 -13.90 -14.16 -21.26 Îles Féroé
-4.60 5.95 -0.41 32.20 32.66 24.69 18.14 14.08 11.17 Finlande-12.38 -7.04 -9.09 1.81 -0.69 -1.93 -4.83 -6.96 -8.93 France*
-5.85 5.48 _ _ _ _ _ _ _ Allemagne (anc. Rép. dém. d')5.69 19.23 _ _ _ _ _ _ _ Allemagne (anc. Rép. fédérale d')
_ _ _ 13.09 14.38 25.77 25.50 24.56 24.18 Allemagne*-54.15 -51.49 -57.70 -57.47 -64.41 -69.73 -69.74 -68.74 -68.13 Grèce*
-6.49 1.36 3.70 -18.52 -10.80 -9.13 -7.81 -5.64 -2.94 Hongrie*(16)-8.62 -7.42 -6.50 -3.68 -19.45 -12.86 -24.53 -34.85 -36.13 Islande*
-26.63 4.28 16.65 37.69 56.03 70.03 66.71 58.81 51.74 Irlande*-16.67 -9.16 -7.18 16.11 3.59 0.86 -1.10 -3.29 -3.78 Italie*
_ _ _ -30.60 -41.98 -43.96 -42.64 -43.93 -44.71 Lettonie*_ _ _ -23.41 -33.48 -27.30 -25.33 -25.50 -27.10 Lituanie (10)_ _ _ _ _ -18.66 -16.82 -15.43 -15.50 Luxembourg*
-46.97 -45.38 -41.92 -36.23 -28.85 -27.52 -32.18 -33.96 -34.16 Malte-1.91 7.04 4.28 8.96 7.82 11.68 11.77 11.55 11.67 Pays-Bas*8.69 14.52 24.60 31.74 62.25 70.61 76.43 82.96 82.05 Norvège
-14.63 2.73 20.58 -26.49 -34.44 -20.31 -15.93 -13.53 -13.36 Pologne*-52.16 -28.25 -35.62 -31.07 -38.86 -34.33 -35.30 -35.85 -35.46 Portugal*-14.18 2.10 -17.09 -23.16 -22.42 -26.23 -29.13 -32.75 -37.82 Roumanie*
_ _ _ -12.25 -14.81 -9.68 -8.15 -7.66 -5.97 Slovaquie*_ _ _ -10.54 -12.57 -7.21 -6.90 -5.49 -4.59 Slovénie*
-35.35 -20.07 -37.33 -12.92 -24.61 -26.52 -29.68 -32.75 -34.61 Espagne*-4.23 10.76 7.24 23.36 21.01 22.29 20.39 18.25 14.59 Suède
-13.69 -10.57 -9.02 2.37 -1.44 5.38 4.67 4.65 5.04 Suisse*-5.81 -11.41 -17.30 -11.05 -17.99 -24.37 -25.01 -25.53 -26.72 Royaume-Uni*
-5.73 -11.20 -5.55 -8.88 -9.45 -16.38 -17.70 -14.43 -13.09 Économies développées : Océanie
-7.06 -12.36 -7.65 -10.66 -10.38 -17.76 -18.52 -14.32 -12.73 Australie*-0.06 -6.24 4.59 -0.99 -4.84 -9.77 -13.81 -14.96 -14.89 Nouvelle-Zélande
Percentage of importsPart dans les importations en pourcentage Régions,
pays ou territoires
1.3.1 Valeur de la balance commerciale et sa part dans lesimportations des pays et des régions géographiques
Sources : - Les données dans ce tableau ont été calculées d'après les chiffres du tableau 1.1.1.
Notes :
*(a)(b)
(1)(2)(3)(4)(5)(6)(7)(8)(9)(10)(11)(12)(13)(14)(15)(16)
Pays qui utilisent le système du commerce spécial en tant que système d'enregistrement.Donnée relative à l'Union Douanière d'Afrique du Sud (Afrique du Sud, Botswana, Lesotho, Namibie et Swaziland)Y compris Aruba
Non-compris le commerce avec les autres pays membres de la CEMAC.Avant 1986 compris dans Antilles néerlandaises. Les données comprennent les exportations et importations de pétrole brut et produits dérivés.À partir de 1990, certains produits pétroliers et chimiques ne sont plus inclus dans les statistiques du commerce. Avant 1986, y compris Aruba.Non-compris les biens d'importation financés par l'aide à l'étranger. Non-compris les biens à usage militaire, le matériel fissile, le combustible de soute et l'avitaillement des navires et aéronefs.Y compris le commerce entre les États de la Malaisie. À partir de 1965, non comprises les importations militaires et l'installation près des côtes de l'industrie pétrolière. Y compris les transbordements vers et en provenance de la Malaisie péninsulaire. Non-compris les biens à usage militaire, les métaux précieux et les biens fournis dans les ports étrangers.Avant 1994, concerne seulement le commerce avec les pays extérieurs à la CEI. Avant 1998, les données se réfèrent uniquement à la Fédération de la Bosnie-Herzégovine. L'autre entité de la Bosnie-Herzégovine, Republika Srpska, n'est pas incluse. Avant 1994, non-compris le commerce avec les républiques indépendantes de l'ancienne URSS.À partir de 1985, les chiffres ne sont pas comparables à ceux des années antérieures à cause des révisions du taux de change de la couronne par rapport au dollar des États-Unis. À partir de 1995, y compris les biens destinés à subir des transformations.Avant 1988, non-compris les navires.Avant 1996, non-compris les zones franches douanières.
1
45
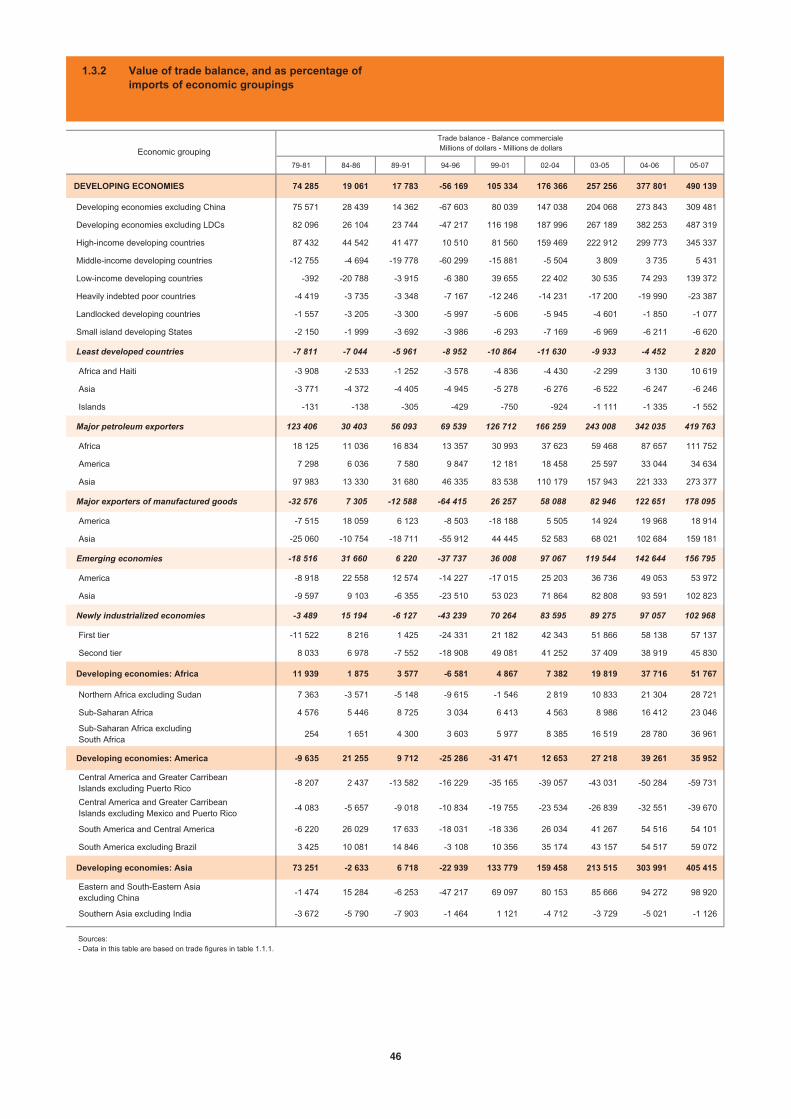
79-81 84-86 89-91 94-96 99-01 02-04 03-05 04-06 05-07
DEVELOPING ECONOMIES 74 285 19 061 17 783 -56 169 105 334 176 366 257 256 377 801 490 139
Developing economies excluding China 75 571 28 439 14 362 -67 603 80 039 147 038 204 068 273 843 309 481
Developing economies excluding LDCs 82 096 26 104 23 744 -47 217 116 198 187 996 267 189 382 253 487 319
High-income developing countries 87 432 44 542 41 477 10 510 81 560 159 469 222 912 299 773 345 337
Middle-income developing countries -12 755 -4 694 -19 778 -60 299 -15 881 -5 504 3 809 3 735 5 431
Low-income developing countries -392 -20 788 -3 915 -6 380 39 655 22 402 30 535 74 293 139 372
Heavily indebted poor countries -4 419 -3 735 -3 348 -7 167 -12 246 -14 231 -17 200 -19 990 -23 387
Landlocked developing countries -1 557 -3 205 -3 300 -5 997 -5 606 -5 945 -4 601 -1 850 -1 077
Small island developing States -2 150 -1 999 -3 692 -3 986 -6 293 -7 169 -6 969 -6 211 -6 620
Least developed countries -7 811 -7 044 -5 961 -8 952 -10 864 -11 630 -9 933 -4 452 2 820
Africa and Haiti -3 908 -2 533 -1 252 -3 578 -4 836 -4 430 -2 299 3 130 10 619
Asia -3 771 -4 372 -4 405 -4 945 -5 278 -6 276 -6 522 -6 247 -6 246
Islands -131 -138 -305 -429 -750 -924 -1 111 -1 335 -1 552
Major petroleum exporters 123 406 30 403 56 093 69 539 126 712 166 259 243 008 342 035 419 763
Africa 18 125 11 036 16 834 13 357 30 993 37 623 59 468 87 657 111 752
America 7 298 6 036 7 580 9 847 12 181 18 458 25 597 33 044 34 634
Asia 97 983 13 330 31 680 46 335 83 538 110 179 157 943 221 333 273 377
Major exporters of manufactured goods -32 576 7 305 -12 588 -64 415 26 257 58 088 82 946 122 651 178 095
America -7 515 18 059 6 123 -8 503 -18 188 5 505 14 924 19 968 18 914
Asia -25 060 -10 754 -18 711 -55 912 44 445 52 583 68 021 102 684 159 181
Emerging economies -18 516 31 660 6 220 -37 737 36 008 97 067 119 544 142 644 156 795
America -8 918 22 558 12 574 -14 227 -17 015 25 203 36 736 49 053 53 972
Asia -9 597 9 103 -6 355 -23 510 53 023 71 864 82 808 93 591 102 823
Newly industrialized economies -3 489 15 194 -6 127 -43 239 70 264 83 595 89 275 97 057 102 968
First tier -11 522 8 216 1 425 -24 331 21 182 42 343 51 866 58 138 57 137
Second tier 8 033 6 978 -7 552 -18 908 49 081 41 252 37 409 38 919 45 830
Developing economies: Africa 11 939 1 875 3 577 -6 581 4 867 7 382 19 819 37 716 51 767
Northern Africa excluding Sudan 7 363 -3 571 -5 148 -9 615 -1 546 2 819 10 833 21 304 28 721
Sub-Saharan Africa 4 576 5 446 8 725 3 034 6 413 4 563 8 986 16 412 23 046
Sub-Saharan Africa excluding South Africa
254 1 651 4 300 3 603 5 977 8 385 16 519 28 780 36 961
Developing economies: America -9 635 21 255 9 712 -25 286 -31 471 12 653 27 218 39 261 35 952
Central America and Greater Carribean Islands excluding Puerto Rico
-8 207 2 437 -13 582 -16 229 -35 165 -39 057 -43 031 -50 284 -59 731
Central America and Greater Carribean Islands excluding Mexico and Puerto Rico
-4 083 -5 657 -9 018 -10 834 -19 755 -23 534 -26 839 -32 551 -39 670
South America and Central America -6 220 26 029 17 633 -18 031 -18 336 26 034 41 267 54 516 54 101
South America excluding Brazil 3 425 10 081 14 846 -3 108 10 356 35 174 43 157 54 517 59 072
Developing economies: Asia 73 251 -2 633 6 718 -22 939 133 779 159 458 213 515 303 991 405 415
Eastern and South-Eastern Asia excluding China
-1 474 15 284 -6 253 -47 217 69 097 80 153 85 666 94 272 98 920
Southern Asia excluding India -3 672 -5 790 -7 903 -1 464 1 121 -4 712 -3 729 -5 021 -1 126
Trade balance - Balance commercialeMillions of dollars - Millions de dollarsEconomic grouping
1.3.2 Value of trade balance, and as percentage ofimports of economic groupings
Sources:- Data in this table are based on trade figures in table 1.1.1.
46
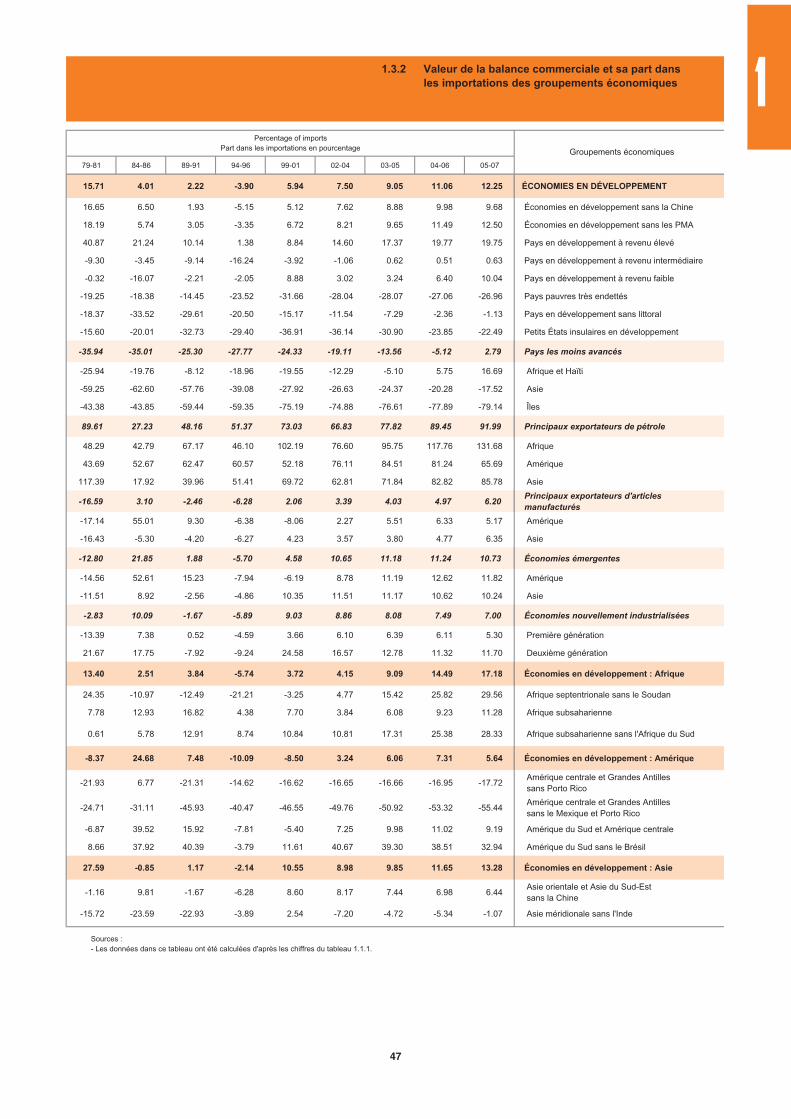
79-81 84-86 89-91 94-96 99-01 02-04 03-05 04-06 05-07
15.71 4.01 2.22 -3.90 5.94 7.50 9.05 11.06 12.25 ÉCONOMIES EN DÉVELOPPEMENT
16.65 6.50 1.93 -5.15 5.12 7.62 8.88 9.98 9.68 Économies en développement sans la Chine
18.19 5.74 3.05 -3.35 6.72 8.21 9.65 11.49 12.50 Économies en développement sans les PMA
40.87 21.24 10.14 1.38 8.84 14.60 17.37 19.77 19.75 Pays en développement à revenu élevé
-9.30 -3.45 -9.14 -16.24 -3.92 -1.06 0.62 0.51 0.63 Pays en développement à revenu intermédiaire
-0.32 -16.07 -2.21 -2.05 8.88 3.02 3.24 6.40 10.04 Pays en développement à revenu faible
-19.25 -18.38 -14.45 -23.52 -31.66 -28.04 -28.07 -27.06 -26.96 Pays pauvres très endettés
-18.37 -33.52 -29.61 -20.50 -15.17 -11.54 -7.29 -2.36 -1.13 Pays en développement sans littoral
-15.60 -20.01 -32.73 -29.40 -36.91 -36.14 -30.90 -23.85 -22.49 Petits États insulaires en développement
-35.94 -35.01 -25.30 -27.77 -24.33 -19.11 -13.56 -5.12 2.79 Pays les moins avancés
-25.94 -19.76 -8.12 -18.96 -19.55 -12.29 -5.10 5.75 16.69 Afrique et Haïti
-59.25 -62.60 -57.76 -39.08 -27.92 -26.63 -24.37 -20.28 -17.52 Asie
-43.38 -43.85 -59.44 -59.35 -75.19 -74.88 -76.61 -77.89 -79.14 Îles
89.61 27.23 48.16 51.37 73.03 66.83 77.82 89.45 91.99 Principaux exportateurs de pétrole
48.29 42.79 67.17 46.10 102.19 76.60 95.75 117.76 131.68 Afrique
43.69 52.67 62.47 60.57 52.18 76.11 84.51 81.24 65.69 Amérique
117.39 17.92 39.96 51.41 69.72 62.81 71.84 82.82 85.78 Asie
-16.59 3.10 -2.46 -6.28 2.06 3.39 4.03 4.97 6.20Principaux exportateurs d'articlesmanufacturés
-17.14 55.01 9.30 -6.38 -8.06 2.27 5.51 6.33 5.17 Amérique
-16.43 -5.30 -4.20 -6.27 4.23 3.57 3.80 4.77 6.35 Asie
-12.80 21.85 1.88 -5.70 4.58 10.65 11.18 11.24 10.73 Économies émergentes
-14.56 52.61 15.23 -7.94 -6.19 8.78 11.19 12.62 11.82 Amérique
-11.51 8.92 -2.56 -4.86 10.35 11.51 11.17 10.62 10.24 Asie
-2.83 10.09 -1.67 -5.89 9.03 8.86 8.08 7.49 7.00 Économies nouvellement industrialisées
-13.39 7.38 0.52 -4.59 3.66 6.10 6.39 6.11 5.30 Première génération
21.67 17.75 -7.92 -9.24 24.58 16.57 12.78 11.32 11.70 Deuxième génération
13.40 2.51 3.84 -5.74 3.72 4.15 9.09 14.49 17.18 Économies en développement : Afrique
24.35 -10.97 -12.49 -21.21 -3.25 4.77 15.42 25.82 29.56 Afrique septentrionale sans le Soudan
7.78 12.93 16.82 4.38 7.70 3.84 6.08 9.23 11.28 Afrique subsaharienne
0.61 5.78 12.91 8.74 10.84 10.81 17.31 25.38 28.33 Afrique subsaharienne sans l'Afrique du Sud
-8.37 24.68 7.48 -10.09 -8.50 3.24 6.06 7.31 5.64 Économies en développement : Amérique
-21.93 6.77 -21.31 -14.62 -16.62 -16.65 -16.66 -16.95 -17.72 Amérique centrale et Grandes Antilles sans Porto Rico
-24.71 -31.11 -45.93 -40.47 -46.55 -49.76 -50.92 -53.32 -55.44 Amérique centrale et Grandes Antilles sans le Mexique et Porto Rico
-6.87 39.52 15.92 -7.81 -5.40 7.25 9.98 11.02 9.19 Amérique du Sud et Amérique centrale
8.66 37.92 40.39 -3.79 11.61 40.67 39.30 38.51 32.94 Amérique du Sud sans le Brésil
27.59 -0.85 1.17 -2.14 10.55 8.98 9.85 11.65 13.28 Économies en développement : Asie
-1.16 9.81 -1.67 -6.28 8.60 8.17 7.44 6.98 6.44 Asie orientale et Asie du Sud-Est sans la Chine
-15.72 -23.59 -22.93 -3.89 2.54 -7.20 -4.72 -5.34 -1.07 Asie méridionale sans l'Inde
Groupements économiques
Percentage of importsPart dans les importations en pourcentage
1.3.2 Valeur de la balance commerciale et sa part dansles importations des groupements économiques
Sources : - Les données dans ce tableau ont été calculées d'après les chiffres du tableau 1.1.1.
1
47
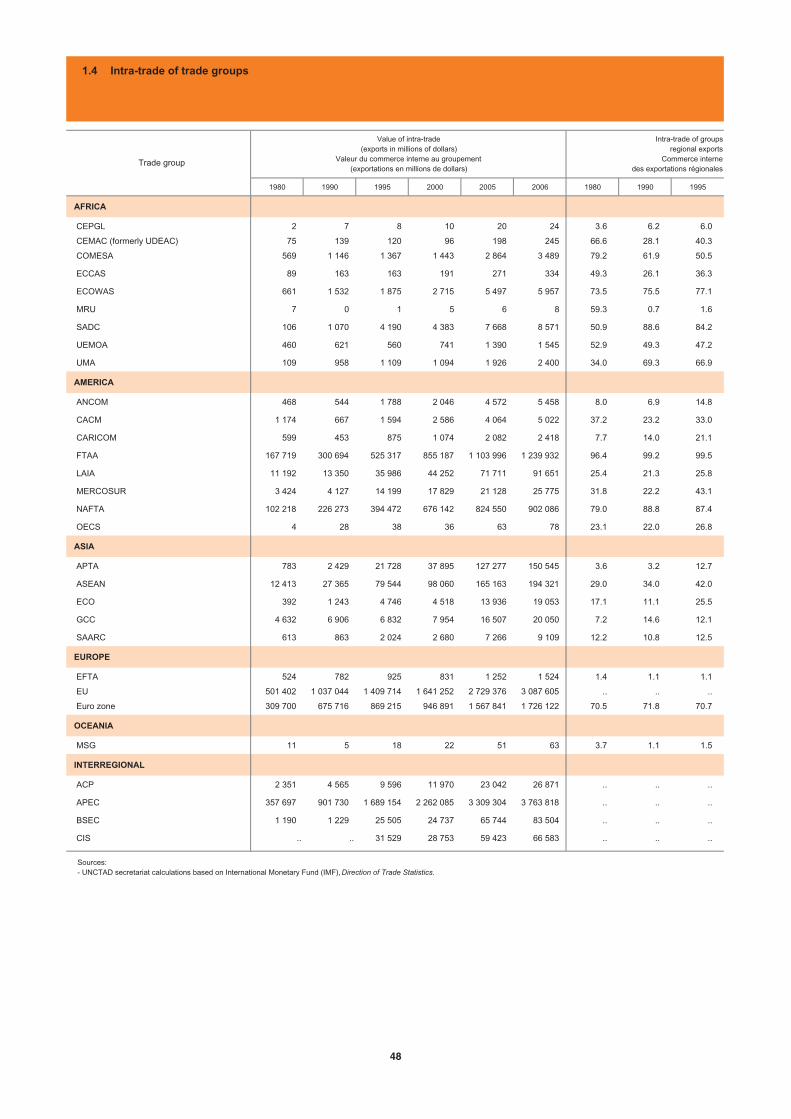
1980 1990 1995 2000 2005 2006 1980 1990 1995
AFRICA
CEPGL 2 7 8 10 20 24 3.6 6.2 6.0
CEMAC (formerly UDEAC) 75 139 120 96 198 245 66.6 28.1 40.3
COMESA 569 1 146 1 367 1 443 2 864 3 489 79.2 61.9 50.5
ECCAS 89 163 163 191 271 334 49.3 26.1 36.3
ECOWAS 661 1 532 1 875 2 715 5 497 5 957 73.5 75.5 77.1
MRU 7 0 1 5 6 8 59.3 0.7 1.6
SADC 106 1 070 4 190 4 383 7 668 8 571 50.9 88.6 84.2
UEMOA 460 621 560 741 1 390 1 545 52.9 49.3 47.2
UMA 109 958 1 109 1 094 1 926 2 400 34.0 69.3 66.9
AMERICA
ANCOM 468 544 1 788 2 046 4 572 5 458 8.0 6.9 14.8
CACM 1 174 667 1 594 2 586 4 064 5 022 37.2 23.2 33.0
CARICOM 599 453 875 1 074 2 082 2 418 7.7 14.0 21.1
FTAA 167 719 300 694 525 317 855 187 1 103 996 1 239 932 96.4 99.2 99.5
LAIA 11 192 13 350 35 986 44 252 71 711 91 651 25.4 21.3 25.8
MERCOSUR 3 424 4 127 14 199 17 829 21 128 25 775 31.8 22.2 43.1
NAFTA 102 218 226 273 394 472 676 142 824 550 902 086 79.0 88.8 87.4
OECS 4 28 38 36 63 78 23.1 22.0 26.8
ASIA
APTA 783 2 429 21 728 37 895 127 277 150 545 3.6 3.2 12.7
ASEAN 12 413 27 365 79 544 98 060 165 163 194 321 29.0 34.0 42.0
ECO 392 1 243 4 746 4 518 13 936 19 053 17.1 11.1 25.5
GCC 4 632 6 906 6 832 7 954 16 507 20 050 7.2 14.6 12.1
SAARC 613 863 2 024 2 680 7 266 9 109 12.2 10.8 12.5
EUROPE
EFTA 524 782 925 831 1 252 1 524 1.4 1.1 1.1
EU 501 402 1 037 044 1 409 714 1 641 252 2 729 376 3 087 605 .. .. ..
Euro zone 309 700 675 716 869 215 946 891 1 567 841 1 726 122 70.5 71.8 70.7
OCEANIA
MSG 11 5 18 22 51 63 3.7 1.1 1.5
INTERREGIONAL
ACP 2 351 4 565 9 596 11 970 23 042 26 871 .. .. ..
APEC 357 697 901 730 1 689 154 2 262 085 3 309 304 3 763 818 .. .. ..
BSEC 1 190 1 229 25 505 24 737 65 744 83 504 .. .. ..
CIS .. .. 31 529 28 753 59 423 66 583 .. .. ..
Trade group
Intra-trade of groupsregional exports
Commerce internedes exportations régionales
Value of intra-trade (exports in millions of dollars)
Valeur du commerce interne au groupement(exportations en millions de dollars)
1.4 Intra-trade of trade groups
Sources:- UNCTAD secretariat calculations based on International Monetary Fund (IMF), Direction of Trade Statistics.
48
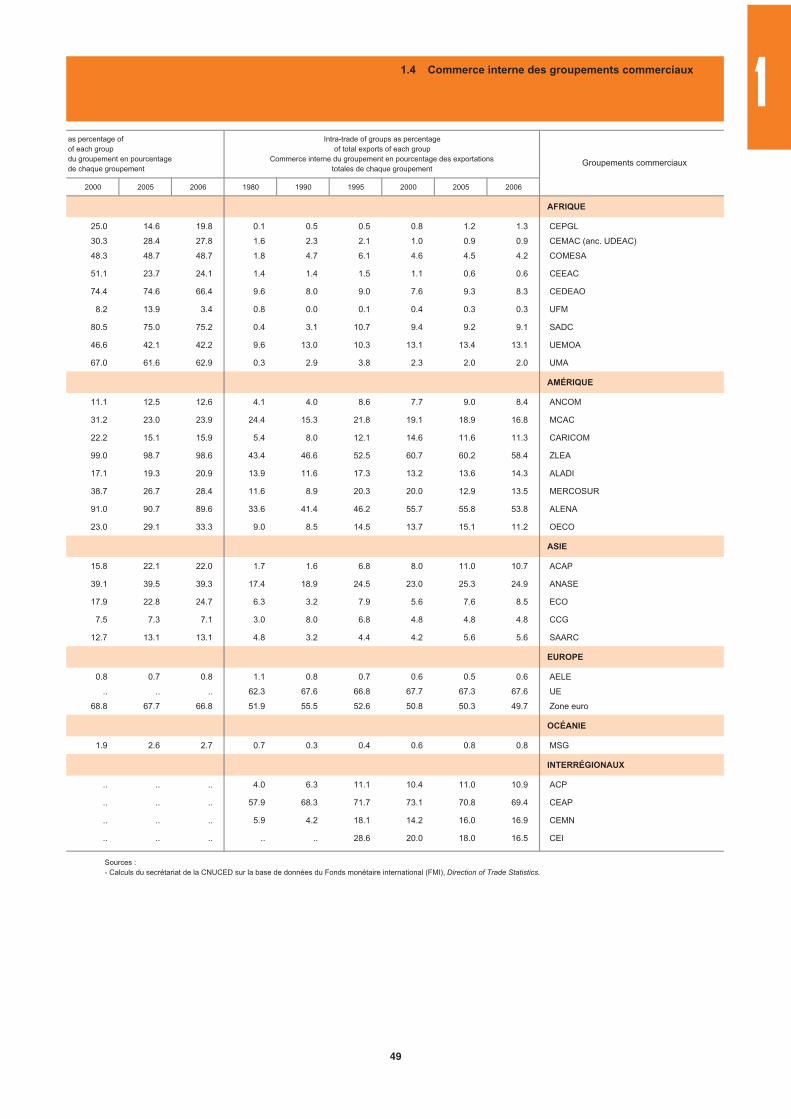
2000 2005 2006 1980 1990 1995 2000 2005 2006
AFRIQUE
25.0 14.6 19.8 0.1 0.5 0.5 0.8 1.2 1.3 CEPGL
30.3 28.4 27.8 1.6 2.3 2.1 1.0 0.9 0.9 CEMAC (anc. UDEAC)
48.3 48.7 48.7 1.8 4.7 6.1 4.6 4.5 4.2 COMESA
51.1 23.7 24.1 1.4 1.4 1.5 1.1 0.6 0.6 CEEAC
74.4 74.6 66.4 9.6 8.0 9.0 7.6 9.3 8.3 CEDEAO
8.2 13.9 3.4 0.8 0.0 0.1 0.4 0.3 0.3 UFM
80.5 75.0 75.2 0.4 3.1 10.7 9.4 9.2 9.1 SADC
46.6 42.1 42.2 9.6 13.0 10.3 13.1 13.4 13.1 UEMOA
67.0 61.6 62.9 0.3 2.9 3.8 2.3 2.0 2.0 UMA
AMÉRIQUE
11.1 12.5 12.6 4.1 4.0 8.6 7.7 9.0 8.4 ANCOM
31.2 23.0 23.9 24.4 15.3 21.8 19.1 18.9 16.8 MCAC
22.2 15.1 15.9 5.4 8.0 12.1 14.6 11.6 11.3 CARICOM
99.0 98.7 98.6 43.4 46.6 52.5 60.7 60.2 58.4 ZLEA
17.1 19.3 20.9 13.9 11.6 17.3 13.2 13.6 14.3 ALADI
38.7 26.7 28.4 11.6 8.9 20.3 20.0 12.9 13.5 MERCOSUR
91.0 90.7 89.6 33.6 41.4 46.2 55.7 55.8 53.8 ALENA
23.0 29.1 33.3 9.0 8.5 14.5 13.7 15.1 11.2 OECO
ASIE
15.8 22.1 22.0 1.7 1.6 6.8 8.0 11.0 10.7 ACAP
39.1 39.5 39.3 17.4 18.9 24.5 23.0 25.3 24.9 ANASE
17.9 22.8 24.7 6.3 3.2 7.9 5.6 7.6 8.5 ECO
7.5 7.3 7.1 3.0 8.0 6.8 4.8 4.8 4.8 CCG
12.7 13.1 13.1 4.8 3.2 4.4 4.2 5.6 5.6 SAARC
EUROPE
0.8 0.7 0.8 1.1 0.8 0.7 0.6 0.5 0.6 AELE
.. .. .. 62.3 67.6 66.8 67.7 67.3 67.6 UE
68.8 67.7 66.8 51.9 55.5 52.6 50.8 50.3 49.7 Zone euro
OCÉANIE
1.9 2.6 2.7 0.7 0.3 0.4 0.6 0.8 0.8 MSG
INTERRÉGIONAUX
.. .. .. 4.0 6.3 11.1 10.4 11.0 10.9 ACP
.. .. .. 57.9 68.3 71.7 73.1 70.8 69.4 CEAP
.. .. .. 5.9 4.2 18.1 14.2 16.0 16.9 CEMN
.. .. .. .. .. 28.6 20.0 18.0 16.5 CEI
Groupements commerciaux
Intra-trade of groups as percentageof total exports of each group
Commerce interne du groupement en pourcentage des exportationstotales de chaque groupement
as percentage ofof each groupdu groupement en pourcentagede chaque groupement
1.4 Commerce interne des groupements commerciaux
Sources : - Calculs du secrétariat de la CNUCED sur la base de données du Fonds monétaire international (FMI), Direction of Trade Statistics.
1
49

MARCHANDISES
MERCHANDISE
1
2
3
4
5
6
7
8
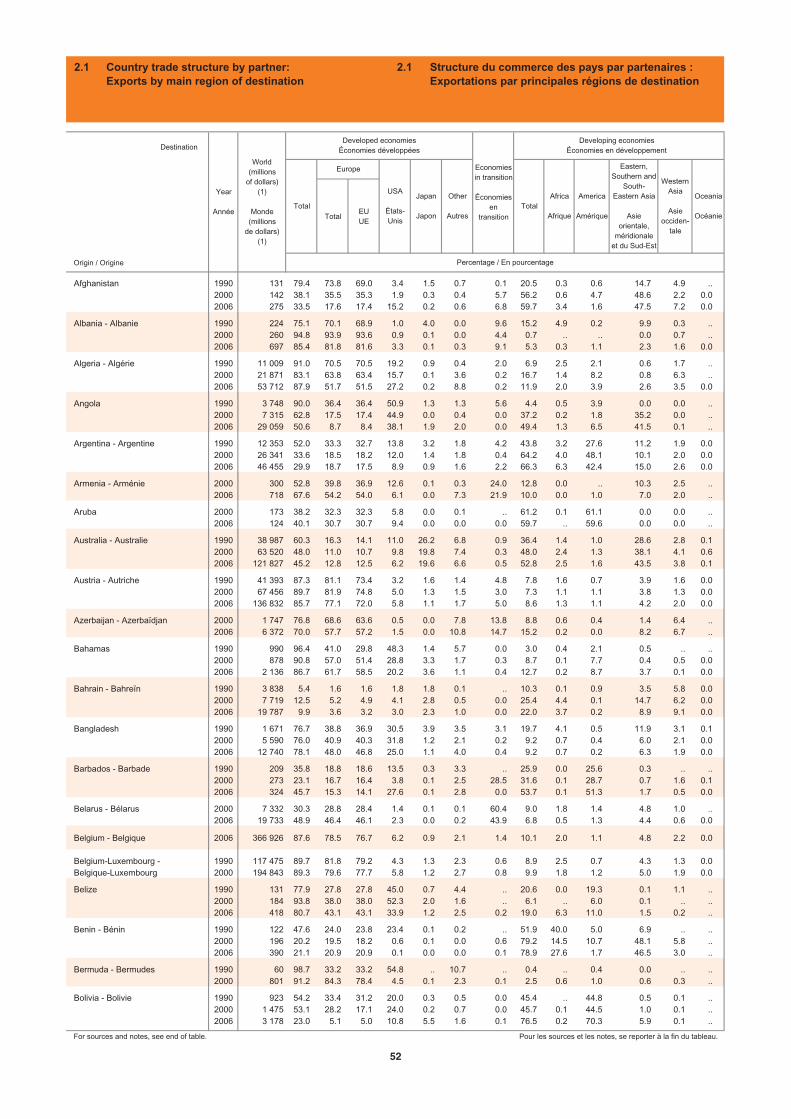
TotalEUUE
Origin / Origine
Afghanistan 1990 131 79.4 73.8 69.0 3.4 1.5 0.7 0.1 20.5 0.3 0.6 14.7 4.9 ..2000 142 38.1 35.5 35.3 1.9 0.3 0.4 5.7 56.2 0.6 4.7 48.6 2.2 0.02006 275 33.5 17.6 17.4 15.2 0.2 0.6 6.8 59.7 3.4 1.6 47.5 7.2 0.0
Albania - Albanie 1990 224 75.1 70.1 68.9 1.0 4.0 0.0 9.6 15.2 4.9 0.2 9.9 0.3 ..2000 260 94.8 93.9 93.6 0.9 0.1 0.0 4.4 0.7 .. .. 0.0 0.7 ..2006 697 85.4 81.8 81.6 3.3 0.1 0.3 9.1 5.3 0.3 1.1 2.3 1.6 0.0
Algeria - Algérie 1990 11 009 91.0 70.5 70.5 19.2 0.9 0.4 2.0 6.9 2.5 2.1 0.6 1.7 ..2000 21 871 83.1 63.8 63.4 15.7 0.1 3.6 0.2 16.7 1.4 8.2 0.8 6.3 ..2006 53 712 87.9 51.7 51.5 27.2 0.2 8.8 0.2 11.9 2.0 3.9 2.6 3.5 0.0
Angola 1990 3 748 90.0 36.4 36.4 50.9 1.3 1.3 5.6 4.4 0.5 3.9 0.0 0.0 ..2000 7 315 62.8 17.5 17.4 44.9 0.0 0.4 0.0 37.2 0.2 1.8 35.2 0.0 ..2006 29 059 50.6 8.7 8.4 38.1 1.9 2.0 0.0 49.4 1.3 6.5 41.5 0.1 ..
Argentina - Argentine 1990 12 353 52.0 33.3 32.7 13.8 3.2 1.8 4.2 43.8 3.2 27.6 11.2 1.9 0.02000 26 341 33.6 18.5 18.2 12.0 1.4 1.8 0.4 64.2 4.0 48.1 10.1 2.0 0.02006 46 455 29.9 18.7 17.5 8.9 0.9 1.6 2.2 66.3 6.3 42.4 15.0 2.6 0.0
Armenia - Arménie 2000 300 52.8 39.8 36.9 12.6 0.1 0.3 24.0 12.8 0.0 .. 10.3 2.5 ..2006 718 67.6 54.2 54.0 6.1 0.0 7.3 21.9 10.0 0.0 1.0 7.0 2.0 ..
Aruba 2000 173 38.2 32.3 32.3 5.8 0.0 0.1 .. 61.2 0.1 61.1 0.0 0.0 ..2006 124 40.1 30.7 30.7 9.4 0.0 0.0 0.0 59.7 .. 59.6 0.0 0.0 ..
Australia - Australie 1990 38 987 60.3 16.3 14.1 11.0 26.2 6.8 0.9 36.4 1.4 1.0 28.6 2.8 0.12000 63 520 48.0 11.0 10.7 9.8 19.8 7.4 0.3 48.0 2.4 1.3 38.1 4.1 0.62006 121 827 45.2 12.8 12.5 6.2 19.6 6.6 0.5 52.8 2.5 1.6 43.5 3.8 0.1
Austria - Autriche 1990 41 393 87.3 81.1 73.4 3.2 1.6 1.4 4.8 7.8 1.6 0.7 3.9 1.6 0.02000 67 456 89.7 81.9 74.8 5.0 1.3 1.5 3.0 7.3 1.1 1.1 3.8 1.3 0.02006 136 832 85.7 77.1 72.0 5.8 1.1 1.7 5.0 8.6 1.3 1.1 4.2 2.0 0.0
Azerbaijan - Azerbaïdjan 2000 1 747 76.8 68.6 63.6 0.5 0.0 7.8 13.8 8.8 0.6 0.4 1.4 6.4 ..2006 6 372 70.0 57.7 57.2 1.5 0.0 10.8 14.7 15.2 0.2 0.0 8.2 6.7 ..
Bahamas 1990 990 96.4 41.0 29.8 48.3 1.4 5.7 0.0 3.0 0.4 2.1 0.5 .. ..2000 878 90.8 57.0 51.4 28.8 3.3 1.7 0.3 8.7 0.1 7.7 0.4 0.5 0.02006 2 136 86.7 61.7 58.5 20.2 3.6 1.1 0.4 12.7 0.2 8.7 3.7 0.1 0.0
Bahrain - Bahreïn 1990 3 838 5.4 1.6 1.6 1.8 1.8 0.1 .. 10.3 0.1 0.9 3.5 5.8 0.02000 7 719 12.5 5.2 4.9 4.1 2.8 0.5 0.0 25.4 4.4 0.1 14.7 6.2 0.02006 19 787 9.9 3.6 3.2 3.0 2.3 1.0 0.0 22.0 3.7 0.2 8.9 9.1 0.0
Bangladesh 1990 1 671 76.7 38.8 36.9 30.5 3.9 3.5 3.1 19.7 4.1 0.5 11.9 3.1 0.12000 5 590 76.0 40.9 40.3 31.8 1.2 2.1 0.2 9.2 0.7 0.4 6.0 2.1 0.02006 12 740 78.1 48.0 46.8 25.0 1.1 4.0 0.4 9.2 0.7 0.2 6.3 1.9 0.0
Barbados - Barbade 1990 209 35.8 18.8 18.6 13.5 0.3 3.3 .. 25.9 0.0 25.6 0.3 .. ..2000 273 23.1 16.7 16.4 3.8 0.1 2.5 28.5 31.6 0.1 28.7 0.7 1.6 0.12006 324 45.7 15.3 14.1 27.6 0.1 2.8 0.0 53.7 0.1 51.3 1.7 0.5 0.0
Belarus - Bélarus 2000 7 332 30.3 28.8 28.4 1.4 0.1 0.1 60.4 9.0 1.8 1.4 4.8 1.0 ..2006 19 733 48.9 46.4 46.1 2.3 0.0 0.2 43.9 6.8 0.5 1.3 4.4 0.6 0.0
Belgium - Belgique 2006 366 926 87.6 78.5 76.7 6.2 0.9 2.1 1.4 10.1 2.0 1.1 4.8 2.2 0.0
Belgium-Luxembourg - 1990 117 475 89.7 81.8 79.2 4.3 1.3 2.3 0.6 8.9 2.5 0.7 4.3 1.3 0.0Belgique-Luxembourg 2000 194 843 89.3 79.6 77.7 5.8 1.2 2.7 0.8 9.9 1.8 1.2 5.0 1.9 0.0
Belize 1990 131 77.9 27.8 27.8 45.0 0.7 4.4 .. 20.6 0.0 19.3 0.1 1.1 ..2000 184 93.8 38.0 38.0 52.3 2.0 1.6 .. 6.1 .. 6.0 0.1 .. ..2006 418 80.7 43.1 43.1 33.9 1.2 2.5 0.2 19.0 6.3 11.0 1.5 0.2 ..
Benin - Bénin 1990 122 47.6 24.0 23.8 23.4 0.1 0.2 .. 51.9 40.0 5.0 6.9 .. ..2000 196 20.2 19.5 18.2 0.6 0.1 0.0 0.6 79.2 14.5 10.7 48.1 5.8 ..2006 390 21.1 20.9 20.9 0.1 0.0 0.0 0.1 78.9 27.6 1.7 46.5 3.0 ..
Bermuda - Bermudes 1990 60 98.7 33.2 33.2 54.8 .. 10.7 .. 0.4 .. 0.4 0.0 .. ..2000 801 91.2 84.3 78.4 4.5 0.1 2.3 0.1 2.5 0.6 1.0 0.6 0.3 ..
Bolivia - Bolivie 1990 923 54.2 33.4 31.2 20.0 0.3 0.5 0.0 45.4 .. 44.8 0.5 0.1 ..2000 1 475 53.1 28.2 17.1 24.0 0.2 0.7 0.0 45.7 0.1 44.5 1.0 0.1 ..2006 3 178 23.0 5.1 5.0 10.8 5.5 1.6 0.1 76.5 0.2 70.3 5.9 0.1 ..
For sources and notes, see end of table. Pour les sources et les notes, se reporter à la fin du tableau.
WesternAsia
Asieocciden-
tale
Oceania
Océanie
America
Amérique
Percentage / En pourcentage
Economiesin transition
Économiesen
transition
Europe
Developing economiesÉconomies en développement
USA
États-Unis
World(millions
of dollars)(1)
Monde(millions
de dollars)(1)
Year
AnnéeTotal
Africa
Afrique
Eastern,Southern and
South-Eastern Asia
Asieorientale,
méridionaleet du Sud-Est
Developed economiesÉconomies développéesDestination
TotalJapan
Japon
Other
Autres
2.1 Country trade structure by partner:Exports by main region of destination
2.1 Structure du commerce des pays par partenaires :Exportations par principales régions de destination
52
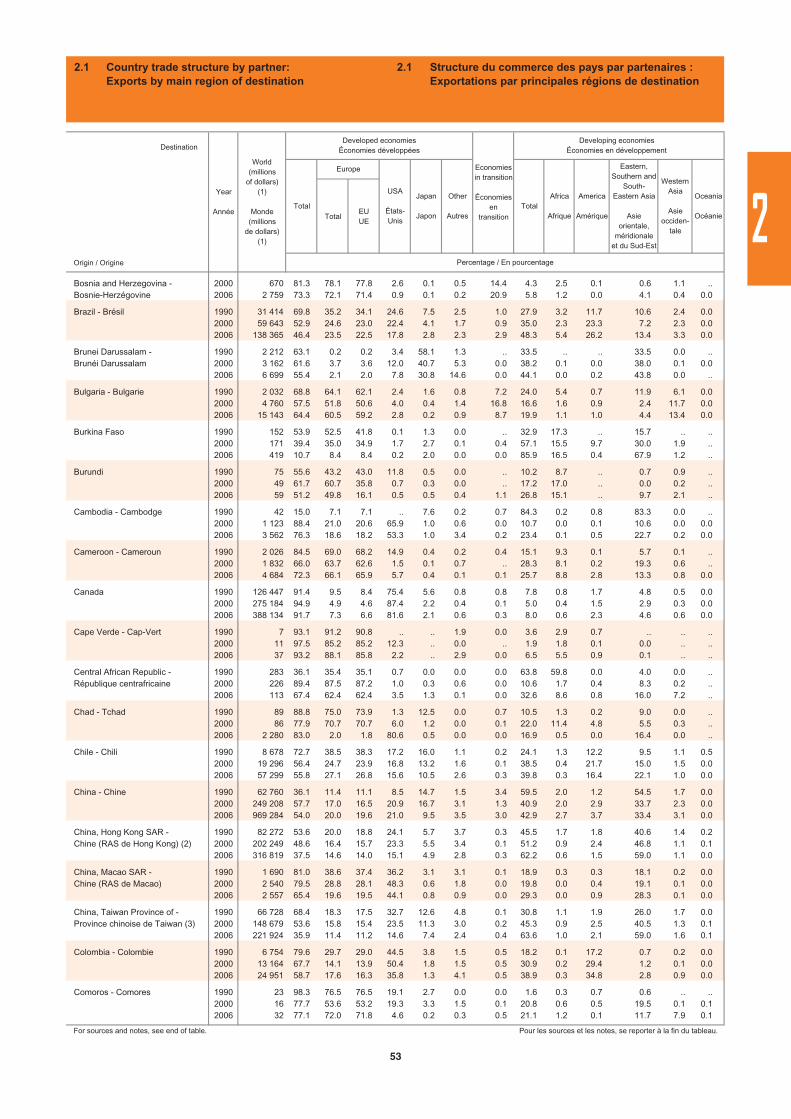
TotalEUUE
Origin / Origine
Bosnia and Herzegovina - 2000 670 81.3 78.1 77.8 2.6 0.1 0.5 14.4 4.3 2.5 0.1 0.6 1.1 ..Bosnie-Herzégovine 2006 2 759 73.3 72.1 71.4 0.9 0.1 0.2 20.9 5.8 1.2 0.0 4.1 0.4 0.0
Brazil - Brésil 1990 31 414 69.8 35.2 34.1 24.6 7.5 2.5 1.0 27.9 3.2 11.7 10.6 2.4 0.02000 59 643 52.9 24.6 23.0 22.4 4.1 1.7 0.9 35.0 2.3 23.3 7.2 2.3 0.02006 138 365 46.4 23.5 22.5 17.8 2.8 2.3 2.9 48.3 5.4 26.2 13.4 3.3 0.0
Brunei Darussalam - 1990 2 212 63.1 0.2 0.2 3.4 58.1 1.3 .. 33.5 .. .. 33.5 0.0 ..Brunéi Darussalam 2000 3 162 61.6 3.7 3.6 12.0 40.7 5.3 0.0 38.2 0.1 0.0 38.0 0.1 0.0
2006 6 699 55.4 2.1 2.0 7.8 30.8 14.6 0.0 44.1 0.0 0.2 43.8 0.0 ..
Bulgaria - Bulgarie 1990 2 032 68.8 64.1 62.1 2.4 1.6 0.8 7.2 24.0 5.4 0.7 11.9 6.1 0.02000 4 760 57.5 51.8 50.6 4.0 0.4 1.4 16.8 16.6 1.6 0.9 2.4 11.7 0.02006 15 143 64.4 60.5 59.2 2.8 0.2 0.9 8.7 19.9 1.1 1.0 4.4 13.4 0.0
Burkina Faso 1990 152 53.9 52.5 41.8 0.1 1.3 0.0 .. 32.9 17.3 .. 15.7 .. ..2000 171 39.4 35.0 34.9 1.7 2.7 0.1 0.4 57.1 15.5 9.7 30.0 1.9 ..2006 419 10.7 8.4 8.4 0.2 2.0 0.0 0.0 85.9 16.5 0.4 67.9 1.2 ..
Burundi 1990 75 55.6 43.2 43.0 11.8 0.5 0.0 .. 10.2 8.7 .. 0.7 0.9 ..2000 49 61.7 60.7 35.8 0.7 0.3 0.0 .. 17.2 17.0 .. 0.0 0.2 ..2006 59 51.2 49.8 16.1 0.5 0.5 0.4 1.1 26.8 15.1 .. 9.7 2.1 ..
Cambodia - Cambodge 1990 42 15.0 7.1 7.1 .. 7.6 0.2 0.7 84.3 0.2 0.8 83.3 0.0 ..2000 1 123 88.4 21.0 20.6 65.9 1.0 0.6 0.0 10.7 0.0 0.1 10.6 0.0 0.02006 3 562 76.3 18.6 18.2 53.3 1.0 3.4 0.2 23.4 0.1 0.5 22.7 0.2 0.0
Cameroon - Cameroun 1990 2 026 84.5 69.0 68.2 14.9 0.4 0.2 0.4 15.1 9.3 0.1 5.7 0.1 ..2000 1 832 66.0 63.7 62.6 1.5 0.1 0.7 .. 28.3 8.1 0.2 19.3 0.6 ..2006 4 684 72.3 66.1 65.9 5.7 0.4 0.1 0.1 25.7 8.8 2.8 13.3 0.8 0.0
Canada 1990 126 447 91.4 9.5 8.4 75.4 5.6 0.8 0.8 7.8 0.8 1.7 4.8 0.5 0.02000 275 184 94.9 4.9 4.6 87.4 2.2 0.4 0.1 5.0 0.4 1.5 2.9 0.3 0.02006 388 134 91.7 7.3 6.6 81.6 2.1 0.6 0.3 8.0 0.6 2.3 4.6 0.6 0.0
Cape Verde - Cap-Vert 1990 7 93.1 91.2 90.8 .. .. 1.9 0.0 3.6 2.9 0.7 .. .. ..2000 11 97.5 85.2 85.2 12.3 .. 0.0 .. 1.9 1.8 0.1 0.0 .. ..2006 37 93.2 88.1 85.8 2.2 .. 2.9 0.0 6.5 5.5 0.9 0.1 .. ..
Central African Republic - 1990 283 36.1 35.4 35.1 0.7 0.0 0.0 0.0 63.8 59.8 0.0 4.0 0.0 ..République centrafricaine 2000 226 89.4 87.5 87.2 1.0 0.3 0.6 0.0 10.6 1.7 0.4 8.3 0.2 ..
2006 113 67.4 62.4 62.4 3.5 1.3 0.1 0.0 32.6 8.6 0.8 16.0 7.2 ..
Chad - Tchad 1990 89 88.8 75.0 73.9 1.3 12.5 0.0 0.7 10.5 1.3 0.2 9.0 0.0 ..2000 86 77.9 70.7 70.7 6.0 1.2 0.0 0.1 22.0 11.4 4.8 5.5 0.3 ..2006 2 280 83.0 2.0 1.8 80.6 0.5 0.0 0.0 16.9 0.5 0.0 16.4 0.0 ..
Chile - Chili 1990 8 678 72.7 38.5 38.3 17.2 16.0 1.1 0.2 24.1 1.3 12.2 9.5 1.1 0.52000 19 296 56.4 24.7 23.9 16.8 13.2 1.6 0.1 38.5 0.4 21.7 15.0 1.5 0.02006 57 299 55.8 27.1 26.8 15.6 10.5 2.6 0.3 39.8 0.3 16.4 22.1 1.0 0.0
China - Chine 1990 62 760 36.1 11.4 11.1 8.5 14.7 1.5 3.4 59.5 2.0 1.2 54.5 1.7 0.02000 249 208 57.7 17.0 16.5 20.9 16.7 3.1 1.3 40.9 2.0 2.9 33.7 2.3 0.02006 969 284 54.0 20.0 19.6 21.0 9.5 3.5 3.0 42.9 2.7 3.7 33.4 3.1 0.0
China, Hong Kong SAR - 1990 82 272 53.6 20.0 18.8 24.1 5.7 3.7 0.3 45.5 1.7 1.8 40.6 1.4 0.2Chine (RAS de Hong Kong) (2) 2000 202 249 48.6 16.4 15.7 23.3 5.5 3.4 0.1 51.2 0.9 2.4 46.8 1.1 0.1
2006 316 819 37.5 14.6 14.0 15.1 4.9 2.8 0.3 62.2 0.6 1.5 59.0 1.1 0.0
China, Macao SAR - 1990 1 690 81.0 38.6 37.4 36.2 3.1 3.1 0.1 18.9 0.3 0.3 18.1 0.2 0.0Chine (RAS de Macao) 2000 2 540 79.5 28.8 28.1 48.3 0.6 1.8 0.0 19.8 0.0 0.4 19.1 0.1 0.0
2006 2 557 65.4 19.6 19.5 44.1 0.8 0.9 0.0 29.3 0.0 0.9 28.3 0.1 0.0
China, Taiwan Province of - 1990 66 728 68.4 18.3 17.5 32.7 12.6 4.8 0.1 30.8 1.1 1.9 26.0 1.7 0.0Province chinoise de Taiwan (3) 2000 148 679 53.6 15.8 15.4 23.5 11.3 3.0 0.2 45.3 0.9 2.5 40.5 1.3 0.1
2006 221 924 35.9 11.4 11.2 14.6 7.4 2.4 0.4 63.6 1.0 2.1 59.0 1.6 0.1
Colombia - Colombie 1990 6 754 79.6 29.7 29.0 44.5 3.8 1.5 0.5 18.2 0.1 17.2 0.7 0.2 0.02000 13 164 67.7 14.1 13.9 50.4 1.8 1.5 0.5 30.9 0.2 29.4 1.2 0.1 0.02006 24 951 58.7 17.6 16.3 35.8 1.3 4.1 0.5 38.9 0.3 34.8 2.8 0.9 0.0
Comoros - Comores 1990 23 98.3 76.5 76.5 19.1 2.7 0.0 0.0 1.6 0.3 0.7 0.6 .. ..2000 16 77.7 53.6 53.2 19.3 3.3 1.5 0.1 20.8 0.6 0.5 19.5 0.1 0.12006 32 77.1 72.0 71.8 4.6 0.2 0.3 0.5 21.1 1.2 0.1 11.7 7.9 0.1
For sources and notes, see end of table. Pour les sources et les notes, se reporter à la fin du tableau.
Europe
Other
Autres
Destination
Year
Année
World(millions
of dollars)(1)
Monde(millions
de dollars)(1)
Developed economiesÉconomies développées
Economiesin transition
Économiesen
transition
Developing economiesÉconomies en développement
Oceania
OcéanieTotal
Percentage / En pourcentage
Africa
Afrique
America
Amérique
Eastern,Southern and
South-Eastern Asia
Asieorientale,
méridionaleet du Sud-Est
WesternAsia
Asieocciden-
tale
USA
États-Unis
Japan
JaponTotal
2.1 Country trade structure by partner:Exports by main region of destination
2.1 Structure du commerce des pays par partenaires :Exportations par principales régions de destination
2
53
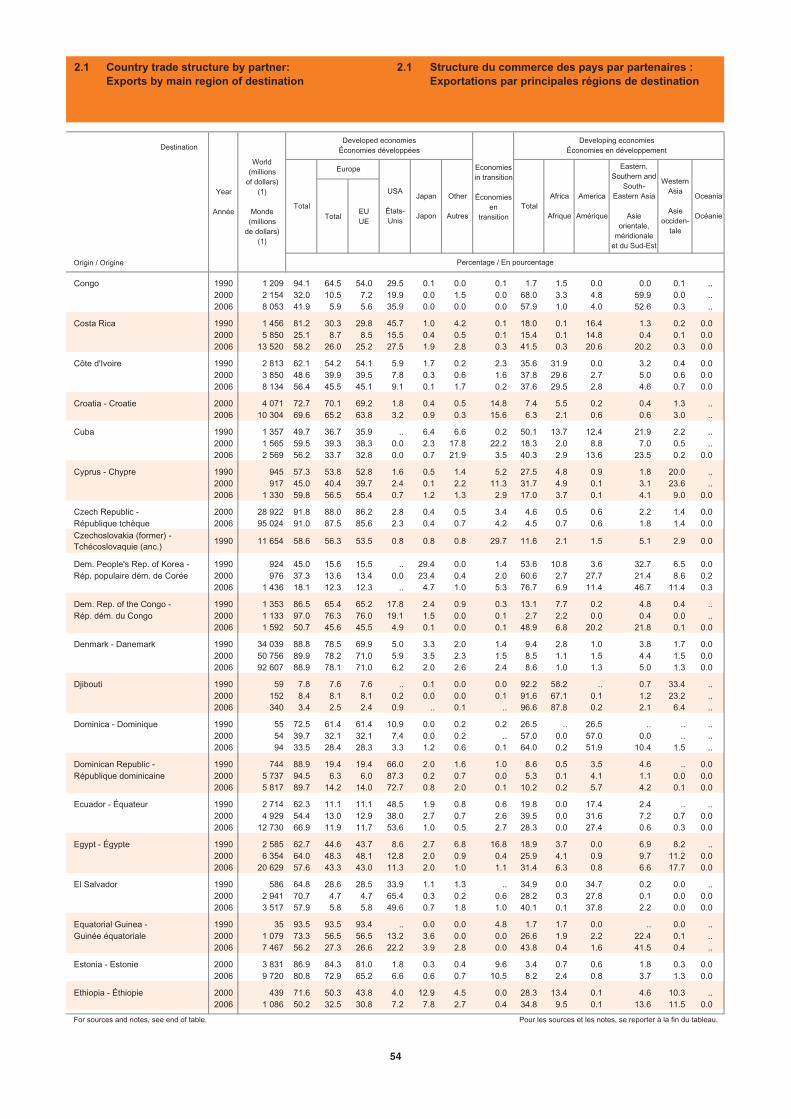
TotalEUUE
Origin / Origine
Congo 1990 1 209 94.1 64.5 54.0 29.5 0.1 0.0 0.1 1.7 1.5 0.0 0.0 0.1 ..2000 2 154 32.0 10.5 7.2 19.9 0.0 1.5 0.0 68.0 3.3 4.8 59.9 0.0 ..2006 8 053 41.9 5.9 5.6 35.9 0.0 0.0 0.0 57.9 1.0 4.0 52.6 0.3 ..
Costa Rica 1990 1 456 81.2 30.3 29.8 45.7 1.0 4.2 0.1 18.0 0.1 16.4 1.3 0.2 0.02000 5 850 25.1 8.7 8.5 15.5 0.4 0.5 0.1 15.4 0.1 14.8 0.4 0.1 0.02006 13 520 58.2 26.0 25.2 27.5 1.9 2.8 0.3 41.5 0.3 20.6 20.2 0.3 0.0
Côte d'Ivoire 1990 2 813 62.1 54.2 54.1 5.9 1.7 0.2 2.3 35.6 31.9 0.0 3.2 0.4 0.02000 3 850 48.6 39.9 39.5 7.8 0.3 0.6 1.6 37.8 29.6 2.7 5.0 0.6 0.02006 8 134 56.4 45.5 45.1 9.1 0.1 1.7 0.2 37.6 29.5 2.8 4.6 0.7 0.0
Croatia - Croatie 2000 4 071 72.7 70.1 69.2 1.8 0.4 0.5 14.8 7.4 5.5 0.2 0.4 1.3 ..2006 10 304 69.6 65.2 63.8 3.2 0.9 0.3 15.6 6.3 2.1 0.6 0.6 3.0 ..
Cuba 1990 1 357 49.7 36.7 35.9 .. 6.4 6.6 0.2 50.1 13.7 12.4 21.9 2.2 ..2000 1 565 59.5 39.3 38.3 0.0 2.3 17.8 22.2 18.3 2.0 8.8 7.0 0.5 ..2006 2 569 56.2 33.7 32.8 0.0 0.7 21.9 3.5 40.3 2.9 13.6 23.5 0.2 0.0
Cyprus - Chypre 1990 945 57.3 53.8 52.8 1.6 0.5 1.4 5.2 27.5 4.8 0.9 1.8 20.0 ..2000 917 45.0 40.4 39.7 2.4 0.1 2.2 11.3 31.7 4.9 0.1 3.1 23.6 ..2006 1 330 59.8 56.5 55.4 0.7 1.2 1.3 2.9 17.0 3.7 0.1 4.1 9.0 0.0
Czech Republic - 2000 28 922 91.8 88.0 86.2 2.8 0.4 0.5 3.4 4.6 0.5 0.6 2.2 1.4 0.0République tchèque 2006 95 024 91.0 87.5 85.6 2.3 0.4 0.7 4.2 4.5 0.7 0.6 1.8 1.4 0.0Czechoslovakia (former) - Tchécoslovaquie (anc.)
1990 11 654 58.6 56.3 53.5 0.8 0.8 0.8 29.7 11.6 2.1 1.5 5.1 2.9 0.0
Dem. People's Rep. of Korea - 1990 924 45.0 15.6 15.5 .. 29.4 0.0 1.4 53.6 10.8 3.6 32.7 6.5 0.0Rép. populaire dém. de Corée 2000 976 37.3 13.6 13.4 0.0 23.4 0.4 2.0 60.6 2.7 27.7 21.4 8.6 0.2
2006 1 436 18.1 12.3 12.3 .. 4.7 1.0 5.3 76.7 6.9 11.4 46.7 11.4 0.3
Dem. Rep. of the Congo - 1990 1 353 86.5 65.4 65.2 17.8 2.4 0.9 0.3 13.1 7.7 0.2 4.8 0.4 ..Rép. dém. du Congo 2000 1 133 97.0 76.3 76.0 19.1 1.5 0.0 0.1 2.7 2.2 0.0 0.4 0.0 ..
2006 1 592 50.7 45.6 45.5 4.9 0.1 0.0 0.1 48.9 6.8 20.2 21.8 0.1 0.0
Denmark - Danemark 1990 34 039 88.8 78.5 69.9 5.0 3.3 2.0 1.4 9.4 2.8 1.0 3.8 1.7 0.02000 50 756 89.9 78.2 71.0 5.9 3.5 2.3 1.5 8.5 1.1 1.5 4.4 1.5 0.02006 92 607 88.9 78.1 71.0 6.2 2.0 2.6 2.4 8.6 1.0 1.3 5.0 1.3 0.0
Djibouti 1990 59 7.8 7.6 7.6 .. 0.1 0.0 0.0 92.2 58.2 .. 0.7 33.4 ..2000 152 8.4 8.1 8.1 0.2 0.0 0.0 0.1 91.6 67.1 0.1 1.2 23.2 ..2006 340 3.4 2.5 2.4 0.9 .. 0.1 .. 96.6 87.8 0.2 2.1 6.4 ..
Dominica - Dominique 1990 55 72.5 61.4 61.4 10.9 0.0 0.2 0.2 26.5 .. 26.5 .. .. ..2000 54 39.7 32.1 32.1 7.4 0.0 0.2 .. 57.0 0.0 57.0 0.0 .. ..2006 94 33.5 28.4 28.3 3.3 1.2 0.6 0.1 64.0 0.2 51.9 10.4 1.5 ..
Dominican Republic - 1990 744 88.9 19.4 19.4 66.0 2.0 1.6 1.0 8.6 0.5 3.5 4.6 .. 0.0République dominicaine 2000 5 737 94.5 6.3 6.0 87.3 0.2 0.7 0.0 5.3 0.1 4.1 1.1 0.0 0.0
2006 5 817 89.7 14.2 14.0 72.7 0.8 2.0 0.1 10.2 0.2 5.7 4.2 0.1 0.0
Ecuador - Équateur 1990 2 714 62.3 11.1 11.1 48.5 1.9 0.8 0.6 19.8 0.0 17.4 2.4 .. ..2000 4 929 54.4 13.0 12.9 38.0 2.7 0.7 2.6 39.5 0.0 31.6 7.2 0.7 0.02006 12 730 66.9 11.9 11.7 53.6 1.0 0.5 2.7 28.3 0.0 27.4 0.6 0.3 0.0
Egypt - Égypte 1990 2 585 62.7 44.6 43.7 8.6 2.7 6.8 16.8 18.9 3.7 0.0 6.9 8.2 ..2000 6 354 64.0 48.3 48.1 12.8 2.0 0.9 0.4 25.9 4.1 0.9 9.7 11.2 0.02006 20 629 57.6 43.3 43.0 11.3 2.0 1.0 1.1 31.4 6.3 0.8 6.6 17.7 0.0
El Salvador 1990 586 64.8 28.6 28.5 33.9 1.1 1.3 .. 34.9 0.0 34.7 0.2 0.0 ..2000 2 941 70.7 4.7 4.7 65.4 0.3 0.2 0.6 28.2 0.3 27.8 0.1 0.0 0.02006 3 517 57.9 5.8 5.8 49.6 0.7 1.8 1.0 40.1 0.1 37.8 2.2 0.0 0.0
Equatorial Guinea - 1990 35 93.5 93.5 93.4 .. 0.0 0.0 4.8 1.7 1.7 0.0 .. 0.0 ..Guinée équatoriale 2000 1 079 73.3 56.5 56.5 13.2 3.6 0.0 0.0 26.6 1.9 2.2 22.4 0.1 ..
2006 7 467 56.2 27.3 26.6 22.2 3.9 2.8 0.0 43.8 0.4 1.6 41.5 0.4 ..
Estonia - Estonie 2000 3 831 86.9 84.3 81.0 1.8 0.3 0.4 9.6 3.4 0.7 0.6 1.8 0.3 0.02006 9 720 80.8 72.9 65.2 6.6 0.6 0.7 10.5 8.2 2.4 0.8 3.7 1.3 0.0
Ethiopia - Éthiopie 2000 439 71.6 50.3 43.8 4.0 12.9 4.5 0.0 28.3 13.4 0.1 4.6 10.3 ..2006 1 086 50.2 32.5 30.8 7.2 7.8 2.7 0.4 34.8 9.5 0.1 13.6 11.5 0.0
For sources and notes, see end of table. Pour les sources et les notes, se reporter à la fin du tableau.
Other
AutresTotal
Destination
Year
Année
World(millions
of dollars)(1)
Monde(millions
de dollars)(1)
Developed economiesÉconomies développées
Oceania
Océanie
Percentage / En pourcentage
Economiesin transition
Économiesen
transition
Developing economiesÉconomies en développement
Total
Europe
USA
États-Unis
Japan
Japon
Eastern,Southern and
South-Eastern Asia
Asieorientale,
méridionaleet du Sud-Est
WesternAsia
Asieocciden-
tale
Africa
Afrique
America
Amérique
2.1 Country trade structure by partner:Exports by main region of destination
2.1 Structure du commerce des pays par partenaires :Exportations par principales régions de destination
54
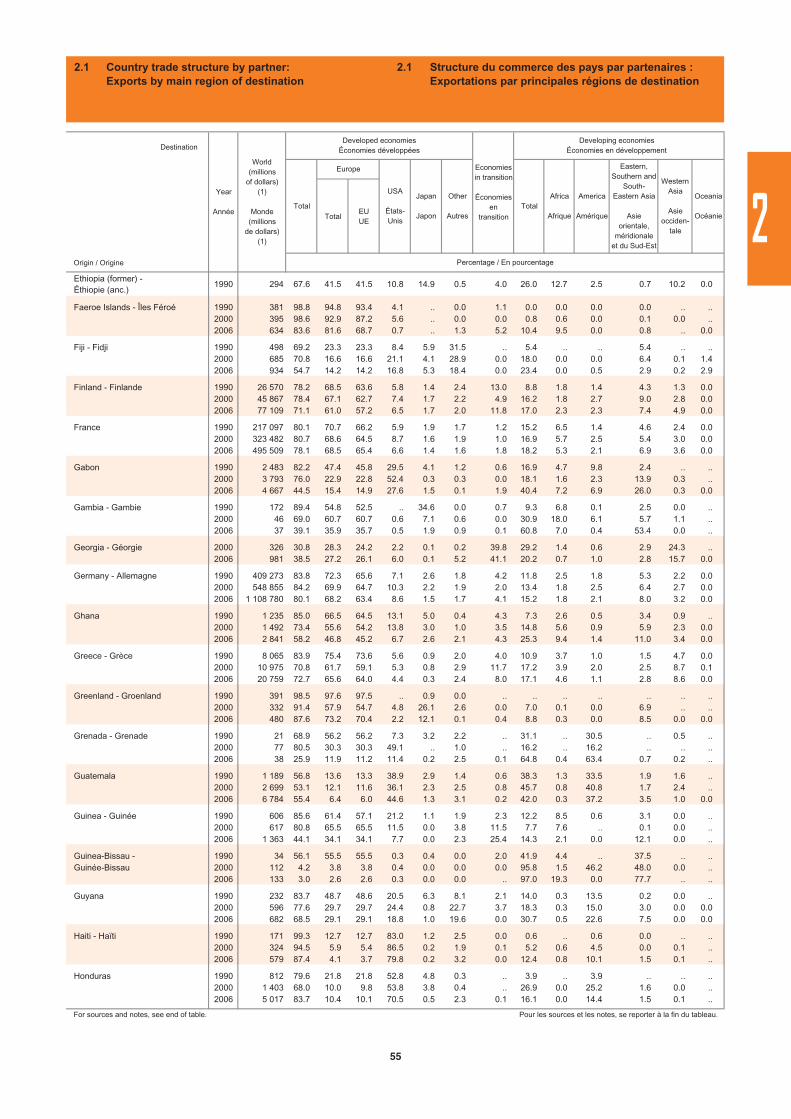
TotalEUUE
Origin / Origine
Ethiopia (former) - Éthiopie (anc.)
1990 294 67.6 41.5 41.5 10.8 14.9 0.5 4.0 26.0 12.7 2.5 0.7 10.2 0.0
Faeroe Islands - Îles Féroé 1990 381 98.8 94.8 93.4 4.1 .. 0.0 1.1 0.0 0.0 0.0 0.0 .. ..2000 395 98.6 92.9 87.2 5.6 .. 0.0 0.0 0.8 0.6 0.0 0.1 0.0 ..2006 634 83.6 81.6 68.7 0.7 .. 1.3 5.2 10.4 9.5 0.0 0.8 .. 0.0
Fiji - Fidji 1990 498 69.2 23.3 23.3 8.4 5.9 31.5 .. 5.4 .. .. 5.4 .. ..2000 685 70.8 16.6 16.6 21.1 4.1 28.9 0.0 18.0 0.0 0.0 6.4 0.1 1.42006 934 54.7 14.2 14.2 16.8 5.3 18.4 0.0 23.4 0.0 0.5 2.9 0.2 2.9
Finland - Finlande 1990 26 570 78.2 68.5 63.6 5.8 1.4 2.4 13.0 8.8 1.8 1.4 4.3 1.3 0.02000 45 867 78.4 67.1 62.7 7.4 1.7 2.2 4.9 16.2 1.8 2.7 9.0 2.8 0.02006 77 109 71.1 61.0 57.2 6.5 1.7 2.0 11.8 17.0 2.3 2.3 7.4 4.9 0.0
France 1990 217 097 80.1 70.7 66.2 5.9 1.9 1.7 1.2 15.2 6.5 1.4 4.6 2.4 0.02000 323 482 80.7 68.6 64.5 8.7 1.6 1.9 1.0 16.9 5.7 2.5 5.4 3.0 0.02006 495 509 78.1 68.5 65.4 6.6 1.4 1.6 1.8 18.2 5.3 2.1 6.9 3.6 0.0
Gabon 1990 2 483 82.2 47.4 45.8 29.5 4.1 1.2 0.6 16.9 4.7 9.8 2.4 .. ..2000 3 793 76.0 22.9 22.8 52.4 0.3 0.3 0.0 18.1 1.6 2.3 13.9 0.3 ..2006 4 667 44.5 15.4 14.9 27.6 1.5 0.1 1.9 40.4 7.2 6.9 26.0 0.3 0.0
Gambia - Gambie 1990 172 89.4 54.8 52.5 .. 34.6 0.0 0.7 9.3 6.8 0.1 2.5 0.0 ..2000 46 69.0 60.7 60.7 0.6 7.1 0.6 0.0 30.9 18.0 6.1 5.7 1.1 ..2006 37 39.1 35.9 35.7 0.5 1.9 0.9 0.1 60.8 7.0 0.4 53.4 0.0 ..
Georgia - Géorgie 2000 326 30.8 28.3 24.2 2.2 0.1 0.2 39.8 29.2 1.4 0.6 2.9 24.3 ..2006 981 38.5 27.2 26.1 6.0 0.1 5.2 41.1 20.2 0.7 1.0 2.8 15.7 0.0
Germany - Allemagne 1990 409 273 83.8 72.3 65.6 7.1 2.6 1.8 4.2 11.8 2.5 1.8 5.3 2.2 0.02000 548 855 84.2 69.9 64.7 10.3 2.2 1.9 2.0 13.4 1.8 2.5 6.4 2.7 0.02006 1 108 780 80.1 68.2 63.4 8.6 1.5 1.7 4.1 15.2 1.8 2.1 8.0 3.2 0.0
Ghana 1990 1 235 85.0 66.5 64.5 13.1 5.0 0.4 4.3 7.3 2.6 0.5 3.4 0.9 ..2000 1 492 73.4 55.6 54.2 13.8 3.0 1.0 3.5 14.8 5.6 0.9 5.9 2.3 0.02006 2 841 58.2 46.8 45.2 6.7 2.6 2.1 4.3 25.3 9.4 1.4 11.0 3.4 0.0
Greece - Grèce 1990 8 065 83.9 75.4 73.6 5.6 0.9 2.0 4.0 10.9 3.7 1.0 1.5 4.7 0.02000 10 975 70.8 61.7 59.1 5.3 0.8 2.9 11.7 17.2 3.9 2.0 2.5 8.7 0.12006 20 759 72.7 65.6 64.0 4.4 0.3 2.4 8.0 17.1 4.6 1.1 2.8 8.6 0.0
Greenland - Groenland 1990 391 98.5 97.6 97.5 .. 0.9 0.0 .. .. .. .. .. .. ..2000 332 91.4 57.9 54.7 4.8 26.1 2.6 0.0 7.0 0.1 0.0 6.9 .. ..2006 480 87.6 73.2 70.4 2.2 12.1 0.1 0.4 8.8 0.3 0.0 8.5 0.0 0.0
Grenada - Grenade 1990 21 68.9 56.2 56.2 7.3 3.2 2.2 .. 31.1 .. 30.5 .. 0.5 ..2000 77 80.5 30.3 30.3 49.1 .. 1.0 .. 16.2 .. 16.2 .. .. ..2006 38 25.9 11.9 11.2 11.4 0.2 2.5 0.1 64.8 0.4 63.4 0.7 0.2 ..
Guatemala 1990 1 189 56.8 13.6 13.3 38.9 2.9 1.4 0.6 38.3 1.3 33.5 1.9 1.6 ..2000 2 699 53.1 12.1 11.6 36.1 2.3 2.5 0.8 45.7 0.8 40.8 1.7 2.4 ..2006 6 784 55.4 6.4 6.0 44.6 1.3 3.1 0.2 42.0 0.3 37.2 3.5 1.0 0.0
Guinea - Guinée 1990 606 85.6 61.4 57.1 21.2 1.1 1.9 2.3 12.2 8.5 0.6 3.1 0.0 ..2000 617 80.8 65.5 65.5 11.5 0.0 3.8 11.5 7.7 7.6 .. 0.1 0.0 ..2006 1 363 44.1 34.1 34.1 7.7 0.0 2.3 25.4 14.3 2.1 0.0 12.1 0.0 ..
Guinea-Bissau - 1990 34 56.1 55.5 55.5 0.3 0.4 0.0 2.0 41.9 4.4 .. 37.5 .. ..Guinée-Bissau 2000 112 4.2 3.8 3.8 0.4 0.0 0.0 0.0 95.8 1.5 46.2 48.0 0.0 ..
2006 133 3.0 2.6 2.6 0.3 0.0 0.0 .. 97.0 19.3 0.0 77.7 .. ..
Guyana 1990 232 83.7 48.7 48.6 20.5 6.3 8.1 2.1 14.0 0.3 13.5 0.2 0.0 ..2000 596 77.6 29.7 29.7 24.4 0.8 22.7 3.7 18.3 0.3 15.0 3.0 0.0 0.02006 682 68.5 29.1 29.1 18.8 1.0 19.6 0.0 30.7 0.5 22.6 7.5 0.0 0.0
Haiti - Haïti 1990 171 99.3 12.7 12.7 83.0 1.2 2.5 0.0 0.6 .. 0.6 0.0 .. ..2000 324 94.5 5.9 5.4 86.5 0.2 1.9 0.1 5.2 0.6 4.5 0.0 0.1 ..2006 579 87.4 4.1 3.7 79.8 0.2 3.2 0.0 12.4 0.8 10.1 1.5 0.1 ..
Honduras 1990 812 79.6 21.8 21.8 52.8 4.8 0.3 .. 3.9 .. 3.9 .. .. ..2000 1 403 68.0 10.0 9.8 53.8 3.8 0.4 .. 26.9 0.0 25.2 1.6 0.0 ..2006 5 017 83.7 10.4 10.1 70.5 0.5 2.3 0.1 16.1 0.0 14.4 1.5 0.1 ..
For sources and notes, see end of table. Pour les sources et les notes, se reporter à la fin du tableau.
Oceania
Océanie
Percentage / En pourcentage
Destination
Year
Année
World(millions
of dollars)(1)
Monde(millions
de dollars)(1)
Developed economiesÉconomies développées
Total
Europe
Other
AutresTotal
Africa
Afrique
America
Amérique
Eastern,Southern and
South-Eastern Asia
Asieorientale,
méridionaleet du Sud-Est
WesternAsia
Asieocciden-
tale
USA
États-Unis
Japan
Japon
Economiesin transition
Économiesen
transition
Developing economiesÉconomies en développement
2.1 Country trade structure by partner:Exports by main region of destination
2.1 Structure du commerce des pays par partenaires :Exportations par principales régions de destination
2
55
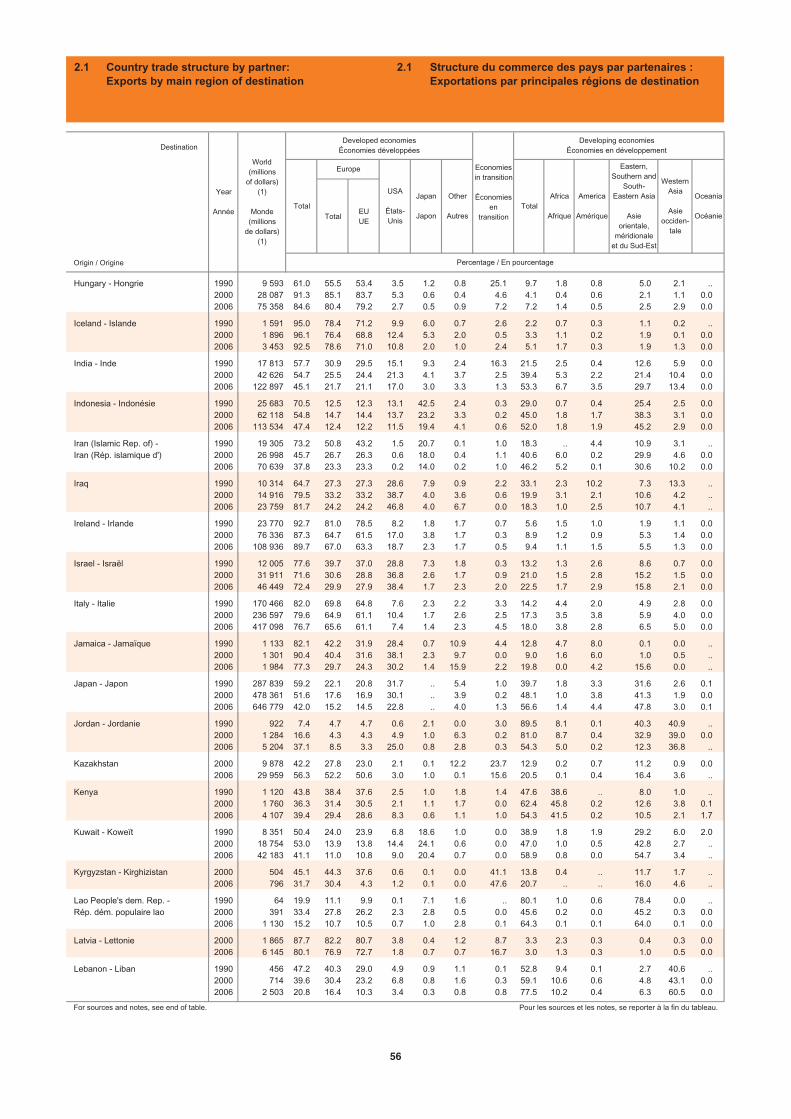
TotalEUUE
Origin / Origine
Hungary - Hongrie 1990 9 593 61.0 55.5 53.4 3.5 1.2 0.8 25.1 9.7 1.8 0.8 5.0 2.1 ..2000 28 087 91.3 85.1 83.7 5.3 0.6 0.4 4.6 4.1 0.4 0.6 2.1 1.1 0.02006 75 358 84.6 80.4 79.2 2.7 0.5 0.9 7.2 7.2 1.4 0.5 2.5 2.9 0.0
Iceland - Islande 1990 1 591 95.0 78.4 71.2 9.9 6.0 0.7 2.6 2.2 0.7 0.3 1.1 0.2 ..2000 1 896 96.1 76.4 68.8 12.4 5.3 2.0 0.5 3.3 1.1 0.2 1.9 0.1 0.02006 3 453 92.5 78.6 71.0 10.8 2.0 1.0 2.4 5.1 1.7 0.3 1.9 1.3 0.0
India - Inde 1990 17 813 57.7 30.9 29.5 15.1 9.3 2.4 16.3 21.5 2.5 0.4 12.6 5.9 0.02000 42 626 54.7 25.5 24.4 21.3 4.1 3.7 2.5 39.4 5.3 2.2 21.4 10.4 0.02006 122 897 45.1 21.7 21.1 17.0 3.0 3.3 1.3 53.3 6.7 3.5 29.7 13.4 0.0
Indonesia - Indonésie 1990 25 683 70.5 12.5 12.3 13.1 42.5 2.4 0.3 29.0 0.7 0.4 25.4 2.5 0.02000 62 118 54.8 14.7 14.4 13.7 23.2 3.3 0.2 45.0 1.8 1.7 38.3 3.1 0.02006 113 534 47.4 12.4 12.2 11.5 19.4 4.1 0.6 52.0 1.8 1.9 45.2 2.9 0.0
Iran (Islamic Rep. of) - 1990 19 305 73.2 50.8 43.2 1.5 20.7 0.1 1.0 18.3 .. 4.4 10.9 3.1 ..Iran (Rép. islamique d') 2000 26 998 45.7 26.7 26.3 0.6 18.0 0.4 1.1 40.6 6.0 0.2 29.9 4.6 0.0
2006 70 639 37.8 23.3 23.3 0.2 14.0 0.2 1.0 46.2 5.2 0.1 30.6 10.2 0.0
Iraq 1990 10 314 64.7 27.3 27.3 28.6 7.9 0.9 2.2 33.1 2.3 10.2 7.3 13.3 ..2000 14 916 79.5 33.2 33.2 38.7 4.0 3.6 0.6 19.9 3.1 2.1 10.6 4.2 ..2006 23 759 81.7 24.2 24.2 46.8 4.0 6.7 0.0 18.3 1.0 2.5 10.7 4.1 ..
Ireland - Irlande 1990 23 770 92.7 81.0 78.5 8.2 1.8 1.7 0.7 5.6 1.5 1.0 1.9 1.1 0.02000 76 336 87.3 64.7 61.5 17.0 3.8 1.7 0.3 8.9 1.2 0.9 5.3 1.4 0.02006 108 936 89.7 67.0 63.3 18.7 2.3 1.7 0.5 9.4 1.1 1.5 5.5 1.3 0.0
Israel - Israël 1990 12 005 77.6 39.7 37.0 28.8 7.3 1.8 0.3 13.2 1.3 2.6 8.6 0.7 0.02000 31 911 71.6 30.6 28.8 36.8 2.6 1.7 0.9 21.0 1.5 2.8 15.2 1.5 0.02006 46 449 72.4 29.9 27.9 38.4 1.7 2.3 2.0 22.5 1.7 2.9 15.8 2.1 0.0
Italy - Italie 1990 170 466 82.0 69.8 64.8 7.6 2.3 2.2 3.3 14.2 4.4 2.0 4.9 2.8 0.02000 236 597 79.6 64.9 61.1 10.4 1.7 2.6 2.5 17.3 3.5 3.8 5.9 4.0 0.02006 417 098 76.7 65.6 61.1 7.4 1.4 2.3 4.5 18.0 3.8 2.8 6.5 5.0 0.0
Jamaica - Jamaïque 1990 1 133 82.1 42.2 31.9 28.4 0.7 10.9 4.4 12.8 4.7 8.0 0.1 0.0 ..2000 1 301 90.4 40.4 31.6 38.1 2.3 9.7 0.0 9.0 1.6 6.0 1.0 0.5 ..2006 1 984 77.3 29.7 24.3 30.2 1.4 15.9 2.2 19.8 0.0 4.2 15.6 0.0 ..
Japan - Japon 1990 287 839 59.2 22.1 20.8 31.7 .. 5.4 1.0 39.7 1.8 3.3 31.6 2.6 0.12000 478 361 51.6 17.6 16.9 30.1 .. 3.9 0.2 48.1 1.0 3.8 41.3 1.9 0.02006 646 779 42.0 15.2 14.5 22.8 .. 4.0 1.3 56.6 1.4 4.4 47.8 3.0 0.1
Jordan - Jordanie 1990 922 7.4 4.7 4.7 0.6 2.1 0.0 3.0 89.5 8.1 0.1 40.3 40.9 ..2000 1 284 16.6 4.3 4.3 4.9 1.0 6.3 0.2 81.0 8.7 0.4 32.9 39.0 0.02006 5 204 37.1 8.5 3.3 25.0 0.8 2.8 0.3 54.3 5.0 0.2 12.3 36.8 ..
Kazakhstan 2000 9 878 42.2 27.8 23.0 2.1 0.1 12.2 23.7 12.9 0.2 0.7 11.2 0.9 0.02006 29 959 56.3 52.2 50.6 3.0 1.0 0.1 15.6 20.5 0.1 0.4 16.4 3.6 ..
Kenya 1990 1 120 43.8 38.4 37.6 2.5 1.0 1.8 1.4 47.6 38.6 .. 8.0 1.0 ..2000 1 760 36.3 31.4 30.5 2.1 1.1 1.7 0.0 62.4 45.8 0.2 12.6 3.8 0.12006 4 107 39.4 29.4 28.6 8.3 0.6 1.1 1.0 54.3 41.5 0.2 10.5 2.1 1.7
Kuwait - Koweït 1990 8 351 50.4 24.0 23.9 6.8 18.6 1.0 0.0 38.9 1.8 1.9 29.2 6.0 2.02000 18 754 53.0 13.9 13.8 14.4 24.1 0.6 0.0 47.0 1.0 0.5 42.8 2.7 ..2006 42 183 41.1 11.0 10.8 9.0 20.4 0.7 0.0 58.9 0.8 0.0 54.7 3.4 ..
Kyrgyzstan - Kirghizistan 2000 504 45.1 44.3 37.6 0.6 0.1 0.0 41.1 13.8 0.4 .. 11.7 1.7 ..2006 796 31.7 30.4 4.3 1.2 0.1 0.0 47.6 20.7 .. .. 16.0 4.6 ..
Lao People's dem. Rep. - 1990 64 19.9 11.1 9.9 0.1 7.1 1.6 .. 80.1 1.0 0.6 78.4 0.0 ..Rép. dém. populaire lao 2000 391 33.4 27.8 26.2 2.3 2.8 0.5 0.0 45.6 0.2 0.0 45.2 0.3 0.0
2006 1 130 15.2 10.7 10.5 0.7 1.0 2.8 0.1 64.3 0.1 0.1 64.0 0.1 0.0
Latvia - Lettonie 2000 1 865 87.7 82.2 80.7 3.8 0.4 1.2 8.7 3.3 2.3 0.3 0.4 0.3 0.02006 6 145 80.1 76.9 72.7 1.8 0.7 0.7 16.7 3.0 1.3 0.3 1.0 0.5 0.0
Lebanon - Liban 1990 456 47.2 40.3 29.0 4.9 0.9 1.1 0.1 52.8 9.4 0.1 2.7 40.6 ..2000 714 39.6 30.4 23.2 6.8 0.8 1.6 0.3 59.1 10.6 0.6 4.8 43.1 0.02006 2 503 20.8 16.4 10.3 3.4 0.3 0.8 0.8 77.5 10.2 0.4 6.3 60.5 0.0
For sources and notes, see end of table. Pour les sources et les notes, se reporter à la fin du tableau.
Other
AutresTotal
Destination
Year
Année
World(millions
of dollars)(1)
Monde(millions
de dollars)(1)
Developed economiesÉconomies développées
Oceania
Océanie
Percentage / En pourcentage
Economiesin transition
Économiesen
transition
Developing economiesÉconomies en développement
Total
Europe
USA
États-Unis
Japan
Japon
Eastern,Southern and
South-Eastern Asia
Asieorientale,
méridionaleet du Sud-Est
WesternAsia
Asieocciden-
tale
Africa
Afrique
America
Amérique
2.1 Country trade structure by partner:Exports by main region of destination
2.1 Structure du commerce des pays par partenaires :Exportations par principales régions de destination
56

TotalEUUE
Origin / Origine
Liberia - Libéria 1990 1 943 86.4 83.7 41.8 2.5 0.0 0.3 0.2 13.4 0.2 1.0 12.2 0.0 0.02000 582 77.3 69.8 61.0 7.1 0.0 0.3 1.6 21.1 2.1 2.6 14.3 2.2 0.02006 1 548 77.7 67.5 66.0 8.5 0.6 1.2 0.4 21.8 13.1 0.2 8.4 0.2 0.0
Libyan Arab Jamahiriya - 1990 13 878 88.3 88.3 88.2 .. 0.0 0.0 4.1 7.6 3.3 0.1 0.3 3.9 ..Jamahiriya arabe libyenne 2000 12 717 88.4 88.3 85.5 .. 0.1 0.0 1.5 10.2 3.4 0.3 0.6 5.9 ..
2006 39 305 85.2 78.9 75.8 6.1 0.0 0.1 0.9 13.9 2.1 1.2 4.2 6.5 ..
Lithuania - Lituanie 2000 3 810 80.4 74.8 72.3 4.9 0.3 0.4 16.3 3.2 0.1 0.5 0.7 1.8 0.02006 14 154 73.4 66.9 63.6 4.3 0.1 2.2 21.4 5.1 0.4 0.4 3.1 1.2 0.0
Luxembourg 2006 22 853 92.9 90.1 88.8 2.1 0.1 0.6 1.0 5.3 0.4 0.7 2.2 2.0 0.0
Madagascar 1990 366 87.5 52.4 51.6 29.4 5.5 0.2 0.7 11.7 5.5 0.2 6.1 0.0 0.02000 806 82.5 59.9 59.5 19.2 2.8 0.5 0.0 12.4 3.3 0.1 9.0 0.1 0.02006 1 072 87.0 57.8 57.2 25.3 2.6 1.4 0.1 10.1 2.7 0.1 6.8 0.3 0.1
Malawi 1990 419 76.6 50.6 48.4 11.5 12.8 1.7 .. 16.6 15.0 .. 1.4 0.2 ..2000 382 68.9 40.8 39.2 14.1 12.2 1.9 3.6 27.0 18.0 0.8 4.4 3.5 0.42006 612 44.0 29.3 28.9 9.5 3.1 2.1 7.2 48.2 40.6 0.9 3.6 2.5 0.6
Malaysia - Malaisie 1990 29 421 50.8 15.8 15.6 16.9 15.3 2.7 0.8 48.4 0.8 0.7 44.7 2.2 0.02000 98 154 51.5 14.2 14.0 20.5 13.0 3.7 0.1 48.4 0.8 1.5 44.2 1.8 0.02006 160 664 44.6 13.1 12.8 18.8 8.9 3.9 0.5 54.9 1.4 1.3 49.3 2.8 0.0
Maldives 1990 52 61.5 26.5 26.2 24.2 8.5 2.3 .. 38.5 .. .. 38.5 .. 0.02000 76 67.2 18.6 18.6 44.2 4.2 0.2 .. 32.8 .. .. 32.8 0.0 ..2006 167 42.4 30.2 30.2 1.3 10.3 0.6 0.0 57.6 8.3 0.0 49.1 0.1 0.0
Mali 1990 252 44.9 37.1 36.2 0.8 1.2 5.7 13.9 40.5 14.4 0.1 26.0 0.0 ..2000 234 45.4 33.8 33.3 3.8 0.5 7.2 .. 52.3 9.6 9.9 32.0 0.8 0.02006 387 39.4 33.6 32.9 1.9 0.1 3.9 0.0 56.6 5.7 1.5 49.1 0.4 0.0
Malta - Malte 1990 1 127 82.1 78.0 77.5 3.8 0.1 0.2 3.0 11.6 6.4 0.1 3.5 1.7 ..2000 2 442 72.9 40.6 34.1 27.4 3.8 1.1 0.1 21.6 2.3 0.2 18.1 1.0 0.02006 2 668 69.2 50.4 49.7 13.0 4.9 0.9 0.6 29.3 5.4 0.6 21.7 1.7 0.0
Mauritania - Mauritanie 1990 469 81.0 61.3 61.2 .. 19.7 0.0 11.8 6.8 5.6 0.5 0.7 0.0 ..2000 529 70.4 56.6 56.0 0.1 13.8 0.0 2.4 26.0 20.8 1.0 3.8 0.4 0.02006 1 400 54.2 45.3 44.6 3.5 5.4 0.0 3.7 40.9 14.0 0.0 26.5 0.4 0.0
Mauritius - Maurice 1990 1 202 96.2 82.3 81.2 12.7 0.2 1.0 0.1 3.7 2.2 0.1 1.4 0.0 0.02000 1 488 90.4 68.7 67.4 20.2 0.5 1.0 0.0 9.6 7.6 0.3 1.4 0.1 0.02006 2 177 73.6 63.9 62.9 8.3 0.8 0.5 0.1 26.3 8.9 0.2 4.3 11.7 0.0
Mexico - Mexique 1990 27 167 90.8 14.2 13.4 69.3 5.5 1.8 0.1 8.2 0.3 6.6 1.2 0.1 0.02000 166 199 95.1 3.7 3.3 88.7 0.6 2.2 0.0 4.4 0.0 3.7 0.7 0.0 ..2006 249 997 91.8 4.2 4.1 84.7 0.6 2.3 0.0 6.9 0.1 5.0 1.7 0.1 ..
Moldova 2000 472 39.2 35.3 35.0 3.3 0.0 0.6 58.6 2.2 0.2 0.1 0.7 1.2 ..2006 1 239 52.7 47.8 47.6 2.9 0.2 1.8 42.6 4.5 0.5 0.5 0.2 3.4 0.0
Mongolia - Mongolie 1990 91 61.9 42.3 41.8 2.0 17.6 0.0 2.9 35.2 20.7 0.4 13.9 0.1 0.02000 536 36.9 8.6 7.7 24.3 1.5 2.5 9.0 54.0 0.0 0.1 53.7 0.2 ..2006 1 449 24.1 3.8 3.6 7.3 0.5 12.5 3.1 72.8 0.0 0.0 72.6 0.2 ..
Morocco - Maroc 1990 4 586 69.5 63.5 62.5 1.8 3.6 0.6 0.6 19.7 6.2 1.3 7.3 4.9 0.32000 7 418 82.0 73.6 72.9 3.4 3.8 1.2 1.0 13.9 3.7 1.8 6.3 2.1 0.02006 13 252 70.8 63.5 62.2 3.8 1.3 2.2 1.9 24.9 4.2 4.5 13.0 3.2 0.0
Mozambique 1990 381 34.1 22.3 21.9 6.9 4.0 0.9 0.1 64.5 3.1 0.7 60.3 0.4 ..2000 364 34.7 25.5 25.5 4.7 4.3 0.1 .. 45.0 36.0 0.0 8.9 0.1 ..2006 2 381 68.9 68.3 66.1 0.3 0.3 0.0 0.4 24.9 20.2 .. 4.3 0.5 ..
Myanmar 1990 409 17.6 7.6 7.0 2.3 6.9 0.8 2.7 63.6 1.0 0.0 61.6 1.1 ..2000 1 980 47.2 16.9 16.7 22.4 5.5 2.6 0.0 42.6 0.2 0.2 42.0 0.2 0.02006 4 376 13.2 7.5 7.4 .. 5.2 0.6 0.1 79.7 0.5 0.2 78.1 0.9 0.0
Nepal - Népal 1990 211 85.0 60.0 53.8 23.4 0.8 0.7 0.0 15.0 0.1 0.1 14.8 0.0 ..2000 721 53.7 23.9 23.0 27.5 1.4 0.9 0.0 44.7 0.0 0.0 44.5 0.1 ..2006 830 26.7 12.7 12.1 11.7 1.0 1.4 0.1 70.8 0.2 0.1 69.8 0.8 ..
For sources and notes, see end of table. Pour les sources et les notes, se reporter à la fin du tableau.
Oceania
Océanie
Percentage / En pourcentage
Destination
Year
Année
World(millions
of dollars)(1)
Monde(millions
de dollars)(1)
Developed economiesÉconomies développées
Total
Europe
Other
AutresTotal
Africa
Afrique
America
Amérique
Eastern,Southern and
South-Eastern Asia
Asieorientale,
méridionaleet du Sud-Est
WesternAsia
Asieocciden-
tale
USA
États-Unis
Japan
Japon
Economiesin transition
Économiesen
transition
Developing economiesÉconomies en développement
2.1 Country trade structure by partner:Exports by main region of destination
2.1 Structure du commerce des pays par partenaires :Exportations par principales régions de destination
2
57
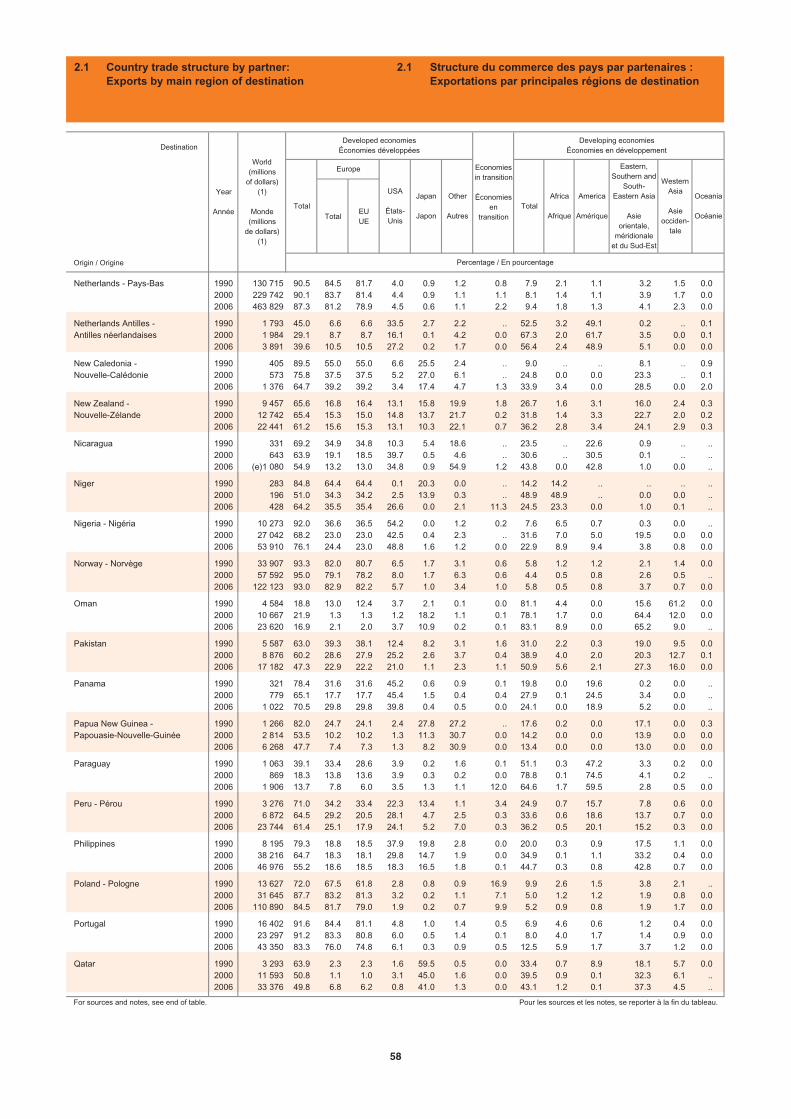
TotalEUUE
Origin / Origine
Netherlands - Pays-Bas 1990 130 715 90.5 84.5 81.7 4.0 0.9 1.2 0.8 7.9 2.1 1.1 3.2 1.5 0.02000 229 742 90.1 83.7 81.4 4.4 0.9 1.1 1.1 8.1 1.4 1.1 3.9 1.7 0.02006 463 829 87.3 81.2 78.9 4.5 0.6 1.1 2.2 9.4 1.8 1.3 4.1 2.3 0.0
Netherlands Antilles - 1990 1 793 45.0 6.6 6.6 33.5 2.7 2.2 .. 52.5 3.2 49.1 0.2 .. 0.1Antilles néerlandaises 2000 1 984 29.1 8.7 8.7 16.1 0.1 4.2 0.0 67.3 2.0 61.7 3.5 0.0 0.1
2006 3 891 39.6 10.5 10.5 27.2 0.2 1.7 0.0 56.4 2.4 48.9 5.1 0.0 0.0
New Caledonia - 1990 405 89.5 55.0 55.0 6.6 25.5 2.4 .. 9.0 .. .. 8.1 .. 0.9Nouvelle-Calédonie 2000 573 75.8 37.5 37.5 5.2 27.0 6.1 .. 24.8 0.0 0.0 23.3 .. 0.1
2006 1 376 64.7 39.2 39.2 3.4 17.4 4.7 1.3 33.9 3.4 0.0 28.5 0.0 2.0
New Zealand - 1990 9 457 65.6 16.8 16.4 13.1 15.8 19.9 1.8 26.7 1.6 3.1 16.0 2.4 0.3Nouvelle-Zélande 2000 12 742 65.4 15.3 15.0 14.8 13.7 21.7 0.2 31.8 1.4 3.3 22.7 2.0 0.2
2006 22 441 61.2 15.6 15.3 13.1 10.3 22.1 0.7 36.2 2.8 3.4 24.1 2.9 0.3
Nicaragua 1990 331 69.2 34.9 34.8 10.3 5.4 18.6 .. 23.5 .. 22.6 0.9 .. ..2000 643 63.9 19.1 18.5 39.7 0.5 4.6 .. 30.6 .. 30.5 0.1 .. ..2006 (e)1 080 54.9 13.2 13.0 34.8 0.9 54.9 1.2 43.8 0.0 42.8 1.0 0.0 ..
Niger 1990 283 84.8 64.4 64.4 0.1 20.3 0.0 .. 14.2 14.2 .. .. .. ..2000 196 51.0 34.3 34.2 2.5 13.9 0.3 .. 48.9 48.9 .. 0.0 0.0 ..2006 428 64.2 35.5 35.4 26.6 0.0 2.1 11.3 24.5 23.3 0.0 1.0 0.1 ..
Nigeria - Nigéria 1990 10 273 92.0 36.6 36.5 54.2 0.0 1.2 0.2 7.6 6.5 0.7 0.3 0.0 ..2000 27 042 68.2 23.0 23.0 42.5 0.4 2.3 .. 31.6 7.0 5.0 19.5 0.0 0.02006 53 910 76.1 24.4 23.0 48.8 1.6 1.2 0.0 22.9 8.9 9.4 3.8 0.8 0.0
Norway - Norvège 1990 33 907 93.3 82.0 80.7 6.5 1.7 3.1 0.6 5.8 1.2 1.2 2.1 1.4 0.02000 57 592 95.0 79.1 78.2 8.0 1.7 6.3 0.6 4.4 0.5 0.8 2.6 0.5 ..2006 122 123 93.0 82.9 82.2 5.7 1.0 3.4 1.0 5.8 0.5 0.8 3.7 0.7 0.0
Oman 1990 4 584 18.8 13.0 12.4 3.7 2.1 0.1 0.0 81.1 4.4 0.0 15.6 61.2 0.02000 10 667 21.9 1.3 1.3 1.2 18.2 1.1 0.1 78.1 1.7 0.0 64.4 12.0 0.02006 23 620 16.9 2.1 2.0 3.7 10.9 0.2 0.1 83.1 8.9 0.0 65.2 9.0 ..
Pakistan 1990 5 587 63.0 39.3 38.1 12.4 8.2 3.1 1.6 31.0 2.2 0.3 19.0 9.5 0.02000 8 876 60.2 28.6 27.9 25.2 2.6 3.7 0.4 38.9 4.0 2.0 20.3 12.7 0.12006 17 182 47.3 22.9 22.2 21.0 1.1 2.3 1.1 50.9 5.6 2.1 27.3 16.0 0.0
Panama 1990 321 78.4 31.6 31.6 45.2 0.6 0.9 0.1 19.8 0.0 19.6 0.2 0.0 ..2000 779 65.1 17.7 17.7 45.4 1.5 0.4 0.4 27.9 0.1 24.5 3.4 0.0 ..2006 1 022 70.5 29.8 29.8 39.8 0.4 0.5 0.0 24.1 0.0 18.9 5.2 0.0 ..
Papua New Guinea - 1990 1 266 82.0 24.7 24.1 2.4 27.8 27.2 .. 17.6 0.2 0.0 17.1 0.0 0.3Papouasie-Nouvelle-Guinée 2000 2 814 53.5 10.2 10.2 1.3 11.3 30.7 0.0 14.2 0.0 0.0 13.9 0.0 0.0
2006 6 268 47.7 7.4 7.3 1.3 8.2 30.9 0.0 13.4 0.0 0.0 13.0 0.0 0.0
Paraguay 1990 1 063 39.1 33.4 28.6 3.9 0.2 1.6 0.1 51.1 0.3 47.2 3.3 0.2 0.02000 869 18.3 13.8 13.6 3.9 0.3 0.2 0.0 78.8 0.1 74.5 4.1 0.2 ..2006 1 906 13.7 7.8 6.0 3.5 1.3 1.1 12.0 64.6 1.7 59.5 2.8 0.5 0.0
Peru - Pérou 1990 3 276 71.0 34.2 33.4 22.3 13.4 1.1 3.4 24.9 0.7 15.7 7.8 0.6 0.02000 6 872 64.5 29.2 20.5 28.1 4.7 2.5 0.3 33.6 0.6 18.6 13.7 0.7 0.02006 23 744 61.4 25.1 17.9 24.1 5.2 7.0 0.3 36.2 0.5 20.1 15.2 0.3 0.0
Philippines 1990 8 195 79.3 18.8 18.5 37.9 19.8 2.8 0.0 20.0 0.3 0.9 17.5 1.1 0.02000 38 216 64.7 18.3 18.1 29.8 14.7 1.9 0.0 34.9 0.1 1.1 33.2 0.4 0.02006 46 976 55.2 18.6 18.5 18.3 16.5 1.8 0.1 44.7 0.3 0.8 42.8 0.7 0.0
Poland - Pologne 1990 13 627 72.0 67.5 61.8 2.8 0.8 0.9 16.9 9.9 2.6 1.5 3.8 2.1 ..2000 31 645 87.7 83.2 81.3 3.2 0.2 1.1 7.1 5.0 1.2 1.2 1.9 0.8 0.02006 110 890 84.5 81.7 79.0 1.9 0.2 0.7 9.9 5.2 0.9 0.8 1.9 1.7 0.0
Portugal 1990 16 402 91.6 84.4 81.1 4.8 1.0 1.4 0.5 6.9 4.6 0.6 1.2 0.4 0.02000 23 297 91.2 83.3 80.8 6.0 0.5 1.4 0.1 8.0 4.0 1.7 1.4 0.9 0.02006 43 350 83.3 76.0 74.8 6.1 0.3 0.9 0.5 12.5 5.9 1.7 3.7 1.2 0.0
Qatar 1990 3 293 63.9 2.3 2.3 1.6 59.5 0.5 0.0 33.4 0.7 8.9 18.1 5.7 0.02000 11 593 50.8 1.1 1.0 3.1 45.0 1.6 0.0 39.5 0.9 0.1 32.3 6.1 ..2006 33 376 49.8 6.8 6.2 0.8 41.0 1.3 0.0 43.1 1.2 0.1 37.3 4.5 ..
For sources and notes, see end of table. Pour les sources et les notes, se reporter à la fin du tableau.
Other
AutresTotal
Destination
Year
Année
World(millions
of dollars)(1)
Monde(millions
de dollars)(1)
Developed economiesÉconomies développées
Oceania
Océanie
Percentage / En pourcentage
Economiesin transition
Économiesen
transition
Developing economiesÉconomies en développement
Total
Europe
USA
États-Unis
Japan
Japon
Eastern,Southern and
South-Eastern Asia
Asieorientale,
méridionaleet du Sud-Est
WesternAsia
Asieocciden-
tale
Africa
Afrique
America
Amérique
2.1 Country trade structure by partner:Exports by main region of destination
2.1 Structure du commerce des pays par partenaires :Exportations par principales régions de destination
58
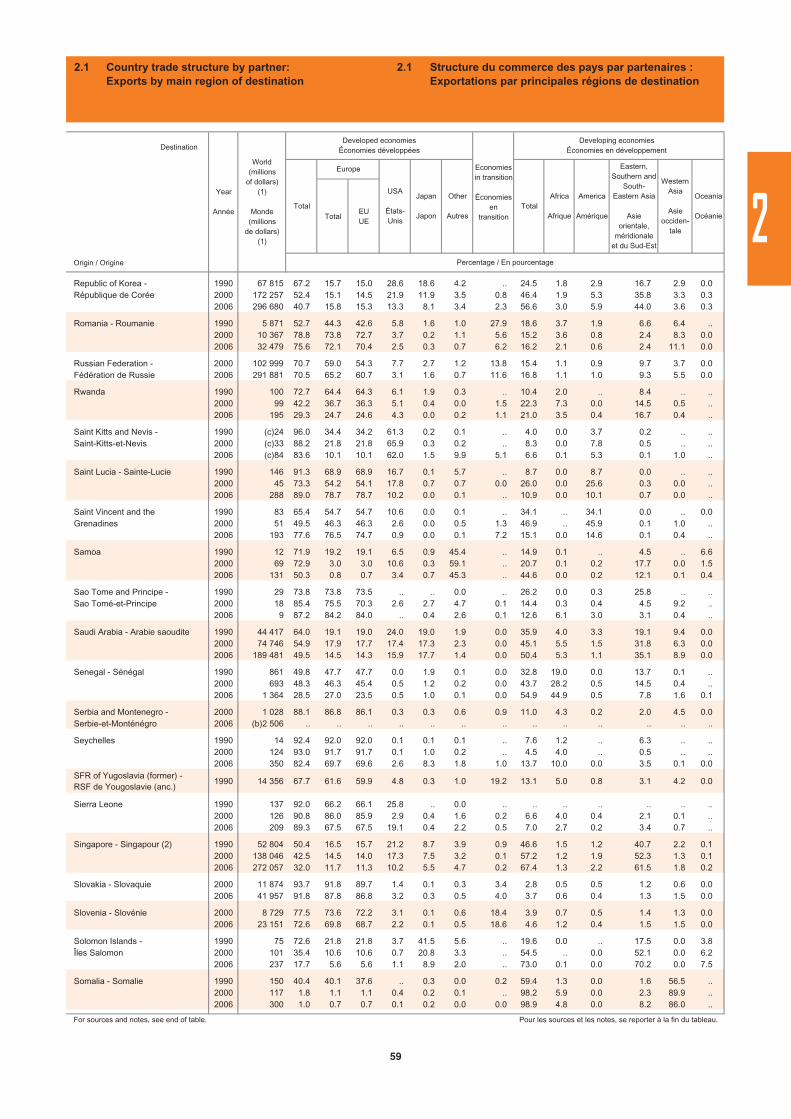
TotalEUUE
Origin / Origine
Republic of Korea - 1990 67 815 67.2 15.7 15.0 28.6 18.6 4.2 .. 24.5 1.8 2.9 16.7 2.9 0.0République de Corée 2000 172 257 52.4 15.1 14.5 21.9 11.9 3.5 0.8 46.4 1.9 5.3 35.8 3.3 0.3
2006 296 680 40.7 15.8 15.3 13.3 8.1 3.4 2.3 56.6 3.0 5.9 44.0 3.6 0.3
Romania - Roumanie 1990 5 871 52.7 44.3 42.6 5.8 1.6 1.0 27.9 18.6 3.7 1.9 6.6 6.4 ..2000 10 367 78.8 73.8 72.7 3.7 0.2 1.1 5.6 15.2 3.6 0.8 2.4 8.3 0.02006 32 479 75.6 72.1 70.4 2.5 0.3 0.7 6.2 16.2 2.1 0.6 2.4 11.1 0.0
Russian Federation - 2000 102 999 70.7 59.0 54.3 7.7 2.7 1.2 13.8 15.4 1.1 0.9 9.7 3.7 0.0Fédération de Russie 2006 291 881 70.5 65.2 60.7 3.1 1.6 0.7 11.6 16.8 1.1 1.0 9.3 5.5 0.0
Rwanda 1990 100 72.7 64.4 64.3 6.1 1.9 0.3 .. 10.4 2.0 .. 8.4 .. ..2000 99 42.2 36.7 36.3 5.1 0.4 0.0 1.5 22.3 7.3 0.0 14.5 0.5 ..2006 195 29.3 24.7 24.6 4.3 0.0 0.2 1.1 21.0 3.5 0.4 16.7 0.4 ..
Saint Kitts and Nevis - 1990 (c)24 96.0 34.4 34.2 61.3 0.2 0.1 .. 4.0 0.0 3.7 0.2 .. ..Saint-Kitts-et-Nevis 2000 (c)33 88.2 21.8 21.8 65.9 0.3 0.2 .. 8.3 0.0 7.8 0.5 .. ..
2006 (c)84 83.6 10.1 10.1 62.0 1.5 9.9 5.1 6.6 0.1 5.3 0.1 1.0 ..
Saint Lucia - Sainte-Lucie 1990 146 91.3 68.9 68.9 16.7 0.1 5.7 .. 8.7 0.0 8.7 0.0 .. ..2000 45 73.3 54.2 54.1 17.8 0.7 0.7 0.0 26.0 0.0 25.6 0.3 0.0 ..2006 288 89.0 78.7 78.7 10.2 0.0 0.1 .. 10.9 0.0 10.1 0.7 0.0 ..
Saint Vincent and the 1990 83 65.4 54.7 54.7 10.6 0.0 0.1 .. 34.1 .. 34.1 0.0 .. 0.0Grenadines 2000 51 49.5 46.3 46.3 2.6 0.0 0.5 1.3 46.9 .. 45.9 0.1 1.0 ..
2006 193 77.6 76.5 74.7 0.9 0.0 0.1 7.2 15.1 0.0 14.6 0.1 0.4 ..
Samoa 1990 12 71.9 19.2 19.1 6.5 0.9 45.4 .. 14.9 0.1 .. 4.5 .. 6.62000 69 72.9 3.0 3.0 10.6 0.3 59.1 .. 20.7 0.1 0.2 17.7 0.0 1.52006 131 50.3 0.8 0.7 3.4 0.7 45.3 .. 44.6 0.0 0.2 12.1 0.1 0.4
Sao Tome and Principe - 1990 29 73.8 73.8 73.5 .. .. 0.0 .. 26.2 0.0 0.3 25.8 .. ..Sao Tomé-et-Principe 2000 18 85.4 75.5 70.3 2.6 2.7 4.7 0.1 14.4 0.3 0.4 4.5 9.2 ..
2006 9 87.2 84.2 84.0 .. 0.4 2.6 0.1 12.6 6.1 3.0 3.1 0.4 ..
Saudi Arabia - Arabie saoudite 1990 44 417 64.0 19.1 19.0 24.0 19.0 1.9 0.0 35.9 4.0 3.3 19.1 9.4 0.02000 74 746 54.9 17.9 17.7 17.4 17.3 2.3 0.0 45.1 5.5 1.5 31.8 6.3 0.02006 189 481 49.5 14.5 14.3 15.9 17.7 1.4 0.0 50.4 5.3 1.1 35.1 8.9 0.0
Senegal - Sénégal 1990 861 49.8 47.7 47.7 0.0 1.9 0.1 0.0 32.8 19.0 0.0 13.7 0.1 ..2000 693 48.3 46.3 45.4 0.5 1.2 0.2 0.0 43.7 28.2 0.5 14.5 0.4 ..2006 1 364 28.5 27.0 23.5 0.5 1.0 0.1 0.0 54.9 44.9 0.5 7.8 1.6 0.1
Serbia and Montenegro - 2000 1 028 88.1 86.8 86.1 0.3 0.3 0.6 0.9 11.0 4.3 0.2 2.0 4.5 0.0Serbie-et-Monténégro 2006 (b)2 506 .. .. .. .. .. .. .. .. .. .. .. .. ..
Seychelles 1990 14 92.4 92.0 92.0 0.1 0.1 0.1 .. 7.6 1.2 .. 6.3 .. ..2000 124 93.0 91.7 91.7 0.1 1.0 0.2 .. 4.5 4.0 .. 0.5 .. ..2006 350 82.4 69.7 69.6 2.6 8.3 1.8 1.0 13.7 10.0 0.0 3.5 0.1 0.0
SFR of Yugoslavia (former) - RSF de Yougoslavie (anc.)
1990 14 356 67.7 61.6 59.9 4.8 0.3 1.0 19.2 13.1 5.0 0.8 3.1 4.2 0.0
Sierra Leone 1990 137 92.0 66.2 66.1 25.8 .. 0.0 .. .. .. .. .. .. ..2000 126 90.8 86.0 85.9 2.9 0.4 1.6 0.2 6.6 4.0 0.4 2.1 0.1 ..2006 209 89.3 67.5 67.5 19.1 0.4 2.2 0.5 7.0 2.7 0.2 3.4 0.7 ..
Singapore - Singapour (2) 1990 52 804 50.4 16.5 15.7 21.2 8.7 3.9 0.9 46.6 1.5 1.2 40.7 2.2 0.12000 138 046 42.5 14.5 14.0 17.3 7.5 3.2 0.1 57.2 1.2 1.9 52.3 1.3 0.12006 272 057 32.0 11.7 11.3 10.2 5.5 4.7 0.2 67.4 1.3 2.2 61.5 1.8 0.2
Slovakia - Slovaquie 2000 11 874 93.7 91.8 89.7 1.4 0.1 0.3 3.4 2.8 0.5 0.5 1.2 0.6 0.02006 41 957 91.8 87.8 86.8 3.2 0.3 0.5 4.0 3.7 0.6 0.4 1.3 1.5 0.0
Slovenia - Slovénie 2000 8 729 77.5 73.6 72.2 3.1 0.1 0.6 18.4 3.9 0.7 0.5 1.4 1.3 0.02006 23 151 72.6 69.8 68.7 2.2 0.1 0.5 18.6 4.6 1.2 0.4 1.5 1.5 0.0
Solomon Islands - 1990 75 72.6 21.8 21.8 3.7 41.5 5.6 .. 19.6 0.0 .. 17.5 0.0 3.8Îles Salomon 2000 101 35.4 10.6 10.6 0.7 20.8 3.3 .. 54.5 .. 0.0 52.1 0.0 6.2
2006 237 17.7 5.6 5.6 1.1 8.9 2.0 .. 73.0 0.1 0.0 70.2 0.0 7.5
Somalia - Somalie 1990 150 40.4 40.1 37.6 .. 0.3 0.0 0.2 59.4 1.3 0.0 1.6 56.5 ..2000 117 1.8 1.1 1.1 0.4 0.2 0.1 .. 98.2 5.9 0.0 2.3 89.9 ..2006 300 1.0 0.7 0.7 0.1 0.2 0.0 0.0 98.9 4.8 0.0 8.2 86.0 ..
For sources and notes, see end of table. Pour les sources et les notes, se reporter à la fin du tableau.
Oceania
Océanie
Percentage / En pourcentage
Destination
Year
Année
World(millions
of dollars)(1)
Monde(millions
de dollars)(1)
Developed economiesÉconomies développées
Total
Europe
Other
AutresTotal
Africa
Afrique
America
Amérique
Eastern,Southern and
South-Eastern Asia
Asieorientale,
méridionaleet du Sud-Est
WesternAsia
Asieocciden-
tale
USA
États-Unis
Japan
Japon
Economiesin transition
Économiesen
transition
Developing economiesÉconomies en développement
2.1 Country trade structure by partner:Exports by main region of destination
2.1 Structure du commerce des pays par partenaires :Exportations par principales régions de destination
2
59
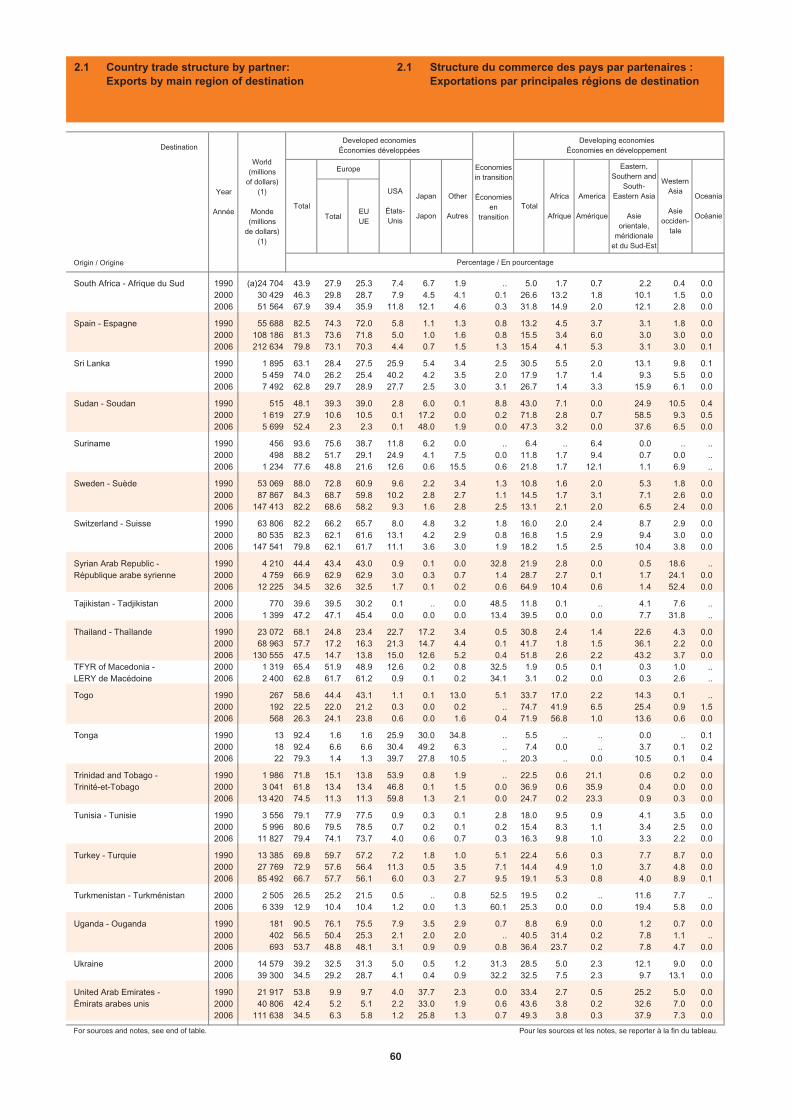
TotalEUUE
Origin / Origine
South Africa - Afrique du Sud 1990 (a)24 704 43.9 27.9 25.3 7.4 6.7 1.9 .. 5.0 1.7 0.7 2.2 0.4 0.02000 30 429 46.3 29.8 28.7 7.9 4.5 4.1 0.1 26.6 13.2 1.8 10.1 1.5 0.02006 51 564 67.9 39.4 35.9 11.8 12.1 4.6 0.3 31.8 14.9 2.0 12.1 2.8 0.0
Spain - Espagne 1990 55 688 82.5 74.3 72.0 5.8 1.1 1.3 0.8 13.2 4.5 3.7 3.1 1.8 0.02000 108 186 81.3 73.6 71.8 5.0 1.0 1.6 0.8 15.5 3.4 6.0 3.0 3.0 0.02006 212 634 79.8 73.1 70.3 4.4 0.7 1.5 1.3 15.4 4.1 5.3 3.1 3.0 0.1
Sri Lanka 1990 1 895 63.1 28.4 27.5 25.9 5.4 3.4 2.5 30.5 5.5 2.0 13.1 9.8 0.12000 5 459 74.0 26.2 25.4 40.2 4.2 3.5 2.0 17.9 1.7 1.4 9.3 5.5 0.02006 7 492 62.8 29.7 28.9 27.7 2.5 3.0 3.1 26.7 1.4 3.3 15.9 6.1 0.0
Sudan - Soudan 1990 515 48.1 39.3 39.0 2.8 6.0 0.1 8.8 43.0 7.1 0.0 24.9 10.5 0.42000 1 619 27.9 10.6 10.5 0.1 17.2 0.0 0.2 71.8 2.8 0.7 58.5 9.3 0.52006 5 699 52.4 2.3 2.3 0.1 48.0 1.9 0.0 47.3 3.2 0.0 37.6 6.5 0.0
Suriname 1990 456 93.6 75.6 38.7 11.8 6.2 0.0 .. 6.4 .. 6.4 0.0 .. ..2000 498 88.2 51.7 29.1 24.9 4.1 7.5 0.0 11.8 1.7 9.4 0.7 0.0 ..2006 1 234 77.6 48.8 21.6 12.6 0.6 15.5 0.6 21.8 1.7 12.1 1.1 6.9 ..
Sweden - Suède 1990 53 069 88.0 72.8 60.9 9.6 2.2 3.4 1.3 10.8 1.6 2.0 5.3 1.8 0.02000 87 867 84.3 68.7 59.8 10.2 2.8 2.7 1.1 14.5 1.7 3.1 7.1 2.6 0.02006 147 413 82.2 68.6 58.2 9.3 1.6 2.8 2.5 13.1 2.1 2.0 6.5 2.4 0.0
Switzerland - Suisse 1990 63 806 82.2 66.2 65.7 8.0 4.8 3.2 1.8 16.0 2.0 2.4 8.7 2.9 0.02000 80 535 82.3 62.1 61.6 13.1 4.2 2.9 0.8 16.8 1.5 2.9 9.4 3.0 0.02006 147 541 79.8 62.1 61.7 11.1 3.6 3.0 1.9 18.2 1.5 2.5 10.4 3.8 0.0
Syrian Arab Republic - 1990 4 210 44.4 43.4 43.0 0.9 0.1 0.0 32.8 21.9 2.8 0.0 0.5 18.6 ..République arabe syrienne 2000 4 759 66.9 62.9 62.9 3.0 0.3 0.7 1.4 28.7 2.7 0.1 1.7 24.1 0.0
2006 12 225 34.5 32.6 32.5 1.7 0.1 0.2 0.6 64.9 10.4 0.6 1.4 52.4 0.0
Tajikistan - Tadjikistan 2000 770 39.6 39.5 30.2 0.1 .. 0.0 48.5 11.8 0.1 .. 4.1 7.6 ..2006 1 399 47.2 47.1 45.4 0.0 0.0 0.0 13.4 39.5 0.0 0.0 7.7 31.8 ..
Thailand - Thaïlande 1990 23 072 68.1 24.8 23.4 22.7 17.2 3.4 0.5 30.8 2.4 1.4 22.6 4.3 0.02000 68 963 57.7 17.2 16.3 21.3 14.7 4.4 0.1 41.7 1.8 1.5 36.1 2.2 0.02006 130 555 47.5 14.7 13.8 15.0 12.6 5.2 0.4 51.8 2.6 2.2 43.2 3.7 0.0
TFYR of Macedonia - 2000 1 319 65.4 51.9 48.9 12.6 0.2 0.8 32.5 1.9 0.5 0.1 0.3 1.0 ..LERY de Macédoine 2006 2 400 62.8 61.7 61.2 0.9 0.1 0.2 34.1 3.1 0.2 0.0 0.3 2.6 ..
Togo 1990 267 58.6 44.4 43.1 1.1 0.1 13.0 5.1 33.7 17.0 2.2 14.3 0.1 ..2000 192 22.5 22.0 21.2 0.3 0.0 0.2 .. 74.7 41.9 6.5 25.4 0.9 1.52006 568 26.3 24.1 23.8 0.6 0.0 1.6 0.4 71.9 56.8 1.0 13.6 0.6 0.0
Tonga 1990 13 92.4 1.6 1.6 25.9 30.0 34.8 .. 5.5 .. .. 0.0 .. 0.12000 18 92.4 6.6 6.6 30.4 49.2 6.3 .. 7.4 0.0 .. 3.7 0.1 0.22006 22 79.3 1.4 1.3 39.7 27.8 10.5 .. 20.3 .. 0.0 10.5 0.1 0.4
Trinidad and Tobago - 1990 1 986 71.8 15.1 13.8 53.9 0.8 1.9 .. 22.5 0.6 21.1 0.6 0.2 0.0Trinité-et-Tobago 2000 3 041 61.8 13.4 13.4 46.8 0.1 1.5 0.0 36.9 0.6 35.9 0.4 0.0 0.0
2006 13 420 74.5 11.3 11.3 59.8 1.3 2.1 0.0 24.7 0.2 23.3 0.9 0.3 0.0
Tunisia - Tunisie 1990 3 556 79.1 77.9 77.5 0.9 0.3 0.1 2.8 18.0 9.5 0.9 4.1 3.5 0.02000 5 996 80.6 79.5 78.5 0.7 0.2 0.1 0.2 15.4 8.3 1.1 3.4 2.5 0.02006 11 827 79.4 74.1 73.7 4.0 0.6 0.7 0.3 16.3 9.8 1.0 3.3 2.2 0.0
Turkey - Turquie 1990 13 385 69.8 59.7 57.2 7.2 1.8 1.0 5.1 22.4 5.6 0.3 7.7 8.7 0.02000 27 769 72.9 57.6 56.4 11.3 0.5 3.5 7.1 14.4 4.9 1.0 3.7 4.8 0.02006 85 492 66.7 57.7 56.1 6.0 0.3 2.7 9.5 19.1 5.3 0.8 4.0 8.9 0.1
Turkmenistan - Turkménistan 2000 2 505 26.5 25.2 21.5 0.5 .. 0.8 52.5 19.5 0.2 .. 11.6 7.7 ..2006 6 339 12.9 10.4 10.4 1.2 0.0 1.3 60.1 25.3 0.0 0.0 19.4 5.8 0.0
Uganda - Ouganda 1990 181 90.5 76.1 75.5 7.9 3.5 2.9 0.7 8.8 6.9 0.0 1.2 0.7 0.02000 402 56.5 50.4 25.3 2.1 2.0 2.0 .. 40.5 31.4 0.2 7.8 1.1 ..2006 693 53.7 48.8 48.1 3.1 0.9 0.9 0.8 36.4 23.7 0.2 7.8 4.7 0.0
Ukraine 2000 14 579 39.2 32.5 31.3 5.0 0.5 1.2 31.3 28.5 5.0 2.3 12.1 9.0 0.02006 39 300 34.5 29.2 28.7 4.1 0.4 0.9 32.2 32.5 7.5 2.3 9.7 13.1 0.0
United Arab Emirates - 1990 21 917 53.8 9.9 9.7 4.0 37.7 2.3 0.0 33.4 2.7 0.5 25.2 5.0 0.0Émirats arabes unis 2000 40 806 42.4 5.2 5.1 2.2 33.0 1.9 0.6 43.6 3.8 0.2 32.6 7.0 0.0
2006 111 638 34.5 6.3 5.8 1.2 25.8 1.3 0.7 49.3 3.8 0.3 37.9 7.3 0.0
For sources and notes, see end of table. Pour les sources et les notes, se reporter à la fin du tableau.
Africa
Afrique
America
Amérique
Eastern,Southern and
South-Eastern Asia
Asieorientale,
méridionaleet du Sud-Est
Destination
Year
Année
World(millions
of dollars)(1)
Monde(millions
de dollars)(1)
Developed economiesÉconomies développées
Other
Autres
WesternAsia
Asieocciden-
tale
Oceania
Océanie
Percentage / En pourcentage
Economiesin transition
Économiesen
transition
Developing economiesÉconomies en développement
Total
Europe
USA
États-Unis
Japan
JaponTotal
2.1 Country trade structure by partner:Exports by main region of destination
2.1 Structure du commerce des pays par partenaires :Exportations par principales régions de destination
60
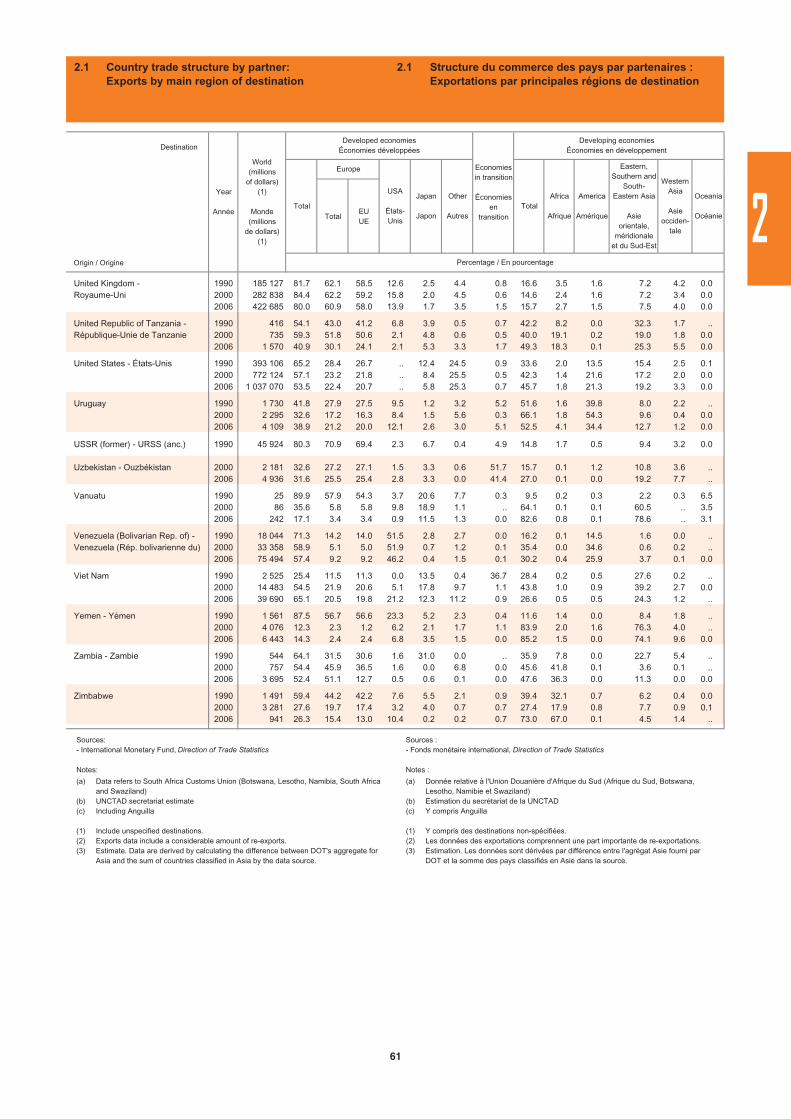
TotalEUUE
Origin / Origine
United Kingdom - 1990 185 127 81.7 62.1 58.5 12.6 2.5 4.4 0.8 16.6 3.5 1.6 7.2 4.2 0.0Royaume-Uni 2000 282 838 84.4 62.2 59.2 15.8 2.0 4.5 0.6 14.6 2.4 1.6 7.2 3.4 0.0
2006 422 685 80.0 60.9 58.0 13.9 1.7 3.5 1.5 15.7 2.7 1.5 7.5 4.0 0.0
United Republic of Tanzania - 1990 416 54.1 43.0 41.2 6.8 3.9 0.5 0.7 42.2 8.2 0.0 32.3 1.7 ..République-Unie de Tanzanie 2000 735 59.3 51.8 50.6 2.1 4.8 0.6 0.5 40.0 19.1 0.2 19.0 1.8 0.0
2006 1 570 40.9 30.1 24.1 2.1 5.3 3.3 1.7 49.3 18.3 0.1 25.3 5.5 0.0
United States - États-Unis 1990 393 106 65.2 28.4 26.7 .. 12.4 24.5 0.9 33.6 2.0 13.5 15.4 2.5 0.12000 772 124 57.1 23.2 21.8 .. 8.4 25.5 0.5 42.3 1.4 21.6 17.2 2.0 0.02006 1 037 070 53.5 22.4 20.7 .. 5.8 25.3 0.7 45.7 1.8 21.3 19.2 3.3 0.0
Uruguay 1990 1 730 41.8 27.9 27.5 9.5 1.2 3.2 5.2 51.6 1.6 39.8 8.0 2.2 ..2000 2 295 32.6 17.2 16.3 8.4 1.5 5.6 0.3 66.1 1.8 54.3 9.6 0.4 0.02006 4 109 38.9 21.2 20.0 12.1 2.6 3.0 5.1 52.5 4.1 34.4 12.7 1.2 0.0
USSR (former) - URSS (anc.) 1990 45 924 80.3 70.9 69.4 2.3 6.7 0.4 4.9 14.8 1.7 0.5 9.4 3.2 0.0
Uzbekistan - Ouzbékistan 2000 2 181 32.6 27.2 27.1 1.5 3.3 0.6 51.7 15.7 0.1 1.2 10.8 3.6 ..2006 4 936 31.6 25.5 25.4 2.8 3.3 0.0 41.4 27.0 0.1 0.0 19.2 7.7 ..
Vanuatu 1990 25 89.9 57.9 54.3 3.7 20.6 7.7 0.3 9.5 0.2 0.3 2.2 0.3 6.52000 86 35.6 5.8 5.8 9.8 18.9 1.1 .. 64.1 0.1 0.1 60.5 .. 3.52006 242 17.1 3.4 3.4 0.9 11.5 1.3 0.0 82.6 0.8 0.1 78.6 .. 3.1
Venezuela (Bolivarian Rep. of) - 1990 18 044 71.3 14.2 14.0 51.5 2.8 2.7 0.0 16.2 0.1 14.5 1.6 0.0 ..Venezuela (Rép. bolivarienne du) 2000 33 358 58.9 5.1 5.0 51.9 0.7 1.2 0.1 35.4 0.0 34.6 0.6 0.2 ..
2006 75 494 57.4 9.2 9.2 46.2 0.4 1.5 0.1 30.2 0.4 25.9 3.7 0.1 0.0
Viet Nam 1990 2 525 25.4 11.5 11.3 0.0 13.5 0.4 36.7 28.4 0.2 0.5 27.6 0.2 ..2000 14 483 54.5 21.9 20.6 5.1 17.8 9.7 1.1 43.8 1.0 0.9 39.2 2.7 0.02006 39 690 65.1 20.5 19.8 21.2 12.3 11.2 0.9 26.6 0.5 0.5 24.3 1.2 ..
Yemen - Yémen 1990 1 561 87.5 56.7 56.6 23.3 5.2 2.3 0.4 11.6 1.4 0.0 8.4 1.8 ..2000 4 076 12.3 2.3 1.2 6.2 2.1 1.7 1.1 83.9 2.0 1.6 76.3 4.0 ..2006 6 443 14.3 2.4 2.4 6.8 3.5 1.5 0.0 85.2 1.5 0.0 74.1 9.6 0.0
Zambia - Zambie 1990 544 64.1 31.5 30.6 1.6 31.0 0.0 .. 35.9 7.8 0.0 22.7 5.4 ..2000 757 54.4 45.9 36.5 1.6 0.0 6.8 0.0 45.6 41.8 0.1 3.6 0.1 ..2006 3 695 52.4 51.1 12.7 0.5 0.6 0.1 0.0 47.6 36.3 0.0 11.3 0.0 0.0
Zimbabwe 1990 1 491 59.4 44.2 42.2 7.6 5.5 2.1 0.9 39.4 32.1 0.7 6.2 0.4 0.02000 3 281 27.6 19.7 17.4 3.2 4.0 0.7 0.7 27.4 17.9 0.8 7.7 0.9 0.12006 941 26.3 15.4 13.0 10.4 0.2 0.2 0.7 73.0 67.0 0.1 4.5 1.4 ..
Destination
Year
Année
World(millions
of dollars)(1)
Monde(millions
de dollars)(1)
Developed economiesÉconomies développées
Economiesin transition
Économiesen
transition
Developing economiesÉconomies en développement
Total
Europe
Oceania
Océanie
Percentage / En pourcentage
Africa
Afrique
America
Amérique
Eastern,Southern and
South-Eastern Asia
Asieorientale,
méridionaleet du Sud-Est
WesternAsia
Asieocciden-
tale
USA
États-Unis
Japan
Japon
Other
AutresTotal
2.1 Country trade structure by partner:Exports by main region of destination
2.1 Structure du commerce des pays par partenaires :Exportations par principales régions de destination
(a)
(b)(c)
(1)(2)(3)
Data refers to South Africa Customs Union (Botswana, Lesotho, Namibia, South Africa and Swaziland) UNCTAD secretariat estimateIncluding Anguilla
Include unspecified destinations.Exports data include a considerable amount of re-exports.Estimate. Data are derived by calculating the difference between DOT's aggregate for Asia and the sum of countries classified in Asia by the data source.
Sources:- International Monetary Fund, Direction of Trade Statistics
Notes:
(a)
(b)(c)
(1)(2)(3)
Donnée relative à l'Union Douanière d'Afrique du Sud (Afrique du Sud, Botswana, Lesotho, Namibie et Swaziland) Estimation du secrétariat de la UNCTAD Y compris Anguilla
Y compris des destinations non-spécifiées.Les données des exportations comprennent une part importante de re-exportations.Estimation. Les données sont dérivées par différence entre l'agrégat Asie fourni par DOT et la somme des pays classifiés en Asie dans la source.
Sources : - Fonds monétaire international, Direction of Trade Statistics
Notes :
2
61
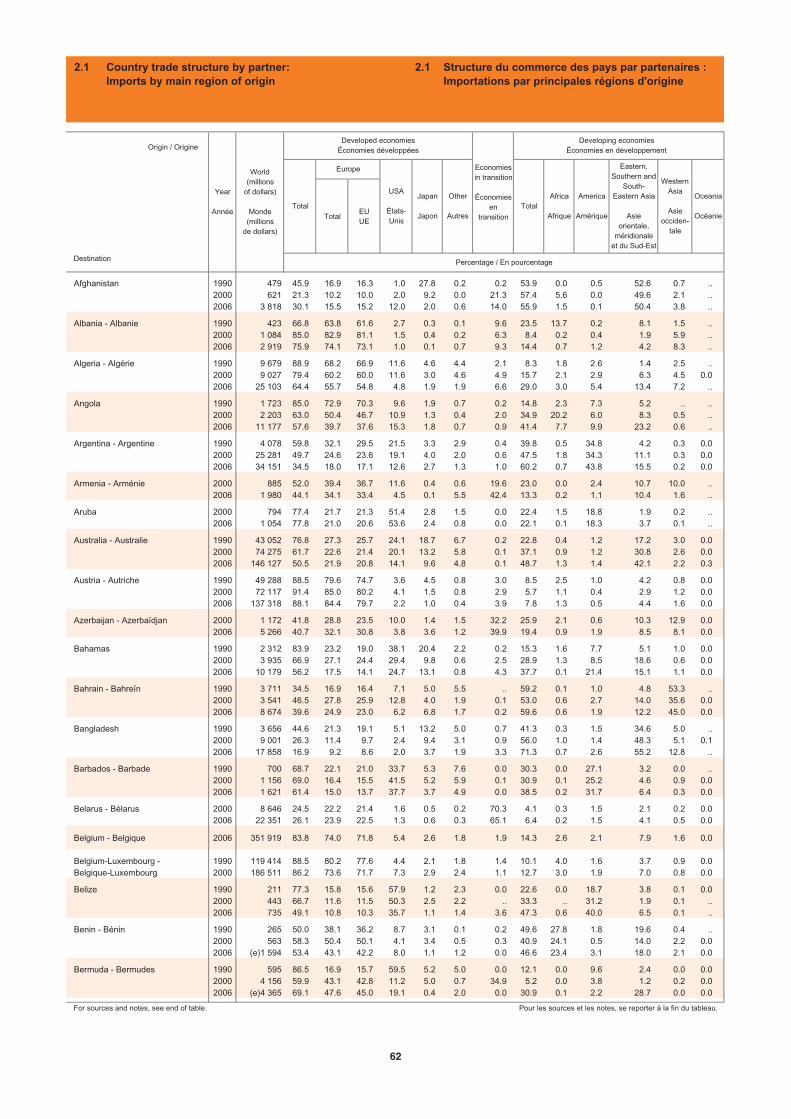
TotalEUUE
Destination
Afghanistan 1990 479 45.9 16.9 16.3 1.0 27.8 0.2 0.2 53.9 0.0 0.5 52.6 0.7 ..2000 621 21.3 10.2 10.0 2.0 9.2 0.0 21.3 57.4 5.6 0.0 49.6 2.1 ..2006 3 818 30.1 15.5 15.2 12.0 2.0 0.6 14.0 55.9 1.5 0.1 50.4 3.8 ..
Albania - Albanie 1990 423 66.8 63.8 61.6 2.7 0.3 0.1 9.6 23.5 13.7 0.2 8.1 1.5 ..2000 1 084 85.0 82.9 81.1 1.5 0.4 0.2 6.3 8.4 0.2 0.4 1.9 5.9 ..2006 2 919 75.9 74.1 73.1 1.0 0.1 0.7 9.3 14.4 0.7 1.2 4.2 8.3 ..
Algeria - Algérie 1990 9 679 88.9 68.2 66.9 11.6 4.6 4.4 2.1 8.3 1.8 2.6 1.4 2.5 ..2000 9 027 79.4 60.2 60.0 11.6 3.0 4.6 4.9 15.7 2.1 2.9 6.3 4.5 0.02006 25 103 64.4 55.7 54.8 4.8 1.9 1.9 6.6 29.0 3.0 5.4 13.4 7.2 ..
Angola 1990 1 723 85.0 72.9 70.3 9.6 1.9 0.7 0.2 14.8 2.3 7.3 5.2 .. ..2000 2 203 63.0 50.4 46.7 10.9 1.3 0.4 2.0 34.9 20.2 6.0 8.3 0.5 ..2006 11 177 57.6 39.7 37.6 15.3 1.8 0.7 0.9 41.4 7.7 9.9 23.2 0.6 ..
Argentina - Argentine 1990 4 078 59.8 32.1 29.5 21.5 3.3 2.9 0.4 39.8 0.5 34.8 4.2 0.3 0.02000 25 281 49.7 24.6 23.6 19.1 4.0 2.0 0.6 47.5 1.8 34.3 11.1 0.3 0.02006 34 151 34.5 18.0 17.1 12.6 2.7 1.3 1.0 60.2 0.7 43.8 15.5 0.2 0.0
Armenia - Arménie 2000 885 52.0 39.4 36.7 11.6 0.4 0.6 19.6 23.0 0.0 2.4 10.7 10.0 ..2006 1 980 44.1 34.1 33.4 4.5 0.1 5.5 42.4 13.3 0.2 1.1 10.4 1.6 ..
Aruba 2000 794 77.4 21.7 21.3 51.4 2.8 1.5 0.0 22.4 1.5 18.8 1.9 0.2 ..2006 1 054 77.8 21.0 20.6 53.6 2.4 0.8 0.0 22.1 0.1 18.3 3.7 0.1 ..
Australia - Australie 1990 43 052 76.8 27.3 25.7 24.1 18.7 6.7 0.2 22.8 0.4 1.2 17.2 3.0 0.02000 74 275 61.7 22.6 21.4 20.1 13.2 5.8 0.1 37.1 0.9 1.2 30.8 2.6 0.02006 146 127 50.5 21.9 20.8 14.1 9.6 4.8 0.1 48.7 1.3 1.4 42.1 2.2 0.3
Austria - Autriche 1990 49 288 88.5 79.6 74.7 3.6 4.5 0.8 3.0 8.5 2.5 1.0 4.2 0.8 0.02000 72 117 91.4 85.0 80.2 4.1 1.5 0.8 2.9 5.7 1.1 0.4 2.9 1.2 0.02006 137 318 88.1 84.4 79.7 2.2 1.0 0.4 3.9 7.8 1.3 0.5 4.4 1.6 0.0
Azerbaijan - Azerbaïdjan 2000 1 172 41.8 28.8 23.5 10.0 1.4 1.5 32.2 25.9 2.1 0.6 10.3 12.9 0.02006 5 266 40.7 32.1 30.8 3.8 3.6 1.2 39.9 19.4 0.9 1.9 8.5 8.1 0.0
Bahamas 1990 2 312 83.9 23.2 19.0 38.1 20.4 2.2 0.2 15.3 1.6 7.7 5.1 1.0 0.02000 3 935 66.9 27.1 24.4 29.4 9.8 0.6 2.5 28.9 1.3 8.5 18.6 0.6 0.02006 10 179 56.2 17.5 14.1 24.7 13.1 0.8 4.3 37.7 0.1 21.4 15.1 1.1 0.0
Bahrain - Bahreïn 1990 3 711 34.5 16.9 16.4 7.1 5.0 5.5 .. 59.2 0.1 1.0 4.8 53.3 ..2000 3 541 46.5 27.8 25.9 12.8 4.0 1.9 0.1 53.0 0.6 2.7 14.0 35.6 0.02006 8 674 39.6 24.9 23.0 6.2 6.8 1.7 0.2 59.6 0.6 1.9 12.2 45.0 0.0
Bangladesh 1990 3 656 44.6 21.3 19.1 5.1 13.2 5.0 0.7 41.3 0.3 1.5 34.6 5.0 ..2000 9 001 26.3 11.4 9.7 2.4 9.4 3.1 0.9 56.0 1.0 1.4 48.3 5.1 0.12006 17 858 16.9 9.2 8.6 2.0 3.7 1.9 3.3 71.3 0.7 2.6 55.2 12.8 ..
Barbados - Barbade 1990 700 68.7 22.1 21.0 33.7 5.3 7.6 0.0 30.3 0.0 27.1 3.2 0.0 ..2000 1 156 69.0 16.4 15.5 41.5 5.2 5.9 0.1 30.9 0.1 25.2 4.6 0.9 0.02006 1 621 61.4 15.0 13.7 37.7 3.7 4.9 0.0 38.5 0.2 31.7 6.4 0.3 0.0
Belarus - Bélarus 2000 8 646 24.5 22.2 21.4 1.6 0.5 0.2 70.3 4.1 0.3 1.5 2.1 0.2 0.02006 22 351 26.1 23.9 22.5 1.3 0.6 0.3 65.1 6.4 0.2 1.5 4.1 0.5 0.0
Belgium - Belgique 2006 351 919 83.8 74.0 71.8 5.4 2.6 1.8 1.9 14.3 2.6 2.1 7.9 1.6 0.0
Belgium-Luxembourg - 1990 119 414 88.5 80.2 77.6 4.4 2.1 1.8 1.4 10.1 4.0 1.6 3.7 0.9 0.0Belgique-Luxembourg 2000 186 511 86.2 73.6 71.7 7.3 2.9 2.4 1.1 12.7 3.0 1.9 7.0 0.8 0.0
Belize 1990 211 77.3 15.8 15.6 57.9 1.2 2.3 0.0 22.6 0.0 18.7 3.8 0.1 0.02000 443 66.7 11.6 11.5 50.3 2.5 2.2 .. 33.3 .. 31.2 1.9 0.1 ..2006 735 49.1 10.8 10.3 35.7 1.1 1.4 3.6 47.3 0.6 40.0 6.5 0.1 ..
Benin - Bénin 1990 265 50.0 38.1 36.2 8.7 3.1 0.1 0.2 49.6 27.8 1.8 19.6 0.4 ..2000 563 58.3 50.4 50.1 4.1 3.4 0.5 0.3 40.9 24.1 0.5 14.0 2.2 0.02006 (e)1 594 53.4 43.1 42.2 8.0 1.1 1.2 0.0 46.6 23.4 3.1 18.0 2.1 0.0
Bermuda - Bermudes 1990 595 86.5 16.9 15.7 59.5 5.2 5.0 0.0 12.1 0.0 9.6 2.4 0.0 0.02000 4 156 59.9 43.1 42.8 11.2 5.0 0.7 34.9 5.2 0.0 3.8 1.2 0.2 0.02006 (e)4 365 69.1 47.6 45.0 19.1 0.4 2.0 0.0 30.9 0.1 2.2 28.7 0.0 0.0
For sources and notes, see end of table. Pour les sources et les notes, se reporter à la fin du tableau.
World(millions
of dollars)
Monde(millions
de dollars)
Year
Année
WesternAsia
Asieocciden-
tale
Oceania
Océanie
America
Amérique
Percentage / En pourcentage
Economiesin transition
Économiesen
transition
Europe
Developing economiesÉconomies en développement
USA
États-Unis
Japan
Japon
Other
AutresTotal
Africa
Afrique
Eastern,Southern and
South-Eastern Asia
Asieorientale,
méridionaleet du Sud-Est
Developed economiesÉconomies développéesOrigin / Origine
Total
2.1 Country trade structure by partner:Imports by main region of origin
2.1 Structure du commerce des pays par partenaires :Importations par principales régions d'origine
62

TotalEUUE
Destination
Bolivia - Bolivie 1990 700 50.0 16.8 16.3 22.3 9.9 1.0 0.5 49.2 0.1 47.2 1.8 0.0 0.02000 2 023 40.8 11.9 11.4 22.5 5.2 1.1 0.1 58.9 0.1 51.3 7.5 0.1 0.02006 2 604 21.7 9.7 9.2 9.1 1.7 1.3 0.1 78.0 0.1 73.6 4.2 0.0 0.0
Bosnia and Herzegovina - 2000 2 644 75.5 73.2 72.3 1.8 0.2 0.4 23.0 1.5 0.0 0.1 0.3 1.1 ..Bosnie-Herzégovine 2006 5 993 68.6 67.4 66.6 0.9 0.0 0.1 27.4 4.0 0.1 0.4 0.7 2.8 ..
Brazil - Brésil 1990 24 977 56.6 26.5 24.3 19.8 7.1 3.1 0.6 42.8 2.9 17.6 7.7 14.7 0.02000 61 875 59.7 28.2 25.9 23.1 5.3 3.1 1.3 38.7 5.2 21.0 10.3 2.2 0.02006 101 173 46.9 23.8 22.0 16.2 4.2 2.7 1.6 51.2 9.1 18.3 20.7 3.1 0.0
Brunei Darussalam - 1990 1 000 51.1 18.5 18.1 15.3 14.6 2.7 0.0 47.2 .. 0.2 46.9 0.0 ..Brunéi Darussalam 2000 1 427 33.7 16.0 15.8 10.8 4.7 2.2 0.0 66.2 0.1 0.1 65.8 0.2 0.0
2006 2 000 29.3 15.4 14.6 2.6 5.6 5.7 0.0 70.5 0.1 0.1 69.7 0.6 0.0
Bulgaria - Bulgarie 1990 3 462 73.8 68.2 65.0 2.7 1.7 1.2 3.5 22.7 9.0 2.6 9.6 1.5 0.02000 6 362 58.5 54.0 52.6 3.0 1.0 0.5 29.2 10.5 0.7 2.9 3.2 3.6 0.02006 19 560 67.1 62.1 60.8 2.4 1.6 0.9 8.3 22.2 0.7 6.2 8.1 7.3 0.0
Burkina Faso 1990 536 58.7 46.8 46.1 6.3 4.2 1.4 0.1 30.8 26.6 0.5 3.7 .. 0.02000 498 51.5 45.8 45.7 3.5 1.8 0.5 0.5 41.8 37.3 0.3 3.9 0.4 0.02006 1 262 38.9 36.3 36.0 1.6 0.6 0.5 2.1 52.2 45.3 0.6 5.8 0.5 0.0
Burundi 1990 235 55.7 47.2 46.1 1.0 7.3 0.2 .. 29.3 10.7 .. 18.6 .. ..2000 147 33.4 24.7 24.1 2.6 5.2 0.9 0.4 44.8 24.2 .. 8.6 12.1 ..2006 430 29.4 18.6 18.4 2.3 7.8 0.7 4.7 43.4 19.6 .. 11.2 12.6 0.1
Cambodia - Cambodge 1990 56 40.0 28.5 28.2 .. 9.0 2.5 0.0 59.9 0.1 0.5 55.8 3.5 ..2000 1 424 15.5 8.1 6.6 2.3 4.1 1.0 0.0 83.6 0.0 0.1 83.4 0.1 0.02006 2 985 10.0 4.3 4.1 0.9 4.3 0.5 0.1 89.6 0.1 0.1 89.3 0.2 0.0
Cameroon - Cameroun 1990 1 555 81.9 69.4 67.9 4.7 5.7 2.1 0.9 17.0 8.2 1.9 6.6 0.2 ..2000 1 490 52.2 40.7 40.1 4.8 4.9 1.8 0.9 37.7 29.3 0.9 6.1 1.5 ..2006 2 906 52.6 46.4 45.4 4.5 0.7 1.0 0.9 45.9 21.4 5.3 17.8 1.4 ..
Canada 1990 131 642 84.7 14.2 12.6 62.9 6.8 0.8 0.2 11.2 0.8 3.3 6.5 0.7 0.02000 262 776 82.1 12.4 10.7 64.3 4.7 0.8 0.2 15.7 0.8 5.0 9.3 0.6 0.02006 384 864 73.8 14.3 12.4 54.9 3.9 0.8 0.5 24.9 2.1 7.3 14.3 1.1 0.0
Cape Verde - Cap-Vert 1990 145 84.9 80.4 80.1 4.5 .. 0.1 2.2 9.4 4.1 4.4 0.9 .. ..2000 237 85.8 75.6 75.4 4.5 5.3 0.4 0.7 12.0 2.0 2.9 5.1 2.0 0.02006 638 75.8 73.4 73.2 2.3 .. 0.0 0.2 19.8 10.7 5.9 2.3 0.9 0.1
Central African Republic - 1990 184 69.5 64.4 63.6 0.8 4.3 0.0 0.2 30.1 24.4 0.8 4.7 0.2 ..République centrafricaine 2000 121 56.3 50.1 50.0 2.1 3.6 0.4 2.0 17.9 12.7 0.2 3.9 1.2 ..
2006 298 50.5 40.8 40.3 9.2 0.3 0.2 0.0 22.7 16.5 2.0 2.8 1.5 ..
Chad - Tchad 1990 167 75.0 65.9 65.4 5.3 3.8 0.1 0.1 24.9 21.3 0.2 3.1 0.2 ..2000 139 73.9 64.8 64.3 7.4 1.4 0.2 0.7 25.4 14.0 0.0 4.8 6.5 ..2006 529 59.3 43.6 41.0 12.5 0.2 3.0 2.4 38.3 25.4 0.3 4.9 7.7 ..
Chile - Chili 1990 7 227 58.5 27.7 26.1 19.0 7.9 3.9 .. 36.5 7.8 24.1 4.5 .. 0.02000 18 535 42.0 16.5 15.7 17.8 3.8 3.9 0.5 46.9 2.8 32.2 11.7 0.3 0.02006 35 892 36.1 15.2 14.6 15.6 3.2 2.2 0.4 54.7 5.7 35.2 13.6 0.2 0.0
China - Chine 1990 53 810 51.8 19.8 18.8 12.2 14.2 5.5 4.2 42.9 0.7 2.8 38.6 0.9 0.02000 225 175 47.3 14.6 13.7 9.9 18.4 4.4 3.3 46.0 2.5 2.4 37.4 3.5 0.02006 791 793 38.0 12.2 11.5 7.5 14.6 3.7 2.9 49.8 3.6 4.3 38.0 3.8 0.0
China, Hong Kong SAR - 1990 82 490 38.6 12.3 10.4 8.1 16.1 2.1 0.1 61.2 0.6 0.7 59.6 0.3 0.0Chine (RAS de Hong Kong) 2000 213 328 30.8 10.0 8.8 6.8 12.0 2.0 0.2 68.9 0.3 0.6 67.5 0.5 0.0
2006 334 691 25.2 8.4 7.3 4.8 10.3 1.7 0.1 74.6 0.3 0.7 72.9 0.7 0.0
China, Macao SAR - 1990 1 532 27.6 9.5 9.3 5.1 11.5 1.4 0.4 72.0 0.2 0.2 71.3 0.2 0.0Chine (RAS de Macao) 2000 2 255 23.3 9.9 9.6 4.5 6.3 2.6 0.0 76.7 0.2 0.3 75.6 0.6 0.0
2006 4 559 30.7 14.7 13.0 5.5 8.4 2.1 0.0 69.3 0.3 0.4 68.0 0.5 0.0
China, Taiwan Province of - 1990 55 244 76.1 18.0 15.7 23.1 29.7 5.2 0.1 22.8 0.5 2.4 14.3 5.6 0.0Province chinoise de Taiwan (1) 2000 141 597 61.9 12.5 11.6 17.8 27.3 4.2 1.2 35.7 2.3 1.5 28.1 3.7 0.0
2006 203 321 47.1 10.0 9.2 10.3 22.9 4.0 1.1 50.2 2.7 2.0 34.8 10.5 0.0
Colombia - Colombie 1990 5 589 76.0 26.4 23.5 35.4 8.9 5.3 0.2 23.0 0.1 21.6 1.3 0.0 0.02000 11 324 62.0 18.6 17.5 35.4 5.5 2.5 0.4 36.3 0.5 28.7 7.1 0.1 0.02006 27 493 48.1 14.7 13.9 26.8 4.1 2.4 0.5 48.0 0.3 34.0 13.5 0.3 0.0
For sources and notes, see end of table. Pour les sources et les notes, se reporter à la fin du tableau.
Total
Europe
Other
AutresTotal
Origin / Origine
Year
Année
World(millions
of dollars)
Monde(millions
de dollars)
Developed economiesÉconomies développées
Economiesin transition
Économiesen
transition
Developing economiesÉconomies en développement
Oceania
Océanie
Percentage / En pourcentage
Africa
Afrique
America
Amérique
Eastern,Southern and
South-Eastern Asia
Asieorientale,
méridionaleet du Sud-Est
WesternAsia
Asieocciden-
tale
USA
États-Unis
Japan
Japon
2.1 Country trade structure by partner:Imports by main region of origin
2.1 Structure du commerce des pays par partenaires :Importations par principales régions d'origine
2
63
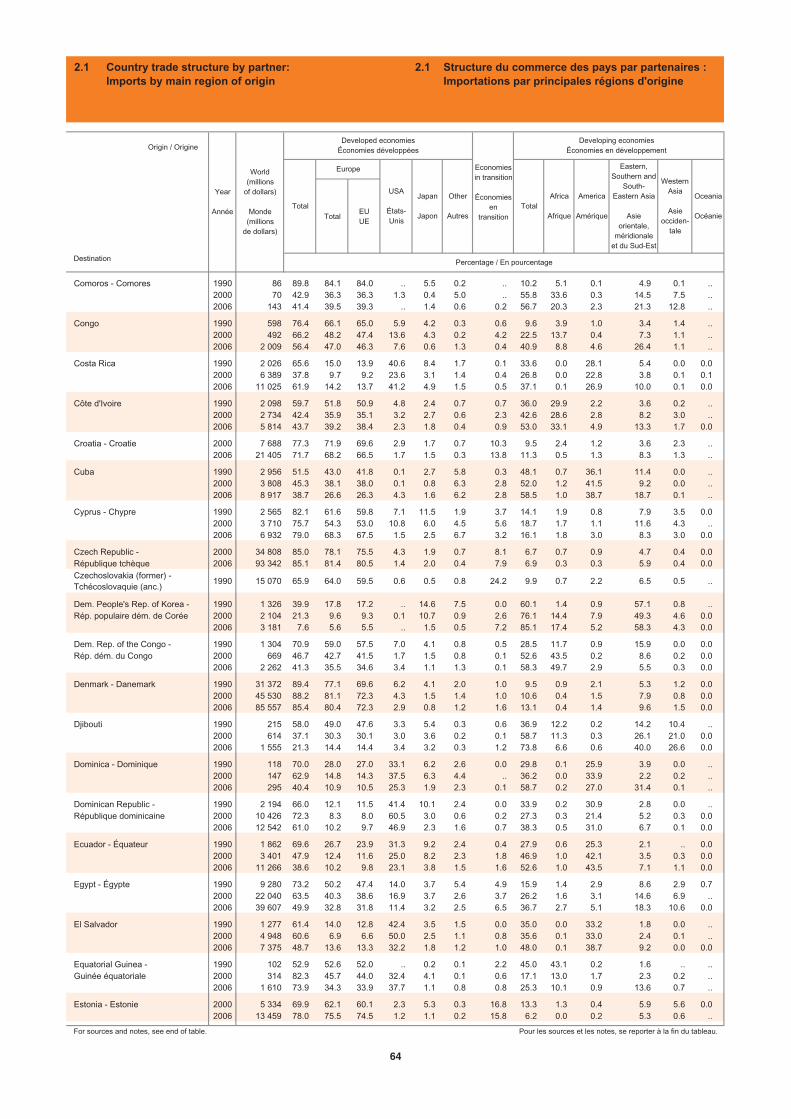
TotalEUUE
Destination
Comoros - Comores 1990 86 89.8 84.1 84.0 .. 5.5 0.2 .. 10.2 5.1 0.1 4.9 0.1 ..2000 70 42.9 36.3 36.3 1.3 0.4 5.0 .. 55.8 33.6 0.3 14.5 7.5 ..2006 143 41.4 39.5 39.3 .. 1.4 0.6 0.2 56.7 20.3 2.3 21.3 12.8 ..
Congo 1990 598 76.4 66.1 65.0 5.9 4.2 0.3 0.6 9.6 3.9 1.0 3.4 1.4 ..2000 492 66.2 48.2 47.4 13.6 4.3 0.2 4.2 22.5 13.7 0.4 7.3 1.1 ..2006 2 009 56.4 47.0 46.3 7.6 0.6 1.3 0.4 40.9 8.8 4.6 26.4 1.1 ..
Costa Rica 1990 2 026 65.6 15.0 13.9 40.6 8.4 1.7 0.1 33.6 0.0 28.1 5.4 0.0 0.02000 6 389 37.8 9.7 9.2 23.6 3.1 1.4 0.4 26.8 0.0 22.8 3.8 0.1 0.12006 11 025 61.9 14.2 13.7 41.2 4.9 1.5 0.5 37.1 0.1 26.9 10.0 0.1 0.0
Côte d'Ivoire 1990 2 098 59.7 51.8 50.9 4.8 2.4 0.7 0.7 36.0 29.9 2.2 3.6 0.2 ..2000 2 734 42.4 35.9 35.1 3.2 2.7 0.6 2.3 42.6 28.6 2.8 8.2 3.0 ..2006 5 814 43.7 39.2 38.4 2.3 1.8 0.4 0.9 53.0 33.1 4.9 13.3 1.7 0.0
Croatia - Croatie 2000 7 688 77.3 71.9 69.6 2.9 1.7 0.7 10.3 9.5 2.4 1.2 3.6 2.3 ..2006 21 405 71.7 68.2 66.5 1.7 1.5 0.3 13.8 11.3 0.5 1.3 8.3 1.3 ..
Cuba 1990 2 956 51.5 43.0 41.8 0.1 2.7 5.8 0.3 48.1 0.7 36.1 11.4 0.0 ..2000 3 808 45.3 38.1 38.0 0.1 0.8 6.3 2.8 52.0 1.2 41.5 9.2 0.0 ..2006 8 917 38.7 26.6 26.3 4.3 1.6 6.2 2.8 58.5 1.0 38.7 18.7 0.1 ..
Cyprus - Chypre 1990 2 565 82.1 61.6 59.8 7.1 11.5 1.9 3.7 14.1 1.9 0.8 7.9 3.5 0.02000 3 710 75.7 54.3 53.0 10.8 6.0 4.5 5.6 18.7 1.7 1.1 11.6 4.3 ..2006 6 932 79.0 68.3 67.5 1.5 2.5 6.7 3.2 16.1 1.8 3.0 8.3 3.0 0.0
Czech Republic - 2000 34 808 85.0 78.1 75.5 4.3 1.9 0.7 8.1 6.7 0.7 0.9 4.7 0.4 0.0République tchèque 2006 93 342 85.1 81.4 80.5 1.4 2.0 0.4 7.9 6.9 0.3 0.3 5.9 0.4 0.0Czechoslovakia (former) - Tchécoslovaquie (anc.)
1990 15 070 65.9 64.0 59.5 0.6 0.5 0.8 24.2 9.9 0.7 2.2 6.5 0.5 ..
Dem. People's Rep. of Korea - 1990 1 326 39.9 17.8 17.2 .. 14.6 7.5 0.0 60.1 1.4 0.9 57.1 0.8 ..Rép. populaire dém. de Corée 2000 2 104 21.3 9.6 9.3 0.1 10.7 0.9 2.6 76.1 14.4 7.9 49.3 4.6 0.0
2006 3 181 7.6 5.6 5.5 .. 1.5 0.5 7.2 85.1 17.4 5.2 58.3 4.3 0.0
Dem. Rep. of the Congo - 1990 1 304 70.9 59.0 57.5 7.0 4.1 0.8 0.5 28.5 11.7 0.9 15.9 0.0 0.0Rép. dém. du Congo 2000 669 46.7 42.7 41.5 1.7 1.5 0.8 0.1 52.6 43.5 0.2 8.6 0.2 0.0
2006 2 262 41.3 35.5 34.6 3.4 1.1 1.3 0.1 58.3 49.7 2.9 5.5 0.3 0.0
Denmark - Danemark 1990 31 372 89.4 77.1 69.6 6.2 4.1 2.0 1.0 9.5 0.9 2.1 5.3 1.2 0.02000 45 530 88.2 81.1 72.3 4.3 1.5 1.4 1.0 10.6 0.4 1.5 7.9 0.8 0.02006 85 557 85.4 80.4 72.3 2.9 0.8 1.2 1.6 13.1 0.4 1.4 9.6 1.5 0.0
Djibouti 1990 215 58.0 49.0 47.6 3.3 5.4 0.3 0.6 36.9 12.2 0.2 14.2 10.4 ..2000 614 37.1 30.3 30.1 3.0 3.6 0.2 0.1 58.7 11.3 0.3 26.1 21.0 0.02006 1 555 21.3 14.4 14.4 3.4 3.2 0.3 1.2 73.8 6.6 0.6 40.0 26.6 0.0
Dominica - Dominique 1990 118 70.0 28.0 27.0 33.1 6.2 2.6 0.0 29.8 0.1 25.9 3.9 0.0 ..2000 147 62.9 14.8 14.3 37.5 6.3 4.4 .. 36.2 0.0 33.9 2.2 0.2 ..2006 295 40.4 10.9 10.5 25.3 1.9 2.3 0.1 58.7 0.2 27.0 31.4 0.1 ..
Dominican Republic - 1990 2 194 66.0 12.1 11.5 41.4 10.1 2.4 0.0 33.9 0.2 30.9 2.8 0.0 ..République dominicaine 2000 10 426 72.3 8.3 8.0 60.5 3.0 0.6 0.2 27.3 0.3 21.4 5.2 0.3 0.0
2006 12 542 61.0 10.2 9.7 46.9 2.3 1.6 0.7 38.3 0.5 31.0 6.7 0.1 0.0
Ecuador - Équateur 1990 1 862 69.6 26.7 23.9 31.3 9.2 2.4 0.4 27.9 0.6 25.3 2.1 .. 0.02000 3 401 47.9 12.4 11.6 25.0 8.2 2.3 1.8 46.9 1.0 42.1 3.5 0.3 0.02006 11 266 38.6 10.2 9.8 23.1 3.8 1.5 1.6 52.6 1.0 43.5 7.1 1.1 0.0
Egypt - Égypte 1990 9 280 73.2 50.2 47.4 14.0 3.7 5.4 4.9 15.9 1.4 2.9 8.6 2.9 0.72000 22 040 63.5 40.3 38.6 16.9 3.7 2.6 3.7 26.2 1.6 3.1 14.6 6.9 ..2006 39 607 49.9 32.8 31.8 11.4 3.2 2.5 6.5 36.7 2.7 5.1 18.3 10.6 0.0
El Salvador 1990 1 277 61.4 14.0 12.8 42.4 3.5 1.5 0.0 35.0 0.0 33.2 1.8 0.0 ..2000 4 948 60.6 6.9 6.6 50.0 2.5 1.1 0.8 35.6 0.1 33.0 2.4 0.1 ..2006 7 375 48.7 13.6 13.3 32.2 1.8 1.2 1.0 48.0 0.1 38.7 9.2 0.0 0.0
Equatorial Guinea - 1990 102 52.9 52.6 52.0 .. 0.2 0.1 2.2 45.0 43.1 0.2 1.6 .. ..Guinée équatoriale 2000 314 82.3 45.7 44.0 32.4 4.1 0.1 0.6 17.1 13.0 1.7 2.3 0.2 ..
2006 1 610 73.9 34.3 33.9 37.7 1.1 0.8 0.8 25.3 10.1 0.9 13.6 0.7 ..
Estonia - Estonie 2000 5 334 69.9 62.1 60.1 2.3 5.3 0.3 16.8 13.3 1.3 0.4 5.9 5.6 0.02006 13 459 78.0 75.5 74.5 1.2 1.1 0.2 15.8 6.2 0.0 0.2 5.3 0.6 ..
For sources and notes, see end of table. Pour les sources et les notes, se reporter à la fin du tableau.
Other
AutresTotal
Origin / Origine
Year
Année
World(millions
of dollars)
Monde(millions
de dollars)
Developed economiesÉconomies développées
Oceania
Océanie
Percentage / En pourcentage
Economiesin transition
Économiesen
transition
Developing economiesÉconomies en développement
Total
Europe
USA
États-Unis
Japan
Japon
Eastern,Southern and
South-Eastern Asia
Asieorientale,
méridionaleet du Sud-Est
WesternAsia
Asieocciden-
tale
Africa
Afrique
America
Amérique
2.1 Country trade structure by partner:Imports by main region of origin
2.1 Structure du commerce des pays par partenaires :Importations par principales régions d'origine
64
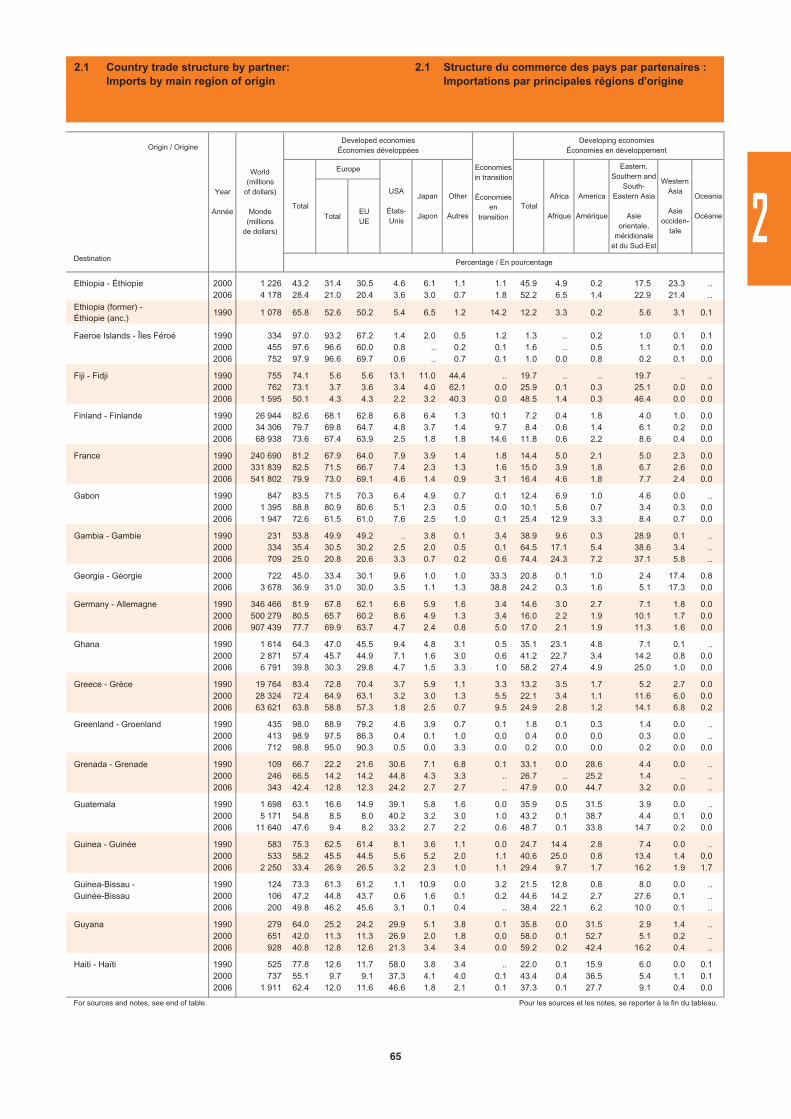
TotalEUUE
Destination
Ethiopia - Éthiopie 2000 1 226 43.2 31.4 30.5 4.6 6.1 1.1 1.1 45.9 4.9 0.2 17.5 23.3 ..2006 4 178 28.4 21.0 20.4 3.6 3.0 0.7 1.8 52.2 6.5 1.4 22.9 21.4 ..
Ethiopia (former) - Éthiopie (anc.)
1990 1 078 65.8 52.6 50.2 5.4 6.5 1.2 14.2 12.2 3.3 0.2 5.6 3.1 0.1
Faeroe Islands - Îles Féroé 1990 334 97.0 93.2 67.2 1.4 2.0 0.5 1.2 1.3 .. 0.2 1.0 0.1 0.12000 455 97.6 96.6 60.0 0.8 .. 0.2 0.1 1.6 .. 0.5 1.1 0.1 0.02006 752 97.9 96.6 69.7 0.6 .. 0.7 0.1 1.0 0.0 0.8 0.2 0.1 0.0
Fiji - Fidji 1990 755 74.1 5.6 5.6 13.1 11.0 44.4 .. 19.7 .. .. 19.7 .. ..2000 762 73.1 3.7 3.6 3.4 4.0 62.1 0.0 25.9 0.1 0.3 25.1 0.0 0.02006 1 595 50.1 4.3 4.3 2.2 3.2 40.3 0.0 48.5 1.4 0.3 46.4 0.0 0.0
Finland - Finlande 1990 26 944 82.6 68.1 62.8 6.8 6.4 1.3 10.1 7.2 0.4 1.8 4.0 1.0 0.02000 34 306 79.7 69.8 64.7 4.8 3.7 1.4 9.7 8.4 0.6 1.4 6.1 0.2 0.02006 68 938 73.6 67.4 63.9 2.5 1.8 1.8 14.6 11.8 0.6 2.2 8.6 0.4 0.0
France 1990 240 690 81.2 67.9 64.0 7.9 3.9 1.4 1.8 14.4 5.0 2.1 5.0 2.3 0.02000 331 839 82.5 71.5 66.7 7.4 2.3 1.3 1.6 15.0 3.9 1.8 6.7 2.6 0.02006 541 802 79.9 73.0 69.1 4.6 1.4 0.9 3.1 16.4 4.6 1.8 7.7 2.4 0.0
Gabon 1990 847 83.5 71.5 70.3 6.4 4.9 0.7 0.1 12.4 6.9 1.0 4.6 0.0 ..2000 1 395 88.8 80.9 80.6 5.1 2.3 0.5 0.0 10.1 5.6 0.7 3.4 0.3 0.02006 1 947 72.6 61.5 61.0 7.6 2.5 1.0 0.1 25.4 12.9 3.3 8.4 0.7 0.0
Gambia - Gambie 1990 231 53.8 49.9 49.2 .. 3.8 0.1 3.4 38.9 9.6 0.3 28.9 0.1 ..2000 334 35.4 30.5 30.2 2.5 2.0 0.5 0.1 64.5 17.1 5.4 38.6 3.4 ..2006 709 25.0 20.8 20.6 3.3 0.7 0.2 0.6 74.4 24.3 7.2 37.1 5.8 ..
Georgia - Géorgie 2000 722 45.0 33.4 30.1 9.6 1.0 1.0 33.3 20.8 0.1 1.0 2.4 17.4 0.82006 3 678 36.9 31.0 30.0 3.5 1.1 1.3 38.8 24.2 0.3 1.6 5.1 17.3 0.0
Germany - Allemagne 1990 346 466 81.9 67.8 62.1 6.6 5.9 1.6 3.4 14.6 3.0 2.7 7.1 1.8 0.02000 500 279 80.5 65.7 60.2 8.6 4.9 1.3 3.4 16.0 2.2 1.9 10.1 1.7 0.02006 907 439 77.7 69.9 63.7 4.7 2.4 0.8 5.0 17.0 2.1 1.9 11.3 1.6 0.0
Ghana 1990 1 614 64.3 47.0 45.5 9.4 4.8 3.1 0.5 35.1 23.1 4.8 7.1 0.1 ..2000 2 871 57.4 45.7 44.9 7.1 1.6 3.0 0.6 41.2 22.7 3.4 14.2 0.8 0.02006 6 791 39.8 30.3 29.8 4.7 1.5 3.3 1.0 58.2 27.4 4.9 25.0 1.0 0.0
Greece - Grèce 1990 19 764 83.4 72.8 70.4 3.7 5.9 1.1 3.3 13.2 3.5 1.7 5.2 2.7 0.02000 28 324 72.4 64.9 63.1 3.2 3.0 1.3 5.5 22.1 3.4 1.1 11.6 6.0 0.02006 63 621 63.8 58.8 57.3 1.8 2.5 0.7 9.5 24.9 2.8 1.2 14.1 6.8 0.2
Greenland - Groenland 1990 435 98.0 88.9 79.2 4.6 3.9 0.7 0.1 1.8 0.1 0.3 1.4 0.0 ..2000 413 98.9 97.5 86.3 0.4 0.1 1.0 0.0 0.4 0.0 0.0 0.3 0.0 ..2006 712 98.8 95.0 90.3 0.5 0.0 3.3 0.0 0.2 0.0 0.0 0.2 0.0 0.0
Grenada - Grenade 1990 109 66.7 22.2 21.6 30.6 7.1 6.8 0.1 33.1 0.0 28.6 4.4 0.0 ..2000 246 66.5 14.2 14.2 44.8 4.3 3.3 .. 26.7 .. 25.2 1.4 .. ..2006 343 42.4 12.8 12.3 24.2 2.7 2.7 .. 47.9 0.0 44.7 3.2 0.0 ..
Guatemala 1990 1 698 63.1 16.6 14.9 39.1 5.8 1.6 0.0 35.9 0.5 31.5 3.9 0.0 ..2000 5 171 54.8 8.5 8.0 40.2 3.2 3.0 1.0 43.2 0.1 38.7 4.4 0.1 0.02006 11 640 47.6 9.4 8.2 33.2 2.7 2.2 0.6 48.7 0.1 33.8 14.7 0.2 0.0
Guinea - Guinée 1990 583 75.3 62.5 61.4 8.1 3.6 1.1 0.0 24.7 14.4 2.8 7.4 0.0 ..2000 533 58.2 45.5 44.5 5.6 5.2 2.0 1.1 40.6 25.0 0.8 13.4 1.4 0.02006 2 250 33.4 26.9 26.5 3.2 2.3 1.0 1.1 29.4 9.7 1.7 16.2 1.9 1.7
Guinea-Bissau - 1990 124 73.3 61.3 61.2 1.1 10.9 0.0 3.2 21.5 12.8 0.8 8.0 0.0 ..Guinée-Bissau 2000 106 47.2 44.8 43.7 0.6 1.6 0.1 0.2 44.6 14.2 2.7 27.6 0.1 ..
2006 200 49.8 46.2 45.6 3.1 0.1 0.4 .. 38.4 22.1 6.2 10.0 0.1 ..
Guyana 1990 279 64.0 25.2 24.2 29.9 5.1 3.8 0.1 35.8 0.0 31.5 2.9 1.4 ..2000 651 42.0 11.3 11.3 26.9 2.0 1.8 0.0 58.0 0.1 52.7 5.1 0.2 ..2006 928 40.8 12.8 12.6 21.3 3.4 3.4 0.0 59.2 0.2 42.4 16.2 0.4 ..
Haiti - Haïti 1990 525 77.8 12.6 11.7 58.0 3.8 3.4 .. 22.0 0.1 15.9 6.0 0.0 0.12000 737 55.1 9.7 9.1 37.3 4.1 4.0 0.1 43.4 0.4 36.5 5.4 1.1 0.12006 1 911 62.4 12.0 11.6 46.6 1.8 2.1 0.1 37.3 0.1 27.7 9.1 0.4 0.0
For sources and notes, see end of table. Pour les sources et les notes, se reporter à la fin du tableau.
Oceania
Océanie
Percentage / En pourcentage
Origin / Origine
Year
Année
World(millions
of dollars)
Monde(millions
de dollars)
Developed economiesÉconomies développées
Total
Europe
Other
AutresTotal
Africa
Afrique
America
Amérique
Eastern,Southern and
South-Eastern Asia
Asieorientale,
méridionaleet du Sud-Est
WesternAsia
Asieocciden-
tale
USA
États-Unis
Japan
Japon
Economiesin transition
Économiesen
transition
Developing economiesÉconomies en développement
2.1 Country trade structure by partner:Imports by main region of origin
2.1 Structure du commerce des pays par partenaires :Importations par principales régions d'origine
2
65
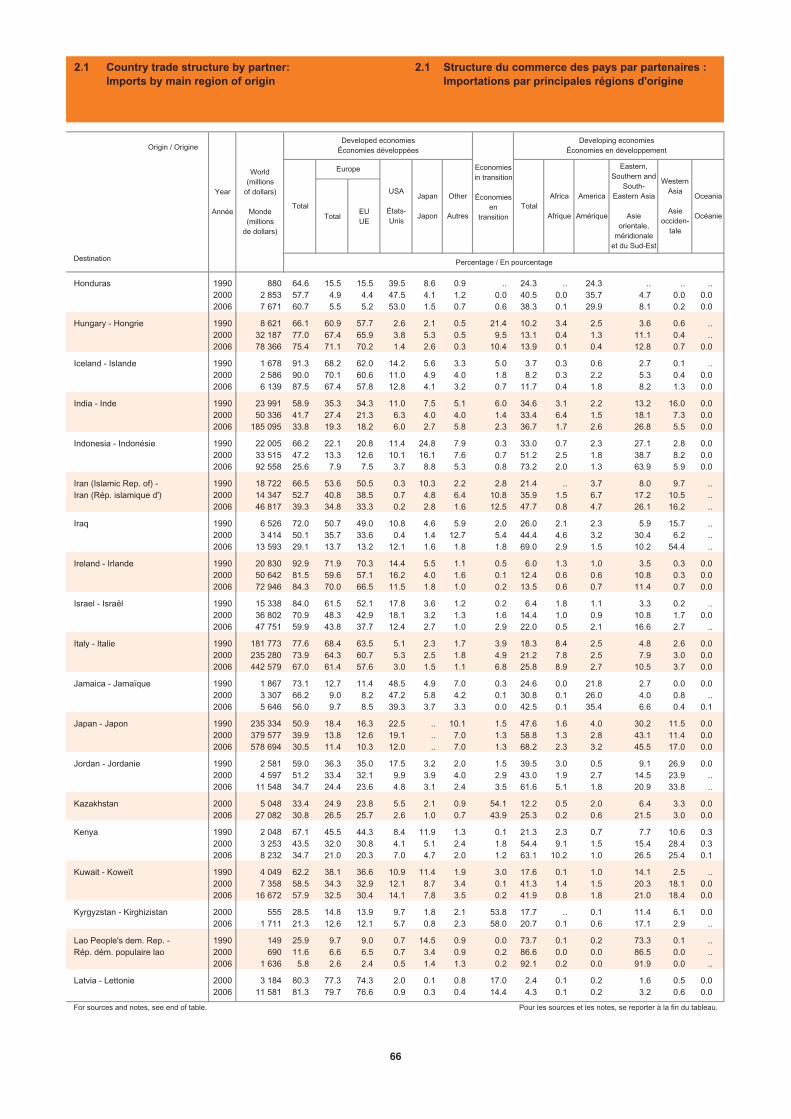
TotalEUUE
Destination
Honduras 1990 880 64.6 15.5 15.5 39.5 8.6 0.9 .. 24.3 .. 24.3 .. .. ..2000 2 853 57.7 4.9 4.4 47.5 4.1 1.2 0.0 40.5 0.0 35.7 4.7 0.0 0.02006 7 671 60.7 5.5 5.2 53.0 1.5 0.7 0.6 38.3 0.1 29.9 8.1 0.2 0.0
Hungary - Hongrie 1990 8 621 66.1 60.9 57.7 2.6 2.1 0.5 21.4 10.2 3.4 2.5 3.6 0.6 ..2000 32 187 77.0 67.4 65.9 3.8 5.3 0.5 9.5 13.1 0.4 1.3 11.1 0.4 ..2006 78 366 75.4 71.1 70.2 1.4 2.6 0.3 10.4 13.9 0.1 0.4 12.8 0.7 0.0
Iceland - Islande 1990 1 678 91.3 68.2 62.0 14.2 5.6 3.3 5.0 3.7 0.3 0.6 2.7 0.1 ..2000 2 586 90.0 70.1 60.6 11.0 4.9 4.0 1.8 8.2 0.3 2.2 5.3 0.4 0.02006 6 139 87.5 67.4 57.8 12.8 4.1 3.2 0.7 11.7 0.4 1.8 8.2 1.3 0.0
India - Inde 1990 23 991 58.9 35.3 34.3 11.0 7.5 5.1 6.0 34.6 3.1 2.2 13.2 16.0 0.02000 50 336 41.7 27.4 21.3 6.3 4.0 4.0 1.4 33.4 6.4 1.5 18.1 7.3 0.02006 185 095 33.8 19.3 18.2 6.0 2.7 5.8 2.3 36.7 1.7 2.6 26.8 5.5 0.0
Indonesia - Indonésie 1990 22 005 66.2 22.1 20.8 11.4 24.8 7.9 0.3 33.0 0.7 2.3 27.1 2.8 0.02000 33 515 47.2 13.3 12.6 10.1 16.1 7.6 0.7 51.2 2.5 1.8 38.7 8.2 0.02006 92 558 25.6 7.9 7.5 3.7 8.8 5.3 0.8 73.2 2.0 1.3 63.9 5.9 0.0
Iran (Islamic Rep. of) - 1990 18 722 66.5 53.6 50.5 0.3 10.3 2.2 2.8 21.4 .. 3.7 8.0 9.7 ..Iran (Rép. islamique d') 2000 14 347 52.7 40.8 38.5 0.7 4.8 6.4 10.8 35.9 1.5 6.7 17.2 10.5 ..
2006 46 817 39.3 34.8 33.3 0.2 2.8 1.6 12.5 47.7 0.8 4.7 26.1 16.2 ..
Iraq 1990 6 526 72.0 50.7 49.0 10.8 4.6 5.9 2.0 26.0 2.1 2.3 5.9 15.7 ..2000 3 414 50.1 35.7 33.6 0.4 1.4 12.7 5.4 44.4 4.6 3.2 30.4 6.2 ..2006 13 593 29.1 13.7 13.2 12.1 1.6 1.8 1.8 69.0 2.9 1.5 10.2 54.4 ..
Ireland - Irlande 1990 20 830 92.9 71.9 70.3 14.4 5.5 1.1 0.5 6.0 1.3 1.0 3.5 0.3 0.02000 50 642 81.5 59.6 57.1 16.2 4.0 1.6 0.1 12.4 0.6 0.6 10.8 0.3 0.02006 72 946 84.3 70.0 66.5 11.5 1.8 1.0 0.2 13.5 0.6 0.7 11.4 0.7 0.0
Israel - Israël 1990 15 338 84.0 61.5 52.1 17.8 3.6 1.2 0.2 6.4 1.8 1.1 3.3 0.2 ..2000 36 802 70.9 48.3 42.9 18.1 3.2 1.3 1.6 14.4 1.0 0.9 10.8 1.7 0.02006 47 751 59.9 43.8 37.7 12.4 2.7 1.0 2.9 22.0 0.5 2.1 16.6 2.7 ..
Italy - Italie 1990 181 773 77.6 68.4 63.5 5.1 2.3 1.7 3.9 18.3 8.4 2.5 4.8 2.6 0.02000 235 280 73.9 64.3 60.7 5.3 2.5 1.8 4.9 21.2 7.8 2.5 7.9 3.0 0.02006 442 579 67.0 61.4 57.6 3.0 1.5 1.1 6.8 25.8 8.9 2.7 10.5 3.7 0.0
Jamaica - Jamaïque 1990 1 867 73.1 12.7 11.4 48.5 4.9 7.0 0.3 24.6 0.0 21.8 2.7 0.0 0.02000 3 307 66.2 9.0 8.2 47.2 5.8 4.2 0.1 30.8 0.1 26.0 4.0 0.8 ..2006 5 646 56.0 9.7 8.5 39.3 3.7 3.3 0.0 42.5 0.1 35.4 6.6 0.4 0.1
Japan - Japon 1990 235 334 50.9 18.4 16.3 22.5 .. 10.1 1.5 47.6 1.6 4.0 30.2 11.5 0.02000 379 577 39.9 13.8 12.6 19.1 .. 7.0 1.3 58.8 1.3 2.8 43.1 11.4 0.02006 578 694 30.5 11.4 10.3 12.0 .. 7.0 1.3 68.2 2.3 3.2 45.5 17.0 0.0
Jordan - Jordanie 1990 2 581 59.0 36.3 35.0 17.5 3.2 2.0 1.5 39.5 3.0 0.5 9.1 26.9 0.02000 4 597 51.2 33.4 32.1 9.9 3.9 4.0 2.9 43.0 1.9 2.7 14.5 23.9 ..2006 11 548 34.7 24.4 23.6 4.8 3.1 2.4 3.5 61.6 5.1 1.8 20.9 33.8 ..
Kazakhstan 2000 5 048 33.4 24.9 23.8 5.5 2.1 0.9 54.1 12.2 0.5 2.0 6.4 3.3 0.02006 27 082 30.8 26.5 25.7 2.6 1.0 0.7 43.9 25.3 0.2 0.6 21.5 3.0 0.0
Kenya 1990 2 048 67.1 45.5 44.3 8.4 11.9 1.3 0.1 21.3 2.3 0.7 7.7 10.6 0.32000 3 253 43.5 32.0 30.8 4.1 5.1 2.4 1.8 54.4 9.1 1.5 15.4 28.4 0.32006 8 232 34.7 21.0 20.3 7.0 4.7 2.0 1.2 63.1 10.2 1.0 26.5 25.4 0.1
Kuwait - Koweït 1990 4 049 62.2 38.1 36.6 10.9 11.4 1.9 3.0 17.6 0.1 1.0 14.1 2.5 ..2000 7 358 58.5 34.3 32.9 12.1 8.7 3.4 0.1 41.3 1.4 1.5 20.3 18.1 0.02006 16 672 57.9 32.5 30.4 14.1 7.8 3.5 0.2 41.9 0.8 1.8 21.0 18.4 0.0
Kyrgyzstan - Kirghizistan 2000 555 28.5 14.8 13.9 9.7 1.8 2.1 53.8 17.7 .. 0.1 11.4 6.1 0.02006 1 711 21.3 12.6 12.1 5.7 0.8 2.3 58.0 20.7 0.1 0.6 17.1 2.9 ..
Lao People's dem. Rep. - 1990 149 25.9 9.7 9.0 0.7 14.5 0.9 0.0 73.7 0.1 0.2 73.3 0.1 ..Rép. dém. populaire lao 2000 690 11.6 6.6 6.5 0.7 3.4 0.9 0.2 86.6 0.0 0.0 86.5 0.0 ..
2006 1 636 5.8 2.6 2.4 0.5 1.4 1.3 0.2 92.1 0.2 0.0 91.9 0.0 ..
Latvia - Lettonie 2000 3 184 80.3 77.3 74.3 2.0 0.1 0.8 17.0 2.4 0.1 0.2 1.6 0.5 0.02006 11 581 81.3 79.7 76.6 0.9 0.3 0.4 14.4 4.3 0.1 0.2 3.2 0.6 0.0
For sources and notes, see end of table. Pour les sources et les notes, se reporter à la fin du tableau.
Other
AutresTotal
Origin / Origine
Year
Année
World(millions
of dollars)
Monde(millions
de dollars)
Developed economiesÉconomies développées
Oceania
Océanie
Percentage / En pourcentage
Economiesin transition
Économiesen
transition
Developing economiesÉconomies en développement
Total
Europe
USA
États-Unis
Japan
Japon
Eastern,Southern and
South-Eastern Asia
Asieorientale,
méridionaleet du Sud-Est
WesternAsia
Asieocciden-
tale
Africa
Afrique
America
Amérique
2.1 Country trade structure by partner:Imports by main region of origin
2.1 Structure du commerce des pays par partenaires :Importations par principales régions d'origine
66

TotalEUUE
Destination
Lebanon - Liban 1990 2 515 66.7 58.2 54.4 4.3 3.9 0.3 0.5 32.8 1.4 1.5 12.2 17.8 ..2000 6 228 65.4 53.7 46.7 7.3 3.4 1.0 5.3 27.9 2.8 1.9 11.2 12.1 0.02006 10 984 54.4 42.6 40.2 9.3 1.7 0.8 3.6 39.7 3.1 2.3 11.3 23.0 0.0
Liberia - Libéria 1990 4 259 68.2 39.0 33.6 1.1 28.0 0.1 5.6 26.2 0.7 1.0 24.6 0.0 ..2000 5 494 57.5 41.9 40.7 0.9 14.7 0.0 4.2 38.3 2.9 1.0 34.1 0.2 ..2006 7 143 26.3 12.3 12.0 1.0 12.8 0.1 2.7 71.0 2.5 1.0 67.3 0.3 ..
Libyan Arab Jamahiriya - 1990 5 663 77.6 70.9 67.0 1.2 4.3 1.2 1.4 19.9 5.3 2.7 6.0 5.9 ..Jamahiriya arabe libyenne 2000 4 016 71.2 67.2 65.5 0.5 2.6 0.9 1.5 27.2 10.5 2.8 7.8 6.1 ..
2006 10 236 59.4 51.9 49.7 4.7 2.0 0.8 2.1 38.2 7.9 3.5 16.3 10.5 ..
Lithuania - Lituanie 2000 5 457 60.7 56.0 54.2 2.4 1.9 0.5 31.7 6.0 0.3 0.9 4.2 0.6 0.02006 19 413 66.0 63.9 62.8 1.6 0.3 0.2 27.9 6.0 0.4 0.9 4.0 0.7 0.0
Luxembourg 2006 26 547 75.9 72.0 70.5 2.8 0.7 0.4 0.7 22.2 0.1 0.2 20.2 1.7 0.0
Madagascar 1990 608 57.6 49.1 47.6 2.2 6.0 0.3 0.6 14.8 2.0 0.9 11.6 0.3 ..2000 734 34.2 24.2 23.9 5.9 2.9 1.2 0.1 57.5 6.4 3.3 32.4 15.5 0.02006 2 046 27.7 23.7 23.6 2.4 1.1 0.5 0.0 58.7 12.1 1.3 39.4 5.9 0.0
Malawi 1990 627 48.9 38.9 37.6 2.0 7.0 1.0 0.0 45.1 42.1 .. 3.0 .. ..2000 562 16.7 11.0 10.7 2.6 2.3 0.8 0.0 82.0 71.8 1.2 9.1 0.0 ..2006 798 26.1 17.7 17.6 6.3 1.3 0.7 0.1 73.1 55.7 0.8 16.4 0.2 ..
Malaysia - Malaisie 1990 29 173 63.8 17.6 16.1 16.9 24.2 5.1 0.4 35.6 0.5 1.8 32.1 1.1 0.02000 82 204 52.7 12.3 11.0 16.6 21.1 2.8 0.3 45.1 0.5 0.8 41.9 1.9 0.02006 130 477 41.0 12.5 11.5 12.6 13.3 2.6 0.2 58.2 0.9 1.7 51.8 3.8 0.0
Maldives 1990 138 17.4 13.3 13.0 0.5 3.3 0.3 0.0 82.6 .. 0.0 82.0 0.5 ..2000 389 20.5 10.5 9.6 2.2 3.4 4.4 0.0 79.1 0.4 0.1 69.8 8.8 ..2006 931 19.3 10.4 10.1 2.1 2.6 4.3 0.0 80.5 0.6 0.5 60.8 18.5 ..
Mali 1990 714 45.2 41.7 41.0 1.4 1.4 0.8 0.7 35.3 28.7 0.2 4.0 2.4 0.02000 1 286 30.5 26.6 26.5 3.0 0.5 0.5 0.2 35.3 26.8 0.4 7.8 0.3 0.02006 2 357 29.5 26.3 26.2 2.0 0.2 1.0 1.1 37.0 29.5 0.9 6.0 0.5 0.0
Malta - Malte 1990 1 951 87.2 79.6 78.6 3.3 3.7 0.5 2.1 10.7 3.6 1.2 5.1 0.8 ..2000 3 400 75.9 62.4 60.6 10.6 2.0 0.9 0.4 23.7 1.6 0.5 20.2 1.3 ..2006 3 980 78.4 69.6 67.7 5.6 2.2 0.9 0.3 21.3 0.8 0.8 18.4 1.3 0.0
Mauritania - Mauritanie 1990 388 78.2 69.3 68.5 6.2 2.3 0.4 0.4 17.0 6.7 1.0 8.9 0.4 ..2000 651 64.3 58.8 58.6 2.6 2.5 0.4 2.5 24.5 9.0 0.6 13.4 1.5 ..2006 1 475 51.8 43.3 42.6 6.7 1.2 0.6 1.6 35.7 10.6 5.7 16.5 2.8 ..
Mauritius - Maurice 1990 1 620 54.1 39.1 37.2 4.8 5.9 4.4 0.1 45.8 12.9 1.1 26.1 5.7 0.02000 2 088 40.6 28.9 27.3 2.9 4.1 4.7 0.3 59.1 18.6 1.4 33.7 5.4 0.02006 3 646 44.3 35.8 34.6 2.0 2.8 3.7 0.1 55.6 11.1 1.5 34.7 8.3 0.0
Mexico - Mexique 1990 33 022 91.8 19.3 17.8 66.1 4.3 2.1 0.0 7.5 0.3 4.4 2.8 0.0 0.02000 194 749 87.1 8.7 8.2 72.0 3.7 2.7 0.2 10.6 0.2 2.6 7.7 0.2 ..2006 281 743 71.7 11.3 10.8 50.9 6.0 3.5 0.4 26.6 0.2 5.8 20.4 0.3 ..
Moldova 2000 776 61.2 54.2 53.2 6.2 0.3 0.5 33.9 4.9 0.1 0.2 2.2 2.4 0.02006 3 504 48.8 47.5 46.8 1.0 0.1 0.3 43.3 7.8 0.3 1.7 2.3 3.4 ..
Mongolia - Mongolie 1990 144 71.2 60.4 57.7 .. 10.7 0.1 5.6 23.2 0.7 0.1 22.5 0.0 ..2000 614 30.5 13.2 12.7 4.6 11.9 0.7 35.8 33.7 0.0 0.0 33.5 0.2 ..2006 1 769 23.4 7.8 7.7 2.4 11.9 1.4 34.6 41.9 0.0 1.6 39.9 0.4 ..
Morocco - Maroc 1990 7 919 62.3 53.2 51.7 5.5 1.6 2.1 2.6 22.5 6.6 2.3 3.2 10.4 0.12000 11 531 68.3 58.7 57.5 5.6 1.7 2.3 3.2 26.9 4.6 3.2 8.7 10.4 0.02006 25 127 64.5 58.6 57.4 3.8 1.1 0.9 2.3 32.8 4.9 3.3 13.9 10.7 ..
Mozambique 1990 913 57.7 43.8 42.5 6.1 4.8 3.1 0.0 42.2 11.1 1.6 17.9 11.6 ..2000 1 046 26.5 16.9 16.7 3.5 4.6 1.5 .. 61.2 51.8 0.6 8.2 0.6 ..2006 2 914 29.1 25.5 25.1 2.2 0.6 0.7 .. 54.3 39.5 1.1 11.4 2.3 ..
Myanmar 1990 668 43.4 20.0 16.8 2.9 16.6 3.9 3.4 53.2 0.5 0.1 52.6 0.0 ..2000 3 039 12.4 4.0 4.0 0.6 7.1 0.7 0.6 86.9 0.1 0.0 86.6 0.2 ..2006 3 788 7.1 3.1 2.9 0.2 3.0 0.9 0.8 91.9 0.1 0.1 91.4 0.2 ..
For sources and notes, see end of table. Pour les sources et les notes, se reporter à la fin du tableau.
Oceania
Océanie
Percentage / En pourcentage
Origin / Origine
Year
Année
World(millions
of dollars)
Monde(millions
de dollars)
Developed economiesÉconomies développées
Total
Europe
Other
AutresTotal
Africa
Afrique
America
Amérique
Eastern,Southern and
South-Eastern Asia
Asieorientale,
méridionaleet du Sud-Est
WesternAsia
Asieocciden-
tale
USA
États-Unis
Japan
Japon
Economiesin transition
Économiesen
transition
Developing economiesÉconomies en développement
2.1 Country trade structure by partner:Imports by main region of origin
2.1 Structure du commerce des pays par partenaires :Importations par principales régions d'origine
2
67
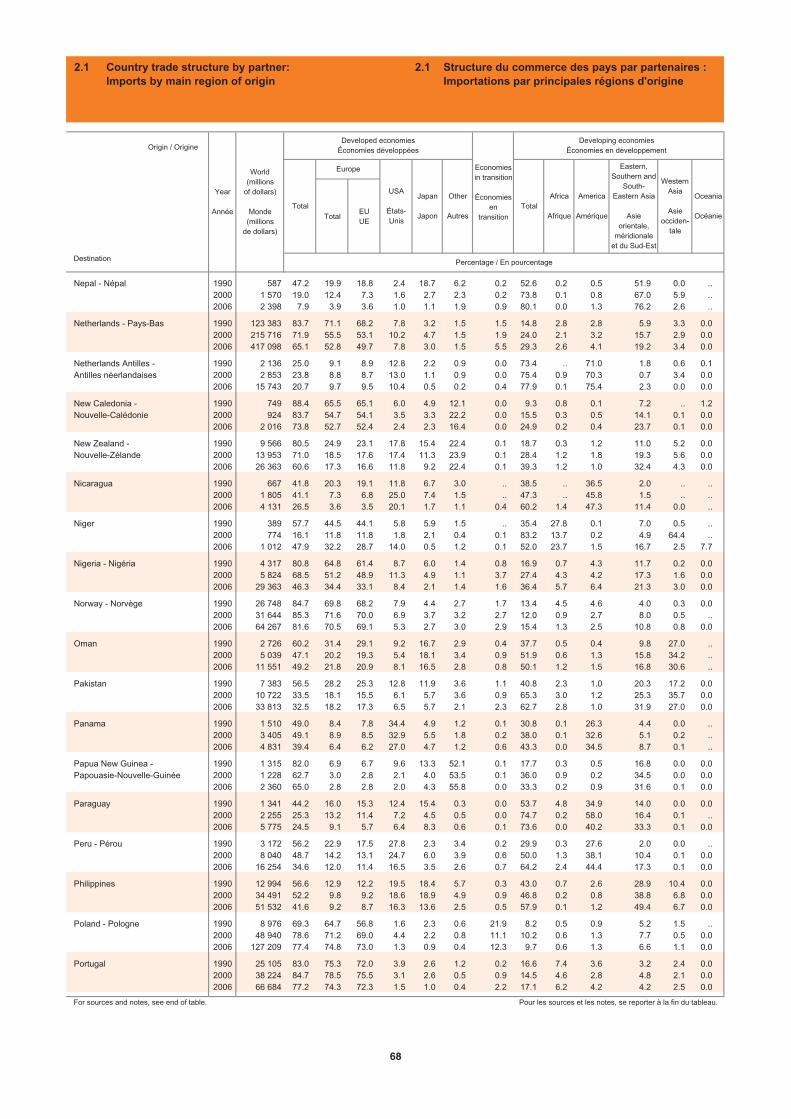
TotalEUUE
Destination
Nepal - Népal 1990 587 47.2 19.9 18.8 2.4 18.7 6.2 0.2 52.6 0.2 0.5 51.9 0.0 ..2000 1 570 19.0 12.4 7.3 1.6 2.7 2.3 0.2 73.8 0.1 0.8 67.0 5.9 ..2006 2 398 7.9 3.9 3.6 1.0 1.1 1.9 0.9 80.1 0.0 1.3 76.2 2.6 ..
Netherlands - Pays-Bas 1990 123 383 83.7 71.1 68.2 7.8 3.2 1.5 1.5 14.8 2.8 2.8 5.9 3.3 0.02000 215 716 71.9 55.5 53.1 10.2 4.7 1.5 1.9 24.0 2.1 3.2 15.7 2.9 0.02006 417 098 65.1 52.8 49.7 7.8 3.0 1.5 5.5 29.3 2.6 4.1 19.2 3.4 0.0
Netherlands Antilles - 1990 2 136 25.0 9.1 8.9 12.8 2.2 0.9 0.0 73.4 .. 71.0 1.8 0.6 0.1Antilles néerlandaises 2000 2 853 23.8 8.8 8.7 13.0 1.1 0.9 0.0 75.4 0.9 70.3 0.7 3.4 0.0
2006 15 743 20.7 9.7 9.5 10.4 0.5 0.2 0.4 77.9 0.1 75.4 2.3 0.0 0.0
New Caledonia - 1990 749 88.4 65.5 65.1 6.0 4.9 12.1 0.0 9.3 0.8 0.1 7.2 .. 1.2Nouvelle-Calédonie 2000 924 83.7 54.7 54.1 3.5 3.3 22.2 0.0 15.5 0.3 0.5 14.1 0.1 0.0
2006 2 016 73.8 52.7 52.4 2.4 2.3 16.4 0.0 24.9 0.2 0.4 23.7 0.1 0.0
New Zealand - 1990 9 566 80.5 24.9 23.1 17.8 15.4 22.4 0.1 18.7 0.3 1.2 11.0 5.2 0.0Nouvelle-Zélande 2000 13 953 71.0 18.5 17.6 17.4 11.3 23.9 0.1 28.4 1.2 1.8 19.3 5.6 0.0
2006 26 363 60.6 17.3 16.6 11.8 9.2 22.4 0.1 39.3 1.2 1.0 32.4 4.3 0.0
Nicaragua 1990 667 41.8 20.3 19.1 11.8 6.7 3.0 .. 38.5 .. 36.5 2.0 .. ..2000 1 805 41.1 7.3 6.8 25.0 7.4 1.5 .. 47.3 .. 45.8 1.5 .. ..2006 4 131 26.5 3.6 3.5 20.1 1.7 1.1 0.4 60.2 1.4 47.3 11.4 0.0 ..
Niger 1990 389 57.7 44.5 44.1 5.8 5.9 1.5 .. 35.4 27.8 0.1 7.0 0.5 ..2000 774 16.1 11.8 11.8 1.8 2.1 0.4 0.1 83.2 13.7 0.2 4.9 64.4 ..2006 1 012 47.9 32.2 28.7 14.0 0.5 1.2 0.1 52.0 23.7 1.5 16.7 2.5 7.7
Nigeria - Nigéria 1990 4 317 80.8 64.8 61.4 8.7 6.0 1.4 0.8 16.9 0.7 4.3 11.7 0.2 0.02000 5 824 68.5 51.2 48.9 11.3 4.9 1.1 3.7 27.4 4.3 4.2 17.3 1.6 0.02006 29 363 46.3 34.4 33.1 8.4 2.1 1.4 1.6 36.4 5.7 6.4 21.3 3.0 0.0
Norway - Norvège 1990 26 748 84.7 69.8 68.2 7.9 4.4 2.7 1.7 13.4 4.5 4.6 4.0 0.3 0.02000 31 644 85.3 71.6 70.0 6.9 3.7 3.2 2.7 12.0 0.9 2.7 8.0 0.5 ..2006 64 267 81.6 70.5 69.1 5.3 2.7 3.0 2.9 15.4 1.3 2.5 10.8 0.8 0.0
Oman 1990 2 726 60.2 31.4 29.1 9.2 16.7 2.9 0.4 37.7 0.5 0.4 9.8 27.0 ..2000 5 039 47.1 20.2 19.3 5.4 18.1 3.4 0.9 51.9 0.6 1.3 15.8 34.2 ..2006 11 551 49.2 21.8 20.9 8.1 16.5 2.8 0.8 50.1 1.2 1.5 16.8 30.6 ..
Pakistan 1990 7 383 56.5 28.2 25.3 12.8 11.9 3.6 1.1 40.8 2.3 1.0 20.3 17.2 0.02000 10 722 33.5 18.1 15.5 6.1 5.7 3.6 0.9 65.3 3.0 1.2 25.3 35.7 0.02006 33 813 32.5 18.2 17.3 6.5 5.7 2.1 2.3 62.7 2.8 1.0 31.9 27.0 0.0
Panama 1990 1 510 49.0 8.4 7.8 34.4 4.9 1.2 0.1 30.8 0.1 26.3 4.4 0.0 ..2000 3 405 49.1 8.9 8.5 32.9 5.5 1.8 0.2 38.0 0.1 32.6 5.1 0.2 ..2006 4 831 39.4 6.4 6.2 27.0 4.7 1.2 0.6 43.3 0.0 34.5 8.7 0.1 ..
Papua New Guinea - 1990 1 315 82.0 6.9 6.7 9.6 13.3 52.1 0.1 17.7 0.3 0.5 16.8 0.0 0.0Papouasie-Nouvelle-Guinée 2000 1 228 62.7 3.0 2.8 2.1 4.0 53.5 0.1 36.0 0.9 0.2 34.5 0.0 0.0
2006 2 360 65.0 2.8 2.8 2.0 4.3 55.8 0.0 33.3 0.2 0.9 31.6 0.1 0.0
Paraguay 1990 1 341 44.2 16.0 15.3 12.4 15.4 0.3 0.0 53.7 4.8 34.9 14.0 0.0 0.02000 2 255 25.3 13.2 11.4 7.2 4.5 0.5 0.0 74.7 0.2 58.0 16.4 0.1 ..2006 5 775 24.5 9.1 5.7 6.4 8.3 0.6 0.1 73.6 0.0 40.2 33.3 0.1 0.0
Peru - Pérou 1990 3 172 56.2 22.9 17.5 27.8 2.3 3.4 0.2 29.9 0.3 27.6 2.0 0.0 ..2000 8 040 48.7 14.2 13.1 24.7 6.0 3.9 0.6 50.0 1.3 38.1 10.4 0.1 0.02006 16 254 34.6 12.0 11.4 16.5 3.5 2.6 0.7 64.2 2.4 44.4 17.3 0.1 0.0
Philippines 1990 12 994 56.6 12.9 12.2 19.5 18.4 5.7 0.3 43.0 0.7 2.6 28.9 10.4 0.02000 34 491 52.2 9.8 9.2 18.6 18.9 4.9 0.9 46.8 0.2 0.8 38.8 6.8 0.02006 51 532 41.6 9.2 8.7 16.3 13.6 2.5 0.5 57.9 0.1 1.2 49.4 6.7 0.0
Poland - Pologne 1990 8 976 69.3 64.7 56.8 1.6 2.3 0.6 21.9 8.2 0.5 0.9 5.2 1.5 ..2000 48 940 78.6 71.2 69.0 4.4 2.2 0.8 11.1 10.2 0.6 1.3 7.7 0.5 0.02006 127 209 77.4 74.8 73.0 1.3 0.9 0.4 12.3 9.7 0.6 1.3 6.6 1.1 0.0
Portugal 1990 25 105 83.0 75.3 72.0 3.9 2.6 1.2 0.2 16.6 7.4 3.6 3.2 2.4 0.02000 38 224 84.7 78.5 75.5 3.1 2.6 0.5 0.9 14.5 4.6 2.8 4.8 2.1 0.02006 66 684 77.2 74.3 72.3 1.5 1.0 0.4 2.2 17.1 6.2 4.2 4.2 2.5 0.0
For sources and notes, see end of table. Pour les sources et les notes, se reporter à la fin du tableau.
Other
AutresTotal
Origin / Origine
Year
Année
World(millions
of dollars)
Monde(millions
de dollars)
Developed economiesÉconomies développées
Oceania
Océanie
Percentage / En pourcentage
Economiesin transition
Économiesen
transition
Developing economiesÉconomies en développement
Total
Europe
USA
États-Unis
Japan
Japon
Eastern,Southern and
South-Eastern Asia
Asieorientale,
méridionaleet du Sud-Est
WesternAsia
Asieocciden-
tale
Africa
Afrique
America
Amérique
2.1 Country trade structure by partner:Imports by main region of origin
2.1 Structure du commerce des pays par partenaires :Importations par principales régions d'origine
68
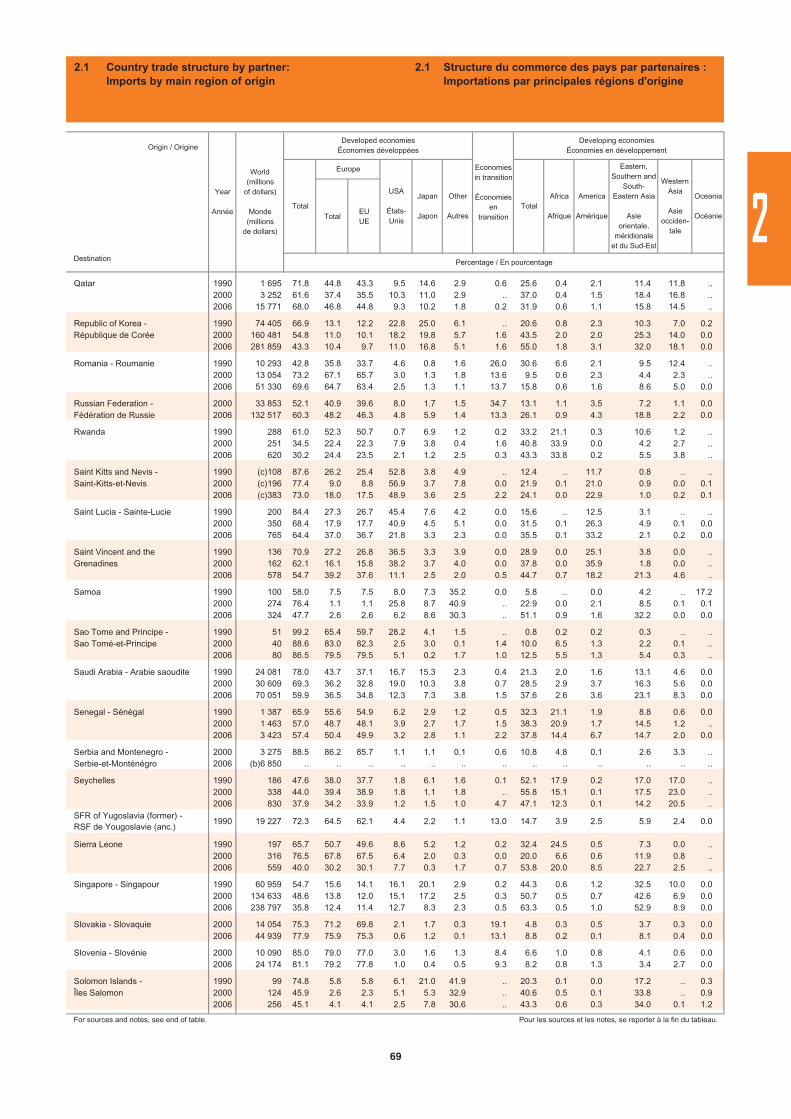
TotalEUUE
Destination
Qatar 1990 1 695 71.8 44.8 43.3 9.5 14.6 2.9 0.6 25.6 0.4 2.1 11.4 11.8 ..2000 3 252 61.6 37.4 35.5 10.3 11.0 2.9 .. 37.0 0.4 1.5 18.4 16.8 ..2006 15 771 68.0 46.8 44.8 9.3 10.2 1.8 0.2 31.9 0.6 1.1 15.8 14.5 ..
Republic of Korea - 1990 74 405 66.9 13.1 12.2 22.8 25.0 6.1 .. 20.6 0.8 2.3 10.3 7.0 0.2République de Corée 2000 160 481 54.8 11.0 10.1 18.2 19.8 5.7 1.6 43.5 2.0 2.0 25.3 14.0 0.0
2006 281 859 43.3 10.4 9.7 11.0 16.8 5.1 1.6 55.0 1.8 3.1 32.0 18.1 0.0
Romania - Roumanie 1990 10 293 42.8 35.8 33.7 4.6 0.8 1.6 26.0 30.6 6.6 2.1 9.5 12.4 ..2000 13 054 73.2 67.1 65.7 3.0 1.3 1.8 13.6 9.5 0.6 2.3 4.4 2.3 ..2006 51 330 69.6 64.7 63.4 2.5 1.3 1.1 13.7 15.8 0.6 1.6 8.6 5.0 0.0
Russian Federation - 2000 33 853 52.1 40.9 39.6 8.0 1.7 1.5 34.7 13.1 1.1 3.5 7.2 1.1 0.0Fédération de Russie 2006 132 517 60.3 48.2 46.3 4.8 5.9 1.4 13.3 26.1 0.9 4.3 18.8 2.2 0.0
Rwanda 1990 288 61.0 52.3 50.7 0.7 6.9 1.2 0.2 33.2 21.1 0.3 10.6 1.2 ..2000 251 34.5 22.4 22.3 7.9 3.8 0.4 1.6 40.8 33.9 0.0 4.2 2.7 ..2006 620 30.2 24.4 23.5 2.1 1.2 2.5 0.3 43.3 33.8 0.2 5.5 3.8 ..
Saint Kitts and Nevis - 1990 (c)108 87.6 26.2 25.4 52.8 3.8 4.9 .. 12.4 .. 11.7 0.8 .. ..Saint-Kitts-et-Nevis 2000 (c)196 77.4 9.0 8.8 56.9 3.7 7.8 0.0 21.9 0.1 21.0 0.9 0.0 0.1
2006 (c)383 73.0 18.0 17.5 48.9 3.6 2.5 2.2 24.1 0.0 22.9 1.0 0.2 0.1
Saint Lucia - Sainte-Lucie 1990 200 84.4 27.3 26.7 45.4 7.6 4.2 0.0 15.6 .. 12.5 3.1 .. ..2000 350 68.4 17.9 17.7 40.9 4.5 5.1 0.0 31.5 0.1 26.3 4.9 0.1 0.02006 765 64.4 37.0 36.7 21.8 3.3 2.3 0.0 35.5 0.1 33.2 2.1 0.2 0.0
Saint Vincent and the 1990 136 70.9 27.2 26.8 36.5 3.3 3.9 0.0 28.9 0.0 25.1 3.8 0.0 ..Grenadines 2000 162 62.1 16.1 15.8 38.2 3.7 4.0 0.0 37.8 0.0 35.9 1.8 0.0 ..
2006 578 54.7 39.2 37.6 11.1 2.5 2.0 0.5 44.7 0.7 18.2 21.3 4.6 ..
Samoa 1990 100 58.0 7.5 7.5 8.0 7.3 35.2 0.0 5.8 .. 0.0 4.2 .. 17.22000 274 76.4 1.1 1.1 25.8 8.7 40.9 .. 22.9 0.0 2.1 8.5 0.1 0.12006 324 47.7 2.6 2.6 6.2 8.6 30.3 .. 51.1 0.9 1.6 32.2 0.0 0.0
Sao Tome and Principe - 1990 51 99.2 65.4 59.7 28.2 4.1 1.5 .. 0.8 0.2 0.2 0.3 .. ..Sao Tomé-et-Principe 2000 40 88.6 83.0 82.3 2.5 3.0 0.1 1.4 10.0 6.5 1.3 2.2 0.1 ..
2006 80 86.5 79.5 79.5 5.1 0.2 1.7 1.0 12.5 5.5 1.3 5.4 0.3 ..
Saudi Arabia - Arabie saoudite 1990 24 081 78.0 43.7 37.1 16.7 15.3 2.3 0.4 21.3 2.0 1.6 13.1 4.6 0.02000 30 609 69.3 36.2 32.8 19.0 10.3 3.8 0.7 28.5 2.9 3.7 16.3 5.6 0.02006 70 051 59.9 36.5 34.8 12.3 7.3 3.8 1.5 37.6 2.6 3.6 23.1 8.3 0.0
Senegal - Sénégal 1990 1 387 65.9 55.6 54.9 6.2 2.9 1.2 0.5 32.3 21.1 1.9 8.8 0.6 0.02000 1 463 57.0 48.7 48.1 3.9 2.7 1.7 1.5 38.3 20.9 1.7 14.5 1.2 ..2006 3 423 57.4 50.4 49.9 3.2 2.8 1.1 2.2 37.8 14.4 6.7 14.7 2.0 0.0
Serbia and Montenegro - 2000 3 275 88.5 86.2 85.7 1.1 1.1 0.1 0.6 10.8 4.8 0.1 2.6 3.3 ..Serbie-et-Monténégro 2006 (b)6 850 .. .. .. .. .. .. .. .. .. .. .. .. ..
Seychelles 1990 186 47.6 38.0 37.7 1.8 6.1 1.6 0.1 52.1 17.9 0.2 17.0 17.0 ..2000 338 44.0 39.4 38.9 1.8 1.1 1.8 .. 55.8 15.1 0.1 17.5 23.0 ..2006 830 37.9 34.2 33.9 1.2 1.5 1.0 4.7 47.1 12.3 0.1 14.2 20.5 ..
SFR of Yugoslavia (former) - RSF de Yougoslavie (anc.)
1990 19 227 72.3 64.5 62.1 4.4 2.2 1.1 13.0 14.7 3.9 2.5 5.9 2.4 0.0
Sierra Leone 1990 197 65.7 50.7 49.6 8.6 5.2 1.2 0.2 32.4 24.5 0.5 7.3 0.0 ..2000 316 76.5 67.8 67.5 6.4 2.0 0.3 0.0 20.0 6.6 0.6 11.9 0.8 ..2006 559 40.0 30.2 30.1 7.7 0.3 1.7 0.7 53.8 20.0 8.5 22.7 2.5 ..
Singapore - Singapour 1990 60 959 54.7 15.6 14.1 16.1 20.1 2.9 0.2 44.3 0.6 1.2 32.5 10.0 0.02000 134 633 48.6 13.8 12.0 15.1 17.2 2.5 0.3 50.7 0.5 0.7 42.6 6.9 0.02006 238 797 35.8 12.4 11.4 12.7 8.3 2.3 0.5 63.3 0.5 1.0 52.9 8.9 0.0
Slovakia - Slovaquie 2000 14 054 75.3 71.2 69.8 2.1 1.7 0.3 19.1 4.8 0.3 0.5 3.7 0.3 0.02006 44 939 77.9 75.9 75.3 0.6 1.2 0.1 13.1 8.8 0.2 0.1 8.1 0.4 0.0
Slovenia - Slovénie 2000 10 090 85.0 79.0 77.0 3.0 1.6 1.3 8.4 6.6 1.0 0.8 4.1 0.6 0.02006 24 174 81.1 79.2 77.8 1.0 0.4 0.5 9.3 8.2 0.8 1.3 3.4 2.7 0.0
Solomon Islands - 1990 99 74.8 5.8 5.8 6.1 21.0 41.9 .. 20.3 0.1 0.0 17.2 .. 0.3Îles Salomon 2000 124 45.9 2.6 2.3 5.1 5.3 32.9 .. 40.6 0.5 0.1 33.8 .. 0.9
2006 256 45.1 4.1 4.1 2.5 7.8 30.6 .. 43.3 0.6 0.3 34.0 0.1 1.2
For sources and notes, see end of table. Pour les sources et les notes, se reporter à la fin du tableau.
Oceania
Océanie
Percentage / En pourcentage
Origin / Origine
Year
Année
World(millions
of dollars)
Monde(millions
de dollars)
Developed economiesÉconomies développées
Total
Europe
Other
AutresTotal
Africa
Afrique
America
Amérique
Eastern,Southern and
South-Eastern Asia
Asieorientale,
méridionaleet du Sud-Est
WesternAsia
Asieocciden-
tale
USA
États-Unis
Japan
Japon
Economiesin transition
Économiesen
transition
Developing economiesÉconomies en développement
2.1 Country trade structure by partner:Imports by main region of origin
2.1 Structure du commerce des pays par partenaires :Importations par principales régions d'origine
2
69
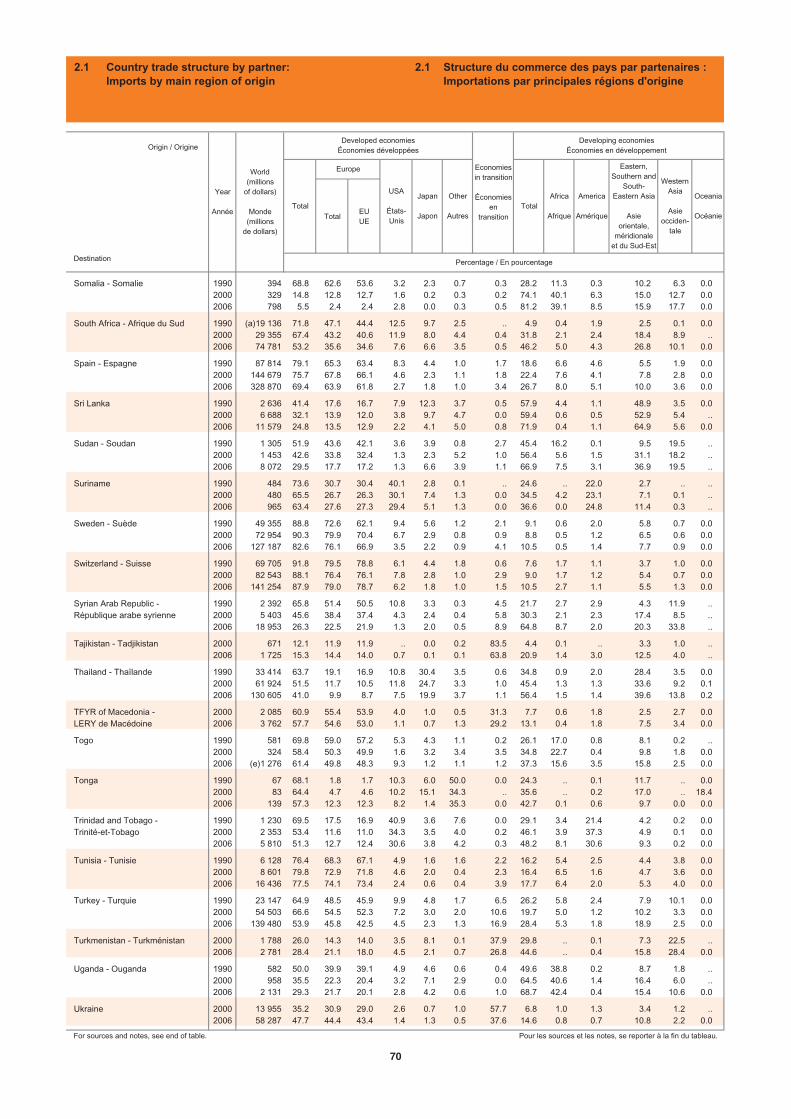
TotalEUUE
Destination
Somalia - Somalie 1990 394 68.8 62.6 53.6 3.2 2.3 0.7 0.3 28.2 11.3 0.3 10.2 6.3 0.02000 329 14.8 12.8 12.7 1.6 0.2 0.3 0.2 74.1 40.1 6.3 15.0 12.7 0.02006 798 5.5 2.4 2.4 2.8 0.0 0.3 0.5 81.2 39.1 8.5 15.9 17.7 0.0
South Africa - Afrique du Sud 1990 (a)19 136 71.8 47.1 44.4 12.5 9.7 2.5 .. 4.9 0.4 1.9 2.5 0.1 0.02000 29 355 67.4 43.2 40.6 11.9 8.0 4.4 0.4 31.8 2.1 2.4 18.4 8.9 ..2006 74 781 53.2 35.6 34.6 7.6 6.6 3.5 0.5 46.2 5.0 4.3 26.8 10.1 0.0
Spain - Espagne 1990 87 814 79.1 65.3 63.4 8.3 4.4 1.0 1.7 18.6 6.6 4.6 5.5 1.9 0.02000 144 679 75.7 67.8 66.1 4.6 2.3 1.1 1.8 22.4 7.6 4.1 7.8 2.8 0.02006 328 870 69.4 63.9 61.8 2.7 1.8 1.0 3.4 26.7 8.0 5.1 10.0 3.6 0.0
Sri Lanka 1990 2 636 41.4 17.6 16.7 7.9 12.3 3.7 0.5 57.9 4.4 1.1 48.9 3.5 0.02000 6 688 32.1 13.9 12.0 3.8 9.7 4.7 0.0 59.4 0.6 0.5 52.9 5.4 ..2006 11 579 24.8 13.5 12.9 2.2 4.1 5.0 0.8 71.9 0.4 1.1 64.9 5.6 0.0
Sudan - Soudan 1990 1 305 51.9 43.6 42.1 3.6 3.9 0.8 2.7 45.4 16.2 0.1 9.5 19.5 ..2000 1 453 42.6 33.8 32.4 1.3 2.3 5.2 1.0 56.4 5.6 1.5 31.1 18.2 ..2006 8 072 29.5 17.7 17.2 1.3 6.6 3.9 1.1 66.9 7.5 3.1 36.9 19.5 ..
Suriname 1990 484 73.6 30.7 30.4 40.1 2.8 0.1 .. 24.6 .. 22.0 2.7 .. ..2000 480 65.5 26.7 26.3 30.1 7.4 1.3 0.0 34.5 4.2 23.1 7.1 0.1 ..2006 965 63.4 27.6 27.3 29.4 5.1 1.3 0.0 36.6 0.0 24.8 11.4 0.3 ..
Sweden - Suède 1990 49 355 88.8 72.6 62.1 9.4 5.6 1.2 2.1 9.1 0.6 2.0 5.8 0.7 0.02000 72 954 90.3 79.9 70.4 6.7 2.9 0.8 0.9 8.8 0.5 1.2 6.5 0.6 0.02006 127 187 82.6 76.1 66.9 3.5 2.2 0.9 4.1 10.5 0.5 1.4 7.7 0.9 0.0
Switzerland - Suisse 1990 69 705 91.8 79.5 78.8 6.1 4.4 1.8 0.6 7.6 1.7 1.1 3.7 1.0 0.02000 82 543 88.1 76.4 76.1 7.8 2.8 1.0 2.9 9.0 1.7 1.2 5.4 0.7 0.02006 141 254 87.9 79.0 78.7 6.2 1.8 1.0 1.5 10.5 2.7 1.1 5.5 1.3 0.0
Syrian Arab Republic - 1990 2 392 65.8 51.4 50.5 10.8 3.3 0.3 4.5 21.7 2.7 2.9 4.3 11.9 ..République arabe syrienne 2000 5 403 45.6 38.4 37.4 4.3 2.4 0.4 5.8 30.3 2.1 2.3 17.4 8.5 ..
2006 18 953 26.3 22.5 21.9 1.3 2.0 0.5 8.9 64.8 8.7 2.0 20.3 33.8 ..
Tajikistan - Tadjikistan 2000 671 12.1 11.9 11.9 .. 0.0 0.2 83.5 4.4 0.1 .. 3.3 1.0 ..2006 1 725 15.3 14.4 14.0 0.7 0.1 0.1 63.8 20.9 1.4 3.0 12.5 4.0 ..
Thailand - Thaïlande 1990 33 414 63.7 19.1 16.9 10.8 30.4 3.5 0.6 34.8 0.9 2.0 28.4 3.5 0.02000 61 924 51.5 11.7 10.5 11.8 24.7 3.3 1.0 45.4 1.3 1.3 33.6 9.2 0.12006 130 605 41.0 9.9 8.7 7.5 19.9 3.7 1.1 56.4 1.5 1.4 39.6 13.8 0.2
TFYR of Macedonia - 2000 2 085 60.9 55.4 53.9 4.0 1.0 0.5 31.3 7.7 0.6 1.8 2.5 2.7 0.0LERY de Macédoine 2006 3 762 57.7 54.6 53.0 1.1 0.7 1.3 29.2 13.1 0.4 1.8 7.5 3.4 0.0
Togo 1990 581 69.8 59.0 57.2 5.3 4.3 1.1 0.2 26.1 17.0 0.8 8.1 0.2 ..2000 324 58.4 50.3 49.9 1.6 3.2 3.4 3.5 34.8 22.7 0.4 9.8 1.8 0.02006 (e)1 276 61.4 49.8 48.3 9.3 1.2 1.1 1.2 37.3 15.6 3.5 15.8 2.5 0.0
Tonga 1990 67 68.1 1.8 1.7 10.3 6.0 50.0 0.0 24.3 .. 0.1 11.7 .. 0.02000 83 64.4 4.7 4.6 10.2 15.1 34.3 .. 35.6 .. 0.2 17.0 .. 18.42006 139 57.3 12.3 12.3 8.2 1.4 35.3 0.0 42.7 0.1 0.6 9.7 0.0 0.0
Trinidad and Tobago - 1990 1 230 69.5 17.5 16.9 40.9 3.6 7.6 0.0 29.1 3.4 21.4 4.2 0.2 0.0Trinité-et-Tobago 2000 2 353 53.4 11.6 11.0 34.3 3.5 4.0 0.2 46.1 3.9 37.3 4.9 0.1 0.0
2006 5 810 51.3 12.7 12.4 30.6 3.8 4.2 0.3 48.2 8.1 30.6 9.3 0.2 0.0
Tunisia - Tunisie 1990 6 128 76.4 68.3 67.1 4.9 1.6 1.6 2.2 16.2 5.4 2.5 4.4 3.8 0.02000 8 601 79.8 72.9 71.8 4.6 2.0 0.4 2.3 16.4 6.5 1.6 4.7 3.6 0.02006 16 436 77.5 74.1 73.4 2.4 0.6 0.4 3.9 17.7 6.4 2.0 5.3 4.0 0.0
Turkey - Turquie 1990 23 147 64.9 48.5 45.9 9.9 4.8 1.7 6.5 26.2 5.8 2.4 7.9 10.1 0.02000 54 503 66.6 54.5 52.3 7.2 3.0 2.0 10.6 19.7 5.0 1.2 10.2 3.3 0.02006 139 480 53.9 45.8 42.5 4.5 2.3 1.3 16.9 28.4 5.3 1.8 18.9 2.5 0.0
Turkmenistan - Turkménistan 2000 1 788 26.0 14.3 14.0 3.5 8.1 0.1 37.9 29.8 .. 0.1 7.3 22.5 ..2006 2 781 28.4 21.1 18.0 4.5 2.1 0.7 26.8 44.6 .. 0.4 15.8 28.4 0.0
Uganda - Ouganda 1990 582 50.0 39.9 39.1 4.9 4.6 0.6 0.4 49.6 38.8 0.2 8.7 1.8 ..2000 958 35.5 22.3 20.4 3.2 7.1 2.9 0.0 64.5 40.6 1.4 16.4 6.0 ..2006 2 131 29.3 21.7 20.1 2.8 4.2 0.6 1.0 68.7 42.4 0.4 15.4 10.6 0.0
Ukraine 2000 13 955 35.2 30.9 29.0 2.6 0.7 1.0 57.7 6.8 1.0 1.3 3.4 1.2 ..2006 58 287 47.7 44.4 43.4 1.4 1.3 0.5 37.6 14.6 0.8 0.7 10.8 2.2 0.0
For sources and notes, see end of table. Pour les sources et les notes, se reporter à la fin du tableau.
Africa
Afrique
America
Amérique
Eastern,Southern and
South-Eastern Asia
Asieorientale,
méridionaleet du Sud-Est
Origin / Origine
Year
Année
World(millions
of dollars)
Monde(millions
de dollars)
Developed economiesÉconomies développées
Other
Autres
WesternAsia
Asieocciden-
tale
Oceania
Océanie
Percentage / En pourcentage
Economiesin transition
Économiesen
transition
Developing economiesÉconomies en développement
Total
Europe
USA
États-Unis
Japan
JaponTotal
2.1 Country trade structure by partner:Imports by main region of origin
2.1 Structure du commerce des pays par partenaires :Importations par principales régions d'origine
70
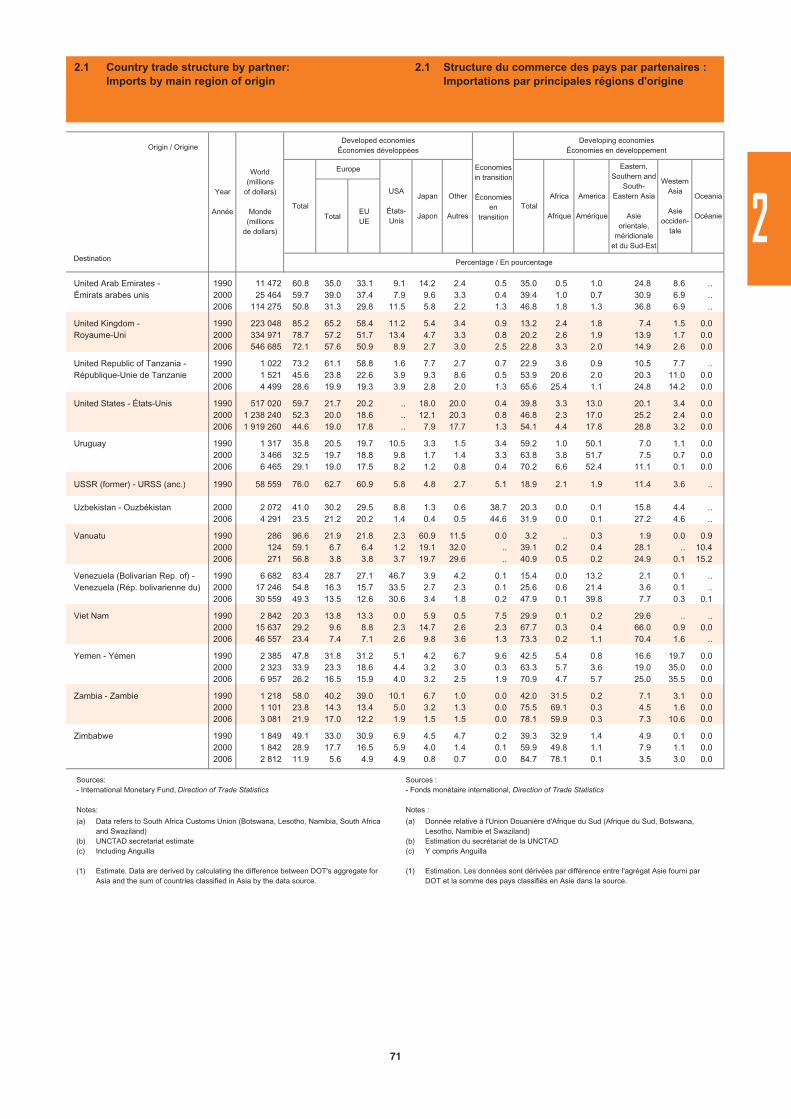
TotalEUUE
Destination
United Arab Emirates - 1990 11 472 60.8 35.0 33.1 9.1 14.2 2.4 0.5 35.0 0.5 1.0 24.8 8.6 ..Émirats arabes unis 2000 25 464 59.7 39.0 37.4 7.9 9.6 3.3 0.4 39.4 1.0 0.7 30.9 6.9 ..
2006 114 275 50.8 31.3 29.8 11.5 5.8 2.2 1.3 46.8 1.8 1.3 36.8 6.9 ..
United Kingdom - 1990 223 048 85.2 65.2 58.4 11.2 5.4 3.4 0.9 13.2 2.4 1.8 7.4 1.5 0.0Royaume-Uni 2000 334 971 78.7 57.2 51.7 13.4 4.7 3.3 0.8 20.2 2.6 1.9 13.9 1.7 0.0
2006 546 685 72.1 57.6 50.9 8.9 2.7 3.0 2.5 22.8 3.3 2.0 14.9 2.6 0.0
United Republic of Tanzania - 1990 1 022 73.2 61.1 58.8 1.6 7.7 2.7 0.7 22.9 3.6 0.9 10.5 7.7 ..République-Unie de Tanzanie 2000 1 521 45.6 23.8 22.6 3.9 9.3 8.6 0.5 53.9 20.6 2.0 20.3 11.0 0.0
2006 4 499 28.6 19.9 19.3 3.9 2.8 2.0 1.3 65.6 25.4 1.1 24.8 14.2 0.0
United States - États-Unis 1990 517 020 59.7 21.7 20.2 .. 18.0 20.0 0.4 39.8 3.3 13.0 20.1 3.4 0.02000 1 238 240 52.3 20.0 18.6 .. 12.1 20.3 0.8 46.8 2.3 17.0 25.2 2.4 0.02006 1 919 260 44.6 19.0 17.8 .. 7.9 17.7 1.3 54.1 4.4 17.8 28.8 3.2 0.0
Uruguay 1990 1 317 35.8 20.5 19.7 10.5 3.3 1.5 3.4 59.2 1.0 50.1 7.0 1.1 0.02000 3 466 32.5 19.7 18.8 9.8 1.7 1.4 3.3 63.8 3.8 51.7 7.5 0.7 0.02006 6 465 29.1 19.0 17.5 8.2 1.2 0.8 0.4 70.2 6.6 52.4 11.1 0.1 0.0
USSR (former) - URSS (anc.) 1990 58 559 76.0 62.7 60.9 5.8 4.8 2.7 5.1 18.9 2.1 1.9 11.4 3.6 ..
Uzbekistan - Ouzbékistan 2000 2 072 41.0 30.2 29.5 8.8 1.3 0.6 38.7 20.3 0.0 0.1 15.8 4.4 ..2006 4 291 23.5 21.2 20.2 1.4 0.4 0.5 44.6 31.9 0.0 0.1 27.2 4.6 ..
Vanuatu 1990 286 96.6 21.9 21.8 2.3 60.9 11.5 0.0 3.2 .. 0.3 1.9 0.0 0.92000 124 59.1 6.7 6.4 1.2 19.1 32.0 .. 39.1 0.2 0.4 28.1 .. 10.42006 271 56.8 3.8 3.8 3.7 19.7 29.6 .. 40.9 0.5 0.2 24.9 0.1 15.2
Venezuela (Bolivarian Rep. of) - 1990 6 682 83.4 28.7 27.1 46.7 3.9 4.2 0.1 15.4 0.0 13.2 2.1 0.1 ..Venezuela (Rép. bolivarienne du) 2000 17 246 54.8 16.3 15.7 33.5 2.7 2.3 0.1 25.6 0.6 21.4 3.6 0.1 ..
2006 30 559 49.3 13.5 12.6 30.6 3.4 1.8 0.2 47.9 0.1 39.8 7.7 0.3 0.1
Viet Nam 1990 2 842 20.3 13.8 13.3 0.0 5.9 0.5 7.5 29.9 0.1 0.2 29.6 .. ..2000 15 637 29.2 9.6 8.8 2.3 14.7 2.6 2.3 67.7 0.3 0.4 66.0 0.9 0.02006 46 557 23.4 7.4 7.1 2.6 9.8 3.6 1.3 73.3 0.2 1.1 70.4 1.6 ..
Yemen - Yémen 1990 2 385 47.8 31.8 31.2 5.1 4.2 6.7 9.6 42.5 5.4 0.8 16.6 19.7 0.02000 2 323 33.9 23.3 18.6 4.4 3.2 3.0 0.3 63.3 5.7 3.6 19.0 35.0 0.02006 6 957 26.2 16.5 15.9 4.0 3.2 2.5 1.9 70.9 4.7 5.7 25.0 35.5 0.0
Zambia - Zambie 1990 1 218 58.0 40.2 39.0 10.1 6.7 1.0 0.0 42.0 31.5 0.2 7.1 3.1 0.02000 1 101 23.8 14.3 13.4 5.0 3.2 1.3 0.0 75.5 69.1 0.3 4.5 1.6 0.02006 3 081 21.9 17.0 12.2 1.9 1.5 1.5 0.0 78.1 59.9 0.3 7.3 10.6 0.0
Zimbabwe 1990 1 849 49.1 33.0 30.9 6.9 4.5 4.7 0.2 39.3 32.9 1.4 4.9 0.1 0.02000 1 842 28.9 17.7 16.5 5.9 4.0 1.4 0.1 59.9 49.8 1.1 7.9 1.1 0.02006 2 812 11.9 5.6 4.9 4.9 0.8 0.7 0.0 84.7 78.1 0.1 3.5 3.0 0.0
Origin / Origine
Year
Année
World(millions
of dollars)
Monde(millions
de dollars)
Developed economiesÉconomies développées
Economiesin transition
Économiesen
transition
Developing economiesÉconomies en développement
Total
Europe
Oceania
Océanie
Percentage / En pourcentage
Africa
Afrique
America
Amérique
Eastern,Southern and
South-Eastern Asia
Asieorientale,
méridionaleet du Sud-Est
WesternAsia
Asieocciden-
tale
USA
États-Unis
Japan
Japon
Other
AutresTotal
2.1 Country trade structure by partner:Imports by main region of origin
2.1 Structure du commerce des pays par partenaires :Importations par principales régions d'origine
(a)
(b)(c)
(1)
Data refers to South Africa Customs Union (Botswana, Lesotho, Namibia, South Africa and Swaziland) UNCTAD secretariat estimateIncluding Anguilla
Estimate. Data are derived by calculating the difference between DOT's aggregate for Asia and the sum of countries classified in Asia by the data source.
Sources:- International Monetary Fund, Direction of Trade Statistics
Notes:
(a)
(b)(c)
(1)
Donnée relative à l'Union Douanière d'Afrique du Sud (Afrique du Sud, Botswana, Lesotho, Namibie et Swaziland) Estimation du secrétariat de la UNCTAD Y compris Anguilla
Estimation. Les données sont dérivées par différence entre l'agrégat Asie fourni par DOT et la somme des pays classifiés en Asie dans la source.
Sources : - Fonds monétaire international, Direction of Trade Statistics
Notes :
2
71

Product group
TotalEU
UE
Millions of dollars
All products 1995 5 065 268 3 430 428 2 137 657 2 014 714 164 449 744 055 293 536 90 730 98 657
2000 6 309 659 4 370 229 2 515 979 2 379 963 232 061 1 177 758 332 349 112 082 93 928
2006 11 921 375 7 713 289 4 853 452 4 590 019 337 348 1 782 644 539 693 200 151 333 242
Share by destination (percentage)
All products 1995 100.0 67.7 42.2 39.8 3.2 14.7 5.8 1.8 1.9
2000 100.0 69.3 39.9 37.7 3.7 18.7 5.3 1.8 1.5
2006 100.0 64.7 40.7 38.5 2.8 15.0 4.5 1.7 2.8
All food items 1995 100.0 68.8 48.5 46.9 2.0 7.5 9.6 1.1 4.6
(SITC 0 + 1 + 22 + 4) 2000 100.0 68.8 44.6 43.1 2.8 10.9 9.2 1.4 3.1
2006 100.0 67.2 47.4 45.9 2.7 9.9 5.8 1.4 4.7
Agricultural raw materials 1995 100.0 68.4 41.4 39.7 2.1 11.7 12.2 1.0 1.0
(SITC 2 - 22 - 27 - 28) 2000 100.0 67.2 40.4 38.8 2.8 14.2 8.8 1.0 1.3
2006 100.0 59.0 37.8 36.5 2.1 11.9 6.3 0.8 2.0
Ores, metals, precious stones 1995 100.0 69.8 43.3 38.5 2.5 11.4 9.9 2.8 1.2
and non-monetary gold 2000 100.0 69.1 41.7 36.4 2.6 14.4 6.8 3.6 1.2
(SITC 27 + 28 + 68 + 667 + 971) 2006 100.0 62.0 40.1 35.1 2.3 10.7 6.2 2.6 1.3
Fuels (SITC 3) 1995 100.0 63.8 33.7 31.8 1.3 16.4 11.4 1.0 2.7
2000 100.0 64.8 31.9 29.6 1.4 21.1 9.2 1.1 1.2
2006 100.0 63.7 33.8 31.5 1.5 18.1 9.1 1.3 1.2
Manufactured goods 1995 100.0 68.1 42.4 39.9 3.7 15.8 4.4 1.9 1.6
(SITC 5 to 8 less 667 and 68) 2000 100.0 69.6 39.9 37.9 4.2 19.5 4.3 1.8 1.3
2006 100.0 64.7 41.1 39.1 3.2 15.3 3.4 1.7 2.9
Share by major product group (percentage)
All products 1995 100.0 100.0 100.0 100.0 100.0 100.0 100.0 100.0 100.0
2000 100.0 100.0 100.0 100.0 100.0 100.0 100.0 100.0 100.0
2006 100.0 100.0 100.0 100.0 100.0 100.0 100.0 100.0 100.0
All food items 1995 8.9 9.1 10.3 10.5 5.6 4.6 14.9 5.6 20.9
(SITC 0 + 1 + 22 + 4) 2000 6.7 6.6 7.5 7.6 5.1 3.9 11.7 5.1 13.9
2006 6.2 6.4 7.2 7.4 5.9 4.1 8.0 5.1 10.3
Agricultural raw materials 1995 2.7 2.7 2.6 2.7 1.7 2.1 5.6 1.5 1.3
(SITC 2 - 22 - 27 - 28) 2000 1.9 1.8 1.9 1.9 1.4 1.4 3.1 1.1 1.7
2006 1.5 1.4 1.4 1.4 1.1 1.2 2.1 0.7 1.1
Ores, metals, precious stones 1995 4.5 4.6 4.6 4.3 3.5 3.5 7.6 7.0 2.8
and non-monetary gold 2000 4.0 4.0 4.2 3.9 2.8 3.1 5.2 8.2 3.3
(SITC 27 + 28 + 68 + 667 + 971) 2006 5.5 5.2 5.4 5.0 4.5 3.9 7.5 8.6 2.5
Fuels (SITC 3) 1995 7.4 7.0 5.9 5.9 3.0 8.3 14.6 4.1 10.3
2000 10.5 9.8 8.4 8.2 4.1 11.9 18.4 6.7 8.4
2006 14.5 14.2 12.0 11.8 7.5 17.5 29.0 11.3 6.4
Manufactured goods 1995 73.7 74.2 74.1 74.1 83.5 79.1 55.8 79.4 60.3
(SITC 5 to 8 less 667 and 68) 2000 73.9 74.3 74.0 74.3 83.9 77.0 59.7 75.0 62.1
2006 69.3 69.3 70.0 70.5 78.3 71.1 51.4 70.7 72.0
Year
Année
Destination
World
MondeTotal
Europe
Canada
Developed economies
Économies développées
Japan
Japon
Otherdevelopedcountries
Autreséconomies
développées
USA
États-Unis
Economiesin
transition
Économiesen
transition
2.2.A Export structure by partner and product groupWorld
Sources:- Data and UNCTAD secretariat estimates based on UN DESA Comtrade and IMF Direction of Trade statistics databases
72
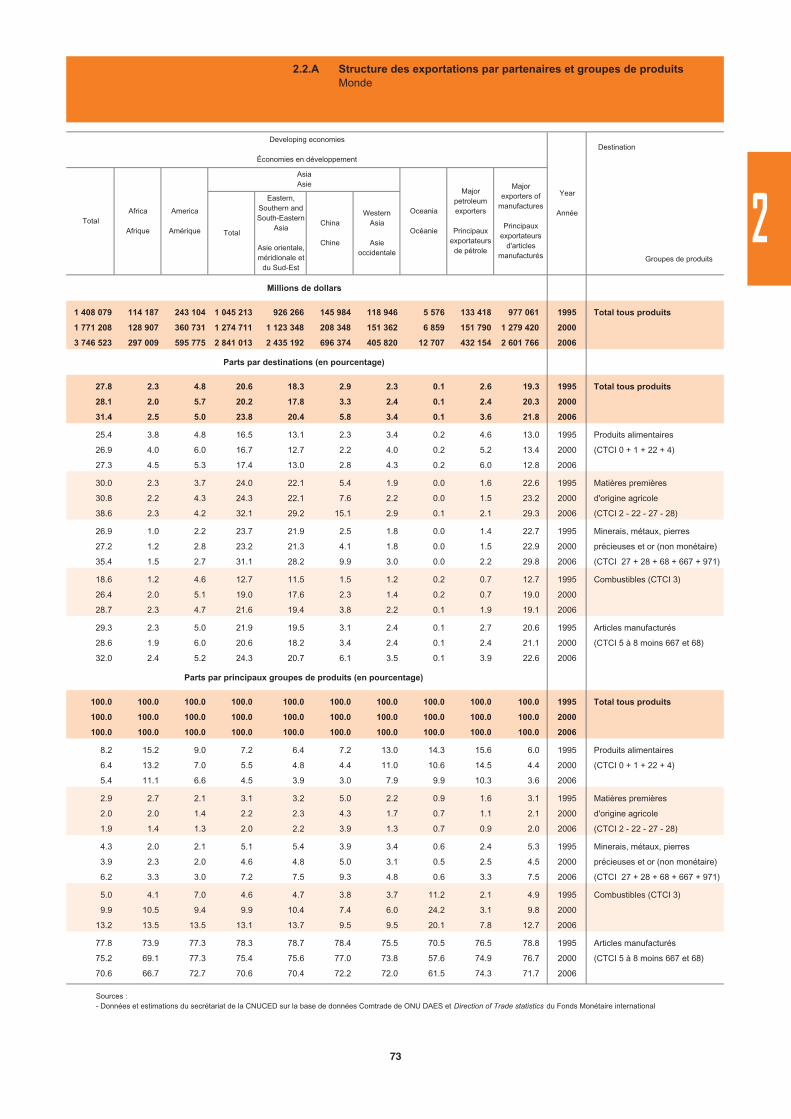
Millions de dollars
1 408 079 114 187 243 104 1 045 213 926 266 145 984 118 946 5 576 133 418 977 061 1995 Total tous produits
1 771 208 128 907 360 731 1 274 711 1 123 348 208 348 151 362 6 859 151 790 1 279 420 2000
3 746 523 297 009 595 775 2 841 013 2 435 192 696 374 405 820 12 707 432 154 2 601 766 2006
Parts par destinations (en pourcentage)
27.8 2.3 4.8 20.6 18.3 2.9 2.3 0.1 2.6 19.3 1995 Total tous produits
28.1 2.0 5.7 20.2 17.8 3.3 2.4 0.1 2.4 20.3 2000
31.4 2.5 5.0 23.8 20.4 5.8 3.4 0.1 3.6 21.8 2006
25.4 3.8 4.8 16.5 13.1 2.3 3.4 0.2 4.6 13.0 1995 Produits alimentaires
26.9 4.0 6.0 16.7 12.7 2.2 4.0 0.2 5.2 13.4 2000 (CTCI 0 + 1 + 22 + 4)
27.3 4.5 5.3 17.4 13.0 2.8 4.3 0.2 6.0 12.8 2006
30.0 2.3 3.7 24.0 22.1 5.4 1.9 0.0 1.6 22.6 1995 Matières premières
30.8 2.2 4.3 24.3 22.1 7.6 2.2 0.0 1.5 23.2 2000 d'origine agricole
38.6 2.3 4.2 32.1 29.2 15.1 2.9 0.1 2.1 29.3 2006 (CTCI 2 - 22 - 27 - 28)
26.9 1.0 2.2 23.7 21.9 2.5 1.8 0.0 1.4 22.7 1995 Minerais, métaux, pierres
27.2 1.2 2.8 23.2 21.3 4.1 1.8 0.0 1.5 22.9 2000 précieuses et or (non monétaire)
35.4 1.5 2.7 31.1 28.2 9.9 3.0 0.0 2.2 29.8 2006 (CTCI 27 + 28 + 68 + 667 + 971)
18.6 1.2 4.6 12.7 11.5 1.5 1.2 0.2 0.7 12.7 1995 Combustibles (CTCI 3)
26.4 2.0 5.1 19.0 17.6 2.3 1.4 0.2 0.7 19.0 2000
28.7 2.3 4.7 21.6 19.4 3.8 2.2 0.1 1.9 19.1 2006
29.3 2.3 5.0 21.9 19.5 3.1 2.4 0.1 2.7 20.6 1995 Articles manufacturés
28.6 1.9 6.0 20.6 18.2 3.4 2.4 0.1 2.4 21.1 2000 (CTCI 5 à 8 moins 667 et 68)
32.0 2.4 5.2 24.3 20.7 6.1 3.5 0.1 3.9 22.6 2006
Parts par principaux groupes de produits (en pourcentage)
100.0 100.0 100.0 100.0 100.0 100.0 100.0 100.0 100.0 100.0 1995 Total tous produits
100.0 100.0 100.0 100.0 100.0 100.0 100.0 100.0 100.0 100.0 2000
100.0 100.0 100.0 100.0 100.0 100.0 100.0 100.0 100.0 100.0 2006
8.2 15.2 9.0 7.2 6.4 7.2 13.0 14.3 15.6 6.0 1995 Produits alimentaires
6.4 13.2 7.0 5.5 4.8 4.4 11.0 10.6 14.5 4.4 2000 (CTCI 0 + 1 + 22 + 4)
5.4 11.1 6.6 4.5 3.9 3.0 7.9 9.9 10.3 3.6 2006
2.9 2.7 2.1 3.1 3.2 5.0 2.2 0.9 1.6 3.1 1995 Matières premières
2.0 2.0 1.4 2.2 2.3 4.3 1.7 0.7 1.1 2.1 2000 d'origine agricole
1.9 1.4 1.3 2.0 2.2 3.9 1.3 0.7 0.9 2.0 2006 (CTCI 2 - 22 - 27 - 28)
4.3 2.0 2.1 5.1 5.4 3.9 3.4 0.6 2.4 5.3 1995 Minerais, métaux, pierres
3.9 2.3 2.0 4.6 4.8 5.0 3.1 0.5 2.5 4.5 2000 précieuses et or (non monétaire)
6.2 3.3 3.0 7.2 7.5 9.3 4.8 0.6 3.3 7.5 2006 (CTCI 27 + 28 + 68 + 667 + 971)
5.0 4.1 7.0 4.6 4.7 3.8 3.7 11.2 2.1 4.9 1995 Combustibles (CTCI 3)
9.9 10.5 9.4 9.9 10.4 7.4 6.0 24.2 3.1 9.8 2000
13.2 13.5 13.5 13.1 13.7 9.5 9.5 20.1 7.8 12.7 2006
77.8 73.9 77.3 78.3 78.7 78.4 75.5 70.5 76.5 78.8 1995 Articles manufacturés
75.2 69.1 77.3 75.4 75.6 77.0 73.8 57.6 74.9 76.7 2000 (CTCI 5 à 8 moins 667 et 68)
70.6 66.7 72.7 70.6 70.4 72.2 72.0 61.5 74.3 71.7 2006
Groupes de produits
Destination
Year
Année
Majorexporters of
manufactures
Principauxexportateurs
d'articlesmanufacturés
Developing economies
Économies en développement
TotalAfrica
Afrique
America
Amérique
Majorpetroleumexporters
Principauxexportateurs
de pétrole
AsiaAsie
Total
Eastern,Southern and South-Eastern
Asia
Asie orientale, méridionale et
du Sud-Est
China
Chine
WesternAsia
Asieoccidentale
Oceania
Océanie
2.2.A Structure des exportations par partenaires et groupes de produitsMonde
Sources : - Données et estimations du secrétariat de la CNUCED sur la base de données Comtrade de ONU DAES et Direction of Trade statistics du Fonds Monétaire international
2
73
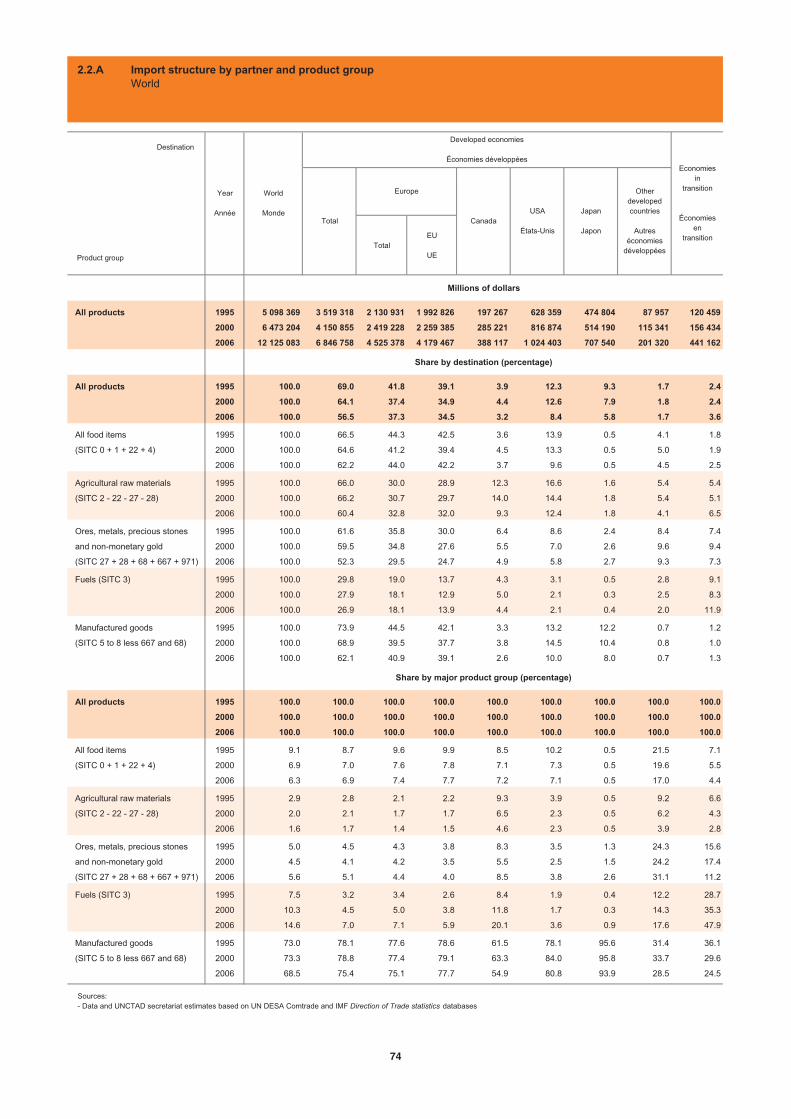
Product group
TotalEU
UE
Millions of dollars
All products 1995 5 098 369 3 519 318 2 130 931 1 992 826 197 267 628 359 474 804 87 957 120 459
2000 6 473 204 4 150 855 2 419 228 2 259 385 285 221 816 874 514 190 115 341 156 434
2006 12 125 083 6 846 758 4 525 378 4 179 467 388 117 1 024 403 707 540 201 320 441 162
Share by destination (percentage)
All products 1995 100.0 69.0 41.8 39.1 3.9 12.3 9.3 1.7 2.4
2000 100.0 64.1 37.4 34.9 4.4 12.6 7.9 1.8 2.4
2006 100.0 56.5 37.3 34.5 3.2 8.4 5.8 1.7 3.6
All food items 1995 100.0 66.5 44.3 42.5 3.6 13.9 0.5 4.1 1.8
(SITC 0 + 1 + 22 + 4) 2000 100.0 64.6 41.2 39.4 4.5 13.3 0.5 5.0 1.9
2006 100.0 62.2 44.0 42.2 3.7 9.6 0.5 4.5 2.5
Agricultural raw materials 1995 100.0 66.0 30.0 28.9 12.3 16.6 1.6 5.4 5.4
(SITC 2 - 22 - 27 - 28) 2000 100.0 66.2 30.7 29.7 14.0 14.4 1.8 5.4 5.1
2006 100.0 60.4 32.8 32.0 9.3 12.4 1.8 4.1 6.5
Ores, metals, precious stones 1995 100.0 61.6 35.8 30.0 6.4 8.6 2.4 8.4 7.4
and non-monetary gold 2000 100.0 59.5 34.8 27.6 5.5 7.0 2.6 9.6 9.4
(SITC 27 + 28 + 68 + 667 + 971) 2006 100.0 52.3 29.5 24.7 4.9 5.8 2.7 9.3 7.3
Fuels (SITC 3) 1995 100.0 29.8 19.0 13.7 4.3 3.1 0.5 2.8 9.1
2000 100.0 27.9 18.1 12.9 5.0 2.1 0.3 2.5 8.3
2006 100.0 26.9 18.1 13.9 4.4 2.1 0.4 2.0 11.9
Manufactured goods 1995 100.0 73.9 44.5 42.1 3.3 13.2 12.2 0.7 1.2
(SITC 5 to 8 less 667 and 68) 2000 100.0 68.9 39.5 37.7 3.8 14.5 10.4 0.8 1.0
2006 100.0 62.1 40.9 39.1 2.6 10.0 8.0 0.7 1.3
Share by major product group (percentage)
All products 1995 100.0 100.0 100.0 100.0 100.0 100.0 100.0 100.0 100.0
2000 100.0 100.0 100.0 100.0 100.0 100.0 100.0 100.0 100.0
2006 100.0 100.0 100.0 100.0 100.0 100.0 100.0 100.0 100.0
All food items 1995 9.1 8.7 9.6 9.9 8.5 10.2 0.5 21.5 7.1
(SITC 0 + 1 + 22 + 4) 2000 6.9 7.0 7.6 7.8 7.1 7.3 0.5 19.6 5.5
2006 6.3 6.9 7.4 7.7 7.2 7.1 0.5 17.0 4.4
Agricultural raw materials 1995 2.9 2.8 2.1 2.2 9.3 3.9 0.5 9.2 6.6
(SITC 2 - 22 - 27 - 28) 2000 2.0 2.1 1.7 1.7 6.5 2.3 0.5 6.2 4.3
2006 1.6 1.7 1.4 1.5 4.6 2.3 0.5 3.9 2.8
Ores, metals, precious stones 1995 5.0 4.5 4.3 3.8 8.3 3.5 1.3 24.3 15.6
and non-monetary gold 2000 4.5 4.1 4.2 3.5 5.5 2.5 1.5 24.2 17.4
(SITC 27 + 28 + 68 + 667 + 971) 2006 5.6 5.1 4.4 4.0 8.5 3.8 2.6 31.1 11.2
Fuels (SITC 3) 1995 7.5 3.2 3.4 2.6 8.4 1.9 0.4 12.2 28.7
2000 10.3 4.5 5.0 3.8 11.8 1.7 0.3 14.3 35.3
2006 14.6 7.0 7.1 5.9 20.1 3.6 0.9 17.6 47.9
Manufactured goods 1995 73.0 78.1 77.6 78.6 61.5 78.1 95.6 31.4 36.1
(SITC 5 to 8 less 667 and 68) 2000 73.3 78.8 77.4 79.1 63.3 84.0 95.8 33.7 29.6
2006 68.5 75.4 75.1 77.7 54.9 80.8 93.9 28.5 24.5
Year
Année
Destination
World
MondeTotal
Europe
Canada
Developed economies
Économies développées
Japan
Japon
Otherdevelopedcountries
Autreséconomies
développées
USA
États-Unis
Economiesin
transition
Économiesen
transition
2.2.A Import structure by partner and product groupWorld
Sources:- Data and UNCTAD secretariat estimates based on UN DESA Comtrade and IMF Direction of Trade statistics databases
74
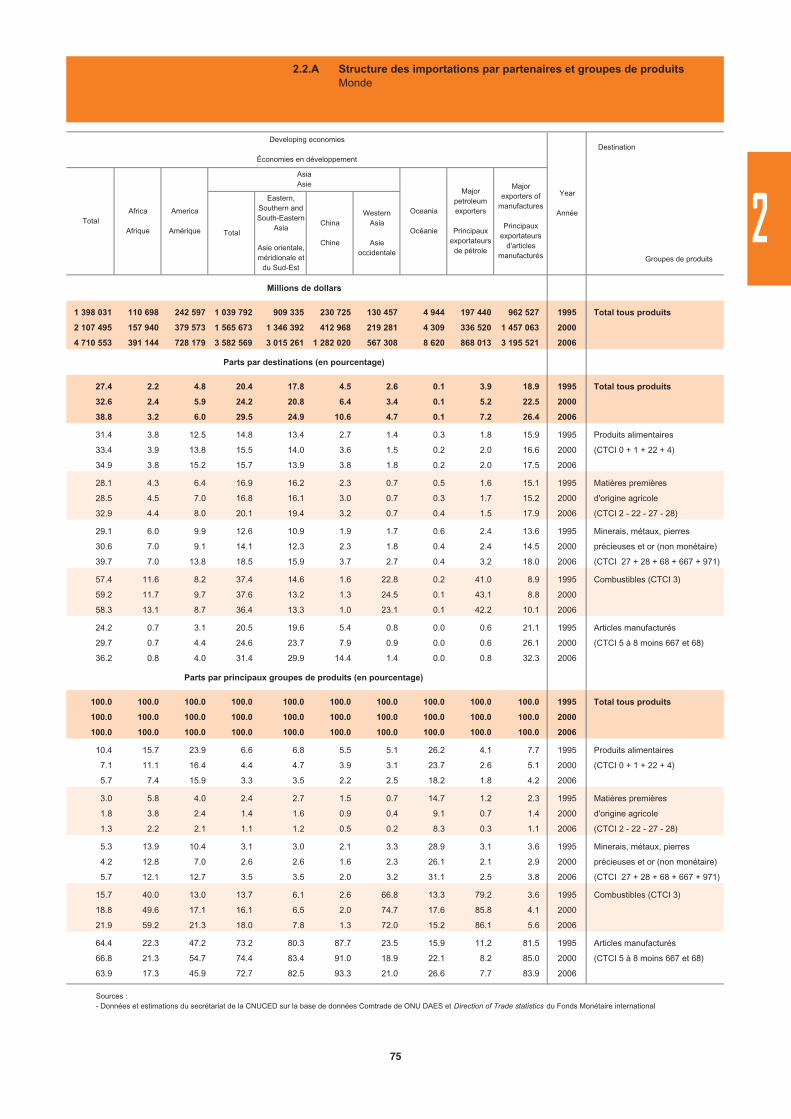
Millions de dollars
1 398 031 110 698 242 597 1 039 792 909 335 230 725 130 457 4 944 197 440 962 527 1995 Total tous produits
2 107 495 157 940 379 573 1 565 673 1 346 392 412 968 219 281 4 309 336 520 1 457 063 2000
4 710 553 391 144 728 179 3 582 569 3 015 261 1 282 020 567 308 8 620 868 013 3 195 521 2006
Parts par destinations (en pourcentage)
27.4 2.2 4.8 20.4 17.8 4.5 2.6 0.1 3.9 18.9 1995 Total tous produits
32.6 2.4 5.9 24.2 20.8 6.4 3.4 0.1 5.2 22.5 2000
38.8 3.2 6.0 29.5 24.9 10.6 4.7 0.1 7.2 26.4 2006
31.4 3.8 12.5 14.8 13.4 2.7 1.4 0.3 1.8 15.9 1995 Produits alimentaires
33.4 3.9 13.8 15.5 14.0 3.6 1.5 0.2 2.0 16.6 2000 (CTCI 0 + 1 + 22 + 4)
34.9 3.8 15.2 15.7 13.9 3.8 1.8 0.2 2.0 17.5 2006
28.1 4.3 6.4 16.9 16.2 2.3 0.7 0.5 1.6 15.1 1995 Matières premières
28.5 4.5 7.0 16.8 16.1 3.0 0.7 0.3 1.7 15.2 2000 d'origine agricole
32.9 4.4 8.0 20.1 19.4 3.2 0.7 0.4 1.5 17.9 2006 (CTCI 2 - 22 - 27 - 28)
29.1 6.0 9.9 12.6 10.9 1.9 1.7 0.6 2.4 13.6 1995 Minerais, métaux, pierres
30.6 7.0 9.1 14.1 12.3 2.3 1.8 0.4 2.4 14.5 2000 précieuses et or (non monétaire)
39.7 7.0 13.8 18.5 15.9 3.7 2.7 0.4 3.2 18.0 2006 (CTCI 27 + 28 + 68 + 667 + 971)
57.4 11.6 8.2 37.4 14.6 1.6 22.8 0.2 41.0 8.9 1995 Combustibles (CTCI 3)
59.2 11.7 9.7 37.6 13.2 1.3 24.5 0.1 43.1 8.8 2000
58.3 13.1 8.7 36.4 13.3 1.0 23.1 0.1 42.2 10.1 2006
24.2 0.7 3.1 20.5 19.6 5.4 0.8 0.0 0.6 21.1 1995 Articles manufacturés
29.7 0.7 4.4 24.6 23.7 7.9 0.9 0.0 0.6 26.1 2000 (CTCI 5 à 8 moins 667 et 68)
36.2 0.8 4.0 31.4 29.9 14.4 1.4 0.0 0.8 32.3 2006
Parts par principaux groupes de produits (en pourcentage)
100.0 100.0 100.0 100.0 100.0 100.0 100.0 100.0 100.0 100.0 1995 Total tous produits
100.0 100.0 100.0 100.0 100.0 100.0 100.0 100.0 100.0 100.0 2000
100.0 100.0 100.0 100.0 100.0 100.0 100.0 100.0 100.0 100.0 2006
10.4 15.7 23.9 6.6 6.8 5.5 5.1 26.2 4.1 7.7 1995 Produits alimentaires
7.1 11.1 16.4 4.4 4.7 3.9 3.1 23.7 2.6 5.1 2000 (CTCI 0 + 1 + 22 + 4)
5.7 7.4 15.9 3.3 3.5 2.2 2.5 18.2 1.8 4.2 2006
3.0 5.8 4.0 2.4 2.7 1.5 0.7 14.7 1.2 2.3 1995 Matières premières
1.8 3.8 2.4 1.4 1.6 0.9 0.4 9.1 0.7 1.4 2000 d'origine agricole
1.3 2.2 2.1 1.1 1.2 0.5 0.2 8.3 0.3 1.1 2006 (CTCI 2 - 22 - 27 - 28)
5.3 13.9 10.4 3.1 3.0 2.1 3.3 28.9 3.1 3.6 1995 Minerais, métaux, pierres
4.2 12.8 7.0 2.6 2.6 1.6 2.3 26.1 2.1 2.9 2000 précieuses et or (non monétaire)
5.7 12.1 12.7 3.5 3.5 2.0 3.2 31.1 2.5 3.8 2006 (CTCI 27 + 28 + 68 + 667 + 971)
15.7 40.0 13.0 13.7 6.1 2.6 66.8 13.3 79.2 3.6 1995 Combustibles (CTCI 3)
18.8 49.6 17.1 16.1 6.5 2.0 74.7 17.6 85.8 4.1 2000
21.9 59.2 21.3 18.0 7.8 1.3 72.0 15.2 86.1 5.6 2006
64.4 22.3 47.2 73.2 80.3 87.7 23.5 15.9 11.2 81.5 1995 Articles manufacturés
66.8 21.3 54.7 74.4 83.4 91.0 18.9 22.1 8.2 85.0 2000 (CTCI 5 à 8 moins 667 et 68)
63.9 17.3 45.9 72.7 82.5 93.3 21.0 26.6 7.7 83.9 2006
Groupes de produits
Destination
Year
Année
Majorexporters of
manufactures
Principauxexportateurs
d'articlesmanufacturés
Developing economies
Économies en développement
TotalAfrica
Afrique
America
Amérique
Majorpetroleumexporters
Principauxexportateurs
de pétrole
AsiaAsie
Total
Eastern,Southern and South-Eastern
Asia
Asie orientale, méridionale et
du Sud-Est
China
Chine
WesternAsia
Asieoccidentale
Oceania
Océanie
2.2.A Structure des importations par partenaires et groupes de produitsMonde
Sources : - Données et estimations du secrétariat de la CNUCED sur la base de données Comtrade de ONU DAES et Direction of Trade statistics du Fonds Monétaire international
2
75

Product group
TotalEU
UE
Millions of dollars
All products 1995 3 528 995 2 597 088 1 819 060 1 711 831 148 277 427 229 134 120 68 402 52 200
2000 4 133 153 3 110 058 2 056 946 1 946 505 208 346 636 299 132 214 76 255 49 240
2006 7 013 671 5 177 096 3 766 185 3 563 766 282 083 855 688 157 730 115 410 186 360
Share by destination (percentage)
All products 1995 100.0 73.6 51.5 48.5 4.2 12.1 3.8 1.9 1.5
2000 100.0 75.2 49.8 47.1 5.0 15.4 3.2 1.8 1.2
2006 100.0 73.8 53.7 50.8 4.0 12.2 2.2 1.6 2.7
All food items 1995 100.0 75.4 58.7 56.8 2.6 5.2 7.7 1.1 3.9
(SITC 0 + 1 + 22 + 4) 2000 100.0 75.9 54.8 53.0 3.7 8.3 7.8 1.4 2.4
2006 100.0 77.8 60.6 58.5 3.5 7.7 4.7 1.4 3.3
Agricultural raw materials 1995 100.0 75.6 48.2 45.9 2.9 12.1 11.4 1.1 0.5
(SITC 2 - 22 - 27 - 28) 2000 100.0 74.3 46.2 44.3 3.8 15.5 7.7 1.1 0.8
2006 100.0 67.5 46.7 44.8 2.9 12.2 4.9 0.8 1.6
Ores, metals, precious stones 1995 100.0 74.1 49.1 44.2 3.4 11.4 6.7 3.5 0.5
and non-monetary gold 2000 100.0 73.4 45.4 39.8 3.4 15.6 4.8 4.2 0.6
(SITC 27 + 28 + 68 + 667 + 971) 2006 100.0 68.9 48.0 43.6 2.7 11.5 3.9 2.8 0.9
Fuels (SITC 3) 1995 100.0 81.6 55.3 51.7 2.8 18.3 4.5 0.7 1.5
2000 100.0 85.0 53.0 50.3 3.3 25.3 2.6 0.7 0.8
2006 100.0 83.1 56.1 53.0 3.0 21.3 2.1 0.6 0.9
Manufactured goods 1995 100.0 73.1 50.9 47.9 4.5 12.6 3.0 2.0 1.3
(SITC 5 to 8 less 667 and 68) 2000 100.0 74.4 49.3 46.6 5.4 15.2 2.6 1.8 1.2
2006 100.0 72.9 53.4 50.6 4.3 11.7 1.8 1.7 2.9
Share by major product group (percentage)
All products 1995 100.0 100.0 100.0 100.0 100.0 100.0 100.0 100.0 100.0
2000 100.0 100.0 100.0 100.0 100.0 100.0 100.0 100.0 100.0
2006 100.0 100.0 100.0 100.0 100.0 100.0 100.0 100.0 100.0
All food items 1995 8.7 8.9 9.9 10.2 5.4 3.7 17.6 5.0 22.9
(SITC 0 + 1 + 22 + 4) 2000 6.8 6.8 7.5 7.6 4.9 3.7 16.5 5.0 13.9
2006 6.7 7.1 7.6 7.8 5.9 4.2 13.9 5.6 8.4
Agricultural raw materials 1995 2.6 2.6 2.4 2.4 1.8 2.6 7.7 1.4 0.9
(SITC 2 - 22 - 27 - 28) 2000 1.9 1.9 1.8 1.8 1.5 1.9 4.7 1.1 1.3
2006 1.6 1.5 1.4 1.4 1.1 1.6 3.5 0.8 0.9
Ores, metals, precious stones 1995 4.1 4.2 4.0 3.8 3.3 3.9 7.3 7.4 1.5
and non-monetary gold 2000 3.9 3.8 3.5 3.3 2.6 3.9 5.8 8.9 2.1
(SITC 27 + 28 + 68 + 667 + 971) 2006 5.1 4.8 4.6 4.4 3.5 4.8 8.9 8.8 1.8
Fuels (SITC 3) 1995 3.3 3.7 3.6 3.6 2.2 5.1 4.0 1.2 3.3
2000 4.7 5.3 5.0 5.1 3.1 7.8 3.9 1.9 3.0
2006 7.0 7.8 7.3 7.3 5.3 12.1 6.5 2.5 2.3
Manufactured goods 1995 78.3 77.8 77.4 77.3 84.3 81.5 61.6 82.1 69.1
(SITC 5 to 8 less 667 and 68) 2000 78.9 78.0 78.1 78.1 84.9 78.1 65.2 78.4 76.5
2006 76.3 75.4 75.9 75.9 81.1 73.3 61.8 78.3 84.5
Year
Année
Destination
World
MondeTotal
Europe
Canada
Developed economies
Économies développées
Japan
Japon
Otherdevelopedcountries
Autreséconomies
développées
USA
États-Unis
Economiesin
transition
Économiesen
transition
2.2.B Export structure by partner and product groupDeveloped economies
Sources:- Data and UNCTAD secretariat estimates based on UN DESA Comtrade and IMF Direction of Trade statistics databases
76

Millions de dollars
823 689 80 135 167 776 571 529 493 335 58 877 78 194 4 250 86 125 560 787 1995 Total tous produits
942 030 80 045 252 904 605 214 511 304 77 566 93 910 3 867 91 062 676 751 2000
1 610 858 153 671 356 752 1 093 987 880 384 257 488 213 603 6 447 213 258 1 109 583 2006
Parts par destinations (en pourcentage)
23.3 2.3 4.8 16.2 14.0 1.7 2.2 0.1 2.4 15.9 1995 Total tous produits
22.8 1.9 6.1 14.6 12.4 1.9 2.3 0.1 2.2 16.4 2000
23.0 2.2 5.1 15.6 12.6 3.7 3.0 0.1 3.0 15.8 2006
19.1 3.6 4.1 11.2 8.6 1.3 2.7 0.2 3.7 9.7 1995 Produits alimentaires
20.3 3.5 5.3 11.2 8.3 1.2 2.9 0.2 4.0 10.4 2000 (CTCI 0 + 1 + 22 + 4)
17.9 3.0 4.8 9.9 7.5 1.6 2.4 0.2 3.5 9.4 2006
23.2 2.0 3.4 17.8 16.1 3.7 1.6 0.0 1.4 17.1 1995 Matières premières
24.2 1.9 4.4 17.8 15.8 4.4 1.9 0.1 1.2 18.0 2000 d'origine agricole
30.5 2.2 4.4 23.8 21.2 11.0 2.6 0.1 1.6 23.7 2006 (CTCI 2 - 22 - 27 - 28)
22.5 0.9 1.7 20.0 18.2 1.3 1.7 0.0 1.0 19.4 1995 Minerais, métaux, pierres
22.8 1.0 2.4 19.4 18.1 2.7 1.3 0.0 0.9 19.9 2000 précieuses et or (non monétaire)
28.0 1.1 2.1 24.9 22.7 8.3 2.1 0.0 1.2 24.6 2006 (CTCI 27 + 28 + 68 + 667 + 971)
12.9 1.5 3.7 7.4 6.5 0.4 1.0 0.3 1.0 8.5 1995 Combustibles (CTCI 3)
10.5 1.4 3.8 5.1 4.2 0.5 0.9 0.2 0.8 7.3 2000
11.7 2.0 4.2 5.5 4.2 0.7 1.2 0.1 1.5 6.5 2006
24.4 2.3 5.1 17.0 14.7 1.7 2.3 0.1 2.5 16.8 1995 Articles manufacturés
23.7 1.9 6.6 15.2 12.8 1.9 2.3 0.1 2.2 17.3 2000 (CTCI 5 à 8 moins 667 et 68)
23.7 2.2 5.4 16.0 12.7 3.6 3.3 0.1 3.3 16.3 2006
Parts par principaux groupes de produits (en pourcentage)
100.0 100.0 100.0 100.0 100.0 100.0 100.0 100.0 100.0 100.0 1995 Total tous produits
100.0 100.0 100.0 100.0 100.0 100.0 100.0 100.0 100.0 100.0 2000
100.0 100.0 100.0 100.0 100.0 100.0 100.0 100.0 100.0 100.0 2006
7.1 13.8 7.5 6.0 5.3 6.5 10.4 16.2 13.2 5.3 1995 Produits alimentaires
6.0 12.4 5.8 5.2 4.5 4.3 8.8 15.0 12.4 4.3 2000 (CTCI 0 + 1 + 22 + 4)
5.2 9.3 6.3 4.3 4.0 3.0 5.4 13.9 7.8 4.0 2006
2.6 2.3 1.8 2.8 3.0 5.7 1.9 1.0 1.4 2.8 1995 Matières premières
2.0 1.9 1.4 2.3 2.5 4.6 1.7 1.1 1.0 2.1 2000 d'origine agricole
2.1 1.6 1.4 2.4 2.7 4.8 1.4 1.2 0.9 2.4 2006 (CTCI 2 - 22 - 27 - 28)
4.0 1.7 1.5 5.1 5.4 3.1 3.2 0.6 1.7 5.1 1995 Minerais, métaux, pierres
3.9 1.9 1.5 5.1 5.7 5.5 2.2 0.7 1.6 4.7 2000 précieuses et or (non monétaire)
6.2 2.5 2.1 8.2 9.3 11.5 3.6 0.8 2.0 8.0 2006 (CTCI 27 + 28 + 68 + 667 + 971)
1.8 2.2 2.6 1.5 1.5 0.7 1.5 7.0 1.3 1.8 1995 Combustibles (CTCI 3)
2.2 3.4 2.9 1.7 1.6 1.1 1.9 11.1 1.6 2.1 2000
3.5 6.2 5.7 2.4 2.3 1.2 2.8 8.3 3.4 2.9 2006
81.9 77.6 83.4 82.2 82.5 80.7 79.9 72.8 79.9 82.5 1995 Articles manufacturés
82.0 76.6 84.7 81.7 81.9 80.7 80.6 62.9 78.0 83.1 2000 (CTCI 5 à 8 moins 667 et 68)
78.7 76.4 80.8 78.5 77.2 75.1 83.7 69.4 82.5 78.7 2006
Groupes de produits
Destination
Year
Année
Majorexporters of
manufactures
Principauxexportateurs
d'articlesmanufacturés
Developing economies
Économies en développement
TotalAfrica
Afrique
America
Amérique
Majorpetroleumexporters
Principauxexportateurs
de pétrole
AsiaAsie
Total
Eastern,Southern and South-Eastern
Asia
Asie orientale, méridionale et
du Sud-Est
China
Chine
WesternAsia
Asieoccidentale
Oceania
Océanie
2.2.B Structure des exportations par partenaires et groupes de produitsÉconomies développées
Sources : - Données et estimations du secrétariat de la CNUCED sur la base de données Comtrade de ONU DAES et Direction of Trade statistics du Fonds Monétaire international
2
77

Product group
TotalEU
UE
Millions of dollars
All products 1995 3 524 933 2 591 050 1 772 403 1 658 890 177 182 357 691 230 485 53 289 64 255
2000 4 525 440 3 103 128 2 044 752 1 911 347 262 387 457 260 269 056 69 672 92 238
2006 7 928 314 5 071 092 3 760 826 3 470 018 350 863 551 860 297 932 109 611 267 193
Share by destination (percentage)
All products 1995 100.0 73.5 50.3 47.1 5.0 10.1 6.5 1.5 1.8
2000 100.0 68.6 45.2 42.2 5.8 10.1 5.9 1.5 2.0
2006 100.0 64.0 47.4 43.8 4.4 7.0 3.8 1.4 3.4
All food items 1995 100.0 70.8 53.0 50.9 3.6 10.7 0.2 3.3 1.1
(SITC 0 + 1 + 22 + 4) 2000 100.0 69.5 50.4 48.2 4.8 10.2 0.2 3.9 1.2
2006 100.0 70.6 55.9 53.8 4.1 6.8 0.2 3.7 1.2
Agricultural raw materials 1995 100.0 71.9 37.8 36.4 15.9 13.3 0.5 4.5 4.8
(SITC 2 - 22 - 27 - 28) 2000 100.0 72.3 38.3 37.1 18.1 11.1 0.7 4.0 4.2
2006 100.0 67.7 44.3 43.2 12.3 7.5 0.7 2.8 4.6
Ores, metals, precious stones 1995 100.0 64.3 41.4 35.6 8.0 7.2 0.6 7.2 7.9
and non-monetary gold 2000 100.0 62.3 39.4 32.2 7.3 6.2 0.9 8.5 10.1
(SITC 27 + 28 + 68 + 667 + 971) 2006 100.0 58.4 38.3 34.2 7.1 5.5 0.7 6.8 8.0
Fuels (SITC 3) 1995 100.0 36.2 25.2 17.7 6.0 2.3 0.1 2.6 7.8
2000 100.0 35.5 24.8 17.4 7.2 1.3 0.1 2.0 8.7
2006 100.0 35.2 25.4 19.3 6.5 1.4 0.2 1.7 13.2
Manufactured goods 1995 100.0 78.0 53.2 50.4 4.3 11.1 8.8 0.7 0.6
(SITC 5 to 8 less 667 and 68) 2000 100.0 72.7 47.4 45.3 5.1 11.6 7.9 0.8 0.6
2006 100.0 69.0 51.3 49.1 3.5 8.3 5.2 0.7 0.9
Share by major product group (percentage)
All products 1995 100.0 100.0 100.0 100.0 100.0 100.0 100.0 100.0 100.0
2000 100.0 100.0 100.0 100.0 100.0 100.0 100.0 100.0 100.0
2006 100.0 100.0 100.0 100.0 100.0 100.0 100.0 100.0 100.0
All food items 1995 9.3 9.0 9.9 10.1 6.8 9.9 0.3 20.1 5.7
(SITC 0 + 1 + 22 + 4) 2000 6.9 7.0 7.7 7.9 5.8 6.9 0.3 17.5 4.1
2006 6.6 7.3 7.8 8.1 6.1 6.5 0.3 17.5 2.4
Agricultural raw materials 1995 2.9 2.9 2.2 2.3 9.2 3.8 0.2 8.6 7.8
(SITC 2 - 22 - 27 - 28) 2000 2.0 2.1 1.7 1.7 6.1 2.1 0.2 5.1 4.0
2006 1.5 1.6 1.4 1.4 4.1 1.6 0.3 3.0 2.0
Ores, metals, precious stones 1995 5.1 4.4 4.2 3.8 8.1 3.6 0.5 24.1 22.0
and non-monetary gold 2000 4.4 4.0 3.8 3.4 5.5 2.7 0.7 24.4 21.8
(SITC 27 + 28 + 68 + 667 + 971) 2006 5.1 4.7 4.1 4.0 8.2 4.0 0.9 25.3 12.1
Fuels (SITC 3) 1995 7.5 3.7 3.8 2.8 8.9 1.7 0.2 12.7 32.3
2000 10.1 5.2 5.5 4.1 12.6 1.3 0.2 13.4 43.0
2006 14.8 8.2 7.9 6.5 21.8 2.9 0.8 18.3 58.2
Manufactured goods 1995 72.6 77.1 76.8 77.8 62.7 79.2 97.8 32.8 25.3
(SITC 5 to 8 less 667 and 68) 2000 73.1 77.5 76.6 78.4 63.7 83.7 96.8 37.1 20.4
2006 68.6 74.0 74.1 76.9 54.8 81.8 95.9 33.9 17.4
Year
Année
Destination
World
MondeTotal
Europe
Canada
Developed economies
Économies développées
Japan
Japon
Otherdevelopedcountries
Autreséconomies
développées
USA
États-Unis
Economiesin
transition
Économiesen
transition
2.2.B Import structure by partner and product groupDeveloped economies
Sources:- Data and UNCTAD secretariat estimates based on UN DESA Comtrade and IMF Direction of Trade statistics databases
78

Millions de dollars
836 708 82 800 172 863 577 010 504 066 126 345 72 945 4 035 123 009 559 192 1995 Total tous produits
1 298 724 112 041 290 341 893 119 768 295 250 527 124 823 3 224 204 138 893 935 2000
2 546 052 261 080 505 403 1 773 581 1 494 198 750 005 279 382 5 987 465 958 1 709 999 2006
Parts par destinations (en pourcentage)
23.7 2.3 4.9 16.4 14.3 3.6 2.1 0.1 3.5 15.9 1995 Total tous produits
28.7 2.5 6.4 19.7 17.0 5.5 2.8 0.1 4.5 19.8 2000
32.1 3.3 6.4 22.4 18.8 9.5 3.5 0.1 5.9 21.6 2006
27.9 4.2 12.1 11.3 10.4 2.1 0.9 0.3 1.3 13.7 1995 Produits alimentaires
29.3 3.8 13.3 11.9 11.1 3.0 0.8 0.2 1.2 14.9 2000 (CTCI 0 + 1 + 22 + 4)
28.1 3.5 13.4 11.0 10.0 3.3 1.1 0.2 1.1 14.5 2006
22.6 3.9 6.0 12.3 11.7 1.9 0.5 0.4 1.4 11.8 1995 Matières premières
23.3 3.9 7.4 11.8 11.3 2.8 0.5 0.2 1.3 12.6 2000 d'origine agricole
27.5 3.8 8.6 15.0 14.5 3.7 0.5 0.1 1.1 15.1 2006 (CTCI 2 - 22 - 27 - 28)
25.1 6.1 9.9 8.4 7.5 1.3 0.8 0.7 1.7 10.8 1995 Minerais, métaux, pierres
27.0 7.8 9.1 9.6 8.6 1.6 1.0 0.5 1.7 11.3 2000 précieuses et or (non monétaire)
32.9 7.5 13.8 11.1 9.4 2.5 1.7 0.5 1.8 12.6 2006 (CTCI 27 + 28 + 68 + 667 + 971)
52.4 13.5 8.8 29.9 10.5 1.2 19.3 0.2 39.2 6.2 1995 Combustibles (CTCI 3)
52.9 12.8 10.6 29.4 8.8 0.8 20.6 0.1 40.2 6.8 2000
47.9 14.1 9.8 23.9 7.2 0.5 16.7 0.1 36.4 6.8 2006
20.5 0.6 3.2 16.7 16.1 4.3 0.6 0.0 0.3 17.9 1995 Articles manufacturés
26.3 0.7 5.0 20.6 19.8 7.0 0.7 0.0 0.3 23.1 2000 (CTCI 5 à 8 moins 667 et 68)
30.0 0.8 4.4 24.8 23.6 13.0 1.2 0.0 0.4 26.8 2006
Parts par principaux groupes de produits (en pourcentage)
100.0 100.0 100.0 100.0 100.0 100.0 100.0 100.0 100.0 100.0 1995 Total tous produits
100.0 100.0 100.0 100.0 100.0 100.0 100.0 100.0 100.0 100.0 2000
100.0 100.0 100.0 100.0 100.0 100.0 100.0 100.0 100.0 100.0 2006
11.0 16.5 23.0 6.5 6.8 5.6 4.0 26.1 3.5 8.1 1995 Produits alimentaires
7.0 10.6 14.3 4.2 4.5 3.7 2.0 23.9 1.8 5.2 2000 (CTCI 0 + 1 + 22 + 4)
5.8 7.1 13.9 3.3 3.5 2.3 2.0 17.9 1.3 4.4 2006
2.8 4.9 3.6 2.2 2.4 1.5 0.7 10.9 1.2 2.2 1995 Matières premières
1.6 3.0 2.3 1.2 1.3 1.0 0.4 5.1 0.6 1.2 2000 d'origine agricole
1.3 1.7 2.0 1.0 1.1 0.6 0.2 2.0 0.3 1.0 2006 (CTCI 2 - 22 - 27 - 28)
5.4 13.2 10.3 2.6 2.7 1.8 2.0 31.0 2.5 3.4 1995 Minerais, métaux, pierres
4.1 13.9 6.2 2.2 2.2 1.3 1.6 30.2 1.6 2.5 2000 précieuses et or (non monétaire)
5.2 11.7 11.1 2.5 2.6 1.3 2.4 34.0 1.6 3.0 2006 (CTCI 27 + 28 + 68 + 667 + 971)
16.6 43.2 13.5 13.7 5.5 2.5 70.1 14.5 84.3 2.9 1995 Combustibles (CTCI 3)
18.6 52.2 16.7 15.0 5.2 1.4 75.4 18.7 89.9 3.5 2000
22.1 63.4 22.8 15.9 5.7 0.7 70.5 18.4 91.9 4.7 2006
62.9 19.6 47.4 74.0 81.5 88.1 22.2 16.3 6.9 81.9 1995 Articles manufacturés
67.0 19.4 57.5 76.2 85.3 91.9 19.7 20.3 5.5 85.6 2000 (CTCI 5 à 8 moins 667 et 68)
64.1 15.7 47.9 76.0 85.7 94.3 24.1 26.4 4.5 85.2 2006
Groupes de produits
Destination
Year
Année
Majorexporters of
manufactures
Principauxexportateurs
d'articlesmanufacturés
Developing economies
Économies en développement
TotalAfrica
Afrique
America
Amérique
Majorpetroleumexporters
Principauxexportateurs
de pétrole
AsiaAsie
Total
Eastern,Southern and South-Eastern
Asia
Asie orientale, méridionale et
du Sud-Est
China
Chine
WesternAsia
Asieoccidentale
Oceania
Océanie
2.2.B Structure des importations par partenaires et groupes de produitsÉconomies développées
Sources : - Données et estimations du secrétariat de la CNUCED sur la base de données Comtrade de ONU DAES et Direction of Trade statistics du Fonds Monétaire international
2
79

Product group
TotalEU
UE
Millions of dollars
All products 1995 118 704 55 346 48 182 43 977 117 4 160 2 517 371 32 903
2000 152 380 91 790 79 865 73 884 210 6 081 2 977 2 657 32 194
2006 441 120 279 052 257 650 236 955 874 11 912 5 168 3 447 84 726
Share by destination (percentage)
All products 1995 100.0 46.6 40.6 37.0 0.1 3.5 2.1 0.3 27.7
2000 100.0 60.2 52.4 48.5 0.1 4.0 2.0 1.7 21.1
2006 100.0 63.3 58.4 53.7 0.2 2.7 1.2 0.8 19.2
All food items 1995 100.0 30.3 25.7 24.9 0.1 1.6 2.0 0.9 63.1
(SITC 0 + 1 + 22 + 4) 2000 100.0 30.0 24.7 22.7 0.1 1.2 2.9 1.2 57.7
2006 100.0 26.6 23.3 23.0 0.1 0.7 1.3 1.2 50.0
Agricultural raw materials 1995 100.0 61.4 51.7 49.8 0.0 0.9 8.6 0.1 12.1
(SITC 2 - 22 - 27 - 28) 2000 100.0 60.2 50.0 47.1 0.0 0.7 9.3 0.3 14.1
2006 100.0 47.2 39.8 39.6 0.1 0.6 6.3 0.3 11.8
Ores, metals, precious stones 1995 100.0 78.7 56.6 48.8 0.0 10.7 11.3 0.1 11.5
and non-monetary gold 2000 100.0 74.9 58.5 53.2 0.1 8.2 8.0 0.2 11.1
(SITC 27 + 28 + 68 + 667 + 971) 2006 100.0 72.5 60.7 49.5 0.3 4.9 5.6 1.1 10.0
Fuels (SITC 3) 1995 100.0 64.5 62.5 56.5 0.0 0.8 0.6 0.5 20.8
2000 100.0 54.8 51.2 47.0 0.0 0.4 0.5 2.8 9.1
2006 100.0 65.4 62.9 57.7 0.2 1.1 0.6 0.7 6.9
Manufactured goods 1995 100.0 35.6 28.6 26.7 0.2 5.8 0.7 0.2 35.9
(SITC 5 to 8 less 667 and 68) 2000 100.0 45.5 37.0 35.7 0.4 7.3 0.4 0.3 25.4
2006 100.0 40.4 34.1 33.0 0.3 5.3 0.4 0.3 33.3
Share by major product group (percentage)
All products 1995 100.0 100.0 100.0 100.0 100.0 100.0 100.0 100.0 100.0
2000 100.0 100.0 100.0 100.0 100.0 100.0 100.0 100.0 100.0
2006 100.0 100.0 100.0 100.0 100.0 100.0 100.0 100.0 100.0
All food items 1995 6.1 4.0 3.8 4.1 5.5 2.9 5.6 17.7 13.8
(SITC 0 + 1 + 22 + 4) 2000 3.6 1.8 1.7 1.7 2.7 1.1 5.4 2.5 9.9
2006 3.8 1.6 1.5 1.6 1.6 0.9 4.3 5.7 9.8
Agricultural raw materials 1995 5.1 6.7 6.5 6.9 0.8 1.3 20.6 2.4 2.2
(SITC 2 - 22 - 27 - 28) 2000 4.0 4.0 3.8 3.9 1.3 0.7 19.1 0.6 2.7
2006 2.5 1.9 1.7 1.8 1.0 0.6 13.5 1.1 1.5
Ores, metals, precious stones 1995 9.8 16.5 13.7 12.9 2.2 29.8 52.2 3.3 4.1
and non-monetary gold 2000 10.2 12.7 11.4 11.2 6.3 21.0 41.9 1.3 5.4
(SITC 27 + 28 + 68 + 667 + 971) 2006 8.6 9.9 9.0 8.0 11.1 15.7 40.9 12.0 4.5
Fuels (SITC 3) 1995 32.8 45.4 50.5 50.1 14.3 7.4 9.6 52.2 24.6
2000 42.0 38.2 41.0 40.7 0.3 3.7 10.1 67.3 18.1
2006 54.0 55.8 58.1 57.9 48.2 21.6 25.7 51.1 19.5
Manufactured goods 1995 35.5 27.1 25.1 25.6 76.6 58.5 11.9 24.3 46.0
(SITC 5 to 8 less 667 and 68) 2000 31.6 23.9 22.3 23.3 88.7 58.0 6.5 6.1 38.0
2006 24.9 15.9 14.5 15.3 37.8 48.7 9.3 11.0 43.2
Year
Année
Destination
World
MondeTotal
Europe
Canada
Developed economies
Économies développées
Japan
Japon
Otherdevelopedcountries
Autreséconomies
développées
USA
États-Unis
Economiesin
transition
Économiesen
transition
2.2.C Export structure by partner and product groupEconomies in transition
Sources:- Data and UNCTAD secretariat estimates based on UN DESA Comtrade and IMF Direction of Trade statistics databases
80
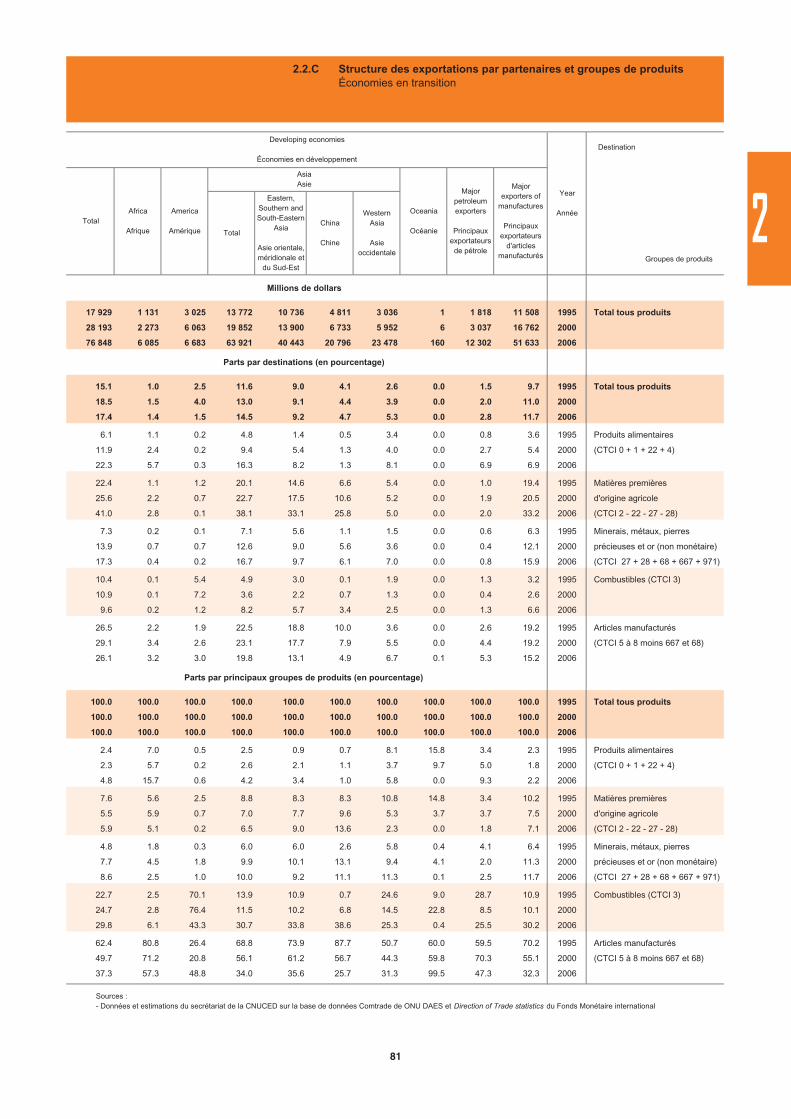
Millions de dollars
17 929 1 131 3 025 13 772 10 736 4 811 3 036 1 1 818 11 508 1995 Total tous produits
28 193 2 273 6 063 19 852 13 900 6 733 5 952 6 3 037 16 762 2000
76 848 6 085 6 683 63 921 40 443 20 796 23 478 160 12 302 51 633 2006
Parts par destinations (en pourcentage)
15.1 1.0 2.5 11.6 9.0 4.1 2.6 0.0 1.5 9.7 1995 Total tous produits
18.5 1.5 4.0 13.0 9.1 4.4 3.9 0.0 2.0 11.0 2000
17.4 1.4 1.5 14.5 9.2 4.7 5.3 0.0 2.8 11.7 2006
6.1 1.1 0.2 4.8 1.4 0.5 3.4 0.0 0.8 3.6 1995 Produits alimentaires
11.9 2.4 0.2 9.4 5.4 1.3 4.0 0.0 2.7 5.4 2000 (CTCI 0 + 1 + 22 + 4)
22.3 5.7 0.3 16.3 8.2 1.3 8.1 0.0 6.9 6.9 2006
22.4 1.1 1.2 20.1 14.6 6.6 5.4 0.0 1.0 19.4 1995 Matières premières
25.6 2.2 0.7 22.7 17.5 10.6 5.2 0.0 1.9 20.5 2000 d'origine agricole
41.0 2.8 0.1 38.1 33.1 25.8 5.0 0.0 2.0 33.2 2006 (CTCI 2 - 22 - 27 - 28)
7.3 0.2 0.1 7.1 5.6 1.1 1.5 0.0 0.6 6.3 1995 Minerais, métaux, pierres
13.9 0.7 0.7 12.6 9.0 5.6 3.6 0.0 0.4 12.1 2000 précieuses et or (non monétaire)
17.3 0.4 0.2 16.7 9.7 6.1 7.0 0.0 0.8 15.9 2006 (CTCI 27 + 28 + 68 + 667 + 971)
10.4 0.1 5.4 4.9 3.0 0.1 1.9 0.0 1.3 3.2 1995 Combustibles (CTCI 3)
10.9 0.1 7.2 3.6 2.2 0.7 1.3 0.0 0.4 2.6 2000
9.6 0.2 1.2 8.2 5.7 3.4 2.5 0.0 1.3 6.6 2006
26.5 2.2 1.9 22.5 18.8 10.0 3.6 0.0 2.6 19.2 1995 Articles manufacturés
29.1 3.4 2.6 23.1 17.7 7.9 5.5 0.0 4.4 19.2 2000 (CTCI 5 à 8 moins 667 et 68)
26.1 3.2 3.0 19.8 13.1 4.9 6.7 0.1 5.3 15.2 2006
Parts par principaux groupes de produits (en pourcentage)
100.0 100.0 100.0 100.0 100.0 100.0 100.0 100.0 100.0 100.0 1995 Total tous produits
100.0 100.0 100.0 100.0 100.0 100.0 100.0 100.0 100.0 100.0 2000
100.0 100.0 100.0 100.0 100.0 100.0 100.0 100.0 100.0 100.0 2006
2.4 7.0 0.5 2.5 0.9 0.7 8.1 15.8 3.4 2.3 1995 Produits alimentaires
2.3 5.7 0.2 2.6 2.1 1.1 3.7 9.7 5.0 1.8 2000 (CTCI 0 + 1 + 22 + 4)
4.8 15.7 0.6 4.2 3.4 1.0 5.8 0.0 9.3 2.2 2006
7.6 5.6 2.5 8.8 8.3 8.3 10.8 14.8 3.4 10.2 1995 Matières premières
5.5 5.9 0.7 7.0 7.7 9.6 5.3 3.7 3.7 7.5 2000 d'origine agricole
5.9 5.1 0.2 6.5 9.0 13.6 2.3 0.0 1.8 7.1 2006 (CTCI 2 - 22 - 27 - 28)
4.8 1.8 0.3 6.0 6.0 2.6 5.8 0.4 4.1 6.4 1995 Minerais, métaux, pierres
7.7 4.5 1.8 9.9 10.1 13.1 9.4 4.1 2.0 11.3 2000 précieuses et or (non monétaire)
8.6 2.5 1.0 10.0 9.2 11.1 11.3 0.1 2.5 11.7 2006 (CTCI 27 + 28 + 68 + 667 + 971)
22.7 2.5 70.1 13.9 10.9 0.7 24.6 9.0 28.7 10.9 1995 Combustibles (CTCI 3)
24.7 2.8 76.4 11.5 10.2 6.8 14.5 22.8 8.5 10.1 2000
29.8 6.1 43.3 30.7 33.8 38.6 25.3 0.4 25.5 30.2 2006
62.4 80.8 26.4 68.8 73.9 87.7 50.7 60.0 59.5 70.2 1995 Articles manufacturés
49.7 71.2 20.8 56.1 61.2 56.7 44.3 59.8 70.3 55.1 2000 (CTCI 5 à 8 moins 667 et 68)
37.3 57.3 48.8 34.0 35.6 25.7 31.3 99.5 47.3 32.3 2006
Groupes de produits
Destination
Year
Année
Majorexporters of
manufactures
Principauxexportateurs
d'articlesmanufacturés
Developing economies
Économies en développement
TotalAfrica
Afrique
America
Amérique
Majorpetroleumexporters
Principauxexportateurs
de pétrole
AsiaAsie
Total
Eastern,Southern and South-Eastern
Asia
Asie orientale, méridionale et
du Sud-Est
China
Chine
WesternAsia
Asieoccidentale
Oceania
Océanie
2.2.C Structure des exportations par partenaires et groupes de produitsÉconomies en transition
Sources : - Données et estimations du secrétariat de la CNUCED sur la base de données Comtrade de ONU DAES et Direction of Trade statistics du Fonds Monétaire international
2
81

Product group
TotalEU
UE
Millions of dollars
All products 1995 93 920 38 184 32 661 31 434 352 3 565 1 129 478 33 508
2000 88 808 42 940 36 195 34 928 321 4 627 1 252 544 35 517
2006 301 456 152 126 128 242 123 731 1 375 10 266 10 615 1 628 89 388
Share by destination (percentage)
All products 1995 100.0 40.7 34.8 33.5 0.4 3.8 1.2 0.5 35.7
2000 100.0 48.4 40.8 39.3 0.4 5.2 1.4 0.6 40.0
2006 100.0 50.5 42.5 41.0 0.5 3.4 3.5 0.5 29.7
All food items 1995 100.0 49.5 39.1 37.3 0.5 8.4 0.0 1.4 27.1
(SITC 0 + 1 + 22 + 4) 2000 100.0 47.0 38.1 36.4 0.3 8.0 0.0 0.6 26.9
2006 100.0 43.3 37.1 34.2 0.9 4.2 0.1 1.1 22.1
Agricultural raw materials 1995 100.0 34.3 29.3 28.5 0.3 2.8 0.3 1.6 58.4
(SITC 2 - 22 - 27 - 28) 2000 100.0 38.1 31.7 30.2 0.5 4.4 0.5 1.1 53.5
2006 100.0 44.1 38.2 37.7 0.3 3.4 0.3 1.9 39.9
Ores, metals, precious stones 1995 100.0 25.3 21.2 20.0 0.4 1.4 0.0 2.3 53.0
and non-monetary gold 2000 100.0 26.7 19.8 18.9 0.2 1.1 0.3 5.3 55.7
(SITC 27 + 28 + 68 + 667 + 971) 2006 100.0 31.1 24.8 23.1 0.3 0.8 0.2 5.1 53.2
Fuels (SITC 3) 1995 100.0 12.6 11.7 11.0 0.0 0.6 0.2 0.0 83.2
2000 100.0 10.9 10.3 9.9 0.0 0.4 0.1 0.0 82.4
2006 100.0 11.5 11.1 10.7 0.0 0.3 0.1 0.0 86.5
Manufactured goods 1995 100.0 60.0 52.0 50.2 0.6 4.7 2.4 0.4 28.5
(SITC 5 to 8 less 667 and 68) 2000 100.0 64.9 54.9 53.1 0.5 6.6 2.4 0.4 25.0
2006 100.0 61.5 51.5 50.1 0.5 4.1 5.1 0.3 17.2
Share by major product group (percentage)
All products 1995 100.0 100.0 100.0 100.0 100.0 100.0 100.0 100.0 100.0
2000 100.0 100.0 100.0 100.0 100.0 100.0 100.0 100.0 100.0
2006 100.0 100.0 100.0 100.0 100.0 100.0 100.0 100.0 100.0
All food items 1995 15.4 18.8 17.3 17.2 20.5 34.3 0.5 43.1 11.7
(SITC 0 + 1 + 22 + 4) 2000 14.3 13.9 13.4 13.3 13.2 21.9 0.2 13.3 9.6
2006 11.3 9.7 9.8 9.4 22.0 14.0 0.2 22.4 8.4
Agricultural raw materials 1995 1.5 1.3 1.3 1.3 1.1 1.1 0.3 5.0 2.5
(SITC 2 - 22 - 27 - 28) 2000 1.8 1.4 1.4 1.4 2.3 1.5 0.6 3.2 2.4
2006 1.1 1.0 1.0 1.0 0.8 1.1 0.1 3.8 1.5
Ores, metals, precious stones 1995 3.4 2.1 2.1 2.0 3.4 1.3 0.0 15.5 5.0
and non-monetary gold 2000 4.6 2.6 2.3 2.2 2.1 1.0 1.0 40.3 6.5
(SITC 27 + 28 + 68 + 667 + 971) 2006 3.2 2.0 1.8 1.8 1.7 0.7 0.2 30.0 5.7
Fuels (SITC 3) 1995 15.1 4.7 5.1 5.0 0.9 2.5 2.5 0.9 35.2
2000 16.1 3.6 4.1 4.0 1.5 1.3 0.9 0.9 33.2
2006 12.0 2.7 3.2 3.1 0.4 0.9 0.3 0.2 35.1
Manufactured goods 1995 48.3 71.3 72.2 72.4 73.9 60.0 96.4 35.2 38.5
(SITC 5 to 8 less 667 and 68) 2000 57.0 76.5 76.8 77.0 78.2 72.7 96.6 41.7 35.6
2006 69.1 84.2 83.7 84.3 75.0 82.3 99.2 43.0 40.1
Year
Année
Destination
World
MondeTotal
Europe
Canada
Developed economies
Économies développées
Japan
Japon
Otherdevelopedcountries
Autreséconomies
développées
USA
États-Unis
Economiesin
transition
Économiesen
transition
2.2.C Import structure by partner and product groupEconomies in transition
Sources:- Data and UNCTAD secretariat estimates based on UN DESA Comtrade and IMF Direction of Trade statistics databases
82
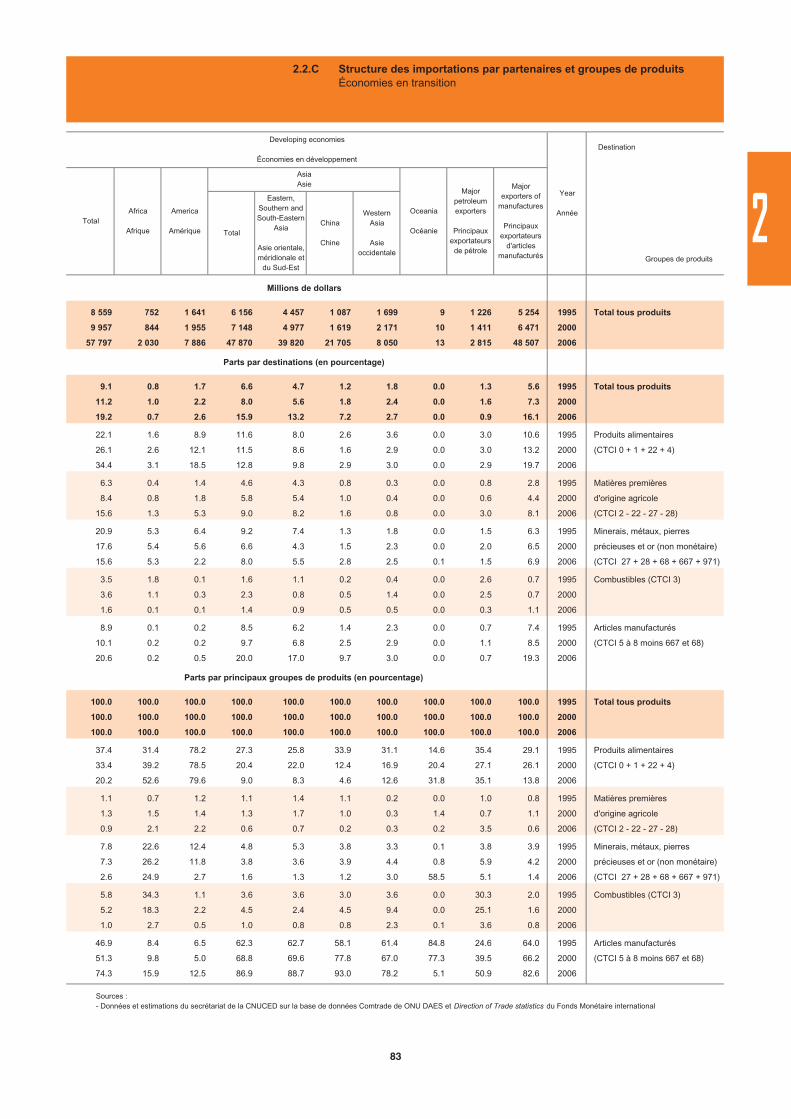
Millions de dollars
8 559 752 1 641 6 156 4 457 1 087 1 699 9 1 226 5 254 1995 Total tous produits
9 957 844 1 955 7 148 4 977 1 619 2 171 10 1 411 6 471 2000
57 797 2 030 7 886 47 870 39 820 21 705 8 050 13 2 815 48 507 2006
Parts par destinations (en pourcentage)
9.1 0.8 1.7 6.6 4.7 1.2 1.8 0.0 1.3 5.6 1995 Total tous produits
11.2 1.0 2.2 8.0 5.6 1.8 2.4 0.0 1.6 7.3 2000
19.2 0.7 2.6 15.9 13.2 7.2 2.7 0.0 0.9 16.1 2006
22.1 1.6 8.9 11.6 8.0 2.6 3.6 0.0 3.0 10.6 1995 Produits alimentaires
26.1 2.6 12.1 11.5 8.6 1.6 2.9 0.0 3.0 13.2 2000 (CTCI 0 + 1 + 22 + 4)
34.4 3.1 18.5 12.8 9.8 2.9 3.0 0.0 2.9 19.7 2006
6.3 0.4 1.4 4.6 4.3 0.8 0.3 0.0 0.8 2.8 1995 Matières premières
8.4 0.8 1.8 5.8 5.4 1.0 0.4 0.0 0.6 4.4 2000 d'origine agricole
15.6 1.3 5.3 9.0 8.2 1.6 0.8 0.0 3.0 8.1 2006 (CTCI 2 - 22 - 27 - 28)
20.9 5.3 6.4 9.2 7.4 1.3 1.8 0.0 1.5 6.3 1995 Minerais, métaux, pierres
17.6 5.4 5.6 6.6 4.3 1.5 2.3 0.0 2.0 6.5 2000 précieuses et or (non monétaire)
15.6 5.3 2.2 8.0 5.5 2.8 2.5 0.1 1.5 6.9 2006 (CTCI 27 + 28 + 68 + 667 + 971)
3.5 1.8 0.1 1.6 1.1 0.2 0.4 0.0 2.6 0.7 1995 Combustibles (CTCI 3)
3.6 1.1 0.3 2.3 0.8 0.5 1.4 0.0 2.5 0.7 2000
1.6 0.1 0.1 1.4 0.9 0.5 0.5 0.0 0.3 1.1 2006
8.9 0.1 0.2 8.5 6.2 1.4 2.3 0.0 0.7 7.4 1995 Articles manufacturés
10.1 0.2 0.2 9.7 6.8 2.5 2.9 0.0 1.1 8.5 2000 (CTCI 5 à 8 moins 667 et 68)
20.6 0.2 0.5 20.0 17.0 9.7 3.0 0.0 0.7 19.3 2006
Parts par principaux groupes de produits (en pourcentage)
100.0 100.0 100.0 100.0 100.0 100.0 100.0 100.0 100.0 100.0 1995 Total tous produits
100.0 100.0 100.0 100.0 100.0 100.0 100.0 100.0 100.0 100.0 2000
100.0 100.0 100.0 100.0 100.0 100.0 100.0 100.0 100.0 100.0 2006
37.4 31.4 78.2 27.3 25.8 33.9 31.1 14.6 35.4 29.1 1995 Produits alimentaires
33.4 39.2 78.5 20.4 22.0 12.4 16.9 20.4 27.1 26.1 2000 (CTCI 0 + 1 + 22 + 4)
20.2 52.6 79.6 9.0 8.3 4.6 12.6 31.8 35.1 13.8 2006
1.1 0.7 1.2 1.1 1.4 1.1 0.2 0.0 1.0 0.8 1995 Matières premières
1.3 1.5 1.4 1.3 1.7 1.0 0.3 1.4 0.7 1.1 2000 d'origine agricole
0.9 2.1 2.2 0.6 0.7 0.2 0.3 0.2 3.5 0.6 2006 (CTCI 2 - 22 - 27 - 28)
7.8 22.6 12.4 4.8 5.3 3.8 3.3 0.1 3.8 3.9 1995 Minerais, métaux, pierres
7.3 26.2 11.8 3.8 3.6 3.9 4.4 0.8 5.9 4.2 2000 précieuses et or (non monétaire)
2.6 24.9 2.7 1.6 1.3 1.2 3.0 58.5 5.1 1.4 2006 (CTCI 27 + 28 + 68 + 667 + 971)
5.8 34.3 1.1 3.6 3.6 3.0 3.6 0.0 30.3 2.0 1995 Combustibles (CTCI 3)
5.2 18.3 2.2 4.5 2.4 4.5 9.4 0.0 25.1 1.6 2000
1.0 2.7 0.5 1.0 0.8 0.8 2.3 0.1 3.6 0.8 2006
46.9 8.4 6.5 62.3 62.7 58.1 61.4 84.8 24.6 64.0 1995 Articles manufacturés
51.3 9.8 5.0 68.8 69.6 77.8 67.0 77.3 39.5 66.2 2000 (CTCI 5 à 8 moins 667 et 68)
74.3 15.9 12.5 86.9 88.7 93.0 78.2 5.1 50.9 82.6 2006
Groupes de produits
Destination
Year
Année
Majorexporters of
manufactures
Principauxexportateurs
d'articlesmanufacturés
Developing economies
Économies en développement
TotalAfrica
Afrique
America
Amérique
Majorpetroleumexporters
Principauxexportateurs
de pétrole
AsiaAsie
Total
Eastern,Southern and South-Eastern
Asia
Asie orientale, méridionale et
du Sud-Est
China
Chine
WesternAsia
Asieoccidentale
Oceania
Océanie
2.2.C Structure des importations par partenaires et groupes de produitsÉconomies en transition
Sources : - Données et estimations du secrétariat de la CNUCED sur la base de données Comtrade de ONU DAES et Direction of Trade statistics du Fonds Monétaire international
2
83

Product group
TotalEU
UE
Millions of dollars
All products 1995 1 417 569 777 994 270 416 258 906 16 055 312 666 156 899 21 958 13 554
2000 2 024 127 1 168 381 379 169 359 575 23 505 535 379 197 158 33 170 12 494
2006 4 466 584 2 257 141 829 618 789 299 54 391 915 044 376 795 81 293 62 155
Share by destination (percentage)
All products 1995 100.0 54.9 19.1 18.3 1.1 22.1 11.1 1.5 1.0
2000 100.0 57.7 18.7 17.8 1.2 26.4 9.7 1.6 0.6
2006 100.0 50.5 18.6 17.7 1.2 20.5 8.4 1.8 1.4
All food items 1995 100.0 56.3 26.9 26.0 0.8 13.0 14.3 1.2 3.0
(SITC 0 + 1 + 22 + 4) 2000 100.0 55.8 24.2 23.4 1.2 16.6 12.5 1.4 2.2
2006 100.0 49.7 24.0 23.4 1.2 14.7 8.4 1.4 4.2
Agricultural raw materials 1995 100.0 52.1 23.8 23.1 0.6 12.2 14.5 1.0 0.3
(SITC 2 - 22 - 27 - 28) 2000 100.0 50.5 23.7 23.0 0.6 13.8 11.4 1.0 0.3
2006 100.0 44.9 20.4 19.9 1.0 13.7 9.0 0.9 0.9
Ores, metals, precious stones 1995 100.0 59.3 28.6 24.6 1.2 11.4 16.3 1.8 0.9
and non-monetary gold 2000 100.0 59.3 30.9 26.2 1.4 13.3 10.7 3.0 0.4
(SITC 27 + 28 + 68 + 667 + 971) 2006 100.0 50.6 26.0 20.9 2.1 10.4 9.4 2.6 0.5
Fuels (SITC 3) 1995 100.0 54.1 17.1 16.7 0.7 18.1 17.0 1.2 0.2
2000 100.0 56.5 18.6 16.8 0.7 22.4 13.8 1.1 0.1
2006 100.0 53.8 15.9 14.7 1.0 20.5 14.5 1.8 0.0
Manufactured goods 1995 100.0 54.9 17.6 17.0 1.3 25.6 8.7 1.7 0.9
(SITC 5 to 8 less 667 and 68) 2000 100.0 58.8 17.5 17.0 1.3 30.0 8.3 1.8 0.6
2006 100.0 50.0 18.0 17.5 1.2 22.6 6.4 1.8 1.6
Share by major product group (percentage)
All products 1995 100.0 100.0 100.0 100.0 100.0 100.0 100.0 100.0 100.0
2000 100.0 100.0 100.0 100.0 100.0 100.0 100.0 100.0 100.0
2006 100.0 100.0 100.0 100.0 100.0 100.0 100.0 100.0 100.0
All food items 1995 9.8 10.0 13.8 13.9 7.3 5.7 12.7 7.4 30.5
(SITC 0 + 1 + 22 + 4) 2000 6.7 6.5 8.6 8.8 6.6 4.2 8.5 5.6 24.3
2006 5.6 5.5 7.2 7.4 5.7 4.0 5.5 4.4 16.9
Agricultural raw materials 1995 2.7 2.6 3.4 3.4 1.5 1.5 3.5 1.7 0.8
(SITC 2 - 22 - 27 - 28) 2000 1.6 1.4 2.0 2.0 0.8 0.8 1.8 0.9 0.8
2006 1.3 1.2 1.4 1.5 1.1 0.9 1.4 0.6 0.8
Ores, metals, precious stones 1995 4.9 5.3 7.3 6.6 5.1 2.5 7.2 5.7 4.5
and non-monetary gold 2000 3.9 4.0 6.4 5.7 4.7 2.0 4.3 7.0 2.5
(SITC 27 + 28 + 68 + 667 + 971) 2006 5.7 5.7 8.0 6.8 9.9 2.9 6.4 8.2 1.9
Fuels (SITC 3) 1995 15.5 15.3 13.8 14.1 10.1 12.7 23.8 12.4 2.6
2000 19.9 19.5 19.7 18.8 12.8 16.9 28.2 12.9 4.6
2006 22.3 23.8 19.2 18.6 18.3 22.4 38.5 22.0 0.7
Manufactured goods 1995 65.6 65.6 60.6 61.0 75.3 76.0 51.6 72.0 61.2
(SITC 5 to 8 less 667 and 68) 2000 66.9 68.2 62.5 63.9 74.7 75.9 56.8 72.7 67.2
2006 62.8 62.2 60.8 62.3 64.4 69.3 47.7 62.4 73.7
Year
Année
Destination
World
MondeTotal
Europe
Canada
Developed economies
Économies développées
Japan
Japon
Otherdevelopedcountries
Autreséconomies
développées
USA
États-Unis
Economiesin
transition
Économiesen
transition
2.2.D Export structure by partner and product groupDeveloping economies
Sources:- Data and UNCTAD secretariat estimates based on UN DESA Comtrade and IMF Direction of Trade statistics databases
84

Millions de dollars
566 461 32 921 72 303 459 912 422 195 82 296 37 716 1 325 45 475 404 765 1995 Total tous produits
800 984 46 589 101 764 649 644 598 145 124 050 51 500 2 987 57 690 585 906 2000
2 058 816 137 253 232 340 1 683 104 1 514 365 418 090 168 739 6 100 206 593 1 440 550 2006
Parts par destinations (en pourcentage)
40.0 2.3 5.1 32.4 29.8 5.8 2.7 0.1 3.2 28.6 1995 Total tous produits
39.6 2.3 5.0 32.1 29.6 6.1 2.5 0.1 2.9 28.9 2000
46.1 3.1 5.2 37.7 33.9 9.4 3.8 0.1 4.6 32.3 2006
40.3 4.5 6.8 29.0 23.8 4.8 5.1 0.1 6.8 20.7 1995 Produits alimentaires
41.2 5.1 7.8 28.2 22.1 4.2 6.1 0.1 7.8 19.9 2000 (CTCI 0 + 1 + 22 + 4)
45.6 7.1 6.7 31.6 23.9 5.2 7.7 0.1 10.7 19.7 2006
47.5 3.2 4.9 39.5 37.5 9.5 2.0 0.0 2.2 36.2 1995 Matières premières
48.9 3.1 4.6 41.2 38.9 15.0 2.3 0.0 2.0 37.0 2000 d'origine agricole
53.8 2.5 4.5 46.8 43.7 21.0 3.1 0.0 2.9 39.3 2006 (CTCI 2 - 22 - 27 - 28)
39.4 1.3 3.8 34.3 32.3 5.3 2.0 0.0 2.5 32.2 1995 Minerais, métaux, pierres
38.8 1.7 4.0 33.0 30.3 6.7 2.7 0.0 2.9 31.2 2000 précieuses et or (non monétaire)
48.5 2.3 4.0 42.1 38.6 12.8 3.6 0.0 3.8 39.1 2006 (CTCI 27 + 28 + 68 + 667 + 971)
23.1 1.3 4.8 16.8 15.7 2.3 1.1 0.2 0.5 16.7 1995 Combustibles (CTCI 3)
36.5 2.6 5.4 28.1 26.5 3.5 1.6 0.3 0.8 27.3 2000
41.6 3.0 5.7 32.7 30.0 5.5 2.6 0.2 2.3 28.3 2006
44.0 2.3 5.1 36.5 33.7 6.7 2.8 0.1 3.5 32.2 1995 Articles manufacturés
40.3 1.9 4.7 33.6 31.1 6.9 2.5 0.1 3.0 30.3 2000 (CTCI 5 à 8 moins 667 et 68)
48.0 2.7 5.0 40.2 36.4 10.8 3.8 0.1 5.0 34.8 2006
Parts par principaux groupes de produits (en pourcentage)
100.0 100.0 100.0 100.0 100.0 100.0 100.0 100.0 100.0 100.0 1995 Total tous produits
100.0 100.0 100.0 100.0 100.0 100.0 100.0 100.0 100.0 100.0 2000
100.0 100.0 100.0 100.0 100.0 100.0 100.0 100.0 100.0 100.0 2006
9.9 19.1 12.9 8.7 7.8 8.0 18.8 8.1 20.7 7.1 1995 Produits alimentaires
7.0 14.9 10.4 5.9 5.0 4.6 16.0 4.9 18.3 4.6 2000 (CTCI 0 + 1 + 22 + 4)
5.5 12.9 7.2 4.7 3.9 3.1 11.3 6.0 12.9 3.4 2006
3.2 3.7 2.6 3.3 3.4 4.4 2.0 0.4 1.9 3.4 1995 Matières premières
1.9 2.1 1.4 2.0 2.0 3.8 1.4 0.2 1.1 2.0 2000 d'origine agricole
1.5 1.1 1.1 1.6 1.7 2.9 1.1 0.2 0.8 1.6 2006 (CTCI 2 - 22 - 27 - 28)
4.8 2.7 3.6 5.2 5.3 4.5 3.7 0.5 3.7 5.5 1995 Minerais, métaux, pierres
3.8 2.9 3.1 4.0 4.0 4.2 4.1 0.3 3.9 4.2 2000 précieuses et or (non monétaire)
6.0 4.4 4.4 6.4 6.5 7.8 5.4 0.3 4.7 6.9 2006 (CTCI 27 + 28 + 68 + 667 + 971)
9.0 8.8 14.7 8.0 8.1 6.2 6.7 24.9 2.5 9.0 1995 Combustibles (CTCI 3)
18.4 22.9 21.6 17.5 17.9 11.4 12.5 41.1 5.3 18.8 2000
20.2 22.0 24.6 19.4 19.8 13.1 15.6 33.0 11.3 19.6 2006
72.2 64.8 65.3 73.8 74.3 76.2 68.3 63.0 70.7 74.0 1995 Articles manufacturés
68.2 56.1 62.3 70.1 70.6 75.7 64.8 50.6 70.2 70.0 2000 (CTCI 5 à 8 moins 667 et 68)
65.5 56.2 60.8 66.9 67.4 72.8 62.9 52.2 67.5 67.8 2006
Groupes de produits
Destination
Year
Année
Majorexporters of
manufactures
Principauxexportateurs
d'articlesmanufacturés
Developing economies
Économies en développement
TotalAfrica
Afrique
America
Amérique
Majorpetroleumexporters
Principauxexportateurs
de pétrole
AsiaAsie
Total
Eastern,Southern and South-Eastern
Asia
Asie orientale, méridionale et
du Sud-Est
China
Chine
WesternAsia
Asieoccidentale
Oceania
Océanie
2.2.D Structure des exportations par partenaires et groupes de produitsÉconomies en développement
Sources : - Données et estimations du secrétariat de la CNUCED sur la base de données Comtrade de ONU DAES et Direction of Trade statistics du Fonds Monétaire international
2
85

Product group
TotalEU
UE
Millions of dollars
All products 1995 1 479 516 890 084 325 867 302 502 19 733 267 103 243 190 34 191 22 696
2000 1 858 955 1 004 787 338 280 313 110 22 514 354 987 243 881 45 125 28 679
2006 3 895 312 1 623 540 636 309 585 718 35 880 462 276 398 994 90 081 84 580
Share by destination (percentage)
All products 1995 100.0 60.2 22.0 20.4 1.3 18.1 16.4 2.3 1.5
2000 100.0 54.1 18.2 16.8 1.2 19.1 13.1 2.4 1.5
2006 100.0 41.7 16.3 15.0 0.9 11.9 10.2 2.3 2.2
All food items 1995 100.0 56.5 20.8 19.9 3.9 23.5 1.6 6.7 0.8
(SITC 0 + 1 + 22 + 4) 2000 100.0 54.0 18.5 17.7 4.1 21.8 1.4 8.3 1.1
2006 100.0 43.7 14.5 13.6 3.1 17.6 1.3 7.2 2.6
Agricultural raw materials 1995 100.0 53.5 12.3 12.0 4.5 24.6 4.2 7.8 4.8
(SITC 2 - 22 - 27 - 28) 2000 100.0 54.7 14.8 14.4 5.9 21.4 4.2 8.3 5.0
2006 100.0 49.3 13.9 13.6 4.9 20.6 3.8 6.1 7.9
Ores, metals, precious stones 1995 100.0 56.5 22.9 16.8 2.9 12.2 7.0 11.6 4.1
and non-monetary gold 2000 100.0 54.6 24.7 17.3 1.6 9.0 6.8 12.5 5.6
(SITC 27 + 28 + 68 + 667 + 971) 2006 100.0 43.5 16.0 9.9 1.7 6.4 6.1 13.3 4.6
Fuels (SITC 3) 1995 100.0 15.7 4.0 3.9 0.7 5.7 1.6 3.9 2.0
2000 100.0 11.5 3.3 2.7 0.3 3.8 0.6 3.6 1.9
2006 100.0 10.5 3.1 2.8 0.3 3.7 0.7 2.8 4.4
Manufactured goods 1995 100.0 64.8 24.2 22.7 0.9 18.4 20.4 0.9 1.3
(SITC 5 to 8 less 667 and 68) 2000 100.0 60.1 20.0 18.8 0.9 21.6 16.6 0.9 1.1
2006 100.0 48.1 19.0 17.8 0.7 13.8 13.9 0.7 1.0
Share by major product group (percentage)
All products 1995 100.0 100.0 100.0 100.0 100.0 100.0 100.0 100.0 100.0
2000 100.0 100.0 100.0 100.0 100.0 100.0 100.0 100.0 100.0
2006 100.0 100.0 100.0 100.0 100.0 100.0 100.0 100.0 100.0
All food items 1995 8.0 7.5 7.6 7.8 23.6 10.4 0.8 23.2 4.3
(SITC 0 + 1 + 22 + 4) 2000 6.7 6.7 6.8 7.0 22.4 7.6 0.7 22.9 4.6
2006 5.2 5.5 4.6 4.7 17.5 7.8 0.6 16.2 6.3
Agricultural raw materials 1995 3.0 2.7 1.7 1.8 10.3 4.2 0.8 10.3 9.6
(SITC 2 - 22 - 27 - 28) 2000 2.3 2.3 1.9 2.0 11.2 2.6 0.7 7.8 7.4
2006 1.8 2.2 1.6 1.7 9.7 3.2 0.7 4.9 6.7
Ores, metals, precious stones 1995 4.9 4.6 5.1 4.0 10.6 3.3 2.1 24.7 13.2
and non-monetary gold 2000 4.6 4.6 6.2 4.7 5.9 2.2 2.4 23.7 16.7
(SITC 27 + 28 + 68 + 667 + 971) 2006 6.6 6.9 6.5 4.4 12.0 3.6 3.9 38.3 14.0
Fuels (SITC 3) 1995 7.0 1.8 1.3 1.3 3.6 2.2 0.7 11.6 9.0
2000 10.7 2.3 1.9 1.7 2.3 2.1 0.5 15.8 13.3
2006 14.3 3.6 2.7 2.6 4.3 4.4 1.0 17.1 28.8
Manufactured goods 1995 75.3 81.2 82.8 83.5 50.6 76.8 93.6 29.1 63.1
(SITC 5 to 8 less 667 and 68) 2000 74.7 83.0 82.0 83.4 57.8 84.4 94.7 28.3 52.0
2006 68.3 78.8 79.2 81.0 54.9 79.6 92.4 21.7 30.6
Year
Année
Destination
World
MondeTotal
Europe
Canada
Developed economies
Économies développées
Japan
Japon
Otherdevelopedcountries
Autreséconomies
développées
USA
États-Unis
Economiesin
transition
Économiesen
transition
2.2.D Import structure by partner and product groupDeveloping economies
Sources:- Data and UNCTAD secretariat estimates based on UN DESA Comtrade and IMF Direction of Trade statistics databases
86

Millions de dollars
552 764 27 146 68 093 456 625 400 812 103 293 55 813 900 73 205 398 082 1995 Total tous produits
798 814 45 055 87 276 665 406 573 119 160 823 92 287 1 076 130 971 556 656 2000
2 106 704 128 034 214 890 1 761 118 1 481 242 510 310 279 876 2 620 399 240 1 437 014 2006
Parts par destinations (en pourcentage)
37.4 1.8 4.6 30.9 27.1 7.0 3.8 0.1 4.9 26.9 1995 Total tous produits
43.0 2.4 4.7 35.8 30.8 8.7 5.0 0.1 7.0 29.9 2000
54.1 3.3 5.5 45.2 38.0 13.1 7.2 0.1 10.2 36.9 2006
42.1 2.9 14.2 24.9 22.2 4.4 2.7 0.2 2.8 22.7 1995 Produits alimentaires
44.6 4.3 15.4 24.7 21.6 5.4 3.1 0.2 3.9 21.2 2000 (CTCI 0 + 1 + 22 + 4)
52.7 4.7 19.3 28.4 24.7 5.0 3.6 0.2 4.1 25.1 2006
41.2 5.2 7.5 27.9 26.9 3.4 1.0 0.6 2.0 23.1 1995 Matières premières
40.2 5.9 6.2 27.6 26.6 3.4 1.0 0.5 2.4 21.0 2000 d'origine agricole
42.4 5.5 7.1 29.0 28.1 2.5 0.9 0.8 2.0 23.0 2006 (CTCI 2 - 22 - 27 - 28)
39.1 5.9 10.0 23.0 19.2 3.5 3.8 0.2 4.2 21.0 1995 Minerais, métaux, pierres
39.7 5.2 9.5 24.8 21.3 3.8 3.5 0.2 4.2 22.4 2000 précieuses et or (non monétaire)
51.3 6.3 14.1 30.6 26.4 5.8 4.2 0.2 5.4 27.0 2006 (CTCI 27 + 28 + 68 + 667 + 971)
77.7 8.1 7.8 61.8 27.0 2.8 34.9 0.1 50.8 17.2 1995 Combustibles (CTCI 3)
77.5 10.0 8.3 59.1 24.2 2.4 35.0 0.1 52.9 14.1 2000
83.9 11.8 7.1 64.9 27.1 2.1 37.8 0.0 57.2 17.6 2006
33.3 0.8 2.9 29.6 28.4 8.1 1.2 0.0 1.2 29.0 1995 Articles manufacturés
38.4 0.9 2.9 34.6 33.5 10.4 1.1 0.0 1.1 33.8 2000 (CTCI 5 à 8 moins 667 et 68)
50.2 1.0 3.4 45.7 44.0 17.6 1.7 0.0 1.7 44.6 2006
Parts par principaux groupes de produits (en pourcentage)
100.0 100.0 100.0 100.0 100.0 100.0 100.0 100.0 100.0 100.0 1995 Total tous produits
100.0 100.0 100.0 100.0 100.0 100.0 100.0 100.0 100.0 100.0 2000
100.0 100.0 100.0 100.0 100.0 100.0 100.0 100.0 100.0 100.0 2006
9.1 12.7 24.7 6.5 6.6 5.1 5.7 26.7 4.6 6.8 1995 Produits alimentaires
6.9 11.8 22.0 4.6 4.7 4.2 4.1 23.2 3.7 4.7 2000 (CTCI 0 + 1 + 22 + 4)
5.1 7.5 18.2 3.3 3.4 2.0 2.6 18.8 2.1 3.5 2006
3.4 8.6 5.0 2.8 3.0 1.5 0.8 31.8 1.2 2.6 1995 Matières premières
2.1 5.6 3.0 1.8 2.0 0.9 0.5 21.3 0.8 1.6 2000 d'origine agricole
1.4 3.1 2.4 1.2 1.4 0.4 0.2 22.6 0.4 1.1 2006 (CTCI 2 - 22 - 27 - 28)
5.1 15.7 10.7 3.7 3.5 2.5 5.0 19.5 4.2 3.8 1995 Minerais, métaux, pierres
4.2 9.8 9.3 3.2 3.2 2.0 3.2 13.9 2.8 3.5 2000 précieuses et or (non monétaire)
6.3 12.8 17.0 4.5 4.6 2.9 3.9 24.3 3.5 4.9 2006 (CTCI 27 + 28 + 68 + 667 + 971)
14.5 30.7 11.8 14.0 6.9 2.8 64.4 8.0 71.6 4.4 1995 Combustibles (CTCI 3)
19.3 43.9 18.9 17.6 8.4 3.0 75.3 14.2 80.2 5.0 2000
22.2 51.6 18.4 20.6 10.2 2.2 75.5 7.8 80.0 6.8 2006
67.1 31.0 47.5 72.2 78.9 87.6 24.1 13.6 18.3 81.3 1995 Articles manufacturés
66.7 26.3 46.5 72.1 81.0 89.6 16.7 27.2 12.0 84.4 2000 (CTCI 5 à 8 moins 667 et 68)
63.3 20.7 42.4 69.0 79.0 91.9 16.3 26.9 11.1 82.5 2006
Groupes de produits
Destination
Year
Année
Majorexporters of
manufactures
Principauxexportateurs
d'articlesmanufacturés
Developing economies
Économies en développement
TotalAfrica
Afrique
America
Amérique
Majorpetroleumexporters
Principauxexportateurs
de pétrole
AsiaAsie
Total
Eastern,Southern and South-Eastern
Asia
Asie orientale, méridionale et
du Sud-Est
China
Chine
WesternAsia
Asieoccidentale
Oceania
Océanie
2.2.D Structure des importations par partenaires et groupes de produitsÉconomies en développement
Sources : - Données et estimations du secrétariat de la CNUCED sur la base de données Comtrade de ONU DAES et Direction of Trade statistics du Fonds Monétaire international
2
87
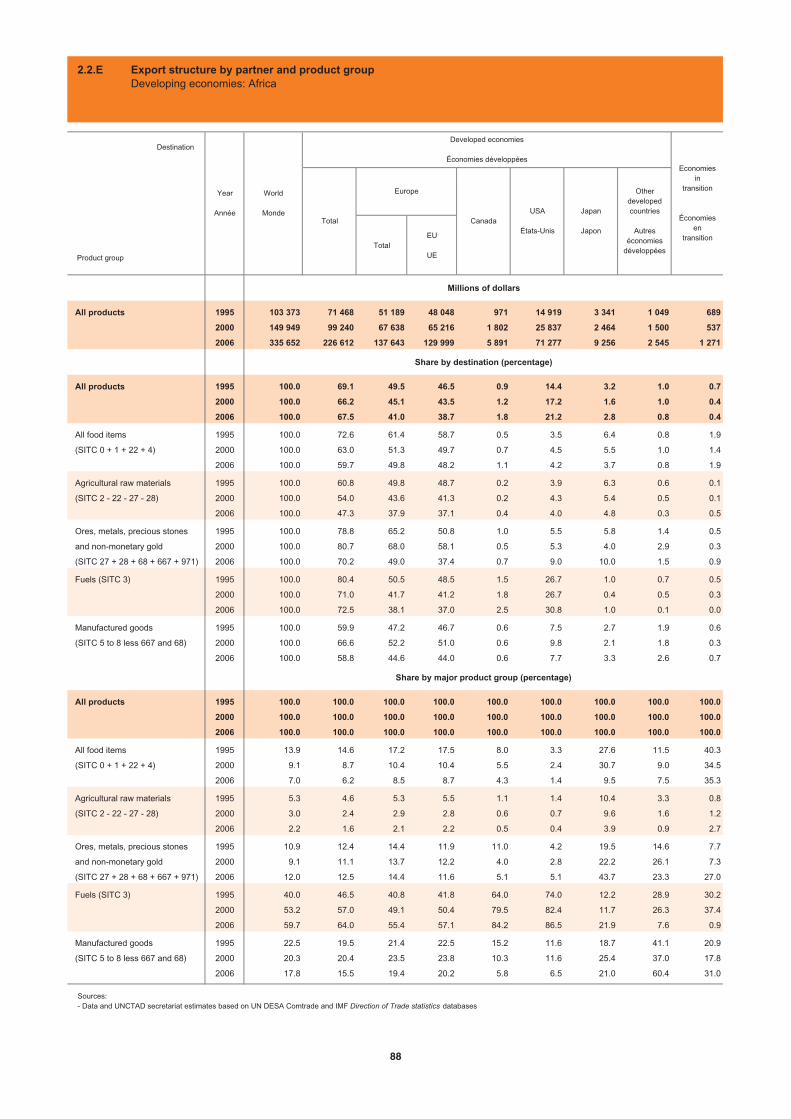
Product group
TotalEU
UE
Millions of dollars
All products 1995 103 373 71 468 51 189 48 048 971 14 919 3 341 1 049 689
2000 149 949 99 240 67 638 65 216 1 802 25 837 2 464 1 500 537
2006 335 652 226 612 137 643 129 999 5 891 71 277 9 256 2 545 1 271
Share by destination (percentage)
All products 1995 100.0 69.1 49.5 46.5 0.9 14.4 3.2 1.0 0.7
2000 100.0 66.2 45.1 43.5 1.2 17.2 1.6 1.0 0.4
2006 100.0 67.5 41.0 38.7 1.8 21.2 2.8 0.8 0.4
All food items 1995 100.0 72.6 61.4 58.7 0.5 3.5 6.4 0.8 1.9
(SITC 0 + 1 + 22 + 4) 2000 100.0 63.0 51.3 49.7 0.7 4.5 5.5 1.0 1.4
2006 100.0 59.7 49.8 48.2 1.1 4.2 3.7 0.8 1.9
Agricultural raw materials 1995 100.0 60.8 49.8 48.7 0.2 3.9 6.3 0.6 0.1
(SITC 2 - 22 - 27 - 28) 2000 100.0 54.0 43.6 41.3 0.2 4.3 5.4 0.5 0.1
2006 100.0 47.3 37.9 37.1 0.4 4.0 4.8 0.3 0.5
Ores, metals, precious stones 1995 100.0 78.8 65.2 50.8 1.0 5.5 5.8 1.4 0.5
and non-monetary gold 2000 100.0 80.7 68.0 58.1 0.5 5.3 4.0 2.9 0.3
(SITC 27 + 28 + 68 + 667 + 971) 2006 100.0 70.2 49.0 37.4 0.7 9.0 10.0 1.5 0.9
Fuels (SITC 3) 1995 100.0 80.4 50.5 48.5 1.5 26.7 1.0 0.7 0.5
2000 100.0 71.0 41.7 41.2 1.8 26.7 0.4 0.5 0.3
2006 100.0 72.5 38.1 37.0 2.5 30.8 1.0 0.1 0.0
Manufactured goods 1995 100.0 59.9 47.2 46.7 0.6 7.5 2.7 1.9 0.6
(SITC 5 to 8 less 667 and 68) 2000 100.0 66.6 52.2 51.0 0.6 9.8 2.1 1.8 0.3
2006 100.0 58.8 44.6 44.0 0.6 7.7 3.3 2.6 0.7
Share by major product group (percentage)
All products 1995 100.0 100.0 100.0 100.0 100.0 100.0 100.0 100.0 100.0
2000 100.0 100.0 100.0 100.0 100.0 100.0 100.0 100.0 100.0
2006 100.0 100.0 100.0 100.0 100.0 100.0 100.0 100.0 100.0
All food items 1995 13.9 14.6 17.2 17.5 8.0 3.3 27.6 11.5 40.3
(SITC 0 + 1 + 22 + 4) 2000 9.1 8.7 10.4 10.4 5.5 2.4 30.7 9.0 34.5
2006 7.0 6.2 8.5 8.7 4.3 1.4 9.5 7.5 35.3
Agricultural raw materials 1995 5.3 4.6 5.3 5.5 1.1 1.4 10.4 3.3 0.8
(SITC 2 - 22 - 27 - 28) 2000 3.0 2.4 2.9 2.8 0.6 0.7 9.6 1.6 1.2
2006 2.2 1.6 2.1 2.2 0.5 0.4 3.9 0.9 2.7
Ores, metals, precious stones 1995 10.9 12.4 14.4 11.9 11.0 4.2 19.5 14.6 7.7
and non-monetary gold 2000 9.1 11.1 13.7 12.2 4.0 2.8 22.2 26.1 7.3
(SITC 27 + 28 + 68 + 667 + 971) 2006 12.0 12.5 14.4 11.6 5.1 5.1 43.7 23.3 27.0
Fuels (SITC 3) 1995 40.0 46.5 40.8 41.8 64.0 74.0 12.2 28.9 30.2
2000 53.2 57.0 49.1 50.4 79.5 82.4 11.7 26.3 37.4
2006 59.7 64.0 55.4 57.1 84.2 86.5 21.9 7.6 0.9
Manufactured goods 1995 22.5 19.5 21.4 22.5 15.2 11.6 18.7 41.1 20.9
(SITC 5 to 8 less 667 and 68) 2000 20.3 20.4 23.5 23.8 10.3 11.6 25.4 37.0 17.8
2006 17.8 15.5 19.4 20.2 5.8 6.5 21.0 60.4 31.0
Year
Année
Destination
World
MondeTotal
Europe
Canada
Developed economies
Économies développées
Japan
Japon
Otherdevelopedcountries
Autreséconomies
développées
USA
États-Unis
Economiesin
transition
Économiesen
transition
2.2.E Export structure by partner and product groupDeveloping economies: Africa
Sources:- Data and UNCTAD secretariat estimates based on UN DESA Comtrade and IMF Direction of Trade statistics databases
88

Millions de dollars
24 244 10 728 2 307 11 200 8 610 910 2 590 9 2 716 10 137 1995 Total tous produits
41 146 14 649 4 723 21 183 16 886 4 235 4 297 592 3 881 20 708 2000
100 217 32 969 12 072 55 133 44 589 25 034 10 544 42 10 355 54 446 2006
Parts par destinations (en pourcentage)
23.5 10.4 2.2 10.8 8.3 0.9 2.5 0.0 2.6 9.8 1995 Total tous produits
27.4 9.8 3.1 14.1 11.3 2.8 2.9 0.4 2.6 13.8 2000
29.9 9.8 3.6 16.4 13.3 7.5 3.1 0.0 3.1 16.2 2006
23.8 14.2 0.5 9.1 4.8 0.5 4.4 0.0 6.4 4.0 1995 Produits alimentaires
35.0 20.3 0.7 13.9 7.2 0.8 6.7 0.1 10.5 5.9 2000 (CTCI 0 + 1 + 22 + 4)
36.6 21.8 0.5 14.2 8.0 1.2 6.3 0.0 9.5 6.5 2006
38.9 12.7 1.5 24.7 22.0 3.9 2.7 0.0 1.8 20.9 1995 Matières premières
45.3 15.1 1.7 28.5 25.5 6.2 3.0 0.0 1.8 24.4 2000 d'origine agricole
50.7 9.7 0.6 40.4 37.8 14.4 2.5 0.0 1.7 24.3 2006 (CTCI 2 - 22 - 27 - 28)
20.4 4.9 0.7 14.8 13.0 1.3 1.8 0.0 1.8 12.6 1995 Minerais, métaux, pierres
18.1 6.3 1.4 10.4 9.5 1.7 0.9 0.0 1.1 10.3 2000 précieuses et or (non monétaire)
27.9 9.8 1.1 17.0 14.7 6.1 2.3 0.0 2.3 14.6 2006 (CTCI 27 + 28 + 68 + 667 + 971)
17.9 5.3 3.5 9.1 6.7 0.7 2.4 0.0 0.5 10.5 1995 Combustibles (CTCI 3)
27.5 5.3 4.7 16.7 14.0 4.2 2.7 0.7 0.7 18.6 2000
26.3 4.9 5.0 16.4 14.7 10.2 1.7 0.0 1.1 19.2 2006
38.6 22.6 2.7 13.2 10.6 0.8 2.6 0.0 5.6 11.3 1995 Articles manufacturés
32.5 19.7 2.0 10.7 7.6 0.7 3.1 0.0 5.2 8.3 2000 (CTCI 5 à 8 moins 667 et 68)
36.2 22.1 2.3 11.8 7.1 1.3 4.6 0.0 8.1 8.3 2006
Parts par principaux groupes de produits (en pourcentage)
100.0 100.0 100.0 100.0 100.0 100.0 100.0 100.0 100.0 100.0 1995 Total tous produits
100.0 100.0 100.0 100.0 100.0 100.0 100.0 100.0 100.0 100.0 2000
100.0 100.0 100.0 100.0 100.0 100.0 100.0 100.0 100.0 100.0 2006
14.1 19.0 3.0 11.7 7.9 8.3 24.2 17.0 33.6 5.6 1995 Produits alimentaires
11.6 18.9 2.0 9.0 5.8 2.7 21.4 2.2 37.1 3.9 2000 (CTCI 0 + 1 + 22 + 4)
8.6 15.5 0.9 6.1 4.2 1.1 13.9 25.7 21.6 2.8 2006
8.8 6.5 3.5 12.0 14.0 23.1 5.6 8.4 3.5 11.3 1995 Matières premières
4.9 4.6 1.6 6.0 6.7 6.5 3.1 0.1 2.0 5.2 2000 d'origine agricole
3.8 2.2 0.4 5.5 6.4 4.3 1.8 7.2 1.2 3.4 2006 (CTCI 2 - 22 - 27 - 28)
9.5 5.1 3.4 14.9 17.0 16.4 7.7 17.0 7.5 14.1 1995 Minerais, métaux, pierres
6.0 5.9 4.2 6.7 7.7 5.4 2.9 0.0 3.9 6.8 2000 précieuses et or (non monétaire)
11.2 12.0 3.6 12.5 13.4 9.9 8.7 0.4 9.0 10.8 2006 (CTCI 27 + 28 + 68 + 667 + 971)
30.5 20.4 62.2 33.7 32.2 30.8 38.7 18.3 6.9 42.9 1995 Combustibles (CTCI 3)
53.2 29.1 79.2 62.9 65.9 79.8 50.7 95.8 15.3 71.8 2000
52.6 29.6 83.7 59.7 66.2 81.5 32.1 7.0 20.5 70.7 2006
36.9 48.9 27.6 27.4 28.5 21.3 23.5 39.3 48.2 25.8 1995 Articles manufacturés
24.0 41.0 13.0 15.3 13.7 5.2 21.9 1.8 40.9 12.1 2000 (CTCI 5 à 8 moins 667 et 68)
21.7 40.2 11.3 12.8 9.6 3.1 26.3 59.1 46.8 9.1 2006
Groupes de produits
Destination
Year
Année
Majorexporters of
manufactures
Principauxexportateurs
d'articlesmanufacturés
Developing economies
Économies en développement
TotalAfrica
Afrique
America
Amérique
Majorpetroleumexporters
Principauxexportateurs
de pétrole
AsiaAsie
Total
Eastern,Southern and South-Eastern
Asia
Asie orientale, méridionale et
du Sud-Est
China
Chine
WesternAsia
Asieoccidentale
Oceania
Océanie
2.2.E Structure des exportations par partenaires et groupes de produitsÉconomies en développement : Afrique
Sources : - Données et estimations du secrétariat de la CNUCED sur la base de données Comtrade de ONU DAES et Direction of Trade statistics du Fonds Monétaire international
2
89

Product group
TotalEU
UE
Millions of dollars
All products 1995 114 358 80 128 58 562 56 311 1 444 10 544 8 253 1 326 1 630
2000 126 809 77 029 57 387 55 291 1 329 10 146 5 917 2 250 2 531
2006 282 661 136 160 103 611 100 207 1 872 16 041 10 922 3 714 6 164
Share by destination (percentage)
All products 1995 100.0 70.1 51.2 49.2 1.3 9.2 7.2 1.2 1.4
2000 100.0 60.7 45.3 43.6 1.0 8.0 4.7 1.8 2.0
2006 100.0 48.2 36.7 35.5 0.7 5.7 3.9 1.3 2.2
All food items 1995 100.0 65.5 41.2 39.4 4.3 17.6 0.2 2.3 0.6
(SITC 0 + 1 + 22 + 4) 2000 100.0 60.3 37.6 36.4 4.0 13.8 0.1 4.8 1.3
2006 100.0 43.4 28.5 27.4 2.3 8.9 0.1 3.5 3.1
Agricultural raw materials 1995 100.0 62.7 48.9 48.3 1.8 8.6 0.9 2.5 6.9
(SITC 2 - 22 - 27 - 28) 2000 100.0 64.6 50.4 49.8 3.0 7.7 1.2 2.3 6.8
2006 100.0 53.9 44.2 43.8 2.3 4.1 1.6 1.6 8.5
Ores, metals, precious stones 1995 100.0 67.4 49.3 45.4 4.3 3.9 1.0 9.0 3.7
and non-monetary gold 2000 100.0 67.4 46.0 39.6 1.4 2.1 0.7 17.1 5.9
(SITC 27 + 28 + 68 + 667 + 971) 2006 100.0 39.9 25.3 23.9 1.0 3.3 0.4 10.0 4.3
Fuels (SITC 3) 1995 100.0 20.4 15.2 15.1 0.3 4.4 0.0 0.5 1.6
2000 100.0 13.6 11.8 11.6 0.1 1.3 0.0 0.5 1.2
2006 100.0 15.6 13.5 13.2 0.1 1.1 0.1 0.8 2.6
Manufactured goods 1995 100.0 76.4 57.4 55.2 0.6 8.1 9.8 0.6 1.3
(SITC 5 to 8 less 667 and 68) 2000 100.0 69.2 53.7 51.7 0.5 8.4 5.8 0.8 2.0
2006 100.0 57.0 44.2 42.7 0.5 6.5 5.1 0.7 1.8
Share by major product group (percentage)
All products 1995 100.0 100.0 100.0 100.0 100.0 100.0 100.0 100.0 100.0
2000 100.0 100.0 100.0 100.0 100.0 100.0 100.0 100.0 100.0
2006 100.0 100.0 100.0 100.0 100.0 100.0 100.0 100.0 100.0
All food items 1995 16.3 15.2 13.1 13.0 54.9 31.0 0.4 32.8 6.8
(SITC 0 + 1 + 22 + 4) 2000 15.1 15.0 12.5 12.6 57.6 26.0 0.4 40.4 9.5
2006 11.7 10.5 9.1 9.0 41.4 18.4 0.5 31.1 16.7
Agricultural raw materials 1995 2.9 2.6 2.8 2.9 4.3 2.7 0.4 6.3 14.2
(SITC 2 - 22 - 27 - 28) 2000 2.2 2.3 2.4 2.5 6.3 2.1 0.5 2.8 7.4
2006 1.6 1.7 1.9 1.9 5.4 1.1 0.7 1.9 6.1
Ores, metals, precious stones 1995 2.4 2.3 2.3 2.2 8.2 1.0 0.3 18.4 6.2
and non-monetary gold 2000 2.4 2.7 2.5 2.2 3.3 0.6 0.4 23.4 7.2
(SITC 27 + 28 + 68 + 667 + 971) 2006 2.8 2.3 1.9 1.9 4.0 1.6 0.3 21.3 5.5
Fuels (SITC 3) 1995 6.9 2.0 2.1 2.1 1.4 3.3 0.0 3.2 8.0
2000 12.0 2.7 3.1 3.2 1.4 1.9 0.0 3.1 7.5
2006 15.0 4.8 5.5 5.6 1.4 3.0 0.4 9.4 17.9
Manufactured goods 1995 70.3 76.7 78.8 78.8 30.9 61.4 95.3 38.9 64.6
(SITC 5 to 8 less 667 and 68) 2000 65.2 74.3 77.3 77.3 31.2 68.3 81.4 30.0 66.9
2006 64.7 76.5 78.1 77.9 45.4 74.1 84.9 35.2 52.9
Year
Année
Destination
World
MondeTotal
Europe
Canada
Developed economies
Économies développées
Japan
Japon
Otherdevelopedcountries
Autreséconomies
développées
USA
États-Unis
Economiesin
transition
Économiesen
transition
2.2.E Import structure by partner and product groupDeveloping economies: Africa
Sources:- Data and UNCTAD secretariat estimates based on UN DESA Comtrade and IMF Direction of Trade statistics databases
90
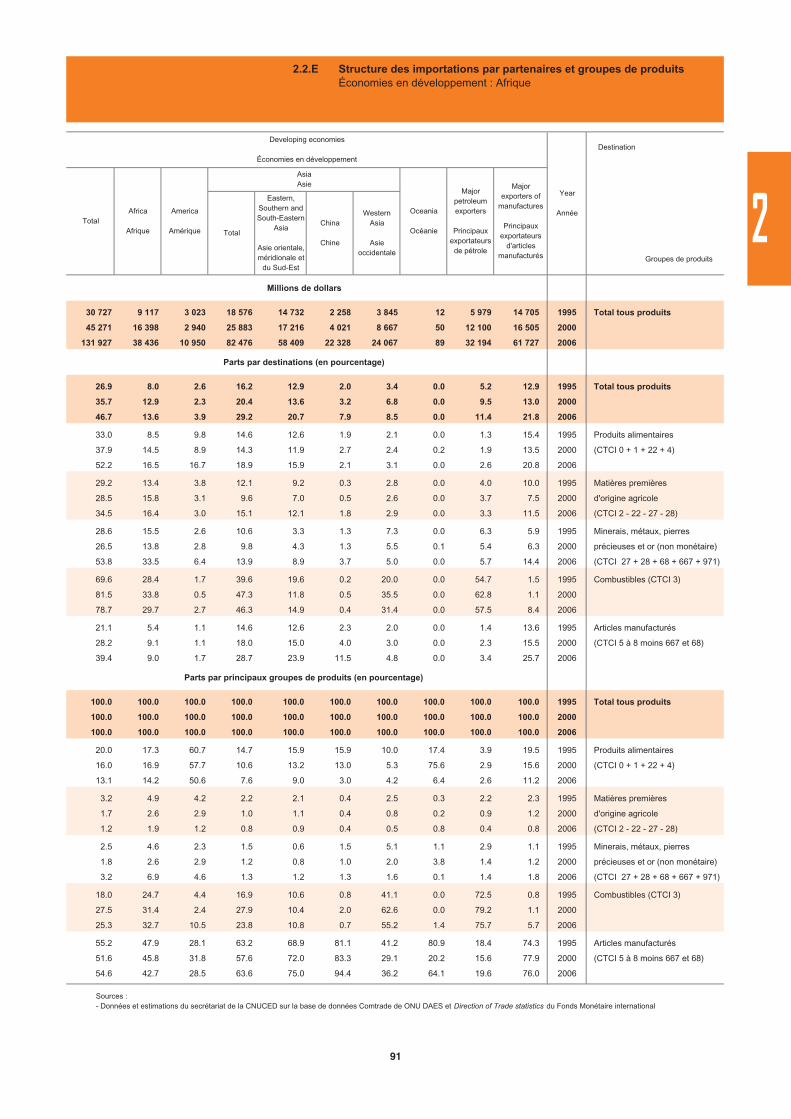
Millions de dollars
30 727 9 117 3 023 18 576 14 732 2 258 3 845 12 5 979 14 705 1995 Total tous produits
45 271 16 398 2 940 25 883 17 216 4 021 8 667 50 12 100 16 505 2000
131 927 38 436 10 950 82 476 58 409 22 328 24 067 89 32 194 61 727 2006
Parts par destinations (en pourcentage)
26.9 8.0 2.6 16.2 12.9 2.0 3.4 0.0 5.2 12.9 1995 Total tous produits
35.7 12.9 2.3 20.4 13.6 3.2 6.8 0.0 9.5 13.0 2000
46.7 13.6 3.9 29.2 20.7 7.9 8.5 0.0 11.4 21.8 2006
33.0 8.5 9.8 14.6 12.6 1.9 2.1 0.0 1.3 15.4 1995 Produits alimentaires
37.9 14.5 8.9 14.3 11.9 2.7 2.4 0.2 1.9 13.5 2000 (CTCI 0 + 1 + 22 + 4)
52.2 16.5 16.7 18.9 15.9 2.1 3.1 0.0 2.6 20.8 2006
29.2 13.4 3.8 12.1 9.2 0.3 2.8 0.0 4.0 10.0 1995 Matières premières
28.5 15.8 3.1 9.6 7.0 0.5 2.6 0.0 3.7 7.5 2000 d'origine agricole
34.5 16.4 3.0 15.1 12.1 1.8 2.9 0.0 3.3 11.5 2006 (CTCI 2 - 22 - 27 - 28)
28.6 15.5 2.6 10.6 3.3 1.3 7.3 0.0 6.3 5.9 1995 Minerais, métaux, pierres
26.5 13.8 2.8 9.8 4.3 1.3 5.5 0.1 5.4 6.3 2000 précieuses et or (non monétaire)
53.8 33.5 6.4 13.9 8.9 3.7 5.0 0.0 5.7 14.4 2006 (CTCI 27 + 28 + 68 + 667 + 971)
69.6 28.4 1.7 39.6 19.6 0.2 20.0 0.0 54.7 1.5 1995 Combustibles (CTCI 3)
81.5 33.8 0.5 47.3 11.8 0.5 35.5 0.0 62.8 1.1 2000
78.7 29.7 2.7 46.3 14.9 0.4 31.4 0.0 57.5 8.4 2006
21.1 5.4 1.1 14.6 12.6 2.3 2.0 0.0 1.4 13.6 1995 Articles manufacturés
28.2 9.1 1.1 18.0 15.0 4.0 3.0 0.0 2.3 15.5 2000 (CTCI 5 à 8 moins 667 et 68)
39.4 9.0 1.7 28.7 23.9 11.5 4.8 0.0 3.4 25.7 2006
Parts par principaux groupes de produits (en pourcentage)
100.0 100.0 100.0 100.0 100.0 100.0 100.0 100.0 100.0 100.0 1995 Total tous produits
100.0 100.0 100.0 100.0 100.0 100.0 100.0 100.0 100.0 100.0 2000
100.0 100.0 100.0 100.0 100.0 100.0 100.0 100.0 100.0 100.0 2006
20.0 17.3 60.7 14.7 15.9 15.9 10.0 17.4 3.9 19.5 1995 Produits alimentaires
16.0 16.9 57.7 10.6 13.2 13.0 5.3 75.6 2.9 15.6 2000 (CTCI 0 + 1 + 22 + 4)
13.1 14.2 50.6 7.6 9.0 3.0 4.2 6.4 2.6 11.2 2006
3.2 4.9 4.2 2.2 2.1 0.4 2.5 0.3 2.2 2.3 1995 Matières premières
1.7 2.6 2.9 1.0 1.1 0.4 0.8 0.2 0.9 1.2 2000 d'origine agricole
1.2 1.9 1.2 0.8 0.9 0.4 0.5 0.8 0.4 0.8 2006 (CTCI 2 - 22 - 27 - 28)
2.5 4.6 2.3 1.5 0.6 1.5 5.1 1.1 2.9 1.1 1995 Minerais, métaux, pierres
1.8 2.6 2.9 1.2 0.8 1.0 2.0 3.8 1.4 1.2 2000 précieuses et or (non monétaire)
3.2 6.9 4.6 1.3 1.2 1.3 1.6 0.1 1.4 1.8 2006 (CTCI 27 + 28 + 68 + 667 + 971)
18.0 24.7 4.4 16.9 10.6 0.8 41.1 0.0 72.5 0.8 1995 Combustibles (CTCI 3)
27.5 31.4 2.4 27.9 10.4 2.0 62.6 0.0 79.2 1.1 2000
25.3 32.7 10.5 23.8 10.8 0.7 55.2 1.4 75.7 5.7 2006
55.2 47.9 28.1 63.2 68.9 81.1 41.2 80.9 18.4 74.3 1995 Articles manufacturés
51.6 45.8 31.8 57.6 72.0 83.3 29.1 20.2 15.6 77.9 2000 (CTCI 5 à 8 moins 667 et 68)
54.6 42.7 28.5 63.6 75.0 94.4 36.2 64.1 19.6 76.0 2006
Groupes de produits
Destination
Year
Année
Majorexporters of
manufactures
Principauxexportateurs
d'articlesmanufacturés
Developing economies
Économies en développement
TotalAfrica
Afrique
America
Amérique
Majorpetroleumexporters
Principauxexportateurs
de pétrole
AsiaAsie
Total
Eastern,Southern and South-Eastern
Asia
Asie orientale, méridionale et
du Sud-Est
China
Chine
WesternAsia
Asieoccidentale
Oceania
Océanie
2.2.E Structure des importations par partenaires et groupes de produitsÉconomies en développement : Afrique
Sources : - Données et estimations du secrétariat de la CNUCED sur la base de données Comtrade de ONU DAES et Direction of Trade statistics du Fonds Monétaire international
2
91
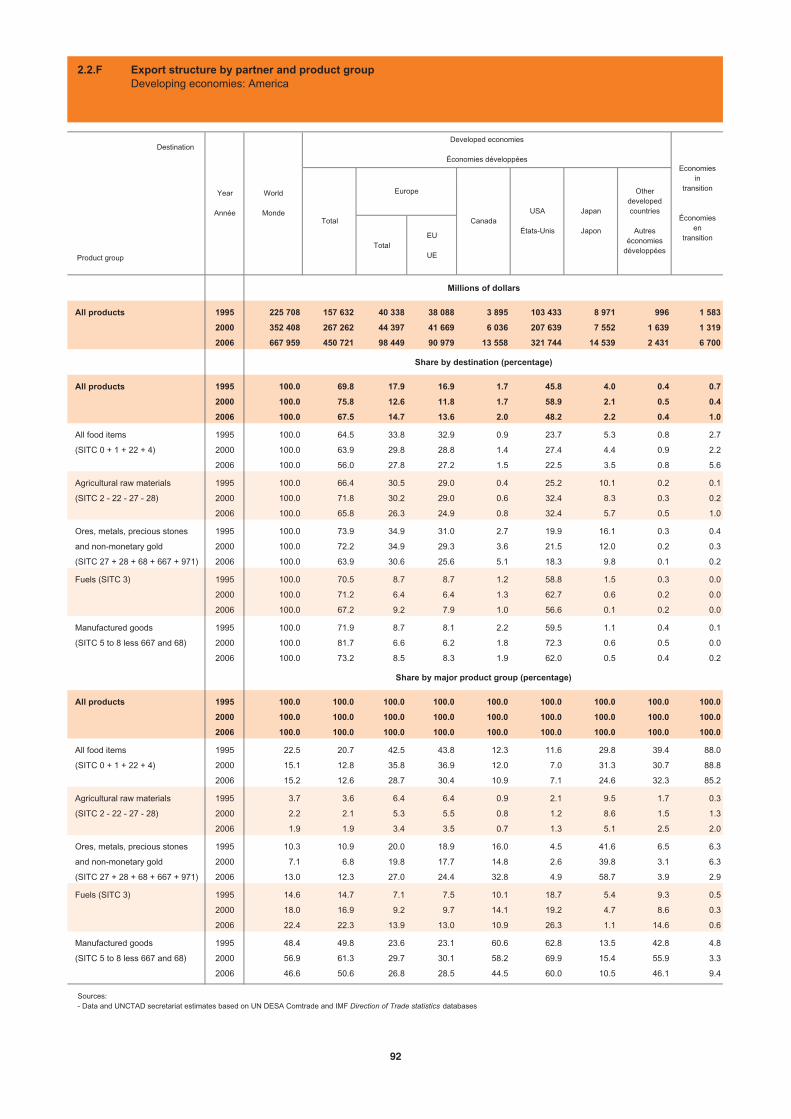
Product group
TotalEU
UE
Millions of dollars
All products 1995 225 708 157 632 40 338 38 088 3 895 103 433 8 971 996 1 583
2000 352 408 267 262 44 397 41 669 6 036 207 639 7 552 1 639 1 319
2006 667 959 450 721 98 449 90 979 13 558 321 744 14 539 2 431 6 700
Share by destination (percentage)
All products 1995 100.0 69.8 17.9 16.9 1.7 45.8 4.0 0.4 0.7
2000 100.0 75.8 12.6 11.8 1.7 58.9 2.1 0.5 0.4
2006 100.0 67.5 14.7 13.6 2.0 48.2 2.2 0.4 1.0
All food items 1995 100.0 64.5 33.8 32.9 0.9 23.7 5.3 0.8 2.7
(SITC 0 + 1 + 22 + 4) 2000 100.0 63.9 29.8 28.8 1.4 27.4 4.4 0.9 2.2
2006 100.0 56.0 27.8 27.2 1.5 22.5 3.5 0.8 5.6
Agricultural raw materials 1995 100.0 66.4 30.5 29.0 0.4 25.2 10.1 0.2 0.1
(SITC 2 - 22 - 27 - 28) 2000 100.0 71.8 30.2 29.0 0.6 32.4 8.3 0.3 0.2
2006 100.0 65.8 26.3 24.9 0.8 32.4 5.7 0.5 1.0
Ores, metals, precious stones 1995 100.0 73.9 34.9 31.0 2.7 19.9 16.1 0.3 0.4
and non-monetary gold 2000 100.0 72.2 34.9 29.3 3.6 21.5 12.0 0.2 0.3
(SITC 27 + 28 + 68 + 667 + 971) 2006 100.0 63.9 30.6 25.6 5.1 18.3 9.8 0.1 0.2
Fuels (SITC 3) 1995 100.0 70.5 8.7 8.7 1.2 58.8 1.5 0.3 0.0
2000 100.0 71.2 6.4 6.4 1.3 62.7 0.6 0.2 0.0
2006 100.0 67.2 9.2 7.9 1.0 56.6 0.1 0.2 0.0
Manufactured goods 1995 100.0 71.9 8.7 8.1 2.2 59.5 1.1 0.4 0.1
(SITC 5 to 8 less 667 and 68) 2000 100.0 81.7 6.6 6.2 1.8 72.3 0.6 0.5 0.0
2006 100.0 73.2 8.5 8.3 1.9 62.0 0.5 0.4 0.2
Share by major product group (percentage)
All products 1995 100.0 100.0 100.0 100.0 100.0 100.0 100.0 100.0 100.0
2000 100.0 100.0 100.0 100.0 100.0 100.0 100.0 100.0 100.0
2006 100.0 100.0 100.0 100.0 100.0 100.0 100.0 100.0 100.0
All food items 1995 22.5 20.7 42.5 43.8 12.3 11.6 29.8 39.4 88.0
(SITC 0 + 1 + 22 + 4) 2000 15.1 12.8 35.8 36.9 12.0 7.0 31.3 30.7 88.8
2006 15.2 12.6 28.7 30.4 10.9 7.1 24.6 32.3 85.2
Agricultural raw materials 1995 3.7 3.6 6.4 6.4 0.9 2.1 9.5 1.7 0.3
(SITC 2 - 22 - 27 - 28) 2000 2.2 2.1 5.3 5.5 0.8 1.2 8.6 1.5 1.3
2006 1.9 1.9 3.4 3.5 0.7 1.3 5.1 2.5 2.0
Ores, metals, precious stones 1995 10.3 10.9 20.0 18.9 16.0 4.5 41.6 6.5 6.3
and non-monetary gold 2000 7.1 6.8 19.8 17.7 14.8 2.6 39.8 3.1 6.3
(SITC 27 + 28 + 68 + 667 + 971) 2006 13.0 12.3 27.0 24.4 32.8 4.9 58.7 3.9 2.9
Fuels (SITC 3) 1995 14.6 14.7 7.1 7.5 10.1 18.7 5.4 9.3 0.5
2000 18.0 16.9 9.2 9.7 14.1 19.2 4.7 8.6 0.3
2006 22.4 22.3 13.9 13.0 10.9 26.3 1.1 14.6 0.6
Manufactured goods 1995 48.4 49.8 23.6 23.1 60.6 62.8 13.5 42.8 4.8
(SITC 5 to 8 less 667 and 68) 2000 56.9 61.3 29.7 30.1 58.2 69.9 15.4 55.9 3.3
2006 46.6 50.6 26.8 28.5 44.5 60.0 10.5 46.1 9.4
USA
États-Unis
Economiesin
transition
Économiesen
transition
Year
Année
Destination
World
MondeTotal
Europe
Canada
Developed economies
Économies développées
Japan
Japon
Otherdevelopedcountries
Autreséconomies
développées
2.2.F Export structure by partner and product groupDeveloping economies: America
Sources:- Data and UNCTAD secretariat estimates based on UN DESA Comtrade and IMF Direction of Trade statistics databases
92
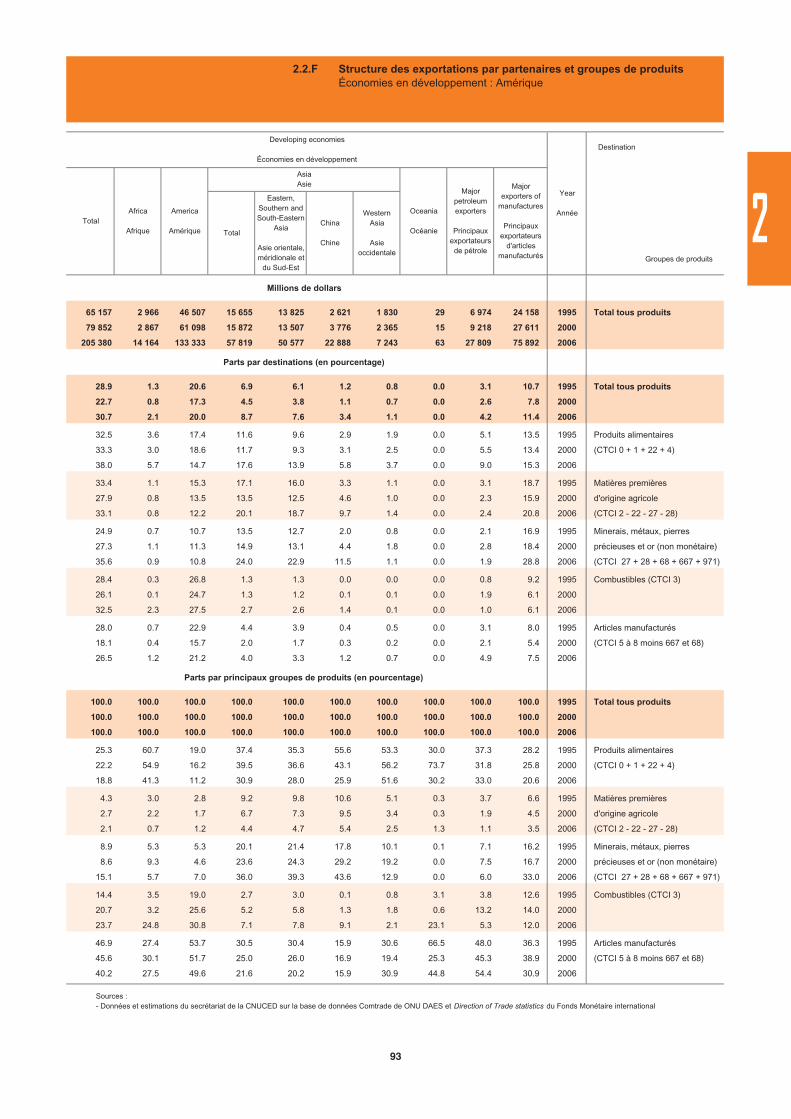
Millions de dollars
65 157 2 966 46 507 15 655 13 825 2 621 1 830 29 6 974 24 158 1995 Total tous produits
79 852 2 867 61 098 15 872 13 507 3 776 2 365 15 9 218 27 611 2000
205 380 14 164 133 333 57 819 50 577 22 888 7 243 63 27 809 75 892 2006
Parts par destinations (en pourcentage)
28.9 1.3 20.6 6.9 6.1 1.2 0.8 0.0 3.1 10.7 1995 Total tous produits
22.7 0.8 17.3 4.5 3.8 1.1 0.7 0.0 2.6 7.8 2000
30.7 2.1 20.0 8.7 7.6 3.4 1.1 0.0 4.2 11.4 2006
32.5 3.6 17.4 11.6 9.6 2.9 1.9 0.0 5.1 13.5 1995 Produits alimentaires
33.3 3.0 18.6 11.7 9.3 3.1 2.5 0.0 5.5 13.4 2000 (CTCI 0 + 1 + 22 + 4)
38.0 5.7 14.7 17.6 13.9 5.8 3.7 0.0 9.0 15.3 2006
33.4 1.1 15.3 17.1 16.0 3.3 1.1 0.0 3.1 18.7 1995 Matières premières
27.9 0.8 13.5 13.5 12.5 4.6 1.0 0.0 2.3 15.9 2000 d'origine agricole
33.1 0.8 12.2 20.1 18.7 9.7 1.4 0.0 2.4 20.8 2006 (CTCI 2 - 22 - 27 - 28)
24.9 0.7 10.7 13.5 12.7 2.0 0.8 0.0 2.1 16.9 1995 Minerais, métaux, pierres
27.3 1.1 11.3 14.9 13.1 4.4 1.8 0.0 2.8 18.4 2000 précieuses et or (non monétaire)
35.6 0.9 10.8 24.0 22.9 11.5 1.1 0.0 1.9 28.8 2006 (CTCI 27 + 28 + 68 + 667 + 971)
28.4 0.3 26.8 1.3 1.3 0.0 0.0 0.0 0.8 9.2 1995 Combustibles (CTCI 3)
26.1 0.1 24.7 1.3 1.2 0.1 0.1 0.0 1.9 6.1 2000
32.5 2.3 27.5 2.7 2.6 1.4 0.1 0.0 1.0 6.1 2006
28.0 0.7 22.9 4.4 3.9 0.4 0.5 0.0 3.1 8.0 1995 Articles manufacturés
18.1 0.4 15.7 2.0 1.7 0.3 0.2 0.0 2.1 5.4 2000 (CTCI 5 à 8 moins 667 et 68)
26.5 1.2 21.2 4.0 3.3 1.2 0.7 0.0 4.9 7.5 2006
Parts par principaux groupes de produits (en pourcentage)
100.0 100.0 100.0 100.0 100.0 100.0 100.0 100.0 100.0 100.0 1995 Total tous produits
100.0 100.0 100.0 100.0 100.0 100.0 100.0 100.0 100.0 100.0 2000
100.0 100.0 100.0 100.0 100.0 100.0 100.0 100.0 100.0 100.0 2006
25.3 60.7 19.0 37.4 35.3 55.6 53.3 30.0 37.3 28.2 1995 Produits alimentaires
22.2 54.9 16.2 39.5 36.6 43.1 56.2 73.7 31.8 25.8 2000 (CTCI 0 + 1 + 22 + 4)
18.8 41.3 11.2 30.9 28.0 25.9 51.6 30.2 33.0 20.6 2006
4.3 3.0 2.8 9.2 9.8 10.6 5.1 0.3 3.7 6.6 1995 Matières premières
2.7 2.2 1.7 6.7 7.3 9.5 3.4 0.3 1.9 4.5 2000 d'origine agricole
2.1 0.7 1.2 4.4 4.7 5.4 2.5 1.3 1.1 3.5 2006 (CTCI 2 - 22 - 27 - 28)
8.9 5.3 5.3 20.1 21.4 17.8 10.1 0.1 7.1 16.2 1995 Minerais, métaux, pierres
8.6 9.3 4.6 23.6 24.3 29.2 19.2 0.0 7.5 16.7 2000 précieuses et or (non monétaire)
15.1 5.7 7.0 36.0 39.3 43.6 12.9 0.0 6.0 33.0 2006 (CTCI 27 + 28 + 68 + 667 + 971)
14.4 3.5 19.0 2.7 3.0 0.1 0.8 3.1 3.8 12.6 1995 Combustibles (CTCI 3)
20.7 3.2 25.6 5.2 5.8 1.3 1.8 0.6 13.2 14.0 2000
23.7 24.8 30.8 7.1 7.8 9.1 2.1 23.1 5.3 12.0 2006
46.9 27.4 53.7 30.5 30.4 15.9 30.6 66.5 48.0 36.3 1995 Articles manufacturés
45.6 30.1 51.7 25.0 26.0 16.9 19.4 25.3 45.3 38.9 2000 (CTCI 5 à 8 moins 667 et 68)
40.2 27.5 49.6 21.6 20.2 15.9 30.9 44.8 54.4 30.9 2006
Majorpetroleumexporters
Principauxexportateurs
de pétrole
AsiaAsie
Total
Eastern,Southern and South-Eastern
Asia
Asie orientale, méridionale et
du Sud-Est
China
Chine
WesternAsia
Asieoccidentale
Oceania
OcéanieTotal
Africa
Afrique
America
Amérique
Developing economies
Économies en développement
Groupes de produits
Destination
Year
Année
Majorexporters of
manufactures
Principauxexportateurs
d'articlesmanufacturés
2.2.F Structure des exportations par partenaires et groupes de produitsÉconomies en développement : Amérique
Sources : - Données et estimations du secrétariat de la CNUCED sur la base de données Comtrade de ONU DAES et Direction of Trade statistics du Fonds Monétaire international
2
93
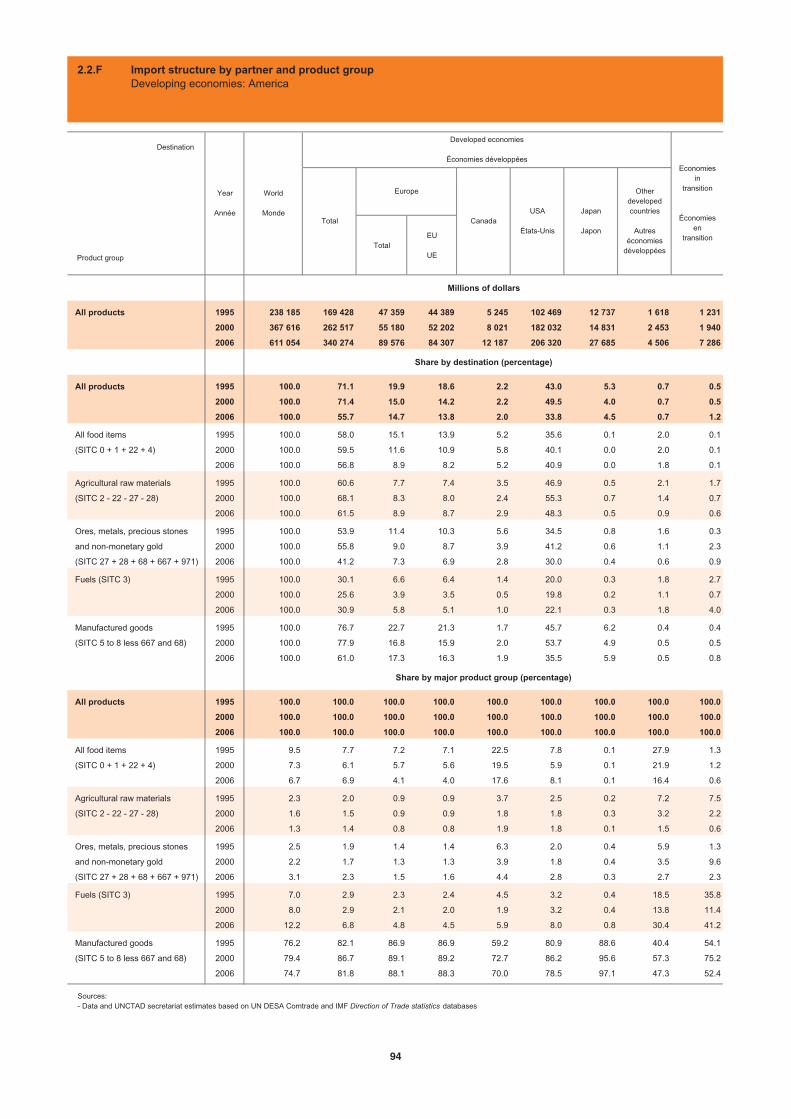
Product group
TotalEU
UE
Millions of dollars
All products 1995 238 185 169 428 47 359 44 389 5 245 102 469 12 737 1 618 1 231
2000 367 616 262 517 55 180 52 202 8 021 182 032 14 831 2 453 1 940
2006 611 054 340 274 89 576 84 307 12 187 206 320 27 685 4 506 7 286
Share by destination (percentage)
All products 1995 100.0 71.1 19.9 18.6 2.2 43.0 5.3 0.7 0.5
2000 100.0 71.4 15.0 14.2 2.2 49.5 4.0 0.7 0.5
2006 100.0 55.7 14.7 13.8 2.0 33.8 4.5 0.7 1.2
All food items 1995 100.0 58.0 15.1 13.9 5.2 35.6 0.1 2.0 0.1
(SITC 0 + 1 + 22 + 4) 2000 100.0 59.5 11.6 10.9 5.8 40.1 0.0 2.0 0.1
2006 100.0 56.8 8.9 8.2 5.2 40.9 0.0 1.8 0.1
Agricultural raw materials 1995 100.0 60.6 7.7 7.4 3.5 46.9 0.5 2.1 1.7
(SITC 2 - 22 - 27 - 28) 2000 100.0 68.1 8.3 8.0 2.4 55.3 0.7 1.4 0.7
2006 100.0 61.5 8.9 8.7 2.9 48.3 0.5 0.9 0.6
Ores, metals, precious stones 1995 100.0 53.9 11.4 10.3 5.6 34.5 0.8 1.6 0.3
and non-monetary gold 2000 100.0 55.8 9.0 8.7 3.9 41.2 0.6 1.1 2.3
(SITC 27 + 28 + 68 + 667 + 971) 2006 100.0 41.2 7.3 6.9 2.8 30.0 0.4 0.6 0.9
Fuels (SITC 3) 1995 100.0 30.1 6.6 6.4 1.4 20.0 0.3 1.8 2.7
2000 100.0 25.6 3.9 3.5 0.5 19.8 0.2 1.1 0.7
2006 100.0 30.9 5.8 5.1 1.0 22.1 0.3 1.8 4.0
Manufactured goods 1995 100.0 76.7 22.7 21.3 1.7 45.7 6.2 0.4 0.4
(SITC 5 to 8 less 667 and 68) 2000 100.0 77.9 16.8 15.9 2.0 53.7 4.9 0.5 0.5
2006 100.0 61.0 17.3 16.3 1.9 35.5 5.9 0.5 0.8
Share by major product group (percentage)
All products 1995 100.0 100.0 100.0 100.0 100.0 100.0 100.0 100.0 100.0
2000 100.0 100.0 100.0 100.0 100.0 100.0 100.0 100.0 100.0
2006 100.0 100.0 100.0 100.0 100.0 100.0 100.0 100.0 100.0
All food items 1995 9.5 7.7 7.2 7.1 22.5 7.8 0.1 27.9 1.3
(SITC 0 + 1 + 22 + 4) 2000 7.3 6.1 5.7 5.6 19.5 5.9 0.1 21.9 1.2
2006 6.7 6.9 4.1 4.0 17.6 8.1 0.1 16.4 0.6
Agricultural raw materials 1995 2.3 2.0 0.9 0.9 3.7 2.5 0.2 7.2 7.5
(SITC 2 - 22 - 27 - 28) 2000 1.6 1.5 0.9 0.9 1.8 1.8 0.3 3.2 2.2
2006 1.3 1.4 0.8 0.8 1.9 1.8 0.1 1.5 0.6
Ores, metals, precious stones 1995 2.5 1.9 1.4 1.4 6.3 2.0 0.4 5.9 1.3
and non-monetary gold 2000 2.2 1.7 1.3 1.3 3.9 1.8 0.4 3.5 9.6
(SITC 27 + 28 + 68 + 667 + 971) 2006 3.1 2.3 1.5 1.6 4.4 2.8 0.3 2.7 2.3
Fuels (SITC 3) 1995 7.0 2.9 2.3 2.4 4.5 3.2 0.4 18.5 35.8
2000 8.0 2.9 2.1 2.0 1.9 3.2 0.4 13.8 11.4
2006 12.2 6.8 4.8 4.5 5.9 8.0 0.8 30.4 41.2
Manufactured goods 1995 76.2 82.1 86.9 86.9 59.2 80.9 88.6 40.4 54.1
(SITC 5 to 8 less 667 and 68) 2000 79.4 86.7 89.1 89.2 72.7 86.2 95.6 57.3 75.2
2006 74.7 81.8 88.1 88.3 70.0 78.5 97.1 47.3 52.4
USA
États-Unis
Economiesin
transition
Économiesen
transition
Year
Année
Destination
World
MondeTotal
Europe
Canada
Developed economies
Économies développées
Japan
Japon
Otherdevelopedcountries
Autreséconomies
développées
2.2.F Import structure by partner and product groupDeveloping economies: America
Sources:- Data and UNCTAD secretariat estimates based on UN DESA Comtrade and IMF Direction of Trade statistics databases
94

Millions de dollars
65 890 2 525 45 110 18 230 16 253 2 691 1 977 24 10 761 29 514 1995 Total tous produits
100 434 5 031 63 405 31 990 29 968 8 443 2 022 8 17 274 48 270 2000
252 672 13 383 129 111 110 137 105 951 51 400 4 186 41 35 437 150 062 2006
Parts par destinations (en pourcentage)
27.7 1.1 18.9 7.7 6.8 1.1 0.8 0.0 4.5 12.4 1995 Total tous produits
27.3 1.4 17.2 8.7 8.2 2.3 0.6 0.0 4.7 13.1 2000
41.4 2.2 21.1 18.0 17.3 8.4 0.7 0.0 5.8 24.6 2006
41.5 0.4 38.8 2.3 2.1 0.4 0.2 0.0 3.3 6.5 1995 Produits alimentaires
40.0 0.4 37.2 2.4 2.2 0.7 0.2 0.0 3.1 7.1 2000 (CTCI 0 + 1 + 22 + 4)
40.7 0.4 36.4 3.9 3.6 1.3 0.2 0.1 2.4 7.6 2006
37.2 2.5 25.6 9.2 9.1 0.4 0.1 0.0 0.9 11.9 1995 Matières premières
30.9 3.2 20.7 7.0 6.9 1.1 0.1 0.0 1.0 10.6 2000 d'origine agricole
37.6 1.2 22.8 13.6 13.4 1.6 0.2 0.0 0.9 16.6 2006 (CTCI 2 - 22 - 27 - 28)
45.7 2.9 41.1 1.6 1.5 0.4 0.1 0.0 5.0 10.6 1995 Minerais, métaux, pierres
41.3 2.7 36.4 2.2 2.1 0.9 0.1 0.0 3.9 12.2 2000 précieuses et or (non monétaire)
57.8 1.8 52.0 3.9 3.5 1.8 0.4 0.0 4.1 14.2 2006 (CTCI 27 + 28 + 68 + 667 + 971)
66.9 8.8 44.5 13.6 3.0 0.9 10.6 0.0 42.3 5.0 1995 Combustibles (CTCI 3)
73.2 13.0 52.8 7.5 1.9 0.7 5.5 0.0 45.7 3.7 2000
64.6 15.3 41.4 7.8 3.6 0.4 4.2 0.0 37.9 8.4 2006
22.3 0.4 13.8 8.1 8.0 1.3 0.1 0.0 1.4 14.2 1995 Articles manufacturés
20.8 0.2 11.4 9.2 9.1 2.7 0.1 0.0 0.9 14.3 2000 (CTCI 5 à 8 moins 667 et 68)
37.5 0.3 15.5 21.8 21.6 10.8 0.1 0.0 1.1 29.5 2006
Parts par principaux groupes de produits (en pourcentage)
100.0 100.0 100.0 100.0 100.0 100.0 100.0 100.0 100.0 100.0 1995 Total tous produits
100.0 100.0 100.0 100.0 100.0 100.0 100.0 100.0 100.0 100.0 2000
100.0 100.0 100.0 100.0 100.0 100.0 100.0 100.0 100.0 100.0 2006
14.2 3.3 19.4 2.9 2.9 3.2 2.4 4.1 7.0 5.0 1995 Produits alimentaires
10.8 2.3 15.8 2.0 1.9 2.2 3.2 13.5 4.8 4.0 2000 (CTCI 0 + 1 + 22 + 4)
6.6 1.1 11.6 1.4 1.4 1.0 2.3 52.3 2.8 2.1 2006
3.1 5.4 3.1 2.8 3.1 0.8 0.2 0.3 0.5 2.2 1995 Matières premières
1.8 3.8 1.9 1.3 1.3 0.8 0.1 1.2 0.3 1.3 2000 d'origine agricole
1.2 0.7 1.4 1.0 1.0 0.2 0.4 1.0 0.2 0.9 2006 (CTCI 2 - 22 - 27 - 28)
4.1 6.9 5.4 0.5 0.6 0.9 0.3 0.1 2.7 2.1 1995 Minerais, métaux, pierres
3.3 4.3 4.6 0.6 0.6 0.8 0.6 0.0 1.8 2.0 2000 précieuses et or (non monétaire)
4.3 2.6 7.6 0.7 0.6 0.7 1.8 0.1 2.2 1.8 2006 (CTCI 27 + 28 + 68 + 667 + 971)
16.8 57.9 16.3 12.3 3.0 5.5 88.6 0.0 65.1 2.8 1995 Combustibles (CTCI 3)
21.5 76.2 24.6 6.9 1.9 2.6 80.8 0.0 78.1 2.3 2000
19.0 85.1 23.9 5.3 2.5 0.6 75.2 0.0 79.6 4.2 2006
61.3 26.5 55.4 80.7 89.5 89.3 8.4 95.4 24.1 87.2 1995 Articles manufacturés
60.6 13.4 52.7 83.6 88.2 92.1 15.2 85.2 14.8 86.7 2000 (CTCI 5 à 8 moins 667 et 68)
67.8 10.5 54.6 90.2 93.1 96.2 16.3 41.6 14.8 89.8 2006
Majorpetroleumexporters
Principauxexportateurs
de pétrole
AsiaAsie
Total
Eastern,Southern and South-Eastern
Asia
Asie orientale, méridionale et
du Sud-Est
China
Chine
WesternAsia
Asieoccidentale
Oceania
OcéanieTotal
Africa
Afrique
America
Amérique
Developing economies
Économies en développement
Groupes de produits
Destination
Year
Année
Majorexporters of
manufactures
Principauxexportateurs
d'articlesmanufacturés
2.2.F Structure des importations par partenaires et groupes de produitsÉconomies en développement : Amérique
Sources : - Données et estimations du secrétariat de la CNUCED sur la base de données Comtrade de ONU DAES et Direction of Trade statistics du Fonds Monétaire international
2
95
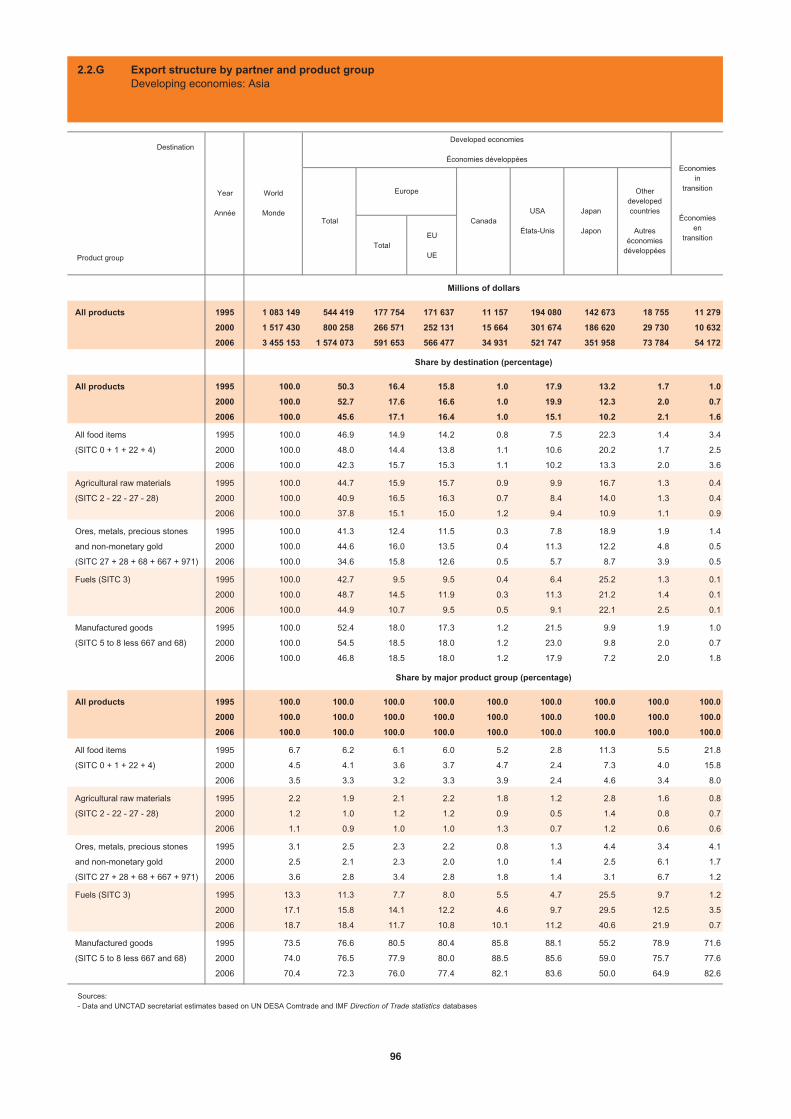
Product group
TotalEU
UE
Millions of dollars
All products 1995 1 083 149 544 419 177 754 171 637 11 157 194 080 142 673 18 755 11 279
2000 1 517 430 800 258 266 571 252 131 15 664 301 674 186 620 29 730 10 632
2006 3 455 153 1 574 073 591 653 566 477 34 931 521 747 351 958 73 784 54 172
Share by destination (percentage)
All products 1995 100.0 50.3 16.4 15.8 1.0 17.9 13.2 1.7 1.0
2000 100.0 52.7 17.6 16.6 1.0 19.9 12.3 2.0 0.7
2006 100.0 45.6 17.1 16.4 1.0 15.1 10.2 2.1 1.6
All food items 1995 100.0 46.9 14.9 14.2 0.8 7.5 22.3 1.4 3.4
(SITC 0 + 1 + 22 + 4) 2000 100.0 48.0 14.4 13.8 1.1 10.6 20.2 1.7 2.5
2006 100.0 42.3 15.7 15.3 1.1 10.2 13.3 2.0 3.6
Agricultural raw materials 1995 100.0 44.7 15.9 15.7 0.9 9.9 16.7 1.3 0.4
(SITC 2 - 22 - 27 - 28) 2000 100.0 40.9 16.5 16.3 0.7 8.4 14.0 1.3 0.4
2006 100.0 37.8 15.1 15.0 1.2 9.4 10.9 1.1 0.9
Ores, metals, precious stones 1995 100.0 41.3 12.4 11.5 0.3 7.8 18.9 1.9 1.4
and non-monetary gold 2000 100.0 44.6 16.0 13.5 0.4 11.3 12.2 4.8 0.5
(SITC 27 + 28 + 68 + 667 + 971) 2006 100.0 34.6 15.8 12.6 0.5 5.7 8.7 3.9 0.5
Fuels (SITC 3) 1995 100.0 42.7 9.5 9.5 0.4 6.4 25.2 1.3 0.1
2000 100.0 48.7 14.5 11.9 0.3 11.3 21.2 1.4 0.1
2006 100.0 44.9 10.7 9.5 0.5 9.1 22.1 2.5 0.1
Manufactured goods 1995 100.0 52.4 18.0 17.3 1.2 21.5 9.9 1.9 1.0
(SITC 5 to 8 less 667 and 68) 2000 100.0 54.5 18.5 18.0 1.2 23.0 9.8 2.0 0.7
2006 100.0 46.8 18.5 18.0 1.2 17.9 7.2 2.0 1.8
Share by major product group (percentage)
All products 1995 100.0 100.0 100.0 100.0 100.0 100.0 100.0 100.0 100.0
2000 100.0 100.0 100.0 100.0 100.0 100.0 100.0 100.0 100.0
2006 100.0 100.0 100.0 100.0 100.0 100.0 100.0 100.0 100.0
All food items 1995 6.7 6.2 6.1 6.0 5.2 2.8 11.3 5.5 21.8
(SITC 0 + 1 + 22 + 4) 2000 4.5 4.1 3.6 3.7 4.7 2.4 7.3 4.0 15.8
2006 3.5 3.3 3.2 3.3 3.9 2.4 4.6 3.4 8.0
Agricultural raw materials 1995 2.2 1.9 2.1 2.2 1.8 1.2 2.8 1.6 0.8
(SITC 2 - 22 - 27 - 28) 2000 1.2 1.0 1.2 1.2 0.9 0.5 1.4 0.8 0.7
2006 1.1 0.9 1.0 1.0 1.3 0.7 1.2 0.6 0.6
Ores, metals, precious stones 1995 3.1 2.5 2.3 2.2 0.8 1.3 4.4 3.4 4.1
and non-monetary gold 2000 2.5 2.1 2.3 2.0 1.0 1.4 2.5 6.1 1.7
(SITC 27 + 28 + 68 + 667 + 971) 2006 3.6 2.8 3.4 2.8 1.8 1.4 3.1 6.7 1.2
Fuels (SITC 3) 1995 13.3 11.3 7.7 8.0 5.5 4.7 25.5 9.7 1.2
2000 17.1 15.8 14.1 12.2 4.6 9.7 29.5 12.5 3.5
2006 18.7 18.4 11.7 10.8 10.1 11.2 40.6 21.9 0.7
Manufactured goods 1995 73.5 76.6 80.5 80.4 85.8 88.1 55.2 78.9 71.6
(SITC 5 to 8 less 667 and 68) 2000 74.0 76.5 77.9 80.0 88.5 85.6 59.0 75.7 77.6
2006 70.4 72.3 76.0 77.4 82.1 83.6 50.0 64.9 82.6
Year
Année
Destination
World
MondeTotal
Europe
Canada
Developed economies
Économies développées
Japan
Japon
Otherdevelopedcountries
Autreséconomies
développées
USA
États-Unis
Economiesin
transition
Économiesen
transition
2.2.G Export structure by partner and product groupDeveloping economies: Asia
Sources:- Data and UNCTAD secretariat estimates based on UN DESA Comtrade and IMF Direction of Trade statistics databases
96
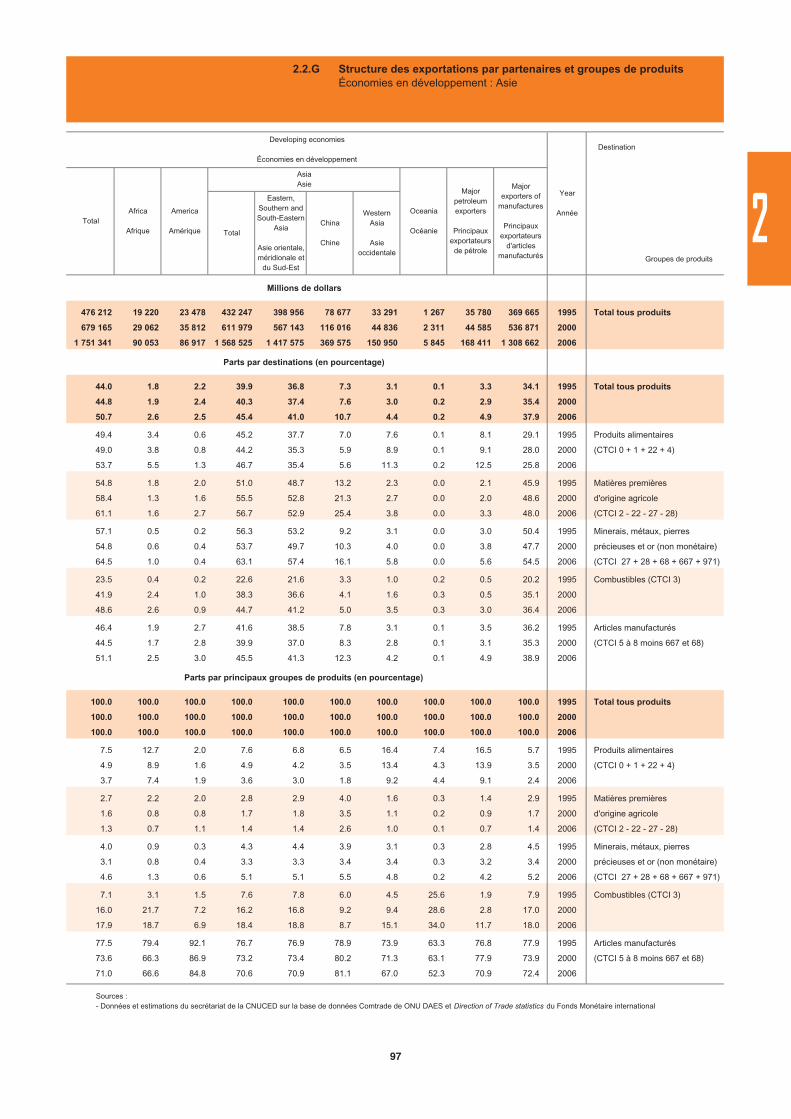
Millions de dollars
476 212 19 220 23 478 432 247 398 956 78 677 33 291 1 267 35 780 369 665 1995 Total tous produits
679 165 29 062 35 812 611 979 567 143 116 016 44 836 2 311 44 585 536 871 2000
1 751 341 90 053 86 917 1 568 525 1 417 575 369 575 150 950 5 845 168 411 1 308 662 2006
Parts par destinations (en pourcentage)
44.0 1.8 2.2 39.9 36.8 7.3 3.1 0.1 3.3 34.1 1995 Total tous produits
44.8 1.9 2.4 40.3 37.4 7.6 3.0 0.2 2.9 35.4 2000
50.7 2.6 2.5 45.4 41.0 10.7 4.4 0.2 4.9 37.9 2006
49.4 3.4 0.6 45.2 37.7 7.0 7.6 0.1 8.1 29.1 1995 Produits alimentaires
49.0 3.8 0.8 44.2 35.3 5.9 8.9 0.1 9.1 28.0 2000 (CTCI 0 + 1 + 22 + 4)
53.7 5.5 1.3 46.7 35.4 5.6 11.3 0.2 12.5 25.8 2006
54.8 1.8 2.0 51.0 48.7 13.2 2.3 0.0 2.1 45.9 1995 Matières premières
58.4 1.3 1.6 55.5 52.8 21.3 2.7 0.0 2.0 48.6 2000 d'origine agricole
61.1 1.6 2.7 56.7 52.9 25.4 3.8 0.0 3.3 48.0 2006 (CTCI 2 - 22 - 27 - 28)
57.1 0.5 0.2 56.3 53.2 9.2 3.1 0.0 3.0 50.4 1995 Minerais, métaux, pierres
54.8 0.6 0.4 53.7 49.7 10.3 4.0 0.0 3.8 47.7 2000 précieuses et or (non monétaire)
64.5 1.0 0.4 63.1 57.4 16.1 5.8 0.0 5.6 54.5 2006 (CTCI 27 + 28 + 68 + 667 + 971)
23.5 0.4 0.2 22.6 21.6 3.3 1.0 0.2 0.5 20.2 1995 Combustibles (CTCI 3)
41.9 2.4 1.0 38.3 36.6 4.1 1.6 0.3 0.5 35.1 2000
48.6 2.6 0.9 44.7 41.2 5.0 3.5 0.3 3.0 36.4 2006
46.4 1.9 2.7 41.6 38.5 7.8 3.1 0.1 3.5 36.2 1995 Articles manufacturés
44.5 1.7 2.8 39.9 37.0 8.3 2.8 0.1 3.1 35.3 2000 (CTCI 5 à 8 moins 667 et 68)
51.1 2.5 3.0 45.5 41.3 12.3 4.2 0.1 4.9 38.9 2006
Parts par principaux groupes de produits (en pourcentage)
100.0 100.0 100.0 100.0 100.0 100.0 100.0 100.0 100.0 100.0 1995 Total tous produits
100.0 100.0 100.0 100.0 100.0 100.0 100.0 100.0 100.0 100.0 2000
100.0 100.0 100.0 100.0 100.0 100.0 100.0 100.0 100.0 100.0 2006
7.5 12.7 2.0 7.6 6.8 6.5 16.4 7.4 16.5 5.7 1995 Produits alimentaires
4.9 8.9 1.6 4.9 4.2 3.5 13.4 4.3 13.9 3.5 2000 (CTCI 0 + 1 + 22 + 4)
3.7 7.4 1.9 3.6 3.0 1.8 9.2 4.4 9.1 2.4 2006
2.7 2.2 2.0 2.8 2.9 4.0 1.6 0.3 1.4 2.9 1995 Matières premières
1.6 0.8 0.8 1.7 1.8 3.5 1.1 0.2 0.9 1.7 2000 d'origine agricole
1.3 0.7 1.1 1.4 1.4 2.6 1.0 0.1 0.7 1.4 2006 (CTCI 2 - 22 - 27 - 28)
4.0 0.9 0.3 4.3 4.4 3.9 3.1 0.3 2.8 4.5 1995 Minerais, métaux, pierres
3.1 0.8 0.4 3.3 3.3 3.4 3.4 0.3 3.2 3.4 2000 précieuses et or (non monétaire)
4.6 1.3 0.6 5.1 5.1 5.5 4.8 0.2 4.2 5.2 2006 (CTCI 27 + 28 + 68 + 667 + 971)
7.1 3.1 1.5 7.6 7.8 6.0 4.5 25.6 1.9 7.9 1995 Combustibles (CTCI 3)
16.0 21.7 7.2 16.2 16.8 9.2 9.4 28.6 2.8 17.0 2000
17.9 18.7 6.9 18.4 18.8 8.7 15.1 34.0 11.7 18.0 2006
77.5 79.4 92.1 76.7 76.9 78.9 73.9 63.3 76.8 77.9 1995 Articles manufacturés
73.6 66.3 86.9 73.2 73.4 80.2 71.3 63.1 77.9 73.9 2000 (CTCI 5 à 8 moins 667 et 68)
71.0 66.6 84.8 70.6 70.9 81.1 67.0 52.3 70.9 72.4 2006
Groupes de produits
Destination
Year
Année
Majorexporters of
manufactures
Principauxexportateurs
d'articlesmanufacturés
Developing economies
Économies en développement
TotalAfrica
Afrique
America
Amérique
Majorpetroleumexporters
Principauxexportateurs
de pétrole
AsiaAsie
Total
Eastern,Southern and South-Eastern
Asia
Asie orientale, méridionale et
du Sud-Est
China
Chine
WesternAsia
Asieoccidentale
Oceania
Océanie
2.2.G Structure des exportations par partenaires et groupes de produitsÉconomies en développement : Asie
Sources : - Données et estimations du secrétariat de la CNUCED sur la base de données Comtrade de ONU DAES et Direction of Trade statistics du Fonds Monétaire international
2
97

Product group
TotalEU
UE
Millions of dollars
All products 1995 1 121 160 635 920 218 504 200 372 13 030 153 717 221 395 29 273 19 834
2000 1 359 101 661 643 224 478 204 400 13 147 162 427 222 738 38 853 24 194
2006 2 990 994 1 141 082 441 033 399 165 21 780 239 485 359 791 78 994 71 127
Share by destination (percentage)
All products 1995 100.0 56.7 19.5 17.9 1.2 13.7 19.7 2.6 1.8
2000 100.0 48.7 16.5 15.0 1.0 12.0 16.4 2.9 1.8
2006 100.0 38.2 14.7 13.3 0.7 8.0 12.0 2.6 2.4
All food items 1995 100.0 53.4 17.5 16.9 3.5 21.5 2.3 8.6 1.1
(SITC 0 + 1 + 22 + 4) 2000 100.0 50.3 16.1 15.4 3.5 17.4 2.2 11.0 1.4
2006 100.0 39.2 12.6 11.7 2.6 12.6 1.9 9.5 3.3
Agricultural raw materials 1995 100.0 51.5 9.7 9.3 4.9 22.7 5.1 9.1 5.1
(SITC 2 - 22 - 27 - 28) 2000 100.0 51.5 13.1 12.7 6.8 16.7 5.0 9.9 5.6
2006 100.0 47.3 12.3 12.1 5.3 18.2 4.4 7.1 8.8
Ores, metals, precious stones 1995 100.0 56.3 22.8 16.1 2.6 10.5 7.8 12.6 4.5
and non-monetary gold 2000 100.0 53.9 25.5 17.3 1.3 5.9 7.8 13.5 5.9
(SITC 27 + 28 + 68 + 667 + 971) 2006 100.0 43.8 16.4 9.7 1.6 4.6 6.7 14.5 4.9
Fuels (SITC 3) 1995 100.0 11.9 2.3 2.2 0.6 2.8 2.0 4.2 1.9
2000 100.0 8.4 2.3 1.7 0.2 1.0 0.7 4.1 2.2
2006 100.0 6.4 1.6 1.4 0.2 0.8 0.8 3.0 4.6
Manufactured goods 1995 100.0 61.1 21.4 19.8 0.8 13.6 24.5 0.9 1.5
(SITC 5 to 8 less 667 and 68) 2000 100.0 54.1 18.1 16.9 0.7 13.4 21.0 1.0 1.2
2006 100.0 44.4 17.0 15.9 0.5 9.6 16.5 0.7 0.9
Share by major product group (percentage)
All products 1995 100.0 100.0 100.0 100.0 100.0 100.0 100.0 100.0 100.0
2000 100.0 100.0 100.0 100.0 100.0 100.0 100.0 100.0 100.0
2006 100.0 100.0 100.0 100.0 100.0 100.0 100.0 100.0 100.0
All food items 1995 6.8 6.4 6.1 6.5 20.6 10.7 0.8 22.6 4.3
(SITC 0 + 1 + 22 + 4) 2000 5.7 5.9 5.6 5.8 20.6 8.3 0.8 21.9 4.4
2006 4.3 4.4 3.6 3.7 15.4 6.7 0.7 15.3 6.0
Agricultural raw materials 1995 3.2 2.9 1.6 1.7 13.7 5.4 0.8 11.2 9.3
(SITC 2 - 22 - 27 - 28) 2000 2.5 2.6 2.0 2.1 17.5 3.5 0.8 8.7 7.9
2006 2.0 2.5 1.7 1.8 14.4 4.5 0.7 5.3 7.4
Ores, metals, precious stones 1995 5.7 5.7 6.7 5.2 12.6 4.4 2.3 27.6 14.5
and non-monetary gold 2000 5.5 6.1 8.4 6.3 7.5 2.7 2.6 25.9 18.3
(SITC 27 + 28 + 68 + 667 + 971) 2006 7.8 8.9 8.6 5.6 16.9 4.5 4.3 42.5 15.9
Fuels (SITC 3) 1995 7.0 1.5 0.8 0.9 3.4 1.4 0.7 11.2 7.4
2000 11.2 1.9 1.6 1.3 2.7 1.0 0.5 16.2 14.0
2006 14.7 2.5 1.6 1.5 3.6 1.5 1.0 16.7 28.4
Manufactured goods 1995 75.7 81.6 83.0 84.1 49.2 75.2 93.9 26.2 63.5
(SITC 5 to 8 less 667 and 68) 2000 74.3 82.6 81.5 83.6 51.4 83.4 95.0 25.7 48.6
2006 67.3 78.3 77.7 80.2 47.3 80.9 92.3 18.5 26.5
Year
Année
Destination
World
MondeTotal
Europe
Canada
Developed economies
Économies développées
Japan
Japon
Otherdevelopedcountries
Autreséconomies
développées
USA
États-Unis
Economiesin
transition
Économiesen
transition
2.2.G Import structure by partner and product groupDeveloping economies: Asia
Sources:- Data and UNCTAD secretariat estimates based on UN DESA Comtrade and IMF Direction of Trade statistics databases
98

Millions de dollars
454 948 15 494 19 927 418 682 368 692 98 273 49 990 845 56 463 352 769 1995 Total tous produits
651 357 23 596 20 635 606 184 524 589 148 259 81 594 943 101 577 490 619 2000
1 717 600 76 171 74 747 1 564 315 1 312 708 436 127 251 607 2 367 331 589 1 221 180 2006
Parts par destinations (en pourcentage)
40.6 1.4 1.8 37.3 32.9 8.8 4.5 0.1 5.0 31.5 1995 Total tous produits
47.9 1.7 1.5 44.6 38.6 10.9 6.0 0.1 7.5 36.1 2000
57.4 2.5 2.5 52.3 43.9 14.6 8.4 0.1 11.1 40.8 2006
44.9 2.3 8.1 34.1 30.6 6.3 3.6 0.3 3.1 29.4 1995 Produits alimentaires
48.2 3.1 9.6 35.3 31.0 7.8 4.3 0.2 4.7 28.1 2000 (CTCI 0 + 1 + 22 + 4)
56.9 3.1 14.6 38.8 33.9 7.0 4.9 0.3 5.0 31.9 2006
43.0 4.9 5.1 32.2 31.3 4.1 0.9 0.8 1.9 26.1 1995 Matières premières
42.8 5.6 4.0 32.6 31.5 4.1 1.1 0.7 2.6 24.0 2000 d'origine agricole
43.7 5.3 5.3 32.1 31.2 2.7 0.9 1.0 2.1 24.7 2006 (CTCI 2 - 22 - 27 - 28)
38.9 5.7 7.4 25.5 21.5 3.9 4.0 0.3 4.0 22.5 1995 Minerais, métaux, pierres
40.0 5.1 6.9 27.9 24.1 4.3 3.8 0.2 4.2 24.2 2000 précieuses et or (non monétaire)
50.7 5.8 11.3 33.4 28.8 6.2 4.5 0.3 5.5 28.5 2006 (CTCI 27 + 28 + 68 + 667 + 971)
81.2 5.9 0.6 74.5 32.7 3.5 41.8 0.1 52.6 21.2 1995 Combustibles (CTCI 3)
78.0 7.1 0.5 70.4 29.6 2.9 40.9 0.1 53.6 17.2 2000
87.7 9.6 1.7 76.3 31.9 2.5 44.4 0.0 60.8 19.7 2006
36.8 0.4 0.8 35.7 34.3 10.1 1.4 0.0 1.1 33.7 1995 Articles manufacturés
44.3 0.4 0.6 43.3 42.1 13.2 1.2 0.0 1.1 41.0 2000 (CTCI 5 à 8 moins 667 et 68)
54.1 0.4 0.9 52.7 51.0 19.8 1.8 0.0 1.6 49.8 2006
Parts par principaux groupes de produits (en pourcentage)
100.0 100.0 100.0 100.0 100.0 100.0 100.0 100.0 100.0 100.0 1995 Total tous produits
100.0 100.0 100.0 100.0 100.0 100.0 100.0 100.0 100.0 100.0 2000
100.0 100.0 100.0 100.0 100.0 100.0 100.0 100.0 100.0 100.0 2006
7.6 11.5 31.3 6.3 6.4 4.9 5.5 27.8 4.2 6.4 1995 Produits alimentaires
5.7 10.2 35.9 4.5 4.6 4.1 4.0 20.0 3.6 4.4 2000 (CTCI 0 + 1 + 22 + 4)
4.2 5.3 25.0 3.2 3.3 2.1 2.5 16.1 1.9 3.3 2006
3.4 11.3 9.3 2.8 3.1 1.5 0.7 33.7 1.2 2.7 1995 Matières premières
2.2 8.0 6.5 1.8 2.0 0.9 0.5 23.6 0.9 1.7 2000 d'origine agricole
1.5 4.1 4.2 1.2 1.4 0.4 0.2 24.7 0.4 1.2 2006 (CTCI 2 - 22 - 27 - 28)
5.5 23.7 23.9 3.9 3.7 2.5 5.1 20.7 4.6 4.1 1995 Minerais, métaux, pierres
4.6 16.0 24.8 3.4 3.4 2.1 3.5 15.4 3.1 3.7 2000 précieuses et or (non monétaire)
6.8 17.6 35.0 4.9 5.1 3.3 4.2 26.7 3.8 5.4 2006 (CTCI 27 + 28 + 68 + 667 + 971)
13.9 29.8 2.5 13.9 6.9 2.8 65.2 8.2 72.7 4.7 1995 Combustibles (CTCI 3)
18.3 45.7 3.6 17.7 8.6 3.0 76.5 14.6 80.6 5.4 2000
22.4 55.3 10.0 21.4 10.7 2.5 77.4 7.8 80.4 7.1 2006
68.7 21.7 32.5 72.3 78.9 87.7 23.4 9.4 17.1 81.1 1995 Articles manufacturés
68.7 15.6 29.0 72.1 81.0 89.7 15.4 26.2 11.1 84.5 2000 (CTCI 5 à 8 moins 667 et 68)
63.4 11.3 23.3 67.9 78.2 91.2 14.3 23.6 9.9 82.1 2006
Groupes de produits
Destination
Year
Année
Majorexporters of
manufactures
Principauxexportateurs
d'articlesmanufacturés
Developing economies
Économies en développement
TotalAfrica
Afrique
America
Amérique
Majorpetroleumexporters
Principauxexportateurs
de pétrole
AsiaAsie
Total
Eastern,Southern and South-Eastern
Asia
Asie orientale, méridionale et
du Sud-Est
China
Chine
WesternAsia
Asieoccidentale
Oceania
Océanie
2.2.G Structure des importations par partenaires et groupes de produitsÉconomies en développement : Asie
Sources : - Données et estimations du secrétariat de la CNUCED sur la base de données Comtrade de ONU DAES et Direction of Trade statistics du Fonds Monétaire international
2
99

Product group
TotalEU
UE
Millions of dollars
All products 1995 950 005 485 570 152 628 146 858 10 630 183 440 121 285 17 586 8 638
2000 1 297 727 690 242 221 690 207 753 14 742 270 513 155 277 28 019 7 908
2006 2 841 169 1 299 154 483 756 462 224 31 077 463 466 251 728 69 128 44 725
Share by destination (percentage)
All products 1995 100.0 51.1 16.1 15.5 1.1 19.3 12.8 1.9 0.9
2000 100.0 53.2 17.1 16.0 1.1 20.8 12.0 2.2 0.6
2006 100.0 45.7 17.0 16.3 1.1 16.3 8.9 2.4 1.6
All food items 1995 100.0 47.8 13.0 12.4 0.9 7.8 24.6 1.5 2.7
(SITC 0 + 1 + 22 + 4) 2000 100.0 49.2 12.9 12.4 1.2 11.3 22.3 1.6 2.0
2006 100.0 44.1 14.4 14.1 1.2 11.3 15.0 2.2 3.3
Agricultural raw materials 1995 100.0 44.5 14.9 14.7 0.9 10.2 17.3 1.3 0.4
(SITC 2 - 22 - 27 - 28) 2000 100.0 40.8 15.6 15.4 0.8 8.6 14.5 1.3 0.4
2006 100.0 38.4 15.1 15.0 1.3 9.6 11.2 1.1 0.9
Ores, metals, precious stones 1995 100.0 42.4 11.7 10.7 0.3 8.5 19.9 2.1 1.4
and non-monetary gold 2000 100.0 44.9 15.0 12.5 0.4 11.9 12.6 5.0 0.3
(SITC 27 + 28 + 68 + 667 + 971) 2006 100.0 36.2 14.5 12.3 0.6 6.6 9.9 4.6 0.5
Fuels (SITC 3) 1995 100.0 40.8 6.8 6.8 0.4 2.5 29.0 2.1 0.2
2000 100.0 45.8 12.4 5.2 0.1 3.4 26.2 3.7 0.1
2006 100.0 38.7 10.4 7.1 0.1 3.6 18.5 6.1 0.1
Manufactured goods 1995 100.0 52.6 17.2 16.5 1.2 22.1 10.2 1.9 0.8
(SITC 5 to 8 less 667 and 68) 2000 100.0 54.6 17.8 17.2 1.3 23.4 10.2 2.0 0.6
2006 100.0 47.2 18.0 17.5 1.2 18.5 7.5 2.0 1.7
Share by major product group (percentage)
All products 1995 100.0 100.0 100.0 100.0 100.0 100.0 100.0 100.0 100.0
2000 100.0 100.0 100.0 100.0 100.0 100.0 100.0 100.0 100.0
2006 100.0 100.0 100.0 100.0 100.0 100.0 100.0 100.0 100.0
All food items 1995 6.9 6.4 5.6 5.5 5.2 2.8 13.2 5.5 20.5
(SITC 0 + 1 + 22 + 4) 2000 4.7 4.4 3.5 3.6 4.8 2.6 8.8 3.6 15.3
2006 3.8 3.6 3.2 3.3 4.2 2.6 6.4 3.4 7.8
Agricultural raw materials 1995 2.4 2.1 2.2 2.3 1.9 1.3 3.2 1.6 1.0
(SITC 2 - 22 - 27 - 28) 2000 1.4 1.1 1.3 1.4 1.0 0.6 1.7 0.8 0.8
2006 1.3 1.1 1.1 1.2 1.5 0.8 1.6 0.6 0.8
Ores, metals, precious stones 1995 3.1 2.6 2.2 2.1 0.8 1.4 4.8 3.5 4.8
and non-monetary gold 2000 2.7 2.2 2.3 2.1 1.0 1.5 2.8 6.2 1.5
(SITC 27 + 28 + 68 + 667 + 971) 2006 3.8 3.0 3.2 2.8 2.1 1.5 4.2 7.1 1.1
Fuels (SITC 3) 1995 5.8 4.6 2.5 2.5 1.9 0.8 13.2 6.6 1.1
2000 7.1 6.1 5.2 2.3 0.6 1.2 15.6 12.3 1.4
2006 8.3 7.0 5.1 3.6 0.6 1.8 17.3 20.9 0.7
Manufactured goods 1995 80.5 82.8 86.0 86.1 89.2 91.9 64.6 81.9 71.8
(SITC 5 to 8 less 667 and 68) 2000 83.4 85.6 86.7 89.7 92.4 93.8 70.8 76.1 80.4
2006 82.1 84.8 86.7 88.4 91.5 93.0 69.8 67.1 89.3
USA
États-Unis
Economiesin
transition
Économiesen
transition
Year
Année
Destination
World
MondeTotal
Europe
Canada
Developed economies
Économies développées
Japan
Japon
Otherdevelopedcountries
Autreséconomies
développées
2.2.H Export structure by partner and product groupDeveloping economies: Eastern, Southern and South-Eastern Asia
Sources:- Data and UNCTAD secretariat estimates based on UN DESA Comtrade and IMF Direction of Trade statistics databases
100
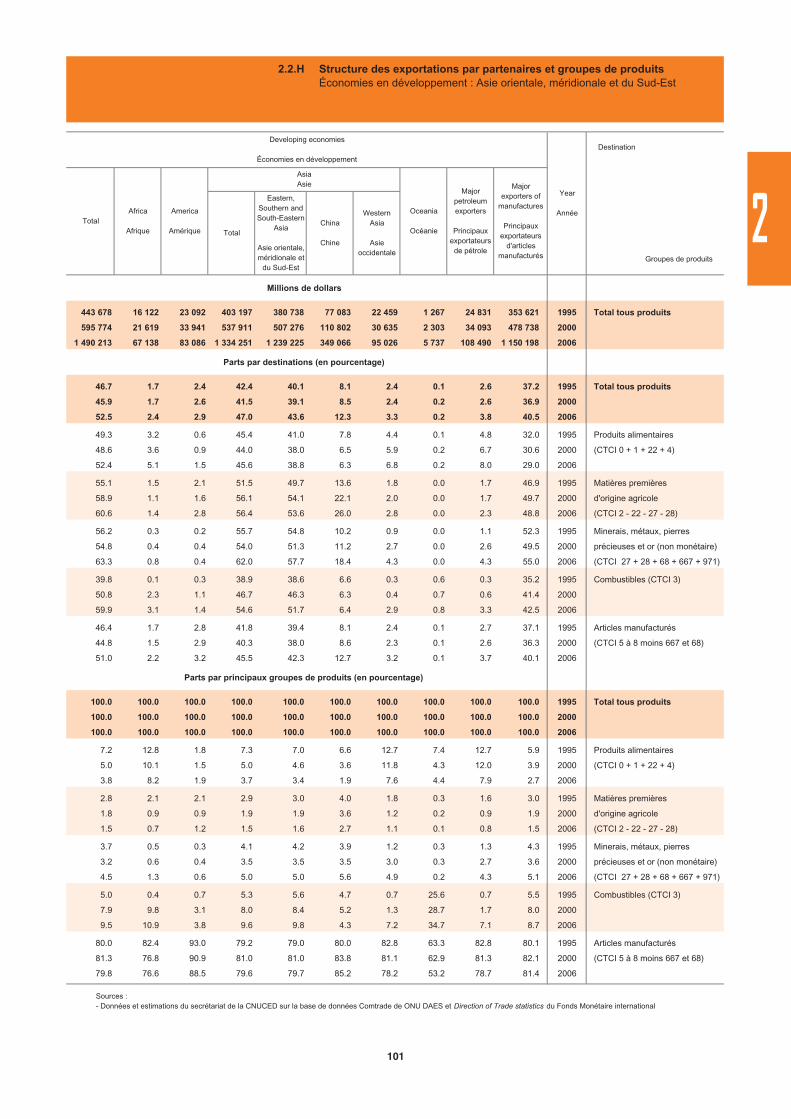
Millions de dollars
443 678 16 122 23 092 403 197 380 738 77 083 22 459 1 267 24 831 353 621 1995 Total tous produits
595 774 21 619 33 941 537 911 507 276 110 802 30 635 2 303 34 093 478 738 2000
1 490 213 67 138 83 086 1 334 251 1 239 225 349 066 95 026 5 737 108 490 1 150 198 2006
Parts par destinations (en pourcentage)
46.7 1.7 2.4 42.4 40.1 8.1 2.4 0.1 2.6 37.2 1995 Total tous produits
45.9 1.7 2.6 41.5 39.1 8.5 2.4 0.2 2.6 36.9 2000
52.5 2.4 2.9 47.0 43.6 12.3 3.3 0.2 3.8 40.5 2006
49.3 3.2 0.6 45.4 41.0 7.8 4.4 0.1 4.8 32.0 1995 Produits alimentaires
48.6 3.6 0.9 44.0 38.0 6.5 5.9 0.2 6.7 30.6 2000 (CTCI 0 + 1 + 22 + 4)
52.4 5.1 1.5 45.6 38.8 6.3 6.8 0.2 8.0 29.0 2006
55.1 1.5 2.1 51.5 49.7 13.6 1.8 0.0 1.7 46.9 1995 Matières premières
58.9 1.1 1.6 56.1 54.1 22.1 2.0 0.0 1.7 49.7 2000 d'origine agricole
60.6 1.4 2.8 56.4 53.6 26.0 2.8 0.0 2.3 48.8 2006 (CTCI 2 - 22 - 27 - 28)
56.2 0.3 0.2 55.7 54.8 10.2 0.9 0.0 1.1 52.3 1995 Minerais, métaux, pierres
54.8 0.4 0.4 54.0 51.3 11.2 2.7 0.0 2.6 49.5 2000 précieuses et or (non monétaire)
63.3 0.8 0.4 62.0 57.7 18.4 4.3 0.0 4.3 55.0 2006 (CTCI 27 + 28 + 68 + 667 + 971)
39.8 0.1 0.3 38.9 38.6 6.6 0.3 0.6 0.3 35.2 1995 Combustibles (CTCI 3)
50.8 2.3 1.1 46.7 46.3 6.3 0.4 0.7 0.6 41.4 2000
59.9 3.1 1.4 54.6 51.7 6.4 2.9 0.8 3.3 42.5 2006
46.4 1.7 2.8 41.8 39.4 8.1 2.4 0.1 2.7 37.1 1995 Articles manufacturés
44.8 1.5 2.9 40.3 38.0 8.6 2.3 0.1 2.6 36.3 2000 (CTCI 5 à 8 moins 667 et 68)
51.0 2.2 3.2 45.5 42.3 12.7 3.2 0.1 3.7 40.1 2006
Parts par principaux groupes de produits (en pourcentage)
100.0 100.0 100.0 100.0 100.0 100.0 100.0 100.0 100.0 100.0 1995 Total tous produits
100.0 100.0 100.0 100.0 100.0 100.0 100.0 100.0 100.0 100.0 2000
100.0 100.0 100.0 100.0 100.0 100.0 100.0 100.0 100.0 100.0 2006
7.2 12.8 1.8 7.3 7.0 6.6 12.7 7.4 12.7 5.9 1995 Produits alimentaires
5.0 10.1 1.5 5.0 4.6 3.6 11.8 4.3 12.0 3.9 2000 (CTCI 0 + 1 + 22 + 4)
3.8 8.2 1.9 3.7 3.4 1.9 7.6 4.4 7.9 2.7 2006
2.8 2.1 2.1 2.9 3.0 4.0 1.8 0.3 1.6 3.0 1995 Matières premières
1.8 0.9 0.9 1.9 1.9 3.6 1.2 0.2 0.9 1.9 2000 d'origine agricole
1.5 0.7 1.2 1.5 1.6 2.7 1.1 0.1 0.8 1.5 2006 (CTCI 2 - 22 - 27 - 28)
3.7 0.5 0.3 4.1 4.2 3.9 1.2 0.3 1.3 4.3 1995 Minerais, métaux, pierres
3.2 0.6 0.4 3.5 3.5 3.5 3.0 0.3 2.7 3.6 2000 précieuses et or (non monétaire)
4.5 1.3 0.6 5.0 5.0 5.6 4.9 0.2 4.3 5.1 2006 (CTCI 27 + 28 + 68 + 667 + 971)
5.0 0.4 0.7 5.3 5.6 4.7 0.7 25.6 0.7 5.5 1995 Combustibles (CTCI 3)
7.9 9.8 3.1 8.0 8.4 5.2 1.3 28.7 1.7 8.0 2000
9.5 10.9 3.8 9.6 9.8 4.3 7.2 34.7 7.1 8.7 2006
80.0 82.4 93.0 79.2 79.0 80.0 82.8 63.3 82.8 80.1 1995 Articles manufacturés
81.3 76.8 90.9 81.0 81.0 83.8 81.1 62.9 81.3 82.1 2000 (CTCI 5 à 8 moins 667 et 68)
79.8 76.6 88.5 79.6 79.7 85.2 78.2 53.2 78.7 81.4 2006
Majorpetroleumexporters
Principauxexportateurs
de pétrole
AsiaAsie
Total
Eastern,Southern and South-Eastern
Asia
Asie orientale, méridionale et
du Sud-Est
China
Chine
WesternAsia
Asieoccidentale
Oceania
OcéanieTotal
Africa
Afrique
America
Amérique
Developing economies
Économies en développement
Groupes de produits
Destination
Year
Année
Majorexporters of
manufactures
Principauxexportateurs
d'articlesmanufacturés
2.2.H Structure des exportations par partenaires et groupes de produitsÉconomies en développement : Asie orientale, méridionale et du Sud-Est
Sources : - Données et estimations du secrétariat de la CNUCED sur la base de données Comtrade de ONU DAES et Direction of Trade statistics du Fonds Monétaire international
2
101

Product group
TotalEU
UE
Millions of dollars
All products 1995 1 001 117 558 665 166 907 152 270 12 063 138 844 213 131 27 719 15 378
2000 1 205 985 566 302 159 944 143 443 11 987 147 806 212 720 33 845 17 073
2006 2 601 990 952 030 304 712 273 340 19 597 216 105 339 228 72 389 42 288
Share by destination (percentage)
All products 1995 100.0 55.8 16.7 15.2 1.2 13.9 21.3 2.8 1.5
2000 100.0 47.0 13.3 11.9 1.0 12.3 17.6 2.8 1.4
2006 100.0 36.6 11.7 10.5 0.8 8.3 13.0 2.8 1.6
All food items 1995 100.0 53.9 13.7 13.2 4.2 23.4 2.9 9.7 0.7
(SITC 0 + 1 + 22 + 4) 2000 100.0 50.3 12.3 11.6 4.2 19.0 2.9 11.9 1.3
2006 100.0 40.1 10.0 9.4 3.1 14.2 2.5 10.3 3.0
Agricultural raw materials 1995 100.0 51.2 7.5 7.2 5.1 23.8 5.5 9.3 4.1
(SITC 2 - 22 - 27 - 28) 2000 100.0 50.7 10.8 10.4 7.3 16.9 5.4 10.4 4.8
2006 100.0 46.4 10.2 9.9 5.6 18.4 4.8 7.5 8.5
Ores, metals, precious stones 1995 100.0 55.1 19.8 14.1 2.6 10.7 8.6 13.5 4.5
and non-monetary gold 2000 100.0 54.2 23.9 16.5 1.4 6.2 8.5 14.2 5.1
(SITC 27 + 28 + 68 + 667 + 971) 2006 100.0 44.9 14.8 8.9 1.7 4.7 7.6 16.1 3.5
Fuels (SITC 3) 1995 100.0 11.7 1.6 1.5 0.6 2.7 2.2 4.5 0.8
2000 100.0 7.3 1.3 0.8 0.2 0.9 0.8 4.0 1.3
2006 100.0 5.8 0.8 0.7 0.2 0.7 0.9 3.1 3.6
Manufactured goods 1995 100.0 60.0 18.4 17.0 0.8 13.7 26.2 1.0 1.3
(SITC 5 to 8 less 667 and 68) 2000 100.0 52.1 14.4 13.3 0.7 13.8 22.4 0.9 1.0
2006 100.0 42.9 14.1 13.2 0.5 9.9 17.6 0.7 0.7
Share by major product group (percentage)
All products 1995 100.0 100.0 100.0 100.0 100.0 100.0 100.0 100.0 100.0
2000 100.0 100.0 100.0 100.0 100.0 100.0 100.0 100.0 100.0
2006 100.0 100.0 100.0 100.0 100.0 100.0 100.0 100.0 100.0
All food items 1995 6.1 5.9 5.0 5.3 21.5 10.3 0.8 21.4 2.9
(SITC 0 + 1 + 22 + 4) 2000 4.9 5.2 4.5 4.7 20.5 7.5 0.8 20.6 4.6
2006 3.8 4.1 3.2 3.4 15.7 6.5 0.7 14.0 6.9
Agricultural raw materials 1995 3.3 3.0 1.5 1.6 14.1 5.7 0.9 11.1 8.8
(SITC 2 - 22 - 27 - 28) 2000 2.6 2.8 2.1 2.2 18.8 3.5 0.8 9.5 8.7
2006 2.1 2.7 1.8 2.0 15.6 4.6 0.8 5.7 11.0
Ores, metals, precious stones 1995 5.8 5.7 6.9 5.4 12.4 4.5 2.3 28.4 16.9
and non-monetary gold 2000 5.6 6.5 10.1 7.8 8.0 2.8 2.7 28.4 20.1
(SITC 27 + 28 + 68 + 667 + 971) 2006 7.9 9.6 9.9 6.7 18.0 4.5 4.6 45.4 16.9
Fuels (SITC 3) 1995 7.0 1.5 0.7 0.7 3.6 1.4 0.7 11.5 3.9
2000 11.7 1.8 1.2 0.8 2.6 0.9 0.5 16.8 11.1
2006 16.0 2.5 1.1 1.1 4.0 1.4 1.1 18.0 35.6
Manufactured goods 1995 76.1 81.8 83.8 84.9 48.0 74.9 93.7 26.5 66.4
(SITC 5 to 8 less 667 and 68) 2000 74.7 82.9 81.1 83.5 49.8 84.0 94.9 22.9 53.3
2006 68.5 80.2 82.7 85.8 46.5 82.0 92.4 16.6 29.3
USA
États-Unis
Economiesin
transition
Économiesen
transition
Year
Année
Destination
World
MondeTotal
Europe
Canada
Developed economies
Économies développées
Japan
Japon
Otherdevelopedcountries
Autreséconomies
développées
2.2.H Import structure by partner and product groupDeveloping economies: Eastern, Southern and South-Eastern Asia
Sources:- Data and UNCTAD secretariat estimates based on UN DESA Comtrade and IMF Direction of Trade statistics databases
102
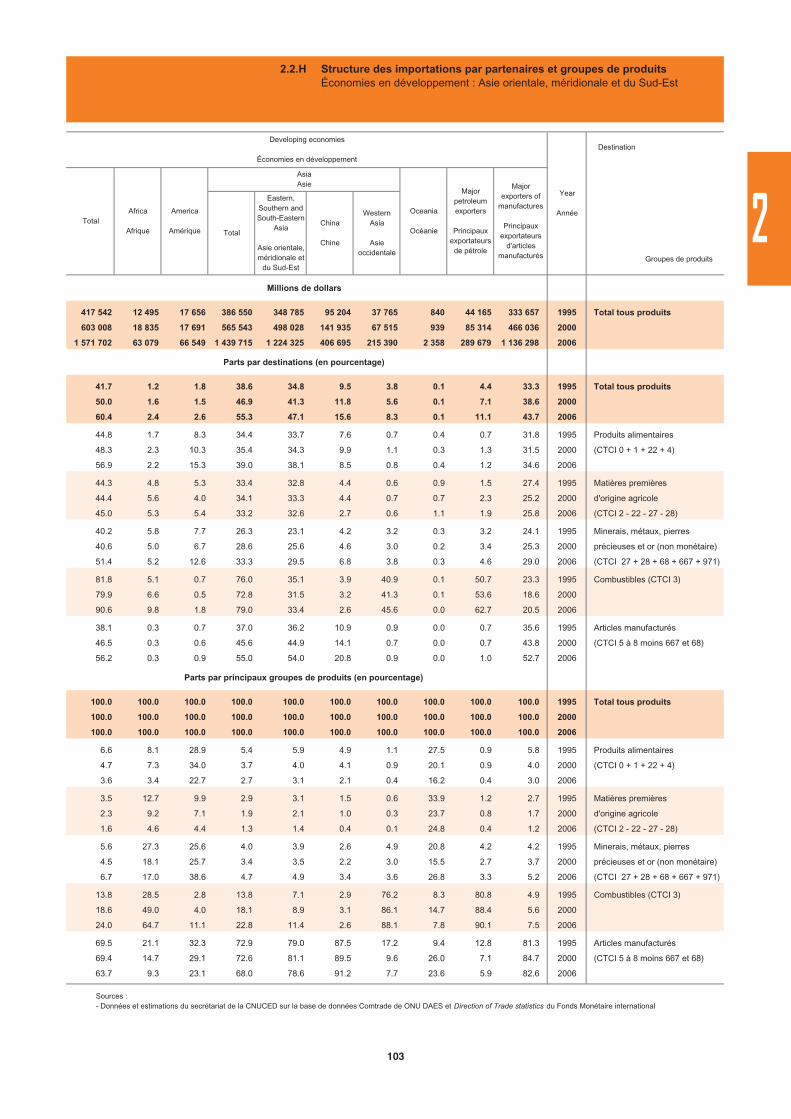
Millions de dollars
417 542 12 495 17 656 386 550 348 785 95 204 37 765 840 44 165 333 657 1995 Total tous produits
603 008 18 835 17 691 565 543 498 028 141 935 67 515 939 85 314 466 036 2000
1 571 702 63 079 66 549 1 439 715 1 224 325 406 695 215 390 2 358 289 679 1 136 298 2006
Parts par destinations (en pourcentage)
41.7 1.2 1.8 38.6 34.8 9.5 3.8 0.1 4.4 33.3 1995 Total tous produits
50.0 1.6 1.5 46.9 41.3 11.8 5.6 0.1 7.1 38.6 2000
60.4 2.4 2.6 55.3 47.1 15.6 8.3 0.1 11.1 43.7 2006
44.8 1.7 8.3 34.4 33.7 7.6 0.7 0.4 0.7 31.8 1995 Produits alimentaires
48.3 2.3 10.3 35.4 34.3 9.9 1.1 0.3 1.3 31.5 2000 (CTCI 0 + 1 + 22 + 4)
56.9 2.2 15.3 39.0 38.1 8.5 0.8 0.4 1.2 34.6 2006
44.3 4.8 5.3 33.4 32.8 4.4 0.6 0.9 1.5 27.4 1995 Matières premières
44.4 5.6 4.0 34.1 33.3 4.4 0.7 0.7 2.3 25.2 2000 d'origine agricole
45.0 5.3 5.4 33.2 32.6 2.7 0.6 1.1 1.9 25.8 2006 (CTCI 2 - 22 - 27 - 28)
40.2 5.8 7.7 26.3 23.1 4.2 3.2 0.3 3.2 24.1 1995 Minerais, métaux, pierres
40.6 5.0 6.7 28.6 25.6 4.6 3.0 0.2 3.4 25.3 2000 précieuses et or (non monétaire)
51.4 5.2 12.6 33.3 29.5 6.8 3.8 0.3 4.6 29.0 2006 (CTCI 27 + 28 + 68 + 667 + 971)
81.8 5.1 0.7 76.0 35.1 3.9 40.9 0.1 50.7 23.3 1995 Combustibles (CTCI 3)
79.9 6.6 0.5 72.8 31.5 3.2 41.3 0.1 53.6 18.6 2000
90.6 9.8 1.8 79.0 33.4 2.6 45.6 0.0 62.7 20.5 2006
38.1 0.3 0.7 37.0 36.2 10.9 0.9 0.0 0.7 35.6 1995 Articles manufacturés
46.5 0.3 0.6 45.6 44.9 14.1 0.7 0.0 0.7 43.8 2000 (CTCI 5 à 8 moins 667 et 68)
56.2 0.3 0.9 55.0 54.0 20.8 0.9 0.0 1.0 52.7 2006
Parts par principaux groupes de produits (en pourcentage)
100.0 100.0 100.0 100.0 100.0 100.0 100.0 100.0 100.0 100.0 1995 Total tous produits
100.0 100.0 100.0 100.0 100.0 100.0 100.0 100.0 100.0 100.0 2000
100.0 100.0 100.0 100.0 100.0 100.0 100.0 100.0 100.0 100.0 2006
6.6 8.1 28.9 5.4 5.9 4.9 1.1 27.5 0.9 5.8 1995 Produits alimentaires
4.7 7.3 34.0 3.7 4.0 4.1 0.9 20.1 0.9 4.0 2000 (CTCI 0 + 1 + 22 + 4)
3.6 3.4 22.7 2.7 3.1 2.1 0.4 16.2 0.4 3.0 2006
3.5 12.7 9.9 2.9 3.1 1.5 0.6 33.9 1.2 2.7 1995 Matières premières
2.3 9.2 7.1 1.9 2.1 1.0 0.3 23.7 0.8 1.7 2000 d'origine agricole
1.6 4.6 4.4 1.3 1.4 0.4 0.1 24.8 0.4 1.2 2006 (CTCI 2 - 22 - 27 - 28)
5.6 27.3 25.6 4.0 3.9 2.6 4.9 20.8 4.2 4.2 1995 Minerais, métaux, pierres
4.5 18.1 25.7 3.4 3.5 2.2 3.0 15.5 2.7 3.7 2000 précieuses et or (non monétaire)
6.7 17.0 38.6 4.7 4.9 3.4 3.6 26.8 3.3 5.2 2006 (CTCI 27 + 28 + 68 + 667 + 971)
13.8 28.5 2.8 13.8 7.1 2.9 76.2 8.3 80.8 4.9 1995 Combustibles (CTCI 3)
18.6 49.0 4.0 18.1 8.9 3.1 86.1 14.7 88.4 5.6 2000
24.0 64.7 11.1 22.8 11.4 2.6 88.1 7.8 90.1 7.5 2006
69.5 21.1 32.3 72.9 79.0 87.5 17.2 9.4 12.8 81.3 1995 Articles manufacturés
69.4 14.7 29.1 72.6 81.1 89.5 9.6 26.0 7.1 84.7 2000 (CTCI 5 à 8 moins 667 et 68)
63.7 9.3 23.1 68.0 78.6 91.2 7.7 23.6 5.9 82.6 2006
Majorpetroleumexporters
Principauxexportateurs
de pétrole
AsiaAsie
Total
Eastern,Southern and South-Eastern
Asia
Asie orientale, méridionale et
du Sud-Est
China
Chine
WesternAsia
Asieoccidentale
Oceania
OcéanieTotal
Africa
Afrique
America
Amérique
Developing economies
Économies en développement
Groupes de produits
Destination
Year
Année
Majorexporters of
manufactures
Principauxexportateurs
d'articlesmanufacturés
2.2.H Structure des importations par partenaires et groupes de produitsÉconomies en développement : Asie orientale, méridionale et du Sud-Est
Sources : - Données et estimations du secrétariat de la CNUCED sur la base de données Comtrade de ONU DAES et Direction of Trade statistics du Fonds Monétaire international
2
103

Product group
TotalEU
UE
Millions of dollars
All products 1995 133 143 58 849 25 126 24 780 526 10 640 21 388 1 169 2 640
2000 219 703 110 016 44 881 44 378 922 31 161 31 342 1 710 2 724
2006 613 984 274 919 107 897 104 254 3 854 58 282 100 230 4 656 9 447
Share by destination (percentage)
All products 1995 100.0 44.2 18.9 18.6 0.4 8.0 16.1 0.9 2.0
2000 100.0 50.1 20.4 20.2 0.4 14.2 14.3 0.8 1.2
2006 100.0 44.8 17.6 17.0 0.6 9.5 16.3 0.8 1.5
All food items 1995 100.0 39.5 32.5 31.3 0.4 4.7 1.0 0.9 9.6
(SITC 0 + 1 + 22 + 4) 2000 100.0 36.6 28.2 27.1 0.4 3.9 1.3 2.7 7.2
2006 100.0 29.7 24.9 23.9 0.4 2.5 0.8 1.1 5.8
Agricultural raw materials 1995 100.0 50.1 44.7 43.8 0.1 2.0 1.5 1.8 0.5
(SITC 2 - 22 - 27 - 28) 2000 100.0 44.5 38.8 37.9 0.2 1.6 2.1 1.8 0.9
2006 100.0 18.7 16.9 16.6 0.1 0.6 0.7 0.3 1.1
Ores, metals, precious stones 1995 100.0 33.0 18.1 17.5 0.1 2.3 11.9 0.6 1.1
and non-monetary gold 2000 100.0 42.0 25.5 23.1 0.3 6.1 8.1 2.0 1.8
(SITC 27 + 28 + 68 + 667 + 971) 2006 100.0 25.7 22.6 13.9 0.0 0.9 2.0 0.2 0.8
Fuels (SITC 3) 1995 .. .. .. .. .. .. .. .. ..
2000 100.0 50.2 15.6 15.6 0.4 15.7 18.4 0.2 0.2
2006 100.0 48.4 10.8 10.8 0.8 12.2 24.1 0.4 0.0
Manufactured goods 1995 100.0 46.9 36.9 36.2 0.3 7.1 1.4 1.2 5.9
(SITC 5 to 8 less 667 and 68) 2000 100.0 52.4 37.9 37.3 0.6 10.8 0.2 2.8 4.7
2006 100.0 38.0 30.7 30.0 0.2 5.2 0.4 1.5 4.9
Share by major product group (percentage)
All products 1995 100.0 100.0 100.0 100.0 100.0 100.0 100.0 100.0 100.0
2000 100.0 100.0 100.0 100.0 100.0 100.0 100.0 100.0 100.0
2006 100.0 100.0 100.0 100.0 100.0 100.0 100.0 100.0 100.0
All food items 1995 5.4 4.8 9.2 9.0 5.2 3.1 0.3 5.7 26.0
(SITC 0 + 1 + 22 + 4) 2000 3.0 2.2 4.1 4.0 2.6 0.8 0.3 10.5 17.3
2006 2.4 1.6 3.4 3.4 1.4 0.6 0.1 3.6 9.2
Agricultural raw materials 1995 0.6 0.7 1.4 1.4 0.2 0.1 0.1 1.2 0.2
(SITC 2 - 22 - 27 - 28) 2000 0.3 0.3 0.6 0.6 0.1 0.0 0.0 0.7 0.2
2006 0.2 0.1 0.2 0.2 0.0 0.0 0.0 0.1 0.1
Ores, metals, precious stones 1995 2.9 2.2 2.8 2.8 0.5 0.8 2.2 2.2 1.7
and non-monetary gold 2000 1.6 1.4 2.0 1.9 1.0 0.7 0.9 4.1 2.4
(SITC 27 + 28 + 68 + 667 + 971) 2006 3.1 1.8 4.0 2.6 0.1 0.3 0.4 0.9 1.6
Fuels (SITC 3) 1995 66.9 66.6 39.5 40.0 77.8 73.3 95.3 57.0 1.3
2000 76.2 76.4 58.2 58.7 69.3 84.1 98.4 16.3 9.3
2006 66.9 72.3 41.3 42.5 86.9 86.0 98.9 36.0 0.3
Manufactured goods 1995 24.0 25.5 47.0 46.7 16.2 21.3 2.1 33.9 70.9
(SITC 5 to 8 less 667 and 68) 2000 18.6 19.4 34.5 34.3 26.4 14.2 0.3 68.0 69.7
2006 16.1 13.7 28.1 28.5 5.8 8.8 0.4 32.5 50.8
Year
Année
Destination
World
MondeTotal
Europe
Canada
Developed economies
Économies développées
Japan
Japon
Otherdevelopedcountries
Autreséconomies
développées
USA
États-Unis
Economiesin
transition
Économiesen
transition
2.2.I Export structure by partner and product groupDeveloping economies: Western Asia
Sources:- Data and UNCTAD secretariat estimates based on UN DESA Comtrade and IMF Direction of Trade statistics databases
104

Millions de dollars
32 535 3 098 386 29 050 18 218 1 594 10 832 1 10 950 16 044 1995 Total tous produits
83 391 7 443 1 871 74 068 59 867 5 213 14 202 8 10 492 58 133 2000
261 127 22 915 3 831 234 274 178 350 20 509 55 924 107 59 920 158 464 2006
Parts par destinations (en pourcentage)
24.4 2.3 0.3 21.8 13.7 1.2 8.1 0.0 8.2 12.1 1995 Total tous produits
38.0 3.4 0.9 33.7 27.2 2.4 6.5 0.0 4.8 26.5 2000
42.5 3.7 0.6 38.2 29.0 3.3 9.1 0.0 9.8 25.8 2006
49.7 5.3 0.6 43.8 7.1 0.1 36.7 0.0 38.4 2.7 1995 Produits alimentaires
52.7 6.0 0.8 45.9 9.9 0.3 36.0 0.0 32.1 4.0 2000 (CTCI 0 + 1 + 22 + 4)
63.6 7.9 0.4 55.3 11.0 0.3 44.3 0.0 45.3 3.1 2006
48.1 12.0 0.3 35.8 21.2 2.8 14.5 0.0 12.7 19.3 1995 Matières premières
47.1 6.8 0.3 40.0 19.2 1.3 20.8 0.0 10.5 20.3 2000 d'origine agricole
76.4 9.6 0.0 66.7 30.1 6.3 36.7 0.0 34.8 23.8 2006 (CTCI 2 - 22 - 27 - 28)
63.4 2.5 0.2 60.6 41.4 1.9 19.3 0.0 17.4 36.1 1995 Minerais, métaux, pierres
54.6 3.0 0.2 51.4 34.2 1.8 17.2 0.0 14.7 30.4 2000 précieuses et or (non monétaire)
71.4 1.9 0.1 69.5 55.8 3.0 13.7 0.0 12.4 51.7 2006 (CTCI 27 + 28 + 68 + 667 + 971)
.. .. .. .. .. .. .. .. .. .. 1995 Combustibles (CTCI 3)
37.0 2.5 0.9 33.6 31.3 2.9 2.3 0.0 0.4 31.7 2000
42.1 2.3 0.7 39.1 35.2 4.2 3.9 0.0 2.9 32.9 2006
44.3 6.2 0.4 37.7 19.0 1.3 18.8 0.0 21.6 14.3 1995 Articles manufacturés
37.6 6.5 0.7 30.4 13.0 0.5 17.4 0.0 17.2 8.6 2000 (CTCI 5 à 8 moins 667 et 68)
54.5 8.7 0.2 45.6 18.5 2.3 27.1 0.0 34.4 10.5 2006
Parts par principaux groupes de produits (en pourcentage)
100.0 100.0 100.0 100.0 100.0 100.0 100.0 100.0 100.0 100.0 1995 Total tous produits
100.0 100.0 100.0 100.0 100.0 100.0 100.0 100.0 100.0 100.0 2000
100.0 100.0 100.0 100.0 100.0 100.0 100.0 100.0 100.0 100.0 2006
10.9 12.3 11.9 10.7 2.8 0.5 24.1 5.2 25.0 1.2 1995 Produits alimentaires
4.2 5.3 2.7 4.1 1.1 0.4 16.7 0.3 20.1 0.5 2000 (CTCI 0 + 1 + 22 + 4)
3.6 5.1 1.7 3.5 0.9 0.2 11.7 0.7 11.2 0.3 2006
1.2 3.1 0.6 1.0 0.9 1.4 1.1 4.5 0.9 1.0 1995 Matières premières
0.4 0.6 0.1 0.4 0.2 0.2 1.0 0.0 0.7 0.2 2000 d'origine agricole
0.3 0.5 0.0 0.3 0.2 0.4 0.8 0.0 0.7 0.2 2006 (CTCI 2 - 22 - 27 - 28)
7.6 3.2 2.3 8.1 8.8 4.7 6.9 7.6 6.2 8.8 1995 Minerais, métaux, pierres
2.3 1.4 0.4 2.5 2.0 1.2 4.3 0.1 5.0 1.9 2000 précieuses et or (non monétaire)
5.3 1.6 0.4 5.7 6.0 2.8 4.7 0.5 4.0 6.3 2006 (CTCI 27 + 28 + 68 + 667 + 971)
36.6 17.7 49.6 38.4 54.0 68.2 12.4 0.0 4.7 60.4 1995 Combustibles (CTCI 3)
74.4 56.3 82.4 76.0 87.6 94.5 27.0 0.0 6.1 91.3 2000
66.2 41.8 72.6 68.6 81.1 83.4 28.7 0.0 20.0 85.3 2006
43.5 63.5 35.6 41.5 33.3 25.2 55.4 82.7 63.2 28.4 1995 Articles manufacturés
18.4 35.9 14.3 16.7 8.8 3.7 50.0 99.6 66.9 6.0 2000 (CTCI 5 à 8 moins 667 et 68)
20.6 37.4 5.3 19.3 10.3 11.2 47.9 2.1 56.8 6.6 2006
Groupes de produits
Destination
Year
Année
Majorexporters of
manufactures
Principauxexportateurs
d'articlesmanufacturés
Developing economies
Économies en développement
TotalAfrica
Afrique
America
Amérique
Majorpetroleumexporters
Principauxexportateurs
de pétrole
AsiaAsie
Total
Eastern,Southern and South-Eastern
Asia
Asie orientale, méridionale et
du Sud-Est
China
Chine
WesternAsia
Asieoccidentale
Oceania
Océanie
2.2.I Structure des exportations par partenaires et groupes de produitsÉconomies en développement : Asie occidentale
Sources : - Données et estimations du secrétariat de la CNUCED sur la base de données Comtrade de ONU DAES et Direction of Trade statistics du Fonds Monétaire international
2
105

Product group
TotalEU
UE
Millions of dollars
All products 1995 120 042 77 255 51 597 48 102 967 14 873 8 264 1 554 4 456
2000 153 116 95 341 64 535 60 958 1 160 14 621 10 017 5 009 7 122
2006 389 004 189 052 136 321 125 824 2 183 23 380 20 563 6 605 28 840
Share by destination (percentage)
All products 1995 100.0 64.4 43.0 40.1 0.8 12.4 6.9 1.3 3.7
2000 100.0 62.3 42.1 39.8 0.8 9.5 6.5 3.3 4.7
2006 100.0 48.6 35.0 32.3 0.6 6.0 5.3 1.7 7.4
All food items 1995 100.0 51.6 32.5 31.6 0.6 13.9 0.2 4.5 2.7
(SITC 0 + 1 + 22 + 4) 2000 100.0 50.1 28.0 27.1 1.3 12.5 0.1 8.1 1.5
2006 100.0 36.0 21.1 19.5 1.0 6.9 0.1 6.9 4.5
Agricultural raw materials 1995 100.0 54.5 33.2 32.5 2.7 10.8 0.9 6.9 16.4
(SITC 2 - 22 - 27 - 28) 2000 100.0 59.2 36.6 36.2 1.7 14.9 0.6 5.4 13.8
2006 100.0 57.0 36.9 36.5 1.8 15.9 0.4 2.1 12.4
Ores, metals, precious stones 1995 100.0 67.7 52.9 35.7 2.4 8.5 0.3 3.5 4.9
and non-monetary gold 2000 100.0 50.8 40.4 25.6 0.4 2.6 0.9 6.6 14.4
(SITC 27 + 28 + 68 + 667 + 971) 2006 100.0 35.7 28.4 15.1 0.6 3.6 0.5 2.6 15.2
Fuels (SITC 3) 1995 100.0 13.3 8.7 8.7 0.2 3.1 0.0 1.3 11.4
2000 100.0 21.4 14.0 12.1 0.3 1.9 0.0 5.1 12.3
2006 100.0 18.8 15.7 13.1 0.1 2.5 0.1 0.5 22.8
Manufactured goods 1995 100.0 71.1 47.4 44.8 0.7 13.3 9.3 0.4 2.7
(SITC 5 to 8 less 667 and 68) 2000 100.0 70.8 48.6 46.7 0.7 10.3 9.0 2.0 2.4
2006 100.0 55.8 39.1 37.0 0.5 7.2 7.9 1.1 2.8
Share by major product group (percentage)
All products 1995 100.0 100.0 100.0 100.0 100.0 100.0 100.0 100.0 100.0
2000 100.0 100.0 100.0 100.0 100.0 100.0 100.0 100.0 100.0
2006 100.0 100.0 100.0 100.0 100.0 100.0 100.0 100.0 100.0
All food items 1995 12.8 10.3 9.7 10.1 9.9 14.3 0.3 44.5 9.2
(SITC 0 + 1 + 22 + 4) 2000 12.3 9.9 8.2 8.3 21.6 16.1 0.2 30.3 3.9
2006 7.5 5.6 4.5 4.5 12.9 8.6 0.2 30.4 4.5
Agricultural raw materials 1995 2.5 2.2 2.0 2.1 8.7 2.2 0.3 13.7 11.3
(SITC 2 - 22 - 27 - 28) 2000 2.0 1.9 1.7 1.8 4.5 3.1 0.2 3.3 5.9
2006 1.3 1.5 1.3 1.4 3.9 3.3 0.1 1.5 2.1
Ores, metals, precious stones 1995 4.9 5.2 6.1 4.4 14.7 3.4 0.2 13.5 6.5
and non-monetary gold 2000 4.5 3.7 4.3 2.9 2.2 1.2 0.6 9.1 14.0
(SITC 27 + 28 + 68 + 667 + 971) 2006 7.0 5.2 5.7 3.3 7.3 4.3 0.7 10.6 14.5
Fuels (SITC 3) 1995 6.3 1.3 1.3 1.4 1.2 1.6 0.0 6.5 19.4
2000 7.9 2.7 2.6 2.4 3.6 1.6 0.1 12.3 20.9
2006 5.8 2.3 2.6 2.4 0.9 2.4 0.1 1.8 17.9
Manufactured goods 1995 72.7 80.4 80.3 81.3 65.1 78.0 98.7 20.7 53.5
(SITC 5 to 8 less 667 and 68) 2000 71.5 81.3 82.5 83.9 67.6 77.4 98.7 44.8 37.1
2006 59.6 68.4 66.5 68.2 54.2 71.0 89.0 39.0 22.3
Year
Année
Destination
World
MondeTotal
Europe
Canada
Developed economies
Économies développées
Japan
Japon
Otherdevelopedcountries
Autreséconomies
développées
USA
États-Unis
Economiesin
transition
Économiesen
transition
2.2.I Import structure by partner and product groupDeveloping economies: Western Asia
Sources:- Data and UNCTAD secretariat estimates based on UN DESA Comtrade and IMF Direction of Trade statistics databases
106

Millions de dollars
37 406 2 999 2 270 32 132 19 907 3 069 12 225 5 12 298 19 112 1995 Total tous produits
48 349 4 761 2 944 40 640 26 561 6 324 14 079 4 16 263 24 583 2000
145 898 13 091 8 198 124 600 88 383 29 432 36 217 9 41 910 84 881 2006
Parts par destinations (en pourcentage)
31.2 2.5 1.9 26.8 16.6 2.6 10.2 0.0 10.2 15.9 1995 Total tous produits
31.6 3.1 1.9 26.5 17.3 4.1 9.2 0.0 10.6 16.1 2000
37.5 3.4 2.1 32.0 22.7 7.6 9.3 0.0 10.8 21.8 2006
45.5 4.9 7.3 33.2 18.1 1.1 15.1 0.0 12.8 20.2 1995 Produits alimentaires
47.9 5.5 7.5 34.9 20.7 1.4 14.2 0.0 15.1 17.4 2000 (CTCI 0 + 1 + 22 + 4)
56.9 6.3 12.2 38.4 19.6 1.9 18.8 0.0 17.8 22.9 2006
28.5 5.7 3.5 19.4 15.2 0.5 4.2 0.0 6.2 12.1 1995 Matières premières
26.3 5.3 3.0 18.1 13.2 0.8 4.8 0.0 5.6 11.1 2000 d'origine agricole
28.8 4.2 4.2 20.5 15.9 3.1 4.6 0.0 4.5 13.1 2006 (CTCI 2 - 22 - 27 - 28)
26.5 4.5 4.2 17.8 5.5 0.4 12.4 0.0 12.3 7.7 1995 Minerais, métaux, pierres
34.2 5.5 8.3 20.4 9.2 0.9 11.1 0.0 11.8 13.4 2000 précieuses et or (non monétaire)
45.6 9.8 1.9 33.9 24.1 1.6 9.8 0.0 11.6 24.3 2006 (CTCI 27 + 28 + 68 + 667 + 971)
75.1 13.9 0.1 61.0 10.9 0.3 50.1 0.0 70.4 1.5 1995 Combustibles (CTCI 3)
56.0 12.9 0.3 42.8 7.2 0.3 35.6 0.0 53.6 1.0 2000
33.6 5.8 0.6 27.2 5.0 1.2 22.2 0.0 25.8 5.0 2006
25.4 0.8 0.9 23.7 17.7 3.2 6.0 0.0 4.6 17.2 1995 Articles manufacturés
26.0 0.8 0.8 24.4 18.9 5.4 5.6 0.0 4.7 18.1 2000 (CTCI 5 à 8 moins 667 et 68)
37.8 1.2 0.9 35.8 27.3 11.7 8.5 0.0 6.8 27.3 2006
Parts par principaux groupes de produits (en pourcentage)
100.0 100.0 100.0 100.0 100.0 100.0 100.0 100.0 100.0 100.0 1995 Total tous produits
100.0 100.0 100.0 100.0 100.0 100.0 100.0 100.0 100.0 100.0 2000
100.0 100.0 100.0 100.0 100.0 100.0 100.0 100.0 100.0 100.0 2006
18.7 25.4 49.8 15.9 14.0 5.4 19.0 84.7 16.1 16.3 1995 Produits alimentaires
18.6 21.8 47.6 16.1 14.6 4.3 18.9 3.0 17.5 13.3 2000 (CTCI 0 + 1 + 22 + 4)
11.4 14.0 43.6 9.0 6.5 1.9 15.1 0.8 12.4 7.9 2006
2.3 5.8 4.7 1.8 2.3 0.5 1.0 0.0 1.6 1.9 1995 Matières premières
1.7 3.4 3.1 1.4 1.5 0.4 1.0 6.8 1.1 1.4 2000 d'origine agricole
1.0 1.6 2.5 0.8 0.9 0.5 0.6 0.1 0.5 0.7 2006 (CTCI 2 - 22 - 27 - 28)
4.2 8.8 11.0 3.3 1.6 0.8 6.0 3.7 5.9 2.4 1995 Minerais, métaux, pierres
4.9 8.0 19.7 3.5 2.4 1.0 5.5 9.1 5.0 3.8 2000 précieuses et or (non monétaire)
8.6 20.5 6.3 7.5 7.5 1.5 7.4 0.0 7.6 7.8 2006 (CTCI 27 + 28 + 68 + 667 + 971)
15.3 35.3 0.4 14.4 4.2 0.8 31.2 0.0 43.5 0.6 1995 Combustibles (CTCI 3)
14.0 32.9 1.3 12.8 3.3 0.5 30.6 0.0 39.9 0.5 2000
5.2 10.1 1.6 5.0 1.3 0.9 13.9 0.0 14.0 1.3 2006
59.3 24.4 34.1 64.3 77.5 92.3 42.8 11.7 32.8 78.5 1995 Articles manufacturés
59.0 18.9 28.1 65.9 77.8 93.4 43.4 81.1 31.9 80.6 2000 (CTCI 5 à 8 moins 667 et 68)
60.1 21.1 24.9 66.6 71.7 92.0 54.1 31.0 37.7 74.6 2006
Groupes de produits
Destination
Year
Année
Majorexporters of
manufactures
Principauxexportateurs
d'articlesmanufacturés
Developing economies
Économies en développement
TotalAfrica
Afrique
America
Amérique
Majorpetroleumexporters
Principauxexportateurs
de pétrole
AsiaAsie
Total
Eastern,Southern and South-Eastern
Asia
Asie orientale, méridionale et
du Sud-Est
China
Chine
WesternAsia
Asieoccidentale
Oceania
Océanie
2.2.I Structure des importations par partenaires et groupes de produitsÉconomies en développement : Asie occidentale
Sources : - Données et estimations du secrétariat de la CNUCED sur la base de données Comtrade de ONU DAES et Direction of Trade statistics du Fonds Monétaire international
2
107

Product group
TotalEU
UE
Millions of dollars
All products 1995 5 339 4 474 1 135 1 132 32 234 1 914 1 158 2
2000 4 339 1 621 564 558 4 229 522 302 6
2006 7 820 5 734 1 871 1 843 11 276 1 042 2 534 12
Share by destination (percentage)
All products 1995 100.0 83.8 21.3 21.2 0.6 4.4 35.9 21.7 0.0
2000 .. .. .. .. .. .. .. .. ..
2006 100.0 73.3 23.9 23.6 0.1 3.5 13.3 32.4 0.1
All food items 1995 100.0 80.1 51.2 51.2 2.5 5.1 13.4 7.8 0.1
(SITC 0 + 1 + 22 + 4) 2000 100.0 52.2 27.4 27.3 0.2 10.4 8.2 6.0 0.1
2006 100.0 74.5 37.9 37.7 0.6 14.6 13.3 8.1 0.3
Agricultural raw materials 1995 100.0 61.8 1.9 1.9 0.0 0.3 58.0 1.6 0.0
(SITC 2 - 22 - 27 - 28) 2000 100.0 45.6 6.0 5.9 0.0 2.2 29.7 7.7 0.0
2006 100.0 17.2 2.3 2.3 0.1 1.9 9.5 3.4 0.0
Ores, metals, precious stones 1995 100.0 87.3 16.0 16.0 0.0 2.4 40.6 28.3 0.0
and non-monetary gold 2000 .. .. .. .. .. .. .. .. ..
(SITC 27 + 28 + 68 + 667 + 971) 2006 100.0 79.8 14.8 14.8 0.0 0.2 22.9 41.8 0.2
Fuels (SITC 3) 1995 100.0 88.9 0.0 0.0 0.0 3.5 1.9 83.4 0.0
2000 .. .. .. .. .. .. .. .. ..
2006 100.0 84.6 0.1 0.1 0.0 1.3 6.4 76.8 0.0
Manufactured goods 1995 100.0 86.6 30.6 30.5 0.4 10.6 31.1 13.9 0.1
(SITC 5 to 8 less 667 and 68) 2000 100.0 66.0 20.7 20.7 0.2 12.1 17.8 15.2 0.2
2006 100.0 71.5 54.6 53.3 0.2 2.7 6.6 7.4 0.0
Share by major product group (percentage)
All products 1995 100.0 100.0 100.0 100.0 100.0 100.0 100.0 100.0 100.0
2000 100.0 100.0 100.0 100.0 100.0 100.0 100.0 100.0 100.0
2006 100.0 100.0 100.0 100.0 100.0 100.0 100.0 100.0 100.0
All food items 1995 20.4 19.5 49.3 49.4 86.0 23.8 7.7 7.4 42.1
(SITC 0 + 1 + 22 + 4) 2000 15.6 21.8 32.9 33.1 28.8 30.6 10.7 13.5 7.2
2006 15.6 15.9 24.8 25.0 62.8 64.5 15.6 3.9 34.6
Agricultural raw materials 1995 12.5 9.2 1.1 1.1 0.2 0.8 20.2 0.9 0.0
(SITC 2 - 22 - 27 - 28) 2000 2.9 3.6 1.4 1.4 0.6 1.2 7.3 3.3 0.9
2006 7.4 1.7 0.7 0.7 3.0 3.9 5.3 0.8 0.7
Ores, metals, precious stones 1995 26.4 27.5 19.9 19.9 0.4 14.3 29.9 34.5 0.4
and non-monetary gold 2000 39.3 30.2 26.0 25.5 20.1 10.6 45.4 26.8 46.6
(SITC 27 + 28 + 68 + 667 + 971) 2006 32.1 34.9 19.9 20.2 2.4 1.9 55.1 41.4 53.9
Fuels (SITC 3) 1995 11.6 12.2 0.0 0.0 0.1 9.3 0.6 44.4 0.0
2000 16.5 0.2 0.0 0.0 0.0 0.0 0.0 1.2 0.0
2006 20.4 23.5 0.1 0.1 0.7 7.6 9.9 48.2 3.4
Manufactured goods 1995 19.9 20.6 28.7 28.6 13.1 48.0 17.3 12.8 57.5
(SITC 5 to 8 less 667 and 68) 2000 24.7 43.7 39.4 39.8 44.1 56.6 36.6 54.1 45.2
2006 23.9 23.3 54.4 53.9 30.2 17.9 11.9 5.5 7.1
USA
États-Unis
Economiesin
transition
Économiesen
transition
Year
Année
Destination
World
MondeTotal
Europe
Canada
Developed economies
Économies développées
Japan
Japon
Otherdevelopedcountries
Autreséconomies
développées
2.2.J Export structure by partner and product groupDeveloping economies: Oceania
Sources:- Data and UNCTAD secretariat estimates based on UN DESA Comtrade and IMF Direction of Trade statistics databases
108
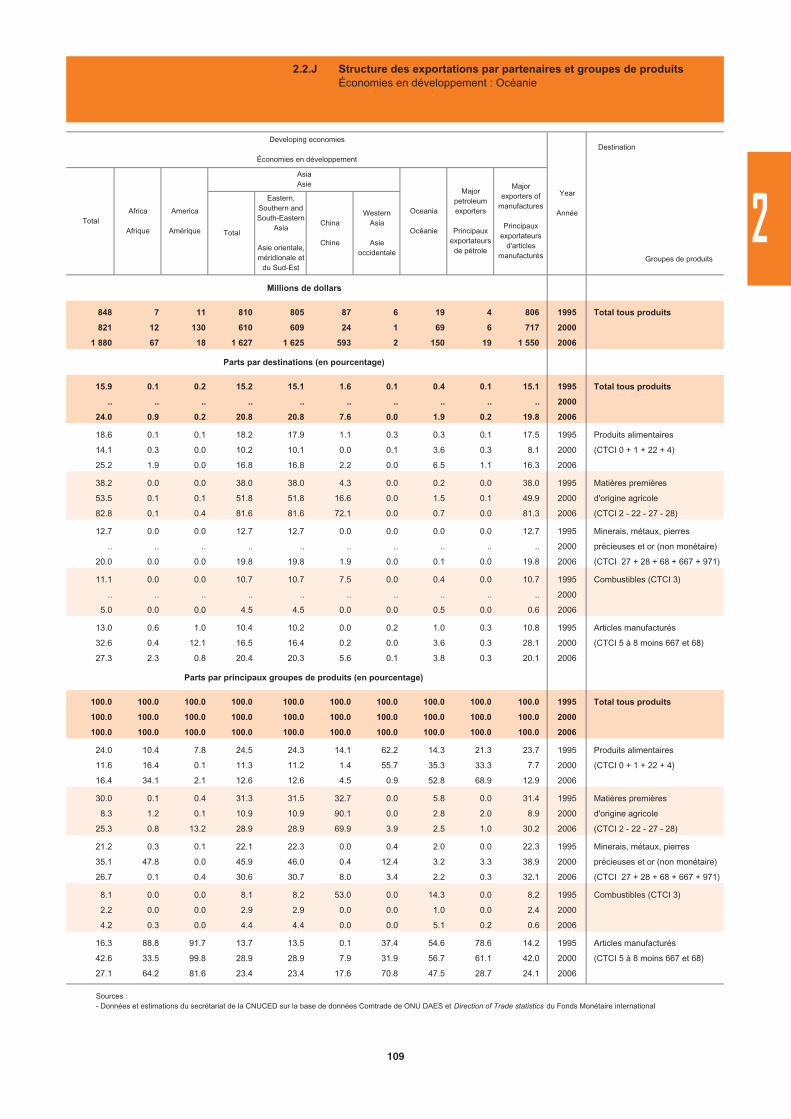
Millions de dollars
848 7 11 810 805 87 6 19 4 806 1995 Total tous produits
821 12 130 610 609 24 1 69 6 717 2000
1 880 67 18 1 627 1 625 593 2 150 19 1 550 2006
Parts par destinations (en pourcentage)
15.9 0.1 0.2 15.2 15.1 1.6 0.1 0.4 0.1 15.1 1995 Total tous produits
.. .. .. .. .. .. .. .. .. .. 2000
24.0 0.9 0.2 20.8 20.8 7.6 0.0 1.9 0.2 19.8 2006
18.6 0.1 0.1 18.2 17.9 1.1 0.3 0.3 0.1 17.5 1995 Produits alimentaires
14.1 0.3 0.0 10.2 10.1 0.0 0.1 3.6 0.3 8.1 2000 (CTCI 0 + 1 + 22 + 4)
25.2 1.9 0.0 16.8 16.8 2.2 0.0 6.5 1.1 16.3 2006
38.2 0.0 0.0 38.0 38.0 4.3 0.0 0.2 0.0 38.0 1995 Matières premières
53.5 0.1 0.1 51.8 51.8 16.6 0.0 1.5 0.1 49.9 2000 d'origine agricole
82.8 0.1 0.4 81.6 81.6 72.1 0.0 0.7 0.0 81.3 2006 (CTCI 2 - 22 - 27 - 28)
12.7 0.0 0.0 12.7 12.7 0.0 0.0 0.0 0.0 12.7 1995 Minerais, métaux, pierres
.. .. .. .. .. .. .. .. .. .. 2000 précieuses et or (non monétaire)
20.0 0.0 0.0 19.8 19.8 1.9 0.0 0.1 0.0 19.8 2006 (CTCI 27 + 28 + 68 + 667 + 971)
11.1 0.0 0.0 10.7 10.7 7.5 0.0 0.4 0.0 10.7 1995 Combustibles (CTCI 3)
.. .. .. .. .. .. .. .. .. .. 2000
5.0 0.0 0.0 4.5 4.5 0.0 0.0 0.5 0.0 0.6 2006
13.0 0.6 1.0 10.4 10.2 0.0 0.2 1.0 0.3 10.8 1995 Articles manufacturés
32.6 0.4 12.1 16.5 16.4 0.2 0.0 3.6 0.3 28.1 2000 (CTCI 5 à 8 moins 667 et 68)
27.3 2.3 0.8 20.4 20.3 5.6 0.1 3.8 0.3 20.1 2006
Parts par principaux groupes de produits (en pourcentage)
100.0 100.0 100.0 100.0 100.0 100.0 100.0 100.0 100.0 100.0 1995 Total tous produits
100.0 100.0 100.0 100.0 100.0 100.0 100.0 100.0 100.0 100.0 2000
100.0 100.0 100.0 100.0 100.0 100.0 100.0 100.0 100.0 100.0 2006
24.0 10.4 7.8 24.5 24.3 14.1 62.2 14.3 21.3 23.7 1995 Produits alimentaires
11.6 16.4 0.1 11.3 11.2 1.4 55.7 35.3 33.3 7.7 2000 (CTCI 0 + 1 + 22 + 4)
16.4 34.1 2.1 12.6 12.6 4.5 0.9 52.8 68.9 12.9 2006
30.0 0.1 0.4 31.3 31.5 32.7 0.0 5.8 0.0 31.4 1995 Matières premières
8.3 1.2 0.1 10.9 10.9 90.1 0.0 2.8 2.0 8.9 2000 d'origine agricole
25.3 0.8 13.2 28.9 28.9 69.9 3.9 2.5 1.0 30.2 2006 (CTCI 2 - 22 - 27 - 28)
21.2 0.3 0.1 22.1 22.3 0.0 0.4 2.0 0.0 22.3 1995 Minerais, métaux, pierres
35.1 47.8 0.0 45.9 46.0 0.4 12.4 3.2 3.3 38.9 2000 précieuses et or (non monétaire)
26.7 0.1 0.4 30.6 30.7 8.0 3.4 2.2 0.3 32.1 2006 (CTCI 27 + 28 + 68 + 667 + 971)
8.1 0.0 0.0 8.1 8.2 53.0 0.0 14.3 0.0 8.2 1995 Combustibles (CTCI 3)
2.2 0.0 0.0 2.9 2.9 0.0 0.0 1.0 0.0 2.4 2000
4.2 0.3 0.0 4.4 4.4 0.0 0.0 5.1 0.2 0.6 2006
16.3 88.8 91.7 13.7 13.5 0.1 37.4 54.6 78.6 14.2 1995 Articles manufacturés
42.6 33.5 99.8 28.9 28.9 7.9 31.9 56.7 61.1 42.0 2000 (CTCI 5 à 8 moins 667 et 68)
27.1 64.2 81.6 23.4 23.4 17.6 70.8 47.5 28.7 24.1 2006
Majorpetroleumexporters
Principauxexportateurs
de pétrole
AsiaAsie
Total
Eastern,Southern and South-Eastern
Asia
Asie orientale, méridionale et
du Sud-Est
China
Chine
WesternAsia
Asieoccidentale
Oceania
OcéanieTotal
Africa
Afrique
America
Amérique
Developing economies
Économies en développement
Groupes de produits
Destination
Year
Année
Majorexporters of
manufactures
Principauxexportateurs
d'articlesmanufacturés
2.2.J Structure des exportations par partenaires et groupes de produitsÉconomies en développement : Océanie
Sources : - Données et estimations du secrétariat de la CNUCED sur la base de données Comtrade de ONU DAES et Direction of Trade statistics du Fonds Monétaire international
2
109

Product group
TotalEU
UE
Millions of dollars
All products 1995 5 814 4 608 1 441 1 430 13 374 805 1 974 1
2000 5 429 3 598 1 234 1 218 17 383 396 1 569 14
2006 10 604 6 023 2 089 2 039 41 430 596 2 867 2
Share by destination (percentage)
All products 1995 100.0 79.3 24.8 24.6 0.2 6.4 13.9 34.0 0.0
2000 100.0 66.3 22.7 22.4 0.3 7.0 7.3 28.9 0.3
2006 100.0 56.8 19.7 19.2 0.4 4.1 5.6 27.0 0.0
All food items 1995 100.0 86.5 23.6 23.6 0.2 10.6 5.1 46.9 0.0
(SITC 0 + 1 + 22 + 4) 2000 100.0 84.2 20.8 20.7 0.4 13.9 1.5 47.6 0.1
2006 100.0 70.4 19.4 19.3 0.4 5.8 3.6 41.2 0.0
Agricultural raw materials 1995 100.0 89.3 7.2 7.2 0.0 27.8 3.0 51.3 0.3
(SITC 2 - 22 - 27 - 28) 2000 100.0 81.1 8.1 8.1 1.2 33.1 0.9 37.8 0.1
2006 100.0 80.3 5.0 5.0 6.3 23.1 0.8 45.2 0.0
Ores, metals, precious stones 1995 100.0 86.9 32.2 32.2 0.0 3.6 1.8 49.3 0.0
and non-monetary gold 2000 100.0 71.9 31.4 31.3 0.0 7.0 2.1 31.4 0.5
(SITC 27 + 28 + 68 + 667 + 971) 2006 100.0 80.9 41.6 41.5 1.3 1.7 3.0 33.3 0.1
Fuels (SITC 3) 1995 100.0 61.8 0.9 0.9 0.0 1.7 0.0 59.1 0.0
2000 100.0 44.5 0.5 0.5 0.0 0.5 0.0 43.4 1.2
2006 100.0 20.7 0.6 0.5 0.0 0.0 1.1 19.0 0.0
Manufactured goods 1995 100.0 80.0 29.3 29.0 0.3 5.3 18.2 26.9 0.0
(SITC 5 to 8 less 667 and 68) 2000 100.0 68.3 30.2 29.7 0.4 6.5 11.1 20.1 0.0
2006 100.0 67.8 29.1 28.4 0.4 5.1 8.3 24.7 0.0
Share by major product group (percentage)
All products 1995 100.0 100.0 100.0 100.0 100.0 100.0 100.0 100.0 100.0
2000 100.0 100.0 100.0 100.0 100.0 100.0 100.0 100.0 100.0
2006 100.0 100.0 100.0 100.0 100.0 100.0 100.0 100.0 100.0
All food items 1995 16.1 17.5 15.3 15.4 12.3 26.6 6.0 22.2 18.4
(SITC 0 + 1 + 22 + 4) 2000 15.9 20.2 14.6 14.7 20.1 31.3 3.3 26.2 4.9
2006 13.7 16.9 13.5 13.7 14.3 19.4 8.7 20.8 5.0
Agricultural raw materials 1995 1.0 1.1 0.3 0.3 0.1 4.3 0.2 1.5 14.9
(SITC 2 - 22 - 27 - 28) 2000 1.0 1.3 0.4 0.4 4.0 4.8 0.1 1.4 0.2
2006 0.9 1.3 0.2 0.2 15.2 5.4 0.1 1.6 0.7
Ores, metals, precious stones 1995 0.7 0.7 0.9 0.9 0.0 0.4 0.1 1.0 1.3
and non-monetary gold 2000 0.8 0.9 1.1 1.1 0.0 0.8 0.2 0.9 1.5
(SITC 27 + 28 + 68 + 667 + 971) 2006 0.8 1.1 1.7 1.7 2.7 0.3 0.4 1.0 5.5
Fuels (SITC 3) 1995 10.1 7.9 0.4 0.4 0.2 2.7 0.0 17.5 5.2
2000 17.7 11.9 0.4 0.4 0.0 1.3 0.1 26.6 86.8
2006 25.3 9.2 0.8 0.7 0.1 0.2 4.7 17.8 0.2
Manufactured goods 1995 69.9 70.5 82.5 82.4 85.7 57.9 91.9 55.3 60.2
(SITC 5 to 8 less 667 and 68) 2000 62.8 64.7 83.3 83.2 75.6 58.2 96.0 43.7 6.4
2006 56.1 66.9 83.0 82.8 63.3 70.7 83.3 51.3 85.9
Year
Année
Destination
World
MondeTotal
Europe
Canada
Developed economies
Économies développées
Japan
Japon
Otherdevelopedcountries
Autreséconomies
développées
USA
États-Unis
Economiesin
transition
Économiesen
transition
2.2.J Import structure by partner and product groupDeveloping economies: Oceania
Sources:- Data and UNCTAD secretariat estimates based on UN DESA Comtrade and IMF Direction of Trade statistics databases
110

Millions de dollars
1 199 9 34 1 137 1 136 71 1 19 1 1 094 1995 Total tous produits
1 751 30 297 1 349 1 346 100 3 75 20 1 262 2000
4 506 44 82 4 190 4 174 456 16 124 20 4 046 2006
Parts par destinations (en pourcentage)
20.6 0.2 0.6 19.6 19.5 1.2 0.0 0.3 0.0 18.8 1995 Total tous produits
32.3 0.6 5.5 24.8 24.8 1.8 0.1 1.4 0.4 23.2 2000
42.5 0.4 0.8 39.5 39.4 4.3 0.1 1.2 0.2 38.2 2006
13.4 0.4 1.4 11.3 11.3 0.8 0.0 0.3 0.0 10.3 1995 Produits alimentaires
15.2 0.7 3.5 8.4 8.3 0.7 0.0 2.5 0.0 7.1 2000 (CTCI 0 + 1 + 22 + 4)
26.9 0.7 2.1 18.3 18.2 3.6 0.1 5.8 0.1 17.3 2006
10.3 1.0 0.2 7.3 7.1 0.0 0.2 1.8 0.2 6.7 1995 Matières premières
18.7 0.2 2.0 6.0 6.0 0.2 0.0 10.5 0.1 4.9 2000 d'origine agricole
17.9 0.7 0.9 9.4 9.4 0.6 0.0 6.9 0.0 6.0 2006 (CTCI 2 - 22 - 27 - 28)
12.6 1.0 0.1 10.6 10.5 0.1 0.1 0.8 0.1 10.4 1995 Minerais, métaux, pierres
25.9 0.1 4.6 16.7 16.7 0.3 0.0 4.5 0.0 14.3 2000 précieuses et or (non monétaire)
18.1 0.2 0.2 14.0 14.0 3.4 0.1 3.7 0.1 13.1 2006 (CTCI 27 + 28 + 68 + 667 + 971)
38.2 0.2 0.1 37.4 37.4 0.0 0.0 0.4 0.0 37.2 1995 Combustibles (CTCI 3)
54.1 1.8 4.7 45.9 45.9 0.0 0.0 1.6 1.8 45.7 2000
79.3 0.0 0.6 78.0 78.0 0.1 0.0 0.8 0.6 77.7 2006
19.9 0.1 0.5 19.0 19.0 1.6 0.0 0.3 0.0 18.3 1995 Articles manufacturés
31.4 0.2 6.4 24.0 24.0 2.7 0.1 0.9 0.1 21.9 2000 (CTCI 5 à 8 moins 667 et 68)
31.7 0.5 0.6 29.4 29.2 6.6 0.2 1.2 0.1 27.5 2006
Parts par principaux groupes de produits (en pourcentage)
100.0 100.0 100.0 100.0 100.0 100.0 100.0 100.0 100.0 100.0 1995 Total tous produits
100.0 100.0 100.0 100.0 100.0 100.0 100.0 100.0 100.0 100.0 2000
100.0 100.0 100.0 100.0 100.0 100.0 100.0 100.0 100.0 100.0 2006
10.5 39.0 40.2 9.3 9.3 10.0 11.1 13.4 28.6 8.8 1995 Produits alimentaires
7.5 19.9 10.2 5.4 5.4 6.4 13.6 29.2 2.0 4.9 2000 (CTCI 0 + 1 + 22 + 4)
8.6 22.3 37.4 6.3 6.3 11.5 12.6 67.5 6.9 6.2 2006
0.5 6.3 0.3 0.4 0.4 0.0 7.2 5.6 14.0 0.4 1995 Matières premières
0.6 0.5 0.4 0.3 0.3 0.1 0.0 7.8 0.3 0.2 2000 d'origine agricole
0.4 1.6 1.1 0.2 0.2 0.1 0.0 5.6 0.0 0.1 2006 (CTCI 2 - 22 - 27 - 28)
0.4 4.2 0.1 0.4 0.4 0.0 4.1 1.6 6.3 0.4 1995 Minerais, métaux, pierres
0.6 0.1 0.7 0.5 0.5 0.1 0.6 2.5 0.0 0.5 2000 précieuses et or (non monétaire)
0.3 0.4 0.2 0.3 0.3 0.6 0.5 2.5 0.4 0.3 2006 (CTCI 27 + 28 + 68 + 667 + 971)
18.6 13.7 2.2 19.3 19.3 0.1 0.0 13.6 0.6 19.9 1995 Combustibles (CTCI 3)
29.7 58.2 15.4 32.8 32.9 0.1 0.0 20.3 87.2 34.9 2000
47.3 2.1 18.0 50.0 50.2 0.8 0.5 16.3 75.2 51.6 2006
67.3 36.8 57.1 68.0 68.0 89.8 77.6 55.5 50.6 67.8 1995 Articles manufacturés
61.2 21.1 73.0 60.8 60.7 92.7 85.1 38.8 10.4 59.3 2000 (CTCI 5 à 8 moins 667 et 68)
41.9 70.4 43.0 41.8 41.7 86.0 59.6 58.3 17.5 40.4 2006
Groupes de produits
Destination
Year
Année
Majorexporters of
manufactures
Principauxexportateurs
d'articlesmanufacturés
Developing economies
Économies en développement
TotalAfrica
Afrique
America
Amérique
Majorpetroleumexporters
Principauxexportateurs
de pétrole
AsiaAsie
Total
Eastern,Southern and South-Eastern
Asia
Asie orientale, méridionale et
du Sud-Est
China
Chine
WesternAsia
Asieoccidentale
Oceania
Océanie
2.2.J Structure des importations par partenaires et groupes de produitsÉconomies en développement : Océanie
Sources : - Données et estimations du secrétariat de la CNUCED sur la base de données Comtrade de ONU DAES et Direction of Trade statistics du Fonds Monétaire international
2
111

Product group
TotalEU
UE
Millions of dollars
All products 1995 194 681 100 443 39 397 38 480 1 574 32 395 26 072 1 005 1 534
2000 337 109 188 628 74 863 67 702 2 757 71 640 38 580 788 1 800
2006 865 978 445 729 156 807 143 454 9 222 156 137 119 590 3 972 3 325
Share by destination (percentage)
All products 1995 100.0 51.6 20.2 19.8 0.8 16.6 13.4 0.5 0.8
2000 100.0 56.0 22.2 20.1 0.8 21.3 11.4 0.2 0.5
2006 100.0 51.5 18.1 16.6 1.1 18.0 13.8 0.5 0.4
All food items 1995 100.0 41.0 22.5 22.1 0.4 15.1 2.5 0.4 6.7
(SITC 0 + 1 + 22 + 4) 2000 100.0 32.1 17.2 17.0 0.4 11.3 2.9 0.4 5.8
2006 100.0 26.7 17.8 17.4 0.4 7.1 1.1 0.3 5.0
Agricultural raw materials 1995 100.0 58.2 44.8 43.9 0.3 7.3 5.1 0.8 0.6
(SITC 2 - 22 - 27 - 28) 2000 100.0 50.2 37.1 35.5 0.4 10.0 2.2 0.5 1.4
2006 100.0 31.3 20.8 20.4 0.6 9.3 0.6 0.1 3.0
Ores, metals, precious stones 1995 100.0 42.1 19.9 19.3 0.0 7.5 14.5 0.2 1.0
and non-monetary gold 2000 100.0 50.9 30.3 28.7 0.2 9.8 10.3 0.3 1.3
(SITC 27 + 28 + 68 + 667 + 971) 2006 100.0 26.4 20.1 14.7 0.9 2.7 2.5 0.1 0.4
Fuels (SITC 3) 1995 100.0 55.0 20.3 19.9 0.9 17.8 15.5 0.5 0.1
2000 100.0 58.8 22.8 20.5 0.8 22.3 12.6 0.2 0.1
2006 100.0 57.7 19.0 17.3 1.2 20.7 16.4 0.4 0.0
Manufactured goods 1995 100.0 31.0 17.0 16.4 0.6 10.5 2.0 1.0 3.7
(SITC 5 to 8 less 667 and 68) 2000 100.0 30.0 13.8 13.4 0.9 14.1 0.4 0.9 3.6
2006 100.0 23.3 16.0 15.3 0.4 5.3 0.5 1.0 3.0
Share by major product group (percentage)
All products 1995 100.0 100.0 100.0 100.0 100.0 100.0 100.0 100.0 100.0
2000 100.0 100.0 100.0 100.0 100.0 100.0 100.0 100.0 100.0
2006 100.0 100.0 100.0 100.0 100.0 100.0 100.0 100.0 100.0
All food items 1995 3.5 2.8 3.9 3.9 1.9 3.2 0.7 2.8 30.1
(SITC 0 + 1 + 22 + 4) 2000 1.9 1.1 1.5 1.6 1.0 1.0 0.5 3.3 20.9
2006 1.8 0.9 1.8 1.9 0.7 0.7 0.1 1.4 23.8
Agricultural raw materials 1995 1.0 1.1 2.1 2.1 0.3 0.4 0.4 1.5 0.7
(SITC 2 - 22 - 27 - 28) 2000 0.4 0.4 0.7 0.7 0.2 0.2 0.1 0.9 1.0
2006 0.4 0.2 0.4 0.5 0.2 0.2 0.0 0.1 3.0
Ores, metals, precious stones 1995 2.4 2.0 2.4 2.3 0.1 1.1 2.6 0.7 3.1
and non-monetary gold 2000 1.5 1.3 2.0 2.1 0.4 0.7 1.3 2.0 3.5
(SITC 27 + 28 + 68 + 667 + 971) 2006 2.5 1.3 2.8 2.2 2.1 0.4 0.5 0.8 2.7
Fuels (SITC 3) 1995 81.9 87.3 82.3 82.3 89.5 87.9 94.7 74.4 14.9
2000 88.7 93.2 91.2 90.6 90.5 93.2 97.9 65.5 23.6
2006 83.4 93.4 87.3 87.3 93.7 95.8 99.0 73.6 2.2
Manufactured goods 1995 11.0 6.6 9.2 9.2 8.1 7.0 1.6 20.4 51.1
(SITC 5 to 8 less 667 and 68) 2000 7.4 4.0 4.6 4.9 7.9 4.9 0.2 28.1 49.8
2006 8.6 3.9 7.6 8.0 3.2 2.5 0.3 19.4 66.4
Year
Année
Destination
World
MondeTotal
Europe
Canada
Developed economies
Économies développées
Japan
Japon
Otherdevelopedcountries
Autreséconomies
développées
USA
États-Unis
Economiesin
transition
Économiesen
transition
2.2.K Export structure by partner and product groupDeveloping economies:Major petroleum exporters
Sources:- Data and UNCTAD secretariat estimates based on UN DESA Comtrade and IMF Direction of Trade statistics databases
112

Millions de dollars
44 276 3 421 10 039 30 815 20 880 2 008 9 935 1 8 891 22 709 1995 Total tous produits
123 122 11 299 17 052 94 740 79 305 9 031 15 434 31 10 130 83 124 2000
351 492 30 687 40 660 280 128 224 999 41 758 55 129 17 53 408 216 051 2006
Parts par destinations (en pourcentage)
22.7 1.8 5.2 15.8 10.7 1.0 5.1 0.0 4.6 11.7 1995 Total tous produits
36.5 3.4 5.1 28.1 23.5 2.7 4.6 0.0 3.0 24.7 2000
40.6 3.5 4.7 32.3 26.0 4.8 6.4 0.0 6.2 24.9 2006
51.1 2.9 12.3 35.9 6.1 0.3 29.8 0.0 28.4 4.0 1995 Produits alimentaires
61.2 4.4 11.1 45.7 11.7 1.2 34.0 0.1 29.8 7.5 2000 (CTCI 0 + 1 + 22 + 4)
67.7 6.8 6.1 54.9 14.0 0.6 40.8 0.0 41.7 5.6 2006
40.7 6.6 2.2 31.9 23.1 8.9 8.7 0.0 6.5 25.0 1995 Matières premières
46.6 5.0 2.6 39.0 26.9 14.8 12.1 0.0 4.5 29.8 2000 d'origine agricole
65.4 5.7 1.0 58.7 44.8 12.2 13.8 0.0 12.7 21.4 2006 (CTCI 2 - 22 - 27 - 28)
52.7 1.6 5.7 45.5 29.8 1.1 15.7 0.0 14.0 29.6 1995 Minerais, métaux, pierres
47.5 1.9 5.2 40.5 27.3 2.8 13.2 0.0 10.9 28.1 2000 précieuses et or (non monétaire)
71.4 2.2 2.4 66.7 52.9 4.0 13.8 0.0 12.3 50.8 2006 (CTCI 27 + 28 + 68 + 667 + 971)
14.9 1.0 4.1 9.7 8.3 0.9 1.5 0.0 0.5 10.1 1995 Combustibles (CTCI 3)
33.5 3.0 4.6 25.9 23.9 2.8 2.0 0.0 0.6 25.7 2000
36.9 3.0 4.9 29.0 26.3 5.2 2.7 0.0 1.9 26.1 2006
64.1 6.4 10.9 46.9 25.2 1.9 21.7 0.0 25.1 20.4 1995 Articles manufacturés
63.0 7.9 8.7 46.4 21.1 0.8 25.3 0.0 23.5 16.0 2000 (CTCI 5 à 8 moins 667 et 68)
71.9 10.0 4.6 57.3 25.8 3.6 31.5 0.0 40.0 16.5 2006
Parts par principaux groupes de produits (en pourcentage)
100.0 100.0 100.0 100.0 100.0 100.0 100.0 100.0 100.0 100.0 1995 Total tous produits
100.0 100.0 100.0 100.0 100.0 100.0 100.0 100.0 100.0 100.0 2000
100.0 100.0 100.0 100.0 100.0 100.0 100.0 100.0 100.0 100.0 2006
7.9 5.8 8.4 8.0 2.0 1.2 20.6 22.8 21.9 1.2 1995 Produits alimentaires
3.2 2.5 4.2 3.1 1.0 0.8 14.2 11.9 19.0 0.6 2000 (CTCI 0 + 1 + 22 + 4)
3.0 3.5 2.4 3.1 1.0 0.2 11.7 4.9 12.3 0.4 2006
1.7 3.6 0.4 1.9 2.1 8.3 1.7 8.2 1.4 2.1 1995 Matières premières
0.5 0.6 0.2 0.6 0.5 2.2 1.1 0.3 0.6 0.5 2000 d'origine agricole
0.6 0.6 0.1 0.7 0.7 1.0 0.8 0.0 0.8 0.3 2006 (CTCI 2 - 22 - 27 - 28)
5.6 2.1 2.7 6.9 6.7 2.6 7.4 4.8 7.4 6.1 1995 Minerais, métaux, pierres
1.9 0.8 1.5 2.1 1.7 1.5 4.2 0.0 5.3 1.7 2000 précieuses et or (non monétaire)
4.4 1.6 1.3 5.2 5.1 2.1 5.4 2.9 5.0 5.1 2006 (CTCI 27 + 28 + 68 + 667 + 971)
53.5 47.9 65.3 50.3 63.1 67.7 23.3 0.5 8.6 71.1 1995 Combustibles (CTCI 3)
81.5 78.5 81.4 81.8 90.2 93.2 39.1 85.0 16.5 92.4 2000
75.8 69.7 87.8 74.7 84.5 90.3 34.8 77.6 25.2 87.4 2006
31.1 40.3 23.2 32.7 25.9 20.2 46.9 63.7 60.6 19.3 1995 Articles manufacturés
12.7 17.3 12.7 12.2 6.6 2.2 40.7 2.8 57.7 4.8 2000 (CTCI 5 à 8 moins 667 et 68)
15.3 24.4 8.4 15.2 8.6 6.4 42.6 13.8 55.8 5.7 2006
Groupes de produits
Destination
Year
Année
Majorexporters of
manufactures
Principauxexportateurs
d'articlesmanufacturés
Developing economies
Économies en développement
TotalAfrica
Afrique
America
Amérique
Majorpetroleumexporters
Principauxexportateurs
de pétrole
AsiaAsie
Total
Eastern,Southern and South-Eastern
Asia
Asie orientale, méridionale et
du Sud-Est
China
Chine
WesternAsia
Asieoccidentale
Oceania
Océanie
2.2.K Structure des exportations par partenaires et groupes de produitsÉconomies en développement :Principaux exportateurs de pétrole
Sources : - Données et estimations du secrétariat de la CNUCED sur la base de données Comtrade de ONU DAES et Direction of Trade statistics du Fonds Monétaire international
2
113

Product group
TotalEU
UE
Millions of dollars
All products 1995 133 287 86 831 52 839 49 467 2 482 19 940 9 672 1 898 2 125
2000 147 871 89 566 53 422 50 489 2 553 19 987 10 417 3 187 3 097
2006 390 915 171 506 106 944 99 870 3 076 33 393 21 929 6 164 6 961
Share by destination (percentage)
All products 1995 100.0 65.1 39.6 37.1 1.9 15.0 7.3 1.4 1.6
2000 100.0 60.6 36.1 34.1 1.7 13.5 7.0 2.2 2.1
2006 100.0 43.9 27.4 25.5 0.8 8.5 5.6 1.6 1.8
All food items 1995 100.0 55.3 31.0 30.2 5.6 12.6 0.1 6.0 0.9
(SITC 0 + 1 + 22 + 4) 2000 100.0 52.7 30.3 29.6 5.4 10.5 0.1 6.4 0.9
2006 100.0 41.1 24.5 22.9 2.4 7.5 0.1 6.6 2.6
Agricultural raw materials 1995 100.0 56.4 30.5 30.2 4.1 17.9 2.5 1.6 5.8
(SITC 2 - 22 - 27 - 28) 2000 100.0 58.1 35.5 34.6 3.3 15.0 1.5 2.7 5.0
2006 100.0 55.4 38.3 37.6 3.1 8.5 3.3 2.2 3.1
Ores, metals, precious stones 1995 100.0 57.5 42.2 22.5 2.6 8.3 0.5 3.9 2.0
and non-monetary gold 2000 100.0 49.5 35.4 23.1 0.4 5.2 1.0 7.5 3.2
(SITC 27 + 28 + 68 + 667 + 971) 2006 100.0 28.0 21.2 15.5 1.0 1.7 0.7 3.3 4.4
Fuels (SITC 3) 1995 100.0 28.9 16.1 16.0 0.4 10.7 0.1 1.6 3.5
2000 100.0 15.0 9.6 7.9 0.1 4.2 0.1 1.0 0.8
2006 100.0 27.2 20.7 19.0 0.2 5.7 0.2 0.5 5.4
Manufactured goods 1995 100.0 69.1 42.3 40.1 1.0 16.0 9.6 0.3 1.6
(SITC 5 to 8 less 667 and 68) 2000 100.0 65.3 38.8 37.0 1.0 15.1 9.4 1.0 2.3
2006 100.0 53.9 33.2 31.3 0.7 11.0 8.1 0.9 1.5
Share by major product group (percentage)
All products 1995 100.0 100.0 100.0 100.0 100.0 100.0 100.0 100.0 100.0
2000 100.0 100.0 100.0 100.0 100.0 100.0 100.0 100.0 100.0
2006 100.0 100.0 100.0 100.0 100.0 100.0 100.0 100.0 100.0
All food items 1995 16.7 14.2 13.1 13.6 50.6 14.0 0.3 70.2 9.8
(SITC 0 + 1 + 22 + 4) 2000 17.3 15.0 14.5 15.0 53.6 13.5 0.2 51.1 7.4
2006 9.9 9.2 8.8 8.8 29.7 8.7 0.2 41.1 14.6
Agricultural raw materials 1995 1.7 1.5 1.3 1.4 3.8 2.1 0.6 1.9 6.3
(SITC 2 - 22 - 27 - 28) 2000 1.3 1.3 1.3 1.4 2.6 1.5 0.3 1.7 3.2
2006 0.8 1.0 1.1 1.1 3.0 0.8 0.4 1.1 1.3
Ores, metals, precious stones 1995 3.7 3.3 3.9 2.2 5.2 2.0 0.2 10.1 4.6
and non-monetary gold 2000 3.5 2.9 3.4 2.4 0.8 1.3 0.5 12.2 5.3
(SITC 27 + 28 + 68 + 667 + 971) 2006 4.7 3.0 3.7 2.8 6.3 0.9 0.6 9.9 11.6
Fuels (SITC 3) 1995 2.6 1.1 1.0 1.1 0.6 1.8 0.0 2.9 5.5
2000 3.9 1.0 1.0 0.9 0.3 1.2 0.1 1.8 1.5
2006 5.7 3.6 4.3 4.3 1.4 3.8 0.2 1.7 17.4
Manufactured goods 1995 74.7 79.2 79.8 80.8 39.7 79.6 98.5 14.0 73.8
(SITC 5 to 8 less 667 and 68) 2000 73.6 79.3 79.1 79.7 42.6 82.3 98.3 33.2 81.2
2006 65.9 80.9 80.0 80.6 58.8 84.6 94.7 39.1 53.8
Year
Année
Destination
World
MondeTotal
Europe
Canada
Developed economies
Économies développées
Japan
Japon
Otherdevelopedcountries
Autreséconomies
développées
USA
États-Unis
Economiesin
transition
Économiesen
transition
2.2.K Import structure by partner and product groupDeveloping economies:Major petroleum exporters
Sources:- Data and UNCTAD secretariat estimates based on UN DESA Comtrade and IMF Direction of Trade statistics databases
114

Millions de dollars
43 350 3 101 7 683 32 562 21 753 3 310 10 808 5 9 160 23 732 1995 Total tous produits
54 641 3 909 10 488 40 202 26 861 6 154 13 342 42 13 515 28 357 2000
151 655 10 281 25 672 115 696 84 134 30 847 31 562 9 28 086 96 030 2006
Parts par destinations (en pourcentage)
32.5 2.3 5.8 24.4 16.3 2.5 8.1 0.0 6.9 17.8 1995 Total tous produits
37.0 2.6 7.1 27.2 18.2 4.2 9.0 0.0 9.1 19.2 2000
38.8 2.6 6.6 29.6 21.5 7.9 8.1 0.0 7.2 24.6 2006
43.3 4.8 13.9 24.5 14.6 1.2 9.9 0.0 8.0 17.5 1995 Produits alimentaires
46.1 5.8 12.3 27.9 17.2 1.2 10.7 0.1 11.2 17.2 2000 (CTCI 0 + 1 + 22 + 4)
54.1 5.8 18.5 29.9 17.2 1.8 12.7 0.0 11.8 22.9 2006
36.8 3.9 11.1 21.8 17.4 0.5 4.3 0.0 4.9 18.6 1995 Matières premières
36.8 5.0 9.8 22.0 16.9 0.8 5.1 0.0 4.1 18.7 2000 d'origine agricole
38.7 4.1 9.9 24.7 18.8 2.2 6.0 0.0 5.1 18.6 2006 (CTCI 2 - 22 - 27 - 28)
40.3 6.1 11.2 23.0 8.6 0.6 14.3 0.0 14.5 14.0 1995 Minerais, métaux, pierres
47.1 7.8 13.2 26.1 13.0 1.1 13.1 0.0 14.1 20.2 2000 précieuses et or (non monétaire)
62.5 7.3 7.3 47.9 36.7 2.7 11.2 0.0 13.4 39.7 2006 (CTCI 27 + 28 + 68 + 667 + 971)
64.3 4.2 5.1 55.0 5.5 0.3 49.5 0.0 55.7 4.0 1995 Combustibles (CTCI 3)
82.1 7.5 25.3 49.3 5.3 2.3 44.0 0.0 61.6 5.4 2000
42.3 9.3 12.3 20.6 10.2 0.7 10.4 0.0 17.5 14.8 2006
28.7 1.5 3.6 23.6 17.5 3.0 6.1 0.0 4.7 18.6 1995 Articles manufacturés
32.0 1.4 4.6 26.0 19.4 5.2 6.7 0.0 5.8 20.3 2000 (CTCI 5 à 8 moins 667 et 68)
41.5 1.7 5.5 34.3 26.2 11.4 8.1 0.0 6.4 29.0 2006
Parts par principaux groupes de produits (en pourcentage)
100.0 100.0 100.0 100.0 100.0 100.0 100.0 100.0 100.0 100.0 1995 Total tous produits
100.0 100.0 100.0 100.0 100.0 100.0 100.0 100.0 100.0 100.0 2000
100.0 100.0 100.0 100.0 100.0 100.0 100.0 100.0 100.0 100.0 2006
22.3 34.8 40.4 16.8 15.0 7.8 20.5 37.4 19.4 16.4 1995 Produits alimentaires
21.5 38.1 29.9 17.7 16.3 5.2 20.4 83.7 21.2 15.5 2000 (CTCI 0 + 1 + 22 + 4)
13.8 21.6 27.7 10.0 7.9 2.2 15.5 22.4 16.2 9.2 2006
2.0 3.0 3.4 1.6 1.9 0.4 0.9 0.0 1.2 1.8 1995 Matières premières
1.3 2.5 1.8 1.1 1.2 0.3 0.8 0.8 0.6 1.3 2000 d'origine agricole
0.8 1.2 1.1 0.6 0.7 0.2 0.6 1.0 0.5 0.6 2006 (CTCI 2 - 22 - 27 - 28)
4.6 9.6 7.2 3.5 2.0 0.9 6.5 0.5 7.8 2.9 1995 Minerais, métaux, pierres
4.5 10.3 6.5 3.4 2.5 0.9 5.1 0.8 5.4 3.7 2000 précieuses et or (non monétaire)
7.6 13.1 5.2 7.6 8.0 1.6 6.5 0.1 8.8 7.6 2006 (CTCI 27 + 28 + 68 + 667 + 971)
5.1 4.6 2.3 5.8 0.9 0.4 15.6 0.0 20.7 0.6 1995 Combustibles (CTCI 3)
8.6 10.9 13.8 7.0 1.1 2.1 18.8 0.0 26.0 1.1 2000
6.3 20.4 10.7 4.0 2.7 0.5 7.4 0.0 14.0 3.5 2006
65.9 47.8 46.7 72.1 80.0 90.4 56.4 62.1 50.7 78.0 1995 Articles manufacturés
63.8 37.8 47.9 70.5 78.4 91.1 54.5 14.6 46.5 78.0 2000 (CTCI 5 à 8 moins 667 et 68)
70.4 42.8 54.8 76.3 80.1 95.3 66.3 41.4 59.0 77.8 2006
Groupes de produits
Destination
Year
Année
Majorexporters of
manufactures
Principauxexportateurs
d'articlesmanufacturés
Developing economies
Économies en développement
TotalAfrica
Afrique
America
Amérique
Majorpetroleumexporters
Principauxexportateurs
de pétrole
AsiaAsie
Total
Eastern,Southern and South-Eastern
Asia
Asie orientale, méridionale et
du Sud-Est
China
Chine
WesternAsia
Asieoccidentale
Oceania
Océanie
2.2.K Structure des importations par partenaires et groupes de produitsÉconomies en développement : Principaux exportateurs de pétrole
Sources : - Données et estimations du secrétariat de la CNUCED sur la base de données Comtrade de ONU DAES et Direction of Trade statistics du Fonds Monétaire international
2
115
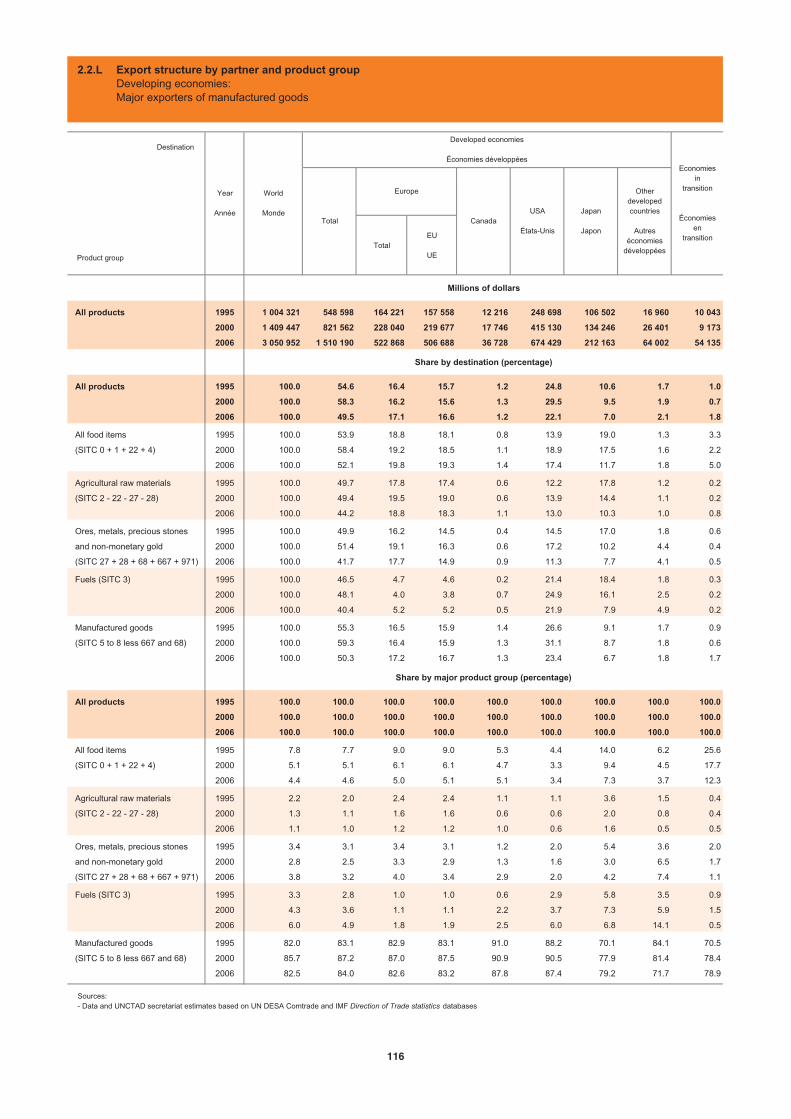
Product group
TotalEU
UE
Millions of dollars
All products 1995 1 004 321 548 598 164 221 157 558 12 216 248 698 106 502 16 960 10 043
2000 1 409 447 821 562 228 040 219 677 17 746 415 130 134 246 26 401 9 173
2006 3 050 952 1 510 190 522 868 506 688 36 728 674 429 212 163 64 002 54 135
Share by destination (percentage)
All products 1995 100.0 54.6 16.4 15.7 1.2 24.8 10.6 1.7 1.0
2000 100.0 58.3 16.2 15.6 1.3 29.5 9.5 1.9 0.7
2006 100.0 49.5 17.1 16.6 1.2 22.1 7.0 2.1 1.8
All food items 1995 100.0 53.9 18.8 18.1 0.8 13.9 19.0 1.3 3.3
(SITC 0 + 1 + 22 + 4) 2000 100.0 58.4 19.2 18.5 1.1 18.9 17.5 1.6 2.2
2006 100.0 52.1 19.8 19.3 1.4 17.4 11.7 1.8 5.0
Agricultural raw materials 1995 100.0 49.7 17.8 17.4 0.6 12.2 17.8 1.2 0.2
(SITC 2 - 22 - 27 - 28) 2000 100.0 49.4 19.5 19.0 0.6 13.9 14.4 1.1 0.2
2006 100.0 44.2 18.8 18.3 1.1 13.0 10.3 1.0 0.8
Ores, metals, precious stones 1995 100.0 49.9 16.2 14.5 0.4 14.5 17.0 1.8 0.6
and non-monetary gold 2000 100.0 51.4 19.1 16.3 0.6 17.2 10.2 4.4 0.4
(SITC 27 + 28 + 68 + 667 + 971) 2006 100.0 41.7 17.7 14.9 0.9 11.3 7.7 4.1 0.5
Fuels (SITC 3) 1995 100.0 46.5 4.7 4.6 0.2 21.4 18.4 1.8 0.3
2000 100.0 48.1 4.0 3.8 0.7 24.9 16.1 2.5 0.2
2006 100.0 40.4 5.2 5.2 0.5 21.9 7.9 4.9 0.2
Manufactured goods 1995 100.0 55.3 16.5 15.9 1.4 26.6 9.1 1.7 0.9
(SITC 5 to 8 less 667 and 68) 2000 100.0 59.3 16.4 15.9 1.3 31.1 8.7 1.8 0.6
2006 100.0 50.3 17.2 16.7 1.3 23.4 6.7 1.8 1.7
Share by major product group (percentage)
All products 1995 100.0 100.0 100.0 100.0 100.0 100.0 100.0 100.0 100.0
2000 100.0 100.0 100.0 100.0 100.0 100.0 100.0 100.0 100.0
2006 100.0 100.0 100.0 100.0 100.0 100.0 100.0 100.0 100.0
All food items 1995 7.8 7.7 9.0 9.0 5.3 4.4 14.0 6.2 25.6
(SITC 0 + 1 + 22 + 4) 2000 5.1 5.1 6.1 6.1 4.7 3.3 9.4 4.5 17.7
2006 4.4 4.6 5.0 5.1 5.1 3.4 7.3 3.7 12.3
Agricultural raw materials 1995 2.2 2.0 2.4 2.4 1.1 1.1 3.6 1.5 0.4
(SITC 2 - 22 - 27 - 28) 2000 1.3 1.1 1.6 1.6 0.6 0.6 2.0 0.8 0.4
2006 1.1 1.0 1.2 1.2 1.0 0.6 1.6 0.5 0.5
Ores, metals, precious stones 1995 3.4 3.1 3.4 3.1 1.2 2.0 5.4 3.6 2.0
and non-monetary gold 2000 2.8 2.5 3.3 2.9 1.3 1.6 3.0 6.5 1.7
(SITC 27 + 28 + 68 + 667 + 971) 2006 3.8 3.2 4.0 3.4 2.9 2.0 4.2 7.4 1.1
Fuels (SITC 3) 1995 3.3 2.8 1.0 1.0 0.6 2.9 5.8 3.5 0.9
2000 4.3 3.6 1.1 1.1 2.2 3.7 7.3 5.9 1.5
2006 6.0 4.9 1.8 1.9 2.5 6.0 6.8 14.1 0.5
Manufactured goods 1995 82.0 83.1 82.9 83.1 91.0 88.2 70.1 84.1 70.5
(SITC 5 to 8 less 667 and 68) 2000 85.7 87.2 87.0 87.5 90.9 90.5 77.9 81.4 78.4
2006 82.5 84.0 82.6 83.2 87.8 87.4 79.2 71.7 78.9
Year
Année
Destination
World
MondeTotal
Europe
Canada
Developed economies
Économies développées
Japan
Japon
Otherdevelopedcountries
Autreséconomies
développées
USA
États-Unis
Economiesin
transition
Économiesen
transition
2.2.L Export structure by partner and product groupDeveloping economies:Major exporters of manufactured goods
Sources:- Data and UNCTAD secretariat estimates based on UN DESA Comtrade and IMF Direction of Trade statistics databases
116
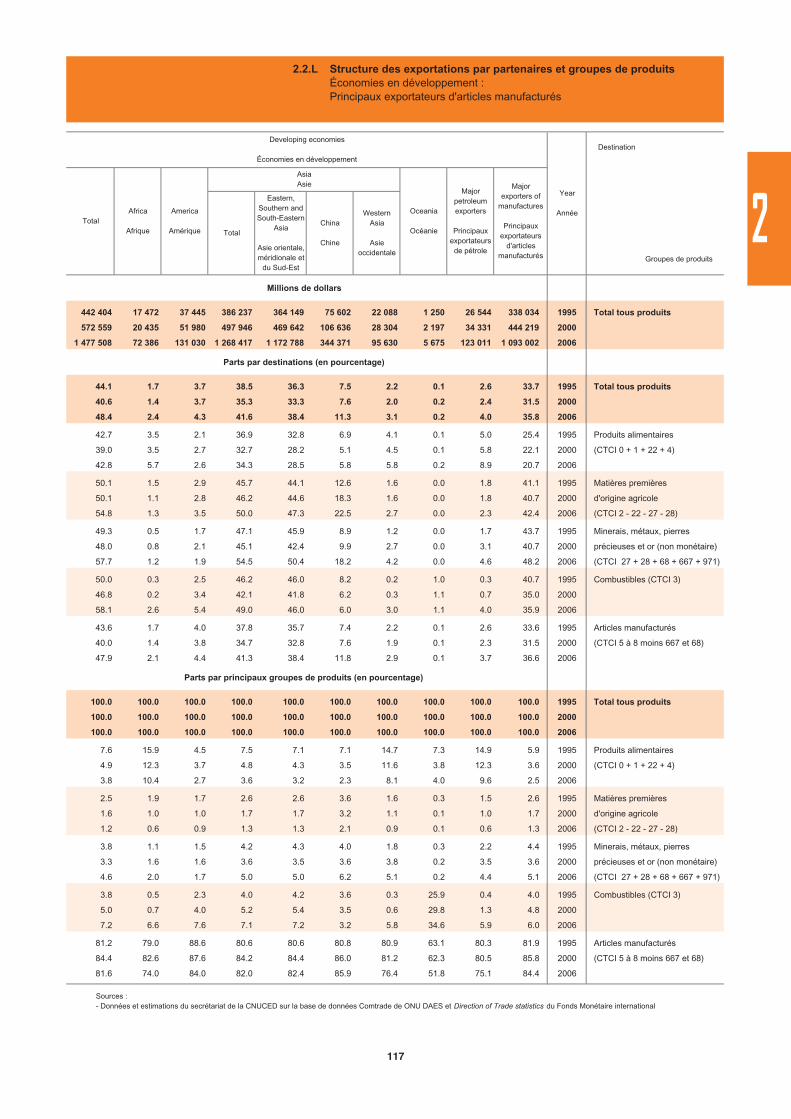
Millions de dollars
442 404 17 472 37 445 386 237 364 149 75 602 22 088 1 250 26 544 338 034 1995 Total tous produits
572 559 20 435 51 980 497 946 469 642 106 636 28 304 2 197 34 331 444 219 2000
1 477 508 72 386 131 030 1 268 417 1 172 788 344 371 95 630 5 675 123 011 1 093 002 2006
Parts par destinations (en pourcentage)
44.1 1.7 3.7 38.5 36.3 7.5 2.2 0.1 2.6 33.7 1995 Total tous produits
40.6 1.4 3.7 35.3 33.3 7.6 2.0 0.2 2.4 31.5 2000
48.4 2.4 4.3 41.6 38.4 11.3 3.1 0.2 4.0 35.8 2006
42.7 3.5 2.1 36.9 32.8 6.9 4.1 0.1 5.0 25.4 1995 Produits alimentaires
39.0 3.5 2.7 32.7 28.2 5.1 4.5 0.1 5.8 22.1 2000 (CTCI 0 + 1 + 22 + 4)
42.8 5.7 2.6 34.3 28.5 5.8 5.8 0.2 8.9 20.7 2006
50.1 1.5 2.9 45.7 44.1 12.6 1.6 0.0 1.8 41.1 1995 Matières premières
50.1 1.1 2.8 46.2 44.6 18.3 1.6 0.0 1.8 40.7 2000 d'origine agricole
54.8 1.3 3.5 50.0 47.3 22.5 2.7 0.0 2.3 42.4 2006 (CTCI 2 - 22 - 27 - 28)
49.3 0.5 1.7 47.1 45.9 8.9 1.2 0.0 1.7 43.7 1995 Minerais, métaux, pierres
48.0 0.8 2.1 45.1 42.4 9.9 2.7 0.0 3.1 40.7 2000 précieuses et or (non monétaire)
57.7 1.2 1.9 54.5 50.4 18.2 4.2 0.0 4.6 48.2 2006 (CTCI 27 + 28 + 68 + 667 + 971)
50.0 0.3 2.5 46.2 46.0 8.2 0.2 1.0 0.3 40.7 1995 Combustibles (CTCI 3)
46.8 0.2 3.4 42.1 41.8 6.2 0.3 1.1 0.7 35.0 2000
58.1 2.6 5.4 49.0 46.0 6.0 3.0 1.1 4.0 35.9 2006
43.6 1.7 4.0 37.8 35.7 7.4 2.2 0.1 2.6 33.6 1995 Articles manufacturés
40.0 1.4 3.8 34.7 32.8 7.6 1.9 0.1 2.3 31.5 2000 (CTCI 5 à 8 moins 667 et 68)
47.9 2.1 4.4 41.3 38.4 11.8 2.9 0.1 3.7 36.6 2006
Parts par principaux groupes de produits (en pourcentage)
100.0 100.0 100.0 100.0 100.0 100.0 100.0 100.0 100.0 100.0 1995 Total tous produits
100.0 100.0 100.0 100.0 100.0 100.0 100.0 100.0 100.0 100.0 2000
100.0 100.0 100.0 100.0 100.0 100.0 100.0 100.0 100.0 100.0 2006
7.6 15.9 4.5 7.5 7.1 7.1 14.7 7.3 14.9 5.9 1995 Produits alimentaires
4.9 12.3 3.7 4.8 4.3 3.5 11.6 3.8 12.3 3.6 2000 (CTCI 0 + 1 + 22 + 4)
3.8 10.4 2.7 3.6 3.2 2.3 8.1 4.0 9.6 2.5 2006
2.5 1.9 1.7 2.6 2.6 3.6 1.6 0.3 1.5 2.6 1995 Matières premières
1.6 1.0 1.0 1.7 1.7 3.2 1.1 0.1 1.0 1.7 2000 d'origine agricole
1.2 0.6 0.9 1.3 1.3 2.1 0.9 0.1 0.6 1.3 2006 (CTCI 2 - 22 - 27 - 28)
3.8 1.1 1.5 4.2 4.3 4.0 1.8 0.3 2.2 4.4 1995 Minerais, métaux, pierres
3.3 1.6 1.6 3.6 3.5 3.6 3.8 0.2 3.5 3.6 2000 précieuses et or (non monétaire)
4.6 2.0 1.7 5.0 5.0 6.2 5.1 0.2 4.4 5.1 2006 (CTCI 27 + 28 + 68 + 667 + 971)
3.8 0.5 2.3 4.0 4.2 3.6 0.3 25.9 0.4 4.0 1995 Combustibles (CTCI 3)
5.0 0.7 4.0 5.2 5.4 3.5 0.6 29.8 1.3 4.8 2000
7.2 6.6 7.6 7.1 7.2 3.2 5.8 34.6 5.9 6.0 2006
81.2 79.0 88.6 80.6 80.6 80.8 80.9 63.1 80.3 81.9 1995 Articles manufacturés
84.4 82.6 87.6 84.2 84.4 86.0 81.2 62.3 80.5 85.8 2000 (CTCI 5 à 8 moins 667 et 68)
81.6 74.0 84.0 82.0 82.4 85.9 76.4 51.8 75.1 84.4 2006
Groupes de produits
Destination
Year
Année
Majorexporters of
manufactures
Principauxexportateurs
d'articlesmanufacturés
Developing economies
Économies en développement
TotalAfrica
Afrique
America
Amérique
Majorpetroleumexporters
Principauxexportateurs
de pétrole
AsiaAsie
Total
Eastern,Southern and South-Eastern
Asia
Asie orientale, méridionale et
du Sud-Est
China
Chine
WesternAsia
Asieoccidentale
Oceania
Océanie
2.2.L Structure des exportations par partenaires et groupes de produitsÉconomies en développement :Principaux exportateurs d'articles manufacturés
Sources : - Données et estimations du secrétariat de la CNUCED sur la base de données Comtrade de ONU DAES et Direction of Trade statistics du Fonds Monétaire international
2
117

Product group
TotalEU
UE
Millions of dollars
All products 1995 1 066 078 634 356 186 895 171 264 13 271 202 204 206 557 25 428 16 878
2000 1 390 160 752 660 204 437 186 284 15 740 287 096 213 017 32 371 21 164
2006 2 863 168 1 199 373 395 702 359 315 26 906 359 685 346 316 70 765 63 662
Share by destination (percentage)
All products 1995 100.0 59.5 17.5 16.1 1.2 19.0 19.4 2.4 1.6
2000 100.0 54.1 14.7 13.4 1.1 20.7 15.3 2.3 1.5
2006 100.0 41.9 13.8 12.5 0.9 12.6 12.1 2.5 2.2
All food items 1995 100.0 58.4 15.7 14.8 3.8 28.4 2.7 7.7 1.0
(SITC 0 + 1 + 22 + 4) 2000 100.0 56.7 12.6 11.7 3.9 28.6 2.7 9.0 1.4
2006 100.0 47.9 10.1 9.3 3.4 23.9 2.3 8.2 2.8
Agricultural raw materials 1995 100.0 52.7 8.4 8.1 5.0 25.9 4.7 8.8 4.9
(SITC 2 - 22 - 27 - 28) 2000 100.0 54.0 11.7 11.4 6.3 22.5 4.7 8.8 5.3
2006 100.0 50.3 11.4 11.2 5.3 22.5 4.2 6.8 8.5
Ores, metals, precious stones 1995 100.0 56.6 20.0 15.1 2.8 13.2 8.2 12.5 4.5
and non-monetary gold 2000 100.0 55.2 23.2 16.5 1.7 9.8 7.8 12.7 6.1
(SITC 27 + 28 + 68 + 667 + 971) 2006 100.0 45.3 15.2 9.2 1.8 7.0 6.9 14.4 4.8
Fuels (SITC 3) 1995 100.0 14.5 2.1 2.0 0.8 5.4 2.0 4.2 1.6
2000 100.0 11.3 2.2 1.7 0.3 4.0 0.7 4.1 2.0
2006 100.0 9.3 1.6 1.4 0.3 3.1 0.9 3.4 4.4
Manufactured goods 1995 100.0 63.8 19.3 17.8 0.8 19.2 23.7 0.8 1.3
(SITC 5 to 8 less 667 and 68) 2000 100.0 59.9 16.1 15.0 0.9 23.1 19.0 0.8 0.9
2006 100.0 47.5 15.6 14.6 0.7 14.5 16.0 0.6 0.8
Share by major product group (percentage)
All products 1995 100.0 100.0 100.0 100.0 100.0 100.0 100.0 100.0 100.0
2000 100.0 100.0 100.0 100.0 100.0 100.0 100.0 100.0 100.0
2006 100.0 100.0 100.0 100.0 100.0 100.0 100.0 100.0 100.0
All food items 1995 5.8 5.7 5.2 5.3 17.7 8.7 0.8 18.6 3.8
(SITC 0 + 1 + 22 + 4) 2000 4.4 4.6 3.7 3.8 15.0 6.0 0.8 16.8 3.9
2006 3.5 4.0 2.6 2.6 12.7 6.7 0.7 11.7 4.4
Agricultural raw materials 1995 3.2 2.8 1.5 1.6 12.8 4.4 0.8 11.7 9.8
(SITC 2 - 22 - 27 - 28) 2000 2.3 2.3 1.8 2.0 13.0 2.5 0.7 8.8 8.1
2006 2.0 2.4 1.6 1.8 11.1 3.5 0.7 5.4 7.5
Ores, metals, precious stones 1995 5.6 5.3 6.4 5.3 12.7 3.9 2.4 29.3 16.0
and non-monetary gold 2000 5.2 5.3 8.2 6.4 7.6 2.5 2.6 28.4 20.7
(SITC 27 + 28 + 68 + 667 + 971) 2006 7.6 8.3 8.4 5.6 14.5 4.3 4.4 44.5 16.5
Fuels (SITC 3) 1995 7.1 1.7 0.8 0.9 4.5 2.0 0.7 12.4 7.3
2000 10.6 2.2 1.6 1.3 2.8 2.1 0.5 18.4 14.1
2006 14.4 3.2 1.7 1.6 4.5 3.6 1.1 19.7 28.7
Manufactured goods 1995 76.4 81.9 84.0 84.8 50.7 77.3 93.4 26.8 62.1
(SITC 5 to 8 less 667 and 68) 2000 76.6 84.7 83.6 85.6 61.2 85.7 94.9 25.7 45.3
2006 69.7 79.0 78.5 81.0 55.4 80.6 92.3 17.2 24.9
USA
États-Unis
Economiesin
transition
Économiesen
transition
Year
Année
Destination
World
MondeTotal
Europe
Canada
Developed economies
Économies développées
Japan
Japon
Otherdevelopedcountries
Autreséconomies
développées
2.2.L Import structure by partner and product groupDeveloping economies: Major exporters of manufactured goods
Sources:- Data and UNCTAD secretariat estimates based on UN DESA Comtrade and IMF Direction of Trade statistics databases
118

Millions de dollars
406 035 14 124 28 419 362 638 326 181 91 035 36 457 854 46 767 311 595 1995 Total tous produits
594 854 23 212 32 665 538 093 476 432 139 513 61 661 884 85 919 447 586 2000
1 594 226 76 603 97 826 1 417 637 1 213 793 420 368 203 844 2 160 293 575 1 133 588 2006
Parts par destinations (en pourcentage)
38.1 1.3 2.7 34.0 30.6 8.5 3.4 0.1 4.4 29.2 1995 Total tous produits
42.8 1.7 2.3 38.7 34.3 10.0 4.4 0.1 6.2 32.2 2000
55.7 2.7 3.4 49.5 42.4 14.7 7.1 0.1 10.3 39.6 2006
40.4 1.3 12.1 26.7 26.3 6.5 0.4 0.4 0.6 25.0 1995 Produits alimentaires
41.9 1.9 13.1 26.5 26.1 8.3 0.4 0.3 0.9 23.7 2000 (CTCI 0 + 1 + 22 + 4)
49.3 2.0 17.7 29.2 28.8 7.2 0.4 0.4 0.8 26.6 2006
42.3 4.7 6.0 30.8 30.3 4.2 0.5 0.8 1.6 24.8 1995 Matières premières
40.6 5.3 4.8 29.7 29.1 3.8 0.7 0.7 2.2 21.7 2000 d'origine agricole
41.2 4.6 6.0 29.5 29.0 2.6 0.5 1.0 1.8 22.8 2006 (CTCI 2 - 22 - 27 - 28)
38.5 5.7 9.0 23.5 20.9 3.9 2.6 0.3 2.9 21.7 1995 Minerais, métaux, pierres
38.7 4.9 8.4 25.2 22.8 4.2 2.5 0.2 3.1 22.6 2000 précieuses et or (non monétaire)
49.6 5.6 14.1 29.7 26.3 6.2 3.4 0.3 4.3 26.1 2006 (CTCI 27 + 28 + 68 + 667 + 971)
78.8 7.0 3.2 68.6 29.5 2.9 39.1 0.1 52.0 18.0 1995 Combustibles (CTCI 3)
75.0 8.7 2.9 63.3 25.9 2.7 37.4 0.1 52.4 13.7 2000
86.2 11.7 3.0 71.5 28.2 2.1 43.3 0.0 61.8 16.1 2006
34.4 0.3 1.4 32.7 32.1 9.9 0.6 0.0 0.6 31.7 1995 Articles manufacturés
38.9 0.3 1.2 37.4 37.0 11.8 0.4 0.0 0.4 36.3 2000 (CTCI 5 à 8 moins 667 et 68)
51.5 0.3 1.5 49.6 48.9 19.4 0.7 0.0 0.8 48.0 2006
Parts par principaux groupes de produits (en pourcentage)
100.0 100.0 100.0 100.0 100.0 100.0 100.0 100.0 100.0 100.0 1995 Total tous produits
100.0 100.0 100.0 100.0 100.0 100.0 100.0 100.0 100.0 100.0 2000
100.0 100.0 100.0 100.0 100.0 100.0 100.0 100.0 100.0 100.0 2006
6.1 5.7 26.2 4.5 5.0 4.4 0.6 27.1 0.8 4.9 1995 Produits alimentaires
4.3 5.0 24.4 3.0 3.3 3.6 0.4 18.7 0.6 3.2 2000 (CTCI 0 + 1 + 22 + 4)
3.1 2.7 18.3 2.1 2.4 1.7 0.2 17.5 0.3 2.4 2006
3.5 11.3 7.1 2.9 3.2 1.6 0.5 33.4 1.1 2.7 1995 Matières premières
2.2 7.4 4.8 1.8 2.0 0.9 0.3 24.3 0.8 1.6 2000 d'origine agricole
1.4 3.4 3.5 1.2 1.3 0.3 0.1 26.4 0.3 1.1 2006 (CTCI 2 - 22 - 27 - 28)
5.7 24.3 18.9 3.9 3.8 2.5 4.3 20.4 3.7 4.2 1995 Minerais, métaux, pierres
4.7 15.1 18.5 3.4 3.4 2.2 2.9 16.4 2.6 3.6 2000 précieuses et or (non monétaire)
6.8 15.9 31.6 4.6 4.7 3.2 3.6 29.2 3.2 5.0 2006 (CTCI 27 + 28 + 68 + 667 + 971)
14.6 37.1 8.4 14.3 6.8 2.4 80.8 8.1 83.8 4.3 1995 Combustibles (CTCI 3)
18.5 55.0 13.2 17.3 8.0 2.8 89.0 15.6 89.7 4.5 2000
22.3 63.2 12.7 20.8 9.6 2.0 87.7 0.4 86.9 5.8 2006
69.1 19.5 38.9 73.5 80.2 88.6 13.7 10.8 10.4 82.8 1995 Articles manufacturés
69.6 13.1 38.8 73.9 82.6 90.4 7.3 24.9 5.4 86.3 2000 (CTCI 5 à 8 moins 667 et 68)
64.6 8.7 31.5 69.9 80.5 92.0 7.2 25.3 5.4 84.6 2006
Majorpetroleumexporters
Principauxexportateurs
de pétrole
AsiaAsie
Total
Eastern,Southern and South-Eastern
Asia
Asie orientale, méridionale et
du Sud-Est
China
Chine
WesternAsia
Asieoccidentale
Oceania
OcéanieTotal
Africa
Afrique
America
Amérique
Developing economies
Économies en développement
Groupes de produits
Destination
Year
Année
Majorexporters of
manufactures
Principauxexportateurs
d'articlesmanufacturés
2.2.L Structure des importations par partenaires et groupes de produitsÉconomies en développement :Principaux exportateurs d'articles manufacturés
Sources : - Données et estimations du secrétariat de la CNUCED sur la base de données Comtrade de ONU DAES et Direction of Trade statistics du Fonds Monétaire international
2
119

MARCHANDISES
MERCHANDISE
1
2
3
4
5
6
7
8
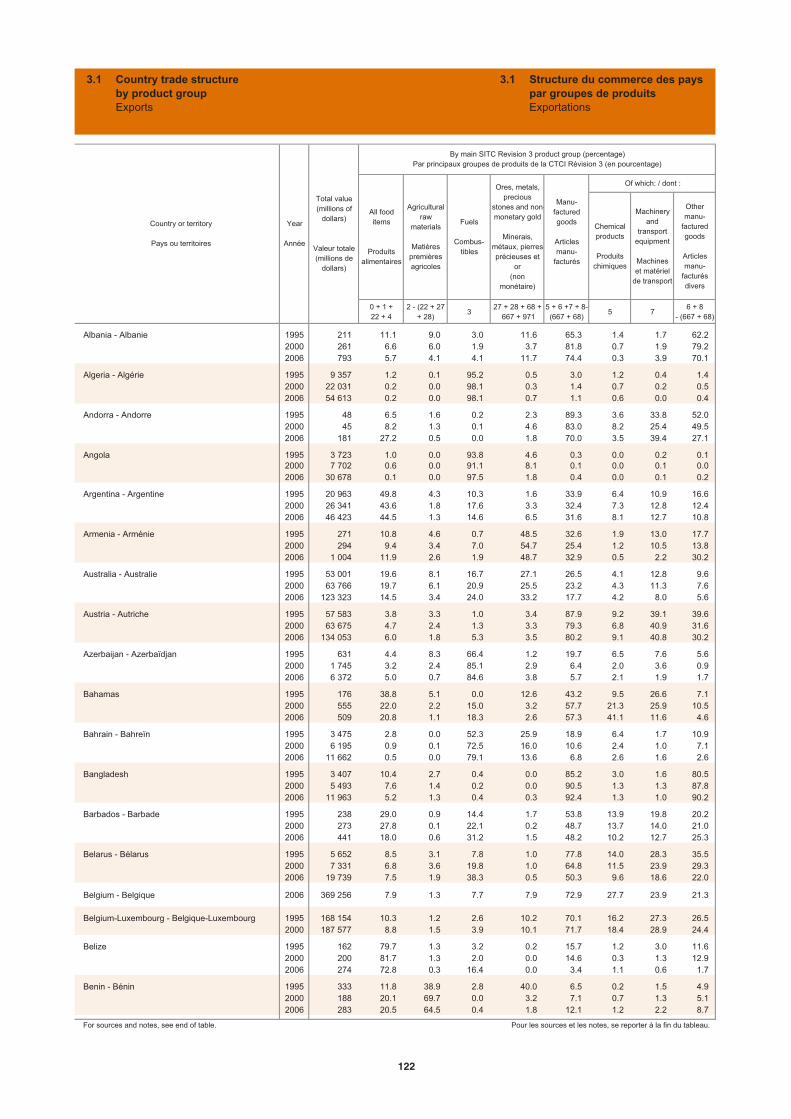
Chemicalproducts
Produitschimiques
Machineryand
transportequipment
Machineset matériel
de transport
Othermanu-
facturedgoods
Articlesmanu-
facturésdivers
0 + 1 + 22 + 4
2 - (22 + 27 + 28)
327 + 28 + 68 +
667 + 9715 + 6 +7 + 8-(667 + 68)
5 76 + 8
- (667 + 68)
Albania - Albanie 1995 211 11.1 9.0 3.0 11.6 65.3 1.4 1.7 62.22000 261 6.6 6.0 1.9 3.7 81.8 0.7 1.9 79.22006 793 5.7 4.1 4.1 11.7 74.4 0.3 3.9 70.1
Algeria - Algérie 1995 9 357 1.2 0.1 95.2 0.5 3.0 1.2 0.4 1.42000 22 031 0.2 0.0 98.1 0.3 1.4 0.7 0.2 0.52006 54 613 0.2 0.0 98.1 0.7 1.1 0.6 0.0 0.4
Andorra - Andorre 1995 48 6.5 1.6 0.2 2.3 89.3 3.6 33.8 52.02000 45 8.2 1.3 0.1 4.6 83.0 8.2 25.4 49.52006 181 27.2 0.5 0.0 1.8 70.0 3.5 39.4 27.1
Angola 1995 3 723 1.0 0.0 93.8 4.6 0.3 0.0 0.2 0.12000 7 702 0.6 0.0 91.1 8.1 0.1 0.0 0.1 0.02006 30 678 0.1 0.0 97.5 1.8 0.4 0.0 0.1 0.2
Argentina - Argentine 1995 20 963 49.8 4.3 10.3 1.6 33.9 6.4 10.9 16.62000 26 341 43.6 1.8 17.6 3.3 32.4 7.3 12.8 12.42006 46 423 44.5 1.3 14.6 6.5 31.6 8.1 12.7 10.8
Armenia - Arménie 1995 271 10.8 4.6 0.7 48.5 32.6 1.9 13.0 17.72000 294 9.4 3.4 7.0 54.7 25.4 1.2 10.5 13.82006 1 004 11.9 2.6 1.9 48.7 32.9 0.5 2.2 30.2
Australia - Australie 1995 53 001 19.6 8.1 16.7 27.1 26.5 4.1 12.8 9.62000 63 766 19.7 6.1 20.9 25.5 23.2 4.3 11.3 7.62006 123 323 14.5 3.4 24.0 33.2 17.7 4.2 8.0 5.6
Austria - Autriche 1995 57 583 3.8 3.3 1.0 3.4 87.9 9.2 39.1 39.62000 63 675 4.7 2.4 1.3 3.3 79.3 6.8 40.9 31.62006 134 053 6.0 1.8 5.3 3.5 80.2 9.1 40.8 30.2
Azerbaijan - Azerbaïdjan 1995 631 4.4 8.3 66.4 1.2 19.7 6.5 7.6 5.62000 1 745 3.2 2.4 85.1 2.9 6.4 2.0 3.6 0.92006 6 372 5.0 0.7 84.6 3.8 5.7 2.1 1.9 1.7
Bahamas 1995 176 38.8 5.1 0.0 12.6 43.2 9.5 26.6 7.12000 555 22.0 2.2 15.0 3.2 57.7 21.3 25.9 10.52006 509 20.8 1.1 18.3 2.6 57.3 41.1 11.6 4.6
Bahrain - Bahreïn 1995 3 475 2.8 0.0 52.3 25.9 18.9 6.4 1.7 10.92000 6 195 0.9 0.1 72.5 16.0 10.6 2.4 1.0 7.12006 11 662 0.5 0.0 79.1 13.6 6.8 2.6 1.6 2.6
Bangladesh 1995 3 407 10.4 2.7 0.4 0.0 85.2 3.0 1.6 80.52000 5 493 7.6 1.4 0.2 0.0 90.5 1.3 1.3 87.82006 11 963 5.2 1.3 0.4 0.3 92.4 1.3 1.0 90.2
Barbados - Barbade 1995 238 29.0 0.9 14.4 1.7 53.8 13.9 19.8 20.22000 273 27.8 0.1 22.1 0.2 48.7 13.7 14.0 21.02006 441 18.0 0.6 31.2 1.5 48.2 10.2 12.7 25.3
Belarus - Bélarus 1995 5 652 8.5 3.1 7.8 1.0 77.8 14.0 28.3 35.52000 7 331 6.8 3.6 19.8 1.0 64.8 11.5 23.9 29.32006 19 739 7.5 1.9 38.3 0.5 50.3 9.6 18.6 22.0
Belgium - Belgique 2006 369 256 7.9 1.3 7.7 7.9 72.9 27.7 23.9 21.3
Belgium-Luxembourg - Belgique-Luxembourg 1995 168 154 10.3 1.2 2.6 10.2 70.1 16.2 27.3 26.52000 187 577 8.8 1.5 3.9 10.1 71.7 18.4 28.9 24.4
Belize 1995 162 79.7 1.3 3.2 0.2 15.7 1.2 3.0 11.62000 200 81.7 1.3 2.0 0.0 14.6 0.3 1.3 12.92006 274 72.8 0.3 16.4 0.0 3.4 1.1 0.6 1.7
Benin - Bénin 1995 333 11.8 38.9 2.8 40.0 6.5 0.2 1.5 4.92000 188 20.1 69.7 0.0 3.2 7.1 0.7 1.3 5.12006 283 20.5 64.5 0.4 1.8 12.1 1.2 2.2 8.7
For sources and notes, see end of table. Pour les sources et les notes, se reporter à la fin du tableau.
Of which: / dont :
By main SITC Revision 3 product group (percentage)Par principaux groupes de produits de la CTCI Révision 3 (en pourcentage)
Fuels
Combus-tibles
Ores, metals, precious
stones and non-monetary gold
Minerais,métaux, pierres précieuses et
or(non
monétaire)
Manu-facturedgoods
Articlesmanu-
facturés
Country or territory
Pays ou territoires
All food items
Produitsalimentaires
Agriculturalraw
materials
Matièrespremièresagricoles
Year
Année
Total value(millions of
dollars)
Valeur totale(millions de
dollars)
3.1 Country trade structureby product groupExports
Structure du commerce des payspar groupes de produitsExportations
3.1
122
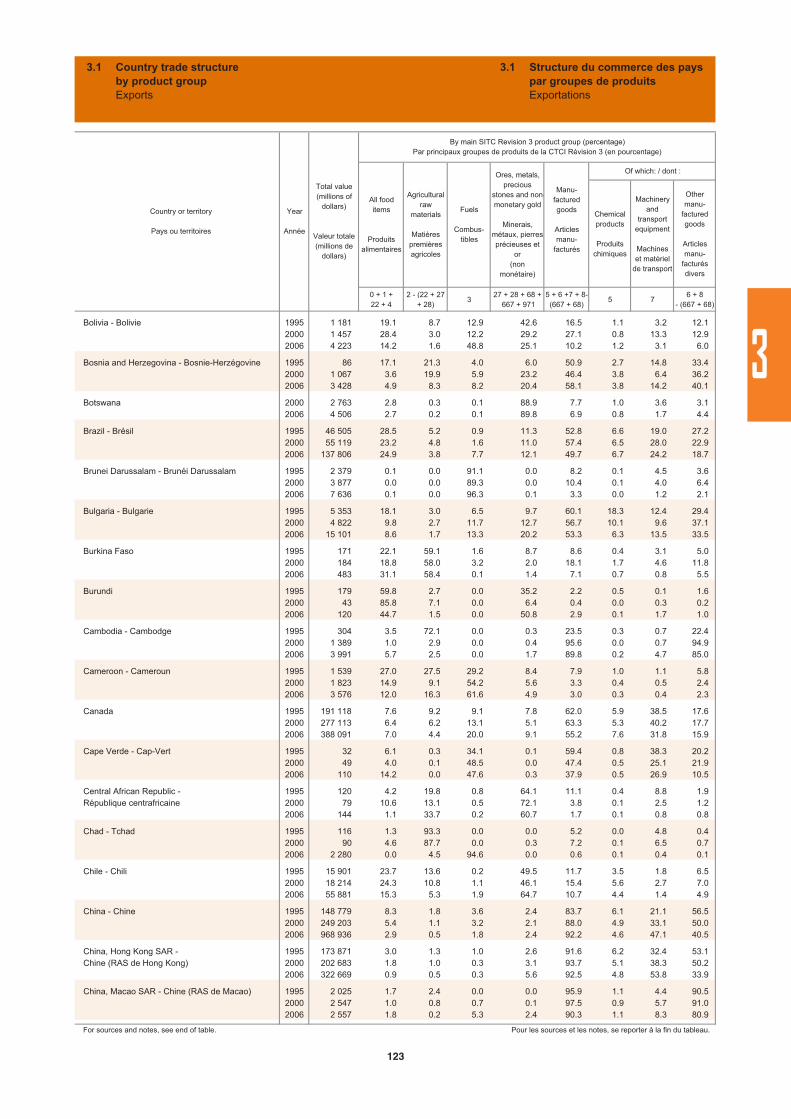
Chemicalproducts
Produitschimiques
Machineryand
transportequipment
Machineset matériel
de transport
Othermanu-
facturedgoods
Articlesmanu-
facturésdivers
0 + 1 + 22 + 4
2 - (22 + 27 + 28)
327 + 28 + 68 +
667 + 9715 + 6 +7 + 8-(667 + 68)
5 76 + 8
- (667 + 68)
Bolivia - Bolivie 1995 1 181 19.1 8.7 12.9 42.6 16.5 1.1 3.2 12.12000 1 457 28.4 3.0 12.2 29.2 27.1 0.8 13.3 12.92006 4 223 14.2 1.6 48.8 25.1 10.2 1.2 3.1 6.0
Bosnia and Herzegovina - Bosnie-Herzégovine 1995 86 17.1 21.3 4.0 6.0 50.9 2.7 14.8 33.42000 1 067 3.6 19.9 5.9 23.2 46.4 3.8 6.4 36.22006 3 428 4.9 8.3 8.2 20.4 58.1 3.8 14.2 40.1
Botswana 2000 2 763 2.8 0.3 0.1 88.9 7.7 1.0 3.6 3.12006 4 506 2.7 0.2 0.1 89.8 6.9 0.8 1.7 4.4
Brazil - Brésil 1995 46 505 28.5 5.2 0.9 11.3 52.8 6.6 19.0 27.22000 55 119 23.2 4.8 1.6 11.0 57.4 6.5 28.0 22.92006 137 806 24.9 3.8 7.7 12.1 49.7 6.7 24.2 18.7
Brunei Darussalam - Brunéi Darussalam 1995 2 379 0.1 0.0 91.1 0.0 8.2 0.1 4.5 3.62000 3 877 0.0 0.0 89.3 0.0 10.4 0.1 4.0 6.42006 7 636 0.1 0.0 96.3 0.1 3.3 0.0 1.2 2.1
Bulgaria - Bulgarie 1995 5 353 18.1 3.0 6.5 9.7 60.1 18.3 12.4 29.42000 4 822 9.8 2.7 11.7 12.7 56.7 10.1 9.6 37.12006 15 101 8.6 1.7 13.3 20.2 53.3 6.3 13.5 33.5
Burkina Faso 1995 171 22.1 59.1 1.6 8.7 8.6 0.4 3.1 5.02000 184 18.8 58.0 3.2 2.0 18.1 1.7 4.6 11.82006 483 31.1 58.4 0.1 1.4 7.1 0.7 0.8 5.5
Burundi 1995 179 59.8 2.7 0.0 35.2 2.2 0.5 0.1 1.62000 43 85.8 7.1 0.0 6.4 0.4 0.0 0.3 0.22006 120 44.7 1.5 0.0 50.8 2.9 0.1 1.7 1.0
Cambodia - Cambodge 1995 304 3.5 72.1 0.0 0.3 23.5 0.3 0.7 22.42000 1 389 1.0 2.9 0.0 0.4 95.6 0.0 0.7 94.92006 3 991 5.7 2.5 0.0 1.7 89.8 0.2 4.7 85.0
Cameroon - Cameroun 1995 1 539 27.0 27.5 29.2 8.4 7.9 1.0 1.1 5.82000 1 823 14.9 9.1 54.2 5.6 3.3 0.4 0.5 2.42006 3 576 12.0 16.3 61.6 4.9 3.0 0.3 0.4 2.3
Canada 1995 191 118 7.6 9.2 9.1 7.8 62.0 5.9 38.5 17.62000 277 113 6.4 6.2 13.1 5.1 63.3 5.3 40.2 17.72006 388 091 7.0 4.4 20.0 9.1 55.2 7.6 31.8 15.9
Cape Verde - Cap-Vert 1995 32 6.1 0.3 34.1 0.1 59.4 0.8 38.3 20.22000 49 4.0 0.1 48.5 0.0 47.4 0.5 25.1 21.92006 110 14.2 0.0 47.6 0.3 37.9 0.5 26.9 10.5
Central African Republic - 1995 120 4.2 19.8 0.8 64.1 11.1 0.4 8.8 1.9République centrafricaine 2000 79 10.6 13.1 0.5 72.1 3.8 0.1 2.5 1.2
2006 144 1.1 33.7 0.2 60.7 1.7 0.1 0.8 0.8
Chad - Tchad 1995 116 1.3 93.3 0.0 0.0 5.2 0.0 4.8 0.42000 90 4.6 87.7 0.0 0.3 7.2 0.1 6.5 0.72006 2 280 0.0 4.5 94.6 0.0 0.6 0.1 0.4 0.1
Chile - Chili 1995 15 901 23.7 13.6 0.2 49.5 11.7 3.5 1.8 6.52000 18 214 24.3 10.8 1.1 46.1 15.4 5.6 2.7 7.02006 55 881 15.3 5.3 1.9 64.7 10.7 4.4 1.4 4.9
China - Chine 1995 148 779 8.3 1.8 3.6 2.4 83.7 6.1 21.1 56.52000 249 203 5.4 1.1 3.2 2.1 88.0 4.9 33.1 50.02006 968 936 2.9 0.5 1.8 2.4 92.2 4.6 47.1 40.5
China, Hong Kong SAR - 1995 173 871 3.0 1.3 1.0 2.6 91.6 6.2 32.4 53.1Chine (RAS de Hong Kong) 2000 202 683 1.8 1.0 0.3 3.1 93.7 5.1 38.3 50.2
2006 322 669 0.9 0.5 0.3 5.6 92.5 4.8 53.8 33.9
China, Macao SAR - Chine (RAS de Macao) 1995 2 025 1.7 2.4 0.0 0.0 95.9 1.1 4.4 90.52000 2 547 1.0 0.8 0.7 0.1 97.5 0.9 5.7 91.02006 2 557 1.8 0.2 5.3 2.4 90.3 1.1 8.3 80.9
For sources and notes, see end of table. Pour les sources et les notes, se reporter à la fin du tableau.
Manu-facturedgoods
Articlesmanu-
facturés
Of which: / dont :
Country or territory
Pays ou territoires
Year
Année
Total value(millions of
dollars)
Valeur totale(millions de
dollars)
By main SITC Revision 3 product group (percentage)Par principaux groupes de produits de la CTCI Révision 3 (en pourcentage)
All food items
Produitsalimentaires
Agriculturalraw
materials
Matièrespremièresagricoles
Fuels
Combus-tibles
Ores, metals, precious
stones and non-monetary gold
Minerais,métaux, pierres précieuses et
or(non
monétaire)
3.1 Country trade structureby product groupExports
Structure du commerce des payspar groupes de produitsExportations
3.1
3
123
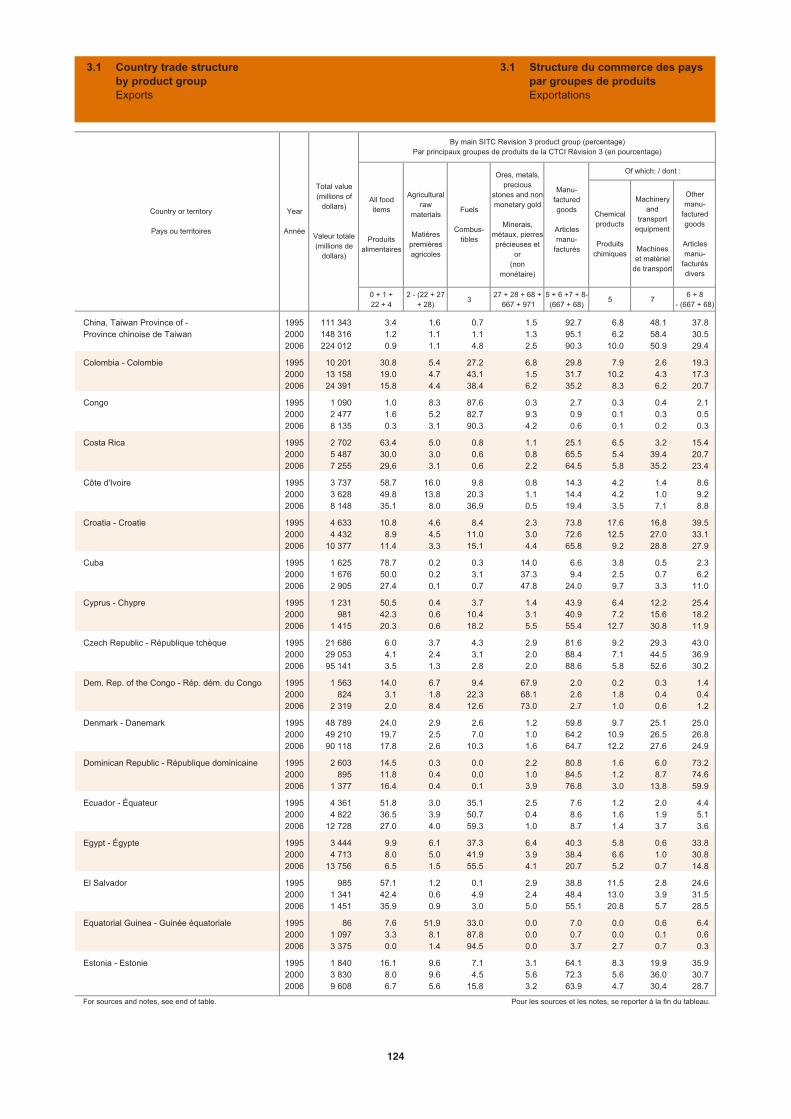
Chemicalproducts
Produitschimiques
Machineryand
transportequipment
Machineset matériel
de transport
Othermanu-
facturedgoods
Articlesmanu-
facturésdivers
0 + 1 + 22 + 4
2 - (22 + 27 + 28)
327 + 28 + 68 +
667 + 9715 + 6 +7 + 8-(667 + 68)
5 76 + 8
- (667 + 68)
China, Taiwan Province of - 1995 111 343 3.4 1.6 0.7 1.5 92.7 6.8 48.1 37.8Province chinoise de Taiwan 2000 148 316 1.2 1.1 1.1 1.3 95.1 6.2 58.4 30.5
2006 224 012 0.9 1.1 4.8 2.5 90.3 10.0 50.9 29.4
Colombia - Colombie 1995 10 201 30.8 5.4 27.2 6.8 29.8 7.9 2.6 19.32000 13 158 19.0 4.7 43.1 1.5 31.7 10.2 4.3 17.32006 24 391 15.8 4.4 38.4 6.2 35.2 8.3 6.2 20.7
Congo 1995 1 090 1.0 8.3 87.6 0.3 2.7 0.3 0.4 2.12000 2 477 1.6 5.2 82.7 9.3 0.9 0.1 0.3 0.52006 8 135 0.3 3.1 90.3 4.2 0.6 0.1 0.2 0.3
Costa Rica 1995 2 702 63.4 5.0 0.8 1.1 25.1 6.5 3.2 15.42000 5 487 30.0 3.0 0.6 0.8 65.5 5.4 39.4 20.72006 7 255 29.6 3.1 0.6 2.2 64.5 5.8 35.2 23.4
Côte d'Ivoire 1995 3 737 58.7 16.0 9.8 0.8 14.3 4.2 1.4 8.62000 3 628 49.8 13.8 20.3 1.1 14.4 4.2 1.0 9.22006 8 148 35.1 8.0 36.9 0.5 19.4 3.5 7.1 8.8
Croatia - Croatie 1995 4 633 10.8 4.6 8.4 2.3 73.8 17.6 16.8 39.52000 4 432 8.9 4.5 11.0 3.0 72.6 12.5 27.0 33.12006 10 377 11.4 3.3 15.1 4.4 65.8 9.2 28.8 27.9
Cuba 1995 1 625 78.7 0.2 0.3 14.0 6.6 3.8 0.5 2.32000 1 676 50.0 0.2 3.1 37.3 9.4 2.5 0.7 6.22006 2 905 27.4 0.1 0.7 47.8 24.0 9.7 3.3 11.0
Cyprus - Chypre 1995 1 231 50.5 0.4 3.7 1.4 43.9 6.4 12.2 25.42000 981 42.3 0.6 10.4 3.1 40.9 7.2 15.6 18.22006 1 415 20.3 0.6 18.2 5.5 55.4 12.7 30.8 11.9
Czech Republic - République tchèque 1995 21 686 6.0 3.7 4.3 2.9 81.6 9.2 29.3 43.02000 29 053 4.1 2.4 3.1 2.0 88.4 7.1 44.5 36.92006 95 141 3.5 1.3 2.8 2.0 88.6 5.8 52.6 30.2
Dem. Rep. of the Congo - Rép. dém. du Congo 1995 1 563 14.0 6.7 9.4 67.9 2.0 0.2 0.3 1.42000 824 3.1 1.8 22.3 68.1 2.6 1.8 0.4 0.42006 2 319 2.0 8.4 12.6 73.0 2.7 1.0 0.6 1.2
Denmark - Danemark 1995 48 789 24.0 2.9 2.6 1.2 59.8 9.7 25.1 25.02000 49 210 19.7 2.5 7.0 1.0 64.2 10.9 26.5 26.82006 90 118 17.8 2.6 10.3 1.6 64.7 12.2 27.6 24.9
Dominican Republic - République dominicaine 1995 2 603 14.5 0.3 0.0 2.2 80.8 1.6 6.0 73.22000 895 11.8 0.4 0.0 1.0 84.5 1.2 8.7 74.62006 1 377 16.4 0.4 0.1 3.9 76.8 3.0 13.8 59.9
Ecuador - Équateur 1995 4 361 51.8 3.0 35.1 2.5 7.6 1.2 2.0 4.42000 4 822 36.5 3.9 50.7 0.4 8.6 1.6 1.9 5.12006 12 728 27.0 4.0 59.3 1.0 8.7 1.4 3.7 3.6
Egypt - Égypte 1995 3 444 9.9 6.1 37.3 6.4 40.3 5.8 0.6 33.82000 4 713 8.0 5.0 41.9 3.9 38.4 6.6 1.0 30.82006 13 756 6.5 1.5 55.5 4.1 20.7 5.2 0.7 14.8
El Salvador 1995 985 57.1 1.2 0.1 2.9 38.8 11.5 2.8 24.62000 1 341 42.4 0.6 4.9 2.4 48.4 13.0 3.9 31.52006 1 451 35.9 0.9 3.0 5.0 55.1 20.8 5.7 28.5
Equatorial Guinea - Guinée équatoriale 1995 86 7.6 51.9 33.0 0.0 7.0 0.0 0.6 6.42000 1 097 3.3 8.1 87.8 0.0 0.7 0.0 0.1 0.62006 3 375 0.0 1.4 94.5 0.0 3.7 2.7 0.7 0.3
Estonia - Estonie 1995 1 840 16.1 9.6 7.1 3.1 64.1 8.3 19.9 35.92000 3 830 8.0 9.6 4.5 5.6 72.3 5.6 36.0 30.72006 9 608 6.7 5.6 15.8 3.2 63.9 4.7 30.4 28.7
For sources and notes, see end of table. Pour les sources et les notes, se reporter à la fin du tableau.
Country or territory
Pays ou territoires
Year
Année
Total value(millions of
dollars)
Valeur totale(millions de
dollars)
By main SITC Revision 3 product group (percentage)Par principaux groupes de produits de la CTCI Révision 3 (en pourcentage)
All food items
Produitsalimentaires
Agriculturalraw
materials
Matièrespremièresagricoles
Fuels
Combus-tibles
Ores, metals, precious
stones and non-monetary gold
Minerais,métaux, pierres précieuses et
or(non
monétaire)
Manu-facturedgoods
Articlesmanu-
facturés
Of which: / dont :
3.1 Country trade structureby product groupExports
Structure du commerce des payspar groupes de produitsExportations
3.1
124

Chemicalproducts
Produitschimiques
Machineryand
transportequipment
Machineset matériel
de transport
Othermanu-
facturedgoods
Articlesmanu-
facturésdivers
0 + 1 + 22 + 4
2 - (22 + 27 + 28)
327 + 28 + 68 +
667 + 9715 + 6 +7 + 8-(667 + 68)
5 76 + 8
- (667 + 68)
Ethiopia - Éthiopie 1995 422 72.5 13.4 2.9 0.1 11.2 0.3 0.0 10.82000 482 66.5 17.6 0.0 6.6 9.2 0.0 0.1 9.12006 1 043 70.5 16.6 0.0 6.8 6.0 0.1 0.1 5.7
Faeroe Islands - Îles Féroé 1995 362 91.1 2.2 0.0 0.0 6.7 0.1 4.8 1.82000 472 93.4 1.3 0.0 0.0 5.3 0.1 3.8 1.42006 631 91.8 2.2 2.0 0.2 3.8 0.1 2.6 1.1
Fiji - Fidji 1995 619 51.5 7.0 0.4 7.6 33.1 0.3 1.0 31.82000 469 34.9 4.6 0.0 7.2 46.1 0.8 0.2 45.12006 679 46.2 3.9 24.7 4.9 19.5 1.8 2.5 15.2
Finland - Finlande 1995 40 409 2.4 8.4 1.9 3.1 83.3 6.0 35.4 42.02000 45 475 1.7 6.3 3.4 3.2 84.8 6.0 45.3 33.62006 77 279 1.8 5.5 5.2 5.0 81.2 7.4 42.0 31.8
France 1995 277 845 14.4 1.5 2.4 2.8 78.9 14.9 39.4 24.62000 295 345 11.0 1.1 2.8 2.0 80.9 13.7 45.0 22.22006 479 013 10.5 0.9 4.3 3.0 79.3 15.7 41.3 22.3
French Polynesia - Polynésie française 1995 196 2.7 1.0 0.0 61.8 28.6 0.8 20.8 7.12000 244 5.9 0.8 0.0 72.3 20.6 0.6 14.1 5.92006 186 12.4 2.7 0.0 59.7 25.1 1.5 13.6 10.0
Gabon 1995 2 718 0.2 13.1 82.7 2.0 1.9 0.4 0.4 1.12000 2 602 0.8 11.8 83.3 1.7 2.3 0.1 0.4 1.92006 6 015 0.8 6.7 85.6 3.1 3.7 0.0 1.5 2.2
Gambia - Gambie 1995 19 58.8 0.5 0.2 1.1 36.8 2.4 7.0 27.52000 16 80.8 1.2 0.1 0.3 17.0 9.6 4.7 2.62006 11 81.1 3.9 0.0 0.9 14.1 0.5 9.8 3.8
Georgia - Géorgie 1995 158 29.3 3.3 18.8 8.0 40.6 11.1 5.7 23.82000 323 28.0 3.0 8.1 29.0 31.4 10.6 12.0 8.82006 992 23.5 2.1 3.0 25.3 46.0 7.9 20.8 17.3
Germany - Allemagne 1995 523 697 5.1 1.1 1.0 2.8 84.5 13.2 46.9 24.32000 549 607 4.2 0.9 1.4 2.6 83.6 12.7 49.6 21.32006 1 121 963 4.4 0.9 2.5 3.4 84.9 14.0 49.1 21.8
Ghana 1995 1 754 40.9 10.3 3.4 36.1 9.3 0.1 0.5 8.72000 1 671 30.7 6.5 4.9 48.6 9.3 0.6 1.2 7.52006 3 614 41.9 2.8 0.4 34.1 20.6 1.1 0.4 19.1
Greece - Grèce 1995 10 955 29.5 4.4 6.5 7.9 49.8 4.9 8.0 36.92000 10 964 21.8 3.3 14.7 7.7 49.7 8.0 12.0 29.62006 20 943 20.3 2.4 13.0 10.8 50.8 13.1 12.6 25.2
Greenland - Groenland 1995 364 95.1 0.6 0.8 0.0 1.5 0.0 0.3 1.22000 271 95.5 0.4 0.0 0.0 1.3 0.0 0.7 0.62006 408 84.4 0.0 0.0 7.3 4.0 0.0 1.1 2.9
Grenada - Grenade 1995 22 79.5 0.1 0.0 0.2 20.3 2.6 3.8 13.82000 76 33.1 0.0 0.0 0.1 66.8 1.4 58.6 6.92006 25 54.8 0.0 0.1 0.1 45.0 4.7 11.9 28.4
Guatemala 1995 1 936 65.2 4.1 2.0 0.5 28.2 10.9 1.8 15.52000 2 699 56.2 3.8 6.0 1.9 32.1 11.7 2.4 18.02006 3 198 49.8 5.4 8.8 1.1 34.9 12.3 4.2 18.4
Guinea - Guinée 1995 702 7.4 1.1 0.5 70.3 20.7 18.2 2.1 0.42000 522 2.5 2.4 0.0 70.2 24.7 10.9 0.9 12.92006 976 8.8 2.5 5.5 78.0 3.1 0.1 2.3 0.8
Guinea-Bissau - Guinée-Bissau 1995 28 81.9 6.3 4.6 0.1 7.2 0.0 6.6 0.62000 62 51.1 4.1 43.7 0.0 0.7 0.0 0.1 0.62006 84 81.3 0.4 0.5 0.6 17.0 0.4 11.5 5.0
For sources and notes, see end of table. Pour les sources et les notes, se reporter à la fin du tableau.
Manu-facturedgoods
Articlesmanu-
facturés
Of which: / dont :
Country or territory
Pays ou territoires
Year
Année
Total value(millions of
dollars)
Valeur totale(millions de
dollars)
By main SITC Revision 3 product group (percentage)Par principaux groupes de produits de la CTCI Révision 3 (en pourcentage)
All food items
Produitsalimentaires
Agriculturalraw
materials
Matièrespremièresagricoles
Fuels
Combus-tibles
Ores, metals, precious
stones and non-monetary gold
Minerais,métaux, pierres précieuses et
or(non
monétaire)
3.1 Country trade structureby product groupExports
Structure du commerce des payspar groupes de produitsExportations
3.1
3
125
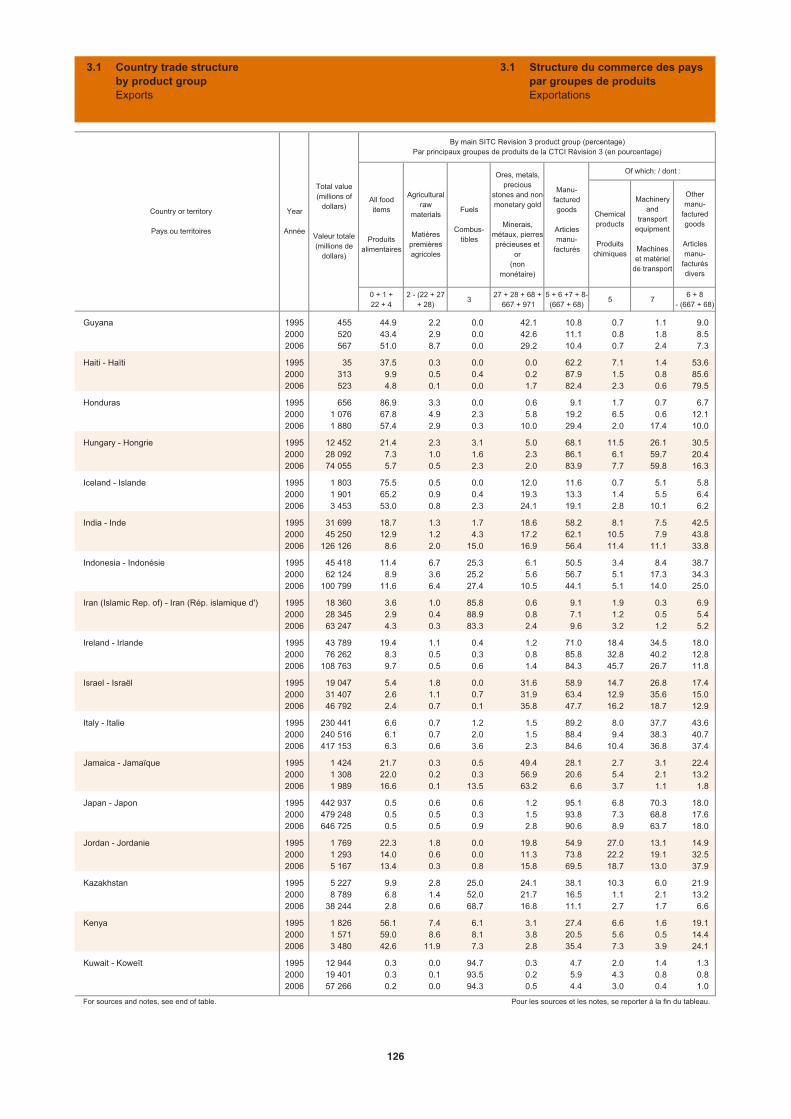
Chemicalproducts
Produitschimiques
Machineryand
transportequipment
Machineset matériel
de transport
Othermanu-
facturedgoods
Articlesmanu-
facturésdivers
0 + 1 + 22 + 4
2 - (22 + 27 + 28)
327 + 28 + 68 +
667 + 9715 + 6 +7 + 8-(667 + 68)
5 76 + 8
- (667 + 68)
Guyana 1995 455 44.9 2.2 0.0 42.1 10.8 0.7 1.1 9.02000 520 43.4 2.9 0.0 42.6 11.1 0.8 1.8 8.52006 567 51.0 8.7 0.0 29.2 10.4 0.7 2.4 7.3
Haiti - Haïti 1995 35 37.5 0.3 0.0 0.0 62.2 7.1 1.4 53.62000 313 9.9 0.5 0.4 0.2 87.9 1.5 0.8 85.62006 523 4.8 0.1 0.0 1.7 82.4 2.3 0.6 79.5
Honduras 1995 656 86.9 3.3 0.0 0.6 9.1 1.7 0.7 6.72000 1 076 67.8 4.9 2.3 5.8 19.2 6.5 0.6 12.12006 1 880 57.4 2.9 0.3 10.0 29.4 2.0 17.4 10.0
Hungary - Hongrie 1995 12 452 21.4 2.3 3.1 5.0 68.1 11.5 26.1 30.52000 28 092 7.3 1.0 1.6 2.3 86.1 6.1 59.7 20.42006 74 055 5.7 0.5 2.3 2.0 83.9 7.7 59.8 16.3
Iceland - Islande 1995 1 803 75.5 0.5 0.0 12.0 11.6 0.7 5.1 5.82000 1 901 65.2 0.9 0.4 19.3 13.3 1.4 5.5 6.42006 3 453 53.0 0.8 2.3 24.1 19.1 2.8 10.1 6.2
India - Inde 1995 31 699 18.7 1.3 1.7 18.6 58.2 8.1 7.5 42.52000 45 250 12.9 1.2 4.3 17.2 62.1 10.5 7.9 43.82006 126 126 8.6 2.0 15.0 16.9 56.4 11.4 11.1 33.8
Indonesia - Indonésie 1995 45 418 11.4 6.7 25.3 6.1 50.5 3.4 8.4 38.72000 62 124 8.9 3.6 25.2 5.6 56.7 5.1 17.3 34.32006 100 799 11.6 6.4 27.4 10.5 44.1 5.1 14.0 25.0
Iran (Islamic Rep. of) - Iran (Rép. islamique d') 1995 18 360 3.6 1.0 85.8 0.6 9.1 1.9 0.3 6.92000 28 345 2.9 0.4 88.9 0.8 7.1 1.2 0.5 5.42006 63 247 4.3 0.3 83.3 2.4 9.6 3.2 1.2 5.2
Ireland - Irlande 1995 43 789 19.4 1.1 0.4 1.2 71.0 18.4 34.5 18.02000 76 262 8.3 0.5 0.3 0.8 85.8 32.8 40.2 12.82006 108 763 9.7 0.5 0.6 1.4 84.3 45.7 26.7 11.8
Israel - Israël 1995 19 047 5.4 1.8 0.0 31.6 58.9 14.7 26.8 17.42000 31 407 2.6 1.1 0.7 31.9 63.4 12.9 35.6 15.02006 46 792 2.4 0.7 0.1 35.8 47.7 16.2 18.7 12.9
Italy - Italie 1995 230 441 6.6 0.7 1.2 1.5 89.2 8.0 37.7 43.62000 240 516 6.1 0.7 2.0 1.5 88.4 9.4 38.3 40.72006 417 153 6.3 0.6 3.6 2.3 84.6 10.4 36.8 37.4
Jamaica - Jamaïque 1995 1 424 21.7 0.3 0.5 49.4 28.1 2.7 3.1 22.42000 1 308 22.0 0.2 0.3 56.9 20.6 5.4 2.1 13.22006 1 989 16.6 0.1 13.5 63.2 6.6 3.7 1.1 1.8
Japan - Japon 1995 442 937 0.5 0.6 0.6 1.2 95.1 6.8 70.3 18.02000 479 248 0.5 0.5 0.3 1.5 93.8 7.3 68.8 17.62006 646 725 0.5 0.5 0.9 2.8 90.6 8.9 63.7 18.0
Jordan - Jordanie 1995 1 769 22.3 1.8 0.0 19.8 54.9 27.0 13.1 14.92000 1 293 14.0 0.6 0.0 11.3 73.8 22.2 19.1 32.52006 5 167 13.4 0.3 0.8 15.8 69.5 18.7 13.0 37.9
Kazakhstan 1995 5 227 9.9 2.8 25.0 24.1 38.1 10.3 6.0 21.92000 8 789 6.8 1.4 52.0 21.7 16.5 1.1 2.1 13.22006 38 244 2.8 0.6 68.7 16.8 11.1 2.7 1.7 6.6
Kenya 1995 1 826 56.1 7.4 6.1 3.1 27.4 6.6 1.6 19.12000 1 571 59.0 8.6 8.1 3.8 20.5 5.6 0.5 14.42006 3 480 42.6 11.9 7.3 2.8 35.4 7.3 3.9 24.1
Kuwait - Koweït 1995 12 944 0.3 0.0 94.7 0.3 4.7 2.0 1.4 1.32000 19 401 0.3 0.1 93.5 0.2 5.9 4.3 0.8 0.82006 57 266 0.2 0.0 94.3 0.5 4.4 3.0 0.4 1.0
For sources and notes, see end of table. Pour les sources et les notes, se reporter à la fin du tableau.
Country or territory
Pays ou territoires
Year
Année
Total value(millions of
dollars)
Valeur totale(millions de
dollars)
By main SITC Revision 3 product group (percentage)Par principaux groupes de produits de la CTCI Révision 3 (en pourcentage)
All food items
Produitsalimentaires
Agriculturalraw
materials
Matièrespremièresagricoles
Fuels
Combus-tibles
Ores, metals, precious
stones and non-monetary gold
Minerais,métaux, pierres précieuses et
or(non
monétaire)
Manu-facturedgoods
Articlesmanu-
facturés
Of which: / dont :
3.1 Country trade structureby product groupExports
Structure du commerce des payspar groupes de produitsExportations
3.1
126
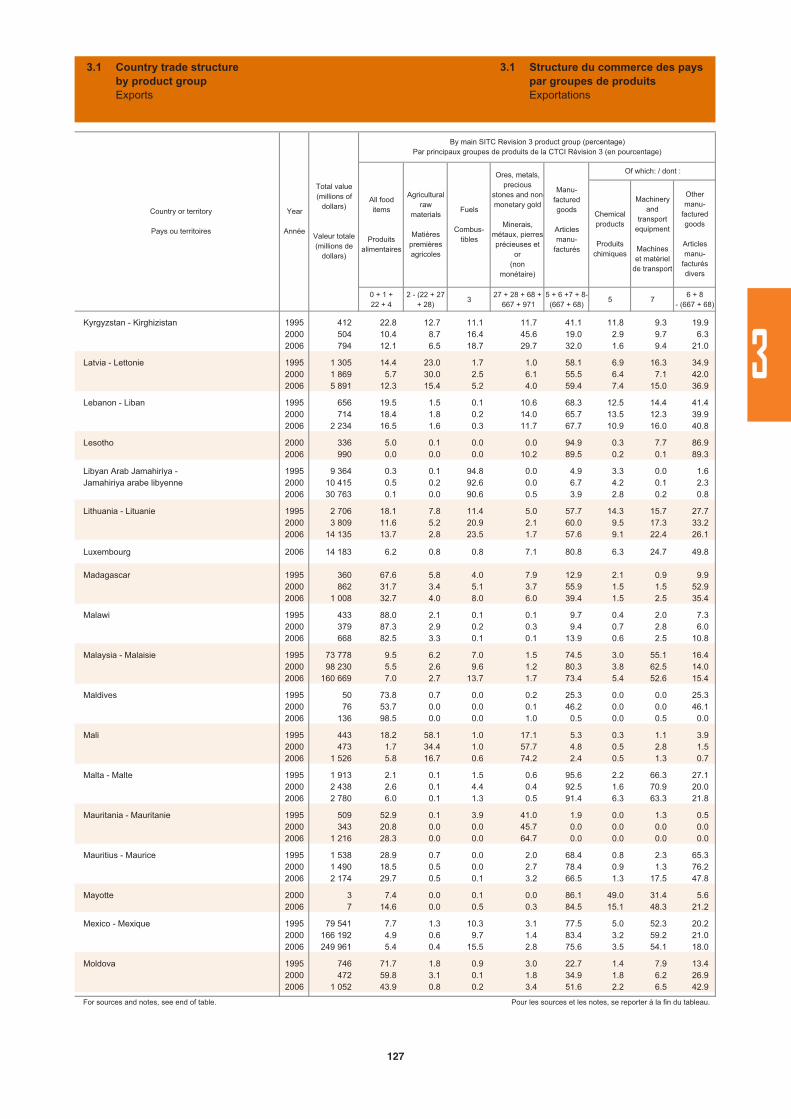
Chemicalproducts
Produitschimiques
Machineryand
transportequipment
Machineset matériel
de transport
Othermanu-
facturedgoods
Articlesmanu-
facturésdivers
0 + 1 + 22 + 4
2 - (22 + 27 + 28)
327 + 28 + 68 +
667 + 9715 + 6 +7 + 8-(667 + 68)
5 76 + 8
- (667 + 68)
Kyrgyzstan - Kirghizistan 1995 412 22.8 12.7 11.1 11.7 41.1 11.8 9.3 19.92000 504 10.4 8.7 16.4 45.6 19.0 2.9 9.7 6.32006 794 12.1 6.5 18.7 29.7 32.0 1.6 9.4 21.0
Latvia - Lettonie 1995 1 305 14.4 23.0 1.7 1.0 58.1 6.9 16.3 34.92000 1 869 5.7 30.0 2.5 6.1 55.5 6.4 7.1 42.02006 5 891 12.3 15.4 5.2 4.0 59.4 7.4 15.0 36.9
Lebanon - Liban 1995 656 19.5 1.5 0.1 10.6 68.3 12.5 14.4 41.42000 714 18.4 1.8 0.2 14.0 65.7 13.5 12.3 39.92006 2 234 16.5 1.6 0.3 11.7 67.7 10.9 16.0 40.8
Lesotho 2000 336 5.0 0.1 0.0 0.0 94.9 0.3 7.7 86.92006 990 0.0 0.0 0.0 10.2 89.5 0.2 0.1 89.3
Libyan Arab Jamahiriya - 1995 9 364 0.3 0.1 94.8 0.0 4.9 3.3 0.0 1.6Jamahiriya arabe libyenne 2000 10 415 0.5 0.2 92.6 0.0 6.7 4.2 0.1 2.3
2006 30 763 0.1 0.0 90.6 0.5 3.9 2.8 0.2 0.8
Lithuania - Lituanie 1995 2 706 18.1 7.8 11.4 5.0 57.7 14.3 15.7 27.72000 3 809 11.6 5.2 20.9 2.1 60.0 9.5 17.3 33.22006 14 135 13.7 2.8 23.5 1.7 57.6 9.1 22.4 26.1
Luxembourg 2006 14 183 6.2 0.8 0.8 7.1 80.8 6.3 24.7 49.8
Madagascar 1995 360 67.6 5.8 4.0 7.9 12.9 2.1 0.9 9.92000 862 31.7 3.4 5.1 3.7 55.9 1.5 1.5 52.92006 1 008 32.7 4.0 8.0 6.0 39.4 1.5 2.5 35.4
Malawi 1995 433 88.0 2.1 0.1 0.1 9.7 0.4 2.0 7.32000 379 87.3 2.9 0.2 0.3 9.4 0.7 2.8 6.02006 668 82.5 3.3 0.1 0.1 13.9 0.6 2.5 10.8
Malaysia - Malaisie 1995 73 778 9.5 6.2 7.0 1.5 74.5 3.0 55.1 16.42000 98 230 5.5 2.6 9.6 1.2 80.3 3.8 62.5 14.02006 160 669 7.0 2.7 13.7 1.7 73.4 5.4 52.6 15.4
Maldives 1995 50 73.8 0.7 0.0 0.2 25.3 0.0 0.0 25.32000 76 53.7 0.0 0.0 0.1 46.2 0.0 0.0 46.12006 136 98.5 0.0 0.0 1.0 0.5 0.0 0.5 0.0
Mali 1995 443 18.2 58.1 1.0 17.1 5.3 0.3 1.1 3.92000 473 1.7 34.4 1.0 57.7 4.8 0.5 2.8 1.52006 1 526 5.8 16.7 0.6 74.2 2.4 0.5 1.3 0.7
Malta - Malte 1995 1 913 2.1 0.1 1.5 0.6 95.6 2.2 66.3 27.12000 2 438 2.6 0.1 4.4 0.4 92.5 1.6 70.9 20.02006 2 780 6.0 0.1 1.3 0.5 91.4 6.3 63.3 21.8
Mauritania - Mauritanie 1995 509 52.9 0.1 3.9 41.0 1.9 0.0 1.3 0.52000 343 20.8 0.0 0.0 45.7 0.0 0.0 0.0 0.02006 1 216 28.3 0.0 0.0 64.7 0.0 0.0 0.0 0.0
Mauritius - Maurice 1995 1 538 28.9 0.7 0.0 2.0 68.4 0.8 2.3 65.32000 1 490 18.5 0.5 0.0 2.7 78.4 0.9 1.3 76.22006 2 174 29.7 0.5 0.1 3.2 66.5 1.3 17.5 47.8
Mayotte 2000 3 7.4 0.0 0.1 0.0 86.1 49.0 31.4 5.62006 7 14.6 0.0 0.5 0.3 84.5 15.1 48.3 21.2
Mexico - Mexique 1995 79 541 7.7 1.3 10.3 3.1 77.5 5.0 52.3 20.22000 166 192 4.9 0.6 9.7 1.4 83.4 3.2 59.2 21.02006 249 961 5.4 0.4 15.5 2.8 75.6 3.5 54.1 18.0
Moldova 1995 746 71.7 1.8 0.9 3.0 22.7 1.4 7.9 13.42000 472 59.8 3.1 0.1 1.8 34.9 1.8 6.2 26.92006 1 052 43.9 0.8 0.2 3.4 51.6 2.2 6.5 42.9
For sources and notes, see end of table. Pour les sources et les notes, se reporter à la fin du tableau.
Manu-facturedgoods
Articlesmanu-
facturés
Of which: / dont :
Country or territory
Pays ou territoires
Year
Année
Total value(millions of
dollars)
Valeur totale(millions de
dollars)
By main SITC Revision 3 product group (percentage)Par principaux groupes de produits de la CTCI Révision 3 (en pourcentage)
All food items
Produitsalimentaires
Agriculturalraw
materials
Matièrespremièresagricoles
Fuels
Combus-tibles
Ores, metals, precious
stones and non-monetary gold
Minerais,métaux, pierres précieuses et
or(non
monétaire)
3.1 Country trade structureby product groupExports
Structure du commerce des payspar groupes de produitsExportations
3.1
3
127
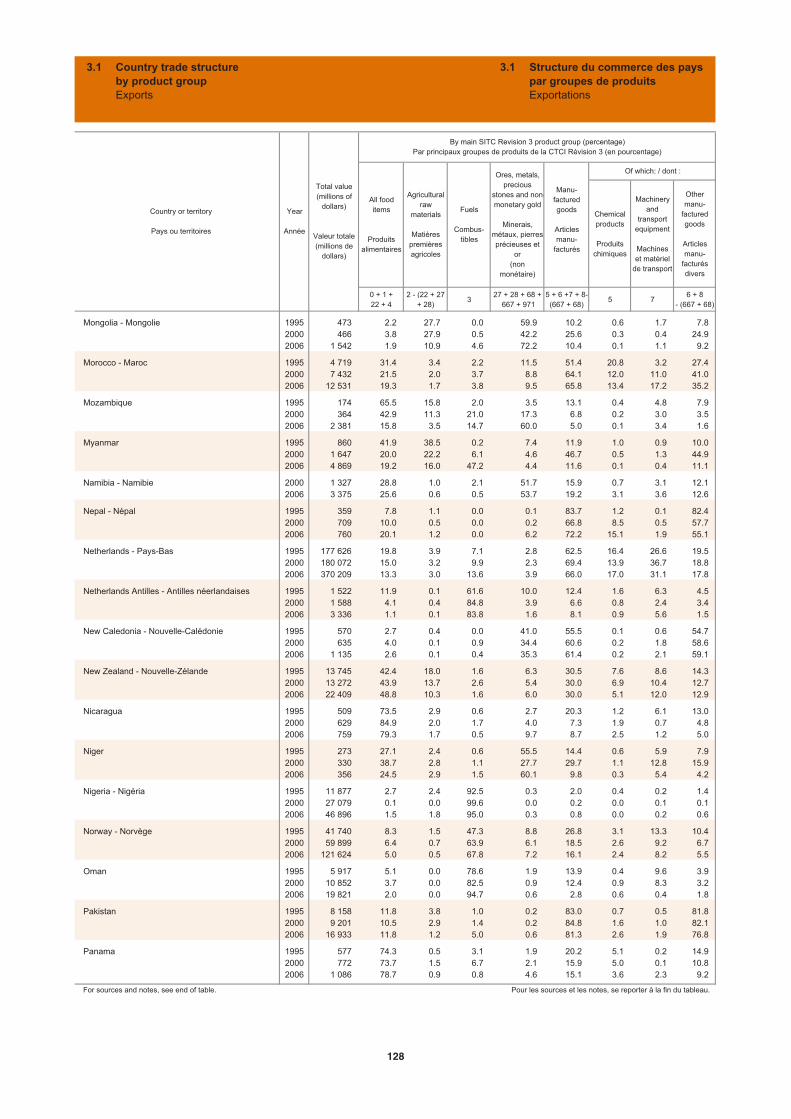
Chemicalproducts
Produitschimiques
Machineryand
transportequipment
Machineset matériel
de transport
Othermanu-
facturedgoods
Articlesmanu-
facturésdivers
0 + 1 + 22 + 4
2 - (22 + 27 + 28)
327 + 28 + 68 +
667 + 9715 + 6 +7 + 8-(667 + 68)
5 76 + 8
- (667 + 68)
Mongolia - Mongolie 1995 473 2.2 27.7 0.0 59.9 10.2 0.6 1.7 7.82000 466 3.8 27.9 0.5 42.2 25.6 0.3 0.4 24.92006 1 542 1.9 10.9 4.6 72.2 10.4 0.1 1.1 9.2
Morocco - Maroc 1995 4 719 31.4 3.4 2.2 11.5 51.4 20.8 3.2 27.42000 7 432 21.5 2.0 3.7 8.8 64.1 12.0 11.0 41.02006 12 531 19.3 1.7 3.8 9.5 65.8 13.4 17.2 35.2
Mozambique 1995 174 65.5 15.8 2.0 3.5 13.1 0.4 4.8 7.92000 364 42.9 11.3 21.0 17.3 6.8 0.2 3.0 3.52006 2 381 15.8 3.5 14.7 60.0 5.0 0.1 3.4 1.6
Myanmar 1995 860 41.9 38.5 0.2 7.4 11.9 1.0 0.9 10.02000 1 647 20.0 22.2 6.1 4.6 46.7 0.5 1.3 44.92006 4 869 19.2 16.0 47.2 4.4 11.6 0.1 0.4 11.1
Namibia - Namibie 2000 1 327 28.8 1.0 2.1 51.7 15.9 0.7 3.1 12.12006 3 375 25.6 0.6 0.5 53.7 19.2 3.1 3.6 12.6
Nepal - Népal 1995 359 7.8 1.1 0.0 0.1 83.7 1.2 0.1 82.42000 709 10.0 0.5 0.0 0.2 66.8 8.5 0.5 57.72006 760 20.1 1.2 0.0 6.2 72.2 15.1 1.9 55.1
Netherlands - Pays-Bas 1995 177 626 19.8 3.9 7.1 2.8 62.5 16.4 26.6 19.52000 180 072 15.0 3.2 9.9 2.3 69.4 13.9 36.7 18.82006 370 209 13.3 3.0 13.6 3.9 66.0 17.0 31.1 17.8
Netherlands Antilles - Antilles néerlandaises 1995 1 522 11.9 0.1 61.6 10.0 12.4 1.6 6.3 4.52000 1 588 4.1 0.4 84.8 3.9 6.6 0.8 2.4 3.42006 3 336 1.1 0.1 83.8 1.6 8.1 0.9 5.6 1.5
New Caledonia - Nouvelle-Calédonie 1995 570 2.7 0.4 0.0 41.0 55.5 0.1 0.6 54.72000 635 4.0 0.1 0.9 34.4 60.6 0.2 1.8 58.62006 1 135 2.6 0.1 0.4 35.3 61.4 0.2 2.1 59.1
New Zealand - Nouvelle-Zélande 1995 13 745 42.4 18.0 1.6 6.3 30.5 7.6 8.6 14.32000 13 272 43.9 13.7 2.6 5.4 30.0 6.9 10.4 12.72006 22 409 48.8 10.3 1.6 6.0 30.0 5.1 12.0 12.9
Nicaragua 1995 509 73.5 2.9 0.6 2.7 20.3 1.2 6.1 13.02000 629 84.9 2.0 1.7 4.0 7.3 1.9 0.7 4.82006 759 79.3 1.7 0.5 9.7 8.7 2.5 1.2 5.0
Niger 1995 273 27.1 2.4 0.6 55.5 14.4 0.6 5.9 7.92000 330 38.7 2.8 1.1 27.7 29.7 1.1 12.8 15.92006 356 24.5 2.9 1.5 60.1 9.8 0.3 5.4 4.2
Nigeria - Nigéria 1995 11 877 2.7 2.4 92.5 0.3 2.0 0.4 0.2 1.42000 27 079 0.1 0.0 99.6 0.0 0.2 0.0 0.1 0.12006 46 896 1.5 1.8 95.0 0.3 0.8 0.0 0.2 0.6
Norway - Norvège 1995 41 740 8.3 1.5 47.3 8.8 26.8 3.1 13.3 10.42000 59 899 6.4 0.7 63.9 6.1 18.5 2.6 9.2 6.72006 121 624 5.0 0.5 67.8 7.2 16.1 2.4 8.2 5.5
Oman 1995 5 917 5.1 0.0 78.6 1.9 13.9 0.4 9.6 3.92000 10 852 3.7 0.0 82.5 0.9 12.4 0.9 8.3 3.22006 19 821 2.0 0.0 94.7 0.6 2.8 0.6 0.4 1.8
Pakistan 1995 8 158 11.8 3.8 1.0 0.2 83.0 0.7 0.5 81.82000 9 201 10.5 2.9 1.4 0.2 84.8 1.6 1.0 82.12006 16 933 11.8 1.2 5.0 0.6 81.3 2.6 1.9 76.8
Panama 1995 577 74.3 0.5 3.1 1.9 20.2 5.1 0.2 14.92000 772 73.7 1.5 6.7 2.1 15.9 5.0 0.1 10.82006 1 086 78.7 0.9 0.8 4.6 15.1 3.6 2.3 9.2
For sources and notes, see end of table. Pour les sources et les notes, se reporter à la fin du tableau.
Country or territory
Pays ou territoires
Year
Année
Total value(millions of
dollars)
Valeur totale(millions de
dollars)
By main SITC Revision 3 product group (percentage)Par principaux groupes de produits de la CTCI Révision 3 (en pourcentage)
All food items
Produitsalimentaires
Agriculturalraw
materials
Matièrespremièresagricoles
Fuels
Combus-tibles
Ores, metals, precious
stones and non-monetary gold
Minerais,métaux, pierres précieuses et
or(non
monétaire)
Manu-facturedgoods
Articlesmanu-
facturés
Of which: / dont :
3.1 Country trade structureby product groupExports
Structure du commerce des payspar groupes de produitsExportations
3.1
128
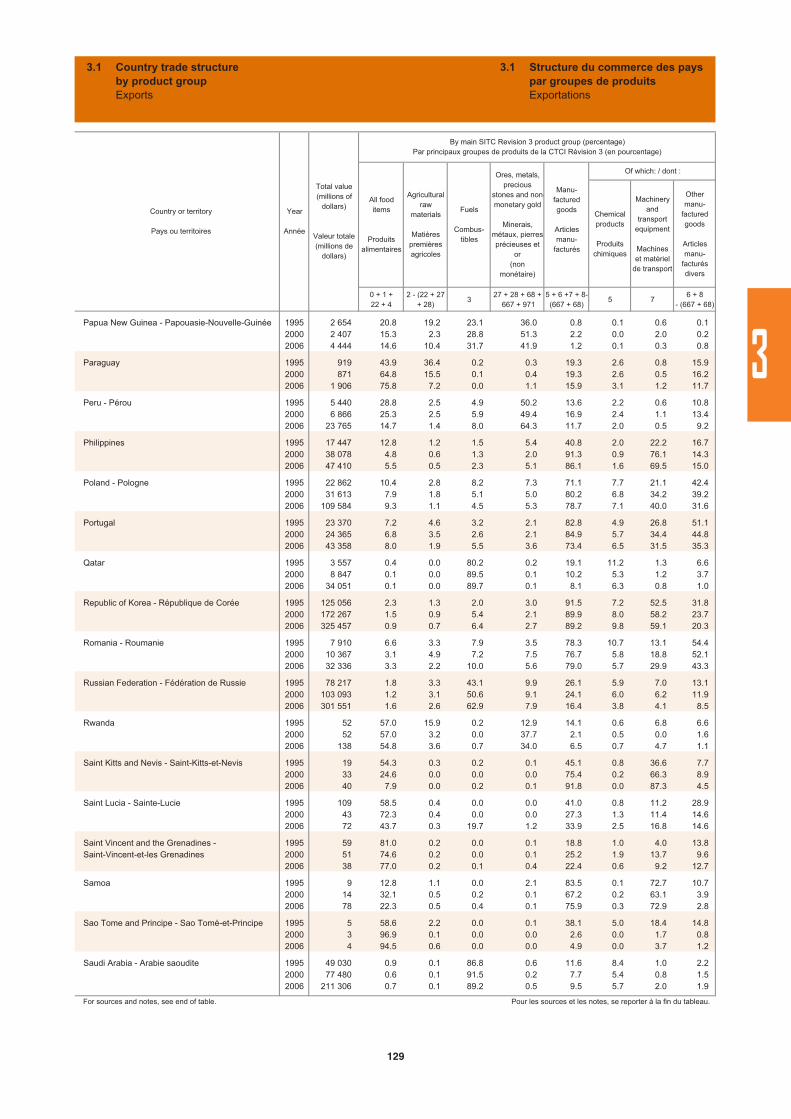
Chemicalproducts
Produitschimiques
Machineryand
transportequipment
Machineset matériel
de transport
Othermanu-
facturedgoods
Articlesmanu-
facturésdivers
0 + 1 + 22 + 4
2 - (22 + 27 + 28)
327 + 28 + 68 +
667 + 9715 + 6 +7 + 8-(667 + 68)
5 76 + 8
- (667 + 68)
Papua New Guinea - Papouasie-Nouvelle-Guinée 1995 2 654 20.8 19.2 23.1 36.0 0.8 0.1 0.6 0.12000 2 407 15.3 2.3 28.8 51.3 2.2 0.0 2.0 0.22006 4 444 14.6 10.4 31.7 41.9 1.2 0.1 0.3 0.8
Paraguay 1995 919 43.9 36.4 0.2 0.3 19.3 2.6 0.8 15.92000 871 64.8 15.5 0.1 0.4 19.3 2.6 0.5 16.22006 1 906 75.8 7.2 0.0 1.1 15.9 3.1 1.2 11.7
Peru - Pérou 1995 5 440 28.8 2.5 4.9 50.2 13.6 2.2 0.6 10.82000 6 866 25.3 2.5 5.9 49.4 16.9 2.4 1.1 13.42006 23 765 14.7 1.4 8.0 64.3 11.7 2.0 0.5 9.2
Philippines 1995 17 447 12.8 1.2 1.5 5.4 40.8 2.0 22.2 16.72000 38 078 4.8 0.6 1.3 2.0 91.3 0.9 76.1 14.32006 47 410 5.5 0.5 2.3 5.1 86.1 1.6 69.5 15.0
Poland - Pologne 1995 22 862 10.4 2.8 8.2 7.3 71.1 7.7 21.1 42.42000 31 613 7.9 1.8 5.1 5.0 80.2 6.8 34.2 39.22006 109 584 9.3 1.1 4.5 5.3 78.7 7.1 40.0 31.6
Portugal 1995 23 370 7.2 4.6 3.2 2.1 82.8 4.9 26.8 51.12000 24 365 6.8 3.5 2.6 2.1 84.9 5.7 34.4 44.82006 43 358 8.0 1.9 5.5 3.6 73.4 6.5 31.5 35.3
Qatar 1995 3 557 0.4 0.0 80.2 0.2 19.1 11.2 1.3 6.62000 8 847 0.1 0.0 89.5 0.1 10.2 5.3 1.2 3.72006 34 051 0.1 0.0 89.7 0.1 8.1 6.3 0.8 1.0
Republic of Korea - République de Corée 1995 125 056 2.3 1.3 2.0 3.0 91.5 7.2 52.5 31.82000 172 267 1.5 0.9 5.4 2.1 89.9 8.0 58.2 23.72006 325 457 0.9 0.7 6.4 2.7 89.2 9.8 59.1 20.3
Romania - Roumanie 1995 7 910 6.6 3.3 7.9 3.5 78.3 10.7 13.1 54.42000 10 367 3.1 4.9 7.2 7.5 76.7 5.8 18.8 52.12006 32 336 3.3 2.2 10.0 5.6 79.0 5.7 29.9 43.3
Russian Federation - Fédération de Russie 1995 78 217 1.8 3.3 43.1 9.9 26.1 5.9 7.0 13.12000 103 093 1.2 3.1 50.6 9.1 24.1 6.0 6.2 11.92006 301 551 1.6 2.6 62.9 7.9 16.4 3.8 4.1 8.5
Rwanda 1995 52 57.0 15.9 0.2 12.9 14.1 0.6 6.8 6.62000 52 57.0 3.2 0.0 37.7 2.1 0.5 0.0 1.62006 138 54.8 3.6 0.7 34.0 6.5 0.7 4.7 1.1
Saint Kitts and Nevis - Saint-Kitts-et-Nevis 1995 19 54.3 0.3 0.2 0.1 45.1 0.8 36.6 7.72000 33 24.6 0.0 0.0 0.0 75.4 0.2 66.3 8.92006 40 7.9 0.0 0.2 0.1 91.8 0.0 87.3 4.5
Saint Lucia - Sainte-Lucie 1995 109 58.5 0.4 0.0 0.0 41.0 0.8 11.2 28.92000 43 72.3 0.4 0.0 0.0 27.3 1.3 11.4 14.62006 72 43.7 0.3 19.7 1.2 33.9 2.5 16.8 14.6
Saint Vincent and the Grenadines - 1995 59 81.0 0.2 0.0 0.1 18.8 1.0 4.0 13.8Saint-Vincent-et-les Grenadines 2000 51 74.6 0.2 0.0 0.1 25.2 1.9 13.7 9.6
2006 38 77.0 0.2 0.1 0.4 22.4 0.6 9.2 12.7
Samoa 1995 9 12.8 1.1 0.0 2.1 83.5 0.1 72.7 10.72000 14 32.1 0.5 0.2 0.1 67.2 0.2 63.1 3.92006 78 22.3 0.5 0.4 0.1 75.9 0.3 72.9 2.8
Sao Tome and Principe - Sao Tomé-et-Principe 1995 5 58.6 2.2 0.0 0.1 38.1 5.0 18.4 14.82000 3 96.9 0.1 0.0 0.0 2.6 0.0 1.7 0.82006 4 94.5 0.6 0.0 0.0 4.9 0.0 3.7 1.2
Saudi Arabia - Arabie saoudite 1995 49 030 0.9 0.1 86.8 0.6 11.6 8.4 1.0 2.22000 77 480 0.6 0.1 91.5 0.2 7.7 5.4 0.8 1.52006 211 306 0.7 0.1 89.2 0.5 9.5 5.7 2.0 1.9
For sources and notes, see end of table. Pour les sources et les notes, se reporter à la fin du tableau.
Manu-facturedgoods
Articlesmanu-
facturés
Of which: / dont :
Country or territory
Pays ou territoires
Year
Année
Total value(millions of
dollars)
Valeur totale(millions de
dollars)
By main SITC Revision 3 product group (percentage)Par principaux groupes de produits de la CTCI Révision 3 (en pourcentage)
All food items
Produitsalimentaires
Agriculturalraw
materials
Matièrespremièresagricoles
Fuels
Combus-tibles
Ores, metals, precious
stones and non-monetary gold
Minerais,métaux, pierres précieuses et
or(non
monétaire)
3.1 Country trade structureby product groupExports
Structure du commerce des payspar groupes de produitsExportations
3.1
3
129
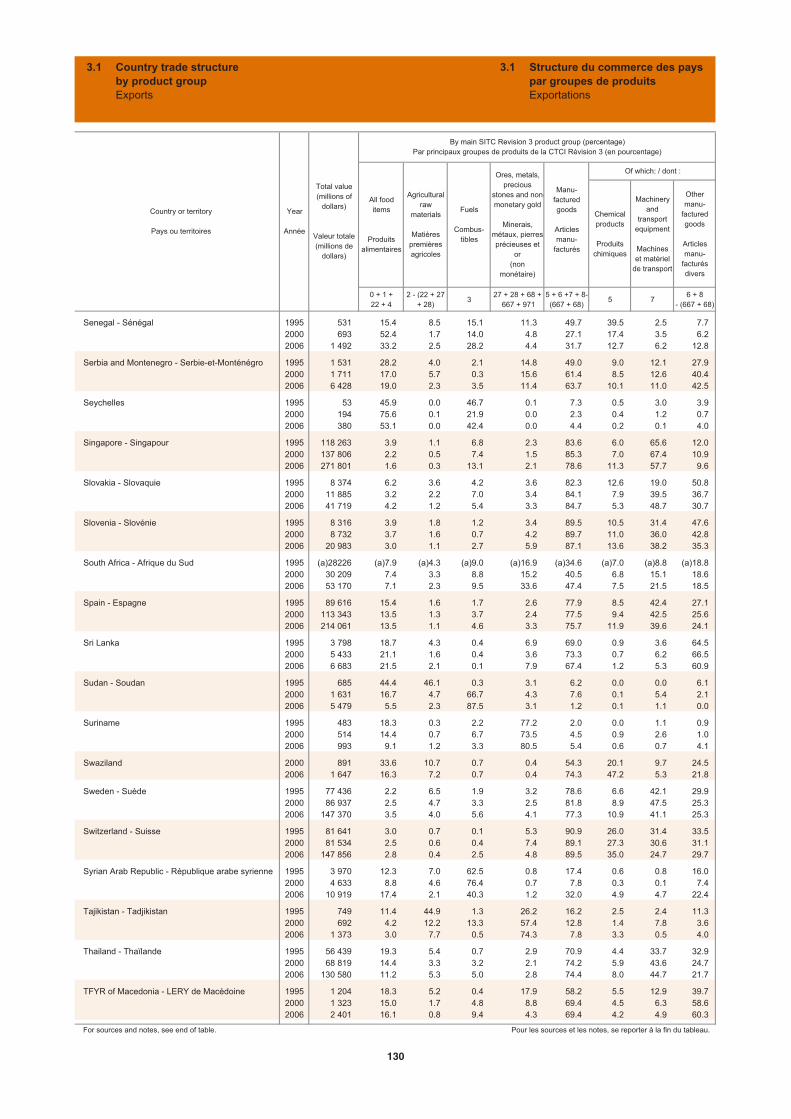
Chemicalproducts
Produitschimiques
Machineryand
transportequipment
Machineset matériel
de transport
Othermanu-
facturedgoods
Articlesmanu-
facturésdivers
0 + 1 + 22 + 4
2 - (22 + 27 + 28)
327 + 28 + 68 +
667 + 9715 + 6 +7 + 8-(667 + 68)
5 76 + 8
- (667 + 68)
Senegal - Sénégal 1995 531 15.4 8.5 15.1 11.3 49.7 39.5 2.5 7.72000 693 52.4 1.7 14.0 4.8 27.1 17.4 3.5 6.22006 1 492 33.2 2.5 28.2 4.4 31.7 12.7 6.2 12.8
Serbia and Montenegro - Serbie-et-Monténégro 1995 1 531 28.2 4.0 2.1 14.8 49.0 9.0 12.1 27.92000 1 711 17.0 5.7 0.3 15.6 61.4 8.5 12.6 40.42006 6 428 19.0 2.3 3.5 11.4 63.7 10.1 11.0 42.5
Seychelles 1995 53 45.9 0.0 46.7 0.1 7.3 0.5 3.0 3.92000 194 75.6 0.1 21.9 0.0 2.3 0.4 1.2 0.72006 380 53.1 0.0 42.4 0.0 4.4 0.2 0.1 4.0
Singapore - Singapour 1995 118 263 3.9 1.1 6.8 2.3 83.6 6.0 65.6 12.02000 137 806 2.2 0.5 7.4 1.5 85.3 7.0 67.4 10.92006 271 801 1.6 0.3 13.1 2.1 78.6 11.3 57.7 9.6
Slovakia - Slovaquie 1995 8 374 6.2 3.6 4.2 3.6 82.3 12.6 19.0 50.82000 11 885 3.2 2.2 7.0 3.4 84.1 7.9 39.5 36.72006 41 719 4.2 1.2 5.4 3.3 84.7 5.3 48.7 30.7
Slovenia - Slovénie 1995 8 316 3.9 1.8 1.2 3.4 89.5 10.5 31.4 47.62000 8 732 3.7 1.6 0.7 4.2 89.7 11.0 36.0 42.82006 20 983 3.0 1.1 2.7 5.9 87.1 13.6 38.2 35.3
South Africa - Afrique du Sud 1995 (a)28226 (a)7.9 (a)4.3 (a)9.0 (a)16.9 (a)34.6 (a)7.0 (a)8.8 (a)18.82000 30 209 7.4 3.3 8.8 15.2 40.5 6.8 15.1 18.62006 53 170 7.1 2.3 9.5 33.6 47.4 7.5 21.5 18.5
Spain - Espagne 1995 89 616 15.4 1.6 1.7 2.6 77.9 8.5 42.4 27.12000 113 343 13.5 1.3 3.7 2.4 77.5 9.4 42.5 25.62006 214 061 13.5 1.1 4.6 3.3 75.7 11.9 39.6 24.1
Sri Lanka 1995 3 798 18.7 4.3 0.4 6.9 69.0 0.9 3.6 64.52000 5 433 21.1 1.6 0.4 3.6 73.3 0.7 6.2 66.52006 6 683 21.5 2.1 0.1 7.9 67.4 1.2 5.3 60.9
Sudan - Soudan 1995 685 44.4 46.1 0.3 3.1 6.2 0.0 0.0 6.12000 1 631 16.7 4.7 66.7 4.3 7.6 0.1 5.4 2.12006 5 479 5.5 2.3 87.5 3.1 1.2 0.1 1.1 0.0
Suriname 1995 483 18.3 0.3 2.2 77.2 2.0 0.0 1.1 0.92000 514 14.4 0.7 6.7 73.5 4.5 0.9 2.6 1.02006 993 9.1 1.2 3.3 80.5 5.4 0.6 0.7 4.1
Swaziland 2000 891 33.6 10.7 0.7 0.4 54.3 20.1 9.7 24.52006 1 647 16.3 7.2 0.7 0.4 74.3 47.2 5.3 21.8
Sweden - Suède 1995 77 436 2.2 6.5 1.9 3.2 78.6 6.6 42.1 29.92000 86 937 2.5 4.7 3.3 2.5 81.8 8.9 47.5 25.32006 147 370 3.5 4.0 5.6 4.1 77.3 10.9 41.1 25.3
Switzerland - Suisse 1995 81 641 3.0 0.7 0.1 5.3 90.9 26.0 31.4 33.52000 81 534 2.5 0.6 0.4 7.4 89.1 27.3 30.6 31.12006 147 856 2.8 0.4 2.5 4.8 89.5 35.0 24.7 29.7
Syrian Arab Republic - République arabe syrienne 1995 3 970 12.3 7.0 62.5 0.8 17.4 0.6 0.8 16.02000 4 633 8.8 4.6 76.4 0.7 7.8 0.3 0.1 7.42006 10 919 17.4 2.1 40.3 1.2 32.0 4.9 4.7 22.4
Tajikistan - Tadjikistan 1995 749 11.4 44.9 1.3 26.2 16.2 2.5 2.4 11.32000 692 4.2 12.2 13.3 57.4 12.8 1.4 7.8 3.62006 1 373 3.0 7.7 0.5 74.3 7.8 3.3 0.5 4.0
Thailand - Thaïlande 1995 56 439 19.3 5.4 0.7 2.9 70.9 4.4 33.7 32.92000 68 819 14.4 3.3 3.2 2.1 74.2 5.9 43.6 24.72006 130 580 11.2 5.3 5.0 2.8 74.4 8.0 44.7 21.7
TFYR of Macedonia - LERY de Macédoine 1995 1 204 18.3 5.2 0.4 17.9 58.2 5.5 12.9 39.72000 1 323 15.0 1.7 4.8 8.8 69.4 4.5 6.3 58.62006 2 401 16.1 0.8 9.4 4.3 69.4 4.2 4.9 60.3
For sources and notes, see end of table. Pour les sources et les notes, se reporter à la fin du tableau.
Country or territory
Pays ou territoires
Year
Année
Total value(millions of
dollars)
Valeur totale(millions de
dollars)
By main SITC Revision 3 product group (percentage)Par principaux groupes de produits de la CTCI Révision 3 (en pourcentage)
All food items
Produitsalimentaires
Agriculturalraw
materials
Matièrespremièresagricoles
Fuels
Combus-tibles
Ores, metals, precious
stones and non-monetary gold
Minerais,métaux, pierres précieuses et
or(non
monétaire)
Manu-facturedgoods
Articlesmanu-
facturés
Of which: / dont :
3.1 Country trade structureby product groupExports
Structure du commerce des payspar groupes de produitsExportations
3.1
130

Chemicalproducts
Produitschimiques
Machineryand
transportequipment
Machineset matériel
de transport
Othermanu-
facturedgoods
Articlesmanu-
facturésdivers
0 + 1 + 22 + 4
2 - (22 + 27 + 28)
327 + 28 + 68 +
667 + 9715 + 6 +7 + 8-(667 + 68)
5 76 + 8
- (667 + 68)
Togo 1995 383 14.1 24.7 18.7 27.4 15.1 1.2 5.1 8.82000 192 19.6 23.4 0.6 25.5 30.8 0.7 3.9 26.32006 418 22.2 12.1 0.8 11.2 51.1 3.7 1.6 45.9
Trinidad and Tobago - Trinité-et-Tobago 1995 2 467 8.4 0.2 47.9 0.2 43.4 25.0 2.3 16.12000 4 273 5.7 0.1 65.3 0.1 28.8 17.3 1.2 10.32006 14 019 2.3 0.0 76.5 0.3 20.9 14.6 1.1 5.2
Tunisia - Tunisie 1995 5 475 9.8 0.6 8.5 1.8 79.3 11.9 9.4 57.92000 5 850 8.7 0.7 12.1 1.6 76.9 10.6 14.0 52.32006 11 513 10.7 0.7 11.3 1.2 76.1 9.4 18.6 48.1
Turkey - Turquie 1995 21 599 19.6 1.5 1.3 3.3 74.3 4.1 11.1 59.12000 27 485 12.8 1.1 1.1 2.6 81.2 3.9 20.6 56.82006 85 526 6.7 0.3 0.2 1.8 41.4 1.7 8.0 31.7
Turkmenistan - Turkménistan 1995 1 939 0.8 13.0 76.5 1.3 8.4 0.6 0.1 7.72000 2 506 0.3 9.9 81.0 0.4 6.9 0.4 0.6 5.82006 4 436 0.2 2.1 79.7 0.4 11.7 2.0 4.2 5.5
Turks and Caicos Islands - Îles Turques et Caïques 1995 5 56.9 0.2 13.9 21.6 5.9 2.9 0.7 2.32000 9 46.8 1.3 0.3 0.1 49.7 0.2 33.2 16.32006 18 38.5 1.1 0.0 0.4 54.2 0.1 34.0 20.2
Uganda - Ouganda 1995 575 86.0 4.4 0.1 5.4 4.2 1.0 1.2 2.02000 403 60.2 12.5 7.0 14.9 5.4 1.1 2.5 1.82006 962 54.4 7.8 4.4 15.0 18.5 1.6 9.3 7.5
Ukraine 1995 13 317 19.0 1.0 4.3 8.2 66.4 12.8 14.1 39.42000 14 573 9.2 1.7 5.5 14.1 67.1 9.0 12.3 45.72006 38 368 12.0 1.4 6.7 7.1 71.9 9.4 14.1 48.4
United Arab Emirates - Émirats arabes unis 1995 27 753 3.4 0.3 71.8 5.0 18.9 2.9 6.9 9.12000 37 720 3.0 0.2 76.2 3.4 16.8 1.2 6.6 9.02006 140 316 2.5 0.2 51.3 9.5 19.5 2.3 10.2 7.1
United Kingdom - Royaume-Uni 1995 234 372 7.6 0.7 6.2 4.8 80.0 12.4 43.8 23.82000 282 854 5.4 0.5 8.5 4.6 74.8 12.1 43.6 19.12006 444 439 4.7 0.6 9.7 5.1 75.4 14.4 42.8 18.2
United Republic of Tanzania - 1995 685 65.2 23.1 0.3 3.9 7.1 0.7 1.3 5.0République-Unie de Tanzanie 2000 656 54.8 11.1 0.1 26.8 7.2 0.8 1.0 5.3
2006 1 690 34.6 7.0 0.1 48.4 9.7 3.1 1.1 5.6
United States - États-Unis 1995 582 965 10.1 3.7 1.8 3.8 77.5 10.6 48.3 18.72000 780 332 7.0 2.2 1.7 3.2 82.9 10.6 52.8 19.52006 1 037 029 6.7 2.3 3.4 5.3 79.3 13.1 47.7 18.6
Uruguay 1995 2 106 44.2 14.9 1.0 0.9 38.7 5.6 6.0 27.12000 2 299 46.3 9.3 1.5 1.4 41.5 6.2 8.5 26.82006 3 952 55.2 9.7 3.5 2.2 29.3 5.7 3.7 19.9
Uzbekistan - Ouzbékistan 1995 3 720 7.9 52.0 12.9 11.8 15.4 3.5 2.9 9.02000 3 265 9.1 38.8 19.2 12.8 18.8 3.1 5.0 10.72006 3 771 10.5 20.0 13.7 13.6 25.9 7.8 10.7 7.4
Venezuela (Bolivarian Rep. of) - 1995 19 093 2.8 0.1 76.3 7.2 13.6 4.1 2.8 6.7Venezuela (Rép. bolivarienne du) 2000 30 948 1.5 0.2 86.1 3.4 8.8 2.8 1.1 4.9
2006 61 385 0.2 0.0 92.6 2.1 5.1 1.1 0.8 3.2
Viet Nam 1995 5 449 30.2 3.1 18.0 0.8 43.7 1.1 7.0 35.62000 14 483 25.3 2.0 26.4 0.7 42.4 1.0 8.7 32.82006 39 826 19.3 4.1 24.4 0.8 51.1 2.0 10.5 38.6
Yemen - Yémen 1995 1 917 2.7 0.6 94.3 0.5 1.9 0.1 0.9 0.82000 4 078 2.1 0.4 96.5 0.1 0.9 0.3 0.3 0.32006 6 264 4.4 0.2 91.8 0.2 3.4 0.3 2.3 0.8
For sources and notes, see end of table. Pour les sources et les notes, se reporter à la fin du tableau.
Manu-facturedgoods
Articlesmanu-
facturés
Of which: / dont :
Country or territory
Pays ou territoires
Year
Année
Total value(millions of
dollars)
Valeur totale(millions de
dollars)
By main SITC Revision 3 product group (percentage)Par principaux groupes de produits de la CTCI Révision 3 (en pourcentage)
All food items
Produitsalimentaires
Agriculturalraw
materials
Matièrespremièresagricoles
Fuels
Combus-tibles
Ores, metals, precious
stones and non-monetary gold
Minerais,métaux, pierres précieuses et
or(non
monétaire)
3.1 Country trade structureby product groupExports
Structure du commerce des payspar groupes de produitsExportations
3.1
3
131
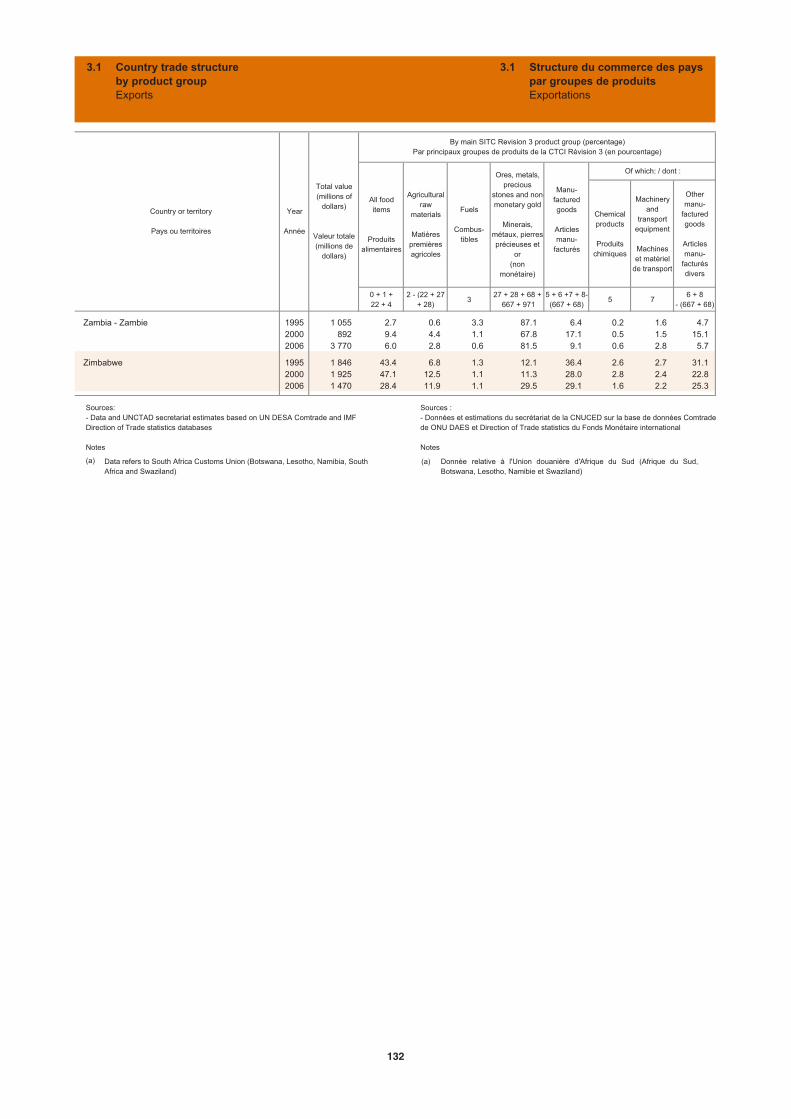
Chemicalproducts
Produitschimiques
Machineryand
transportequipment
Machineset matériel
de transport
Othermanu-
facturedgoods
Articlesmanu-
facturésdivers
0 + 1 + 22 + 4
2 - (22 + 27 + 28)
327 + 28 + 68 +
667 + 9715 + 6 +7 + 8-(667 + 68)
5 76 + 8
- (667 + 68)
Zambia - Zambie 1995 1 055 2.7 0.6 3.3 87.1 6.4 0.2 1.6 4.72000 892 9.4 4.4 1.1 67.8 17.1 0.5 1.5 15.12006 3 770 6.0 2.8 0.6 81.5 9.1 0.6 2.8 5.7
Zimbabwe 1995 1 846 43.4 6.8 1.3 12.1 36.4 2.6 2.7 31.12000 1 925 47.1 12.5 1.1 11.3 28.0 2.8 2.4 22.82006 1 470 28.4 11.9 1.1 29.5 29.1 1.6 2.2 25.3
Country or territory
Pays ou territoires
Year
Année
Total value(millions of
dollars)
Valeur totale(millions de
dollars)
By main SITC Revision 3 product group (percentage)Par principaux groupes de produits de la CTCI Révision 3 (en pourcentage)
All food items
Produitsalimentaires
Agriculturalraw
materials
Matièrespremièresagricoles
Fuels
Combus-tibles
Ores, metals, precious
stones and non-monetary gold
Minerais,métaux, pierres précieuses et
or(non
monétaire)
Manu-facturedgoods
Articlesmanu-
facturés
Of which: / dont :
3.1 Country trade structureby product groupExports
Structure du commerce des payspar groupes de produitsExportations
3.1
Sources:- Data and UNCTAD secretariat estimates based on UN DESA Comtrade and IMF Direction of Trade statistics databases
Notes
Sources : - Données et estimations du secrétariat de la CNUCED sur la base de données Comtrade de ONU DAES et Direction of Trade statistics du Fonds Monétaire international
Notes
(a) Data refers to South Africa Customs Union (Botswana, Lesotho, Namibia, South Africa and Swaziland)
(a) Donnée relative à l'Union douanière d'Afrique du Sud (Afrique du Sud,Botswana, Lesotho, Namibie et Swaziland)
132
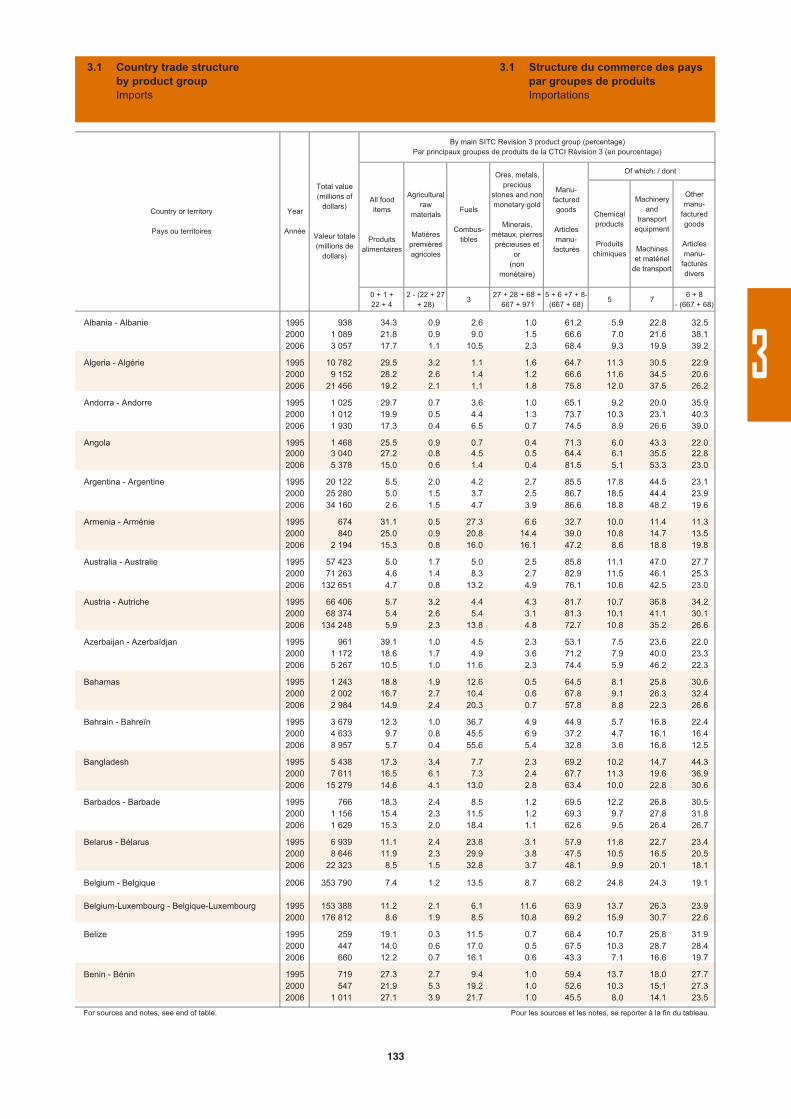
Chemicalproducts
Produitschimiques
Machineryand
transportequipment
Machineset matériel
de transport
Othermanu-
facturedgoods
Articlesmanu-
facturésdivers
0 + 1 +22 + 4
2 - (22 + 27 + 28)
327 + 28 + 68 +
667 + 9715 + 6 +7 + 8-(667 + 68)
5 76 + 8
- (667 + 68)
Albania - Albanie 1995 938 34.3 0.9 2.6 1.0 61.2 5.9 22.8 32.52000 1 089 21.8 0.9 9.0 1.5 66.6 7.0 21.6 38.12006 3 057 17.7 1.1 10.5 2.3 68.4 9.3 19.9 39.2
Algeria - Algérie 1995 10 782 29.5 3.2 1.1 1.6 64.7 11.3 30.5 22.92000 9 152 28.2 2.6 1.4 1.2 66.6 11.6 34.5 20.62006 21 456 19.2 2.1 1.1 1.8 75.8 12.0 37.5 26.2
Andorra - Andorre 1995 1 025 29.7 0.7 3.6 1.0 65.1 9.2 20.0 35.92000 1 012 19.9 0.5 4.4 1.3 73.7 10.3 23.1 40.32006 1 930 17.3 0.4 6.5 0.7 74.5 8.9 26.6 39.0
Angola 1995 1 468 25.5 0.9 0.7 0.4 71.3 6.0 43.3 22.02000 3 040 27.2 0.8 4.5 0.5 64.4 6.1 35.5 22.82006 5 378 15.0 0.6 1.4 0.4 81.5 5.1 53.3 23.0
Argentina - Argentine 1995 20 122 5.5 2.0 4.2 2.7 85.5 17.8 44.5 23.12000 25 280 5.0 1.5 3.7 2.5 86.7 18.5 44.4 23.92006 34 160 2.6 1.5 4.7 3.9 86.6 18.8 48.2 19.6
Armenia - Arménie 1995 674 31.1 0.5 27.3 6.6 32.7 10.0 11.4 11.32000 840 25.0 0.9 20.8 14.4 39.0 10.8 14.7 13.52006 2 194 15.3 0.8 16.0 16.1 47.2 8.6 18.8 19.8
Australia - Australie 1995 57 423 5.0 1.7 5.0 2.5 85.8 11.1 47.0 27.72000 71 263 4.6 1.4 8.3 2.7 82.9 11.5 46.1 25.32006 132 651 4.7 0.8 13.2 4.9 76.1 10.6 42.5 23.0
Austria - Autriche 1995 66 406 5.7 3.2 4.4 4.3 81.7 10.7 36.8 34.22000 68 374 5.4 2.6 5.4 3.1 81.3 10.1 41.1 30.12006 134 248 5.9 2.3 13.8 4.8 72.7 10.8 35.2 26.6
Azerbaijan - Azerbaïdjan 1995 961 39.1 1.0 4.5 2.3 53.1 7.5 23.6 22.02000 1 172 18.6 1.7 4.9 3.6 71.2 7.9 40.0 23.32006 5 267 10.5 1.0 11.6 2.3 74.4 5.9 46.2 22.3
Bahamas 1995 1 243 18.8 1.9 12.6 0.5 64.5 8.1 25.8 30.62000 2 002 16.7 2.7 10.4 0.6 67.8 9.1 26.3 32.42006 2 984 14.9 2.4 20.3 0.7 57.8 8.8 22.3 26.6
Bahrain - Bahreïn 1995 3 679 12.3 1.0 36.7 4.9 44.9 5.7 16.8 22.42000 4 633 9.7 0.8 45.5 6.9 37.2 4.7 16.1 16.42006 8 957 5.7 0.4 55.6 5.4 32.8 3.6 16.8 12.5
Bangladesh 1995 5 438 17.3 3.4 7.7 2.3 69.2 10.2 14.7 44.32000 7 611 16.5 6.1 7.3 2.4 67.7 11.3 19.6 36.92006 15 279 14.6 4.1 13.0 2.8 63.4 10.0 22.8 30.6
Barbados - Barbade 1995 766 18.3 2.4 8.5 1.2 69.5 12.2 26.8 30.52000 1 156 15.4 2.3 11.5 1.2 69.3 9.7 27.8 31.82006 1 629 15.3 2.0 18.4 1.1 62.6 9.5 26.4 26.7
Belarus - Bélarus 1995 6 939 11.1 2.4 23.8 3.1 57.9 11.8 22.7 23.42000 8 646 11.9 2.3 29.9 3.8 47.5 10.5 16.5 20.52006 22 323 8.5 1.5 32.8 3.7 48.1 9.9 20.1 18.1
Belgium - Belgique 2006 353 790 7.4 1.2 13.5 8.7 68.2 24.8 24.3 19.1
Belgium-Luxembourg - Belgique-Luxembourg 1995 153 388 11.2 2.1 6.1 11.6 63.9 13.7 26.3 23.92000 176 812 8.6 1.9 8.5 10.8 69.2 15.9 30.7 22.6
Belize 1995 259 19.1 0.3 11.5 0.7 68.4 10.7 25.8 31.92000 447 14.0 0.6 17.0 0.5 67.5 10.3 28.7 28.42006 660 12.2 0.7 16.1 0.6 43.3 7.1 16.6 19.7
Benin - Bénin 1995 719 27.3 2.7 9.4 1.0 59.4 13.7 18.0 27.72000 547 21.9 5.3 19.2 1.0 52.6 10.3 15.1 27.32006 1 011 27.1 3.9 21.7 1.0 45.5 8.0 14.1 23.5
For sources and notes, see end of table. Pour les sources et les notes, se reporter à la fin du tableau.
Of which: / dont :
By main SITC Revision 3 product group (percentage)Par principaux groupes de produits de la CTCI Révision 3 (en pourcentage)
Fuels
Combus-tibles
Ores, metals, precious
stones and non-monetary gold
Minerais,métaux, pierres précieuses et
or(non
monétaire)
Manu-facturedgoods
Articlesmanu-
facturés
Country or territory
Pays ou territoires
All food items
Produitsalimentaires
Agriculturalraw
materials
Matièrespremièresagricoles
Year
Année
Total value(millions of
dollars)
Valeur totale(millions de
dollars)
3.1 Country trade structureby product groupImports
Structure du commerce des payspar groupes de produitsImportations
3.1
3
133
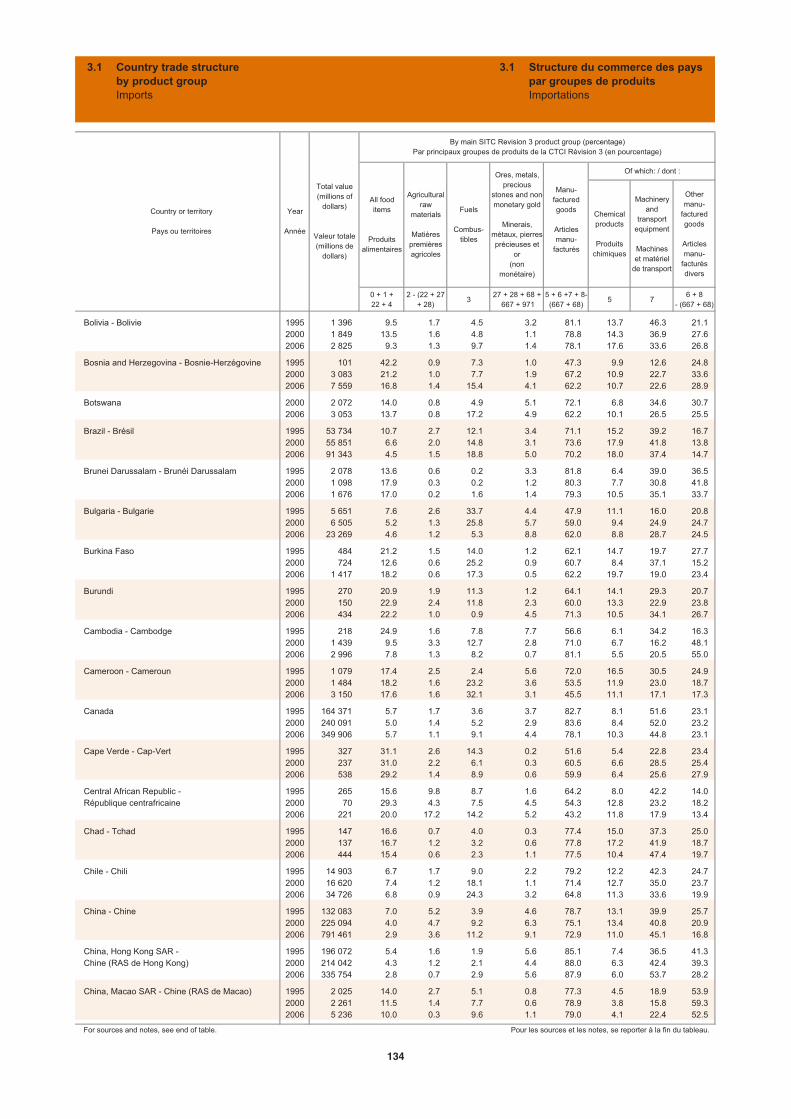
Chemicalproducts
Produitschimiques
Machineryand
transportequipment
Machineset matériel
de transport
Othermanu-
facturedgoods
Articlesmanu-
facturésdivers
0 + 1 +22 + 4
2 - (22 + 27 + 28)
327 + 28 + 68 +
667 + 9715 + 6 +7 + 8-(667 + 68)
5 76 + 8
- (667 + 68)
Bolivia - Bolivie 1995 1 396 9.5 1.7 4.5 3.2 81.1 13.7 46.3 21.12000 1 849 13.5 1.6 4.8 1.1 78.8 14.3 36.9 27.62006 2 825 9.3 1.3 9.7 1.4 78.1 17.6 33.6 26.8
Bosnia and Herzegovina - Bosnie-Herzégovine 1995 101 42.2 0.9 7.3 1.0 47.3 9.9 12.6 24.82000 3 083 21.2 1.0 7.7 1.9 67.2 10.9 22.7 33.62006 7 559 16.8 1.4 15.4 4.1 62.2 10.7 22.6 28.9
Botswana 2000 2 072 14.0 0.8 4.9 5.1 72.1 6.8 34.6 30.72006 3 053 13.7 0.8 17.2 4.9 62.2 10.1 26.5 25.5
Brazil - Brésil 1995 53 734 10.7 2.7 12.1 3.4 71.1 15.2 39.2 16.72000 55 851 6.6 2.0 14.8 3.1 73.6 17.9 41.8 13.82006 91 343 4.5 1.5 18.8 5.0 70.2 18.0 37.4 14.7
Brunei Darussalam - Brunéi Darussalam 1995 2 078 13.6 0.6 0.2 3.3 81.8 6.4 39.0 36.52000 1 098 17.9 0.3 0.2 1.2 80.3 7.7 30.8 41.82006 1 676 17.0 0.2 1.6 1.4 79.3 10.5 35.1 33.7
Bulgaria - Bulgarie 1995 5 651 7.6 2.6 33.7 4.4 47.9 11.1 16.0 20.82000 6 505 5.2 1.3 25.8 5.7 59.0 9.4 24.9 24.72006 23 269 4.6 1.2 5.3 8.8 62.0 8.8 28.7 24.5
Burkina Faso 1995 484 21.2 1.5 14.0 1.2 62.1 14.7 19.7 27.72000 724 12.6 0.6 25.2 0.9 60.7 8.4 37.1 15.22006 1 417 18.2 0.6 17.3 0.5 62.2 19.7 19.0 23.4
Burundi 1995 270 20.9 1.9 11.3 1.2 64.1 14.1 29.3 20.72000 150 22.9 2.4 11.8 2.3 60.0 13.3 22.9 23.82006 434 22.2 1.0 0.9 4.5 71.3 10.5 34.1 26.7
Cambodia - Cambodge 1995 218 24.9 1.6 7.8 7.7 56.6 6.1 34.2 16.32000 1 439 9.5 3.3 12.7 2.8 71.0 6.7 16.2 48.12006 2 996 7.8 1.3 8.2 0.7 81.1 5.5 20.5 55.0
Cameroon - Cameroun 1995 1 079 17.4 2.5 2.4 5.6 72.0 16.5 30.5 24.92000 1 484 18.2 1.6 23.2 3.6 53.5 11.9 23.0 18.72006 3 150 17.6 1.6 32.1 3.1 45.5 11.1 17.1 17.3
Canada 1995 164 371 5.7 1.7 3.6 3.7 82.7 8.1 51.6 23.12000 240 091 5.0 1.4 5.2 2.9 83.6 8.4 52.0 23.22006 349 906 5.7 1.1 9.1 4.4 78.1 10.3 44.8 23.1
Cape Verde - Cap-Vert 1995 327 31.1 2.6 14.3 0.2 51.6 5.4 22.8 23.42000 237 31.0 2.2 6.1 0.3 60.5 6.6 28.5 25.42006 538 29.2 1.4 8.9 0.6 59.9 6.4 25.6 27.9
Central African Republic - 1995 265 15.6 9.8 8.7 1.6 64.2 8.0 42.2 14.0République centrafricaine 2000 70 29.3 4.3 7.5 4.5 54.3 12.8 23.2 18.2
2006 221 20.0 17.2 14.2 5.2 43.2 11.8 17.9 13.4
Chad - Tchad 1995 147 16.6 0.7 4.0 0.3 77.4 15.0 37.3 25.02000 137 16.7 1.2 3.2 0.6 77.8 17.2 41.9 18.72006 444 15.4 0.6 2.3 1.1 77.5 10.4 47.4 19.7
Chile - Chili 1995 14 903 6.7 1.7 9.0 2.2 79.2 12.2 42.3 24.72000 16 620 7.4 1.2 18.1 1.1 71.4 12.7 35.0 23.72006 34 726 6.8 0.9 24.3 3.2 64.8 11.3 33.6 19.9
China - Chine 1995 132 083 7.0 5.2 3.9 4.6 78.7 13.1 39.9 25.72000 225 094 4.0 4.7 9.2 6.3 75.1 13.4 40.8 20.92006 791 461 2.9 3.6 11.2 9.1 72.9 11.0 45.1 16.8
China, Hong Kong SAR - 1995 196 072 5.4 1.6 1.9 5.6 85.1 7.4 36.5 41.3Chine (RAS de Hong Kong) 2000 214 042 4.3 1.2 2.1 4.4 88.0 6.3 42.4 39.3
2006 335 754 2.8 0.7 2.9 5.6 87.9 6.0 53.7 28.2
China, Macao SAR - Chine (RAS de Macao) 1995 2 025 14.0 2.7 5.1 0.8 77.3 4.5 18.9 53.92000 2 261 11.5 1.4 7.7 0.6 78.9 3.8 15.8 59.32006 5 236 10.0 0.3 9.6 1.1 79.0 4.1 22.4 52.5
For sources and notes, see end of table. Pour les sources et les notes, se reporter à la fin du tableau.
Country or territory
Pays ou territoires
Year
Année
Total value(millions of
dollars)
Valeur totale(millions de
dollars)
By main SITC Revision 3 product group (percentage)Par principaux groupes de produits de la CTCI Révision 3 (en pourcentage)
All food items
Produitsalimentaires
Agriculturalraw
materials
Matièrespremièresagricoles
Fuels
Combus-tibles
Ores, metals, precious
stones and non-monetary gold
Minerais,métaux, pierres précieuses et
or(non
monétaire)
Manu-facturedgoods
Articlesmanu-
facturés
Of which: / dont :
3.1 Country trade structureby product groupImports
Structure du commerce des payspar groupes de produitsImportations
3.1
134
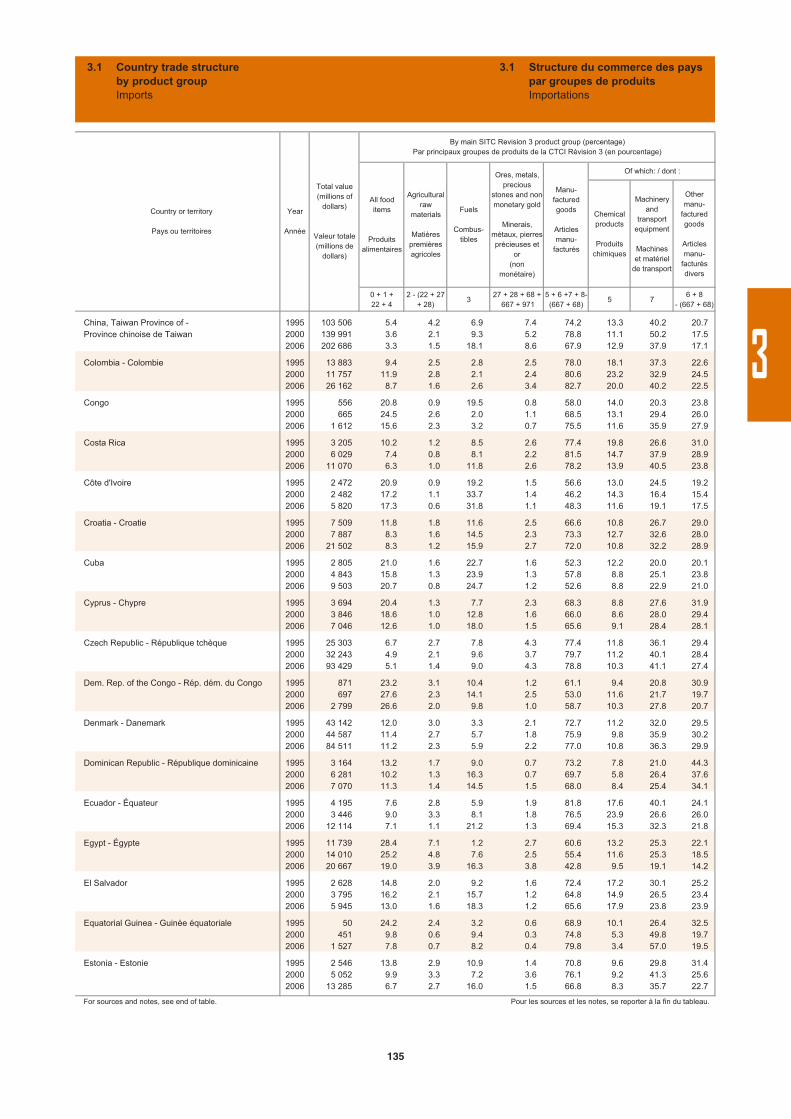
Chemicalproducts
Produitschimiques
Machineryand
transportequipment
Machineset matériel
de transport
Othermanu-
facturedgoods
Articlesmanu-
facturésdivers
0 + 1 +22 + 4
2 - (22 + 27 + 28)
327 + 28 + 68 +
667 + 9715 + 6 +7 + 8-(667 + 68)
5 76 + 8
- (667 + 68)
China, Taiwan Province of - 1995 103 506 5.4 4.2 6.9 7.4 74.2 13.3 40.2 20.7Province chinoise de Taiwan 2000 139 991 3.6 2.1 9.3 5.2 78.8 11.1 50.2 17.5
2006 202 686 3.3 1.5 18.1 8.6 67.9 12.9 37.9 17.1
Colombia - Colombie 1995 13 883 9.4 2.5 2.8 2.5 78.0 18.1 37.3 22.62000 11 757 11.9 2.8 2.1 2.4 80.6 23.2 32.9 24.52006 26 162 8.7 1.6 2.6 3.4 82.7 20.0 40.2 22.5
Congo 1995 556 20.8 0.9 19.5 0.8 58.0 14.0 20.3 23.82000 665 24.5 2.6 2.0 1.1 68.5 13.1 29.4 26.02006 1 612 15.6 2.3 3.2 0.7 75.5 11.6 35.9 27.9
Costa Rica 1995 3 205 10.2 1.2 8.5 2.6 77.4 19.8 26.6 31.02000 6 029 7.4 0.8 8.1 2.2 81.5 14.7 37.9 28.92006 11 070 6.3 1.0 11.8 2.6 78.2 13.9 40.5 23.8
Côte d'Ivoire 1995 2 472 20.9 0.9 19.2 1.5 56.6 13.0 24.5 19.22000 2 482 17.2 1.1 33.7 1.4 46.2 14.3 16.4 15.42006 5 820 17.3 0.6 31.8 1.1 48.3 11.6 19.1 17.5
Croatia - Croatie 1995 7 509 11.8 1.8 11.6 2.5 66.6 10.8 26.7 29.02000 7 887 8.3 1.6 14.5 2.3 73.3 12.7 32.6 28.02006 21 502 8.3 1.2 15.9 2.7 72.0 10.8 32.2 28.9
Cuba 1995 2 805 21.0 1.6 22.7 1.6 52.3 12.2 20.0 20.12000 4 843 15.8 1.3 23.9 1.3 57.8 8.8 25.1 23.82006 9 503 20.7 0.8 24.7 1.2 52.6 8.8 22.9 21.0
Cyprus - Chypre 1995 3 694 20.4 1.3 7.7 2.3 68.3 8.8 27.6 31.92000 3 846 18.6 1.0 12.8 1.6 66.0 8.6 28.0 29.42006 7 046 12.6 1.0 18.0 1.5 65.6 9.1 28.4 28.1
Czech Republic - République tchèque 1995 25 303 6.7 2.7 7.8 4.3 77.4 11.8 36.1 29.42000 32 243 4.9 2.1 9.6 3.7 79.7 11.2 40.1 28.42006 93 429 5.1 1.4 9.0 4.3 78.8 10.3 41.1 27.4
Dem. Rep. of the Congo - Rép. dém. du Congo 1995 871 23.2 3.1 10.4 1.2 61.1 9.4 20.8 30.92000 697 27.6 2.3 14.1 2.5 53.0 11.6 21.7 19.72006 2 799 26.6 2.0 9.8 1.0 58.7 10.3 27.8 20.7
Denmark - Danemark 1995 43 142 12.0 3.0 3.3 2.1 72.7 11.2 32.0 29.52000 44 587 11.4 2.7 5.7 1.8 75.9 9.8 35.9 30.22006 84 511 11.2 2.3 5.9 2.2 77.0 10.8 36.3 29.9
Dominican Republic - République dominicaine 1995 3 164 13.2 1.7 9.0 0.7 73.2 7.8 21.0 44.32000 6 281 10.2 1.3 16.3 0.7 69.7 5.8 26.4 37.62006 7 070 11.3 1.4 14.5 1.5 68.0 8.4 25.4 34.1
Ecuador - Équateur 1995 4 195 7.6 2.8 5.9 1.9 81.8 17.6 40.1 24.12000 3 446 9.0 3.3 8.1 1.8 76.5 23.9 26.6 26.02006 12 114 7.1 1.1 21.2 1.3 69.4 15.3 32.3 21.8
Egypt - Égypte 1995 11 739 28.4 7.1 1.2 2.7 60.6 13.2 25.3 22.12000 14 010 25.2 4.8 7.6 2.5 55.4 11.6 25.3 18.52006 20 667 19.0 3.9 16.3 3.8 42.8 9.5 19.1 14.2
El Salvador 1995 2 628 14.8 2.0 9.2 1.6 72.4 17.2 30.1 25.22000 3 795 16.2 2.1 15.7 1.2 64.8 14.9 26.5 23.42006 5 945 13.0 1.6 18.3 1.2 65.6 17.9 23.8 23.9
Equatorial Guinea - Guinée équatoriale 1995 50 24.2 2.4 3.2 0.6 68.9 10.1 26.4 32.52000 451 9.8 0.6 9.4 0.3 74.8 5.3 49.8 19.72006 1 527 7.8 0.7 8.2 0.4 79.8 3.4 57.0 19.5
Estonia - Estonie 1995 2 546 13.8 2.9 10.9 1.4 70.8 9.6 29.8 31.42000 5 052 9.9 3.3 7.2 3.6 76.1 9.2 41.3 25.62006 13 285 6.7 2.7 16.0 1.5 66.8 8.3 35.7 22.7
For sources and notes, see end of table. Pour les sources et les notes, se reporter à la fin du tableau.
Country or territory
Pays ou territoires
Year
Année
Total value(millions of
dollars)
Valeur totale(millions de
dollars)
By main SITC Revision 3 product group (percentage)Par principaux groupes de produits de la CTCI Révision 3 (en pourcentage)
All food items
Produitsalimentaires
Agriculturalraw
materials
Matièrespremièresagricoles
Fuels
Combus-tibles
Ores, metals, precious
stones and non-monetary gold
Minerais,métaux, pierres précieuses et
or(non
monétaire)
Manu-facturedgoods
Articlesmanu-
facturés
Of which: / dont :
3.1 Country trade structureby product groupImports
Structure du commerce des payspar groupes de produitsImportations
3.1
3
135

Chemicalproducts
Produitschimiques
Machineryand
transportequipment
Machineset matériel
de transport
Othermanu-
facturedgoods
Articlesmanu-
facturésdivers
0 + 1 +22 + 4
2 - (22 + 27 + 28)
327 + 28 + 68 +
667 + 9715 + 6 +7 + 8-(667 + 68)
5 76 + 8
- (667 + 68)
Ethiopia - Éthiopie 1995 1 141 13.8 1.9 11.1 0.8 72.4 14.1 35.5 22.72000 1 260 7.0 1.2 20.1 0.7 71.0 11.5 31.9 27.62006 5 207 8.5 1.6 19.9 0.8 69.2 11.0 35.6 22.6
Faeroe Islands - Îles Féroé 1995 314 22.3 3.5 11.7 1.2 57.9 7.4 27.5 23.02000 532 20.3 2.4 8.1 0.9 66.0 7.0 36.6 22.52006 783 13.6 3.1 18.8 1.2 62.0 6.9 28.3 26.8
Fiji - Fidji 1995 892 14.1 0.6 13.3 0.9 68.8 6.9 23.6 38.32000 776 13.7 0.6 6.8 0.9 71.0 7.0 20.4 43.52006 1 804 14.0 0.3 32.7 1.1 51.3 7.3 21.8 22.2
Finland - Finlande 1995 29 520 6.0 3.6 8.8 5.7 74.3 12.2 38.7 23.32000 33 886 5.2 2.4 11.9 5.6 72.6 10.5 42.1 20.02006 69 427 4.8 2.6 15.3 9.1 65.9 10.8 36.6 18.5
France 1995 275 510 10.7 2.5 6.9 3.9 76.0 12.5 35.4 28.12000 303 758 7.9 1.9 9.9 3.2 77.1 12.2 39.2 25.72006 529 902 7.4 1.4 14.8 3.6 72.8 12.7 35.2 24.9
French Polynesia - Polynésie française 1995 1 019 21.6 1.5 5.5 0.9 70.5 8.5 34.7 27.42000 1 072 20.0 1.9 7.2 1.0 69.9 8.6 33.3 28.02006 1 547 19.7 1.7 12.9 0.8 65.0 9.5 29.5 26.0
Gabon 1995 884 19.1 0.7 3.4 1.1 75.6 10.7 39.3 25.72000 952 18.2 0.5 4.1 1.0 76.1 8.6 48.0 19.52006 1 725 16.6 0.4 3.9 1.1 77.5 9.2 42.8 25.6
Gambia - Gambie 1995 215 36.4 0.7 14.1 0.3 45.8 5.9 22.0 17.92000 189 34.5 0.7 11.9 0.8 51.2 5.6 21.9 23.72006 259 31.2 2.2 17.4 0.6 48.7 4.6 25.2 18.9
Georgia - Géorgie 1995 412 36.1 0.2 38.8 0.5 24.4 4.8 9.7 9.92000 709 23.3 0.7 19.6 0.7 55.1 11.1 24.8 19.22006 3 675 16.4 0.5 19.4 0.7 60.8 9.0 28.9 23.0
Germany - Allemagne 1995 464 145 9.8 2.6 6.2 4.4 69.9 9.1 31.8 28.92000 500 830 6.6 1.7 8.6 3.8 67.3 8.9 35.8 22.62006 922 213 6.6 1.4 12.1 5.4 69.8 11.5 37.1 21.3
Ghana 1995 1 896 7.9 1.0 5.8 2.6 74.9 9.3 43.7 21.92000 2 933 12.8 2.4 21.4 2.9 59.5 9.8 30.4 19.32006 5 329 13.4 1.2 13.8 1.5 69.9 10.8 34.0 25.2
Greece - Grèce 1995 25 927 16.0 2.5 7.2 3.2 71.1 13.2 27.4 30.52000 29 816 11.3 1.5 13.4 2.7 71.0 11.6 34.6 24.82006 63 739 10.7 1.2 19.1 3.9 64.8 13.7 28.5 22.6
Greenland - Groenland 1995 421 14.2 1.2 5.8 0.4 59.3 4.3 24.6 30.42000 364 15.2 0.8 18.7 0.4 51.9 3.5 26.6 21.82006 581 19.6 0.7 21.9 0.5 56.7 5.2 22.0 29.5
Grenada - Grenade 1995 129 27.5 2.5 7.8 0.4 61.8 8.8 21.3 31.72000 239 18.4 2.2 8.8 0.8 69.9 6.6 32.9 30.42006 299 18.7 3.3 5.9 0.7 71.5 9.6 22.1 39.8
Guatemala 1995 3 292 11.9 1.5 12.4 1.2 73.0 17.2 31.5 24.32000 4 882 12.1 1.7 12.7 1.3 72.2 16.4 32.6 23.32006 9 540 10.1 1.0 19.5 1.3 68.2 16.0 28.9 23.3
Guinea - Guinée 1995 819 31.0 1.0 19.1 0.8 47.4 6.6 20.9 19.92000 612 24.2 1.2 24.9 0.8 48.7 8.7 19.0 21.02006 807 17.1 1.2 11.7 0.5 63.1 11.2 28.0 23.9
Guinea-Bissau - Guinée-Bissau 1995 57 43.6 0.5 16.2 0.2 39.6 4.9 22.9 11.82000 49 24.7 0.8 5.0 0.5 66.7 9.6 18.2 38.92006 97 28.8 0.4 18.8 0.5 49.4 5.8 21.3 22.3
For sources and notes, see end of table. Pour les sources et les notes, se reporter à la fin du tableau.
Country or territory
Pays ou territoires
Year
Année
Total value(millions of
dollars)
Valeur totale(millions de
dollars)
By main SITC Revision 3 product group (percentage)Par principaux groupes de produits de la CTCI Révision 3 (en pourcentage)
All food items
Produitsalimentaires
Agriculturalraw
materials
Matièrespremièresagricoles
Fuels
Combus-tibles
Ores, metals, precious
stones and non-monetary gold
Minerais,métaux, pierres précieuses et
or(non
monétaire)
Manu-facturedgoods
Articlesmanu-
facturés
Of which: / dont :
3.1 Country trade structureby product groupImports
Structure du commerce des payspar groupes de produitsImportations
3.1
136
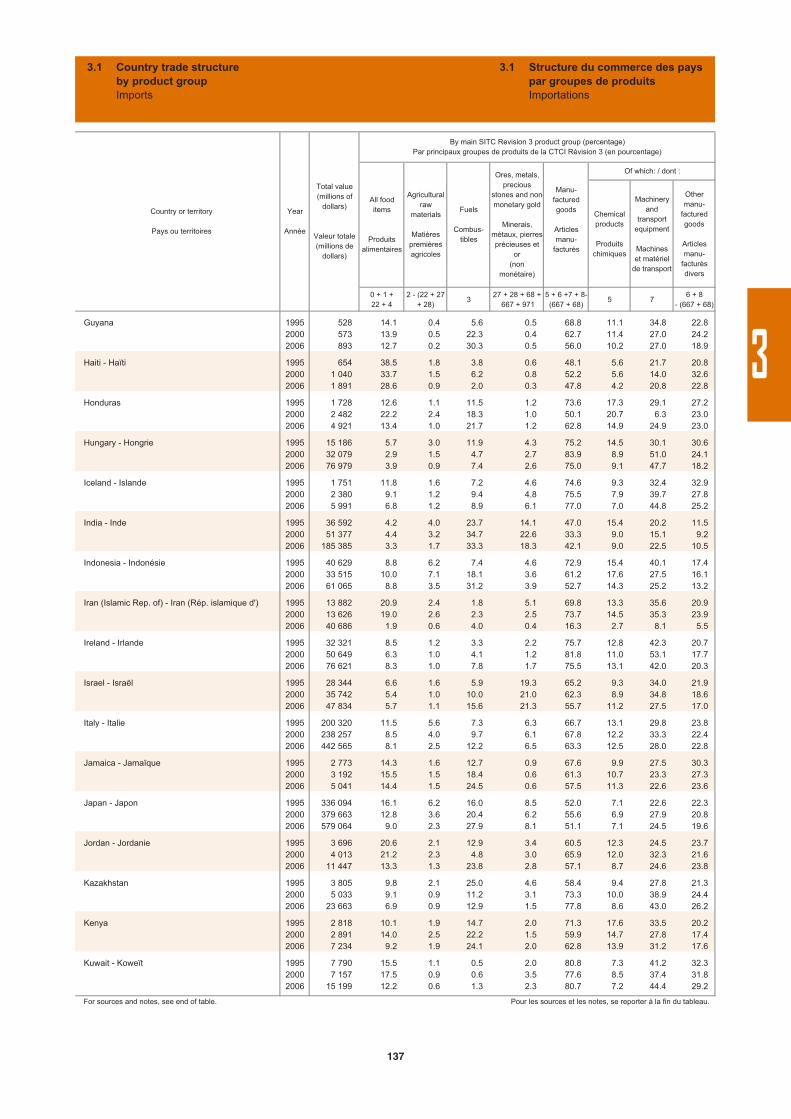
Chemicalproducts
Produitschimiques
Machineryand
transportequipment
Machineset matériel
de transport
Othermanu-
facturedgoods
Articlesmanu-
facturésdivers
0 + 1 +22 + 4
2 - (22 + 27 + 28)
327 + 28 + 68 +
667 + 9715 + 6 +7 + 8-(667 + 68)
5 76 + 8
- (667 + 68)
Guyana 1995 528 14.1 0.4 5.6 0.5 68.8 11.1 34.8 22.82000 573 13.9 0.5 22.3 0.4 62.7 11.4 27.0 24.22006 893 12.7 0.2 30.3 0.5 56.0 10.2 27.0 18.9
Haiti - Haïti 1995 654 38.5 1.8 3.8 0.6 48.1 5.6 21.7 20.82000 1 040 33.7 1.5 6.2 0.8 52.2 5.6 14.0 32.62006 1 891 28.6 0.9 2.0 0.3 47.8 4.2 20.8 22.8
Honduras 1995 1 728 12.6 1.1 11.5 1.2 73.6 17.3 29.1 27.22000 2 482 22.2 2.4 18.3 1.0 50.1 20.7 6.3 23.02006 4 921 13.4 1.0 21.7 1.2 62.8 14.9 24.9 23.0
Hungary - Hongrie 1995 15 186 5.7 3.0 11.9 4.3 75.2 14.5 30.1 30.62000 32 079 2.9 1.5 4.7 2.7 83.9 8.9 51.0 24.12006 76 979 3.9 0.9 7.4 2.6 75.0 9.1 47.7 18.2
Iceland - Islande 1995 1 751 11.8 1.6 7.2 4.6 74.6 9.3 32.4 32.92000 2 380 9.1 1.2 9.4 4.8 75.5 7.9 39.7 27.82006 5 991 6.8 1.2 8.9 6.1 77.0 7.0 44.8 25.2
India - Inde 1995 36 592 4.2 4.0 23.7 14.1 47.0 15.4 20.2 11.52000 51 377 4.4 3.2 34.7 22.6 33.3 9.0 15.1 9.22006 185 385 3.3 1.7 33.3 18.3 42.1 9.0 22.5 10.5
Indonesia - Indonésie 1995 40 629 8.8 6.2 7.4 4.6 72.9 15.4 40.1 17.42000 33 515 10.0 7.1 18.1 3.6 61.2 17.6 27.5 16.12006 61 065 8.8 3.5 31.2 3.9 52.7 14.3 25.2 13.2
Iran (Islamic Rep. of) - Iran (Rép. islamique d') 1995 13 882 20.9 2.4 1.8 5.1 69.8 13.3 35.6 20.92000 13 626 19.0 2.6 2.3 2.5 73.7 14.5 35.3 23.92006 40 686 1.9 0.6 4.0 0.4 16.3 2.7 8.1 5.5
Ireland - Irlande 1995 32 321 8.5 1.2 3.3 2.2 75.7 12.8 42.3 20.72000 50 649 6.3 1.0 4.1 1.2 81.8 11.0 53.1 17.72006 76 621 8.3 1.0 7.8 1.7 75.5 13.1 42.0 20.3
Israel - Israël 1995 28 344 6.6 1.6 5.9 19.3 65.2 9.3 34.0 21.92000 35 742 5.4 1.0 10.0 21.0 62.3 8.9 34.8 18.62006 47 834 5.7 1.1 15.6 21.3 55.7 11.2 27.5 17.0
Italy - Italie 1995 200 320 11.5 5.6 7.3 6.3 66.7 13.1 29.8 23.82000 238 257 8.5 4.0 9.7 6.1 67.8 12.2 33.3 22.42006 442 565 8.1 2.5 12.2 6.5 63.3 12.5 28.0 22.8
Jamaica - Jamaïque 1995 2 773 14.3 1.6 12.7 0.9 67.6 9.9 27.5 30.32000 3 192 15.5 1.5 18.4 0.6 61.3 10.7 23.3 27.32006 5 041 14.4 1.5 24.5 0.6 57.5 11.3 22.6 23.6
Japan - Japon 1995 336 094 16.1 6.2 16.0 8.5 52.0 7.1 22.6 22.32000 379 663 12.8 3.6 20.4 6.2 55.6 6.9 27.9 20.82006 579 064 9.0 2.3 27.9 8.1 51.1 7.1 24.5 19.6
Jordan - Jordanie 1995 3 696 20.6 2.1 12.9 3.4 60.5 12.3 24.5 23.72000 4 013 21.2 2.3 4.8 3.0 65.9 12.0 32.3 21.62006 11 447 13.3 1.3 23.8 2.8 57.1 8.7 24.6 23.8
Kazakhstan 1995 3 805 9.8 2.1 25.0 4.6 58.4 9.4 27.8 21.32000 5 033 9.1 0.9 11.2 3.1 73.3 10.0 38.9 24.42006 23 663 6.9 0.9 12.9 1.5 77.8 8.6 43.0 26.2
Kenya 1995 2 818 10.1 1.9 14.7 2.0 71.3 17.6 33.5 20.22000 2 891 14.0 2.5 22.2 1.5 59.9 14.7 27.8 17.42006 7 234 9.2 1.9 24.1 2.0 62.8 13.9 31.2 17.6
Kuwait - Koweït 1995 7 790 15.5 1.1 0.5 2.0 80.8 7.3 41.2 32.32000 7 157 17.5 0.9 0.6 3.5 77.6 8.5 37.4 31.82006 15 199 12.2 0.6 1.3 2.3 80.7 7.2 44.4 29.2
For sources and notes, see end of table. Pour les sources et les notes, se reporter à la fin du tableau.
Country or territory
Pays ou territoires
Year
Année
Total value(millions of
dollars)
Valeur totale(millions de
dollars)
By main SITC Revision 3 product group (percentage)Par principaux groupes de produits de la CTCI Révision 3 (en pourcentage)
All food items
Produitsalimentaires
Agriculturalraw
materials
Matièrespremièresagricoles
Fuels
Combus-tibles
Ores, metals, precious
stones and non-monetary gold
Minerais,métaux, pierres précieuses et
or(non
monétaire)
Manu-facturedgoods
Articlesmanu-
facturés
Of which: / dont :
3.1 Country trade structureby product groupImports
Structure du commerce des payspar groupes de produitsImportations
3.1
3
137
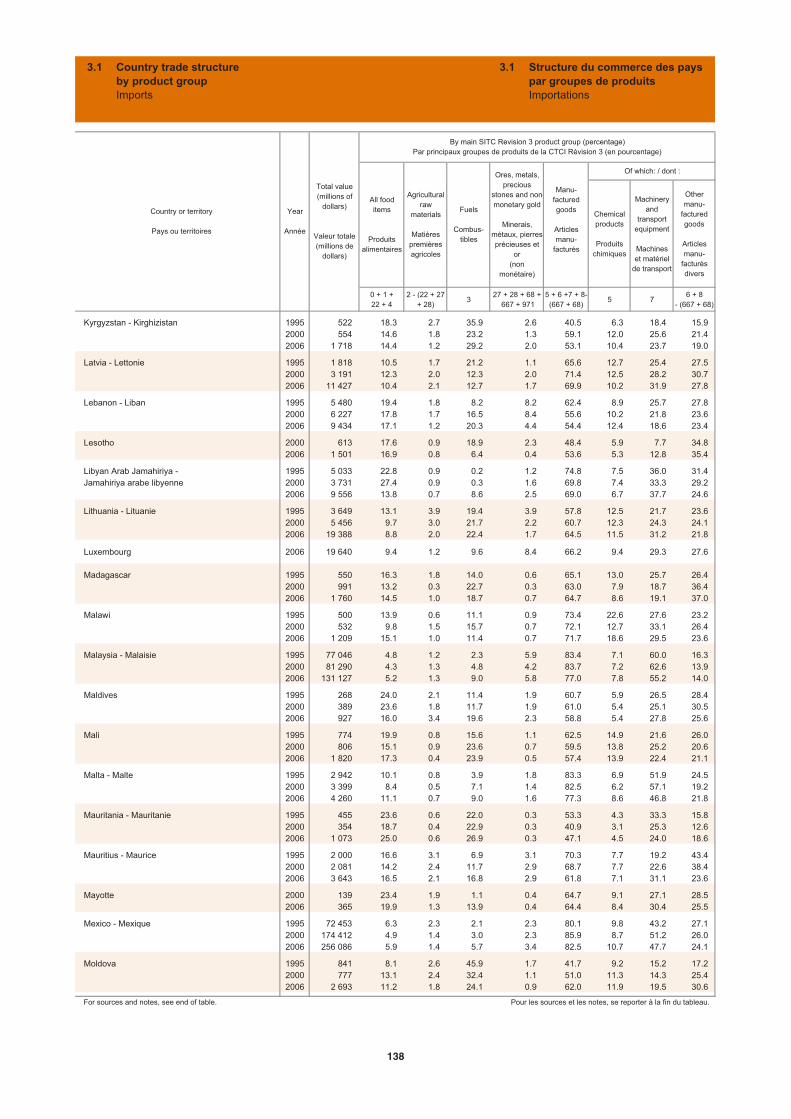
Chemicalproducts
Produitschimiques
Machineryand
transportequipment
Machineset matériel
de transport
Othermanu-
facturedgoods
Articlesmanu-
facturésdivers
0 + 1 +22 + 4
2 - (22 + 27 + 28)
327 + 28 + 68 +
667 + 9715 + 6 +7 + 8-(667 + 68)
5 76 + 8
- (667 + 68)
Kyrgyzstan - Kirghizistan 1995 522 18.3 2.7 35.9 2.6 40.5 6.3 18.4 15.92000 554 14.6 1.8 23.2 1.3 59.1 12.0 25.6 21.42006 1 718 14.4 1.2 29.2 2.0 53.1 10.4 23.7 19.0
Latvia - Lettonie 1995 1 818 10.5 1.7 21.2 1.1 65.6 12.7 25.4 27.52000 3 191 12.3 2.0 12.3 2.0 71.4 12.5 28.2 30.72006 11 427 10.4 2.1 12.7 1.7 69.9 10.2 31.9 27.8
Lebanon - Liban 1995 5 480 19.4 1.8 8.2 8.2 62.4 8.9 25.7 27.82000 6 227 17.8 1.7 16.5 8.4 55.6 10.2 21.8 23.62006 9 434 17.1 1.2 20.3 4.4 54.4 12.4 18.6 23.4
Lesotho 2000 613 17.6 0.9 18.9 2.3 48.4 5.9 7.7 34.82006 1 501 16.9 0.8 6.4 0.4 53.6 5.3 12.8 35.4
Libyan Arab Jamahiriya - 1995 5 033 22.8 0.9 0.2 1.2 74.8 7.5 36.0 31.4Jamahiriya arabe libyenne 2000 3 731 27.4 0.9 0.3 1.6 69.8 7.4 33.3 29.2
2006 9 556 13.8 0.7 8.6 2.5 69.0 6.7 37.7 24.6
Lithuania - Lituanie 1995 3 649 13.1 3.9 19.4 3.9 57.8 12.5 21.7 23.62000 5 456 9.7 3.0 21.7 2.2 60.7 12.3 24.3 24.12006 19 388 8.8 2.0 22.4 1.7 64.5 11.5 31.2 21.8
Luxembourg 2006 19 640 9.4 1.2 9.6 8.4 66.2 9.4 29.3 27.6
Madagascar 1995 550 16.3 1.8 14.0 0.6 65.1 13.0 25.7 26.42000 991 13.2 0.3 22.7 0.3 63.0 7.9 18.7 36.42006 1 760 14.5 1.0 18.7 0.7 64.7 8.6 19.1 37.0
Malawi 1995 500 13.9 0.6 11.1 0.9 73.4 22.6 27.6 23.22000 532 9.8 1.5 15.7 0.7 72.1 12.7 33.1 26.42006 1 209 15.1 1.0 11.4 0.7 71.7 18.6 29.5 23.6
Malaysia - Malaisie 1995 77 046 4.8 1.2 2.3 5.9 83.4 7.1 60.0 16.32000 81 290 4.3 1.3 4.8 4.2 83.7 7.2 62.6 13.92006 131 127 5.2 1.3 9.0 5.8 77.0 7.8 55.2 14.0
Maldives 1995 268 24.0 2.1 11.4 1.9 60.7 5.9 26.5 28.42000 389 23.6 1.8 11.7 1.9 61.0 5.4 25.1 30.52006 927 16.0 3.4 19.6 2.3 58.8 5.4 27.8 25.6
Mali 1995 774 19.9 0.8 15.6 1.1 62.5 14.9 21.6 26.02000 806 15.1 0.9 23.6 0.7 59.5 13.8 25.2 20.62006 1 820 17.3 0.4 23.9 0.5 57.4 13.9 22.4 21.1
Malta - Malte 1995 2 942 10.1 0.8 3.9 1.8 83.3 6.9 51.9 24.52000 3 399 8.4 0.5 7.1 1.4 82.5 6.2 57.1 19.22006 4 260 11.1 0.7 9.0 1.6 77.3 8.6 46.8 21.8
Mauritania - Mauritanie 1995 455 23.6 0.6 22.0 0.3 53.3 4.3 33.3 15.82000 354 18.7 0.4 22.9 0.3 40.9 3.1 25.3 12.62006 1 073 25.0 0.6 26.9 0.3 47.1 4.5 24.0 18.6
Mauritius - Maurice 1995 2 000 16.6 3.1 6.9 3.1 70.3 7.7 19.2 43.42000 2 081 14.2 2.4 11.7 2.9 68.7 7.7 22.6 38.42006 3 643 16.5 2.1 16.8 2.9 61.8 7.1 31.1 23.6
Mayotte 2000 139 23.4 1.9 1.1 0.4 64.7 9.1 27.1 28.52006 365 19.9 1.3 13.9 0.4 64.4 8.4 30.4 25.5
Mexico - Mexique 1995 72 453 6.3 2.3 2.1 2.3 80.1 9.8 43.2 27.12000 174 412 4.9 1.4 3.0 2.3 85.9 8.7 51.2 26.02006 256 086 5.9 1.4 5.7 3.4 82.5 10.7 47.7 24.1
Moldova 1995 841 8.1 2.6 45.9 1.7 41.7 9.2 15.2 17.22000 777 13.1 2.4 32.4 1.1 51.0 11.3 14.3 25.42006 2 693 11.2 1.8 24.1 0.9 62.0 11.9 19.5 30.6
For sources and notes, see end of table. Pour les sources et les notes, se reporter à la fin du tableau.
Country or territory
Pays ou territoires
Year
Année
Total value(millions of
dollars)
Valeur totale(millions de
dollars)
By main SITC Revision 3 product group (percentage)Par principaux groupes de produits de la CTCI Révision 3 (en pourcentage)
All food items
Produitsalimentaires
Agriculturalraw
materials
Matièrespremièresagricoles
Fuels
Combus-tibles
Ores, metals, precious
stones and non-monetary gold
Minerais,métaux, pierres précieuses et
or(non
monétaire)
Manu-facturedgoods
Articlesmanu-
facturés
Of which: / dont :
3.1 Country trade structureby product groupImports
Structure du commerce des payspar groupes de produitsImportations
3.1
138
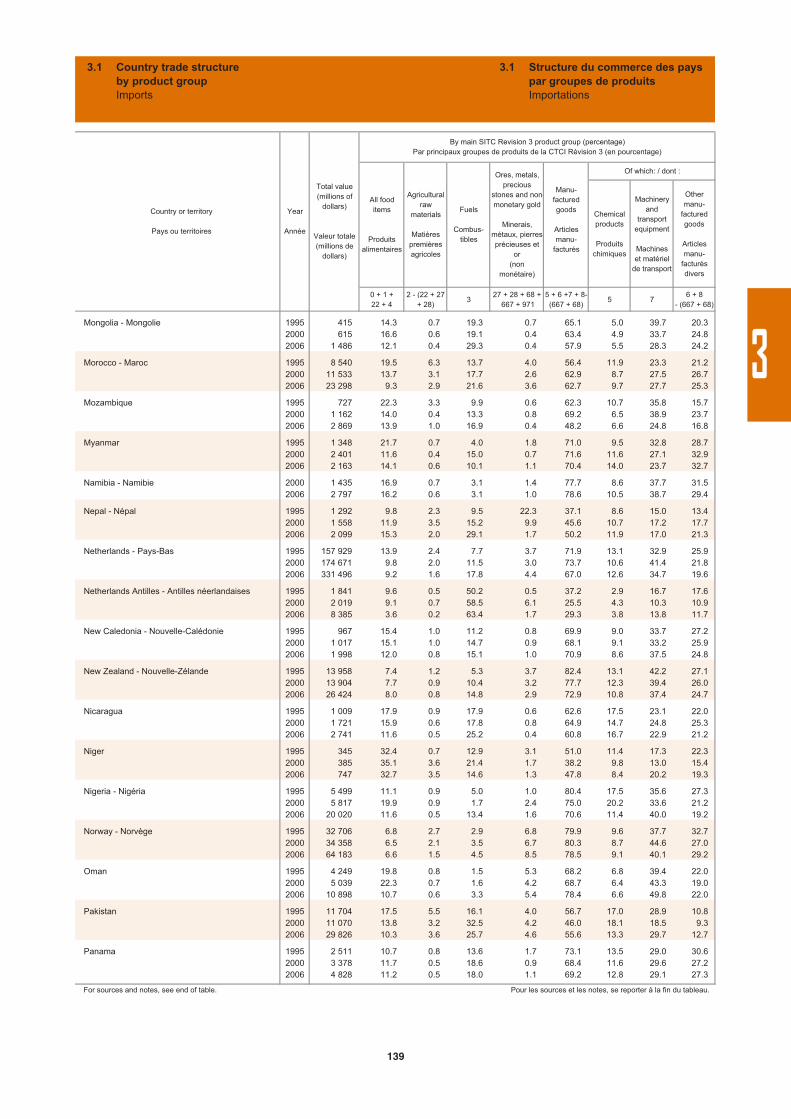
Chemicalproducts
Produitschimiques
Machineryand
transportequipment
Machineset matériel
de transport
Othermanu-
facturedgoods
Articlesmanu-
facturésdivers
0 + 1 +22 + 4
2 - (22 + 27 + 28)
327 + 28 + 68 +
667 + 9715 + 6 +7 + 8-(667 + 68)
5 76 + 8
- (667 + 68)
Mongolia - Mongolie 1995 415 14.3 0.7 19.3 0.7 65.1 5.0 39.7 20.32000 615 16.6 0.6 19.1 0.4 63.4 4.9 33.7 24.82006 1 486 12.1 0.4 29.3 0.4 57.9 5.5 28.3 24.2
Morocco - Maroc 1995 8 540 19.5 6.3 13.7 4.0 56.4 11.9 23.3 21.22000 11 533 13.7 3.1 17.7 2.6 62.9 8.7 27.5 26.72006 23 298 9.3 2.9 21.6 3.6 62.7 9.7 27.7 25.3
Mozambique 1995 727 22.3 3.3 9.9 0.6 62.3 10.7 35.8 15.72000 1 162 14.0 0.4 13.3 0.8 69.2 6.5 38.9 23.72006 2 869 13.9 1.0 16.9 0.4 48.2 6.6 24.8 16.8
Myanmar 1995 1 348 21.7 0.7 4.0 1.8 71.0 9.5 32.8 28.72000 2 401 11.6 0.4 15.0 0.7 71.6 11.6 27.1 32.92006 2 163 14.1 0.6 10.1 1.1 70.4 14.0 23.7 32.7
Namibia - Namibie 2000 1 435 16.9 0.7 3.1 1.4 77.7 8.6 37.7 31.52006 2 797 16.2 0.6 3.1 1.0 78.6 10.5 38.7 29.4
Nepal - Népal 1995 1 292 9.8 2.3 9.5 22.3 37.1 8.6 15.0 13.42000 1 558 11.9 3.5 15.2 9.9 45.6 10.7 17.2 17.72006 2 099 15.3 2.0 29.1 1.7 50.2 11.9 17.0 21.3
Netherlands - Pays-Bas 1995 157 929 13.9 2.4 7.7 3.7 71.9 13.1 32.9 25.92000 174 671 9.8 2.0 11.5 3.0 73.7 10.6 41.4 21.82006 331 496 9.2 1.6 17.8 4.4 67.0 12.6 34.7 19.6
Netherlands Antilles - Antilles néerlandaises 1995 1 841 9.6 0.5 50.2 0.5 37.2 2.9 16.7 17.62000 2 019 9.1 0.7 58.5 6.1 25.5 4.3 10.3 10.92006 8 385 3.6 0.2 63.4 1.7 29.3 3.8 13.8 11.7
New Caledonia - Nouvelle-Calédonie 1995 967 15.4 1.0 11.2 0.8 69.9 9.0 33.7 27.22000 1 017 15.1 1.0 14.7 0.9 68.1 9.1 33.2 25.92006 1 998 12.0 0.8 15.1 1.0 70.9 8.6 37.5 24.8
New Zealand - Nouvelle-Zélande 1995 13 958 7.4 1.2 5.3 3.7 82.4 13.1 42.2 27.12000 13 904 7.7 0.9 10.4 3.2 77.7 12.3 39.4 26.02006 26 424 8.0 0.8 14.8 2.9 72.9 10.8 37.4 24.7
Nicaragua 1995 1 009 17.9 0.9 17.9 0.6 62.6 17.5 23.1 22.02000 1 721 15.9 0.6 17.8 0.8 64.9 14.7 24.8 25.32006 2 741 11.6 0.5 25.2 0.4 60.8 16.7 22.9 21.2
Niger 1995 345 32.4 0.7 12.9 3.1 51.0 11.4 17.3 22.32000 385 35.1 3.6 21.4 1.7 38.2 9.8 13.0 15.42006 747 32.7 3.5 14.6 1.3 47.8 8.4 20.2 19.3
Nigeria - Nigéria 1995 5 499 11.1 0.9 5.0 1.0 80.4 17.5 35.6 27.32000 5 817 19.9 0.9 1.7 2.4 75.0 20.2 33.6 21.22006 20 020 11.6 0.5 13.4 1.6 70.6 11.4 40.0 19.2
Norway - Norvège 1995 32 706 6.8 2.7 2.9 6.8 79.9 9.6 37.7 32.72000 34 358 6.5 2.1 3.5 6.7 80.3 8.7 44.6 27.02006 64 183 6.6 1.5 4.5 8.5 78.5 9.1 40.1 29.2
Oman 1995 4 249 19.8 0.8 1.5 5.3 68.2 6.8 39.4 22.02000 5 039 22.3 0.7 1.6 4.2 68.7 6.4 43.3 19.02006 10 898 10.7 0.6 3.3 5.4 78.4 6.6 49.8 22.0
Pakistan 1995 11 704 17.5 5.5 16.1 4.0 56.7 17.0 28.9 10.82000 11 070 13.8 3.2 32.5 4.2 46.0 18.1 18.5 9.32006 29 826 10.3 3.6 25.7 4.6 55.6 13.3 29.7 12.7
Panama 1995 2 511 10.7 0.8 13.6 1.7 73.1 13.5 29.0 30.62000 3 378 11.7 0.5 18.6 0.9 68.4 11.6 29.6 27.22006 4 828 11.2 0.5 18.0 1.1 69.2 12.8 29.1 27.3
For sources and notes, see end of table. Pour les sources et les notes, se reporter à la fin du tableau.
Country or territory
Pays ou territoires
Year
Année
Total value(millions of
dollars)
Valeur totale(millions de
dollars)
By main SITC Revision 3 product group (percentage)Par principaux groupes de produits de la CTCI Révision 3 (en pourcentage)
All food items
Produitsalimentaires
Agriculturalraw
materials
Matièrespremièresagricoles
Fuels
Combus-tibles
Ores, metals, precious
stones and non-monetary gold
Minerais,métaux, pierres précieuses et
or(non
monétaire)
Manu-facturedgoods
Articlesmanu-
facturés
Of which: / dont :
3.1 Country trade structureby product groupImports
Structure du commerce des payspar groupes de produitsImportations
3.1
3
139
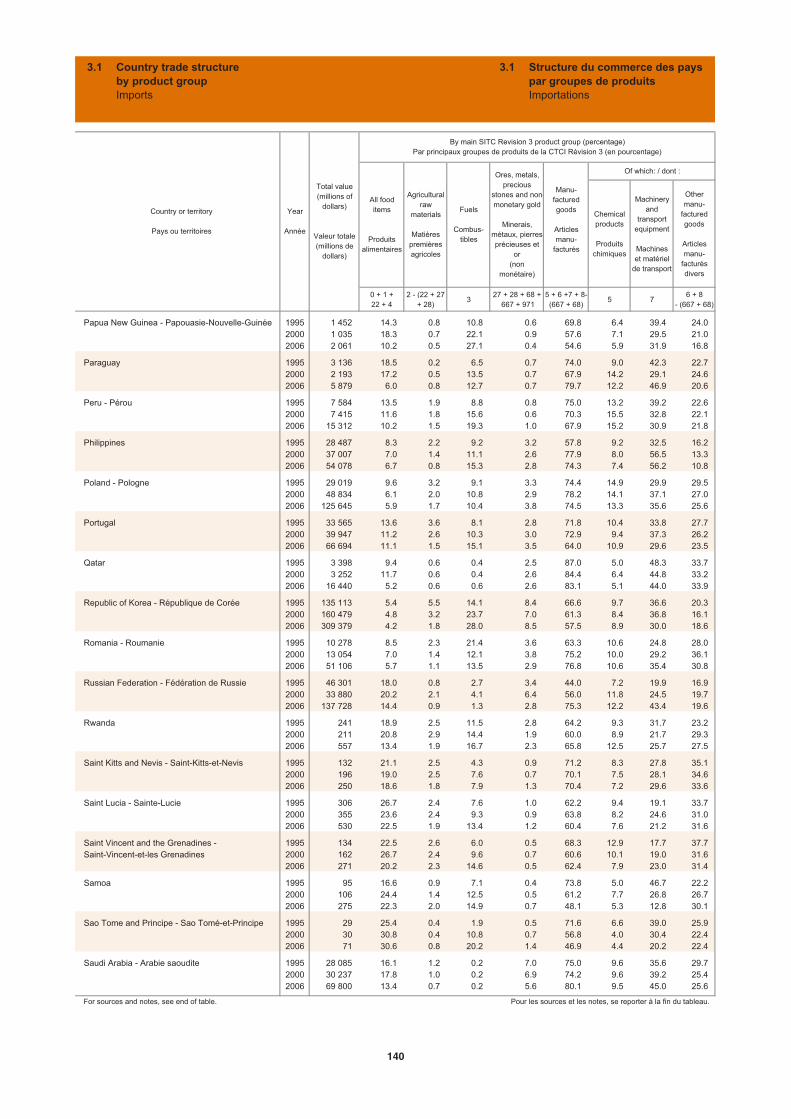
Chemicalproducts
Produitschimiques
Machineryand
transportequipment
Machineset matériel
de transport
Othermanu-
facturedgoods
Articlesmanu-
facturésdivers
0 + 1 +22 + 4
2 - (22 + 27 + 28)
327 + 28 + 68 +
667 + 9715 + 6 +7 + 8-(667 + 68)
5 76 + 8
- (667 + 68)
Papua New Guinea - Papouasie-Nouvelle-Guinée 1995 1 452 14.3 0.8 10.8 0.6 69.8 6.4 39.4 24.02000 1 035 18.3 0.7 22.1 0.9 57.6 7.1 29.5 21.02006 2 061 10.2 0.5 27.1 0.4 54.6 5.9 31.9 16.8
Paraguay 1995 3 136 18.5 0.2 6.5 0.7 74.0 9.0 42.3 22.72000 2 193 17.2 0.5 13.5 0.7 67.9 14.2 29.1 24.62006 5 879 6.0 0.8 12.7 0.7 79.7 12.2 46.9 20.6
Peru - Pérou 1995 7 584 13.5 1.9 8.8 0.8 75.0 13.2 39.2 22.62000 7 415 11.6 1.8 15.6 0.6 70.3 15.5 32.8 22.12006 15 312 10.2 1.5 19.3 1.0 67.9 15.2 30.9 21.8
Philippines 1995 28 487 8.3 2.2 9.2 3.2 57.8 9.2 32.5 16.22000 37 007 7.0 1.4 11.1 2.6 77.9 8.0 56.5 13.32006 54 078 6.7 0.8 15.3 2.8 74.3 7.4 56.2 10.8
Poland - Pologne 1995 29 019 9.6 3.2 9.1 3.3 74.4 14.9 29.9 29.52000 48 834 6.1 2.0 10.8 2.9 78.2 14.1 37.1 27.02006 125 645 5.9 1.7 10.4 3.8 74.5 13.3 35.6 25.6
Portugal 1995 33 565 13.6 3.6 8.1 2.8 71.8 10.4 33.8 27.72000 39 947 11.2 2.6 10.3 3.0 72.9 9.4 37.3 26.22006 66 694 11.1 1.5 15.1 3.5 64.0 10.9 29.6 23.5
Qatar 1995 3 398 9.4 0.6 0.4 2.5 87.0 5.0 48.3 33.72000 3 252 11.7 0.6 0.4 2.6 84.4 6.4 44.8 33.22006 16 440 5.2 0.6 0.6 2.6 83.1 5.1 44.0 33.9
Republic of Korea - République de Corée 1995 135 113 5.4 5.5 14.1 8.4 66.6 9.7 36.6 20.32000 160 479 4.8 3.2 23.7 7.0 61.3 8.4 36.8 16.12006 309 379 4.2 1.8 28.0 8.5 57.5 8.9 30.0 18.6
Romania - Roumanie 1995 10 278 8.5 2.3 21.4 3.6 63.3 10.6 24.8 28.02000 13 054 7.0 1.4 12.1 3.8 75.2 10.0 29.2 36.12006 51 106 5.7 1.1 13.5 2.9 76.8 10.6 35.4 30.8
Russian Federation - Fédération de Russie 1995 46 301 18.0 0.8 2.7 3.4 44.0 7.2 19.9 16.92000 33 880 20.2 2.1 4.1 6.4 56.0 11.8 24.5 19.72006 137 728 14.4 0.9 1.3 2.8 75.3 12.2 43.4 19.6
Rwanda 1995 241 18.9 2.5 11.5 2.8 64.2 9.3 31.7 23.22000 211 20.8 2.9 14.4 1.9 60.0 8.9 21.7 29.32006 557 13.4 1.9 16.7 2.3 65.8 12.5 25.7 27.5
Saint Kitts and Nevis - Saint-Kitts-et-Nevis 1995 132 21.1 2.5 4.3 0.9 71.2 8.3 27.8 35.12000 196 19.0 2.5 7.6 0.7 70.1 7.5 28.1 34.62006 250 18.6 1.8 7.9 1.3 70.4 7.2 29.6 33.6
Saint Lucia - Sainte-Lucie 1995 306 26.7 2.4 7.6 1.0 62.2 9.4 19.1 33.72000 355 23.6 2.4 9.3 0.9 63.8 8.2 24.6 31.02006 530 22.5 1.9 13.4 1.2 60.4 7.6 21.2 31.6
Saint Vincent and the Grenadines - 1995 134 22.5 2.6 6.0 0.5 68.3 12.9 17.7 37.7Saint-Vincent-et-les Grenadines 2000 162 26.7 2.4 9.6 0.7 60.6 10.1 19.0 31.6
2006 271 20.2 2.3 14.6 0.5 62.4 7.9 23.0 31.4
Samoa 1995 95 16.6 0.9 7.1 0.4 73.8 5.0 46.7 22.22000 106 24.4 1.4 12.5 0.5 61.2 7.7 26.8 26.72006 275 22.3 2.0 14.9 0.7 48.1 5.3 12.8 30.1
Sao Tome and Principe - Sao Tomé-et-Principe 1995 29 25.4 0.4 1.9 0.5 71.6 6.6 39.0 25.92000 30 30.8 0.4 10.8 0.7 56.8 4.0 30.4 22.42006 71 30.6 0.8 20.2 1.4 46.9 4.4 20.2 22.4
Saudi Arabia - Arabie saoudite 1995 28 085 16.1 1.2 0.2 7.0 75.0 9.6 35.6 29.72000 30 237 17.8 1.0 0.2 6.9 74.2 9.6 39.2 25.42006 69 800 13.4 0.7 0.2 5.6 80.1 9.5 45.0 25.6
For sources and notes, see end of table. Pour les sources et les notes, se reporter à la fin du tableau.
Country or territory
Pays ou territoires
Year
Année
Total value(millions of
dollars)
Valeur totale(millions de
dollars)
By main SITC Revision 3 product group (percentage)Par principaux groupes de produits de la CTCI Révision 3 (en pourcentage)
All food items
Produitsalimentaires
Agriculturalraw
materials
Matièrespremièresagricoles
Fuels
Combus-tibles
Ores, metals, precious
stones and non-monetary gold
Minerais,métaux, pierres précieuses et
or(non
monétaire)
Manu-facturedgoods
Articlesmanu-
facturés
Of which: / dont :
3.1 Country trade structureby product groupImports
Structure du commerce des payspar groupes de produitsImportations
3.1
140
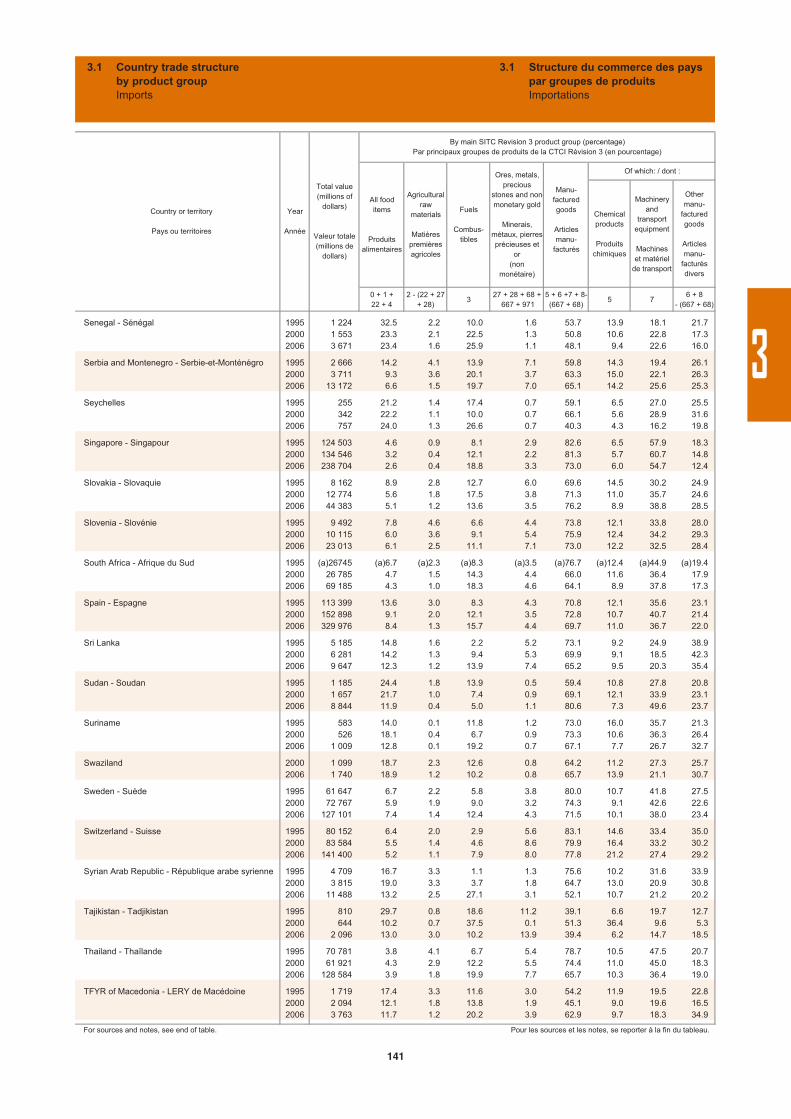
Chemicalproducts
Produitschimiques
Machineryand
transportequipment
Machineset matériel
de transport
Othermanu-
facturedgoods
Articlesmanu-
facturésdivers
0 + 1 +22 + 4
2 - (22 + 27 + 28)
327 + 28 + 68 +
667 + 9715 + 6 +7 + 8-(667 + 68)
5 76 + 8
- (667 + 68)
Senegal - Sénégal 1995 1 224 32.5 2.2 10.0 1.6 53.7 13.9 18.1 21.72000 1 553 23.3 2.1 22.5 1.3 50.8 10.6 22.8 17.32006 3 671 23.4 1.6 25.9 1.1 48.1 9.4 22.6 16.0
Serbia and Montenegro - Serbie-et-Monténégro 1995 2 666 14.2 4.1 13.9 7.1 59.8 14.3 19.4 26.12000 3 711 9.3 3.6 20.1 3.7 63.3 15.0 22.1 26.32006 13 172 6.6 1.5 19.7 7.0 65.1 14.2 25.6 25.3
Seychelles 1995 255 21.2 1.4 17.4 0.7 59.1 6.5 27.0 25.52000 342 22.2 1.1 10.0 0.7 66.1 5.6 28.9 31.62006 757 24.0 1.3 26.6 0.7 40.3 4.3 16.2 19.8
Singapore - Singapour 1995 124 503 4.6 0.9 8.1 2.9 82.6 6.5 57.9 18.32000 134 546 3.2 0.4 12.1 2.2 81.3 5.7 60.7 14.82006 238 704 2.6 0.4 18.8 3.3 73.0 6.0 54.7 12.4
Slovakia - Slovaquie 1995 8 162 8.9 2.8 12.7 6.0 69.6 14.5 30.2 24.92000 12 774 5.6 1.8 17.5 3.8 71.3 11.0 35.7 24.62006 44 383 5.1 1.2 13.6 3.5 76.2 8.9 38.8 28.5
Slovenia - Slovénie 1995 9 492 7.8 4.6 6.6 4.4 73.8 12.1 33.8 28.02000 10 115 6.0 3.6 9.1 5.4 75.9 12.4 34.2 29.32006 23 013 6.1 2.5 11.1 7.1 73.0 12.2 32.5 28.4
South Africa - Afrique du Sud 1995 (a)26745 (a)6.7 (a)2.3 (a)8.3 (a)3.5 (a)76.7 (a)12.4 (a)44.9 (a)19.42000 26 785 4.7 1.5 14.3 4.4 66.0 11.6 36.4 17.92006 69 185 4.3 1.0 18.3 4.6 64.1 8.9 37.8 17.3
Spain - Espagne 1995 113 399 13.6 3.0 8.3 4.3 70.8 12.1 35.6 23.12000 152 898 9.1 2.0 12.1 3.5 72.8 10.7 40.7 21.42006 329 976 8.4 1.3 15.7 4.4 69.7 11.0 36.7 22.0
Sri Lanka 1995 5 185 14.8 1.6 2.2 5.2 73.1 9.2 24.9 38.92000 6 281 14.2 1.3 9.4 5.3 69.9 9.1 18.5 42.32006 9 647 12.3 1.2 13.9 7.4 65.2 9.5 20.3 35.4
Sudan - Soudan 1995 1 185 24.4 1.8 13.9 0.5 59.4 10.8 27.8 20.82000 1 657 21.7 1.0 7.4 0.9 69.1 12.1 33.9 23.12006 8 844 11.9 0.4 5.0 1.1 80.6 7.3 49.6 23.7
Suriname 1995 583 14.0 0.1 11.8 1.2 73.0 16.0 35.7 21.32000 526 18.1 0.4 6.7 0.9 73.3 10.6 36.3 26.42006 1 009 12.8 0.1 19.2 0.7 67.1 7.7 26.7 32.7
Swaziland 2000 1 099 18.7 2.3 12.6 0.8 64.2 11.2 27.3 25.72006 1 740 18.9 1.2 10.2 0.8 65.7 13.9 21.1 30.7
Sweden - Suède 1995 61 647 6.7 2.2 5.8 3.8 80.0 10.7 41.8 27.52000 72 767 5.9 1.9 9.0 3.2 74.3 9.1 42.6 22.62006 127 101 7.4 1.4 12.4 4.3 71.5 10.1 38.0 23.4
Switzerland - Suisse 1995 80 152 6.4 2.0 2.9 5.6 83.1 14.6 33.4 35.02000 83 584 5.5 1.4 4.6 8.6 79.9 16.4 33.2 30.22006 141 400 5.2 1.1 7.9 8.0 77.8 21.2 27.4 29.2
Syrian Arab Republic - République arabe syrienne 1995 4 709 16.7 3.3 1.1 1.3 75.6 10.2 31.6 33.92000 3 815 19.0 3.3 3.7 1.8 64.7 13.0 20.9 30.82006 11 488 13.2 2.5 27.1 3.1 52.1 10.7 21.2 20.2
Tajikistan - Tadjikistan 1995 810 29.7 0.8 18.6 11.2 39.1 6.6 19.7 12.72000 644 10.2 0.7 37.5 0.1 51.3 36.4 9.6 5.32006 2 096 13.0 3.0 10.2 13.9 39.4 6.2 14.7 18.5
Thailand - Thaïlande 1995 70 781 3.8 4.1 6.7 5.4 78.7 10.5 47.5 20.72000 61 921 4.3 2.9 12.2 5.5 74.4 11.0 45.0 18.32006 128 584 3.9 1.8 19.9 7.7 65.7 10.3 36.4 19.0
TFYR of Macedonia - LERY de Macédoine 1995 1 719 17.4 3.3 11.6 3.0 54.2 11.9 19.5 22.82000 2 094 12.1 1.8 13.8 1.9 45.1 9.0 19.6 16.52006 3 763 11.7 1.2 20.2 3.9 62.9 9.7 18.3 34.9
For sources and notes, see end of table. Pour les sources et les notes, se reporter à la fin du tableau.
Country or territory
Pays ou territoires
Year
Année
Total value(millions of
dollars)
Valeur totale(millions de
dollars)
By main SITC Revision 3 product group (percentage)Par principaux groupes de produits de la CTCI Révision 3 (en pourcentage)
All food items
Produitsalimentaires
Agriculturalraw
materials
Matièrespremièresagricoles
Fuels
Combus-tibles
Ores, metals, precious
stones and non-monetary gold
Minerais,métaux, pierres précieuses et
or(non
monétaire)
Manu-facturedgoods
Articlesmanu-
facturés
Of which: / dont :
3.1 Country trade structureby product groupImports
Structure du commerce des payspar groupes de produitsImportations
3.1
3
141

Chemicalproducts
Produitschimiques
Machineryand
transportequipment
Machineset matériel
de transport
Othermanu-
facturedgoods
Articlesmanu-
facturésdivers
0 + 1 +22 + 4
2 - (22 + 27 + 28)
327 + 28 + 68 +
667 + 9715 + 6 +7 + 8-(667 + 68)
5 76 + 8
- (667 + 68)
Togo 1995 556 18.4 1.9 29.9 1.3 48.5 8.5 17.2 22.82000 324 18.4 1.7 18.8 1.6 59.5 10.7 18.6 30.32006 637 15.6 0.8 26.1 2.2 53.7 8.8 14.9 30.0
Trinidad and Tobago - Trinité-et-Tobago 1995 1 724 15.7 0.7 0.5 5.7 77.0 13.1 36.7 27.22000 3 308 8.3 1.0 32.3 2.0 56.1 7.9 30.6 17.62006 6 478 7.8 0.6 35.0 4.8 51.7 8.1 26.7 16.8
Tunisia - Tunisie 1995 7 903 12.5 4.2 7.2 3.3 72.8 9.1 25.9 37.82000 8 566 8.2 3.1 10.5 2.7 75.4 8.9 32.5 34.02006 14 862 8.5 2.7 12.0 3.0 73.7 10.2 29.8 33.7
Turkey - Turquie 1995 35 707 7.0 5.6 12.9 5.9 68.6 15.0 32.2 21.52000 54 150 3.9 3.7 13.9 4.0 70.7 13.6 37.6 19.62006 138 581 1.8 2.2 4.9 7.5 40.3 9.0 17.3 14.0
Turkmenistan - Turkménistan 1995 777 24.4 0.4 2.7 1.7 70.5 11.3 36.6 22.72000 1 786 11.7 0.4 1.2 1.0 79.8 8.9 43.8 27.12006 2 668 7.1 0.4 0.8 1.2 78.4 7.8 42.6 28.0
Turks and Caicos Islands - Îles Turques et Caïques 1995 51 11.8 1.7 0.9 0.3 59.7 20.8 16.9 22.02000 149 21.4 2.2 10.4 0.9 65.0 6.0 29.4 29.62006 498 13.3 2.6 10.2 1.5 69.4 4.9 27.4 37.2
Uganda - Ouganda 1995 1 038 15.8 2.6 1.8 2.0 77.8 10.7 34.8 32.42000 954 14.1 2.1 17.2 1.9 64.7 11.4 27.1 26.32006 2 557 13.6 1.4 21.1 1.1 62.6 13.2 25.9 23.5
Ukraine 1995 16 052 7.9 2.4 47.8 3.1 37.9 6.7 17.0 14.22000 13 956 6.3 1.5 43.0 5.4 41.1 8.8 17.5 14.82006 45 022 6.8 1.2 28.2 3.5 59.5 12.1 28.8 18.6
United Arab Emirates - Émirats arabes unis 1995 20 984 10.0 0.9 1.6 2.6 83.6 6.3 36.9 40.32000 27 192 11.1 0.8 0.8 3.8 83.2 7.9 39.8 35.42006 86 766 6.8 0.5 1.5 11.6 68.2 5.4 34.9 28.0
United Kingdom - Royaume-Uni 1995 261 456 10.1 2.4 3.5 5.2 78.1 10.3 41.3 26.62000 339 445 7.8 1.6 4.3 5.0 75.6 8.9 42.5 24.22006 606 428 7.8 1.2 8.9 4.5 65.4 9.6 33.7 22.1
United Republic of Tanzania - 1995 1 653 10.0 1.2 0.5 3.8 84.4 19.6 38.4 26.4République-Unie de Tanzanie 2000 1 586 14.6 2.5 18.5 1.2 63.1 10.2 32.7 20.2
2006 4 440 12.2 0.8 24.2 1.2 61.5 11.5 31.1 18.9
United States - États-Unis 1995 770 821 4.8 2.1 8.2 3.8 78.1 5.5 46.4 26.22000 1 258 080 4.1 1.4 11.1 3.5 76.0 6.0 44.8 25.12006 1 918 997 4.2 1.2 18.0 4.0 69.5 7.6 37.7 24.1
Uruguay 1995 2 866 10.4 4.0 10.1 1.2 74.3 15.3 34.5 24.52000 3 466 11.5 2.6 15.3 1.1 69.5 16.9 28.0 24.52006 4 775 8.1 2.9 27.5 1.4 60.1 17.5 23.4 19.2
Uzbekistan - Ouzbékistan 1995 2 893 16.0 1.7 1.5 3.0 77.1 9.5 37.3 30.22000 2 947 11.1 0.9 8.6 3.2 75.1 11.0 40.2 23.92006 3 355 5.8 3.6 2.8 3.5 78.5 11.5 41.8 25.2
Venezuela (Bolivarian Rep. of) - 1995 10 791 14.3 4.5 1.1 3.7 76.5 16.4 37.0 23.1Venezuela (Rép. bolivarienne du) 2000 14 584 11.7 1.8 3.6 1.8 81.1 14.1 41.7 25.3
2006 30 559 7.5 0.9 0.5 1.4 69.6 11.0 41.5 17.2
Viet Nam 1995 8 155 4.9 2.4 10.3 2.4 75.9 16.7 28.3 30.92000 15 637 5.2 2.9 13.5 2.6 72.6 15.3 30.0 27.22006 44 891 6.0 3.8 14.9 8.5 66.3 14.0 24.0 28.4
Yemen - Yémen 1995 1 817 28.9 2.4 7.9 1.4 59.4 8.2 23.1 28.12000 2 326 35.6 1.5 12.0 1.1 49.0 9.7 20.8 18.42006 4 935 21.2 0.8 21.9 0.7 55.3 8.7 23.4 23.1
For sources and notes, see end of table. Pour les sources et les notes, se reporter à la fin du tableau.
Country or territory
Pays ou territoires
Year
Année
Total value(millions of
dollars)
Valeur totale(millions de
dollars)
By main SITC Revision 3 product group (percentage)Par principaux groupes de produits de la CTCI Révision 3 (en pourcentage)
All food items
Produitsalimentaires
Agriculturalraw
materials
Matièrespremièresagricoles
Fuels
Combus-tibles
Ores, metals, precious
stones and non-monetary gold
Minerais,métaux, pierres précieuses et
or(non
monétaire)
Manu-facturedgoods
Articlesmanu-
facturés
Of which: / dont :
3.1 Country trade structureby product groupImports
Structure du commerce des payspar groupes de produitsImportations
3.1
142
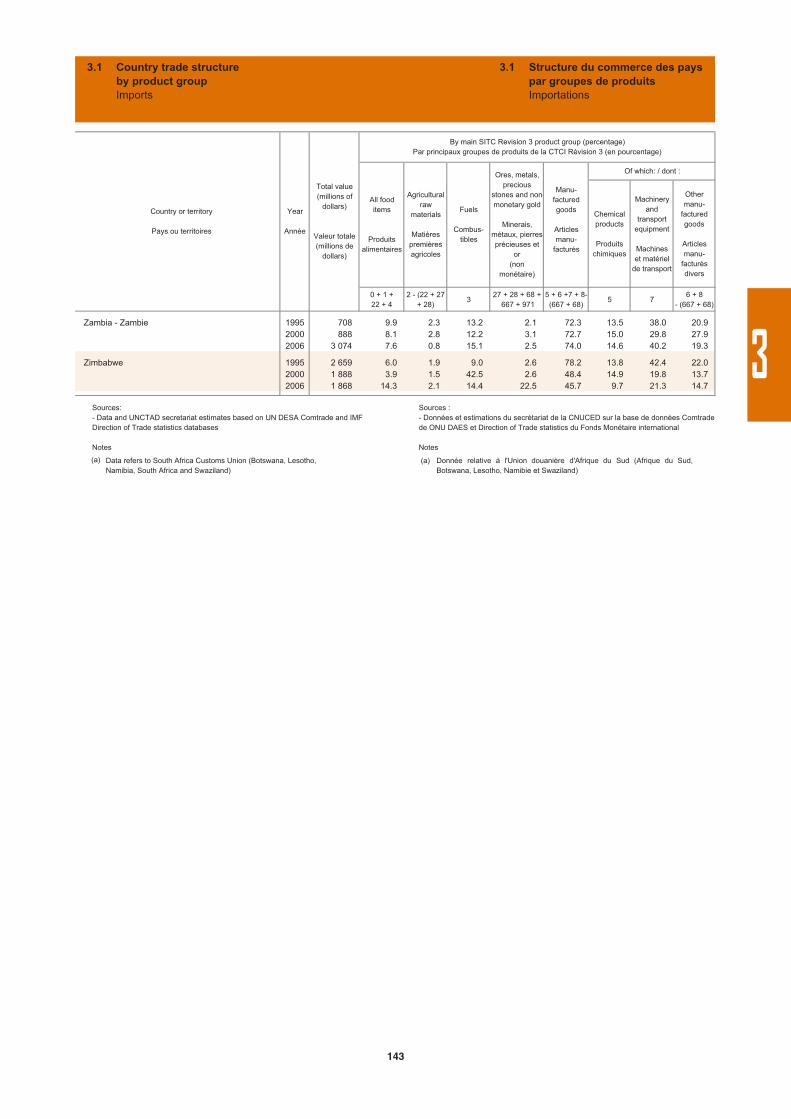
Chemicalproducts
Produitschimiques
Machineryand
transportequipment
Machineset matériel
de transport
Othermanu-
facturedgoods
Articlesmanu-
facturésdivers
0 + 1 +22 + 4
2 - (22 + 27 + 28)
327 + 28 + 68 +
667 + 9715 + 6 +7 + 8-(667 + 68)
5 76 + 8
- (667 + 68)
Zambia - Zambie 1995 708 9.9 2.3 13.2 2.1 72.3 13.5 38.0 20.92000 888 8.1 2.8 12.2 3.1 72.7 15.0 29.8 27.92006 3 074 7.6 0.8 15.1 2.5 74.0 14.6 40.2 19.3
Zimbabwe 1995 2 659 6.0 1.9 9.0 2.6 78.2 13.8 42.4 22.02000 1 888 3.9 1.5 42.5 2.6 48.4 14.9 19.8 13.72006 1 868 14.3 2.1 14.4 22.5 45.7 9.7 21.3 14.7
Country or territory
Pays ou territoires
Year
Année
Total value(millions of
dollars)
Valeur totale(millions de
dollars)
By main SITC Revision 3 product group (percentage)Par principaux groupes de produits de la CTCI Révision 3 (en pourcentage)
All food items
Produitsalimentaires
Agriculturalraw
materials
Matièrespremièresagricoles
Fuels
Combus-tibles
Ores, metals, precious
stones and non-monetary gold
Minerais,métaux, pierres précieuses et
or(non
monétaire)
Manu-facturedgoods
Articlesmanu-
facturés
Of which: / dont :
3.1 Country trade structureby product groupImports
Structure du commerce des payspar groupes de produitsImportations
3.1
Sources:- Data and UNCTAD secretariat estimates based on UN DESA Comtrade and IMF Direction of Trade statistics databases
Notes
Sources : - Données et estimations du secrétariat de la CNUCED sur la base de données Comtradede ONU DAES et Direction of Trade statistics du Fonds Monétaire international
Notes
(a) Data refers to South Africa Customs Union (Botswana, Lesotho, Namibia, South Africa and Swaziland)
(a) Donnée relative à l'Union douanière d'Afrique du Sud (Afrique du Sud,Botswana, Lesotho, Namibie et Swaziland)
3
143
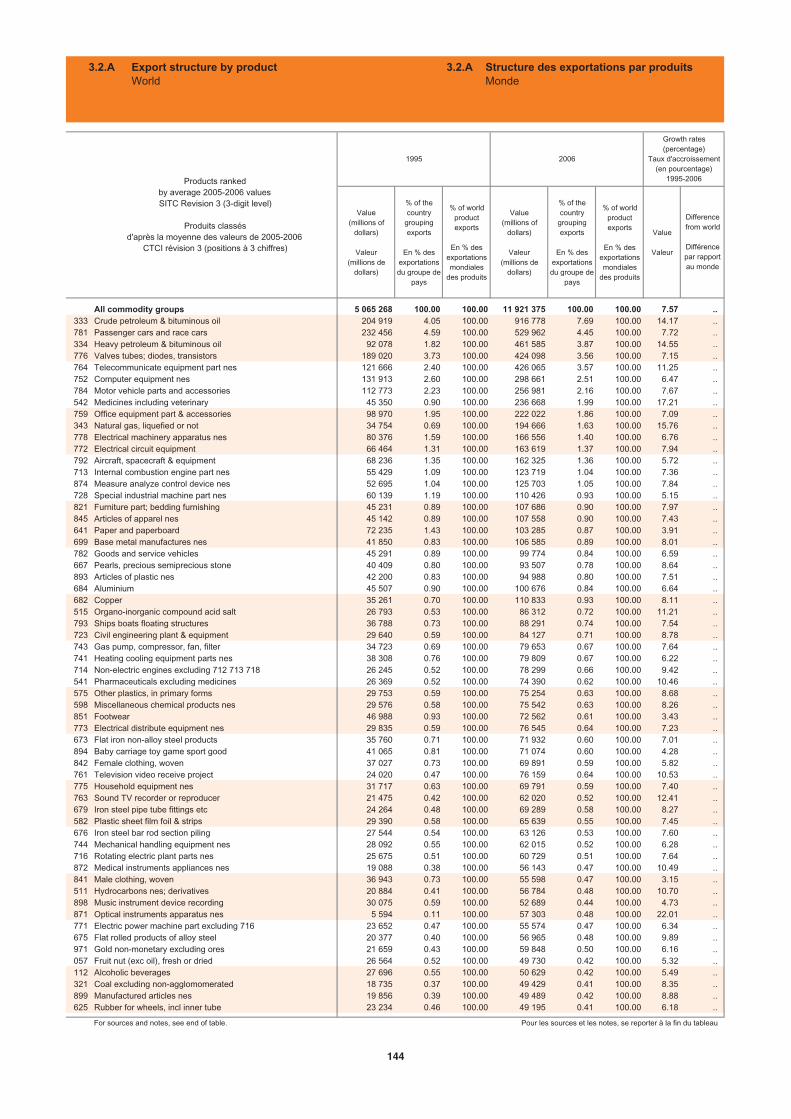
Value(millions of
dollars)
Valeur(millions de
dollars)
% of the country
groupingexports
En % desexportationsdu groupe de
pays
% of worldproductexports
En % des exportationsmondiales
des produits
Value(millions of
dollars)
Valeur(millions de
dollars)
% of the country
groupingexports
En % desexportationsdu groupe de
pays
% of worldproductexports
En % des exportationsmondiales
des produits
Value
Valeur
All commodity groups 5 065 268 100.00 100.00 11 921 375 100.00 100.00 7.57 ..333 Crude petroleum & bituminous oil 204 919 4.05 100.00 916 778 7.69 100.00 14.17 ..781 Passenger cars and race cars 232 456 4.59 100.00 529 962 4.45 100.00 7.72 ..334 Heavy petroleum & bituminous oil 92 078 1.82 100.00 461 585 3.87 100.00 14.55 ..776 Valves tubes; diodes, transistors 189 020 3.73 100.00 424 098 3.56 100.00 7.15 ..764 Telecommunicate equipment part nes 121 666 2.40 100.00 426 065 3.57 100.00 11.25 ..752 Computer equipment nes 131 913 2.60 100.00 298 661 2.51 100.00 6.47 ..784 Motor vehicle parts and accessories 112 773 2.23 100.00 256 981 2.16 100.00 7.67 ..542 Medicines including veterinary 45 350 0.90 100.00 236 668 1.99 100.00 17.21 ..759 Office equipment part & accessories 98 970 1.95 100.00 222 022 1.86 100.00 7.09 ..343 Natural gas, liquefied or not 34 754 0.69 100.00 194 666 1.63 100.00 15.76 ..778 Electrical machinery apparatus nes 80 376 1.59 100.00 166 556 1.40 100.00 6.76 ..772 Electrical circuit equipment 66 464 1.31 100.00 163 619 1.37 100.00 7.94 ..792 Aircraft, spacecraft & equipment 68 236 1.35 100.00 162 325 1.36 100.00 5.72 ..713 Internal combustion engine part nes 55 429 1.09 100.00 123 719 1.04 100.00 7.36 ..874 Measure analyze control device nes 52 695 1.04 100.00 125 703 1.05 100.00 7.84 ..728 Special industrial machine part nes 60 139 1.19 100.00 110 426 0.93 100.00 5.15 ..821 Furniture part; bedding furnishing 45 231 0.89 100.00 107 686 0.90 100.00 7.97 ..845 Articles of apparel nes 45 142 0.89 100.00 107 558 0.90 100.00 7.43 ..641 Paper and paperboard 72 235 1.43 100.00 103 285 0.87 100.00 3.91 ..699 Base metal manufactures nes 41 850 0.83 100.00 106 585 0.89 100.00 8.01 ..782 Goods and service vehicles 45 291 0.89 100.00 99 774 0.84 100.00 6.59 ..667 Pearls, precious semiprecious stone 40 409 0.80 100.00 93 507 0.78 100.00 8.64 ..893 Articles of plastic nes 42 200 0.83 100.00 94 988 0.80 100.00 7.51 ..684 Aluminium 45 507 0.90 100.00 100 676 0.84 100.00 6.64 ..682 Copper 35 261 0.70 100.00 110 833 0.93 100.00 8.11 ..515 Organo-inorganic compound acid salt 26 793 0.53 100.00 86 312 0.72 100.00 11.21 ..793 Ships boats floating structures 36 788 0.73 100.00 88 291 0.74 100.00 7.54 ..723 Civil engineering plant & equipment 29 640 0.59 100.00 84 127 0.71 100.00 8.78 ..743 Gas pump, compressor, fan, filter 34 723 0.69 100.00 79 653 0.67 100.00 7.64 ..741 Heating cooling equipment parts nes 38 308 0.76 100.00 79 809 0.67 100.00 6.22 ..714 Non-electric engines excluding 712 713 718 26 245 0.52 100.00 78 299 0.66 100.00 9.42 ..541 Pharmaceuticals excluding medicines 26 369 0.52 100.00 74 390 0.62 100.00 10.46 ..575 Other plastics, in primary forms 29 753 0.59 100.00 75 254 0.63 100.00 8.68 ..598 Miscellaneous chemical products nes 29 576 0.58 100.00 75 542 0.63 100.00 8.26 ..851 Footwear 46 988 0.93 100.00 72 562 0.61 100.00 3.43 ..773 Electrical distribute equipment nes 29 835 0.59 100.00 76 545 0.64 100.00 7.23 ..673 Flat iron non-alloy steel products 35 760 0.71 100.00 71 932 0.60 100.00 7.01 ..894 Baby carriage toy game sport good 41 065 0.81 100.00 71 074 0.60 100.00 4.28 ..842 Female clothing, woven 37 027 0.73 100.00 69 891 0.59 100.00 5.82 ..761 Television video receive project 24 020 0.47 100.00 76 159 0.64 100.00 10.53 ..775 Household equipment nes 31 717 0.63 100.00 69 791 0.59 100.00 7.40 ..763 Sound TV recorder or reproducer 21 475 0.42 100.00 62 020 0.52 100.00 12.41 ..679 Iron steel pipe tube fittings etc 24 264 0.48 100.00 69 289 0.58 100.00 8.27 ..582 Plastic sheet film foil & strips 29 390 0.58 100.00 65 639 0.55 100.00 7.45 ..676 Iron steel bar rod section piling 27 544 0.54 100.00 63 126 0.53 100.00 7.60 ..744 Mechanical handling equipment nes 28 092 0.55 100.00 62 015 0.52 100.00 6.28 ..716 Rotating electric plant parts nes 25 675 0.51 100.00 60 729 0.51 100.00 7.64 ..872 Medical instruments appliances nes 19 088 0.38 100.00 56 143 0.47 100.00 10.49 ..841 Male clothing, woven 36 943 0.73 100.00 55 598 0.47 100.00 3.15 ..511 Hydrocarbons nes; derivatives 20 884 0.41 100.00 56 784 0.48 100.00 10.70 ..898 Music instrument device recording 30 075 0.59 100.00 52 689 0.44 100.00 4.73 ..871 Optical instruments apparatus nes 5 594 0.11 100.00 57 303 0.48 100.00 22.01 ..771 Electric power machine part excluding 716 23 652 0.47 100.00 55 574 0.47 100.00 6.34 ..675 Flat rolled products of alloy steel 20 377 0.40 100.00 56 965 0.48 100.00 9.89 ..971 Gold non-monetary excluding ores 21 659 0.43 100.00 59 848 0.50 100.00 6.16 ..057 Fruit nut (exc oil), fresh or dried 26 564 0.52 100.00 49 730 0.42 100.00 5.32 ..112 Alcoholic beverages 27 696 0.55 100.00 50 629 0.42 100.00 5.49 ..321 Coal excluding non-agglomomerated 18 735 0.37 100.00 49 429 0.41 100.00 8.35 ..899 Manufactured articles nes 19 856 0.39 100.00 49 489 0.42 100.00 8.88 ..625 Rubber for wheels, incl inner tube 23 234 0.46 100.00 49 195 0.41 100.00 6.18 ..
For sources and notes, see end of table. Pour les sources et les notes, se reporter à la fin du tableau
Growth rates (percentage)
Taux d'accroissement (en pourcentage)
1995-2006Products rankedby average 2005-2006 valuesSITC Revision 3 (3-digit level)
Produits classésd'après la moyenne des valeurs de 2005-2006
CTCI révision 3 (positions à 3 chiffres)
1995 2006
Differencefrom world
Différencepar rapportau monde
3.2.A Export structure by productWorld
3.2.A Structure des exportations par produitsMonde
144
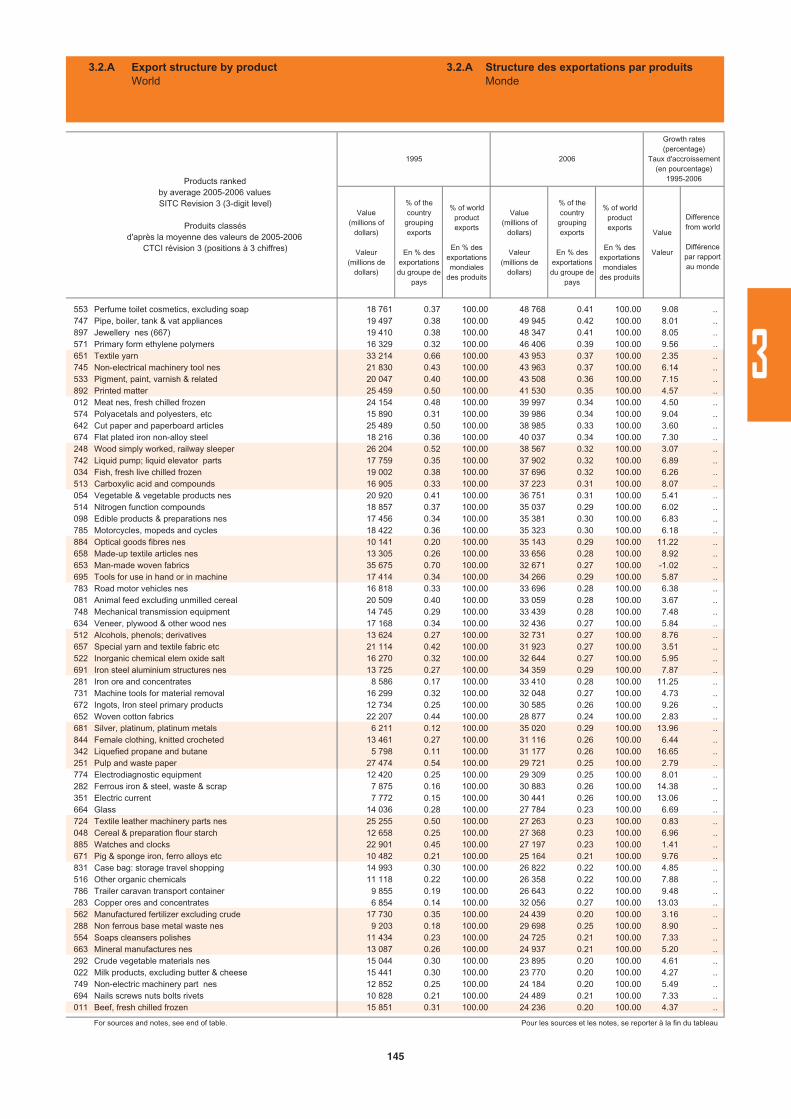
Value(millions of
dollars)
Valeur(millions de
dollars)
% of the country
groupingexports
En % desexportationsdu groupe de
pays
% of worldproductexports
En % des exportationsmondiales
des produits
Value(millions of
dollars)
Valeur(millions de
dollars)
% of the country
groupingexports
En % desexportationsdu groupe de
pays
% of worldproductexports
En % des exportationsmondiales
des produits
Value
Valeur
553 Perfume toilet cosmetics, excluding soap 18 761 0.37 100.00 48 768 0.41 100.00 9.08 ..747 Pipe, boiler, tank & vat appliances 19 497 0.38 100.00 49 945 0.42 100.00 8.01 ..897 Jewellery nes (667) 19 410 0.38 100.00 48 347 0.41 100.00 8.05 ..571 Primary form ethylene polymers 16 329 0.32 100.00 46 406 0.39 100.00 9.56 ..651 Textile yarn 33 214 0.66 100.00 43 953 0.37 100.00 2.35 ..745 Non-electrical machinery tool nes 21 830 0.43 100.00 43 963 0.37 100.00 6.14 ..533 Pigment, paint, varnish & related 20 047 0.40 100.00 43 508 0.36 100.00 7.15 ..892 Printed matter 25 459 0.50 100.00 41 530 0.35 100.00 4.57 ..012 Meat nes, fresh chilled frozen 24 154 0.48 100.00 39 997 0.34 100.00 4.50 ..574 Polyacetals and polyesters, etc 15 890 0.31 100.00 39 986 0.34 100.00 9.04 ..642 Cut paper and paperboard articles 25 489 0.50 100.00 38 985 0.33 100.00 3.60 ..674 Flat plated iron non-alloy steel 18 216 0.36 100.00 40 037 0.34 100.00 7.30 ..248 Wood simply worked, railway sleeper 26 204 0.52 100.00 38 567 0.32 100.00 3.07 ..742 Liquid pump; liquid elevator parts 17 759 0.35 100.00 37 902 0.32 100.00 6.89 ..034 Fish, fresh live chilled frozen 19 002 0.38 100.00 37 696 0.32 100.00 6.26 ..513 Carboxylic acid and compounds 16 905 0.33 100.00 37 223 0.31 100.00 8.07 ..054 Vegetable & vegetable products nes 20 920 0.41 100.00 36 751 0.31 100.00 5.41 ..514 Nitrogen function compounds 18 857 0.37 100.00 35 037 0.29 100.00 6.02 ..098 Edible products & preparations nes 17 456 0.34 100.00 35 381 0.30 100.00 6.83 ..785 Motorcycles, mopeds and cycles 18 422 0.36 100.00 35 323 0.30 100.00 6.18 ..884 Optical goods fibres nes 10 141 0.20 100.00 35 143 0.29 100.00 11.22 ..658 Made-up textile articles nes 13 305 0.26 100.00 33 656 0.28 100.00 8.92 ..653 Man-made woven fabrics 35 675 0.70 100.00 32 671 0.27 100.00 -1.02 ..695 Tools for use in hand or in machine 17 414 0.34 100.00 34 266 0.29 100.00 5.87 ..783 Road motor vehicles nes 16 818 0.33 100.00 33 696 0.28 100.00 6.38 ..081 Animal feed excluding unmilled cereal 20 509 0.40 100.00 33 059 0.28 100.00 3.67 ..748 Mechanical transmission equipment 14 745 0.29 100.00 33 439 0.28 100.00 7.48 ..634 Veneer, plywood & other wood nes 17 168 0.34 100.00 32 436 0.27 100.00 5.84 ..512 Alcohols, phenols; derivatives 13 624 0.27 100.00 32 731 0.27 100.00 8.76 ..657 Special yarn and textile fabric etc 21 114 0.42 100.00 31 923 0.27 100.00 3.51 ..522 Inorganic chemical elem oxide salt 16 270 0.32 100.00 32 644 0.27 100.00 5.95 ..691 Iron steel aluminium structures nes 13 725 0.27 100.00 34 359 0.29 100.00 7.87 ..281 Iron ore and concentrates 8 586 0.17 100.00 33 410 0.28 100.00 11.25 ..731 Machine tools for material removal 16 299 0.32 100.00 32 048 0.27 100.00 4.73 ..672 Ingots, Iron steel primary products 12 734 0.25 100.00 30 585 0.26 100.00 9.26 ..652 Woven cotton fabrics 22 207 0.44 100.00 28 877 0.24 100.00 2.83 ..681 Silver, platinum, platinum metals 6 211 0.12 100.00 35 020 0.29 100.00 13.96 ..844 Female clothing, knitted crocheted 13 461 0.27 100.00 31 116 0.26 100.00 6.44 ..342 Liquefied propane and butane 5 798 0.11 100.00 31 177 0.26 100.00 16.65 ..251 Pulp and waste paper 27 474 0.54 100.00 29 721 0.25 100.00 2.79 ..774 Electrodiagnostic equipment 12 420 0.25 100.00 29 309 0.25 100.00 8.01 ..282 Ferrous iron & steel, waste & scrap 7 875 0.16 100.00 30 883 0.26 100.00 14.38 ..351 Electric current 7 772 0.15 100.00 30 441 0.26 100.00 13.06 ..664 Glass 14 036 0.28 100.00 27 784 0.23 100.00 6.69 ..724 Textile leather machinery parts nes 25 255 0.50 100.00 27 263 0.23 100.00 0.83 ..048 Cereal & preparation flour starch 12 658 0.25 100.00 27 368 0.23 100.00 6.96 ..885 Watches and clocks 22 901 0.45 100.00 27 197 0.23 100.00 1.41 ..671 Pig & sponge iron, ferro alloys etc 10 482 0.21 100.00 25 164 0.21 100.00 9.76 ..831 Case bag: storage travel shopping 14 993 0.30 100.00 26 822 0.22 100.00 4.85 ..516 Other organic chemicals 11 118 0.22 100.00 26 358 0.22 100.00 7.88 ..786 Trailer caravan transport container 9 855 0.19 100.00 26 643 0.22 100.00 9.48 ..283 Copper ores and concentrates 6 854 0.14 100.00 32 056 0.27 100.00 13.03 ..562 Manufactured fertilizer excluding crude 17 730 0.35 100.00 24 439 0.20 100.00 3.16 ..288 Non ferrous base metal waste nes 9 203 0.18 100.00 29 698 0.25 100.00 8.90 ..554 Soaps cleansers polishes 11 434 0.23 100.00 24 725 0.21 100.00 7.33 ..663 Mineral manufactures nes 13 087 0.26 100.00 24 937 0.21 100.00 5.20 ..292 Crude vegetable materials nes 15 044 0.30 100.00 23 895 0.20 100.00 4.61 ..022 Milk products, excluding butter & cheese 15 441 0.30 100.00 23 770 0.20 100.00 4.27 ..749 Non-electric machinery part nes 12 852 0.25 100.00 24 184 0.20 100.00 5.49 ..694 Nails screws nuts bolts rivets 10 828 0.21 100.00 24 489 0.21 100.00 7.33 ..011 Beef, fresh chilled frozen 15 851 0.31 100.00 24 236 0.20 100.00 4.37 ..
For sources and notes, see end of table. Pour les sources et les notes, se reporter à la fin du tableau
Growth rates (percentage)
Taux d'accroissement (en pourcentage)
1995-2006
Differencefrom world
Différencepar rapportau monde
Products rankedby average 2005-2006 valuesSITC Revision 3 (3-digit level)
Produits classésd'après la moyenne des valeurs de 2005-2006
CTCI révision 3 (positions à 3 chiffres)
1995 2006
3.2.A Export structure by productWorld
3.2.A Structure des exportations par produitsMonde
3
145
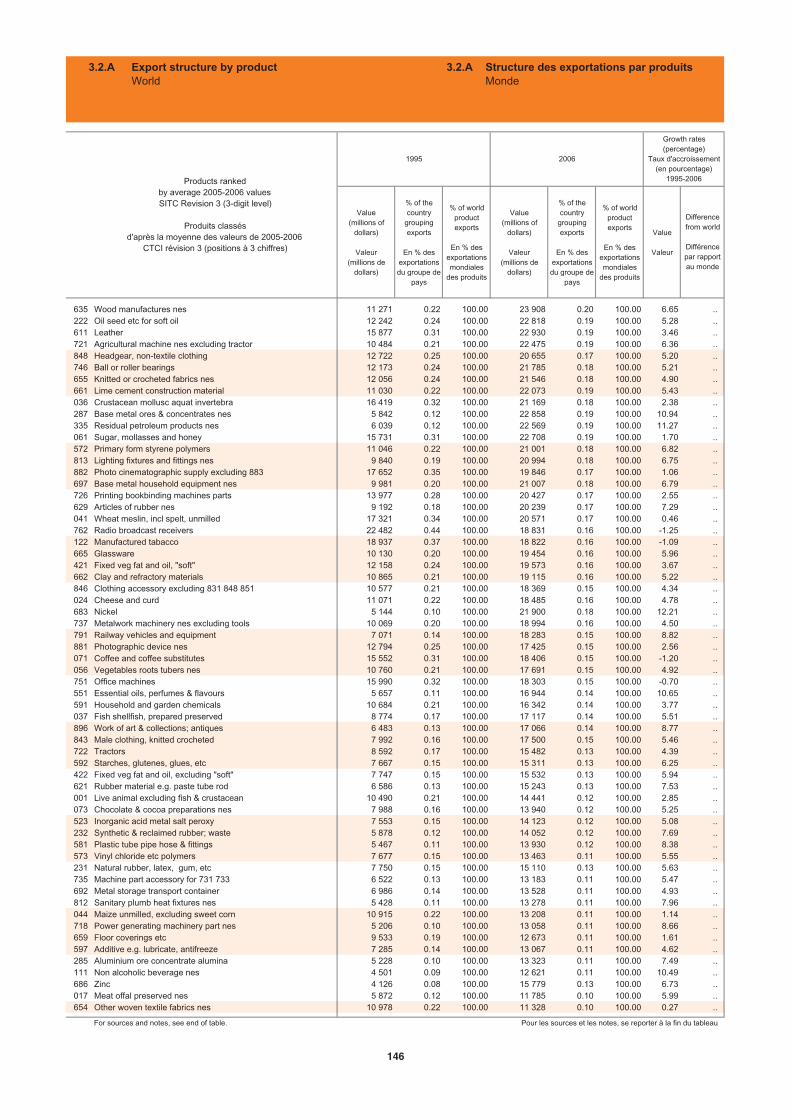
Value(millions of
dollars)
Valeur(millions de
dollars)
% of the country
groupingexports
En % desexportationsdu groupe de
pays
% of worldproductexports
En % des exportationsmondiales
des produits
Value(millions of
dollars)
Valeur(millions de
dollars)
% of the country
groupingexports
En % desexportationsdu groupe de
pays
% of worldproductexports
En % des exportationsmondiales
des produits
Value
Valeur
635 Wood manufactures nes 11 271 0.22 100.00 23 908 0.20 100.00 6.65 ..222 Oil seed etc for soft oil 12 242 0.24 100.00 22 818 0.19 100.00 5.28 ..611 Leather 15 877 0.31 100.00 22 930 0.19 100.00 3.46 ..721 Agricultural machine nes excluding tractor 10 484 0.21 100.00 22 475 0.19 100.00 6.36 ..848 Headgear, non-textile clothing 12 722 0.25 100.00 20 655 0.17 100.00 5.20 ..746 Ball or roller bearings 12 173 0.24 100.00 21 785 0.18 100.00 5.21 ..655 Knitted or crocheted fabrics nes 12 056 0.24 100.00 21 546 0.18 100.00 4.90 ..661 Lime cement construction material 11 030 0.22 100.00 22 073 0.19 100.00 5.43 ..036 Crustacean mollusc aquat invertebra 16 419 0.32 100.00 21 169 0.18 100.00 2.38 ..287 Base metal ores & concentrates nes 5 842 0.12 100.00 22 858 0.19 100.00 10.94 ..335 Residual petroleum products nes 6 039 0.12 100.00 22 569 0.19 100.00 11.27 ..061 Sugar, mollasses and honey 15 731 0.31 100.00 22 708 0.19 100.00 1.70 ..572 Primary form styrene polymers 11 046 0.22 100.00 21 001 0.18 100.00 6.82 ..813 Lighting fixtures and fittings nes 9 840 0.19 100.00 20 994 0.18 100.00 6.75 ..882 Photo cinematographic supply excluding 883 17 652 0.35 100.00 19 846 0.17 100.00 1.06 ..697 Base metal household equipment nes 9 981 0.20 100.00 21 007 0.18 100.00 6.79 ..726 Printing bookbinding machines parts 13 977 0.28 100.00 20 427 0.17 100.00 2.55 ..629 Articles of rubber nes 9 192 0.18 100.00 20 239 0.17 100.00 7.29 ..041 Wheat meslin, incl spelt, unmilled 17 321 0.34 100.00 20 571 0.17 100.00 0.46 ..762 Radio broadcast receivers 22 482 0.44 100.00 18 831 0.16 100.00 -1.25 ..122 Manufactured tabacco 18 937 0.37 100.00 18 822 0.16 100.00 -1.09 ..665 Glassware 10 130 0.20 100.00 19 454 0.16 100.00 5.96 ..421 Fixed veg fat and oil, "soft" 12 158 0.24 100.00 19 573 0.16 100.00 3.67 ..662 Clay and refractory materials 10 865 0.21 100.00 19 115 0.16 100.00 5.22 ..846 Clothing accessory excluding 831 848 851 10 577 0.21 100.00 18 369 0.15 100.00 4.34 ..024 Cheese and curd 11 071 0.22 100.00 18 485 0.16 100.00 4.78 ..683 Nickel 5 144 0.10 100.00 21 900 0.18 100.00 12.21 ..737 Metalwork machinery nes excluding tools 10 069 0.20 100.00 18 994 0.16 100.00 4.50 ..791 Railway vehicles and equipment 7 071 0.14 100.00 18 283 0.15 100.00 8.82 ..881 Photographic device nes 12 794 0.25 100.00 17 425 0.15 100.00 2.56 ..071 Coffee and coffee substitutes 15 552 0.31 100.00 18 406 0.15 100.00 -1.20 ..056 Vegetables roots tubers nes 10 760 0.21 100.00 17 691 0.15 100.00 4.92 ..751 Office machines 15 990 0.32 100.00 18 303 0.15 100.00 -0.70 ..551 Essential oils, perfumes & flavours 5 657 0.11 100.00 16 944 0.14 100.00 10.65 ..591 Household and garden chemicals 10 684 0.21 100.00 16 342 0.14 100.00 3.77 ..037 Fish shellfish, prepared preserved 8 774 0.17 100.00 17 117 0.14 100.00 5.51 ..896 Work of art & collections; antiques 6 483 0.13 100.00 17 066 0.14 100.00 8.77 ..843 Male clothing, knitted crocheted 7 992 0.16 100.00 17 500 0.15 100.00 5.46 ..722 Tractors 8 592 0.17 100.00 15 482 0.13 100.00 4.39 ..592 Starches, glutenes, glues, etc 7 667 0.15 100.00 15 311 0.13 100.00 6.25 ..422 Fixed veg fat and oil, excluding "soft" 7 747 0.15 100.00 15 532 0.13 100.00 5.94 ..621 Rubber material e.g. paste tube rod 6 586 0.13 100.00 15 243 0.13 100.00 7.53 ..001 Live animal excluding fish & crustacean 10 490 0.21 100.00 14 441 0.12 100.00 2.85 ..073 Chocolate & cocoa preparations nes 7 988 0.16 100.00 13 940 0.12 100.00 5.25 ..523 Inorganic acid metal salt peroxy 7 553 0.15 100.00 14 123 0.12 100.00 5.08 ..232 Synthetic & reclaimed rubber; waste 5 878 0.12 100.00 14 052 0.12 100.00 7.69 ..581 Plastic tube pipe hose & fittings 5 467 0.11 100.00 13 930 0.12 100.00 8.38 ..573 Vinyl chloride etc polymers 7 677 0.15 100.00 13 463 0.11 100.00 5.55 ..231 Natural rubber, latex, gum, etc 7 750 0.15 100.00 15 110 0.13 100.00 5.63 ..735 Machine part accessory for 731 733 6 522 0.13 100.00 13 183 0.11 100.00 5.47 ..692 Metal storage transport container 6 986 0.14 100.00 13 528 0.11 100.00 4.93 ..812 Sanitary plumb heat fixtures nes 5 428 0.11 100.00 13 278 0.11 100.00 7.96 ..044 Maize unmilled, excluding sweet corn 10 915 0.22 100.00 13 208 0.11 100.00 1.14 ..718 Power generating machinery part nes 5 206 0.10 100.00 13 058 0.11 100.00 8.66 ..659 Floor coverings etc 9 533 0.19 100.00 12 673 0.11 100.00 1.61 ..597 Additive e.g. lubricate, antifreeze 7 285 0.14 100.00 13 067 0.11 100.00 4.62 ..285 Aluminium ore concentrate alumina 5 228 0.10 100.00 13 323 0.11 100.00 7.49 ..111 Non alcoholic beverage nes 4 501 0.09 100.00 12 621 0.11 100.00 10.49 ..686 Zinc 4 126 0.08 100.00 15 779 0.13 100.00 6.73 ..017 Meat offal preserved nes 5 872 0.12 100.00 11 785 0.10 100.00 5.99 ..654 Other woven textile fabrics nes 10 978 0.22 100.00 11 328 0.10 100.00 0.27 ..
For sources and notes, see end of table. Pour les sources et les notes, se reporter à la fin du tableau
Products rankedby average 2005-2006 valuesSITC Revision 3 (3-digit level)
Produits classésd'après la moyenne des valeurs de 2005-2006
CTCI révision 3 (positions à 3 chiffres)
1995 2006
Growth rates (percentage)
Taux d'accroissement (en pourcentage)
1995-2006
Differencefrom world
Différencepar rapportau monde
3.2.A Export structure by productWorld
3.2.A Structure des exportations par produitsMonde
146
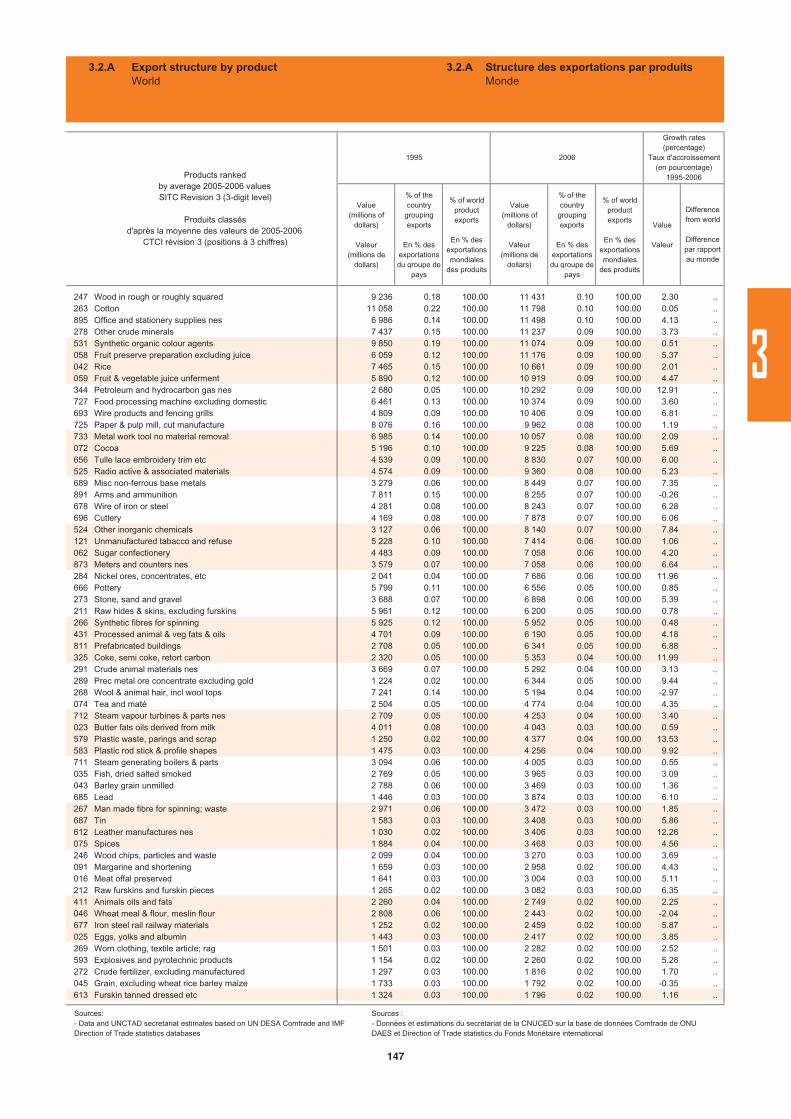
Value(millions of
dollars)
Valeur(millions de
dollars)
% of the country
groupingexports
En % desexportationsdu groupe de
pays
% of worldproductexports
En % des exportationsmondiales
des produits
Value(millions of
dollars)
Valeur(millions de
dollars)
% of the country
groupingexports
En % desexportationsdu groupe de
pays
% of worldproductexports
En % des exportationsmondiales
des produits
Value
Valeur
247 Wood in rough or roughly squared 9 236 0.18 100.00 11 431 0.10 100.00 2.30 ..263 Cotton 11 058 0.22 100.00 11 798 0.10 100.00 0.05 ..895 Office and stationery supplies nes 6 986 0.14 100.00 11 498 0.10 100.00 4.13 ..278 Other crude minerals 7 437 0.15 100.00 11 237 0.09 100.00 3.73 ..531 Synthetic organic colour agents 9 850 0.19 100.00 11 074 0.09 100.00 0.51 ..058 Fruit preserve preparation excluding juice 6 059 0.12 100.00 11 176 0.09 100.00 5.37 ..042 Rice 7 465 0.15 100.00 10 661 0.09 100.00 2.01 ..059 Fruit & vegetable juice unferment 5 890 0.12 100.00 10 919 0.09 100.00 4.47 ..344 Petroleum and hydrocarbon gas nes 2 680 0.05 100.00 10 292 0.09 100.00 12.91 ..727 Food processing machine excluding domestic 6 461 0.13 100.00 10 374 0.09 100.00 3.60 ..693 Wire products and fencing grills 4 809 0.09 100.00 10 406 0.09 100.00 6.81 ..725 Paper & pulp mill, cut manufacture 8 076 0.16 100.00 9 962 0.08 100.00 1.19 ..733 Metal work tool no material removal 6 985 0.14 100.00 10 057 0.08 100.00 2.09 ..072 Cocoa 5 196 0.10 100.00 9 225 0.08 100.00 5.69 ..656 Tulle lace embroidery trim etc 4 539 0.09 100.00 8 830 0.07 100.00 6.00 ..525 Radio active & associated materials 4 574 0.09 100.00 9 360 0.08 100.00 5.23 ..689 Misc non-ferrous base metals 3 279 0.06 100.00 8 449 0.07 100.00 7.35 ..891 Arms and ammunition 7 811 0.15 100.00 8 255 0.07 100.00 -0.26 ..678 Wire of iron or steel 4 281 0.08 100.00 8 243 0.07 100.00 6.28 ..696 Cutlery 4 169 0.08 100.00 7 878 0.07 100.00 6.06 ..524 Other inorganic chemicals 3 127 0.06 100.00 8 140 0.07 100.00 7.84 ..121 Unmanufactured tabacco and refuse 5 228 0.10 100.00 7 414 0.06 100.00 1.06 ..062 Sugar confectionery 4 483 0.09 100.00 7 058 0.06 100.00 4.20 ..873 Meters and counters nes 3 579 0.07 100.00 7 058 0.06 100.00 6.64 ..284 Nickel ores, concentrates, etc 2 041 0.04 100.00 7 686 0.06 100.00 11.96 ..666 Pottery 5 799 0.11 100.00 6 556 0.05 100.00 0.85 ..273 Stone, sand and gravel 3 688 0.07 100.00 6 898 0.06 100.00 5.39 ..211 Raw hides & skins, excluding furskins 5 961 0.12 100.00 6 200 0.05 100.00 0.78 ..266 Synthetic fibres for spinning 5 925 0.12 100.00 5 952 0.05 100.00 0.48 ..431 Processed animal & veg fats & oils 4 701 0.09 100.00 6 190 0.05 100.00 4.18 ..811 Prefabricated buildings 2 708 0.05 100.00 6 341 0.05 100.00 6.88 ..325 Coke, semi coke, retort carbon 2 320 0.05 100.00 5 353 0.04 100.00 11.99 ..291 Crude animal materials nes 3 669 0.07 100.00 5 292 0.04 100.00 3.13 ..289 Prec metal ore concentrate excluding gold 1 224 0.02 100.00 6 344 0.05 100.00 9.44 ..268 Wool & animal hair, incl wool tops 7 241 0.14 100.00 5 194 0.04 100.00 -2.97 ..074 Tea and maté 2 504 0.05 100.00 4 774 0.04 100.00 4.35 ..712 Steam vapour turbines & parts nes 2 709 0.05 100.00 4 253 0.04 100.00 3.40 ..023 Butter fats oils derived from milk 4 011 0.08 100.00 4 043 0.03 100.00 0.59 ..579 Plastic waste, parings and scrap 1 250 0.02 100.00 4 377 0.04 100.00 13.53 ..583 Plastic rod stick & profile shapes 1 475 0.03 100.00 4 256 0.04 100.00 9.92 ..711 Steam generating boilers & parts 3 094 0.06 100.00 4 005 0.03 100.00 0.55 ..035 Fish, dried salted smoked 2 769 0.05 100.00 3 965 0.03 100.00 3.09 ..043 Barley grain unmilled 2 788 0.06 100.00 3 469 0.03 100.00 1.36 ..685 Lead 1 446 0.03 100.00 3 874 0.03 100.00 6.10 ..267 Man made fibre for spinning; waste 2 971 0.06 100.00 3 472 0.03 100.00 1.85 ..687 Tin 1 583 0.03 100.00 3 408 0.03 100.00 5.86 ..612 Leather manufactures nes 1 030 0.02 100.00 3 406 0.03 100.00 12.26 ..075 Spices 1 884 0.04 100.00 3 468 0.03 100.00 4.56 ..246 Wood chips, particles and waste 2 099 0.04 100.00 3 270 0.03 100.00 3.69 ..091 Margarine and shortening 1 659 0.03 100.00 2 958 0.02 100.00 4.43 ..016 Meat offal preserved 1 641 0.03 100.00 3 004 0.03 100.00 5.11 ..212 Raw furskins and furskin pieces 1 265 0.02 100.00 3 082 0.03 100.00 6.35 ..411 Animals oils and fats 2 260 0.04 100.00 2 749 0.02 100.00 2.25 ..046 Wheat meal & flour, meslin flour 2 808 0.06 100.00 2 443 0.02 100.00 -2.04 ..677 Iron steel rail railway materials 1 252 0.02 100.00 2 459 0.02 100.00 5.87 ..025 Eggs, yolks and albumin 1 443 0.03 100.00 2 417 0.02 100.00 3.85 ..269 Worn clothing, textile article; rag 1 501 0.03 100.00 2 282 0.02 100.00 2.52 ..593 Explosives and pyrotechnic products 1 154 0.02 100.00 2 260 0.02 100.00 5.28 ..272 Crude fertilizer, excluding manufactured 1 297 0.03 100.00 1 816 0.02 100.00 1.70 ..045 Grain, excluding wheat rice barley maize 1 733 0.03 100.00 1 792 0.02 100.00 -0.35 ..613 Furskin tanned dressed etc 1 324 0.03 100.00 1 796 0.02 100.00 1.16 ..
Growth rates (percentage)
Taux d'accroissement (en pourcentage)
1995-2006
Differencefrom world
Différencepar rapportau monde
Products rankedby average 2005-2006 valuesSITC Revision 3 (3-digit level)
Produits classésd'après la moyenne des valeurs de 2005-2006
CTCI révision 3 (positions à 3 chiffres)
1995 2006
3.2.A Export structure by productWorld
3.2.A Structure des exportations par produitsMonde
Sources:- Data and UNCTAD secretariat estimates based on UN DESA Comtrade and IMF Direction of Trade statistics databases
Sources : - Données et estimations du secrétariat de la CNUCED sur la base de données Comtrade de ONU DAES et Direction of Trade statistics du Fonds Monétaire international
3
147
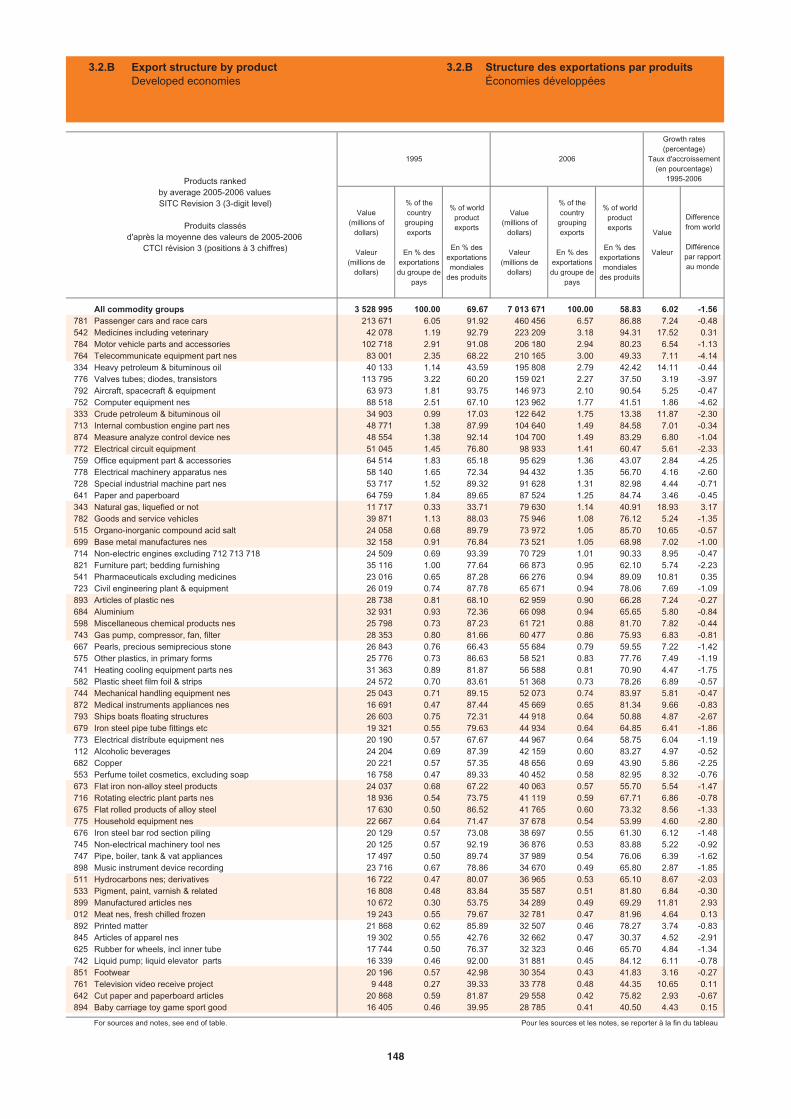
Value(millions of
dollars)
Valeur(millions de
dollars)
% of the country
groupingexports
En % desexportationsdu groupe de
pays
% of worldproductexports
En % des exportationsmondiales
des produits
Value(millions of
dollars)
Valeur(millions de
dollars)
% of the country
groupingexports
En % desexportationsdu groupe de
pays
% of worldproductexports
En % des exportationsmondiales
des produits
Value
Valeur
All commodity groups 3 528 995 100.00 69.67 7 013 671 100.00 58.83 6.02 -1.56781 Passenger cars and race cars 213 671 6.05 91.92 460 456 6.57 86.88 7.24 -0.48542 Medicines including veterinary 42 078 1.19 92.79 223 209 3.18 94.31 17.52 0.31784 Motor vehicle parts and accessories 102 718 2.91 91.08 206 180 2.94 80.23 6.54 -1.13764 Telecommunicate equipment part nes 83 001 2.35 68.22 210 165 3.00 49.33 7.11 -4.14334 Heavy petroleum & bituminous oil 40 133 1.14 43.59 195 808 2.79 42.42 14.11 -0.44776 Valves tubes; diodes, transistors 113 795 3.22 60.20 159 021 2.27 37.50 3.19 -3.97792 Aircraft, spacecraft & equipment 63 973 1.81 93.75 146 973 2.10 90.54 5.25 -0.47752 Computer equipment nes 88 518 2.51 67.10 123 962 1.77 41.51 1.86 -4.62333 Crude petroleum & bituminous oil 34 903 0.99 17.03 122 642 1.75 13.38 11.87 -2.30713 Internal combustion engine part nes 48 771 1.38 87.99 104 640 1.49 84.58 7.01 -0.34874 Measure analyze control device nes 48 554 1.38 92.14 104 700 1.49 83.29 6.80 -1.04772 Electrical circuit equipment 51 045 1.45 76.80 98 933 1.41 60.47 5.61 -2.33759 Office equipment part & accessories 64 514 1.83 65.18 95 629 1.36 43.07 2.84 -4.25778 Electrical machinery apparatus nes 58 140 1.65 72.34 94 432 1.35 56.70 4.16 -2.60728 Special industrial machine part nes 53 717 1.52 89.32 91 628 1.31 82.98 4.44 -0.71641 Paper and paperboard 64 759 1.84 89.65 87 524 1.25 84.74 3.46 -0.45343 Natural gas, liquefied or not 11 717 0.33 33.71 79 630 1.14 40.91 18.93 3.17782 Goods and service vehicles 39 871 1.13 88.03 75 946 1.08 76.12 5.24 -1.35515 Organo-inorganic compound acid salt 24 058 0.68 89.79 73 972 1.05 85.70 10.65 -0.57699 Base metal manufactures nes 32 158 0.91 76.84 73 521 1.05 68.98 7.02 -1.00714 Non-electric engines excluding 712 713 718 24 509 0.69 93.39 70 729 1.01 90.33 8.95 -0.47821 Furniture part; bedding furnishing 35 116 1.00 77.64 66 873 0.95 62.10 5.74 -2.23541 Pharmaceuticals excluding medicines 23 016 0.65 87.28 66 276 0.94 89.09 10.81 0.35723 Civil engineering plant & equipment 26 019 0.74 87.78 65 671 0.94 78.06 7.69 -1.09893 Articles of plastic nes 28 738 0.81 68.10 62 959 0.90 66.28 7.24 -0.27684 Aluminium 32 931 0.93 72.36 66 098 0.94 65.65 5.80 -0.84598 Miscellaneous chemical products nes 25 798 0.73 87.23 61 721 0.88 81.70 7.82 -0.44743 Gas pump, compressor, fan, filter 28 353 0.80 81.66 60 477 0.86 75.93 6.83 -0.81667 Pearls, precious semiprecious stone 26 843 0.76 66.43 55 684 0.79 59.55 7.22 -1.42575 Other plastics, in primary forms 25 776 0.73 86.63 58 521 0.83 77.76 7.49 -1.19741 Heating cooling equipment parts nes 31 363 0.89 81.87 56 588 0.81 70.90 4.47 -1.75582 Plastic sheet film foil & strips 24 572 0.70 83.61 51 368 0.73 78.26 6.89 -0.57744 Mechanical handling equipment nes 25 043 0.71 89.15 52 073 0.74 83.97 5.81 -0.47872 Medical instruments appliances nes 16 691 0.47 87.44 45 669 0.65 81.34 9.66 -0.83793 Ships boats floating structures 26 603 0.75 72.31 44 918 0.64 50.88 4.87 -2.67679 Iron steel pipe tube fittings etc 19 321 0.55 79.63 44 934 0.64 64.85 6.41 -1.86773 Electrical distribute equipment nes 20 190 0.57 67.67 44 967 0.64 58.75 6.04 -1.19112 Alcoholic beverages 24 204 0.69 87.39 42 159 0.60 83.27 4.97 -0.52682 Copper 20 221 0.57 57.35 48 656 0.69 43.90 5.86 -2.25553 Perfume toilet cosmetics, excluding soap 16 758 0.47 89.33 40 452 0.58 82.95 8.32 -0.76673 Flat iron non-alloy steel products 24 037 0.68 67.22 40 063 0.57 55.70 5.54 -1.47716 Rotating electric plant parts nes 18 936 0.54 73.75 41 119 0.59 67.71 6.86 -0.78675 Flat rolled products of alloy steel 17 630 0.50 86.52 41 765 0.60 73.32 8.56 -1.33775 Household equipment nes 22 667 0.64 71.47 37 678 0.54 53.99 4.60 -2.80676 Iron steel bar rod section piling 20 129 0.57 73.08 38 697 0.55 61.30 6.12 -1.48745 Non-electrical machinery tool nes 20 125 0.57 92.19 36 876 0.53 83.88 5.22 -0.92747 Pipe, boiler, tank & vat appliances 17 497 0.50 89.74 37 989 0.54 76.06 6.39 -1.62898 Music instrument device recording 23 716 0.67 78.86 34 670 0.49 65.80 2.87 -1.85511 Hydrocarbons nes; derivatives 16 722 0.47 80.07 36 965 0.53 65.10 8.67 -2.03533 Pigment, paint, varnish & related 16 808 0.48 83.84 35 587 0.51 81.80 6.84 -0.30899 Manufactured articles nes 10 672 0.30 53.75 34 289 0.49 69.29 11.81 2.93012 Meat nes, fresh chilled frozen 19 243 0.55 79.67 32 781 0.47 81.96 4.64 0.13892 Printed matter 21 868 0.62 85.89 32 507 0.46 78.27 3.74 -0.83845 Articles of apparel nes 19 302 0.55 42.76 32 662 0.47 30.37 4.52 -2.91625 Rubber for wheels, incl inner tube 17 744 0.50 76.37 32 323 0.46 65.70 4.84 -1.34742 Liquid pump; liquid elevator parts 16 339 0.46 92.00 31 881 0.45 84.12 6.11 -0.78851 Footwear 20 196 0.57 42.98 30 354 0.43 41.83 3.16 -0.27761 Television video receive project 9 448 0.27 39.33 33 778 0.48 44.35 10.65 0.11642 Cut paper and paperboard articles 20 868 0.59 81.87 29 558 0.42 75.82 2.93 -0.67894 Baby carriage toy game sport good 16 405 0.46 39.95 28 785 0.41 40.50 4.43 0.15
For sources and notes, see end of table. Pour les sources et les notes, se reporter à la fin du tableau
Growth rates (percentage)
Taux d'accroissement (en pourcentage)
1995-2006Products rankedby average 2005-2006 valuesSITC Revision 3 (3-digit level)
Produits classésd'après la moyenne des valeurs de 2005-2006
CTCI révision 3 (positions à 3 chiffres)
1995 2006
Differencefrom world
Différencepar rapportau monde
3.2.B Export structure by productDeveloped economies
3.2.B Structure des exportations par produitsÉconomies développées
148
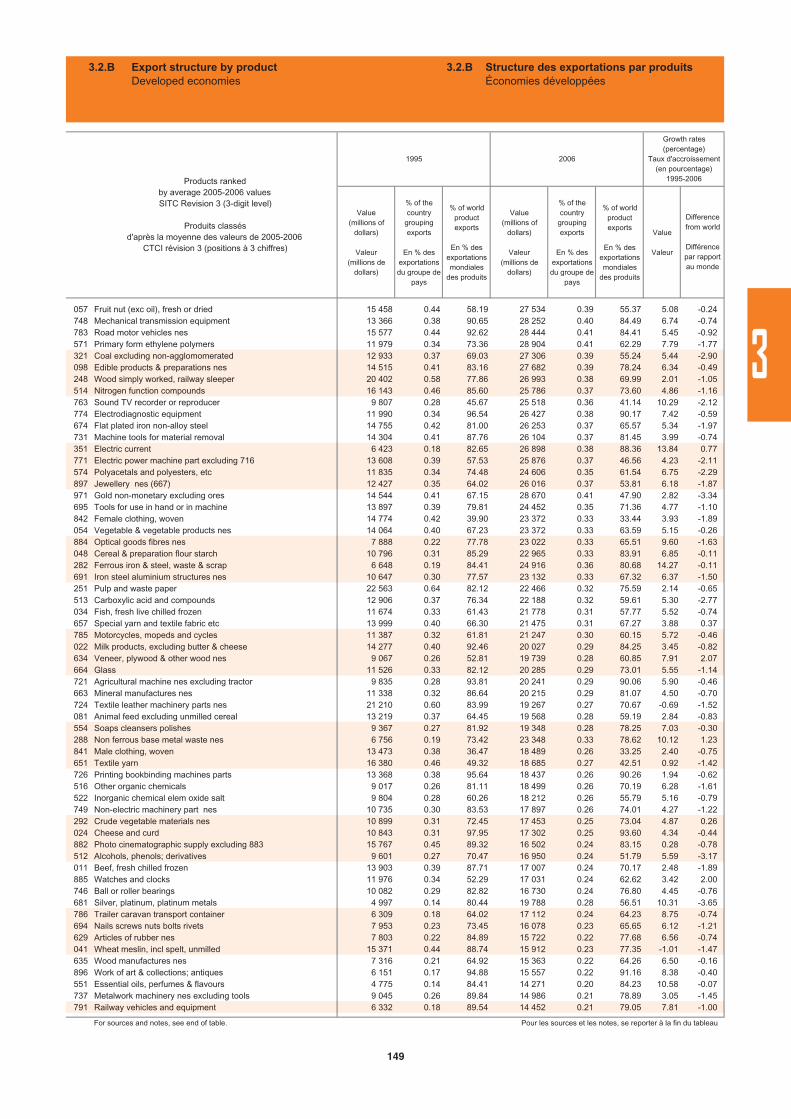
Value(millions of
dollars)
Valeur(millions de
dollars)
% of the country
groupingexports
En % desexportationsdu groupe de
pays
% of worldproductexports
En % des exportationsmondiales
des produits
Value(millions of
dollars)
Valeur(millions de
dollars)
% of the country
groupingexports
En % desexportationsdu groupe de
pays
% of worldproductexports
En % des exportationsmondiales
des produits
Value
Valeur
057 Fruit nut (exc oil), fresh or dried 15 458 0.44 58.19 27 534 0.39 55.37 5.08 -0.24748 Mechanical transmission equipment 13 366 0.38 90.65 28 252 0.40 84.49 6.74 -0.74783 Road motor vehicles nes 15 577 0.44 92.62 28 444 0.41 84.41 5.45 -0.92571 Primary form ethylene polymers 11 979 0.34 73.36 28 904 0.41 62.29 7.79 -1.77321 Coal excluding non-agglomomerated 12 933 0.37 69.03 27 306 0.39 55.24 5.44 -2.90098 Edible products & preparations nes 14 515 0.41 83.16 27 682 0.39 78.24 6.34 -0.49248 Wood simply worked, railway sleeper 20 402 0.58 77.86 26 993 0.38 69.99 2.01 -1.05514 Nitrogen function compounds 16 143 0.46 85.60 25 786 0.37 73.60 4.86 -1.16763 Sound TV recorder or reproducer 9 807 0.28 45.67 25 518 0.36 41.14 10.29 -2.12774 Electrodiagnostic equipment 11 990 0.34 96.54 26 427 0.38 90.17 7.42 -0.59674 Flat plated iron non-alloy steel 14 755 0.42 81.00 26 253 0.37 65.57 5.34 -1.97731 Machine tools for material removal 14 304 0.41 87.76 26 104 0.37 81.45 3.99 -0.74351 Electric current 6 423 0.18 82.65 26 898 0.38 88.36 13.84 0.77771 Electric power machine part excluding 716 13 608 0.39 57.53 25 876 0.37 46.56 4.23 -2.11574 Polyacetals and polyesters, etc 11 835 0.34 74.48 24 606 0.35 61.54 6.75 -2.29897 Jewellery nes (667) 12 427 0.35 64.02 26 016 0.37 53.81 6.18 -1.87971 Gold non-monetary excluding ores 14 544 0.41 67.15 28 670 0.41 47.90 2.82 -3.34695 Tools for use in hand or in machine 13 897 0.39 79.81 24 452 0.35 71.36 4.77 -1.10842 Female clothing, woven 14 774 0.42 39.90 23 372 0.33 33.44 3.93 -1.89054 Vegetable & vegetable products nes 14 064 0.40 67.23 23 372 0.33 63.59 5.15 -0.26884 Optical goods fibres nes 7 888 0.22 77.78 23 022 0.33 65.51 9.60 -1.63048 Cereal & preparation flour starch 10 796 0.31 85.29 22 965 0.33 83.91 6.85 -0.11282 Ferrous iron & steel, waste & scrap 6 648 0.19 84.41 24 916 0.36 80.68 14.27 -0.11691 Iron steel aluminium structures nes 10 647 0.30 77.57 23 132 0.33 67.32 6.37 -1.50251 Pulp and waste paper 22 563 0.64 82.12 22 466 0.32 75.59 2.14 -0.65513 Carboxylic acid and compounds 12 906 0.37 76.34 22 188 0.32 59.61 5.30 -2.77034 Fish, fresh live chilled frozen 11 674 0.33 61.43 21 778 0.31 57.77 5.52 -0.74657 Special yarn and textile fabric etc 13 999 0.40 66.30 21 475 0.31 67.27 3.88 0.37785 Motorcycles, mopeds and cycles 11 387 0.32 61.81 21 247 0.30 60.15 5.72 -0.46022 Milk products, excluding butter & cheese 14 277 0.40 92.46 20 027 0.29 84.25 3.45 -0.82634 Veneer, plywood & other wood nes 9 067 0.26 52.81 19 739 0.28 60.85 7.91 2.07664 Glass 11 526 0.33 82.12 20 285 0.29 73.01 5.55 -1.14721 Agricultural machine nes excluding tractor 9 835 0.28 93.81 20 241 0.29 90.06 5.90 -0.46663 Mineral manufactures nes 11 338 0.32 86.64 20 215 0.29 81.07 4.50 -0.70724 Textile leather machinery parts nes 21 210 0.60 83.99 19 267 0.27 70.67 -0.69 -1.52081 Animal feed excluding unmilled cereal 13 219 0.37 64.45 19 568 0.28 59.19 2.84 -0.83554 Soaps cleansers polishes 9 367 0.27 81.92 19 348 0.28 78.25 7.03 -0.30288 Non ferrous base metal waste nes 6 756 0.19 73.42 23 348 0.33 78.62 10.12 1.23841 Male clothing, woven 13 473 0.38 36.47 18 489 0.26 33.25 2.40 -0.75651 Textile yarn 16 380 0.46 49.32 18 685 0.27 42.51 0.92 -1.42726 Printing bookbinding machines parts 13 368 0.38 95.64 18 437 0.26 90.26 1.94 -0.62516 Other organic chemicals 9 017 0.26 81.11 18 499 0.26 70.19 6.28 -1.61522 Inorganic chemical elem oxide salt 9 804 0.28 60.26 18 212 0.26 55.79 5.16 -0.79749 Non-electric machinery part nes 10 735 0.30 83.53 17 897 0.26 74.01 4.27 -1.22292 Crude vegetable materials nes 10 899 0.31 72.45 17 453 0.25 73.04 4.87 0.26024 Cheese and curd 10 843 0.31 97.95 17 302 0.25 93.60 4.34 -0.44882 Photo cinematographic supply excluding 883 15 767 0.45 89.32 16 502 0.24 83.15 0.28 -0.78512 Alcohols, phenols; derivatives 9 601 0.27 70.47 16 950 0.24 51.79 5.59 -3.17011 Beef, fresh chilled frozen 13 903 0.39 87.71 17 007 0.24 70.17 2.48 -1.89885 Watches and clocks 11 976 0.34 52.29 17 031 0.24 62.62 3.42 2.00746 Ball or roller bearings 10 082 0.29 82.82 16 730 0.24 76.80 4.45 -0.76681 Silver, platinum, platinum metals 4 997 0.14 80.44 19 788 0.28 56.51 10.31 -3.65786 Trailer caravan transport container 6 309 0.18 64.02 17 112 0.24 64.23 8.75 -0.74694 Nails screws nuts bolts rivets 7 953 0.23 73.45 16 078 0.23 65.65 6.12 -1.21629 Articles of rubber nes 7 803 0.22 84.89 15 722 0.22 77.68 6.56 -0.74041 Wheat meslin, incl spelt, unmilled 15 371 0.44 88.74 15 912 0.23 77.35 -1.01 -1.47635 Wood manufactures nes 7 316 0.21 64.92 15 363 0.22 64.26 6.50 -0.16896 Work of art & collections; antiques 6 151 0.17 94.88 15 557 0.22 91.16 8.38 -0.40551 Essential oils, perfumes & flavours 4 775 0.14 84.41 14 271 0.20 84.23 10.58 -0.07737 Metalwork machinery nes excluding tools 9 045 0.26 89.84 14 986 0.21 78.89 3.05 -1.45791 Railway vehicles and equipment 6 332 0.18 89.54 14 452 0.21 79.05 7.81 -1.00
For sources and notes, see end of table. Pour les sources et les notes, se reporter à la fin du tableau
Products rankedby average 2005-2006 valuesSITC Revision 3 (3-digit level)
Produits classésd'après la moyenne des valeurs de 2005-2006
CTCI révision 3 (positions à 3 chiffres)
1995 2006
Growth rates (percentage)
Taux d'accroissement (en pourcentage)
1995-2006
Differencefrom world
Différencepar rapportau monde
3.2.B Export structure by productDeveloped economies
3.2.B Structure des exportations par produitsÉconomies développées
3
149
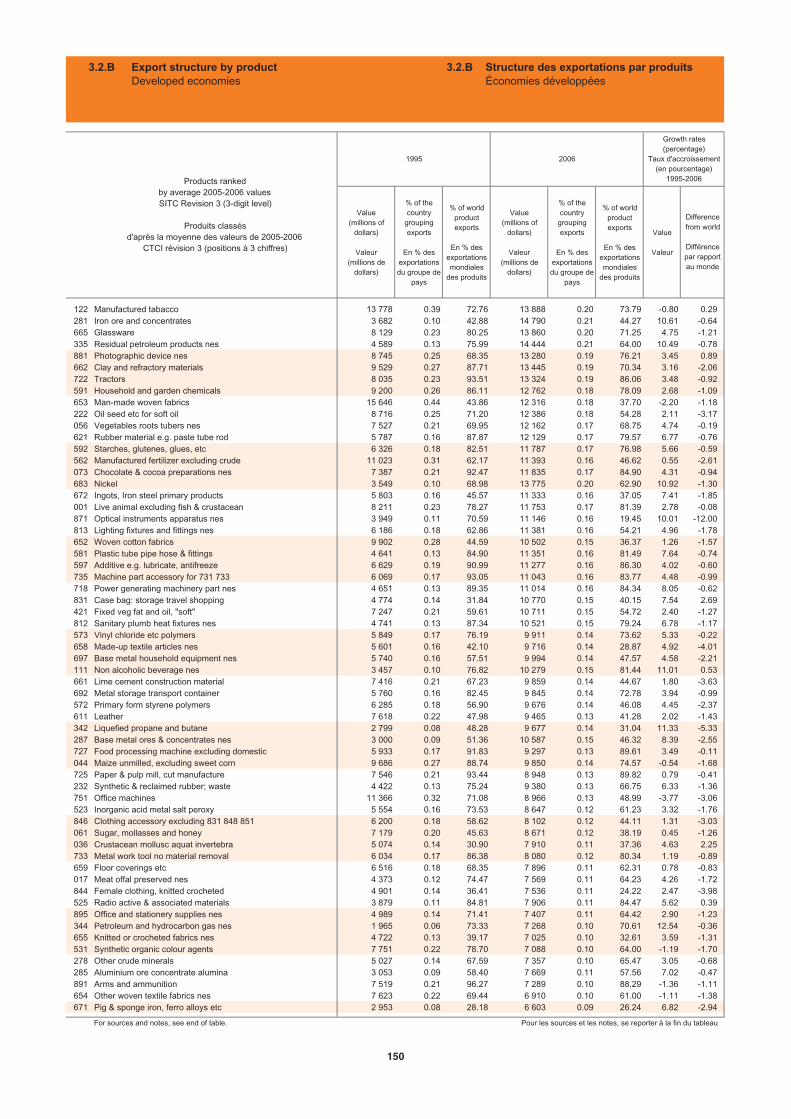
Value(millions of
dollars)
Valeur(millions de
dollars)
% of the country
groupingexports
En % desexportationsdu groupe de
pays
% of worldproductexports
En % des exportationsmondiales
des produits
Value(millions of
dollars)
Valeur(millions de
dollars)
% of the country
groupingexports
En % desexportationsdu groupe de
pays
% of worldproductexports
En % des exportationsmondiales
des produits
Value
Valeur
122 Manufactured tabacco 13 778 0.39 72.76 13 888 0.20 73.79 -0.80 0.29281 Iron ore and concentrates 3 682 0.10 42.88 14 790 0.21 44.27 10.61 -0.64665 Glassware 8 129 0.23 80.25 13 860 0.20 71.25 4.75 -1.21335 Residual petroleum products nes 4 589 0.13 75.99 14 444 0.21 64.00 10.49 -0.78881 Photographic device nes 8 745 0.25 68.35 13 280 0.19 76.21 3.45 0.89662 Clay and refractory materials 9 529 0.27 87.71 13 445 0.19 70.34 3.16 -2.06722 Tractors 8 035 0.23 93.51 13 324 0.19 86.06 3.48 -0.92591 Household and garden chemicals 9 200 0.26 86.11 12 762 0.18 78.09 2.68 -1.09653 Man-made woven fabrics 15 646 0.44 43.86 12 316 0.18 37.70 -2.20 -1.18222 Oil seed etc for soft oil 8 716 0.25 71.20 12 386 0.18 54.28 2.11 -3.17056 Vegetables roots tubers nes 7 527 0.21 69.95 12 162 0.17 68.75 4.74 -0.19621 Rubber material e.g. paste tube rod 5 787 0.16 87.87 12 129 0.17 79.57 6.77 -0.76592 Starches, glutenes, glues, etc 6 326 0.18 82.51 11 787 0.17 76.98 5.66 -0.59562 Manufactured fertilizer excluding crude 11 023 0.31 62.17 11 393 0.16 46.62 0.55 -2.61073 Chocolate & cocoa preparations nes 7 387 0.21 92.47 11 835 0.17 84.90 4.31 -0.94683 Nickel 3 549 0.10 68.98 13 775 0.20 62.90 10.92 -1.30672 Ingots, Iron steel primary products 5 803 0.16 45.57 11 333 0.16 37.05 7.41 -1.85001 Live animal excluding fish & crustacean 8 211 0.23 78.27 11 753 0.17 81.39 2.78 -0.08871 Optical instruments apparatus nes 3 949 0.11 70.59 11 146 0.16 19.45 10.01 -12.00813 Lighting fixtures and fittings nes 6 186 0.18 62.86 11 381 0.16 54.21 4.96 -1.78652 Woven cotton fabrics 9 902 0.28 44.59 10 502 0.15 36.37 1.26 -1.57581 Plastic tube pipe hose & fittings 4 641 0.13 84.90 11 351 0.16 81.49 7.64 -0.74597 Additive e.g. lubricate, antifreeze 6 629 0.19 90.99 11 277 0.16 86.30 4.02 -0.60735 Machine part accessory for 731 733 6 069 0.17 93.05 11 043 0.16 83.77 4.48 -0.99718 Power generating machinery part nes 4 651 0.13 89.35 11 014 0.16 84.34 8.05 -0.62831 Case bag: storage travel shopping 4 774 0.14 31.84 10 770 0.15 40.15 7.54 2.69421 Fixed veg fat and oil, "soft" 7 247 0.21 59.61 10 711 0.15 54.72 2.40 -1.27812 Sanitary plumb heat fixtures nes 4 741 0.13 87.34 10 521 0.15 79.24 6.78 -1.17573 Vinyl chloride etc polymers 5 849 0.17 76.19 9 911 0.14 73.62 5.33 -0.22658 Made-up textile articles nes 5 601 0.16 42.10 9 716 0.14 28.87 4.92 -4.01697 Base metal household equipment nes 5 740 0.16 57.51 9 994 0.14 47.57 4.58 -2.21111 Non alcoholic beverage nes 3 457 0.10 76.82 10 279 0.15 81.44 11.01 0.53661 Lime cement construction material 7 416 0.21 67.23 9 859 0.14 44.67 1.80 -3.63692 Metal storage transport container 5 760 0.16 82.45 9 845 0.14 72.78 3.94 -0.99572 Primary form styrene polymers 6 285 0.18 56.90 9 676 0.14 46.08 4.45 -2.37611 Leather 7 618 0.22 47.98 9 465 0.13 41.28 2.02 -1.43342 Liquefied propane and butane 2 799 0.08 48.28 9 677 0.14 31.04 11.33 -5.33287 Base metal ores & concentrates nes 3 000 0.09 51.36 10 587 0.15 46.32 8.39 -2.55727 Food processing machine excluding domestic 5 933 0.17 91.83 9 297 0.13 89.61 3.49 -0.11044 Maize unmilled, excluding sweet corn 9 686 0.27 88.74 9 850 0.14 74.57 -0.54 -1.68725 Paper & pulp mill, cut manufacture 7 546 0.21 93.44 8 948 0.13 89.82 0.79 -0.41232 Synthetic & reclaimed rubber; waste 4 422 0.13 75.24 9 380 0.13 66.75 6.33 -1.36751 Office machines 11 366 0.32 71.08 8 966 0.13 48.99 -3.77 -3.06523 Inorganic acid metal salt peroxy 5 554 0.16 73.53 8 647 0.12 61.23 3.32 -1.76846 Clothing accessory excluding 831 848 851 6 200 0.18 58.62 8 102 0.12 44.11 1.31 -3.03061 Sugar, mollasses and honey 7 179 0.20 45.63 8 671 0.12 38.19 0.45 -1.26036 Crustacean mollusc aquat invertebra 5 074 0.14 30.90 7 910 0.11 37.36 4.63 2.25733 Metal work tool no material removal 6 034 0.17 86.38 8 080 0.12 80.34 1.19 -0.89659 Floor coverings etc 6 516 0.18 68.35 7 896 0.11 62.31 0.78 -0.83017 Meat offal preserved nes 4 373 0.12 74.47 7 569 0.11 64.23 4.26 -1.72844 Female clothing, knitted crocheted 4 901 0.14 36.41 7 536 0.11 24.22 2.47 -3.98525 Radio active & associated materials 3 879 0.11 84.81 7 906 0.11 84.47 5.62 0.39895 Office and stationery supplies nes 4 989 0.14 71.41 7 407 0.11 64.42 2.90 -1.23344 Petroleum and hydrocarbon gas nes 1 965 0.06 73.33 7 268 0.10 70.61 12.54 -0.36655 Knitted or crocheted fabrics nes 4 722 0.13 39.17 7 025 0.10 32.61 3.59 -1.31531 Synthetic organic colour agents 7 751 0.22 78.70 7 088 0.10 64.00 -1.19 -1.70278 Other crude minerals 5 027 0.14 67.59 7 357 0.10 65.47 3.05 -0.68285 Aluminium ore concentrate alumina 3 053 0.09 58.40 7 669 0.11 57.56 7.02 -0.47891 Arms and ammunition 7 519 0.21 96.27 7 289 0.10 88.29 -1.36 -1.11654 Other woven textile fabrics nes 7 623 0.22 69.44 6 910 0.10 61.00 -1.11 -1.38671 Pig & sponge iron, ferro alloys etc 2 953 0.08 28.18 6 603 0.09 26.24 6.82 -2.94
For sources and notes, see end of table. Pour les sources et les notes, se reporter à la fin du tableau
Products rankedby average 2005-2006 valuesSITC Revision 3 (3-digit level)
Produits classésd'après la moyenne des valeurs de 2005-2006
CTCI révision 3 (positions à 3 chiffres)
1995 2006
Growth rates (percentage)
Taux d'accroissement (en pourcentage)
1995-2006
Differencefrom world
Différencepar rapportau monde
3.2.B Export structure by productDeveloped economies
3.2.B Structure des exportations par produitsÉconomies développées
150

Value(millions of
dollars)
Valeur(millions de
dollars)
% of the country
groupingexports
En % desexportationsdu groupe de
pays
% of worldproductexports
En % des exportationsmondiales
des produits
Value(millions of
dollars)
Valeur(millions de
dollars)
% of the country
groupingexports
En % desexportationsdu groupe de
pays
% of worldproductexports
En % des exportationsmondiales
des produits
Value
Valeur
686 Zinc 2 706 0.08 65.58 8 924 0.13 56.55 5.78 -0.95762 Radio broadcast receivers 6 553 0.19 29.15 6 440 0.09 34.20 0.44 1.70848 Headgear, non-textile clothing 3 715 0.11 29.20 6 792 0.10 32.88 4.95 -0.25693 Wire products and fencing grills 3 528 0.10 73.36 6 737 0.10 64.74 5.56 -1.25071 Coffee and coffee substitutes 3 392 0.10 21.81 6 522 0.09 35.44 4.64 5.84059 Fruit & vegetable juice unferment 3 538 0.10 60.08 6 439 0.09 58.98 4.72 0.25263 Cotton 5 142 0.15 46.50 6 157 0.09 52.19 2.49 2.44058 Fruit preserve preparation excluding juice 3 740 0.11 61.72 6 027 0.09 53.93 4.02 -1.34037 Fish shellfish, prepared preserved 3 853 0.11 43.91 5 757 0.08 33.64 3.54 -1.97283 Copper ores and concentrates 1 853 0.05 27.04 6 636 0.09 20.70 9.05 -3.98873 Meters and counters nes 3 231 0.09 90.27 5 258 0.07 74.50 5.06 -1.58247 Wood in rough or roughly squared 5 167 0.15 55.94 5 113 0.07 44.73 0.46 -1.84678 Wire of iron or steel 3 180 0.09 74.29 5 117 0.07 62.07 4.55 -1.73211 Raw hides & skins, excluding furskins 4 808 0.14 80.65 5 020 0.07 80.97 0.82 0.04811 Prefabricated buildings 2 521 0.07 93.09 4 903 0.07 77.32 5.51 -1.37524 Other inorganic chemicals 2 277 0.06 72.83 5 363 0.08 65.88 6.52 -1.32689 Misc non-ferrous base metals 1 952 0.06 59.53 4 693 0.07 55.54 6.59 -0.77062 Sugar confectionery 3 069 0.09 68.46 4 285 0.06 60.72 3.40 -0.80273 Stone, sand and gravel 2 666 0.08 72.29 4 251 0.06 61.63 3.93 -1.46696 Cutlery 2 381 0.07 57.11 4 084 0.06 51.84 5.20 -0.86023 Butter fats oils derived from milk 3 806 0.11 94.88 3 757 0.05 92.92 0.44 -0.15712 Steam vapour turbines & parts nes 2 521 0.07 93.06 3 581 0.05 84.22 2.42 -0.98583 Plastic rod stick & profile shapes 1 409 0.04 95.58 3 791 0.05 89.06 9.30 -0.62656 Tulle lace embroidery trim etc 2 607 0.07 57.43 3 551 0.05 40.21 3.24 -2.76284 Nickel ores, concentrates, etc 1 139 0.03 55.81 3 995 0.06 51.98 12.02 0.06289 Prec metal ore concentrate excluding gold 866 0.02 70.73 4 324 0.06 68.16 13.99 4.55268 Wool & animal hair, incl wool tops 5 334 0.15 73.66 3 459 0.05 66.61 -3.57 -0.59291 Crude animal materials nes 2 090 0.06 56.97 3 250 0.05 61.41 3.71 0.57843 Male clothing, knitted crocheted 2 356 0.07 29.48 3 271 0.05 18.69 0.81 -4.65072 Cocoa 1 673 0.05 32.20 3 051 0.04 33.07 6.38 0.69666 Pottery 3 387 0.10 58.41 2 858 0.04 43.60 -1.53 -2.38035 Fish, dried salted smoked 2 085 0.06 75.29 2 975 0.04 75.03 2.79 -0.30325 Coke, semi coke, retort carbon 1 445 0.04 62.26 2 783 0.04 51.99 8.15 -3.83043 Barley grain unmilled 2 472 0.07 88.66 2 627 0.04 75.73 -0.38 -1.73711 Steam generating boilers & parts 2 726 0.08 88.10 2 627 0.04 65.58 -1.87 -2.42016 Meat offal preserved 1 598 0.05 97.41 2 930 0.04 97.53 5.14 0.03121 Unmanufactured tabacco and refuse 2 481 0.07 47.44 2 716 0.04 36.64 0.01 -1.04431 Processed animal & veg fats & oils 2 266 0.06 48.19 2 737 0.04 44.22 3.85 -0.33267 Man made fibre for spinning; waste 2 555 0.07 85.98 2 647 0.04 76.24 1.23 -0.62042 Rice 2 242 0.06 30.03 2 514 0.04 23.58 -0.19 -2.19266 Synthetic fibres for spinning 2 787 0.08 47.04 2 420 0.03 40.66 -1.23 -1.71579 Plastic waste, parings and scrap 621 0.02 49.73 2 588 0.04 59.14 15.67 2.14411 Animals oils and fats 2 019 0.06 89.35 2 308 0.03 83.93 1.71 -0.53212 Raw furskins and furskin pieces 1 040 0.03 82.19 2 398 0.03 77.81 5.06 -1.29246 Wood chips, particles and waste 1 449 0.04 69.06 2 190 0.03 66.98 2.84 -0.85677 Iron steel rail railway materials 1 017 0.03 81.21 2 017 0.03 82.01 6.43 0.56685 Lead 973 0.03 67.32 2 164 0.03 55.87 4.39 -1.70422 Fixed veg fat and oil, excluding "soft" 782 0.02 10.09 2 092 0.03 13.47 8.36 2.42091 Margarine and shortening 1 221 0.03 73.60 2 035 0.03 68.79 3.65 -0.78025 Eggs, yolks and albumin 1 208 0.03 83.71 1 989 0.03 82.29 3.85 0.00269 Worn clothing, textile article; rag 1 188 0.03 79.16 1 743 0.02 76.37 2.32 -0.20612 Leather manufactures nes 508 0.01 49.35 1 635 0.02 48.00 11.95 -0.30045 Grain, excluding wheat rice barley maize 1 537 0.04 88.69 1 590 0.02 88.75 -0.61 -0.26633 Cork manufactures 953 0.03 97.11 1 441 0.02 93.02 4.07 -0.46046 Wheat meal & flour, meslin flour 1 964 0.06 69.94 1 307 0.02 53.47 -3.97 -1.93593 Explosives and pyrotechnic products 669 0.02 57.95 1 344 0.02 59.50 5.61 0.34074 Tea and maté 577 0.02 23.03 1 217 0.02 25.50 6.32 1.97223 Oil seed for non soft oil 415 0.01 57.67 991 0.01 68.88 7.77 1.67322 Briquettes, lignite and peat 831 0.02 92.32 1 008 0.01 91.85 1.49 -0.17532 Dyeing and tanning extracts 546 0.02 64.03 876 0.01 61.16 3.89 -0.52613 Furskin tanned dressed etc 965 0.03 72.89 913 0.01 50.83 -2.98 -4.15
Growth rates (percentage)
Taux d'accroissement (en pourcentage)
1995-2006
Differencefrom world
Différencepar rapportau monde
Products rankedby average 2005-2006 valuesSITC Revision 3 (3-digit level)
Produits classésd'après la moyenne des valeurs de 2005-2006
CTCI révision 3 (positions à 3 chiffres)
1995 2006
3.2.B Export structure by productDeveloped economies
3.2.B Structure des exportations par produitsÉconomies développées
Sources:- Data and UNCTAD secretariat estimates based on UN DESA Comtrade and IMF Direction of Trade statistics databases
Sources : - Données et estimations du secrétariat de la CNUCED sur la base de données Comtrade de ONU DAES et Direction of Trade statistics du Fonds Monétaire international
3
151
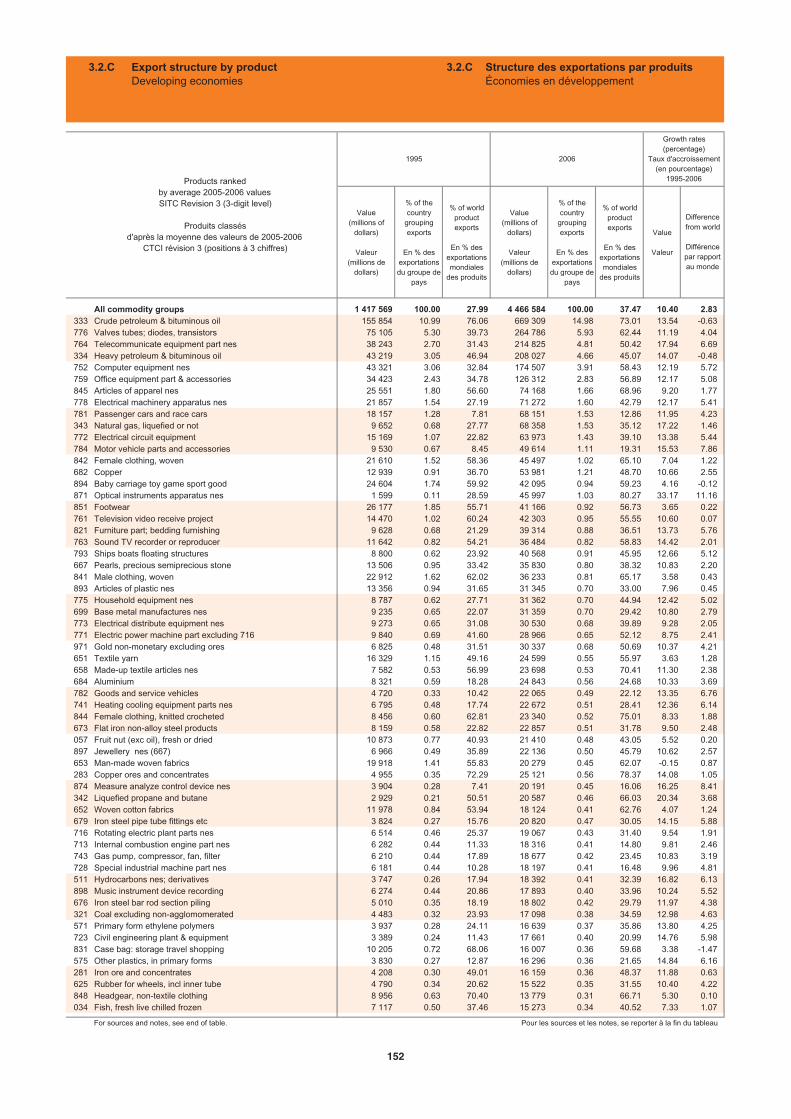
Value(millions of
dollars)
Valeur(millions de
dollars)
% of the country
groupingexports
En % desexportationsdu groupe de
pays
% of worldproductexports
En % des exportationsmondiales
des produits
Value(millions of
dollars)
Valeur(millions de
dollars)
% of the country
groupingexports
En % desexportationsdu groupe de
pays
% of worldproductexports
En % des exportationsmondiales
des produits
Value
Valeur
All commodity groups 1 417 569 100.00 27.99 4 466 584 100.00 37.47 10.40 2.83333 Crude petroleum & bituminous oil 155 854 10.99 76.06 669 309 14.98 73.01 13.54 -0.63776 Valves tubes; diodes, transistors 75 105 5.30 39.73 264 786 5.93 62.44 11.19 4.04764 Telecommunicate equipment part nes 38 243 2.70 31.43 214 825 4.81 50.42 17.94 6.69334 Heavy petroleum & bituminous oil 43 219 3.05 46.94 208 027 4.66 45.07 14.07 -0.48752 Computer equipment nes 43 321 3.06 32.84 174 507 3.91 58.43 12.19 5.72759 Office equipment part & accessories 34 423 2.43 34.78 126 312 2.83 56.89 12.17 5.08845 Articles of apparel nes 25 551 1.80 56.60 74 168 1.66 68.96 9.20 1.77778 Electrical machinery apparatus nes 21 857 1.54 27.19 71 272 1.60 42.79 12.17 5.41781 Passenger cars and race cars 18 157 1.28 7.81 68 151 1.53 12.86 11.95 4.23343 Natural gas, liquefied or not 9 652 0.68 27.77 68 358 1.53 35.12 17.22 1.46772 Electrical circuit equipment 15 169 1.07 22.82 63 973 1.43 39.10 13.38 5.44784 Motor vehicle parts and accessories 9 530 0.67 8.45 49 614 1.11 19.31 15.53 7.86842 Female clothing, woven 21 610 1.52 58.36 45 497 1.02 65.10 7.04 1.22682 Copper 12 939 0.91 36.70 53 981 1.21 48.70 10.66 2.55894 Baby carriage toy game sport good 24 604 1.74 59.92 42 095 0.94 59.23 4.16 -0.12871 Optical instruments apparatus nes 1 599 0.11 28.59 45 997 1.03 80.27 33.17 11.16851 Footwear 26 177 1.85 55.71 41 166 0.92 56.73 3.65 0.22761 Television video receive project 14 470 1.02 60.24 42 303 0.95 55.55 10.60 0.07821 Furniture part; bedding furnishing 9 628 0.68 21.29 39 314 0.88 36.51 13.73 5.76763 Sound TV recorder or reproducer 11 642 0.82 54.21 36 484 0.82 58.83 14.42 2.01793 Ships boats floating structures 8 800 0.62 23.92 40 568 0.91 45.95 12.66 5.12667 Pearls, precious semiprecious stone 13 506 0.95 33.42 35 830 0.80 38.32 10.83 2.20841 Male clothing, woven 22 912 1.62 62.02 36 233 0.81 65.17 3.58 0.43893 Articles of plastic nes 13 356 0.94 31.65 31 345 0.70 33.00 7.96 0.45775 Household equipment nes 8 787 0.62 27.71 31 362 0.70 44.94 12.42 5.02699 Base metal manufactures nes 9 235 0.65 22.07 31 359 0.70 29.42 10.80 2.79773 Electrical distribute equipment nes 9 273 0.65 31.08 30 530 0.68 39.89 9.28 2.05771 Electric power machine part excluding 716 9 840 0.69 41.60 28 966 0.65 52.12 8.75 2.41971 Gold non-monetary excluding ores 6 825 0.48 31.51 30 337 0.68 50.69 10.37 4.21651 Textile yarn 16 329 1.15 49.16 24 599 0.55 55.97 3.63 1.28658 Made-up textile articles nes 7 582 0.53 56.99 23 698 0.53 70.41 11.30 2.38684 Aluminium 8 321 0.59 18.28 24 843 0.56 24.68 10.33 3.69782 Goods and service vehicles 4 720 0.33 10.42 22 065 0.49 22.12 13.35 6.76741 Heating cooling equipment parts nes 6 795 0.48 17.74 22 672 0.51 28.41 12.36 6.14844 Female clothing, knitted crocheted 8 456 0.60 62.81 23 340 0.52 75.01 8.33 1.88673 Flat iron non-alloy steel products 8 159 0.58 22.82 22 857 0.51 31.78 9.50 2.48057 Fruit nut (exc oil), fresh or dried 10 873 0.77 40.93 21 410 0.48 43.05 5.52 0.20897 Jewellery nes (667) 6 966 0.49 35.89 22 136 0.50 45.79 10.62 2.57653 Man-made woven fabrics 19 918 1.41 55.83 20 279 0.45 62.07 -0.15 0.87283 Copper ores and concentrates 4 955 0.35 72.29 25 121 0.56 78.37 14.08 1.05874 Measure analyze control device nes 3 904 0.28 7.41 20 191 0.45 16.06 16.25 8.41342 Liquefied propane and butane 2 929 0.21 50.51 20 587 0.46 66.03 20.34 3.68652 Woven cotton fabrics 11 978 0.84 53.94 18 124 0.41 62.76 4.07 1.24679 Iron steel pipe tube fittings etc 3 824 0.27 15.76 20 820 0.47 30.05 14.15 5.88716 Rotating electric plant parts nes 6 514 0.46 25.37 19 067 0.43 31.40 9.54 1.91713 Internal combustion engine part nes 6 282 0.44 11.33 18 316 0.41 14.80 9.81 2.46743 Gas pump, compressor, fan, filter 6 210 0.44 17.89 18 677 0.42 23.45 10.83 3.19728 Special industrial machine part nes 6 181 0.44 10.28 18 197 0.41 16.48 9.96 4.81511 Hydrocarbons nes; derivatives 3 747 0.26 17.94 18 392 0.41 32.39 16.82 6.13898 Music instrument device recording 6 274 0.44 20.86 17 893 0.40 33.96 10.24 5.52676 Iron steel bar rod section piling 5 010 0.35 18.19 18 802 0.42 29.79 11.97 4.38321 Coal excluding non-agglomomerated 4 483 0.32 23.93 17 098 0.38 34.59 12.98 4.63571 Primary form ethylene polymers 3 937 0.28 24.11 16 639 0.37 35.86 13.80 4.25723 Civil engineering plant & equipment 3 389 0.24 11.43 17 661 0.40 20.99 14.76 5.98831 Case bag: storage travel shopping 10 205 0.72 68.06 16 007 0.36 59.68 3.38 -1.47575 Other plastics, in primary forms 3 830 0.27 12.87 16 296 0.36 21.65 14.84 6.16281 Iron ore and concentrates 4 208 0.30 49.01 16 159 0.36 48.37 11.88 0.63625 Rubber for wheels, incl inner tube 4 790 0.34 20.62 15 522 0.35 31.55 10.40 4.22848 Headgear, non-textile clothing 8 956 0.63 70.40 13 779 0.31 66.71 5.30 0.10034 Fish, fresh live chilled frozen 7 117 0.50 37.46 15 273 0.34 40.52 7.33 1.07
For sources and notes, see end of table. Pour les sources et les notes, se reporter à la fin du tableau
Growth rates (percentage)
Taux d'accroissement (en pourcentage)
1995-2006Products rankedby average 2005-2006 valuesSITC Revision 3 (3-digit level)
Produits classésd'après la moyenne des valeurs de 2005-2006
CTCI révision 3 (positions à 3 chiffres)
1995 2006
Differencefrom world
Différencepar rapportau monde
3.2.C Export structure by productDeveloping economies
3.2.C Structure des exportations par produitsÉconomies en développement
152

Value(millions of
dollars)
Valeur(millions de
dollars)
% of the country
groupingexports
En % desexportationsdu groupe de
pays
% of worldproductexports
En % des exportationsmondiales
des produits
Value(millions of
dollars)
Valeur(millions de
dollars)
% of the country
groupingexports
En % desexportationsdu groupe de
pays
% of worldproductexports
En % des exportationsmondiales
des produits
Value
Valeur
574 Polyacetals and polyesters, etc 4 002 0.28 25.19 15 204 0.34 38.02 14.72 5.67899 Manufactured articles nes 9 110 0.64 45.88 15 094 0.34 30.50 4.22 -4.66655 Knitted or crocheted fabrics nes 7 292 0.51 60.49 14 474 0.32 67.18 5.68 0.78512 Alcohols, phenols; derivatives 3 380 0.24 24.81 14 806 0.33 45.23 15.29 6.53513 Carboxylic acid and compounds 3 858 0.27 22.82 14 478 0.32 38.90 14.91 6.84785 Motorcycles, mopeds and cycles 6 991 0.49 37.95 14 036 0.31 39.74 7.01 0.83671 Pig & sponge iron, ferro alloys etc 5 866 0.41 55.96 13 209 0.30 52.49 10.24 0.48582 Plastic sheet film foil & strips 4 724 0.33 16.07 13 929 0.31 21.22 9.89 2.44641 Paper and paperboard 6 670 0.47 9.23 13 669 0.31 13.23 6.82 2.91081 Animal feed excluding unmilled cereal 7 156 0.50 34.89 13 085 0.29 39.58 4.91 1.23036 Crustacean mollusc aquat invertebra 11 278 0.80 68.69 13 211 0.30 62.41 1.25 -1.13843 Male clothing, knitted crocheted 5 592 0.39 69.97 14 155 0.32 80.89 7.17 1.71422 Fixed veg fat and oil, excluding "soft" 6 963 0.49 89.89 13 425 0.30 86.44 5.61 -0.33681 Silver, platinum, platinum metals 1 188 0.08 19.13 14 925 0.33 42.62 24.41 10.45231 Natural rubber, latex, gum, etc 7 557 0.53 97.51 14 744 0.33 97.58 5.69 0.05762 Radio broadcast receivers 15 924 1.12 70.83 12 383 0.28 65.76 -2.04 -0.79792 Aircraft, spacecraft & equipment 3 928 0.28 5.76 13 760 0.31 8.48 10.07 4.35054 Vegetable & vegetable products nes 6 568 0.46 31.40 12 888 0.29 35.07 5.96 0.55611 Leather 8 132 0.57 51.22 12 640 0.28 55.12 4.24 0.78675 Flat rolled products of alloy steel 2 486 0.18 12.20 13 429 0.30 23.57 14.73 4.83598 Miscellaneous chemical products nes 3 631 0.26 12.28 13 303 0.30 17.61 10.78 2.52522 Inorganic chemical elem oxide salt 5 173 0.36 31.80 12 245 0.27 37.51 7.70 1.75674 Flat plated iron non-alloy steel 3 212 0.23 17.63 12 683 0.28 31.68 12.87 5.56061 Sugar, mollasses and honey 7 684 0.54 48.85 13 285 0.30 58.50 2.78 1.08542 Medicines including veterinary 2 962 0.21 6.53 12 718 0.28 5.37 12.67 -4.54071 Coffee and coffee substitutes 12 129 0.86 77.99 11 828 0.26 64.26 -3.55 -2.35287 Base metal ores & concentrates nes 2 633 0.19 45.06 11 686 0.26 51.12 13.67 2.73884 Optical goods fibres nes 2 233 0.16 22.02 12 066 0.27 34.34 15.83 4.60572 Primary form styrene polymers 4 572 0.32 41.40 11 157 0.25 53.13 9.53 2.71634 Veneer, plywood & other wood nes 7 767 0.55 45.24 11 588 0.26 35.73 2.46 -3.39515 Organo-inorganic compound acid salt 2 471 0.17 9.22 11 663 0.26 13.51 16.24 5.03661 Lime cement construction material 3 401 0.24 30.83 11 345 0.25 51.40 10.25 4.82037 Fish shellfish, prepared preserved 4 819 0.34 54.93 11 155 0.25 65.17 6.81 1.30222 Oil seed etc for soft oil 2 939 0.21 24.01 10 022 0.22 43.92 12.24 6.96747 Pipe, boiler, tank & vat appliances 1 876 0.13 9.62 11 604 0.26 23.23 17.18 9.16697 Base metal household equipment nes 4 150 0.29 41.58 10 660 0.24 50.74 9.19 2.40885 Watches and clocks 10 896 0.77 47.58 10 129 0.23 37.24 -1.09 -2.50657 Special yarn and textile fabric etc 6 895 0.49 32.65 10 172 0.23 31.87 2.82 -0.70872 Medical instruments appliances nes 2 334 0.16 12.23 10 327 0.23 18.39 15.43 4.94846 Clothing accessory excluding 831 848 851 4 310 0.30 40.75 10 039 0.22 54.65 7.74 3.40813 Lighting fixtures and fittings nes 3 596 0.25 36.54 9 475 0.21 45.13 9.37 2.62672 Ingots, Iron steel primary products 4 286 0.30 33.66 9 032 0.20 29.53 8.73 -0.53786 Trailer caravan transport container 3 450 0.24 35.00 9 299 0.21 34.90 10.98 1.50695 Tools for use in hand or in machine 3 408 0.24 19.57 9 567 0.21 27.92 9.55 3.68691 Iron steel aluminium structures nes 2 960 0.21 21.56 10 434 0.23 30.37 12.29 4.43642 Cut paper and paperboard articles 4 451 0.31 17.46 9 054 0.20 23.23 6.09 2.49514 Nitrogen function compounds 2 660 0.19 14.11 9 041 0.20 25.80 10.88 4.86744 Mechanical handling equipment nes 2 851 0.20 10.15 9 411 0.21 15.17 9.63 3.35751 Office machines 4 601 0.32 28.77 9 306 0.21 50.84 4.37 5.07892 Printed matter 3 157 0.22 12.40 8 412 0.19 20.26 9.47 4.90042 Rice 5 197 0.37 69.62 8 132 0.18 76.28 2.84 0.84248 Wood simply worked, railway sleeper 4 971 0.35 18.97 8 356 0.19 21.67 4.73 1.67694 Nails screws nuts bolts rivets 2 798 0.20 25.84 8 173 0.18 33.38 10.25 2.92635 Wood manufactures nes 3 872 0.27 34.36 8 074 0.18 33.77 6.79 0.13724 Textile leather machinery parts nes 3 977 0.28 15.75 7 943 0.18 29.14 6.60 5.77553 Perfume toilet cosmetics, excluding soap 1 947 0.14 10.38 7 962 0.18 16.33 13.92 4.83541 Pharmaceuticals excluding medicines 3 180 0.22 12.06 7 953 0.18 10.69 8.12 -2.35516 Other organic chemicals 2 050 0.14 18.44 7 489 0.17 28.41 12.61 4.72012 Meat nes, fresh chilled frozen 4 784 0.34 19.81 7 075 0.16 17.69 4.08 -0.42533 Pigment, paint, varnish & related 3 007 0.21 15.00 7 369 0.16 16.94 8.88 1.73421 Fixed veg fat and oil, "soft" 4 684 0.33 38.52 7 360 0.16 37.60 4.26 0.59
For sources and notes, see end of table. Pour les sources et les notes, se reporter à la fin du tableau
Growth rates (percentage)
Taux d'accroissement (en pourcentage)
1995-2006
Differencefrom world
Différencepar rapportau monde
Products rankedby average 2005-2006 valuesSITC Revision 3 (3-digit level)
Produits classésd'après la moyenne des valeurs de 2005-2006
CTCI révision 3 (positions à 3 chiffres)
1995 2006
3.2.C Export structure by productDeveloping economies
3.2.C Structure des exportations par produitsÉconomies en développement
3
153
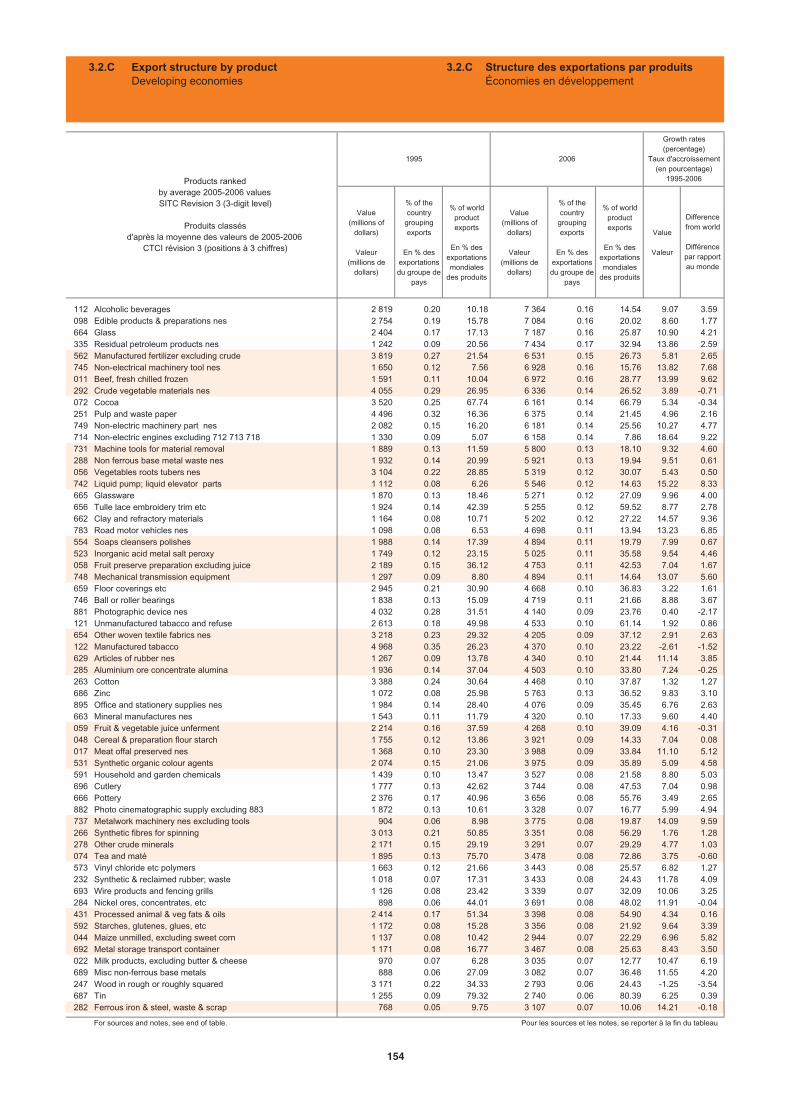
Value(millions of
dollars)
Valeur(millions de
dollars)
% of the country
groupingexports
En % desexportationsdu groupe de
pays
% of worldproductexports
En % des exportationsmondiales
des produits
Value(millions of
dollars)
Valeur(millions de
dollars)
% of the country
groupingexports
En % desexportationsdu groupe de
pays
% of worldproductexports
En % des exportationsmondiales
des produits
Value
Valeur
112 Alcoholic beverages 2 819 0.20 10.18 7 364 0.16 14.54 9.07 3.59098 Edible products & preparations nes 2 754 0.19 15.78 7 084 0.16 20.02 8.60 1.77664 Glass 2 404 0.17 17.13 7 187 0.16 25.87 10.90 4.21335 Residual petroleum products nes 1 242 0.09 20.56 7 434 0.17 32.94 13.86 2.59562 Manufactured fertilizer excluding crude 3 819 0.27 21.54 6 531 0.15 26.73 5.81 2.65745 Non-electrical machinery tool nes 1 650 0.12 7.56 6 928 0.16 15.76 13.82 7.68011 Beef, fresh chilled frozen 1 591 0.11 10.04 6 972 0.16 28.77 13.99 9.62292 Crude vegetable materials nes 4 055 0.29 26.95 6 336 0.14 26.52 3.89 -0.71072 Cocoa 3 520 0.25 67.74 6 161 0.14 66.79 5.34 -0.34251 Pulp and waste paper 4 496 0.32 16.36 6 375 0.14 21.45 4.96 2.16749 Non-electric machinery part nes 2 082 0.15 16.20 6 181 0.14 25.56 10.27 4.77714 Non-electric engines excluding 712 713 718 1 330 0.09 5.07 6 158 0.14 7.86 18.64 9.22731 Machine tools for material removal 1 889 0.13 11.59 5 800 0.13 18.10 9.32 4.60288 Non ferrous base metal waste nes 1 932 0.14 20.99 5 921 0.13 19.94 9.51 0.61056 Vegetables roots tubers nes 3 104 0.22 28.85 5 319 0.12 30.07 5.43 0.50742 Liquid pump; liquid elevator parts 1 112 0.08 6.26 5 546 0.12 14.63 15.22 8.33665 Glassware 1 870 0.13 18.46 5 271 0.12 27.09 9.96 4.00656 Tulle lace embroidery trim etc 1 924 0.14 42.39 5 255 0.12 59.52 8.77 2.78662 Clay and refractory materials 1 164 0.08 10.71 5 202 0.12 27.22 14.57 9.36783 Road motor vehicles nes 1 098 0.08 6.53 4 698 0.11 13.94 13.23 6.85554 Soaps cleansers polishes 1 988 0.14 17.39 4 894 0.11 19.79 7.99 0.67523 Inorganic acid metal salt peroxy 1 749 0.12 23.15 5 025 0.11 35.58 9.54 4.46058 Fruit preserve preparation excluding juice 2 189 0.15 36.12 4 753 0.11 42.53 7.04 1.67748 Mechanical transmission equipment 1 297 0.09 8.80 4 894 0.11 14.64 13.07 5.60659 Floor coverings etc 2 945 0.21 30.90 4 668 0.10 36.83 3.22 1.61746 Ball or roller bearings 1 838 0.13 15.09 4 719 0.11 21.66 8.88 3.67881 Photographic device nes 4 032 0.28 31.51 4 140 0.09 23.76 0.40 -2.17121 Unmanufactured tabacco and refuse 2 613 0.18 49.98 4 533 0.10 61.14 1.92 0.86654 Other woven textile fabrics nes 3 218 0.23 29.32 4 205 0.09 37.12 2.91 2.63122 Manufactured tabacco 4 968 0.35 26.23 4 370 0.10 23.22 -2.61 -1.52629 Articles of rubber nes 1 267 0.09 13.78 4 340 0.10 21.44 11.14 3.85285 Aluminium ore concentrate alumina 1 936 0.14 37.04 4 503 0.10 33.80 7.24 -0.25263 Cotton 3 388 0.24 30.64 4 468 0.10 37.87 1.32 1.27686 Zinc 1 072 0.08 25.98 5 763 0.13 36.52 9.83 3.10895 Office and stationery supplies nes 1 984 0.14 28.40 4 076 0.09 35.45 6.76 2.63663 Mineral manufactures nes 1 543 0.11 11.79 4 320 0.10 17.33 9.60 4.40059 Fruit & vegetable juice unferment 2 214 0.16 37.59 4 268 0.10 39.09 4.16 -0.31048 Cereal & preparation flour starch 1 755 0.12 13.86 3 921 0.09 14.33 7.04 0.08017 Meat offal preserved nes 1 368 0.10 23.30 3 988 0.09 33.84 11.10 5.12531 Synthetic organic colour agents 2 074 0.15 21.06 3 975 0.09 35.89 5.09 4.58591 Household and garden chemicals 1 439 0.10 13.47 3 527 0.08 21.58 8.80 5.03696 Cutlery 1 777 0.13 42.62 3 744 0.08 47.53 7.04 0.98666 Pottery 2 376 0.17 40.96 3 656 0.08 55.76 3.49 2.65882 Photo cinematographic supply excluding 883 1 872 0.13 10.61 3 328 0.07 16.77 5.99 4.94737 Metalwork machinery nes excluding tools 904 0.06 8.98 3 775 0.08 19.87 14.09 9.59266 Synthetic fibres for spinning 3 013 0.21 50.85 3 351 0.08 56.29 1.76 1.28278 Other crude minerals 2 171 0.15 29.19 3 291 0.07 29.29 4.77 1.03074 Tea and maté 1 895 0.13 75.70 3 478 0.08 72.86 3.75 -0.60573 Vinyl chloride etc polymers 1 663 0.12 21.66 3 443 0.08 25.57 6.82 1.27232 Synthetic & reclaimed rubber; waste 1 018 0.07 17.31 3 433 0.08 24.43 11.78 4.09693 Wire products and fencing grills 1 126 0.08 23.42 3 339 0.07 32.09 10.06 3.25284 Nickel ores, concentrates, etc 898 0.06 44.01 3 691 0.08 48.02 11.91 -0.04431 Processed animal & veg fats & oils 2 414 0.17 51.34 3 398 0.08 54.90 4.34 0.16592 Starches, glutenes, glues, etc 1 172 0.08 15.28 3 356 0.08 21.92 9.64 3.39044 Maize unmilled, excluding sweet corn 1 137 0.08 10.42 2 944 0.07 22.29 6.96 5.82692 Metal storage transport container 1 171 0.08 16.77 3 467 0.08 25.63 8.43 3.50022 Milk products, excluding butter & cheese 970 0.07 6.28 3 035 0.07 12.77 10.47 6.19689 Misc non-ferrous base metals 888 0.06 27.09 3 082 0.07 36.48 11.55 4.20247 Wood in rough or roughly squared 3 171 0.22 34.33 2 793 0.06 24.43 -1.25 -3.54687 Tin 1 255 0.09 79.32 2 740 0.06 80.39 6.25 0.39282 Ferrous iron & steel, waste & scrap 768 0.05 9.75 3 107 0.07 10.06 14.21 -0.18
For sources and notes, see end of table. Pour les sources et les notes, se reporter à la fin du tableau
Products rankedby average 2005-2006 valuesSITC Revision 3 (3-digit level)
Produits classésd'après la moyenne des valeurs de 2005-2006
CTCI révision 3 (positions à 3 chiffres)
1995 2006
Growth rates (percentage)
Taux d'accroissement (en pourcentage)
1995-2006
Differencefrom world
Différencepar rapportau monde
3.2.C Export structure by productDeveloping economies
3.2.C Structure des exportations par produitsÉconomies en développement
154
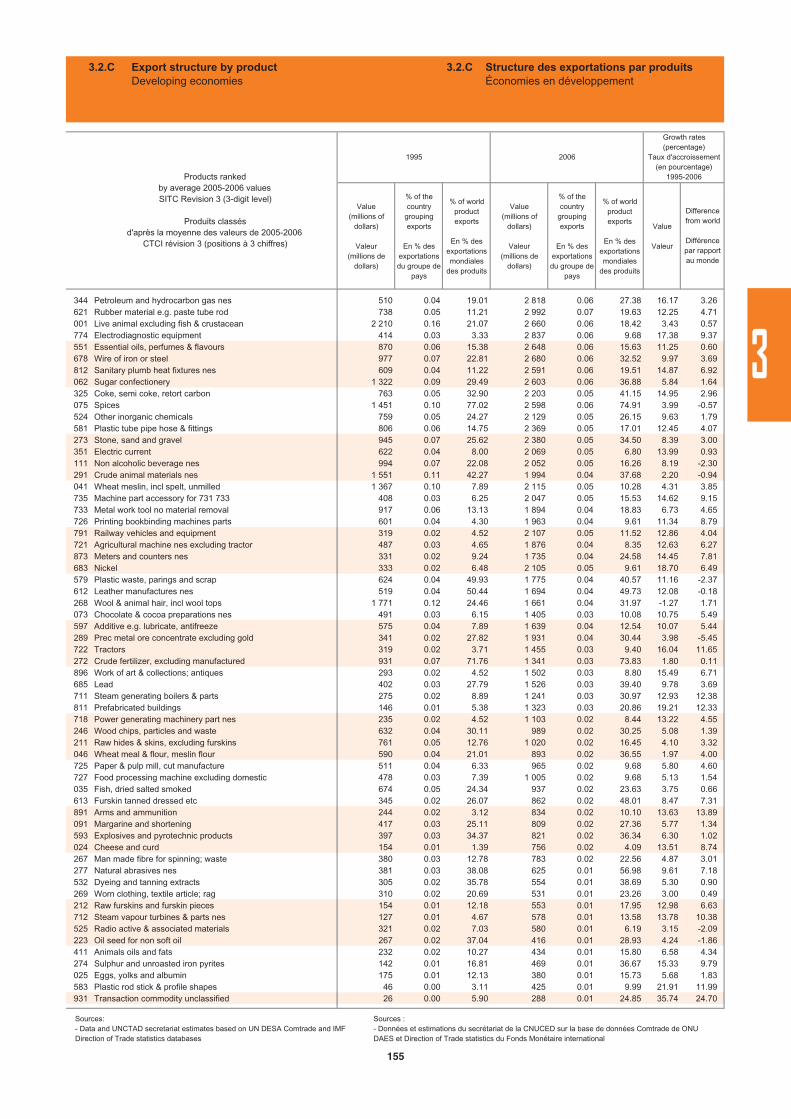
Value(millions of
dollars)
Valeur(millions de
dollars)
% of the country
groupingexports
En % desexportationsdu groupe de
pays
% of worldproductexports
En % des exportationsmondiales
des produits
Value(millions of
dollars)
Valeur(millions de
dollars)
% of the country
groupingexports
En % desexportationsdu groupe de
pays
% of worldproductexports
En % des exportationsmondiales
des produits
Value
Valeur
344 Petroleum and hydrocarbon gas nes 510 0.04 19.01 2 818 0.06 27.38 16.17 3.26621 Rubber material e.g. paste tube rod 738 0.05 11.21 2 992 0.07 19.63 12.25 4.71001 Live animal excluding fish & crustacean 2 210 0.16 21.07 2 660 0.06 18.42 3.43 0.57774 Electrodiagnostic equipment 414 0.03 3.33 2 837 0.06 9.68 17.38 9.37551 Essential oils, perfumes & flavours 870 0.06 15.38 2 648 0.06 15.63 11.25 0.60678 Wire of iron or steel 977 0.07 22.81 2 680 0.06 32.52 9.97 3.69812 Sanitary plumb heat fixtures nes 609 0.04 11.22 2 591 0.06 19.51 14.87 6.92062 Sugar confectionery 1 322 0.09 29.49 2 603 0.06 36.88 5.84 1.64325 Coke, semi coke, retort carbon 763 0.05 32.90 2 203 0.05 41.15 14.95 2.96075 Spices 1 451 0.10 77.02 2 598 0.06 74.91 3.99 -0.57524 Other inorganic chemicals 759 0.05 24.27 2 129 0.05 26.15 9.63 1.79581 Plastic tube pipe hose & fittings 806 0.06 14.75 2 369 0.05 17.01 12.45 4.07273 Stone, sand and gravel 945 0.07 25.62 2 380 0.05 34.50 8.39 3.00351 Electric current 622 0.04 8.00 2 069 0.05 6.80 13.99 0.93111 Non alcoholic beverage nes 994 0.07 22.08 2 052 0.05 16.26 8.19 -2.30291 Crude animal materials nes 1 551 0.11 42.27 1 994 0.04 37.68 2.20 -0.94041 Wheat meslin, incl spelt, unmilled 1 367 0.10 7.89 2 115 0.05 10.28 4.31 3.85735 Machine part accessory for 731 733 408 0.03 6.25 2 047 0.05 15.53 14.62 9.15733 Metal work tool no material removal 917 0.06 13.13 1 894 0.04 18.83 6.73 4.65726 Printing bookbinding machines parts 601 0.04 4.30 1 963 0.04 9.61 11.34 8.79791 Railway vehicles and equipment 319 0.02 4.52 2 107 0.05 11.52 12.86 4.04721 Agricultural machine nes excluding tractor 487 0.03 4.65 1 876 0.04 8.35 12.63 6.27873 Meters and counters nes 331 0.02 9.24 1 735 0.04 24.58 14.45 7.81683 Nickel 333 0.02 6.48 2 105 0.05 9.61 18.70 6.49579 Plastic waste, parings and scrap 624 0.04 49.93 1 775 0.04 40.57 11.16 -2.37612 Leather manufactures nes 519 0.04 50.44 1 694 0.04 49.73 12.08 -0.18268 Wool & animal hair, incl wool tops 1 771 0.12 24.46 1 661 0.04 31.97 -1.27 1.71073 Chocolate & cocoa preparations nes 491 0.03 6.15 1 405 0.03 10.08 10.75 5.49597 Additive e.g. lubricate, antifreeze 575 0.04 7.89 1 639 0.04 12.54 10.07 5.44289 Prec metal ore concentrate excluding gold 341 0.02 27.82 1 931 0.04 30.44 3.98 -5.45722 Tractors 319 0.02 3.71 1 455 0.03 9.40 16.04 11.65272 Crude fertilizer, excluding manufactured 931 0.07 71.76 1 341 0.03 73.83 1.80 0.11896 Work of art & collections; antiques 293 0.02 4.52 1 502 0.03 8.80 15.49 6.71685 Lead 402 0.03 27.79 1 526 0.03 39.40 9.78 3.69711 Steam generating boilers & parts 275 0.02 8.89 1 241 0.03 30.97 12.93 12.38811 Prefabricated buildings 146 0.01 5.38 1 323 0.03 20.86 19.21 12.33718 Power generating machinery part nes 235 0.02 4.52 1 103 0.02 8.44 13.22 4.55246 Wood chips, particles and waste 632 0.04 30.11 989 0.02 30.25 5.08 1.39211 Raw hides & skins, excluding furskins 761 0.05 12.76 1 020 0.02 16.45 4.10 3.32046 Wheat meal & flour, meslin flour 590 0.04 21.01 893 0.02 36.55 1.97 4.00725 Paper & pulp mill, cut manufacture 511 0.04 6.33 965 0.02 9.68 5.80 4.60727 Food processing machine excluding domestic 478 0.03 7.39 1 005 0.02 9.68 5.13 1.54035 Fish, dried salted smoked 674 0.05 24.34 937 0.02 23.63 3.75 0.66613 Furskin tanned dressed etc 345 0.02 26.07 862 0.02 48.01 8.47 7.31891 Arms and ammunition 244 0.02 3.12 834 0.02 10.10 13.63 13.89091 Margarine and shortening 417 0.03 25.11 809 0.02 27.36 5.77 1.34593 Explosives and pyrotechnic products 397 0.03 34.37 821 0.02 36.34 6.30 1.02024 Cheese and curd 154 0.01 1.39 756 0.02 4.09 13.51 8.74267 Man made fibre for spinning; waste 380 0.03 12.78 783 0.02 22.56 4.87 3.01277 Natural abrasives nes 381 0.03 38.08 625 0.01 56.98 9.61 7.18532 Dyeing and tanning extracts 305 0.02 35.78 554 0.01 38.69 5.30 0.90269 Worn clothing, textile article; rag 310 0.02 20.69 531 0.01 23.26 3.00 0.49212 Raw furskins and furskin pieces 154 0.01 12.18 553 0.01 17.95 12.98 6.63712 Steam vapour turbines & parts nes 127 0.01 4.67 578 0.01 13.58 13.78 10.38525 Radio active & associated materials 321 0.02 7.03 580 0.01 6.19 3.15 -2.09223 Oil seed for non soft oil 267 0.02 37.04 416 0.01 28.93 4.24 -1.86411 Animals oils and fats 232 0.02 10.27 434 0.01 15.80 6.58 4.34274 Sulphur and unroasted iron pyrites 142 0.01 16.81 469 0.01 36.67 15.33 9.79025 Eggs, yolks and albumin 175 0.01 12.13 380 0.01 15.73 5.68 1.83583 Plastic rod stick & profile shapes 46 0.00 3.11 425 0.01 9.99 21.91 11.99931 Transaction commodity unclassified 26 0.00 5.90 288 0.01 24.85 35.74 24.70
Growth rates (percentage)
Taux d'accroissement (en pourcentage)
1995-2006
Differencefrom world
Différencepar rapportau monde
Products rankedby average 2005-2006 valuesSITC Revision 3 (3-digit level)
Produits classésd'après la moyenne des valeurs de 2005-2006
CTCI révision 3 (positions à 3 chiffres)
1995 2006
3.2.C Export structure by productDeveloping economies
3.2.C Structure des exportations par produitsÉconomies en développement
Sources:- Data and UNCTAD secretariat estimates based on UN DESA Comtrade and IMF Direction of Trade statistics databases
Sources : - Données et estimations du secrétariat de la CNUCED sur la base de données Comtrade de ONU DAES et Direction of Trade statistics du Fonds Monétaire international
3
155
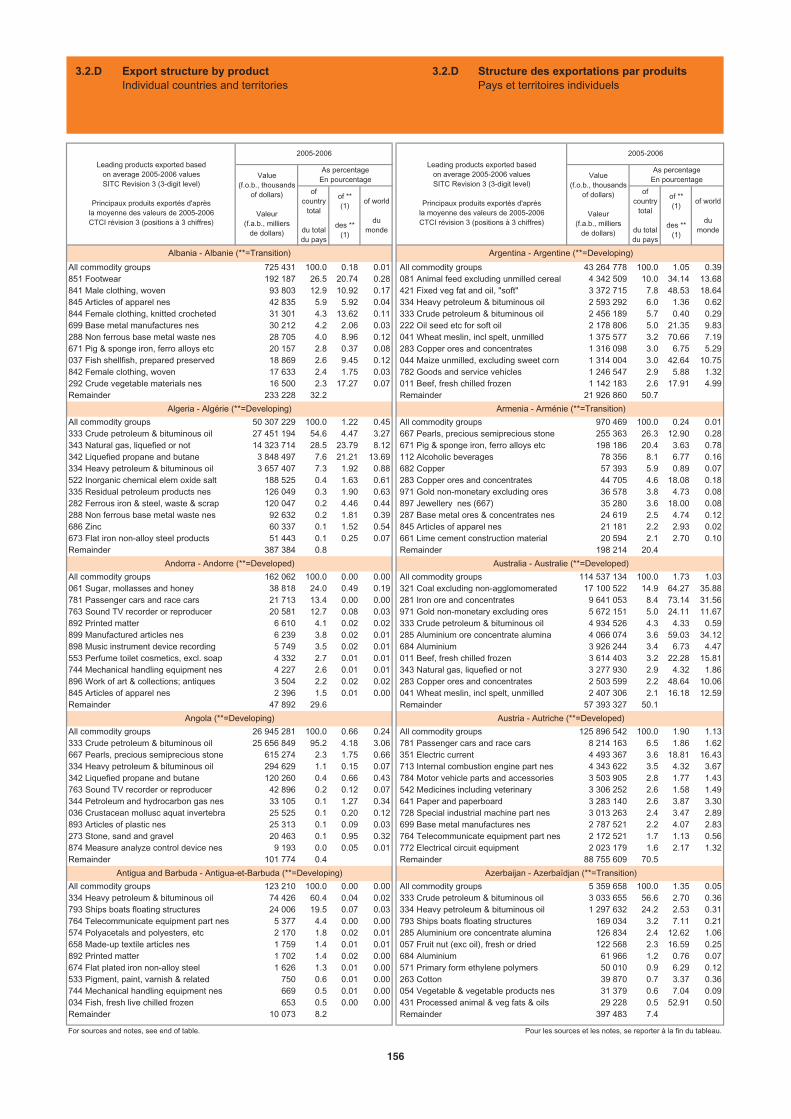
ofcountry
total
du totaldu pays
of ** (1)
des ** (1)
of world
dumonde
ofcountry
total
du totaldu pays
of ** (1)
des ** (1)
of world
dumonde
All commodity groups 725 431 100.0 0.18 0.01 All commodity groups 43 264 778 100.0 1.05 0.39851 Footwear 192 187 26.5 20.74 0.28 081 Animal feed excluding unmilled cereal 4 342 509 10.0 34.14 13.68841 Male clothing, woven 93 803 12.9 10.92 0.17 421 Fixed veg fat and oil, "soft" 3 372 715 7.8 48.53 18.64845 Articles of apparel nes 42 835 5.9 5.92 0.04 334 Heavy petroleum & bituminous oil 2 593 292 6.0 1.36 0.62844 Female clothing, knitted crocheted 31 301 4.3 13.62 0.11 333 Crude petroleum & bituminous oil 2 456 189 5.7 0.40 0.29699 Base metal manufactures nes 30 212 4.2 2.06 0.03 222 Oil seed etc for soft oil 2 178 806 5.0 21.35 9.83288 Non ferrous base metal waste nes 28 705 4.0 8.96 0.12 041 Wheat meslin, incl spelt, unmilled 1 375 577 3.2 70.66 7.19671 Pig & sponge iron, ferro alloys etc 20 157 2.8 0.37 0.08 283 Copper ores and concentrates 1 316 098 3.0 6.75 5.29037 Fish shellfish, prepared preserved 18 869 2.6 9.45 0.12 044 Maize unmilled, excluding sweet corn 1 314 004 3.0 42.64 10.75842 Female clothing, woven 17 633 2.4 1.75 0.03 782 Goods and service vehicles 1 246 547 2.9 5.88 1.32292 Crude vegetable materials nes 16 500 2.3 17.27 0.07 011 Beef, fresh chilled frozen 1 142 183 2.6 17.91 4.99Remainder 233 228 32.2 Remainder 21 926 860 50.7
All commodity groups 50 307 229 100.0 1.22 0.45 All commodity groups 970 469 100.0 0.24 0.01333 Crude petroleum & bituminous oil 27 451 194 54.6 4.47 3.27 667 Pearls, precious semiprecious stone 255 363 26.3 12.90 0.28343 Natural gas, liquefied or not 14 323 714 28.5 23.79 8.12 671 Pig & sponge iron, ferro alloys etc 198 186 20.4 3.63 0.78342 Liquefied propane and butane 3 848 497 7.6 21.21 13.69 112 Alcoholic beverages 78 356 8.1 6.77 0.16334 Heavy petroleum & bituminous oil 3 657 407 7.3 1.92 0.88 682 Copper 57 393 5.9 0.89 0.07522 Inorganic chemical elem oxide salt 188 525 0.4 1.63 0.61 283 Copper ores and concentrates 44 705 4.6 18.08 0.18335 Residual petroleum products nes 126 049 0.3 1.90 0.63 971 Gold non-monetary excluding ores 36 578 3.8 4.73 0.08282 Ferrous iron & steel, waste & scrap 120 047 0.2 4.46 0.44 897 Jewellery nes (667) 35 280 3.6 18.00 0.08288 Non ferrous base metal waste nes 92 632 0.2 1.81 0.39 287 Base metal ores & concentrates nes 24 619 2.5 4.74 0.12686 Zinc 60 337 0.1 1.52 0.54 845 Articles of apparel nes 21 181 2.2 2.93 0.02673 Flat iron non-alloy steel products 51 443 0.1 0.25 0.07 661 Lime cement construction material 20 594 2.1 2.70 0.10Remainder 387 384 0.8 Remainder 198 214 20.4
All commodity groups 162 062 100.0 0.00 0.00 All commodity groups 114 537 134 100.0 1.73 1.03061 Sugar, mollasses and honey 38 818 24.0 0.49 0.19 321 Coal excluding non-agglomomerated 17 100 522 14.9 64.27 35.88781 Passenger cars and race cars 21 713 13.4 0.00 0.00 281 Iron ore and concentrates 9 641 053 8.4 73.14 31.56763 Sound TV recorder or reproducer 20 581 12.7 0.08 0.03 971 Gold non-monetary excluding ores 5 672 151 5.0 24.11 11.67892 Printed matter 6 610 4.1 0.02 0.02 333 Crude petroleum & bituminous oil 4 934 526 4.3 4.33 0.59899 Manufactured articles nes 6 239 3.8 0.02 0.01 285 Aluminium ore concentrate alumina 4 066 074 3.6 59.03 34.12898 Music instrument device recording 5 749 3.5 0.02 0.01 684 Aluminium 3 926 244 3.4 6.73 4.47553 Perfume toilet cosmetics, excl. soap 4 332 2.7 0.01 0.01 011 Beef, fresh chilled frozen 3 614 403 3.2 22.28 15.81744 Mechanical handling equipment nes 4 227 2.6 0.01 0.01 343 Natural gas, liquefied or not 3 277 930 2.9 4.32 1.86896 Work of art & collections; antiques 3 504 2.2 0.02 0.02 283 Copper ores and concentrates 2 503 599 2.2 48.64 10.06845 Articles of apparel nes 2 396 1.5 0.01 0.00 041 Wheat meslin, incl spelt, unmilled 2 407 306 2.1 16.18 12.59Remainder 47 892 29.6 Remainder 57 393 327 50.1
All commodity groups 26 945 281 100.0 0.66 0.24 All commodity groups 125 896 542 100.0 1.90 1.13333 Crude petroleum & bituminous oil 25 656 849 95.2 4.18 3.06 781 Passenger cars and race cars 8 214 163 6.5 1.86 1.62667 Pearls, precious semiprecious stone 615 274 2.3 1.75 0.66 351 Electric current 4 493 367 3.6 18.81 16.43334 Heavy petroleum & bituminous oil 294 629 1.1 0.15 0.07 713 Internal combustion engine part nes 4 343 622 3.5 4.32 3.67342 Liquefied propane and butane 120 260 0.4 0.66 0.43 784 Motor vehicle parts and accessories 3 503 905 2.8 1.77 1.43763 Sound TV recorder or reproducer 42 896 0.2 0.12 0.07 542 Medicines including veterinary 3 306 252 2.6 1.58 1.49344 Petroleum and hydrocarbon gas nes 33 105 0.1 1.27 0.34 641 Paper and paperboard 3 283 140 2.6 3.87 3.30036 Crustacean mollusc aquat invertebra 25 525 0.1 0.20 0.12 728 Special industrial machine part nes 3 013 263 2.4 3.47 2.89893 Articles of plastic nes 25 313 0.1 0.09 0.03 699 Base metal manufactures nes 2 787 521 2.2 4.07 2.83273 Stone, sand and gravel 20 463 0.1 0.95 0.32 764 Telecommunicate equipment part nes 2 172 521 1.7 1.13 0.56874 Measure analyze control device nes 9 193 0.0 0.05 0.01 772 Electrical circuit equipment 2 023 179 1.6 2.17 1.32Remainder 101 774 0.4 Remainder 88 755 609 70.5
All commodity groups 123 210 100.0 0.00 0.00 All commodity groups 5 359 658 100.0 1.35 0.05334 Heavy petroleum & bituminous oil 74 426 60.4 0.04 0.02 333 Crude petroleum & bituminous oil 3 033 655 56.6 2.70 0.36793 Ships boats floating structures 24 006 19.5 0.07 0.03 334 Heavy petroleum & bituminous oil 1 297 632 24.2 2.53 0.31764 Telecommunicate equipment part nes 5 377 4.4 0.00 0.00 793 Ships boats floating structures 169 034 3.2 7.11 0.21574 Polyacetals and polyesters, etc 2 170 1.8 0.02 0.01 285 Aluminium ore concentrate alumina 126 834 2.4 12.62 1.06658 Made-up textile articles nes 1 759 1.4 0.01 0.01 057 Fruit nut (exc oil), fresh or dried 122 568 2.3 16.59 0.25892 Printed matter 1 702 1.4 0.02 0.00 684 Aluminium 61 966 1.2 0.76 0.07674 Flat plated iron non-alloy steel 1 626 1.3 0.01 0.00 571 Primary form ethylene polymers 50 010 0.9 6.29 0.12533 Pigment, paint, varnish & related 750 0.6 0.01 0.00 263 Cotton 39 870 0.7 3.37 0.36744 Mechanical handling equipment nes 669 0.5 0.01 0.00 054 Vegetable & vegetable products nes 31 379 0.6 7.04 0.09034 Fish, fresh live chilled frozen 653 0.5 0.00 0.00 431 Processed animal & veg fats & oils 29 228 0.5 52.91 0.50Remainder 10 073 8.2 Remainder 397 483 7.4
For sources and notes, see end of table. Pour les sources et les notes, se reporter à la fin du tableau.
2005-2006
Value(f.o.b., thousands
of dollars)
Valeur(f.a.b., milliers
de dollars)
Antigua and Barbuda - Antigua-et-Barbuda (**=Developing)
Australia - Australie (**=Developed)
Angola (**=Developing) Austria - Autriche (**=Developed)
Azerbaijan - Azerbaïdjan (**=Transition)
Andorra - Andorre (**=Developed)
2005-2006
As percentageEn pourcentageValue
(f.o.b., thousandsof dollars)
Valeur(f.a.b., milliers
de dollars)
Leading products exported basedon average 2005-2006 valuesSITC Revision 3 (3-digit level)
Principaux produits exportés d'aprèsla moyenne des valeurs de 2005-2006CTCI révision 3 (positions à 3 chiffres)
Albania - Albanie (**=Transition)
Algeria - Algérie (**=Developing)
Argentina - Argentine (**=Developing)
Armenia - Arménie (**=Transition)
Leading products exported basedon average 2005-2006 valuesSITC Revision 3 (3-digit level)
Principaux produits exportés d'aprèsla moyenne des valeurs de 2005-2006CTCI révision 3 (positions à 3 chiffres)
As percentageEn pourcentage
3.2.D Export structure by productIndividual countries and territories
3.2.D Structure des exportations par produitsPays et territoires individuels
156
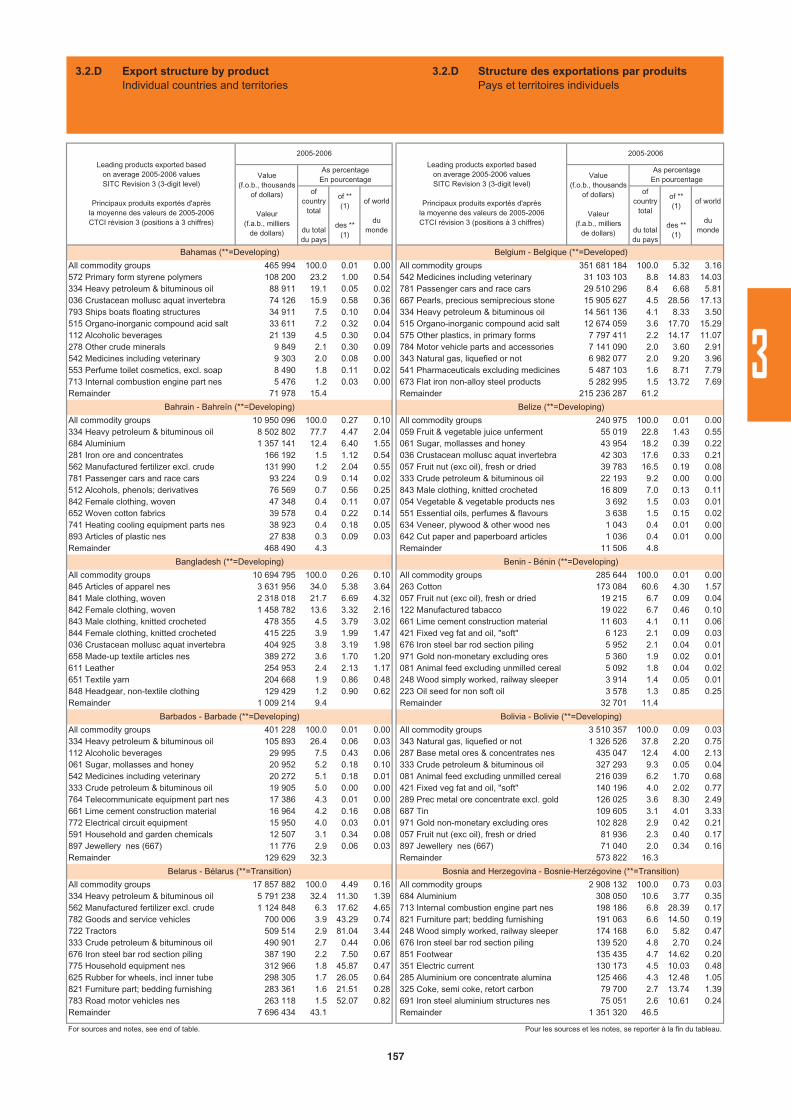
ofcountry
total
du totaldu pays
of ** (1)
des ** (1)
of world
dumonde
ofcountry
total
du totaldu pays
of ** (1)
des ** (1)
of world
dumonde
All commodity groups 465 994 100.0 0.01 0.00 All commodity groups 351 681 184 100.0 5.32 3.16572 Primary form styrene polymers 108 200 23.2 1.00 0.54 542 Medicines including veterinary 31 103 103 8.8 14.83 14.03334 Heavy petroleum & bituminous oil 88 911 19.1 0.05 0.02 781 Passenger cars and race cars 29 510 296 8.4 6.68 5.81036 Crustacean mollusc aquat invertebra 74 126 15.9 0.58 0.36 667 Pearls, precious semiprecious stone 15 905 627 4.5 28.56 17.13793 Ships boats floating structures 34 911 7.5 0.10 0.04 334 Heavy petroleum & bituminous oil 14 561 136 4.1 8.33 3.50515 Organo-inorganic compound acid salt 33 611 7.2 0.32 0.04 515 Organo-inorganic compound acid salt 12 674 059 3.6 17.70 15.29112 Alcoholic beverages 21 139 4.5 0.30 0.04 575 Other plastics, in primary forms 7 797 411 2.2 14.17 11.07278 Other crude minerals 9 849 2.1 0.30 0.09 784 Motor vehicle parts and accessories 7 141 090 2.0 3.60 2.91542 Medicines including veterinary 9 303 2.0 0.08 0.00 343 Natural gas, liquefied or not 6 982 077 2.0 9.20 3.96553 Perfume toilet cosmetics, excl. soap 8 490 1.8 0.11 0.02 541 Pharmaceuticals excluding medicines 5 487 103 1.6 8.71 7.79713 Internal combustion engine part nes 5 476 1.2 0.03 0.00 673 Flat iron non-alloy steel products 5 282 995 1.5 13.72 7.69Remainder 71 978 15.4 Remainder 215 236 287 61.2
All commodity groups 10 950 096 100.0 0.27 0.10 All commodity groups 240 975 100.0 0.01 0.00334 Heavy petroleum & bituminous oil 8 502 802 77.7 4.47 2.04 059 Fruit & vegetable juice unferment 55 019 22.8 1.43 0.55684 Aluminium 1 357 141 12.4 6.40 1.55 061 Sugar, mollasses and honey 43 954 18.2 0.39 0.22281 Iron ore and concentrates 166 192 1.5 1.12 0.54 036 Crustacean mollusc aquat invertebra 42 303 17.6 0.33 0.21562 Manufactured fertilizer excl. crude 131 990 1.2 2.04 0.55 057 Fruit nut (exc oil), fresh or dried 39 783 16.5 0.19 0.08781 Passenger cars and race cars 93 224 0.9 0.14 0.02 333 Crude petroleum & bituminous oil 22 193 9.2 0.00 0.00512 Alcohols, phenols; derivatives 76 569 0.7 0.56 0.25 843 Male clothing, knitted crocheted 16 809 7.0 0.13 0.11842 Female clothing, woven 47 348 0.4 0.11 0.07 054 Vegetable & vegetable products nes 3 692 1.5 0.03 0.01652 Woven cotton fabrics 39 578 0.4 0.22 0.14 551 Essential oils, perfumes & flavours 3 638 1.5 0.15 0.02741 Heating cooling equipment parts nes 38 923 0.4 0.18 0.05 634 Veneer, plywood & other wood nes 1 043 0.4 0.01 0.00893 Articles of plastic nes 27 838 0.3 0.09 0.03 642 Cut paper and paperboard articles 1 036 0.4 0.01 0.00Remainder 468 490 4.3 Remainder 11 506 4.8
All commodity groups 10 694 795 100.0 0.26 0.10 All commodity groups 285 644 100.0 0.01 0.00845 Articles of apparel nes 3 631 956 34.0 5.38 3.64 263 Cotton 173 084 60.6 4.30 1.57841 Male clothing, woven 2 318 018 21.7 6.69 4.32 057 Fruit nut (exc oil), fresh or dried 19 215 6.7 0.09 0.04842 Female clothing, woven 1 458 782 13.6 3.32 2.16 122 Manufactured tabacco 19 022 6.7 0.46 0.10843 Male clothing, knitted crocheted 478 355 4.5 3.79 3.02 661 Lime cement construction material 11 603 4.1 0.11 0.06844 Female clothing, knitted crocheted 415 225 3.9 1.99 1.47 421 Fixed veg fat and oil, "soft" 6 123 2.1 0.09 0.03036 Crustacean mollusc aquat invertebra 404 925 3.8 3.19 1.98 676 Iron steel bar rod section piling 5 952 2.1 0.04 0.01658 Made-up textile articles nes 389 272 3.6 1.70 1.20 971 Gold non-monetary excluding ores 5 360 1.9 0.02 0.01611 Leather 254 953 2.4 2.13 1.17 081 Animal feed excluding unmilled cereal 5 092 1.8 0.04 0.02651 Textile yarn 204 668 1.9 0.86 0.48 248 Wood simply worked, railway sleeper 3 914 1.4 0.05 0.01848 Headgear, non-textile clothing 129 429 1.2 0.90 0.62 223 Oil seed for non soft oil 3 578 1.3 0.85 0.25Remainder 1 009 214 9.4 Remainder 32 701 11.4
All commodity groups 401 228 100.0 0.01 0.00 All commodity groups 3 510 357 100.0 0.09 0.03334 Heavy petroleum & bituminous oil 105 893 26.4 0.06 0.03 343 Natural gas, liquefied or not 1 326 526 37.8 2.20 0.75112 Alcoholic beverages 29 995 7.5 0.43 0.06 287 Base metal ores & concentrates nes 435 047 12.4 4.00 2.13061 Sugar, mollasses and honey 20 952 5.2 0.18 0.10 333 Crude petroleum & bituminous oil 327 293 9.3 0.05 0.04542 Medicines including veterinary 20 272 5.1 0.18 0.01 081 Animal feed excluding unmilled cereal 216 039 6.2 1.70 0.68333 Crude petroleum & bituminous oil 19 905 5.0 0.00 0.00 421 Fixed veg fat and oil, "soft" 140 196 4.0 2.02 0.77764 Telecommunicate equipment part nes 17 386 4.3 0.01 0.00 289 Prec metal ore concentrate excl. gold 126 025 3.6 8.30 2.49661 Lime cement construction material 16 964 4.2 0.16 0.08 687 Tin 109 605 3.1 4.01 3.33772 Electrical circuit equipment 15 950 4.0 0.03 0.01 971 Gold non-monetary excluding ores 102 828 2.9 0.42 0.21591 Household and garden chemicals 12 507 3.1 0.34 0.08 057 Fruit nut (exc oil), fresh or dried 81 936 2.3 0.40 0.17897 Jewellery nes (667) 11 776 2.9 0.06 0.03 897 Jewellery nes (667) 71 040 2.0 0.34 0.16Remainder 129 629 32.3 Remainder 573 822 16.3
All commodity groups 17 857 882 100.0 4.49 0.16 All commodity groups 2 908 132 100.0 0.73 0.03334 Heavy petroleum & bituminous oil 5 791 238 32.4 11.30 1.39 684 Aluminium 308 050 10.6 3.77 0.35562 Manufactured fertilizer excl. crude 1 124 848 6.3 17.62 4.65 713 Internal combustion engine part nes 198 186 6.8 28.39 0.17782 Goods and service vehicles 700 006 3.9 43.29 0.74 821 Furniture part; bedding furnishing 191 063 6.6 14.50 0.19722 Tractors 509 514 2.9 81.04 3.44 248 Wood simply worked, railway sleeper 174 168 6.0 5.82 0.47333 Crude petroleum & bituminous oil 490 901 2.7 0.44 0.06 676 Iron steel bar rod section piling 139 520 4.8 2.70 0.24676 Iron steel bar rod section piling 387 190 2.2 7.50 0.67 851 Footwear 135 435 4.7 14.62 0.20775 Household equipment nes 312 966 1.8 45.87 0.47 351 Electric current 130 173 4.5 10.03 0.48625 Rubber for wheels, incl inner tube 298 305 1.7 26.05 0.64 285 Aluminium ore concentrate alumina 125 466 4.3 12.48 1.05821 Furniture part; bedding furnishing 283 361 1.6 21.51 0.28 325 Coke, semi coke, retort carbon 79 700 2.7 13.74 1.39783 Road motor vehicles nes 263 118 1.5 52.07 0.82 691 Iron steel aluminium structures nes 75 051 2.6 10.61 0.24Remainder 7 696 434 43.1 Remainder 1 351 320 46.5
For sources and notes, see end of table. Pour les sources et les notes, se reporter à la fin du tableau.
Leading products exported basedon average 2005-2006 valuesSITC Revision 3 (3-digit level)
Principaux produits exportés d'aprèsla moyenne des valeurs de 2005-2006CTCI révision 3 (positions à 3 chiffres)
2005-2006
Leading products exported basedon average 2005-2006 valuesSITC Revision 3 (3-digit level)
Principaux produits exportés d'aprèsla moyenne des valeurs de 2005-2006CTCI révision 3 (positions à 3 chiffres)
2005-2006
Value(f.o.b., thousands
of dollars)
Valeur(f.a.b., milliers
de dollars)
As percentageEn pourcentage Value
(f.o.b., thousandsof dollars)
Valeur(f.a.b., milliers
de dollars)
As percentageEn pourcentage
Barbados - Barbade (**=Developing)
Belarus - Bélarus (**=Transition)
Belgium - Belgique (**=Developed)
Belize (**=Developing)
Benin - Bénin (**=Developing)
Bolivia - Bolivie (**=Developing)
Bosnia and Herzegovina - Bosnie-Herzégovine (**=Transition)
Bahamas (**=Developing)
Bangladesh (**=Developing)
Bahrain - Bahreïn (**=Developing)
3.2.D Export structure by productIndividual countries and territories
3.2.D Structure des exportations par produitsPays et territoires individuels
3
157
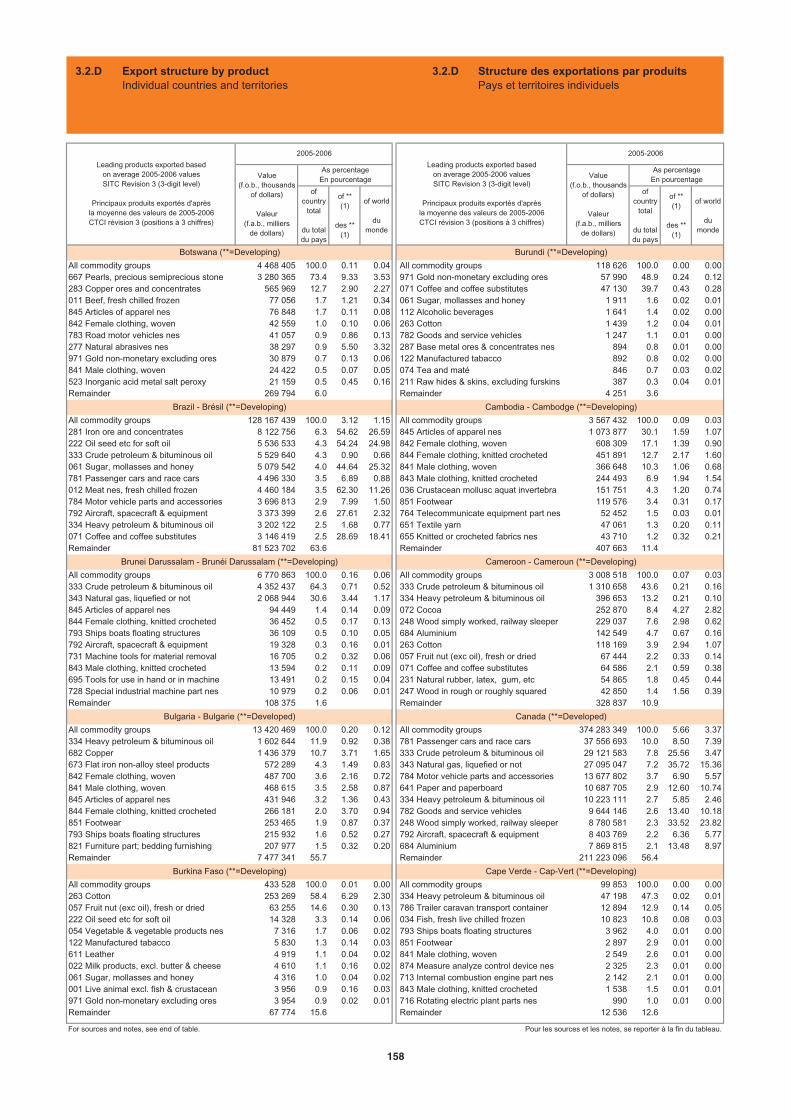
ofcountry
total
du totaldu pays
of ** (1)
des ** (1)
of world
dumonde
ofcountry
total
du totaldu pays
of ** (1)
des ** (1)
of world
dumonde
All commodity groups 4 468 405 100.0 0.11 0.04 All commodity groups 118 626 100.0 0.00 0.00667 Pearls, precious semiprecious stone 3 280 365 73.4 9.33 3.53 971 Gold non-monetary excluding ores 57 990 48.9 0.24 0.12283 Copper ores and concentrates 565 969 12.7 2.90 2.27 071 Coffee and coffee substitutes 47 130 39.7 0.43 0.28011 Beef, fresh chilled frozen 77 056 1.7 1.21 0.34 061 Sugar, mollasses and honey 1 911 1.6 0.02 0.01845 Articles of apparel nes 76 848 1.7 0.11 0.08 112 Alcoholic beverages 1 641 1.4 0.02 0.00842 Female clothing, woven 42 559 1.0 0.10 0.06 263 Cotton 1 439 1.2 0.04 0.01783 Road motor vehicles nes 41 057 0.9 0.86 0.13 782 Goods and service vehicles 1 247 1.1 0.01 0.00277 Natural abrasives nes 38 297 0.9 5.50 3.32 287 Base metal ores & concentrates nes 894 0.8 0.01 0.00971 Gold non-monetary excluding ores 30 879 0.7 0.13 0.06 122 Manufactured tabacco 892 0.8 0.02 0.00841 Male clothing, woven 24 422 0.5 0.07 0.05 074 Tea and maté 846 0.7 0.03 0.02523 Inorganic acid metal salt peroxy 21 159 0.5 0.45 0.16 211 Raw hides & skins, excluding furskins 387 0.3 0.04 0.01Remainder 269 794 6.0 Remainder 4 251 3.6
All commodity groups 128 167 439 100.0 3.12 1.15 All commodity groups 3 567 432 100.0 0.09 0.03281 Iron ore and concentrates 8 122 756 6.3 54.62 26.59 845 Articles of apparel nes 1 073 877 30.1 1.59 1.07222 Oil seed etc for soft oil 5 536 533 4.3 54.24 24.98 842 Female clothing, woven 608 309 17.1 1.39 0.90333 Crude petroleum & bituminous oil 5 529 640 4.3 0.90 0.66 844 Female clothing, knitted crocheted 451 891 12.7 2.17 1.60061 Sugar, mollasses and honey 5 079 542 4.0 44.64 25.32 841 Male clothing, woven 366 648 10.3 1.06 0.68781 Passenger cars and race cars 4 496 330 3.5 6.89 0.88 843 Male clothing, knitted crocheted 244 493 6.9 1.94 1.54012 Meat nes, fresh chilled frozen 4 460 184 3.5 62.30 11.26 036 Crustacean mollusc aquat invertebra 151 751 4.3 1.20 0.74784 Motor vehicle parts and accessories 3 696 813 2.9 7.99 1.50 851 Footwear 119 576 3.4 0.31 0.17792 Aircraft, spacecraft & equipment 3 373 399 2.6 27.61 2.32 764 Telecommunicate equipment part nes 52 452 1.5 0.03 0.01334 Heavy petroleum & bituminous oil 3 202 122 2.5 1.68 0.77 651 Textile yarn 47 061 1.3 0.20 0.11071 Coffee and coffee substitutes 3 146 419 2.5 28.69 18.41 655 Knitted or crocheted fabrics nes 43 710 1.2 0.32 0.21Remainder 81 523 702 63.6 Remainder 407 663 11.4
All commodity groups 6 770 863 100.0 0.16 0.06 All commodity groups 3 008 518 100.0 0.07 0.03333 Crude petroleum & bituminous oil 4 352 437 64.3 0.71 0.52 333 Crude petroleum & bituminous oil 1 310 658 43.6 0.21 0.16343 Natural gas, liquefied or not 2 068 944 30.6 3.44 1.17 334 Heavy petroleum & bituminous oil 396 653 13.2 0.21 0.10845 Articles of apparel nes 94 449 1.4 0.14 0.09 072 Cocoa 252 870 8.4 4.27 2.82844 Female clothing, knitted crocheted 36 452 0.5 0.17 0.13 248 Wood simply worked, railway sleeper 229 037 7.6 2.98 0.62793 Ships boats floating structures 36 109 0.5 0.10 0.05 684 Aluminium 142 549 4.7 0.67 0.16792 Aircraft, spacecraft & equipment 19 328 0.3 0.16 0.01 263 Cotton 118 169 3.9 2.94 1.07731 Machine tools for material removal 16 705 0.2 0.32 0.06 057 Fruit nut (exc oil), fresh or dried 67 444 2.2 0.33 0.14843 Male clothing, knitted crocheted 13 594 0.2 0.11 0.09 071 Coffee and coffee substitutes 64 586 2.1 0.59 0.38695 Tools for use in hand or in machine 13 491 0.2 0.15 0.04 231 Natural rubber, latex, gum, etc 54 865 1.8 0.45 0.44728 Special industrial machine part nes 10 979 0.2 0.06 0.01 247 Wood in rough or roughly squared 42 850 1.4 1.56 0.39Remainder 108 375 1.6 Remainder 328 837 10.9
All commodity groups 13 420 469 100.0 0.20 0.12 All commodity groups 374 283 349 100.0 5.66 3.37334 Heavy petroleum & bituminous oil 1 602 644 11.9 0.92 0.38 781 Passenger cars and race cars 37 556 693 10.0 8.50 7.39682 Copper 1 436 379 10.7 3.71 1.65 333 Crude petroleum & bituminous oil 29 121 583 7.8 25.56 3.47673 Flat iron non-alloy steel products 572 289 4.3 1.49 0.83 343 Natural gas, liquefied or not 27 095 047 7.2 35.72 15.36842 Female clothing, woven 487 700 3.6 2.16 0.72 784 Motor vehicle parts and accessories 13 677 802 3.7 6.90 5.57841 Male clothing, woven 468 615 3.5 2.58 0.87 641 Paper and paperboard 10 687 705 2.9 12.60 10.74845 Articles of apparel nes 431 946 3.2 1.36 0.43 334 Heavy petroleum & bituminous oil 10 223 111 2.7 5.85 2.46844 Female clothing, knitted crocheted 266 181 2.0 3.70 0.94 782 Goods and service vehicles 9 644 146 2.6 13.40 10.18851 Footwear 253 465 1.9 0.87 0.37 248 Wood simply worked, railway sleeper 8 780 581 2.3 33.52 23.82793 Ships boats floating structures 215 932 1.6 0.52 0.27 792 Aircraft, spacecraft & equipment 8 403 769 2.2 6.36 5.77821 Furniture part; bedding furnishing 207 977 1.5 0.32 0.20 684 Aluminium 7 869 815 2.1 13.48 8.97Remainder 7 477 341 55.7 Remainder 211 223 096 56.4
All commodity groups 433 528 100.0 0.01 0.00 All commodity groups 99 853 100.0 0.00 0.00263 Cotton 253 269 58.4 6.29 2.30 334 Heavy petroleum & bituminous oil 47 198 47.3 0.02 0.01057 Fruit nut (exc oil), fresh or dried 63 255 14.6 0.30 0.13 786 Trailer caravan transport container 12 894 12.9 0.14 0.05222 Oil seed etc for soft oil 14 328 3.3 0.14 0.06 034 Fish, fresh live chilled frozen 10 823 10.8 0.08 0.03054 Vegetable & vegetable products nes 7 316 1.7 0.06 0.02 793 Ships boats floating structures 3 962 4.0 0.01 0.00122 Manufactured tabacco 5 830 1.3 0.14 0.03 851 Footwear 2 897 2.9 0.01 0.00611 Leather 4 919 1.1 0.04 0.02 841 Male clothing, woven 2 549 2.6 0.01 0.00022 Milk products, excl. butter & cheese 4 610 1.1 0.16 0.02 874 Measure analyze control device nes 2 325 2.3 0.01 0.00061 Sugar, mollasses and honey 4 316 1.0 0.04 0.02 713 Internal combustion engine part nes 2 142 2.1 0.01 0.00001 Live animal excl. fish & crustacean 3 956 0.9 0.16 0.03 843 Male clothing, knitted crocheted 1 538 1.5 0.01 0.01971 Gold non-monetary excluding ores 3 954 0.9 0.02 0.01 716 Rotating electric plant parts nes 990 1.0 0.01 0.00Remainder 67 774 15.6 Remainder 12 536 12.6
For sources and notes, see end of table. Pour les sources et les notes, se reporter à la fin du tableau.
Leading products exported basedon average 2005-2006 valuesSITC Revision 3 (3-digit level)
Principaux produits exportés d'aprèsla moyenne des valeurs de 2005-2006CTCI révision 3 (positions à 3 chiffres)
2005-2006
Leading products exported basedon average 2005-2006 valuesSITC Revision 3 (3-digit level)
Principaux produits exportés d'aprèsla moyenne des valeurs de 2005-2006CTCI révision 3 (positions à 3 chiffres)
2005-2006
Value(f.o.b., thousands
of dollars)
Valeur(f.a.b., milliers
de dollars)
As percentageEn pourcentage Value
(f.o.b., thousandsof dollars)
Valeur(f.a.b., milliers
de dollars)
As percentageEn pourcentage
Canada (**=Developed)
Cape Verde - Cap-Vert (**=Developing)Burkina Faso (**=Developing)
Bulgaria - Bulgarie (**=Developed)
Burundi (**=Developing)
Cambodia - Cambodge (**=Developing)
Cameroon - Cameroun (**=Developing)
Botswana (**=Developing)
Brazil - Brésil (**=Developing)
Brunei Darussalam - Brunéi Darussalam (**=Developing)
3.2.D Export structure by productIndividual countries and territories
3.2.D Structure des exportations par produitsPays et territoires individuels
158
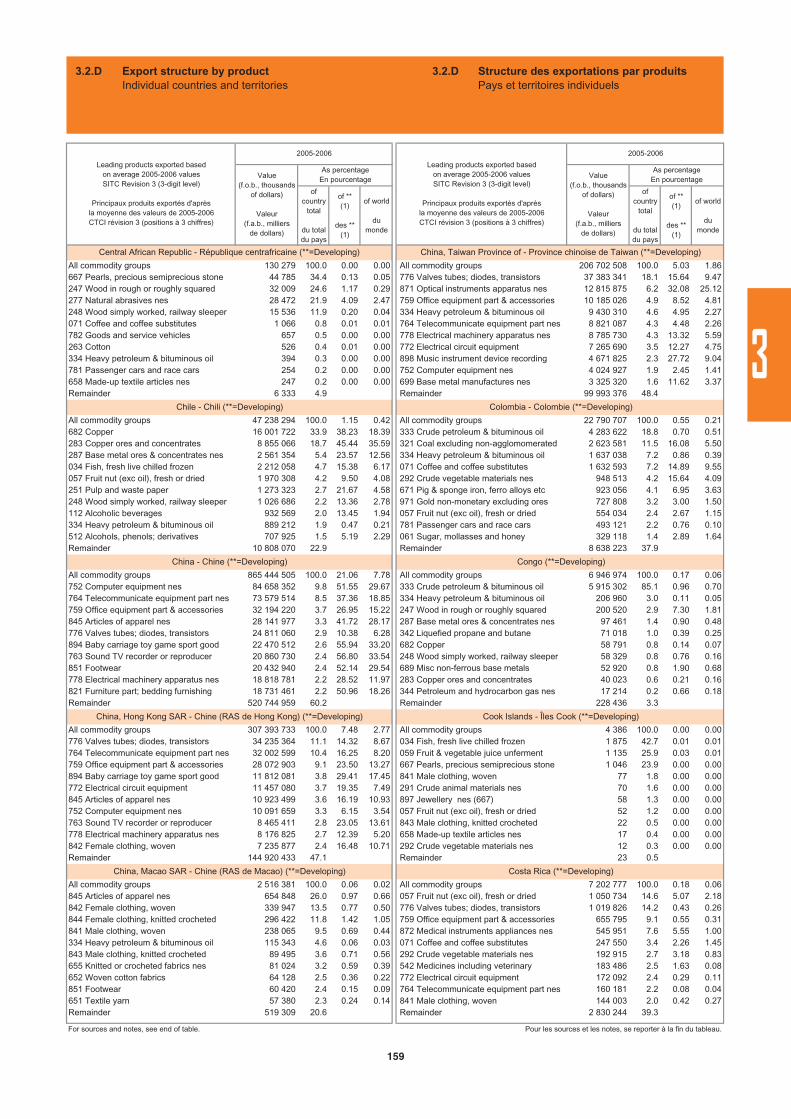
ofcountry
total
du totaldu pays
of ** (1)
des ** (1)
of world
dumonde
ofcountry
total
du totaldu pays
of ** (1)
des ** (1)
of world
dumonde
All commodity groups 130 279 100.0 0.00 0.00 All commodity groups 206 702 508 100.0 5.03 1.86667 Pearls, precious semiprecious stone 44 785 34.4 0.13 0.05 776 Valves tubes; diodes, transistors 37 383 341 18.1 15.64 9.47247 Wood in rough or roughly squared 32 009 24.6 1.17 0.29 871 Optical instruments apparatus nes 12 815 875 6.2 32.08 25.12277 Natural abrasives nes 28 472 21.9 4.09 2.47 759 Office equipment part & accessories 10 185 026 4.9 8.52 4.81248 Wood simply worked, railway sleeper 15 536 11.9 0.20 0.04 334 Heavy petroleum & bituminous oil 9 430 310 4.6 4.95 2.27071 Coffee and coffee substitutes 1 066 0.8 0.01 0.01 764 Telecommunicate equipment part nes 8 821 087 4.3 4.48 2.26782 Goods and service vehicles 657 0.5 0.00 0.00 778 Electrical machinery apparatus nes 8 785 730 4.3 13.32 5.59263 Cotton 526 0.4 0.01 0.00 772 Electrical circuit equipment 7 265 690 3.5 12.27 4.75334 Heavy petroleum & bituminous oil 394 0.3 0.00 0.00 898 Music instrument device recording 4 671 825 2.3 27.72 9.04781 Passenger cars and race cars 254 0.2 0.00 0.00 752 Computer equipment nes 4 024 927 1.9 2.45 1.41658 Made-up textile articles nes 247 0.2 0.00 0.00 699 Base metal manufactures nes 3 325 320 1.6 11.62 3.37Remainder 6 333 4.9 Remainder 99 993 376 48.4
All commodity groups 47 238 294 100.0 1.15 0.42 All commodity groups 22 790 707 100.0 0.55 0.21682 Copper 16 001 722 33.9 38.23 18.39 333 Crude petroleum & bituminous oil 4 283 622 18.8 0.70 0.51283 Copper ores and concentrates 8 855 066 18.7 45.44 35.59 321 Coal excluding non-agglomomerated 2 623 581 11.5 16.08 5.50287 Base metal ores & concentrates nes 2 561 354 5.4 23.57 12.56 334 Heavy petroleum & bituminous oil 1 637 038 7.2 0.86 0.39034 Fish, fresh live chilled frozen 2 212 058 4.7 15.38 6.17 071 Coffee and coffee substitutes 1 632 593 7.2 14.89 9.55057 Fruit nut (exc oil), fresh or dried 1 970 308 4.2 9.50 4.08 292 Crude vegetable materials nes 948 513 4.2 15.64 4.09251 Pulp and waste paper 1 273 323 2.7 21.67 4.58 671 Pig & sponge iron, ferro alloys etc 923 056 4.1 6.95 3.63248 Wood simply worked, railway sleeper 1 026 686 2.2 13.36 2.78 971 Gold non-monetary excluding ores 727 808 3.2 3.00 1.50112 Alcoholic beverages 932 569 2.0 13.45 1.94 057 Fruit nut (exc oil), fresh or dried 554 034 2.4 2.67 1.15334 Heavy petroleum & bituminous oil 889 212 1.9 0.47 0.21 781 Passenger cars and race cars 493 121 2.2 0.76 0.10512 Alcohols, phenols; derivatives 707 925 1.5 5.19 2.29 061 Sugar, mollasses and honey 329 118 1.4 2.89 1.64Remainder 10 808 070 22.9 Remainder 8 638 223 37.9
All commodity groups 865 444 505 100.0 21.06 7.78 All commodity groups 6 946 974 100.0 0.17 0.06752 Computer equipment nes 84 658 352 9.8 51.55 29.67 333 Crude petroleum & bituminous oil 5 915 302 85.1 0.96 0.70764 Telecommunicate equipment part nes 73 579 514 8.5 37.36 18.85 334 Heavy petroleum & bituminous oil 206 960 3.0 0.11 0.05759 Office equipment part & accessories 32 194 220 3.7 26.95 15.22 247 Wood in rough or roughly squared 200 520 2.9 7.30 1.81845 Articles of apparel nes 28 141 977 3.3 41.72 28.17 287 Base metal ores & concentrates nes 97 461 1.4 0.90 0.48776 Valves tubes; diodes, transistors 24 811 060 2.9 10.38 6.28 342 Liquefied propane and butane 71 018 1.0 0.39 0.25894 Baby carriage toy game sport good 22 470 512 2.6 55.94 33.20 682 Copper 58 791 0.8 0.14 0.07763 Sound TV recorder or reproducer 20 860 730 2.4 56.80 33.54 248 Wood simply worked, railway sleeper 58 329 0.8 0.76 0.16851 Footwear 20 432 940 2.4 52.14 29.54 689 Misc non-ferrous base metals 52 920 0.8 1.90 0.68778 Electrical machinery apparatus nes 18 818 781 2.2 28.52 11.97 283 Copper ores and concentrates 40 023 0.6 0.21 0.16821 Furniture part; bedding furnishing 18 731 461 2.2 50.96 18.26 344 Petroleum and hydrocarbon gas nes 17 214 0.2 0.66 0.18Remainder 520 744 959 60.2 Remainder 228 436 3.3
All commodity groups 307 393 733 100.0 7.48 2.77 All commodity groups 4 386 100.0 0.00 0.00776 Valves tubes; diodes, transistors 34 235 364 11.1 14.32 8.67 034 Fish, fresh live chilled frozen 1 875 42.7 0.01 0.01764 Telecommunicate equipment part nes 32 002 599 10.4 16.25 8.20 059 Fruit & vegetable juice unferment 1 135 25.9 0.03 0.01759 Office equipment part & accessories 28 072 903 9.1 23.50 13.27 667 Pearls, precious semiprecious stone 1 046 23.9 0.00 0.00894 Baby carriage toy game sport good 11 812 081 3.8 29.41 17.45 841 Male clothing, woven 77 1.8 0.00 0.00772 Electrical circuit equipment 11 457 080 3.7 19.35 7.49 291 Crude animal materials nes 70 1.6 0.00 0.00845 Articles of apparel nes 10 923 499 3.6 16.19 10.93 897 Jewellery nes (667) 58 1.3 0.00 0.00752 Computer equipment nes 10 091 659 3.3 6.15 3.54 057 Fruit nut (exc oil), fresh or dried 52 1.2 0.00 0.00763 Sound TV recorder or reproducer 8 465 411 2.8 23.05 13.61 843 Male clothing, knitted crocheted 22 0.5 0.00 0.00778 Electrical machinery apparatus nes 8 176 825 2.7 12.39 5.20 658 Made-up textile articles nes 17 0.4 0.00 0.00842 Female clothing, woven 7 235 877 2.4 16.48 10.71 292 Crude vegetable materials nes 12 0.3 0.00 0.00Remainder 144 920 433 47.1 Remainder 23 0.5
All commodity groups 2 516 381 100.0 0.06 0.02 All commodity groups 7 202 777 100.0 0.18 0.06845 Articles of apparel nes 654 848 26.0 0.97 0.66 057 Fruit nut (exc oil), fresh or dried 1 050 734 14.6 5.07 2.18842 Female clothing, woven 339 947 13.5 0.77 0.50 776 Valves tubes; diodes, transistors 1 019 826 14.2 0.43 0.26844 Female clothing, knitted crocheted 296 422 11.8 1.42 1.05 759 Office equipment part & accessories 655 795 9.1 0.55 0.31841 Male clothing, woven 238 065 9.5 0.69 0.44 872 Medical instruments appliances nes 545 951 7.6 5.55 1.00334 Heavy petroleum & bituminous oil 115 343 4.6 0.06 0.03 071 Coffee and coffee substitutes 247 550 3.4 2.26 1.45843 Male clothing, knitted crocheted 89 495 3.6 0.71 0.56 292 Crude vegetable materials nes 192 915 2.7 3.18 0.83655 Knitted or crocheted fabrics nes 81 024 3.2 0.59 0.39 542 Medicines including veterinary 183 486 2.5 1.63 0.08652 Woven cotton fabrics 64 128 2.5 0.36 0.22 772 Electrical circuit equipment 172 092 2.4 0.29 0.11851 Footwear 60 420 2.4 0.15 0.09 764 Telecommunicate equipment part nes 160 181 2.2 0.08 0.04651 Textile yarn 57 380 2.3 0.24 0.14 841 Male clothing, woven 144 003 2.0 0.42 0.27Remainder 519 309 20.6 Remainder 2 830 244 39.3
For sources and notes, see end of table. Pour les sources et les notes, se reporter à la fin du tableau.
Leading products exported basedon average 2005-2006 valuesSITC Revision 3 (3-digit level)
Principaux produits exportés d'aprèsla moyenne des valeurs de 2005-2006CTCI révision 3 (positions à 3 chiffres)
2005-2006
Value(f.o.b., thousands
of dollars)
Valeur(f.a.b., milliers
de dollars)
As percentageEn pourcentage Value
(f.o.b., thousandsof dollars)
Valeur(f.a.b., milliers
de dollars)
As percentageEn pourcentage
China - Chine (**=Developing)
China, Hong Kong SAR - Chine (RAS de Hong Kong) (**=Developing)
China, Macao SAR - Chine (RAS de Macao) (**=Developing)
China, Taiwan Province of - Province chinoise de Taiwan (**=Developing)
Colombia - Colombie (**=Developing)
Congo (**=Developing)
Cook Islands - Îles Cook (**=Developing)
Costa Rica (**=Developing)
Central African Republic - République centrafricaine (**=Developing)
Chile - Chili (**=Developing)
Leading products exported basedon average 2005-2006 valuesSITC Revision 3 (3-digit level)
Principaux produits exportés d'aprèsla moyenne des valeurs de 2005-2006CTCI révision 3 (positions à 3 chiffres)
2005-2006
3.2.D Export structure by productIndividual countries and territories
3.2.D Structure des exportations par produitsPays et territoires individuels
3
159
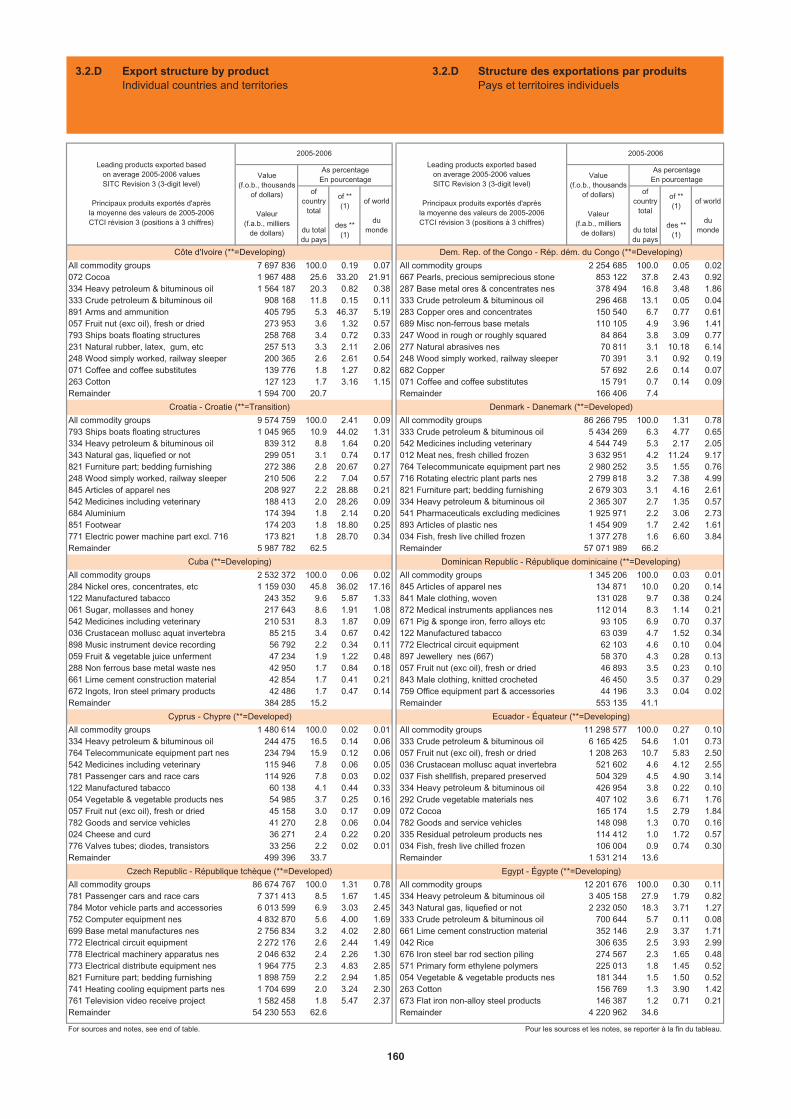
ofcountry
total
du totaldu pays
of ** (1)
des ** (1)
of world
dumonde
ofcountry
total
du totaldu pays
of ** (1)
des ** (1)
of world
dumonde
All commodity groups 7 697 836 100.0 0.19 0.07 All commodity groups 2 254 685 100.0 0.05 0.02072 Cocoa 1 967 488 25.6 33.20 21.91 667 Pearls, precious semiprecious stone 853 122 37.8 2.43 0.92334 Heavy petroleum & bituminous oil 1 564 187 20.3 0.82 0.38 287 Base metal ores & concentrates nes 378 494 16.8 3.48 1.86333 Crude petroleum & bituminous oil 908 168 11.8 0.15 0.11 333 Crude petroleum & bituminous oil 296 468 13.1 0.05 0.04891 Arms and ammunition 405 795 5.3 46.37 5.19 283 Copper ores and concentrates 150 540 6.7 0.77 0.61057 Fruit nut (exc oil), fresh or dried 273 953 3.6 1.32 0.57 689 Misc non-ferrous base metals 110 105 4.9 3.96 1.41793 Ships boats floating structures 258 768 3.4 0.72 0.33 247 Wood in rough or roughly squared 84 864 3.8 3.09 0.77231 Natural rubber, latex, gum, etc 257 513 3.3 2.11 2.06 277 Natural abrasives nes 70 811 3.1 10.18 6.14248 Wood simply worked, railway sleeper 200 365 2.6 2.61 0.54 248 Wood simply worked, railway sleeper 70 391 3.1 0.92 0.19071 Coffee and coffee substitutes 139 776 1.8 1.27 0.82 682 Copper 57 692 2.6 0.14 0.07263 Cotton 127 123 1.7 3.16 1.15 071 Coffee and coffee substitutes 15 791 0.7 0.14 0.09Remainder 1 594 700 20.7 Remainder 166 406 7.4
All commodity groups 9 574 759 100.0 2.41 0.09 All commodity groups 86 266 795 100.0 1.31 0.78793 Ships boats floating structures 1 045 965 10.9 44.02 1.31 333 Crude petroleum & bituminous oil 5 434 269 6.3 4.77 0.65334 Heavy petroleum & bituminous oil 839 312 8.8 1.64 0.20 542 Medicines including veterinary 4 544 749 5.3 2.17 2.05343 Natural gas, liquefied or not 299 051 3.1 0.74 0.17 012 Meat nes, fresh chilled frozen 3 632 951 4.2 11.24 9.17821 Furniture part; bedding furnishing 272 386 2.8 20.67 0.27 764 Telecommunicate equipment part nes 2 980 252 3.5 1.55 0.76248 Wood simply worked, railway sleeper 210 506 2.2 7.04 0.57 716 Rotating electric plant parts nes 2 799 818 3.2 7.38 4.99845 Articles of apparel nes 208 927 2.2 28.88 0.21 821 Furniture part; bedding furnishing 2 679 303 3.1 4.16 2.61542 Medicines including veterinary 188 413 2.0 28.26 0.09 334 Heavy petroleum & bituminous oil 2 365 307 2.7 1.35 0.57684 Aluminium 174 394 1.8 2.14 0.20 541 Pharmaceuticals excluding medicines 1 925 971 2.2 3.06 2.73851 Footwear 174 203 1.8 18.80 0.25 893 Articles of plastic nes 1 454 909 1.7 2.42 1.61771 Electric power machine part excl. 716 173 821 1.8 28.70 0.34 034 Fish, fresh live chilled frozen 1 377 278 1.6 6.60 3.84Remainder 5 987 782 62.5 Remainder 57 071 989 66.2
All commodity groups 2 532 372 100.0 0.06 0.02 All commodity groups 1 345 206 100.0 0.03 0.01284 Nickel ores, concentrates, etc 1 159 030 45.8 36.02 17.16 845 Articles of apparel nes 134 871 10.0 0.20 0.14122 Manufactured tabacco 243 352 9.6 5.87 1.33 841 Male clothing, woven 131 028 9.7 0.38 0.24061 Sugar, mollasses and honey 217 643 8.6 1.91 1.08 872 Medical instruments appliances nes 112 014 8.3 1.14 0.21542 Medicines including veterinary 210 531 8.3 1.87 0.09 671 Pig & sponge iron, ferro alloys etc 93 105 6.9 0.70 0.37036 Crustacean mollusc aquat invertebra 85 215 3.4 0.67 0.42 122 Manufactured tabacco 63 039 4.7 1.52 0.34898 Music instrument device recording 56 792 2.2 0.34 0.11 772 Electrical circuit equipment 62 103 4.6 0.10 0.04059 Fruit & vegetable juice unferment 47 234 1.9 1.22 0.48 897 Jewellery nes (667) 58 370 4.3 0.28 0.13288 Non ferrous base metal waste nes 42 950 1.7 0.84 0.18 057 Fruit nut (exc oil), fresh or dried 46 893 3.5 0.23 0.10661 Lime cement construction material 42 854 1.7 0.41 0.21 843 Male clothing, knitted crocheted 46 450 3.5 0.37 0.29672 Ingots, Iron steel primary products 42 486 1.7 0.47 0.14 759 Office equipment part & accessories 44 196 3.3 0.04 0.02Remainder 384 285 15.2 Remainder 553 135 41.1
All commodity groups 1 480 614 100.0 0.02 0.01 All commodity groups 11 298 577 100.0 0.27 0.10334 Heavy petroleum & bituminous oil 244 475 16.5 0.14 0.06 333 Crude petroleum & bituminous oil 6 165 425 54.6 1.01 0.73764 Telecommunicate equipment part nes 234 794 15.9 0.12 0.06 057 Fruit nut (exc oil), fresh or dried 1 208 263 10.7 5.83 2.50542 Medicines including veterinary 115 946 7.8 0.06 0.05 036 Crustacean mollusc aquat invertebra 521 602 4.6 4.12 2.55781 Passenger cars and race cars 114 926 7.8 0.03 0.02 037 Fish shellfish, prepared preserved 504 329 4.5 4.90 3.14122 Manufactured tabacco 60 138 4.1 0.44 0.33 334 Heavy petroleum & bituminous oil 426 954 3.8 0.22 0.10054 Vegetable & vegetable products nes 54 985 3.7 0.25 0.16 292 Crude vegetable materials nes 407 102 3.6 6.71 1.76057 Fruit nut (exc oil), fresh or dried 45 158 3.0 0.17 0.09 072 Cocoa 165 174 1.5 2.79 1.84782 Goods and service vehicles 41 270 2.8 0.06 0.04 782 Goods and service vehicles 148 098 1.3 0.70 0.16024 Cheese and curd 36 271 2.4 0.22 0.20 335 Residual petroleum products nes 114 412 1.0 1.72 0.57776 Valves tubes; diodes, transistors 33 256 2.2 0.02 0.01 034 Fish, fresh live chilled frozen 106 004 0.9 0.74 0.30Remainder 499 396 33.7 Remainder 1 531 214 13.6
All commodity groups 86 674 767 100.0 1.31 0.78 All commodity groups 12 201 676 100.0 0.30 0.11781 Passenger cars and race cars 7 371 413 8.5 1.67 1.45 334 Heavy petroleum & bituminous oil 3 405 158 27.9 1.79 0.82784 Motor vehicle parts and accessories 6 013 599 6.9 3.03 2.45 343 Natural gas, liquefied or not 2 232 050 18.3 3.71 1.27752 Computer equipment nes 4 832 870 5.6 4.00 1.69 333 Crude petroleum & bituminous oil 700 644 5.7 0.11 0.08699 Base metal manufactures nes 2 756 834 3.2 4.02 2.80 661 Lime cement construction material 352 146 2.9 3.37 1.71772 Electrical circuit equipment 2 272 176 2.6 2.44 1.49 042 Rice 306 635 2.5 3.93 2.99778 Electrical machinery apparatus nes 2 046 632 2.4 2.26 1.30 676 Iron steel bar rod section piling 274 567 2.3 1.65 0.48773 Electrical distribute equipment nes 1 964 775 2.3 4.83 2.85 571 Primary form ethylene polymers 225 013 1.8 1.45 0.52821 Furniture part; bedding furnishing 1 898 759 2.2 2.94 1.85 054 Vegetable & vegetable products nes 181 344 1.5 1.50 0.52741 Heating cooling equipment parts nes 1 704 699 2.0 3.24 2.30 263 Cotton 156 769 1.3 3.90 1.42761 Television video receive project 1 582 458 1.8 5.47 2.37 673 Flat iron non-alloy steel products 146 387 1.2 0.71 0.21Remainder 54 230 553 62.6 Remainder 4 220 962 34.6
For sources and notes, see end of table. Pour les sources et les notes, se reporter à la fin du tableau.
Leading products exported basedon average 2005-2006 valuesSITC Revision 3 (3-digit level)
Principaux produits exportés d'aprèsla moyenne des valeurs de 2005-2006CTCI révision 3 (positions à 3 chiffres)
2005-2006
Leading products exported basedon average 2005-2006 valuesSITC Revision 3 (3-digit level)
Principaux produits exportés d'aprèsla moyenne des valeurs de 2005-2006CTCI révision 3 (positions à 3 chiffres)
2005-2006
Value(f.o.b., thousands
of dollars)
Valeur(f.a.b., milliers
de dollars)
As percentageEn pourcentage Value
(f.o.b., thousandsof dollars)
Valeur(f.a.b., milliers
de dollars)
As percentageEn pourcentage
Ecuador - Équateur (**=Developing)
Egypt - Égypte (**=Developing)Czech Republic - République tchèque (**=Developed)
Cyprus - Chypre (**=Developed)
Dem. Rep. of the Congo - Rép. dém. du Congo (**=Developing)
Denmark - Danemark (**=Developed)
Dominican Republic - République dominicaine (**=Developing)
Côte d'Ivoire (**=Developing)
Croatia - Croatie (**=Transition)
Cuba (**=Developing)
3.2.D Export structure by productIndividual countries and territories
3.2.D Structure des exportations par produitsPays et territoires individuels
160
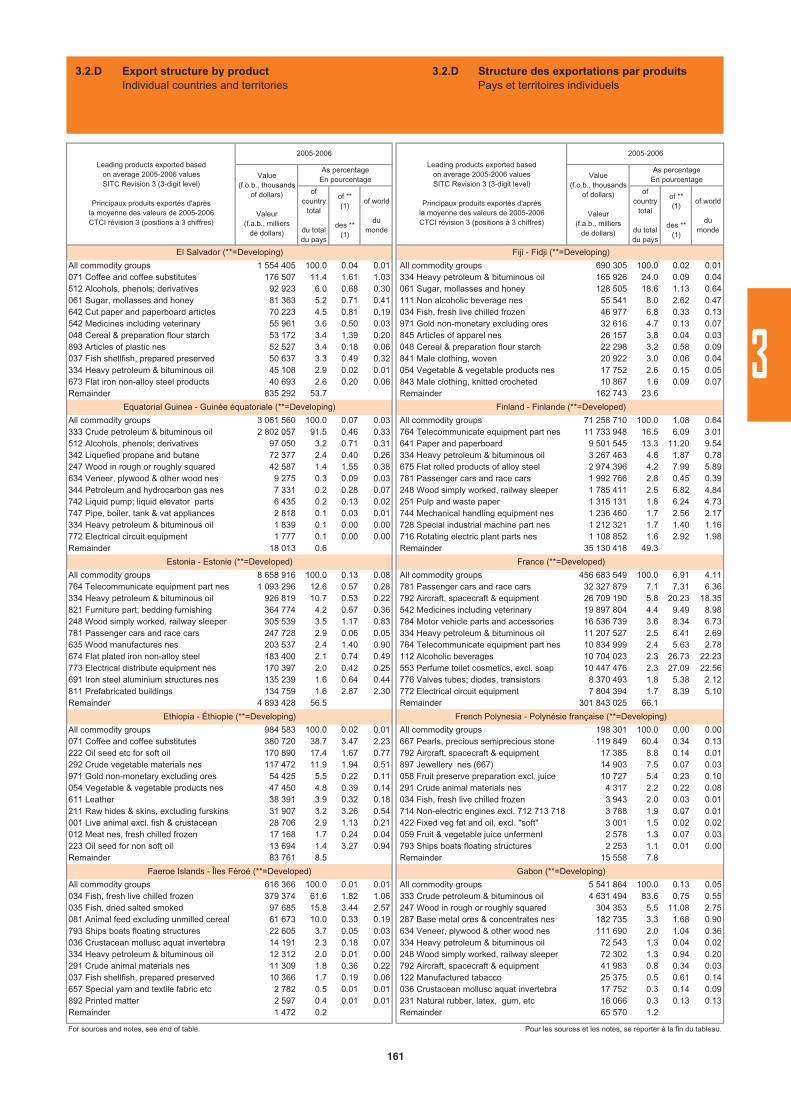
ofcountry
total
du totaldu pays
of ** (1)
des ** (1)
of world
dumonde
ofcountry
total
du totaldu pays
of ** (1)
des ** (1)
of world
dumonde
All commodity groups 1 554 405 100.0 0.04 0.01 All commodity groups 690 305 100.0 0.02 0.01071 Coffee and coffee substitutes 176 507 11.4 1.61 1.03 334 Heavy petroleum & bituminous oil 165 926 24.0 0.09 0.04512 Alcohols, phenols; derivatives 92 923 6.0 0.68 0.30 061 Sugar, mollasses and honey 128 505 18.6 1.13 0.64061 Sugar, mollasses and honey 81 363 5.2 0.71 0.41 111 Non alcoholic beverage nes 55 541 8.0 2.62 0.47642 Cut paper and paperboard articles 70 223 4.5 0.81 0.19 034 Fish, fresh live chilled frozen 46 977 6.8 0.33 0.13542 Medicines including veterinary 55 961 3.6 0.50 0.03 971 Gold non-monetary excluding ores 32 616 4.7 0.13 0.07048 Cereal & preparation flour starch 53 172 3.4 1.39 0.20 845 Articles of apparel nes 26 157 3.8 0.04 0.03893 Articles of plastic nes 52 527 3.4 0.18 0.06 048 Cereal & preparation flour starch 22 298 3.2 0.58 0.09037 Fish shellfish, prepared preserved 50 637 3.3 0.49 0.32 841 Male clothing, woven 20 922 3.0 0.06 0.04334 Heavy petroleum & bituminous oil 45 108 2.9 0.02 0.01 054 Vegetable & vegetable products nes 17 752 2.6 0.15 0.05673 Flat iron non-alloy steel products 40 693 2.6 0.20 0.06 843 Male clothing, knitted crocheted 10 867 1.6 0.09 0.07Remainder 835 292 53.7 Remainder 162 743 23.6
All commodity groups 3 061 560 100.0 0.07 0.03 All commodity groups 71 258 710 100.0 1.08 0.64333 Crude petroleum & bituminous oil 2 802 057 91.5 0.46 0.33 764 Telecommunicate equipment part nes 11 733 948 16.5 6.09 3.01512 Alcohols, phenols; derivatives 97 050 3.2 0.71 0.31 641 Paper and paperboard 9 501 545 13.3 11.20 9.54342 Liquefied propane and butane 72 377 2.4 0.40 0.26 334 Heavy petroleum & bituminous oil 3 267 463 4.6 1.87 0.78247 Wood in rough or roughly squared 42 587 1.4 1.55 0.38 675 Flat rolled products of alloy steel 2 974 396 4.2 7.99 5.89634 Veneer, plywood & other wood nes 9 275 0.3 0.09 0.03 781 Passenger cars and race cars 1 992 766 2.8 0.45 0.39344 Petroleum and hydrocarbon gas nes 7 331 0.2 0.28 0.07 248 Wood simply worked, railway sleeper 1 785 411 2.5 6.82 4.84742 Liquid pump; liquid elevator parts 6 435 0.2 0.13 0.02 251 Pulp and waste paper 1 315 131 1.8 6.24 4.73747 Pipe, boiler, tank & vat appliances 2 818 0.1 0.03 0.01 744 Mechanical handling equipment nes 1 236 460 1.7 2.56 2.17334 Heavy petroleum & bituminous oil 1 839 0.1 0.00 0.00 728 Special industrial machine part nes 1 212 321 1.7 1.40 1.16772 Electrical circuit equipment 1 777 0.1 0.00 0.00 716 Rotating electric plant parts nes 1 108 852 1.6 2.92 1.98Remainder 18 013 0.6 Remainder 35 130 418 49.3
All commodity groups 8 658 916 100.0 0.13 0.08 All commodity groups 456 683 549 100.0 6.91 4.11764 Telecommunicate equipment part nes 1 093 296 12.6 0.57 0.28 781 Passenger cars and race cars 32 327 879 7.1 7.31 6.36334 Heavy petroleum & bituminous oil 926 819 10.7 0.53 0.22 792 Aircraft, spacecraft & equipment 26 709 190 5.8 20.23 18.35821 Furniture part; bedding furnishing 364 774 4.2 0.57 0.36 542 Medicines including veterinary 19 897 804 4.4 9.49 8.98248 Wood simply worked, railway sleeper 305 539 3.5 1.17 0.83 784 Motor vehicle parts and accessories 16 536 739 3.6 8.34 6.73781 Passenger cars and race cars 247 728 2.9 0.06 0.05 334 Heavy petroleum & bituminous oil 11 207 527 2.5 6.41 2.69635 Wood manufactures nes 203 537 2.4 1.40 0.90 764 Telecommunicate equipment part nes 10 834 999 2.4 5.63 2.78674 Flat plated iron non-alloy steel 183 400 2.1 0.74 0.49 112 Alcoholic beverages 10 704 023 2.3 26.73 22.23773 Electrical distribute equipment nes 170 397 2.0 0.42 0.25 553 Perfume toilet cosmetics, excl. soap 10 447 476 2.3 27.09 22.56691 Iron steel aluminium structures nes 135 239 1.6 0.64 0.44 776 Valves tubes; diodes, transistors 8 370 493 1.8 5.38 2.12811 Prefabricated buildings 134 759 1.6 2.87 2.30 772 Electrical circuit equipment 7 804 394 1.7 8.39 5.10Remainder 4 893 428 56.5 Remainder 301 843 025 66.1
All commodity groups 984 583 100.0 0.02 0.01 All commodity groups 198 301 100.0 0.00 0.00071 Coffee and coffee substitutes 380 720 38.7 3.47 2.23 667 Pearls, precious semiprecious stone 119 849 60.4 0.34 0.13222 Oil seed etc for soft oil 170 890 17.4 1.67 0.77 792 Aircraft, spacecraft & equipment 17 385 8.8 0.14 0.01292 Crude vegetable materials nes 117 472 11.9 1.94 0.51 897 Jewellery nes (667) 14 903 7.5 0.07 0.03971 Gold non-monetary excluding ores 54 425 5.5 0.22 0.11 058 Fruit preserve preparation excl. juice 10 727 5.4 0.23 0.10054 Vegetable & vegetable products nes 47 450 4.8 0.39 0.14 291 Crude animal materials nes 4 317 2.2 0.22 0.08611 Leather 38 391 3.9 0.32 0.18 034 Fish, fresh live chilled frozen 3 943 2.0 0.03 0.01211 Raw hides & skins, excluding furskins 31 907 3.2 3.26 0.54 714 Non-electric engines excl. 712 713 718 3 788 1.9 0.07 0.01001 Live animal excl. fish & crustacean 28 706 2.9 1.13 0.21 422 Fixed veg fat and oil, excl. "soft" 3 001 1.5 0.02 0.02012 Meat nes, fresh chilled frozen 17 168 1.7 0.24 0.04 059 Fruit & vegetable juice unferment 2 578 1.3 0.07 0.03223 Oil seed for non soft oil 13 694 1.4 3.27 0.94 793 Ships boats floating structures 2 253 1.1 0.01 0.00Remainder 83 761 8.5 Remainder 15 558 7.8
All commodity groups 616 366 100.0 0.01 0.01 All commodity groups 5 541 864 100.0 0.13 0.05034 Fish, fresh live chilled frozen 379 374 61.6 1.82 1.06 333 Crude petroleum & bituminous oil 4 631 494 83.6 0.75 0.55035 Fish, dried salted smoked 97 685 15.8 3.44 2.57 247 Wood in rough or roughly squared 304 353 5.5 11.08 2.75081 Animal feed excluding unmilled cereal 61 673 10.0 0.33 0.19 287 Base metal ores & concentrates nes 182 735 3.3 1.68 0.90793 Ships boats floating structures 22 605 3.7 0.05 0.03 634 Veneer, plywood & other wood nes 111 690 2.0 1.04 0.36036 Crustacean mollusc aquat invertebra 14 191 2.3 0.18 0.07 334 Heavy petroleum & bituminous oil 72 543 1.3 0.04 0.02334 Heavy petroleum & bituminous oil 12 312 2.0 0.01 0.00 248 Wood simply worked, railway sleeper 72 302 1.3 0.94 0.20291 Crude animal materials nes 11 309 1.8 0.36 0.22 792 Aircraft, spacecraft & equipment 41 983 0.8 0.34 0.03037 Fish shellfish, prepared preserved 10 366 1.7 0.19 0.06 122 Manufactured tabacco 25 375 0.5 0.61 0.14657 Special yarn and textile fabric etc 2 782 0.5 0.01 0.01 036 Crustacean mollusc aquat invertebra 17 752 0.3 0.14 0.09892 Printed matter 2 597 0.4 0.01 0.01 231 Natural rubber, latex, gum, etc 16 066 0.3 0.13 0.13Remainder 1 472 0.2 Remainder 65 570 1.2
For sources and notes, see end of table. Pour les sources et les notes, se reporter à la fin du tableau.
Leading products exported basedon average 2005-2006 valuesSITC Revision 3 (3-digit level)
Principaux produits exportés d'aprèsla moyenne des valeurs de 2005-2006CTCI révision 3 (positions à 3 chiffres)
2005-2006
Value(f.o.b., thousands
of dollars)
Valeur(f.a.b., milliers
de dollars)
As percentageEn pourcentage Value
(f.o.b., thousandsof dollars)
Valeur(f.a.b., milliers
de dollars)
As percentageEn pourcentage
Estonia - Estonie (**=Developed)
Ethiopia - Éthiopie (**=Developing)
Faeroe Islands - Îles Féroé (**=Developed)
Fiji - Fidji (**=Developing)
Finland - Finlande (**=Developed)
France (**=Developed)
French Polynesia - Polynésie française (**=Developing)
Gabon (**=Developing)
El Salvador (**=Developing)
Equatorial Guinea - Guinée équatoriale (**=Developing)
Leading products exported basedon average 2005-2006 valuesSITC Revision 3 (3-digit level)
Principaux produits exportés d'aprèsla moyenne des valeurs de 2005-2006CTCI révision 3 (positions à 3 chiffres)
2005-2006
3.2.D Export structure by productIndividual countries and territories
3.2.D Structure des exportations par produitsPays et territoires individuels
3
161
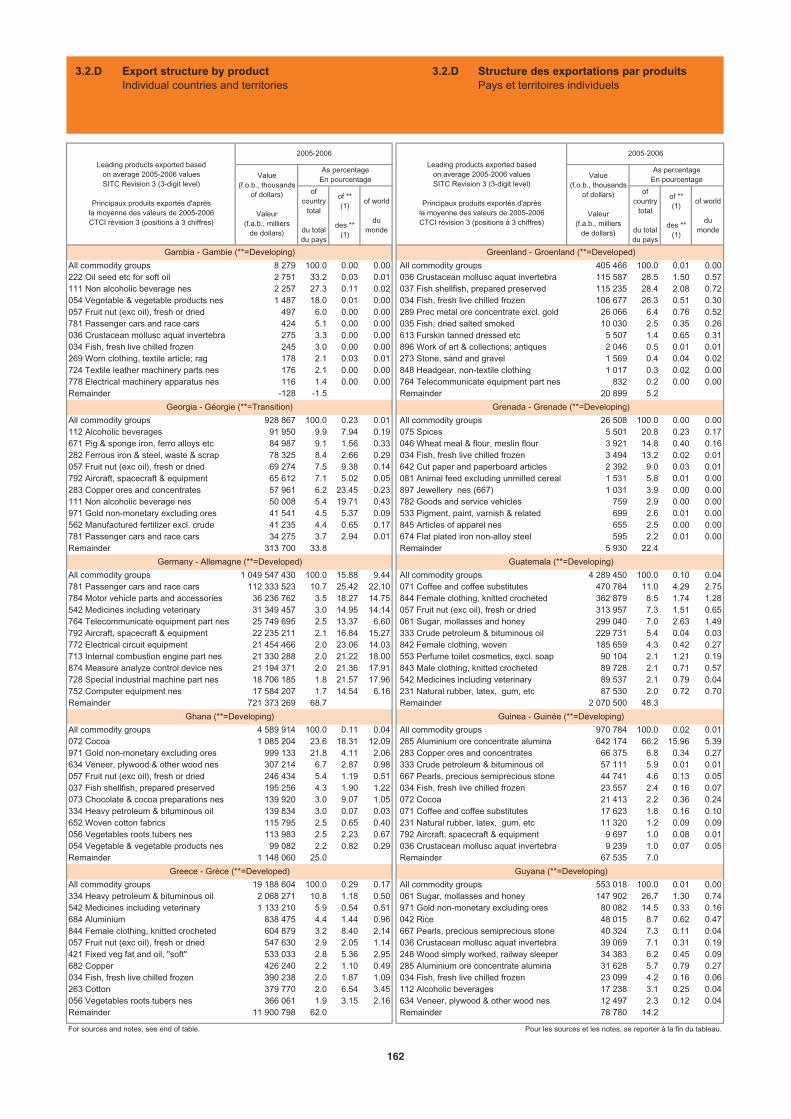
ofcountry
total
du totaldu pays
of ** (1)
des ** (1)
of world
dumonde
ofcountry
total
du totaldu pays
of ** (1)
des ** (1)
of world
dumonde
All commodity groups 8 279 100.0 0.00 0.00 All commodity groups 405 466 100.0 0.01 0.00222 Oil seed etc for soft oil 2 751 33.2 0.03 0.01 036 Crustacean mollusc aquat invertebra 115 587 28.5 1.50 0.57111 Non alcoholic beverage nes 2 257 27.3 0.11 0.02 037 Fish shellfish, prepared preserved 115 235 28.4 2.08 0.72054 Vegetable & vegetable products nes 1 487 18.0 0.01 0.00 034 Fish, fresh live chilled frozen 106 677 26.3 0.51 0.30057 Fruit nut (exc oil), fresh or dried 497 6.0 0.00 0.00 289 Prec metal ore concentrate excl. gold 26 066 6.4 0.76 0.52781 Passenger cars and race cars 424 5.1 0.00 0.00 035 Fish, dried salted smoked 10 030 2.5 0.35 0.26036 Crustacean mollusc aquat invertebra 275 3.3 0.00 0.00 613 Furskin tanned dressed etc 5 507 1.4 0.65 0.31034 Fish, fresh live chilled frozen 245 3.0 0.00 0.00 896 Work of art & collections; antiques 2 046 0.5 0.01 0.01269 Worn clothing, textile article; rag 178 2.1 0.03 0.01 273 Stone, sand and gravel 1 569 0.4 0.04 0.02724 Textile leather machinery parts nes 176 2.1 0.00 0.00 848 Headgear, non-textile clothing 1 017 0.3 0.02 0.00778 Electrical machinery apparatus nes 116 1.4 0.00 0.00 764 Telecommunicate equipment part nes 832 0.2 0.00 0.00Remainder -128 -1.5 Remainder 20 899 5.2
All commodity groups 928 867 100.0 0.23 0.01 All commodity groups 26 508 100.0 0.00 0.00112 Alcoholic beverages 91 950 9.9 7.94 0.19 075 Spices 5 501 20.8 0.23 0.17671 Pig & sponge iron, ferro alloys etc 84 987 9.1 1.56 0.33 046 Wheat meal & flour, meslin flour 3 921 14.8 0.40 0.16282 Ferrous iron & steel, waste & scrap 78 325 8.4 2.66 0.29 034 Fish, fresh live chilled frozen 3 494 13.2 0.02 0.01057 Fruit nut (exc oil), fresh or dried 69 274 7.5 9.38 0.14 642 Cut paper and paperboard articles 2 392 9.0 0.03 0.01792 Aircraft, spacecraft & equipment 65 612 7.1 5.02 0.05 081 Animal feed excluding unmilled cereal 1 531 5.8 0.01 0.00283 Copper ores and concentrates 57 961 6.2 23.45 0.23 897 Jewellery nes (667) 1 031 3.9 0.00 0.00111 Non alcoholic beverage nes 50 008 5.4 19.71 0.43 782 Goods and service vehicles 759 2.9 0.00 0.00971 Gold non-monetary excluding ores 41 541 4.5 5.37 0.09 533 Pigment, paint, varnish & related 699 2.6 0.01 0.00562 Manufactured fertilizer excl. crude 41 235 4.4 0.65 0.17 845 Articles of apparel nes 655 2.5 0.00 0.00781 Passenger cars and race cars 34 275 3.7 2.94 0.01 674 Flat plated iron non-alloy steel 595 2.2 0.01 0.00Remainder 313 700 33.8 Remainder 5 930 22.4
All commodity groups 1 049 547 430 100.0 15.88 9.44 All commodity groups 4 289 450 100.0 0.10 0.04781 Passenger cars and race cars 112 333 523 10.7 25.42 22.10 071 Coffee and coffee substitutes 470 784 11.0 4.29 2.75784 Motor vehicle parts and accessories 36 236 762 3.5 18.27 14.75 844 Female clothing, knitted crocheted 362 879 8.5 1.74 1.28542 Medicines including veterinary 31 349 457 3.0 14.95 14.14 057 Fruit nut (exc oil), fresh or dried 313 957 7.3 1.51 0.65764 Telecommunicate equipment part nes 25 749 695 2.5 13.37 6.60 061 Sugar, mollasses and honey 299 040 7.0 2.63 1.49792 Aircraft, spacecraft & equipment 22 235 211 2.1 16.84 15.27 333 Crude petroleum & bituminous oil 229 731 5.4 0.04 0.03772 Electrical circuit equipment 21 454 466 2.0 23.06 14.03 842 Female clothing, woven 185 659 4.3 0.42 0.27713 Internal combustion engine part nes 21 330 288 2.0 21.22 18.00 553 Perfume toilet cosmetics, excl. soap 90 104 2.1 1.21 0.19874 Measure analyze control device nes 21 194 371 2.0 21.36 17.91 843 Male clothing, knitted crocheted 89 728 2.1 0.71 0.57728 Special industrial machine part nes 18 706 185 1.8 21.57 17.96 542 Medicines including veterinary 89 537 2.1 0.79 0.04752 Computer equipment nes 17 584 207 1.7 14.54 6.16 231 Natural rubber, latex, gum, etc 87 530 2.0 0.72 0.70Remainder 721 373 269 68.7 Remainder 2 070 500 48.3
All commodity groups 4 589 914 100.0 0.11 0.04 All commodity groups 970 784 100.0 0.02 0.01072 Cocoa 1 085 204 23.6 18.31 12.09 285 Aluminium ore concentrate alumina 642 174 66.2 15.96 5.39971 Gold non-monetary excluding ores 999 133 21.8 4.11 2.06 283 Copper ores and concentrates 66 375 6.8 0.34 0.27634 Veneer, plywood & other wood nes 307 214 6.7 2.87 0.98 333 Crude petroleum & bituminous oil 57 111 5.9 0.01 0.01057 Fruit nut (exc oil), fresh or dried 246 434 5.4 1.19 0.51 667 Pearls, precious semiprecious stone 44 741 4.6 0.13 0.05037 Fish shellfish, prepared preserved 195 256 4.3 1.90 1.22 034 Fish, fresh live chilled frozen 23 557 2.4 0.16 0.07073 Chocolate & cocoa preparations nes 139 920 3.0 9.07 1.05 072 Cocoa 21 413 2.2 0.36 0.24334 Heavy petroleum & bituminous oil 139 834 3.0 0.07 0.03 071 Coffee and coffee substitutes 17 623 1.8 0.16 0.10652 Woven cotton fabrics 115 795 2.5 0.65 0.40 231 Natural rubber, latex, gum, etc 11 320 1.2 0.09 0.09056 Vegetables roots tubers nes 113 983 2.5 2.23 0.67 792 Aircraft, spacecraft & equipment 9 697 1.0 0.08 0.01054 Vegetable & vegetable products nes 99 082 2.2 0.82 0.29 036 Crustacean mollusc aquat invertebra 9 239 1.0 0.07 0.05Remainder 1 148 060 25.0 Remainder 67 535 7.0
All commodity groups 19 188 604 100.0 0.29 0.17 All commodity groups 553 018 100.0 0.01 0.00334 Heavy petroleum & bituminous oil 2 068 271 10.8 1.18 0.50 061 Sugar, mollasses and honey 147 902 26.7 1.30 0.74542 Medicines including veterinary 1 133 210 5.9 0.54 0.51 971 Gold non-monetary excluding ores 80 082 14.5 0.33 0.16684 Aluminium 838 475 4.4 1.44 0.96 042 Rice 48 015 8.7 0.62 0.47844 Female clothing, knitted crocheted 604 879 3.2 8.40 2.14 667 Pearls, precious semiprecious stone 40 324 7.3 0.11 0.04057 Fruit nut (exc oil), fresh or dried 547 630 2.9 2.05 1.14 036 Crustacean mollusc aquat invertebra 39 069 7.1 0.31 0.19421 Fixed veg fat and oil, "soft" 533 033 2.8 5.36 2.95 248 Wood simply worked, railway sleeper 34 383 6.2 0.45 0.09682 Copper 426 240 2.2 1.10 0.49 285 Aluminium ore concentrate alumina 31 628 5.7 0.79 0.27034 Fish, fresh live chilled frozen 390 238 2.0 1.87 1.09 034 Fish, fresh live chilled frozen 23 099 4.2 0.16 0.06263 Cotton 379 770 2.0 6.54 3.45 112 Alcoholic beverages 17 238 3.1 0.25 0.04056 Vegetables roots tubers nes 366 061 1.9 3.15 2.16 634 Veneer, plywood & other wood nes 12 497 2.3 0.12 0.04Remainder 11 900 798 62.0 Remainder 78 780 14.2
For sources and notes, see end of table. Pour les sources et les notes, se reporter à la fin du tableau.
Leading products exported basedon average 2005-2006 valuesSITC Revision 3 (3-digit level)
Principaux produits exportés d'aprèsla moyenne des valeurs de 2005-2006CTCI révision 3 (positions à 3 chiffres)
2005-2006
Leading products exported basedon average 2005-2006 valuesSITC Revision 3 (3-digit level)
Principaux produits exportés d'aprèsla moyenne des valeurs de 2005-2006CTCI révision 3 (positions à 3 chiffres)
2005-2006
Value(f.o.b., thousands
of dollars)
Valeur(f.a.b., milliers
de dollars)
As percentageEn pourcentage Value
(f.o.b., thousandsof dollars)
Valeur(f.a.b., milliers
de dollars)
As percentageEn pourcentage
Guinea - Guinée (**=Developing)
Guyana (**=Developing)Greece - Grèce (**=Developed)
Ghana (**=Developing)
Greenland - Groenland (**=Developed)
Grenada - Grenade (**=Developing)
Guatemala (**=Developing)
Gambia - Gambie (**=Developing)
Georgia - Géorgie (**=Transition)
Germany - Allemagne (**=Developed)
3.2.D Export structure by productIndividual countries and territories
3.2.D Structure des exportations par produitsPays et territoires individuels
162
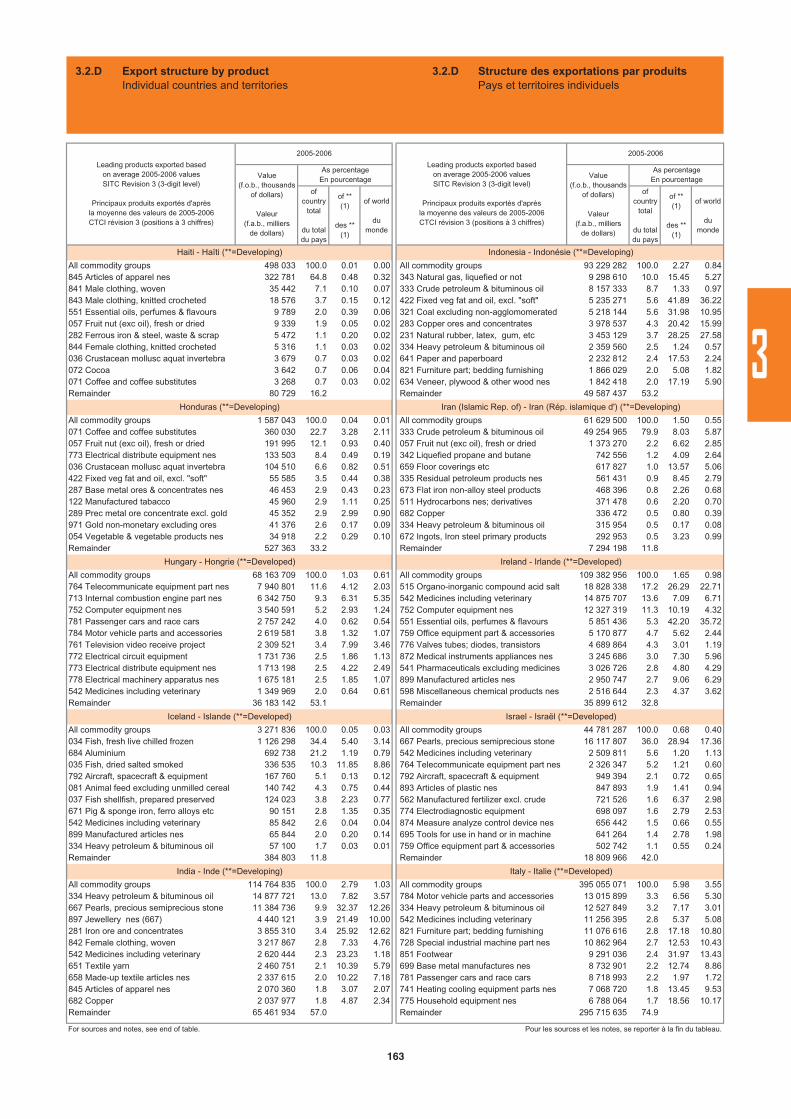
ofcountry
total
du totaldu pays
of ** (1)
des ** (1)
of world
dumonde
ofcountry
total
du totaldu pays
of ** (1)
des ** (1)
of world
dumonde
All commodity groups 498 033 100.0 0.01 0.00 All commodity groups 93 229 282 100.0 2.27 0.84845 Articles of apparel nes 322 781 64.8 0.48 0.32 343 Natural gas, liquefied or not 9 298 610 10.0 15.45 5.27841 Male clothing, woven 35 442 7.1 0.10 0.07 333 Crude petroleum & bituminous oil 8 157 333 8.7 1.33 0.97843 Male clothing, knitted crocheted 18 576 3.7 0.15 0.12 422 Fixed veg fat and oil, excl. "soft" 5 235 271 5.6 41.89 36.22551 Essential oils, perfumes & flavours 9 789 2.0 0.39 0.06 321 Coal excluding non-agglomomerated 5 218 144 5.6 31.98 10.95057 Fruit nut (exc oil), fresh or dried 9 339 1.9 0.05 0.02 283 Copper ores and concentrates 3 978 537 4.3 20.42 15.99282 Ferrous iron & steel, waste & scrap 5 472 1.1 0.20 0.02 231 Natural rubber, latex, gum, etc 3 453 129 3.7 28.25 27.58844 Female clothing, knitted crocheted 5 316 1.1 0.03 0.02 334 Heavy petroleum & bituminous oil 2 359 560 2.5 1.24 0.57036 Crustacean mollusc aquat invertebra 3 679 0.7 0.03 0.02 641 Paper and paperboard 2 232 812 2.4 17.53 2.24072 Cocoa 3 642 0.7 0.06 0.04 821 Furniture part; bedding furnishing 1 866 029 2.0 5.08 1.82071 Coffee and coffee substitutes 3 268 0.7 0.03 0.02 634 Veneer, plywood & other wood nes 1 842 418 2.0 17.19 5.90Remainder 80 729 16.2 Remainder 49 587 437 53.2
All commodity groups 1 587 043 100.0 0.04 0.01 All commodity groups 61 629 500 100.0 1.50 0.55071 Coffee and coffee substitutes 360 030 22.7 3.28 2.11 333 Crude petroleum & bituminous oil 49 254 965 79.9 8.03 5.87057 Fruit nut (exc oil), fresh or dried 191 995 12.1 0.93 0.40 057 Fruit nut (exc oil), fresh or dried 1 373 270 2.2 6.62 2.85773 Electrical distribute equipment nes 133 503 8.4 0.49 0.19 342 Liquefied propane and butane 742 556 1.2 4.09 2.64036 Crustacean mollusc aquat invertebra 104 510 6.6 0.82 0.51 659 Floor coverings etc 617 827 1.0 13.57 5.06422 Fixed veg fat and oil, excl. "soft" 55 585 3.5 0.44 0.38 335 Residual petroleum products nes 561 431 0.9 8.45 2.79287 Base metal ores & concentrates nes 46 453 2.9 0.43 0.23 673 Flat iron non-alloy steel products 468 396 0.8 2.26 0.68122 Manufactured tabacco 45 960 2.9 1.11 0.25 511 Hydrocarbons nes; derivatives 371 478 0.6 2.20 0.70289 Prec metal ore concentrate excl. gold 45 352 2.9 2.99 0.90 682 Copper 336 472 0.5 0.80 0.39971 Gold non-monetary excluding ores 41 376 2.6 0.17 0.09 334 Heavy petroleum & bituminous oil 315 954 0.5 0.17 0.08054 Vegetable & vegetable products nes 34 918 2.2 0.29 0.10 672 Ingots, Iron steel primary products 292 953 0.5 3.23 0.99Remainder 527 363 33.2 Remainder 7 294 198 11.8
All commodity groups 68 163 709 100.0 1.03 0.61 All commodity groups 109 382 956 100.0 1.65 0.98764 Telecommunicate equipment part nes 7 940 801 11.6 4.12 2.03 515 Organo-inorganic compound acid salt 18 828 338 17.2 26.29 22.71713 Internal combustion engine part nes 6 342 750 9.3 6.31 5.35 542 Medicines including veterinary 14 875 707 13.6 7.09 6.71752 Computer equipment nes 3 540 591 5.2 2.93 1.24 752 Computer equipment nes 12 327 319 11.3 10.19 4.32781 Passenger cars and race cars 2 757 242 4.0 0.62 0.54 551 Essential oils, perfumes & flavours 5 851 436 5.3 42.20 35.72784 Motor vehicle parts and accessories 2 619 581 3.8 1.32 1.07 759 Office equipment part & accessories 5 170 877 4.7 5.62 2.44761 Television video receive project 2 309 521 3.4 7.99 3.46 776 Valves tubes; diodes, transistors 4 689 864 4.3 3.01 1.19772 Electrical circuit equipment 1 731 736 2.5 1.86 1.13 872 Medical instruments appliances nes 3 245 686 3.0 7.30 5.96773 Electrical distribute equipment nes 1 713 198 2.5 4.22 2.49 541 Pharmaceuticals excluding medicines 3 026 726 2.8 4.80 4.29778 Electrical machinery apparatus nes 1 675 181 2.5 1.85 1.07 899 Manufactured articles nes 2 950 747 2.7 9.06 6.29542 Medicines including veterinary 1 349 969 2.0 0.64 0.61 598 Miscellaneous chemical products nes 2 516 644 2.3 4.37 3.62Remainder 36 183 142 53.1 Remainder 35 899 612 32.8
All commodity groups 3 271 836 100.0 0.05 0.03 All commodity groups 44 781 287 100.0 0.68 0.40034 Fish, fresh live chilled frozen 1 126 298 34.4 5.40 3.14 667 Pearls, precious semiprecious stone 16 117 807 36.0 28.94 17.36684 Aluminium 692 738 21.2 1.19 0.79 542 Medicines including veterinary 2 509 811 5.6 1.20 1.13035 Fish, dried salted smoked 336 535 10.3 11.85 8.86 764 Telecommunicate equipment part nes 2 326 347 5.2 1.21 0.60792 Aircraft, spacecraft & equipment 167 760 5.1 0.13 0.12 792 Aircraft, spacecraft & equipment 949 394 2.1 0.72 0.65081 Animal feed excluding unmilled cereal 140 742 4.3 0.75 0.44 893 Articles of plastic nes 847 893 1.9 1.41 0.94037 Fish shellfish, prepared preserved 124 023 3.8 2.23 0.77 562 Manufactured fertilizer excl. crude 721 526 1.6 6.37 2.98671 Pig & sponge iron, ferro alloys etc 90 151 2.8 1.35 0.35 774 Electrodiagnostic equipment 698 097 1.6 2.79 2.53542 Medicines including veterinary 85 842 2.6 0.04 0.04 874 Measure analyze control device nes 656 442 1.5 0.66 0.55899 Manufactured articles nes 65 844 2.0 0.20 0.14 695 Tools for use in hand or in machine 641 264 1.4 2.78 1.98334 Heavy petroleum & bituminous oil 57 100 1.7 0.03 0.01 759 Office equipment part & accessories 502 742 1.1 0.55 0.24Remainder 384 803 11.8 Remainder 18 809 966 42.0
All commodity groups 114 764 835 100.0 2.79 1.03 All commodity groups 395 055 071 100.0 5.98 3.55334 Heavy petroleum & bituminous oil 14 877 721 13.0 7.82 3.57 784 Motor vehicle parts and accessories 13 015 899 3.3 6.56 5.30667 Pearls, precious semiprecious stone 11 384 736 9.9 32.37 12.26 334 Heavy petroleum & bituminous oil 12 527 849 3.2 7.17 3.01897 Jewellery nes (667) 4 440 121 3.9 21.49 10.00 542 Medicines including veterinary 11 256 395 2.8 5.37 5.08281 Iron ore and concentrates 3 855 310 3.4 25.92 12.62 821 Furniture part; bedding furnishing 11 076 616 2.8 17.18 10.80842 Female clothing, woven 3 217 867 2.8 7.33 4.76 728 Special industrial machine part nes 10 862 964 2.7 12.53 10.43542 Medicines including veterinary 2 620 444 2.3 23.23 1.18 851 Footwear 9 291 036 2.4 31.97 13.43651 Textile yarn 2 460 751 2.1 10.39 5.79 699 Base metal manufactures nes 8 732 901 2.2 12.74 8.86658 Made-up textile articles nes 2 337 615 2.0 10.22 7.18 781 Passenger cars and race cars 8 718 993 2.2 1.97 1.72845 Articles of apparel nes 2 070 360 1.8 3.07 2.07 741 Heating cooling equipment parts nes 7 068 720 1.8 13.45 9.53682 Copper 2 037 977 1.8 4.87 2.34 775 Household equipment nes 6 788 064 1.7 18.56 10.17Remainder 65 461 934 57.0 Remainder 295 715 635 74.9
For sources and notes, see end of table. Pour les sources et les notes, se reporter à la fin du tableau.
Leading products exported basedon average 2005-2006 valuesSITC Revision 3 (3-digit level)
Principaux produits exportés d'aprèsla moyenne des valeurs de 2005-2006CTCI révision 3 (positions à 3 chiffres)
2005-2006
Value(f.o.b., thousands
of dollars)
Valeur(f.a.b., milliers
de dollars)
As percentageEn pourcentage Value
(f.o.b., thousandsof dollars)
Valeur(f.a.b., milliers
de dollars)
As percentageEn pourcentage
Hungary - Hongrie (**=Developed)
Iceland - Islande (**=Developed)
India - Inde (**=Developing)
Indonesia - Indonésie (**=Developing)
Iran (Islamic Rep. of) - Iran (Rép. islamique d') (**=Developing)
Ireland - Irlande (**=Developed)
Israel - Israël (**=Developed)
Italy - Italie (**=Developed)
Haiti - Haïti (**=Developing)
Honduras (**=Developing)
Leading products exported basedon average 2005-2006 valuesSITC Revision 3 (3-digit level)
Principaux produits exportés d'aprèsla moyenne des valeurs de 2005-2006CTCI révision 3 (positions à 3 chiffres)
2005-2006
3.2.D Export structure by productIndividual countries and territories
3.2.D Structure des exportations par produitsPays et territoires individuels
163
3

ofcountry
total
du totaldu pays
of ** (1)
des ** (1)
of world
dumonde
ofcountry
total
du totaldu pays
of ** (1)
des ** (1)
of world
dumonde
All commodity groups 1 751 638 100.0 0.04 0.02 All commodity groups 51 138 491 100.0 1.24 0.46285 Aluminium ore concentrate alumina 1 086 393 62.0 27.00 9.12 333 Crude petroleum & bituminous oil 31 728 442 62.0 5.17 3.78334 Heavy petroleum & bituminous oil 189 665 10.8 0.10 0.05 334 Heavy petroleum & bituminous oil 14 175 499 27.7 7.45 3.41061 Sugar, mollasses and honey 83 293 4.8 0.73 0.42 342 Liquefied propane and butane 1 909 447 3.7 10.52 6.79112 Alcoholic beverages 75 351 4.3 1.09 0.16 571 Primary form ethylene polymers 759 431 1.5 4.88 1.77282 Ferrous iron & steel, waste & scrap 54 750 3.1 2.03 0.20 512 Alcohols, phenols; derivatives 336 194 0.7 2.46 1.09512 Alcohols, phenols; derivatives 40 671 2.3 0.30 0.13 562 Manufactured fertilizer excl. crude 255 528 0.5 3.95 1.06071 Coffee and coffee substitutes 24 456 1.4 0.22 0.14 575 Other plastics, in primary forms 193 961 0.4 1.29 0.28054 Vegetable & vegetable products nes 19 427 1.1 0.16 0.06 897 Jewellery nes (667) 93 505 0.2 0.45 0.21098 Edible products & preparations nes 19 240 1.1 0.28 0.06 971 Gold non-monetary excluding ores 75 777 0.1 0.31 0.16057 Fruit nut (exc oil), fresh or dried 14 977 0.9 0.07 0.03 274 Sulphur and unroasted iron pyrites 70 518 0.1 18.47 5.79Remainder 143 413 8.2 Remainder 1 540 188 3.0
All commodity groups 620 832 962 100.0 9.39 5.58 All commodity groups 733 041 100.0 0.18 0.01781 Passenger cars and race cars 87 127 262 14.0 19.71 17.14 971 Gold non-monetary excluding ores 218 339 29.8 28.23 0.45776 Valves tubes; diodes, transistors 40 805 288 6.6 26.23 10.33 334 Heavy petroleum & bituminous oil 89 310 12.2 0.17 0.02784 Motor vehicle parts and accessories 26 173 060 4.2 13.20 10.65 263 Cotton 38 886 5.3 3.29 0.35778 Electrical machinery apparatus nes 19 350 927 3.1 21.40 12.31 664 Glass 30 246 4.1 11.06 0.11728 Special industrial machine part nes 18 589 739 3.0 21.43 17.84 661 Lime cement construction material 27 112 3.7 3.56 0.13764 Telecommunicate equipment part nes 18 071 498 2.9 9.39 4.63 842 Female clothing, woven 26 907 3.7 2.66 0.04759 Office equipment part & accessories 16 583 758 2.7 18.03 7.84 351 Electric current 22 762 3.1 1.75 0.08772 Electrical circuit equipment 15 878 627 2.6 17.06 10.38 054 Vegetable & vegetable products nes 18 746 2.6 4.21 0.05713 Internal combustion engine part nes 14 789 292 2.4 14.72 12.48 778 Electrical machinery apparatus nes 16 985 2.3 2.05 0.01874 Measure analyze control device nes 13 071 199 2.1 13.17 11.05 893 Articles of plastic nes 15 719 2.1 2.66 0.02Remainder 350 392 311 56.4 Remainder 228 030 31.1
All commodity groups 4 722 652 100.0 0.11 0.04 All commodity groups 5 597 109 100.0 0.08 0.05272 Crude fertilizer, excl. manufactured 429 619 9.1 32.00 23.55 248 Wood simply worked, railway sleeper 581 918 10.4 2.22 1.58845 Articles of apparel nes 426 360 9.0 0.63 0.43 676 Iron steel bar rod section piling 349 445 6.2 0.98 0.61842 Female clothing, woven 321 589 6.8 0.73 0.48 334 Heavy petroleum & bituminous oil 314 207 5.6 0.18 0.08542 Medicines including veterinary 294 500 6.2 2.61 0.13 635 Wood manufactures nes 185 076 3.3 1.27 0.82844 Female clothing, knitted crocheted 241 378 5.1 1.16 0.85 634 Veneer, plywood & other wood nes 182 577 3.3 0.94 0.59054 Vegetable & vegetable products nes 217 230 4.6 1.80 0.63 821 Furniture part; bedding furnishing 166 731 3.0 0.26 0.16562 Manufactured fertilizer excl. crude 197 720 4.2 3.05 0.82 247 Wood in rough or roughly squared 166 453 3.0 3.32 1.50897 Jewellery nes (667) 185 645 3.9 0.90 0.42 542 Medicines including veterinary 140 828 2.5 0.07 0.06971 Gold non-monetary excluding ores 140 726 3.0 0.58 0.29 781 Passenger cars and race cars 122 481 2.2 0.03 0.02764 Telecommunicate equipment part nes 115 317 2.4 0.06 0.03 246 Wood chips, particles and waste 118 813 2.1 5.89 3.85Remainder 2 152 567 45.6 Remainder 3 268 580 58.4
All commodity groups 33 046 736 100.0 8.31 0.30 All commodity groups 2 044 476 100.0 0.05 0.02333 Crude petroleum & bituminous oil 20 503 623 62.0 18.25 2.44 661 Lime cement construction material 200 259 9.8 1.91 0.97682 Copper 2 062 811 6.2 31.96 2.37 897 Jewellery nes (667) 196 581 9.6 0.95 0.44334 Heavy petroleum & bituminous oil 1 053 067 3.2 2.06 0.25 282 Ferrous iron & steel, waste & scrap 86 214 4.2 3.20 0.31671 Pig & sponge iron, ferro alloys etc 958 839 2.9 17.55 3.77 716 Rotating electric plant parts nes 80 341 3.9 0.45 0.14281 Iron ore and concentrates 656 319 2.0 26.37 2.15 667 Pearls, precious semiprecious stone 77 959 3.8 0.22 0.08686 Zinc 558 268 1.7 74.24 4.95 562 Manufactured fertilizer excl. crude 66 982 3.3 1.03 0.28673 Flat iron non-alloy steel products 525 547 1.6 5.56 0.76 057 Fruit nut (exc oil), fresh or dried 65 235 3.2 0.31 0.14343 Natural gas, liquefied or not 475 876 1.4 1.18 0.27 892 Printed matter 62 308 3.0 0.79 0.15321 Coal excluding non-agglomomerated 462 945 1.4 9.76 0.97 642 Cut paper and paperboard articles 56 881 2.8 0.66 0.15285 Aluminium ore concentrate alumina 448 861 1.4 44.65 3.77 054 Vegetable & vegetable products nes 43 475 2.1 0.36 0.13Remainder 5 340 578 16.2 Remainder 1 108 241 54.2
All commodity groups 3 523 856 100.0 0.09 0.03 All commodity groups 26 700 166 100.0 0.65 0.24074 Tea and maté 603 553 17.1 18.51 13.57 333 Crude petroleum & bituminous oil 21 879 688 81.9 3.57 2.61334 Heavy petroleum & bituminous oil 415 062 11.8 0.22 0.10 334 Heavy petroleum & bituminous oil 2 225 924 8.3 1.17 0.53292 Crude vegetable materials nes 331 421 9.4 5.47 1.43 571 Primary form ethylene polymers 299 623 1.1 1.92 0.70054 Vegetable & vegetable products nes 194 952 5.5 1.61 0.56 342 Liquefied propane and butane 243 731 0.9 1.34 0.87071 Coffee and coffee substitutes 128 929 3.7 1.18 0.75 344 Petroleum and hydrocarbon gas nes 169 981 0.6 6.50 1.73842 Female clothing, woven 96 459 2.7 0.22 0.14 562 Manufactured fertilizer excl. crude 155 135 0.6 2.40 0.64674 Flat plated iron non-alloy steel 79 965 2.3 0.70 0.22 511 Hydrocarbons nes; derivatives 150 526 0.6 0.89 0.29523 Inorganic acid metal salt peroxy 73 763 2.1 1.58 0.56 512 Alcohols, phenols; derivatives 135 726 0.5 1.00 0.44122 Manufactured tabacco 72 510 2.1 1.75 0.39 673 Flat iron non-alloy steel products 127 853 0.5 0.62 0.19893 Articles of plastic nes 66 455 1.9 0.22 0.07 343 Natural gas, liquefied or not 123 084 0.5 0.20 0.07Remainder 1 460 788 41.5 Remainder 1 188 894 4.5
For sources and notes, see end of table. Pour les sources et les notes, se reporter à la fin du tableau.
Leading products exported basedon average 2005-2006 valuesSITC Revision 3 (3-digit level)
Principaux produits exportés d'aprèsla moyenne des valeurs de 2005-2006CTCI révision 3 (positions à 3 chiffres)
2005-2006
Leading products exported basedon average 2005-2006 valuesSITC Revision 3 (3-digit level)
Principaux produits exportés d'aprèsla moyenne des valeurs de 2005-2006CTCI révision 3 (positions à 3 chiffres)
2005-2006
Value(f.o.b., thousands
of dollars)
Valeur(f.a.b., milliers
de dollars)
As percentageEn pourcentage Value
(f.o.b., thousandsof dollars)
Valeur(f.a.b., milliers
de dollars)
As percentageEn pourcentage
Lebanon - Liban (**=Developing)
Libyan Arab Jamahiriya - Jamahiriya arabe libyenne (**=Developing)Kenya (**=Developing)
Kazakhstan (**=Transition)
Kuwait - Koweït (**=Developing)
Kyrgyzstan - Kirghizistan (**=Transition)
Latvia - Lettonie (**=Developed)
Jamaica - Jamaïque (**=Developing)
Japan - Japon (**=Developed)
Jordan - Jordanie (**=Developing)
3.2.D Export structure by productIndividual countries and territories
3.2.D Structure des exportations par produitsPays et territoires individuels
164
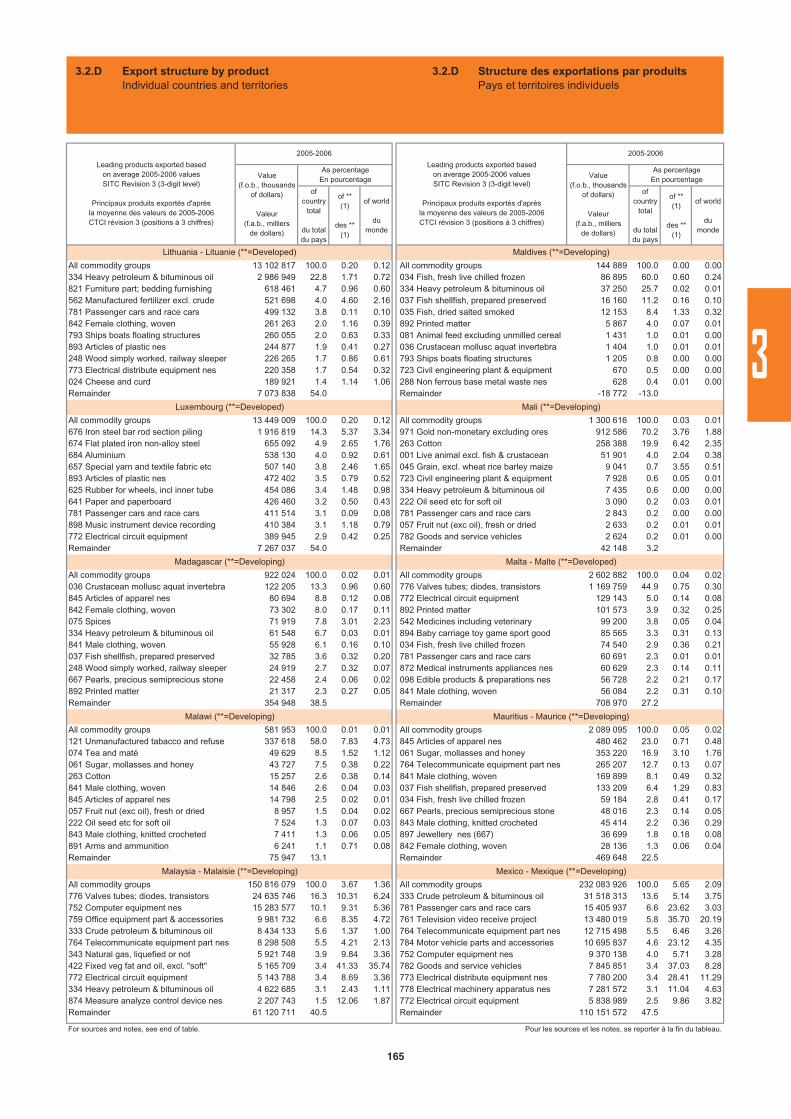
ofcountry
total
du totaldu pays
of ** (1)
des ** (1)
of world
dumonde
ofcountry
total
du totaldu pays
of ** (1)
des ** (1)
of world
dumonde
All commodity groups 13 102 817 100.0 0.20 0.12 All commodity groups 144 889 100.0 0.00 0.00334 Heavy petroleum & bituminous oil 2 986 949 22.8 1.71 0.72 034 Fish, fresh live chilled frozen 86 895 60.0 0.60 0.24821 Furniture part; bedding furnishing 618 461 4.7 0.96 0.60 334 Heavy petroleum & bituminous oil 37 250 25.7 0.02 0.01562 Manufactured fertilizer excl. crude 521 698 4.0 4.60 2.16 037 Fish shellfish, prepared preserved 16 160 11.2 0.16 0.10781 Passenger cars and race cars 499 132 3.8 0.11 0.10 035 Fish, dried salted smoked 12 153 8.4 1.33 0.32842 Female clothing, woven 261 263 2.0 1.16 0.39 892 Printed matter 5 867 4.0 0.07 0.01793 Ships boats floating structures 260 055 2.0 0.63 0.33 081 Animal feed excluding unmilled cereal 1 431 1.0 0.01 0.00893 Articles of plastic nes 244 877 1.9 0.41 0.27 036 Crustacean mollusc aquat invertebra 1 404 1.0 0.01 0.01248 Wood simply worked, railway sleeper 226 265 1.7 0.86 0.61 793 Ships boats floating structures 1 205 0.8 0.00 0.00773 Electrical distribute equipment nes 220 358 1.7 0.54 0.32 723 Civil engineering plant & equipment 670 0.5 0.00 0.00024 Cheese and curd 189 921 1.4 1.14 1.06 288 Non ferrous base metal waste nes 628 0.4 0.01 0.00Remainder 7 073 838 54.0 Remainder -18 772 -13.0
All commodity groups 13 449 009 100.0 0.20 0.12 All commodity groups 1 300 616 100.0 0.03 0.01676 Iron steel bar rod section piling 1 916 819 14.3 5.37 3.34 971 Gold non-monetary excluding ores 912 586 70.2 3.76 1.88674 Flat plated iron non-alloy steel 655 092 4.9 2.65 1.76 263 Cotton 258 388 19.9 6.42 2.35684 Aluminium 538 130 4.0 0.92 0.61 001 Live animal excl. fish & crustacean 51 901 4.0 2.04 0.38657 Special yarn and textile fabric etc 507 140 3.8 2.46 1.65 045 Grain, excl. wheat rice barley maize 9 041 0.7 3.55 0.51893 Articles of plastic nes 472 402 3.5 0.79 0.52 723 Civil engineering plant & equipment 7 928 0.6 0.05 0.01625 Rubber for wheels, incl inner tube 454 086 3.4 1.48 0.98 334 Heavy petroleum & bituminous oil 7 435 0.6 0.00 0.00641 Paper and paperboard 426 460 3.2 0.50 0.43 222 Oil seed etc for soft oil 3 090 0.2 0.03 0.01781 Passenger cars and race cars 411 514 3.1 0.09 0.08 781 Passenger cars and race cars 2 843 0.2 0.00 0.00898 Music instrument device recording 410 384 3.1 1.18 0.79 057 Fruit nut (exc oil), fresh or dried 2 633 0.2 0.01 0.01772 Electrical circuit equipment 389 945 2.9 0.42 0.25 782 Goods and service vehicles 2 624 0.2 0.01 0.00Remainder 7 267 037 54.0 Remainder 42 148 3.2
All commodity groups 922 024 100.0 0.02 0.01 All commodity groups 2 602 882 100.0 0.04 0.02036 Crustacean mollusc aquat invertebra 122 205 13.3 0.96 0.60 776 Valves tubes; diodes, transistors 1 169 759 44.9 0.75 0.30845 Articles of apparel nes 80 694 8.8 0.12 0.08 772 Electrical circuit equipment 129 143 5.0 0.14 0.08842 Female clothing, woven 73 302 8.0 0.17 0.11 892 Printed matter 101 573 3.9 0.32 0.25075 Spices 71 919 7.8 3.01 2.23 542 Medicines including veterinary 99 200 3.8 0.05 0.04334 Heavy petroleum & bituminous oil 61 548 6.7 0.03 0.01 894 Baby carriage toy game sport good 85 565 3.3 0.31 0.13841 Male clothing, woven 55 928 6.1 0.16 0.10 034 Fish, fresh live chilled frozen 74 540 2.9 0.36 0.21037 Fish shellfish, prepared preserved 32 785 3.6 0.32 0.20 781 Passenger cars and race cars 60 691 2.3 0.01 0.01248 Wood simply worked, railway sleeper 24 919 2.7 0.32 0.07 872 Medical instruments appliances nes 60 629 2.3 0.14 0.11667 Pearls, precious semiprecious stone 22 458 2.4 0.06 0.02 098 Edible products & preparations nes 56 728 2.2 0.21 0.17892 Printed matter 21 317 2.3 0.27 0.05 841 Male clothing, woven 56 084 2.2 0.31 0.10Remainder 354 948 38.5 Remainder 708 970 27.2
All commodity groups 581 953 100.0 0.01 0.01 All commodity groups 2 089 095 100.0 0.05 0.02121 Unmanufactured tabacco and refuse 337 618 58.0 7.83 4.73 845 Articles of apparel nes 480 462 23.0 0.71 0.48074 Tea and maté 49 629 8.5 1.52 1.12 061 Sugar, mollasses and honey 353 220 16.9 3.10 1.76061 Sugar, mollasses and honey 43 727 7.5 0.38 0.22 764 Telecommunicate equipment part nes 265 207 12.7 0.13 0.07263 Cotton 15 257 2.6 0.38 0.14 841 Male clothing, woven 169 899 8.1 0.49 0.32841 Male clothing, woven 14 846 2.6 0.04 0.03 037 Fish shellfish, prepared preserved 133 209 6.4 1.29 0.83845 Articles of apparel nes 14 798 2.5 0.02 0.01 034 Fish, fresh live chilled frozen 59 184 2.8 0.41 0.17057 Fruit nut (exc oil), fresh or dried 8 957 1.5 0.04 0.02 667 Pearls, precious semiprecious stone 48 016 2.3 0.14 0.05222 Oil seed etc for soft oil 7 524 1.3 0.07 0.03 843 Male clothing, knitted crocheted 45 414 2.2 0.36 0.29843 Male clothing, knitted crocheted 7 411 1.3 0.06 0.05 897 Jewellery nes (667) 36 699 1.8 0.18 0.08891 Arms and ammunition 6 241 1.1 0.71 0.08 842 Female clothing, woven 28 136 1.3 0.06 0.04Remainder 75 947 13.1 Remainder 469 648 22.5
All commodity groups 150 816 079 100.0 3.67 1.36 All commodity groups 232 083 926 100.0 5.65 2.09776 Valves tubes; diodes, transistors 24 635 746 16.3 10.31 6.24 333 Crude petroleum & bituminous oil 31 518 313 13.6 5.14 3.75752 Computer equipment nes 15 283 577 10.1 9.31 5.36 781 Passenger cars and race cars 15 405 937 6.6 23.62 3.03759 Office equipment part & accessories 9 981 732 6.6 8.35 4.72 761 Television video receive project 13 480 019 5.8 35.70 20.19333 Crude petroleum & bituminous oil 8 434 133 5.6 1.37 1.00 764 Telecommunicate equipment part nes 12 715 498 5.5 6.46 3.26764 Telecommunicate equipment part nes 8 298 508 5.5 4.21 2.13 784 Motor vehicle parts and accessories 10 695 837 4.6 23.12 4.35343 Natural gas, liquefied or not 5 921 748 3.9 9.84 3.36 752 Computer equipment nes 9 370 138 4.0 5.71 3.28422 Fixed veg fat and oil, excl. "soft" 5 165 709 3.4 41.33 35.74 782 Goods and service vehicles 7 845 851 3.4 37.03 8.28772 Electrical circuit equipment 5 143 788 3.4 8.69 3.36 773 Electrical distribute equipment nes 7 780 200 3.4 28.41 11.29334 Heavy petroleum & bituminous oil 4 622 685 3.1 2.43 1.11 778 Electrical machinery apparatus nes 7 281 572 3.1 11.04 4.63874 Measure analyze control device nes 2 207 743 1.5 12.06 1.87 772 Electrical circuit equipment 5 838 989 2.5 9.86 3.82Remainder 61 120 711 40.5 Remainder 110 151 572 47.5
For sources and notes, see end of table. Pour les sources et les notes, se reporter à la fin du tableau.
Leading products exported basedon average 2005-2006 valuesSITC Revision 3 (3-digit level)
Principaux produits exportés d'aprèsla moyenne des valeurs de 2005-2006CTCI révision 3 (positions à 3 chiffres)
2005-2006
Value(f.o.b., thousands
of dollars)
Valeur(f.a.b., milliers
de dollars)
As percentageEn pourcentage Value
(f.o.b., thousandsof dollars)
Valeur(f.a.b., milliers
de dollars)
As percentageEn pourcentage
Madagascar (**=Developing)
Malawi (**=Developing)
Malaysia - Malaisie (**=Developing)
Maldives (**=Developing)
Mali (**=Developing)
Malta - Malte (**=Developed)
Mauritius - Maurice (**=Developing)
Mexico - Mexique (**=Developing)
Lithuania - Lituanie (**=Developed)
Luxembourg (**=Developed)
Leading products exported basedon average 2005-2006 valuesSITC Revision 3 (3-digit level)
Principaux produits exportés d'aprèsla moyenne des valeurs de 2005-2006CTCI révision 3 (positions à 3 chiffres)
2005-2006
3.2.D Export structure by productIndividual countries and territories
3.2.D Structure des exportations par produitsPays et territoires individuels
165
3
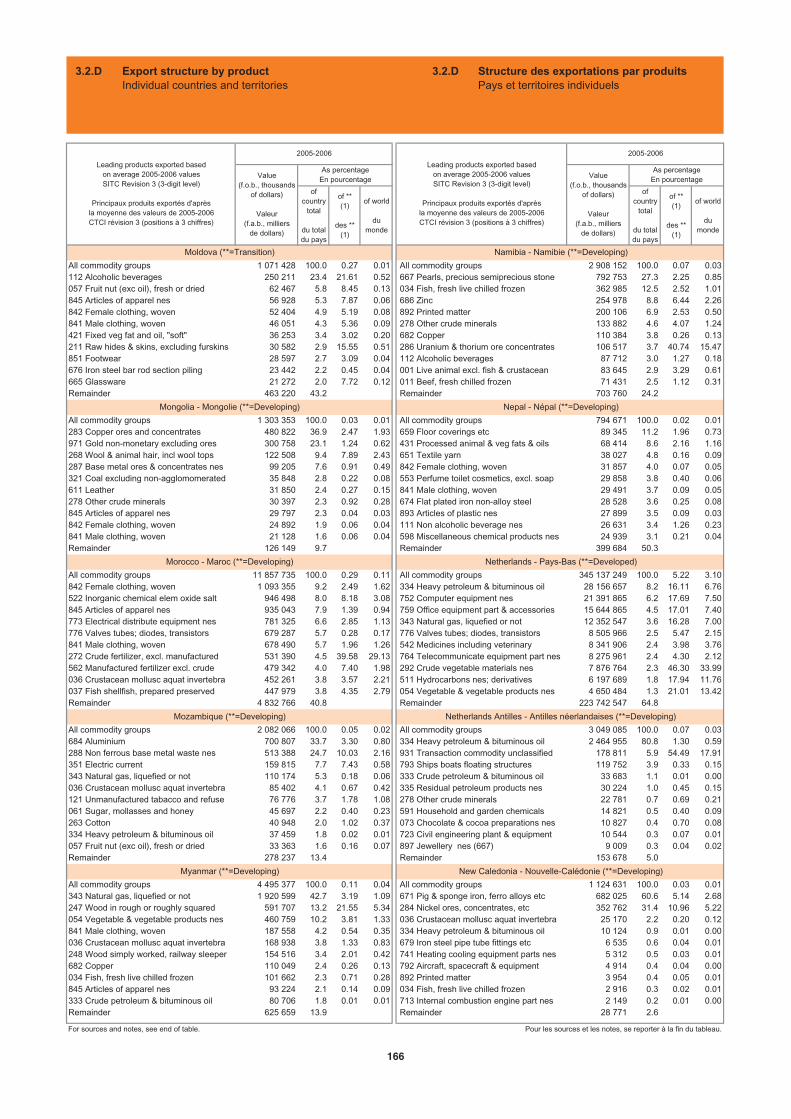
ofcountry
total
du totaldu pays
of ** (1)
des ** (1)
of world
dumonde
ofcountry
total
du totaldu pays
of ** (1)
des ** (1)
of world
dumonde
All commodity groups 1 071 428 100.0 0.27 0.01 All commodity groups 2 908 152 100.0 0.07 0.03112 Alcoholic beverages 250 211 23.4 21.61 0.52 667 Pearls, precious semiprecious stone 792 753 27.3 2.25 0.85057 Fruit nut (exc oil), fresh or dried 62 467 5.8 8.45 0.13 034 Fish, fresh live chilled frozen 362 985 12.5 2.52 1.01845 Articles of apparel nes 56 928 5.3 7.87 0.06 686 Zinc 254 978 8.8 6.44 2.26842 Female clothing, woven 52 404 4.9 5.19 0.08 892 Printed matter 200 106 6.9 2.53 0.50841 Male clothing, woven 46 051 4.3 5.36 0.09 278 Other crude minerals 133 882 4.6 4.07 1.24421 Fixed veg fat and oil, "soft" 36 253 3.4 3.02 0.20 682 Copper 110 384 3.8 0.26 0.13211 Raw hides & skins, excluding furskins 30 582 2.9 15.55 0.51 286 Uranium & thorium ore concentrates 106 517 3.7 40.74 15.47851 Footwear 28 597 2.7 3.09 0.04 112 Alcoholic beverages 87 712 3.0 1.27 0.18676 Iron steel bar rod section piling 23 442 2.2 0.45 0.04 001 Live animal excl. fish & crustacean 83 645 2.9 3.29 0.61665 Glassware 21 272 2.0 7.72 0.12 011 Beef, fresh chilled frozen 71 431 2.5 1.12 0.31Remainder 463 220 43.2 Remainder 703 760 24.2
All commodity groups 1 303 353 100.0 0.03 0.01 All commodity groups 794 671 100.0 0.02 0.01283 Copper ores and concentrates 480 822 36.9 2.47 1.93 659 Floor coverings etc 89 345 11.2 1.96 0.73971 Gold non-monetary excluding ores 300 758 23.1 1.24 0.62 431 Processed animal & veg fats & oils 68 414 8.6 2.16 1.16268 Wool & animal hair, incl wool tops 122 508 9.4 7.89 2.43 651 Textile yarn 38 027 4.8 0.16 0.09287 Base metal ores & concentrates nes 99 205 7.6 0.91 0.49 842 Female clothing, woven 31 857 4.0 0.07 0.05321 Coal excluding non-agglomomerated 35 848 2.8 0.22 0.08 553 Perfume toilet cosmetics, excl. soap 29 858 3.8 0.40 0.06611 Leather 31 850 2.4 0.27 0.15 841 Male clothing, woven 29 491 3.7 0.09 0.05278 Other crude minerals 30 397 2.3 0.92 0.28 674 Flat plated iron non-alloy steel 28 528 3.6 0.25 0.08845 Articles of apparel nes 29 797 2.3 0.04 0.03 893 Articles of plastic nes 27 899 3.5 0.09 0.03842 Female clothing, woven 24 892 1.9 0.06 0.04 111 Non alcoholic beverage nes 26 631 3.4 1.26 0.23841 Male clothing, woven 21 128 1.6 0.06 0.04 598 Miscellaneous chemical products nes 24 939 3.1 0.21 0.04Remainder 126 149 9.7 Remainder 399 684 50.3
All commodity groups 11 857 735 100.0 0.29 0.11 All commodity groups 345 137 249 100.0 5.22 3.10842 Female clothing, woven 1 093 355 9.2 2.49 1.62 334 Heavy petroleum & bituminous oil 28 156 657 8.2 16.11 6.76522 Inorganic chemical elem oxide salt 946 498 8.0 8.18 3.08 752 Computer equipment nes 21 391 865 6.2 17.69 7.50845 Articles of apparel nes 935 043 7.9 1.39 0.94 759 Office equipment part & accessories 15 644 865 4.5 17.01 7.40773 Electrical distribute equipment nes 781 325 6.6 2.85 1.13 343 Natural gas, liquefied or not 12 352 547 3.6 16.28 7.00776 Valves tubes; diodes, transistors 679 287 5.7 0.28 0.17 776 Valves tubes; diodes, transistors 8 505 966 2.5 5.47 2.15841 Male clothing, woven 678 490 5.7 1.96 1.26 542 Medicines including veterinary 8 341 906 2.4 3.98 3.76272 Crude fertilizer, excl. manufactured 531 390 4.5 39.58 29.13 764 Telecommunicate equipment part nes 8 275 961 2.4 4.30 2.12562 Manufactured fertilizer excl. crude 479 342 4.0 7.40 1.98 292 Crude vegetable materials nes 7 876 764 2.3 46.30 33.99036 Crustacean mollusc aquat invertebra 452 261 3.8 3.57 2.21 511 Hydrocarbons nes; derivatives 6 197 689 1.8 17.94 11.76037 Fish shellfish, prepared preserved 447 979 3.8 4.35 2.79 054 Vegetable & vegetable products nes 4 650 484 1.3 21.01 13.42Remainder 4 832 766 40.8 Remainder 223 742 547 64.8
All commodity groups 2 082 066 100.0 0.05 0.02 All commodity groups 3 049 085 100.0 0.07 0.03684 Aluminium 700 807 33.7 3.30 0.80 334 Heavy petroleum & bituminous oil 2 464 955 80.8 1.30 0.59288 Non ferrous base metal waste nes 513 388 24.7 10.03 2.16 931 Transaction commodity unclassified 178 811 5.9 54.49 17.91351 Electric current 159 815 7.7 7.43 0.58 793 Ships boats floating structures 119 752 3.9 0.33 0.15343 Natural gas, liquefied or not 110 174 5.3 0.18 0.06 333 Crude petroleum & bituminous oil 33 683 1.1 0.01 0.00036 Crustacean mollusc aquat invertebra 85 402 4.1 0.67 0.42 335 Residual petroleum products nes 30 224 1.0 0.45 0.15121 Unmanufactured tabacco and refuse 76 776 3.7 1.78 1.08 278 Other crude minerals 22 781 0.7 0.69 0.21061 Sugar, mollasses and honey 45 697 2.2 0.40 0.23 591 Household and garden chemicals 14 821 0.5 0.40 0.09263 Cotton 40 948 2.0 1.02 0.37 073 Chocolate & cocoa preparations nes 10 827 0.4 0.70 0.08334 Heavy petroleum & bituminous oil 37 459 1.8 0.02 0.01 723 Civil engineering plant & equipment 10 544 0.3 0.07 0.01057 Fruit nut (exc oil), fresh or dried 33 363 1.6 0.16 0.07 897 Jewellery nes (667) 9 009 0.3 0.04 0.02Remainder 278 237 13.4 Remainder 153 678 5.0
All commodity groups 4 495 377 100.0 0.11 0.04 All commodity groups 1 124 631 100.0 0.03 0.01343 Natural gas, liquefied or not 1 920 599 42.7 3.19 1.09 671 Pig & sponge iron, ferro alloys etc 682 025 60.6 5.14 2.68247 Wood in rough or roughly squared 591 707 13.2 21.55 5.34 284 Nickel ores, concentrates, etc 352 762 31.4 10.96 5.22054 Vegetable & vegetable products nes 460 759 10.2 3.81 1.33 036 Crustacean mollusc aquat invertebra 25 170 2.2 0.20 0.12841 Male clothing, woven 187 558 4.2 0.54 0.35 334 Heavy petroleum & bituminous oil 10 124 0.9 0.01 0.00036 Crustacean mollusc aquat invertebra 168 938 3.8 1.33 0.83 679 Iron steel pipe tube fittings etc 6 535 0.6 0.04 0.01248 Wood simply worked, railway sleeper 154 516 3.4 2.01 0.42 741 Heating cooling equipment parts nes 5 312 0.5 0.03 0.01682 Copper 110 049 2.4 0.26 0.13 792 Aircraft, spacecraft & equipment 4 914 0.4 0.04 0.00034 Fish, fresh live chilled frozen 101 662 2.3 0.71 0.28 892 Printed matter 3 954 0.4 0.05 0.01845 Articles of apparel nes 93 224 2.1 0.14 0.09 034 Fish, fresh live chilled frozen 2 916 0.3 0.02 0.01333 Crude petroleum & bituminous oil 80 706 1.8 0.01 0.01 713 Internal combustion engine part nes 2 149 0.2 0.01 0.00Remainder 625 659 13.9 Remainder 28 771 2.6
For sources and notes, see end of table. Pour les sources et les notes, se reporter à la fin du tableau.
Leading products exported basedon average 2005-2006 valuesSITC Revision 3 (3-digit level)
Principaux produits exportés d'aprèsla moyenne des valeurs de 2005-2006CTCI révision 3 (positions à 3 chiffres)
2005-2006
Leading products exported basedon average 2005-2006 valuesSITC Revision 3 (3-digit level)
Principaux produits exportés d'aprèsla moyenne des valeurs de 2005-2006CTCI révision 3 (positions à 3 chiffres)
2005-2006
Value(f.o.b., thousands
of dollars)
Valeur(f.a.b., milliers
de dollars)
As percentageEn pourcentage Value
(f.o.b., thousandsof dollars)
Valeur(f.a.b., milliers
de dollars)
As percentageEn pourcentage
New Caledonia - Nouvelle-Calédonie (**=Developing)Myanmar (**=Developing)
Namibia - Namibie (**=Developing)
Nepal - Népal (**=Developing)
Netherlands - Pays-Bas (**=Developed)
Netherlands Antilles - Antilles néerlandaises (**=Developing)
Moldova (**=Transition)
Mongolia - Mongolie (**=Developing)
Morocco - Maroc (**=Developing)
Mozambique (**=Developing)
3.2.D Export structure by productIndividual countries and territories
3.2.D Structure des exportations par produitsPays et territoires individuels
166
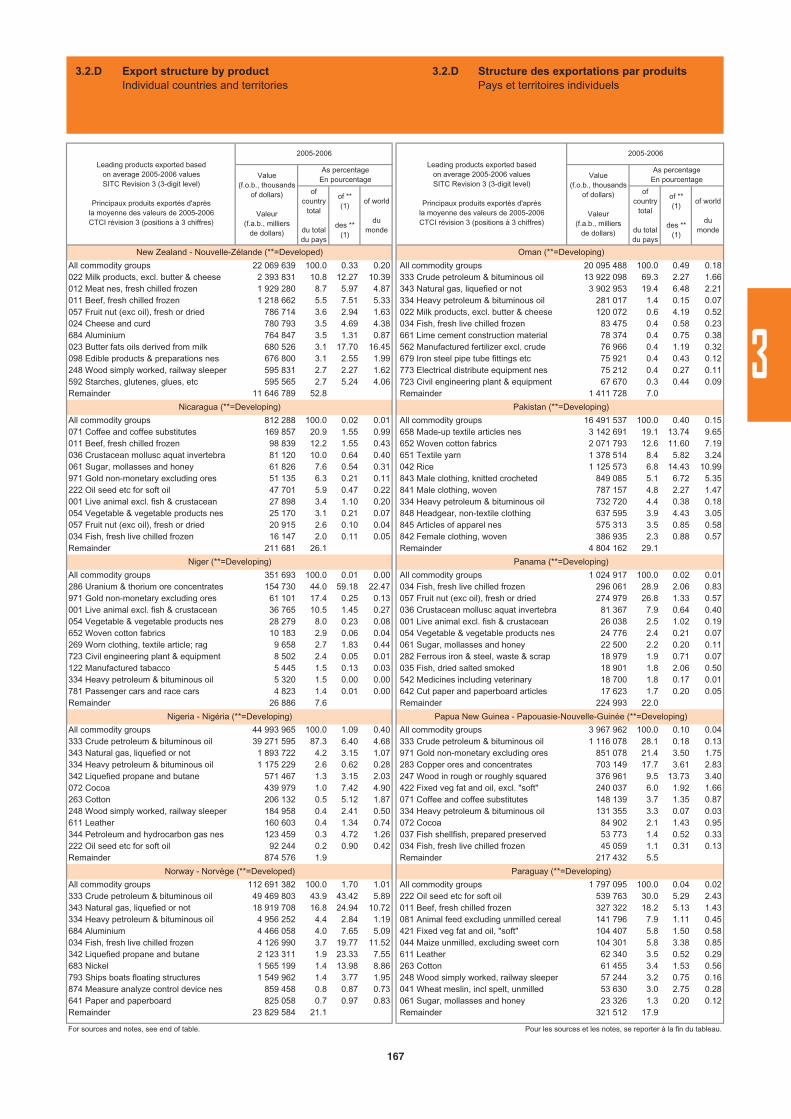
ofcountry
total
du totaldu pays
of ** (1)
des ** (1)
of world
dumonde
ofcountry
total
du totaldu pays
of ** (1)
des ** (1)
of world
dumonde
All commodity groups 22 069 639 100.0 0.33 0.20 All commodity groups 20 095 488 100.0 0.49 0.18022 Milk products, excl. butter & cheese 2 393 831 10.8 12.27 10.39 333 Crude petroleum & bituminous oil 13 922 098 69.3 2.27 1.66012 Meat nes, fresh chilled frozen 1 929 280 8.7 5.97 4.87 343 Natural gas, liquefied or not 3 902 953 19.4 6.48 2.21011 Beef, fresh chilled frozen 1 218 662 5.5 7.51 5.33 334 Heavy petroleum & bituminous oil 281 017 1.4 0.15 0.07057 Fruit nut (exc oil), fresh or dried 786 714 3.6 2.94 1.63 022 Milk products, excl. butter & cheese 120 072 0.6 4.19 0.52024 Cheese and curd 780 793 3.5 4.69 4.38 034 Fish, fresh live chilled frozen 83 475 0.4 0.58 0.23684 Aluminium 764 847 3.5 1.31 0.87 661 Lime cement construction material 78 374 0.4 0.75 0.38023 Butter fats oils derived from milk 680 526 3.1 17.70 16.45 562 Manufactured fertilizer excl. crude 76 966 0.4 1.19 0.32098 Edible products & preparations nes 676 800 3.1 2.55 1.99 679 Iron steel pipe tube fittings etc 75 921 0.4 0.43 0.12248 Wood simply worked, railway sleeper 595 831 2.7 2.27 1.62 773 Electrical distribute equipment nes 75 212 0.4 0.27 0.11592 Starches, glutenes, glues, etc 595 565 2.7 5.24 4.06 723 Civil engineering plant & equipment 67 670 0.3 0.44 0.09Remainder 11 646 789 52.8 Remainder 1 411 728 7.0
All commodity groups 812 288 100.0 0.02 0.01 All commodity groups 16 491 537 100.0 0.40 0.15071 Coffee and coffee substitutes 169 857 20.9 1.55 0.99 658 Made-up textile articles nes 3 142 691 19.1 13.74 9.65011 Beef, fresh chilled frozen 98 839 12.2 1.55 0.43 652 Woven cotton fabrics 2 071 793 12.6 11.60 7.19036 Crustacean mollusc aquat invertebra 81 120 10.0 0.64 0.40 651 Textile yarn 1 378 514 8.4 5.82 3.24061 Sugar, mollasses and honey 61 826 7.6 0.54 0.31 042 Rice 1 125 573 6.8 14.43 10.99971 Gold non-monetary excluding ores 51 135 6.3 0.21 0.11 843 Male clothing, knitted crocheted 849 085 5.1 6.72 5.35222 Oil seed etc for soft oil 47 701 5.9 0.47 0.22 841 Male clothing, woven 787 157 4.8 2.27 1.47001 Live animal excl. fish & crustacean 27 898 3.4 1.10 0.20 334 Heavy petroleum & bituminous oil 732 720 4.4 0.38 0.18054 Vegetable & vegetable products nes 25 170 3.1 0.21 0.07 848 Headgear, non-textile clothing 637 595 3.9 4.43 3.05057 Fruit nut (exc oil), fresh or dried 20 915 2.6 0.10 0.04 845 Articles of apparel nes 575 313 3.5 0.85 0.58034 Fish, fresh live chilled frozen 16 147 2.0 0.11 0.05 842 Female clothing, woven 386 935 2.3 0.88 0.57Remainder 211 681 26.1 Remainder 4 804 162 29.1
All commodity groups 351 693 100.0 0.01 0.00 All commodity groups 1 024 917 100.0 0.02 0.01286 Uranium & thorium ore concentrates 154 730 44.0 59.18 22.47 034 Fish, fresh live chilled frozen 296 061 28.9 2.06 0.83971 Gold non-monetary excluding ores 61 101 17.4 0.25 0.13 057 Fruit nut (exc oil), fresh or dried 274 979 26.8 1.33 0.57001 Live animal excl. fish & crustacean 36 765 10.5 1.45 0.27 036 Crustacean mollusc aquat invertebra 81 367 7.9 0.64 0.40054 Vegetable & vegetable products nes 28 279 8.0 0.23 0.08 001 Live animal excl. fish & crustacean 26 038 2.5 1.02 0.19652 Woven cotton fabrics 10 183 2.9 0.06 0.04 054 Vegetable & vegetable products nes 24 776 2.4 0.21 0.07269 Worn clothing, textile article; rag 9 658 2.7 1.83 0.44 061 Sugar, mollasses and honey 22 500 2.2 0.20 0.11723 Civil engineering plant & equipment 8 502 2.4 0.05 0.01 282 Ferrous iron & steel, waste & scrap 18 979 1.9 0.71 0.07122 Manufactured tabacco 5 445 1.5 0.13 0.03 035 Fish, dried salted smoked 18 901 1.8 2.06 0.50334 Heavy petroleum & bituminous oil 5 320 1.5 0.00 0.00 542 Medicines including veterinary 18 700 1.8 0.17 0.01781 Passenger cars and race cars 4 823 1.4 0.01 0.00 642 Cut paper and paperboard articles 17 623 1.7 0.20 0.05Remainder 26 886 7.6 Remainder 224 993 22.0
All commodity groups 44 993 965 100.0 1.09 0.40 All commodity groups 3 967 962 100.0 0.10 0.04333 Crude petroleum & bituminous oil 39 271 595 87.3 6.40 4.68 333 Crude petroleum & bituminous oil 1 116 078 28.1 0.18 0.13343 Natural gas, liquefied or not 1 893 722 4.2 3.15 1.07 971 Gold non-monetary excluding ores 851 078 21.4 3.50 1.75334 Heavy petroleum & bituminous oil 1 175 229 2.6 0.62 0.28 283 Copper ores and concentrates 703 149 17.7 3.61 2.83342 Liquefied propane and butane 571 467 1.3 3.15 2.03 247 Wood in rough or roughly squared 376 961 9.5 13.73 3.40072 Cocoa 439 979 1.0 7.42 4.90 422 Fixed veg fat and oil, excl. "soft" 240 037 6.0 1.92 1.66263 Cotton 206 132 0.5 5.12 1.87 071 Coffee and coffee substitutes 148 139 3.7 1.35 0.87248 Wood simply worked, railway sleeper 184 958 0.4 2.41 0.50 334 Heavy petroleum & bituminous oil 131 355 3.3 0.07 0.03611 Leather 160 603 0.4 1.34 0.74 072 Cocoa 84 902 2.1 1.43 0.95344 Petroleum and hydrocarbon gas nes 123 459 0.3 4.72 1.26 037 Fish shellfish, prepared preserved 53 773 1.4 0.52 0.33222 Oil seed etc for soft oil 92 244 0.2 0.90 0.42 034 Fish, fresh live chilled frozen 45 059 1.1 0.31 0.13Remainder 874 576 1.9 Remainder 217 432 5.5
All commodity groups 112 691 382 100.0 1.70 1.01 All commodity groups 1 797 095 100.0 0.04 0.02333 Crude petroleum & bituminous oil 49 469 803 43.9 43.42 5.89 222 Oil seed etc for soft oil 539 763 30.0 5.29 2.43343 Natural gas, liquefied or not 18 919 708 16.8 24.94 10.72 011 Beef, fresh chilled frozen 327 322 18.2 5.13 1.43334 Heavy petroleum & bituminous oil 4 956 252 4.4 2.84 1.19 081 Animal feed excluding unmilled cereal 141 796 7.9 1.11 0.45684 Aluminium 4 466 058 4.0 7.65 5.09 421 Fixed veg fat and oil, "soft" 104 407 5.8 1.50 0.58034 Fish, fresh live chilled frozen 4 126 990 3.7 19.77 11.52 044 Maize unmilled, excluding sweet corn 104 301 5.8 3.38 0.85342 Liquefied propane and butane 2 123 311 1.9 23.33 7.55 611 Leather 62 340 3.5 0.52 0.29683 Nickel 1 565 199 1.4 13.98 8.86 263 Cotton 61 455 3.4 1.53 0.56793 Ships boats floating structures 1 549 962 1.4 3.77 1.95 248 Wood simply worked, railway sleeper 57 244 3.2 0.75 0.16874 Measure analyze control device nes 859 458 0.8 0.87 0.73 041 Wheat meslin, incl spelt, unmilled 53 630 3.0 2.75 0.28641 Paper and paperboard 825 058 0.7 0.97 0.83 061 Sugar, mollasses and honey 23 326 1.3 0.20 0.12Remainder 23 829 584 21.1 Remainder 321 512 17.9
For sources and notes, see end of table. Pour les sources et les notes, se reporter à la fin du tableau.
Leading products exported basedon average 2005-2006 valuesSITC Revision 3 (3-digit level)
Principaux produits exportés d'aprèsla moyenne des valeurs de 2005-2006CTCI révision 3 (positions à 3 chiffres)
2005-2006
Value(f.o.b., thousands
of dollars)
Valeur(f.a.b., milliers
de dollars)
As percentageEn pourcentage Value
(f.o.b., thousandsof dollars)
Valeur(f.a.b., milliers
de dollars)
As percentageEn pourcentage
Panama (**=Developing)
Papua New Guinea - Papouasie-Nouvelle-Guinée (**=Developing)
Paraguay (**=Developing)
Nigeria - Nigéria (**=Developing)
Norway - Norvège (**=Developed)
Niger (**=Developing)
Oman (**=Developing)
Pakistan (**=Developing)
New Zealand - Nouvelle-Zélande (**=Developed)
Nicaragua (**=Developing)
Leading products exported basedon average 2005-2006 valuesSITC Revision 3 (3-digit level)
Principaux produits exportés d'aprèsla moyenne des valeurs de 2005-2006CTCI révision 3 (positions à 3 chiffres)
2005-2006
3.2.D Export structure by productIndividual countries and territories
3.2.D Structure des exportations par produitsPays et territoires individuels
167
3
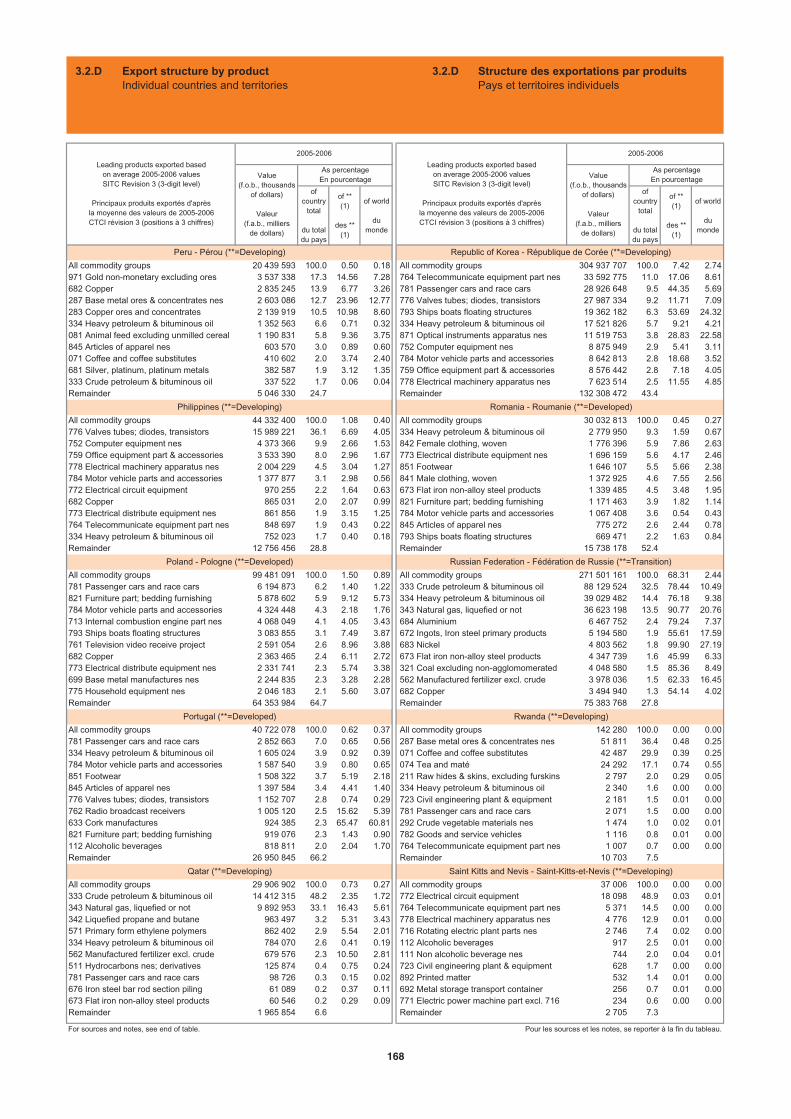
ofcountry
total
du totaldu pays
of ** (1)
des ** (1)
of world
dumonde
ofcountry
total
du totaldu pays
of ** (1)
des ** (1)
of world
dumonde
All commodity groups 20 439 593 100.0 0.50 0.18 All commodity groups 304 937 707 100.0 7.42 2.74971 Gold non-monetary excluding ores 3 537 338 17.3 14.56 7.28 764 Telecommunicate equipment part nes 33 592 775 11.0 17.06 8.61682 Copper 2 835 245 13.9 6.77 3.26 781 Passenger cars and race cars 28 926 648 9.5 44.35 5.69287 Base metal ores & concentrates nes 2 603 086 12.7 23.96 12.77 776 Valves tubes; diodes, transistors 27 987 334 9.2 11.71 7.09283 Copper ores and concentrates 2 139 919 10.5 10.98 8.60 793 Ships boats floating structures 19 362 182 6.3 53.69 24.32334 Heavy petroleum & bituminous oil 1 352 563 6.6 0.71 0.32 334 Heavy petroleum & bituminous oil 17 521 826 5.7 9.21 4.21081 Animal feed excluding unmilled cereal 1 190 831 5.8 9.36 3.75 871 Optical instruments apparatus nes 11 519 753 3.8 28.83 22.58845 Articles of apparel nes 603 570 3.0 0.89 0.60 752 Computer equipment nes 8 875 949 2.9 5.41 3.11071 Coffee and coffee substitutes 410 602 2.0 3.74 2.40 784 Motor vehicle parts and accessories 8 642 813 2.8 18.68 3.52681 Silver, platinum, platinum metals 382 587 1.9 3.12 1.35 759 Office equipment part & accessories 8 576 442 2.8 7.18 4.05333 Crude petroleum & bituminous oil 337 522 1.7 0.06 0.04 778 Electrical machinery apparatus nes 7 623 514 2.5 11.55 4.85Remainder 5 046 330 24.7 Remainder 132 308 472 43.4
All commodity groups 44 332 400 100.0 1.08 0.40 All commodity groups 30 032 813 100.0 0.45 0.27776 Valves tubes; diodes, transistors 15 989 221 36.1 6.69 4.05 334 Heavy petroleum & bituminous oil 2 779 950 9.3 1.59 0.67752 Computer equipment nes 4 373 366 9.9 2.66 1.53 842 Female clothing, woven 1 776 396 5.9 7.86 2.63759 Office equipment part & accessories 3 533 390 8.0 2.96 1.67 773 Electrical distribute equipment nes 1 696 159 5.6 4.17 2.46778 Electrical machinery apparatus nes 2 004 229 4.5 3.04 1.27 851 Footwear 1 646 107 5.5 5.66 2.38784 Motor vehicle parts and accessories 1 377 877 3.1 2.98 0.56 841 Male clothing, woven 1 372 925 4.6 7.55 2.56772 Electrical circuit equipment 970 255 2.2 1.64 0.63 673 Flat iron non-alloy steel products 1 339 485 4.5 3.48 1.95682 Copper 865 031 2.0 2.07 0.99 821 Furniture part; bedding furnishing 1 171 463 3.9 1.82 1.14773 Electrical distribute equipment nes 861 856 1.9 3.15 1.25 784 Motor vehicle parts and accessories 1 067 408 3.6 0.54 0.43764 Telecommunicate equipment part nes 848 697 1.9 0.43 0.22 845 Articles of apparel nes 775 272 2.6 2.44 0.78334 Heavy petroleum & bituminous oil 752 023 1.7 0.40 0.18 793 Ships boats floating structures 669 471 2.2 1.63 0.84Remainder 12 756 456 28.8 Remainder 15 738 178 52.4
All commodity groups 99 481 091 100.0 1.50 0.89 All commodity groups 271 501 161 100.0 68.31 2.44781 Passenger cars and race cars 6 194 873 6.2 1.40 1.22 333 Crude petroleum & bituminous oil 88 129 524 32.5 78.44 10.49821 Furniture part; bedding furnishing 5 878 602 5.9 9.12 5.73 334 Heavy petroleum & bituminous oil 39 029 482 14.4 76.18 9.38784 Motor vehicle parts and accessories 4 324 448 4.3 2.18 1.76 343 Natural gas, liquefied or not 36 623 198 13.5 90.77 20.76713 Internal combustion engine part nes 4 068 049 4.1 4.05 3.43 684 Aluminium 6 467 752 2.4 79.24 7.37793 Ships boats floating structures 3 083 855 3.1 7.49 3.87 672 Ingots, Iron steel primary products 5 194 580 1.9 55.61 17.59761 Television video receive project 2 591 054 2.6 8.96 3.88 683 Nickel 4 803 562 1.8 99.90 27.19682 Copper 2 363 465 2.4 6.11 2.72 673 Flat iron non-alloy steel products 4 347 739 1.6 45.99 6.33773 Electrical distribute equipment nes 2 331 741 2.3 5.74 3.38 321 Coal excluding non-agglomomerated 4 048 580 1.5 85.36 8.49699 Base metal manufactures nes 2 244 835 2.3 3.28 2.28 562 Manufactured fertilizer excl. crude 3 978 036 1.5 62.33 16.45775 Household equipment nes 2 046 183 2.1 5.60 3.07 682 Copper 3 494 940 1.3 54.14 4.02Remainder 64 353 984 64.7 Remainder 75 383 768 27.8
All commodity groups 40 722 078 100.0 0.62 0.37 All commodity groups 142 280 100.0 0.00 0.00781 Passenger cars and race cars 2 852 663 7.0 0.65 0.56 287 Base metal ores & concentrates nes 51 811 36.4 0.48 0.25334 Heavy petroleum & bituminous oil 1 605 024 3.9 0.92 0.39 071 Coffee and coffee substitutes 42 487 29.9 0.39 0.25784 Motor vehicle parts and accessories 1 587 540 3.9 0.80 0.65 074 Tea and maté 24 292 17.1 0.74 0.55851 Footwear 1 508 322 3.7 5.19 2.18 211 Raw hides & skins, excluding furskins 2 797 2.0 0.29 0.05845 Articles of apparel nes 1 397 584 3.4 4.41 1.40 334 Heavy petroleum & bituminous oil 2 340 1.6 0.00 0.00776 Valves tubes; diodes, transistors 1 152 707 2.8 0.74 0.29 723 Civil engineering plant & equipment 2 181 1.5 0.01 0.00762 Radio broadcast receivers 1 005 120 2.5 15.62 5.39 781 Passenger cars and race cars 2 071 1.5 0.00 0.00633 Cork manufactures 924 385 2.3 65.47 60.81 292 Crude vegetable materials nes 1 474 1.0 0.02 0.01821 Furniture part; bedding furnishing 919 076 2.3 1.43 0.90 782 Goods and service vehicles 1 116 0.8 0.01 0.00112 Alcoholic beverages 818 811 2.0 2.04 1.70 764 Telecommunicate equipment part nes 1 007 0.7 0.00 0.00Remainder 26 950 845 66.2 Remainder 10 703 7.5
All commodity groups 29 906 902 100.0 0.73 0.27 All commodity groups 37 006 100.0 0.00 0.00333 Crude petroleum & bituminous oil 14 412 315 48.2 2.35 1.72 772 Electrical circuit equipment 18 098 48.9 0.03 0.01343 Natural gas, liquefied or not 9 892 953 33.1 16.43 5.61 764 Telecommunicate equipment part nes 5 371 14.5 0.00 0.00342 Liquefied propane and butane 963 497 3.2 5.31 3.43 778 Electrical machinery apparatus nes 4 776 12.9 0.01 0.00571 Primary form ethylene polymers 862 402 2.9 5.54 2.01 716 Rotating electric plant parts nes 2 746 7.4 0.02 0.00334 Heavy petroleum & bituminous oil 784 070 2.6 0.41 0.19 112 Alcoholic beverages 917 2.5 0.01 0.00562 Manufactured fertilizer excl. crude 679 576 2.3 10.50 2.81 111 Non alcoholic beverage nes 744 2.0 0.04 0.01511 Hydrocarbons nes; derivatives 125 874 0.4 0.75 0.24 723 Civil engineering plant & equipment 628 1.7 0.00 0.00781 Passenger cars and race cars 98 726 0.3 0.15 0.02 892 Printed matter 532 1.4 0.01 0.00676 Iron steel bar rod section piling 61 089 0.2 0.37 0.11 692 Metal storage transport container 256 0.7 0.01 0.00673 Flat iron non-alloy steel products 60 546 0.2 0.29 0.09 771 Electric power machine part excl. 716 234 0.6 0.00 0.00Remainder 1 965 854 6.6 Remainder 2 705 7.3
For sources and notes, see end of table. Pour les sources et les notes, se reporter à la fin du tableau.
Leading products exported basedon average 2005-2006 valuesSITC Revision 3 (3-digit level)
Principaux produits exportés d'aprèsla moyenne des valeurs de 2005-2006CTCI révision 3 (positions à 3 chiffres)
2005-2006
Leading products exported basedon average 2005-2006 valuesSITC Revision 3 (3-digit level)
Principaux produits exportés d'aprèsla moyenne des valeurs de 2005-2006CTCI révision 3 (positions à 3 chiffres)
2005-2006
Value(f.o.b., thousands
of dollars)
Valeur(f.a.b., milliers
de dollars)
As percentageEn pourcentage Value
(f.o.b., thousandsof dollars)
Valeur(f.a.b., milliers
de dollars)
As percentageEn pourcentage
Saint Kitts and Nevis - Saint-Kitts-et-Nevis (**=Developing)
Romania - Roumanie (**=Developed)
Russian Federation - Fédération de Russie (**=Transition)
Rwanda (**=Developing)
Philippines (**=Developing)
Poland - Pologne (**=Developed)
Portugal (**=Developed)
Qatar (**=Developing)
Peru - Pérou (**=Developing) Republic of Korea - République de Corée (**=Developing)
3.2.D Export structure by productIndividual countries and territories
3.2.D Structure des exportations par produitsPays et territoires individuels
168
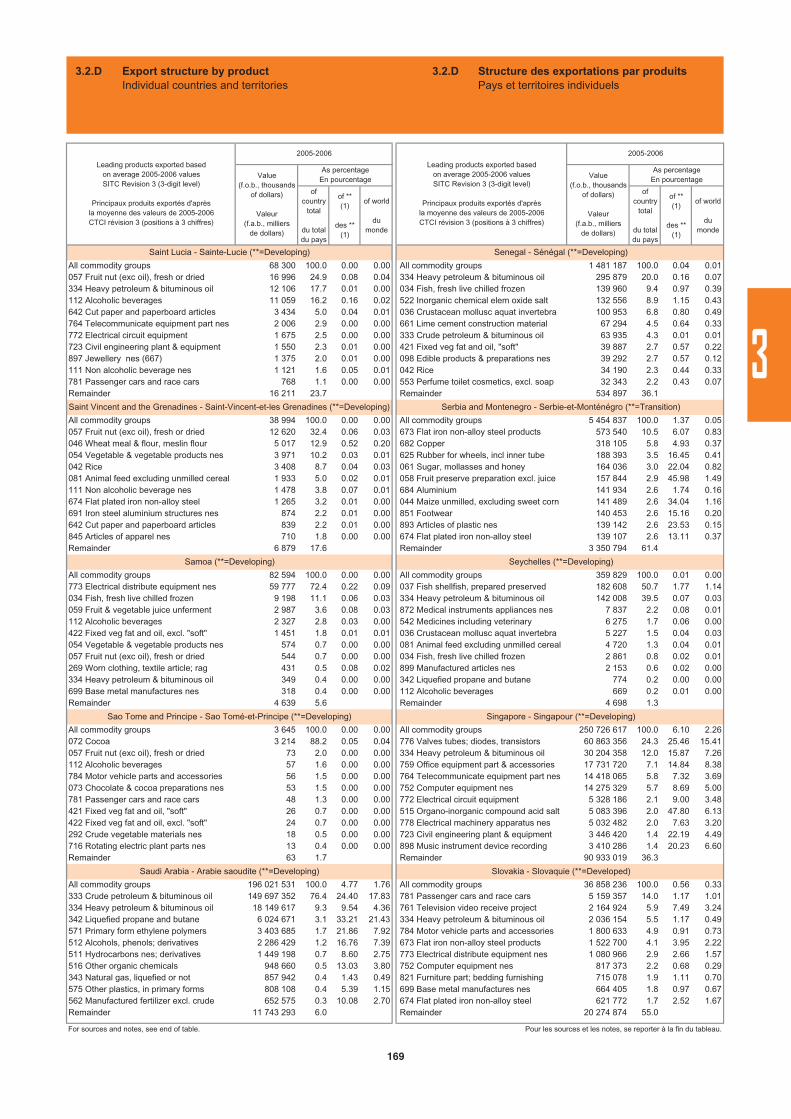
ofcountry
total
du totaldu pays
of ** (1)
des ** (1)
of world
dumonde
ofcountry
total
du totaldu pays
of ** (1)
des ** (1)
of world
dumonde
All commodity groups 68 300 100.0 0.00 0.00 All commodity groups 1 481 187 100.0 0.04 0.01057 Fruit nut (exc oil), fresh or dried 16 996 24.9 0.08 0.04 334 Heavy petroleum & bituminous oil 295 879 20.0 0.16 0.07334 Heavy petroleum & bituminous oil 12 106 17.7 0.01 0.00 034 Fish, fresh live chilled frozen 139 960 9.4 0.97 0.39112 Alcoholic beverages 11 059 16.2 0.16 0.02 522 Inorganic chemical elem oxide salt 132 556 8.9 1.15 0.43642 Cut paper and paperboard articles 3 434 5.0 0.04 0.01 036 Crustacean mollusc aquat invertebra 100 953 6.8 0.80 0.49764 Telecommunicate equipment part nes 2 006 2.9 0.00 0.00 661 Lime cement construction material 67 294 4.5 0.64 0.33772 Electrical circuit equipment 1 675 2.5 0.00 0.00 333 Crude petroleum & bituminous oil 63 935 4.3 0.01 0.01723 Civil engineering plant & equipment 1 550 2.3 0.01 0.00 421 Fixed veg fat and oil, "soft" 39 887 2.7 0.57 0.22897 Jewellery nes (667) 1 375 2.0 0.01 0.00 098 Edible products & preparations nes 39 292 2.7 0.57 0.12111 Non alcoholic beverage nes 1 121 1.6 0.05 0.01 042 Rice 34 190 2.3 0.44 0.33781 Passenger cars and race cars 768 1.1 0.00 0.00 553 Perfume toilet cosmetics, excl. soap 32 343 2.2 0.43 0.07Remainder 16 211 23.7 Remainder 534 897 36.1
All commodity groups 38 994 100.0 0.00 0.00 All commodity groups 5 454 837 100.0 1.37 0.05057 Fruit nut (exc oil), fresh or dried 12 620 32.4 0.06 0.03 673 Flat iron non-alloy steel products 573 540 10.5 6.07 0.83046 Wheat meal & flour, meslin flour 5 017 12.9 0.52 0.20 682 Copper 318 105 5.8 4.93 0.37054 Vegetable & vegetable products nes 3 971 10.2 0.03 0.01 625 Rubber for wheels, incl inner tube 188 393 3.5 16.45 0.41042 Rice 3 408 8.7 0.04 0.03 061 Sugar, mollasses and honey 164 036 3.0 22.04 0.82081 Animal feed excluding unmilled cereal 1 933 5.0 0.02 0.01 058 Fruit preserve preparation excl. juice 157 844 2.9 45.98 1.49111 Non alcoholic beverage nes 1 478 3.8 0.07 0.01 684 Aluminium 141 934 2.6 1.74 0.16674 Flat plated iron non-alloy steel 1 265 3.2 0.01 0.00 044 Maize unmilled, excluding sweet corn 141 489 2.6 34.04 1.16691 Iron steel aluminium structures nes 874 2.2 0.01 0.00 851 Footwear 140 453 2.6 15.16 0.20642 Cut paper and paperboard articles 839 2.2 0.01 0.00 893 Articles of plastic nes 139 142 2.6 23.53 0.15845 Articles of apparel nes 710 1.8 0.00 0.00 674 Flat plated iron non-alloy steel 139 107 2.6 13.11 0.37Remainder 6 879 17.6 Remainder 3 350 794 61.4
All commodity groups 82 594 100.0 0.00 0.00 All commodity groups 359 829 100.0 0.01 0.00773 Electrical distribute equipment nes 59 777 72.4 0.22 0.09 037 Fish shellfish, prepared preserved 182 608 50.7 1.77 1.14034 Fish, fresh live chilled frozen 9 198 11.1 0.06 0.03 334 Heavy petroleum & bituminous oil 142 008 39.5 0.07 0.03059 Fruit & vegetable juice unferment 2 987 3.6 0.08 0.03 872 Medical instruments appliances nes 7 837 2.2 0.08 0.01112 Alcoholic beverages 2 327 2.8 0.03 0.00 542 Medicines including veterinary 6 275 1.7 0.06 0.00422 Fixed veg fat and oil, excl. "soft" 1 451 1.8 0.01 0.01 036 Crustacean mollusc aquat invertebra 5 227 1.5 0.04 0.03054 Vegetable & vegetable products nes 574 0.7 0.00 0.00 081 Animal feed excluding unmilled cereal 4 720 1.3 0.04 0.01057 Fruit nut (exc oil), fresh or dried 544 0.7 0.00 0.00 034 Fish, fresh live chilled frozen 2 861 0.8 0.02 0.01269 Worn clothing, textile article; rag 431 0.5 0.08 0.02 899 Manufactured articles nes 2 153 0.6 0.02 0.00334 Heavy petroleum & bituminous oil 349 0.4 0.00 0.00 342 Liquefied propane and butane 774 0.2 0.00 0.00699 Base metal manufactures nes 318 0.4 0.00 0.00 112 Alcoholic beverages 669 0.2 0.01 0.00Remainder 4 639 5.6 Remainder 4 698 1.3
All commodity groups 3 645 100.0 0.00 0.00 All commodity groups 250 726 617 100.0 6.10 2.26072 Cocoa 3 214 88.2 0.05 0.04 776 Valves tubes; diodes, transistors 60 863 356 24.3 25.46 15.41057 Fruit nut (exc oil), fresh or dried 73 2.0 0.00 0.00 334 Heavy petroleum & bituminous oil 30 204 358 12.0 15.87 7.26112 Alcoholic beverages 57 1.6 0.00 0.00 759 Office equipment part & accessories 17 731 720 7.1 14.84 8.38784 Motor vehicle parts and accessories 56 1.5 0.00 0.00 764 Telecommunicate equipment part nes 14 418 065 5.8 7.32 3.69073 Chocolate & cocoa preparations nes 53 1.5 0.00 0.00 752 Computer equipment nes 14 275 329 5.7 8.69 5.00781 Passenger cars and race cars 48 1.3 0.00 0.00 772 Electrical circuit equipment 5 328 186 2.1 9.00 3.48421 Fixed veg fat and oil, "soft" 26 0.7 0.00 0.00 515 Organo-inorganic compound acid salt 5 083 396 2.0 47.80 6.13422 Fixed veg fat and oil, excl. "soft" 24 0.7 0.00 0.00 778 Electrical machinery apparatus nes 5 032 482 2.0 7.63 3.20292 Crude vegetable materials nes 18 0.5 0.00 0.00 723 Civil engineering plant & equipment 3 446 420 1.4 22.19 4.49716 Rotating electric plant parts nes 13 0.4 0.00 0.00 898 Music instrument device recording 3 410 286 1.4 20.23 6.60Remainder 63 1.7 Remainder 90 933 019 36.3
All commodity groups 196 021 531 100.0 4.77 1.76 All commodity groups 36 858 236 100.0 0.56 0.33333 Crude petroleum & bituminous oil 149 697 352 76.4 24.40 17.83 781 Passenger cars and race cars 5 159 357 14.0 1.17 1.01334 Heavy petroleum & bituminous oil 18 149 617 9.3 9.54 4.36 761 Television video receive project 2 164 924 5.9 7.49 3.24342 Liquefied propane and butane 6 024 671 3.1 33.21 21.43 334 Heavy petroleum & bituminous oil 2 036 154 5.5 1.17 0.49571 Primary form ethylene polymers 3 403 685 1.7 21.86 7.92 784 Motor vehicle parts and accessories 1 800 633 4.9 0.91 0.73512 Alcohols, phenols; derivatives 2 286 429 1.2 16.76 7.39 673 Flat iron non-alloy steel products 1 522 700 4.1 3.95 2.22511 Hydrocarbons nes; derivatives 1 449 198 0.7 8.60 2.75 773 Electrical distribute equipment nes 1 080 966 2.9 2.66 1.57516 Other organic chemicals 948 660 0.5 13.03 3.80 752 Computer equipment nes 817 373 2.2 0.68 0.29343 Natural gas, liquefied or not 857 942 0.4 1.43 0.49 821 Furniture part; bedding furnishing 715 078 1.9 1.11 0.70575 Other plastics, in primary forms 808 108 0.4 5.39 1.15 699 Base metal manufactures nes 664 405 1.8 0.97 0.67562 Manufactured fertilizer excl. crude 652 575 0.3 10.08 2.70 674 Flat plated iron non-alloy steel 621 772 1.7 2.52 1.67Remainder 11 743 293 6.0 Remainder 20 274 874 55.0
For sources and notes, see end of table. Pour les sources et les notes, se reporter à la fin du tableau.
Value(f.o.b., thousands
of dollars)
Valeur(f.a.b., milliers
de dollars)
As percentageEn pourcentage Value
(f.o.b., thousandsof dollars)
Valeur(f.a.b., milliers
de dollars)
As percentageEn pourcentage
Seychelles (**=Developing)
Singapore - Singapour (**=Developing)
Slovakia - Slovaquie (**=Developed)
Sao Tome and Principe - Sao Tomé-et-Principe (**=Developing)
Saudi Arabia - Arabie saoudite (**=Developing)
Samoa (**=Developing)
Serbia and Montenegro - Serbie-et-Monténégro (**=Transition)
Saint Lucia - Sainte-Lucie (**=Developing)
Saint Vincent and the Grenadines - Saint-Vincent-et-les Grenadines (**=Developing)
Leading products exported basedon average 2005-2006 valuesSITC Revision 3 (3-digit level)
Principaux produits exportés d'aprèsla moyenne des valeurs de 2005-2006CTCI révision 3 (positions à 3 chiffres)
2005-2006
Leading products exported basedon average 2005-2006 valuesSITC Revision 3 (3-digit level)
Principaux produits exportés d'aprèsla moyenne des valeurs de 2005-2006CTCI révision 3 (positions à 3 chiffres)
2005-2006
Senegal - Sénégal (**=Developing)
3.2.D Export structure by productIndividual countries and territories
3.2.D Structure des exportations par produitsPays et territoires individuels
169
3
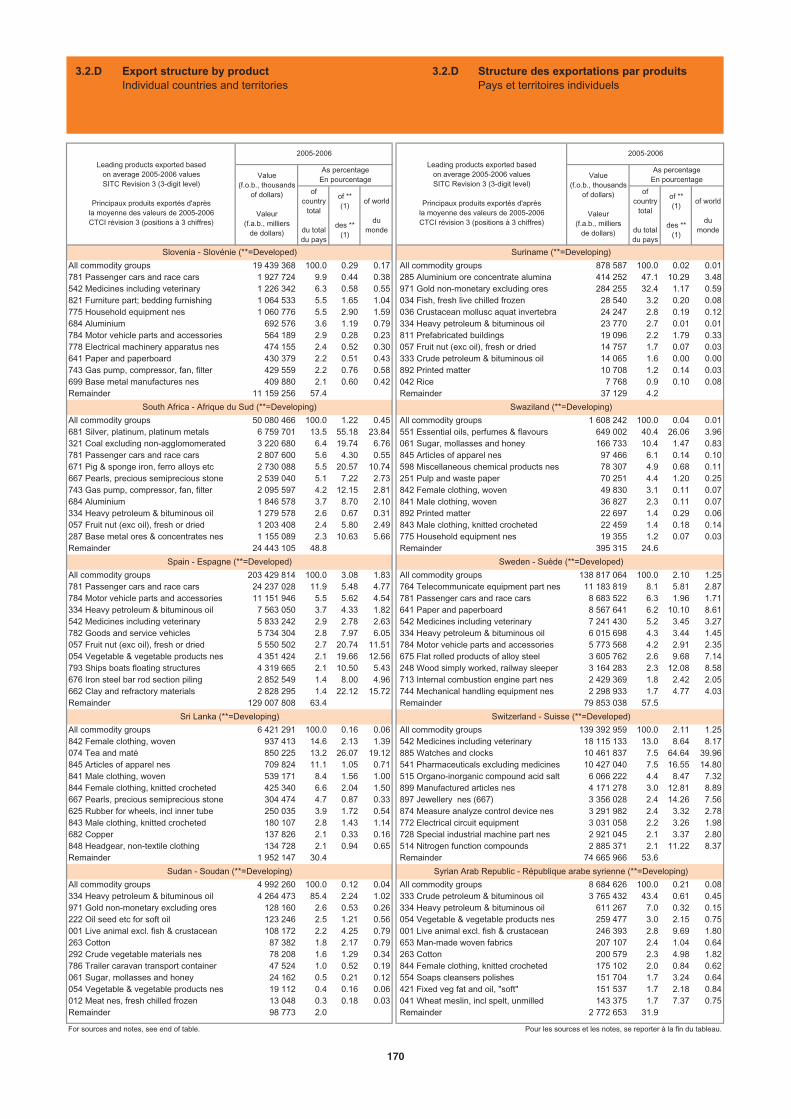
ofcountry
total
du totaldu pays
of ** (1)
des ** (1)
of world
dumonde
ofcountry
total
du totaldu pays
of ** (1)
des ** (1)
of world
dumonde
All commodity groups 19 439 368 100.0 0.29 0.17 All commodity groups 878 587 100.0 0.02 0.01781 Passenger cars and race cars 1 927 724 9.9 0.44 0.38 285 Aluminium ore concentrate alumina 414 252 47.1 10.29 3.48542 Medicines including veterinary 1 226 342 6.3 0.58 0.55 971 Gold non-monetary excluding ores 284 255 32.4 1.17 0.59821 Furniture part; bedding furnishing 1 064 533 5.5 1.65 1.04 034 Fish, fresh live chilled frozen 28 540 3.2 0.20 0.08775 Household equipment nes 1 060 776 5.5 2.90 1.59 036 Crustacean mollusc aquat invertebra 24 247 2.8 0.19 0.12684 Aluminium 692 576 3.6 1.19 0.79 334 Heavy petroleum & bituminous oil 23 770 2.7 0.01 0.01784 Motor vehicle parts and accessories 564 189 2.9 0.28 0.23 811 Prefabricated buildings 19 096 2.2 1.79 0.33778 Electrical machinery apparatus nes 474 155 2.4 0.52 0.30 057 Fruit nut (exc oil), fresh or dried 14 757 1.7 0.07 0.03641 Paper and paperboard 430 379 2.2 0.51 0.43 333 Crude petroleum & bituminous oil 14 065 1.6 0.00 0.00743 Gas pump, compressor, fan, filter 429 559 2.2 0.76 0.58 892 Printed matter 10 708 1.2 0.14 0.03699 Base metal manufactures nes 409 880 2.1 0.60 0.42 042 Rice 7 768 0.9 0.10 0.08Remainder 11 159 256 57.4 Remainder 37 129 4.2
All commodity groups 50 080 466 100.0 1.22 0.45 All commodity groups 1 608 242 100.0 0.04 0.01681 Silver, platinum, platinum metals 6 759 701 13.5 55.18 23.84 551 Essential oils, perfumes & flavours 649 002 40.4 26.06 3.96321 Coal excluding non-agglomomerated 3 220 680 6.4 19.74 6.76 061 Sugar, mollasses and honey 166 733 10.4 1.47 0.83781 Passenger cars and race cars 2 807 600 5.6 4.30 0.55 845 Articles of apparel nes 97 466 6.1 0.14 0.10671 Pig & sponge iron, ferro alloys etc 2 730 088 5.5 20.57 10.74 598 Miscellaneous chemical products nes 78 307 4.9 0.68 0.11667 Pearls, precious semiprecious stone 2 539 040 5.1 7.22 2.73 251 Pulp and waste paper 70 251 4.4 1.20 0.25743 Gas pump, compressor, fan, filter 2 095 597 4.2 12.15 2.81 842 Female clothing, woven 49 830 3.1 0.11 0.07684 Aluminium 1 846 578 3.7 8.70 2.10 841 Male clothing, woven 36 827 2.3 0.11 0.07334 Heavy petroleum & bituminous oil 1 279 578 2.6 0.67 0.31 892 Printed matter 22 697 1.4 0.29 0.06057 Fruit nut (exc oil), fresh or dried 1 203 408 2.4 5.80 2.49 843 Male clothing, knitted crocheted 22 459 1.4 0.18 0.14287 Base metal ores & concentrates nes 1 155 089 2.3 10.63 5.66 775 Household equipment nes 19 355 1.2 0.07 0.03Remainder 24 443 105 48.8 Remainder 395 315 24.6
All commodity groups 203 429 814 100.0 3.08 1.83 All commodity groups 138 817 064 100.0 2.10 1.25781 Passenger cars and race cars 24 237 028 11.9 5.48 4.77 764 Telecommunicate equipment part nes 11 183 819 8.1 5.81 2.87784 Motor vehicle parts and accessories 11 151 946 5.5 5.62 4.54 781 Passenger cars and race cars 8 683 522 6.3 1.96 1.71334 Heavy petroleum & bituminous oil 7 563 050 3.7 4.33 1.82 641 Paper and paperboard 8 567 641 6.2 10.10 8.61542 Medicines including veterinary 5 833 242 2.9 2.78 2.63 542 Medicines including veterinary 7 241 430 5.2 3.45 3.27782 Goods and service vehicles 5 734 304 2.8 7.97 6.05 334 Heavy petroleum & bituminous oil 6 015 698 4.3 3.44 1.45057 Fruit nut (exc oil), fresh or dried 5 550 502 2.7 20.74 11.51 784 Motor vehicle parts and accessories 5 773 568 4.2 2.91 2.35054 Vegetable & vegetable products nes 4 351 424 2.1 19.66 12.56 675 Flat rolled products of alloy steel 3 605 762 2.6 9.68 7.14793 Ships boats floating structures 4 319 665 2.1 10.50 5.43 248 Wood simply worked, railway sleeper 3 164 283 2.3 12.08 8.58676 Iron steel bar rod section piling 2 852 549 1.4 8.00 4.96 713 Internal combustion engine part nes 2 429 369 1.8 2.42 2.05662 Clay and refractory materials 2 828 295 1.4 22.12 15.72 744 Mechanical handling equipment nes 2 298 933 1.7 4.77 4.03Remainder 129 007 808 63.4 Remainder 79 853 038 57.5
All commodity groups 6 421 291 100.0 0.16 0.06 All commodity groups 139 392 959 100.0 2.11 1.25842 Female clothing, woven 937 413 14.6 2.13 1.39 542 Medicines including veterinary 18 115 133 13.0 8.64 8.17074 Tea and maté 850 225 13.2 26.07 19.12 885 Watches and clocks 10 461 837 7.5 64.64 39.96845 Articles of apparel nes 709 824 11.1 1.05 0.71 541 Pharmaceuticals excluding medicines 10 427 040 7.5 16.55 14.80841 Male clothing, woven 539 171 8.4 1.56 1.00 515 Organo-inorganic compound acid salt 6 066 222 4.4 8.47 7.32844 Female clothing, knitted crocheted 425 340 6.6 2.04 1.50 899 Manufactured articles nes 4 171 278 3.0 12.81 8.89667 Pearls, precious semiprecious stone 304 474 4.7 0.87 0.33 897 Jewellery nes (667) 3 356 028 2.4 14.26 7.56625 Rubber for wheels, incl inner tube 250 035 3.9 1.72 0.54 874 Measure analyze control device nes 3 291 982 2.4 3.32 2.78843 Male clothing, knitted crocheted 180 107 2.8 1.43 1.14 772 Electrical circuit equipment 3 031 058 2.2 3.26 1.98682 Copper 137 826 2.1 0.33 0.16 728 Special industrial machine part nes 2 921 045 2.1 3.37 2.80848 Headgear, non-textile clothing 134 728 2.1 0.94 0.65 514 Nitrogen function compounds 2 885 371 2.1 11.22 8.37Remainder 1 952 147 30.4 Remainder 74 665 966 53.6
All commodity groups 4 992 260 100.0 0.12 0.04 All commodity groups 8 684 626 100.0 0.21 0.08334 Heavy petroleum & bituminous oil 4 264 473 85.4 2.24 1.02 333 Crude petroleum & bituminous oil 3 765 432 43.4 0.61 0.45971 Gold non-monetary excluding ores 128 160 2.6 0.53 0.26 334 Heavy petroleum & bituminous oil 611 267 7.0 0.32 0.15222 Oil seed etc for soft oil 123 246 2.5 1.21 0.56 054 Vegetable & vegetable products nes 259 477 3.0 2.15 0.75001 Live animal excl. fish & crustacean 108 172 2.2 4.25 0.79 001 Live animal excl. fish & crustacean 246 393 2.8 9.69 1.80263 Cotton 87 382 1.8 2.17 0.79 653 Man-made woven fabrics 207 107 2.4 1.04 0.64292 Crude vegetable materials nes 78 208 1.6 1.29 0.34 263 Cotton 200 579 2.3 4.98 1.82786 Trailer caravan transport container 47 524 1.0 0.52 0.19 844 Female clothing, knitted crocheted 175 102 2.0 0.84 0.62061 Sugar, mollasses and honey 24 162 0.5 0.21 0.12 554 Soaps cleansers polishes 151 704 1.7 3.24 0.64054 Vegetable & vegetable products nes 19 112 0.4 0.16 0.06 421 Fixed veg fat and oil, "soft" 151 537 1.7 2.18 0.84012 Meat nes, fresh chilled frozen 13 048 0.3 0.18 0.03 041 Wheat meslin, incl spelt, unmilled 143 375 1.7 7.37 0.75Remainder 98 773 2.0 Remainder 2 772 653 31.9
For sources and notes, see end of table. Pour les sources et les notes, se reporter à la fin du tableau.
Leading products exported basedon average 2005-2006 valuesSITC Revision 3 (3-digit level)
Principaux produits exportés d'aprèsla moyenne des valeurs de 2005-2006CTCI révision 3 (positions à 3 chiffres)
2005-2006
Leading products exported basedon average 2005-2006 valuesSITC Revision 3 (3-digit level)
Principaux produits exportés d'aprèsla moyenne des valeurs de 2005-2006CTCI révision 3 (positions à 3 chiffres)
2005-2006
Value(f.o.b., thousands
of dollars)
Valeur(f.a.b., milliers
de dollars)
As percentageEn pourcentage Value
(f.o.b., thousandsof dollars)
Valeur(f.a.b., milliers
de dollars)
As percentageEn pourcentage
Syrian Arab Republic - République arabe syrienne (**=Developing)
Swaziland (**=Developing)
Sweden - Suède (**=Developed)
Switzerland - Suisse (**=Developed)
South Africa - Afrique du Sud (**=Developing)
Spain - Espagne (**=Developed)
Sri Lanka (**=Developing)
Sudan - Soudan (**=Developing)
Slovenia - Slovénie (**=Developed) Suriname (**=Developing)
3.2.D Export structure by productIndividual countries and territories
3.2.D Structure des exportations par produitsPays et territoires individuels
170
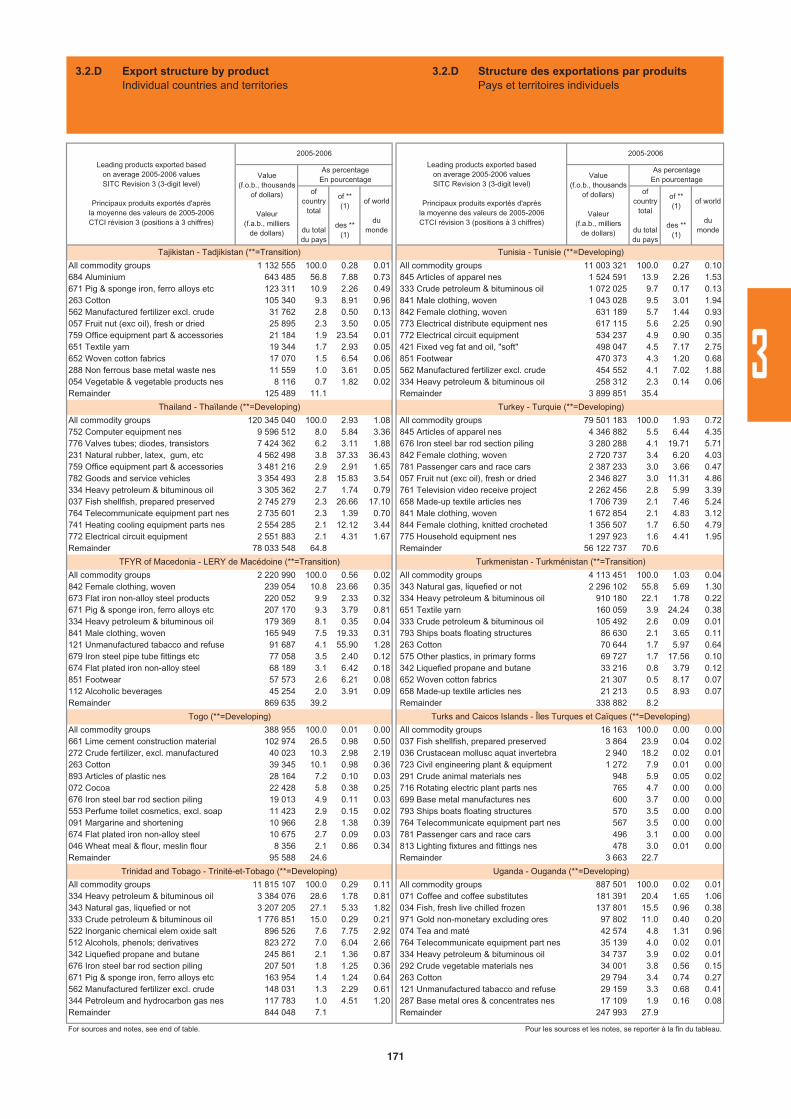
ofcountry
total
du totaldu pays
of ** (1)
des ** (1)
of world
dumonde
ofcountry
total
du totaldu pays
of ** (1)
des ** (1)
of world
dumonde
All commodity groups 1 132 555 100.0 0.28 0.01 All commodity groups 11 003 321 100.0 0.27 0.10684 Aluminium 643 485 56.8 7.88 0.73 845 Articles of apparel nes 1 524 591 13.9 2.26 1.53671 Pig & sponge iron, ferro alloys etc 123 311 10.9 2.26 0.49 333 Crude petroleum & bituminous oil 1 072 025 9.7 0.17 0.13263 Cotton 105 340 9.3 8.91 0.96 841 Male clothing, woven 1 043 028 9.5 3.01 1.94562 Manufactured fertilizer excl. crude 31 762 2.8 0.50 0.13 842 Female clothing, woven 631 189 5.7 1.44 0.93057 Fruit nut (exc oil), fresh or dried 25 895 2.3 3.50 0.05 773 Electrical distribute equipment nes 617 115 5.6 2.25 0.90759 Office equipment part & accessories 21 184 1.9 23.54 0.01 772 Electrical circuit equipment 534 237 4.9 0.90 0.35651 Textile yarn 19 344 1.7 2.93 0.05 421 Fixed veg fat and oil, "soft" 498 047 4.5 7.17 2.75652 Woven cotton fabrics 17 070 1.5 6.54 0.06 851 Footwear 470 373 4.3 1.20 0.68288 Non ferrous base metal waste nes 11 559 1.0 3.61 0.05 562 Manufactured fertilizer excl. crude 454 552 4.1 7.02 1.88054 Vegetable & vegetable products nes 8 116 0.7 1.82 0.02 334 Heavy petroleum & bituminous oil 258 312 2.3 0.14 0.06Remainder 125 489 11.1 Remainder 3 899 851 35.4
All commodity groups 120 345 040 100.0 2.93 1.08 All commodity groups 79 501 183 100.0 1.93 0.72752 Computer equipment nes 9 596 512 8.0 5.84 3.36 845 Articles of apparel nes 4 346 882 5.5 6.44 4.35776 Valves tubes; diodes, transistors 7 424 362 6.2 3.11 1.88 676 Iron steel bar rod section piling 3 280 288 4.1 19.71 5.71231 Natural rubber, latex, gum, etc 4 562 498 3.8 37.33 36.43 842 Female clothing, woven 2 720 737 3.4 6.20 4.03759 Office equipment part & accessories 3 481 216 2.9 2.91 1.65 781 Passenger cars and race cars 2 387 233 3.0 3.66 0.47782 Goods and service vehicles 3 354 493 2.8 15.83 3.54 057 Fruit nut (exc oil), fresh or dried 2 346 827 3.0 11.31 4.86334 Heavy petroleum & bituminous oil 3 305 362 2.7 1.74 0.79 761 Television video receive project 2 262 456 2.8 5.99 3.39037 Fish shellfish, prepared preserved 2 745 279 2.3 26.66 17.10 658 Made-up textile articles nes 1 706 739 2.1 7.46 5.24764 Telecommunicate equipment part nes 2 735 601 2.3 1.39 0.70 841 Male clothing, woven 1 672 854 2.1 4.83 3.12741 Heating cooling equipment parts nes 2 554 285 2.1 12.12 3.44 844 Female clothing, knitted crocheted 1 356 507 1.7 6.50 4.79772 Electrical circuit equipment 2 551 883 2.1 4.31 1.67 775 Household equipment nes 1 297 923 1.6 4.41 1.95Remainder 78 033 548 64.8 Remainder 56 122 737 70.6
All commodity groups 2 220 990 100.0 0.56 0.02 All commodity groups 4 113 451 100.0 1.03 0.04842 Female clothing, woven 239 054 10.8 23.66 0.35 343 Natural gas, liquefied or not 2 296 102 55.8 5.69 1.30673 Flat iron non-alloy steel products 220 052 9.9 2.33 0.32 334 Heavy petroleum & bituminous oil 910 180 22.1 1.78 0.22671 Pig & sponge iron, ferro alloys etc 207 170 9.3 3.79 0.81 651 Textile yarn 160 059 3.9 24.24 0.38334 Heavy petroleum & bituminous oil 179 369 8.1 0.35 0.04 333 Crude petroleum & bituminous oil 105 492 2.6 0.09 0.01841 Male clothing, woven 165 949 7.5 19.33 0.31 793 Ships boats floating structures 86 630 2.1 3.65 0.11121 Unmanufactured tabacco and refuse 91 687 4.1 55.90 1.28 263 Cotton 70 644 1.7 5.97 0.64679 Iron steel pipe tube fittings etc 77 058 3.5 2.40 0.12 575 Other plastics, in primary forms 69 727 1.7 17.56 0.10674 Flat plated iron non-alloy steel 68 189 3.1 6.42 0.18 342 Liquefied propane and butane 33 216 0.8 3.79 0.12851 Footwear 57 573 2.6 6.21 0.08 652 Woven cotton fabrics 21 307 0.5 8.17 0.07112 Alcoholic beverages 45 254 2.0 3.91 0.09 658 Made-up textile articles nes 21 213 0.5 8.93 0.07Remainder 869 635 39.2 Remainder 338 882 8.2
All commodity groups 388 955 100.0 0.01 0.00 All commodity groups 16 163 100.0 0.00 0.00661 Lime cement construction material 102 974 26.5 0.98 0.50 037 Fish shellfish, prepared preserved 3 864 23.9 0.04 0.02272 Crude fertilizer, excl. manufactured 40 023 10.3 2.98 2.19 036 Crustacean mollusc aquat invertebra 2 940 18.2 0.02 0.01263 Cotton 39 345 10.1 0.98 0.36 723 Civil engineering plant & equipment 1 272 7.9 0.01 0.00893 Articles of plastic nes 28 164 7.2 0.10 0.03 291 Crude animal materials nes 948 5.9 0.05 0.02072 Cocoa 22 428 5.8 0.38 0.25 716 Rotating electric plant parts nes 765 4.7 0.00 0.00676 Iron steel bar rod section piling 19 013 4.9 0.11 0.03 699 Base metal manufactures nes 600 3.7 0.00 0.00553 Perfume toilet cosmetics, excl. soap 11 423 2.9 0.15 0.02 793 Ships boats floating structures 570 3.5 0.00 0.00091 Margarine and shortening 10 966 2.8 1.38 0.39 764 Telecommunicate equipment part nes 567 3.5 0.00 0.00674 Flat plated iron non-alloy steel 10 675 2.7 0.09 0.03 781 Passenger cars and race cars 496 3.1 0.00 0.00046 Wheat meal & flour, meslin flour 8 356 2.1 0.86 0.34 813 Lighting fixtures and fittings nes 478 3.0 0.01 0.00Remainder 95 588 24.6 Remainder 3 663 22.7
All commodity groups 11 815 107 100.0 0.29 0.11 All commodity groups 887 501 100.0 0.02 0.01334 Heavy petroleum & bituminous oil 3 384 076 28.6 1.78 0.81 071 Coffee and coffee substitutes 181 391 20.4 1.65 1.06343 Natural gas, liquefied or not 3 207 205 27.1 5.33 1.82 034 Fish, fresh live chilled frozen 137 801 15.5 0.96 0.38333 Crude petroleum & bituminous oil 1 776 851 15.0 0.29 0.21 971 Gold non-monetary excluding ores 97 802 11.0 0.40 0.20522 Inorganic chemical elem oxide salt 896 526 7.6 7.75 2.92 074 Tea and maté 42 574 4.8 1.31 0.96512 Alcohols, phenols; derivatives 823 272 7.0 6.04 2.66 764 Telecommunicate equipment part nes 35 139 4.0 0.02 0.01342 Liquefied propane and butane 245 861 2.1 1.36 0.87 334 Heavy petroleum & bituminous oil 34 737 3.9 0.02 0.01676 Iron steel bar rod section piling 207 501 1.8 1.25 0.36 292 Crude vegetable materials nes 34 001 3.8 0.56 0.15671 Pig & sponge iron, ferro alloys etc 163 954 1.4 1.24 0.64 263 Cotton 29 794 3.4 0.74 0.27562 Manufactured fertilizer excl. crude 148 031 1.3 2.29 0.61 121 Unmanufactured tabacco and refuse 29 159 3.3 0.68 0.41344 Petroleum and hydrocarbon gas nes 117 783 1.0 4.51 1.20 287 Base metal ores & concentrates nes 17 109 1.9 0.16 0.08Remainder 844 048 7.1 Remainder 247 993 27.9
For sources and notes, see end of table. Pour les sources et les notes, se reporter à la fin du tableau.
Value(f.o.b., thousands
of dollars)
Valeur(f.a.b., milliers
de dollars)
As percentageEn pourcentage Value
(f.o.b., thousandsof dollars)
Valeur(f.a.b., milliers
de dollars)
As percentageEn pourcentage
Turkmenistan - Turkménistan (**=Transition)
Turks and Caicos Islands - Îles Turques et Caïques (**=Developing)
Uganda - Ouganda (**=Developing)
Togo (**=Developing)
Trinidad and Tobago - Trinité-et-Tobago (**=Developing)
TFYR of Macedonia - LERY de Macédoine (**=Transition)
Turkey - Turquie (**=Developing)
Tajikistan - Tadjikistan (**=Transition)
Thailand - Thaïlande (**=Developing)
Leading products exported basedon average 2005-2006 valuesSITC Revision 3 (3-digit level)
Principaux produits exportés d'aprèsla moyenne des valeurs de 2005-2006CTCI révision 3 (positions à 3 chiffres)
2005-2006
Leading products exported basedon average 2005-2006 valuesSITC Revision 3 (3-digit level)
Principaux produits exportés d'aprèsla moyenne des valeurs de 2005-2006CTCI révision 3 (positions à 3 chiffres)
2005-2006
Tunisia - Tunisie (**=Developing)
3.2.D Export structure by productIndividual countries and territories
3.2.D Structure des exportations par produitsPays et territoires individuels
171
3
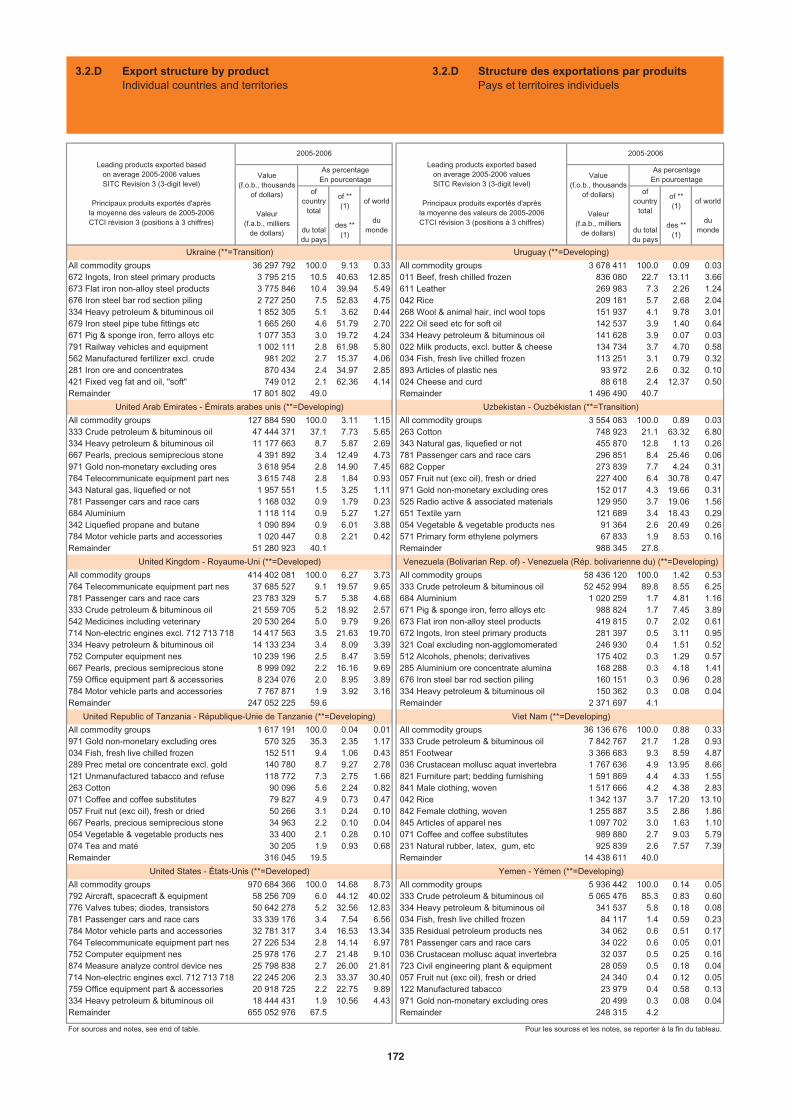
ofcountry
total
du totaldu pays
of ** (1)
des ** (1)
of world
dumonde
ofcountry
total
du totaldu pays
of ** (1)
des ** (1)
of world
dumonde
All commodity groups 36 297 792 100.0 9.13 0.33 All commodity groups 3 678 411 100.0 0.09 0.03672 Ingots, Iron steel primary products 3 795 215 10.5 40.63 12.85 011 Beef, fresh chilled frozen 836 080 22.7 13.11 3.66673 Flat iron non-alloy steel products 3 775 846 10.4 39.94 5.49 611 Leather 269 983 7.3 2.26 1.24676 Iron steel bar rod section piling 2 727 250 7.5 52.83 4.75 042 Rice 209 181 5.7 2.68 2.04334 Heavy petroleum & bituminous oil 1 852 305 5.1 3.62 0.44 268 Wool & animal hair, incl wool tops 151 937 4.1 9.78 3.01679 Iron steel pipe tube fittings etc 1 665 260 4.6 51.79 2.70 222 Oil seed etc for soft oil 142 537 3.9 1.40 0.64671 Pig & sponge iron, ferro alloys etc 1 077 353 3.0 19.72 4.24 334 Heavy petroleum & bituminous oil 141 628 3.9 0.07 0.03791 Railway vehicles and equipment 1 002 111 2.8 61.98 5.80 022 Milk products, excl. butter & cheese 134 734 3.7 4.70 0.58562 Manufactured fertilizer excl. crude 981 202 2.7 15.37 4.06 034 Fish, fresh live chilled frozen 113 251 3.1 0.79 0.32281 Iron ore and concentrates 870 434 2.4 34.97 2.85 893 Articles of plastic nes 93 972 2.6 0.32 0.10421 Fixed veg fat and oil, "soft" 749 012 2.1 62.36 4.14 024 Cheese and curd 88 618 2.4 12.37 0.50Remainder 17 801 802 49.0 Remainder 1 496 490 40.7
All commodity groups 127 884 590 100.0 3.11 1.15 All commodity groups 3 554 083 100.0 0.89 0.03333 Crude petroleum & bituminous oil 47 444 371 37.1 7.73 5.65 263 Cotton 748 923 21.1 63.32 6.80334 Heavy petroleum & bituminous oil 11 177 663 8.7 5.87 2.69 343 Natural gas, liquefied or not 455 870 12.8 1.13 0.26667 Pearls, precious semiprecious stone 4 391 892 3.4 12.49 4.73 781 Passenger cars and race cars 296 851 8.4 25.46 0.06971 Gold non-monetary excluding ores 3 618 954 2.8 14.90 7.45 682 Copper 273 839 7.7 4.24 0.31764 Telecommunicate equipment part nes 3 615 748 2.8 1.84 0.93 057 Fruit nut (exc oil), fresh or dried 227 400 6.4 30.78 0.47343 Natural gas, liquefied or not 1 957 551 1.5 3.25 1.11 971 Gold non-monetary excluding ores 152 017 4.3 19.66 0.31781 Passenger cars and race cars 1 168 032 0.9 1.79 0.23 525 Radio active & associated materials 129 950 3.7 19.06 1.56684 Aluminium 1 118 114 0.9 5.27 1.27 651 Textile yarn 121 689 3.4 18.43 0.29342 Liquefied propane and butane 1 090 894 0.9 6.01 3.88 054 Vegetable & vegetable products nes 91 364 2.6 20.49 0.26784 Motor vehicle parts and accessories 1 020 447 0.8 2.21 0.42 571 Primary form ethylene polymers 67 833 1.9 8.53 0.16Remainder 51 280 923 40.1 Remainder 988 345 27.8
All commodity groups 414 402 081 100.0 6.27 3.73 All commodity groups 58 436 120 100.0 1.42 0.53764 Telecommunicate equipment part nes 37 685 527 9.1 19.57 9.65 333 Crude petroleum & bituminous oil 52 452 994 89.8 8.55 6.25781 Passenger cars and race cars 23 783 329 5.7 5.38 4.68 684 Aluminium 1 020 259 1.7 4.81 1.16333 Crude petroleum & bituminous oil 21 559 705 5.2 18.92 2.57 671 Pig & sponge iron, ferro alloys etc 988 824 1.7 7.45 3.89542 Medicines including veterinary 20 530 264 5.0 9.79 9.26 673 Flat iron non-alloy steel products 419 815 0.7 2.02 0.61714 Non-electric engines excl. 712 713 718 14 417 563 3.5 21.63 19.70 672 Ingots, Iron steel primary products 281 397 0.5 3.11 0.95334 Heavy petroleum & bituminous oil 14 133 234 3.4 8.09 3.39 321 Coal excluding non-agglomomerated 246 930 0.4 1.51 0.52752 Computer equipment nes 10 239 196 2.5 8.47 3.59 512 Alcohols, phenols; derivatives 175 402 0.3 1.29 0.57667 Pearls, precious semiprecious stone 8 999 092 2.2 16.16 9.69 285 Aluminium ore concentrate alumina 168 288 0.3 4.18 1.41759 Office equipment part & accessories 8 234 076 2.0 8.95 3.89 676 Iron steel bar rod section piling 160 151 0.3 0.96 0.28784 Motor vehicle parts and accessories 7 767 871 1.9 3.92 3.16 334 Heavy petroleum & bituminous oil 150 362 0.3 0.08 0.04Remainder 247 052 225 59.6 Remainder 2 371 697 4.1
All commodity groups 1 617 191 100.0 0.04 0.01 All commodity groups 36 136 676 100.0 0.88 0.33971 Gold non-monetary excluding ores 570 325 35.3 2.35 1.17 333 Crude petroleum & bituminous oil 7 842 767 21.7 1.28 0.93034 Fish, fresh live chilled frozen 152 511 9.4 1.06 0.43 851 Footwear 3 366 683 9.3 8.59 4.87289 Prec metal ore concentrate excl. gold 140 780 8.7 9.27 2.78 036 Crustacean mollusc aquat invertebra 1 767 636 4.9 13.95 8.66121 Unmanufactured tabacco and refuse 118 772 7.3 2.75 1.66 821 Furniture part; bedding furnishing 1 591 869 4.4 4.33 1.55263 Cotton 90 096 5.6 2.24 0.82 841 Male clothing, woven 1 517 666 4.2 4.38 2.83071 Coffee and coffee substitutes 79 827 4.9 0.73 0.47 042 Rice 1 342 137 3.7 17.20 13.10057 Fruit nut (exc oil), fresh or dried 50 266 3.1 0.24 0.10 842 Female clothing, woven 1 255 887 3.5 2.86 1.86667 Pearls, precious semiprecious stone 34 963 2.2 0.10 0.04 845 Articles of apparel nes 1 097 702 3.0 1.63 1.10054 Vegetable & vegetable products nes 33 400 2.1 0.28 0.10 071 Coffee and coffee substitutes 989 880 2.7 9.03 5.79074 Tea and maté 30 205 1.9 0.93 0.68 231 Natural rubber, latex, gum, etc 925 839 2.6 7.57 7.39Remainder 316 045 19.5 Remainder 14 438 611 40.0
All commodity groups 970 684 366 100.0 14.68 8.73 All commodity groups 5 936 442 100.0 0.14 0.05792 Aircraft, spacecraft & equipment 58 256 709 6.0 44.12 40.02 333 Crude petroleum & bituminous oil 5 065 476 85.3 0.83 0.60776 Valves tubes; diodes, transistors 50 642 278 5.2 32.56 12.83 334 Heavy petroleum & bituminous oil 341 537 5.8 0.18 0.08781 Passenger cars and race cars 33 339 176 3.4 7.54 6.56 034 Fish, fresh live chilled frozen 84 117 1.4 0.59 0.23784 Motor vehicle parts and accessories 32 781 317 3.4 16.53 13.34 335 Residual petroleum products nes 34 062 0.6 0.51 0.17764 Telecommunicate equipment part nes 27 226 534 2.8 14.14 6.97 781 Passenger cars and race cars 34 022 0.6 0.05 0.01752 Computer equipment nes 25 978 176 2.7 21.48 9.10 036 Crustacean mollusc aquat invertebra 32 037 0.5 0.25 0.16874 Measure analyze control device nes 25 798 838 2.7 26.00 21.81 723 Civil engineering plant & equipment 28 059 0.5 0.18 0.04714 Non-electric engines excl. 712 713 718 22 245 206 2.3 33.37 30.40 057 Fruit nut (exc oil), fresh or dried 24 340 0.4 0.12 0.05759 Office equipment part & accessories 20 918 725 2.2 22.75 9.89 122 Manufactured tabacco 23 979 0.4 0.58 0.13334 Heavy petroleum & bituminous oil 18 444 431 1.9 10.56 4.43 971 Gold non-monetary excluding ores 20 499 0.3 0.08 0.04Remainder 655 052 976 67.5 Remainder 248 315 4.2
For sources and notes, see end of table. Pour les sources et les notes, se reporter à la fin du tableau.
Leading products exported basedon average 2005-2006 valuesSITC Revision 3 (3-digit level)
Principaux produits exportés d'aprèsla moyenne des valeurs de 2005-2006CTCI révision 3 (positions à 3 chiffres)
2005-2006
Leading products exported basedon average 2005-2006 valuesSITC Revision 3 (3-digit level)
Principaux produits exportés d'aprèsla moyenne des valeurs de 2005-2006CTCI révision 3 (positions à 3 chiffres)
2005-2006
Value(f.o.b., thousands
of dollars)
Valeur(f.a.b., milliers
de dollars)
As percentageEn pourcentage Value
(f.o.b., thousandsof dollars)
Valeur(f.a.b., milliers
de dollars)
As percentageEn pourcentage
Uzbekistan - Ouzbékistan (**=Transition)
Venezuela (Bolivarian Rep. of) - Venezuela (Rép. bolivarienne du) (**=Developing)
Viet Nam (**=Developing)
Yemen - Yémen (**=Developing)
United Arab Emirates - Émirats arabes unis (**=Developing)
United Kingdom - Royaume-Uni (**=Developed)
United Republic of Tanzania - République-Unie de Tanzanie (**=Developing)
United States - États-Unis (**=Developed)
Ukraine (**=Transition) Uruguay (**=Developing)
3.2.D Export structure by productIndividual countries and territories
3.2.D Structure des exportations par produitsPays et territoires individuels
172
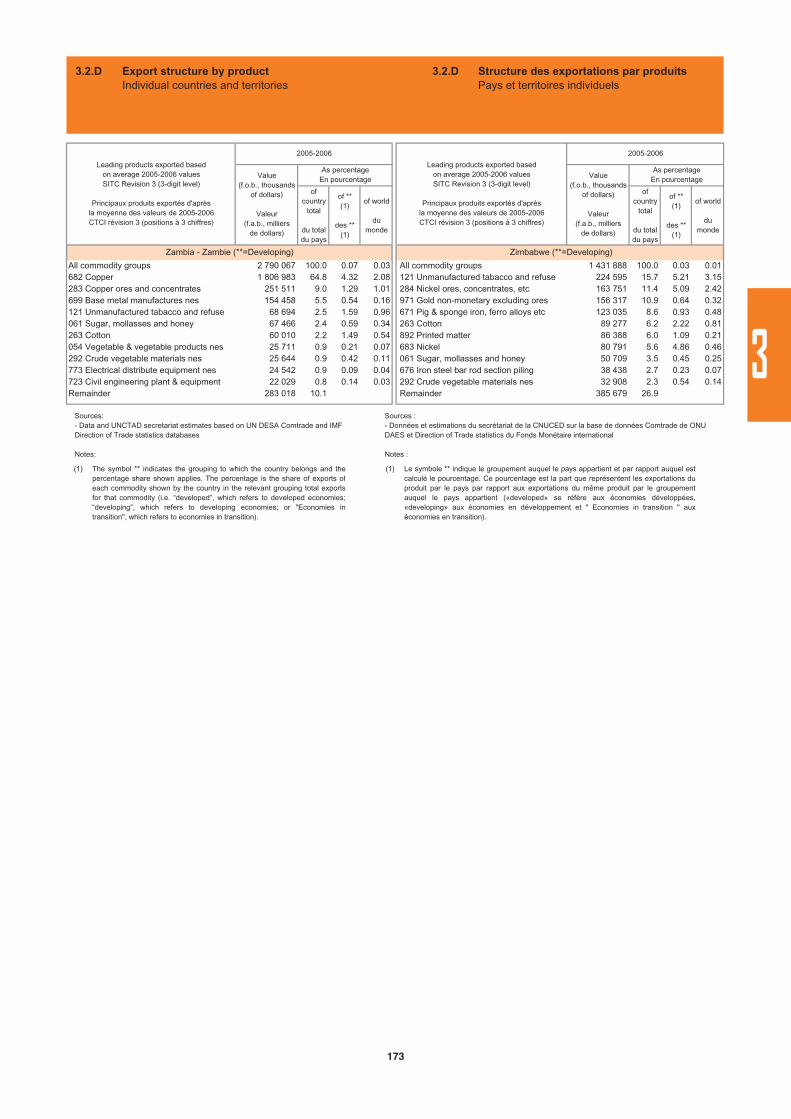
ofcountry
total
du totaldu pays
of ** (1)
des ** (1)
of world
dumonde
ofcountry
total
du totaldu pays
of ** (1)
des ** (1)
of world
dumonde
All commodity groups 2 790 067 100.0 0.07 0.03 All commodity groups 1 431 888 100.0 0.03 0.01682 Copper 1 806 983 64.8 4.32 2.08 121 Unmanufactured tabacco and refuse 224 595 15.7 5.21 3.15283 Copper ores and concentrates 251 511 9.0 1.29 1.01 284 Nickel ores, concentrates, etc 163 751 11.4 5.09 2.42699 Base metal manufactures nes 154 458 5.5 0.54 0.16 971 Gold non-monetary excluding ores 156 317 10.9 0.64 0.32121 Unmanufactured tabacco and refuse 68 694 2.5 1.59 0.96 671 Pig & sponge iron, ferro alloys etc 123 035 8.6 0.93 0.48061 Sugar, mollasses and honey 67 466 2.4 0.59 0.34 263 Cotton 89 277 6.2 2.22 0.81263 Cotton 60 010 2.2 1.49 0.54 892 Printed matter 86 388 6.0 1.09 0.21054 Vegetable & vegetable products nes 25 711 0.9 0.21 0.07 683 Nickel 80 791 5.6 4.86 0.46292 Crude vegetable materials nes 25 644 0.9 0.42 0.11 061 Sugar, mollasses and honey 50 709 3.5 0.45 0.25773 Electrical distribute equipment nes 24 542 0.9 0.09 0.04 676 Iron steel bar rod section piling 38 438 2.7 0.23 0.07723 Civil engineering plant & equipment 22 029 0.8 0.14 0.03 292 Crude vegetable materials nes 32 908 2.3 0.54 0.14Remainder 283 018 10.1 Remainder 385 679 26.9
Leading products exported basedon average 2005-2006 valuesSITC Revision 3 (3-digit level)
Principaux produits exportés d'aprèsla moyenne des valeurs de 2005-2006CTCI révision 3 (positions à 3 chiffres)
2005-2006
Leading products exported basedon average 2005-2006 valuesSITC Revision 3 (3-digit level)
Principaux produits exportés d'aprèsla moyenne des valeurs de 2005-2006CTCI révision 3 (positions à 3 chiffres)
2005-2006
Value(f.o.b., thousands
of dollars)
Valeur(f.a.b., milliers
de dollars)
As percentageEn pourcentage Value
(f.o.b., thousandsof dollars)
Valeur(f.a.b., milliers
de dollars)
As percentageEn pourcentage
Zambia - Zambie (**=Developing) Zimbabwe (**=Developing)
3.2.D Export structure by productIndividual countries and territories
3.2.D Structure des exportations par produitsPays et territoires individuels
(1) The symbol ** indicates the grouping to which the country belongs and thepercentage share shown applies. The percentage is the share of exports ofeach commodity shown by the country in the relevant grouping total exportsfor that commodity (i.e. “developed”, which refers to developed economies;“developing”, which refers to developing economies; or "Economies intransition", which refers to economies in transition).
Sources:- Data and UNCTAD secretariat estimates based on UN DESA Comtrade and IMF Direction of Trade statistics databases
Notes:
(1) Le symbole ** indique le groupement auquel le pays appartient et par rapport auquel estcalculé le pourcentage. Ce pourcentage est la part que représentent les exportations duproduit par le pays par rapport aux exportations du même produit par le groupementauquel le pays appartient («developed» se réfère aux économies développées,«developing» aux économies en développement et " Economies in transition " auxéconomies en transition).
Sources : - Données et estimations du secrétariat de la CNUCED sur la base de données Comtrade de ONU DAES et Direction of Trade statistics du Fonds Monétaire international
Notes :
173
3
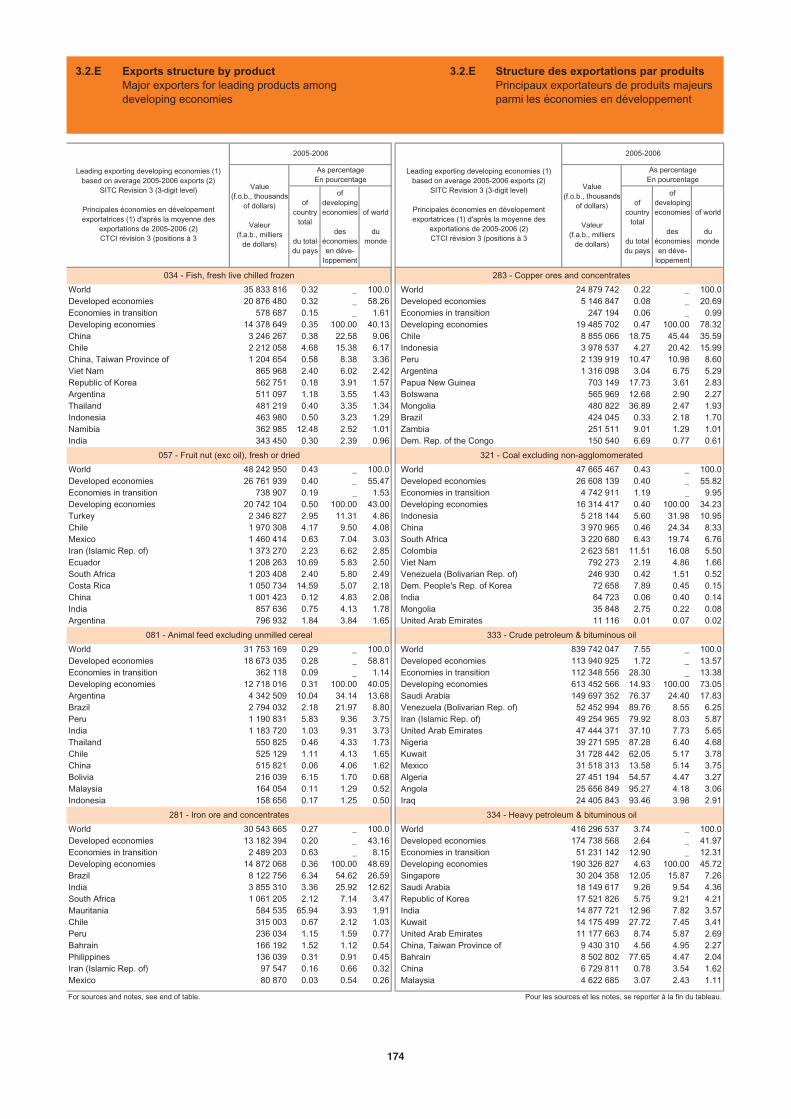
ofcountry
total
du totaldu pays
ofdevelopingeconomies
deséconomiesen déve-
loppement
of world
dumonde
ofcountry
total
du totaldu pays
ofdevelopingeconomies
deséconomiesen déve-
loppement
of world
dumonde
World 35 833 816 0.32 _ 100.0 World 24 879 742 0.22 _ 100.0Developed economies 20 876 480 0.32 _ 58.26 Developed economies 5 146 847 0.08 _ 20.69Economies in transition 578 687 0.15 _ 1.61 Economies in transition 247 194 0.06 _ 0.99Developing economies 14 378 649 0.35 100.00 40.13 Developing economies 19 485 702 0.47 100.00 78.32China 3 246 267 0.38 22.58 9.06 Chile 8 855 066 18.75 45.44 35.59Chile 2 212 058 4.68 15.38 6.17 Indonesia 3 978 537 4.27 20.42 15.99China, Taiwan Province of 1 204 654 0.58 8.38 3.36 Peru 2 139 919 10.47 10.98 8.60Viet Nam 865 968 2.40 6.02 2.42 Argentina 1 316 098 3.04 6.75 5.29Republic of Korea 562 751 0.18 3.91 1.57 Papua New Guinea 703 149 17.73 3.61 2.83Argentina 511 097 1.18 3.55 1.43 Botswana 565 969 12.68 2.90 2.27Thailand 481 219 0.40 3.35 1.34 Mongolia 480 822 36.89 2.47 1.93Indonesia 463 980 0.50 3.23 1.29 Brazil 424 045 0.33 2.18 1.70Namibia 362 985 12.48 2.52 1.01 Zambia 251 511 9.01 1.29 1.01India 343 450 0.30 2.39 0.96 Dem. Rep. of the Congo 150 540 6.69 0.77 0.61
World 48 242 950 0.43 _ 100.0 World 47 665 467 0.43 _ 100.0Developed economies 26 761 939 0.40 _ 55.47 Developed economies 26 608 139 0.40 _ 55.82Economies in transition 738 907 0.19 _ 1.53 Economies in transition 4 742 911 1.19 _ 9.95Developing economies 20 742 104 0.50 100.00 43.00 Developing economies 16 314 417 0.40 100.00 34.23Turkey 2 346 827 2.95 11.31 4.86 Indonesia 5 218 144 5.60 31.98 10.95Chile 1 970 308 4.17 9.50 4.08 China 3 970 965 0.46 24.34 8.33Mexico 1 460 414 0.63 7.04 3.03 South Africa 3 220 680 6.43 19.74 6.76Iran (Islamic Rep. of) 1 373 270 2.23 6.62 2.85 Colombia 2 623 581 11.51 16.08 5.50Ecuador 1 208 263 10.69 5.83 2.50 Viet Nam 792 273 2.19 4.86 1.66South Africa 1 203 408 2.40 5.80 2.49 Venezuela (Bolivarian Rep. of) 246 930 0.42 1.51 0.52Costa Rica 1 050 734 14.59 5.07 2.18 Dem. People's Rep. of Korea 72 658 7.89 0.45 0.15China 1 001 423 0.12 4.83 2.08 India 64 723 0.06 0.40 0.14India 857 636 0.75 4.13 1.78 Mongolia 35 848 2.75 0.22 0.08Argentina 796 932 1.84 3.84 1.65 United Arab Emirates 11 116 0.01 0.07 0.02
World 31 753 169 0.29 _ 100.0 World 839 742 047 7.55 _ 100.0Developed economies 18 673 035 0.28 _ 58.81 Developed economies 113 940 925 1.72 _ 13.57Economies in transition 362 118 0.09 _ 1.14 Economies in transition 112 348 556 28.30 _ 13.38Developing economies 12 718 016 0.31 100.00 40.05 Developing economies 613 452 566 14.93 100.00 73.05Argentina 4 342 509 10.04 34.14 13.68 Saudi Arabia 149 697 352 76.37 24.40 17.83Brazil 2 794 032 2.18 21.97 8.80 Venezuela (Bolivarian Rep. of) 52 452 994 89.76 8.55 6.25Peru 1 190 831 5.83 9.36 3.75 Iran (Islamic Rep. of) 49 254 965 79.92 8.03 5.87India 1 183 720 1.03 9.31 3.73 United Arab Emirates 47 444 371 37.10 7.73 5.65Thailand 550 825 0.46 4.33 1.73 Nigeria 39 271 595 87.28 6.40 4.68Chile 525 129 1.11 4.13 1.65 Kuwait 31 728 442 62.05 5.17 3.78China 515 821 0.06 4.06 1.62 Mexico 31 518 313 13.58 5.14 3.75Bolivia 216 039 6.15 1.70 0.68 Algeria 27 451 194 54.57 4.47 3.27Malaysia 164 054 0.11 1.29 0.52 Angola 25 656 849 95.27 4.18 3.06Indonesia 158 656 0.17 1.25 0.50 Iraq 24 405 843 93.46 3.98 2.91
World 30 543 665 0.27 _ 100.0 World 416 296 537 3.74 _ 100.0Developed economies 13 182 394 0.20 _ 43.16 Developed economies 174 738 568 2.64 _ 41.97Economies in transition 2 489 203 0.63 _ 8.15 Economies in transition 51 231 142 12.90 _ 12.31Developing economies 14 872 068 0.36 100.00 48.69 Developing economies 190 326 827 4.63 100.00 45.72Brazil 8 122 756 6.34 54.62 26.59 Singapore 30 204 358 12.05 15.87 7.26India 3 855 310 3.36 25.92 12.62 Saudi Arabia 18 149 617 9.26 9.54 4.36South Africa 1 061 205 2.12 7.14 3.47 Republic of Korea 17 521 826 5.75 9.21 4.21Mauritania 584 535 65.94 3.93 1.91 India 14 877 721 12.96 7.82 3.57Chile 315 003 0.67 2.12 1.03 Kuwait 14 175 499 27.72 7.45 3.41Peru 236 034 1.15 1.59 0.77 United Arab Emirates 11 177 663 8.74 5.87 2.69Bahrain 166 192 1.52 1.12 0.54 China, Taiwan Province of 9 430 310 4.56 4.95 2.27Philippines 136 039 0.31 0.91 0.45 Bahrain 8 502 802 77.65 4.47 2.04Iran (Islamic Rep. of) 97 547 0.16 0.66 0.32 China 6 729 811 0.78 3.54 1.62Mexico 80 870 0.03 0.54 0.26 Malaysia 4 622 685 3.07 2.43 1.11
For sources and notes, see end of table. Pour les sources et les notes, se reporter à la fin du tableau.
334 - Heavy petroleum & bituminous oil281 - Iron ore and concentrates
057 - Fruit nut (exc oil), fresh or dried
Leading exporting developing economies (1)based on average 2005-2006 exports (2)
SITC Revision 3 (3-digit level)
Principales économies en dévelopement exportatrices (1) d'après la moyenne des
exportations de 2005-2006 (2)CTCI révision 3 (positions à 3
081 - Animal feed excluding unmilled cereal
283 - Copper ores and concentrates
321 - Coal excluding non-agglomomerated
333 - Crude petroleum & bituminous oil
034 - Fish, fresh live chilled frozen
2005-2006
As percentageEn pourcentage
Value(f.o.b., thousands
of dollars)
Valeur(f.a.b., milliers
de dollars)
Leading exporting developing economies (1)based on average 2005-2006 exports (2)
SITC Revision 3 (3-digit level)
Principales économies en dévelopement exportatrices (1) d'après la moyenne des
exportations de 2005-2006 (2)CTCI révision 3 (positions à 3
2005-2006
As percentageEn pourcentage
Value(f.o.b., thousands
of dollars)
Valeur(f.a.b., milliers
de dollars)
3.2.E Exports structure by productMajor exporters for leading products among developing economies
3.2.E Structure des exportations par produitsPrincipaux exportateurs de produits majeurs parmi les économies en développement
174
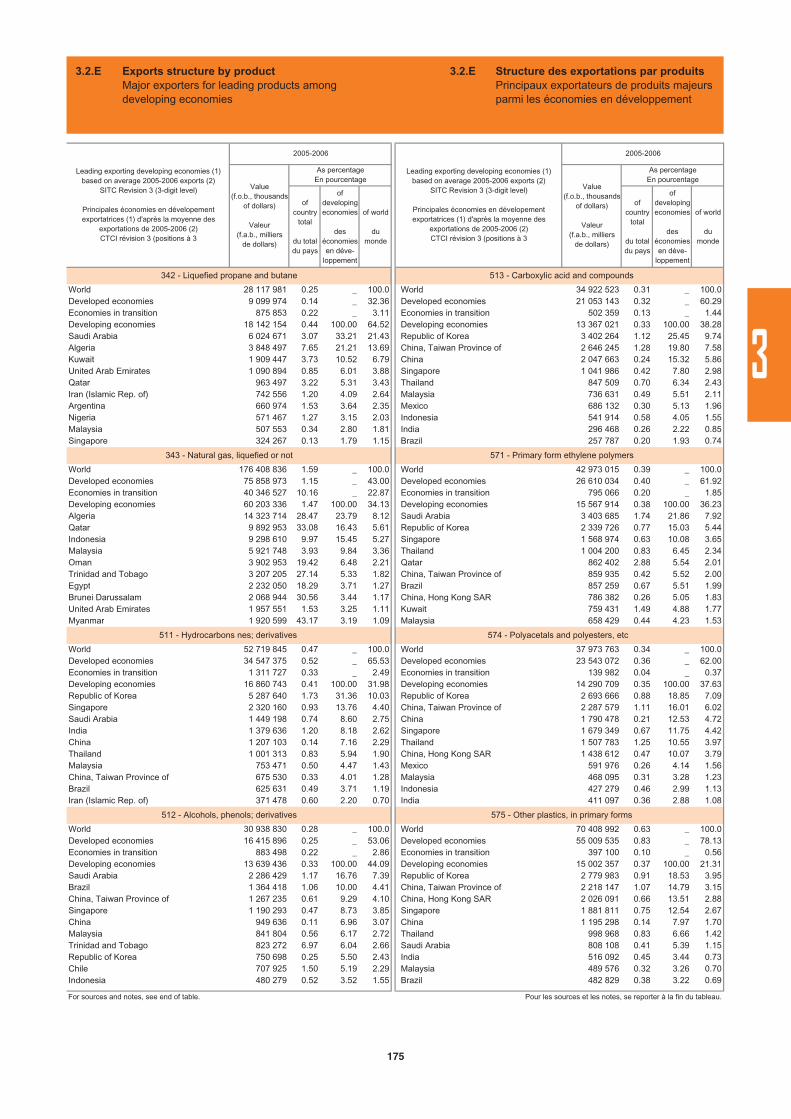
ofcountry
total
du totaldu pays
ofdevelopingeconomies
deséconomiesen déve-
loppement
of world
dumonde
ofcountry
total
du totaldu pays
ofdevelopingeconomies
deséconomiesen déve-
loppement
of world
dumonde
World 28 117 981 0.25 _ 100.0 World 34 922 523 0.31 _ 100.0Developed economies 9 099 974 0.14 _ 32.36 Developed economies 21 053 143 0.32 _ 60.29Economies in transition 875 853 0.22 _ 3.11 Economies in transition 502 359 0.13 _ 1.44Developing economies 18 142 154 0.44 100.00 64.52 Developing economies 13 367 021 0.33 100.00 38.28Saudi Arabia 6 024 671 3.07 33.21 21.43 Republic of Korea 3 402 264 1.12 25.45 9.74Algeria 3 848 497 7.65 21.21 13.69 China, Taiwan Province of 2 646 245 1.28 19.80 7.58Kuwait 1 909 447 3.73 10.52 6.79 China 2 047 663 0.24 15.32 5.86United Arab Emirates 1 090 894 0.85 6.01 3.88 Singapore 1 041 986 0.42 7.80 2.98Qatar 963 497 3.22 5.31 3.43 Thailand 847 509 0.70 6.34 2.43Iran (Islamic Rep. of) 742 556 1.20 4.09 2.64 Malaysia 736 631 0.49 5.51 2.11Argentina 660 974 1.53 3.64 2.35 Mexico 686 132 0.30 5.13 1.96Nigeria 571 467 1.27 3.15 2.03 Indonesia 541 914 0.58 4.05 1.55Malaysia 507 553 0.34 2.80 1.81 India 296 468 0.26 2.22 0.85Singapore 324 267 0.13 1.79 1.15 Brazil 257 787 0.20 1.93 0.74
World 176 408 836 1.59 _ 100.0 World 42 973 015 0.39 _ 100.0Developed economies 75 858 973 1.15 _ 43.00 Developed economies 26 610 034 0.40 _ 61.92Economies in transition 40 346 527 10.16 _ 22.87 Economies in transition 795 066 0.20 _ 1.85Developing economies 60 203 336 1.47 100.00 34.13 Developing economies 15 567 914 0.38 100.00 36.23Algeria 14 323 714 28.47 23.79 8.12 Saudi Arabia 3 403 685 1.74 21.86 7.92Qatar 9 892 953 33.08 16.43 5.61 Republic of Korea 2 339 726 0.77 15.03 5.44Indonesia 9 298 610 9.97 15.45 5.27 Singapore 1 568 974 0.63 10.08 3.65Malaysia 5 921 748 3.93 9.84 3.36 Thailand 1 004 200 0.83 6.45 2.34Oman 3 902 953 19.42 6.48 2.21 Qatar 862 402 2.88 5.54 2.01Trinidad and Tobago 3 207 205 27.14 5.33 1.82 China, Taiwan Province of 859 935 0.42 5.52 2.00Egypt 2 232 050 18.29 3.71 1.27 Brazil 857 259 0.67 5.51 1.99Brunei Darussalam 2 068 944 30.56 3.44 1.17 China, Hong Kong SAR 786 382 0.26 5.05 1.83United Arab Emirates 1 957 551 1.53 3.25 1.11 Kuwait 759 431 1.49 4.88 1.77Myanmar 1 920 599 43.17 3.19 1.09 Malaysia 658 429 0.44 4.23 1.53
World 52 719 845 0.47 _ 100.0 World 37 973 763 0.34 _ 100.0Developed economies 34 547 375 0.52 _ 65.53 Developed economies 23 543 072 0.36 _ 62.00Economies in transition 1 311 727 0.33 _ 2.49 Economies in transition 139 982 0.04 _ 0.37Developing economies 16 860 743 0.41 100.00 31.98 Developing economies 14 290 709 0.35 100.00 37.63Republic of Korea 5 287 640 1.73 31.36 10.03 Republic of Korea 2 693 666 0.88 18.85 7.09Singapore 2 320 160 0.93 13.76 4.40 China, Taiwan Province of 2 287 579 1.11 16.01 6.02Saudi Arabia 1 449 198 0.74 8.60 2.75 China 1 790 478 0.21 12.53 4.72India 1 379 636 1.20 8.18 2.62 Singapore 1 679 349 0.67 11.75 4.42China 1 207 103 0.14 7.16 2.29 Thailand 1 507 783 1.25 10.55 3.97Thailand 1 001 313 0.83 5.94 1.90 China, Hong Kong SAR 1 438 612 0.47 10.07 3.79Malaysia 753 471 0.50 4.47 1.43 Mexico 591 976 0.26 4.14 1.56China, Taiwan Province of 675 530 0.33 4.01 1.28 Malaysia 468 095 0.31 3.28 1.23Brazil 625 631 0.49 3.71 1.19 Indonesia 427 279 0.46 2.99 1.13Iran (Islamic Rep. of) 371 478 0.60 2.20 0.70 India 411 097 0.36 2.88 1.08
World 30 938 830 0.28 _ 100.0 World 70 408 992 0.63 _ 100.0Developed economies 16 415 896 0.25 _ 53.06 Developed economies 55 009 535 0.83 _ 78.13Economies in transition 883 498 0.22 _ 2.86 Economies in transition 397 100 0.10 _ 0.56Developing economies 13 639 436 0.33 100.00 44.09 Developing economies 15 002 357 0.37 100.00 21.31Saudi Arabia 2 286 429 1.17 16.76 7.39 Republic of Korea 2 779 983 0.91 18.53 3.95Brazil 1 364 418 1.06 10.00 4.41 China, Taiwan Province of 2 218 147 1.07 14.79 3.15China, Taiwan Province of 1 267 235 0.61 9.29 4.10 China, Hong Kong SAR 2 026 091 0.66 13.51 2.88Singapore 1 190 293 0.47 8.73 3.85 Singapore 1 881 811 0.75 12.54 2.67China 949 636 0.11 6.96 3.07 China 1 195 298 0.14 7.97 1.70Malaysia 841 804 0.56 6.17 2.72 Thailand 998 968 0.83 6.66 1.42Trinidad and Tobago 823 272 6.97 6.04 2.66 Saudi Arabia 808 108 0.41 5.39 1.15Republic of Korea 750 698 0.25 5.50 2.43 India 516 092 0.45 3.44 0.73Chile 707 925 1.50 5.19 2.29 Malaysia 489 576 0.32 3.26 0.70Indonesia 480 279 0.52 3.52 1.55 Brazil 482 829 0.38 3.22 0.69
For sources and notes, see end of table. Pour les sources et les notes, se reporter à la fin du tableau.
512 - Alcohols, phenols; derivatives
513 - Carboxylic acid and compounds
571 - Primary form ethylene polymers
574 - Polyacetals and polyesters, etc
575 - Other plastics, in primary forms
511 - Hydrocarbons nes; derivatives
342 - Liquefied propane and butane
343 - Natural gas, liquefied or not
Leading exporting developing economies (1)based on average 2005-2006 exports (2)
SITC Revision 3 (3-digit level)
Principales économies en dévelopement exportatrices (1) d'après la moyenne des
exportations de 2005-2006 (2)CTCI révision 3 (positions à 3
2005-2006
Leading exporting developing economies (1)based on average 2005-2006 exports (2)
SITC Revision 3 (3-digit level)
Principales économies en dévelopement exportatrices (1) d'après la moyenne des
exportations de 2005-2006 (2)CTCI révision 3 (positions à 3
2005-2006
Value(f.o.b., thousands
of dollars)
Valeur(f.a.b., milliers
de dollars)
As percentageEn pourcentage
Value(f.o.b., thousands
of dollars)
Valeur(f.a.b., milliers
de dollars)
As percentageEn pourcentage
3.2.E Exports structure by productMajor exporters for leading products among developing economies
3.2.E Structure des exportations par produitsPrincipaux exportateurs de produits majeurs parmi les économies en développement
175
3
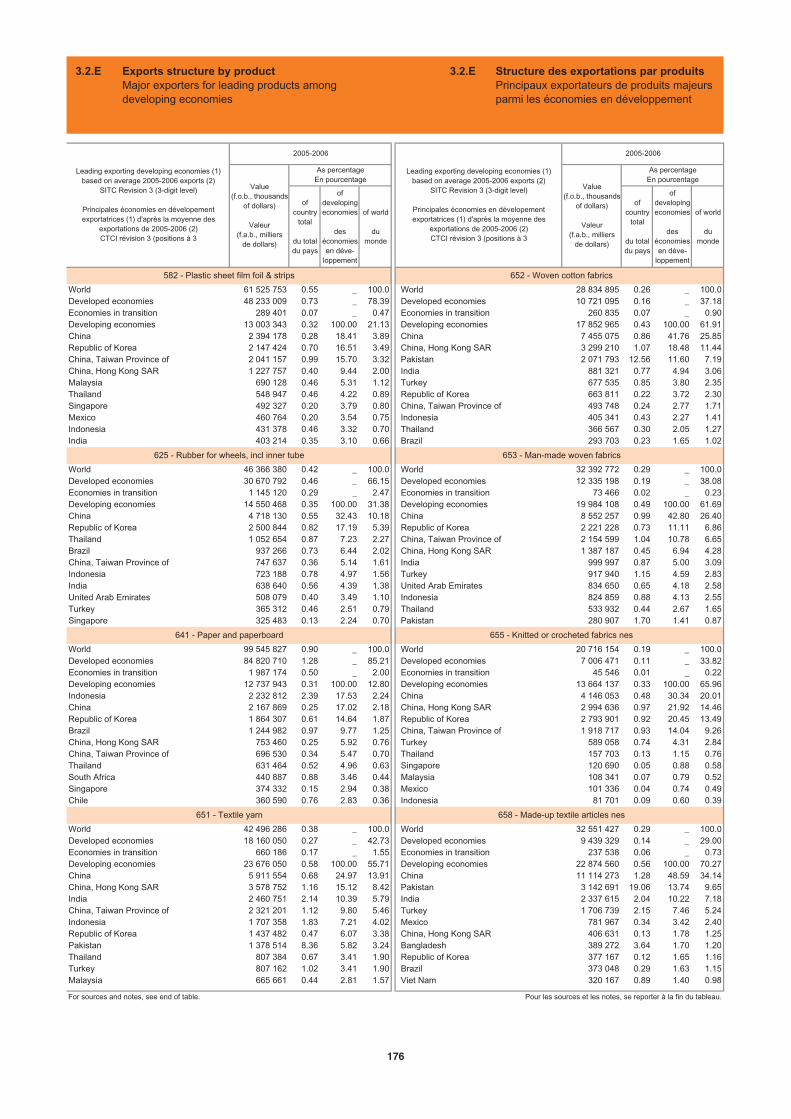
ofcountry
total
du totaldu pays
ofdevelopingeconomies
deséconomiesen déve-
loppement
of world
dumonde
ofcountry
total
du totaldu pays
ofdevelopingeconomies
deséconomiesen déve-
loppement
of world
dumonde
World 61 525 753 0.55 _ 100.0 World 28 834 895 0.26 _ 100.0Developed economies 48 233 009 0.73 _ 78.39 Developed economies 10 721 095 0.16 _ 37.18Economies in transition 289 401 0.07 _ 0.47 Economies in transition 260 835 0.07 _ 0.90Developing economies 13 003 343 0.32 100.00 21.13 Developing economies 17 852 965 0.43 100.00 61.91China 2 394 178 0.28 18.41 3.89 China 7 455 075 0.86 41.76 25.85Republic of Korea 2 147 424 0.70 16.51 3.49 China, Hong Kong SAR 3 299 210 1.07 18.48 11.44China, Taiwan Province of 2 041 157 0.99 15.70 3.32 Pakistan 2 071 793 12.56 11.60 7.19China, Hong Kong SAR 1 227 757 0.40 9.44 2.00 India 881 321 0.77 4.94 3.06Malaysia 690 128 0.46 5.31 1.12 Turkey 677 535 0.85 3.80 2.35Thailand 548 947 0.46 4.22 0.89 Republic of Korea 663 811 0.22 3.72 2.30Singapore 492 327 0.20 3.79 0.80 China, Taiwan Province of 493 748 0.24 2.77 1.71Mexico 460 764 0.20 3.54 0.75 Indonesia 405 341 0.43 2.27 1.41Indonesia 431 378 0.46 3.32 0.70 Thailand 366 567 0.30 2.05 1.27India 403 214 0.35 3.10 0.66 Brazil 293 703 0.23 1.65 1.02
World 46 366 380 0.42 _ 100.0 World 32 392 772 0.29 _ 100.0Developed economies 30 670 792 0.46 _ 66.15 Developed economies 12 335 198 0.19 _ 38.08Economies in transition 1 145 120 0.29 _ 2.47 Economies in transition 73 466 0.02 _ 0.23Developing economies 14 550 468 0.35 100.00 31.38 Developing economies 19 984 108 0.49 100.00 61.69China 4 718 130 0.55 32.43 10.18 China 8 552 257 0.99 42.80 26.40Republic of Korea 2 500 844 0.82 17.19 5.39 Republic of Korea 2 221 228 0.73 11.11 6.86Thailand 1 052 654 0.87 7.23 2.27 China, Taiwan Province of 2 154 599 1.04 10.78 6.65Brazil 937 266 0.73 6.44 2.02 China, Hong Kong SAR 1 387 187 0.45 6.94 4.28China, Taiwan Province of 747 637 0.36 5.14 1.61 India 999 997 0.87 5.00 3.09Indonesia 723 188 0.78 4.97 1.56 Turkey 917 940 1.15 4.59 2.83India 638 640 0.56 4.39 1.38 United Arab Emirates 834 650 0.65 4.18 2.58United Arab Emirates 508 079 0.40 3.49 1.10 Indonesia 824 859 0.88 4.13 2.55Turkey 365 312 0.46 2.51 0.79 Thailand 533 932 0.44 2.67 1.65Singapore 325 483 0.13 2.24 0.70 Pakistan 280 907 1.70 1.41 0.87
World 99 545 827 0.90 _ 100.0 World 20 716 154 0.19 _ 100.0Developed economies 84 820 710 1.28 _ 85.21 Developed economies 7 006 471 0.11 _ 33.82Economies in transition 1 987 174 0.50 _ 2.00 Economies in transition 45 546 0.01 _ 0.22Developing economies 12 737 943 0.31 100.00 12.80 Developing economies 13 664 137 0.33 100.00 65.96Indonesia 2 232 812 2.39 17.53 2.24 China 4 146 053 0.48 30.34 20.01China 2 167 869 0.25 17.02 2.18 China, Hong Kong SAR 2 994 636 0.97 21.92 14.46Republic of Korea 1 864 307 0.61 14.64 1.87 Republic of Korea 2 793 901 0.92 20.45 13.49Brazil 1 244 982 0.97 9.77 1.25 China, Taiwan Province of 1 918 717 0.93 14.04 9.26China, Hong Kong SAR 753 460 0.25 5.92 0.76 Turkey 589 058 0.74 4.31 2.84China, Taiwan Province of 696 530 0.34 5.47 0.70 Thailand 157 703 0.13 1.15 0.76Thailand 631 464 0.52 4.96 0.63 Singapore 120 690 0.05 0.88 0.58South Africa 440 887 0.88 3.46 0.44 Malaysia 108 341 0.07 0.79 0.52Singapore 374 332 0.15 2.94 0.38 Mexico 101 336 0.04 0.74 0.49Chile 360 590 0.76 2.83 0.36 Indonesia 81 701 0.09 0.60 0.39
World 42 496 286 0.38 _ 100.0 World 32 551 427 0.29 _ 100.0Developed economies 18 160 050 0.27 _ 42.73 Developed economies 9 439 329 0.14 _ 29.00Economies in transition 660 186 0.17 _ 1.55 Economies in transition 237 538 0.06 _ 0.73Developing economies 23 676 050 0.58 100.00 55.71 Developing economies 22 874 560 0.56 100.00 70.27China 5 911 554 0.68 24.97 13.91 China 11 114 273 1.28 48.59 34.14China, Hong Kong SAR 3 578 752 1.16 15.12 8.42 Pakistan 3 142 691 19.06 13.74 9.65India 2 460 751 2.14 10.39 5.79 India 2 337 615 2.04 10.22 7.18China, Taiwan Province of 2 321 201 1.12 9.80 5.46 Turkey 1 706 739 2.15 7.46 5.24Indonesia 1 707 358 1.83 7.21 4.02 Mexico 781 967 0.34 3.42 2.40Republic of Korea 1 437 482 0.47 6.07 3.38 China, Hong Kong SAR 406 631 0.13 1.78 1.25Pakistan 1 378 514 8.36 5.82 3.24 Bangladesh 389 272 3.64 1.70 1.20Thailand 807 384 0.67 3.41 1.90 Republic of Korea 377 167 0.12 1.65 1.16Turkey 807 162 1.02 3.41 1.90 Brazil 373 048 0.29 1.63 1.15Malaysia 665 661 0.44 2.81 1.57 Viet Nam 320 167 0.89 1.40 0.98
For sources and notes, see end of table. Pour les sources et les notes, se reporter à la fin du tableau.
652 - Woven cotton fabrics
653 - Man-made woven fabrics
655 - Knitted or crocheted fabrics nes
658 - Made-up textile articles nes
582 - Plastic sheet film foil & strips
625 - Rubber for wheels, incl inner tube
641 - Paper and paperboard
651 - Textile yarn
Leading exporting developing economies (1)based on average 2005-2006 exports (2)
SITC Revision 3 (3-digit level)
Principales économies en dévelopement exportatrices (1) d'après la moyenne des
exportations de 2005-2006 (2)CTCI révision 3 (positions à 3
2005-2006
Leading exporting developing economies (1)based on average 2005-2006 exports (2)
SITC Revision 3 (3-digit level)
Principales économies en dévelopement exportatrices (1) d'après la moyenne des
exportations de 2005-2006 (2)CTCI révision 3 (positions à 3
2005-2006
Value(f.o.b., thousands
of dollars)
Valeur(f.a.b., milliers
de dollars)
As percentageEn pourcentage
Value(f.o.b., thousands
of dollars)
Valeur(f.a.b., milliers
de dollars)
As percentageEn pourcentage
3.2.E Exports structure by productMajor exporters for leading products among developing economies
3.2.E Structure des exportations par produitsPrincipaux exportateurs de produits majeurs parmi les économies en développement
176
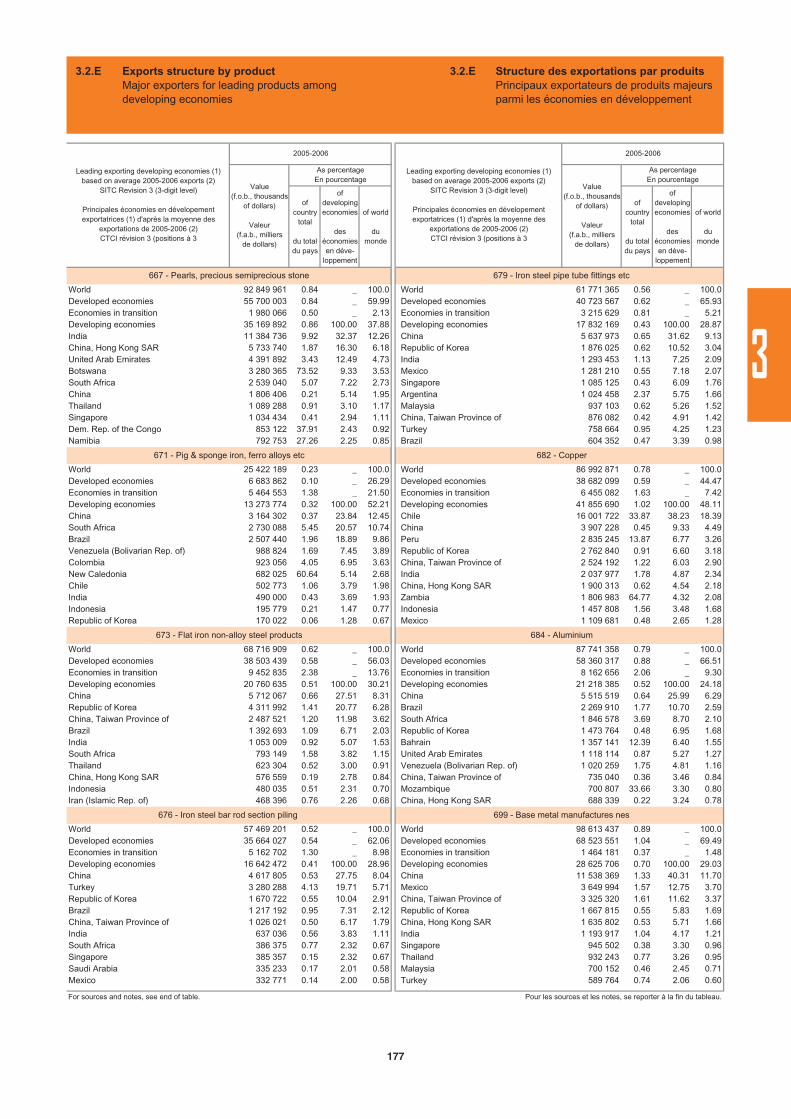
ofcountry
total
du totaldu pays
ofdevelopingeconomies
deséconomiesen déve-
loppement
of world
dumonde
ofcountry
total
du totaldu pays
ofdevelopingeconomies
deséconomiesen déve-
loppement
of world
dumonde
World 92 849 961 0.84 _ 100.0 World 61 771 365 0.56 _ 100.0Developed economies 55 700 003 0.84 _ 59.99 Developed economies 40 723 567 0.62 _ 65.93Economies in transition 1 980 066 0.50 _ 2.13 Economies in transition 3 215 629 0.81 _ 5.21Developing economies 35 169 892 0.86 100.00 37.88 Developing economies 17 832 169 0.43 100.00 28.87India 11 384 736 9.92 32.37 12.26 China 5 637 973 0.65 31.62 9.13China, Hong Kong SAR 5 733 740 1.87 16.30 6.18 Republic of Korea 1 876 025 0.62 10.52 3.04United Arab Emirates 4 391 892 3.43 12.49 4.73 India 1 293 453 1.13 7.25 2.09Botswana 3 280 365 73.52 9.33 3.53 Mexico 1 281 210 0.55 7.18 2.07South Africa 2 539 040 5.07 7.22 2.73 Singapore 1 085 125 0.43 6.09 1.76China 1 806 406 0.21 5.14 1.95 Argentina 1 024 458 2.37 5.75 1.66Thailand 1 089 288 0.91 3.10 1.17 Malaysia 937 103 0.62 5.26 1.52Singapore 1 034 434 0.41 2.94 1.11 China, Taiwan Province of 876 082 0.42 4.91 1.42Dem. Rep. of the Congo 853 122 37.91 2.43 0.92 Turkey 758 664 0.95 4.25 1.23Namibia 792 753 27.26 2.25 0.85 Brazil 604 352 0.47 3.39 0.98
World 25 422 189 0.23 _ 100.0 World 86 992 871 0.78 _ 100.0Developed economies 6 683 862 0.10 _ 26.29 Developed economies 38 682 099 0.59 _ 44.47Economies in transition 5 464 553 1.38 _ 21.50 Economies in transition 6 455 082 1.63 _ 7.42Developing economies 13 273 774 0.32 100.00 52.21 Developing economies 41 855 690 1.02 100.00 48.11China 3 164 302 0.37 23.84 12.45 Chile 16 001 722 33.87 38.23 18.39South Africa 2 730 088 5.45 20.57 10.74 China 3 907 228 0.45 9.33 4.49Brazil 2 507 440 1.96 18.89 9.86 Peru 2 835 245 13.87 6.77 3.26Venezuela (Bolivarian Rep. of) 988 824 1.69 7.45 3.89 Republic of Korea 2 762 840 0.91 6.60 3.18Colombia 923 056 4.05 6.95 3.63 China, Taiwan Province of 2 524 192 1.22 6.03 2.90New Caledonia 682 025 60.64 5.14 2.68 India 2 037 977 1.78 4.87 2.34Chile 502 773 1.06 3.79 1.98 China, Hong Kong SAR 1 900 313 0.62 4.54 2.18India 490 000 0.43 3.69 1.93 Zambia 1 806 983 64.77 4.32 2.08Indonesia 195 779 0.21 1.47 0.77 Indonesia 1 457 808 1.56 3.48 1.68Republic of Korea 170 022 0.06 1.28 0.67 Mexico 1 109 681 0.48 2.65 1.28
World 68 716 909 0.62 _ 100.0 World 87 741 358 0.79 _ 100.0Developed economies 38 503 439 0.58 _ 56.03 Developed economies 58 360 317 0.88 _ 66.51Economies in transition 9 452 835 2.38 _ 13.76 Economies in transition 8 162 656 2.06 _ 9.30Developing economies 20 760 635 0.51 100.00 30.21 Developing economies 21 218 385 0.52 100.00 24.18China 5 712 067 0.66 27.51 8.31 China 5 515 519 0.64 25.99 6.29Republic of Korea 4 311 992 1.41 20.77 6.28 Brazil 2 269 910 1.77 10.70 2.59China, Taiwan Province of 2 487 521 1.20 11.98 3.62 South Africa 1 846 578 3.69 8.70 2.10Brazil 1 392 693 1.09 6.71 2.03 Republic of Korea 1 473 764 0.48 6.95 1.68India 1 053 009 0.92 5.07 1.53 Bahrain 1 357 141 12.39 6.40 1.55South Africa 793 149 1.58 3.82 1.15 United Arab Emirates 1 118 114 0.87 5.27 1.27Thailand 623 304 0.52 3.00 0.91 Venezuela (Bolivarian Rep. of) 1 020 259 1.75 4.81 1.16China, Hong Kong SAR 576 559 0.19 2.78 0.84 China, Taiwan Province of 735 040 0.36 3.46 0.84Indonesia 480 035 0.51 2.31 0.70 Mozambique 700 807 33.66 3.30 0.80Iran (Islamic Rep. of) 468 396 0.76 2.26 0.68 China, Hong Kong SAR 688 339 0.22 3.24 0.78
World 57 469 201 0.52 _ 100.0 World 98 613 437 0.89 _ 100.0Developed economies 35 664 027 0.54 _ 62.06 Developed economies 68 523 551 1.04 _ 69.49Economies in transition 5 162 702 1.30 _ 8.98 Economies in transition 1 464 181 0.37 _ 1.48Developing economies 16 642 472 0.41 100.00 28.96 Developing economies 28 625 706 0.70 100.00 29.03China 4 617 805 0.53 27.75 8.04 China 11 538 369 1.33 40.31 11.70Turkey 3 280 288 4.13 19.71 5.71 Mexico 3 649 994 1.57 12.75 3.70Republic of Korea 1 670 722 0.55 10.04 2.91 China, Taiwan Province of 3 325 320 1.61 11.62 3.37Brazil 1 217 192 0.95 7.31 2.12 Republic of Korea 1 667 815 0.55 5.83 1.69China, Taiwan Province of 1 026 021 0.50 6.17 1.79 China, Hong Kong SAR 1 635 802 0.53 5.71 1.66India 637 036 0.56 3.83 1.11 India 1 193 917 1.04 4.17 1.21South Africa 386 375 0.77 2.32 0.67 Singapore 945 502 0.38 3.30 0.96Singapore 385 357 0.15 2.32 0.67 Thailand 932 243 0.77 3.26 0.95Saudi Arabia 335 233 0.17 2.01 0.58 Malaysia 700 152 0.46 2.45 0.71Mexico 332 771 0.14 2.00 0.58 Turkey 589 764 0.74 2.06 0.60
For sources and notes, see end of table. Pour les sources et les notes, se reporter à la fin du tableau.
679 - Iron steel pipe tube fittings etc
682 - Copper
684 - Aluminium
699 - Base metal manufactures nes
667 - Pearls, precious semiprecious stone
671 - Pig & sponge iron, ferro alloys etc
673 - Flat iron non-alloy steel products
676 - Iron steel bar rod section piling
Leading exporting developing economies (1)based on average 2005-2006 exports (2)
SITC Revision 3 (3-digit level)
Principales économies en dévelopement exportatrices (1) d'après la moyenne des
exportations de 2005-2006 (2)CTCI révision 3 (positions à 3
2005-2006
Leading exporting developing economies (1)based on average 2005-2006 exports (2)
SITC Revision 3 (3-digit level)
Principales économies en dévelopement exportatrices (1) d'après la moyenne des
exportations de 2005-2006 (2)CTCI révision 3 (positions à 3
2005-2006
Value(f.o.b., thousands
of dollars)
Valeur(f.a.b., milliers
de dollars)
As percentageEn pourcentage
Value(f.o.b., thousands
of dollars)
Valeur(f.a.b., milliers
de dollars)
As percentageEn pourcentage
3.2.E Exports structure by productMajor exporters for leading products among developing economies
3.2.E Structure des exportations par produitsPrincipaux exportateurs de produits majeurs parmi les économies en développement
177
3
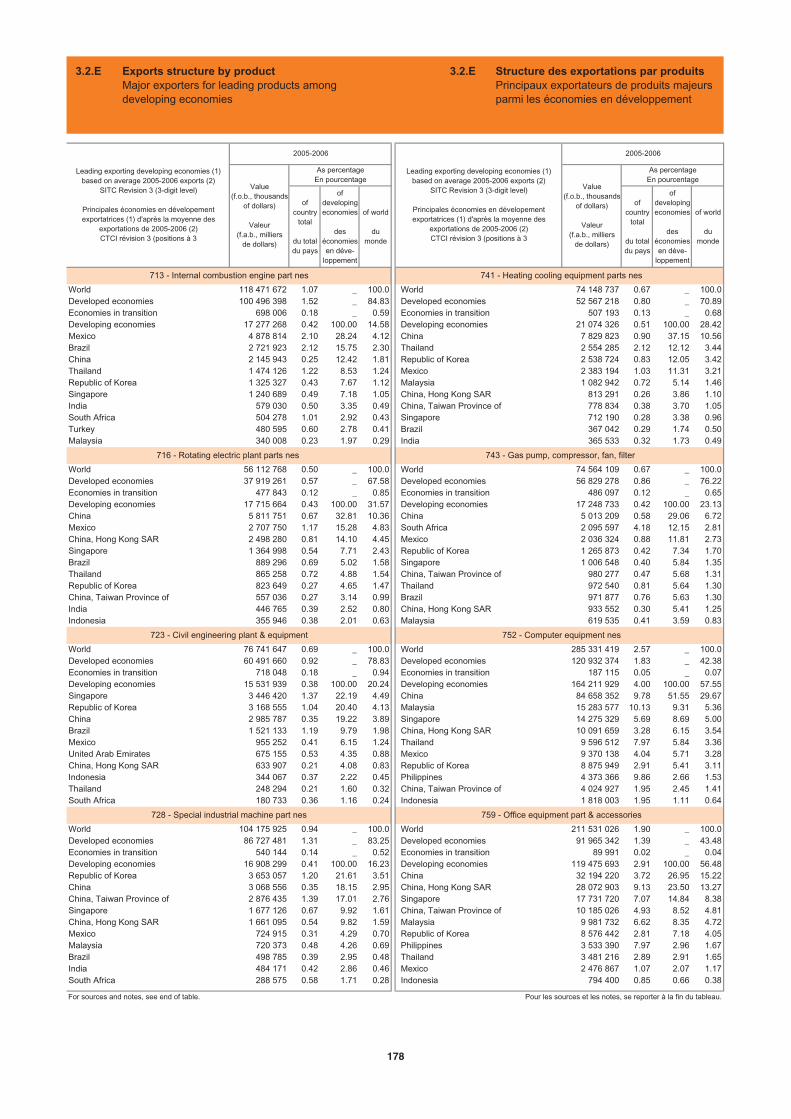
ofcountry
total
du totaldu pays
ofdevelopingeconomies
deséconomiesen déve-
loppement
of world
dumonde
ofcountry
total
du totaldu pays
ofdevelopingeconomies
deséconomiesen déve-
loppement
of world
dumonde
World 118 471 672 1.07 _ 100.0 World 74 148 737 0.67 _ 100.0Developed economies 100 496 398 1.52 _ 84.83 Developed economies 52 567 218 0.80 _ 70.89Economies in transition 698 006 0.18 _ 0.59 Economies in transition 507 193 0.13 _ 0.68Developing economies 17 277 268 0.42 100.00 14.58 Developing economies 21 074 326 0.51 100.00 28.42Mexico 4 878 814 2.10 28.24 4.12 China 7 829 823 0.90 37.15 10.56Brazil 2 721 923 2.12 15.75 2.30 Thailand 2 554 285 2.12 12.12 3.44China 2 145 943 0.25 12.42 1.81 Republic of Korea 2 538 724 0.83 12.05 3.42Thailand 1 474 126 1.22 8.53 1.24 Mexico 2 383 194 1.03 11.31 3.21Republic of Korea 1 325 327 0.43 7.67 1.12 Malaysia 1 082 942 0.72 5.14 1.46Singapore 1 240 689 0.49 7.18 1.05 China, Hong Kong SAR 813 291 0.26 3.86 1.10India 579 030 0.50 3.35 0.49 China, Taiwan Province of 778 834 0.38 3.70 1.05South Africa 504 278 1.01 2.92 0.43 Singapore 712 190 0.28 3.38 0.96Turkey 480 595 0.60 2.78 0.41 Brazil 367 042 0.29 1.74 0.50Malaysia 340 008 0.23 1.97 0.29 India 365 533 0.32 1.73 0.49
World 56 112 768 0.50 _ 100.0 World 74 564 109 0.67 _ 100.0Developed economies 37 919 261 0.57 _ 67.58 Developed economies 56 829 278 0.86 _ 76.22Economies in transition 477 843 0.12 _ 0.85 Economies in transition 486 097 0.12 _ 0.65Developing economies 17 715 664 0.43 100.00 31.57 Developing economies 17 248 733 0.42 100.00 23.13China 5 811 751 0.67 32.81 10.36 China 5 013 209 0.58 29.06 6.72Mexico 2 707 750 1.17 15.28 4.83 South Africa 2 095 597 4.18 12.15 2.81China, Hong Kong SAR 2 498 280 0.81 14.10 4.45 Mexico 2 036 324 0.88 11.81 2.73Singapore 1 364 998 0.54 7.71 2.43 Republic of Korea 1 265 873 0.42 7.34 1.70Brazil 889 296 0.69 5.02 1.58 Singapore 1 006 548 0.40 5.84 1.35Thailand 865 258 0.72 4.88 1.54 China, Taiwan Province of 980 277 0.47 5.68 1.31Republic of Korea 823 649 0.27 4.65 1.47 Thailand 972 540 0.81 5.64 1.30China, Taiwan Province of 557 036 0.27 3.14 0.99 Brazil 971 877 0.76 5.63 1.30India 446 765 0.39 2.52 0.80 China, Hong Kong SAR 933 552 0.30 5.41 1.25Indonesia 355 946 0.38 2.01 0.63 Malaysia 619 535 0.41 3.59 0.83
World 76 741 647 0.69 _ 100.0 World 285 331 419 2.57 _ 100.0Developed economies 60 491 660 0.92 _ 78.83 Developed economies 120 932 374 1.83 _ 42.38Economies in transition 718 048 0.18 _ 0.94 Economies in transition 187 115 0.05 _ 0.07Developing economies 15 531 939 0.38 100.00 20.24 Developing economies 164 211 929 4.00 100.00 57.55Singapore 3 446 420 1.37 22.19 4.49 China 84 658 352 9.78 51.55 29.67Republic of Korea 3 168 555 1.04 20.40 4.13 Malaysia 15 283 577 10.13 9.31 5.36China 2 985 787 0.35 19.22 3.89 Singapore 14 275 329 5.69 8.69 5.00Brazil 1 521 133 1.19 9.79 1.98 China, Hong Kong SAR 10 091 659 3.28 6.15 3.54Mexico 955 252 0.41 6.15 1.24 Thailand 9 596 512 7.97 5.84 3.36United Arab Emirates 675 155 0.53 4.35 0.88 Mexico 9 370 138 4.04 5.71 3.28China, Hong Kong SAR 633 907 0.21 4.08 0.83 Republic of Korea 8 875 949 2.91 5.41 3.11Indonesia 344 067 0.37 2.22 0.45 Philippines 4 373 366 9.86 2.66 1.53Thailand 248 294 0.21 1.60 0.32 China, Taiwan Province of 4 024 927 1.95 2.45 1.41South Africa 180 733 0.36 1.16 0.24 Indonesia 1 818 003 1.95 1.11 0.64
World 104 175 925 0.94 _ 100.0 World 211 531 026 1.90 _ 100.0Developed economies 86 727 481 1.31 _ 83.25 Developed economies 91 965 342 1.39 _ 43.48Economies in transition 540 144 0.14 _ 0.52 Economies in transition 89 991 0.02 _ 0.04Developing economies 16 908 299 0.41 100.00 16.23 Developing economies 119 475 693 2.91 100.00 56.48Republic of Korea 3 653 057 1.20 21.61 3.51 China 32 194 220 3.72 26.95 15.22China 3 068 556 0.35 18.15 2.95 China, Hong Kong SAR 28 072 903 9.13 23.50 13.27China, Taiwan Province of 2 876 435 1.39 17.01 2.76 Singapore 17 731 720 7.07 14.84 8.38Singapore 1 677 126 0.67 9.92 1.61 China, Taiwan Province of 10 185 026 4.93 8.52 4.81China, Hong Kong SAR 1 661 095 0.54 9.82 1.59 Malaysia 9 981 732 6.62 8.35 4.72Mexico 724 915 0.31 4.29 0.70 Republic of Korea 8 576 442 2.81 7.18 4.05Malaysia 720 373 0.48 4.26 0.69 Philippines 3 533 390 7.97 2.96 1.67Brazil 498 785 0.39 2.95 0.48 Thailand 3 481 216 2.89 2.91 1.65India 484 171 0.42 2.86 0.46 Mexico 2 476 867 1.07 2.07 1.17South Africa 288 575 0.58 1.71 0.28 Indonesia 794 400 0.85 0.66 0.38
For sources and notes, see end of table. Pour les sources et les notes, se reporter à la fin du tableau.
741 - Heating cooling equipment parts nes
743 - Gas pump, compressor, fan, filter
752 - Computer equipment nes
759 - Office equipment part & accessories
713 - Internal combustion engine part nes
716 - Rotating electric plant parts nes
723 - Civil engineering plant & equipment
728 - Special industrial machine part nes
Leading exporting developing economies (1)based on average 2005-2006 exports (2)
SITC Revision 3 (3-digit level)
Principales économies en dévelopement exportatrices (1) d'après la moyenne des
exportations de 2005-2006 (2)CTCI révision 3 (positions à 3
2005-2006
Leading exporting developing economies (1)based on average 2005-2006 exports (2)
SITC Revision 3 (3-digit level)
Principales économies en dévelopement exportatrices (1) d'après la moyenne des
exportations de 2005-2006 (2)CTCI révision 3 (positions à 3
2005-2006
Value(f.o.b., thousands
of dollars)
Valeur(f.a.b., milliers
de dollars)
As percentageEn pourcentage
Value(f.o.b., thousands
of dollars)
Valeur(f.a.b., milliers
de dollars)
As percentageEn pourcentage
3.2.E Exports structure by productMajor exporters for leading products among developing economies
3.2.E Structure des exportations par produitsPrincipaux exportateurs de produits majeurs parmi les économies en développement
178
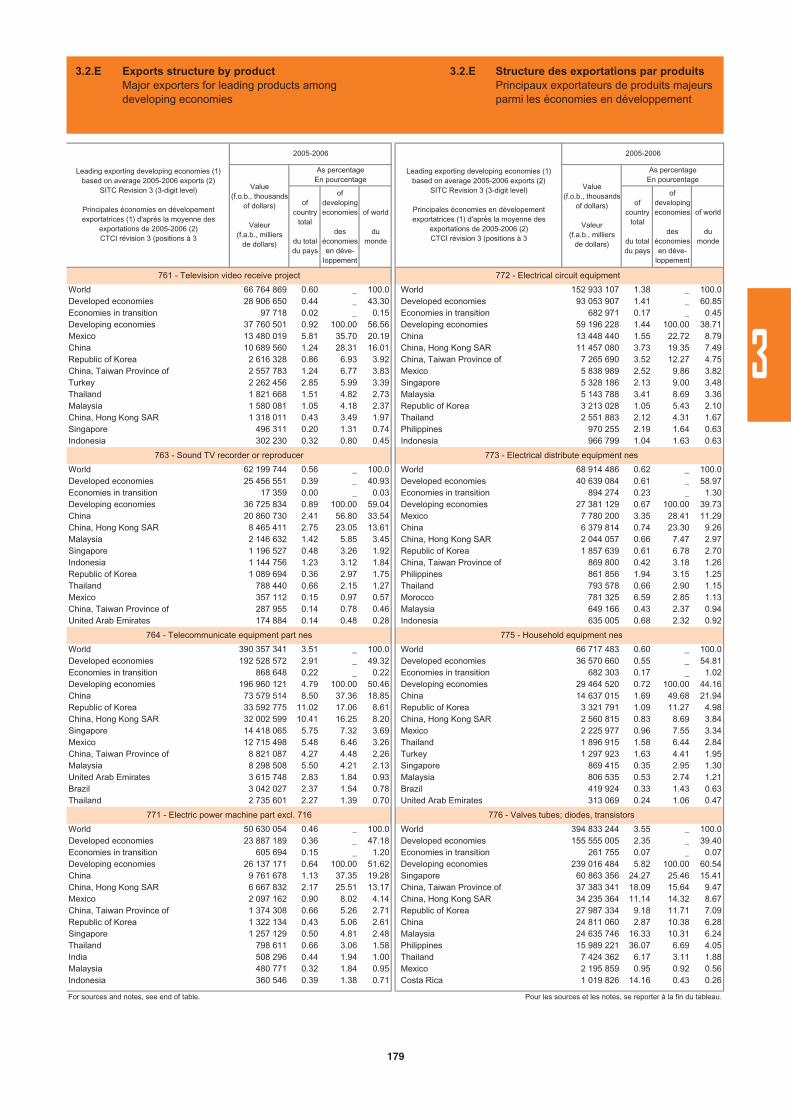
ofcountry
total
du totaldu pays
ofdevelopingeconomies
deséconomiesen déve-
loppement
of world
dumonde
ofcountry
total
du totaldu pays
ofdevelopingeconomies
deséconomiesen déve-
loppement
of world
dumonde
World 66 764 869 0.60 _ 100.0 World 152 933 107 1.38 _ 100.0Developed economies 28 906 650 0.44 _ 43.30 Developed economies 93 053 907 1.41 _ 60.85Economies in transition 97 718 0.02 _ 0.15 Economies in transition 682 971 0.17 _ 0.45Developing economies 37 760 501 0.92 100.00 56.56 Developing economies 59 196 228 1.44 100.00 38.71Mexico 13 480 019 5.81 35.70 20.19 China 13 448 440 1.55 22.72 8.79China 10 689 560 1.24 28.31 16.01 China, Hong Kong SAR 11 457 080 3.73 19.35 7.49Republic of Korea 2 616 328 0.86 6.93 3.92 China, Taiwan Province of 7 265 690 3.52 12.27 4.75China, Taiwan Province of 2 557 783 1.24 6.77 3.83 Mexico 5 838 989 2.52 9.86 3.82Turkey 2 262 456 2.85 5.99 3.39 Singapore 5 328 186 2.13 9.00 3.48Thailand 1 821 668 1.51 4.82 2.73 Malaysia 5 143 788 3.41 8.69 3.36Malaysia 1 580 081 1.05 4.18 2.37 Republic of Korea 3 213 028 1.05 5.43 2.10China, Hong Kong SAR 1 318 011 0.43 3.49 1.97 Thailand 2 551 883 2.12 4.31 1.67Singapore 496 311 0.20 1.31 0.74 Philippines 970 255 2.19 1.64 0.63Indonesia 302 230 0.32 0.80 0.45 Indonesia 966 799 1.04 1.63 0.63
World 62 199 744 0.56 _ 100.0 World 68 914 486 0.62 _ 100.0Developed economies 25 456 551 0.39 _ 40.93 Developed economies 40 639 084 0.61 _ 58.97Economies in transition 17 359 0.00 _ 0.03 Economies in transition 894 274 0.23 _ 1.30Developing economies 36 725 834 0.89 100.00 59.04 Developing economies 27 381 129 0.67 100.00 39.73China 20 860 730 2.41 56.80 33.54 Mexico 7 780 200 3.35 28.41 11.29China, Hong Kong SAR 8 465 411 2.75 23.05 13.61 China 6 379 814 0.74 23.30 9.26Malaysia 2 146 632 1.42 5.85 3.45 China, Hong Kong SAR 2 044 057 0.66 7.47 2.97Singapore 1 196 527 0.48 3.26 1.92 Republic of Korea 1 857 639 0.61 6.78 2.70Indonesia 1 144 756 1.23 3.12 1.84 China, Taiwan Province of 869 800 0.42 3.18 1.26Republic of Korea 1 089 694 0.36 2.97 1.75 Philippines 861 856 1.94 3.15 1.25Thailand 788 440 0.66 2.15 1.27 Thailand 793 578 0.66 2.90 1.15Mexico 357 112 0.15 0.97 0.57 Morocco 781 325 6.59 2.85 1.13China, Taiwan Province of 287 955 0.14 0.78 0.46 Malaysia 649 166 0.43 2.37 0.94United Arab Emirates 174 884 0.14 0.48 0.28 Indonesia 635 005 0.68 2.32 0.92
World 390 357 341 3.51 _ 100.0 World 66 717 483 0.60 _ 100.0Developed economies 192 528 572 2.91 _ 49.32 Developed economies 36 570 660 0.55 _ 54.81Economies in transition 868 648 0.22 _ 0.22 Economies in transition 682 303 0.17 _ 1.02Developing economies 196 960 121 4.79 100.00 50.46 Developing economies 29 464 520 0.72 100.00 44.16China 73 579 514 8.50 37.36 18.85 China 14 637 015 1.69 49.68 21.94Republic of Korea 33 592 775 11.02 17.06 8.61 Republic of Korea 3 321 791 1.09 11.27 4.98China, Hong Kong SAR 32 002 599 10.41 16.25 8.20 China, Hong Kong SAR 2 560 815 0.83 8.69 3.84Singapore 14 418 065 5.75 7.32 3.69 Mexico 2 225 977 0.96 7.55 3.34Mexico 12 715 498 5.48 6.46 3.26 Thailand 1 896 915 1.58 6.44 2.84China, Taiwan Province of 8 821 087 4.27 4.48 2.26 Turkey 1 297 923 1.63 4.41 1.95Malaysia 8 298 508 5.50 4.21 2.13 Singapore 869 415 0.35 2.95 1.30United Arab Emirates 3 615 748 2.83 1.84 0.93 Malaysia 806 535 0.53 2.74 1.21Brazil 3 042 027 2.37 1.54 0.78 Brazil 419 924 0.33 1.43 0.63Thailand 2 735 601 2.27 1.39 0.70 United Arab Emirates 313 069 0.24 1.06 0.47
World 50 630 054 0.46 _ 100.0 World 394 833 244 3.55 _ 100.0Developed economies 23 887 189 0.36 _ 47.18 Developed economies 155 555 005 2.35 _ 39.40Economies in transition 605 694 0.15 _ 1.20 Economies in transition 261 755 0.07 _ 0.07Developing economies 26 137 171 0.64 100.00 51.62 Developing economies 239 016 484 5.82 100.00 60.54China 9 761 678 1.13 37.35 19.28 Singapore 60 863 356 24.27 25.46 15.41China, Hong Kong SAR 6 667 832 2.17 25.51 13.17 China, Taiwan Province of 37 383 341 18.09 15.64 9.47Mexico 2 097 162 0.90 8.02 4.14 China, Hong Kong SAR 34 235 364 11.14 14.32 8.67China, Taiwan Province of 1 374 308 0.66 5.26 2.71 Republic of Korea 27 987 334 9.18 11.71 7.09Republic of Korea 1 322 134 0.43 5.06 2.61 China 24 811 060 2.87 10.38 6.28Singapore 1 257 129 0.50 4.81 2.48 Malaysia 24 635 746 16.33 10.31 6.24Thailand 798 611 0.66 3.06 1.58 Philippines 15 989 221 36.07 6.69 4.05India 508 296 0.44 1.94 1.00 Thailand 7 424 362 6.17 3.11 1.88Malaysia 480 771 0.32 1.84 0.95 Mexico 2 195 859 0.95 0.92 0.56Indonesia 360 546 0.39 1.38 0.71 Costa Rica 1 019 826 14.16 0.43 0.26
For sources and notes, see end of table. Pour les sources et les notes, se reporter à la fin du tableau.
772 - Electrical circuit equipment
773 - Electrical distribute equipment nes
775 - Household equipment nes
776 - Valves tubes; diodes, transistors
761 - Television video receive project
763 - Sound TV recorder or reproducer
764 - Telecommunicate equipment part nes
771 - Electric power machine part excl. 716
Leading exporting developing economies (1)based on average 2005-2006 exports (2)
SITC Revision 3 (3-digit level)
Principales économies en dévelopement exportatrices (1) d'après la moyenne des
exportations de 2005-2006 (2)CTCI révision 3 (positions à 3
2005-2006
Leading exporting developing economies (1)based on average 2005-2006 exports (2)
SITC Revision 3 (3-digit level)
Principales économies en dévelopement exportatrices (1) d'après la moyenne des
exportations de 2005-2006 (2)CTCI révision 3 (positions à 3
2005-2006
Value(f.o.b., thousands
of dollars)
Valeur(f.a.b., milliers
de dollars)
As percentageEn pourcentage
Value(f.o.b., thousands
of dollars)
Valeur(f.a.b., milliers
de dollars)
As percentageEn pourcentage
3.2.E Exports structure by productMajor exporters for leading products among developing economies
3.2.E Structure des exportations par produitsPrincipaux exportateurs de produits majeurs parmi les économies en développement
179
3
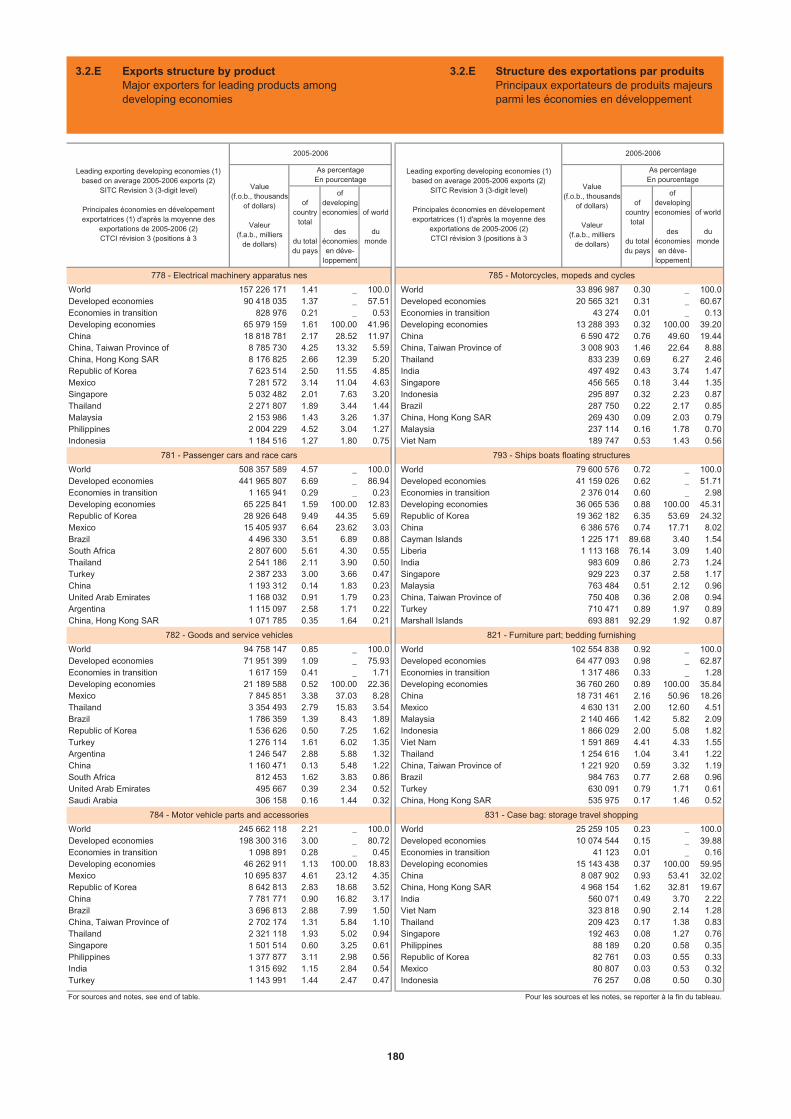
ofcountry
total
du totaldu pays
ofdevelopingeconomies
deséconomiesen déve-
loppement
of world
dumonde
ofcountry
total
du totaldu pays
ofdevelopingeconomies
deséconomiesen déve-
loppement
of world
dumonde
World 157 226 171 1.41 _ 100.0 World 33 896 987 0.30 _ 100.0Developed economies 90 418 035 1.37 _ 57.51 Developed economies 20 565 321 0.31 _ 60.67Economies in transition 828 976 0.21 _ 0.53 Economies in transition 43 274 0.01 _ 0.13Developing economies 65 979 159 1.61 100.00 41.96 Developing economies 13 288 393 0.32 100.00 39.20China 18 818 781 2.17 28.52 11.97 China 6 590 472 0.76 49.60 19.44China, Taiwan Province of 8 785 730 4.25 13.32 5.59 China, Taiwan Province of 3 008 903 1.46 22.64 8.88China, Hong Kong SAR 8 176 825 2.66 12.39 5.20 Thailand 833 239 0.69 6.27 2.46Republic of Korea 7 623 514 2.50 11.55 4.85 India 497 492 0.43 3.74 1.47Mexico 7 281 572 3.14 11.04 4.63 Singapore 456 565 0.18 3.44 1.35Singapore 5 032 482 2.01 7.63 3.20 Indonesia 295 897 0.32 2.23 0.87Thailand 2 271 807 1.89 3.44 1.44 Brazil 287 750 0.22 2.17 0.85Malaysia 2 153 986 1.43 3.26 1.37 China, Hong Kong SAR 269 430 0.09 2.03 0.79Philippines 2 004 229 4.52 3.04 1.27 Malaysia 237 114 0.16 1.78 0.70Indonesia 1 184 516 1.27 1.80 0.75 Viet Nam 189 747 0.53 1.43 0.56
World 508 357 589 4.57 _ 100.0 World 79 600 576 0.72 _ 100.0Developed economies 441 965 807 6.69 _ 86.94 Developed economies 41 159 026 0.62 _ 51.71Economies in transition 1 165 941 0.29 _ 0.23 Economies in transition 2 376 014 0.60 _ 2.98Developing economies 65 225 841 1.59 100.00 12.83 Developing economies 36 065 536 0.88 100.00 45.31Republic of Korea 28 926 648 9.49 44.35 5.69 Republic of Korea 19 362 182 6.35 53.69 24.32Mexico 15 405 937 6.64 23.62 3.03 China 6 386 576 0.74 17.71 8.02Brazil 4 496 330 3.51 6.89 0.88 Cayman Islands 1 225 171 89.68 3.40 1.54South Africa 2 807 600 5.61 4.30 0.55 Liberia 1 113 168 76.14 3.09 1.40Thailand 2 541 186 2.11 3.90 0.50 India 983 609 0.86 2.73 1.24Turkey 2 387 233 3.00 3.66 0.47 Singapore 929 223 0.37 2.58 1.17China 1 193 312 0.14 1.83 0.23 Malaysia 763 484 0.51 2.12 0.96United Arab Emirates 1 168 032 0.91 1.79 0.23 China, Taiwan Province of 750 408 0.36 2.08 0.94Argentina 1 115 097 2.58 1.71 0.22 Turkey 710 471 0.89 1.97 0.89China, Hong Kong SAR 1 071 785 0.35 1.64 0.21 Marshall Islands 693 881 92.29 1.92 0.87
World 94 758 147 0.85 _ 100.0 World 102 554 838 0.92 _ 100.0Developed economies 71 951 399 1.09 _ 75.93 Developed economies 64 477 093 0.98 _ 62.87Economies in transition 1 617 159 0.41 _ 1.71 Economies in transition 1 317 486 0.33 _ 1.28Developing economies 21 189 588 0.52 100.00 22.36 Developing economies 36 760 260 0.89 100.00 35.84Mexico 7 845 851 3.38 37.03 8.28 China 18 731 461 2.16 50.96 18.26Thailand 3 354 493 2.79 15.83 3.54 Mexico 4 630 131 2.00 12.60 4.51Brazil 1 786 359 1.39 8.43 1.89 Malaysia 2 140 466 1.42 5.82 2.09Republic of Korea 1 536 626 0.50 7.25 1.62 Indonesia 1 866 029 2.00 5.08 1.82Turkey 1 276 114 1.61 6.02 1.35 Viet Nam 1 591 869 4.41 4.33 1.55Argentina 1 246 547 2.88 5.88 1.32 Thailand 1 254 616 1.04 3.41 1.22China 1 160 471 0.13 5.48 1.22 China, Taiwan Province of 1 221 920 0.59 3.32 1.19South Africa 812 453 1.62 3.83 0.86 Brazil 984 763 0.77 2.68 0.96United Arab Emirates 495 667 0.39 2.34 0.52 Turkey 630 091 0.79 1.71 0.61Saudi Arabia 306 158 0.16 1.44 0.32 China, Hong Kong SAR 535 975 0.17 1.46 0.52
World 245 662 118 2.21 _ 100.0 World 25 259 105 0.23 _ 100.0Developed economies 198 300 316 3.00 _ 80.72 Developed economies 10 074 544 0.15 _ 39.88Economies in transition 1 098 891 0.28 _ 0.45 Economies in transition 41 123 0.01 _ 0.16Developing economies 46 262 911 1.13 100.00 18.83 Developing economies 15 143 438 0.37 100.00 59.95Mexico 10 695 837 4.61 23.12 4.35 China 8 087 902 0.93 53.41 32.02Republic of Korea 8 642 813 2.83 18.68 3.52 China, Hong Kong SAR 4 968 154 1.62 32.81 19.67China 7 781 771 0.90 16.82 3.17 India 560 071 0.49 3.70 2.22Brazil 3 696 813 2.88 7.99 1.50 Viet Nam 323 818 0.90 2.14 1.28China, Taiwan Province of 2 702 174 1.31 5.84 1.10 Thailand 209 423 0.17 1.38 0.83Thailand 2 321 118 1.93 5.02 0.94 Singapore 192 463 0.08 1.27 0.76Singapore 1 501 514 0.60 3.25 0.61 Philippines 88 189 0.20 0.58 0.35Philippines 1 377 877 3.11 2.98 0.56 Republic of Korea 82 761 0.03 0.55 0.33India 1 315 692 1.15 2.84 0.54 Mexico 80 807 0.03 0.53 0.32Turkey 1 143 991 1.44 2.47 0.47 Indonesia 76 257 0.08 0.50 0.30
For sources and notes, see end of table. Pour les sources et les notes, se reporter à la fin du tableau.
785 - Motorcycles, mopeds and cycles
793 - Ships boats floating structures
821 - Furniture part; bedding furnishing
831 - Case bag: storage travel shopping
778 - Electrical machinery apparatus nes
781 - Passenger cars and race cars
782 - Goods and service vehicles
784 - Motor vehicle parts and accessories
Leading exporting developing economies (1)based on average 2005-2006 exports (2)
SITC Revision 3 (3-digit level)
Principales économies en dévelopement exportatrices (1) d'après la moyenne des
exportations de 2005-2006 (2)CTCI révision 3 (positions à 3
2005-2006
Leading exporting developing economies (1)based on average 2005-2006 exports (2)
SITC Revision 3 (3-digit level)
Principales économies en dévelopement exportatrices (1) d'après la moyenne des
exportations de 2005-2006 (2)CTCI révision 3 (positions à 3
2005-2006
Value(f.o.b., thousands
of dollars)
Valeur(f.a.b., milliers
de dollars)
As percentageEn pourcentage
Value(f.o.b., thousands
of dollars)
Valeur(f.a.b., milliers
de dollars)
As percentageEn pourcentage
3.2.E Exports structure by productMajor exporters for leading products among developing economies
3.2.E Structure des exportations par produitsPrincipaux exportateurs de produits majeurs parmi les économies en développement
180
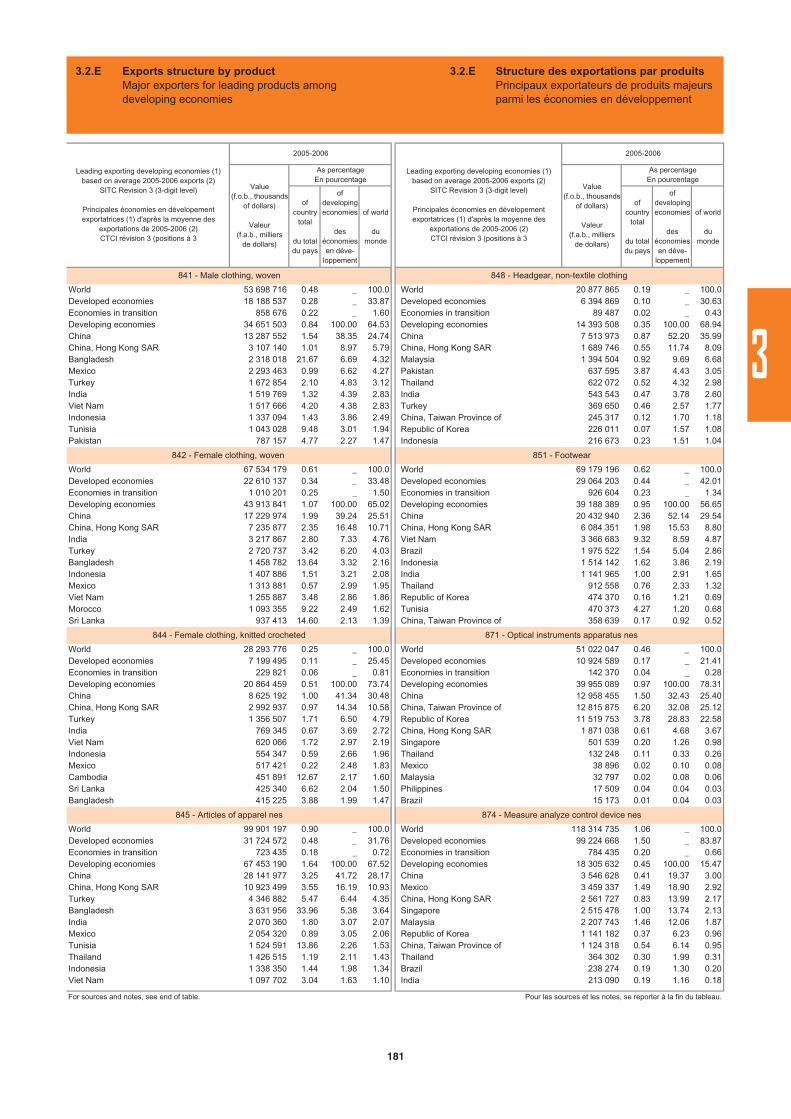
ofcountry
total
du totaldu pays
ofdevelopingeconomies
deséconomiesen déve-
loppement
of world
dumonde
ofcountry
total
du totaldu pays
ofdevelopingeconomies
deséconomiesen déve-
loppement
of world
dumonde
World 53 698 716 0.48 _ 100.0 World 20 877 865 0.19 _ 100.0Developed economies 18 188 537 0.28 _ 33.87 Developed economies 6 394 869 0.10 _ 30.63Economies in transition 858 676 0.22 _ 1.60 Economies in transition 89 487 0.02 _ 0.43Developing economies 34 651 503 0.84 100.00 64.53 Developing economies 14 393 508 0.35 100.00 68.94China 13 287 552 1.54 38.35 24.74 China 7 513 973 0.87 52.20 35.99China, Hong Kong SAR 3 107 140 1.01 8.97 5.79 China, Hong Kong SAR 1 689 746 0.55 11.74 8.09Bangladesh 2 318 018 21.67 6.69 4.32 Malaysia 1 394 504 0.92 9.69 6.68Mexico 2 293 463 0.99 6.62 4.27 Pakistan 637 595 3.87 4.43 3.05Turkey 1 672 854 2.10 4.83 3.12 Thailand 622 072 0.52 4.32 2.98India 1 519 769 1.32 4.39 2.83 India 543 543 0.47 3.78 2.60Viet Nam 1 517 666 4.20 4.38 2.83 Turkey 369 650 0.46 2.57 1.77Indonesia 1 337 094 1.43 3.86 2.49 China, Taiwan Province of 245 317 0.12 1.70 1.18Tunisia 1 043 028 9.48 3.01 1.94 Republic of Korea 226 011 0.07 1.57 1.08Pakistan 787 157 4.77 2.27 1.47 Indonesia 216 673 0.23 1.51 1.04
World 67 534 179 0.61 _ 100.0 World 69 179 196 0.62 _ 100.0Developed economies 22 610 137 0.34 _ 33.48 Developed economies 29 064 203 0.44 _ 42.01Economies in transition 1 010 201 0.25 _ 1.50 Economies in transition 926 604 0.23 _ 1.34Developing economies 43 913 841 1.07 100.00 65.02 Developing economies 39 188 389 0.95 100.00 56.65China 17 229 974 1.99 39.24 25.51 China 20 432 940 2.36 52.14 29.54China, Hong Kong SAR 7 235 877 2.35 16.48 10.71 China, Hong Kong SAR 6 084 351 1.98 15.53 8.80India 3 217 867 2.80 7.33 4.76 Viet Nam 3 366 683 9.32 8.59 4.87Turkey 2 720 737 3.42 6.20 4.03 Brazil 1 975 522 1.54 5.04 2.86Bangladesh 1 458 782 13.64 3.32 2.16 Indonesia 1 514 142 1.62 3.86 2.19Indonesia 1 407 886 1.51 3.21 2.08 India 1 141 965 1.00 2.91 1.65Mexico 1 313 881 0.57 2.99 1.95 Thailand 912 558 0.76 2.33 1.32Viet Nam 1 255 887 3.48 2.86 1.86 Republic of Korea 474 370 0.16 1.21 0.69Morocco 1 093 355 9.22 2.49 1.62 Tunisia 470 373 4.27 1.20 0.68Sri Lanka 937 413 14.60 2.13 1.39 China, Taiwan Province of 358 639 0.17 0.92 0.52
World 28 293 776 0.25 _ 100.0 World 51 022 047 0.46 _ 100.0Developed economies 7 199 495 0.11 _ 25.45 Developed economies 10 924 589 0.17 _ 21.41Economies in transition 229 821 0.06 _ 0.81 Economies in transition 142 370 0.04 _ 0.28Developing economies 20 864 459 0.51 100.00 73.74 Developing economies 39 955 089 0.97 100.00 78.31China 8 625 192 1.00 41.34 30.48 China 12 958 455 1.50 32.43 25.40China, Hong Kong SAR 2 992 937 0.97 14.34 10.58 China, Taiwan Province of 12 815 875 6.20 32.08 25.12Turkey 1 356 507 1.71 6.50 4.79 Republic of Korea 11 519 753 3.78 28.83 22.58India 769 345 0.67 3.69 2.72 China, Hong Kong SAR 1 871 038 0.61 4.68 3.67Viet Nam 620 066 1.72 2.97 2.19 Singapore 501 539 0.20 1.26 0.98Indonesia 554 347 0.59 2.66 1.96 Thailand 132 248 0.11 0.33 0.26Mexico 517 421 0.22 2.48 1.83 Mexico 38 896 0.02 0.10 0.08Cambodia 451 891 12.67 2.17 1.60 Malaysia 32 797 0.02 0.08 0.06Sri Lanka 425 340 6.62 2.04 1.50 Philippines 17 509 0.04 0.04 0.03Bangladesh 415 225 3.88 1.99 1.47 Brazil 15 173 0.01 0.04 0.03
World 99 901 197 0.90 _ 100.0 World 118 314 735 1.06 _ 100.0Developed economies 31 724 572 0.48 _ 31.76 Developed economies 99 224 668 1.50 _ 83.87Economies in transition 723 435 0.18 _ 0.72 Economies in transition 784 435 0.20 _ 0.66Developing economies 67 453 190 1.64 100.00 67.52 Developing economies 18 305 632 0.45 100.00 15.47China 28 141 977 3.25 41.72 28.17 China 3 546 628 0.41 19.37 3.00China, Hong Kong SAR 10 923 499 3.55 16.19 10.93 Mexico 3 459 337 1.49 18.90 2.92Turkey 4 346 882 5.47 6.44 4.35 China, Hong Kong SAR 2 561 727 0.83 13.99 2.17Bangladesh 3 631 956 33.96 5.38 3.64 Singapore 2 515 478 1.00 13.74 2.13India 2 070 360 1.80 3.07 2.07 Malaysia 2 207 743 1.46 12.06 1.87Mexico 2 054 320 0.89 3.05 2.06 Republic of Korea 1 141 182 0.37 6.23 0.96Tunisia 1 524 591 13.86 2.26 1.53 China, Taiwan Province of 1 124 318 0.54 6.14 0.95Thailand 1 426 515 1.19 2.11 1.43 Thailand 364 302 0.30 1.99 0.31Indonesia 1 338 350 1.44 1.98 1.34 Brazil 238 274 0.19 1.30 0.20Viet Nam 1 097 702 3.04 1.63 1.10 India 213 090 0.19 1.16 0.18
For sources and notes, see end of table. Pour les sources et les notes, se reporter à la fin du tableau.
848 - Headgear, non-textile clothing
851 - Footwear
871 - Optical instruments apparatus nes
874 - Measure analyze control device nes
841 - Male clothing, woven
842 - Female clothing, woven
844 - Female clothing, knitted crocheted
845 - Articles of apparel nes
Leading exporting developing economies (1)based on average 2005-2006 exports (2)
SITC Revision 3 (3-digit level)
Principales économies en dévelopement exportatrices (1) d'après la moyenne des
exportations de 2005-2006 (2)CTCI révision 3 (positions à 3
2005-2006
Leading exporting developing economies (1)based on average 2005-2006 exports (2)
SITC Revision 3 (3-digit level)
Principales économies en dévelopement exportatrices (1) d'après la moyenne des
exportations de 2005-2006 (2)CTCI révision 3 (positions à 3
2005-2006
Value(f.o.b., thousands
of dollars)
Valeur(f.a.b., milliers
de dollars)
As percentageEn pourcentage
Value(f.o.b., thousands
of dollars)
Valeur(f.a.b., milliers
de dollars)
As percentageEn pourcentage
3.2.E Exports structure by productMajor exporters for leading products among developing economies
3.2.E Structure des exportations par produitsPrincipaux exportateurs de produits majeurs parmi les économies en développement
181
3
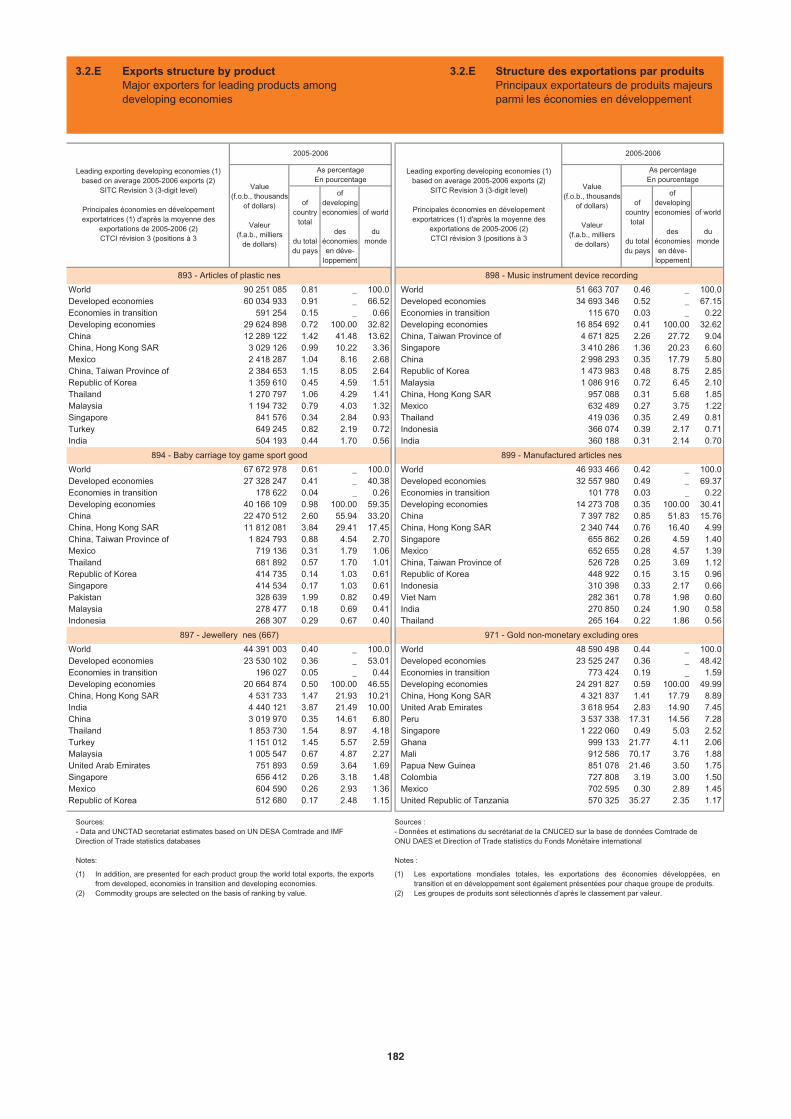
ofcountry
total
du totaldu pays
ofdevelopingeconomies
deséconomiesen déve-
loppement
of world
dumonde
ofcountry
total
du totaldu pays
ofdevelopingeconomies
deséconomiesen déve-
loppement
of world
dumonde
World 90 251 085 0.81 _ 100.0 World 51 663 707 0.46 _ 100.0Developed economies 60 034 933 0.91 _ 66.52 Developed economies 34 693 346 0.52 _ 67.15Economies in transition 591 254 0.15 _ 0.66 Economies in transition 115 670 0.03 _ 0.22Developing economies 29 624 898 0.72 100.00 32.82 Developing economies 16 854 692 0.41 100.00 32.62China 12 289 122 1.42 41.48 13.62 China, Taiwan Province of 4 671 825 2.26 27.72 9.04China, Hong Kong SAR 3 029 126 0.99 10.22 3.36 Singapore 3 410 286 1.36 20.23 6.60Mexico 2 418 287 1.04 8.16 2.68 China 2 998 293 0.35 17.79 5.80China, Taiwan Province of 2 384 653 1.15 8.05 2.64 Republic of Korea 1 473 983 0.48 8.75 2.85Republic of Korea 1 359 610 0.45 4.59 1.51 Malaysia 1 086 916 0.72 6.45 2.10Thailand 1 270 797 1.06 4.29 1.41 China, Hong Kong SAR 957 088 0.31 5.68 1.85Malaysia 1 194 732 0.79 4.03 1.32 Mexico 632 489 0.27 3.75 1.22Singapore 841 576 0.34 2.84 0.93 Thailand 419 036 0.35 2.49 0.81Turkey 649 245 0.82 2.19 0.72 Indonesia 366 074 0.39 2.17 0.71India 504 193 0.44 1.70 0.56 India 360 188 0.31 2.14 0.70
World 67 672 978 0.61 _ 100.0 World 46 933 466 0.42 _ 100.0Developed economies 27 328 247 0.41 _ 40.38 Developed economies 32 557 980 0.49 _ 69.37Economies in transition 178 622 0.04 _ 0.26 Economies in transition 101 778 0.03 _ 0.22Developing economies 40 166 109 0.98 100.00 59.35 Developing economies 14 273 708 0.35 100.00 30.41China 22 470 512 2.60 55.94 33.20 China 7 397 782 0.85 51.83 15.76China, Hong Kong SAR 11 812 081 3.84 29.41 17.45 China, Hong Kong SAR 2 340 744 0.76 16.40 4.99China, Taiwan Province of 1 824 793 0.88 4.54 2.70 Singapore 655 862 0.26 4.59 1.40Mexico 719 136 0.31 1.79 1.06 Mexico 652 655 0.28 4.57 1.39Thailand 681 892 0.57 1.70 1.01 China, Taiwan Province of 526 728 0.25 3.69 1.12Republic of Korea 414 735 0.14 1.03 0.61 Republic of Korea 448 922 0.15 3.15 0.96Singapore 414 534 0.17 1.03 0.61 Indonesia 310 398 0.33 2.17 0.66Pakistan 328 639 1.99 0.82 0.49 Viet Nam 282 361 0.78 1.98 0.60Malaysia 278 477 0.18 0.69 0.41 India 270 850 0.24 1.90 0.58Indonesia 268 307 0.29 0.67 0.40 Thailand 265 164 0.22 1.86 0.56
World 44 391 003 0.40 _ 100.0 World 48 590 498 0.44 _ 100.0Developed economies 23 530 102 0.36 _ 53.01 Developed economies 23 525 247 0.36 _ 48.42Economies in transition 196 027 0.05 _ 0.44 Economies in transition 773 424 0.19 _ 1.59Developing economies 20 664 874 0.50 100.00 46.55 Developing economies 24 291 827 0.59 100.00 49.99China, Hong Kong SAR 4 531 733 1.47 21.93 10.21 China, Hong Kong SAR 4 321 837 1.41 17.79 8.89India 4 440 121 3.87 21.49 10.00 United Arab Emirates 3 618 954 2.83 14.90 7.45China 3 019 970 0.35 14.61 6.80 Peru 3 537 338 17.31 14.56 7.28Thailand 1 853 730 1.54 8.97 4.18 Singapore 1 222 060 0.49 5.03 2.52Turkey 1 151 012 1.45 5.57 2.59 Ghana 999 133 21.77 4.11 2.06Malaysia 1 005 547 0.67 4.87 2.27 Mali 912 586 70.17 3.76 1.88United Arab Emirates 751 893 0.59 3.64 1.69 Papua New Guinea 851 078 21.46 3.50 1.75Singapore 656 412 0.26 3.18 1.48 Colombia 727 808 3.19 3.00 1.50Mexico 604 590 0.26 2.93 1.36 Mexico 702 595 0.30 2.89 1.45Republic of Korea 512 680 0.17 2.48 1.15 United Republic of Tanzania 570 325 35.27 2.35 1.17
893 - Articles of plastic nes
894 - Baby carriage toy game sport good
897 - Jewellery nes (667)
898 - Music instrument device recording
899 - Manufactured articles nes
971 - Gold non-monetary excluding ores
Leading exporting developing economies (1)based on average 2005-2006 exports (2)
SITC Revision 3 (3-digit level)
Principales économies en dévelopement exportatrices (1) d'après la moyenne des
exportations de 2005-2006 (2)CTCI révision 3 (positions à 3
2005-2006
Leading exporting developing economies (1)based on average 2005-2006 exports (2)
SITC Revision 3 (3-digit level)
Principales économies en dévelopement exportatrices (1) d'après la moyenne des
exportations de 2005-2006 (2)CTCI révision 3 (positions à 3
2005-2006
Value(f.o.b., thousands
of dollars)
Valeur(f.a.b., milliers
de dollars)
As percentageEn pourcentage
Value(f.o.b., thousands
of dollars)
Valeur(f.a.b., milliers
de dollars)
As percentageEn pourcentage
3.2.E Exports structure by productMajor exporters for leading products among developing economies
3.2.E Structure des exportations par produitsPrincipaux exportateurs de produits majeurs parmi les économies en développement
(1)
(2)
In addition, are presented for each product group the world total exports, the exportsfrom developed, economies in transition and developing economies.Commodity groups are selected on the basis of ranking by value.
Sources:- Data and UNCTAD secretariat estimates based on UN DESA Comtrade and IMF Direction of Trade statistics databases
Notes:
(1)
(2)
Les exportations mondiales totales, les exportations des économies développées, entransition et en développement sont également présentées pour chaque groupe de produits.Les groupes de produits sont sélectionnés d’après le classement par valeur.
Sources : - Données et estimations du secrétariat de la CNUCED sur la base de données Comtrade de ONU DAES et Direction of Trade statistics du Fonds Monétaire international
Notes :
182
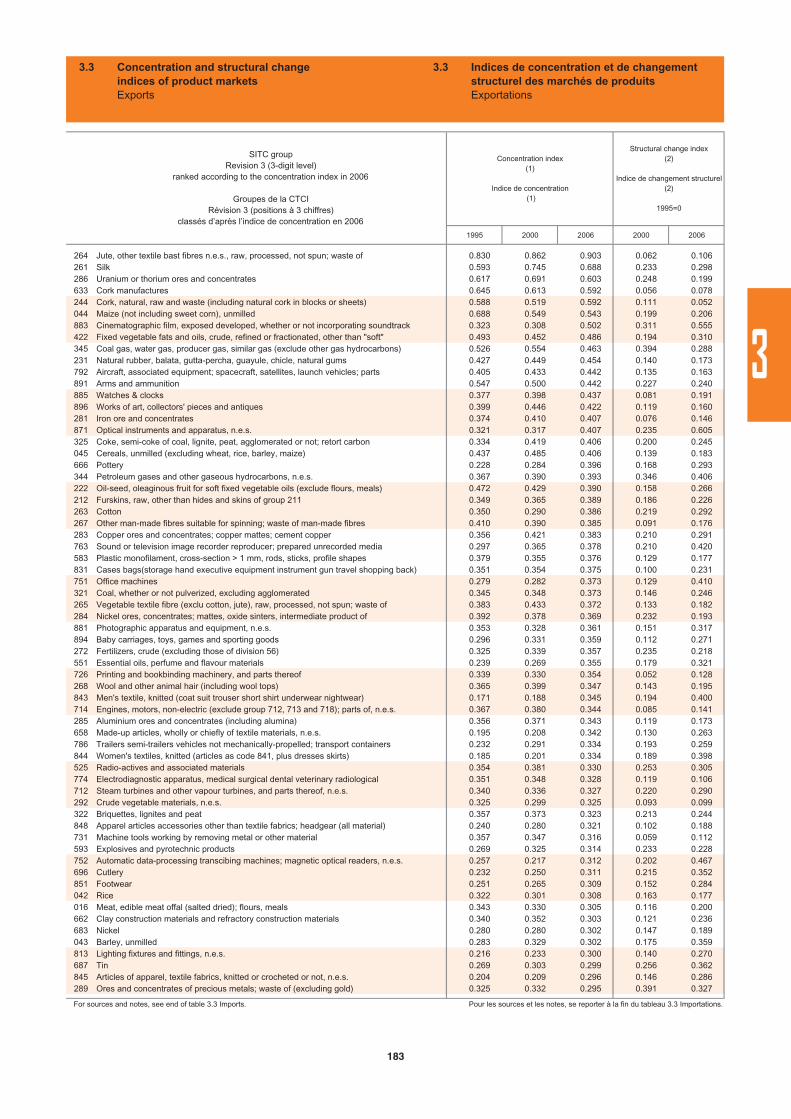
1995 2000 2006 2000 2006
264 Jute, other textile bast fibres n.e.s., raw, processed, not spun; waste of 0.830 0.862 0.903 0.062 0.106261 Silk 0.593 0.745 0.688 0.233 0.298286 Uranium or thorium ores and concentrates 0.617 0.691 0.603 0.248 0.199633 Cork manufactures 0.645 0.613 0.592 0.056 0.078244 Cork, natural, raw and waste (including natural cork in blocks or sheets) 0.588 0.519 0.592 0.111 0.052044 Maize (not including sweet corn), unmilled 0.688 0.549 0.543 0.199 0.206883 Cinematographic film, exposed developed, whether or not incorporating soundtrack 0.323 0.308 0.502 0.311 0.555422 Fixed vegetable fats and oils, crude, refined or fractionated, other than "soft" 0.493 0.452 0.486 0.194 0.310345 Coal gas, water gas, producer gas, similar gas (exclude other gas hydrocarbons) 0.526 0.554 0.463 0.394 0.288231 Natural rubber, balata, gutta-percha, guayule, chicle, natural gums 0.427 0.449 0.454 0.140 0.173792 Aircraft, associated equipment; spacecraft, satellites, launch vehicles; parts 0.405 0.433 0.442 0.135 0.163891 Arms and ammunition 0.547 0.500 0.442 0.227 0.240885 Watches & clocks 0.377 0.398 0.437 0.081 0.191896 Works of art, collectors' pieces and antiques 0.399 0.446 0.422 0.119 0.160281 Iron ore and concentrates 0.374 0.410 0.407 0.076 0.146871 Optical instruments and apparatus, n.e.s. 0.321 0.317 0.407 0.235 0.605325 Coke, semi-coke of coal, lignite, peat, agglomerated or not; retort carbon 0.334 0.419 0.406 0.200 0.245045 Cereals, unmilled (excluding wheat, rice, barley, maize) 0.437 0.485 0.406 0.139 0.183666 Pottery 0.228 0.284 0.396 0.168 0.293344 Petroleum gases and other gaseous hydrocarbons, n.e.s. 0.367 0.390 0.393 0.346 0.406222 Oil-seed, oleaginous fruit for soft fixed vegetable oils (exclude flours, meals) 0.472 0.429 0.390 0.158 0.266212 Furskins, raw, other than hides and skins of group 211 0.349 0.365 0.389 0.186 0.226263 Cotton 0.350 0.290 0.386 0.219 0.292267 Other man-made fibres suitable for spinning; waste of man-made fibres 0.410 0.390 0.385 0.091 0.176283 Copper ores and concentrates; copper mattes; cement copper 0.356 0.421 0.383 0.210 0.291763 Sound or television image recorder reproducer; prepared unrecorded media 0.297 0.365 0.378 0.210 0.420583 Plastic monofilament, cross-section > 1 mm, rods, sticks, profile shapes 0.379 0.355 0.376 0.129 0.177831 Cases bags(storage hand executive equipment instrument gun travel shopping back) 0.351 0.354 0.375 0.100 0.231751 Office machines 0.279 0.282 0.373 0.129 0.410321 Coal, whether or not pulverized, excluding agglomerated 0.345 0.348 0.373 0.146 0.246265 Vegetable textile fibre (exclu cotton, jute), raw, processed, not spun; waste of 0.383 0.433 0.372 0.133 0.182284 Nickel ores, concentrates; mattes, oxide sinters, intermediate product of 0.392 0.378 0.369 0.232 0.193881 Photographic apparatus and equipment, n.e.s. 0.353 0.328 0.361 0.151 0.317894 Baby carriages, toys, games and sporting goods 0.296 0.331 0.359 0.112 0.271272 Fertilizers, crude (excluding those of division 56) 0.325 0.339 0.357 0.235 0.218551 Essential oils, perfume and flavour materials 0.239 0.269 0.355 0.179 0.321726 Printing and bookbinding machinery, and parts thereof 0.339 0.330 0.354 0.052 0.128268 Wool and other animal hair (including wool tops) 0.365 0.399 0.347 0.143 0.195843 Men's textile, knitted (coat suit trouser short shirt underwear nightwear) 0.171 0.188 0.345 0.194 0.400714 Engines, motors, non-electric (exclude group 712, 713 and 718); parts of, n.e.s. 0.367 0.380 0.344 0.085 0.141285 Aluminium ores and concentrates (including alumina) 0.356 0.371 0.343 0.119 0.173658 Made-up articles, wholly or chiefly of textile materials, n.e.s. 0.195 0.208 0.342 0.130 0.263786 Trailers semi-trailers vehicles not mechanically-propelled; transport containers 0.232 0.291 0.334 0.193 0.259844 Women's textiles, knitted (articles as code 841, plus dresses skirts) 0.185 0.201 0.334 0.189 0.398525 Radio-actives and associated materials 0.354 0.381 0.330 0.253 0.305774 Electrodiagnostic apparatus, medical surgical dental veterinary radiological 0.351 0.348 0.328 0.119 0.106712 Steam turbines and other vapour turbines, and parts thereof, n.e.s. 0.340 0.336 0.327 0.220 0.290292 Crude vegetable materials, n.e.s. 0.325 0.299 0.325 0.093 0.099322 Briquettes, lignites and peat 0.357 0.373 0.323 0.213 0.244848 Apparel articles accessories other than textile fabrics; headgear (all material) 0.240 0.280 0.321 0.102 0.188731 Machine tools working by removing metal or other material 0.357 0.347 0.316 0.059 0.112593 Explosives and pyrotechnic products 0.269 0.325 0.314 0.233 0.228752 Automatic data-processing transcibing machines; magnetic optical readers, n.e.s. 0.257 0.217 0.312 0.202 0.467696 Cutlery 0.232 0.250 0.311 0.215 0.352851 Footwear 0.251 0.265 0.309 0.152 0.284042 Rice 0.322 0.301 0.308 0.163 0.177016 Meat, edible meat offal (salted dried); flours, meals 0.343 0.330 0.305 0.116 0.200662 Clay construction materials and refractory construction materials 0.340 0.352 0.303 0.121 0.236683 Nickel 0.280 0.280 0.302 0.147 0.189043 Barley, unmilled 0.283 0.329 0.302 0.175 0.359813 Lighting fixtures and fittings, n.e.s. 0.216 0.233 0.300 0.140 0.270687 Tin 0.269 0.303 0.299 0.256 0.362845 Articles of apparel, textile fabrics, knitted or crocheted or not, n.e.s. 0.204 0.209 0.296 0.146 0.286289 Ores and concentrates of precious metals; waste of (excluding gold) 0.325 0.332 0.295 0.391 0.327
For sources and notes, see end of table 3.3 Imports. Pour les sources et les notes, se reporter à la fin du tableau 3.3 Importations.
SITC groupRevision 3 (3-digit level)
ranked according to the concentration index in 2006
Groupes de la CTCIRévision 3 (positions à 3 chiffres)
classés d’après l’indice de concentration en 2006
Concentration index(1)
Indice de concentration (1)
Structural change index (2)
Indice de changement structurel (2)
1995=0
3.3 Concentration and structural changeindices of product marketsExports
3.3 Indices de concentration et de changement structurel des marchés de produitsExportations
183
3
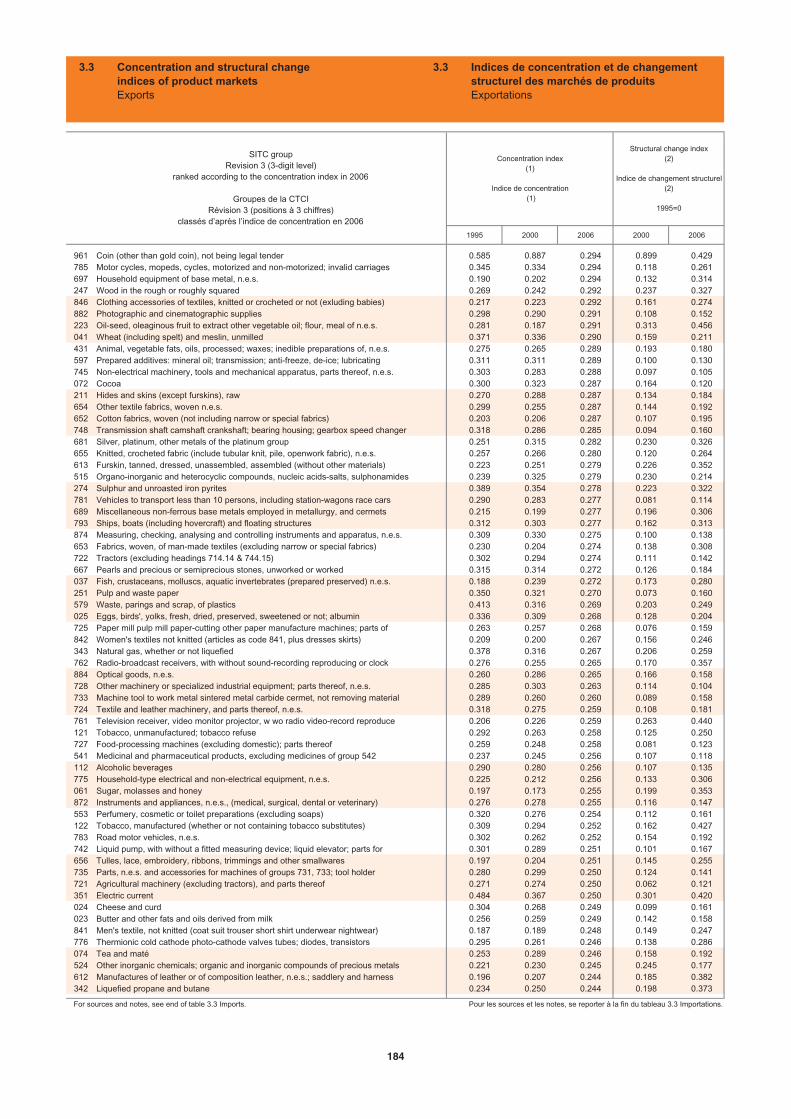
1995 2000 2006 2000 2006
961 Coin (other than gold coin), not being legal tender 0.585 0.887 0.294 0.899 0.429785 Motor cycles, mopeds, cycles, motorized and non-motorized; invalid carriages 0.345 0.334 0.294 0.118 0.261697 Household equipment of base metal, n.e.s. 0.190 0.202 0.294 0.132 0.314247 Wood in the rough or roughly squared 0.269 0.242 0.292 0.237 0.327846 Clothing accessories of textiles, knitted or crocheted or not (exluding babies) 0.217 0.223 0.292 0.161 0.274882 Photographic and cinematographic supplies 0.298 0.290 0.291 0.108 0.152223 Oil-seed, oleaginous fruit to extract other vegetable oil; flour, meal of n.e.s. 0.281 0.187 0.291 0.313 0.456041 Wheat (including spelt) and meslin, unmilled 0.371 0.336 0.290 0.159 0.211431 Animal, vegetable fats, oils, processed; waxes; inedible preparations of, n.e.s. 0.275 0.265 0.289 0.193 0.180597 Prepared additives: mineral oil; transmission; anti-freeze, de-ice; lubricating 0.311 0.311 0.289 0.100 0.130745 Non-electrical machinery, tools and mechanical apparatus, parts thereof, n.e.s. 0.303 0.283 0.288 0.097 0.105072 Cocoa 0.300 0.323 0.287 0.164 0.120211 Hides and skins (except furskins), raw 0.270 0.288 0.287 0.134 0.184654 Other textile fabrics, woven n.e.s. 0.299 0.255 0.287 0.144 0.192652 Cotton fabrics, woven (not including narrow or special fabrics) 0.203 0.206 0.287 0.107 0.195748 Transmission shaft camshaft crankshaft; bearing housing; gearbox speed changer 0.318 0.286 0.285 0.094 0.160681 Silver, platinum, other metals of the platinum group 0.251 0.315 0.282 0.230 0.326655 Knitted, crocheted fabric (include tubular knit, pile, openwork fabric), n.e.s. 0.257 0.266 0.280 0.120 0.264613 Furskin, tanned, dressed, unassembled, assembled (without other materials) 0.223 0.251 0.279 0.226 0.352515 Organo-inorganic and heterocyclic compounds, nucleic acids-salts, sulphonamides 0.239 0.325 0.279 0.230 0.214274 Sulphur and unroasted iron pyrites 0.389 0.354 0.278 0.223 0.322781 Vehicles to transport less than 10 persons, including station-wagons race cars 0.290 0.283 0.277 0.081 0.114689 Miscellaneous non-ferrous base metals employed in metallurgy, and cermets 0.215 0.199 0.277 0.196 0.306793 Ships, boats (including hovercraft) and floating structures 0.312 0.303 0.277 0.162 0.313874 Measuring, checking, analysing and controlling instruments and apparatus, n.e.s. 0.309 0.330 0.275 0.100 0.138653 Fabrics, woven, of man-made textiles (excluding narrow or special fabrics) 0.230 0.204 0.274 0.138 0.308722 Tractors (excluding headings 714.14 & 744.15) 0.302 0.294 0.274 0.111 0.142667 Pearls and precious or semiprecious stones, unworked or worked 0.315 0.314 0.272 0.126 0.184037 Fish, crustaceans, molluscs, aquatic invertebrates (prepared preserved) n.e.s. 0.188 0.239 0.272 0.173 0.280251 Pulp and waste paper 0.350 0.321 0.270 0.073 0.160579 Waste, parings and scrap, of plastics 0.413 0.316 0.269 0.203 0.249025 Eggs, birds', yolks, fresh, dried, preserved, sweetened or not; albumin 0.336 0.309 0.268 0.128 0.204725 Paper mill pulp mill paper-cutting other paper manufacture machines; parts of 0.263 0.257 0.268 0.076 0.159842 Women's textiles not knitted (articles as code 841, plus dresses skirts) 0.209 0.200 0.267 0.156 0.246343 Natural gas, whether or not liquefied 0.378 0.316 0.267 0.206 0.259762 Radio-broadcast receivers, with without sound-recording reproducing or clock 0.276 0.255 0.265 0.170 0.357884 Optical goods, n.e.s. 0.260 0.286 0.265 0.166 0.158728 Other machinery or specialized industrial equipment; parts thereof, n.e.s. 0.285 0.303 0.263 0.114 0.104733 Machine tool to work metal sintered metal carbide cermet, not removing material 0.289 0.260 0.260 0.089 0.158724 Textile and leather machinery, and parts thereof, n.e.s. 0.318 0.275 0.259 0.108 0.181761 Television receiver, video monitor projector, w wo radio video-record reproduce 0.206 0.226 0.259 0.263 0.440121 Tobacco, unmanufactured; tobacco refuse 0.292 0.263 0.258 0.125 0.250727 Food-processing machines (excluding domestic); parts thereof 0.259 0.248 0.258 0.081 0.123541 Medicinal and pharmaceutical products, excluding medicines of group 542 0.237 0.245 0.256 0.107 0.118112 Alcoholic beverages 0.290 0.280 0.256 0.107 0.135775 Household-type electrical and non-electrical equipment, n.e.s. 0.225 0.212 0.256 0.133 0.306061 Sugar, molasses and honey 0.197 0.173 0.255 0.199 0.353872 Instruments and appliances, n.e.s., (medical, surgical, dental or veterinary) 0.276 0.278 0.255 0.116 0.147553 Perfumery, cosmetic or toilet preparations (excluding soaps) 0.320 0.276 0.254 0.112 0.161122 Tobacco, manufactured (whether or not containing tobacco substitutes) 0.309 0.294 0.252 0.162 0.427783 Road motor vehicles, n.e.s. 0.302 0.262 0.252 0.154 0.192742 Liquid pump, with without a fitted measuring device; liquid elevator; parts for 0.301 0.289 0.251 0.101 0.167656 Tulles, lace, embroidery, ribbons, trimmings and other smallwares 0.197 0.204 0.251 0.145 0.255735 Parts, n.e.s. and accessories for machines of groups 731, 733; tool holder 0.280 0.299 0.250 0.124 0.141721 Agricultural machinery (excluding tractors), and parts thereof 0.271 0.274 0.250 0.062 0.121351 Electric current 0.484 0.367 0.250 0.301 0.420024 Cheese and curd 0.304 0.268 0.249 0.099 0.161023 Butter and other fats and oils derived from milk 0.256 0.259 0.249 0.142 0.158841 Men's textile, not knitted (coat suit trouser short shirt underwear nightwear) 0.187 0.189 0.248 0.149 0.247776 Thermionic cold cathode photo-cathode valves tubes; diodes, transistors 0.295 0.261 0.246 0.138 0.286074 Tea and maté 0.253 0.289 0.246 0.158 0.192524 Other inorganic chemicals; organic and inorganic compounds of precious metals 0.221 0.230 0.245 0.245 0.177612 Manufactures of leather or of composition leather, n.e.s.; saddlery and harness 0.196 0.207 0.244 0.185 0.382342 Liquefied propane and butane 0.234 0.250 0.244 0.198 0.373
For sources and notes, see end of table 3.3 Imports. Pour les sources et les notes, se reporter à la fin du tableau 3.3 Importations.
SITC groupRevision 3 (3-digit level)
ranked according to the concentration index in 2006
Groupes de la CTCIRévision 3 (positions à 3 chiffres)
classés d’après l’indice de concentration en 2006
Concentration index(1)
Indice de concentration (1)
Structural change index (2)
Indice de changement structurel (2)
1995=0
3.3 Concentration and structural changeindices of product marketsExports
3.3 Indices de concentration et de changement structurel des marchés de produitsExportations
184

1995 2000 2006 2000 2006
791 Railway vehicles (including hovertrains) and associated equipment 0.246 0.234 0.244 0.183 0.213672 Ingots, other primary forms of iron or steel; semi-finished products of 0.210 0.232 0.243 0.162 0.223659 Floor coverings, etc. 0.287 0.250 0.241 0.095 0.129764 Telecommunications equipment and parts, n.e.s.; accessories within division 76 0.218 0.185 0.240 0.177 0.326723 Civil engineering and contractors' plant and equipment; parts thereof 0.294 0.288 0.239 0.076 0.135266 Synthetic fibres suitable for spinning 0.246 0.267 0.238 0.130 0.231718 Power-generating machinery, and parts thereof, n.e.s. 0.280 0.219 0.238 0.224 0.166737 Metalworking machinery (other than machine tools), and parts thereof, n.e.s. 0.263 0.250 0.236 0.130 0.168232 Synthetic rubber; reclaimed rubber; waste, parings, scrap of unhardened rubber 0.259 0.266 0.236 0.141 0.180531 Synthetic organic colouring matter and colour lakes, preparations based thereon 0.298 0.247 0.236 0.148 0.232713 Internal combustion piston engines, and parts thereof, n.e.s. 0.294 0.272 0.235 0.138 0.217759 Parts, accessories for machines of groups 751, 752 0.254 0.213 0.235 0.190 0.330873 Meters and counters, n.e.s. 0.260 0.260 0.234 0.186 0.268598 Miscellaneous chemical products, n.e.s. 0.265 0.259 0.234 0.109 0.126771 Electric power machinery parts (excluding rotating electric plant, group 716) 0.192 0.201 0.234 0.146 0.237575 Other plastics, in primary forms 0.277 0.266 0.233 0.097 0.145694 Nails, screws, nuts, bolts, rivets, of iron, steel, copper or aluminium 0.231 0.237 0.233 0.085 0.151611 Leather 0.216 0.236 0.232 0.101 0.211047 Other cereal meals and flours 0.240 0.284 0.232 0.204 0.203572 Polymers of styrene, in primary forms 0.237 0.235 0.231 0.129 0.172248 Wood, simply worked, and railway sleepers of wood 0.318 0.316 0.231 0.111 0.233542 Medicines (including veterinary medicines) 0.228 0.221 0.230 0.109 0.143516 Other organic chemicals 0.227 0.217 0.229 0.110 0.180747 Appliances for pipes boiler shells tanks vats; pressure and temperature valves 0.259 0.239 0.229 0.139 0.187291 Crude animal materials, nes 0.220 0.239 0.227 0.105 0.168287 Ores and concentrates of base metals, n.e.s. 0.226 0.231 0.227 0.154 0.191246 Wood in chips or particles and wood waste 0.333 0.314 0.227 0.150 0.355899 Miscellaneous manufactured articles, n.e.s. 0.227 0.222 0.227 0.125 0.238421 Fixed vegetable fats and oils, "soft", crude, refined or fractionated 0.225 0.238 0.226 0.176 0.228746 Ball or roller bearings 0.270 0.248 0.226 0.103 0.147591 Insecticide, rodenticide, fungicide, herbicide, plant-growth reg, disinfectant 0.256 0.245 0.223 0.123 0.168685 Lead 0.219 0.221 0.223 0.206 0.233035 Fish (dried, salted, in brine, smoked); flours, meals, pellets for human consump 0.274 0.233 0.223 0.172 0.263411 Animals oils and fats 0.357 0.270 0.222 0.155 0.237743 Pump (non liquid), air gas compressor, fan ventilation filter; centrifuge; parts 0.244 0.241 0.221 0.105 0.174011 Meat of bovine animals (fresh chilled frozen) 0.241 0.267 0.220 0.195 0.275782 Motor vehicles for the transport of goods and special-purpose motor vehicles 0.276 0.250 0.219 0.148 0.206523 Metallic salts and peroxysalts, of inorganic acids 0.233 0.244 0.219 0.115 0.221821 Furniture and parts; bedding, mattresses, mattress supports, cushions 0.204 0.186 0.218 0.152 0.264621 Materials of rubber (e.g., pastes, plates, sheets, rods, thread, tubes, of rubber) 0.243 0.232 0.217 0.118 0.154812 Sanitary, plumbing and heating fixtures and fittings, n.e.s. 0.253 0.231 0.217 0.153 0.207695 Tools for use in the hand or in machine 0.224 0.202 0.217 0.112 0.146269 Worn clothing and other worn textile articles; rags 0.259 0.227 0.216 0.139 0.262744 Mechanical handling equipment, and parts thereof, n.e.s. 0.239 0.229 0.216 0.119 0.149784 Parts and accessories of the motor vehicles of groups 722, 781, 782 and 783 0.283 0.268 0.215 0.088 0.231511 Hydrocarbons, n.e.s., halogenated, sulphonated, nitrated, nitrosated derivatives 0.247 0.230 0.215 0.119 0.171081 Feeding stuff for animals (excluding unmilled cereals) 0.232 0.240 0.214 0.134 0.156897 Jewellery, articles of goldsmiths' silversmiths' B2 semiprecious, n.e.s. 0.256 0.258 0.214 0.163 0.246749 Non-electric parts and accessories of machinery, n.e.s. 0.253 0.236 0.213 0.093 0.143898 Musical instrument, parts accessory; tape, sound recording (excluding 763 & 883) 0.258 0.229 0.212 0.138 0.267111 Non-alcoholic beverages, n.e.s. 0.213 0.206 0.212 0.161 0.268895 Office and stationery supplies, n.e.s. 0.236 0.224 0.212 0.122 0.242073 Chocolate and other food preparations containing cocoa, n.e.s. 0.241 0.216 0.211 0.140 0.174892 Printed matter 0.238 0.229 0.210 0.104 0.134533 Pigments, paints, varnishes and related materials 0.223 0.218 0.210 0.106 0.103581 Tubes, pipes and hoses, and fittings therefor, of plastics 0.225 0.228 0.209 0.164 0.202056 Vegetables, roots and tubers (prepared preserved) n.e.s. 0.221 0.209 0.209 0.123 0.169582 Plates, sheets, film, foil and strip, of plastics 0.224 0.220 0.209 0.093 0.121012 Other meat and edible meat offal (fresh chilled frozen) 0.224 0.222 0.209 0.149 0.270333 Petroleum oils and oils obtained from bituminous minerals, crude 0.212 0.200 0.208 0.128 0.181971 Gold, non-monetary (excluding gold ores and concentrates) 0.293 0.293 0.208 0.220 0.384001 Live animals other than animals of division 03 0.223 0.220 0.208 0.154 0.147772 Electrical apparatus to switch protect circuits or make circuit connections 0.246 0.222 0.207 0.144 0.195071 Coffee and coffee substitutes 0.190 0.186 0.207 0.139 0.243
For sources and notes, see end of table 3.3 Imports. Pour les sources et les notes, se reporter à la fin du tableau 3.3 Importations.
SITC groupRevision 3 (3-digit level)
ranked according to the concentration index in 2006
Groupes de la CTCIRévision 3 (positions à 3 chiffres)
classés d’après l’indice de concentration en 2006
Concentration index(1)
Indice de concentration (1)
Structural change index (2)
Indice de changement structurel (2)
1995=0
3.3 Concentration and structural changeindices of product marketsExports
3.3 Indices de concentration et de changement structurel des marchés de produitsExportations
185
3
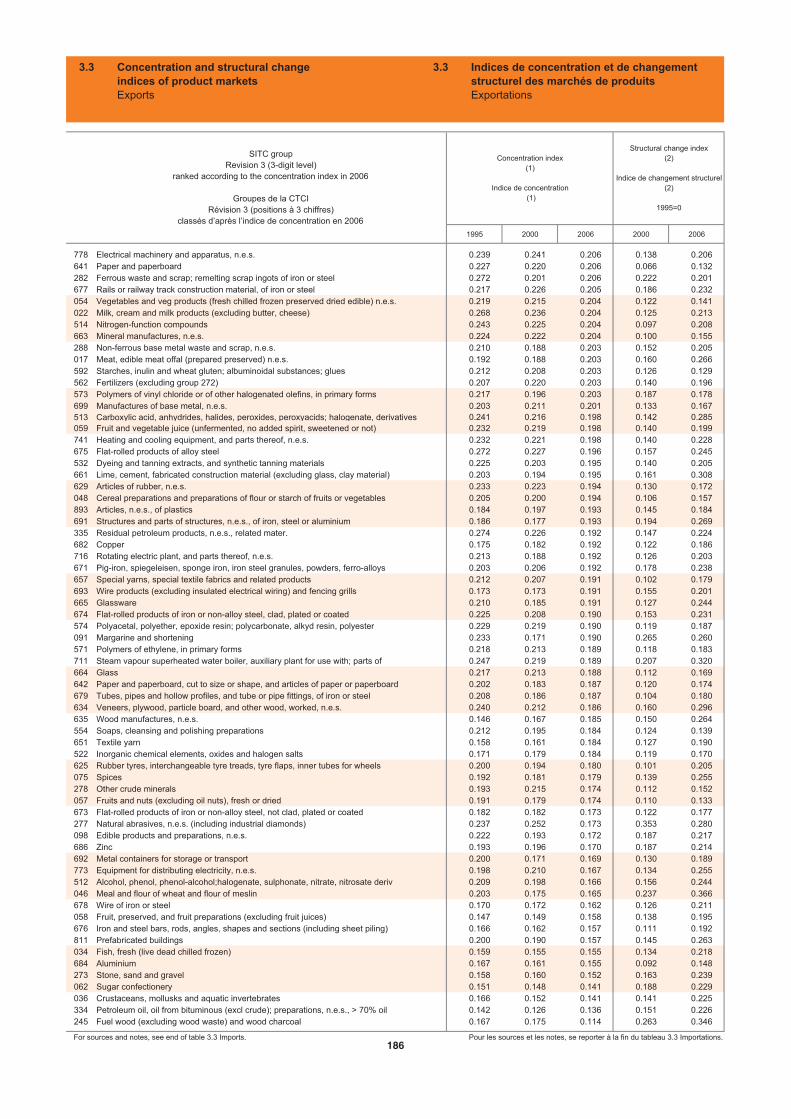
1995 2000 2006 2000 2006
778 Electrical machinery and apparatus, n.e.s. 0.239 0.241 0.206 0.138 0.206641 Paper and paperboard 0.227 0.220 0.206 0.066 0.132282 Ferrous waste and scrap; remelting scrap ingots of iron or steel 0.272 0.201 0.206 0.222 0.201677 Rails or railway track construction material, of iron or steel 0.217 0.226 0.205 0.186 0.232054 Vegetables and veg products (fresh chilled frozen preserved dried edible) n.e.s. 0.219 0.215 0.204 0.122 0.141022 Milk, cream and milk products (excluding butter, cheese) 0.268 0.236 0.204 0.125 0.213514 Nitrogen-function compounds 0.243 0.225 0.204 0.097 0.208663 Mineral manufactures, n.e.s. 0.224 0.222 0.204 0.100 0.155288 Non-ferrous base metal waste and scrap, n.e.s. 0.210 0.188 0.203 0.152 0.205017 Meat, edible meat offal (prepared preserved) n.e.s. 0.192 0.188 0.203 0.160 0.266592 Starches, inulin and wheat gluten; albuminoidal substances; glues 0.212 0.208 0.203 0.126 0.129562 Fertilizers (excluding group 272) 0.207 0.220 0.203 0.140 0.196573 Polymers of vinyl chloride or of other halogenated olefins, in primary forms 0.217 0.196 0.203 0.187 0.178699 Manufactures of base metal, n.e.s. 0.203 0.211 0.201 0.133 0.167513 Carboxylic acid, anhydrides, halides, peroxides, peroxyacids; halogenate, derivatives 0.241 0.216 0.198 0.142 0.285059 Fruit and vegetable juice (unfermented, no added spirit, sweetened or not) 0.232 0.219 0.198 0.140 0.199741 Heating and cooling equipment, and parts thereof, n.e.s. 0.232 0.221 0.198 0.140 0.228675 Flat-rolled products of alloy steel 0.272 0.227 0.196 0.157 0.245532 Dyeing and tanning extracts, and synthetic tanning materials 0.225 0.203 0.195 0.140 0.205661 Lime, cement, fabricated construction material (excluding glass, clay material) 0.203 0.194 0.195 0.161 0.308629 Articles of rubber, n.e.s. 0.233 0.223 0.194 0.130 0.172048 Cereal preparations and preparations of flour or starch of fruits or vegetables 0.205 0.200 0.194 0.106 0.157893 Articles, n.e.s., of plastics 0.184 0.197 0.193 0.145 0.184691 Structures and parts of structures, n.e.s., of iron, steel or aluminium 0.186 0.177 0.193 0.194 0.269335 Residual petroleum products, n.e.s., related mater. 0.274 0.226 0.192 0.147 0.224682 Copper 0.175 0.182 0.192 0.122 0.186716 Rotating electric plant, and parts thereof, n.e.s. 0.213 0.188 0.192 0.126 0.203671 Pig-iron, spiegeleisen, sponge iron, iron steel granules, powders, ferro-alloys 0.203 0.206 0.192 0.178 0.238657 Special yarns, special textile fabrics and related products 0.212 0.207 0.191 0.102 0.179693 Wire products (excluding insulated electrical wiring) and fencing grills 0.173 0.173 0.191 0.155 0.201665 Glassware 0.210 0.185 0.191 0.127 0.244674 Flat-rolled products of iron or non-alloy steel, clad, plated or coated 0.225 0.208 0.190 0.153 0.231574 Polyacetal, polyether, epoxide resin; polycarbonate, alkyd resin, polyester 0.229 0.219 0.190 0.119 0.187091 Margarine and shortening 0.233 0.171 0.190 0.265 0.260571 Polymers of ethylene, in primary forms 0.218 0.213 0.189 0.118 0.183711 Steam vapour superheated water boiler, auxiliary plant for use with; parts of 0.247 0.219 0.189 0.207 0.320664 Glass 0.217 0.213 0.188 0.112 0.169642 Paper and paperboard, cut to size or shape, and articles of paper or paperboard 0.202 0.183 0.187 0.120 0.174679 Tubes, pipes and hollow profiles, and tube or pipe fittings, of iron or steel 0.208 0.186 0.187 0.104 0.180634 Veneers, plywood, particle board, and other wood, worked, n.e.s. 0.240 0.212 0.186 0.160 0.296635 Wood manufactures, n.e.s. 0.146 0.167 0.185 0.150 0.264554 Soaps, cleansing and polishing preparations 0.212 0.195 0.184 0.124 0.139651 Textile yarn 0.158 0.161 0.184 0.127 0.190522 Inorganic chemical elements, oxides and halogen salts 0.171 0.179 0.184 0.119 0.170625 Rubber tyres, interchangeable tyre treads, tyre flaps, inner tubes for wheels 0.200 0.194 0.180 0.101 0.205075 Spices 0.192 0.181 0.179 0.139 0.255278 Other crude minerals 0.193 0.215 0.174 0.112 0.152057 Fruits and nuts (excluding oil nuts), fresh or dried 0.191 0.179 0.174 0.110 0.133673 Flat-rolled products of iron or non-alloy steel, not clad, plated or coated 0.182 0.182 0.173 0.122 0.177277 Natural abrasives, n.e.s. (including industrial diamonds) 0.237 0.252 0.173 0.353 0.280098 Edible products and preparations, n.e.s. 0.222 0.193 0.172 0.187 0.217686 Zinc 0.193 0.196 0.170 0.187 0.214692 Metal containers for storage or transport 0.200 0.171 0.169 0.130 0.189773 Equipment for distributing electricity, n.e.s. 0.198 0.210 0.167 0.134 0.255512 Alcohol, phenol, phenol-alcohol;halogenate, sulphonate, nitrate, nitrosate deriv 0.209 0.198 0.166 0.156 0.244046 Meal and flour of wheat and flour of meslin 0.203 0.175 0.165 0.237 0.366678 Wire of iron or steel 0.170 0.172 0.162 0.126 0.211058 Fruit, preserved, and fruit preparations (excluding fruit juices) 0.147 0.149 0.158 0.138 0.195676 Iron and steel bars, rods, angles, shapes and sections (including sheet piling) 0.166 0.162 0.157 0.111 0.192811 Prefabricated buildings 0.200 0.190 0.157 0.145 0.263034 Fish, fresh (live dead chilled frozen) 0.159 0.155 0.155 0.134 0.218684 Aluminium 0.167 0.161 0.155 0.092 0.148273 Stone, sand and gravel 0.158 0.160 0.152 0.163 0.239062 Sugar confectionery 0.151 0.148 0.141 0.188 0.229036 Crustaceans, mollusks and aquatic invertebrates 0.166 0.152 0.141 0.141 0.225334 Petroleum oil, oil from bituminous (excl crude); preparations, n.e.s., > 70% oil 0.142 0.126 0.136 0.151 0.226245 Fuel wood (excluding wood waste) and wood charcoal 0.167 0.175 0.114 0.263 0.346
For sources and notes, see end of table 3.3 Imports. Pour les sources et les notes, se reporter à la fin du tableau 3.3 Importations.
SITC groupRevision 3 (3-digit level)
ranked according to the concentration index in 2006
Groupes de la CTCIRévision 3 (positions à 3 chiffres)
classés d’après l’indice de concentration en 2006
Concentration index(1)
Indice de concentration (1)
Structural change index (2)
Indice de changement structurel (2)
1995=0
3.3 Concentration and structural changeindices of product marketsExports
3.3 Indices de concentration et de changement structurel des marchés de produitsExportations
186

1995 2000 2006 2000 2006
286 Uranium or thorium ores and concentrates 0.551 0.733 0.914 0.304 0.294871 Optical instruments and apparatus, n.e.s. 0.243 0.270 0.558 0.289 0.658883 Cinematographic film, exposed developed, whether or not incorporating soundtrack 0.317 0.367 0.511 0.213 0.370579 Waste, parings and scrap, of plastics 0.473 0.425 0.500 0.256 0.362244 Cork, natural, raw and waste (including natural cork in blocks or sheets) 0.359 0.464 0.499 0.238 0.291246 Wood in chips or particles and wood waste 0.735 0.723 0.491 0.055 0.274896 Works of art, collectors' pieces and antiques 0.441 0.533 0.473 0.145 0.114281 Iron ore and concentrates 0.275 0.276 0.442 0.116 0.351289 Ores and concentrates of precious metals; waste of (excluding gold) 0.390 0.402 0.410 0.138 0.223345 Coal gas, water gas, producer gas, similar gas (exclude other gas hydrocarbons) 0.722 0.251 0.399 0.764 0.515265 Vegetable textile fibre (exclu cotton, jute), raw, processed, not spun; waste of 0.211 0.242 0.392 0.224 0.422263 Cotton 0.167 0.154 0.391 0.245 0.430212 Furskins, raw, other than hides and skins of group 211 0.292 0.358 0.386 0.190 0.257264 Jute, other textile bast fibres n.e.s., raw, processed, not spun; waste of 0.253 0.324 0.380 0.282 0.349613 Furskin, tanned, dressed, unassembled, assembled (without other materials) 0.297 0.308 0.376 0.311 0.380016 Meat, edible meat offal (salted dried); flours, meals 0.519 0.408 0.367 0.167 0.206261 Silk 0.308 0.324 0.364 0.198 0.313274 Sulphur and unroasted iron pyrites 0.209 0.205 0.357 0.229 0.414283 Copper ores and concentrates; copper mattes; cement copper 0.451 0.391 0.347 0.191 0.375761 Television receiver, video monitor projector, w wo radio video-record reproduce 0.226 0.275 0.343 0.244 0.320843 Men's textile, knitted (coat suit trouser short shirt underwear nightwear) 0.301 0.346 0.332 0.143 0.170284 Nickel ores, concentrates; mattes, oxide sinters, intermediate product of 0.376 0.387 0.328 0.179 0.275525 Radio-actives and associated materials 0.343 0.362 0.327 0.223 0.220268 Wool and other animal hair (including wool tops) 0.236 0.295 0.313 0.178 0.272043 Barley, unmilled 0.199 0.232 0.313 0.257 0.239894 Baby carriages, toys, games and sporting goods 0.317 0.361 0.312 0.091 0.093222 Oil-seed, oleaginous fruit for soft fixed vegetable oils (exclude flours, meals) 0.217 0.231 0.311 0.259 0.386658 Made-up articles, wholly or chiefly of textile materials, n.e.s. 0.228 0.285 0.306 0.143 0.198821 Furniture and parts; bedding, mattresses, mattress supports, cushions 0.252 0.319 0.301 0.168 0.210891 Arms and ammunition 0.200 0.248 0.301 0.269 0.328667 Pearls and precious or semiprecious stones, unworked or worked 0.315 0.326 0.299 0.136 0.161036 Crustaceans, mollusks and aquatic invertebrates 0.423 0.371 0.294 0.127 0.242211 Hides and skins (except furskins), raw 0.268 0.273 0.293 0.140 0.312844 Women's textiles, knitted (articles as code 841, plus dresses skirts) 0.294 0.312 0.291 0.148 0.154247 Wood in the rough or roughly squared 0.357 0.256 0.287 0.257 0.409848 Apparel articles accessories other than textile fabrics; headgear (all material) 0.294 0.358 0.286 0.139 0.137681 Silver, platinum, other metals of the platinum group 0.301 0.345 0.282 0.200 0.215897 Jewellery, articles of goldsmiths' silversmiths' B2 semiprecious, n.e.s. 0.292 0.330 0.279 0.144 0.160762 Radio-broadcast receivers, with without sound-recording reproducing or clock 0.290 0.334 0.277 0.147 0.166842 Women's textiles not knitted (articles as code 841, plus dresses skirts) 0.299 0.342 0.275 0.126 0.168776 Thermionic cold cathode photo-cathode valves tubes; diodes, transistors 0.246 0.207 0.274 0.128 0.325697 Household equipment of base metal, n.e.s. 0.214 0.278 0.274 0.141 0.173813 Lighting fixtures and fittings, n.e.s. 0.222 0.308 0.274 0.158 0.196841 Men's textile, not knitted (coat suit trouser short shirt underwear nightwear) 0.285 0.336 0.274 0.119 0.134515 Organo-inorganic and heterocyclic compounds, nucleic acids-salts, sulphonamides 0.194 0.315 0.272 0.198 0.189845 Articles of apparel, textile fabrics, knitted or crocheted or not, n.e.s. 0.280 0.319 0.271 0.126 0.160971 Gold, non-monetary (excluding gold ores and concentrates) 0.220 0.246 0.268 0.327 0.552342 Liquefied propane and butane 0.355 0.308 0.265 0.135 0.237831 Cases bags(storage hand executive equipment instrument gun travel shopping back) 0.317 0.313 0.264 0.090 0.177045 Cereals, unmilled (excluding wheat, rice, barley, maize) 0.271 0.339 0.263 0.277 0.242763 Sound or television image recorder reproducer; prepared unrecorded media 0.307 0.390 0.263 0.140 0.128635 Wood manufactures, n.e.s. 0.259 0.295 0.262 0.182 0.217112 Alcoholic beverages 0.216 0.276 0.262 0.142 0.166689 Miscellaneous non-ferrous base metals employed in metallurgy, and cermets 0.281 0.269 0.261 0.094 0.139248 Wood, simply worked, and railway sleepers of wood 0.264 0.289 0.261 0.156 0.200781 Vehicles to transport less than 10 persons, including station-wagons race cars 0.288 0.348 0.257 0.141 0.164666 Pottery 0.299 0.318 0.256 0.090 0.161851 Footwear 0.291 0.309 0.256 0.104 0.150231 Natural rubber, balata, gutta-percha, guayule, chicle, natural gums 0.247 0.241 0.256 0.147 0.216633 Cork manufactures 0.260 0.260 0.255 0.125 0.184572 Polymers of styrene, in primary forms 0.229 0.266 0.251 0.151 0.211285 Aluminium ores and concentrates (including alumina) 0.241 0.225 0.251 0.131 0.277343 Natural gas, whether or not liquefied 0.296 0.294 0.250 0.194 0.264037 Fish, crustaceans, molluscs, aquatic invertebrates (prepared preserved) n.e.s. 0.275 0.296 0.249 0.109 0.188
For sources and notes, see end of table. Pour les sources et les notes, se reporter à la fin du tableau.
SITC groupRevision 3 (3-digit level)
ranked according to the concentration index in 2006
Groupes de la CTCIRévision 3 (positions à 3 chiffres)
classés d’après l’indice de concentration en 2006
Concentration index(1)
Indice de concentration (1)
Structural change index (2)
Indice de changement structurel (2)
1995=0
3.3 Concentration and structural changeindices of product marketsImports
3.3 Indices de concentration et de changement structurel des marchés de produitsImportations
187
3
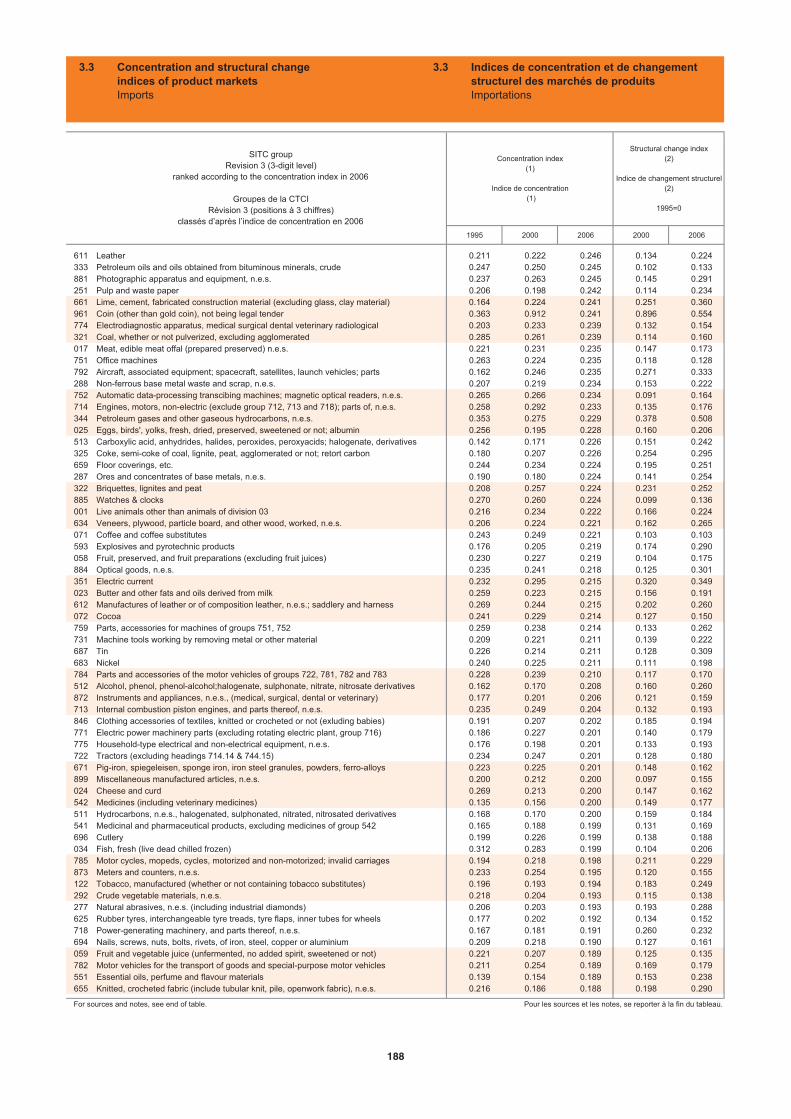
1995 2000 2006 2000 2006
611 Leather 0.211 0.222 0.246 0.134 0.224333 Petroleum oils and oils obtained from bituminous minerals, crude 0.247 0.250 0.245 0.102 0.133881 Photographic apparatus and equipment, n.e.s. 0.237 0.263 0.245 0.145 0.291251 Pulp and waste paper 0.206 0.198 0.242 0.114 0.234661 Lime, cement, fabricated construction material (excluding glass, clay material) 0.164 0.224 0.241 0.251 0.360961 Coin (other than gold coin), not being legal tender 0.363 0.912 0.241 0.896 0.554774 Electrodiagnostic apparatus, medical surgical dental veterinary radiological 0.203 0.233 0.239 0.132 0.154321 Coal, whether or not pulverized, excluding agglomerated 0.285 0.261 0.239 0.114 0.160017 Meat, edible meat offal (prepared preserved) n.e.s. 0.221 0.231 0.235 0.147 0.173751 Office machines 0.263 0.224 0.235 0.118 0.128792 Aircraft, associated equipment; spacecraft, satellites, launch vehicles; parts 0.162 0.246 0.235 0.271 0.333288 Non-ferrous base metal waste and scrap, n.e.s. 0.207 0.219 0.234 0.153 0.222752 Automatic data-processing transcibing machines; magnetic optical readers, n.e.s. 0.265 0.266 0.234 0.091 0.164714 Engines, motors, non-electric (exclude group 712, 713 and 718); parts of, n.e.s. 0.258 0.292 0.233 0.135 0.176344 Petroleum gases and other gaseous hydrocarbons, n.e.s. 0.353 0.275 0.229 0.378 0.508025 Eggs, birds', yolks, fresh, dried, preserved, sweetened or not; albumin 0.256 0.195 0.228 0.160 0.206513 Carboxylic acid, anhydrides, halides, peroxides, peroxyacids; halogenate, derivatives 0.142 0.171 0.226 0.151 0.242325 Coke, semi-coke of coal, lignite, peat, agglomerated or not; retort carbon 0.180 0.207 0.226 0.254 0.295659 Floor coverings, etc. 0.244 0.234 0.224 0.195 0.251287 Ores and concentrates of base metals, n.e.s. 0.190 0.180 0.224 0.141 0.254322 Briquettes, lignites and peat 0.208 0.257 0.224 0.231 0.252885 Watches & clocks 0.270 0.260 0.224 0.099 0.136001 Live animals other than animals of division 03 0.216 0.234 0.222 0.166 0.224634 Veneers, plywood, particle board, and other wood, worked, n.e.s. 0.206 0.224 0.221 0.162 0.265071 Coffee and coffee substitutes 0.243 0.249 0.221 0.103 0.103593 Explosives and pyrotechnic products 0.176 0.205 0.219 0.174 0.290058 Fruit, preserved, and fruit preparations (excluding fruit juices) 0.230 0.227 0.219 0.104 0.175884 Optical goods, n.e.s. 0.235 0.241 0.218 0.125 0.301351 Electric current 0.232 0.295 0.215 0.320 0.349023 Butter and other fats and oils derived from milk 0.259 0.223 0.215 0.156 0.191612 Manufactures of leather or of composition leather, n.e.s.; saddlery and harness 0.269 0.244 0.215 0.202 0.260072 Cocoa 0.241 0.229 0.214 0.127 0.150759 Parts, accessories for machines of groups 751, 752 0.259 0.238 0.214 0.133 0.262731 Machine tools working by removing metal or other material 0.209 0.221 0.211 0.139 0.222687 Tin 0.226 0.214 0.211 0.128 0.309683 Nickel 0.240 0.225 0.211 0.111 0.198784 Parts and accessories of the motor vehicles of groups 722, 781, 782 and 783 0.228 0.239 0.210 0.117 0.170512 Alcohol, phenol, phenol-alcohol;halogenate, sulphonate, nitrate, nitrosate derivatives 0.162 0.170 0.208 0.160 0.260872 Instruments and appliances, n.e.s., (medical, surgical, dental or veterinary) 0.177 0.201 0.206 0.121 0.159713 Internal combustion piston engines, and parts thereof, n.e.s. 0.235 0.249 0.204 0.132 0.193846 Clothing accessories of textiles, knitted or crocheted or not (exluding babies) 0.191 0.207 0.202 0.185 0.194771 Electric power machinery parts (excluding rotating electric plant, group 716) 0.186 0.227 0.201 0.140 0.179775 Household-type electrical and non-electrical equipment, n.e.s. 0.176 0.198 0.201 0.133 0.193722 Tractors (excluding headings 714.14 & 744.15) 0.234 0.247 0.201 0.128 0.180671 Pig-iron, spiegeleisen, sponge iron, iron steel granules, powders, ferro-alloys 0.223 0.225 0.201 0.148 0.162899 Miscellaneous manufactured articles, n.e.s. 0.200 0.212 0.200 0.097 0.155024 Cheese and curd 0.269 0.213 0.200 0.147 0.162542 Medicines (including veterinary medicines) 0.135 0.156 0.200 0.149 0.177511 Hydrocarbons, n.e.s., halogenated, sulphonated, nitrated, nitrosated derivatives 0.168 0.170 0.200 0.159 0.184541 Medicinal and pharmaceutical products, excluding medicines of group 542 0.165 0.188 0.199 0.131 0.169696 Cutlery 0.199 0.226 0.199 0.138 0.188034 Fish, fresh (live dead chilled frozen) 0.312 0.283 0.199 0.104 0.206785 Motor cycles, mopeds, cycles, motorized and non-motorized; invalid carriages 0.194 0.218 0.198 0.211 0.229873 Meters and counters, n.e.s. 0.233 0.254 0.195 0.120 0.155122 Tobacco, manufactured (whether or not containing tobacco substitutes) 0.196 0.193 0.194 0.183 0.249292 Crude vegetable materials, n.e.s. 0.218 0.204 0.193 0.115 0.138277 Natural abrasives, n.e.s. (including industrial diamonds) 0.206 0.203 0.193 0.193 0.288625 Rubber tyres, interchangeable tyre treads, tyre flaps, inner tubes for wheels 0.177 0.202 0.192 0.134 0.152718 Power-generating machinery, and parts thereof, n.e.s. 0.167 0.181 0.191 0.260 0.232694 Nails, screws, nuts, bolts, rivets, of iron, steel, copper or aluminium 0.209 0.218 0.190 0.127 0.161059 Fruit and vegetable juice (unfermented, no added spirit, sweetened or not) 0.221 0.207 0.189 0.125 0.135782 Motor vehicles for the transport of goods and special-purpose motor vehicles 0.211 0.254 0.189 0.169 0.179551 Essential oils, perfume and flavour materials 0.139 0.154 0.189 0.153 0.238655 Knitted, crocheted fabric (include tubular knit, pile, openwork fabric), n.e.s. 0.216 0.186 0.188 0.198 0.290
For sources and notes, see end of table. Pour les sources et les notes, se reporter à la fin du tableau.
SITC groupRevision 3 (3-digit level)
ranked according to the concentration index in 2006
Groupes de la CTCIRévision 3 (positions à 3 chiffres)
classés d’après l’indice de concentration en 2006
Concentration index(1)
Indice de concentration (1)
Structural change index (2)
Indice de changement structurel (2)
1995=0
3.3 Concentration and structural changeindices of product marketsImports
3.3 Indices de concentration et de changement structurel des marchés de produitsImportations
188
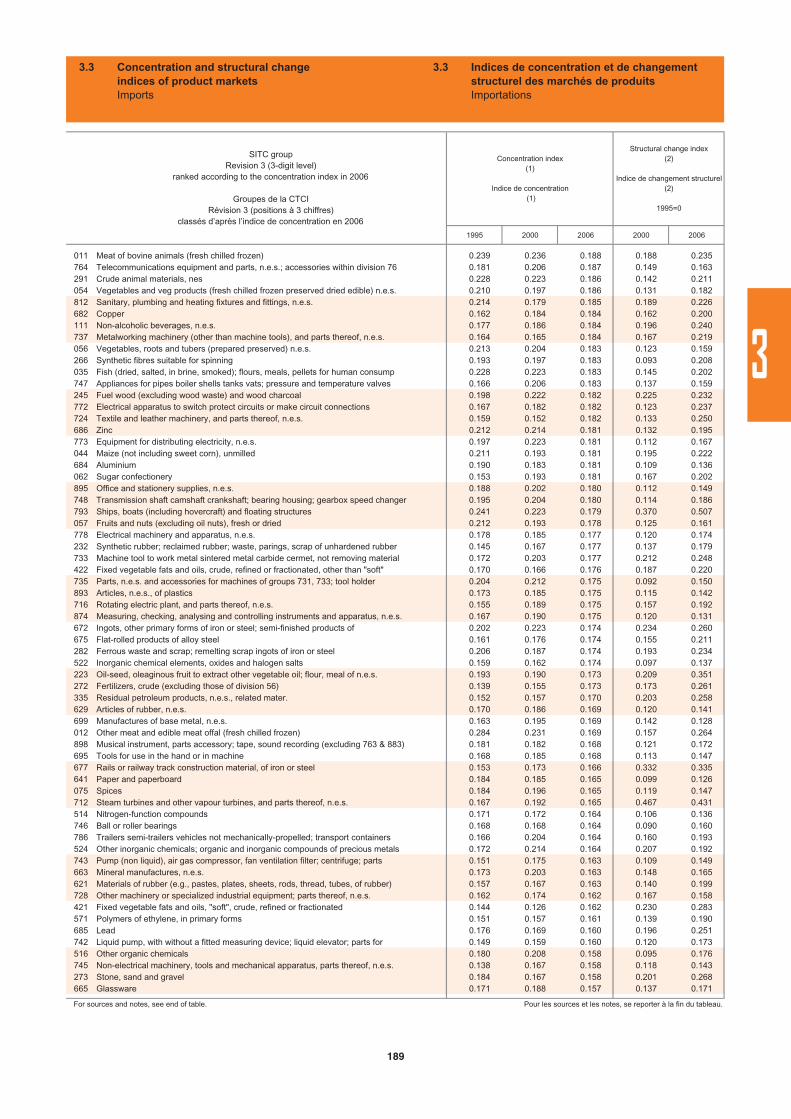
1995 2000 2006 2000 2006
011 Meat of bovine animals (fresh chilled frozen) 0.239 0.236 0.188 0.188 0.235764 Telecommunications equipment and parts, n.e.s.; accessories within division 76 0.181 0.206 0.187 0.149 0.163291 Crude animal materials, nes 0.228 0.223 0.186 0.142 0.211054 Vegetables and veg products (fresh chilled frozen preserved dried edible) n.e.s. 0.210 0.197 0.186 0.131 0.182812 Sanitary, plumbing and heating fixtures and fittings, n.e.s. 0.214 0.179 0.185 0.189 0.226682 Copper 0.162 0.184 0.184 0.162 0.200111 Non-alcoholic beverages, n.e.s. 0.177 0.186 0.184 0.196 0.240737 Metalworking machinery (other than machine tools), and parts thereof, n.e.s. 0.164 0.165 0.184 0.167 0.219056 Vegetables, roots and tubers (prepared preserved) n.e.s. 0.213 0.204 0.183 0.123 0.159266 Synthetic fibres suitable for spinning 0.193 0.197 0.183 0.093 0.208035 Fish (dried, salted, in brine, smoked); flours, meals, pellets for human consump 0.228 0.223 0.183 0.145 0.202747 Appliances for pipes boiler shells tanks vats; pressure and temperature valves 0.166 0.206 0.183 0.137 0.159245 Fuel wood (excluding wood waste) and wood charcoal 0.198 0.222 0.182 0.225 0.232772 Electrical apparatus to switch protect circuits or make circuit connections 0.167 0.182 0.182 0.123 0.237724 Textile and leather machinery, and parts thereof, n.e.s. 0.159 0.152 0.182 0.133 0.250686 Zinc 0.212 0.214 0.181 0.132 0.195773 Equipment for distributing electricity, n.e.s. 0.197 0.223 0.181 0.112 0.167044 Maize (not including sweet corn), unmilled 0.211 0.193 0.181 0.195 0.222684 Aluminium 0.190 0.183 0.181 0.109 0.136062 Sugar confectionery 0.153 0.193 0.181 0.167 0.202895 Office and stationery supplies, n.e.s. 0.188 0.202 0.180 0.112 0.149748 Transmission shaft camshaft crankshaft; bearing housing; gearbox speed changer 0.195 0.204 0.180 0.114 0.186793 Ships, boats (including hovercraft) and floating structures 0.241 0.223 0.179 0.370 0.507057 Fruits and nuts (excluding oil nuts), fresh or dried 0.212 0.193 0.178 0.125 0.161778 Electrical machinery and apparatus, n.e.s. 0.178 0.185 0.177 0.120 0.174232 Synthetic rubber; reclaimed rubber; waste, parings, scrap of unhardened rubber 0.145 0.167 0.177 0.137 0.179733 Machine tool to work metal sintered metal carbide cermet, not removing material 0.172 0.203 0.177 0.212 0.248422 Fixed vegetable fats and oils, crude, refined or fractionated, other than "soft" 0.170 0.166 0.176 0.187 0.220735 Parts, n.e.s. and accessories for machines of groups 731, 733; tool holder 0.204 0.212 0.175 0.092 0.150893 Articles, n.e.s., of plastics 0.173 0.185 0.175 0.115 0.142716 Rotating electric plant, and parts thereof, n.e.s. 0.155 0.189 0.175 0.157 0.192874 Measuring, checking, analysing and controlling instruments and apparatus, n.e.s. 0.167 0.190 0.175 0.120 0.131672 Ingots, other primary forms of iron or steel; semi-finished products of 0.202 0.223 0.174 0.234 0.260675 Flat-rolled products of alloy steel 0.161 0.176 0.174 0.155 0.211282 Ferrous waste and scrap; remelting scrap ingots of iron or steel 0.206 0.187 0.174 0.193 0.234522 Inorganic chemical elements, oxides and halogen salts 0.159 0.162 0.174 0.097 0.137223 Oil-seed, oleaginous fruit to extract other vegetable oil; flour, meal of n.e.s. 0.193 0.190 0.173 0.209 0.351272 Fertilizers, crude (excluding those of division 56) 0.139 0.155 0.173 0.173 0.261335 Residual petroleum products, n.e.s., related mater. 0.152 0.157 0.170 0.203 0.258629 Articles of rubber, n.e.s. 0.170 0.186 0.169 0.120 0.141699 Manufactures of base metal, n.e.s. 0.163 0.195 0.169 0.142 0.128012 Other meat and edible meat offal (fresh chilled frozen) 0.284 0.231 0.169 0.157 0.264898 Musical instrument, parts accessory; tape, sound recording (excluding 763 & 883) 0.181 0.182 0.168 0.121 0.172695 Tools for use in the hand or in machine 0.168 0.185 0.168 0.113 0.147677 Rails or railway track construction material, of iron or steel 0.153 0.173 0.166 0.332 0.335641 Paper and paperboard 0.184 0.185 0.165 0.099 0.126075 Spices 0.184 0.196 0.165 0.119 0.147712 Steam turbines and other vapour turbines, and parts thereof, n.e.s. 0.167 0.192 0.165 0.467 0.431514 Nitrogen-function compounds 0.171 0.172 0.164 0.106 0.136746 Ball or roller bearings 0.168 0.168 0.164 0.090 0.160786 Trailers semi-trailers vehicles not mechanically-propelled; transport containers 0.166 0.204 0.164 0.160 0.193524 Other inorganic chemicals; organic and inorganic compounds of precious metals 0.172 0.214 0.164 0.207 0.192743 Pump (non liquid), air gas compressor, fan ventilation filter; centrifuge; parts 0.151 0.175 0.163 0.109 0.149663 Mineral manufactures, n.e.s. 0.173 0.203 0.163 0.148 0.165621 Materials of rubber (e.g., pastes, plates, sheets, rods, thread, tubes, of rubber) 0.157 0.167 0.163 0.140 0.199728 Other machinery or specialized industrial equipment; parts thereof, n.e.s. 0.162 0.174 0.162 0.167 0.158421 Fixed vegetable fats and oils, "soft", crude, refined or fractionated 0.144 0.126 0.162 0.230 0.283571 Polymers of ethylene, in primary forms 0.151 0.157 0.161 0.139 0.190685 Lead 0.176 0.169 0.160 0.196 0.251742 Liquid pump, with without a fitted measuring device; liquid elevator; parts for 0.149 0.159 0.160 0.120 0.173516 Other organic chemicals 0.180 0.208 0.158 0.095 0.176745 Non-electrical machinery, tools and mechanical apparatus, parts thereof, n.e.s. 0.138 0.167 0.158 0.118 0.143273 Stone, sand and gravel 0.184 0.167 0.158 0.201 0.268665 Glassware 0.171 0.188 0.157 0.137 0.171
For sources and notes, see end of table. Pour les sources et les notes, se reporter à la fin du tableau.
SITC groupRevision 3 (3-digit level)
ranked according to the concentration index in 2006
Groupes de la CTCIRévision 3 (positions à 3 chiffres)
classés d’après l’indice de concentration en 2006
Concentration index(1)
Indice de concentration (1)
Structural change index (2)
Indice de changement structurel (2)
1995=0
3.3 Concentration and structural changeindices of product marketsImports
3.3 Indices de concentration et de changement structurel des marchés de produitsImportations
189
3
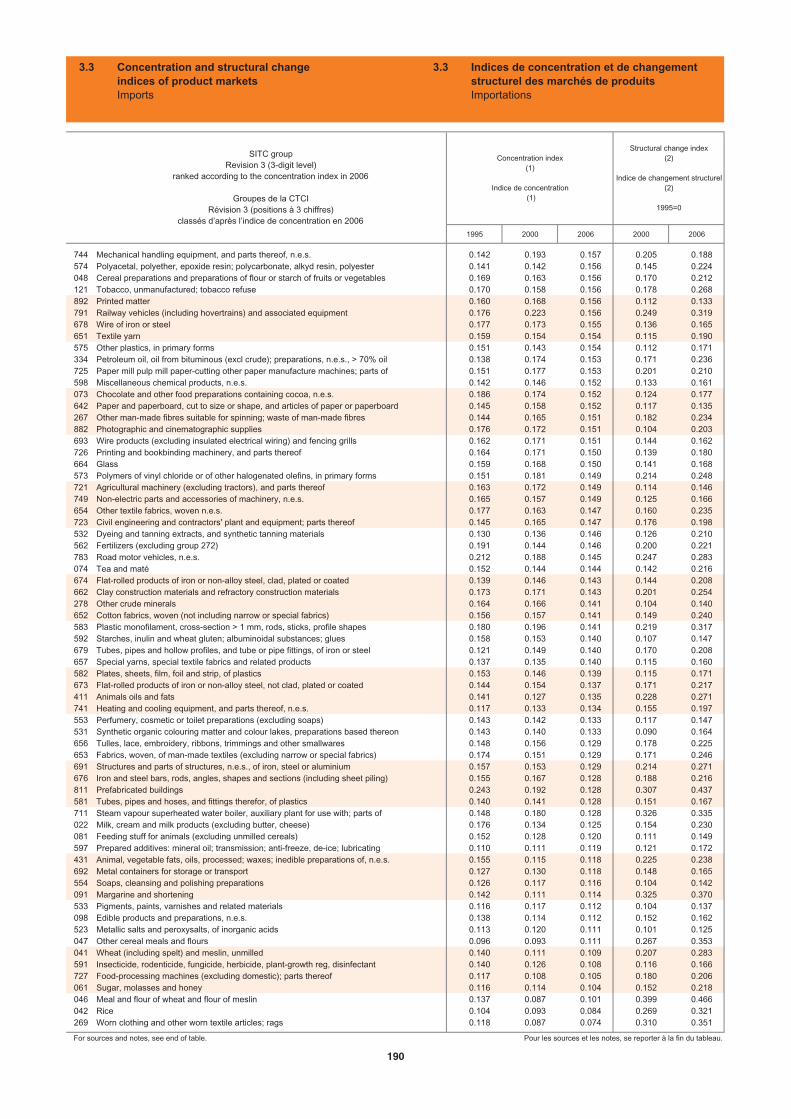
1995 2000 2006 2000 2006
744 Mechanical handling equipment, and parts thereof, n.e.s. 0.142 0.193 0.157 0.205 0.188574 Polyacetal, polyether, epoxide resin; polycarbonate, alkyd resin, polyester 0.141 0.142 0.156 0.145 0.224048 Cereal preparations and preparations of flour or starch of fruits or vegetables 0.169 0.163 0.156 0.170 0.212121 Tobacco, unmanufactured; tobacco refuse 0.170 0.158 0.156 0.178 0.268892 Printed matter 0.160 0.168 0.156 0.112 0.133791 Railway vehicles (including hovertrains) and associated equipment 0.176 0.223 0.156 0.249 0.319678 Wire of iron or steel 0.177 0.173 0.155 0.136 0.165651 Textile yarn 0.159 0.154 0.154 0.115 0.190575 Other plastics, in primary forms 0.151 0.143 0.154 0.112 0.171334 Petroleum oil, oil from bituminous (excl crude); preparations, n.e.s., > 70% oil 0.138 0.174 0.153 0.171 0.236725 Paper mill pulp mill paper-cutting other paper manufacture machines; parts of 0.151 0.177 0.153 0.201 0.210598 Miscellaneous chemical products, n.e.s. 0.142 0.146 0.152 0.133 0.161073 Chocolate and other food preparations containing cocoa, n.e.s. 0.186 0.174 0.152 0.124 0.177642 Paper and paperboard, cut to size or shape, and articles of paper or paperboard 0.145 0.158 0.152 0.117 0.135267 Other man-made fibres suitable for spinning; waste of man-made fibres 0.144 0.165 0.151 0.182 0.234882 Photographic and cinematographic supplies 0.176 0.172 0.151 0.104 0.203693 Wire products (excluding insulated electrical wiring) and fencing grills 0.162 0.171 0.151 0.144 0.162726 Printing and bookbinding machinery, and parts thereof 0.164 0.171 0.150 0.139 0.180664 Glass 0.159 0.168 0.150 0.141 0.168573 Polymers of vinyl chloride or of other halogenated olefins, in primary forms 0.151 0.181 0.149 0.214 0.248721 Agricultural machinery (excluding tractors), and parts thereof 0.163 0.172 0.149 0.114 0.146749 Non-electric parts and accessories of machinery, n.e.s. 0.165 0.157 0.149 0.125 0.166654 Other textile fabrics, woven n.e.s. 0.177 0.163 0.147 0.160 0.235723 Civil engineering and contractors' plant and equipment; parts thereof 0.145 0.165 0.147 0.176 0.198532 Dyeing and tanning extracts, and synthetic tanning materials 0.130 0.136 0.146 0.126 0.210562 Fertilizers (excluding group 272) 0.191 0.144 0.146 0.200 0.221783 Road motor vehicles, n.e.s. 0.212 0.188 0.145 0.247 0.283074 Tea and maté 0.152 0.144 0.144 0.142 0.216674 Flat-rolled products of iron or non-alloy steel, clad, plated or coated 0.139 0.146 0.143 0.144 0.208662 Clay construction materials and refractory construction materials 0.173 0.171 0.143 0.201 0.254278 Other crude minerals 0.164 0.166 0.141 0.104 0.140652 Cotton fabrics, woven (not including narrow or special fabrics) 0.156 0.157 0.141 0.149 0.240583 Plastic monofilament, cross-section > 1 mm, rods, sticks, profile shapes 0.180 0.196 0.141 0.219 0.317592 Starches, inulin and wheat gluten; albuminoidal substances; glues 0.158 0.153 0.140 0.107 0.147679 Tubes, pipes and hollow profiles, and tube or pipe fittings, of iron or steel 0.121 0.149 0.140 0.170 0.208657 Special yarns, special textile fabrics and related products 0.137 0.135 0.140 0.115 0.160582 Plates, sheets, film, foil and strip, of plastics 0.153 0.146 0.139 0.115 0.171673 Flat-rolled products of iron or non-alloy steel, not clad, plated or coated 0.144 0.154 0.137 0.171 0.217411 Animals oils and fats 0.141 0.127 0.135 0.228 0.271741 Heating and cooling equipment, and parts thereof, n.e.s. 0.117 0.133 0.134 0.155 0.197553 Perfumery, cosmetic or toilet preparations (excluding soaps) 0.143 0.142 0.133 0.117 0.147531 Synthetic organic colouring matter and colour lakes, preparations based thereon 0.143 0.140 0.133 0.090 0.164656 Tulles, lace, embroidery, ribbons, trimmings and other smallwares 0.148 0.156 0.129 0.178 0.225653 Fabrics, woven, of man-made textiles (excluding narrow or special fabrics) 0.174 0.151 0.129 0.171 0.246691 Structures and parts of structures, n.e.s., of iron, steel or aluminium 0.157 0.153 0.129 0.214 0.271676 Iron and steel bars, rods, angles, shapes and sections (including sheet piling) 0.155 0.167 0.128 0.188 0.216811 Prefabricated buildings 0.243 0.192 0.128 0.307 0.437581 Tubes, pipes and hoses, and fittings therefor, of plastics 0.140 0.141 0.128 0.151 0.167711 Steam vapour superheated water boiler, auxiliary plant for use with; parts of 0.148 0.180 0.128 0.326 0.335022 Milk, cream and milk products (excluding butter, cheese) 0.176 0.134 0.125 0.154 0.230081 Feeding stuff for animals (excluding unmilled cereals) 0.152 0.128 0.120 0.111 0.149597 Prepared additives: mineral oil; transmission; anti-freeze, de-ice; lubricating 0.110 0.111 0.119 0.121 0.172431 Animal, vegetable fats, oils, processed; waxes; inedible preparations of, n.e.s. 0.155 0.115 0.118 0.225 0.238692 Metal containers for storage or transport 0.127 0.130 0.118 0.148 0.165554 Soaps, cleansing and polishing preparations 0.126 0.117 0.116 0.104 0.142091 Margarine and shortening 0.142 0.111 0.114 0.325 0.370533 Pigments, paints, varnishes and related materials 0.116 0.117 0.112 0.104 0.137098 Edible products and preparations, n.e.s. 0.138 0.114 0.112 0.152 0.162523 Metallic salts and peroxysalts, of inorganic acids 0.113 0.120 0.111 0.101 0.125047 Other cereal meals and flours 0.096 0.093 0.111 0.267 0.353041 Wheat (including spelt) and meslin, unmilled 0.140 0.111 0.109 0.207 0.283591 Insecticide, rodenticide, fungicide, herbicide, plant-growth reg, disinfectant 0.140 0.126 0.108 0.116 0.166727 Food-processing machines (excluding domestic); parts thereof 0.117 0.108 0.105 0.180 0.206061 Sugar, molasses and honey 0.116 0.114 0.104 0.152 0.218046 Meal and flour of wheat and flour of meslin 0.137 0.087 0.101 0.399 0.466042 Rice 0.104 0.093 0.084 0.269 0.321269 Worn clothing and other worn textile articles; rags 0.118 0.087 0.074 0.310 0.351
For sources and notes, see end of table. Pour les sources et les notes, se reporter à la fin du tableau.
SITC groupRevision 3 (3-digit level)
ranked according to the concentration index in 2006
Groupes de la CTCIRévision 3 (positions à 3 chiffres)
classés d’après l’indice de concentration en 2006
Concentration index(1)
Indice de concentration (1)
Structural change index (2)
Indice de changement structurel (2)
1995=0
3.3 Concentration and structural changeindices of product marketsImports
3.3 Indices de concentration et de changement structurel des marchés de produitsImportations
190
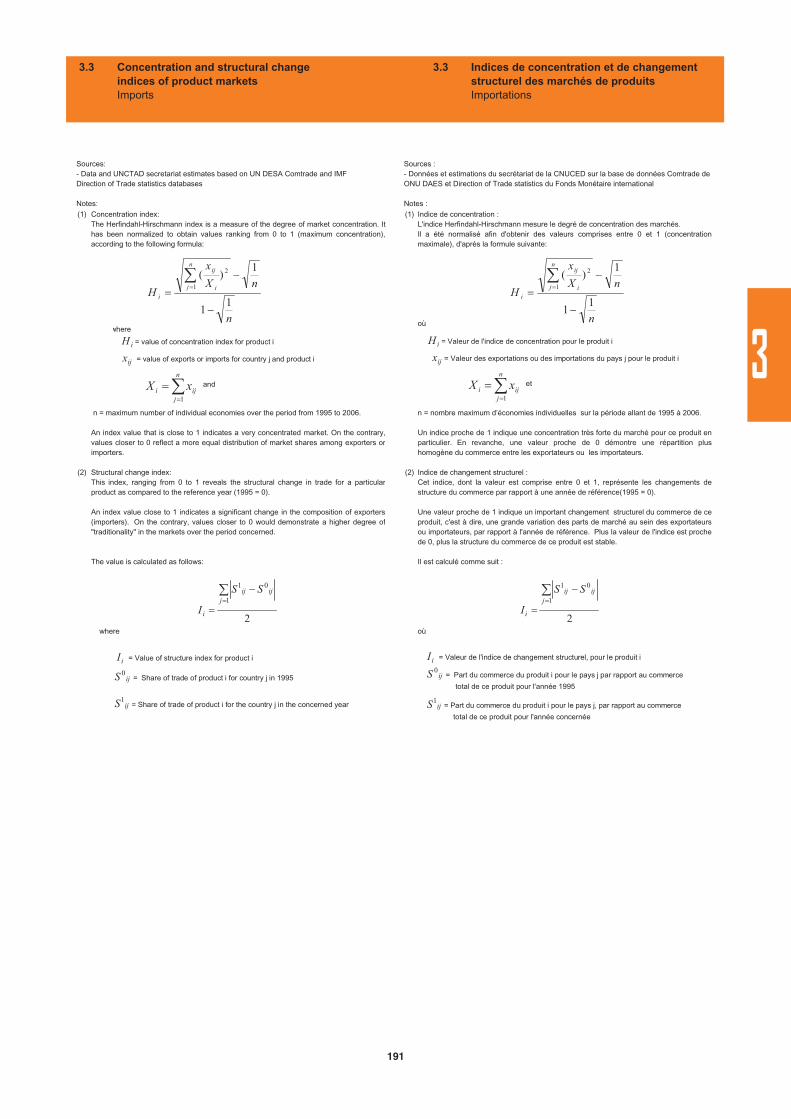
3.3 Concentration and structural changeindices of product marketsImports
3.3 Indices de concentration et de changement structurel des marchés de produitsImportations
(1)
(2)
Concentration index:The Herfindahl-Hirschmann index is a measure of the degree of market concentration. Ithas been normalized to obtain values ranking from 0 to 1 (maximum concentration),according to the following formula:
n = maximum number of individual economies over the period from 1995 to 2006.
An index value that is close to 1 indicates a very concentrated market. On the contrary,values closer to 0 reflect a more equal distribution of market shares among exporters orimporters.
Structural change index:This index, ranging from 0 to 1 reveals the structural change in trade for a particularproduct as compared to the reference year (1995 = 0).
An index value close to 1 indicates a significant change in the composition of exporters(importers). On the contrary, values closer to 0 would demonstrate a higher degree of"traditionality" in the markets over the period concerned.
The value is calculated as follows:
where
Sources:- Data and UNCTAD secretariat estimates based on UN DESA Comtrade and IMF Direction of Trade statistics databases
Notes:
n
nX
x
H
n
j i
ij
i1
1
1)(
1
2
where
iH = value of concentration index for product i
ijx = value of exports or imports for country j and product i
n
j
iji xX1
and
2
1
01
j
ijij
i
SS
I
iI = Value of structure index for product i
ijS 0= Share of trade of product i for country j in 1995
ijS1
= Share of trade of product i for the country j in the concerned year
Sources : - Données et estimations du secrétariat de la CNUCED sur la base de données Comtrade de ONU DAES et Direction of Trade statistics du Fonds Monétaire international
Notes :(1)
(2)
Indice de concentration : L'indice Herfindahl-Hirschmann mesure le degré de concentration des marchés. Il a été normalisé afin d'obtenir des valeurs comprises entre 0 et 1 (concentrationmaximale), d'après la formule suivante:
où
n = nombre maximum d’économies individuelles sur la période allant de 1995 à 2006.
Un indice proche de 1 indique une concentration très forte du marché pour ce produit enparticulier. En revanche, une valeur proche de 0 démontre une répartition plushomogène du commerce entre les exportateurs ou les importateurs.
Indice de changement structurel :Cet indice, dont la valeur est comprise entre 0 et 1, représente les changements destructure du commerce par rapport à une année de référence(1995 = 0).
Une valeur proche de 1 indique un important changement structurel du commerce de ceproduit, c'est à dire, une grande variation des parts de marché au sein des exportateursou importateurs, par rapport à l'année de référence. Plus la valeur de l'indice est prochede 0, plus la structure du commerce de ce produit est stable.
Il est calculé comme suit :
où
iI = Valeur de l'indice de changement structurel, pour le produit i
ijS 0= Part du commerce du produit i pour le pays j par rapport au commerce
total de ce produit pour l'année 1995
ijS1
= Part du commerce du produit i pour le pays j, par rapport au commerce
total de ce produit pour l'année concernée
iH = Valeur de l'indice de concentration pour le produit i
ijx = Valeur des exportations ou des importations du pays j pour le produit i
n
j
iji xX1
et
n
nX
x
H
n
j i
ij
i1
1
1)(
1
2
2
1
01
j
ijij
i
SS
I
191
3

MARCHANDISES
MERCHANDISE
1
2
3
4
5
6
7
8
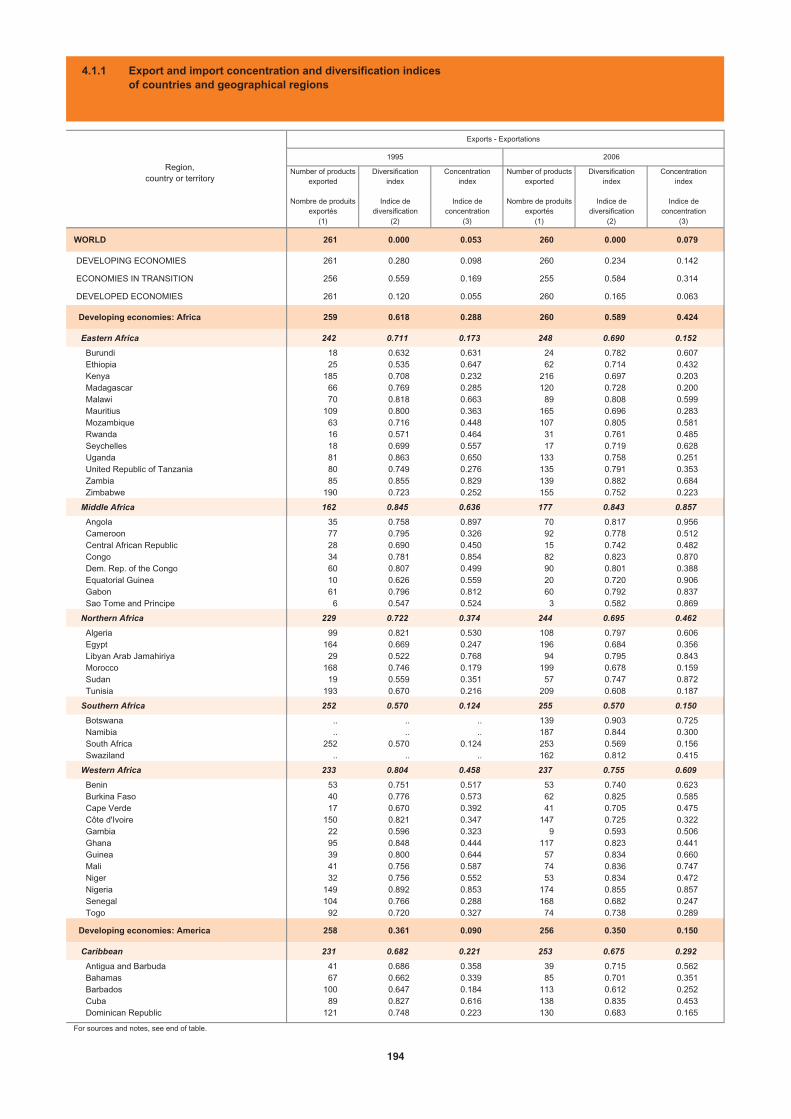
Number of products exported
Nombre de produits exportés
Diversificationindex
Indice de diversification
Concentrationindex
Indice de concentration
Number of products exported
Nombre de produits exportés
Diversificationindex
Indice de diversification
Concentrationindex
Indice de concentration
(1) (2) (3) (1) (2) (3)
WORLD 261 0.000 0.053 260 0.000 0.079
DEVELOPING ECONOMIES 261 0.280 0.098 260 0.234 0.142
ECONOMIES IN TRANSITION 256 0.559 0.169 255 0.584 0.314
DEVELOPED ECONOMIES 261 0.120 0.055 260 0.165 0.063
Developing economies: Africa 259 0.618 0.288 260 0.589 0.424
Eastern Africa 242 0.711 0.173 248 0.690 0.152
Burundi 18 0.632 0.631 24 0.782 0.607 Ethiopia 25 0.535 0.647 62 0.714 0.432 Kenya 185 0.708 0.232 216 0.697 0.203 Madagascar 66 0.769 0.285 120 0.728 0.200 Malawi 70 0.818 0.663 89 0.808 0.599 Mauritius 109 0.800 0.363 165 0.696 0.283 Mozambique 63 0.716 0.448 107 0.805 0.581 Rwanda 16 0.571 0.464 31 0.761 0.485 Seychelles 18 0.699 0.557 17 0.719 0.628 Uganda 81 0.863 0.650 133 0.758 0.251 United Republic of Tanzania 80 0.749 0.276 135 0.791 0.353 Zambia 85 0.855 0.829 139 0.882 0.684 Zimbabwe 190 0.723 0.252 155 0.752 0.223
Middle Africa 162 0.845 0.636 177 0.843 0.857
Angola 35 0.758 0.897 70 0.817 0.956 Cameroon 77 0.795 0.326 92 0.778 0.512 Central African Republic 28 0.690 0.450 15 0.742 0.482 Congo 34 0.781 0.854 82 0.823 0.870 Dem. Rep. of the Congo 60 0.807 0.499 90 0.801 0.388 Equatorial Guinea 10 0.626 0.559 20 0.720 0.906 Gabon 61 0.796 0.812 60 0.792 0.837 Sao Tome and Principe 6 0.547 0.524 3 0.582 0.869
Northern Africa 229 0.722 0.374 244 0.695 0.462
Algeria 99 0.821 0.530 108 0.797 0.606 Egypt 164 0.669 0.247 196 0.684 0.356 Libyan Arab Jamahiriya 29 0.522 0.768 94 0.795 0.843 Morocco 168 0.746 0.179 199 0.678 0.159 Sudan 19 0.559 0.351 57 0.747 0.872 Tunisia 193 0.670 0.216 209 0.608 0.187
Southern Africa 252 0.570 0.124 255 0.570 0.150
Botswana .. .. .. 139 0.903 0.725 Namibia .. .. .. 187 0.844 0.300 South Africa 252 0.570 0.124 253 0.569 0.156 Swaziland .. .. .. 162 0.812 0.415
Western Africa 233 0.804 0.458 237 0.755 0.609
Benin 53 0.751 0.517 53 0.740 0.623 Burkina Faso 40 0.776 0.573 62 0.825 0.585 Cape Verde 17 0.670 0.392 41 0.705 0.475 Côte d'Ivoire 150 0.821 0.347 147 0.725 0.322 Gambia 22 0.596 0.323 9 0.593 0.506 Ghana 95 0.848 0.444 117 0.823 0.441 Guinea 39 0.800 0.644 57 0.834 0.660 Mali 41 0.756 0.587 74 0.836 0.747 Niger 32 0.756 0.552 53 0.834 0.472 Nigeria 149 0.892 0.853 174 0.855 0.857 Senegal 104 0.766 0.288 168 0.682 0.247 Togo 92 0.720 0.327 74 0.738 0.289
Developing economies: America 258 0.361 0.090 256 0.350 0.150
Caribbean 231 0.682 0.221 253 0.675 0.292
Antigua and Barbuda 41 0.686 0.358 39 0.715 0.562 Bahamas 67 0.662 0.339 85 0.701 0.351 Barbados 100 0.647 0.184 113 0.612 0.252 Cuba 89 0.827 0.616 138 0.835 0.453 Dominican Republic 121 0.748 0.223 130 0.683 0.165
For sources and notes, see end of table.
Region,country or territory
1995 2006
Exports - Exportations
4.1.1 Export and import concentration and diversification indicesof countries and geographical regions
194
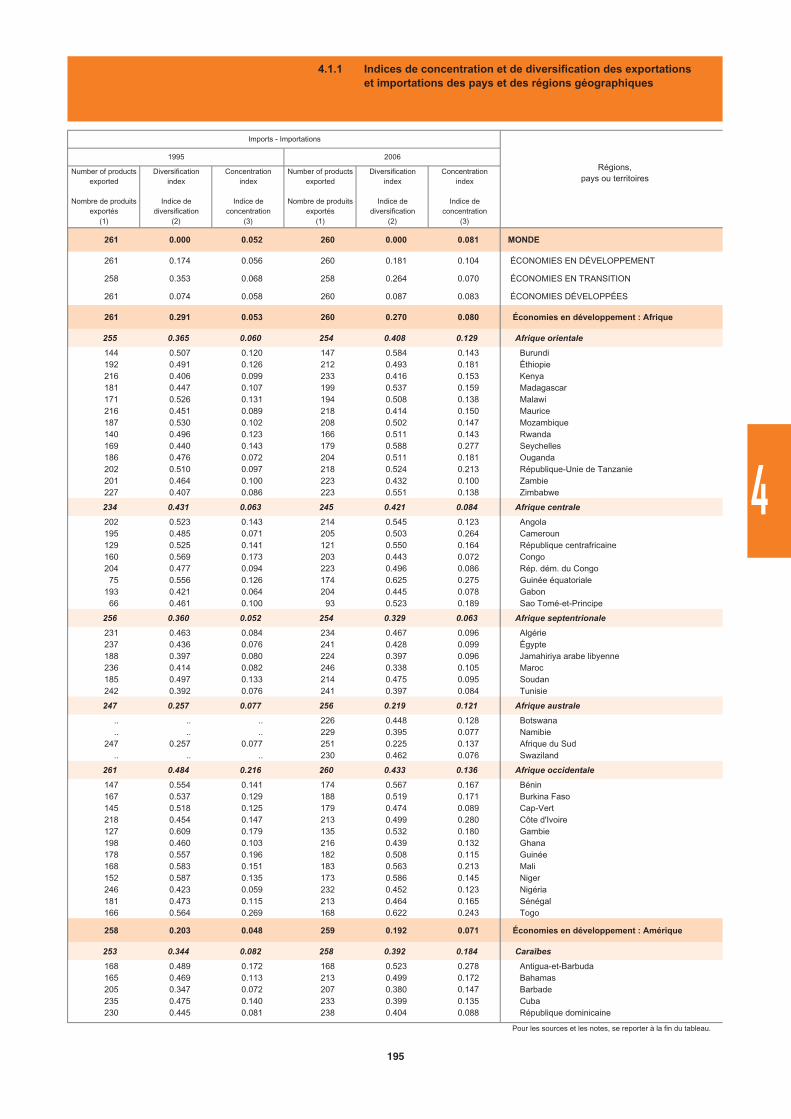
Number of products exported
Nombre de produits exportés
Diversificationindex
Indice de diversification
Concentrationindex
Indice de concentration
Number of products exported
Nombre de produits exportés
Diversificationindex
Indice de diversification
Concentrationindex
Indice de concentration
(1) (2) (3) (1) (2) (3)
261 0.000 0.052 260 0.000 0.081 MONDE
261 0.174 0.056 260 0.181 0.104 ÉCONOMIES EN DÉVELOPPEMENT
258 0.353 0.068 258 0.264 0.070 ÉCONOMIES EN TRANSITION
261 0.074 0.058 260 0.087 0.083 ÉCONOMIES DÉVELOPPÉES
261 0.291 0.053 260 0.270 0.080 Économies en développement : Afrique
255 0.365 0.060 254 0.408 0.129 Afrique orientale
144 0.507 0.120 147 0.584 0.143 Burundi192 0.491 0.126 212 0.493 0.181 Éthiopie216 0.406 0.099 233 0.416 0.153 Kenya181 0.447 0.107 199 0.537 0.159 Madagascar171 0.526 0.131 194 0.508 0.138 Malawi216 0.451 0.089 218 0.414 0.150 Maurice187 0.530 0.102 208 0.502 0.147 Mozambique140 0.496 0.123 166 0.511 0.143 Rwanda169 0.440 0.143 179 0.588 0.277 Seychelles186 0.476 0.072 204 0.511 0.181 Ouganda202 0.510 0.097 218 0.524 0.213 République-Unie de Tanzanie201 0.464 0.100 223 0.432 0.100 Zambie227 0.407 0.086 223 0.551 0.138 Zimbabwe
234 0.431 0.063 245 0.421 0.084 Afrique centrale
202 0.523 0.143 214 0.545 0.123 Angola195 0.485 0.071 205 0.503 0.264 Cameroun129 0.525 0.141 121 0.550 0.164 République centrafricaine160 0.569 0.173 203 0.443 0.072 Congo204 0.477 0.094 223 0.496 0.086 Rép. dém. du Congo
75 0.556 0.126 174 0.625 0.275 Guinée équatoriale193 0.421 0.064 204 0.445 0.078 Gabon
66 0.461 0.100 93 0.523 0.189 Sao Tomé-et-Principe
256 0.360 0.052 254 0.329 0.063 Afrique septentrionale
231 0.463 0.084 234 0.467 0.096 Algérie237 0.436 0.076 241 0.428 0.099 Égypte188 0.397 0.080 224 0.397 0.096 Jamahiriya arabe libyenne236 0.414 0.082 246 0.338 0.105 Maroc185 0.497 0.133 214 0.475 0.095 Soudan242 0.392 0.076 241 0.397 0.084 Tunisie
247 0.257 0.077 256 0.219 0.121 Afrique australe
.. .. .. 226 0.448 0.128 Botswana
.. .. .. 229 0.395 0.077 Namibie247 0.257 0.077 251 0.225 0.137 Afrique du Sud
.. .. .. 230 0.462 0.076 Swaziland
261 0.484 0.216 260 0.433 0.136 Afrique occidentale
147 0.554 0.141 174 0.567 0.167 Bénin167 0.537 0.129 188 0.519 0.171 Burkina Faso145 0.518 0.125 179 0.474 0.089 Cap-Vert218 0.454 0.147 213 0.499 0.280 Côte d'Ivoire127 0.609 0.179 135 0.532 0.180 Gambie198 0.460 0.103 216 0.439 0.132 Ghana178 0.557 0.196 182 0.508 0.115 Guinée168 0.583 0.151 183 0.563 0.213 Mali152 0.587 0.135 173 0.586 0.145 Niger246 0.423 0.059 232 0.452 0.123 Nigéria181 0.473 0.115 213 0.464 0.165 Sénégal166 0.564 0.269 168 0.622 0.243 Togo
258 0.203 0.048 259 0.192 0.071 Économies en développement : Amérique
253 0.344 0.082 258 0.392 0.184 Caraïbes
168 0.489 0.172 168 0.523 0.278 Antigua-et-Barbuda165 0.469 0.113 213 0.499 0.172 Bahamas205 0.347 0.072 207 0.380 0.147 Barbade235 0.475 0.140 233 0.399 0.135 Cuba230 0.445 0.081 238 0.404 0.088 République dominicaine
Pour les sources et les notes, se reporter à la fin du tableau.
Régions,pays ou territoires
2006
Imports - Importations
1995
4.1.1 Indices de concentration et de diversification des exportations et importations des pays et des régions géographiques
195
4
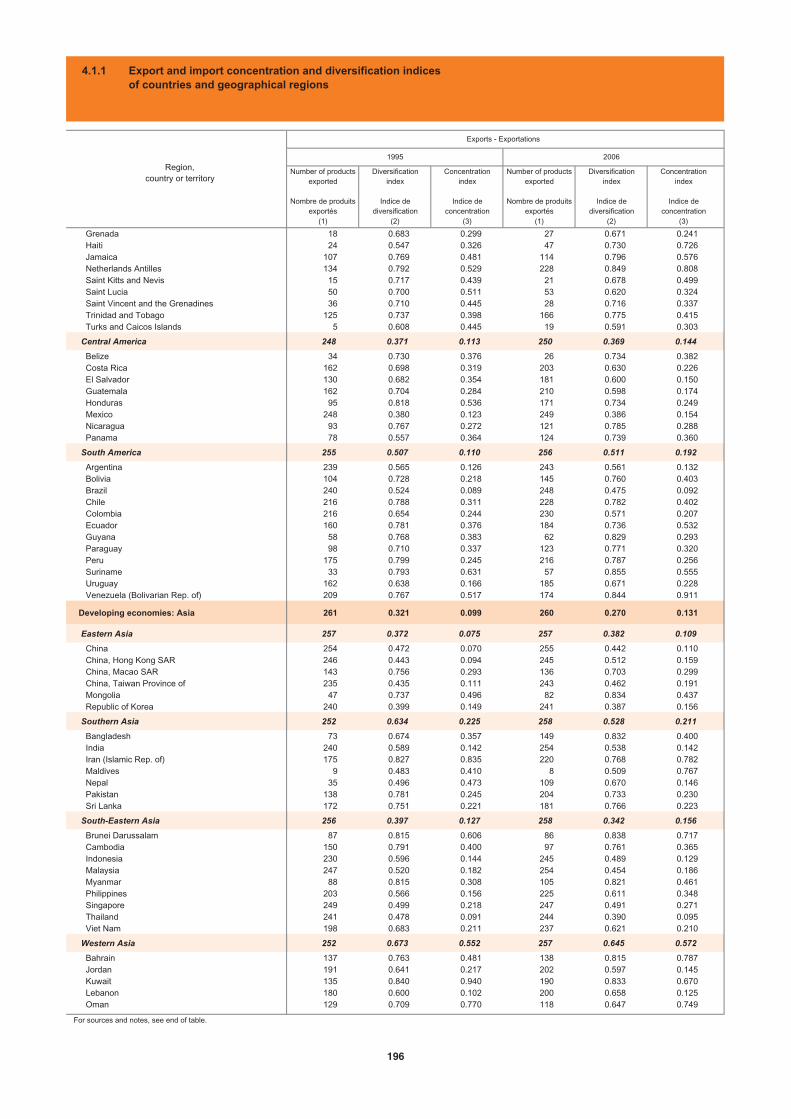
Number of products exported
Nombre de produits exportés
Diversificationindex
Indice de diversification
Concentrationindex
Indice de concentration
Number of products exported
Nombre de produits exportés
Diversificationindex
Indice de diversification
Concentrationindex
Indice de concentration
(1) (2) (3) (1) (2) (3)
Grenada 18 0.683 0.299 27 0.671 0.241 Haiti 24 0.547 0.326 47 0.730 0.726 Jamaica 107 0.769 0.481 114 0.796 0.576 Netherlands Antilles 134 0.792 0.529 228 0.849 0.808 Saint Kitts and Nevis 15 0.717 0.439 21 0.678 0.499 Saint Lucia 50 0.700 0.511 53 0.620 0.324 Saint Vincent and the Grenadines 36 0.710 0.445 28 0.716 0.337 Trinidad and Tobago 125 0.737 0.398 166 0.775 0.415 Turks and Caicos Islands 5 0.608 0.445 19 0.591 0.303
Central America 248 0.371 0.113 250 0.369 0.144
Belize 34 0.730 0.376 26 0.734 0.382 Costa Rica 162 0.698 0.319 203 0.630 0.226 El Salvador 130 0.682 0.354 181 0.600 0.150 Guatemala 162 0.704 0.284 210 0.598 0.174 Honduras 95 0.818 0.536 171 0.734 0.249 Mexico 248 0.380 0.123 249 0.386 0.154 Nicaragua 93 0.767 0.272 121 0.785 0.288 Panama 78 0.557 0.364 124 0.739 0.360
South America 255 0.507 0.110 256 0.511 0.192
Argentina 239 0.565 0.126 243 0.561 0.132 Bolivia 104 0.728 0.218 145 0.760 0.403 Brazil 240 0.524 0.089 248 0.475 0.092 Chile 216 0.788 0.311 228 0.782 0.402 Colombia 216 0.654 0.244 230 0.571 0.207 Ecuador 160 0.781 0.376 184 0.736 0.532 Guyana 58 0.768 0.383 62 0.829 0.293 Paraguay 98 0.710 0.337 123 0.771 0.320 Peru 175 0.799 0.245 216 0.787 0.256 Suriname 33 0.793 0.631 57 0.855 0.555 Uruguay 162 0.638 0.166 185 0.671 0.228 Venezuela (Bolivarian Rep. of) 209 0.767 0.517 174 0.844 0.911
Developing economies: Asia 261 0.321 0.099 260 0.270 0.131
Eastern Asia 257 0.372 0.075 257 0.382 0.109
China 254 0.472 0.070 255 0.442 0.110 China, Hong Kong SAR 246 0.443 0.094 245 0.512 0.159 China, Macao SAR 143 0.756 0.293 136 0.703 0.299 China, Taiwan Province of 235 0.435 0.111 243 0.462 0.191 Mongolia 47 0.737 0.496 82 0.834 0.437 Republic of Korea 240 0.399 0.149 241 0.387 0.156
Southern Asia 252 0.634 0.225 258 0.528 0.211
Bangladesh 73 0.674 0.357 149 0.832 0.400 India 240 0.589 0.142 254 0.538 0.142 Iran (Islamic Rep. of) 175 0.827 0.835 220 0.768 0.782 Maldives 9 0.483 0.410 8 0.509 0.767 Nepal 35 0.496 0.473 109 0.670 0.146 Pakistan 138 0.781 0.245 204 0.733 0.230 Sri Lanka 172 0.751 0.221 181 0.766 0.223
South-Eastern Asia 256 0.397 0.127 258 0.342 0.156
Brunei Darussalam 87 0.815 0.606 86 0.838 0.717 Cambodia 150 0.791 0.400 97 0.761 0.365 Indonesia 230 0.596 0.144 245 0.489 0.129 Malaysia 247 0.520 0.182 254 0.454 0.186 Myanmar 88 0.815 0.308 105 0.821 0.461 Philippines 203 0.566 0.156 225 0.611 0.348 Singapore 249 0.499 0.218 247 0.491 0.271 Thailand 241 0.478 0.091 244 0.390 0.095 Viet Nam 198 0.683 0.211 237 0.621 0.210
Western Asia 252 0.673 0.552 257 0.645 0.572
Bahrain 137 0.763 0.481 138 0.815 0.787 Jordan 191 0.641 0.217 202 0.597 0.145 Kuwait 135 0.840 0.940 190 0.833 0.670 Lebanon 180 0.600 0.102 200 0.658 0.125 Oman 129 0.709 0.770 118 0.647 0.749
For sources and notes, see end of table.
Region,country or territory
Exports - Exportations
1995 2006
4.1.1 Export and import concentration and diversification indicesof countries and geographical regions
196
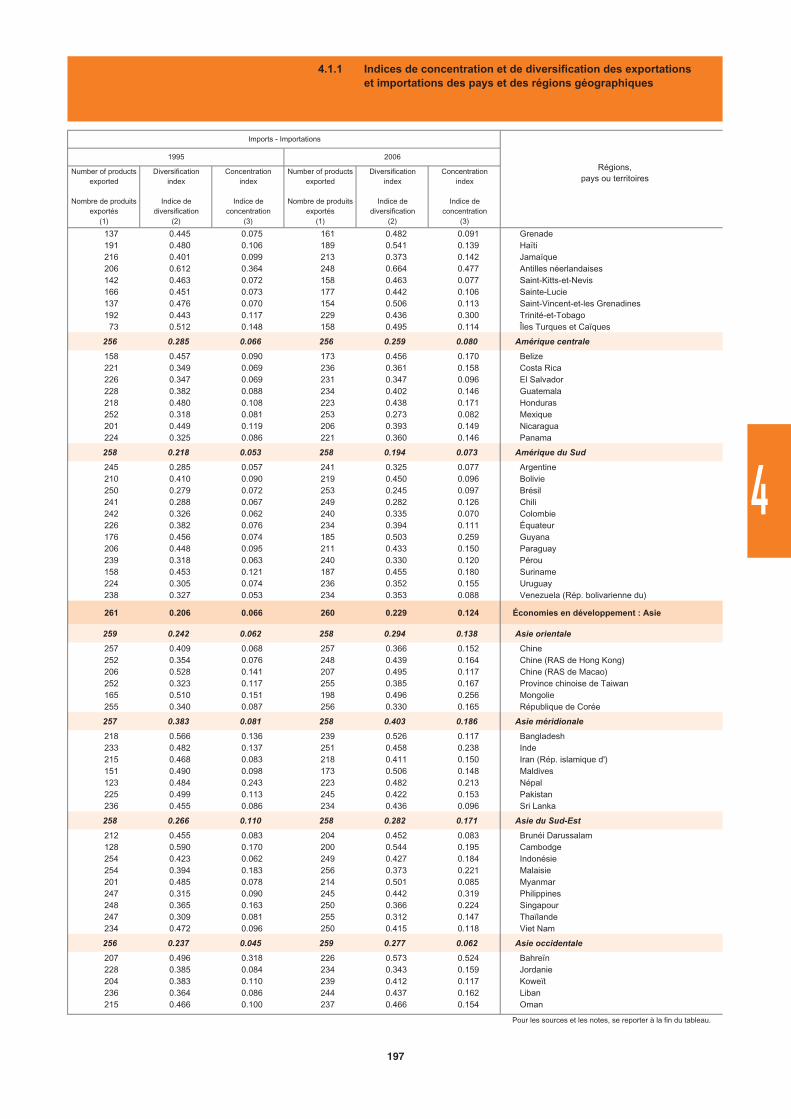
Number of products exported
Nombre de produits exportés
Diversificationindex
Indice de diversification
Concentrationindex
Indice de concentration
Number of products exported
Nombre de produits exportés
Diversificationindex
Indice de diversification
Concentrationindex
Indice de concentration
(1) (2) (3) (1) (2) (3)
137 0.445 0.075 161 0.482 0.091 Grenade191 0.480 0.106 189 0.541 0.139 Haïti216 0.401 0.099 213 0.373 0.142 Jamaïque206 0.612 0.364 248 0.664 0.477 Antilles néerlandaises142 0.463 0.072 158 0.463 0.077 Saint-Kitts-et-Nevis166 0.451 0.073 177 0.442 0.106 Sainte-Lucie137 0.476 0.070 154 0.506 0.113 Saint-Vincent-et-les Grenadines192 0.443 0.117 229 0.436 0.300 Trinité-et-Tobago
73 0.512 0.148 158 0.495 0.114 Îles Turques et Caïques
256 0.285 0.066 256 0.259 0.080 Amérique centrale
158 0.457 0.090 173 0.456 0.170 Belize221 0.349 0.069 236 0.361 0.158 Costa Rica226 0.347 0.069 231 0.347 0.096 El Salvador228 0.382 0.088 234 0.402 0.146 Guatemala218 0.480 0.108 223 0.438 0.171 Honduras252 0.318 0.081 253 0.273 0.082 Mexique201 0.449 0.119 206 0.393 0.149 Nicaragua224 0.325 0.086 221 0.360 0.146 Panama
258 0.218 0.053 258 0.194 0.073 Amérique du Sud
245 0.285 0.057 241 0.325 0.077 Argentine210 0.410 0.090 219 0.450 0.096 Bolivie250 0.279 0.072 253 0.245 0.097 Brésil241 0.288 0.067 249 0.282 0.126 Chili242 0.326 0.062 240 0.335 0.070 Colombie226 0.382 0.076 234 0.394 0.111 Équateur176 0.456 0.074 185 0.503 0.259 Guyana206 0.448 0.095 211 0.433 0.150 Paraguay239 0.318 0.063 240 0.330 0.120 Pérou158 0.453 0.121 187 0.455 0.180 Suriname224 0.305 0.074 236 0.352 0.155 Uruguay238 0.327 0.053 234 0.353 0.088 Venezuela (Rép. bolivarienne du)
261 0.206 0.066 260 0.229 0.124 Économies en développement : Asie
259 0.242 0.062 258 0.294 0.138 Asie orientale
257 0.409 0.068 257 0.366 0.152 Chine252 0.354 0.076 248 0.439 0.164 Chine (RAS de Hong Kong)206 0.528 0.141 207 0.495 0.117 Chine (RAS de Macao)252 0.323 0.117 255 0.385 0.167 Province chinoise de Taiwan165 0.510 0.151 198 0.496 0.256 Mongolie255 0.340 0.087 256 0.330 0.165 République de Corée
257 0.383 0.081 258 0.403 0.186 Asie méridionale
218 0.566 0.136 239 0.526 0.117 Bangladesh233 0.482 0.137 251 0.458 0.238 Inde215 0.468 0.083 218 0.411 0.150 Iran (Rép. islamique d')151 0.490 0.098 173 0.506 0.148 Maldives123 0.484 0.243 223 0.482 0.213 Népal225 0.499 0.113 245 0.422 0.153 Pakistan236 0.455 0.086 234 0.436 0.096 Sri Lanka
258 0.266 0.110 258 0.282 0.171 Asie du Sud-Est
212 0.455 0.083 204 0.452 0.083 Brunéi Darussalam128 0.590 0.170 200 0.544 0.195 Cambodge254 0.423 0.062 249 0.427 0.184 Indonésie254 0.394 0.183 256 0.373 0.221 Malaisie201 0.485 0.078 214 0.501 0.085 Myanmar247 0.315 0.090 245 0.442 0.319 Philippines248 0.365 0.163 250 0.366 0.224 Singapour247 0.309 0.081 255 0.312 0.147 Thaïlande234 0.472 0.096 250 0.415 0.118 Viet Nam
256 0.237 0.045 259 0.277 0.062 Asie occidentale
207 0.496 0.318 226 0.573 0.524 Bahreïn228 0.385 0.084 234 0.343 0.159 Jordanie204 0.383 0.110 239 0.412 0.117 Koweït236 0.364 0.086 244 0.437 0.162 Liban215 0.466 0.100 237 0.466 0.154 Oman
Pour les sources et les notes, se reporter à la fin du tableau.
Imports - Importations
Régions,pays ou territoires
1995 2006
4.1.1 Indices de concentration et de diversification des exportations et importations des pays et des régions géographiques
197
4
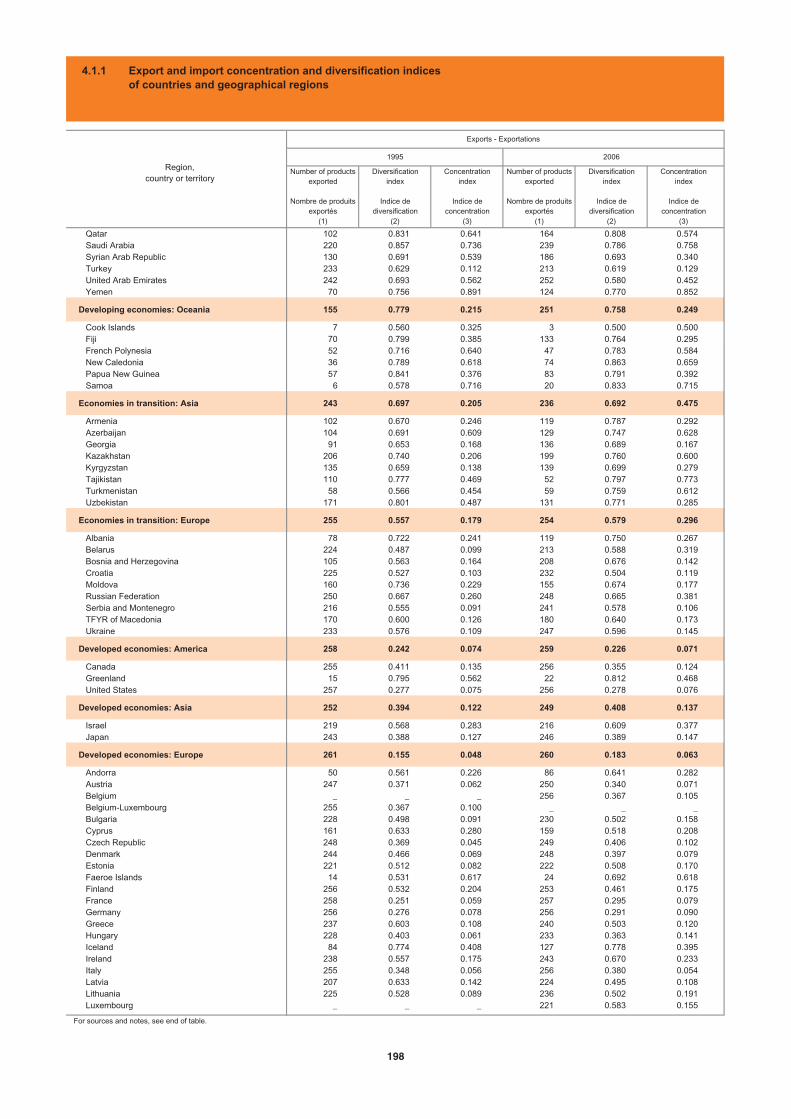
Number of products exported
Nombre de produits exportés
Diversificationindex
Indice de diversification
Concentrationindex
Indice de concentration
Number of products exported
Nombre de produits exportés
Diversificationindex
Indice de diversification
Concentrationindex
Indice de concentration
(1) (2) (3) (1) (2) (3)
Qatar 102 0.831 0.641 164 0.808 0.574 Saudi Arabia 220 0.857 0.736 239 0.786 0.758 Syrian Arab Republic 130 0.691 0.539 186 0.693 0.340 Turkey 233 0.629 0.112 213 0.619 0.129 United Arab Emirates 242 0.693 0.562 252 0.580 0.452 Yemen 70 0.756 0.891 124 0.770 0.852
Developing economies: Oceania 155 0.779 0.215 251 0.758 0.249
Cook Islands 7 0.560 0.325 3 0.500 0.500 Fiji 70 0.799 0.385 133 0.764 0.295 French Polynesia 52 0.716 0.640 47 0.783 0.584 New Caledonia 36 0.789 0.618 74 0.863 0.659 Papua New Guinea 57 0.841 0.376 83 0.791 0.392 Samoa 6 0.578 0.716 20 0.833 0.715
Economies in transition: Asia 243 0.697 0.205 236 0.692 0.475
Armenia 102 0.670 0.246 119 0.787 0.292 Azerbaijan 104 0.691 0.609 129 0.747 0.628 Georgia 91 0.653 0.168 136 0.689 0.167 Kazakhstan 206 0.740 0.206 199 0.760 0.600 Kyrgyzstan 135 0.659 0.138 139 0.699 0.279 Tajikistan 110 0.777 0.469 52 0.797 0.773 Turkmenistan 58 0.566 0.454 59 0.759 0.612 Uzbekistan 171 0.801 0.487 131 0.771 0.285
Economies in transition: Europe 255 0.557 0.179 254 0.579 0.296
Albania 78 0.722 0.241 119 0.750 0.267 Belarus 224 0.487 0.099 213 0.588 0.319 Bosnia and Herzegovina 105 0.563 0.164 208 0.676 0.142 Croatia 225 0.527 0.103 232 0.504 0.119 Moldova 160 0.736 0.229 155 0.674 0.177 Russian Federation 250 0.667 0.260 248 0.665 0.381 Serbia and Montenegro 216 0.555 0.091 241 0.578 0.106 TFYR of Macedonia 170 0.600 0.126 180 0.640 0.173 Ukraine 233 0.576 0.109 247 0.596 0.145
Developed economies: America 258 0.242 0.074 259 0.226 0.071
Canada 255 0.411 0.135 256 0.355 0.124 Greenland 15 0.795 0.562 22 0.812 0.468 United States 257 0.277 0.075 256 0.278 0.076
Developed economies: Asia 252 0.394 0.122 249 0.408 0.137
Israel 219 0.568 0.283 216 0.609 0.377 Japan 243 0.388 0.127 246 0.389 0.147
Developed economies: Europe 261 0.155 0.048 260 0.183 0.063
Andorra 50 0.561 0.226 86 0.641 0.282 Austria 247 0.371 0.062 250 0.340 0.071 Belgium _ _ _ 256 0.367 0.105 Belgium-Luxembourg 255 0.367 0.100 _ _ _ Bulgaria 228 0.498 0.091 230 0.502 0.158 Cyprus 161 0.633 0.280 159 0.518 0.208 Czech Republic 248 0.369 0.045 249 0.406 0.102 Denmark 244 0.466 0.069 248 0.397 0.079 Estonia 221 0.512 0.082 222 0.508 0.170 Faeroe Islands 14 0.531 0.617 24 0.692 0.618 Finland 256 0.532 0.204 253 0.461 0.175 France 258 0.251 0.059 257 0.295 0.079 Germany 256 0.276 0.078 256 0.291 0.090 Greece 237 0.603 0.108 240 0.503 0.120 Hungary 228 0.403 0.061 233 0.363 0.141 Iceland 84 0.774 0.408 127 0.778 0.395 Ireland 238 0.557 0.175 243 0.670 0.233 Italy 255 0.348 0.056 256 0.380 0.054 Latvia 207 0.633 0.142 224 0.495 0.108 Lithuania 225 0.528 0.089 236 0.502 0.191 Luxembourg _ _ _ 221 0.583 0.155
For sources and notes, see end of table.
Region,country or territory
Exports - Exportations
1995 2006
4.1.1 Export and import concentration and diversification indicesof countries and geographical regions
198
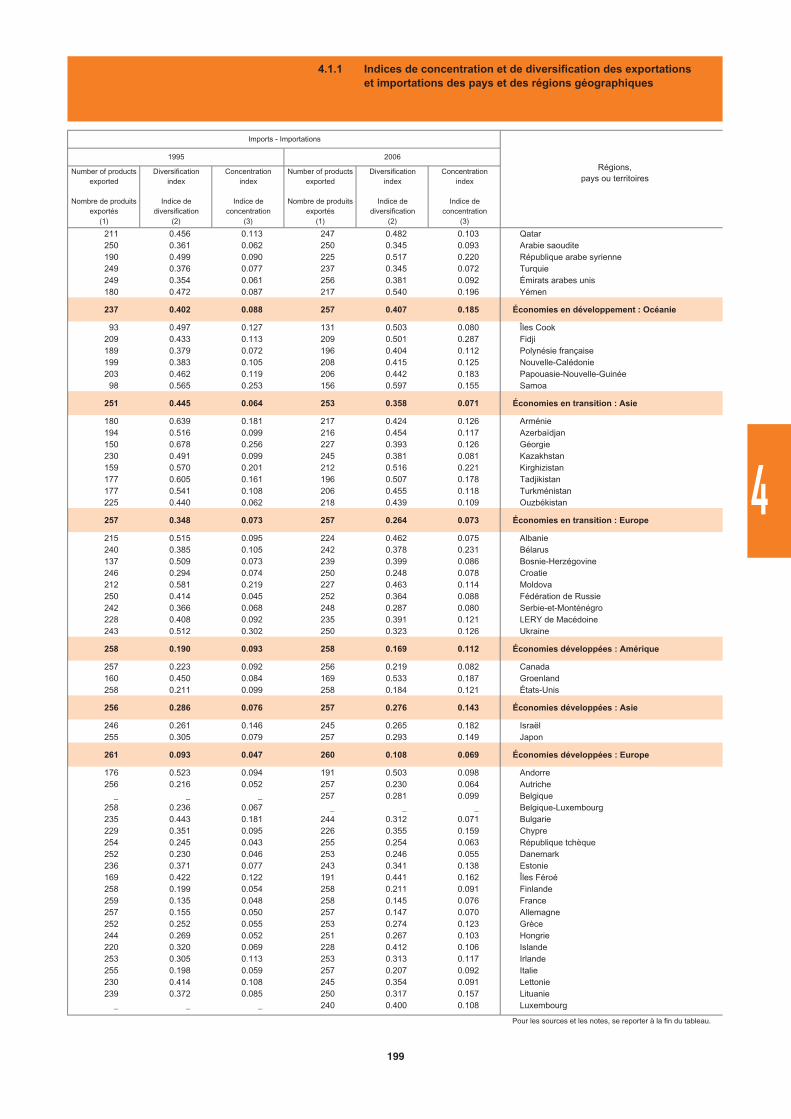
Number of products exported
Nombre de produits exportés
Diversificationindex
Indice de diversification
Concentrationindex
Indice de concentration
Number of products exported
Nombre de produits exportés
Diversificationindex
Indice de diversification
Concentrationindex
Indice de concentration
(1) (2) (3) (1) (2) (3)
211 0.456 0.113 247 0.482 0.103 Qatar250 0.361 0.062 250 0.345 0.093 Arabie saoudite190 0.499 0.090 225 0.517 0.220 République arabe syrienne249 0.376 0.077 237 0.345 0.072 Turquie249 0.354 0.061 256 0.381 0.092 Émirats arabes unis180 0.472 0.087 217 0.540 0.196 Yémen
237 0.402 0.088 257 0.407 0.185 Économies en développement : Océanie
93 0.497 0.127 131 0.503 0.080 Îles Cook209 0.433 0.113 209 0.501 0.287 Fidji189 0.379 0.072 196 0.404 0.112 Polynésie française199 0.383 0.105 208 0.415 0.125 Nouvelle-Calédonie203 0.462 0.119 206 0.442 0.183 Papouasie-Nouvelle-Guinée
98 0.565 0.253 156 0.597 0.155 Samoa
251 0.445 0.064 253 0.358 0.071 Économies en transition : Asie
180 0.639 0.181 217 0.424 0.126 Arménie194 0.516 0.099 216 0.454 0.117 Azerbaïdjan150 0.678 0.256 227 0.393 0.126 Géorgie230 0.491 0.099 245 0.381 0.081 Kazakhstan159 0.570 0.201 212 0.516 0.221 Kirghizistan177 0.605 0.161 196 0.507 0.178 Tadjikistan177 0.541 0.108 206 0.455 0.118 Turkménistan225 0.440 0.062 218 0.439 0.109 Ouzbékistan
257 0.348 0.073 257 0.264 0.073 Économies en transition : Europe
215 0.515 0.095 224 0.462 0.075 Albanie240 0.385 0.105 242 0.378 0.231 Bélarus137 0.509 0.073 239 0.399 0.086 Bosnie-Herzégovine246 0.294 0.074 250 0.248 0.078 Croatie212 0.581 0.219 227 0.463 0.114 Moldova250 0.414 0.045 252 0.364 0.088 Fédération de Russie242 0.366 0.068 248 0.287 0.080 Serbie-et-Monténégro228 0.408 0.092 235 0.391 0.121 LERY de Macédoine243 0.512 0.302 250 0.323 0.126 Ukraine
258 0.190 0.093 258 0.169 0.112 Économies développées : Amérique
257 0.223 0.092 256 0.219 0.082 Canada160 0.450 0.084 169 0.533 0.187 Groenland258 0.211 0.099 258 0.184 0.121 États-Unis
256 0.286 0.076 257 0.276 0.143 Économies développées : Asie
246 0.261 0.146 245 0.265 0.182 Israël255 0.305 0.079 257 0.293 0.149 Japon
261 0.093 0.047 260 0.108 0.069 Économies développées : Europe
176 0.523 0.094 191 0.503 0.098 Andorre256 0.216 0.052 257 0.230 0.064 Autriche
_ _ _ 257 0.281 0.099 Belgique258 0.236 0.067 _ _ _ Belgique-Luxembourg235 0.443 0.181 244 0.312 0.071 Bulgarie229 0.351 0.095 226 0.355 0.159 Chypre254 0.245 0.043 255 0.254 0.063 République tchèque252 0.230 0.046 253 0.246 0.055 Danemark236 0.371 0.077 243 0.341 0.138 Estonie169 0.422 0.122 191 0.441 0.162 Îles Féroé258 0.199 0.054 258 0.211 0.091 Finlande259 0.135 0.048 258 0.145 0.076 France257 0.155 0.050 257 0.147 0.070 Allemagne252 0.252 0.055 253 0.274 0.123 Grèce244 0.269 0.052 251 0.267 0.103 Hongrie220 0.320 0.069 228 0.412 0.106 Islande253 0.305 0.113 253 0.313 0.117 Irlande255 0.198 0.059 257 0.207 0.092 Italie230 0.414 0.108 245 0.354 0.091 Lettonie239 0.372 0.085 250 0.317 0.157 Lituanie
_ _ _ 240 0.400 0.108 Luxembourg
Pour les sources et les notes, se reporter à la fin du tableau.
Imports - Importations
Régions,pays ou territoires
1995 2006
4.1.1 Indices de concentration et de diversification des exportations et importations des pays et des régions géographiques
199
4
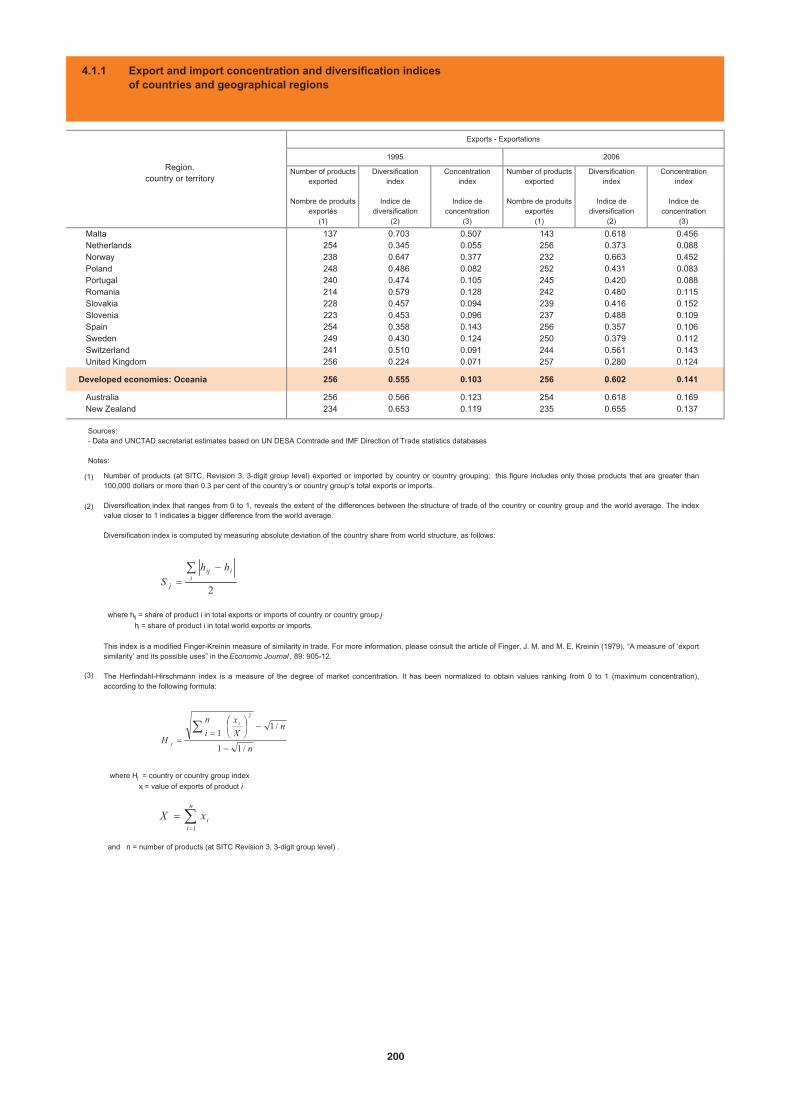
Number of products exported
Nombre de produits exportés
Diversificationindex
Indice de diversification
Concentrationindex
Indice de concentration
Number of products exported
Nombre de produits exportés
Diversificationindex
Indice de diversification
Concentrationindex
Indice de concentration
(1) (2) (3) (1) (2) (3)
Malta 137 0.703 0.507 143 0.618 0.456 Netherlands 254 0.345 0.055 256 0.373 0.088 Norway 238 0.647 0.377 232 0.663 0.452 Poland 248 0.486 0.082 252 0.431 0.083 Portugal 240 0.474 0.105 245 0.420 0.088 Romania 214 0.579 0.128 242 0.480 0.115 Slovakia 228 0.457 0.094 239 0.416 0.152 Slovenia 223 0.453 0.096 237 0.488 0.109 Spain 254 0.358 0.143 256 0.357 0.106 Sweden 249 0.430 0.124 250 0.379 0.112 Switzerland 241 0.510 0.091 244 0.561 0.143 United Kingdom 256 0.224 0.071 257 0.280 0.124
Developed economies: Oceania 256 0.555 0.103 256 0.602 0.141
Australia 256 0.566 0.123 254 0.618 0.169 New Zealand 234 0.653 0.119 235 0.655 0.137
Region,country or territory
Exports - Exportations
1995 2006
4.1.1 Export and import concentration and diversification indicesof countries and geographical regions
(1)
(2)
(3)
Number of products (at SITC, Revision 3, 3-digit group level) exported or imported by country or country grouping; this figure includes only those products that are greater than100,000 dollars or more than 0.3 per cent of the country’s or country group’s total exports or imports.
Diversification index that ranges from 0 to 1, reveals the extent of the differences between the structure of trade of the country or country group and the world average. The indexvalue closer to 1 indicates a bigger difference from the world average.
Diversification index is computed by measuring absolute deviation of the country share from world structure, as follows:
where hij = share of product i in total exports or imports of country or country group j
hi = share of product i in total world exports or imports.
This index is a modified Finger-Kreinin measure of similarity in trade. For more information, please consult the article of Finger, J. M. and M. E. Kreinin (1979), “A measure of ‘exportsimilarity’ and its possible uses” in the Economic Journal , 89: 905-12.
The Herfindahl-Hirschmann index is a measure of the degree of market concentration. It has been normalized to obtain values ranking from 0 to 1 (maximum concentration),according to the following formula:
where Hj = country or country group index
xi = value of exports of product i
and n = number of products (at SITC Revision 3, 3-digit group level) .
Sources:- Data and UNCTAD secretariat estimates based on UN DESA Comtrade and IMF Direction of Trade statistics databases
Notes:
2i
iij
j
hh
S
n
i
ixX1
n
nX
x
i
n
H
i
j/11
/11
2
200
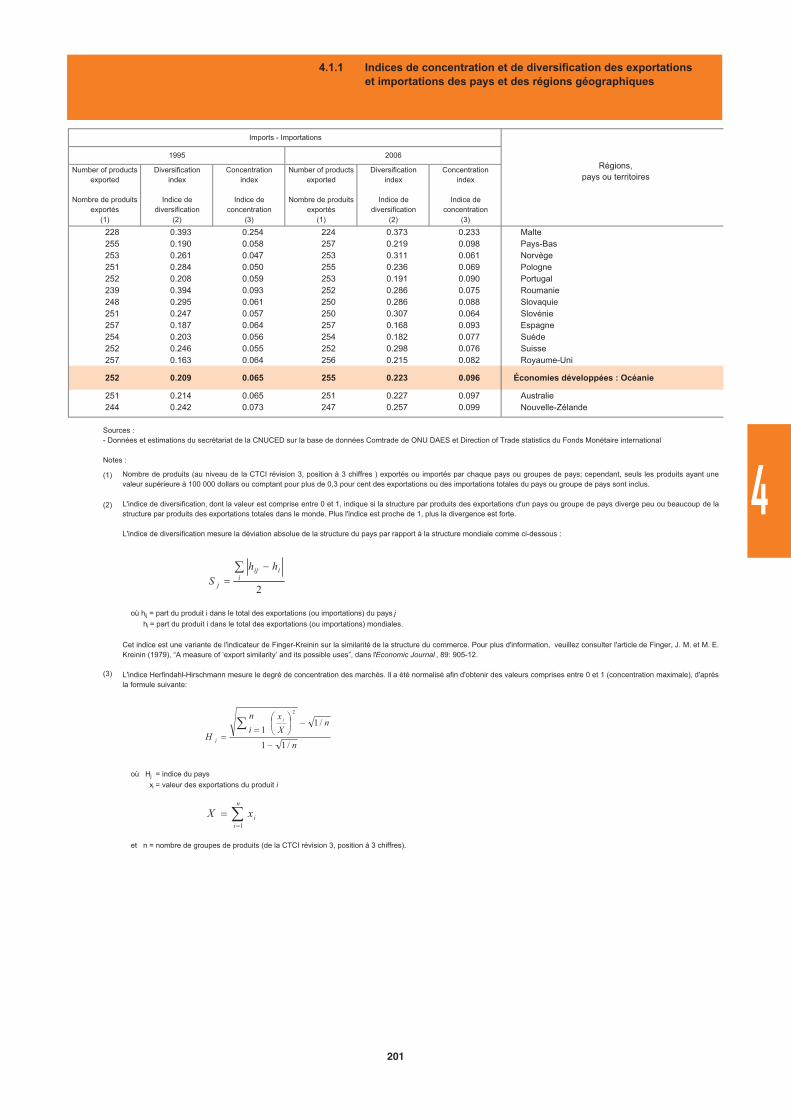
Number of products exported
Nombre de produits exportés
Diversificationindex
Indice de diversification
Concentrationindex
Indice de concentration
Number of products exported
Nombre de produits exportés
Diversificationindex
Indice de diversification
Concentrationindex
Indice de concentration
(1) (2) (3) (1) (2) (3)
228 0.393 0.254 224 0.373 0.233 Malte255 0.190 0.058 257 0.219 0.098 Pays-Bas253 0.261 0.047 253 0.311 0.061 Norvège251 0.284 0.050 255 0.236 0.069 Pologne252 0.208 0.059 253 0.191 0.090 Portugal239 0.394 0.093 252 0.286 0.075 Roumanie248 0.295 0.061 250 0.286 0.088 Slovaquie251 0.247 0.057 250 0.307 0.064 Slovénie257 0.187 0.064 257 0.168 0.093 Espagne254 0.203 0.056 254 0.182 0.077 Suède252 0.246 0.055 252 0.298 0.076 Suisse257 0.163 0.064 256 0.215 0.082 Royaume-Uni
252 0.209 0.065 255 0.223 0.096 Économies développées : Océanie
251 0.214 0.065 251 0.227 0.097 Australie244 0.242 0.073 247 0.257 0.099 Nouvelle-Zélande
Imports - Importations
Régions,pays ou territoires
1995 2006
4.1.1 Indices de concentration et de diversification des exportations et importations des pays et des régions géographiques
Nombre de produits (au niveau de la CTCI révision 3, position à 3 chiffres ) exportés ou importés par chaque pays ou groupes de pays; cependant, seuls les produits ayant unevaleur supérieure à 100 000 dollars ou comptant pour plus de 0,3 pour cent des exportations ou des importations totales du pays ou groupe de pays sont inclus.
L'indice de diversification, dont la valeur est comprise entre 0 et 1, indique si la structure par produits des exportations d'un pays ou groupe de pays diverge peu ou beaucoup de lastructure par produits des exportations totales dans le monde. Plus l'indice est proche de 1, plus la divergence est forte.
L'indice de diversification mesure la déviation absolue de la structure du pays par rapport à la structure mondiale comme ci-dessous :
où hij = part du produit i dans le total des exportations (ou importations) du pays j
hi = part du produit i dans le total des exportations (ou importations) mondiales.
Cet indice est une variante de l'indicateur de Finger-Kreinin sur la similarité de la structure du commerce. Pour plus d'information, veuillez consulter l'article de Finger, J. M. et M. E.Kreinin (1979), “A measure of ‘export similarity’ and its possible uses”, dans l'Economic Journal , 89: 905-12.
L'indice Herfindahl-Hirschmann mesure le degré de concentration des marchés. Il a été normalisé afin d'obtenir des valeurs comprises entre 0 et 1 (concentration maximale), d'aprèsla formule suivante:
où Hj = indice du pays
xi = valeur des exportations du produit i
et n = nombre de groupes de produits (de la CTCI révision 3, position à 3 chiffres).
2i
iij
j
hh
S
n
i
ixX1
n
nX
x
i
n
H
i
j/11
/11
2
(1)
(2)
(3)
Sources : - Données et estimations du secrétariat de la CNUCED sur la base de données Comtrade de ONU DAES et Direction of Trade statistics du Fonds Monétaire international
Notes :
201
4
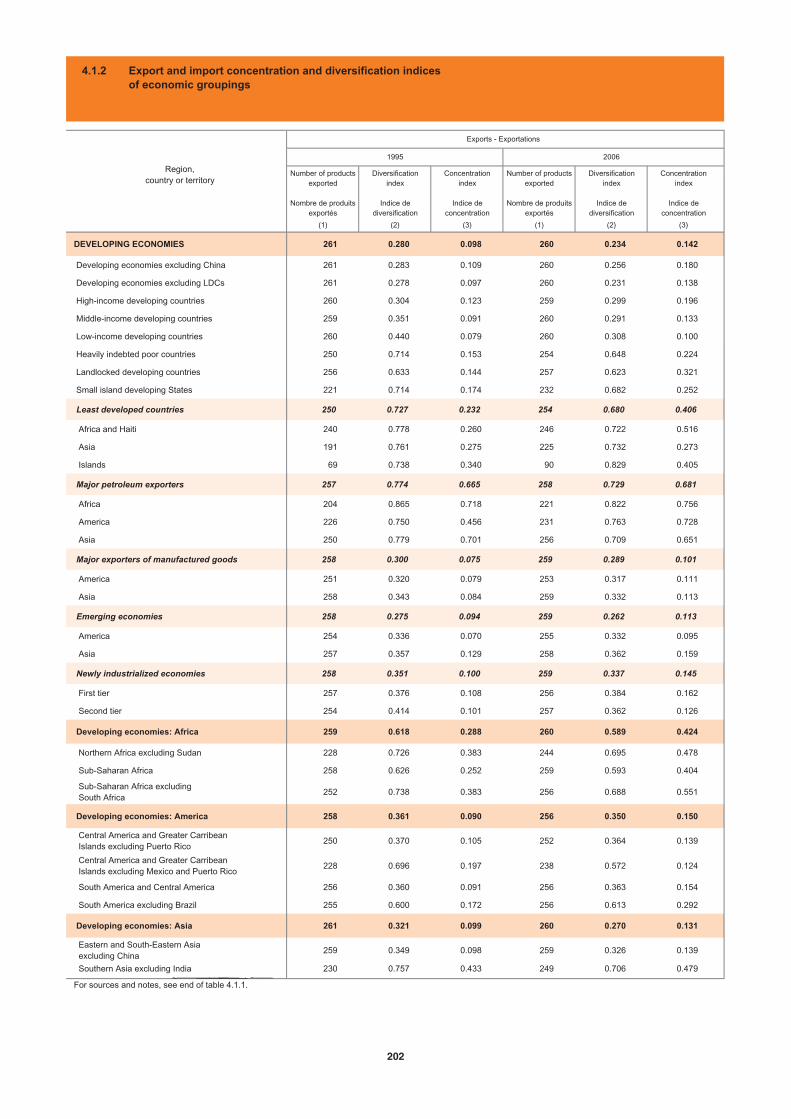
Number of products exported
Nombre de produits exportés
Diversificationindex
Indice de diversification
Concentrationindex
Indice de concentration
Number of products exported
Nombre de produits exportés
Diversificationindex
Indice de diversification
Concentrationindex
Indice de concentration
(1) (2) (3) (1) (2) (3)
DEVELOPING ECONOMIES 261 0.280 0.098 260 0.234 0.142
Developing economies excluding China 261 0.283 0.109 260 0.256 0.180
Developing economies excluding LDCs 261 0.278 0.097 260 0.231 0.138
High-income developing countries 260 0.304 0.123 259 0.299 0.196
Middle-income developing countries 259 0.351 0.091 260 0.291 0.133
Low-income developing countries 260 0.440 0.079 260 0.308 0.100
Heavily indebted poor countries 250 0.714 0.153 254 0.648 0.224
Landlocked developing countries 256 0.633 0.144 257 0.623 0.321
Small island developing States 221 0.714 0.174 232 0.682 0.252
Least developed countries 250 0.727 0.232 254 0.680 0.406
Africa and Haiti 240 0.778 0.260 246 0.722 0.516
Asia 191 0.761 0.275 225 0.732 0.273
Islands 69 0.738 0.340 90 0.829 0.405
Major petroleum exporters 257 0.774 0.665 258 0.729 0.681
Africa 204 0.865 0.718 221 0.822 0.756
America 226 0.750 0.456 231 0.763 0.728
Asia 250 0.779 0.701 256 0.709 0.651
Major exporters of manufactured goods 258 0.300 0.075 259 0.289 0.101
America 251 0.320 0.079 253 0.317 0.111
Asia 258 0.343 0.084 259 0.332 0.113
Emerging economies 258 0.275 0.094 259 0.262 0.113
America 254 0.336 0.070 255 0.332 0.095
Asia 257 0.357 0.129 258 0.362 0.159
Newly industrialized economies 258 0.351 0.100 259 0.337 0.145
First tier 257 0.376 0.108 256 0.384 0.162
Second tier 254 0.414 0.101 257 0.362 0.126
Developing economies: Africa 259 0.618 0.288 260 0.589 0.424
Northern Africa excluding Sudan 228 0.726 0.383 244 0.695 0.478
Sub-Saharan Africa 258 0.626 0.252 259 0.593 0.404
Sub-Saharan Africa excluding South Africa
252 0.738 0.383 256 0.688 0.551
Developing economies: America 258 0.361 0.090 256 0.350 0.150
Central America and Greater Carribean Islands excluding Puerto Rico
250 0.370 0.105 252 0.364 0.139
Central America and Greater Carribean Islands excluding Mexico and Puerto Rico
228 0.696 0.197 238 0.572 0.124
South America and Central America 256 0.360 0.091 256 0.363 0.154
South America excluding Brazil 255 0.600 0.172 256 0.613 0.292
Developing economies: Asia 261 0.321 0.099 260 0.270 0.131
Eastern and South-Eastern Asia excluding China
259 0.349 0.098 259 0.326 0.139
Southern Asia excluding India 230 0.757 0.433 249 0.706 0.479
For sources and notes, see end of table 4.1.1.
Region,country or territory
1995 2006
Exports - Exportations
4.1.2 Export and import concentration and diversification indicesof economic groupings
2ijS i ixX 1 nXiH j /111
202
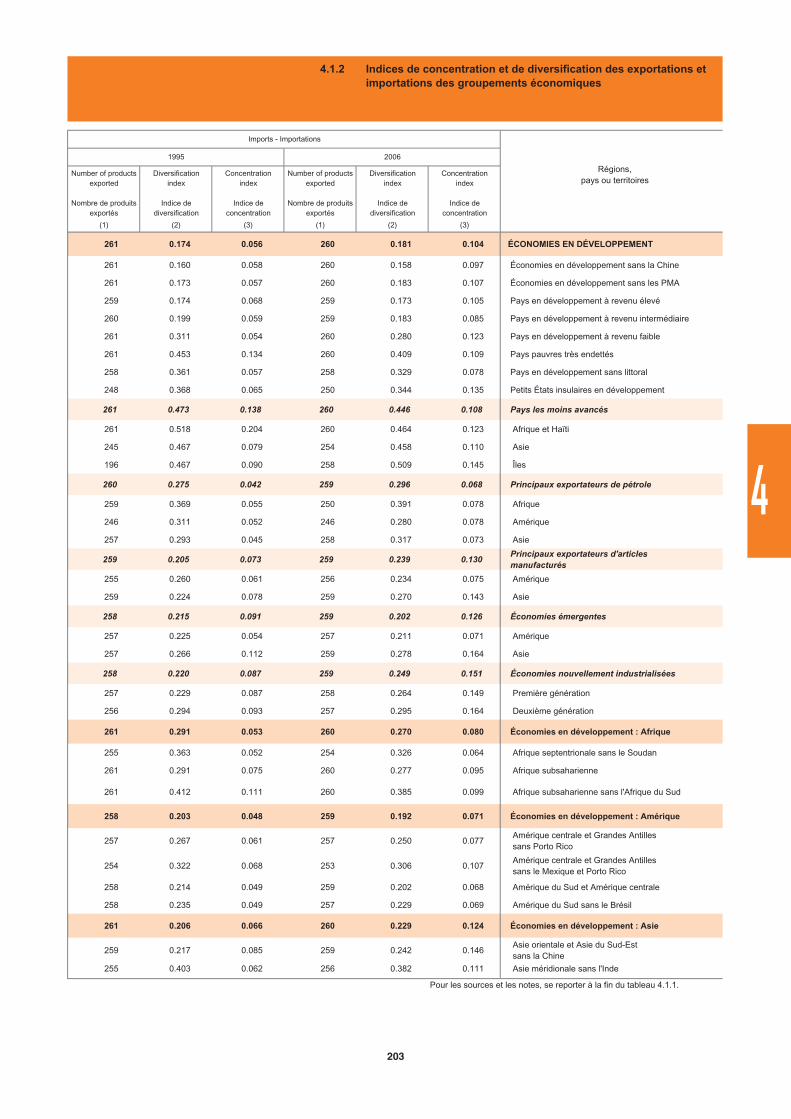
Number of products exported
Nombre de produits exportés
Diversificationindex
Indice de diversification
Concentrationindex
Indice de concentration
Number of products exported
Nombre de produits exportés
Diversificationindex
Indice de diversification
Concentrationindex
Indice de concentration
(1) (2) (3) (1) (2) (3)
261 0.174 0.056 260 0.181 0.104 ÉCONOMIES EN DÉVELOPPEMENT
261 0.160 0.058 260 0.158 0.097 Économies en développement sans la Chine
261 0.173 0.057 260 0.183 0.107 Économies en développement sans les PMA
259 0.174 0.068 259 0.173 0.105 Pays en développement à revenu élevé
260 0.199 0.059 259 0.183 0.085 Pays en développement à revenu intermédiaire
261 0.311 0.054 260 0.280 0.123 Pays en développement à revenu faible
261 0.453 0.134 260 0.409 0.109 Pays pauvres très endettés
258 0.361 0.057 258 0.329 0.078 Pays en développement sans littoral
248 0.368 0.065 250 0.344 0.135 Petits États insulaires en développement
261 0.473 0.138 260 0.446 0.108 Pays les moins avancés
261 0.518 0.204 260 0.464 0.123 Afrique et Haïti
245 0.467 0.079 254 0.458 0.110 Asie
196 0.467 0.090 258 0.509 0.145 Îles
260 0.275 0.042 259 0.296 0.068 Principaux exportateurs de pétrole
259 0.369 0.055 250 0.391 0.078 Afrique
246 0.311 0.052 246 0.280 0.078 Amérique
257 0.293 0.045 258 0.317 0.073 Asie
259 0.205 0.073 259 0.239 0.130Principaux exportateurs d'articlesmanufacturés
255 0.260 0.061 256 0.234 0.075 Amérique
259 0.224 0.078 259 0.270 0.143 Asie
258 0.215 0.091 259 0.202 0.126 Économies émergentes
257 0.225 0.054 257 0.211 0.071 Amérique
257 0.266 0.112 259 0.278 0.164 Asie
258 0.220 0.087 259 0.249 0.151 Économies nouvellement industrialisées
257 0.229 0.087 258 0.264 0.149 Première génération
256 0.294 0.093 257 0.295 0.164 Deuxième génération
261 0.291 0.053 260 0.270 0.080 Économies en développement : Afrique
255 0.363 0.052 254 0.326 0.064 Afrique septentrionale sans le Soudan
261 0.291 0.075 260 0.277 0.095 Afrique subsaharienne
261 0.412 0.111 260 0.385 0.099 Afrique subsaharienne sans l'Afrique du Sud
258 0.203 0.048 259 0.192 0.071 Économies en développement : Amérique
257 0.267 0.061 257 0.250 0.077 Amérique centrale et Grandes Antilles sans Porto Rico
254 0.322 0.068 253 0.306 0.107 Amérique centrale et Grandes Antilles sans le Mexique et Porto Rico
258 0.214 0.049 259 0.202 0.068 Amérique du Sud et Amérique centrale
258 0.235 0.049 257 0.229 0.069 Amérique du Sud sans le Brésil
261 0.206 0.066 260 0.229 0.124 Économies en développement : Asie
259 0.217 0.085 259 0.242 0.146 Asie orientale et Asie du Sud-Est sans la Chine
255 0.403 0.062 256 0.382 0.111 Asie méridionale sans l'Inde
Pour les sources et les notes, se reporter à la fin du tableau 4.1.1.
Régions,pays ou territoires
2006
Imports - Importations
1995
4.1.2 Indices de concentration et de diversification des exportations et importations des groupements économiques
203
4
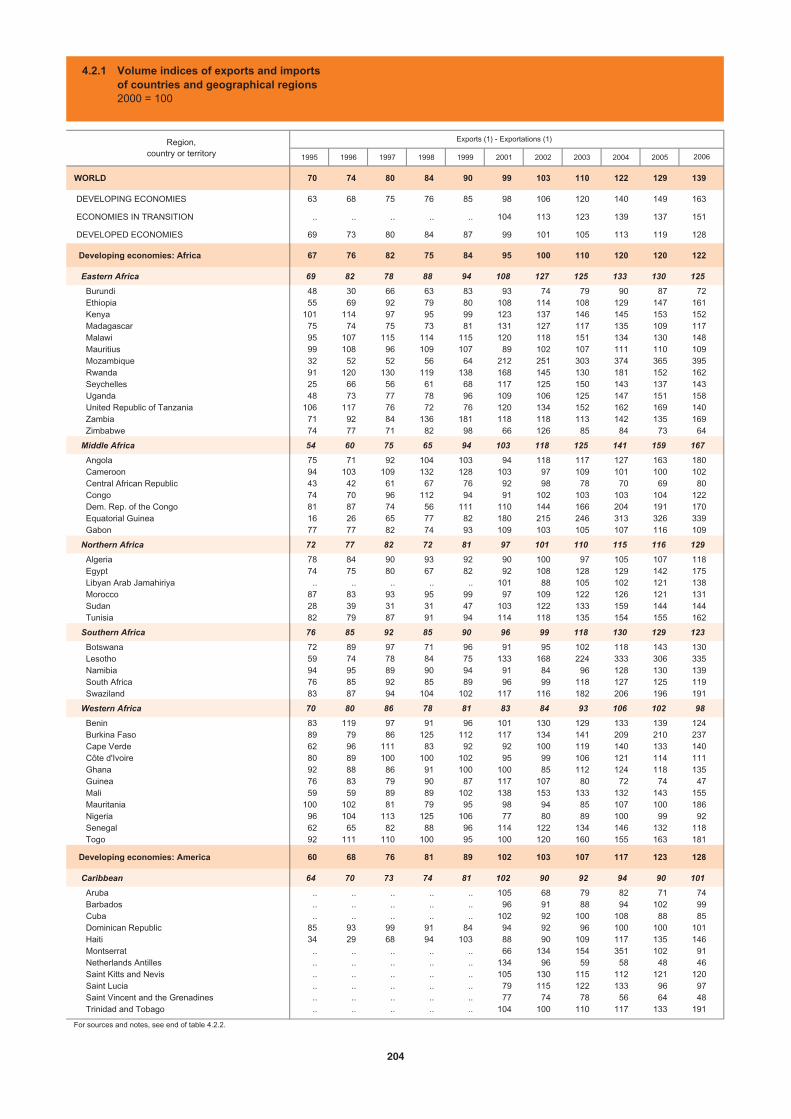
1995 1996 1997 1998 1999 2001 2002 2003 2004 2005
WORLD 70 74 80 84 90 99 103 110 122 129 139
DEVELOPING ECONOMIES 63 68 75 76 85 98 106 120 140 149 163
ECONOMIES IN TRANSITION .. .. .. .. .. 104 113 123 139 137 151
DEVELOPED ECONOMIES 69 73 80 84 87 99 101 105 113 119 128
Developing economies: Africa 67 76 82 75 84 95 100 110 120 120 122
Eastern Africa 69 82 78 88 94 108 127 125 133 130 125
Burundi 48 30 66 63 83 93 74 79 90 87 72 Ethiopia 55 69 92 79 80 108 114 108 129 147 161 Kenya 101 114 97 95 99 123 137 146 145 153 152 Madagascar 75 74 75 73 81 131 127 117 135 109 117 Malawi 95 107 115 114 115 120 118 151 134 130 148 Mauritius 99 108 96 109 107 89 102 107 111 110 109 Mozambique 32 52 52 56 64 212 251 303 374 365 395 Rwanda 91 120 130 119 138 168 145 130 181 152 162 Seychelles 25 66 56 61 68 117 125 150 143 137 143 Uganda 48 73 77 78 96 109 106 125 147 151 158 United Republic of Tanzania 106 117 76 72 76 120 134 152 162 169 140 Zambia 71 92 84 136 181 118 118 113 142 135 169 Zimbabwe 74 77 71 82 98 66 126 85 84 73 64
Middle Africa 54 60 75 65 94 103 118 125 141 159 167
Angola 75 71 92 104 103 94 118 117 127 163 180 Cameroon 94 103 109 132 128 103 97 109 101 100 102 Central African Republic 43 42 61 67 76 92 98 78 70 69 80 Congo 74 70 96 112 94 91 102 103 103 104 122 Dem. Rep. of the Congo 81 87 74 56 111 110 144 166 204 191 170 Equatorial Guinea 16 26 65 77 82 180 215 246 313 326 339 Gabon 77 77 82 74 93 109 103 105 107 116 109
Northern Africa 72 77 82 72 81 97 101 110 115 116 129
Algeria 78 84 90 93 92 90 100 97 105 107 118 Egypt 74 75 80 67 82 92 108 128 129 142 175 Libyan Arab Jamahiriya .. .. .. .. .. 101 88 105 102 121 138 Morocco 87 83 93 95 99 97 109 122 126 121 131 Sudan 28 39 31 31 47 103 122 133 159 144 144 Tunisia 82 79 87 91 94 114 118 135 154 155 162
Southern Africa 76 85 92 85 90 96 99 118 130 129 123
Botswana 72 89 97 71 96 91 95 102 118 143 130 Lesotho 59 74 78 84 75 133 168 224 333 306 335 Namibia 94 95 89 90 94 91 84 96 128 130 139 South Africa 76 85 92 85 89 96 99 118 127 125 119 Swaziland 83 87 94 104 102 117 116 182 206 196 191
Western Africa 70 80 86 78 81 83 84 93 106 102 98
Benin 83 119 97 91 96 101 130 129 133 139 124 Burkina Faso 89 79 86 125 112 117 134 141 209 210 237 Cape Verde 62 96 111 83 92 92 100 119 140 133 140 Côte d'Ivoire 80 89 100 100 102 95 99 106 121 114 111 Ghana 92 88 86 91 100 100 85 112 124 118 135 Guinea 76 83 79 90 87 117 107 80 72 74 47 Mali 59 59 89 89 102 138 153 133 132 143 155 Mauritania 100 102 81 79 95 98 94 85 107 100 186 Nigeria 96 104 113 125 106 77 80 89 100 99 92 Senegal 62 65 82 88 96 114 122 134 146 132 118 Togo 92 111 110 100 95 100 120 160 155 163 181
Developing economies: America 60 68 76 81 89 102 103 107 117 123 128
Caribbean 64 70 73 74 81 102 90 92 94 90 101
Aruba .. .. .. .. .. 105 68 79 82 71 74 Barbados .. .. .. .. .. 96 91 88 94 102 99 Cuba .. .. .. .. .. 102 92 100 108 88 85 Dominican Republic 85 93 99 91 84 94 92 96 100 100 101 Haiti 34 29 68 94 103 88 90 109 117 135 146 Montserrat .. .. .. .. .. 66 134 154 351 102 91 Netherlands Antilles .. .. .. .. .. 134 96 59 58 48 46 Saint Kitts and Nevis .. .. .. .. .. 105 130 115 112 121 120 Saint Lucia .. .. .. .. .. 79 115 122 133 96 97 Saint Vincent and the Grenadines .. .. .. .. .. 77 74 78 56 64 48 Trinidad and Tobago .. .. .. .. .. 104 100 110 117 133 191
For sources and notes, see end of table 4.2.2.
Region,country or territory
Exports (1) - Exportations (1)
2006
4.2.1 Volume indices of exports and imports of countries and geographical regions2000 = 100
204
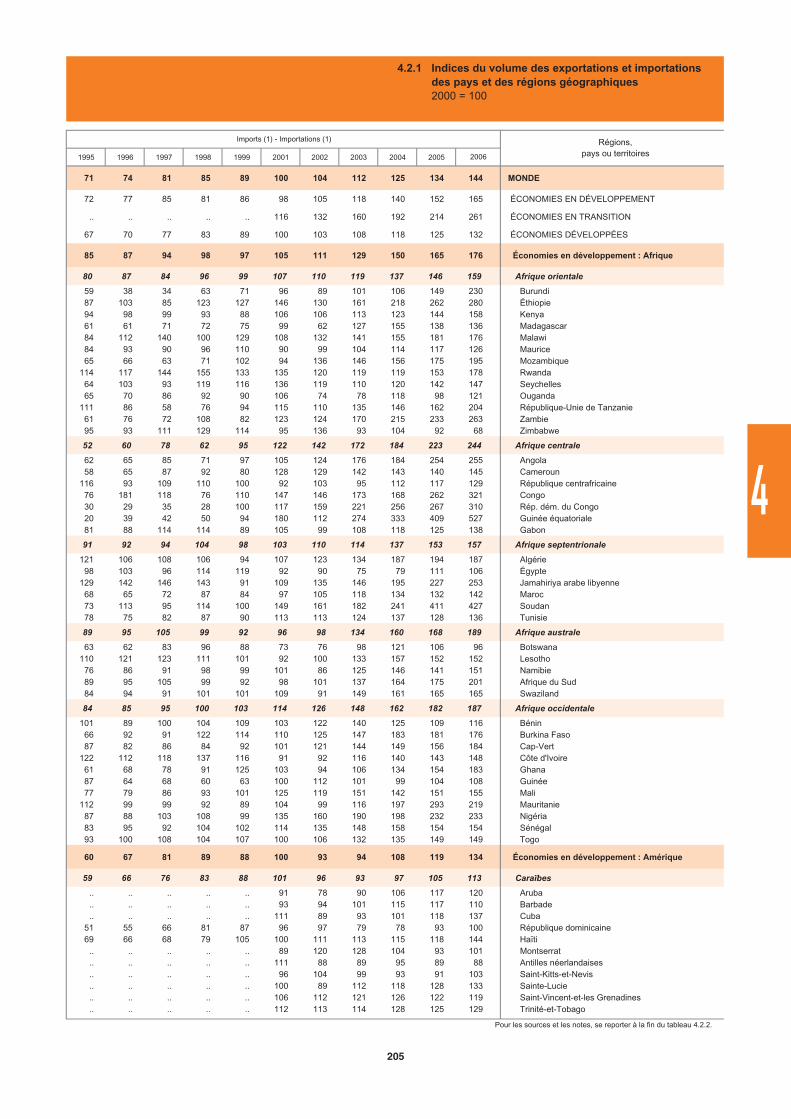
1995 1996 1997 1998 1999 2001 2002 2003 2004 2005
71 74 81 85 89 100 104 112 125 134 144 MONDE
72 77 85 81 86 98 105 118 140 152 165 ÉCONOMIES EN DÉVELOPPEMENT
.. .. .. .. .. 116 132 160 192 214 261 ÉCONOMIES EN TRANSITION
67 70 77 83 89 100 103 108 118 125 132 ÉCONOMIES DÉVELOPPÉES
85 87 94 98 97 105 111 129 150 165 176 Économies en développement : Afrique
80 87 84 96 99 107 110 119 137 146 159 Afrique orientale
59 38 34 63 71 96 89 101 106 149 230 Burundi87 103 85 123 127 146 130 161 218 262 280 Éthiopie94 98 99 93 88 106 106 113 123 144 158 Kenya61 61 71 72 75 99 62 127 155 138 136 Madagascar84 112 140 100 129 108 132 141 155 181 176 Malawi84 93 90 96 110 90 99 104 114 117 126 Maurice65 66 63 71 102 94 136 146 156 175 195 Mozambique
114 117 144 155 133 135 120 119 119 153 178 Rwanda64 103 93 119 116 136 119 110 120 142 147 Seychelles65 70 86 92 90 106 74 78 118 98 121 Ouganda
111 86 58 76 94 115 110 135 146 162 204 République-Unie de Tanzanie61 76 72 108 82 123 124 170 215 233 263 Zambie95 93 111 129 114 95 136 93 104 92 68 Zimbabwe
52 60 78 62 95 122 142 172 184 223 244 Afrique centrale
62 65 85 71 97 105 124 176 184 254 255 Angola58 65 87 92 80 128 129 142 143 140 145 Cameroun
116 93 109 110 100 92 103 95 112 117 129 République centrafricaine76 181 118 76 110 147 146 173 168 262 321 Congo30 29 35 28 100 117 159 221 256 267 310 Rép. dém. du Congo20 39 42 50 94 180 112 274 333 409 527 Guinée équatoriale81 88 114 114 89 105 99 108 118 125 138 Gabon
91 92 94 104 98 103 110 114 137 153 157 Afrique septentrionale
121 106 108 106 94 107 123 134 187 194 187 Algérie98 103 96 114 119 92 90 75 79 111 106 Égypte
129 142 146 143 91 109 135 146 195 227 253 Jamahiriya arabe libyenne68 65 72 87 84 97 105 118 134 132 142 Maroc73 113 95 114 100 149 161 182 241 411 427 Soudan78 75 82 87 90 113 113 124 137 128 136 Tunisie
89 95 105 99 92 96 98 134 160 168 189 Afrique australe
63 62 83 96 88 73 76 98 121 106 96 Botswana110 121 123 111 101 92 100 133 157 152 152 Lesotho
76 86 91 98 99 101 86 125 146 141 151 Namibie89 95 105 99 92 98 101 137 164 175 201 Afrique du Sud84 94 91 101 101 109 91 149 161 165 165 Swaziland
84 85 95 100 103 114 126 148 162 182 187 Afrique occidentale
101 89 100 104 109 103 122 140 125 109 116 Bénin66 92 91 122 114 110 125 147 183 181 176 Burkina Faso87 82 86 84 92 101 121 144 149 156 184 Cap-Vert
122 112 118 137 116 91 92 116 140 143 148 Côte d'Ivoire61 68 78 91 125 103 94 106 134 154 183 Ghana87 64 68 60 63 100 112 101 99 104 108 Guinée77 79 86 93 101 125 119 151 142 151 155 Mali
112 99 99 92 89 104 99 116 197 293 219 Mauritanie87 88 103 108 99 135 160 190 198 232 233 Nigéria83 95 92 104 102 114 135 148 158 154 154 Sénégal93 100 108 104 107 100 106 132 135 149 149 Togo
60 67 81 89 88 100 93 94 108 119 134 Économies en développement : Amérique
59 66 76 83 88 101 96 93 97 105 113 Caraïbes
.. .. .. .. .. 91 78 90 106 117 120 Aruba
.. .. .. .. .. 93 94 101 115 117 110 Barbade
.. .. .. .. .. 111 89 93 101 118 137 Cuba51 55 66 81 87 96 97 79 78 93 100 République dominicaine69 66 68 79 105 100 111 113 115 118 144 Haïti
.. .. .. .. .. 89 120 128 104 93 101 Montserrat
.. .. .. .. .. 111 88 89 95 89 88 Antilles néerlandaises
.. .. .. .. .. 96 104 99 93 91 103 Saint-Kitts-et-Nevis
.. .. .. .. .. 100 89 112 118 128 133 Sainte-Lucie
.. .. .. .. .. 106 112 121 126 122 119 Saint-Vincent-et-les Grenadines
.. .. .. .. .. 112 113 114 128 125 129 Trinité-et-Tobago
Pour les sources et les notes, se reporter à la fin du tableau 4.2.2.
Régions,pays ou territoires
Imports (1) - Importations (1)
2006
4.2.1 Indices du volume des exportations et importations des pays et des régions géographiques2000 = 100
205
4
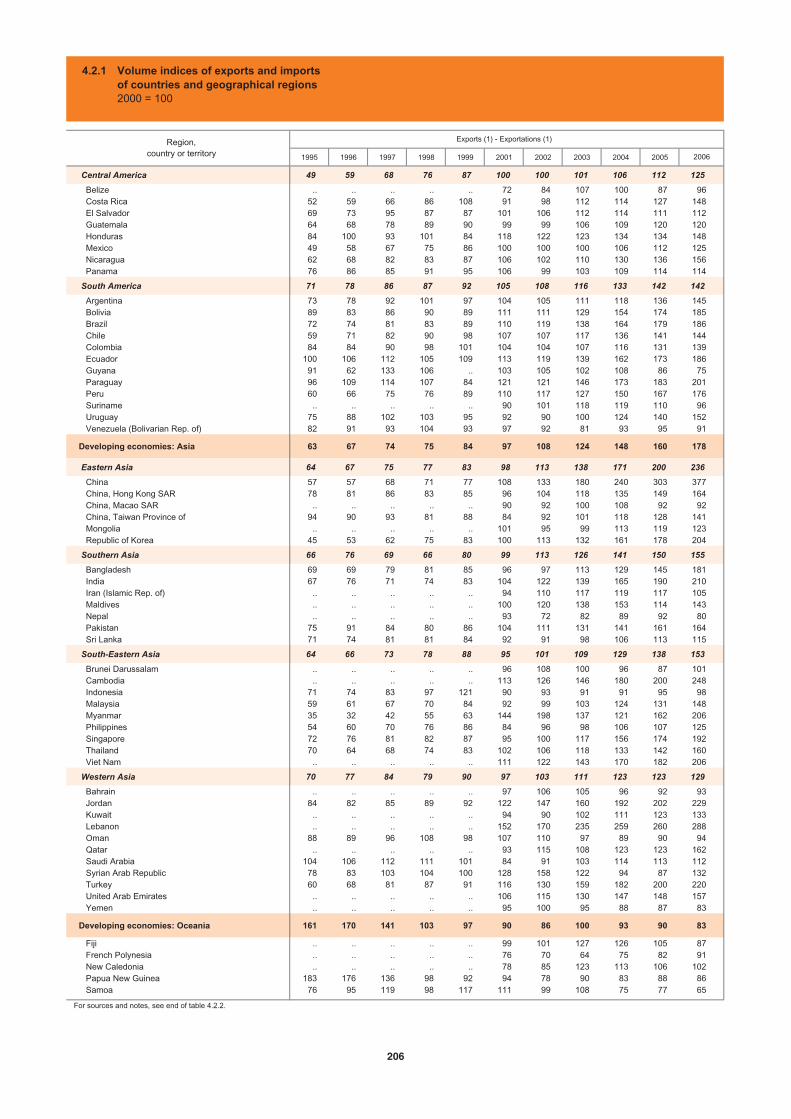
1995 1996 1997 1998 1999 2001 2002 2003 2004 2005
Central America 49 59 68 76 87 100 100 101 106 112 125
Belize .. .. .. .. .. 72 84 107 100 87 96 Costa Rica 52 59 66 86 108 91 98 112 114 127 148 El Salvador 69 73 95 87 87 101 106 112 114 111 112 Guatemala 64 68 78 89 90 99 99 106 109 120 120 Honduras 84 100 93 101 84 118 122 123 134 134 148 Mexico 49 58 67 75 86 100 100 100 106 112 125 Nicaragua 62 68 82 83 87 106 102 110 130 136 156 Panama 76 86 85 91 95 106 99 103 109 114 114
South America 71 78 86 87 92 105 108 116 133 142 142
Argentina 73 78 92 101 97 104 105 111 118 136 145 Bolivia 89 83 86 90 89 111 111 129 154 174 185 Brazil 72 74 81 83 89 110 119 138 164 179 186 Chile 59 71 82 90 98 107 107 117 136 141 144 Colombia 84 84 90 98 101 104 104 107 116 131 139 Ecuador 100 106 112 105 109 113 119 139 162 173 186 Guyana 91 62 133 106 .. 103 105 102 108 86 75 Paraguay 96 109 114 107 84 121 121 146 173 183 201 Peru 60 66 75 76 89 110 117 127 150 167 176 Suriname .. .. .. .. .. 90 101 118 119 110 96 Uruguay 75 88 102 103 95 92 90 100 124 140 152 Venezuela (Bolivarian Rep. of) 82 91 93 104 93 97 92 81 93 95 91
Developing economies: Asia 63 67 74 75 84 97 108 124 148 160 178
Eastern Asia 64 67 75 77 83 98 113 138 171 200 236
China 57 57 68 71 77 108 133 180 240 303 377 China, Hong Kong SAR 78 81 86 83 85 96 104 118 135 149 164 China, Macao SAR .. .. .. .. .. 90 92 100 108 92 92 China, Taiwan Province of 94 90 93 81 88 84 92 101 118 128 141 Mongolia .. .. .. .. .. 101 95 99 113 119 123 Republic of Korea 45 53 62 75 83 100 113 132 161 178 204
Southern Asia 66 76 69 66 80 99 113 126 141 150 155
Bangladesh 69 69 79 81 85 96 97 113 129 145 181 India 67 76 71 74 83 104 122 139 165 190 210 Iran (Islamic Rep. of) .. .. .. .. .. 94 110 117 119 117 105 Maldives .. .. .. .. .. 100 120 138 153 114 143 Nepal .. .. .. .. .. 93 72 82 89 92 80 Pakistan 75 91 84 80 86 104 111 131 141 161 164 Sri Lanka 71 74 81 81 84 92 91 98 106 113 115
South-Eastern Asia 64 66 73 78 88 95 101 109 129 138 153
Brunei Darussalam .. .. .. .. .. 96 108 100 96 87 101 Cambodia .. .. .. .. .. 113 126 146 180 200 248 Indonesia 71 74 83 97 121 90 93 91 91 95 98 Malaysia 59 61 67 70 84 92 99 103 124 131 148 Myanmar 35 32 42 55 63 144 198 137 121 162 206 Philippines 54 60 70 76 86 84 96 98 106 107 125 Singapore 72 76 81 82 87 95 100 117 156 174 192 Thailand 70 64 68 74 83 102 106 118 133 142 160 Viet Nam .. .. .. .. .. 111 122 143 170 182 206
Western Asia 70 77 84 79 90 97 103 111 123 123 129
Bahrain .. .. .. .. .. 97 106 105 96 92 93 Jordan 84 82 85 89 92 122 147 160 192 202 229 Kuwait .. .. .. .. .. 94 90 102 111 123 133 Lebanon .. .. .. .. .. 152 170 235 259 260 288 Oman 88 89 96 108 98 107 110 97 89 90 94 Qatar .. .. .. .. .. 93 115 108 123 123 162 Saudi Arabia 104 106 112 111 101 84 91 103 114 113 112 Syrian Arab Republic 78 83 103 104 100 128 158 122 94 87 132 Turkey 60 68 81 87 91 116 130 159 182 200 220 United Arab Emirates .. .. .. .. .. 106 115 130 147 148 157 Yemen .. .. .. .. .. 95 100 95 88 87 83
Developing economies: Oceania 161 170 141 103 97 90 86 100 93 90 83
Fiji .. .. .. .. .. 99 101 127 126 105 87 French Polynesia .. .. .. .. .. 76 70 64 75 82 91 New Caledonia .. .. .. .. .. 78 85 123 113 106 102 Papua New Guinea 183 176 136 98 92 94 78 90 83 88 86 Samoa 76 95 119 98 117 111 99 108 75 77 65
For sources and notes, see end of table 4.2.2.
Region,country or territory
Exports (1) - Exportations (1)
2006
4.2.1 Volume indices of exports and imports of countries and geographical regions2000 = 100
206
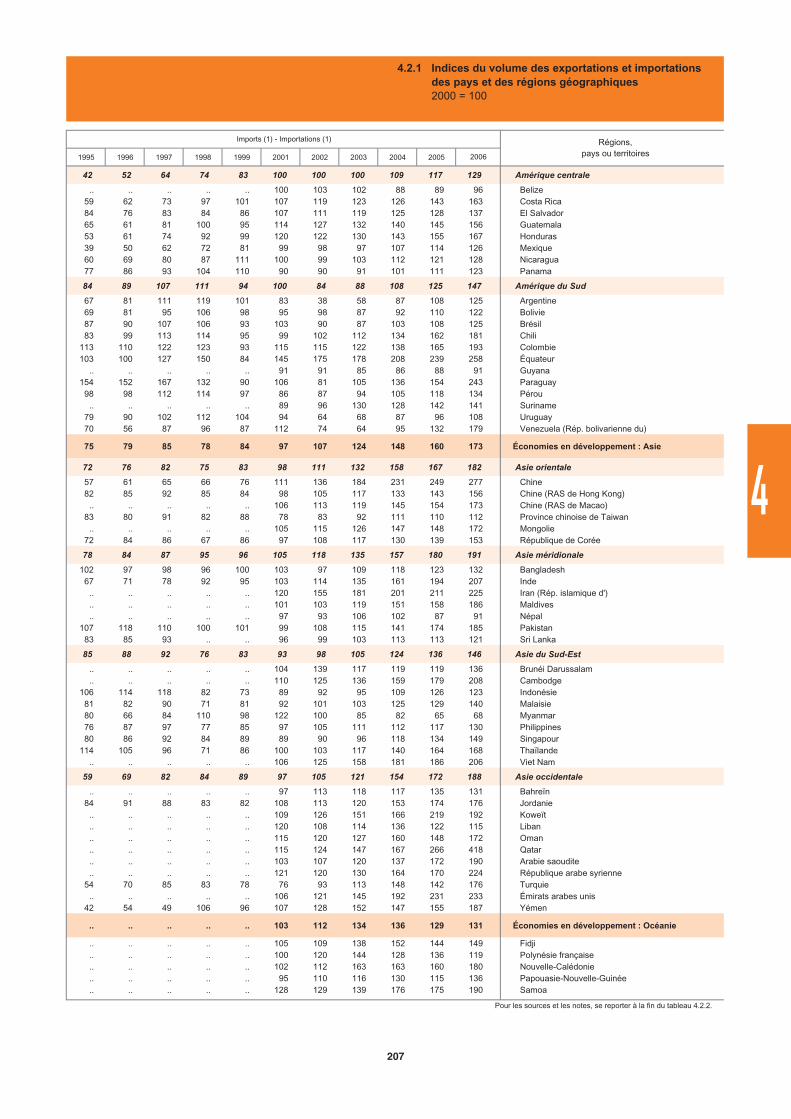
1995 1996 1997 1998 1999 2001 2002 2003 2004 2005
42 52 64 74 83 100 100 100 109 117 129 Amérique centrale
.. .. .. .. .. 100 103 102 88 89 96 Belize59 62 73 97 101 107 119 123 126 143 163 Costa Rica84 76 83 84 86 107 111 119 125 128 137 El Salvador65 61 81 100 95 114 127 132 140 145 156 Guatemala53 61 74 92 99 120 122 130 143 155 167 Honduras39 50 62 72 81 99 98 97 107 114 126 Mexique60 69 80 87 111 100 99 103 112 121 128 Nicaragua77 86 93 104 110 90 90 91 101 111 123 Panama
84 89 107 111 94 100 84 88 108 125 147 Amérique du Sud
67 81 111 119 101 83 38 58 87 108 125 Argentine69 81 95 106 98 95 98 87 92 110 122 Bolivie87 90 107 106 93 103 90 87 103 108 125 Brésil83 99 113 114 95 99 102 112 134 162 181 Chili
113 110 122 123 93 115 115 122 138 165 193 Colombie103 100 127 150 84 145 175 178 208 239 258 Équateur
.. .. .. .. .. 91 91 85 86 88 91 Guyana154 152 167 132 90 106 81 105 136 154 243 Paraguay
98 98 112 114 97 86 87 94 105 118 134 Pérou.. .. .. .. .. 89 96 130 128 142 141 Suriname
79 90 102 112 104 94 64 68 87 96 108 Uruguay70 56 87 96 87 112 74 64 95 132 179 Venezuela (Rép. bolivarienne du)
75 79 85 78 84 97 107 124 148 160 173 Économies en développement : Asie
72 76 82 75 83 98 111 132 158 167 182 Asie orientale
57 61 65 66 76 111 136 184 231 249 277 Chine82 85 92 85 84 98 105 117 133 143 156 Chine (RAS de Hong Kong)
.. .. .. .. .. 106 113 119 145 154 173 Chine (RAS de Macao)83 80 91 82 88 78 83 92 111 110 112 Province chinoise de Taiwan
.. .. .. .. .. 105 115 126 147 148 172 Mongolie72 84 86 67 86 97 108 117 130 139 153 République de Corée
78 84 87 95 96 105 118 135 157 180 191 Asie méridionale
102 97 98 96 100 103 97 109 118 123 132 Bangladesh67 71 78 92 95 103 114 135 161 194 207 Inde
.. .. .. .. .. 120 155 181 201 211 225 Iran (Rép. islamique d')
.. .. .. .. .. 101 103 119 151 158 186 Maldives
.. .. .. .. .. 97 93 106 102 87 91 Népal107 118 110 100 101 99 108 115 141 174 185 Pakistan
83 85 93 .. .. 96 99 103 113 113 121 Sri Lanka
85 88 92 76 83 93 98 105 124 136 146 Asie du Sud-Est
.. .. .. .. .. 104 139 117 119 119 136 Brunéi Darussalam
.. .. .. .. .. 110 125 136 159 179 208 Cambodge106 114 118 82 73 89 92 95 109 126 123 Indonésie
81 82 90 71 81 92 101 103 125 129 140 Malaisie80 66 84 110 98 122 100 85 82 65 68 Myanmar76 87 97 77 85 97 105 111 112 117 130 Philippines80 86 92 84 89 89 90 96 118 134 149 Singapour
114 105 96 71 86 100 103 117 140 164 168 Thaïlande.. .. .. .. .. 106 125 158 181 186 206 Viet Nam
59 69 82 84 89 97 105 121 154 172 188 Asie occidentale
.. .. .. .. .. 97 113 118 117 135 131 Bahreïn84 91 88 83 82 108 113 120 153 174 176 Jordanie
.. .. .. .. .. 109 126 151 166 219 192 Koweït
.. .. .. .. .. 120 108 114 136 122 115 Liban
.. .. .. .. .. 115 120 127 160 148 172 Oman
.. .. .. .. .. 115 124 147 167 266 418 Qatar
.. .. .. .. .. 103 107 120 137 172 190 Arabie saoudite
.. .. .. .. .. 121 120 130 164 170 224 République arabe syrienne54 70 85 83 78 76 93 113 148 142 176 Turquie
.. .. .. .. .. 106 121 145 192 231 233 Émirats arabes unis42 54 49 106 96 107 128 152 147 155 187 Yémen
.. .. .. .. .. 103 112 134 136 129 131 Économies en développement : Océanie
.. .. .. .. .. 105 109 138 152 144 149 Fidji
.. .. .. .. .. 100 120 144 128 136 119 Polynésie française
.. .. .. .. .. 102 112 163 163 160 180 Nouvelle-Calédonie
.. .. .. .. .. 95 110 116 130 115 136 Papouasie-Nouvelle-Guinée
.. .. .. .. .. 128 129 139 176 175 190 Samoa
Pour les sources et les notes, se reporter à la fin du tableau 4.2.2.
Imports (1) - Importations (1) Régions,pays ou territoires2006
4.2.1 Indices du volume des exportations et importations des pays et des régions géographiques2000 = 100
207
4
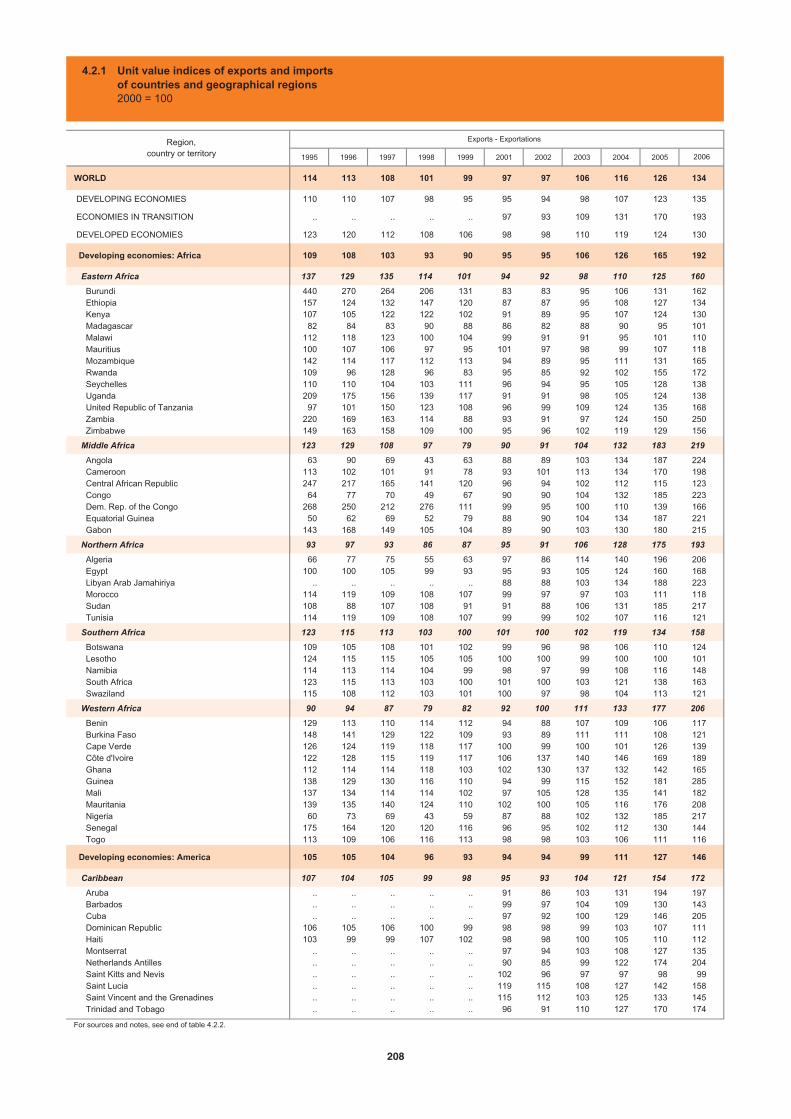
1995 1996 1997 1998 1999 2001 2002 2003 2004 2005
WORLD 114 113 108 101 99 97 97 106 116 126 134
DEVELOPING ECONOMIES 110 110 107 98 95 95 94 98 107 123 135
ECONOMIES IN TRANSITION .. .. .. .. .. 97 93 109 131 170 193
DEVELOPED ECONOMIES 123 120 112 108 106 98 98 110 119 124 130
Developing economies: Africa 109 108 103 93 90 95 95 106 126 165 192
Eastern Africa 137 129 135 114 101 94 92 98 110 125 160
Burundi 440 270 264 206 131 83 83 95 106 131 162 Ethiopia 157 124 132 147 120 87 87 95 108 127 134 Kenya 107 105 122 122 102 91 89 95 107 124 130 Madagascar 82 84 83 90 88 86 82 88 90 95 101 Malawi 112 118 123 100 104 99 91 91 95 101 110 Mauritius 100 107 106 97 95 101 97 98 99 107 118 Mozambique 142 114 117 112 113 94 89 95 111 131 165 Rwanda 109 96 128 96 83 95 85 92 102 155 172 Seychelles 110 110 104 103 111 96 94 95 105 128 138 Uganda 209 175 156 139 117 91 91 98 105 124 138 United Republic of Tanzania 97 101 150 123 108 96 99 109 124 135 168 Zambia 220 169 163 114 88 93 91 97 124 150 250 Zimbabwe 149 163 158 109 100 95 96 102 119 129 156
Middle Africa 123 129 108 97 79 90 91 104 132 183 219
Angola 63 90 69 43 63 88 89 103 134 187 224 Cameroon 113 102 101 91 78 93 101 113 134 170 198 Central African Republic 247 217 165 141 120 96 94 102 112 115 123 Congo 64 77 70 49 67 90 90 104 132 185 223 Dem. Rep. of the Congo 268 250 212 276 111 99 95 100 110 139 166 Equatorial Guinea 50 62 69 52 79 88 90 104 134 187 221 Gabon 143 168 149 105 104 89 90 103 130 180 215
Northern Africa 93 97 93 86 87 95 91 106 128 175 193
Algeria 66 77 75 55 63 97 86 114 140 196 206 Egypt 100 100 105 99 93 95 93 105 124 160 168 Libyan Arab Jamahiriya .. .. .. .. .. 88 88 103 134 188 223 Morocco 114 119 109 108 107 99 97 97 103 111 118 Sudan 108 88 107 108 91 91 88 106 131 185 217 Tunisia 114 119 109 108 107 99 99 102 107 116 121
Southern Africa 123 115 113 103 100 101 100 102 119 134 158
Botswana 109 105 108 101 102 99 96 98 106 110 124 Lesotho 124 115 115 105 105 100 100 99 100 100 101 Namibia 114 113 114 104 99 98 97 99 108 116 148 South Africa 123 115 113 103 100 101 100 103 121 138 163 Swaziland 115 108 112 103 101 100 97 98 104 113 121
Western Africa 90 94 87 79 82 92 100 111 133 177 206
Benin 129 113 110 114 112 94 88 107 109 106 117 Burkina Faso 148 141 129 122 109 93 89 111 111 108 121 Cape Verde 126 124 119 118 117 100 99 100 101 126 139 Côte d'Ivoire 122 128 115 119 117 106 137 140 146 169 189 Ghana 112 114 114 118 103 102 130 137 132 142 165 Guinea 138 129 130 116 110 94 99 115 152 181 285 Mali 137 134 114 114 102 97 105 128 135 141 182 Mauritania 139 135 140 124 110 102 100 105 116 176 208 Nigeria 60 73 69 43 59 87 88 102 132 185 217 Senegal 175 164 120 120 116 96 95 102 112 130 144 Togo 113 109 106 116 113 98 98 103 106 111 116
Developing economies: America 105 105 104 96 93 94 94 99 111 127 146
Caribbean 107 104 105 99 98 95 93 104 121 154 172
Aruba .. .. .. .. .. 91 86 103 131 194 197 Barbados .. .. .. .. .. 99 97 104 109 130 143 Cuba .. .. .. .. .. 97 92 100 129 146 205 Dominican Republic 106 105 106 100 99 98 98 99 103 107 111 Haiti 103 99 99 107 102 98 98 100 105 110 112 Montserrat .. .. .. .. .. 97 94 103 108 127 135 Netherlands Antilles .. .. .. .. .. 90 85 99 122 174 204 Saint Kitts and Nevis .. .. .. .. .. 102 96 97 97 98 99 Saint Lucia .. .. .. .. .. 119 115 108 127 142 158 Saint Vincent and the Grenadines .. .. .. .. .. 115 112 103 125 133 145 Trinidad and Tobago .. .. .. .. .. 96 91 110 127 170 174
For sources and notes, see end of table 4.2.2.
Region,country or territory
Exports - Exportations
2006
4.2.1 Unit value indices of exports and importsof countries and geographical regions2000 = 100
208
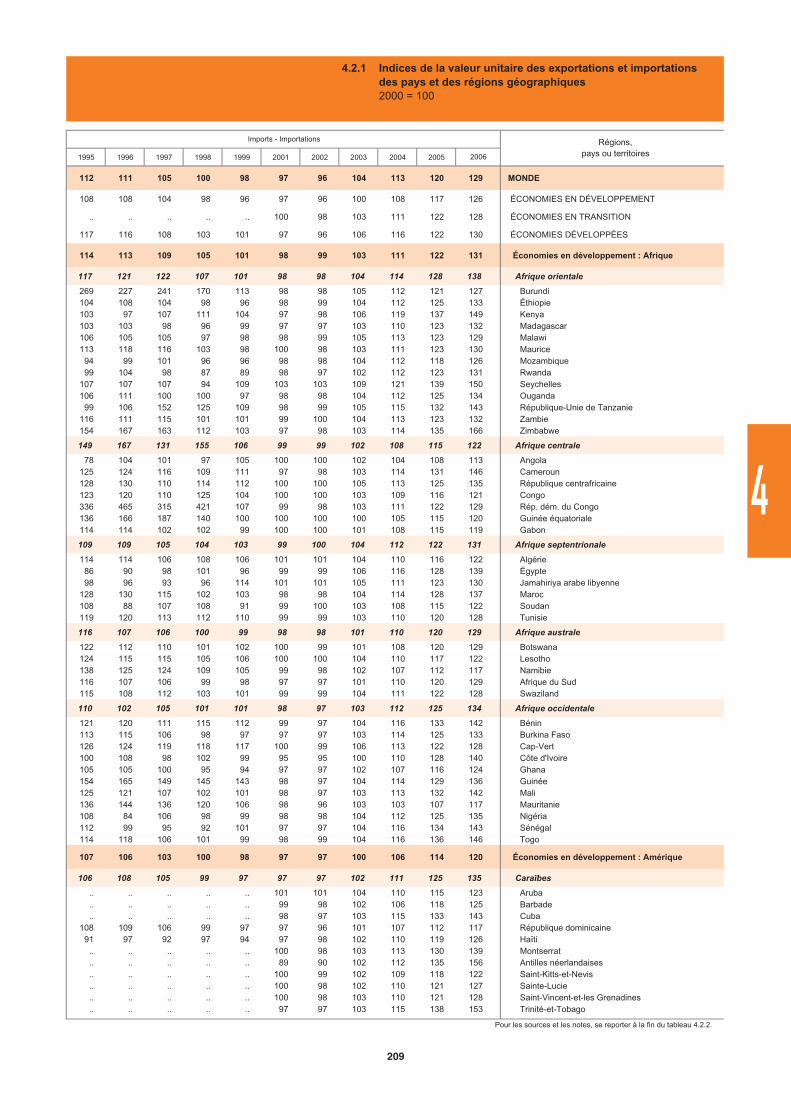
1995 1996 1997 1998 1999 2001 2002 2003 2004 2005
112 111 105 100 98 97 96 104 113 120 129 MONDE
108 108 104 98 96 97 96 100 108 117 126 ÉCONOMIES EN DÉVELOPPEMENT
.. .. .. .. .. 100 98 103 111 122 128 ÉCONOMIES EN TRANSITION
117 116 108 103 101 97 96 106 116 122 130 ÉCONOMIES DÉVELOPPÉES
114 113 109 105 101 98 99 103 111 122 131 Économies en développement : Afrique
117 121 122 107 101 98 98 104 114 128 138 Afrique orientale
269 227 241 170 113 98 98 105 112 121 127 Burundi104 108 104 98 96 98 99 104 112 125 133 Éthiopie103 97 107 111 104 97 98 106 119 137 149 Kenya103 103 98 96 99 97 97 103 110 123 132 Madagascar106 105 105 97 98 98 99 105 113 123 129 Malawi113 118 116 103 98 100 98 103 111 123 130 Maurice
94 99 101 96 96 98 98 104 112 118 126 Mozambique99 104 98 87 89 98 97 102 112 123 131 Rwanda
107 107 107 94 109 103 103 109 121 139 150 Seychelles106 111 100 100 97 98 98 104 112 125 134 Ouganda
99 106 152 125 109 98 99 105 115 132 143 République-Unie de Tanzanie116 111 115 101 101 99 100 104 113 123 132 Zambie154 167 163 112 103 97 98 103 114 135 166 Zimbabwe
149 167 131 155 106 99 99 102 108 115 122 Afrique centrale
78 104 101 97 105 100 100 102 104 108 113 Angola125 124 116 109 111 97 98 103 114 131 146 Cameroun128 130 110 114 112 100 100 105 113 125 135 République centrafricaine123 120 110 125 104 100 100 103 109 116 121 Congo336 465 315 421 107 99 98 103 111 122 129 Rép. dém. du Congo136 166 187 140 100 100 100 100 105 115 120 Guinée équatoriale114 114 102 102 99 100 100 101 108 115 119 Gabon
109 109 105 104 103 99 100 104 112 122 131 Afrique septentrionale
114 114 106 108 106 101 101 104 110 116 122 Algérie86 90 98 101 96 99 99 106 116 128 139 Égypte98 96 93 96 114 101 101 105 111 123 130 Jamahiriya arabe libyenne
128 130 115 102 103 98 98 104 114 128 137 Maroc108 88 107 108 91 99 100 103 108 115 122 Soudan119 120 113 112 110 99 99 103 110 120 128 Tunisie
116 107 106 100 99 98 98 101 110 120 129 Afrique australe
122 112 110 101 102 100 99 101 108 120 129 Botswana124 115 115 105 106 100 100 104 110 117 122 Lesotho138 125 124 109 105 99 98 102 107 112 117 Namibie116 107 106 99 98 97 97 101 110 120 129 Afrique du Sud115 108 112 103 101 99 99 104 111 122 128 Swaziland
110 102 105 101 101 98 97 103 112 125 134 Afrique occidentale
121 120 111 115 112 99 97 104 116 133 142 Bénin113 115 106 98 97 97 97 103 114 125 133 Burkina Faso126 124 119 118 117 100 99 106 113 122 128 Cap-Vert100 108 98 102 99 95 95 100 110 128 140 Côte d'Ivoire105 105 100 95 94 97 97 102 107 116 124 Ghana154 165 149 145 143 98 97 104 114 129 136 Guinée125 121 107 102 101 98 97 103 113 132 142 Mali136 144 136 120 106 98 96 103 103 107 117 Mauritanie108 84 106 98 99 98 98 104 112 125 135 Nigéria112 99 95 92 101 97 97 104 116 134 143 Sénégal114 118 106 101 99 98 99 104 116 136 146 Togo
107 106 103 100 98 97 97 100 106 114 120 Économies en développement : Amérique
106 108 105 99 97 97 97 102 111 125 135 Caraïbes
.. .. .. .. .. 101 101 104 110 115 123 Aruba
.. .. .. .. .. 99 98 102 106 118 125 Barbade
.. .. .. .. .. 98 97 103 115 133 143 Cuba108 109 106 99 97 97 96 101 107 112 117 République dominicaine
91 97 92 97 94 97 98 102 110 119 126 Haïti.. .. .. .. .. 100 98 103 113 130 139 Montserrat.. .. .. .. .. 89 90 102 112 135 156 Antilles néerlandaises.. .. .. .. .. 100 99 102 109 118 122 Saint-Kitts-et-Nevis.. .. .. .. .. 100 98 102 110 121 127 Sainte-Lucie.. .. .. .. .. 100 98 103 110 121 128 Saint-Vincent-et-les Grenadines.. .. .. .. .. 97 97 103 115 138 153 Trinité-et-Tobago
Pour les sources et les notes, se reporter à la fin du tableau 4.2.2.
Régions,pays ou territoires
Imports - Importations
2006
4.2.1 Indices de la valeur unitaire des exportations et importations des pays et des régions géographiques2000 = 100
209
4
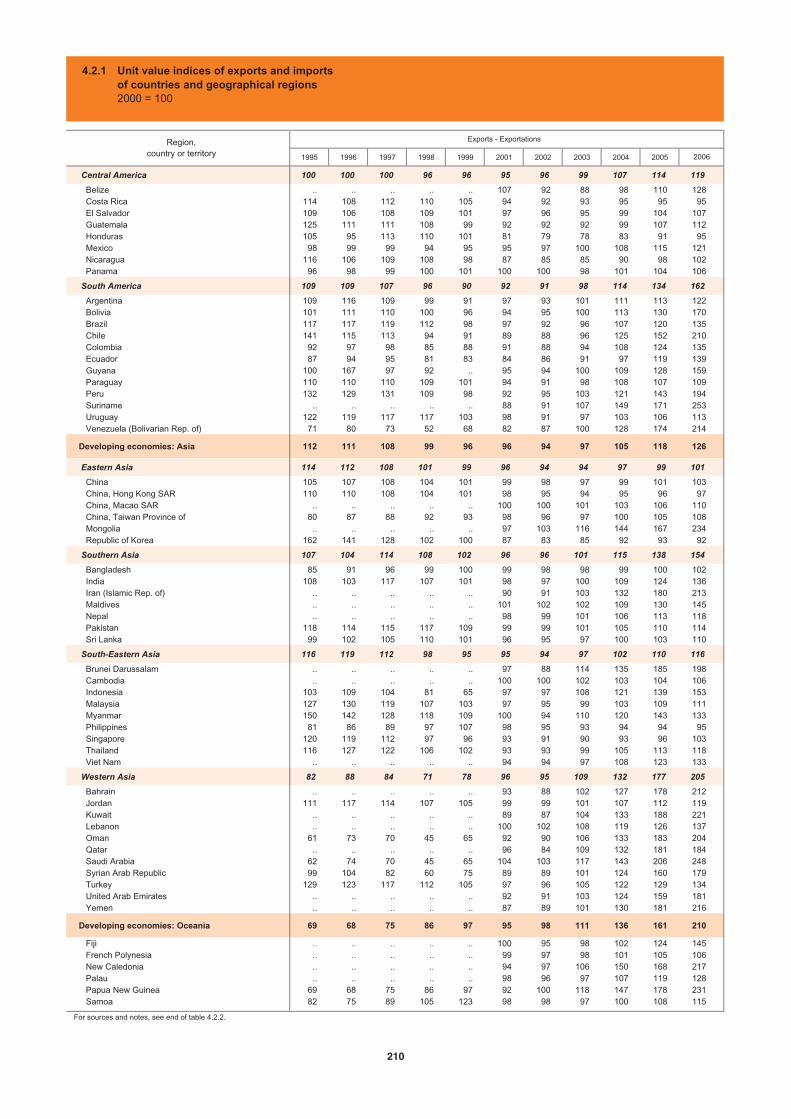
1995 1996 1997 1998 1999 2001 2002 2003 2004 2005
Central America 100 100 100 96 96 95 96 99 107 114 119
Belize .. .. .. .. .. 107 92 88 98 110 128 Costa Rica 114 108 112 110 105 94 92 93 95 95 95 El Salvador 109 106 108 109 101 97 96 95 99 104 107 Guatemala 125 111 111 108 99 92 92 92 99 107 112 Honduras 105 95 113 110 101 81 79 78 83 91 95 Mexico 98 99 99 94 95 95 97 100 108 115 121 Nicaragua 116 106 109 108 98 87 85 85 90 98 102 Panama 96 98 99 100 101 100 100 98 101 104 106
South America 109 109 107 96 90 92 91 98 114 134 162
Argentina 109 116 109 99 91 97 93 101 111 113 122 Bolivia 101 111 110 100 96 94 95 100 113 130 170 Brazil 117 117 119 112 98 97 92 96 107 120 135 Chile 141 115 113 94 91 89 88 96 125 152 210 Colombia 92 97 98 85 88 91 88 94 108 124 135 Ecuador 87 94 95 81 83 84 86 91 97 119 139 Guyana 100 167 97 92 .. 95 94 100 109 128 159 Paraguay 110 110 110 109 101 94 91 98 108 107 109 Peru 132 129 131 109 98 92 95 103 121 143 194 Suriname .. .. .. .. .. 88 91 107 149 171 253 Uruguay 122 119 117 117 103 98 91 97 103 106 113 Venezuela (Bolivarian Rep. of) 71 80 73 52 68 82 87 100 128 174 214
Developing economies: Asia 112 111 108 99 96 96 94 97 105 118 126
Eastern Asia 114 112 108 101 99 96 94 94 97 99 101
China 105 107 108 104 101 99 98 97 99 101 103 China, Hong Kong SAR 110 110 108 104 101 98 95 94 95 96 97 China, Macao SAR .. .. .. .. .. 100 100 101 103 106 110 China, Taiwan Province of 80 87 88 92 93 98 96 97 100 105 108 Mongolia .. .. .. .. .. 97 103 116 144 167 234 Republic of Korea 162 141 128 102 100 87 83 85 92 93 92
Southern Asia 107 104 114 108 102 96 96 101 115 138 154
Bangladesh 85 91 96 99 100 99 98 98 99 100 102 India 108 103 117 107 101 98 97 100 109 124 136 Iran (Islamic Rep. of) .. .. .. .. .. 90 91 103 132 180 213 Maldives .. .. .. .. .. 101 102 102 109 130 145 Nepal .. .. .. .. .. 98 99 101 106 113 118 Pakistan 118 114 115 117 109 99 99 101 105 110 114 Sri Lanka 99 102 105 110 101 96 95 97 100 103 110
South-Eastern Asia 116 119 112 98 95 95 94 97 102 110 116
Brunei Darussalam .. .. .. .. .. 97 88 114 135 185 198 Cambodia .. .. .. .. .. 100 100 102 103 104 106 Indonesia 103 109 104 81 65 97 97 108 121 139 153 Malaysia 127 130 119 107 103 97 95 99 103 109 111 Myanmar 150 142 128 118 109 100 94 110 120 143 133 Philippines 81 86 89 97 107 98 95 93 94 94 95 Singapore 120 119 112 97 96 93 91 90 93 96 103 Thailand 116 127 122 106 102 93 93 99 105 113 118 Viet Nam .. .. .. .. .. 94 94 97 108 123 133
Western Asia 82 88 84 71 78 96 95 109 132 177 205
Bahrain .. .. .. .. .. 93 88 102 127 178 212 Jordan 111 117 114 107 105 99 99 101 107 112 119 Kuwait .. .. .. .. .. 89 87 104 133 188 221 Lebanon .. .. .. .. .. 100 102 108 119 126 137 Oman 61 73 70 45 65 92 90 106 133 183 204 Qatar .. .. .. .. .. 96 84 109 132 181 184 Saudi Arabia 62 74 70 45 65 104 103 117 143 206 248 Syrian Arab Republic 99 104 82 60 75 89 89 101 124 160 179 Turkey 129 123 117 112 105 97 96 105 122 129 134 United Arab Emirates .. .. .. .. .. 92 91 103 124 159 181 Yemen .. .. .. .. .. 87 89 101 130 181 216
Developing economies: Oceania 69 68 75 86 97 95 98 111 136 161 210
Fiji .. .. .. .. .. 100 95 98 102 124 145 French Polynesia .. .. .. .. .. 99 97 98 101 105 106 New Caledonia .. .. .. .. .. 94 97 106 150 168 217 Palau .. .. .. .. .. 98 96 97 107 119 128 Papua New Guinea 69 68 75 86 97 92 100 118 147 178 231 Samoa 82 75 89 105 123 98 98 97 100 108 115
For sources and notes, see end of table 4.2.2.
Region,country or territory
Exports - Exportations
2006
4.2.1 Unit value indices of exports and importsof countries and geographical regions2000 = 100
210
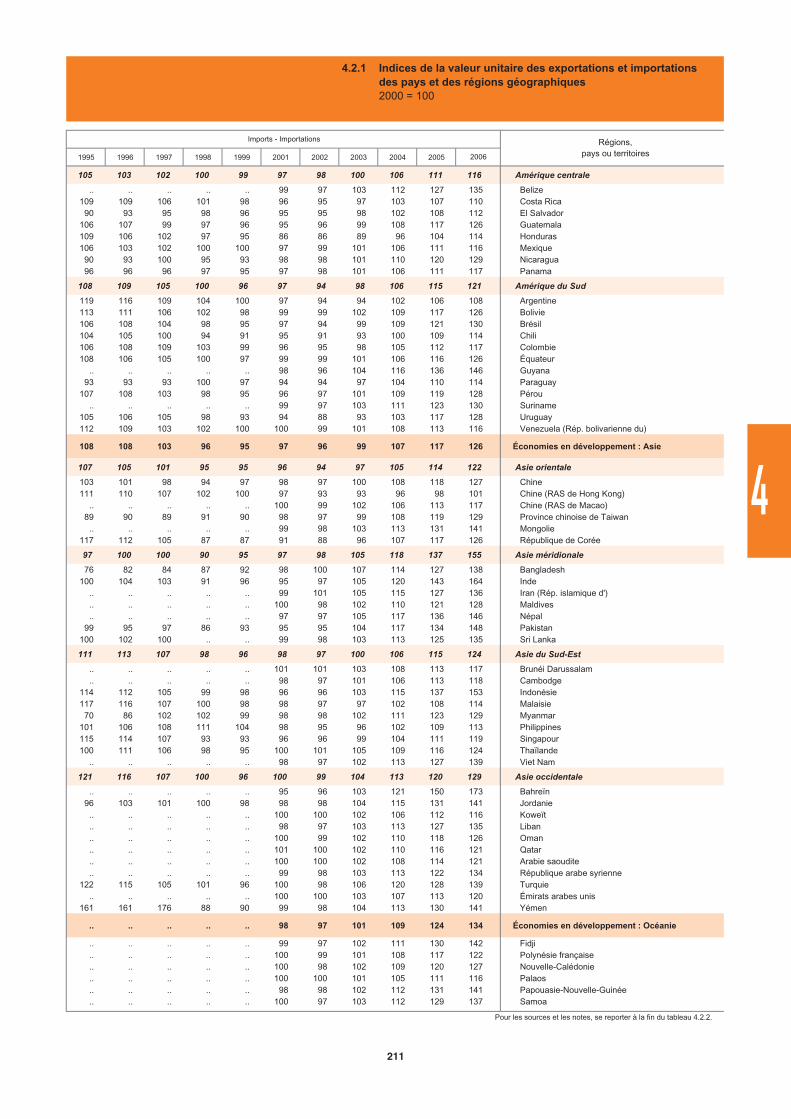
1995 1996 1997 1998 1999 2001 2002 2003 2004 2005
105 103 102 100 99 97 98 100 106 111 116 Amérique centrale
.. .. .. .. .. 99 97 103 112 127 135 Belize109 109 106 101 98 96 95 97 103 107 110 Costa Rica
90 93 95 98 96 95 95 98 102 108 112 El Salvador106 107 99 97 96 95 96 99 108 117 126 Guatemala109 106 102 97 95 86 86 89 96 104 114 Honduras106 103 102 100 100 97 99 101 106 111 116 Mexique
90 93 100 95 93 98 98 101 110 120 129 Nicaragua96 96 96 97 95 97 98 101 106 111 117 Panama
108 109 105 100 96 97 94 98 106 115 121 Amérique du Sud
119 116 109 104 100 97 94 94 102 106 108 Argentine113 111 106 102 98 99 99 102 109 117 126 Bolivie106 108 104 98 95 97 94 99 109 121 130 Brésil104 105 100 94 91 95 91 93 100 109 114 Chili106 108 109 103 99 96 95 98 105 112 117 Colombie108 106 105 100 97 99 99 101 106 116 126 Équateur
.. .. .. .. .. 98 96 104 116 136 146 Guyana93 93 93 100 97 94 94 97 104 110 114 Paraguay
107 108 103 98 95 96 97 101 109 119 128 Pérou.. .. .. .. .. 99 97 103 111 123 130 Suriname
105 106 105 98 93 94 88 93 103 117 128 Uruguay112 109 103 102 100 100 99 101 108 113 116 Venezuela (Rép. bolivarienne du)
108 108 103 96 95 97 96 99 107 117 126 Économies en développement : Asie
107 105 101 95 95 96 94 97 105 114 122 Asie orientale
103 101 98 94 97 98 97 100 108 118 127 Chine111 110 107 102 100 97 93 93 96 98 101 Chine (RAS de Hong Kong)
.. .. .. .. .. 100 99 102 106 113 117 Chine (RAS de Macao)89 90 89 91 90 98 97 99 108 119 129 Province chinoise de Taiwan
.. .. .. .. .. 99 98 103 113 131 141 Mongolie117 112 105 87 87 91 88 96 107 117 126 République de Corée
97 100 100 90 95 97 98 105 118 137 155 Asie méridionale
76 82 84 87 92 98 100 107 114 127 138 Bangladesh100 104 103 91 96 95 97 105 120 143 164 Inde
.. .. .. .. .. 99 101 105 115 127 136 Iran (Rép. islamique d')
.. .. .. .. .. 100 98 102 110 121 128 Maldives
.. .. .. .. .. 97 97 105 117 136 146 Népal99 95 97 86 93 95 95 104 117 134 148 Pakistan
100 102 100 .. .. 99 98 103 113 125 135 Sri Lanka
111 113 107 98 96 98 97 100 106 115 124 Asie du Sud-Est
.. .. .. .. .. 101 101 103 108 113 117 Brunéi Darussalam
.. .. .. .. .. 98 97 101 106 113 118 Cambodge114 112 105 99 98 96 96 103 115 137 153 Indonésie117 116 107 100 98 98 97 97 102 108 114 Malaisie
70 86 102 102 99 98 98 102 111 123 129 Myanmar101 106 108 111 104 98 95 96 102 109 113 Philippines115 114 107 93 93 96 96 99 104 111 119 Singapour100 111 106 98 95 100 101 105 109 116 124 Thaïlande
.. .. .. .. .. 98 97 102 113 127 139 Viet Nam
121 116 107 100 96 100 99 104 113 120 129 Asie occidentale
.. .. .. .. .. 95 96 103 121 150 173 Bahreïn96 103 101 100 98 98 98 104 115 131 141 Jordanie
.. .. .. .. .. 100 100 102 106 112 116 Koweït
.. .. .. .. .. 98 97 103 113 127 135 Liban
.. .. .. .. .. 100 99 102 110 118 126 Oman
.. .. .. .. .. 101 100 102 110 116 121 Qatar
.. .. .. .. .. 100 100 102 108 114 121 Arabie saoudite
.. .. .. .. .. 99 98 103 113 122 134 République arabe syrienne122 115 105 101 96 100 98 106 120 128 139 Turquie
.. .. .. .. .. 100 100 103 107 113 120 Émirats arabes unis161 161 176 88 90 99 98 104 113 130 141 Yémen
.. .. .. .. .. 98 97 101 109 124 134 Économies en développement : Océanie
.. .. .. .. .. 99 97 102 111 130 142 Fidji
.. .. .. .. .. 100 99 101 108 117 122 Polynésie française
.. .. .. .. .. 100 98 102 109 120 127 Nouvelle-Calédonie
.. .. .. .. .. 100 100 101 105 111 116 Palaos
.. .. .. .. .. 98 98 102 112 131 141 Papouasie-Nouvelle-Guinée
.. .. .. .. .. 100 97 103 112 129 137 Samoa
Pour les sources et les notes, se reporter à la fin du tableau 4.2.2.
Imports - Importations Régions,pays ou territoires2006
4.2.1 Indices de la valeur unitaire des exportations et importations des pays et des régions géographiques2000 = 100
211
4
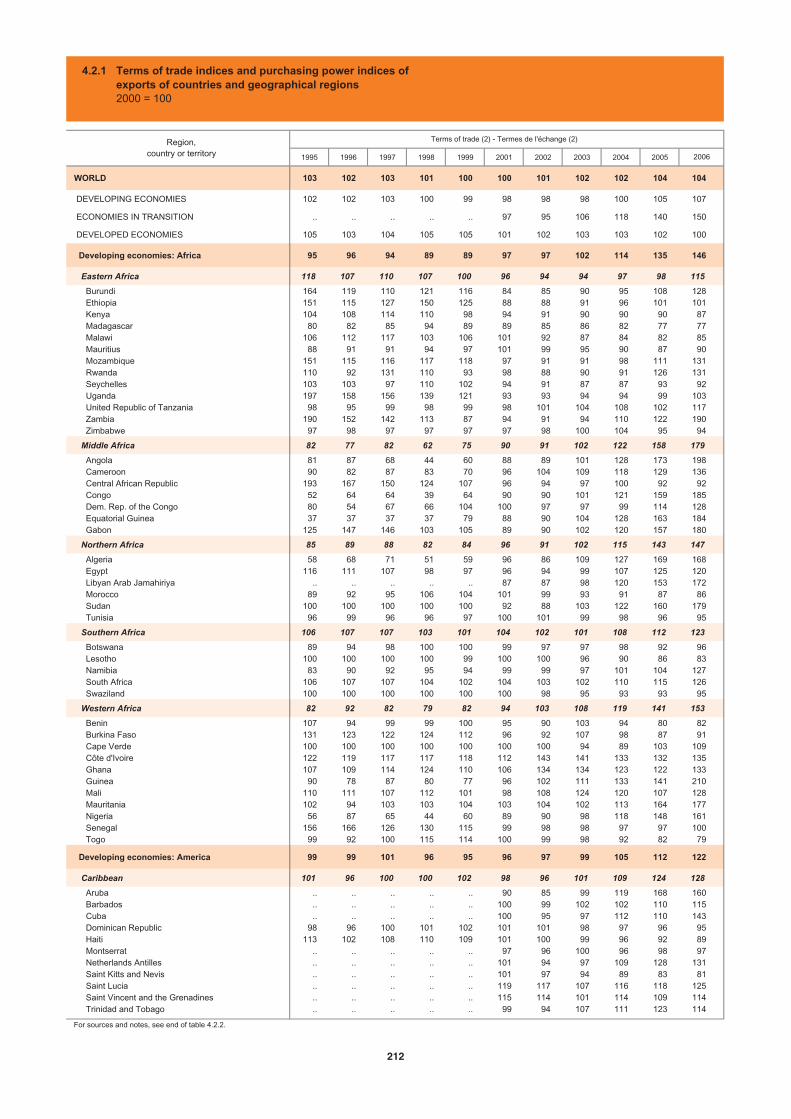
1995 1996 1997 1998 1999 2001 2002 2003 2004 2005
WORLD 103 102 103 101 100 100 101 102 102 104 104
DEVELOPING ECONOMIES 102 102 103 100 99 98 98 98 100 105 107
ECONOMIES IN TRANSITION .. .. .. .. .. 97 95 106 118 140 150
DEVELOPED ECONOMIES 105 103 104 105 105 101 102 103 103 102 100
Developing economies: Africa 95 96 94 89 89 97 97 102 114 135 146
Eastern Africa 118 107 110 107 100 96 94 94 97 98 115
Burundi 164 119 110 121 116 84 85 90 95 108 128 Ethiopia 151 115 127 150 125 88 88 91 96 101 101 Kenya 104 108 114 110 98 94 91 90 90 90 87 Madagascar 80 82 85 94 89 89 85 86 82 77 77 Malawi 106 112 117 103 106 101 92 87 84 82 85 Mauritius 88 91 91 94 97 101 99 95 90 87 90 Mozambique 151 115 116 117 118 97 91 91 98 111 131 Rwanda 110 92 131 110 93 98 88 90 91 126 131 Seychelles 103 103 97 110 102 94 91 87 87 93 92 Uganda 197 158 156 139 121 93 93 94 94 99 103 United Republic of Tanzania 98 95 99 98 99 98 101 104 108 102 117 Zambia 190 152 142 113 87 94 91 94 110 122 190 Zimbabwe 97 98 97 97 97 97 98 100 104 95 94
Middle Africa 82 77 82 62 75 90 91 102 122 158 179
Angola 81 87 68 44 60 88 89 101 128 173 198 Cameroon 90 82 87 83 70 96 104 109 118 129 136 Central African Republic 193 167 150 124 107 96 94 97 100 92 92 Congo 52 64 64 39 64 90 90 101 121 159 185 Dem. Rep. of the Congo 80 54 67 66 104 100 97 97 99 114 128 Equatorial Guinea 37 37 37 37 79 88 90 104 128 163 184 Gabon 125 147 146 103 105 89 90 102 120 157 180
Northern Africa 85 89 88 82 84 96 91 102 115 143 147
Algeria 58 68 71 51 59 96 86 109 127 169 168 Egypt 116 111 107 98 97 96 94 99 107 125 120 Libyan Arab Jamahiriya .. .. .. .. .. 87 87 98 120 153 172 Morocco 89 92 95 106 104 101 99 93 91 87 86 Sudan 100 100 100 100 100 92 88 103 122 160 179 Tunisia 96 99 96 96 97 100 101 99 98 96 95
Southern Africa 106 107 107 103 101 104 102 101 108 112 123
Botswana 89 94 98 100 100 99 97 97 98 92 96 Lesotho 100 100 100 100 99 100 100 96 90 86 83 Namibia 83 90 92 95 94 99 99 97 101 104 127 South Africa 106 107 107 104 102 104 103 102 110 115 126 Swaziland 100 100 100 100 100 100 98 95 93 93 95
Western Africa 82 92 82 79 82 94 103 108 119 141 153
Benin 107 94 99 99 100 95 90 103 94 80 82 Burkina Faso 131 123 122 124 112 96 92 107 98 87 91 Cape Verde 100 100 100 100 100 100 100 94 89 103 109 Côte d'Ivoire 122 119 117 117 118 112 143 141 133 132 135 Ghana 107 109 114 124 110 106 134 134 123 122 133 Guinea 90 78 87 80 77 96 102 111 133 141 210 Mali 110 111 107 112 101 98 108 124 120 107 128 Mauritania 102 94 103 103 104 103 104 102 113 164 177 Nigeria 56 87 65 44 60 89 90 98 118 148 161 Senegal 156 166 126 130 115 99 98 98 97 97 100 Togo 99 92 100 115 114 100 99 98 92 82 79
Developing economies: America 99 99 101 96 95 96 97 99 105 112 122
Caribbean 101 96 100 100 102 98 96 101 109 124 128
Aruba .. .. .. .. .. 90 85 99 119 168 160 Barbados .. .. .. .. .. 100 99 102 102 110 115 Cuba .. .. .. .. .. 100 95 97 112 110 143 Dominican Republic 98 96 100 101 102 101 101 98 97 96 95 Haiti 113 102 108 110 109 101 100 99 96 92 89 Montserrat .. .. .. .. .. 97 96 100 96 98 97 Netherlands Antilles .. .. .. .. .. 101 94 97 109 128 131 Saint Kitts and Nevis .. .. .. .. .. 101 97 94 89 83 81 Saint Lucia .. .. .. .. .. 119 117 107 116 118 125 Saint Vincent and the Grenadines .. .. .. .. .. 115 114 101 114 109 114 Trinidad and Tobago .. .. .. .. .. 99 94 107 111 123 114
For sources and notes, see end of table 4.2.2.
Region,country or territory
Terms of trade (2) - Termes de l'échange (2)
2006
4.2.1 Terms of trade indices and purchasing power indices ofexports of countries and geographical regions2000 = 100
212

1995 1996 1997 1998 1999 2001 2002 2003 2004 2005
72 76 82 85 90 99 104 112 125 134 145 MONDE
64 69 77 76 84 96 104 118 140 157 174 ÉCONOMIES EN DÉVELOPPEMENT
.. .. .. .. .. 100 107 130 164 191 227 ÉCONOMIES EN TRANSITION
73 76 83 88 92 100 104 108 117 121 128 ÉCONOMIES DÉVELOPPÉES
64 73 77 67 75 92 97 113 136 162 179 Économies en développement : Afrique
82 88 86 94 94 104 119 117 128 128 145 Afrique orientale
79 35 72 76 96 78 63 72 85 94 92 Burundi84 80 116 118 100 95 100 98 124 149 162 Éthiopie
105 123 111 104 97 115 124 131 130 138 133 Kenya60 60 64 68 72 116 108 100 111 84 90 Madagascar
101 121 135 117 122 121 108 132 113 106 127 Malawi87 98 88 103 104 90 101 102 100 96 99 Maurice49 60 60 66 75 204 227 277 367 405 518 Mozambique
100 111 169 131 128 164 127 116 165 191 213 Rwanda26 67 55 67 69 109 114 130 125 127 131 Seychelles94 115 121 109 116 102 98 118 138 150 162 Ouganda
104 112 75 71 75 119 135 157 175 172 164 République-Unie de Tanzanie135 140 120 154 158 112 107 105 156 164 321 Zambie
71 75 68 80 95 64 124 84 88 70 60 Zimbabwe
45 47 61 41 70 93 108 126 172 251 298 Afrique centrale
60 62 63 46 62 82 105 117 163 282 355 Angola85 84 95 110 90 98 101 119 119 129 138 Cameroun83 70 92 83 81 89 92 75 70 64 73 République centrafricaine38 45 61 44 60 83 92 104 125 166 226 Congo65 47 50 37 115 111 141 161 202 218 217 Rép. dém. du Congo
6 10 24 29 65 158 193 256 399 531 623 Guinée équatoriale97 113 120 76 98 97 93 107 129 182 195 Gabon
61 69 72 60 68 93 93 112 132 166 190 Afrique septentrionale
45 57 64 47 55 87 85 106 134 180 199 Algérie86 84 85 66 79 89 101 127 138 178 210 Égypte69 83 81 50 55 89 77 103 123 185 238 Jamahiriya arabe libyenne77 76 88 101 103 98 108 113 115 106 113 Maroc28 39 31 31 47 95 108 137 194 231 257 Soudan79 79 84 88 91 115 119 133 151 149 154 Tunisie
80 91 98 88 91 100 101 119 140 144 150 Afrique australe
65 83 95 71 96 90 92 99 116 131 125 Botswana59 74 78 84 74 133 168 214 301 262 278 Lesotho77 86 82 86 89 90 82 93 129 135 177 Namibie80 91 98 89 91 100 102 120 140 143 150 Afrique du Sud83 87 94 104 102 118 115 173 192 181 181 Swaziland
57 74 71 61 66 78 86 101 125 145 150 Afrique occidentale
88 112 96 90 96 96 118 133 124 111 102 Bénin117 97 105 156 126 112 123 151 204 182 216 Burkina Faso
62 96 111 83 92 92 100 112 125 136 152 Cap-Vert98 106 117 116 121 107 142 149 161 150 150 Côte d'Ivoire98 95 98 113 110 106 114 150 153 144 180 Ghana68 65 69 72 67 112 109 88 95 104 99 Guinée64 65 95 100 103 136 165 165 159 153 200 Mali
102 95 83 81 98 102 98 87 120 164 329 Mauritanie54 91 74 55 63 68 72 87 118 146 148 Nigéria96 108 104 114 111 112 120 131 141 128 118 Sénégal91 103 110 115 109 100 119 158 142 134 144 Togo
59 67 76 78 85 99 99 106 123 138 156 Économies en développement : Amérique
64 67 73 74 82 100 87 93 103 111 128 Caraïbes
.. .. .. .. .. 95 58 78 98 120 118 Aruba
.. .. .. .. .. 96 90 90 96 112 113 Barbade
.. .. .. .. .. 102 88 97 121 97 121 Cuba84 90 99 92 86 95 93 94 97 96 96 République dominicaine38 29 73 104 112 89 90 107 112 125 130 Haïti
.. .. .. .. .. 64 128 154 336 99 89 Montserrat
.. .. .. .. .. 135 90 57 63 61 61 Antilles néerlandaises
.. .. .. .. .. 106 126 108 100 100 97 Saint-Kitts-et-Nevis
.. .. .. .. .. 94 135 130 154 112 121 Sainte-Lucie
.. .. .. .. .. 88 85 79 64 70 54 Saint-Vincent-et-les Grenadines
.. .. .. .. .. 103 93 118 130 164 217 Trinité-et-Tobago
Pour les sources et les notes, se reporter à la fin du tableau 4.2.2.
Régions,pays ou territoires
Purchasing power (3) - Pouvoir d'achat (3)
2006
4.2.1 Indices des termes de l'échange et du pouvoir d'achat des exportations des pays et des régions géographiques2000 = 100
213
4
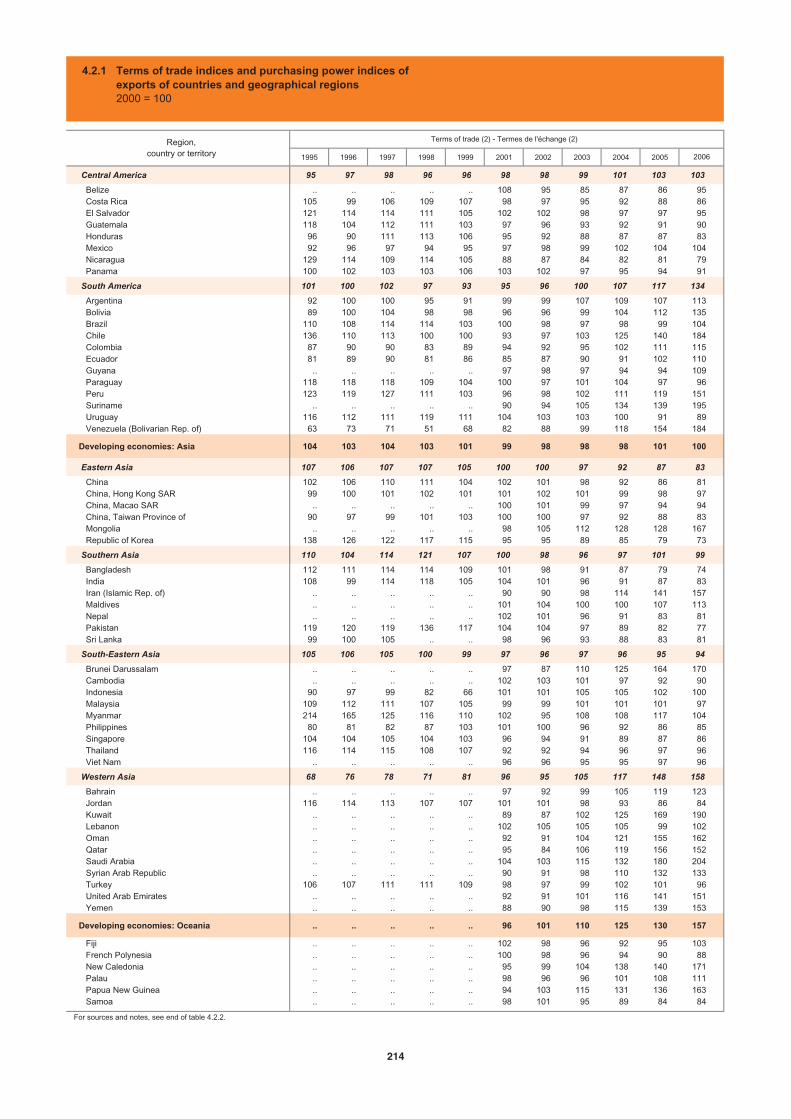
1995 1996 1997 1998 1999 2001 2002 2003 2004 2005
Central America 95 97 98 96 96 98 98 99 101 103 103
Belize .. .. .. .. .. 108 95 85 87 86 95 Costa Rica 105 99 106 109 107 98 97 95 92 88 86 El Salvador 121 114 114 111 105 102 102 98 97 97 95 Guatemala 118 104 112 111 103 97 96 93 92 91 90 Honduras 96 90 111 113 106 95 92 88 87 87 83 Mexico 92 96 97 94 95 97 98 99 102 104 104 Nicaragua 129 114 109 114 105 88 87 84 82 81 79 Panama 100 102 103 103 106 103 102 97 95 94 91
South America 101 100 102 97 93 95 96 100 107 117 134
Argentina 92 100 100 95 91 99 99 107 109 107 113 Bolivia 89 100 104 98 98 96 96 99 104 112 135 Brazil 110 108 114 114 103 100 98 97 98 99 104 Chile 136 110 113 100 100 93 97 103 125 140 184 Colombia 87 90 90 83 89 94 92 95 102 111 115 Ecuador 81 89 90 81 86 85 87 90 91 102 110 Guyana .. .. .. .. .. 97 98 97 94 94 109 Paraguay 118 118 118 109 104 100 97 101 104 97 96 Peru 123 119 127 111 103 96 98 102 111 119 151 Suriname .. .. .. .. .. 90 94 105 134 139 195 Uruguay 116 112 111 119 111 104 103 103 100 91 89 Venezuela (Bolivarian Rep. of) 63 73 71 51 68 82 88 99 118 154 184
Developing economies: Asia 104 103 104 103 101 99 98 98 98 101 100
Eastern Asia 107 106 107 107 105 100 100 97 92 87 83
China 102 106 110 111 104 102 101 98 92 86 81 China, Hong Kong SAR 99 100 101 102 101 101 102 101 99 98 97 China, Macao SAR .. .. .. .. .. 100 101 99 97 94 94 China, Taiwan Province of 90 97 99 101 103 100 100 97 92 88 83 Mongolia .. .. .. .. .. 98 105 112 128 128 167 Republic of Korea 138 126 122 117 115 95 95 89 85 79 73
Southern Asia 110 104 114 121 107 100 98 96 97 101 99
Bangladesh 112 111 114 114 109 101 98 91 87 79 74 India 108 99 114 118 105 104 101 96 91 87 83 Iran (Islamic Rep. of) .. .. .. .. .. 90 90 98 114 141 157 Maldives .. .. .. .. .. 101 104 100 100 107 113 Nepal .. .. .. .. .. 102 101 96 91 83 81 Pakistan 119 120 119 136 117 104 104 97 89 82 77 Sri Lanka 99 100 105 .. .. 98 96 93 88 83 81
South-Eastern Asia 105 106 105 100 99 97 96 97 96 95 94
Brunei Darussalam .. .. .. .. .. 97 87 110 125 164 170 Cambodia .. .. .. .. .. 102 103 101 97 92 90 Indonesia 90 97 99 82 66 101 101 105 105 102 100 Malaysia 109 112 111 107 105 99 99 101 101 101 97 Myanmar 214 165 125 116 110 102 95 108 108 117 104 Philippines 80 81 82 87 103 101 100 96 92 86 85 Singapore 104 104 105 104 103 96 94 91 89 87 86 Thailand 116 114 115 108 107 92 92 94 96 97 96 Viet Nam .. .. .. .. .. 96 96 95 95 97 96
Western Asia 68 76 78 71 81 96 95 105 117 148 158
Bahrain .. .. .. .. .. 97 92 99 105 119 123 Jordan 116 114 113 107 107 101 101 98 93 86 84 Kuwait .. .. .. .. .. 89 87 102 125 169 190 Lebanon .. .. .. .. .. 102 105 105 105 99 102 Oman .. .. .. .. .. 92 91 104 121 155 162 Qatar .. .. .. .. .. 95 84 106 119 156 152 Saudi Arabia .. .. .. .. .. 104 103 115 132 180 204 Syrian Arab Republic .. .. .. .. .. 90 91 98 110 132 133 Turkey 106 107 111 111 109 98 97 99 102 101 96 United Arab Emirates .. .. .. .. .. 92 91 101 116 141 151 Yemen .. .. .. .. .. 88 90 98 115 139 153
Developing economies: Oceania .. .. .. .. .. 96 101 110 125 130 157
Fiji .. .. .. .. .. 102 98 96 92 95 103 French Polynesia .. .. .. .. .. 100 98 96 94 90 88 New Caledonia .. .. .. .. .. 95 99 104 138 140 171 Palau .. .. .. .. .. 98 96 96 101 108 111 Papua New Guinea .. .. .. .. .. 94 103 115 131 136 163 Samoa .. .. .. .. .. 98 101 95 89 84 84
For sources and notes, see end of table 4.2.2.
Region,country or territory
Terms of trade (2) - Termes de l'échange (2)
2006
4.2.1 Terms of trade indices and purchasing power indices ofexports of countries and geographical regions2000 = 100
214

1995 1996 1997 1998 1999 2001 2002 2003 2004 2005
47 57 67 73 84 98 98 99 107 115 128 Amérique centrale
.. .. .. .. .. 78 80 91 87 75 91 Belize55 59 70 94 116 90 95 107 104 112 127 Costa Rica83 83 108 96 92 103 108 109 110 108 107 El Salvador75 70 88 99 93 95 95 98 101 109 108 Guatemala81 90 103 115 89 112 112 108 116 117 123 Honduras45 56 65 71 82 98 98 99 107 116 130 Mexique81 78 90 94 91 94 89 93 107 111 124 Nicaragua76 88 88 94 101 109 100 100 104 107 104 Panama
72 78 88 84 86 100 103 115 142 166 191 Amérique du Sud
67 78 92 96 88 104 103 119 129 145 164 Argentine79 83 90 88 87 106 107 128 160 195 250 Bolivie80 80 93 95 92 109 117 134 161 177 193 Brésil80 78 93 90 98 100 104 121 169 197 264 Chili73 75 81 81 90 98 96 102 118 145 160 Colombie81 94 102 85 93 96 104 125 148 177 205 Équateur
.. .. .. .. .. 99 102 99 102 81 81 Guyana114 129 135 117 88 121 117 148 181 178 192 Paraguay
74 78 95 84 92 105 115 130 167 200 266 Pérou.. .. .. .. .. 81 95 123 160 153 188 Suriname
87 99 113 123 105 96 92 103 124 127 135 Uruguay52 67 66 53 63 80 81 80 109 147 168 Venezuela (Rép. bolivarienne du)
66 70 77 77 85 96 106 122 145 161 178 Économies en développement : Asie
68 71 81 82 87 98 113 133 158 174 196 Asie orientale
58 60 75 78 81 109 135 176 221 259 307 Chine78 81 87 85 86 97 107 119 134 146 159 Chine (RAS de Hong Kong)
.. .. .. .. .. 91 93 99 104 86 86 Chine (RAS de Macao)85 87 92 82 91 85 91 98 109 113 117 Province chinoise de Taiwan
.. .. .. .. .. 99 100 111 144 152 205 Mongolie62 67 75 88 96 96 108 118 137 141 150 République de Corée
72 80 78 79 86 99 110 122 137 152 154 Asie méridionale
77 76 90 92 93 97 96 103 111 114 134 Bangladesh72 75 80 87 88 108 123 133 150 165 174 Inde
.. .. .. .. .. 85 98 114 136 166 164 Iran (Rép. islamique d')
.. .. .. .. .. 102 124 138 152 122 162 Maldives
.. .. .. .. .. 95 73 78 81 76 65 Népal89 109 100 109 100 108 115 127 126 133 126 Pakistan70 74 85 .. .. 90 88 91 94 94 94 Sri Lanka
68 70 77 78 87 92 97 105 124 131 143 Asie du Sud-Est
.. .. .. .. .. 93 94 110 120 142 171 Brunéi Darussalam
.. .. .. .. .. 114 130 147 175 184 224 Cambodge64 72 82 79 80 91 94 95 95 96 99 Indonésie64 69 75 75 88 91 98 104 125 132 143 Malaisie75 53 52 64 70 148 189 148 130 189 213 Myanmar44 48 58 67 88 84 96 94 98 92 106 Philippines75 80 85 86 89 92 95 106 139 151 165 Singapour82 73 78 80 89 94 98 111 128 138 153 Thaïlande
.. .. .. .. .. 107 118 136 162 177 197 Viet Nam
48 58 65 56 74 94 98 116 144 181 204 Asie occidentale
.. .. .. .. .. 95 98 104 101 110 114 Bahreïn97 93 96 95 98 123 149 156 179 173 193 Jordanie
.. .. .. .. .. 83 79 105 139 207 254 Koweït
.. .. .. .. .. 156 178 247 272 258 292 Liban
.. .. .. .. .. 98 99 101 107 140 152 Oman
.. .. .. .. .. 88 96 114 146 191 246 Qatar
.. .. .. .. .. 87 94 118 150 204 229 Arabie saoudite
.. .. .. .. .. 115 144 120 103 114 176 République arabe syrienne64 73 90 96 100 113 126 158 186 202 212 Turquie
.. .. .. .. .. 98 104 131 170 208 238 Émirats arabes unis30 41 35 42 66 83 90 93 101 121 127 Yémen
.. .. .. .. .. 87 86 109 115 116 131 Économies en développement : Océanie
.. .. .. .. .. 100 99 122 116 100 89 Fidji
.. .. .. .. .. 75 69 61 70 74 79 Polynésie française
.. .. .. .. .. 74 84 128 155 149 175 Nouvelle-Calédonie
.. .. .. .. .. .. .. .. .. .. .. Palaos
.. .. .. .. .. 88 80 103 108 119 141 Papouasie-Nouvelle-Guinée
.. .. .. .. .. 109 99 103 67 65 55 Samoa
Pour les sources et les notes, se reporter à la fin du tableau 4.2.2.
Purchasing power (3) - Pouvoir d'achat (3) Régions,pays ou territoires2006
4.2.1 Indices des termes de l'échange et du pouvoir d'achat des exportations des pays et des régions géographiques2000 = 100
215
4
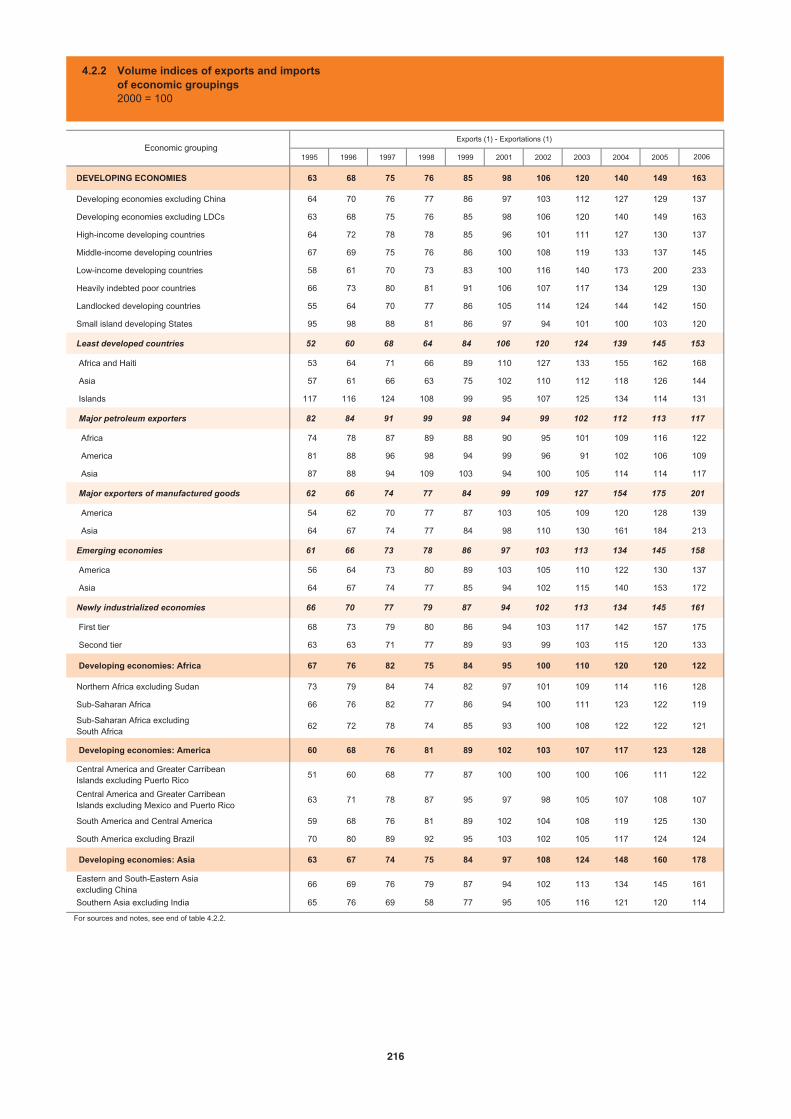
1995 1996 1997 1998 1999 2001 2002 2003 2004 2005
DEVELOPING ECONOMIES 63 68 75 76 85 98 106 120 140 149 163
Developing economies excluding China 64 70 76 77 86 97 103 112 127 129 137
Developing economies excluding LDCs 63 68 75 76 85 98 106 120 140 149 163
High-income developing countries 64 72 78 78 85 96 101 111 127 130 137
Middle-income developing countries 67 69 75 76 86 100 108 119 133 137 145
Low-income developing countries 58 61 70 73 83 100 116 140 173 200 233
Heavily indebted poor countries 66 73 80 81 91 106 107 117 134 129 130
Landlocked developing countries 55 64 70 77 86 105 114 124 144 142 150
Small island developing States 95 98 88 81 86 97 94 101 100 103 120
Least developed countries 52 60 68 64 84 106 120 124 139 145 153
Africa and Haiti 53 64 71 66 89 110 127 133 155 162 168
Asia 57 61 66 63 75 102 110 112 118 126 144
Islands 117 116 124 108 99 95 107 125 134 114 131
Major petroleum exporters 82 84 91 99 98 94 99 102 112 113 117
Africa 74 78 87 89 88 90 95 101 109 116 122
America 81 88 96 98 94 99 96 91 102 106 109
Asia 87 88 94 109 103 94 100 105 114 114 117
Major exporters of manufactured goods 62 66 74 77 84 99 109 127 154 175 201
America 54 62 70 77 87 103 105 109 120 128 139
Asia 64 67 74 77 84 98 110 130 161 184 213
Emerging economies 61 66 73 78 86 97 103 113 134 145 158
America 56 64 73 80 89 103 105 110 122 130 137
Asia 64 67 74 77 85 94 102 115 140 153 172
Newly industrialized economies 66 70 77 79 87 94 102 113 134 145 161
First tier 68 73 79 80 86 94 103 117 142 157 175
Second tier 63 63 71 77 89 93 99 103 115 120 133
Developing economies: Africa 67 76 82 75 84 95 100 110 120 120 122
Northern Africa excluding Sudan 73 79 84 74 82 97 101 109 114 116 128
Sub-Saharan Africa 66 76 82 77 86 94 100 111 123 122 119
Sub-Saharan Africa excluding South Africa
62 72 78 74 85 93 100 108 122 122 121
Developing economies: America 60 68 76 81 89 102 103 107 117 123 128
Central America and Greater Carribean Islands excluding Puerto Rico
51 60 68 77 87 100 100 100 106 111 122
Central America and Greater Carribean Islands excluding Mexico and Puerto Rico
63 71 78 87 95 97 98 105 107 108 107
South America and Central America 59 68 76 81 89 102 104 108 119 125 130
South America excluding Brazil 70 80 89 92 95 103 102 105 117 124 124
Developing economies: Asia 63 67 74 75 84 97 108 124 148 160 178
Eastern and South-Eastern Asia excluding China
66 69 76 79 87 94 102 113 134 145 161
Southern Asia excluding India 65 76 69 58 77 95 105 116 121 120 114
For sources and notes, see end of table 4.2.2.
Economic groupingExports (1) - Exportations (1)
2006
4.2.2 Volume indices of exports and importsof economic groupings2000 = 100
216
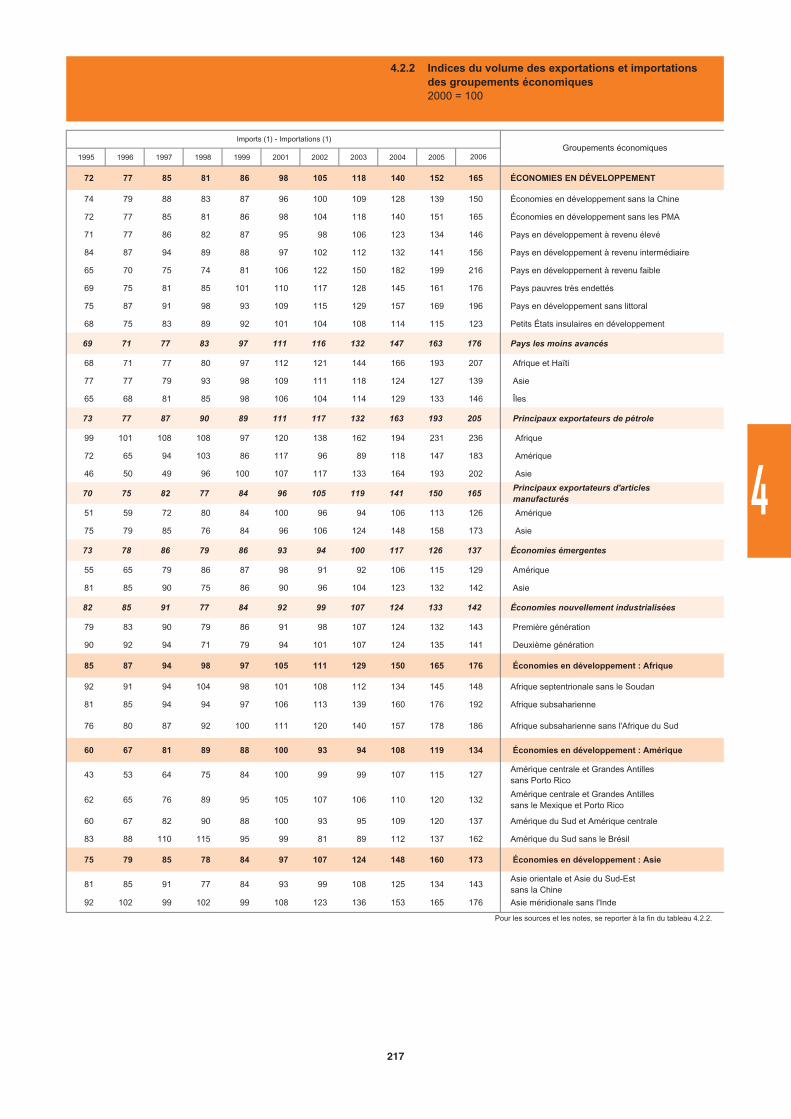
1995 1996 1997 1998 1999 2001 2002 2003 2004 2005
72 77 85 81 86 98 105 118 140 152 165 ÉCONOMIES EN DÉVELOPPEMENT
74 79 88 83 87 96 100 109 128 139 150 Économies en développement sans la Chine
72 77 85 81 86 98 104 118 140 151 165 Économies en développement sans les PMA
71 77 86 82 87 95 98 106 123 134 146 Pays en développement à revenu élevé
84 87 94 89 88 97 102 112 132 141 156 Pays en développement à revenu intermédiaire
65 70 75 74 81 106 122 150 182 199 216 Pays en développement à revenu faible
69 75 81 85 101 110 117 128 145 161 176 Pays pauvres très endettés
75 87 91 98 93 109 115 129 157 169 196 Pays en développement sans littoral
68 75 83 89 92 101 104 108 114 115 123 Petits États insulaires en développement
69 71 77 83 97 111 116 132 147 163 176 Pays les moins avancés
68 71 77 80 97 112 121 144 166 193 207 Afrique et Haïti
77 77 79 93 98 109 111 118 124 127 139 Asie
65 68 81 85 98 106 104 114 129 133 146 Îles
73 77 87 90 89 111 117 132 163 193 205 Principaux exportateurs de pétrole
99 101 108 108 97 120 138 162 194 231 236 Afrique
72 65 94 103 86 117 96 89 118 147 183 Amérique
46 50 49 96 100 107 117 133 164 193 202 Asie
70 75 82 77 84 96 105 119 141 150 165 Principaux exportateurs d'articles manufacturés
51 59 72 80 84 100 96 94 106 113 126 Amérique
75 79 85 76 84 96 106 124 148 158 173 Asie
73 78 86 79 86 93 94 100 117 126 137 Économies émergentes
55 65 79 86 87 98 91 92 106 115 129 Amérique
81 85 90 75 86 90 96 104 123 132 142 Asie
82 85 91 77 84 92 99 107 124 133 142 Économies nouvellement industrialisées
79 83 90 79 86 91 98 107 124 132 143 Première génération
90 92 94 71 79 94 101 107 124 135 141 Deuxième génération
85 87 94 98 97 105 111 129 150 165 176 Économies en développement : Afrique
92 91 94 104 98 101 108 112 134 145 148 Afrique septentrionale sans le Soudan
81 85 94 94 97 106 113 139 160 176 192 Afrique subsaharienne
76 80 87 92 100 111 120 140 157 178 186 Afrique subsaharienne sans l'Afrique du Sud
60 67 81 89 88 100 93 94 108 119 134 Économies en développement : Amérique
43 53 64 75 84 100 99 99 107 115 127 Amérique centrale et Grandes Antilles sans Porto Rico
62 65 76 89 95 105 107 106 110 120 132 Amérique centrale et Grandes Antilles sans le Mexique et Porto Rico
60 67 82 90 88 100 93 95 109 120 137 Amérique du Sud et Amérique centrale
83 88 110 115 95 99 81 89 112 137 162 Amérique du Sud sans le Brésil
75 79 85 78 84 97 107 124 148 160 173 Économies en développement : Asie
81 85 91 77 84 93 99 108 125 134 143 Asie orientale et Asie du Sud-Est sans la Chine
92 102 99 102 99 108 123 136 153 165 176 Asie méridionale sans l'Inde
Pour les sources et les notes, se reporter à la fin du tableau 4.2.2.
Groupements économiquesImports (1) - Importations (1)
2006
4.2.2 Indices du volume des exportations et importations des groupements économiques2000 = 100
217
4
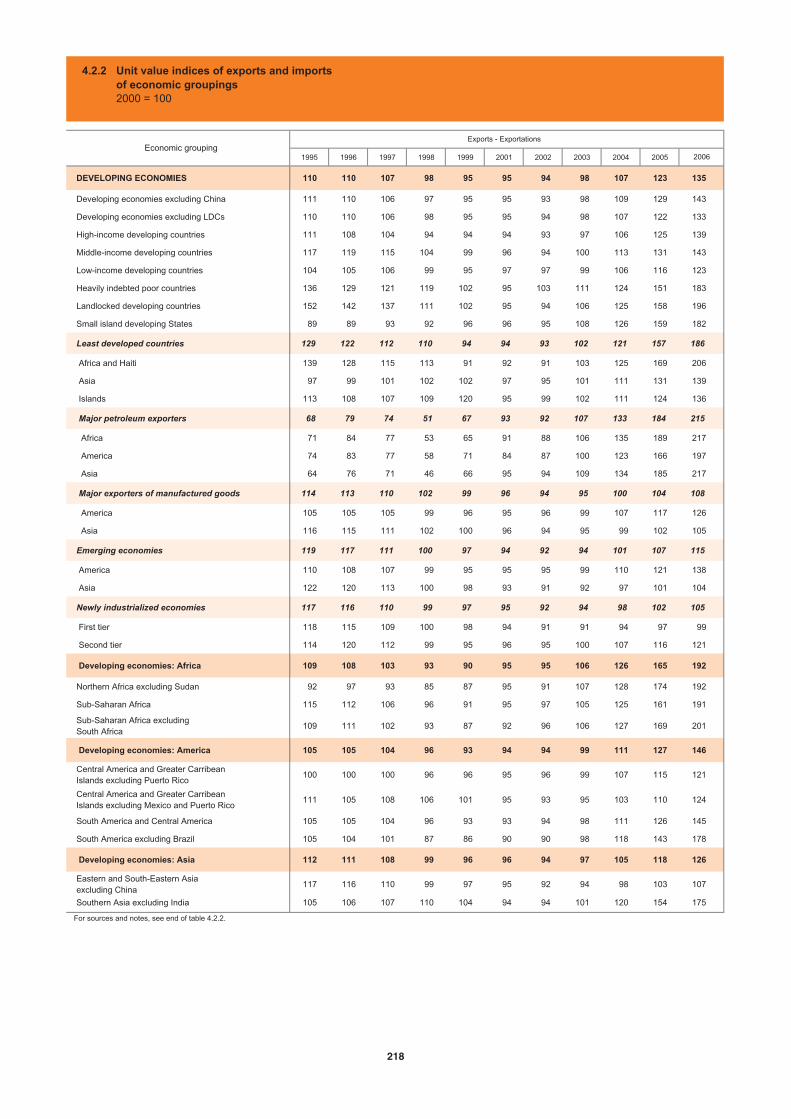
1995 1996 1997 1998 1999 2001 2002 2003 2004 2005
DEVELOPING ECONOMIES 110 110 107 98 95 95 94 98 107 123 135
Developing economies excluding China 111 110 106 97 95 95 93 98 109 129 143
Developing economies excluding LDCs 110 110 106 98 95 95 94 98 107 122 133
High-income developing countries 111 108 104 94 94 94 93 97 106 125 139
Middle-income developing countries 117 119 115 104 99 96 94 100 113 131 143
Low-income developing countries 104 105 106 99 95 97 97 99 106 116 123
Heavily indebted poor countries 136 129 121 119 102 95 103 111 124 151 183
Landlocked developing countries 152 142 137 111 102 95 94 106 125 158 196
Small island developing States 89 89 93 92 96 96 95 108 126 159 182
Least developed countries 129 122 112 110 94 94 93 102 121 157 186
Africa and Haiti 139 128 115 113 91 92 91 103 125 169 206
Asia 97 99 101 102 102 97 95 101 111 131 139
Islands 113 108 107 109 120 95 99 102 111 124 136
Major petroleum exporters 68 79 74 51 67 93 92 107 133 184 215
Africa 71 84 77 53 65 91 88 106 135 189 217
America 74 83 77 58 71 84 87 100 123 166 197
Asia 64 76 71 46 66 95 94 109 134 185 217
Major exporters of manufactured goods 114 113 110 102 99 96 94 95 100 104 108
America 105 105 105 99 96 95 96 99 107 117 126
Asia 116 115 111 102 100 96 94 95 99 102 105
Emerging economies 119 117 111 100 97 94 92 94 101 107 115
America 110 108 107 99 95 95 95 99 110 121 138
Asia 122 120 113 100 98 93 91 92 97 101 104
Newly industrialized economies 117 116 110 99 97 95 92 94 98 102 105
First tier 118 115 109 100 98 94 91 91 94 97 99
Second tier 114 120 112 99 95 96 95 100 107 116 121
Developing economies: Africa 109 108 103 93 90 95 95 106 126 165 192
Northern Africa excluding Sudan 92 97 93 85 87 95 91 107 128 174 192
Sub-Saharan Africa 115 112 106 96 91 95 97 105 125 161 191
Sub-Saharan Africa excluding South Africa
109 111 102 93 87 92 96 106 127 169 201
Developing economies: America 105 105 104 96 93 94 94 99 111 127 146
Central America and Greater Carribean Islands excluding Puerto Rico
100 100 100 96 96 95 96 99 107 115 121
Central America and Greater Carribean Islands excluding Mexico and Puerto Rico
111 105 108 106 101 95 93 95 103 110 124
South America and Central America 105 105 104 96 93 93 94 98 111 126 145
South America excluding Brazil 105 104 101 87 86 90 90 98 118 143 178
Developing economies: Asia 112 111 108 99 96 96 94 97 105 118 126
Eastern and South-Eastern Asia excluding China
117 116 110 99 97 95 92 94 98 103 107
Southern Asia excluding India 105 106 107 110 104 94 94 101 120 154 175
For sources and notes, see end of table 4.2.2.
Economic groupingExports - Exportations
2006
4.2.2 Unit value indices of exports and imports of economic groupings2000 = 100
218
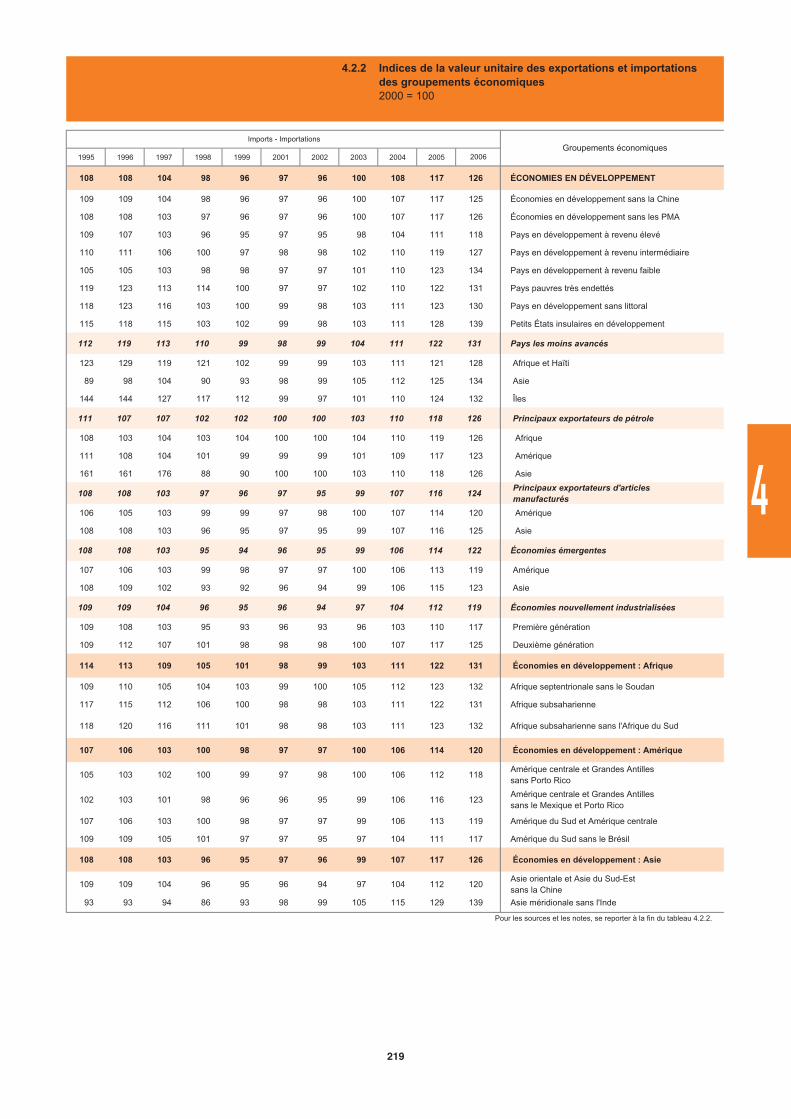
1995 1996 1997 1998 1999 2001 2002 2003 2004 2005
108 108 104 98 96 97 96 100 108 117 126 ÉCONOMIES EN DÉVELOPPEMENT
109 109 104 98 96 97 96 100 107 117 125 Économies en développement sans la Chine
108 108 103 97 96 97 96 100 107 117 126 Économies en développement sans les PMA
109 107 103 96 95 97 95 98 104 111 118 Pays en développement à revenu élevé
110 111 106 100 97 98 98 102 110 119 127 Pays en développement à revenu intermédiaire
105 105 103 98 98 97 97 101 110 123 134 Pays en développement à revenu faible
119 123 113 114 100 97 97 102 110 122 131 Pays pauvres très endettés
118 123 116 103 100 99 98 103 111 123 130 Pays en développement sans littoral
115 118 115 103 102 99 98 103 111 128 139 Petits États insulaires en développement
112 119 113 110 99 98 99 104 111 122 131 Pays les moins avancés
123 129 119 121 102 99 99 103 111 121 128 Afrique et Haïti
89 98 104 90 93 98 99 105 112 125 134 Asie
144 144 127 117 112 99 97 101 110 124 132 Îles
111 107 107 102 102 100 100 103 110 118 126 Principaux exportateurs de pétrole
108 103 104 103 104 100 100 104 110 119 126 Afrique
111 108 104 101 99 99 99 101 109 117 123 Amérique
161 161 176 88 90 100 100 103 110 118 126 Asie
108 108 103 97 96 97 95 99 107 116 124 Principaux exportateurs d'articles manufacturés
106 105 103 99 99 97 98 100 107 114 120 Amérique
108 108 103 96 95 97 95 99 107 116 125 Asie
108 108 103 95 94 96 95 99 106 114 122 Économies émergentes
107 106 103 99 98 97 97 100 106 113 119 Amérique
108 109 102 93 92 96 94 99 106 115 123 Asie
109 109 104 96 95 96 94 97 104 112 119 Économies nouvellement industrialisées
109 108 103 95 93 96 93 96 103 110 117 Première génération
109 112 107 101 98 98 98 100 107 117 125 Deuxième génération
114 113 109 105 101 98 99 103 111 122 131 Économies en développement : Afrique
109 110 105 104 103 99 100 105 112 123 132 Afrique septentrionale sans le Soudan
117 115 112 106 100 98 98 103 111 122 131 Afrique subsaharienne
118 120 116 111 101 98 98 103 111 123 132 Afrique subsaharienne sans l'Afrique du Sud
107 106 103 100 98 97 97 100 106 114 120 Économies en développement : Amérique
105 103 102 100 99 97 98 100 106 112 118 Amérique centrale et Grandes Antilles sans Porto Rico
102 103 101 98 96 96 95 99 106 116 123 Amérique centrale et Grandes Antilles sans le Mexique et Porto Rico
107 106 103 100 98 97 97 99 106 113 119 Amérique du Sud et Amérique centrale
109 109 105 101 97 97 95 97 104 111 117 Amérique du Sud sans le Brésil
108 108 103 96 95 97 96 99 107 117 126 Économies en développement : Asie
109 109 104 96 95 96 94 97 104 112 120 Asie orientale et Asie du Sud-Est sans la Chine
93 93 94 86 93 98 99 105 115 129 139 Asie méridionale sans l'Inde
Pour les sources et les notes, se reporter à la fin du tableau 4.2.2.
Groupements économiquesImports - Importations
2006
4.2.2 Indices de la valeur unitaire des exportations et importations des groupements économiques2000 = 100
219
4
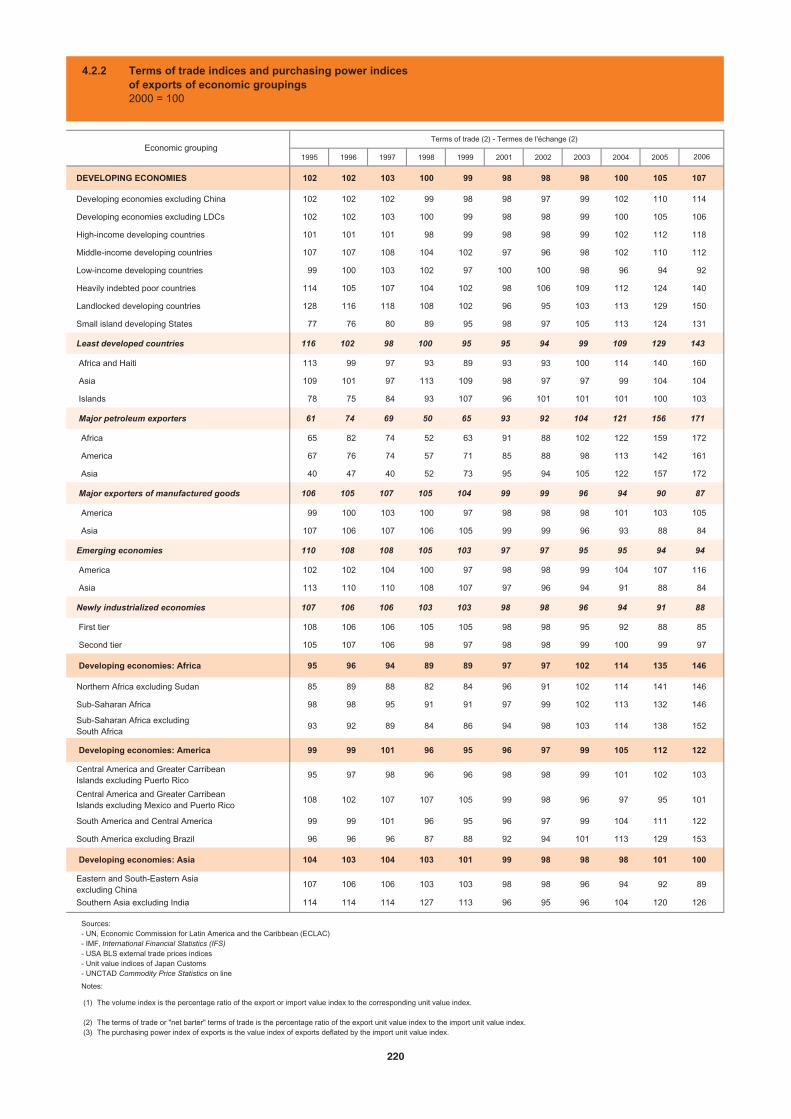
1995 1996 1997 1998 1999 2001 2002 2003 2004 2005
DEVELOPING ECONOMIES 102 102 103 100 99 98 98 98 100 105 107
Developing economies excluding China 102 102 102 99 98 98 97 99 102 110 114
Developing economies excluding LDCs 102 102 103 100 99 98 98 99 100 105 106
High-income developing countries 101 101 101 98 99 98 98 99 102 112 118
Middle-income developing countries 107 107 108 104 102 97 96 98 102 110 112
Low-income developing countries 99 100 103 102 97 100 100 98 96 94 92
Heavily indebted poor countries 114 105 107 104 102 98 106 109 112 124 140
Landlocked developing countries 128 116 118 108 102 96 95 103 113 129 150
Small island developing States 77 76 80 89 95 98 97 105 113 124 131
Least developed countries 116 102 98 100 95 95 94 99 109 129 143
Africa and Haiti 113 99 97 93 89 93 93 100 114 140 160
Asia 109 101 97 113 109 98 97 97 99 104 104
Islands 78 75 84 93 107 96 101 101 101 100 103
Major petroleum exporters 61 74 69 50 65 93 92 104 121 156 171
Africa 65 82 74 52 63 91 88 102 122 159 172
America 67 76 74 57 71 85 88 98 113 142 161
Asia 40 47 40 52 73 95 94 105 122 157 172
Major exporters of manufactured goods 106 105 107 105 104 99 99 96 94 90 87
America 99 100 103 100 97 98 98 98 101 103 105
Asia 107 106 107 106 105 99 99 96 93 88 84
Emerging economies 110 108 108 105 103 97 97 95 95 94 94
America 102 102 104 100 97 98 98 99 104 107 116
Asia 113 110 110 108 107 97 96 94 91 88 84
Newly industrialized economies 107 106 106 103 103 98 98 96 94 91 88
First tier 108 106 106 105 105 98 98 95 92 88 85
Second tier 105 107 106 98 97 98 98 99 100 99 97
Developing economies: Africa 95 96 94 89 89 97 97 102 114 135 146
Northern Africa excluding Sudan 85 89 88 82 84 96 91 102 114 141 146
Sub-Saharan Africa 98 98 95 91 91 97 99 102 113 132 146
Sub-Saharan Africa excluding South Africa
93 92 89 84 86 94 98 103 114 138 152
Developing economies: America 99 99 101 96 95 96 97 99 105 112 122
Central America and Greater Carribean Islands excluding Puerto Rico
95 97 98 96 96 98 98 99 101 102 103
Central America and Greater Carribean Islands excluding Mexico and Puerto Rico
108 102 107 107 105 99 98 96 97 95 101
South America and Central America 99 99 101 96 95 96 97 99 104 111 122
South America excluding Brazil 96 96 96 87 88 92 94 101 113 129 153
Developing economies: Asia 104 103 104 103 101 99 98 98 98 101 100
Eastern and South-Eastern Asia excluding China
107 106 106 103 103 98 98 96 94 92 89
Southern Asia excluding India 114 114 114 127 113 96 95 96 104 120 126
Economic groupingTerms of trade (2) - Termes de l'échange (2)
2006
4.2.2 Terms of trade indices and purchasing power indicesof exports of economic groupings2000 = 100
(1)
(2)(3)
The volume index is the percentage ratio of the export or import value index to the corresponding unit value index.
The terms of trade or "net barter" terms of trade is the percentage ratio of the export unit value index to the import unit value index.The purchasing power index of exports is the value index of exports deflated by the import unit value index.
Sources:- UN, Economic Commission for Latin America and the Caribbean (ECLAC)- IMF, International Financial Statistics (IFS)- USA BLS external trade prices indices - Unit value indices of Japan Customs - UNCTAD Commodity Price Statistics on line
Notes:
220
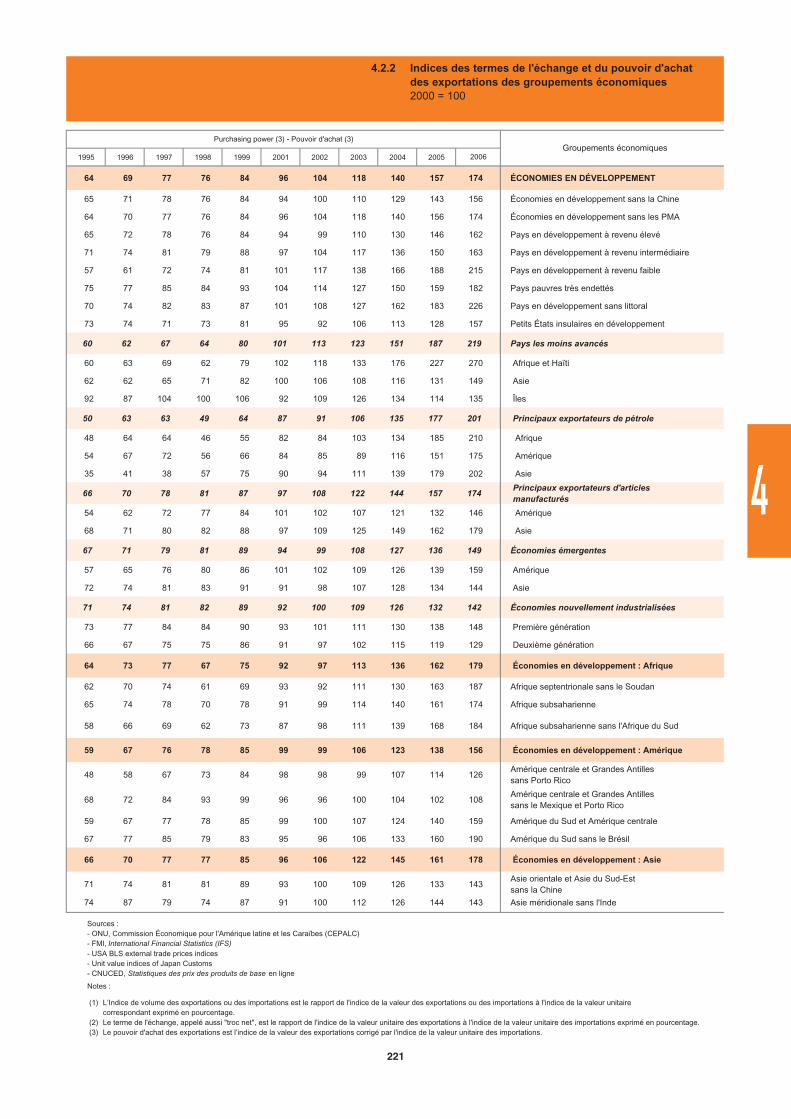
1995 1996 1997 1998 1999 2001 2002 2003 2004 2005
64 69 77 76 84 96 104 118 140 157 174 ÉCONOMIES EN DÉVELOPPEMENT
65 71 78 76 84 94 100 110 129 143 156 Économies en développement sans la Chine
64 70 77 76 84 96 104 118 140 156 174 Économies en développement sans les PMA
65 72 78 76 84 94 99 110 130 146 162 Pays en développement à revenu élevé
71 74 81 79 88 97 104 117 136 150 163 Pays en développement à revenu intermédiaire
57 61 72 74 81 101 117 138 166 188 215 Pays en développement à revenu faible
75 77 85 84 93 104 114 127 150 159 182 Pays pauvres très endettés
70 74 82 83 87 101 108 127 162 183 226 Pays en développement sans littoral
73 74 71 73 81 95 92 106 113 128 157 Petits États insulaires en développement
60 62 67 64 80 101 113 123 151 187 219 Pays les moins avancés
60 63 69 62 79 102 118 133 176 227 270 Afrique et Haïti
62 62 65 71 82 100 106 108 116 131 149 Asie
92 87 104 100 106 92 109 126 134 114 135 Îles
50 63 63 49 64 87 91 106 135 177 201 Principaux exportateurs de pétrole
48 64 64 46 55 82 84 103 134 185 210 Afrique
54 67 72 56 66 84 85 89 116 151 175 Amérique
35 41 38 57 75 90 94 111 139 179 202 Asie
66 70 78 81 87 97 108 122 144 157 174 Principaux exportateurs d'articles manufacturés
54 62 72 77 84 101 102 107 121 132 146 Amérique
68 71 80 82 88 97 109 125 149 162 179 Asie
67 71 79 81 89 94 99 108 127 136 149 Économies émergentes
57 65 76 80 86 101 102 109 126 139 159 Amérique
72 74 81 83 91 91 98 107 128 134 144 Asie
71 74 81 82 89 92 100 109 126 132 142 Économies nouvellement industrialisées
73 77 84 84 90 93 101 111 130 138 148 Première génération
66 67 75 75 86 91 97 102 115 119 129 Deuxième génération
64 73 77 67 75 92 97 113 136 162 179 Économies en développement : Afrique
62 70 74 61 69 93 92 111 130 163 187 Afrique septentrionale sans le Soudan
65 74 78 70 78 91 99 114 140 161 174 Afrique subsaharienne
58 66 69 62 73 87 98 111 139 168 184 Afrique subsaharienne sans l'Afrique du Sud
59 67 76 78 85 99 99 106 123 138 156 Économies en développement : Amérique
48 58 67 73 84 98 98 99 107 114 126 Amérique centrale et Grandes Antilles sans Porto Rico
68 72 84 93 99 96 96 100 104 102 108 Amérique centrale et Grandes Antilles sans le Mexique et Porto Rico
59 67 77 78 85 99 100 107 124 140 159 Amérique du Sud et Amérique centrale
67 77 85 79 83 95 96 106 133 160 190 Amérique du Sud sans le Brésil
66 70 77 77 85 96 106 122 145 161 178 Économies en développement : Asie
71 74 81 81 89 93 100 109 126 133 143 Asie orientale et Asie du Sud-Est sans la Chine
74 87 79 74 87 91 100 112 126 144 143 Asie méridionale sans l'Inde
Groupements économiquesPurchasing power (3) - Pouvoir d'achat (3)
2006
4.2.2 Indices des termes de l'échange et du pouvoir d'achat des exportations des groupements économiques2000 = 100
(1)
(2)(3)
L’Indice de volume des exportations ou des importations est le rapport de l'indice de la valeur des exportations ou des importations à l'indice de la valeur unitaire correspondant exprimé en pourcentage.Le terme de l'échange, appelé aussi "troc net", est le rapport de l'indice de la valeur unitaire des exportations à l'indice de la valeur unitaire des importations exprimé en pourcentage.Le pouvoir d'achat des exportations est l’indice de la valeur des exportations corrigé par l'indice de la valeur unitaire des importations.
Sources : - ONU, Commission Économique pour l'Amérique latine et les Caraïbes (CEPALC)- FMI, International Financial Statistics (IFS)- USA BLS external trade prices indices - Unit value indices of Japan Customs - CNUCED, Statistiques des prix des produits de base en ligne
Notes :
221
4

Chemicalproducts
Produitschimiques
Machineryand
transportequipment
Machineset matériel
detransport
Othermanu-
facturedproducts
Produitsmanu-
facturésdivers
Chemicalproducts
Produitschimiques
Machineryand
transportequipment
Machineset matériel
detransport
Othermanu-
facturedproducts
Produitsmanu-
facturésdivers
SITC Rev.2 (1) / CTCI Rév.2 (1)5+6+7+8+27+28
27+28+68(5+6+7+8)
- 685 7
(6+8)- 68
5+6+7+8+27+28
27+28+68(5+6+7+8)
- 685 7
(6+8)- 68
Albania - Albanie 1997 16.1 12.2 16.3 12.4 8.9 21.0 15.2 15.1 15.2 12.3 9.8 18.72001 10.5 8.3 10.6 7.6 6.0 13.7 11.6 9.5 11.6 8.1 7.2 15.02002 7.2 5.1 7.3 3.8 3.5 10.2 8.6 7.9 8.7 4.8 3.9 11.82005 5.8 2.5 6.1 2.0 2.5 9.1 7.4 0.9 7.6 2.9 4.2 10.7
Algeria - Algérie 1993 24.4 12.1 25.2 13.2 16.8 33.2 18.7 11.5 18.9 13.7 16.5 24.31997 23.5 11.5 24.3 15.5 17.3 30.6 19.4 12.1 19.5 10.0 18.3 25.71998 23.3 11.4 24.1 15.1 17.1 30.4 18.6 12.1 18.7 9.0 17.2 26.02001 21.7 11.4 22.4 13.8 16.8 28.0 17.2 12.7 17.3 9.2 17.0 21.92002 18.6 12.3 19.1 15.7 12.2 23.2 13.1 13.8 13.1 11.6 11.5 16.22003 18.1 11.9 18.6 14.3 11.9 23.0 12.5 10.9 12.5 8.5 11.3 16.52005 18.1 11.9 18.6 14.3 11.8 23.0 12.5 9.6 12.5 8.6 11.7 16.42006 18.1 11.9 18.6 14.3 11.8 23.0 12.5 9.6 12.5 8.6 11.7 16.4
Angola 2002 8.0 9.5 7.9 4.8 3.8 10.9 5.8 6.4 5.8 7.0 4.1 8.72005 6.4 7.2 6.3 4.7 3.0 8.4 5.0 6.5 5.0 7.6 2.8 9.92006 6.4 7.2 6.3 4.7 3.0 8.4 5.0 6.5 5.0 7.6 2.8 9.9
Antigua and Barbuda - 1996 20.6 16.0 20.7 14.5 20.6 21.6 25.0 13.6 25.1 19.1 31.0 20.7Antigua-et-Barbuda 1999 17.2 12.8 17.2 11.3 17.9 18.0 22.1 11.4 22.2 14.7 29.8 16.4
2000 10.1 4.3 10.4 6.3 8.9 12.7 15.3 10.0 15.4 16.0 13.6 17.22001 8.6 3.9 8.9 5.7 8.0 10.5 12.4 7.8 12.5 12.4 12.0 13.12002 8.6 3.9 8.9 5.7 8.0 10.5 12.4 7.8 12.5 12.4 12.0 13.12003 8.6 3.9 8.9 5.7 8.0 10.5 13.9 6.4 13.9 12.7 14.5 13.62006 8.6 3.9 9.0 5.7 7.9 10.6 13.5 6.4 13.5 8.8 14.5 13.6
Argentina - Argentine 1992 13.8 8.1 14.2 9.4 13.6 16.3 13.5 6.5 13.7 8.5 14.5 15.21993 12.5 6.0 12.9 7.6 14.6 14.2 13.4 5.2 13.6 7.7 14.7 14.51995 12.7 6.5 13.1 8.3 9.9 16.3 12.0 5.9 12.2 8.9 11.3 16.11996 13.5 6.3 13.9 8.3 13.4 16.3 14.2 5.8 14.4 8.8 15.5 16.51997 13.6 6.3 14.1 8.3 14.5 16.1 14.7 6.0 14.9 9.3 16.1 16.21998 15.9 9.1 16.4 11.3 15.2 18.8 16.3 8.5 16.5 12.4 16.8 18.51999 15.8 9.1 16.2 11.4 14.9 18.6 15.3 8.6 15.4 12.5 15.2 17.92000 15.7 9.0 16.1 11.4 14.7 18.5 15.1 8.2 15.3 12.4 15.0 17.92001 13.0 8.5 13.3 11.0 14.5 13.6 14.1 7.3 14.3 12.1 15.4 14.32002 14.5 7.3 15.0 9.7 15.0 16.9 12.7 5.1 13.1 10.9 13.9 15.32003 15.2 5.9 15.8 8.3 14.0 19.5 13.6 4.0 14.1 9.5 16.1 16.22004 12.7 7.0 13.1 9.0 8.8 16.5 12.9 4.8 13.2 9.5 14.2 15.02005 11.6 5.8 12.0 8.0 8.5 15.1 12.5 4.0 12.8 8.5 14.3 13.62006 11.6 5.8 12.0 7.9 8.4 15.0 12.5 4.0 12.8 8.4 14.3 13.6
Armenia - Arménie 2001 2.2 0.0 2.4 0.1 1.4 3.7 1.5 0.0 1.6 0.0 2.1 1.82006 2.1 0.4 2.3 0.0 1.9 3.3 2.3 0.1 2.4 0.0 3.4 2.5
Australia - Australie 1991 13.6 2.6 14.4 5.0 11.5 19.1 11.7 5.1 11.8 5.5 9.9 16.81993 10.1 2.4 10.7 4.4 9.3 13.6 10.0 4.9 10.1 5.0 9.4 13.01996 6.5 1.2 6.8 1.9 4.0 9.9 5.4 2.2 5.5 1.8 4.5 8.61997 6.1 1.2 6.5 1.9 4.0 9.3 5.4 2.2 5.4 1.9 4.6 8.11998 5.8 1.2 6.1 1.9 3.9 8.6 5.2 2.1 5.2 1.8 4.5 7.71999 5.5 1.2 5.8 1.9 3.9 8.0 4.9 2.4 4.9 1.8 4.2 7.42000 5.2 1.2 5.4 1.9 3.9 7.5 4.7 2.4 4.7 1.7 4.2 7.12001 4.8 1.1 5.1 1.5 3.2 7.2 4.5 2.3 4.5 1.7 3.9 6.82002 4.9 1.0 5.1 1.5 3.2 7.3 4.6 2.2 4.6 1.7 4.0 6.92003 4.9 1.0 5.1 1.5 3.2 7.3 4.7 2.2 4.7 1.7 4.2 6.92004 4.9 1.0 5.1 1.5 3.2 7.3 4.7 2.5 4.7 1.6 4.2 6.92005 4.0 1.0 4.2 1.5 3.0 5.8 3.8 2.6 3.8 1.5 3.4 5.62006 4.0 1.0 4.2 1.4 3.0 5.7 3.8 2.6 3.8 1.5 3.4 5.6
Azerbaijan - Azerbaïdjan 2002 8.3 4.4 8.5 3.9 5.2 11.7 6.9 3.4 7.0 6.0 4.0 10.62005 8.6 4.3 8.9 4.0 6.0 11.8 5.8 2.1 6.0 5.5 2.8 10.8
Bahamas 1999 32.1 34.3 32.0 34.0 35.6 29.7 32.1 28.7 32.1 26.9 38.5 27.62002 31.6 33.3 31.5 33.5 34.6 29.5 30.3 26.9 30.4 24.6 36.8 26.12006 31.3 33.1 31.1 33.5 34.1 29.0 15.0 31.3 15.0 27.5 13.2 23.4
For sources and notes, see end of table. Pour les sources et les notes, se reporter à la fin du tableau.
Manu-facturedproducts
Produitsmanu-
facturés
Of which: / dont :
Ores and metals
Minéraiset
métaux
Manu-facturedproducts
Produitsmanu-
facturés
Of which: / dont :
Ores and metals
Minéraiset
métaux
Market
Marchés Year
Année
MFN rate - Simple average (2) / Droit NPF - Moyenne simple (2) MFN rate - Weighted average (3) / Droit NPF - Moyenne pondérée (3)
Total of non- agriculturaland non-
fuel products
Total des produits
non-agricoleset
non-pétroliers
of which: / dont :
Total of non- agriculturaland non-
fuel products
Total des produits
non-agricoleset
non-pétroliers
of which: / dont :
4.3 Average applied import MFN tariff rates on non-agricultural and non-fuelproducts
4.3 Droits de douane moyens NPF appliqués àl'importation des produits non-agricoles etnon-pétroliers
222
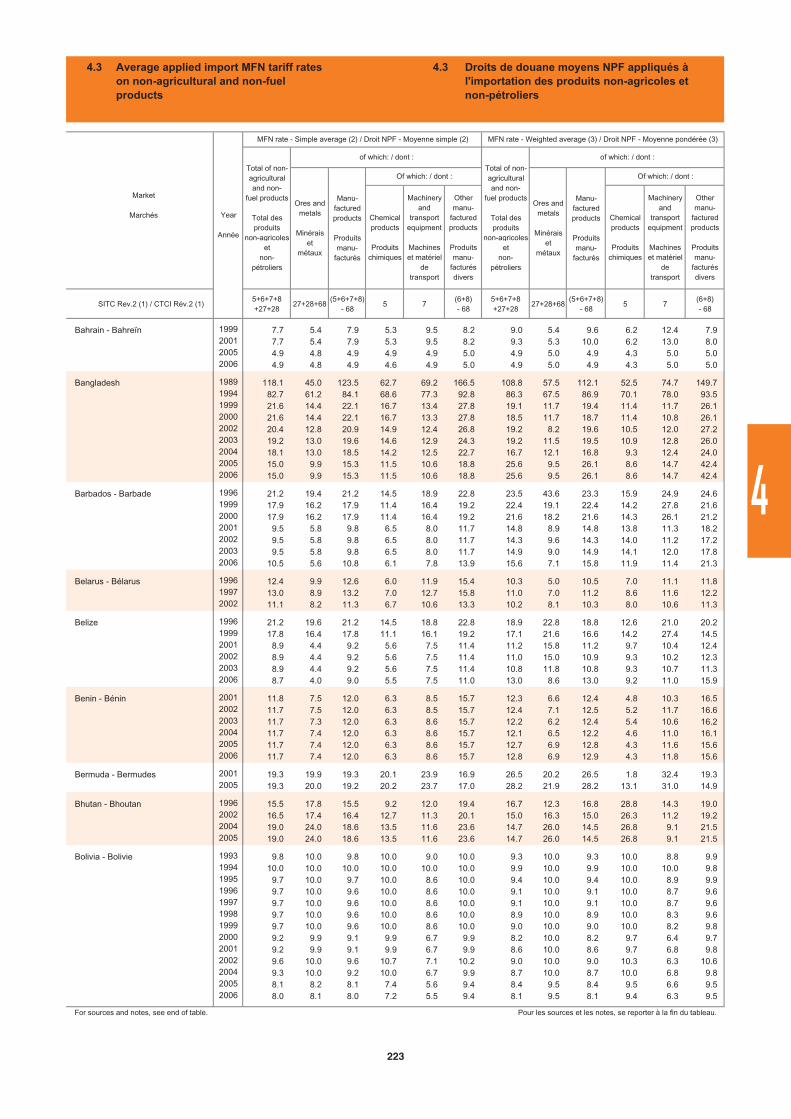
Chemicalproducts
Produitschimiques
Machineryand
transportequipment
Machineset matériel
detransport
Othermanu-
facturedproducts
Produitsmanu-
facturésdivers
Chemicalproducts
Produitschimiques
Machineryand
transportequipment
Machineset matériel
detransport
Othermanu-
facturedproducts
Produitsmanu-
facturésdivers
SITC Rev.2 (1) / CTCI Rév.2 (1)5+6+7+8+27+28
27+28+68(5+6+7+8)
- 685 7
(6+8)- 68
5+6+7+8+27+28
27+28+68(5+6+7+8)
- 685 7
(6+8)- 68
Bahrain - Bahreïn 1999 7.7 5.4 7.9 5.3 9.5 8.2 9.0 5.4 9.6 6.2 12.4 7.92001 7.7 5.4 7.9 5.3 9.5 8.2 9.3 5.3 10.0 6.2 13.0 8.02005 4.9 4.8 4.9 4.9 4.9 5.0 4.9 5.0 4.9 4.3 5.0 5.02006 4.9 4.8 4.9 4.6 4.9 5.0 4.9 5.0 4.9 4.3 5.0 5.0
Bangladesh 1989 118.1 45.0 123.5 62.7 69.2 166.5 108.8 57.5 112.1 52.5 74.7 149.71994 82.7 61.2 84.1 68.6 77.3 92.8 86.3 67.5 86.9 70.1 78.0 93.51999 21.6 14.4 22.1 16.7 13.4 27.8 19.1 11.7 19.4 11.4 11.7 26.12000 21.6 14.4 22.1 16.7 13.3 27.8 18.5 11.7 18.7 11.4 10.8 26.12002 20.4 12.8 20.9 14.9 12.4 26.8 19.2 8.2 19.6 10.5 12.0 27.22003 19.2 13.0 19.6 14.6 12.9 24.3 19.2 11.5 19.5 10.9 12.8 26.02004 18.1 13.0 18.5 14.2 12.5 22.7 16.7 12.1 16.8 9.3 12.4 24.02005 15.0 9.9 15.3 11.5 10.6 18.8 25.6 9.5 26.1 8.6 14.7 42.42006 15.0 9.9 15.3 11.5 10.6 18.8 25.6 9.5 26.1 8.6 14.7 42.4
Barbados - Barbade 1996 21.2 19.4 21.2 14.5 18.9 22.8 23.5 43.6 23.3 15.9 24.9 24.61999 17.9 16.2 17.9 11.4 16.4 19.2 22.4 19.1 22.4 14.2 27.8 21.62000 17.9 16.2 17.9 11.4 16.4 19.2 21.6 18.2 21.6 14.3 26.1 21.22001 9.5 5.8 9.8 6.5 8.0 11.7 14.8 8.9 14.8 13.8 11.3 18.22002 9.5 5.8 9.8 6.5 8.0 11.7 14.3 9.6 14.3 14.0 11.2 17.22003 9.5 5.8 9.8 6.5 8.0 11.7 14.9 9.0 14.9 14.1 12.0 17.82006 10.5 5.6 10.8 6.1 7.8 13.9 15.6 7.1 15.8 11.9 11.4 21.3
Belarus - Bélarus 1996 12.4 9.9 12.6 6.0 11.9 15.4 10.3 5.0 10.5 7.0 11.1 11.81997 13.0 8.9 13.2 7.0 12.7 15.8 11.0 7.0 11.2 8.6 11.6 12.22002 11.1 8.2 11.3 6.7 10.6 13.3 10.2 8.1 10.3 8.0 10.6 11.3
Belize 1996 21.2 19.6 21.2 14.5 18.8 22.8 18.9 22.8 18.8 12.6 21.0 20.21999 17.8 16.4 17.8 11.1 16.1 19.2 17.1 21.6 16.6 14.2 27.4 14.52001 8.9 4.4 9.2 5.6 7.5 11.4 11.2 15.8 11.2 9.7 10.4 12.42002 8.9 4.4 9.2 5.6 7.5 11.4 11.0 15.0 10.9 9.3 10.2 12.32003 8.9 4.4 9.2 5.6 7.5 11.4 10.8 11.8 10.8 9.3 10.7 11.32006 8.7 4.0 9.0 5.5 7.5 11.0 13.0 8.6 13.0 9.2 11.0 15.9
Benin - Bénin 2001 11.8 7.5 12.0 6.3 8.5 15.7 12.3 6.6 12.4 4.8 10.3 16.52002 11.7 7.5 12.0 6.3 8.5 15.7 12.4 7.1 12.5 5.2 11.7 16.62003 11.7 7.3 12.0 6.3 8.6 15.7 12.2 6.2 12.4 5.4 10.6 16.22004 11.7 7.4 12.0 6.3 8.6 15.7 12.1 6.5 12.2 4.6 11.0 16.12005 11.7 7.4 12.0 6.3 8.6 15.7 12.7 6.9 12.8 4.3 11.6 15.62006 11.7 7.4 12.0 6.3 8.6 15.7 12.8 6.9 12.9 4.3 11.8 15.6
Bermuda - Bermudes 2001 19.3 19.9 19.3 20.1 23.9 16.9 26.5 20.2 26.5 1.8 32.4 19.32005 19.3 20.0 19.2 20.2 23.7 17.0 28.2 21.9 28.2 13.1 31.0 14.9
Bhutan - Bhoutan 1996 15.5 17.8 15.5 9.2 12.0 19.4 16.7 12.3 16.8 28.8 14.3 19.02002 16.5 17.4 16.4 12.7 11.3 20.1 15.0 16.3 15.0 26.3 11.2 19.22004 19.0 24.0 18.6 13.5 11.6 23.6 14.7 26.0 14.5 26.8 9.1 21.52005 19.0 24.0 18.6 13.5 11.6 23.6 14.7 26.0 14.5 26.8 9.1 21.5
Bolivia - Bolivie 1993 9.8 10.0 9.8 10.0 9.0 10.0 9.3 10.0 9.3 10.0 8.8 9.91994 10.0 10.0 10.0 10.0 10.0 10.0 9.9 10.0 9.9 10.0 10.0 9.81995 9.7 10.0 9.7 10.0 8.6 10.0 9.4 10.0 9.4 10.0 8.9 9.91996 9.7 10.0 9.6 10.0 8.6 10.0 9.1 10.0 9.1 10.0 8.7 9.61997 9.7 10.0 9.6 10.0 8.6 10.0 9.1 10.0 9.1 10.0 8.7 9.61998 9.7 10.0 9.6 10.0 8.6 10.0 8.9 10.0 8.9 10.0 8.3 9.61999 9.7 10.0 9.6 10.0 8.6 10.0 9.0 10.0 9.0 10.0 8.2 9.82000 9.2 9.9 9.1 9.9 6.7 9.9 8.2 10.0 8.2 9.7 6.4 9.72001 9.2 9.9 9.1 9.9 6.7 9.9 8.6 10.0 8.6 9.7 6.8 9.82002 9.6 10.0 9.6 10.7 7.1 10.2 9.0 10.0 9.0 10.3 6.3 10.62004 9.3 10.0 9.2 10.0 6.7 9.9 8.7 10.0 8.7 10.0 6.8 9.82005 8.1 8.2 8.1 7.4 5.6 9.4 8.4 9.5 8.4 9.5 6.6 9.52006 8.0 8.1 8.0 7.2 5.5 9.4 8.1 9.5 8.1 9.4 6.3 9.5
For sources and notes, see end of table. Pour les sources et les notes, se reporter à la fin du tableau.
Market
Marchés Year
Année
MFN rate - Simple average (2) / Droit NPF - Moyenne simple (2) MFN rate - Weighted average (3) / Droit NPF - Moyenne pondérée (3)
Total of non- agriculturaland non-
fuel products
Total des produits
non-agricoleset
non-pétroliers
of which: / dont :
Total of non- agriculturaland non-
fuel products
Total des produits
non-agricoleset
non-pétroliers
of which: / dont :
Manu-facturedproducts
Produitsmanu-
facturés
Of which: / dont :
Ores and metals
Minéraiset
métaux
Manu-facturedproducts
Produitsmanu-
facturés
Of which: / dont :
Ores and metals
Minéraiset
métaux
4.3 Average applied import MFN tariff rates on non-agricultural and non-fuelproducts
4.3 Droits de douane moyens NPF appliqués àl'importation des produits non-agricoles etnon-pétroliers
223
4
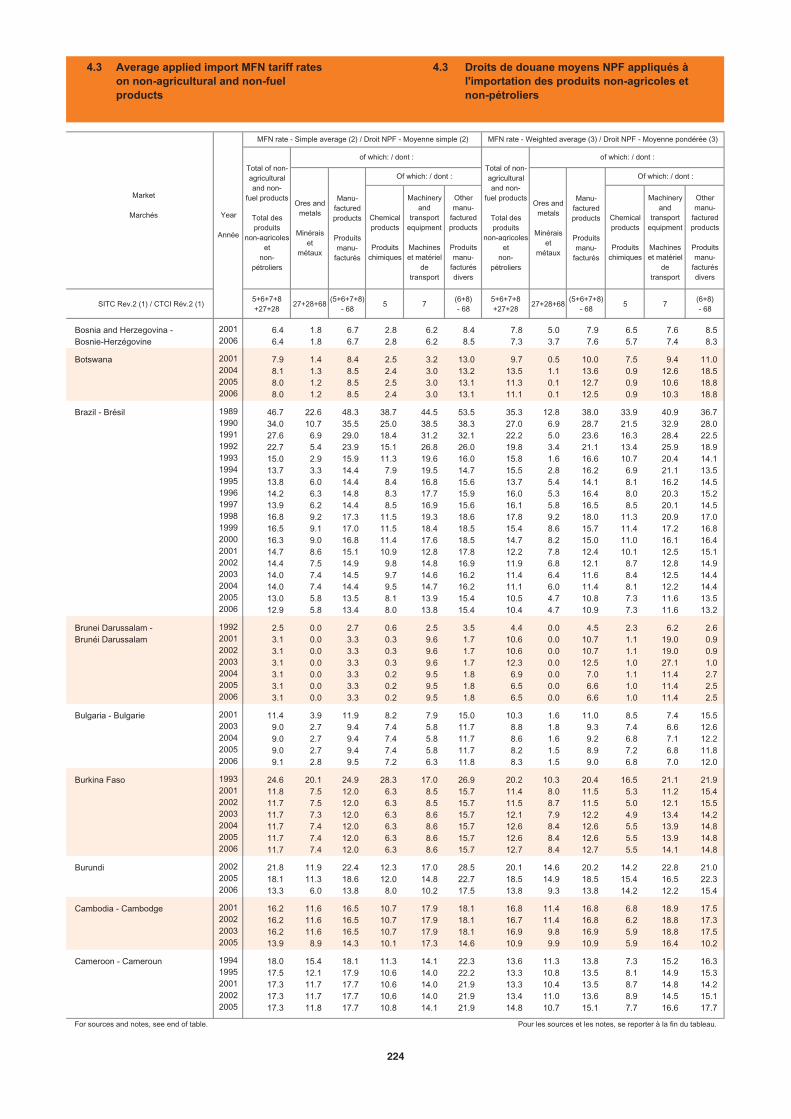
Chemicalproducts
Produitschimiques
Machineryand
transportequipment
Machineset matériel
detransport
Othermanu-
facturedproducts
Produitsmanu-
facturésdivers
Chemicalproducts
Produitschimiques
Machineryand
transportequipment
Machineset matériel
detransport
Othermanu-
facturedproducts
Produitsmanu-
facturésdivers
SITC Rev.2 (1) / CTCI Rév.2 (1)5+6+7+8+27+28
27+28+68(5+6+7+8)
- 685 7
(6+8)- 68
5+6+7+8+27+28
27+28+68(5+6+7+8)
- 685 7
(6+8)- 68
Bosnia and Herzegovina - 2001 6.4 1.8 6.7 2.8 6.2 8.4 7.8 5.0 7.9 6.5 7.6 8.5Bosnie-Herzégovine 2006 6.4 1.8 6.7 2.8 6.2 8.5 7.3 3.7 7.6 5.7 7.4 8.3
Botswana 2001 7.9 1.4 8.4 2.5 3.2 13.0 9.7 0.5 10.0 7.5 9.4 11.02004 8.1 1.3 8.5 2.4 3.0 13.2 13.5 1.1 13.6 0.9 12.6 18.52005 8.0 1.2 8.5 2.5 3.0 13.1 11.3 0.1 12.7 0.9 10.6 18.82006 8.0 1.2 8.5 2.4 3.0 13.1 11.1 0.1 12.5 0.9 10.3 18.8
Brazil - Brésil 1989 46.7 22.6 48.3 38.7 44.5 53.5 35.3 12.8 38.0 33.9 40.9 36.71990 34.0 10.7 35.5 25.0 38.5 38.3 27.0 6.9 28.7 21.5 32.9 28.01991 27.6 6.9 29.0 18.4 31.2 32.1 22.2 5.0 23.6 16.3 28.4 22.51992 22.7 5.4 23.9 15.1 26.8 26.0 19.8 3.4 21.1 13.4 25.9 18.91993 15.0 2.9 15.9 11.3 19.6 16.0 15.8 1.6 16.6 10.7 20.4 14.11994 13.7 3.3 14.4 7.9 19.5 14.7 15.5 2.8 16.2 6.9 21.1 13.51995 13.8 6.0 14.4 8.4 16.8 15.6 13.7 5.4 14.1 8.1 16.2 14.51996 14.2 6.3 14.8 8.3 17.7 15.9 16.0 5.3 16.4 8.0 20.3 15.21997 13.9 6.2 14.4 8.5 16.9 15.6 16.1 5.8 16.5 8.5 20.1 14.51998 16.8 9.2 17.3 11.5 19.3 18.6 17.8 9.2 18.0 11.3 20.9 17.01999 16.5 9.1 17.0 11.5 18.4 18.5 15.4 8.6 15.7 11.4 17.2 16.82000 16.3 9.0 16.8 11.4 17.6 18.5 14.7 8.2 15.0 11.0 16.1 16.42001 14.7 8.6 15.1 10.9 12.8 17.8 12.2 7.8 12.4 10.1 12.5 15.12002 14.4 7.5 14.9 9.8 14.8 16.9 11.9 6.8 12.1 8.7 12.8 14.92003 14.0 7.4 14.5 9.7 14.6 16.2 11.4 6.4 11.6 8.4 12.5 14.42004 14.0 7.4 14.4 9.5 14.7 16.2 11.1 6.0 11.4 8.1 12.2 14.42005 13.0 5.8 13.5 8.1 13.9 15.4 10.5 4.7 10.8 7.3 11.6 13.52006 12.9 5.8 13.4 8.0 13.8 15.4 10.4 4.7 10.9 7.3 11.6 13.2
Brunei Darussalam - 1992 2.5 0.0 2.7 0.6 2.5 3.5 4.4 0.0 4.5 2.3 6.2 2.6Brunéi Darussalam 2001 3.1 0.0 3.3 0.3 9.6 1.7 10.6 0.0 10.7 1.1 19.0 0.9
2002 3.1 0.0 3.3 0.3 9.6 1.7 10.6 0.0 10.7 1.1 19.0 0.92003 3.1 0.0 3.3 0.3 9.6 1.7 12.3 0.0 12.5 1.0 27.1 1.02004 3.1 0.0 3.3 0.2 9.5 1.8 6.9 0.0 7.0 1.1 11.4 2.72005 3.1 0.0 3.3 0.2 9.5 1.8 6.5 0.0 6.6 1.0 11.4 2.52006 3.1 0.0 3.3 0.2 9.5 1.8 6.5 0.0 6.6 1.0 11.4 2.5
Bulgaria - Bulgarie 2001 11.4 3.9 11.9 8.2 7.9 15.0 10.3 1.6 11.0 8.5 7.4 15.52003 9.0 2.7 9.4 7.4 5.8 11.7 8.8 1.8 9.3 7.4 6.6 12.62004 9.0 2.7 9.4 7.4 5.8 11.7 8.6 1.6 9.2 6.8 7.1 12.22005 9.0 2.7 9.4 7.4 5.8 11.7 8.2 1.5 8.9 7.2 6.8 11.82006 9.1 2.8 9.5 7.2 6.3 11.8 8.3 1.5 9.0 6.8 7.0 12.0
Burkina Faso 1993 24.6 20.1 24.9 28.3 17.0 26.9 20.2 10.3 20.4 16.5 21.1 21.92001 11.8 7.5 12.0 6.3 8.5 15.7 11.4 8.0 11.5 5.3 11.2 15.42002 11.7 7.5 12.0 6.3 8.5 15.7 11.5 8.7 11.5 5.0 12.1 15.52003 11.7 7.3 12.0 6.3 8.6 15.7 12.1 7.9 12.2 4.9 13.4 14.22004 11.7 7.4 12.0 6.3 8.6 15.7 12.6 8.4 12.6 5.5 13.9 14.82005 11.7 7.4 12.0 6.3 8.6 15.7 12.6 8.4 12.6 5.5 13.9 14.82006 11.7 7.4 12.0 6.3 8.6 15.7 12.7 8.4 12.7 5.5 14.1 14.8
Burundi 2002 21.8 11.9 22.4 12.3 17.0 28.5 20.1 14.6 20.2 14.2 22.8 21.02005 18.1 11.3 18.6 12.0 14.8 22.7 18.5 14.9 18.5 15.4 16.5 22.32006 13.3 6.0 13.8 8.0 10.2 17.5 13.8 9.3 13.8 14.2 12.2 15.4
Cambodia - Cambodge 2001 16.2 11.6 16.5 10.7 17.9 18.1 16.8 11.4 16.8 6.8 18.9 17.52002 16.2 11.6 16.5 10.7 17.9 18.1 16.7 11.4 16.8 6.2 18.8 17.32003 16.2 11.6 16.5 10.7 17.9 18.1 16.9 9.8 16.9 5.9 18.8 17.52005 13.9 8.9 14.3 10.1 17.3 14.6 10.9 9.9 10.9 5.9 16.4 10.2
Cameroon - Cameroun 1994 18.0 15.4 18.1 11.3 14.1 22.3 13.6 11.3 13.8 7.3 15.2 16.31995 17.5 12.1 17.9 10.6 14.0 22.2 13.3 10.8 13.5 8.1 14.9 15.32001 17.3 11.7 17.7 10.6 14.0 21.9 13.3 10.4 13.5 8.7 14.8 14.22002 17.3 11.7 17.7 10.6 14.0 21.9 13.4 11.0 13.6 8.9 14.5 15.12005 17.3 11.8 17.7 10.8 14.1 21.9 14.8 10.7 15.1 7.7 16.6 17.7
For sources and notes, see end of table. Pour les sources et les notes, se reporter à la fin du tableau.
Market
Marchés Year
Année
MFN rate - Simple average (2) / Droit NPF - Moyenne simple (2) MFN rate - Weighted average (3) / Droit NPF - Moyenne pondérée (3)
Total of non- agriculturaland non-
fuel products
Total des produits
non-agricoleset
non-pétroliers
of which: / dont :
Total of non- agriculturaland non-
fuel products
Total des produits
non-agricoleset
non-pétroliers
of which: / dont :
Ores and metals
Minéraiset
métaux
Manu-facturedproducts
Produitsmanu-
facturés
Of which: / dont :
Ores and metals
Minéraiset
métaux
Manu-facturedproducts
Produitsmanu-
facturés
Of which: / dont :
4.3 Average applied import MFN tariff rates on non-agricultural and non-fuelproducts
4.3 Droits de douane moyens NPF appliqués àl'importation des produits non-agricoles etnon-pétroliers
224
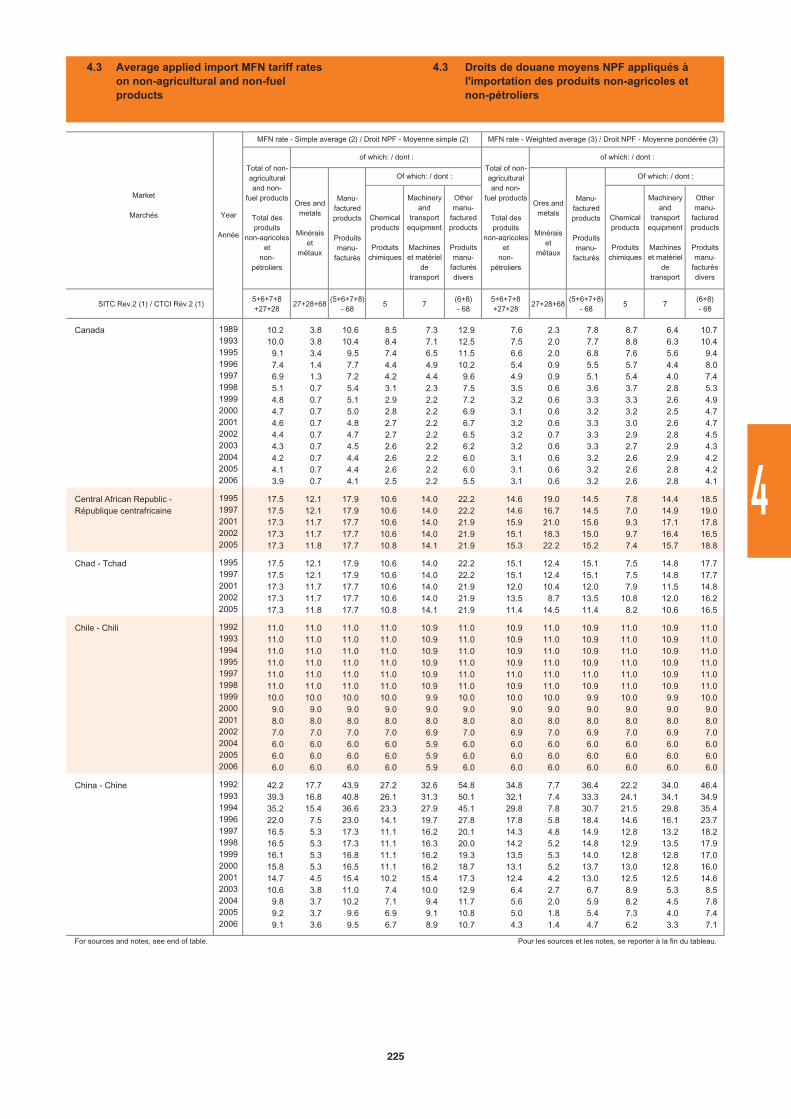
Chemicalproducts
Produitschimiques
Machineryand
transportequipment
Machineset matériel
detransport
Othermanu-
facturedproducts
Produitsmanu-
facturésdivers
Chemicalproducts
Produitschimiques
Machineryand
transportequipment
Machineset matériel
detransport
Othermanu-
facturedproducts
Produitsmanu-
facturésdivers
SITC Rev.2 (1) / CTCI Rév.2 (1)5+6+7+8+27+28
27+28+68(5+6+7+8)
- 685 7
(6+8)- 68
5+6+7+8+27+28
27+28+68(5+6+7+8)
- 685 7
(6+8)- 68
Canada 1989 10.2 3.8 10.6 8.5 7.3 12.9 7.6 2.3 7.8 8.7 6.4 10.71993 10.0 3.8 10.4 8.4 7.1 12.5 7.5 2.0 7.7 8.8 6.3 10.41995 9.1 3.4 9.5 7.4 6.5 11.5 6.6 2.0 6.8 7.6 5.6 9.41996 7.4 1.4 7.7 4.4 4.9 10.2 5.4 0.9 5.5 5.7 4.4 8.01997 6.9 1.3 7.2 4.2 4.4 9.6 4.9 0.9 5.1 5.4 4.0 7.41998 5.1 0.7 5.4 3.1 2.3 7.5 3.5 0.6 3.6 3.7 2.8 5.31999 4.8 0.7 5.1 2.9 2.2 7.2 3.2 0.6 3.3 3.3 2.6 4.92000 4.7 0.7 5.0 2.8 2.2 6.9 3.1 0.6 3.2 3.2 2.5 4.72001 4.6 0.7 4.8 2.7 2.2 6.7 3.2 0.6 3.3 3.0 2.6 4.72002 4.4 0.7 4.7 2.7 2.2 6.5 3.2 0.7 3.3 2.9 2.8 4.52003 4.3 0.7 4.5 2.6 2.2 6.2 3.2 0.6 3.3 2.7 2.9 4.32004 4.2 0.7 4.4 2.6 2.2 6.0 3.1 0.6 3.2 2.6 2.9 4.22005 4.1 0.7 4.4 2.6 2.2 6.0 3.1 0.6 3.2 2.6 2.8 4.22006 3.9 0.7 4.1 2.5 2.2 5.5 3.1 0.6 3.2 2.6 2.8 4.1
Central African Republic - 1995 17.5 12.1 17.9 10.6 14.0 22.2 14.6 19.0 14.5 7.8 14.4 18.5République centrafricaine 1997 17.5 12.1 17.9 10.6 14.0 22.2 14.6 16.7 14.5 7.0 14.9 19.0
2001 17.3 11.7 17.7 10.6 14.0 21.9 15.9 21.0 15.6 9.3 17.1 17.82002 17.3 11.7 17.7 10.6 14.0 21.9 15.1 18.3 15.0 9.7 16.4 16.52005 17.3 11.8 17.7 10.8 14.1 21.9 15.3 22.2 15.2 7.4 15.7 18.8
Chad - Tchad 1995 17.5 12.1 17.9 10.6 14.0 22.2 15.1 12.4 15.1 7.5 14.8 17.71997 17.5 12.1 17.9 10.6 14.0 22.2 15.1 12.4 15.1 7.5 14.8 17.72001 17.3 11.7 17.7 10.6 14.0 21.9 12.0 10.4 12.0 7.9 11.5 14.82002 17.3 11.7 17.7 10.6 14.0 21.9 13.5 8.7 13.5 10.8 12.0 16.22005 17.3 11.8 17.7 10.8 14.1 21.9 11.4 14.5 11.4 8.2 10.6 16.5
Chile - Chili 1992 11.0 11.0 11.0 11.0 10.9 11.0 10.9 11.0 10.9 11.0 10.9 11.01993 11.0 11.0 11.0 11.0 10.9 11.0 10.9 11.0 10.9 11.0 10.9 11.01994 11.0 11.0 11.0 11.0 10.9 11.0 10.9 11.0 10.9 11.0 10.9 11.01995 11.0 11.0 11.0 11.0 10.9 11.0 10.9 11.0 10.9 11.0 10.9 11.01997 11.0 11.0 11.0 11.0 10.9 11.0 11.0 11.0 11.0 11.0 10.9 11.01998 11.0 11.0 11.0 11.0 10.9 11.0 10.9 11.0 10.9 11.0 10.9 11.01999 10.0 10.0 10.0 10.0 9.9 10.0 10.0 10.0 9.9 10.0 9.9 10.02000 9.0 9.0 9.0 9.0 9.0 9.0 9.0 9.0 9.0 9.0 9.0 9.02001 8.0 8.0 8.0 8.0 8.0 8.0 8.0 8.0 8.0 8.0 8.0 8.02002 7.0 7.0 7.0 7.0 6.9 7.0 6.9 7.0 6.9 7.0 6.9 7.02004 6.0 6.0 6.0 6.0 5.9 6.0 6.0 6.0 6.0 6.0 6.0 6.02005 6.0 6.0 6.0 6.0 5.9 6.0 6.0 6.0 6.0 6.0 6.0 6.02006 6.0 6.0 6.0 6.0 5.9 6.0 6.0 6.0 6.0 6.0 6.0 6.0
China - Chine 1992 42.2 17.7 43.9 27.2 32.6 54.8 34.8 7.7 36.4 22.2 34.0 46.41993 39.3 16.8 40.8 26.1 31.3 50.1 32.1 7.4 33.3 24.1 34.1 34.91994 35.2 15.4 36.6 23.3 27.9 45.1 29.8 7.8 30.7 21.5 29.8 35.41996 22.0 7.5 23.0 14.1 19.7 27.8 17.8 5.8 18.4 14.6 16.1 23.71997 16.5 5.3 17.3 11.1 16.2 20.1 14.3 4.8 14.9 12.8 13.2 18.21998 16.5 5.3 17.3 11.1 16.3 20.0 14.2 5.2 14.8 12.9 13.5 17.91999 16.1 5.3 16.8 11.1 16.2 19.3 13.5 5.3 14.0 12.8 12.8 17.02000 15.8 5.3 16.5 11.1 16.2 18.7 13.1 5.2 13.7 13.0 12.8 16.02001 14.7 4.5 15.4 10.2 15.4 17.3 12.4 4.2 13.0 12.5 12.5 14.62003 10.6 3.8 11.0 7.4 10.0 12.9 6.4 2.7 6.7 8.9 5.3 8.52004 9.8 3.7 10.2 7.1 9.4 11.7 5.6 2.0 5.9 8.2 4.5 7.82005 9.2 3.7 9.6 6.9 9.1 10.8 5.0 1.8 5.4 7.3 4.0 7.42006 9.1 3.6 9.5 6.7 8.9 10.7 4.3 1.4 4.7 6.2 3.3 7.1
For sources and notes, see end of table. Pour les sources et les notes, se reporter à la fin du tableau.
Market
Marchés Year
Année
MFN rate - Simple average (2) / Droit NPF - Moyenne simple (2) MFN rate - Weighted average (3) / Droit NPF - Moyenne pondérée (3)
Total of non- agriculturaland non-
fuel products
Total des produits
non-agricoleset
non-pétroliers
of which: / dont :
Total of non- agriculturaland non-
fuel products
Total des produits
non-agricoleset
non-pétroliers
of which: / dont :
Manu-facturedproducts
Produitsmanu-
facturés
Of which: / dont :
Ores and metals
Minéraiset
métaux
Manu-facturedproducts
Produitsmanu-
facturés
Of which: / dont :
Ores and metals
Minéraiset
métaux
4.3 Average applied import MFN tariff rates on non-agricultural and non-fuelproducts
4.3 Droits de douane moyens NPF appliqués àl'importation des produits non-agricoles etnon-pétroliers
225
4
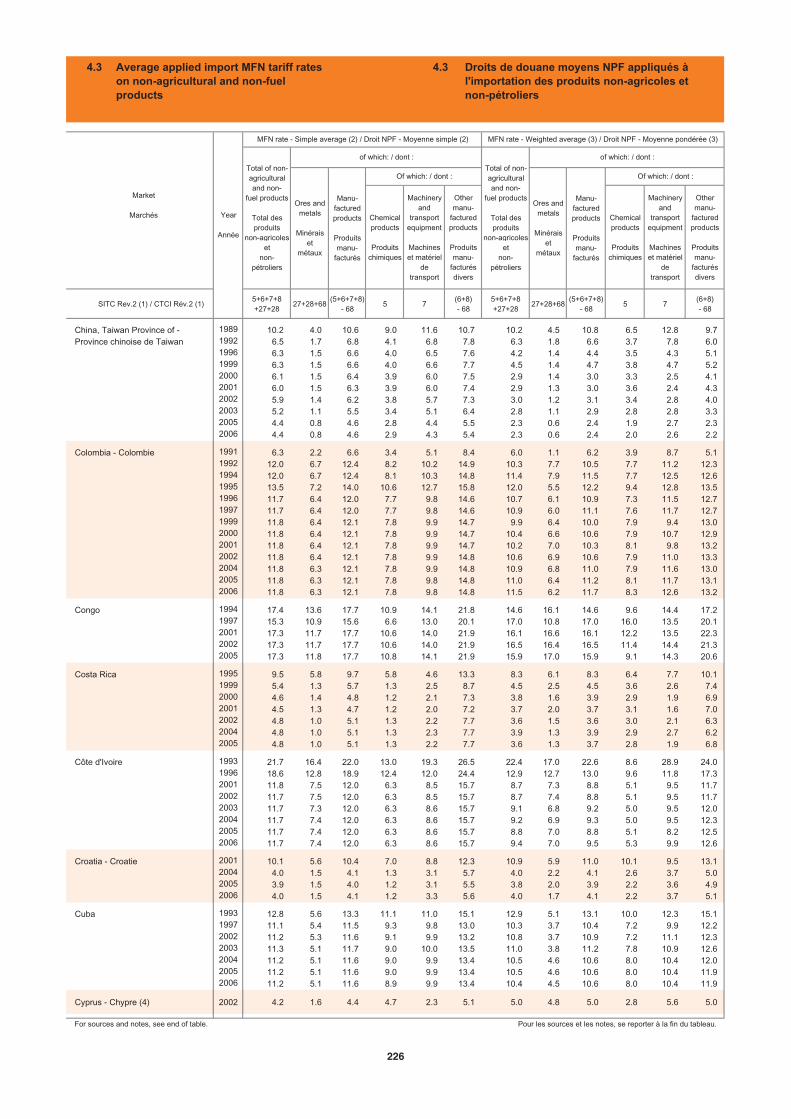
Chemicalproducts
Produitschimiques
Machineryand
transportequipment
Machineset matériel
detransport
Othermanu-
facturedproducts
Produitsmanu-
facturésdivers
Chemicalproducts
Produitschimiques
Machineryand
transportequipment
Machineset matériel
detransport
Othermanu-
facturedproducts
Produitsmanu-
facturésdivers
SITC Rev.2 (1) / CTCI Rév.2 (1)5+6+7+8+27+28
27+28+68(5+6+7+8)
- 685 7
(6+8)- 68
5+6+7+8+27+28
27+28+68(5+6+7+8)
- 685 7
(6+8)- 68
China, Taiwan Province of - 1989 10.2 4.0 10.6 9.0 11.6 10.7 10.2 4.5 10.8 6.5 12.8 9.7Province chinoise de Taiwan 1992 6.5 1.7 6.8 4.1 6.8 7.8 6.3 1.8 6.6 3.7 7.8 6.0
1996 6.3 1.5 6.6 4.0 6.5 7.6 4.2 1.4 4.4 3.5 4.3 5.11999 6.3 1.5 6.6 4.0 6.6 7.7 4.5 1.4 4.7 3.8 4.7 5.22000 6.1 1.5 6.4 3.9 6.0 7.5 2.9 1.4 3.0 3.3 2.5 4.12001 6.0 1.5 6.3 3.9 6.0 7.4 2.9 1.3 3.0 3.6 2.4 4.32002 5.9 1.4 6.2 3.8 5.7 7.3 3.0 1.2 3.1 3.4 2.8 4.02003 5.2 1.1 5.5 3.4 5.1 6.4 2.8 1.1 2.9 2.8 2.8 3.32005 4.4 0.8 4.6 2.8 4.4 5.5 2.3 0.6 2.4 1.9 2.7 2.32006 4.4 0.8 4.6 2.9 4.3 5.4 2.3 0.6 2.4 2.0 2.6 2.2
Colombia - Colombie 1991 6.3 2.2 6.6 3.4 5.1 8.4 6.0 1.1 6.2 3.9 8.7 5.11992 12.0 6.7 12.4 8.2 10.2 14.9 10.3 7.7 10.5 7.7 11.2 12.31994 12.0 6.7 12.4 8.1 10.3 14.8 11.4 7.9 11.5 7.7 12.5 12.61995 13.5 7.2 14.0 10.6 12.7 15.8 12.0 5.5 12.2 9.4 12.8 13.51996 11.7 6.4 12.0 7.7 9.8 14.6 10.7 6.1 10.9 7.3 11.5 12.71997 11.7 6.4 12.0 7.7 9.8 14.6 10.9 6.0 11.1 7.6 11.7 12.71999 11.8 6.4 12.1 7.8 9.9 14.7 9.9 6.4 10.0 7.9 9.4 13.02000 11.8 6.4 12.1 7.8 9.9 14.7 10.4 6.6 10.6 7.9 10.7 12.92001 11.8 6.4 12.1 7.8 9.9 14.7 10.2 7.0 10.3 8.1 9.8 13.22002 11.8 6.4 12.1 7.8 9.9 14.8 10.6 6.9 10.6 7.9 11.0 13.32004 11.8 6.3 12.1 7.8 9.9 14.8 10.9 6.8 11.0 7.9 11.6 13.02005 11.8 6.3 12.1 7.8 9.8 14.8 11.0 6.4 11.2 8.1 11.7 13.12006 11.8 6.3 12.1 7.8 9.8 14.8 11.5 6.2 11.7 8.3 12.6 13.2
Congo 1994 17.4 13.6 17.7 10.9 14.1 21.8 14.6 16.1 14.6 9.6 14.4 17.21997 15.3 10.9 15.6 6.6 13.0 20.1 17.0 10.8 17.0 16.0 13.5 20.12001 17.3 11.7 17.7 10.6 14.0 21.9 16.1 16.6 16.1 12.2 13.5 22.32002 17.3 11.7 17.7 10.6 14.0 21.9 16.5 16.4 16.5 11.4 14.4 21.32005 17.3 11.8 17.7 10.8 14.1 21.9 15.9 17.0 15.9 9.1 14.3 20.6
Costa Rica 1995 9.5 5.8 9.7 5.8 4.6 13.3 8.3 6.1 8.3 6.4 7.7 10.11999 5.4 1.3 5.7 1.3 2.5 8.7 4.5 2.5 4.5 3.6 2.6 7.42000 4.6 1.4 4.8 1.2 2.1 7.3 3.8 1.6 3.9 2.9 1.9 6.92001 4.5 1.3 4.7 1.2 2.0 7.2 3.7 2.0 3.7 3.1 1.6 7.02002 4.8 1.0 5.1 1.3 2.2 7.7 3.6 1.5 3.6 3.0 2.1 6.32004 4.8 1.0 5.1 1.3 2.3 7.7 3.9 1.3 3.9 2.9 2.7 6.22005 4.8 1.0 5.1 1.3 2.2 7.7 3.6 1.3 3.7 2.8 1.9 6.8
Côte d'Ivoire 1993 21.7 16.4 22.0 13.0 19.3 26.5 22.4 17.0 22.6 8.6 28.9 24.01996 18.6 12.8 18.9 12.4 12.0 24.4 12.9 12.7 13.0 9.6 11.8 17.32001 11.8 7.5 12.0 6.3 8.5 15.7 8.7 7.3 8.8 5.1 9.5 11.72002 11.7 7.5 12.0 6.3 8.5 15.7 8.7 7.4 8.8 5.1 9.5 11.72003 11.7 7.3 12.0 6.3 8.6 15.7 9.1 6.8 9.2 5.0 9.5 12.02004 11.7 7.4 12.0 6.3 8.6 15.7 9.2 6.9 9.3 5.0 9.5 12.32005 11.7 7.4 12.0 6.3 8.6 15.7 8.8 7.0 8.8 5.1 8.2 12.52006 11.7 7.4 12.0 6.3 8.6 15.7 9.4 7.0 9.5 5.3 9.9 12.6
Croatia - Croatie 2001 10.1 5.6 10.4 7.0 8.8 12.3 10.9 5.9 11.0 10.1 9.5 13.12004 4.0 1.5 4.1 1.3 3.1 5.7 4.0 2.2 4.1 2.6 3.7 5.02005 3.9 1.5 4.0 1.2 3.1 5.5 3.8 2.0 3.9 2.2 3.6 4.92006 4.0 1.5 4.1 1.2 3.3 5.6 4.0 1.7 4.1 2.2 3.7 5.1
Cuba 1993 12.8 5.6 13.3 11.1 11.0 15.1 12.9 5.1 13.1 10.0 12.3 15.11997 11.1 5.4 11.5 9.3 9.8 13.0 10.3 3.7 10.4 7.2 9.9 12.22002 11.2 5.3 11.6 9.1 9.9 13.2 10.8 3.7 10.9 7.2 11.1 12.32003 11.3 5.1 11.7 9.0 10.0 13.5 11.0 3.8 11.2 7.8 10.9 12.62004 11.2 5.1 11.6 9.0 9.9 13.4 10.5 4.6 10.6 8.0 10.4 12.02005 11.2 5.1 11.6 9.0 9.9 13.4 10.5 4.6 10.6 8.0 10.4 11.92006 11.2 5.1 11.6 8.9 9.9 13.4 10.4 4.5 10.6 8.0 10.4 11.9
Cyprus - Chypre (4) 2002 4.2 1.6 4.4 4.7 2.3 5.1 5.0 4.8 5.0 2.8 5.6 5.0
For sources and notes, see end of table. Pour les sources et les notes, se reporter à la fin du tableau.
Market
Marchés Year
Année
MFN rate - Simple average (2) / Droit NPF - Moyenne simple (2) MFN rate - Weighted average (3) / Droit NPF - Moyenne pondérée (3)
Total of non- agriculturaland non-
fuel products
Total des produits
non-agricoleset
non-pétroliers
of which: / dont :
Total of non- agriculturaland non-
fuel products
Total des produits
non-agricoleset
non-pétroliers
of which: / dont :
Ores and metals
Minéraiset
métaux
Manu-facturedproducts
Produitsmanu-
facturés
Of which: / dont :
Ores and metals
Minéraiset
métaux
Manu-facturedproducts
Produitsmanu-
facturés
Of which: / dont :
4.3 Average applied import MFN tariff rates on non-agricultural and non-fuelproducts
4.3 Droits de douane moyens NPF appliqués àl'importation des produits non-agricoles etnon-pétroliers
226
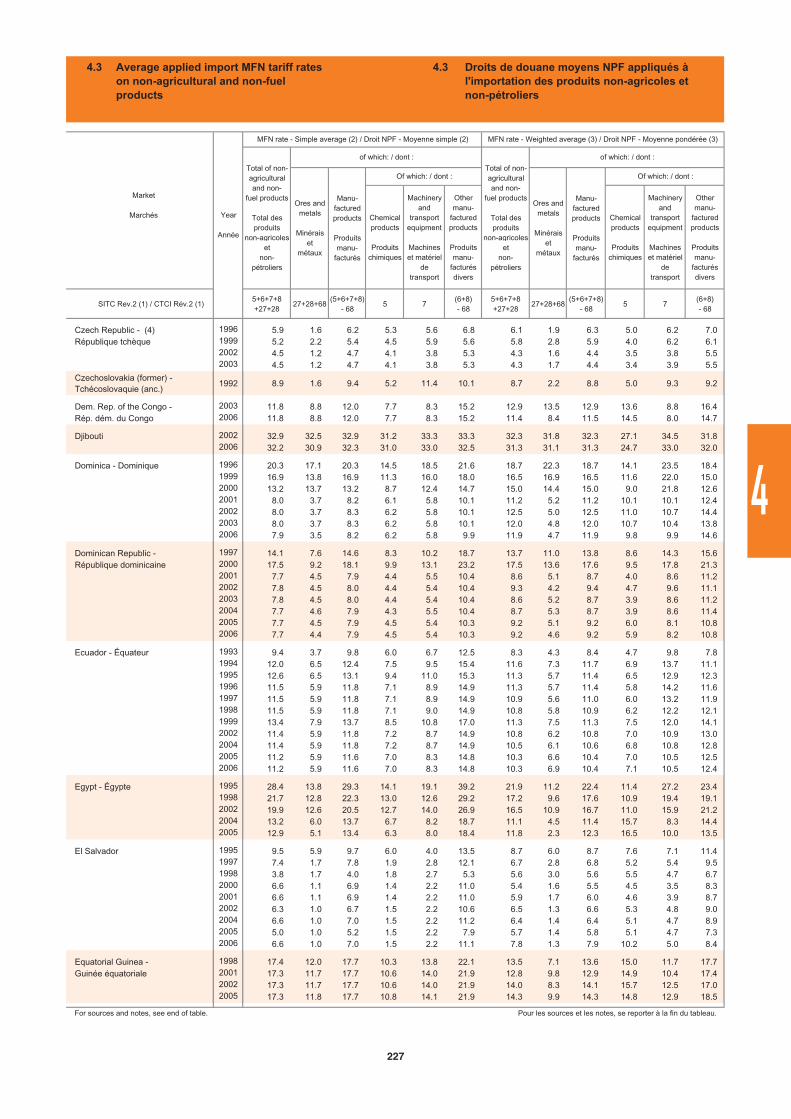
Chemicalproducts
Produitschimiques
Machineryand
transportequipment
Machineset matériel
detransport
Othermanu-
facturedproducts
Produitsmanu-
facturésdivers
Chemicalproducts
Produitschimiques
Machineryand
transportequipment
Machineset matériel
detransport
Othermanu-
facturedproducts
Produitsmanu-
facturésdivers
SITC Rev.2 (1) / CTCI Rév.2 (1)5+6+7+8+27+28
27+28+68(5+6+7+8)
- 685 7
(6+8)- 68
5+6+7+8+27+28
27+28+68(5+6+7+8)
- 685 7
(6+8)- 68
Czech Republic - (4) 1996 5.9 1.6 6.2 5.3 5.6 6.8 6.1 1.9 6.3 5.0 6.2 7.0République tchèque 1999 5.2 2.2 5.4 4.5 5.9 5.6 5.8 2.8 5.9 4.0 6.2 6.1
2002 4.5 1.2 4.7 4.1 3.8 5.3 4.3 1.6 4.4 3.5 3.8 5.52003 4.5 1.2 4.7 4.1 3.8 5.3 4.3 1.7 4.4 3.4 3.9 5.5
Czechoslovakia (former) -Tchécoslovaquie (anc.)
1992 8.9 1.6 9.4 5.2 11.4 10.1 8.7 2.2 8.8 5.0 9.3 9.2
Dem. Rep. of the Congo - 2003 11.8 8.8 12.0 7.7 8.3 15.2 12.9 13.5 12.9 13.6 8.8 16.4Rép. dém. du Congo 2006 11.8 8.8 12.0 7.7 8.3 15.2 11.4 8.4 11.5 14.5 8.0 14.7
Djibouti 2002 32.9 32.5 32.9 31.2 33.3 33.3 32.3 31.8 32.3 27.1 34.5 31.82006 32.2 30.9 32.3 31.0 33.0 32.5 31.3 31.1 31.3 24.7 33.0 32.0
Dominica - Dominique 1996 20.3 17.1 20.3 14.5 18.5 21.6 18.7 22.3 18.7 14.1 23.5 18.41999 16.9 13.8 16.9 11.3 16.0 18.0 16.5 16.9 16.5 11.6 22.0 15.02000 13.2 13.7 13.2 8.7 12.4 14.7 15.0 14.4 15.0 9.0 21.8 12.62001 8.0 3.7 8.2 6.1 5.8 10.1 11.2 5.2 11.2 10.1 10.1 12.42002 8.0 3.7 8.3 6.2 5.8 10.1 12.5 5.0 12.5 11.0 10.7 14.42003 8.0 3.7 8.3 6.2 5.8 10.1 12.0 4.8 12.0 10.7 10.4 13.82006 7.9 3.5 8.2 6.2 5.8 9.9 11.9 4.7 11.9 9.8 9.9 14.6
Dominican Republic - 1997 14.1 7.6 14.6 8.3 10.2 18.7 13.7 11.0 13.8 8.6 14.3 15.6République dominicaine 2000 17.5 9.2 18.1 9.9 13.1 23.2 17.5 13.6 17.6 9.5 17.8 21.3
2001 7.7 4.5 7.9 4.4 5.5 10.4 8.6 5.1 8.7 4.0 8.6 11.22002 7.8 4.5 8.0 4.4 5.4 10.4 9.3 4.2 9.4 4.7 9.6 11.12003 7.8 4.5 8.0 4.4 5.4 10.4 8.6 5.2 8.7 3.9 8.6 11.22004 7.7 4.6 7.9 4.3 5.5 10.4 8.7 5.3 8.7 3.9 8.6 11.42005 7.7 4.5 7.9 4.5 5.4 10.3 9.2 5.1 9.2 6.0 8.1 10.82006 7.7 4.4 7.9 4.5 5.4 10.3 9.2 4.6 9.2 5.9 8.2 10.8
Ecuador - Équateur 1993 9.4 3.7 9.8 6.0 6.7 12.5 8.3 4.3 8.4 4.7 9.8 7.81994 12.0 6.5 12.4 7.5 9.5 15.4 11.6 7.3 11.7 6.9 13.7 11.11995 12.6 6.5 13.1 9.4 11.0 15.3 11.3 5.7 11.4 6.5 12.9 12.31996 11.5 5.9 11.8 7.1 8.9 14.9 11.3 5.7 11.4 5.8 14.2 11.61997 11.5 5.9 11.8 7.1 8.9 14.9 10.9 5.6 11.0 6.0 13.2 11.91998 11.5 5.9 11.8 7.1 9.0 14.9 10.8 5.8 10.9 6.2 12.2 12.11999 13.4 7.9 13.7 8.5 10.8 17.0 11.3 7.5 11.3 7.5 12.0 14.12002 11.4 5.9 11.8 7.2 8.7 14.9 10.8 6.2 10.8 7.0 10.9 13.02004 11.4 5.9 11.8 7.2 8.7 14.9 10.5 6.1 10.6 6.8 10.8 12.82005 11.2 5.9 11.6 7.0 8.3 14.8 10.3 6.6 10.4 7.0 10.5 12.52006 11.2 5.9 11.6 7.0 8.3 14.8 10.3 6.9 10.4 7.1 10.5 12.4
Egypt - Égypte 1995 28.4 13.8 29.3 14.1 19.1 39.2 21.9 11.2 22.4 11.4 27.2 23.41998 21.7 12.8 22.3 13.0 12.6 29.2 17.2 9.6 17.6 10.9 19.4 19.12002 19.9 12.6 20.5 12.7 14.0 26.9 16.5 10.9 16.7 11.0 15.9 21.22004 13.2 6.0 13.7 6.7 8.2 18.7 11.1 4.5 11.4 15.7 8.3 14.42005 12.9 5.1 13.4 6.3 8.0 18.4 11.8 2.3 12.3 16.5 10.0 13.5
El Salvador 1995 9.5 5.9 9.7 6.0 4.0 13.5 8.7 6.0 8.7 7.6 7.1 11.41997 7.4 1.7 7.8 1.9 2.8 12.1 6.7 2.8 6.8 5.2 5.4 9.51998 3.8 1.7 4.0 1.8 2.7 5.3 5.6 3.0 5.6 5.5 4.7 6.72000 6.6 1.1 6.9 1.4 2.2 11.0 5.4 1.6 5.5 4.5 3.5 8.32001 6.6 1.1 6.9 1.4 2.2 11.0 5.9 1.7 6.0 4.6 3.9 8.72002 6.3 1.0 6.7 1.5 2.2 10.6 6.5 1.3 6.6 5.3 4.8 9.02004 6.6 1.0 7.0 1.5 2.2 11.2 6.4 1.4 6.4 5.1 4.7 8.92005 5.0 1.0 5.2 1.5 2.2 7.9 5.7 1.4 5.8 5.1 4.7 7.32006 6.6 1.0 7.0 1.5 2.2 11.1 7.8 1.3 7.9 10.2 5.0 8.4
Equatorial Guinea - 1998 17.4 12.0 17.7 10.3 13.8 22.1 13.5 7.1 13.6 15.0 11.7 17.7Guinée équatoriale 2001 17.3 11.7 17.7 10.6 14.0 21.9 12.8 9.8 12.9 14.9 10.4 17.4
2002 17.3 11.7 17.7 10.6 14.0 21.9 14.0 8.3 14.1 15.7 12.5 17.02005 17.3 11.8 17.7 10.8 14.1 21.9 14.3 9.9 14.3 14.8 12.9 18.5
For sources and notes, see end of table. Pour les sources et les notes, se reporter à la fin du tableau.
Market
Marchés Year
Année
MFN rate - Simple average (2) / Droit NPF - Moyenne simple (2) MFN rate - Weighted average (3) / Droit NPF - Moyenne pondérée (3)
Total of non- agriculturaland non-
fuel products
Total des produits
non-agricoleset
non-pétroliers
of which: / dont :
Total of non- agriculturaland non-
fuel products
Total des produits
non-agricoleset
non-pétroliers
of which: / dont :
Manu-facturedproducts
Produitsmanu-
facturés
Of which: / dont :
Ores and metals
Minéraiset
métaux
Manu-facturedproducts
Produitsmanu-
facturés
Of which: / dont :
Ores and metals
Minéraiset
métaux
4.3 Average applied import MFN tariff rates on non-agricultural and non-fuelproducts
4.3 Droits de douane moyens NPF appliqués àl'importation des produits non-agricoles etnon-pétroliers
227
4
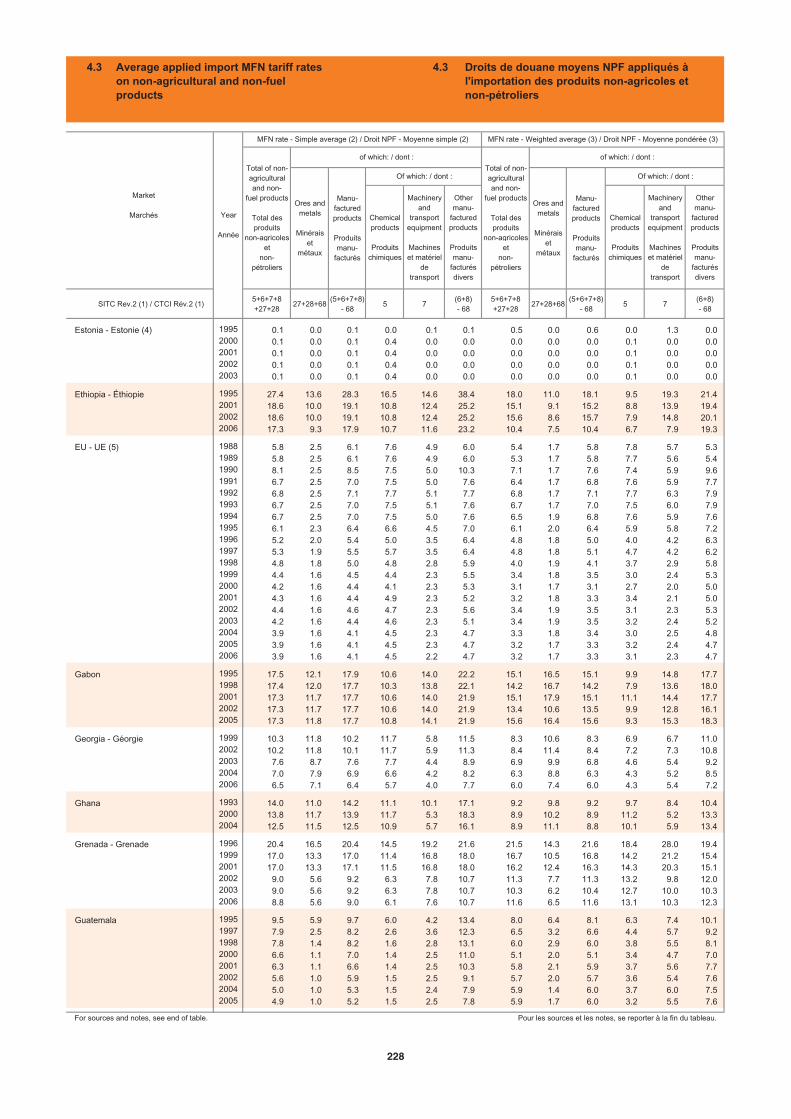
Chemicalproducts
Produitschimiques
Machineryand
transportequipment
Machineset matériel
detransport
Othermanu-
facturedproducts
Produitsmanu-
facturésdivers
Chemicalproducts
Produitschimiques
Machineryand
transportequipment
Machineset matériel
detransport
Othermanu-
facturedproducts
Produitsmanu-
facturésdivers
SITC Rev.2 (1) / CTCI Rév.2 (1)5+6+7+8+27+28
27+28+68(5+6+7+8)
- 685 7
(6+8)- 68
5+6+7+8+27+28
27+28+68(5+6+7+8)
- 685 7
(6+8)- 68
Estonia - Estonie (4) 1995 0.1 0.0 0.1 0.0 0.1 0.1 0.5 0.0 0.6 0.0 1.3 0.02000 0.1 0.0 0.1 0.4 0.0 0.0 0.0 0.0 0.0 0.1 0.0 0.02001 0.1 0.0 0.1 0.4 0.0 0.0 0.0 0.0 0.0 0.1 0.0 0.02002 0.1 0.0 0.1 0.4 0.0 0.0 0.0 0.0 0.0 0.1 0.0 0.02003 0.1 0.0 0.1 0.4 0.0 0.0 0.0 0.0 0.0 0.1 0.0 0.0
Ethiopia - Éthiopie 1995 27.4 13.6 28.3 16.5 14.6 38.4 18.0 11.0 18.1 9.5 19.3 21.42001 18.6 10.0 19.1 10.8 12.4 25.2 15.1 9.1 15.2 8.8 13.9 19.42002 18.6 10.0 19.1 10.8 12.4 25.2 15.6 8.6 15.7 7.9 14.8 20.12006 17.3 9.3 17.9 10.7 11.6 23.2 10.4 7.5 10.4 6.7 7.9 19.3
EU - UE (5) 1988 5.8 2.5 6.1 7.6 4.9 6.0 5.4 1.7 5.8 7.8 5.7 5.31989 5.8 2.5 6.1 7.6 4.9 6.0 5.3 1.7 5.8 7.7 5.6 5.41990 8.1 2.5 8.5 7.5 5.0 10.3 7.1 1.7 7.6 7.4 5.9 9.61991 6.7 2.5 7.0 7.5 5.0 7.6 6.4 1.7 6.8 7.6 5.9 7.71992 6.8 2.5 7.1 7.7 5.1 7.7 6.8 1.7 7.1 7.7 6.3 7.91993 6.7 2.5 7.0 7.5 5.1 7.6 6.7 1.7 7.0 7.5 6.0 7.91994 6.7 2.5 7.0 7.5 5.0 7.6 6.5 1.9 6.8 7.6 5.9 7.61995 6.1 2.3 6.4 6.6 4.5 7.0 6.1 2.0 6.4 5.9 5.8 7.21996 5.2 2.0 5.4 5.0 3.5 6.4 4.8 1.8 5.0 4.0 4.2 6.31997 5.3 1.9 5.5 5.7 3.5 6.4 4.8 1.8 5.1 4.7 4.2 6.21998 4.8 1.8 5.0 4.8 2.8 5.9 4.0 1.9 4.1 3.7 2.9 5.81999 4.4 1.6 4.5 4.4 2.3 5.5 3.4 1.8 3.5 3.0 2.4 5.32000 4.2 1.6 4.4 4.1 2.3 5.3 3.1 1.7 3.1 2.7 2.0 5.02001 4.3 1.6 4.4 4.9 2.3 5.2 3.2 1.8 3.3 3.4 2.1 5.02002 4.4 1.6 4.6 4.7 2.3 5.6 3.4 1.9 3.5 3.1 2.3 5.32003 4.2 1.6 4.4 4.6 2.3 5.1 3.4 1.9 3.5 3.2 2.4 5.22004 3.9 1.6 4.1 4.5 2.3 4.7 3.3 1.8 3.4 3.0 2.5 4.82005 3.9 1.6 4.1 4.5 2.3 4.7 3.2 1.7 3.3 3.2 2.4 4.72006 3.9 1.6 4.1 4.5 2.2 4.7 3.2 1.7 3.3 3.1 2.3 4.7
Gabon 1995 17.5 12.1 17.9 10.6 14.0 22.2 15.1 16.5 15.1 9.9 14.8 17.71998 17.4 12.0 17.7 10.3 13.8 22.1 14.2 16.7 14.2 7.9 13.6 18.02001 17.3 11.7 17.7 10.6 14.0 21.9 15.1 17.9 15.1 11.1 14.4 17.72002 17.3 11.7 17.7 10.6 14.0 21.9 13.4 10.6 13.5 9.9 12.8 16.12005 17.3 11.8 17.7 10.8 14.1 21.9 15.6 16.4 15.6 9.3 15.3 18.3
Georgia - Géorgie 1999 10.3 11.8 10.2 11.7 5.8 11.5 8.3 10.6 8.3 6.9 6.7 11.02002 10.2 11.8 10.1 11.7 5.9 11.3 8.4 11.4 8.4 7.2 7.3 10.82003 7.6 8.7 7.6 7.7 4.4 8.9 6.9 9.9 6.8 4.6 5.4 9.22004 7.0 7.9 6.9 6.6 4.2 8.2 6.3 8.8 6.3 4.3 5.2 8.52006 6.5 7.1 6.4 5.7 4.0 7.7 6.0 7.4 6.0 4.3 5.4 7.2
Ghana 1993 14.0 11.0 14.2 11.1 10.1 17.1 9.2 9.8 9.2 9.7 8.4 10.42000 13.8 11.7 13.9 11.7 5.3 18.3 8.9 10.2 8.9 11.2 5.2 13.32004 12.5 11.5 12.5 10.9 5.7 16.1 8.9 11.1 8.8 10.1 5.9 13.4
Grenada - Grenade 1996 20.4 16.5 20.4 14.5 19.2 21.6 21.5 14.3 21.6 18.4 28.0 19.41999 17.0 13.3 17.0 11.4 16.8 18.0 16.7 10.5 16.8 14.2 21.2 15.42001 17.0 13.3 17.1 11.5 16.8 18.0 16.2 12.4 16.3 14.3 20.3 15.12002 9.0 5.6 9.2 6.3 7.8 10.7 11.3 7.7 11.3 13.2 9.8 12.02003 9.0 5.6 9.2 6.3 7.8 10.7 10.3 6.2 10.4 12.7 10.0 10.32006 8.8 5.6 9.0 6.1 7.6 10.7 11.6 6.5 11.6 13.1 10.3 12.3
Guatemala 1995 9.5 5.9 9.7 6.0 4.2 13.4 8.0 6.4 8.1 6.3 7.4 10.11997 7.9 2.5 8.2 2.6 3.6 12.3 6.5 3.2 6.6 4.4 5.7 9.21998 7.8 1.4 8.2 1.6 2.8 13.1 6.0 2.9 6.0 3.8 5.5 8.12000 6.6 1.1 7.0 1.4 2.5 11.0 5.1 2.0 5.1 3.4 4.7 7.02001 6.3 1.1 6.6 1.4 2.5 10.3 5.8 2.1 5.9 3.7 5.6 7.72002 5.6 1.0 5.9 1.5 2.5 9.1 5.7 2.0 5.7 3.6 5.4 7.62004 5.0 1.0 5.3 1.5 2.4 7.9 5.9 1.4 6.0 3.7 6.0 7.52005 4.9 1.0 5.2 1.5 2.5 7.8 5.9 1.7 6.0 3.2 5.5 7.6
For sources and notes, see end of table. Pour les sources et les notes, se reporter à la fin du tableau.
Market
Marchés Year
Année
MFN rate - Simple average (2) / Droit NPF - Moyenne simple (2) MFN rate - Weighted average (3) / Droit NPF - Moyenne pondérée (3)
Total of non- agriculturaland non-
fuel products
Total des produits
non-agricoleset
non-pétroliers
of which: / dont :
Total of non- agriculturaland non-
fuel products
Total des produits
non-agricoleset
non-pétroliers
of which: / dont :
Ores and metals
Minéraiset
métaux
Manu-facturedproducts
Produitsmanu-
facturés
Of which: / dont :
Ores and metals
Minéraiset
métaux
Manu-facturedproducts
Produitsmanu-
facturés
Of which: / dont :
4.3 Average applied import MFN tariff rates on non-agricultural and non-fuelproducts
4.3 Droits de douane moyens NPF appliqués àl'importation des produits non-agricoles etnon-pétroliers
228
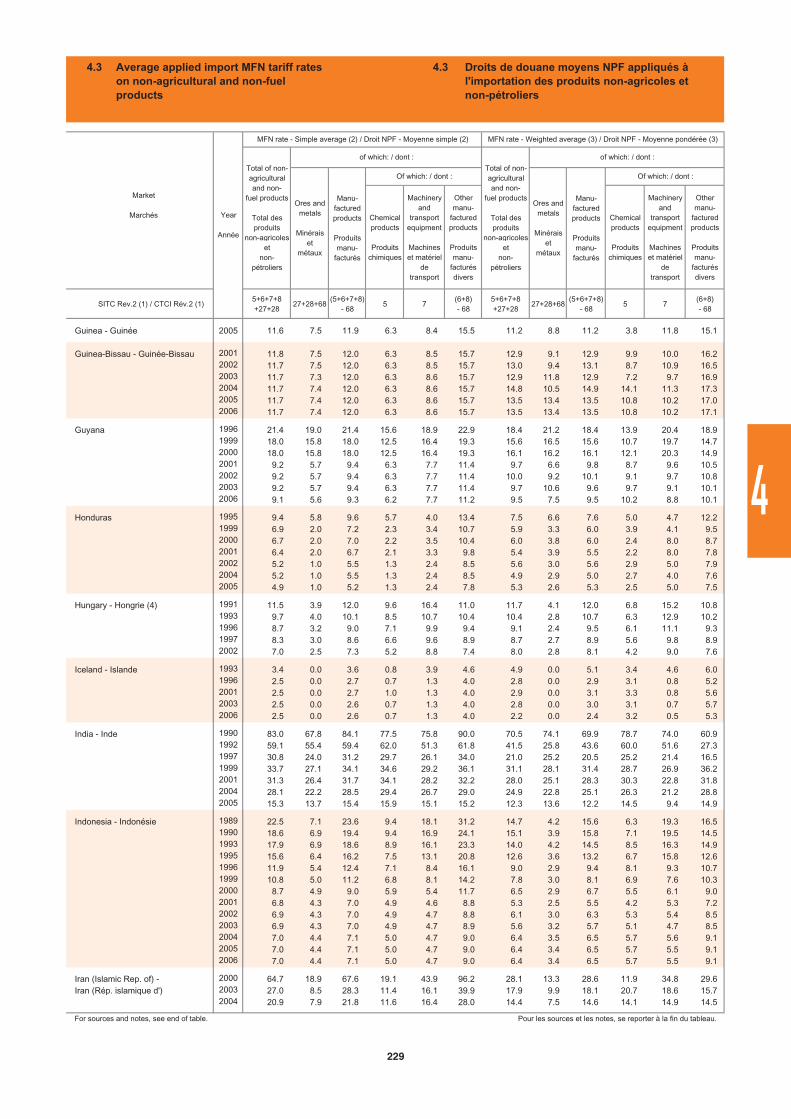
Chemicalproducts
Produitschimiques
Machineryand
transportequipment
Machineset matériel
detransport
Othermanu-
facturedproducts
Produitsmanu-
facturésdivers
Chemicalproducts
Produitschimiques
Machineryand
transportequipment
Machineset matériel
detransport
Othermanu-
facturedproducts
Produitsmanu-
facturésdivers
SITC Rev.2 (1) / CTCI Rév.2 (1)5+6+7+8+27+28
27+28+68(5+6+7+8)
- 685 7
(6+8)- 68
5+6+7+8+27+28
27+28+68(5+6+7+8)
- 685 7
(6+8)- 68
Guinea - Guinée 2005 11.6 7.5 11.9 6.3 8.4 15.5 11.2 8.8 11.2 3.8 11.8 15.1
Guinea-Bissau - Guinée-Bissau 2001 11.8 7.5 12.0 6.3 8.5 15.7 12.9 9.1 12.9 9.9 10.0 16.22002 11.7 7.5 12.0 6.3 8.5 15.7 13.0 9.4 13.1 8.7 10.9 16.52003 11.7 7.3 12.0 6.3 8.6 15.7 12.9 11.8 12.9 7.2 9.7 16.92004 11.7 7.4 12.0 6.3 8.6 15.7 14.8 10.5 14.9 14.1 11.3 17.32005 11.7 7.4 12.0 6.3 8.6 15.7 13.5 13.4 13.5 10.8 10.2 17.02006 11.7 7.4 12.0 6.3 8.6 15.7 13.5 13.4 13.5 10.8 10.2 17.1
Guyana 1996 21.4 19.0 21.4 15.6 18.9 22.9 18.4 21.2 18.4 13.9 20.4 18.91999 18.0 15.8 18.0 12.5 16.4 19.3 15.6 16.5 15.6 10.7 19.7 14.72000 18.0 15.8 18.0 12.5 16.4 19.3 16.1 16.2 16.1 12.1 20.3 14.92001 9.2 5.7 9.4 6.3 7.7 11.4 9.7 6.6 9.8 8.7 9.6 10.52002 9.2 5.7 9.4 6.3 7.7 11.4 10.0 9.2 10.1 9.1 9.7 10.82003 9.2 5.7 9.4 6.3 7.7 11.4 9.7 10.6 9.6 9.7 9.1 10.12006 9.1 5.6 9.3 6.2 7.7 11.2 9.5 7.5 9.5 10.2 8.8 10.1
Honduras 1995 9.4 5.8 9.6 5.7 4.0 13.4 7.5 6.6 7.6 5.0 4.7 12.21999 6.9 2.0 7.2 2.3 3.4 10.7 5.9 3.3 6.0 3.9 4.1 9.52000 6.7 2.0 7.0 2.2 3.5 10.4 6.0 3.8 6.0 2.4 8.0 8.72001 6.4 2.0 6.7 2.1 3.3 9.8 5.4 3.9 5.5 2.2 8.0 7.82002 5.2 1.0 5.5 1.3 2.4 8.5 5.6 3.0 5.6 2.9 5.0 7.92004 5.2 1.0 5.5 1.3 2.4 8.5 4.9 2.9 5.0 2.7 4.0 7.62005 4.9 1.0 5.2 1.3 2.4 7.8 5.3 2.6 5.3 2.5 5.0 7.5
Hungary - Hongrie (4) 1991 11.5 3.9 12.0 9.6 16.4 11.0 11.7 4.1 12.0 6.8 15.2 10.81993 9.7 4.0 10.1 8.5 10.7 10.4 10.4 2.8 10.7 6.3 12.9 10.21996 8.7 3.2 9.0 7.1 9.9 9.4 9.1 2.4 9.5 6.1 11.1 9.31997 8.3 3.0 8.6 6.6 9.6 8.9 8.7 2.7 8.9 5.6 9.8 8.92002 7.0 2.5 7.3 5.2 8.8 7.4 8.0 2.8 8.1 4.2 9.0 7.6
Iceland - Islande 1993 3.4 0.0 3.6 0.8 3.9 4.6 4.9 0.0 5.1 3.4 4.6 6.01996 2.5 0.0 2.7 0.7 1.3 4.0 2.8 0.0 2.9 3.1 0.8 5.22001 2.5 0.0 2.7 1.0 1.3 4.0 2.9 0.0 3.1 3.3 0.8 5.62003 2.5 0.0 2.6 0.7 1.3 4.0 2.8 0.0 3.0 3.1 0.7 5.72006 2.5 0.0 2.6 0.7 1.3 4.0 2.2 0.0 2.4 3.2 0.5 5.3
India - Inde 1990 83.0 67.8 84.1 77.5 75.8 90.0 70.5 74.1 69.9 78.7 74.0 60.91992 59.1 55.4 59.4 62.0 51.3 61.8 41.5 25.8 43.6 60.0 51.6 27.31997 30.8 24.0 31.2 29.7 26.1 34.0 21.0 25.2 20.5 25.2 21.4 16.51999 33.7 27.1 34.1 34.6 29.2 36.1 31.1 28.1 31.4 28.7 26.9 36.22001 31.3 26.4 31.7 34.1 28.2 32.2 28.0 25.1 28.3 30.3 22.8 31.82004 28.1 22.2 28.5 29.4 26.7 29.0 24.9 22.8 25.1 26.3 21.2 28.82005 15.3 13.7 15.4 15.9 15.1 15.2 12.3 13.6 12.2 14.5 9.4 14.9
Indonesia - Indonésie 1989 22.5 7.1 23.6 9.4 18.1 31.2 14.7 4.2 15.6 6.3 19.3 16.51990 18.6 6.9 19.4 9.4 16.9 24.1 15.1 3.9 15.8 7.1 19.5 14.51993 17.9 6.9 18.6 8.9 16.1 23.3 14.0 4.2 14.5 8.5 16.3 14.91995 15.6 6.4 16.2 7.5 13.1 20.8 12.6 3.6 13.2 6.7 15.8 12.61996 11.9 5.4 12.4 7.1 8.4 16.1 9.0 2.9 9.4 8.1 9.3 10.71999 10.8 5.0 11.2 6.8 8.1 14.2 7.8 3.0 8.1 6.9 7.6 10.32000 8.7 4.9 9.0 5.9 5.4 11.7 6.5 2.9 6.7 5.5 6.1 9.02001 6.8 4.3 7.0 4.9 4.6 8.8 5.3 2.5 5.5 4.2 5.3 7.22002 6.9 4.3 7.0 4.9 4.7 8.8 6.1 3.0 6.3 5.3 5.4 8.52003 6.9 4.3 7.0 4.9 4.7 8.9 5.6 3.2 5.7 5.1 4.7 8.52004 7.0 4.4 7.1 5.0 4.7 9.0 6.4 3.5 6.5 5.7 5.6 9.12005 7.0 4.4 7.1 5.0 4.7 9.0 6.4 3.4 6.5 5.7 5.5 9.12006 7.0 4.4 7.1 5.0 4.7 9.0 6.4 3.4 6.5 5.7 5.5 9.1
Iran (Islamic Rep. of) - 2000 64.7 18.9 67.6 19.1 43.9 96.2 28.1 13.3 28.6 11.9 34.8 29.6Iran (Rép. islamique d') 2003 27.0 8.5 28.3 11.4 16.1 39.9 17.9 9.9 18.1 20.7 18.6 15.7
2004 20.9 7.9 21.8 11.6 16.4 28.0 14.4 7.5 14.6 14.1 14.9 14.5
For sources and notes, see end of table. Pour les sources et les notes, se reporter à la fin du tableau.
Market
Marchés Year
Année
MFN rate - Simple average (2) / Droit NPF - Moyenne simple (2) MFN rate - Weighted average (3) / Droit NPF - Moyenne pondérée (3)
Total of non- agriculturaland non-
fuel products
Total des produits
non-agricoleset
non-pétroliers
of which: / dont :
Total of non- agriculturaland non-
fuel products
Total des produits
non-agricoleset
non-pétroliers
of which: / dont :
Manu-facturedproducts
Produitsmanu-
facturés
Of which: / dont :
Ores and metals
Minéraiset
métaux
Manu-facturedproducts
Produitsmanu-
facturés
Of which: / dont :
Ores and metals
Minéraiset
métaux
4.3 Average applied import MFN tariff rates on non-agricultural and non-fuelproducts
4.3 Droits de douane moyens NPF appliqués àl'importation des produits non-agricoles etnon-pétroliers
229
4
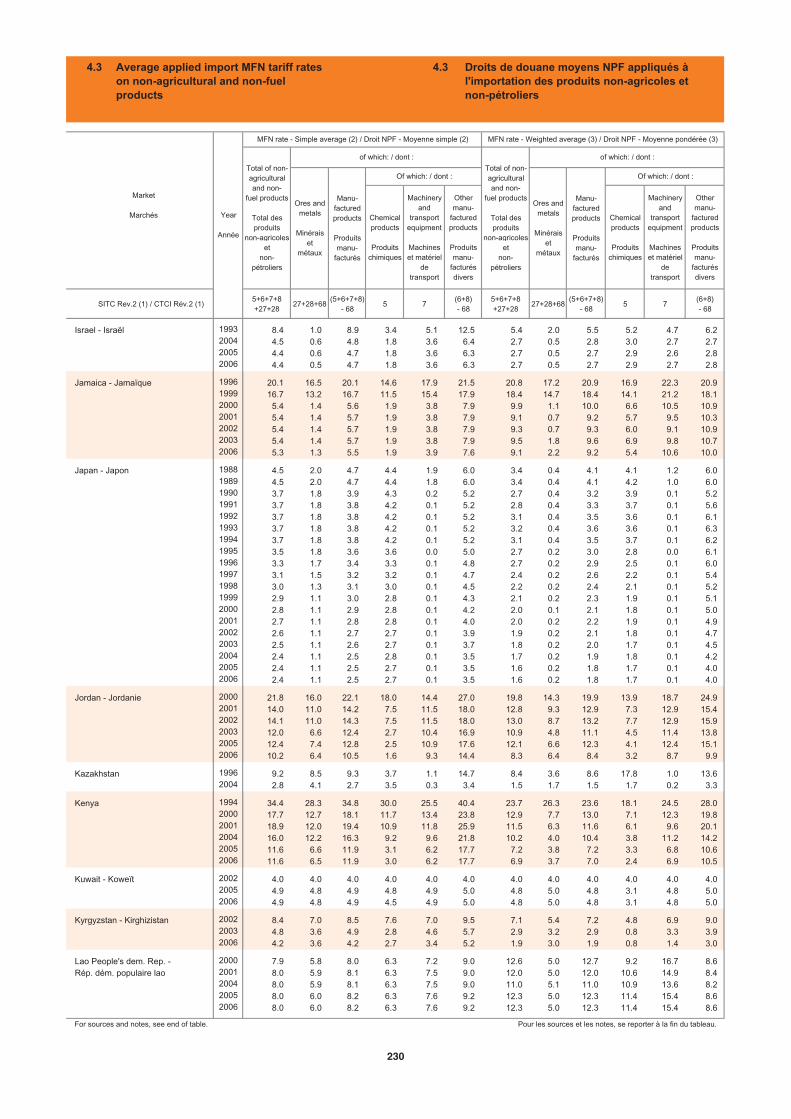
Chemicalproducts
Produitschimiques
Machineryand
transportequipment
Machineset matériel
detransport
Othermanu-
facturedproducts
Produitsmanu-
facturésdivers
Chemicalproducts
Produitschimiques
Machineryand
transportequipment
Machineset matériel
detransport
Othermanu-
facturedproducts
Produitsmanu-
facturésdivers
SITC Rev.2 (1) / CTCI Rév.2 (1)5+6+7+8+27+28
27+28+68(5+6+7+8)
- 685 7
(6+8)- 68
5+6+7+8+27+28
27+28+68(5+6+7+8)
- 685 7
(6+8)- 68
Israel - Israël 1993 8.4 1.0 8.9 3.4 5.1 12.5 5.4 2.0 5.5 5.2 4.7 6.22004 4.5 0.6 4.8 1.8 3.6 6.4 2.7 0.5 2.8 3.0 2.7 2.72005 4.4 0.6 4.7 1.8 3.6 6.3 2.7 0.5 2.7 2.9 2.6 2.82006 4.4 0.5 4.7 1.8 3.6 6.3 2.7 0.5 2.7 2.9 2.7 2.8
Jamaica - Jamaïque 1996 20.1 16.5 20.1 14.6 17.9 21.5 20.8 17.2 20.9 16.9 22.3 20.91999 16.7 13.2 16.7 11.5 15.4 17.9 18.4 14.7 18.4 14.1 21.2 18.12000 5.4 1.4 5.6 1.9 3.8 7.9 9.9 1.1 10.0 6.6 10.5 10.92001 5.4 1.4 5.7 1.9 3.8 7.9 9.1 0.7 9.2 5.7 9.5 10.32002 5.4 1.4 5.7 1.9 3.8 7.9 9.3 0.7 9.3 6.0 9.1 10.92003 5.4 1.4 5.7 1.9 3.8 7.9 9.5 1.8 9.6 6.9 9.8 10.72006 5.3 1.3 5.5 1.9 3.9 7.6 9.1 2.2 9.2 5.4 10.6 10.0
Japan - Japon 1988 4.5 2.0 4.7 4.4 1.9 6.0 3.4 0.4 4.1 4.1 1.2 6.01989 4.5 2.0 4.7 4.4 1.8 6.0 3.4 0.4 4.1 4.2 1.0 6.01990 3.7 1.8 3.9 4.3 0.2 5.2 2.7 0.4 3.2 3.9 0.1 5.21991 3.7 1.8 3.8 4.2 0.1 5.2 2.8 0.4 3.3 3.7 0.1 5.61992 3.7 1.8 3.8 4.2 0.1 5.2 3.1 0.4 3.5 3.6 0.1 6.11993 3.7 1.8 3.8 4.2 0.1 5.2 3.2 0.4 3.6 3.6 0.1 6.31994 3.7 1.8 3.8 4.2 0.1 5.2 3.1 0.4 3.5 3.7 0.1 6.21995 3.5 1.8 3.6 3.6 0.0 5.0 2.7 0.2 3.0 2.8 0.0 6.11996 3.3 1.7 3.4 3.3 0.1 4.8 2.7 0.2 2.9 2.5 0.1 6.01997 3.1 1.5 3.2 3.2 0.1 4.7 2.4 0.2 2.6 2.2 0.1 5.41998 3.0 1.3 3.1 3.0 0.1 4.5 2.2 0.2 2.4 2.1 0.1 5.21999 2.9 1.1 3.0 2.8 0.1 4.3 2.1 0.2 2.3 1.9 0.1 5.12000 2.8 1.1 2.9 2.8 0.1 4.2 2.0 0.1 2.1 1.8 0.1 5.02001 2.7 1.1 2.8 2.8 0.1 4.0 2.0 0.2 2.2 1.9 0.1 4.92002 2.6 1.1 2.7 2.7 0.1 3.9 1.9 0.2 2.1 1.8 0.1 4.72003 2.5 1.1 2.6 2.7 0.1 3.7 1.8 0.2 2.0 1.7 0.1 4.52004 2.4 1.1 2.5 2.8 0.1 3.5 1.7 0.2 1.9 1.8 0.1 4.22005 2.4 1.1 2.5 2.7 0.1 3.5 1.6 0.2 1.8 1.7 0.1 4.02006 2.4 1.1 2.5 2.7 0.1 3.5 1.6 0.2 1.8 1.7 0.1 4.0
Jordan - Jordanie 2000 21.8 16.0 22.1 18.0 14.4 27.0 19.8 14.3 19.9 13.9 18.7 24.92001 14.0 11.0 14.2 7.5 11.5 18.0 12.8 9.3 12.9 7.3 12.9 15.42002 14.1 11.0 14.3 7.5 11.5 18.0 13.0 8.7 13.2 7.7 12.9 15.92003 12.0 6.6 12.4 2.7 10.4 16.9 10.9 4.8 11.1 4.5 11.4 13.82005 12.4 7.4 12.8 2.5 10.9 17.6 12.1 6.6 12.3 4.1 12.4 15.12006 10.2 6.4 10.5 1.6 9.3 14.4 8.3 6.4 8.4 3.2 8.7 9.9
Kazakhstan 1996 9.2 8.5 9.3 3.7 1.1 14.7 8.4 3.6 8.6 17.8 1.0 13.62004 2.8 4.1 2.7 3.5 0.3 3.4 1.5 1.7 1.5 1.7 0.2 3.3
Kenya 1994 34.4 28.3 34.8 30.0 25.5 40.4 23.7 26.3 23.6 18.1 24.5 28.02000 17.7 12.7 18.1 11.7 13.4 23.8 12.9 7.7 13.0 7.1 12.3 19.82001 18.9 12.0 19.4 10.9 11.8 25.9 11.5 6.3 11.6 6.1 9.6 20.12004 16.0 12.2 16.3 9.2 9.6 21.8 10.2 4.0 10.4 3.8 11.2 14.22005 11.6 6.6 11.9 3.1 6.2 17.7 7.2 3.8 7.2 3.3 6.8 10.62006 11.6 6.5 11.9 3.0 6.2 17.7 6.9 3.7 7.0 2.4 6.9 10.5
Kuwait - Koweït 2002 4.0 4.0 4.0 4.0 4.0 4.0 4.0 4.0 4.0 4.0 4.0 4.02005 4.9 4.8 4.9 4.8 4.9 5.0 4.8 5.0 4.8 3.1 4.8 5.02006 4.9 4.8 4.9 4.5 4.9 5.0 4.8 5.0 4.8 3.1 4.8 5.0
Kyrgyzstan - Kirghizistan 2002 8.4 7.0 8.5 7.6 7.0 9.5 7.1 5.4 7.2 4.8 6.9 9.02003 4.8 3.6 4.9 2.8 4.6 5.7 2.9 3.2 2.9 0.8 3.3 3.92006 4.2 3.6 4.2 2.7 3.4 5.2 1.9 3.0 1.9 0.8 1.4 3.0
Lao People's dem. Rep. - 2000 7.9 5.8 8.0 6.3 7.2 9.0 12.6 5.0 12.7 9.2 16.7 8.6Rép. dém. populaire lao 2001 8.0 5.9 8.1 6.3 7.5 9.0 12.0 5.0 12.0 10.6 14.9 8.4
2004 8.0 5.9 8.1 6.3 7.5 9.0 11.0 5.1 11.0 10.9 13.6 8.22005 8.0 6.0 8.2 6.3 7.6 9.2 12.3 5.0 12.3 11.4 15.4 8.62006 8.0 6.0 8.2 6.3 7.6 9.2 12.3 5.0 12.3 11.4 15.4 8.6
For sources and notes, see end of table. Pour les sources et les notes, se reporter à la fin du tableau.
Market
Marchés Year
Année
MFN rate - Simple average (2) / Droit NPF - Moyenne simple (2) MFN rate - Weighted average (3) / Droit NPF - Moyenne pondérée (3)
Total of non- agriculturaland non-
fuel products
Total des produits
non-agricoleset
non-pétroliers
of which: / dont :
Total of non- agriculturaland non-
fuel products
Total des produits
non-agricoleset
non-pétroliers
of which: / dont :
Ores and metals
Minéraiset
métaux
Manu-facturedproducts
Produitsmanu-
facturés
Of which: / dont :
Ores and metals
Minéraiset
métaux
Manu-facturedproducts
Produitsmanu-
facturés
Of which: / dont :
4.3 Average applied import MFN tariff rates on non-agricultural and non-fuelproducts
4.3 Droits de douane moyens NPF appliqués àl'importation des produits non-agricoles etnon-pétroliers
230

Chemicalproducts
Produitschimiques
Machineryand
transportequipment
Machineset matériel
detransport
Othermanu-
facturedproducts
Produitsmanu-
facturésdivers
Chemicalproducts
Produitschimiques
Machineryand
transportequipment
Machineset matériel
detransport
Othermanu-
facturedproducts
Produitsmanu-
facturésdivers
SITC Rev.2 (1) / CTCI Rév.2 (1)5+6+7+8+27+28
27+28+68(5+6+7+8)
- 685 7
(6+8)- 68
5+6+7+8+27+28
27+28+68(5+6+7+8)
- 685 7
(6+8)- 68
Latvia - Lettonie (4) 1996 2.7 0.5 2.8 1.1 1.7 3.9 2.6 0.5 2.6 1.8 0.9 4.31997 3.6 0.5 3.8 1.1 1.4 5.7 2.8 0.5 2.9 1.9 0.9 5.02001 2.1 0.5 2.2 0.8 0.4 3.5 1.5 0.5 1.6 0.6 0.1 3.3
Lebanon - Liban 1999 9.8 4.1 10.1 4.7 7.7 13.3 12.6 4.6 12.9 6.7 13.5 14.82000 13.6 6.5 14.1 7.4 11.5 17.7 16.0 6.4 16.5 10.6 15.7 19.32001 4.7 2.0 4.9 2.3 3.8 6.4 6.7 2.1 6.8 5.6 5.3 8.42002 4.1 1.9 4.2 2.3 3.6 5.3 6.2 2.0 6.3 5.7 5.1 7.62004 4.1 1.9 4.2 2.3 3.6 5.3 6.0 1.6 6.1 5.5 4.9 7.52005 4.1 1.8 4.2 2.3 3.6 5.2 6.0 1.5 6.1 5.5 4.9 7.52006 4.1 1.8 4.2 2.3 3.6 5.2 6.0 1.6 6.1 5.5 4.9 7.5
Lesotho 2001 7.9 1.4 8.4 2.5 3.2 13.0 17.6 0.0 17.6 1.4 5.9 21.52004 8.1 1.3 8.5 2.4 3.0 13.2 17.4 4.4 17.4 3.6 7.5 20.22005 8.0 1.2 8.5 2.5 3.0 13.1 17.3 2.4 17.3 2.1 8.0 20.12006 8.0 1.2 8.5 2.4 3.0 13.1 17.3 2.4 17.3 2.1 7.9 20.1
Libyan Arab Jamahiriya - 1996 18.6 8.3 19.2 6.9 21.3 23.0 25.1 3.4 25.7 10.2 35.1 18.0Jamahiriya arabe libyenne 2002 16.8 7.7 17.4 6.5 19.3 20.7 28.5 7.3 28.7 8.7 38.9 16.4
Lithuania - Lituanie (4) 1995 2.8 0.0 2.9 0.7 0.5 4.8 2.0 0.0 2.1 0.4 0.7 4.21997 2.7 0.0 2.9 0.6 0.4 4.8 2.0 0.0 2.0 0.7 0.6 4.42002 2.6 0.0 2.7 0.5 0.4 4.6 1.9 0.0 1.9 0.5 0.6 4.32003 2.4 0.0 2.6 0.5 0.4 4.3 1.9 0.0 1.9 0.6 0.7 4.2
Madagascar 1995 7.3 2.1 7.6 0.9 7.7 10.1 6.3 0.7 6.3 0.8 9.0 6.42001 4.6 1.5 4.8 0.6 4.5 6.5 4.6 0.7 4.6 0.9 5.3 5.42005 11.1 11.0 11.1 9.9 6.7 13.4 6.2 7.9 6.2 6.6 3.5 9.62006 13.1 8.2 13.4 9.8 11.0 15.8 12.6 8.3 12.6 6.4 12.4 15.3
Malawi 1994 31.8 15.4 33.0 25.0 26.8 37.5 26.3 10.9 26.6 13.4 26.7 34.11996 27.4 14.8 28.3 20.1 23.2 33.5 19.4 13.3 19.5 6.8 19.9 31.11997 25.7 13.9 26.5 19.8 22.1 30.8 21.0 4.1 21.2 11.9 20.1 27.41998 20.3 10.4 20.9 11.1 17.2 26.1 16.4 2.4 16.6 8.2 14.8 23.42001 13.0 8.0 13.3 6.1 9.4 17.7 11.6 5.7 11.7 5.5 11.8 14.62006 13.0 7.8 13.4 6.2 9.4 17.8 10.1 2.7 10.2 3.8 10.4 15.1
Malaysia - Malaisie 1988 14.1 5.9 14.7 5.5 11.1 19.6 10.8 4.8 11.2 4.7 10.9 14.51991 14.3 6.0 14.8 6.9 10.4 19.6 10.9 5.7 11.1 9.9 10.3 13.81993 11.8 5.4 12.3 6.0 9.2 15.9 9.3 5.5 9.5 9.3 8.9 11.31996 9.0 2.4 9.4 2.7 5.9 13.5 6.2 4.2 6.3 4.7 5.6 9.31997 9.4 2.4 9.9 3.7 6.5 13.7 5.7 4.4 5.8 4.8 5.2 8.42001 9.3 2.4 9.7 3.0 7.0 13.4 5.2 4.3 5.2 4.4 4.3 9.62002 9.3 2.4 9.7 3.0 7.0 13.4 5.1 4.6 5.1 4.4 4.2 9.42003 9.3 2.4 9.7 3.0 7.0 13.5 5.1 4.4 5.1 4.5 4.2 9.62005 8.3 2.3 8.7 2.6 5.6 12.4 4.8 4.0 4.8 4.9 2.8 13.22006 8.2 2.3 8.6 2.6 5.1 12.3 4.4 3.7 4.5 4.5 2.2 13.5
Maldives 2000 20.6 24.3 20.3 14.7 23.9 20.9 21.4 19.2 21.5 19.8 23.8 19.92001 20.6 24.3 20.3 14.7 23.9 20.9 21.4 18.3 21.5 20.5 23.8 19.82002 20.6 24.2 20.3 14.7 23.9 20.9 21.5 18.1 21.7 20.1 23.4 20.72003 20.6 24.3 20.3 14.7 23.9 21.0 21.9 19.8 21.9 20.7 24.0 20.32004 20.6 24.3 20.3 14.7 24.1 20.9 21.5 19.7 21.5 21.2 23.8 19.82005 20.6 24.3 20.3 14.7 23.9 21.0 21.9 20.1 22.0 20.9 23.7 20.22006 20.6 24.3 20.3 14.7 23.9 21.0 21.9 20.1 22.0 20.9 23.7 20.2
Mali 1995 14.8 16.9 14.7 3.3 8.4 21.5 8.6 12.0 8.5 2.0 9.0 11.72001 11.8 7.5 12.0 6.3 8.5 15.7 10.6 8.9 10.6 5.1 9.2 15.52002 11.7 7.5 12.0 6.3 8.5 15.7 10.6 8.8 10.6 5.3 9.7 16.02003 11.7 7.3 12.0 6.3 8.6 15.7 11.2 8.2 11.2 4.7 10.8 16.22004 11.7 7.4 12.0 6.3 8.6 15.7 11.2 8.4 11.2 4.7 10.7 16.22005 11.7 7.4 12.0 6.3 8.6 15.7 11.2 8.4 11.2 4.7 10.7 16.32006 11.7 7.4 12.0 6.3 8.6 15.7 11.2 8.4 11.3 4.7 10.8 16.3
For sources and notes, see end of table. Pour les sources et les notes, se reporter à la fin du tableau.
Market
Marchés Year
Année
MFN rate - Simple average (2) / Droit NPF - Moyenne simple (2) MFN rate - Weighted average (3) / Droit NPF - Moyenne pondérée (3)
Total of non- agriculturaland non-
fuel products
Total des produits
non-agricoleset
non-pétroliers
of which: / dont :
Total of non- agriculturaland non-
fuel products
Total des produits
non-agricoleset
non-pétroliers
of which: / dont :
Manu-facturedproducts
Produitsmanu-
facturés
Of which: / dont :
Ores and metals
Minéraiset
métaux
Manu-facturedproducts
Produitsmanu-
facturés
Of which: / dont :
Ores and metals
Minéraiset
métaux
4.3 Average applied import MFN tariff rates on non-agricultural and non-fuelproducts
4.3 Droits de douane moyens NPF appliqués àl'importation des produits non-agricoles etnon-pétroliers
231
4

Chemicalproducts
Produitschimiques
Machineryand
transportequipment
Machineset matériel
detransport
Othermanu-
facturedproducts
Produitsmanu-
facturésdivers
Chemicalproducts
Produitschimiques
Machineryand
transportequipment
Machineset matériel
detransport
Othermanu-
facturedproducts
Produitsmanu-
facturésdivers
SITC Rev.2 (1) / CTCI Rév.2 (1)5+6+7+8+27+28
27+28+68(5+6+7+8)
- 685 7
(6+8)- 68
5+6+7+8+27+28
27+28+68(5+6+7+8)
- 685 7
(6+8)- 68
Malta - Malte (4) 1997 7.9 7.9 7.9 7.3 7.2 8.4 9.3 4.6 9.3 4.4 10.9 7.92000 7.8 7.9 7.8 7.3 7.1 8.4 10.3 4.5 10.3 4.2 11.7 8.12002 6.2 2.5 6.4 6.5 4.7 7.1 6.4 5.0 6.4 4.7 6.3 7.22003 6.2 2.5 6.4 6.5 4.7 7.1 6.0 6.0 6.0 4.8 5.6 7.1
Mauritania - Mauritanie 2001 10.5 5.6 10.8 4.9 8.4 14.2 9.9 5.1 9.9 9.4 8.9 12.12006 10.4 5.6 10.7 5.0 8.2 13.9 6.6 5.0 6.6 7.6 5.8 11.7
Mauritius - Maurice 1995 31.7 15.9 32.7 22.0 31.5 37.2 23.0 16.4 23.1 20.6 38.6 16.91997 30.6 16.1 31.6 22.0 30.7 35.5 19.0 12.3 19.1 19.8 25.5 15.01998 30.6 22.6 31.2 24.9 30.0 34.0 27.0 23.8 27.1 36.6 27.9 24.92002 18.7 1.0 19.9 6.1 14.2 27.6 14.2 2.2 14.5 14.1 13.5 15.02005 5.5 1.1 5.8 3.3 5.3 6.9 4.7 1.7 4.8 5.2 3.6 5.82006 2.5 0.3 2.6 1.4 2.6 3.2 1.8 0.3 1.9 2.8 1.2 2.4
Mexico - Mexique 1991 13.7 10.0 14.0 11.2 13.7 15.2 12.9 8.1 13.0 9.8 13.7 13.41995 13.1 9.8 13.3 10.8 11.3 15.0 11.7 8.9 11.8 9.5 11.1 13.71997 13.9 9.6 14.2 9.9 11.1 17.1 12.4 8.3 12.5 8.8 11.3 15.61998 13.8 9.4 14.1 9.6 10.9 17.1 12.1 8.8 12.2 8.7 10.8 15.71999 17.0 12.4 17.3 12.3 14.3 20.6 15.1 12.0 15.2 11.5 14.0 18.52000 17.0 12.4 17.3 12.3 14.1 20.5 14.6 11.9 14.6 11.4 13.2 18.32001 17.0 12.4 17.3 12.3 14.0 20.5 14.5 12.2 14.5 11.6 12.9 18.62002 17.1 12.4 17.4 12.6 14.0 20.7 14.5 12.3 14.6 11.9 12.8 18.92003 17.1 12.3 17.4 12.4 14.0 20.8 14.5 12.2 14.5 11.7 12.6 19.12004 16.4 12.3 16.7 12.3 13.5 19.7 12.8 11.8 12.8 11.4 10.8 17.12005 13.5 9.4 13.8 9.4 10.4 16.9 11.8 9.4 11.9 8.7 11.1 14.62006 13.4 9.4 13.7 9.2 10.4 16.8 11.7 9.6 11.8 8.6 11.2 14.0
Moldova 1996 4.9 2.9 5.1 3.4 1.0 7.4 2.3 1.9 2.3 1.4 1.1 3.72000 4.3 2.0 4.4 3.5 1.5 5.9 2.8 1.8 2.8 1.5 1.3 4.12001 4.1 1.3 4.3 3.4 1.5 5.8 2.9 1.6 2.9 1.7 1.1 4.32006 4.2 0.9 4.4 2.9 1.6 6.2 3.3 0.6 3.3 2.1 1.6 4.7
Mongolia - Mongolie 2005 4.4 5.0 4.3 5.0 2.1 5.0 3.8 5.0 3.7 5.0 2.6 5.02006 4.4 5.0 4.3 5.0 2.1 5.0 3.9 5.0 3.9 5.0 2.8 5.0
Montserrat 1996 19.8 15.8 19.8 14.5 16.7 21.3 15.4 7.0 15.6 19.8 10.7 18.71999 16.4 12.9 16.4 11.2 14.3 17.7 12.1 6.9 12.2 15.1 9.1 14.4
Morocco - Maroc 1993 64.5 28.0 67.0 49.5 55.3 78.3 53.6 17.8 55.7 45.9 51.9 66.41997 18.4 9.3 19.0 12.5 10.7 25.0 17.7 3.9 18.3 12.2 10.9 26.62000 27.9 23.8 28.2 26.2 13.1 35.4 25.9 12.8 26.4 25.6 15.5 36.22001 27.7 23.7 28.0 25.8 13.0 35.1 25.6 12.9 26.1 25.3 14.4 36.42002 27.5 24.1 27.8 24.6 13.0 35.2 25.4 12.7 25.9 24.1 15.2 35.72003 27.1 23.9 27.3 23.2 12.7 35.0 24.1 10.7 24.7 21.1 14.5 35.12005 23.0 12.8 23.7 16.8 10.8 31.8 21.2 7.5 21.8 18.8 14.3 30.32006 20.9 12.8 21.5 16.6 10.8 27.9 18.8 7.5 19.3 18.0 14.3 24.7
Mozambique 1994 5.0 5.0 5.0 5.0 5.0 5.0 5.0 5.0 5.0 5.0 5.0 5.01997 14.5 4.4 15.2 4.9 9.4 21.5 15.4 4.3 15.5 12.0 10.6 21.42001 12.9 4.4 13.4 4.7 8.8 18.7 11.9 6.8 12.0 5.5 8.8 17.62002 11.2 4.3 11.7 4.4 8.1 16.0 9.5 6.7 9.5 9.4 8.2 11.62003 11.2 4.3 11.7 4.4 8.1 16.0 9.5 6.7 9.5 9.4 8.2 11.62005 11.2 4.3 11.7 4.4 8.1 16.0 8.8 6.2 8.8 5.6 8.1 11.02006 11.2 4.3 11.7 4.4 8.1 16.0 8.8 6.2 8.8 5.6 8.1 11.1
Myanmar 2001 5.0 3.2 5.1 1.9 2.9 7.3 4.8 2.9 4.8 2.5 2.8 6.92002 5.0 3.2 5.1 1.9 2.9 7.3 4.7 3.0 4.7 2.5 2.9 6.82003 5.0 3.2 5.1 1.9 2.9 7.3 4.0 2.7 4.1 2.4 2.6 6.22004 5.0 3.2 5.1 1.9 2.9 7.3 4.0 2.5 4.0 2.4 3.1 5.52005 5.1 3.1 5.2 1.8 3.0 7.4 4.0 2.8 4.1 2.6 3.0 5.52006 5.1 3.1 5.2 1.8 3.0 7.4 4.1 2.8 4.1 2.6 3.0 5.6
For sources and notes, see end of table. Pour les sources et les notes, se reporter à la fin du tableau.
Market
Marchés Year
Année
MFN rate - Simple average (2) / Droit NPF - Moyenne simple (2) MFN rate - Weighted average (3) / Droit NPF - Moyenne pondérée (3)
Total of non- agriculturaland non-
fuel products
Total des produits
non-agricoleset
non-pétroliers
of which: / dont :
Total of non- agriculturaland non-
fuel products
Total des produits
non-agricoleset
non-pétroliers
of which: / dont :
Ores and metals
Minéraiset
métaux
Manu-facturedproducts
Produitsmanu-
facturés
Of which: / dont :
Ores and metals
Minéraiset
métaux
Manu-facturedproducts
Produitsmanu-
facturés
Of which: / dont :
4.3 Average applied import MFN tariff rates on non-agricultural and non-fuelproducts
4.3 Droits de douane moyens NPF appliqués àl'importation des produits non-agricoles etnon-pétroliers
232

Chemicalproducts
Produitschimiques
Machineryand
transportequipment
Machineset matériel
detransport
Othermanu-
facturedproducts
Produitsmanu-
facturésdivers
Chemicalproducts
Produitschimiques
Machineryand
transportequipment
Machineset matériel
detransport
Othermanu-
facturedproducts
Produitsmanu-
facturésdivers
SITC Rev.2 (1) / CTCI Rév.2 (1)5+6+7+8+27+28
27+28+68(5+6+7+8)
- 685 7
(6+8)- 68
5+6+7+8+27+28
27+28+68(5+6+7+8)
- 685 7
(6+8)- 68
Namibia - Namibie 2001 7.9 1.4 8.4 2.5 3.2 13.0 11.3 0.7 11.5 10.4 10.2 13.52004 8.1 1.3 8.5 2.4 3.0 13.2 10.9 1.8 11.1 6.1 10.2 14.02005 8.0 1.2 8.5 2.5 3.0 13.1 11.0 1.9 11.1 5.9 10.6 13.62006 8.0 1.2 8.5 2.4 3.0 13.1 10.9 1.9 11.0 5.9 10.3 13.6
Nepal - Népal 1993 18.0 7.4 18.7 8.9 18.0 22.6 20.8 5.2 22.1 8.5 25.6 24.91998 17.5 7.5 18.1 8.8 17.4 22.1 29.2 5.1 30.4 9.2 44.9 23.71999 12.9 7.2 13.3 9.7 12.1 15.2 15.1 7.2 15.5 10.9 21.9 12.52000 13.4 9.5 13.6 12.1 11.8 15.0 19.5 5.4 20.3 12.0 33.2 12.42002 13.6 10.2 13.9 12.2 11.9 15.3 16.8 7.3 17.5 13.9 22.7 15.92003 13.7 10.2 14.0 12.3 12.0 15.5 17.0 7.3 17.7 14.1 23.0 16.12004 13.8 10.4 14.1 12.5 11.4 15.8 16.1 7.2 16.8 14.5 18.8 16.52005 13.8 10.4 14.1 12.5 11.4 15.8 16.4 7.2 17.0 14.5 19.6 16.42006 12.3 10.0 12.5 11.4 10.3 13.8 14.9 7.0 15.5 12.6 17.1 15.6
New Zealand - Nouvelle-Zélande 1992 8.9 2.4 9.3 2.4 10.9 11.3 9.3 3.5 9.6 5.5 9.5 11.51993 8.4 2.4 8.8 2.1 9.7 11.0 9.0 3.4 9.3 4.4 9.7 11.01996 6.1 1.7 6.4 1.4 6.6 8.2 7.3 2.2 7.5 2.9 8.1 8.81997 5.3 1.3 5.6 1.2 5.8 7.2 6.2 2.4 6.4 2.3 6.4 8.11998 4.5 1.0 4.7 0.9 4.9 6.0 5.3 1.8 5.5 1.8 5.4 7.31999 3.7 0.8 3.9 0.8 4.1 5.1 4.6 1.7 4.7 1.7 4.8 5.92000 2.9 0.6 3.1 0.6 3.1 4.0 3.6 1.3 3.7 1.3 3.8 4.62002 3.6 0.8 3.8 0.8 3.9 5.0 4.6 1.8 4.7 1.8 4.8 5.82003 3.6 0.8 3.8 0.8 3.9 4.9 4.6 1.9 4.7 1.9 4.9 5.52004 3.5 0.8 3.7 0.8 3.9 4.7 4.5 2.0 4.6 1.7 4.8 5.42005 3.5 0.8 3.7 0.8 3.9 4.7 4.3 2.2 4.4 1.7 4.6 5.22006 3.3 0.8 3.5 0.8 3.9 4.4 4.2 2.2 4.3 1.7 4.5 5.0
Nicaragua 1995 9.4 5.8 9.6 5.8 4.1 13.3 7.6 6.3 7.6 6.5 5.1 10.91998 4.8 1.2 5.0 1.3 1.9 7.7 5.1 3.8 5.1 3.9 4.0 7.31999 9.7 6.2 9.9 6.2 6.9 12.6 9.6 10.0 9.6 8.0 8.2 12.12000 3.1 0.9 3.3 0.9 1.5 5.0 3.9 2.3 3.9 3.0 3.5 4.82001 3.9 0.9 4.1 1.1 1.8 6.3 4.5 2.2 4.5 3.8 3.6 5.72002 3.9 0.9 4.1 1.1 1.8 6.3 4.5 2.2 4.5 3.9 3.7 5.52004 4.3 1.0 4.6 1.4 2.2 6.8 5.5 4.5 5.5 3.7 5.3 6.82005 4.8 1.0 5.1 1.4 2.2 7.7 5.4 4.7 5.4 3.3 4.2 7.9
Niger 2001 11.8 7.5 12.0 6.3 8.5 15.7 13.0 5.5 13.3 6.2 12.9 16.82002 11.7 7.5 12.0 6.3 8.5 15.7 12.4 5.4 12.6 6.0 11.5 16.82003 11.7 7.3 12.0 6.3 8.6 15.7 11.3 5.5 11.5 4.0 10.7 15.72004 11.7 7.4 12.0 6.3 8.6 15.7 11.4 5.6 11.5 4.0 10.7 15.82005 11.7 7.4 12.0 6.3 8.6 15.7 11.8 5.6 12.0 5.1 11.0 15.62006 11.7 7.4 12.0 6.3 8.6 15.7 11.9 5.6 12.1 5.1 11.1 15.6
Nigeria - Nigéria 1988 33.6 22.5 34.4 18.5 18.2 47.0 21.3 18.7 21.4 18.5 18.9 27.41989 35.6 29.9 36.0 19.1 19.5 49.2 22.3 15.8 22.5 19.0 19.8 29.11990 35.8 30.0 36.2 19.0 20.2 49.2 22.5 16.6 22.7 18.9 20.6 28.61992 34.5 23.2 35.2 22.6 20.2 46.2 23.1 16.6 23.3 22.3 20.6 28.21995 27.0 11.4 28.5 11.5 12.3 36.4 19.5 10.3 19.8 12.4 17.8 24.61996 23.4 16.6 23.9 13.2 12.7 32.7 14.9 9.8 15.1 14.4 12.9 18.31997 23.4 16.6 23.9 13.2 12.7 32.7 15.1 10.0 15.3 15.1 12.9 18.41998 23.4 16.6 23.9 13.2 12.7 32.7 15.1 10.0 15.3 15.1 12.9 18.41999 25.3 18.8 25.7 17.6 16.3 32.9 18.5 14.6 18.7 18.9 16.7 20.82000 25.3 18.8 25.7 17.6 16.3 32.9 18.2 15.4 18.2 17.0 17.5 20.62001 25.3 18.8 25.8 17.6 16.3 32.9 18.6 16.9 18.7 17.5 17.4 21.32002 26.7 17.4 27.3 16.1 15.4 36.6 15.7 10.0 15.8 12.4 14.6 20.32005 11.4 6.9 11.7 6.8 5.9 16.0 9.8 10.1 9.8 10.1 6.6 14.82006 11.4 6.9 11.8 6.8 6.0 16.1 10.2 10.1 10.2 10.1 7.3 14.9
For sources and notes, see end of table. Pour les sources et les notes, se reporter à la fin du tableau.
Market
Marchés Year
Année
MFN rate - Simple average (2) / Droit NPF - Moyenne simple (2) MFN rate - Weighted average (3) / Droit NPF - Moyenne pondérée (3)
Total of non- agriculturaland non-
fuel products
Total des produits
non-agricoleset
non-pétroliers
of which: / dont :
Total of non- agriculturaland non-
fuel products
Total des produits
non-agricoleset
non-pétroliers
of which: / dont :
Manu-facturedproducts
Produitsmanu-
facturés
Of which: / dont :
Ores and metals
Minéraiset
métaux
Manu-facturedproducts
Produitsmanu-
facturés
Of which: / dont :
Ores and metals
Minéraiset
métaux
4.3 Average applied import MFN tariff rates on non-agricultural and non-fuelproducts
4.3 Droits de douane moyens NPF appliqués àl'importation des produits non-agricoles etnon-pétroliers
233
4
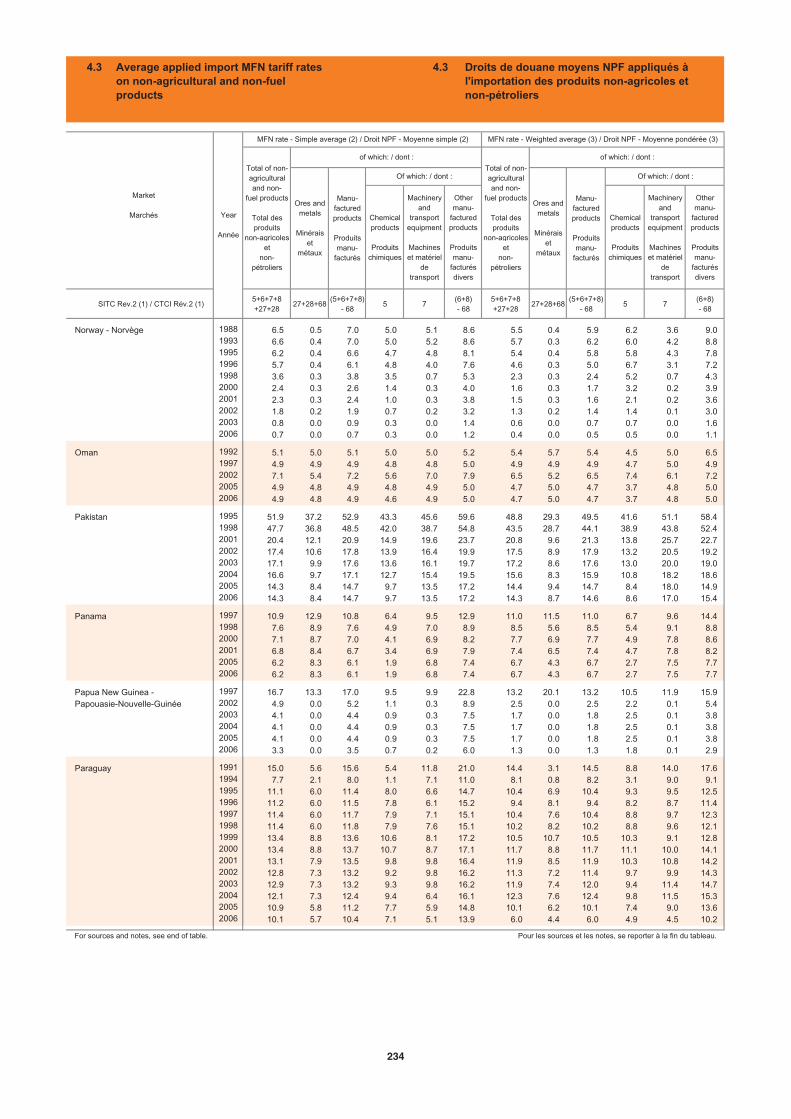
Chemicalproducts
Produitschimiques
Machineryand
transportequipment
Machineset matériel
detransport
Othermanu-
facturedproducts
Produitsmanu-
facturésdivers
Chemicalproducts
Produitschimiques
Machineryand
transportequipment
Machineset matériel
detransport
Othermanu-
facturedproducts
Produitsmanu-
facturésdivers
SITC Rev.2 (1) / CTCI Rév.2 (1)5+6+7+8+27+28
27+28+68(5+6+7+8)
- 685 7
(6+8)- 68
5+6+7+8+27+28
27+28+68(5+6+7+8)
- 685 7
(6+8)- 68
Norway - Norvège 1988 6.5 0.5 7.0 5.0 5.1 8.6 5.5 0.4 5.9 6.2 3.6 9.01993 6.6 0.4 7.0 5.0 5.2 8.6 5.7 0.3 6.2 6.0 4.2 8.81995 6.2 0.4 6.6 4.7 4.8 8.1 5.4 0.4 5.8 5.8 4.3 7.81996 5.7 0.4 6.1 4.8 4.0 7.6 4.6 0.3 5.0 6.7 3.1 7.21998 3.6 0.3 3.8 3.5 0.7 5.3 2.3 0.3 2.4 5.2 0.7 4.32000 2.4 0.3 2.6 1.4 0.3 4.0 1.6 0.3 1.7 3.2 0.2 3.92001 2.3 0.3 2.4 1.0 0.3 3.8 1.5 0.3 1.6 2.1 0.2 3.62002 1.8 0.2 1.9 0.7 0.2 3.2 1.3 0.2 1.4 1.4 0.1 3.02003 0.8 0.0 0.9 0.3 0.0 1.4 0.6 0.0 0.7 0.7 0.0 1.62006 0.7 0.0 0.7 0.3 0.0 1.2 0.4 0.0 0.5 0.5 0.0 1.1
Oman 1992 5.1 5.0 5.1 5.0 5.0 5.2 5.4 5.7 5.4 4.5 5.0 6.51997 4.9 4.9 4.9 4.8 4.8 5.0 4.9 4.9 4.9 4.7 5.0 4.92002 7.1 5.4 7.2 5.6 7.0 7.9 6.5 5.2 6.5 7.4 6.1 7.22005 4.9 4.8 4.9 4.8 4.9 5.0 4.7 5.0 4.7 3.7 4.8 5.02006 4.9 4.8 4.9 4.6 4.9 5.0 4.7 5.0 4.7 3.7 4.8 5.0
Pakistan 1995 51.9 37.2 52.9 43.3 45.6 59.6 48.8 29.3 49.5 41.6 51.1 58.41998 47.7 36.8 48.5 42.0 38.7 54.8 43.5 28.7 44.1 38.9 43.8 52.42001 20.4 12.1 20.9 14.9 19.6 23.7 20.8 9.6 21.3 13.8 25.7 22.72002 17.4 10.6 17.8 13.9 16.4 19.9 17.5 8.9 17.9 13.2 20.5 19.22003 17.1 9.9 17.6 13.6 16.1 19.7 17.2 8.6 17.6 13.0 20.0 19.02004 16.6 9.7 17.1 12.7 15.4 19.5 15.6 8.3 15.9 10.8 18.2 18.62005 14.3 8.4 14.7 9.7 13.5 17.2 14.4 9.4 14.7 8.4 18.0 14.92006 14.3 8.4 14.7 9.7 13.5 17.2 14.3 8.7 14.6 8.6 17.0 15.4
Panama 1997 10.9 12.9 10.8 6.4 9.5 12.9 11.0 11.5 11.0 6.7 9.6 14.41998 7.6 8.9 7.6 4.9 7.0 8.9 8.5 5.6 8.5 5.4 9.1 8.82000 7.1 8.7 7.0 4.1 6.9 8.2 7.7 6.9 7.7 4.9 7.8 8.62001 6.8 8.4 6.7 3.4 6.9 7.9 7.4 6.5 7.4 4.7 7.8 8.22005 6.2 8.3 6.1 1.9 6.8 7.4 6.7 4.3 6.7 2.7 7.5 7.72006 6.2 8.3 6.1 1.9 6.8 7.4 6.7 4.3 6.7 2.7 7.5 7.7
Papua New Guinea - 1997 16.7 13.3 17.0 9.5 9.9 22.8 13.2 20.1 13.2 10.5 11.9 15.9Papouasie-Nouvelle-Guinée 2002 4.9 0.0 5.2 1.1 0.3 8.9 2.5 0.0 2.5 2.2 0.1 5.4
2003 4.1 0.0 4.4 0.9 0.3 7.5 1.7 0.0 1.8 2.5 0.1 3.82004 4.1 0.0 4.4 0.9 0.3 7.5 1.7 0.0 1.8 2.5 0.1 3.82005 4.1 0.0 4.4 0.9 0.3 7.5 1.7 0.0 1.8 2.5 0.1 3.82006 3.3 0.0 3.5 0.7 0.2 6.0 1.3 0.0 1.3 1.8 0.1 2.9
Paraguay 1991 15.0 5.6 15.6 5.4 11.8 21.0 14.4 3.1 14.5 8.8 14.0 17.61994 7.7 2.1 8.0 1.1 7.1 11.0 8.1 0.8 8.2 3.1 9.0 9.11995 11.1 6.0 11.4 8.0 6.6 14.7 10.4 6.9 10.4 9.3 9.5 12.51996 11.2 6.0 11.5 7.8 6.1 15.2 9.4 8.1 9.4 8.2 8.7 11.41997 11.4 6.0 11.7 7.9 7.1 15.1 10.4 7.6 10.4 8.8 9.7 12.31998 11.4 6.0 11.8 7.9 7.6 15.1 10.2 8.2 10.2 8.8 9.6 12.11999 13.4 8.8 13.6 10.6 8.1 17.2 10.5 10.7 10.5 10.3 9.1 12.82000 13.4 8.8 13.7 10.7 8.7 17.1 11.7 8.8 11.7 11.1 10.0 14.12001 13.1 7.9 13.5 9.8 9.8 16.4 11.9 8.5 11.9 10.3 10.8 14.22002 12.8 7.3 13.2 9.2 9.8 16.2 11.3 7.2 11.4 9.7 9.9 14.32003 12.9 7.3 13.2 9.3 9.8 16.2 11.9 7.4 12.0 9.4 11.4 14.72004 12.1 7.3 12.4 9.4 6.4 16.1 12.3 7.6 12.4 9.8 11.5 15.32005 10.9 5.8 11.2 7.7 5.9 14.8 10.1 6.2 10.1 7.4 9.0 13.62006 10.1 5.7 10.4 7.1 5.1 13.9 6.0 4.4 6.0 4.9 4.5 10.2
For sources and notes, see end of table. Pour les sources et les notes, se reporter à la fin du tableau.
Market
Marchés Year
Année
MFN rate - Simple average (2) / Droit NPF - Moyenne simple (2) MFN rate - Weighted average (3) / Droit NPF - Moyenne pondérée (3)
Total of non- agriculturaland non-
fuel products
Total des produits
non-agricoleset
non-pétroliers
of which: / dont :
Total of non- agriculturaland non-
fuel products
Total des produits
non-agricoleset
non-pétroliers
of which: / dont :
Ores and metals
Minéraiset
métaux
Manu-facturedproducts
Produitsmanu-
facturés
Of which: / dont :
Ores and metals
Minéraiset
métaux
Manu-facturedproducts
Produitsmanu-
facturés
Of which: / dont :
4.3 Average applied import MFN tariff rates on non-agricultural and non-fuelproducts
4.3 Droits de douane moyens NPF appliqués àl'importation des produits non-agricoles etnon-pétroliers
234
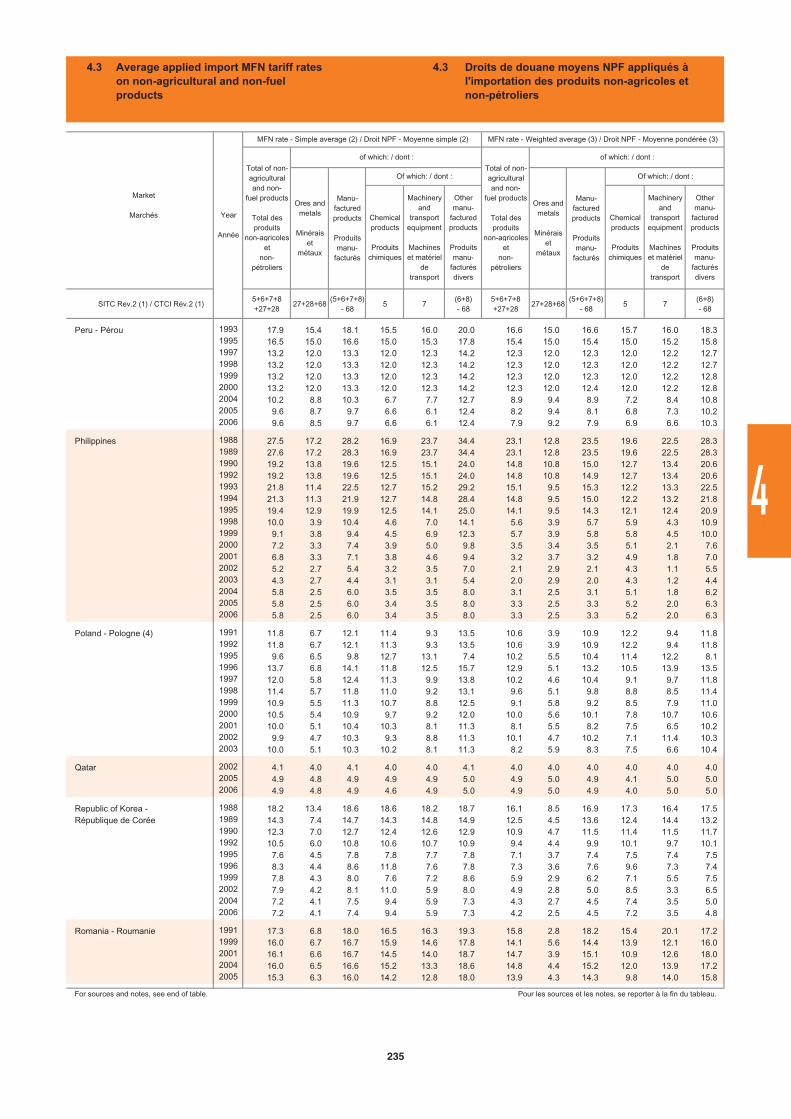
Chemicalproducts
Produitschimiques
Machineryand
transportequipment
Machineset matériel
detransport
Othermanu-
facturedproducts
Produitsmanu-
facturésdivers
Chemicalproducts
Produitschimiques
Machineryand
transportequipment
Machineset matériel
detransport
Othermanu-
facturedproducts
Produitsmanu-
facturésdivers
SITC Rev.2 (1) / CTCI Rév.2 (1)5+6+7+8+27+28
27+28+68(5+6+7+8)
- 685 7
(6+8)- 68
5+6+7+8+27+28
27+28+68(5+6+7+8)
- 685 7
(6+8)- 68
Peru - Pérou 1993 17.9 15.4 18.1 15.5 16.0 20.0 16.6 15.0 16.6 15.7 16.0 18.31995 16.5 15.0 16.6 15.0 15.3 17.8 15.4 15.0 15.4 15.0 15.2 15.81997 13.2 12.0 13.3 12.0 12.3 14.2 12.3 12.0 12.3 12.0 12.2 12.71998 13.2 12.0 13.3 12.0 12.3 14.2 12.3 12.0 12.3 12.0 12.2 12.71999 13.2 12.0 13.3 12.0 12.3 14.2 12.3 12.0 12.3 12.0 12.2 12.82000 13.2 12.0 13.3 12.0 12.3 14.2 12.3 12.0 12.4 12.0 12.2 12.82004 10.2 8.8 10.3 6.7 7.7 12.7 8.9 9.4 8.9 7.2 8.4 10.82005 9.6 8.7 9.7 6.6 6.1 12.4 8.2 9.4 8.1 6.8 7.3 10.22006 9.6 8.5 9.7 6.6 6.1 12.4 7.9 9.2 7.9 6.9 6.6 10.3
Philippines 1988 27.5 17.2 28.2 16.9 23.7 34.4 23.1 12.8 23.5 19.6 22.5 28.31989 27.6 17.2 28.3 16.9 23.7 34.4 23.1 12.8 23.5 19.6 22.5 28.31990 19.2 13.8 19.6 12.5 15.1 24.0 14.8 10.8 15.0 12.7 13.4 20.61992 19.2 13.8 19.6 12.5 15.1 24.0 14.8 10.8 14.9 12.7 13.4 20.61993 21.8 11.4 22.5 12.7 15.2 29.2 15.1 9.5 15.3 12.2 13.3 22.51994 21.3 11.3 21.9 12.7 14.8 28.4 14.8 9.5 15.0 12.2 13.2 21.81995 19.4 12.9 19.9 12.5 14.1 25.0 14.1 9.5 14.3 12.1 12.4 20.91998 10.0 3.9 10.4 4.6 7.0 14.1 5.6 3.9 5.7 5.9 4.3 10.91999 9.1 3.8 9.4 4.5 6.9 12.3 5.7 3.9 5.8 5.8 4.5 10.02000 7.2 3.3 7.4 3.9 5.0 9.8 3.5 3.4 3.5 5.1 2.1 7.62001 6.8 3.3 7.1 3.8 4.6 9.4 3.2 3.7 3.2 4.9 1.8 7.02002 5.2 2.7 5.4 3.2 3.5 7.0 2.1 2.9 2.1 4.3 1.1 5.52003 4.3 2.7 4.4 3.1 3.1 5.4 2.0 2.9 2.0 4.3 1.2 4.42004 5.8 2.5 6.0 3.5 3.5 8.0 3.1 2.5 3.1 5.1 1.8 6.22005 5.8 2.5 6.0 3.4 3.5 8.0 3.3 2.5 3.3 5.2 2.0 6.32006 5.8 2.5 6.0 3.4 3.5 8.0 3.3 2.5 3.3 5.2 2.0 6.3
Poland - Pologne (4) 1991 11.8 6.7 12.1 11.4 9.3 13.5 10.6 3.9 10.9 12.2 9.4 11.81992 11.8 6.7 12.1 11.3 9.3 13.5 10.6 3.9 10.9 12.2 9.4 11.81995 9.6 6.5 9.8 12.7 13.1 7.4 10.2 5.5 10.4 11.4 12.2 8.11996 13.7 6.8 14.1 11.8 12.5 15.7 12.9 5.1 13.2 10.5 13.9 13.51997 12.0 5.8 12.4 11.3 9.9 13.8 10.2 4.6 10.4 9.1 9.7 11.81998 11.4 5.7 11.8 11.0 9.2 13.1 9.6 5.1 9.8 8.8 8.5 11.41999 10.9 5.5 11.3 10.7 8.8 12.5 9.1 5.8 9.2 8.5 7.9 11.02000 10.5 5.4 10.9 9.7 9.2 12.0 10.0 5.6 10.1 7.8 10.7 10.62001 10.0 5.1 10.4 10.3 8.1 11.3 8.1 5.5 8.2 7.5 6.5 10.22002 9.9 4.7 10.3 9.3 8.8 11.3 10.1 4.7 10.2 7.1 11.4 10.32003 10.0 5.1 10.3 10.2 8.1 11.3 8.2 5.9 8.3 7.5 6.6 10.4
Qatar 2002 4.1 4.0 4.1 4.0 4.0 4.1 4.0 4.0 4.0 4.0 4.0 4.02005 4.9 4.8 4.9 4.9 4.9 5.0 4.9 5.0 4.9 4.1 5.0 5.02006 4.9 4.8 4.9 4.6 4.9 5.0 4.9 5.0 4.9 4.0 5.0 5.0
Republic of Korea - 1988 18.2 13.4 18.6 18.6 18.2 18.7 16.1 8.5 16.9 17.3 16.4 17.5République de Corée 1989 14.3 7.4 14.7 14.3 14.8 14.9 12.5 4.5 13.6 12.4 14.4 13.2
1990 12.3 7.0 12.7 12.4 12.6 12.9 10.9 4.7 11.5 11.4 11.5 11.71992 10.5 6.0 10.8 10.6 10.7 10.9 9.4 4.4 9.9 10.1 9.7 10.11995 7.6 4.5 7.8 7.8 7.7 7.8 7.1 3.7 7.4 7.5 7.4 7.51996 8.3 4.4 8.6 11.8 7.6 7.8 7.3 3.6 7.6 9.6 7.3 7.41999 7.8 4.3 8.0 7.6 7.2 8.6 5.9 2.9 6.2 7.1 5.5 7.52002 7.9 4.2 8.1 11.0 5.9 8.0 4.9 2.8 5.0 8.5 3.3 6.52004 7.2 4.1 7.5 9.4 5.9 7.3 4.3 2.7 4.5 7.4 3.5 5.02006 7.2 4.1 7.4 9.4 5.9 7.3 4.2 2.5 4.5 7.2 3.5 4.8
Romania - Roumanie 1991 17.3 6.8 18.0 16.5 16.3 19.3 15.8 2.8 18.2 15.4 20.1 17.21999 16.0 6.7 16.7 15.9 14.6 17.8 14.1 5.6 14.4 13.9 12.1 16.02001 16.1 6.6 16.7 14.5 14.0 18.7 14.7 3.9 15.1 10.9 12.6 18.02004 16.0 6.5 16.6 15.2 13.3 18.6 14.8 4.4 15.2 12.0 13.9 17.22005 15.3 6.3 16.0 14.2 12.8 18.0 13.9 4.3 14.3 9.8 14.0 15.8
For sources and notes, see end of table. Pour les sources et les notes, se reporter à la fin du tableau.
Market
Marchés Year
Année
MFN rate - Simple average (2) / Droit NPF - Moyenne simple (2) MFN rate - Weighted average (3) / Droit NPF - Moyenne pondérée (3)
Total of non- agriculturaland non-
fuel products
Total des produits
non-agricoleset
non-pétroliers
of which: / dont :
Total of non- agriculturaland non-
fuel products
Total des produits
non-agricoleset
non-pétroliers
of which: / dont :
Manu-facturedproducts
Produitsmanu-
facturés
Of which: / dont :
Ores and metals
Minéraiset
métaux
Manu-facturedproducts
Produitsmanu-
facturés
Of which: / dont :
Ores and metals
Minéraiset
métaux
4.3 Average applied import MFN tariff rates on non-agricultural and non-fuelproducts
4.3 Droits de douane moyens NPF appliqués àl'importation des produits non-agricoles etnon-pétroliers
235
4
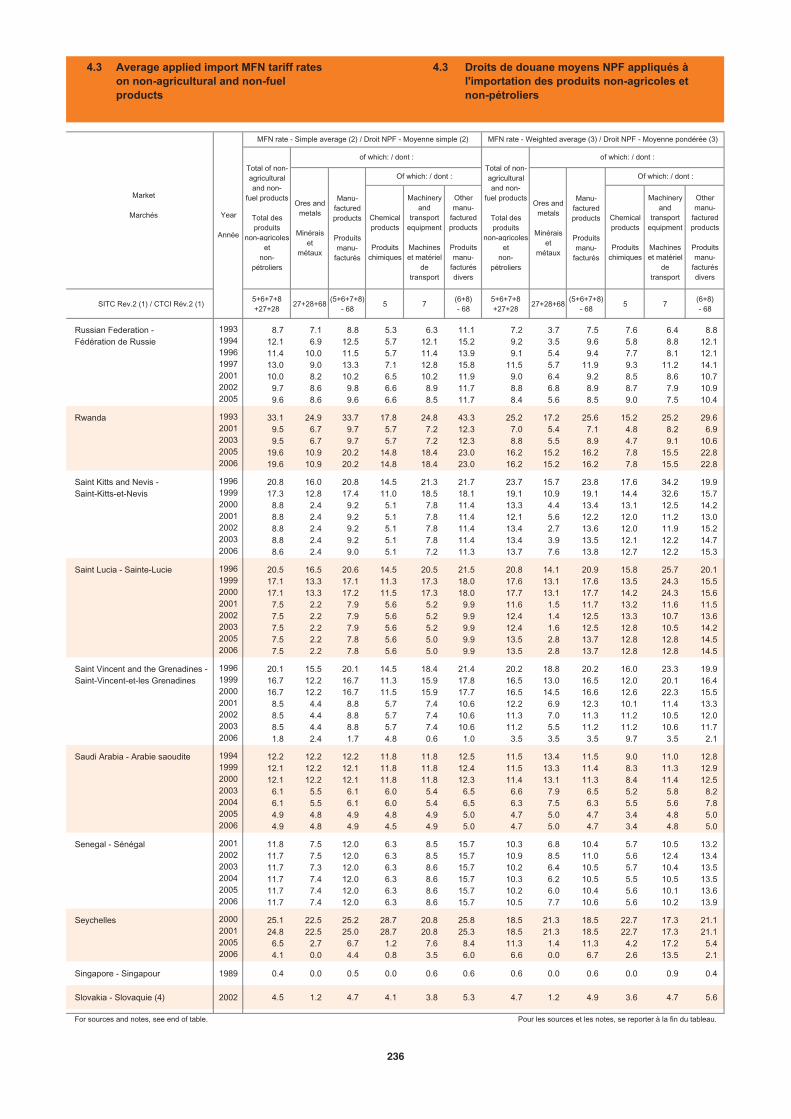
Chemicalproducts
Produitschimiques
Machineryand
transportequipment
Machineset matériel
detransport
Othermanu-
facturedproducts
Produitsmanu-
facturésdivers
Chemicalproducts
Produitschimiques
Machineryand
transportequipment
Machineset matériel
detransport
Othermanu-
facturedproducts
Produitsmanu-
facturésdivers
SITC Rev.2 (1) / CTCI Rév.2 (1)5+6+7+8+27+28
27+28+68(5+6+7+8)
- 685 7
(6+8)- 68
5+6+7+8+27+28
27+28+68(5+6+7+8)
- 685 7
(6+8)- 68
Russian Federation - 1993 8.7 7.1 8.8 5.3 6.3 11.1 7.2 3.7 7.5 7.6 6.4 8.8Fédération de Russie 1994 12.1 6.9 12.5 5.7 12.1 15.2 9.2 3.5 9.6 5.8 8.8 12.1
1996 11.4 10.0 11.5 5.7 11.4 13.9 9.1 5.4 9.4 7.7 8.1 12.11997 13.0 9.0 13.3 7.1 12.8 15.8 11.5 5.7 11.9 9.3 11.2 14.12001 10.0 8.2 10.2 6.5 10.2 11.9 9.0 6.4 9.2 8.5 8.6 10.72002 9.7 8.6 9.8 6.6 8.9 11.7 8.8 6.8 8.9 8.7 7.9 10.92005 9.6 8.6 9.6 6.6 8.5 11.7 8.4 5.6 8.5 9.0 7.5 10.4
Rwanda 1993 33.1 24.9 33.7 17.8 24.8 43.3 25.2 17.2 25.6 15.2 25.2 29.62001 9.5 6.7 9.7 5.7 7.2 12.3 7.0 5.4 7.1 4.8 8.2 6.92003 9.5 6.7 9.7 5.7 7.2 12.3 8.8 5.5 8.9 4.7 9.1 10.62005 19.6 10.9 20.2 14.8 18.4 23.0 16.2 15.2 16.2 7.8 15.5 22.82006 19.6 10.9 20.2 14.8 18.4 23.0 16.2 15.2 16.2 7.8 15.5 22.8
Saint Kitts and Nevis - 1996 20.8 16.0 20.8 14.5 21.3 21.7 23.7 15.7 23.8 17.6 34.2 19.9Saint-Kitts-et-Nevis 1999 17.3 12.8 17.4 11.0 18.5 18.1 19.1 10.9 19.1 14.4 32.6 15.7
2000 8.8 2.4 9.2 5.1 7.8 11.4 13.3 4.4 13.4 13.1 12.5 14.22001 8.8 2.4 9.2 5.1 7.8 11.4 12.1 5.6 12.2 12.0 11.2 13.02002 8.8 2.4 9.2 5.1 7.8 11.4 13.4 2.7 13.6 12.0 11.9 15.22003 8.8 2.4 9.2 5.1 7.8 11.4 13.4 3.9 13.5 12.1 12.2 14.72006 8.6 2.4 9.0 5.1 7.2 11.3 13.7 7.6 13.8 12.7 12.2 15.3
Saint Lucia - Sainte-Lucie 1996 20.5 16.5 20.6 14.5 20.5 21.5 20.8 14.1 20.9 15.8 25.7 20.11999 17.1 13.3 17.1 11.3 17.3 18.0 17.6 13.1 17.6 13.5 24.3 15.52000 17.1 13.3 17.2 11.5 17.3 18.0 17.7 13.1 17.7 14.2 24.3 15.62001 7.5 2.2 7.9 5.6 5.2 9.9 11.6 1.5 11.7 13.2 11.6 11.52002 7.5 2.2 7.9 5.6 5.2 9.9 12.4 1.4 12.5 13.3 10.7 13.62003 7.5 2.2 7.9 5.6 5.2 9.9 12.4 1.6 12.5 12.8 10.5 14.22005 7.5 2.2 7.8 5.6 5.0 9.9 13.5 2.8 13.7 12.8 12.8 14.52006 7.5 2.2 7.8 5.6 5.0 9.9 13.5 2.8 13.7 12.8 12.8 14.5
Saint Vincent and the Grenadines - 1996 20.1 15.5 20.1 14.5 18.4 21.4 20.2 18.8 20.2 16.0 23.3 19.9Saint-Vincent-et-les Grenadines 1999 16.7 12.2 16.7 11.3 15.9 17.8 16.5 13.0 16.5 12.0 20.1 16.4
2000 16.7 12.2 16.7 11.5 15.9 17.7 16.5 14.5 16.6 12.6 22.3 15.52001 8.5 4.4 8.8 5.7 7.4 10.6 12.2 6.9 12.3 10.1 11.4 13.32002 8.5 4.4 8.8 5.7 7.4 10.6 11.3 7.0 11.3 11.2 10.5 12.02003 8.5 4.4 8.8 5.7 7.4 10.6 11.2 5.5 11.2 11.2 10.6 11.72006 1.8 2.4 1.7 4.8 0.6 1.0 3.5 3.5 3.5 9.7 3.5 2.1
Saudi Arabia - Arabie saoudite 1994 12.2 12.2 12.2 11.8 11.8 12.5 11.5 13.4 11.5 9.0 11.0 12.81999 12.1 12.2 12.1 11.8 11.8 12.4 11.5 13.3 11.4 8.3 11.3 12.92000 12.1 12.2 12.1 11.8 11.8 12.3 11.4 13.1 11.3 8.4 11.4 12.52003 6.1 5.5 6.1 6.0 5.4 6.5 6.6 7.9 6.5 5.2 5.8 8.22004 6.1 5.5 6.1 6.0 5.4 6.5 6.3 7.5 6.3 5.5 5.6 7.82005 4.9 4.8 4.9 4.8 4.9 5.0 4.7 5.0 4.7 3.4 4.8 5.02006 4.9 4.8 4.9 4.5 4.9 5.0 4.7 5.0 4.7 3.4 4.8 5.0
Senegal - Sénégal 2001 11.8 7.5 12.0 6.3 8.5 15.7 10.3 6.8 10.4 5.7 10.5 13.22002 11.7 7.5 12.0 6.3 8.5 15.7 10.9 8.5 11.0 5.6 12.4 13.42003 11.7 7.3 12.0 6.3 8.6 15.7 10.2 6.4 10.5 5.7 10.4 13.52004 11.7 7.4 12.0 6.3 8.6 15.7 10.3 6.2 10.5 5.5 10.5 13.52005 11.7 7.4 12.0 6.3 8.6 15.7 10.2 6.0 10.4 5.6 10.1 13.62006 11.7 7.4 12.0 6.3 8.6 15.7 10.5 7.7 10.6 5.6 10.2 13.9
Seychelles 2000 25.1 22.5 25.2 28.7 20.8 25.8 18.5 21.3 18.5 22.7 17.3 21.12001 24.8 22.5 25.0 28.7 20.8 25.3 18.5 21.3 18.5 22.7 17.3 21.12005 6.5 2.7 6.7 1.2 7.6 8.4 11.3 1.4 11.3 4.2 17.2 5.42006 4.1 0.0 4.4 0.8 3.5 6.0 6.6 0.0 6.7 2.6 13.5 2.1
Singapore - Singapour 1989 0.4 0.0 0.5 0.0 0.6 0.6 0.6 0.0 0.6 0.0 0.9 0.4
Slovakia - Slovaquie (4) 2002 4.5 1.2 4.7 4.1 3.8 5.3 4.7 1.2 4.9 3.6 4.7 5.6
For sources and notes, see end of table. Pour les sources et les notes, se reporter à la fin du tableau.
Market
Marchés Year
Année
MFN rate - Simple average (2) / Droit NPF - Moyenne simple (2) MFN rate - Weighted average (3) / Droit NPF - Moyenne pondérée (3)
Total of non- agriculturaland non-
fuel products
Total des produits
non-agricoleset
non-pétroliers
of which: / dont :
Total of non- agriculturaland non-
fuel products
Total des produits
non-agricoleset
non-pétroliers
of which: / dont :
Ores and metals
Minéraiset
métaux
Manu-facturedproducts
Produitsmanu-
facturés
Of which: / dont :
Ores and metals
Minéraiset
métaux
Manu-facturedproducts
Produitsmanu-
facturés
Of which: / dont :
4.3 Average applied import MFN tariff rates on non-agricultural and non-fuelproducts
4.3 Droits de douane moyens NPF appliqués àl'importation des produits non-agricoles etnon-pétroliers
236
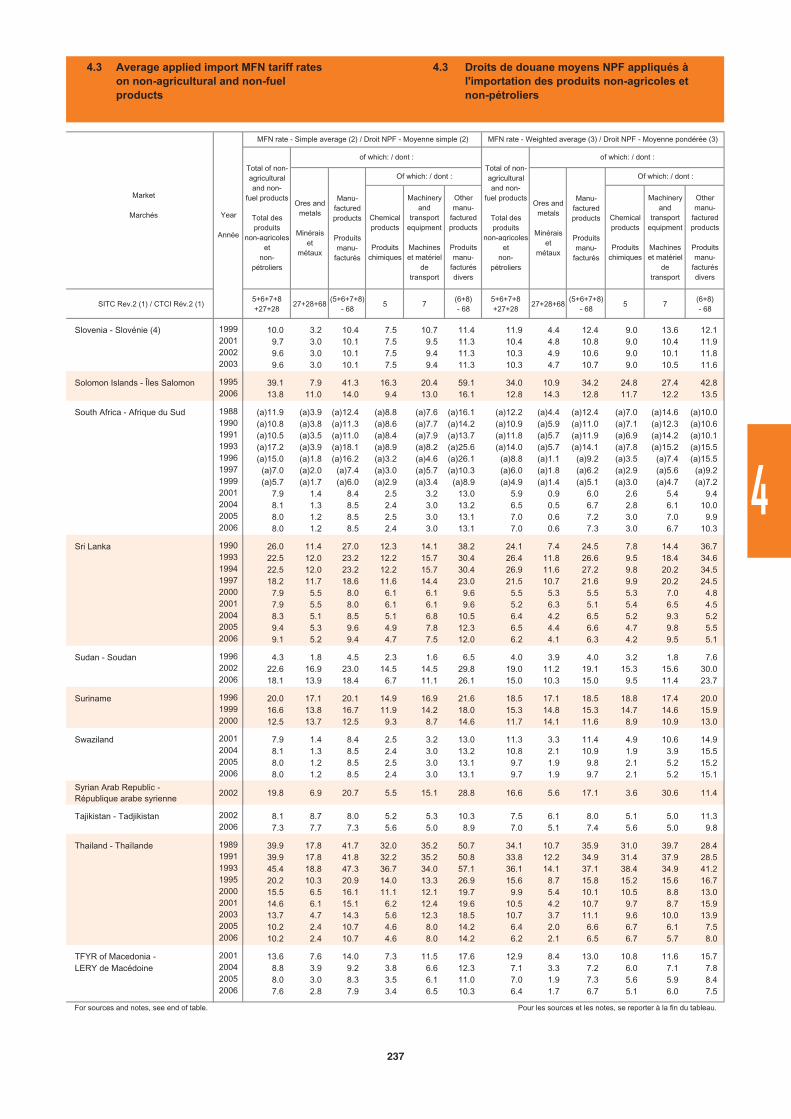
Chemicalproducts
Produitschimiques
Machineryand
transportequipment
Machineset matériel
detransport
Othermanu-
facturedproducts
Produitsmanu-
facturésdivers
Chemicalproducts
Produitschimiques
Machineryand
transportequipment
Machineset matériel
detransport
Othermanu-
facturedproducts
Produitsmanu-
facturésdivers
SITC Rev.2 (1) / CTCI Rév.2 (1)5+6+7+8+27+28
27+28+68(5+6+7+8)
- 685 7
(6+8)- 68
5+6+7+8+27+28
27+28+68(5+6+7+8)
- 685 7
(6+8)- 68
Slovenia - Slovénie (4) 1999 10.0 3.2 10.4 7.5 10.7 11.4 11.9 4.4 12.4 9.0 13.6 12.12001 9.7 3.0 10.1 7.5 9.5 11.3 10.4 4.8 10.8 9.0 10.4 11.92002 9.6 3.0 10.1 7.5 9.4 11.3 10.3 4.9 10.6 9.0 10.1 11.82003 9.6 3.0 10.1 7.5 9.4 11.3 10.3 4.7 10.7 9.0 10.5 11.6
Solomon Islands - Îles Salomon 1995 39.1 7.9 41.3 16.3 20.4 59.1 34.0 10.9 34.2 24.8 27.4 42.82006 13.8 11.0 14.0 9.4 13.0 16.1 12.8 14.3 12.8 11.7 12.2 13.5
South Africa - Afrique du Sud 1988 (a)11.9 (a)3.9 (a)12.4 (a)8.8 (a)7.6 (a)16.1 (a)12.2 (a)4.4 (a)12.4 (a)7.0 (a)14.6 (a)10.01990 (a)10.8 (a)3.8 (a)11.3 (a)8.6 (a)7.7 (a)14.2 (a)10.9 (a)5.9 (a)11.0 (a)7.1 (a)12.3 (a)10.61991 (a)10.5 (a)3.5 (a)11.0 (a)8.4 (a)7.9 (a)13.7 (a)11.8 (a)5.7 (a)11.9 (a)6.9 (a)14.2 (a)10.11993 (a)17.2 (a)3.9 (a)18.1 (a)8.9 (a)8.2 (a)25.6 (a)14.0 (a)5.7 (a)14.1 (a)7.8 (a)15.2 (a)15.51996 (a)15.0 (a)1.8 (a)16.2 (a)3.2 (a)4.6 (a)26.1 (a)8.8 (a)1.1 (a)9.2 (a)3.5 (a)7.4 (a)15.51997 (a)7.0 (a)2.0 (a)7.4 (a)3.0 (a)5.7 (a)10.3 (a)6.0 (a)1.8 (a)6.2 (a)2.9 (a)5.6 (a)9.21999 (a)5.7 (a)1.7 (a)6.0 (a)2.9 (a)3.4 (a)8.9 (a)4.9 (a)1.4 (a)5.1 (a)3.0 (a)4.7 (a)7.22001 7.9 1.4 8.4 2.5 3.2 13.0 5.9 0.9 6.0 2.6 5.4 9.42004 8.1 1.3 8.5 2.4 3.0 13.2 6.5 0.5 6.7 2.8 6.1 10.02005 8.0 1.2 8.5 2.5 3.0 13.1 7.0 0.6 7.2 3.0 7.0 9.92006 8.0 1.2 8.5 2.4 3.0 13.1 7.0 0.6 7.3 3.0 6.7 10.3
Sri Lanka 1990 26.0 11.4 27.0 12.3 14.1 38.2 24.1 7.4 24.5 7.8 14.4 36.71993 22.5 12.0 23.2 12.2 15.7 30.4 26.4 11.8 26.6 9.5 18.4 34.61994 22.5 12.0 23.2 12.2 15.7 30.4 26.9 11.6 27.2 9.8 20.2 34.51997 18.2 11.7 18.6 11.6 14.4 23.0 21.5 10.7 21.6 9.9 20.2 24.52000 7.9 5.5 8.0 6.1 6.1 9.6 5.5 5.3 5.5 5.3 7.0 4.82001 7.9 5.5 8.0 6.1 6.1 9.6 5.2 6.3 5.1 5.4 6.5 4.52004 8.3 5.1 8.5 5.1 6.8 10.5 6.4 4.2 6.5 5.2 9.3 5.22005 9.4 5.3 9.6 4.9 7.8 12.3 6.5 4.4 6.6 4.7 9.8 5.52006 9.1 5.2 9.4 4.7 7.5 12.0 6.2 4.1 6.3 4.2 9.5 5.1
Sudan - Soudan 1996 4.3 1.8 4.5 2.3 1.6 6.5 4.0 3.9 4.0 3.2 1.8 7.62002 22.6 16.9 23.0 14.5 14.5 29.8 19.0 11.2 19.1 15.3 15.6 30.02006 18.1 13.9 18.4 6.7 11.1 26.1 15.0 10.3 15.0 9.5 11.4 23.7
Suriname 1996 20.0 17.1 20.1 14.9 16.9 21.6 18.5 17.1 18.5 18.8 17.4 20.01999 16.6 13.8 16.7 11.9 14.2 18.0 15.3 14.8 15.3 14.7 14.6 15.92000 12.5 13.7 12.5 9.3 8.7 14.6 11.7 14.1 11.6 8.9 10.9 13.0
Swaziland 2001 7.9 1.4 8.4 2.5 3.2 13.0 11.3 3.3 11.4 4.9 10.6 14.92004 8.1 1.3 8.5 2.4 3.0 13.2 10.8 2.1 10.9 1.9 3.9 15.52005 8.0 1.2 8.5 2.5 3.0 13.1 9.7 1.9 9.8 2.1 5.2 15.22006 8.0 1.2 8.5 2.4 3.0 13.1 9.7 1.9 9.7 2.1 5.2 15.1
Syrian Arab Republic - République arabe syrienne
2002 19.8 6.9 20.7 5.5 15.1 28.8 16.6 5.6 17.1 3.6 30.6 11.4
Tajikistan - Tadjikistan 2002 8.1 8.7 8.0 5.2 5.3 10.3 7.5 6.1 8.0 5.1 5.0 11.32006 7.3 7.7 7.3 5.6 5.0 8.9 7.0 5.1 7.4 5.6 5.0 9.8
Thailand - Thaïlande 1989 39.9 17.8 41.7 32.0 35.2 50.7 34.1 10.7 35.9 31.0 39.7 28.41991 39.9 17.8 41.8 32.2 35.2 50.8 33.8 12.2 34.9 31.4 37.9 28.51993 45.4 18.8 47.3 36.7 34.0 57.1 36.1 14.1 37.1 38.4 34.9 41.21995 20.2 10.3 20.9 14.0 13.3 26.9 15.6 8.7 15.8 15.2 15.6 16.72000 15.5 6.5 16.1 11.1 12.1 19.7 9.9 5.4 10.1 10.5 8.8 13.02001 14.6 6.1 15.1 6.2 12.4 19.6 10.5 4.2 10.7 9.7 8.7 15.92003 13.7 4.7 14.3 5.6 12.3 18.5 10.7 3.7 11.1 9.6 10.0 13.92005 10.2 2.4 10.7 4.6 8.0 14.2 6.4 2.0 6.6 6.7 6.1 7.52006 10.2 2.4 10.7 4.6 8.0 14.2 6.2 2.1 6.5 6.7 5.7 8.0
TFYR of Macedonia - 2001 13.6 7.6 14.0 7.3 11.5 17.6 12.9 8.4 13.0 10.8 11.6 15.7LERY de Macédoine 2004 8.8 3.9 9.2 3.8 6.6 12.3 7.1 3.3 7.2 6.0 7.1 7.8
2005 8.0 3.0 8.3 3.5 6.1 11.0 7.0 1.9 7.3 5.6 5.9 8.42006 7.6 2.8 7.9 3.4 6.5 10.3 6.4 1.7 6.7 5.1 6.0 7.5
For sources and notes, see end of table. Pour les sources et les notes, se reporter à la fin du tableau.
Market
Marchés Year
Année
MFN rate - Simple average (2) / Droit NPF - Moyenne simple (2) MFN rate - Weighted average (3) / Droit NPF - Moyenne pondérée (3)
Total of non- agriculturaland non-
fuel products
Total des produits
non-agricoleset
non-pétroliers
of which: / dont :
Total of non- agriculturaland non-
fuel products
Total des produits
non-agricoleset
non-pétroliers
of which: / dont :
Manu-facturedproducts
Produitsmanu-
facturés
Of which: / dont :
Ores and metals
Minéraiset
métaux
Manu-facturedproducts
Produitsmanu-
facturés
Of which: / dont :
Ores and metals
Minéraiset
métaux
4.3 Average applied import MFN tariff rates on non-agricultural and non-fuelproducts
4.3 Droits de douane moyens NPF appliqués àl'importation des produits non-agricoles etnon-pétroliers
237
4
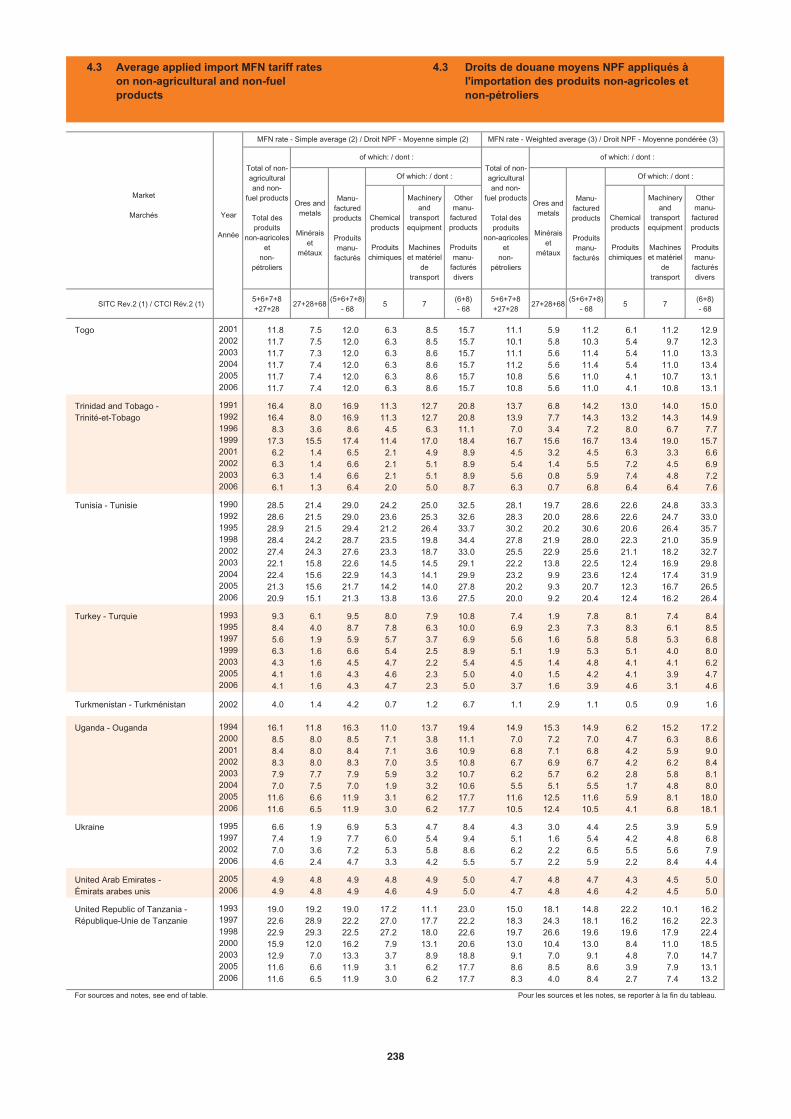
Chemicalproducts
Produitschimiques
Machineryand
transportequipment
Machineset matériel
detransport
Othermanu-
facturedproducts
Produitsmanu-
facturésdivers
Chemicalproducts
Produitschimiques
Machineryand
transportequipment
Machineset matériel
detransport
Othermanu-
facturedproducts
Produitsmanu-
facturésdivers
SITC Rev.2 (1) / CTCI Rév.2 (1)5+6+7+8+27+28
27+28+68(5+6+7+8)
- 685 7
(6+8)- 68
5+6+7+8+27+28
27+28+68(5+6+7+8)
- 685 7
(6+8)- 68
Togo 2001 11.8 7.5 12.0 6.3 8.5 15.7 11.1 5.9 11.2 6.1 11.2 12.92002 11.7 7.5 12.0 6.3 8.5 15.7 10.1 5.8 10.3 5.4 9.7 12.32003 11.7 7.3 12.0 6.3 8.6 15.7 11.1 5.6 11.4 5.4 11.0 13.32004 11.7 7.4 12.0 6.3 8.6 15.7 11.2 5.6 11.4 5.4 11.0 13.42005 11.7 7.4 12.0 6.3 8.6 15.7 10.8 5.6 11.0 4.1 10.7 13.12006 11.7 7.4 12.0 6.3 8.6 15.7 10.8 5.6 11.0 4.1 10.8 13.1
Trinidad and Tobago - 1991 16.4 8.0 16.9 11.3 12.7 20.8 13.7 6.8 14.2 13.0 14.0 15.0Trinité-et-Tobago 1992 16.4 8.0 16.9 11.3 12.7 20.8 13.9 7.7 14.3 13.2 14.3 14.9
1996 8.3 3.6 8.6 4.5 6.3 11.1 7.0 3.4 7.2 8.0 6.7 7.71999 17.3 15.5 17.4 11.4 17.0 18.4 16.7 15.6 16.7 13.4 19.0 15.72001 6.2 1.4 6.5 2.1 4.9 8.9 4.5 3.2 4.5 6.3 3.3 6.62002 6.3 1.4 6.6 2.1 5.1 8.9 5.4 1.4 5.5 7.2 4.5 6.92003 6.3 1.4 6.6 2.1 5.1 8.9 5.6 0.8 5.9 7.4 4.8 7.22006 6.1 1.3 6.4 2.0 5.0 8.7 6.3 0.7 6.8 6.4 6.4 7.6
Tunisia - Tunisie 1990 28.5 21.4 29.0 24.2 25.0 32.5 28.1 19.7 28.6 22.6 24.8 33.31992 28.6 21.5 29.0 23.6 25.3 32.6 28.3 20.0 28.6 22.6 24.7 33.01995 28.9 21.5 29.4 21.2 26.4 33.7 30.2 20.2 30.6 20.6 26.4 35.71998 28.4 24.2 28.7 23.5 19.8 34.4 27.8 21.9 28.0 22.3 21.0 35.92002 27.4 24.3 27.6 23.3 18.7 33.0 25.5 22.9 25.6 21.1 18.2 32.72003 22.1 15.8 22.6 14.5 14.5 29.1 22.2 13.8 22.5 12.4 16.9 29.82004 22.4 15.6 22.9 14.3 14.1 29.9 23.2 9.9 23.6 12.4 17.4 31.92005 21.3 15.6 21.7 14.2 14.0 27.8 20.2 9.3 20.7 12.3 16.7 26.52006 20.9 15.1 21.3 13.8 13.6 27.5 20.0 9.2 20.4 12.4 16.2 26.4
Turkey - Turquie 1993 9.3 6.1 9.5 8.0 7.9 10.8 7.4 1.9 7.8 8.1 7.4 8.41995 8.4 4.0 8.7 7.8 6.3 10.0 6.9 2.3 7.3 8.3 6.1 8.51997 5.6 1.9 5.9 5.7 3.7 6.9 5.6 1.6 5.8 5.8 5.3 6.81999 6.3 1.6 6.6 5.4 2.5 8.9 5.1 1.9 5.3 5.1 4.0 8.02003 4.3 1.6 4.5 4.7 2.2 5.4 4.5 1.4 4.8 4.1 4.1 6.22005 4.1 1.6 4.3 4.6 2.3 5.0 4.0 1.5 4.2 4.1 3.9 4.72006 4.1 1.6 4.3 4.7 2.3 5.0 3.7 1.6 3.9 4.6 3.1 4.6
Turkmenistan - Turkménistan 2002 4.0 1.4 4.2 0.7 1.2 6.7 1.1 2.9 1.1 0.5 0.9 1.6
Uganda - Ouganda 1994 16.1 11.8 16.3 11.0 13.7 19.4 14.9 15.3 14.9 6.2 15.2 17.22000 8.5 8.0 8.5 7.1 3.8 11.1 7.0 7.2 7.0 4.7 6.3 8.62001 8.4 8.0 8.4 7.1 3.6 10.9 6.8 7.1 6.8 4.2 5.9 9.02002 8.3 8.0 8.3 7.0 3.5 10.8 6.7 6.9 6.7 4.2 6.2 8.42003 7.9 7.7 7.9 5.9 3.2 10.7 6.2 5.7 6.2 2.8 5.8 8.12004 7.0 7.5 7.0 1.9 3.2 10.6 5.5 5.1 5.5 1.7 4.8 8.02005 11.6 6.6 11.9 3.1 6.2 17.7 11.6 12.5 11.6 5.9 8.1 18.02006 11.6 6.5 11.9 3.0 6.2 17.7 10.5 12.4 10.5 4.1 6.8 18.1
Ukraine 1995 6.6 1.9 6.9 5.3 4.7 8.4 4.3 3.0 4.4 2.5 3.9 5.91997 7.4 1.9 7.7 6.0 5.4 9.4 5.1 1.6 5.4 4.2 4.8 6.82002 7.0 3.6 7.2 5.3 5.8 8.6 6.2 2.2 6.5 5.5 5.6 7.92006 4.6 2.4 4.7 3.3 4.2 5.5 5.7 2.2 5.9 2.2 8.4 4.4
United Arab Emirates - 2005 4.9 4.8 4.9 4.8 4.9 5.0 4.7 4.8 4.7 4.3 4.5 5.0Émirats arabes unis 2006 4.9 4.8 4.9 4.6 4.9 5.0 4.7 4.8 4.6 4.2 4.5 5.0
United Republic of Tanzania - 1993 19.0 19.2 19.0 17.2 11.1 23.0 15.0 18.1 14.8 22.2 10.1 16.2République-Unie de Tanzanie 1997 22.6 28.9 22.2 27.0 17.7 22.2 18.3 24.3 18.1 16.2 16.2 22.3
1998 22.9 29.3 22.5 27.2 18.0 22.6 19.7 26.6 19.6 19.6 17.9 22.42000 15.9 12.0 16.2 7.9 13.1 20.6 13.0 10.4 13.0 8.4 11.0 18.52003 12.9 7.0 13.3 3.7 8.9 18.8 9.1 7.0 9.1 4.8 7.0 14.72005 11.6 6.6 11.9 3.1 6.2 17.7 8.6 8.5 8.6 3.9 7.9 13.12006 11.6 6.5 11.9 3.0 6.2 17.7 8.3 4.0 8.4 2.7 7.4 13.2
For sources and notes, see end of table. Pour les sources et les notes, se reporter à la fin du tableau.
Market
Marchés Year
Année
MFN rate - Simple average (2) / Droit NPF - Moyenne simple (2) MFN rate - Weighted average (3) / Droit NPF - Moyenne pondérée (3)
Total of non- agriculturaland non-
fuel products
Total des produits
non-agricoleset
non-pétroliers
of which: / dont :
Total of non- agriculturaland non-
fuel products
Total des produits
non-agricoleset
non-pétroliers
of which: / dont :
Ores and metals
Minéraiset
métaux
Manu-facturedproducts
Produitsmanu-
facturés
Of which: / dont :
Ores and metals
Minéraiset
métaux
Manu-facturedproducts
Produitsmanu-
facturés
Of which: / dont :
4.3 Average applied import MFN tariff rates on non-agricultural and non-fuelproducts
4.3 Droits de douane moyens NPF appliqués àl'importation des produits non-agricoles etnon-pétroliers
238
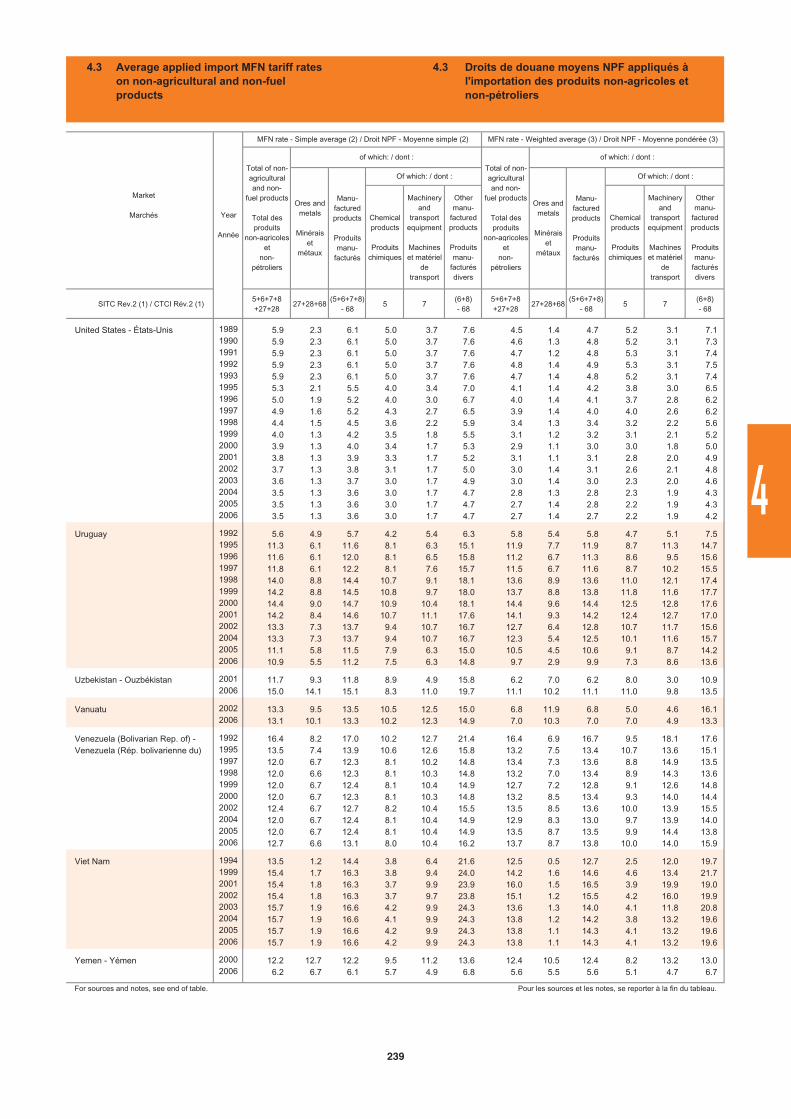
Chemicalproducts
Produitschimiques
Machineryand
transportequipment
Machineset matériel
detransport
Othermanu-
facturedproducts
Produitsmanu-
facturésdivers
Chemicalproducts
Produitschimiques
Machineryand
transportequipment
Machineset matériel
detransport
Othermanu-
facturedproducts
Produitsmanu-
facturésdivers
SITC Rev.2 (1) / CTCI Rév.2 (1)5+6+7+8+27+28
27+28+68(5+6+7+8)
- 685 7
(6+8)- 68
5+6+7+8+27+28
27+28+68(5+6+7+8)
- 685 7
(6+8)- 68
United States - États-Unis 1989 5.9 2.3 6.1 5.0 3.7 7.6 4.5 1.4 4.7 5.2 3.1 7.11990 5.9 2.3 6.1 5.0 3.7 7.6 4.6 1.3 4.8 5.2 3.1 7.31991 5.9 2.3 6.1 5.0 3.7 7.6 4.7 1.2 4.8 5.3 3.1 7.41992 5.9 2.3 6.1 5.0 3.7 7.6 4.8 1.4 4.9 5.3 3.1 7.51993 5.9 2.3 6.1 5.0 3.7 7.6 4.7 1.4 4.8 5.2 3.1 7.41995 5.3 2.1 5.5 4.0 3.4 7.0 4.1 1.4 4.2 3.8 3.0 6.51996 5.0 1.9 5.2 4.0 3.0 6.7 4.0 1.4 4.1 3.7 2.8 6.21997 4.9 1.6 5.2 4.3 2.7 6.5 3.9 1.4 4.0 4.0 2.6 6.21998 4.4 1.5 4.5 3.6 2.2 5.9 3.4 1.3 3.4 3.2 2.2 5.61999 4.0 1.3 4.2 3.5 1.8 5.5 3.1 1.2 3.2 3.1 2.1 5.22000 3.9 1.3 4.0 3.4 1.7 5.3 2.9 1.1 3.0 3.0 1.8 5.02001 3.8 1.3 3.9 3.3 1.7 5.2 3.1 1.1 3.1 2.8 2.0 4.92002 3.7 1.3 3.8 3.1 1.7 5.0 3.0 1.4 3.1 2.6 2.1 4.82003 3.6 1.3 3.7 3.0 1.7 4.9 3.0 1.4 3.0 2.3 2.0 4.62004 3.5 1.3 3.6 3.0 1.7 4.7 2.8 1.3 2.8 2.3 1.9 4.32005 3.5 1.3 3.6 3.0 1.7 4.7 2.7 1.4 2.8 2.2 1.9 4.32006 3.5 1.3 3.6 3.0 1.7 4.7 2.7 1.4 2.7 2.2 1.9 4.2
Uruguay 1992 5.6 4.9 5.7 4.2 5.4 6.3 5.8 5.4 5.8 4.7 5.1 7.51995 11.3 6.1 11.6 8.1 6.3 15.1 11.9 7.7 11.9 8.7 11.3 14.71996 11.6 6.1 12.0 8.1 6.5 15.8 11.2 6.7 11.3 8.6 9.5 15.61997 11.8 6.1 12.2 8.1 7.6 15.7 11.5 6.7 11.6 8.7 10.2 15.51998 14.0 8.8 14.4 10.7 9.1 18.1 13.6 8.9 13.6 11.0 12.1 17.41999 14.2 8.8 14.5 10.8 9.7 18.0 13.7 8.8 13.8 11.8 11.6 17.72000 14.4 9.0 14.7 10.9 10.4 18.1 14.4 9.6 14.4 12.5 12.8 17.62001 14.2 8.4 14.6 10.7 11.1 17.6 14.1 9.3 14.2 12.4 12.7 17.02002 13.3 7.3 13.7 9.4 10.7 16.7 12.7 6.4 12.8 10.7 11.7 15.62004 13.3 7.3 13.7 9.4 10.7 16.7 12.3 5.4 12.5 10.1 11.6 15.72005 11.1 5.8 11.5 7.9 6.3 15.0 10.5 4.5 10.6 9.1 8.7 14.22006 10.9 5.5 11.2 7.5 6.3 14.8 9.7 2.9 9.9 7.3 8.6 13.6
Uzbekistan - Ouzbékistan 2001 11.7 9.3 11.8 8.9 4.9 15.8 6.2 7.0 6.2 8.0 3.0 10.92006 15.0 14.1 15.1 8.3 11.0 19.7 11.1 10.2 11.1 11.0 9.8 13.5
Vanuatu 2002 13.3 9.5 13.5 10.5 12.5 15.0 6.8 11.9 6.8 5.0 4.6 16.12006 13.1 10.1 13.3 10.2 12.3 14.9 7.0 10.3 7.0 7.0 4.9 13.3
Venezuela (Bolivarian Rep. of) - 1992 16.4 8.2 17.0 10.2 12.7 21.4 16.4 6.9 16.7 9.5 18.1 17.6Venezuela (Rép. bolivarienne du) 1995 13.5 7.4 13.9 10.6 12.6 15.8 13.2 7.5 13.4 10.7 13.6 15.1
1997 12.0 6.7 12.3 8.1 10.2 14.8 13.4 7.3 13.6 8.8 14.9 13.51998 12.0 6.6 12.3 8.1 10.3 14.8 13.2 7.0 13.4 8.9 14.3 13.61999 12.0 6.7 12.4 8.1 10.4 14.9 12.7 7.2 12.8 9.1 12.6 14.82000 12.0 6.7 12.3 8.1 10.3 14.8 13.2 8.5 13.4 9.3 14.0 14.42002 12.4 6.7 12.7 8.2 10.4 15.5 13.5 8.5 13.6 10.0 13.9 15.52004 12.0 6.7 12.4 8.1 10.4 14.9 12.9 8.3 13.0 9.7 13.9 14.02005 12.0 6.7 12.4 8.1 10.4 14.9 13.5 8.7 13.5 9.9 14.4 13.82006 12.7 6.6 13.1 8.0 10.4 16.2 13.7 8.7 13.8 10.0 14.0 15.9
Viet Nam 1994 13.5 1.2 14.4 3.8 6.4 21.6 12.5 0.5 12.7 2.5 12.0 19.71999 15.4 1.7 16.3 3.8 9.4 24.0 14.2 1.6 14.6 4.6 13.4 21.72001 15.4 1.8 16.3 3.7 9.9 23.9 16.0 1.5 16.5 3.9 19.9 19.02002 15.4 1.8 16.3 3.7 9.7 23.8 15.1 1.2 15.5 4.2 16.0 19.92003 15.7 1.9 16.6 4.2 9.9 24.3 13.6 1.3 14.0 4.1 11.8 20.82004 15.7 1.9 16.6 4.1 9.9 24.3 13.8 1.2 14.2 3.8 13.2 19.62005 15.7 1.9 16.6 4.2 9.9 24.3 13.8 1.1 14.3 4.1 13.2 19.62006 15.7 1.9 16.6 4.2 9.9 24.3 13.8 1.1 14.3 4.1 13.2 19.6
Yemen - Yémen 2000 12.2 12.7 12.2 9.5 11.2 13.6 12.4 10.5 12.4 8.2 13.2 13.02006 6.2 6.7 6.1 5.7 4.9 6.8 5.6 5.5 5.6 5.1 4.7 6.7
For sources and notes, see end of table. Pour les sources et les notes, se reporter à la fin du tableau.
Market
Marchés Year
Année
MFN rate - Simple average (2) / Droit NPF - Moyenne simple (2) MFN rate - Weighted average (3) / Droit NPF - Moyenne pondérée (3)
Total of non- agriculturaland non-
fuel products
Total des produits
non-agricoleset
non-pétroliers
of which: / dont :
Total of non- agriculturaland non-
fuel products
Total des produits
non-agricoleset
non-pétroliers
of which: / dont :
Manu-facturedproducts
Produitsmanu-
facturés
Of which: / dont :
Ores and metals
Minéraiset
métaux
Manu-facturedproducts
Produitsmanu-
facturés
Of which: / dont :
Ores and metals
Minéraiset
métaux
4.3 Average applied import MFN tariff rates on non-agricultural and non-fuelproducts
4.3 Droits de douane moyens NPF appliqués àl'importation des produits non-agricoles etnon-pétroliers
239
4
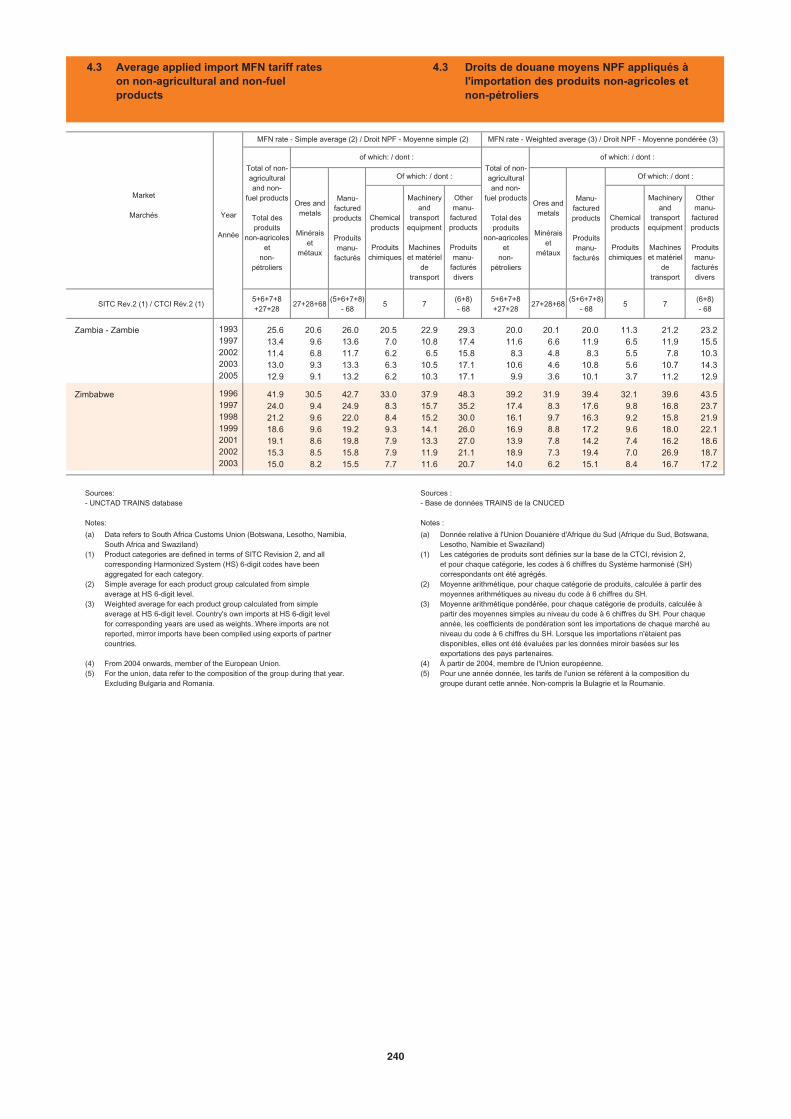
Chemicalproducts
Produitschimiques
Machineryand
transportequipment
Machineset matériel
detransport
Othermanu-
facturedproducts
Produitsmanu-
facturésdivers
Chemicalproducts
Produitschimiques
Machineryand
transportequipment
Machineset matériel
detransport
Othermanu-
facturedproducts
Produitsmanu-
facturésdivers
SITC Rev.2 (1) / CTCI Rév.2 (1)5+6+7+8+27+28
27+28+68(5+6+7+8)
- 685 7
(6+8)- 68
5+6+7+8+27+28
27+28+68(5+6+7+8)
- 685 7
(6+8)- 68
Zambia - Zambie 1993 25.6 20.6 26.0 20.5 22.9 29.3 20.0 20.1 20.0 11.3 21.2 23.21997 13.4 9.6 13.6 7.0 10.8 17.4 11.6 6.6 11.9 6.5 11.9 15.52002 11.4 6.8 11.7 6.2 6.5 15.8 8.3 4.8 8.3 5.5 7.8 10.32003 13.0 9.3 13.3 6.3 10.5 17.1 10.6 4.6 10.8 5.6 10.7 14.32005 12.9 9.1 13.2 6.2 10.3 17.1 9.9 3.6 10.1 3.7 11.2 12.9
Zimbabwe 1996 41.9 30.5 42.7 33.0 37.9 48.3 39.2 31.9 39.4 32.1 39.6 43.51997 24.0 9.4 24.9 8.3 15.7 35.2 17.4 8.3 17.6 9.8 16.8 23.71998 21.2 9.6 22.0 8.4 15.2 30.0 16.1 9.7 16.3 9.2 15.8 21.91999 18.6 9.6 19.2 9.3 14.1 26.0 16.9 8.8 17.2 9.6 18.0 22.12001 19.1 8.6 19.8 7.9 13.3 27.0 13.9 7.8 14.2 7.4 16.2 18.62002 15.3 8.5 15.8 7.9 11.9 21.1 18.9 7.3 19.4 7.0 26.9 18.72003 15.0 8.2 15.5 7.7 11.6 20.7 14.0 6.2 15.1 8.4 16.7 17.2
Market
Marchés Year
Année
MFN rate - Simple average (2) / Droit NPF - Moyenne simple (2) MFN rate - Weighted average (3) / Droit NPF - Moyenne pondérée (3)
Total of non- agriculturaland non-
fuel products
Total des produits
non-agricoleset
non-pétroliers
of which: / dont :
Total of non- agriculturaland non-
fuel products
Total des produits
non-agricoleset
non-pétroliers
of which: / dont :
Ores and metals
Minéraiset
métaux
Manu-facturedproducts
Produitsmanu-
facturés
Of which: / dont :
Ores and metals
Minéraiset
métaux
Manu-facturedproducts
Produitsmanu-
facturés
Of which: / dont :
4.3 Average applied import MFN tariff rates on non-agricultural and non-fuelproducts
4.3 Droits de douane moyens NPF appliqués àl'importation des produits non-agricoles etnon-pétroliers
(a)
(1)
(2)
(3)
(4)(5)
Data refers to South Africa Customs Union (Botswana, Lesotho, Namibia, South Africa and Swaziland)Product categories are defined in terms of SITC Revision 2, and all corresponding Harmonized System (HS) 6-digit codes have been aggregated for each category.Simple average for each product group calculated from simpleaverage at HS 6-digit level.Weighted average for each product group calculated from simpleaverage at HS 6-digit level. Country's own imports at HS 6-digit levelfor corresponding years are used as weights. Where imports are notreported, mirror imports have been compiled using exports of partnercountries.
From 2004 onwards, member of the European Union.For the union, data refer to the composition of the group during that year. Excluding Bulgaria and Romania.
Sources:- UNCTAD TRAINS database
Notes:
(a)
(1)
(2)
(3)
(4)(5)
Donnée relative à l'Union Douanière d'Afrique du Sud (Afrique du Sud, Botswana, Lesotho, Namibie et Swaziland)Les catégories de produits sont définies sur la base de la CTCI, révision 2, et pour chaque catégorie, les codes à 6 chiffres du Système harmonisé (SH) correspondants ont été agrégés.Moyenne arithmétique, pour chaque catégorie de produits, calculée à partir desmoyennes arithmétiques au niveau du code à 6 chiffres du SH.Moyenne arithmétique pondérée, pour chaque catégorie de produits, calculée à partir des moyennes simples au niveau du code à 6 chiffres du SH. Pour chaque année, les coefficients de pondération sont les importations de chaque marché au niveau du code à 6 chiffres du SH. Lorsque les importations n'étaient pas disponibles, elles ont été évaluées par les données miroir basées sur les exportations des pays partenaires.À partir de 2004, membre de l'Union européenne.Pour une année donnée, les tarifs de l'union se réfèrent à la composition du groupe durant cette année. Non-compris la Bulagrie et la Roumanie.
Sources : - Base de données TRAINS de la CNUCED
Notes :
240

SERVICES
SERVICES
1
2
3
4
5
6
7
8
4
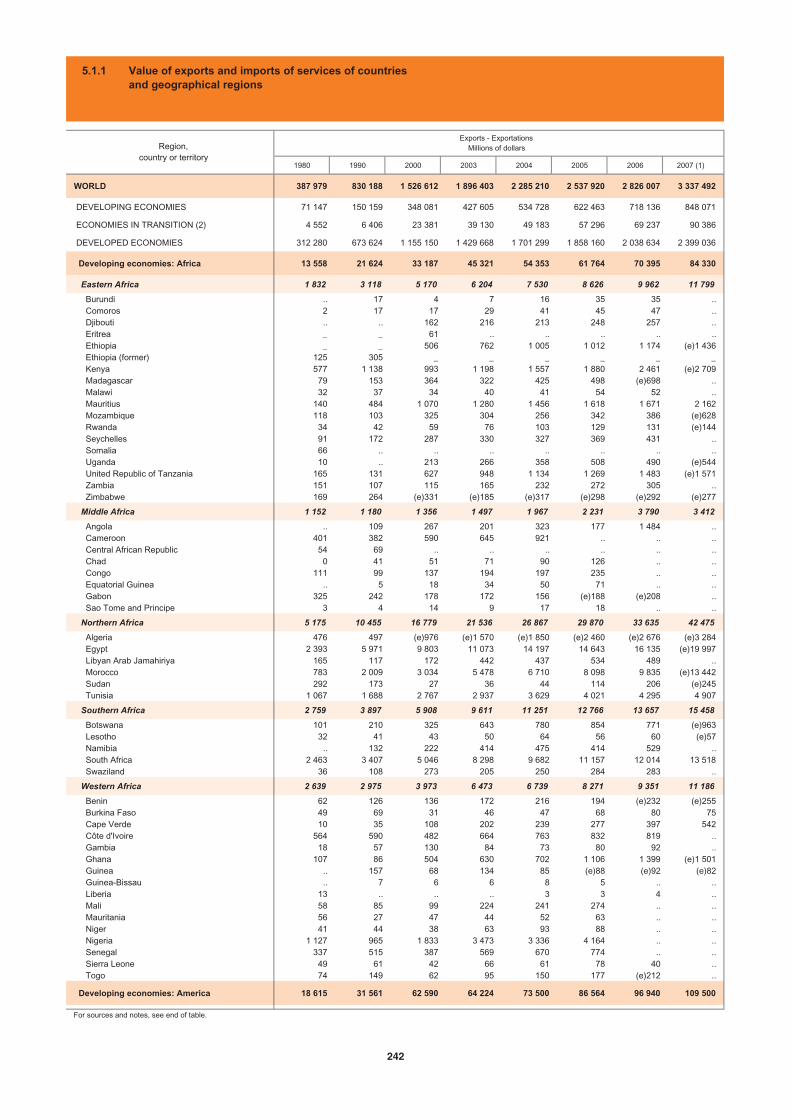
1980 1990 2000 2003 2004 2005 2006 2007 (1)
WORLD 387 979 830 188 1 526 612 1 896 403 2 285 210 2 537 920 2 826 007 3 337 492
DEVELOPING ECONOMIES 71 147 150 159 348 081 427 605 534 728 622 463 718 136 848 071
ECONOMIES IN TRANSITION (2) 4 552 6 406 23 381 39 130 49 183 57 296 69 237 90 386
DEVELOPED ECONOMIES 312 280 673 624 1 155 150 1 429 668 1 701 299 1 858 160 2 038 634 2 399 036
Developing economies: Africa 13 558 21 624 33 187 45 321 54 353 61 764 70 395 84 330
Eastern Africa 1 832 3 118 5 170 6 204 7 530 8 626 9 962 11 799
Burundi .. 17 4 7 16 35 35 .. Comoros 2 17 17 29 41 45 47 .. Djibouti .. .. 162 216 213 248 257 .. Eritrea _ _ 61 .. .. .. .. .. Ethiopia _ _ 506 762 1 005 1 012 1 174 (e)1 436 Ethiopia (former) 125 305 _ _ _ _ _ _ Kenya 577 1 138 993 1 198 1 557 1 880 2 461 (e)2 709 Madagascar 79 153 364 322 425 498 (e)698 .. Malawi 32 37 34 40 41 54 52 .. Mauritius 140 484 1 070 1 280 1 456 1 618 1 671 2 162 Mozambique 118 103 325 304 256 342 386 (e)628 Rwanda 34 42 59 76 103 129 131 (e)144 Seychelles 91 172 287 330 327 369 431 .. Somalia 66 .. .. .. .. .. .. .. Uganda 10 .. 213 266 358 508 490 (e)544 United Republic of Tanzania 165 131 627 948 1 134 1 269 1 483 (e)1 571 Zambia 151 107 115 165 232 272 305 .. Zimbabwe 169 264 (e)331 (e)185 (e)317 (e)298 (e)292 (e)277
Middle Africa 1 152 1 180 1 356 1 497 1 967 2 231 3 790 3 412
Angola .. 109 267 201 323 177 1 484 .. Cameroon 401 382 590 645 921 .. .. .. Central African Republic 54 69 .. .. .. .. .. .. Chad 0 41 51 71 90 126 .. .. Congo 111 99 137 194 197 235 .. .. Equatorial Guinea .. 5 18 34 50 71 .. .. Gabon 325 242 178 172 156 (e)188 (e)208 .. Sao Tome and Principe 3 4 14 9 17 18 .. ..
Northern Africa 5 175 10 455 16 779 21 536 26 867 29 870 33 635 42 475
Algeria 476 497 (e)976 (e)1 570 (e)1 850 (e)2 460 (e)2 676 (e)3 284 Egypt 2 393 5 971 9 803 11 073 14 197 14 643 16 135 (e)19 997 Libyan Arab Jamahiriya 165 117 172 442 437 534 489 .. Morocco 783 2 009 3 034 5 478 6 710 8 098 9 835 (e)13 442 Sudan 292 173 27 36 44 114 206 (e)245 Tunisia 1 067 1 688 2 767 2 937 3 629 4 021 4 295 4 907
Southern Africa 2 759 3 897 5 908 9 611 11 251 12 766 13 657 15 458
Botswana 101 210 325 643 780 854 771 (e)963 Lesotho 32 41 43 50 64 56 60 (e)57 Namibia .. 132 222 414 475 414 529 .. South Africa 2 463 3 407 5 046 8 298 9 682 11 157 12 014 13 518 Swaziland 36 108 273 205 250 284 283 ..
Western Africa 2 639 2 975 3 973 6 473 6 739 8 271 9 351 11 186
Benin 62 126 136 172 216 194 (e)232 (e)255 Burkina Faso 49 69 31 46 47 68 80 75 Cape Verde 10 35 108 202 239 277 397 542 Côte d'Ivoire 564 590 482 664 763 832 819 .. Gambia 18 57 130 84 73 80 92 .. Ghana 107 86 504 630 702 1 106 1 399 (e)1 501 Guinea .. 157 68 134 85 (e)88 (e)92 (e)82 Guinea-Bissau .. 7 6 6 8 5 .. .. Liberia 13 .. .. .. 3 3 4 .. Mali 58 85 99 224 241 274 .. .. Mauritania 56 27 47 44 52 63 .. .. Niger 41 44 38 63 93 88 .. .. Nigeria 1 127 965 1 833 3 473 3 336 4 164 .. .. Senegal 337 515 387 569 670 774 .. .. Sierra Leone 49 61 42 66 61 78 40 .. Togo 74 149 62 95 150 177 (e)212 ..
Developing economies: America 18 615 31 561 62 590 64 224 73 500 86 564 96 940 109 500
For sources and notes, see end of table.
Exports - ExportationsMillions of dollarsRegion,
country or territory
5.1.1 Value of exports and imports of services of countriesand geographical regions
242
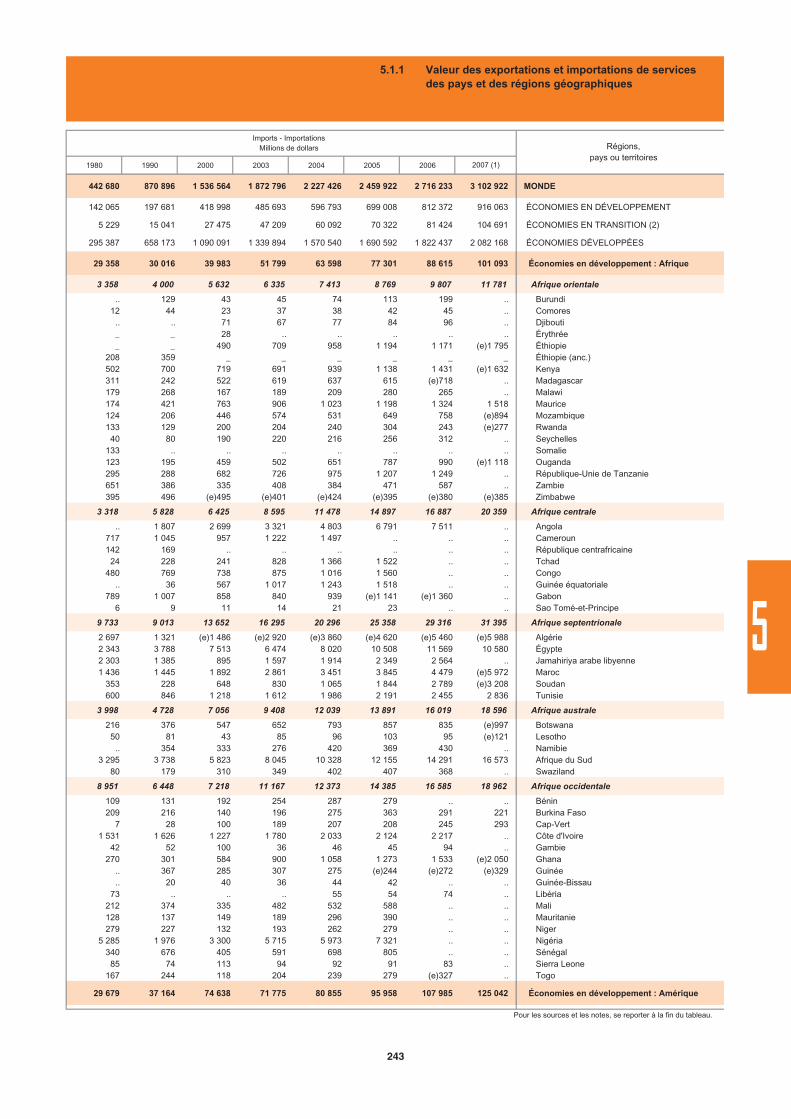
1980 1990 2000 2003 2004 2005 2006
442 680 870 896 1 536 564 1 872 796 2 227 426 2 459 922 2 716 233 3 102 922 MONDE
142 065 197 681 418 998 485 693 596 793 699 008 812 372 916 063 ÉCONOMIES EN DÉVELOPPEMENT
5 229 15 041 27 475 47 209 60 092 70 322 81 424 104 691 ÉCONOMIES EN TRANSITION (2)
295 387 658 173 1 090 091 1 339 894 1 570 540 1 690 592 1 822 437 2 082 168 ÉCONOMIES DÉVELOPPÉES
29 358 30 016 39 983 51 799 63 598 77 301 88 615 101 093 Économies en développement : Afrique
3 358 4 000 5 632 6 335 7 413 8 769 9 807 11 781 Afrique orientale
.. 129 43 45 74 113 199 .. Burundi12 44 23 37 38 42 45 .. Comores .. .. 71 67 77 84 96 .. Djibouti_ _ 28 .. .. .. .. .. Érythrée_ _ 490 709 958 1 194 1 171 (e)1 795 Éthiopie
208 359 _ _ _ _ _ _ Éthiopie (anc.)502 700 719 691 939 1 138 1 431 (e)1 632 Kenya311 242 522 619 637 615 (e)718 .. Madagascar179 268 167 189 209 280 265 .. Malawi174 421 763 906 1 023 1 198 1 324 1 518 Maurice124 206 446 574 531 649 758 (e)894 Mozambique133 129 200 204 240 304 243 (e)277 Rwanda
40 80 190 220 216 256 312 .. Seychelles133 .. .. .. .. .. .. .. Somalie123 195 459 502 651 787 990 (e)1 118 Ouganda295 288 682 726 975 1 207 1 249 .. République-Unie de Tanzanie651 386 335 408 384 471 587 .. Zambie395 496 (e)495 (e)401 (e)424 (e)395 (e)380 (e)385 Zimbabwe
3 318 5 828 6 425 8 595 11 478 14 897 16 887 20 359 Afrique centrale
.. 1 807 2 699 3 321 4 803 6 791 7 511 .. Angola717 1 045 957 1 222 1 497 .. .. .. Cameroun142 169 .. .. .. .. .. .. République centrafricaine
24 228 241 828 1 366 1 522 .. .. Tchad480 769 738 875 1 016 1 560 .. .. Congo
.. 36 567 1 017 1 243 1 518 .. .. Guinée équatoriale789 1 007 858 840 939 (e)1 141 (e)1 360 .. Gabon
6 9 11 14 21 23 .. .. Sao Tomé-et-Principe
9 733 9 013 13 652 16 295 20 296 25 358 29 316 31 395 Afrique septentrionale
2 697 1 321 (e)1 486 (e)2 920 (e)3 860 (e)4 620 (e)5 460 (e)5 988 Algérie2 343 3 788 7 513 6 474 8 020 10 508 11 569 10 580 Égypte2 303 1 385 895 1 597 1 914 2 349 2 564 .. Jamahiriya arabe libyenne1 436 1 445 1 892 2 861 3 451 3 845 4 479 (e)5 972 Maroc
353 228 648 830 1 065 1 844 2 789 (e)3 208 Soudan600 846 1 218 1 612 1 986 2 191 2 455 2 836 Tunisie
3 998 4 728 7 056 9 408 12 039 13 891 16 019 18 596 Afrique australe
216 376 547 652 793 857 835 (e)997 Botswana50 81 43 85 96 103 95 (e)121 Lesotho .. 354 333 276 420 369 430 .. Namibie
3 295 3 738 5 823 8 045 10 328 12 155 14 291 16 573 Afrique du Sud80 179 310 349 402 407 368 .. Swaziland
8 951 6 448 7 218 11 167 12 373 14 385 16 585 18 962 Afrique occidentale
109 131 192 254 287 279 .. .. Bénin209 216 140 196 275 363 291 221 Burkina Faso
7 28 100 189 207 208 245 293 Cap-Vert1 531 1 626 1 227 1 780 2 033 2 124 2 217 .. Côte d'Ivoire
42 52 100 36 46 45 94 .. Gambie270 301 584 900 1 058 1 273 1 533 (e)2 050 Ghana
.. 367 285 307 275 (e)244 (e)272 (e)329 Guinée .. 20 40 36 44 42 .. .. Guinée-Bissau
73 .. .. .. 55 54 74 .. Libéria212 374 335 482 532 588 .. .. Mali128 137 149 189 296 390 .. .. Mauritanie279 227 132 193 262 279 .. .. Niger
5 285 1 976 3 300 5 715 5 973 7 321 .. .. Nigéria340 676 405 591 698 805 .. .. Sénégal
85 74 113 94 92 91 83 .. Sierra Leone167 244 118 204 239 279 (e)327 .. Togo
29 679 37 164 74 638 71 775 80 855 95 958 107 985 125 042 Économies en développement : Amérique
Pour les sources et les notes, se reporter à la fin du tableau.
Régions,pays ou territoires
Imports - ImportationsMillions de dollars
2007 (1)
5.1.1 Valeur des exportations et importations de servicesdes pays et des régions géographiques
243
5
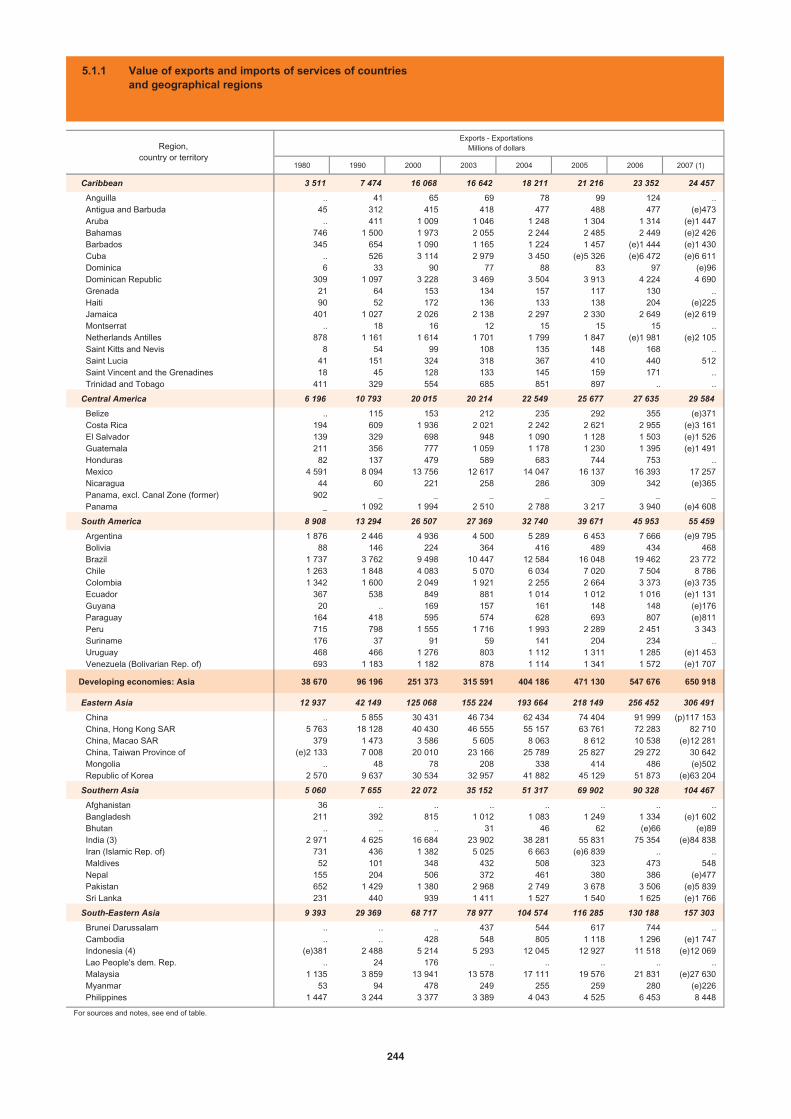
1980 1990 2000 2003 2004 2005 2006 2007 (1)
Caribbean 3 511 7 474 16 068 16 642 18 211 21 216 23 352 24 457
Anguilla .. 41 65 69 78 99 124 .. Antigua and Barbuda 45 312 415 418 477 488 477 (e)473 Aruba .. 411 1 009 1 046 1 248 1 304 1 314 (e)1 447 Bahamas 746 1 500 1 973 2 055 2 244 2 485 2 449 (e)2 426 Barbados 345 654 1 090 1 165 1 224 1 457 (e)1 444 (e)1 430 Cuba .. 526 3 114 2 979 3 450 (e)5 326 (e)6 472 (e)6 611 Dominica 6 33 90 77 88 83 97 (e)96 Dominican Republic 309 1 097 3 228 3 469 3 504 3 913 4 224 4 690 Grenada 21 64 153 134 157 117 130 .. Haiti 90 52 172 136 133 138 204 (e)225 Jamaica 401 1 027 2 026 2 138 2 297 2 330 2 649 (e)2 619 Montserrat .. 18 16 12 15 15 15 .. Netherlands Antilles 878 1 161 1 614 1 701 1 799 1 847 (e)1 981 (e)2 105 Saint Kitts and Nevis 8 54 99 108 135 148 168 .. Saint Lucia 41 151 324 318 367 410 440 512 Saint Vincent and the Grenadines 18 45 128 133 145 159 171 .. Trinidad and Tobago 411 329 554 685 851 897 .. ..
Central America 6 196 10 793 20 015 20 214 22 549 25 677 27 635 29 584
Belize .. 115 153 212 235 292 355 (e)371 Costa Rica 194 609 1 936 2 021 2 242 2 621 2 955 (e)3 161 El Salvador 139 329 698 948 1 090 1 128 1 503 (e)1 526 Guatemala 211 356 777 1 059 1 178 1 230 1 395 (e)1 491 Honduras 82 137 479 589 683 744 753 .. Mexico 4 591 8 094 13 756 12 617 14 047 16 137 16 393 17 257 Nicaragua 44 60 221 258 286 309 342 (e)365 Panama, excl. Canal Zone (former) 902 _ _ _ _ _ _ _ Panama _ 1 092 1 994 2 510 2 788 3 217 3 940 (e)4 608
South America 8 908 13 294 26 507 27 369 32 740 39 671 45 953 55 459
Argentina 1 876 2 446 4 936 4 500 5 289 6 453 7 666 (e)9 795 Bolivia 88 146 224 364 416 489 434 468 Brazil 1 737 3 762 9 498 10 447 12 584 16 048 19 462 23 772 Chile 1 263 1 848 4 083 5 070 6 034 7 020 7 504 8 786 Colombia 1 342 1 600 2 049 1 921 2 255 2 664 3 373 (e)3 735 Ecuador 367 538 849 881 1 014 1 012 1 016 (e)1 131 Guyana 20 .. 169 157 161 148 148 (e)176 Paraguay 164 418 595 574 628 693 807 (e)811 Peru 715 798 1 555 1 716 1 993 2 289 2 451 3 343 Suriname 176 37 91 59 141 204 234 .. Uruguay 468 466 1 276 803 1 112 1 311 1 285 (e)1 453 Venezuela (Bolivarian Rep. of) 693 1 183 1 182 878 1 114 1 341 1 572 (e)1 707
Developing economies: Asia 38 670 96 196 251 373 315 591 404 186 471 130 547 676 650 918
Eastern Asia 12 937 42 149 125 068 155 224 193 664 218 149 256 452 306 491
China .. 5 855 30 431 46 734 62 434 74 404 91 999 (p)117 153 China, Hong Kong SAR 5 763 18 128 40 430 46 555 55 157 63 761 72 283 82 710 China, Macao SAR 379 1 473 3 586 5 605 8 063 8 612 10 538 (e)12 281 China, Taiwan Province of (e)2 133 7 008 20 010 23 166 25 789 25 827 29 272 30 642 Mongolia .. 48 78 208 338 414 486 (e)502 Republic of Korea 2 570 9 637 30 534 32 957 41 882 45 129 51 873 (e)63 204
Southern Asia 5 060 7 655 22 072 35 152 51 317 69 902 90 328 104 467
Afghanistan 36 .. .. .. .. .. .. .. Bangladesh 211 392 815 1 012 1 083 1 249 1 334 (e)1 602 Bhutan .. .. .. 31 46 62 (e)66 (e)89 India (3) 2 971 4 625 16 684 23 902 38 281 55 831 75 354 (e)84 838 Iran (Islamic Rep. of) 731 436 1 382 5 025 6 663 (e)6 839 .. .. Maldives 52 101 348 432 508 323 473 548 Nepal 155 204 506 372 461 380 386 (e)477 Pakistan 652 1 429 1 380 2 968 2 749 3 678 3 506 (e)5 839 Sri Lanka 231 440 939 1 411 1 527 1 540 1 625 (e)1 766
South-Eastern Asia 9 393 29 369 68 717 78 977 104 574 116 285 130 188 157 303
Brunei Darussalam .. .. .. 437 544 617 744 .. Cambodia .. .. 428 548 805 1 118 1 296 (e)1 747 Indonesia (4) (e)381 2 488 5 214 5 293 12 045 12 927 11 518 (e)12 069 Lao People's dem. Rep. .. 24 176 .. .. .. .. .. Malaysia 1 135 3 859 13 941 13 578 17 111 19 576 21 831 (e)27 630 Myanmar 53 94 478 249 255 259 280 (e)226 Philippines 1 447 3 244 3 377 3 389 4 043 4 525 6 453 8 448
For sources and notes, see end of table.
Region,country or territory
Exports - ExportationsMillions of dollars
5.1.1 Value of exports and imports of services of countriesand geographical regions
244
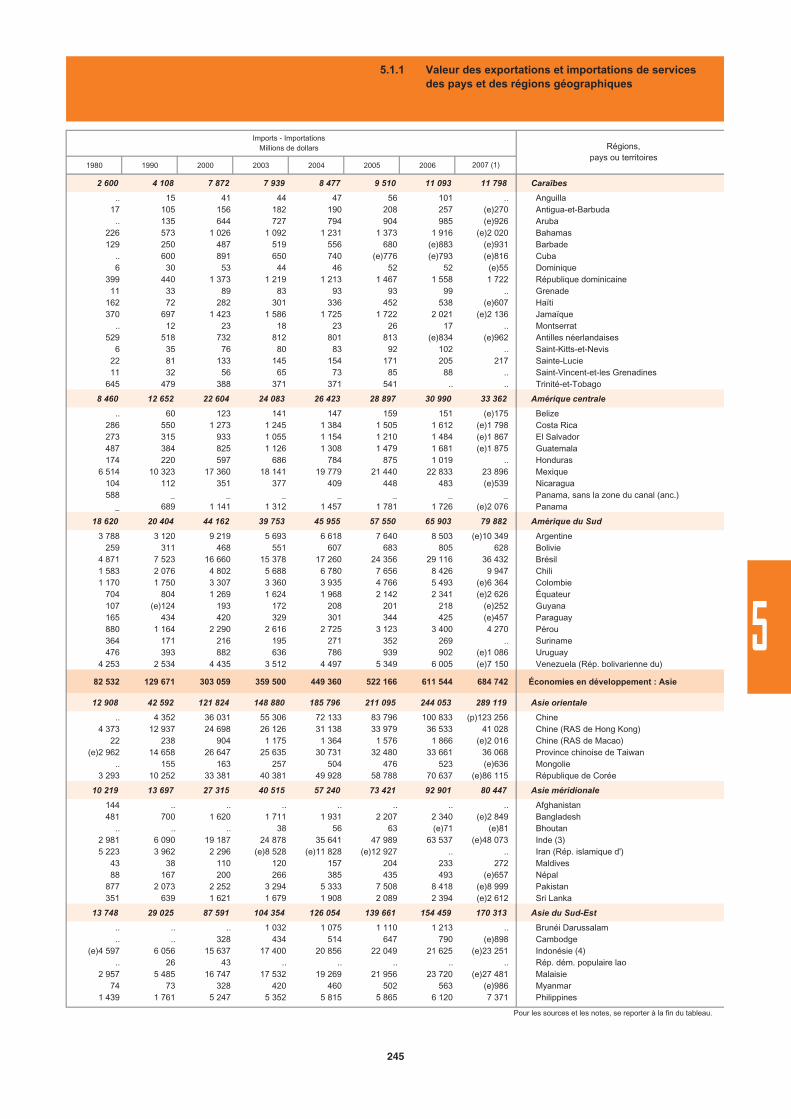
1980 1990 2000 2003 2004 2005 2006
2 600 4 108 7 872 7 939 8 477 9 510 11 093 11 798 Caraïbes
.. 15 41 44 47 56 101 .. Anguilla17 105 156 182 190 208 257 (e)270 Antigua-et-Barbuda .. 135 644 727 794 904 985 (e)926 Aruba
226 573 1 026 1 092 1 231 1 373 1 916 (e)2 020 Bahamas129 250 487 519 556 680 (e)883 (e)931 Barbade
.. 600 891 650 740 (e)776 (e)793 (e)816 Cuba6 30 53 44 46 52 52 (e)55 Dominique
399 440 1 373 1 219 1 213 1 467 1 558 1 722 République dominicaine11 33 89 83 93 93 99 .. Grenade
162 72 282 301 336 452 538 (e)607 Haïti370 697 1 423 1 586 1 725 1 722 2 021 (e)2 136 Jamaïque
.. 12 23 18 23 26 17 .. Montserrat529 518 732 812 801 813 (e)834 (e)962 Antilles néerlandaises
6 35 76 80 83 92 102 .. Saint-Kitts-et-Nevis22 81 133 145 154 171 205 217 Sainte-Lucie11 32 56 65 73 85 88 .. Saint-Vincent-et-les Grenadines
645 479 388 371 371 541 .. .. Trinité-et-Tobago
8 460 12 652 22 604 24 083 26 423 28 897 30 990 33 362 Amérique centrale
.. 60 123 141 147 159 151 (e)175 Belize286 550 1 273 1 245 1 384 1 505 1 612 (e)1 798 Costa Rica273 315 933 1 055 1 154 1 210 1 484 (e)1 867 El Salvador487 384 825 1 126 1 308 1 479 1 681 (e)1 875 Guatemala174 220 597 686 784 875 1 019 .. Honduras
6 514 10 323 17 360 18 141 19 779 21 440 22 833 23 896 Mexique104 112 351 377 409 448 483 (e)539 Nicaragua588 _ _ _ _ _ _ _ Panama, sans la zone du canal (anc.)
_ 689 1 141 1 312 1 457 1 781 1 726 (e)2 076 Panama
18 620 20 404 44 162 39 753 45 955 57 550 65 903 79 882 Amérique du Sud
3 788 3 120 9 219 5 693 6 618 7 640 8 503 (e)10 349 Argentine259 311 468 551 607 683 805 628 Bolivie
4 871 7 523 16 660 15 378 17 260 24 356 29 116 36 432 Brésil1 583 2 076 4 802 5 688 6 780 7 656 8 426 9 947 Chili1 170 1 750 3 307 3 360 3 935 4 766 5 493 (e)6 364 Colombie
704 804 1 269 1 624 1 968 2 142 2 341 (e)2 626 Équateur107 (e)124 193 172 208 201 218 (e)252 Guyana165 434 420 329 301 344 425 (e)457 Paraguay880 1 164 2 290 2 616 2 725 3 123 3 400 4 270 Pérou364 171 216 195 271 352 269 .. Suriname476 393 882 636 786 939 902 (e)1 086 Uruguay
4 253 2 534 4 435 3 512 4 497 5 349 6 005 (e)7 150 Venezuela (Rép. bolivarienne du)
82 532 129 671 303 059 359 500 449 360 522 166 611 544 684 742 Économies en développement : Asie
12 908 42 592 121 824 148 880 185 796 211 095 244 053 289 119 Asie orientale
.. 4 352 36 031 55 306 72 133 83 796 100 833 (p)123 256 Chine4 373 12 937 24 698 26 126 31 138 33 979 36 533 41 028 Chine (RAS de Hong Kong)
22 238 904 1 175 1 364 1 576 1 866 (e)2 016 Chine (RAS de Macao)(e)2 962 14 658 26 647 25 635 30 731 32 480 33 661 36 068 Province chinoise de Taiwan
.. 155 163 257 504 476 523 (e)636 Mongolie3 293 10 252 33 381 40 381 49 928 58 788 70 637 (e)86 115 République de Corée
10 219 13 697 27 315 40 515 57 240 73 421 92 901 80 447 Asie méridionale
144 .. .. .. .. .. .. .. Afghanistan481 700 1 620 1 711 1 931 2 207 2 340 (e)2 849 Bangladesh
.. .. .. 38 56 63 (e)71 (e)81 Bhoutan2 981 6 090 19 187 24 878 35 641 47 989 63 537 (e)48 073 Inde (3)5 223 3 962 2 296 (e)8 528 (e)11 828 (e)12 927 .. .. Iran (Rép. islamique d')
43 38 110 120 157 204 233 272 Maldives88 167 200 266 385 435 493 (e)657 Népal
877 2 073 2 252 3 294 5 333 7 508 8 418 (e)8 999 Pakistan351 639 1 621 1 679 1 908 2 089 2 394 (e)2 612 Sri Lanka
13 748 29 025 87 591 104 354 126 054 139 661 154 459 170 313 Asie du Sud-Est
.. .. .. 1 032 1 075 1 110 1 213 .. Brunéi Darussalam .. .. 328 434 514 647 790 (e)898 Cambodge
(e)4 597 6 056 15 637 17 400 20 856 22 049 21 625 (e)23 251 Indonésie (4) .. 26 43 .. .. .. .. .. Rép. dém. populaire lao
2 957 5 485 16 747 17 532 19 269 21 956 23 720 (e)27 481 Malaisie74 73 328 420 460 502 563 (e)986 Myanmar
1 439 1 761 5 247 5 352 5 815 5 865 6 120 7 371 Philippines
Pour les sources et les notes, se reporter à la fin du tableau.
Imports - ImportationsMillions de dollars Régions,
pays ou territoires2007 (1)
5.1.1 Valeur des exportations et importations de servicesdes pays et des régions géographiques
245
5
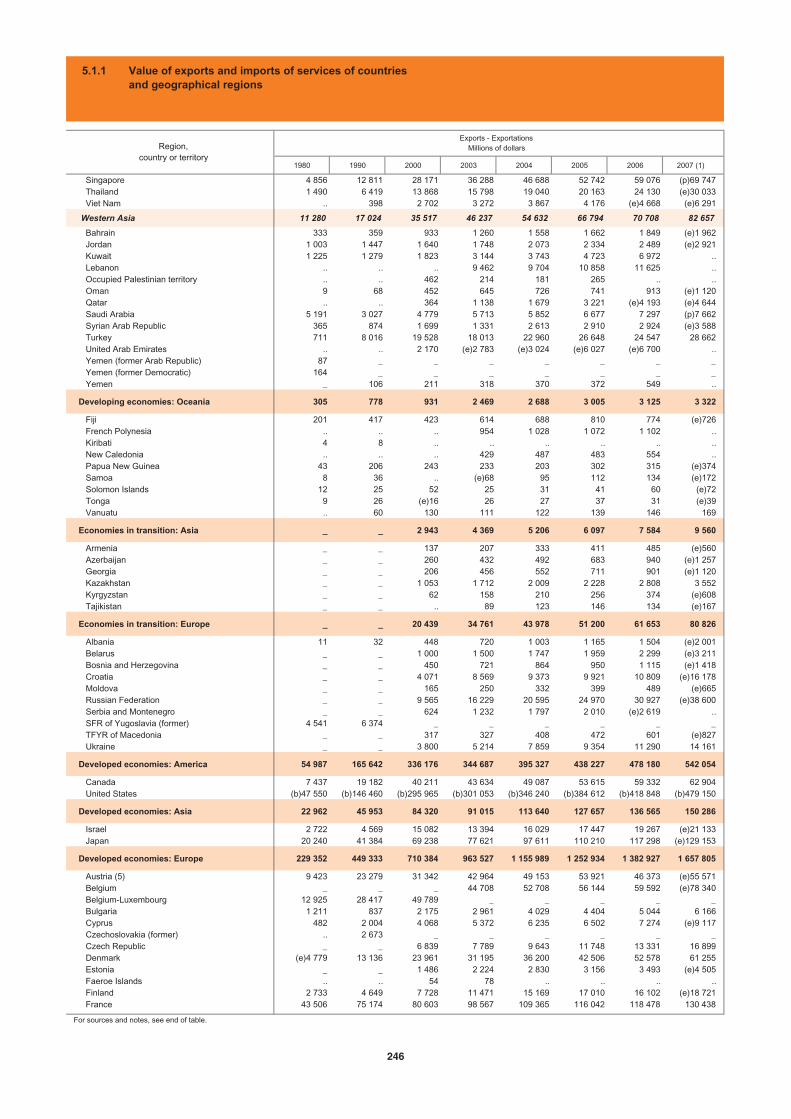
1980 1990 2000 2003 2004 2005 2006 2007 (1)
Singapore 4 856 12 811 28 171 36 288 46 688 52 742 59 076 (p)69 747 Thailand 1 490 6 419 13 868 15 798 19 040 20 163 24 130 (e)30 033 Viet Nam .. 398 2 702 3 272 3 867 4 176 (e)4 668 (e)6 291
Western Asia 11 280 17 024 35 517 46 237 54 632 66 794 70 708 82 657
Bahrain 333 359 933 1 260 1 558 1 662 1 849 (e)1 962 Jordan 1 003 1 447 1 640 1 748 2 073 2 334 2 489 (e)2 921 Kuwait 1 225 1 279 1 823 3 144 3 743 4 723 6 972 .. Lebanon .. .. .. 9 462 9 704 10 858 11 625 .. Occupied Palestinian territory .. .. 462 214 181 265 .. .. Oman 9 68 452 645 726 741 913 (e)1 120 Qatar .. .. 364 1 138 1 679 3 221 (e)4 193 (e)4 644 Saudi Arabia 5 191 3 027 4 779 5 713 5 852 6 677 7 297 (p)7 662 Syrian Arab Republic 365 874 1 699 1 331 2 613 2 910 2 924 (e)3 588 Turkey 711 8 016 19 528 18 013 22 960 26 648 24 547 28 662 United Arab Emirates .. .. 2 170 (e)2 783 (e)3 024 (e)6 027 (e)6 700 .. Yemen (former Arab Republic) 87 _ _ _ _ _ _ _ Yemen (former Democratic) 164 _ _ _ _ _ _ _ Yemen _ 106 211 318 370 372 549 ..
Developing economies: Oceania 305 778 931 2 469 2 688 3 005 3 125 3 322
Fiji 201 417 423 614 688 810 774 (e)726 French Polynesia .. .. .. 954 1 028 1 072 1 102 .. Kiribati 4 8 .. .. .. .. .. .. New Caledonia .. .. .. 429 487 483 554 .. Papua New Guinea 43 206 243 233 203 302 315 (e)374 Samoa 8 36 .. (e)68 95 112 134 (e)172 Solomon Islands 12 25 52 25 31 41 60 (e)72 Tonga 9 26 (e)16 26 27 37 31 (e)39 Vanuatu .. 60 130 111 122 139 146 169
Economies in transition: Asia _ _ 2 943 4 369 5 206 6 097 7 584 9 560
Armenia _ _ 137 207 333 411 485 (e)560 Azerbaijan _ _ 260 432 492 683 940 (e)1 257 Georgia _ _ 206 456 552 711 901 (e)1 120 Kazakhstan _ _ 1 053 1 712 2 009 2 228 2 808 3 552 Kyrgyzstan _ _ 62 158 210 256 374 (e)608 Tajikistan _ _ .. 89 123 146 134 (e)167
Economies in transition: Europe _ _ 20 439 34 761 43 978 51 200 61 653 80 826
Albania 11 32 448 720 1 003 1 165 1 504 (e)2 001 Belarus _ _ 1 000 1 500 1 747 1 959 2 299 (e)3 211 Bosnia and Herzegovina _ _ 450 721 864 950 1 115 (e)1 418 Croatia _ _ 4 071 8 569 9 373 9 921 10 809 (e)16 178 Moldova _ _ 165 250 332 399 489 (e)665 Russian Federation _ _ 9 565 16 229 20 595 24 970 30 927 (e)38 600 Serbia and Montenegro _ _ 624 1 232 1 797 2 010 (e)2 619 .. SFR of Yugoslavia (former) 4 541 6 374 _ _ _ _ _ _ TFYR of Macedonia _ _ 317 327 408 472 601 (e)827 Ukraine _ _ 3 800 5 214 7 859 9 354 11 290 14 161
Developed economies: America 54 987 165 642 336 176 344 687 395 327 438 227 478 180 542 054
Canada 7 437 19 182 40 211 43 634 49 087 53 615 59 332 62 904 United States (b)47 550 (b)146 460 (b)295 965 (b)301 053 (b)346 240 (b)384 612 (b)418 848 (b)479 150
Developed economies: Asia 22 962 45 953 84 320 91 015 113 640 127 657 136 565 150 286
Israel 2 722 4 569 15 082 13 394 16 029 17 447 19 267 (e)21 133 Japan 20 240 41 384 69 238 77 621 97 611 110 210 117 298 (e)129 153
Developed economies: Europe 229 352 449 333 710 384 963 527 1 155 989 1 252 934 1 382 927 1 657 805
Austria (5) 9 423 23 279 31 342 42 964 49 153 53 921 46 373 (e)55 571 Belgium _ _ _ 44 708 52 708 56 144 59 592 (e)78 340 Belgium-Luxembourg 12 925 28 417 49 789 _ _ _ _ _ Bulgaria 1 211 837 2 175 2 961 4 029 4 404 5 044 6 166 Cyprus 482 2 004 4 068 5 372 6 235 6 502 7 274 (e)9 117 Czechoslovakia (former) .. 2 673 _ _ _ _ _ _ Czech Republic _ _ 6 839 7 789 9 643 11 748 13 331 16 899 Denmark (e)4 779 13 136 23 961 31 195 36 200 42 506 52 578 61 255 Estonia _ _ 1 486 2 224 2 830 3 156 3 493 (e)4 505 Faeroe Islands .. .. 54 78 .. .. .. .. Finland 2 733 4 649 7 728 11 471 15 169 17 010 16 102 (e)18 721 France 43 506 75 174 80 603 98 567 109 365 116 042 118 478 130 438
For sources and notes, see end of table.
Region,country or territory
Exports - ExportationsMillions of dollars
5.1.1 Value of exports and imports of services of countriesand geographical regions
246
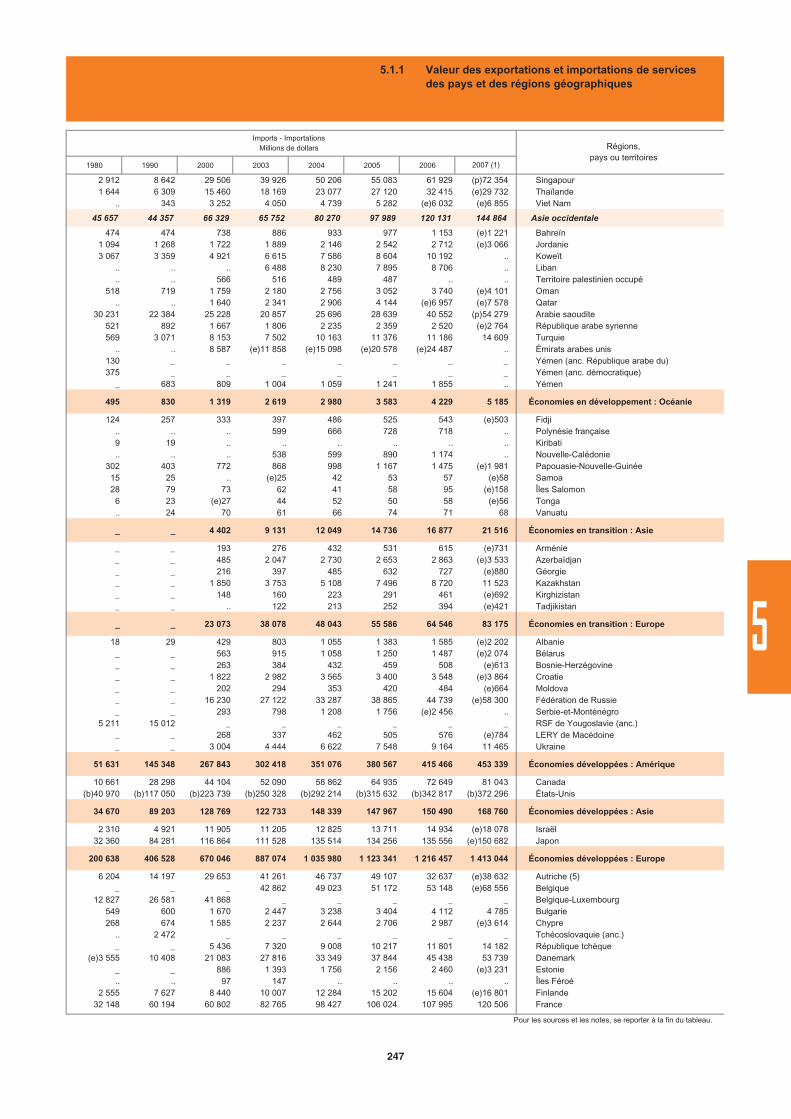
1980 1990 2000 2003 2004 2005 2006
2 912 8 642 29 506 39 926 50 206 55 083 61 929 (p)72 354 Singapour1 644 6 309 15 460 18 169 23 077 27 120 32 415 (e)29 732 Thaïlande
.. 343 3 252 4 050 4 739 5 282 (e)6 032 (e)6 855 Viet Nam
45 657 44 357 66 329 65 752 80 270 97 989 120 131 144 864 Asie occidentale
474 474 738 886 933 977 1 153 (e)1 221 Bahreïn1 094 1 268 1 722 1 889 2 146 2 542 2 712 (e)3 066 Jordanie3 067 3 359 4 921 6 615 7 586 8 604 10 192 .. Koweït
.. .. .. 6 488 8 230 7 895 8 706 .. Liban
.. .. 566 516 489 487 .. .. Territoire palestinien occupé518 719 1 759 2 180 2 756 3 052 3 740 (e)4 101 Oman
.. .. 1 640 2 341 2 906 4 144 (e)6 957 (e)7 578 Qatar30 231 22 384 25 228 20 857 25 696 28 639 40 552 (p)54 279 Arabie saoudite
521 892 1 667 1 806 2 235 2 359 2 520 (e)2 764 République arabe syrienne569 3 071 8 153 7 502 10 163 11 376 11 186 14 609 Turquie
.. .. 8 587 (e)11 858 (e)15 098 (e)20 578 (e)24 487 .. Émirats arabes unis130 _ _ _ _ _ _ _ Yémen (anc. République arabe du)375 _ _ _ _ _ _ _ Yémen (anc. démocratique)
_ 683 809 1 004 1 059 1 241 1 855 .. Yémen
495 830 1 319 2 619 2 980 3 583 4 229 5 185 Économies en développement : Océanie
124 257 333 397 486 525 543 (e)503 Fidji.. .. .. 599 666 728 718 .. Polynésie française9 19 .. .. .. .. .. .. Kiribati.. .. .. 538 599 890 1 174 .. Nouvelle-Calédonie
302 403 772 868 998 1 167 1 475 (e)1 981 Papouasie-Nouvelle-Guinée15 25 .. (e)25 42 53 57 (e)58 Samoa28 79 73 62 41 58 95 (e)158 Îles Salomon
6 23 (e)27 44 52 50 58 (e)56 Tonga .. 24 70 61 66 74 71 68 Vanuatu
_ _ 4 402 9 131 12 049 14 736 16 877 21 516 Économies en transition : Asie
_ _ 193 276 432 531 615 (e)731 Arménie_ _ 485 2 047 2 730 2 653 2 863 (e)3 533 Azerbaïdjan_ _ 216 397 485 632 727 (e)880 Géorgie_ _ 1 850 3 753 5 108 7 496 8 720 11 523 Kazakhstan_ _ 148 160 223 291 461 (e)692 Kirghizistan_ _ .. 122 213 252 394 (e)421 Tadjikistan
_ _ 23 073 38 078 48 043 55 586 64 546 83 175 Économies en transition : Europe
18 29 429 803 1 055 1 383 1 585 (e)2 202 Albanie_ _ 563 915 1 058 1 250 1 487 (e)2 074 Bélarus_ _ 263 384 432 459 508 (e)613 Bosnie-Herzégovine_ _ 1 822 2 982 3 565 3 400 3 548 (e)3 864 Croatie_ _ 202 294 353 420 484 (e)664 Moldova_ _ 16 230 27 122 33 287 38 865 44 739 (e)58 300 Fédération de Russie_ _ 293 798 1 208 1 756 (e)2 456 .. Serbie-et-Monténégro
5 211 15 012 _ _ _ _ _ _ RSF de Yougoslavie (anc.)_ _ 268 337 462 505 576 (e)784 LERY de Macédoine_ _ 3 004 4 444 6 622 7 548 9 164 11 465 Ukraine
51 631 145 348 267 843 302 418 351 076 380 567 415 466 453 339 Économies développées : Amérique
10 661 28 298 44 104 52 090 58 862 64 935 72 649 81 043 Canada(b)40 970 (b)117 050 (b)223 739 (b)250 328 (b)292 214 (b)315 632 (b)342 817 (b)372 296 États-Unis
34 670 89 203 128 769 122 733 148 339 147 967 150 490 168 760 Économies développées : Asie
2 310 4 921 11 905 11 205 12 825 13 711 14 934 (e)18 078 Israël32 360 84 281 116 864 111 528 135 514 134 256 135 556 (e)150 682 Japon
200 638 406 528 670 046 887 074 1 035 980 1 123 341 1 216 457 1 413 044 Économies développées : Europe
6 204 14 197 29 653 41 261 46 737 49 107 32 637 (e)38 632 Autriche (5)_ _ _ 42 862 49 023 51 172 53 148 (e)68 556 Belgique
12 827 26 581 41 868 _ _ _ _ _ Belgique-Luxembourg549 600 1 670 2 447 3 238 3 404 4 112 4 785 Bulgarie268 674 1 585 2 237 2 644 2 706 2 987 (e)3 614 Chypre
.. 2 472 _ _ _ _ _ _ Tchécoslovaquie (anc.)_ _ 5 436 7 320 9 008 10 217 11 801 14 182 République tchèque
(e)3 555 10 408 21 083 27 816 33 349 37 844 45 438 53 739 Danemark_ _ 886 1 393 1 756 2 156 2 460 (e)3 231 Estonie.. .. 97 147 .. .. .. .. Îles Féroé
2 555 7 627 8 440 10 007 12 284 15 202 15 604 (e)16 801 Finlande32 148 60 194 60 802 82 765 98 427 106 024 107 995 120 506 France
Pour les sources et les notes, se reporter à la fin du tableau.
Imports - ImportationsMillions de dollars Régions,
pays ou territoires2007 (1)
5.1.1 Valeur des exportations et importations de servicesdes pays et des régions géographiques
247
5
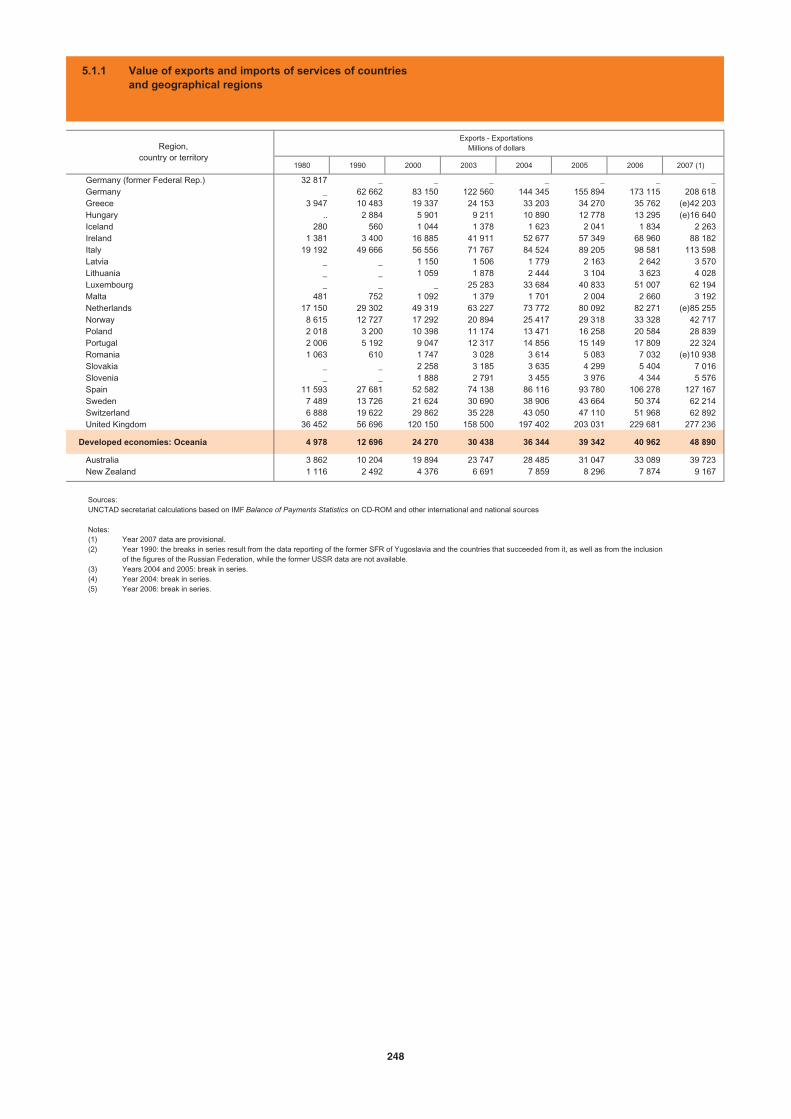
1980 1990 2000 2003 2004 2005 2006 2007 (1)
Germany (former Federal Rep.) 32 817 _ _ _ _ _ _ _ Germany _ 62 662 83 150 122 560 144 345 155 894 173 115 208 618 Greece 3 947 10 483 19 337 24 153 33 203 34 270 35 762 (e)42 203 Hungary .. 2 884 5 901 9 211 10 890 12 778 13 295 (e)16 640 Iceland 280 560 1 044 1 378 1 623 2 041 1 834 2 263 Ireland 1 381 3 400 16 885 41 911 52 677 57 349 68 960 88 182 Italy 19 192 49 666 56 556 71 767 84 524 89 205 98 581 113 598 Latvia _ _ 1 150 1 506 1 779 2 163 2 642 3 570 Lithuania _ _ 1 059 1 878 2 444 3 104 3 623 4 028 Luxembourg _ _ _ 25 283 33 684 40 833 51 007 62 194 Malta 481 752 1 092 1 379 1 701 2 004 2 660 3 192 Netherlands 17 150 29 302 49 319 63 227 73 772 80 092 82 271 (e)85 255 Norway 8 615 12 727 17 292 20 894 25 417 29 318 33 328 42 717 Poland 2 018 3 200 10 398 11 174 13 471 16 258 20 584 28 839 Portugal 2 006 5 192 9 047 12 317 14 856 15 149 17 809 22 324 Romania 1 063 610 1 747 3 028 3 614 5 083 7 032 (e)10 938 Slovakia _ _ 2 258 3 185 3 635 4 299 5 404 7 016 Slovenia _ _ 1 888 2 791 3 455 3 976 4 344 5 576 Spain 11 593 27 681 52 582 74 138 86 116 93 780 106 278 127 167 Sweden 7 489 13 726 21 624 30 690 38 906 43 664 50 374 62 214 Switzerland 6 888 19 622 29 862 35 228 43 050 47 110 51 968 62 892 United Kingdom 36 452 56 696 120 150 158 500 197 402 203 031 229 681 277 236
Developed economies: Oceania 4 978 12 696 24 270 30 438 36 344 39 342 40 962 48 890
Australia 3 862 10 204 19 894 23 747 28 485 31 047 33 089 39 723 New Zealand 1 116 2 492 4 376 6 691 7 859 8 296 7 874 9 167
Region,country or territory
Exports - ExportationsMillions of dollars
5.1.1 Value of exports and imports of services of countriesand geographical regions
(1)(2)
(3)(4)(5)
Year 2007 data are provisional.Year 1990: the breaks in series result from the data reporting of the former SFR of Yugoslavia and the countries that succeeded from it, as well as from the inclusion of the figures of the Russian Federation, while the former USSR data are not available. Years 2004 and 2005: break in series.Year 2004: break in series.Year 2006: break in series.
Sources:UNCTAD secretariat calculations based on IMF Balance of Payments Statistics on CD-ROM and other international and national sources
Notes:
248
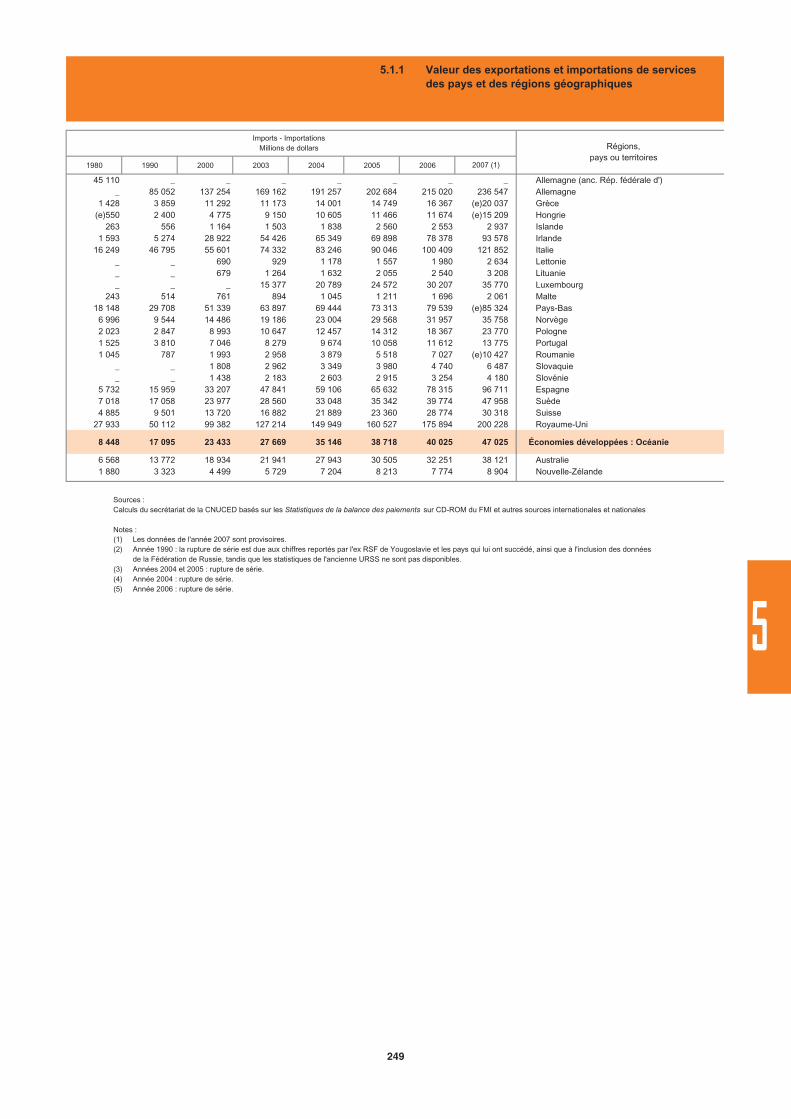
1980 1990 2000 2003 2004 2005 2006
45 110 _ _ _ _ _ _ _ Allemagne (anc. Rép. fédérale d')_ 85 052 137 254 169 162 191 257 202 684 215 020 236 547 Allemagne
1 428 3 859 11 292 11 173 14 001 14 749 16 367 (e)20 037 Grèce(e)550 2 400 4 775 9 150 10 605 11 466 11 674 (e)15 209 Hongrie
263 556 1 164 1 503 1 838 2 560 2 553 2 937 Islande1 593 5 274 28 922 54 426 65 349 69 898 78 378 93 578 Irlande
16 249 46 795 55 601 74 332 83 246 90 046 100 409 121 852 Italie_ _ 690 929 1 178 1 557 1 980 2 634 Lettonie_ _ 679 1 264 1 632 2 055 2 540 3 208 Lituanie_ _ _ 15 377 20 789 24 572 30 207 35 770 Luxembourg
243 514 761 894 1 045 1 211 1 696 2 061 Malte18 148 29 708 51 339 63 897 69 444 73 313 79 539 (e)85 324 Pays-Bas
6 996 9 544 14 486 19 186 23 004 29 568 31 957 35 758 Norvège2 023 2 847 8 993 10 647 12 457 14 312 18 367 23 770 Pologne1 525 3 810 7 046 8 279 9 674 10 058 11 612 13 775 Portugal1 045 787 1 993 2 958 3 879 5 518 7 027 (e)10 427 Roumanie
_ _ 1 808 2 962 3 349 3 980 4 740 6 487 Slovaquie_ _ 1 438 2 183 2 603 2 915 3 254 4 180 Slovénie
5 732 15 959 33 207 47 841 59 106 65 632 78 315 96 711 Espagne7 018 17 058 23 977 28 560 33 048 35 342 39 774 47 958 Suède4 885 9 501 13 720 16 882 21 889 23 360 28 774 30 318 Suisse
27 933 50 112 99 382 127 214 149 949 160 527 175 894 200 228 Royaume-Uni
8 448 17 095 23 433 27 669 35 146 38 718 40 025 47 025 Économies développées : Océanie
6 568 13 772 18 934 21 941 27 943 30 505 32 251 38 121 Australie1 880 3 323 4 499 5 729 7 204 8 213 7 774 8 904 Nouvelle-Zélande
Imports - ImportationsMillions de dollars Régions,
pays ou territoires2007 (1)
5.1.1 Valeur des exportations et importations de servicesdes pays et des régions géographiques
(1)(2)
(3)(4)(5)
Les données de l'année 2007 sont provisoires.Année 1990 : la rupture de série est due aux chiffres reportés par l'ex RSF de Yougoslavie et les pays qui lui ont succédé, ainsi que à l'inclusion des données de la Fédération de Russie, tandis que les statistiques de l'ancienne URSS ne sont pas disponibles. Années 2004 et 2005 : rupture de série.Année 2004 : rupture de série.Année 2006 : rupture de série.
Sources : Calculs du secrétariat de la CNUCED basés sur les Statistiques de la balance des paiements sur CD-ROM du FMI et autres sources internationales et nationales
Notes :
249
5
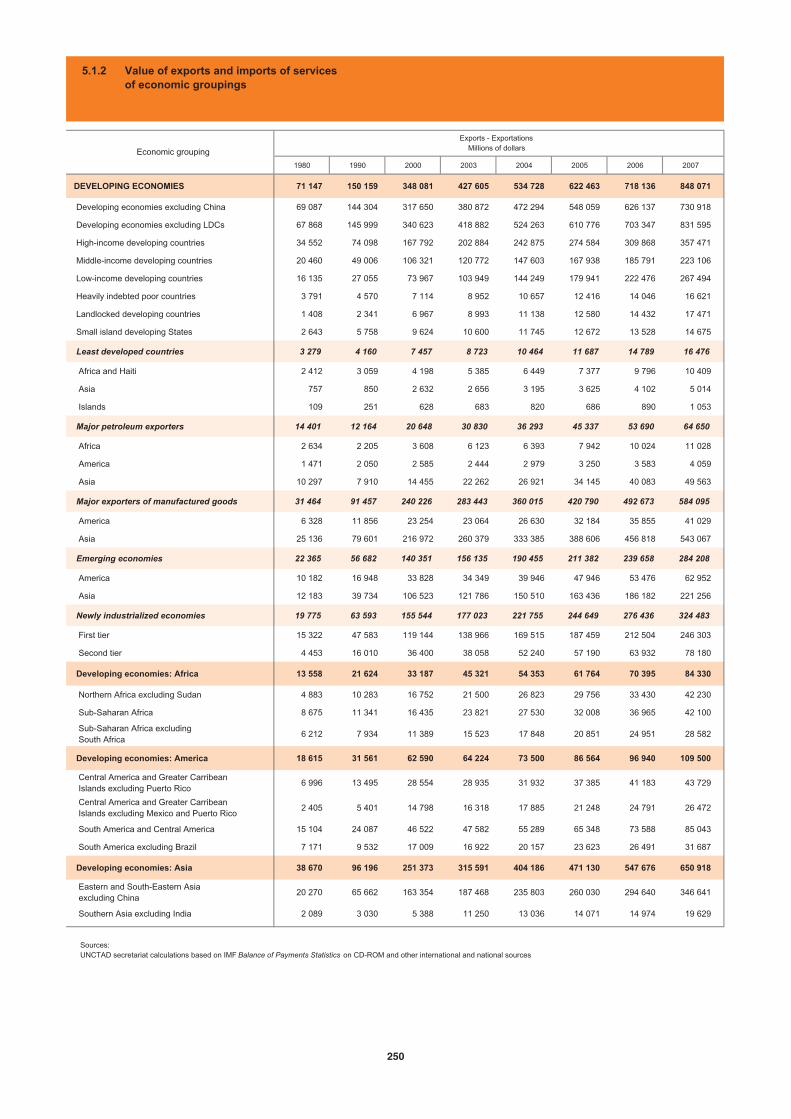
1980 1990 2000 2003 2004 2005 2006 2007
DEVELOPING ECONOMIES 71 147 150 159 348 081 427 605 534 728 622 463 718 136 848 071
Developing economies excluding China 69 087 144 304 317 650 380 872 472 294 548 059 626 137 730 918
Developing economies excluding LDCs 67 868 145 999 340 623 418 882 524 263 610 776 703 347 831 595
High-income developing countries 34 552 74 098 167 792 202 884 242 875 274 584 309 868 357 471
Middle-income developing countries 20 460 49 006 106 321 120 772 147 603 167 938 185 791 223 106
Low-income developing countries 16 135 27 055 73 967 103 949 144 249 179 941 222 476 267 494
Heavily indebted poor countries 3 791 4 570 7 114 8 952 10 657 12 416 14 046 16 621
Landlocked developing countries 1 408 2 341 6 967 8 993 11 138 12 580 14 432 17 471
Small island developing States 2 643 5 758 9 624 10 600 11 745 12 672 13 528 14 675
Least developed countries 3 279 4 160 7 457 8 723 10 464 11 687 14 789 16 476
Africa and Haiti 2 412 3 059 4 198 5 385 6 449 7 377 9 796 10 409
Asia 757 850 2 632 2 656 3 195 3 625 4 102 5 014
Islands 109 251 628 683 820 686 890 1 053
Major petroleum exporters 14 401 12 164 20 648 30 830 36 293 45 337 53 690 64 650
Africa 2 634 2 205 3 608 6 123 6 393 7 942 10 024 11 028
America 1 471 2 050 2 585 2 444 2 979 3 250 3 583 4 059
Asia 10 297 7 910 14 455 22 262 26 921 34 145 40 083 49 563
Major exporters of manufactured goods 31 464 91 457 240 226 283 443 360 015 420 790 492 673 584 095
America 6 328 11 856 23 254 23 064 26 630 32 184 35 855 41 029
Asia 25 136 79 601 216 972 260 379 333 385 388 606 456 818 543 067
Emerging economies 22 365 56 682 140 351 156 135 190 455 211 382 239 658 284 208
America 10 182 16 948 33 828 34 349 39 946 47 946 53 476 62 952
Asia 12 183 39 734 106 523 121 786 150 510 163 436 186 182 221 256
Newly industrialized economies 19 775 63 593 155 544 177 023 221 755 244 649 276 436 324 483
First tier 15 322 47 583 119 144 138 966 169 515 187 459 212 504 246 303
Second tier 4 453 16 010 36 400 38 058 52 240 57 190 63 932 78 180
Developing economies: Africa 13 558 21 624 33 187 45 321 54 353 61 764 70 395 84 330
Northern Africa excluding Sudan 4 883 10 283 16 752 21 500 26 823 29 756 33 430 42 230
Sub-Saharan Africa 8 675 11 341 16 435 23 821 27 530 32 008 36 965 42 100
Sub-Saharan Africa excluding South Africa
6 212 7 934 11 389 15 523 17 848 20 851 24 951 28 582
Developing economies: America 18 615 31 561 62 590 64 224 73 500 86 564 96 940 109 500
Central America and Greater Carribean Islands excluding Puerto Rico
6 996 13 495 28 554 28 935 31 932 37 385 41 183 43 729
Central America and Greater Carribean Islands excluding Mexico and Puerto Rico
2 405 5 401 14 798 16 318 17 885 21 248 24 791 26 472
South America and Central America 15 104 24 087 46 522 47 582 55 289 65 348 73 588 85 043
South America excluding Brazil 7 171 9 532 17 009 16 922 20 157 23 623 26 491 31 687
Developing economies: Asia 38 670 96 196 251 373 315 591 404 186 471 130 547 676 650 918
Eastern and South-Eastern Asia excluding China
20 270 65 662 163 354 187 468 235 803 260 030 294 640 346 641
Southern Asia excluding India 2 089 3 030 5 388 11 250 13 036 14 071 14 974 19 629
Exports - ExportationsMillions of dollarsEconomic grouping
5.1.2 Value of exports and imports of servicesof economic groupings
Sources:UNCTAD secretariat calculations based on IMF Balance of Payments Statistics on CD-ROM and other international and national sources
250
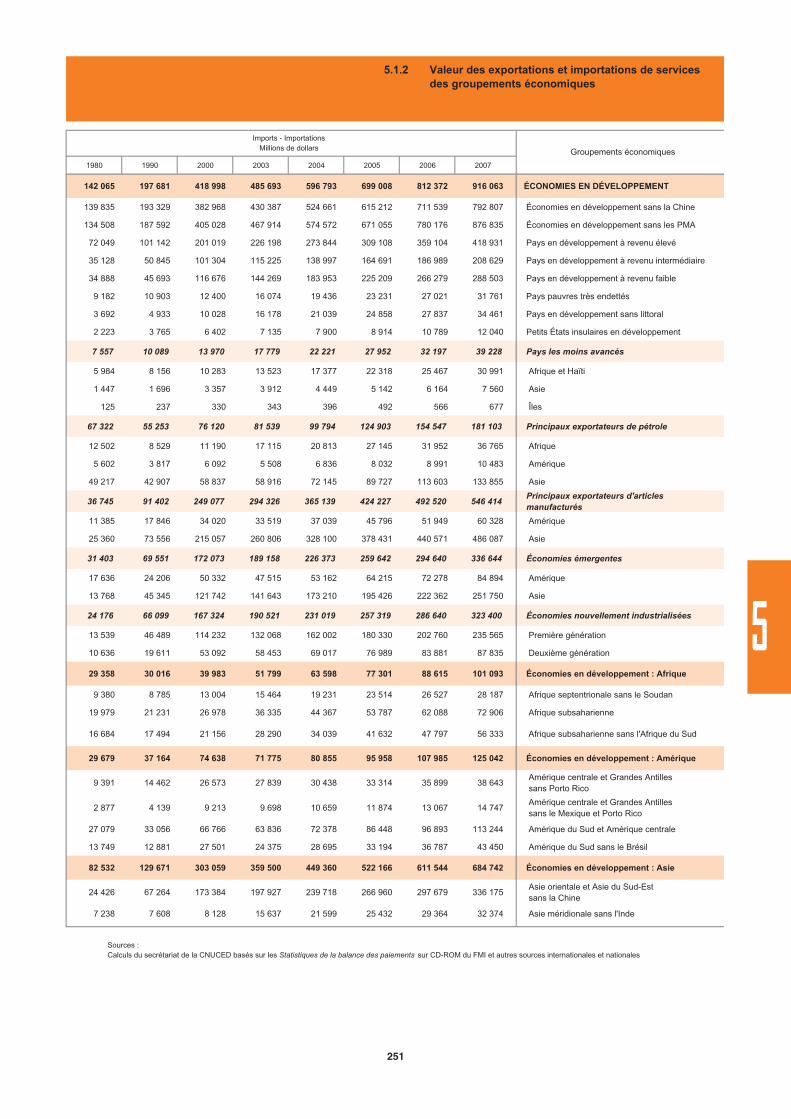
1980 1990 2000 2003 2004 2005 2006 2007
142 065 197 681 418 998 485 693 596 793 699 008 812 372 916 063 ÉCONOMIES EN DÉVELOPPEMENT
139 835 193 329 382 968 430 387 524 661 615 212 711 539 792 807 Économies en développement sans la Chine
134 508 187 592 405 028 467 914 574 572 671 055 780 176 876 835 Économies en développement sans les PMA
72 049 101 142 201 019 226 198 273 844 309 108 359 104 418 931 Pays en développement à revenu élevé
35 128 50 845 101 304 115 225 138 997 164 691 186 989 208 629 Pays en développement à revenu intermédiaire
34 888 45 693 116 676 144 269 183 953 225 209 266 279 288 503 Pays en développement à revenu faible
9 182 10 903 12 400 16 074 19 436 23 231 27 021 31 761 Pays pauvres très endettés
3 692 4 933 10 028 16 178 21 039 24 858 27 837 34 461 Pays en développement sans littoral
2 223 3 765 6 402 7 135 7 900 8 914 10 789 12 040 Petits États insulaires en développement
7 557 10 089 13 970 17 779 22 221 27 952 32 197 39 228 Pays les moins avancés
5 984 8 156 10 283 13 523 17 377 22 318 25 467 30 991 Afrique et Haïti
1 447 1 696 3 357 3 912 4 449 5 142 6 164 7 560 Asie
125 237 330 343 396 492 566 677 Îles
67 322 55 253 76 120 81 539 99 794 124 903 154 547 181 103 Principaux exportateurs de pétrole
12 502 8 529 11 190 17 115 20 813 27 145 31 952 36 765 Afrique
5 602 3 817 6 092 5 508 6 836 8 032 8 991 10 483 Amérique
49 217 42 907 58 837 58 916 72 145 89 727 113 603 133 855 Asie
36 745 91 402 249 077 294 326 365 139 424 227 492 520 546 414Principaux exportateurs d'articlesmanufacturés
11 385 17 846 34 020 33 519 37 039 45 796 51 949 60 328 Amérique
25 360 73 556 215 057 260 806 328 100 378 431 440 571 486 087 Asie
31 403 69 551 172 073 189 158 226 373 259 642 294 640 336 644 Économies émergentes
17 636 24 206 50 332 47 515 53 162 64 215 72 278 84 894 Amérique
13 768 45 345 121 742 141 643 173 210 195 426 222 362 251 750 Asie
24 176 66 099 167 324 190 521 231 019 257 319 286 640 323 400 Économies nouvellement industrialisées
13 539 46 489 114 232 132 068 162 002 180 330 202 760 235 565 Première génération
10 636 19 611 53 092 58 453 69 017 76 989 83 881 87 835 Deuxième génération
29 358 30 016 39 983 51 799 63 598 77 301 88 615 101 093 Économies en développement : Afrique
9 380 8 785 13 004 15 464 19 231 23 514 26 527 28 187 Afrique septentrionale sans le Soudan
19 979 21 231 26 978 36 335 44 367 53 787 62 088 72 906 Afrique subsaharienne
16 684 17 494 21 156 28 290 34 039 41 632 47 797 56 333 Afrique subsaharienne sans l'Afrique du Sud
29 679 37 164 74 638 71 775 80 855 95 958 107 985 125 042 Économies en développement : Amérique
9 391 14 462 26 573 27 839 30 438 33 314 35 899 38 643 Amérique centrale et Grandes Antilles sans Porto Rico
2 877 4 139 9 213 9 698 10 659 11 874 13 067 14 747 Amérique centrale et Grandes Antilles sans le Mexique et Porto Rico
27 079 33 056 66 766 63 836 72 378 86 448 96 893 113 244 Amérique du Sud et Amérique centrale
13 749 12 881 27 501 24 375 28 695 33 194 36 787 43 450 Amérique du Sud sans le Brésil
82 532 129 671 303 059 359 500 449 360 522 166 611 544 684 742 Économies en développement : Asie
24 426 67 264 173 384 197 927 239 718 266 960 297 679 336 175 Asie orientale et Asie du Sud-Est sans la Chine
7 238 7 608 8 128 15 637 21 599 25 432 29 364 32 374 Asie méridionale sans l'Inde
Groupements économiques
Imports - Importations Millions de dollars
5.1.2 Valeur des exportations et importations de servicesdes groupements économiques
Sources : Calculs du secrétariat de la CNUCED basés sur les Statistiques de la balance des paiements sur CD-ROM du FMI et autres sources internationales et nationales
251
5
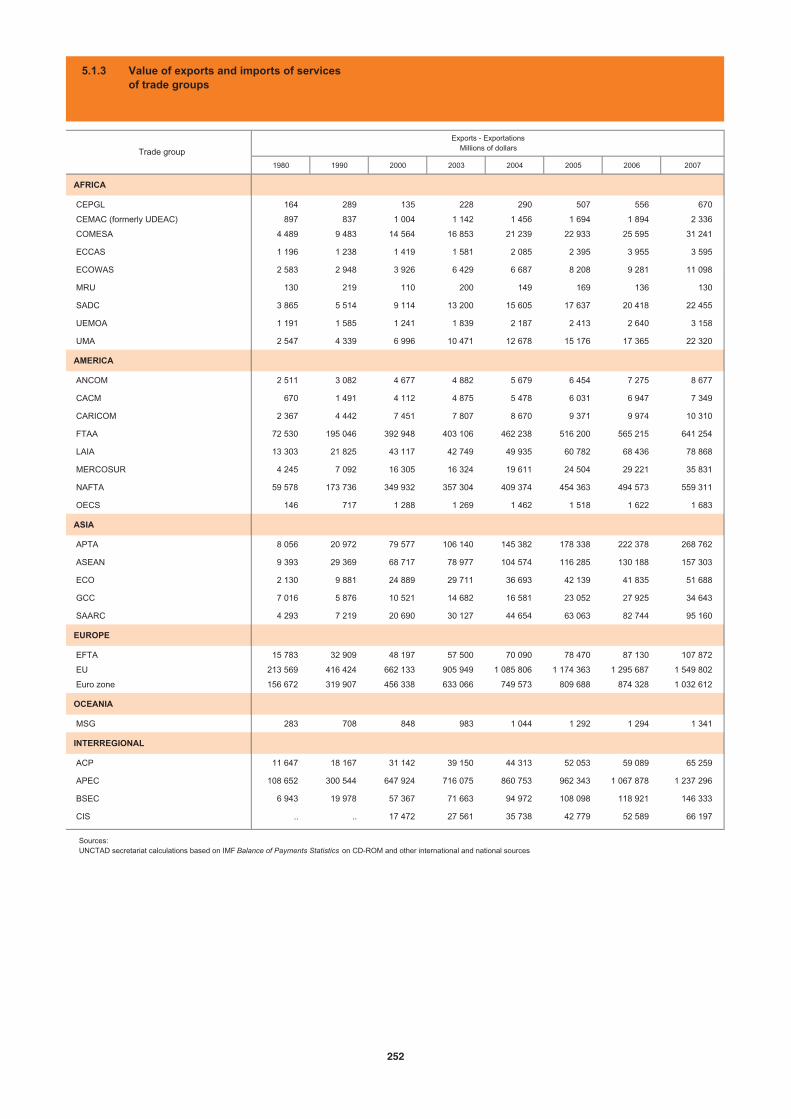
1980 1990 2000 2003 2004 2005 2006 2007
AFRICA
CEPGL 164 289 135 228 290 507 556 670
CEMAC (formerly UDEAC) 897 837 1 004 1 142 1 456 1 694 1 894 2 336
COMESA 4 489 9 483 14 564 16 853 21 239 22 933 25 595 31 241
ECCAS 1 196 1 238 1 419 1 581 2 085 2 395 3 955 3 595
ECOWAS 2 583 2 948 3 926 6 429 6 687 8 208 9 281 11 098
MRU 130 219 110 200 149 169 136 130
SADC 3 865 5 514 9 114 13 200 15 605 17 637 20 418 22 455
UEMOA 1 191 1 585 1 241 1 839 2 187 2 413 2 640 3 158
UMA 2 547 4 339 6 996 10 471 12 678 15 176 17 365 22 320
AMERICA
ANCOM 2 511 3 082 4 677 4 882 5 679 6 454 7 275 8 677
CACM 670 1 491 4 112 4 875 5 478 6 031 6 947 7 349
CARICOM 2 367 4 442 7 451 7 807 8 670 9 371 9 974 10 310
FTAA 72 530 195 046 392 948 403 106 462 238 516 200 565 215 641 254
LAIA 13 303 21 825 43 117 42 749 49 935 60 782 68 436 78 868
MERCOSUR 4 245 7 092 16 305 16 324 19 611 24 504 29 221 35 831
NAFTA 59 578 173 736 349 932 357 304 409 374 454 363 494 573 559 311
OECS 146 717 1 288 1 269 1 462 1 518 1 622 1 683
ASIA
APTA 8 056 20 972 79 577 106 140 145 382 178 338 222 378 268 762
ASEAN 9 393 29 369 68 717 78 977 104 574 116 285 130 188 157 303
ECO 2 130 9 881 24 889 29 711 36 693 42 139 41 835 51 688
GCC 7 016 5 876 10 521 14 682 16 581 23 052 27 925 34 643
SAARC 4 293 7 219 20 690 30 127 44 654 63 063 82 744 95 160
EUROPE
EFTA 15 783 32 909 48 197 57 500 70 090 78 470 87 130 107 872
EU 213 569 416 424 662 133 905 949 1 085 806 1 174 363 1 295 687 1 549 802
Euro zone 156 672 319 907 456 338 633 066 749 573 809 688 874 328 1 032 612
OCEANIA
MSG 283 708 848 983 1 044 1 292 1 294 1 341
INTERREGIONAL
ACP 11 647 18 167 31 142 39 150 44 313 52 053 59 089 65 259
APEC 108 652 300 544 647 924 716 075 860 753 962 343 1 067 878 1 237 296
BSEC 6 943 19 978 57 367 71 663 94 972 108 098 118 921 146 333
CIS .. .. 17 472 27 561 35 738 42 779 52 589 66 197
Exports - ExportationsMillions of dollarsTrade group
5.1.3 Value of exports and imports of servicesof trade groups
Sources:UNCTAD secretariat calculations based on IMF Balance of Payments Statistics on CD-ROM and other international and national sources
252
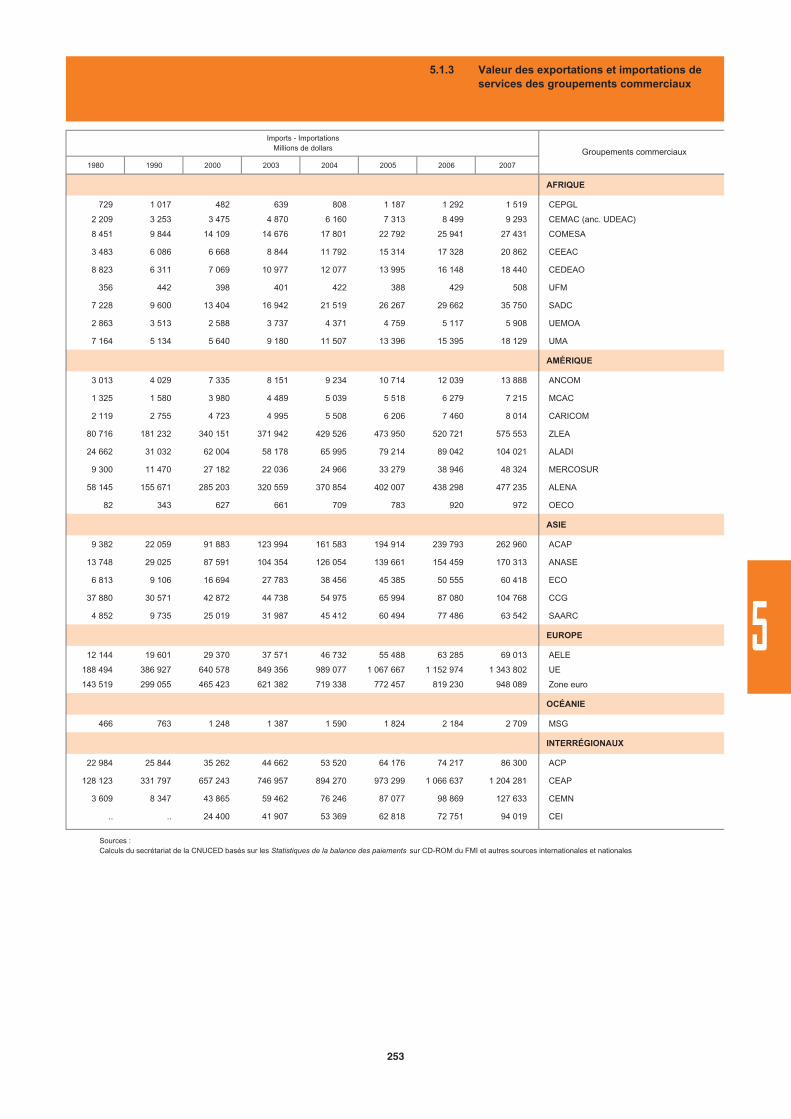
1980 1990 2000 2003 2004 2005 2006 2007
AFRIQUE
729 1 017 482 639 808 1 187 1 292 1 519 CEPGL
2 209 3 253 3 475 4 870 6 160 7 313 8 499 9 293 CEMAC (anc. UDEAC)
8 451 9 844 14 109 14 676 17 801 22 792 25 941 27 431 COMESA
3 483 6 086 6 668 8 844 11 792 15 314 17 328 20 862 CEEAC
8 823 6 311 7 069 10 977 12 077 13 995 16 148 18 440 CEDEAO
356 442 398 401 422 388 429 508 UFM
7 228 9 600 13 404 16 942 21 519 26 267 29 662 35 750 SADC
2 863 3 513 2 588 3 737 4 371 4 759 5 117 5 908 UEMOA
7 164 5 134 5 640 9 180 11 507 13 396 15 395 18 129 UMA
AMÉRIQUE
3 013 4 029 7 335 8 151 9 234 10 714 12 039 13 888 ANCOM
1 325 1 580 3 980 4 489 5 039 5 518 6 279 7 215 MCAC
2 119 2 755 4 723 4 995 5 508 6 206 7 460 8 014 CARICOM
80 716 181 232 340 151 371 942 429 526 473 950 520 721 575 553 ZLEA
24 662 31 032 62 004 58 178 65 995 79 214 89 042 104 021 ALADI
9 300 11 470 27 182 22 036 24 966 33 279 38 946 48 324 MERCOSUR
58 145 155 671 285 203 320 559 370 854 402 007 438 298 477 235 ALENA
82 343 627 661 709 783 920 972 OECO
ASIE
9 382 22 059 91 883 123 994 161 583 194 914 239 793 262 960 ACAP
13 748 29 025 87 591 104 354 126 054 139 661 154 459 170 313 ANASE
6 813 9 106 16 694 27 783 38 456 45 385 50 555 60 418 ECO
37 880 30 571 42 872 44 738 54 975 65 994 87 080 104 768 CCG
4 852 9 735 25 019 31 987 45 412 60 494 77 486 63 542 SAARC
EUROPE
12 144 19 601 29 370 37 571 46 732 55 488 63 285 69 013 AELE
188 494 386 927 640 578 849 356 989 077 1 067 667 1 152 974 1 343 802 UE
143 519 299 055 465 423 621 382 719 338 772 457 819 230 948 089 Zone euro
OCÉANIE
466 763 1 248 1 387 1 590 1 824 2 184 2 709 MSG
INTERRÉGIONAUX
22 984 25 844 35 262 44 662 53 520 64 176 74 217 86 300 ACP
128 123 331 797 657 243 746 957 894 270 973 299 1 066 637 1 204 281 CEAP
3 609 8 347 43 865 59 462 76 246 87 077 98 869 127 633 CEMN
.. .. 24 400 41 907 53 369 62 818 72 751 94 019 CEI
Groupements commerciaux
Imports - ImportationsMillions de dollars
5.1.3 Valeur des exportations et importations de services des groupements commerciaux
Sources : Calculs du secrétariat de la CNUCED basés sur les Statistiques de la balance des paiements sur CD-ROM du FMI et autres sources internationales et nationales
253
5
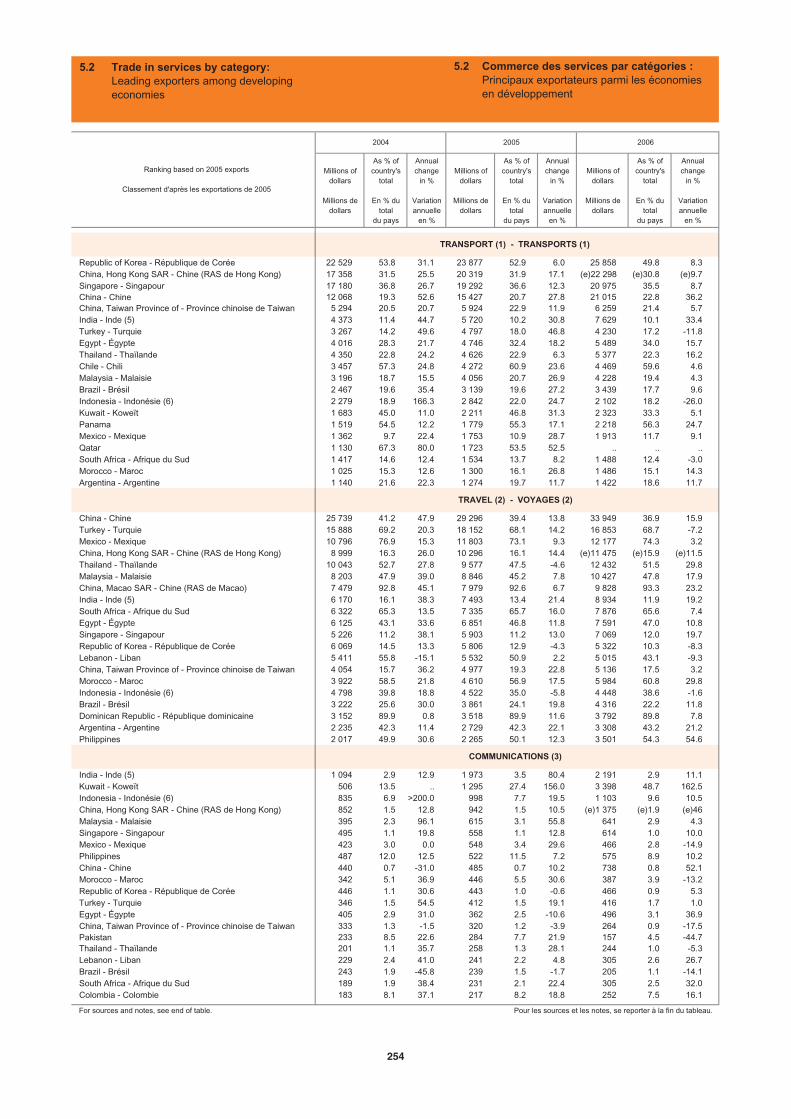
Millions of dollars
Millions dedollars
As % ofcountry's
total
En % du total
du pays
Annualchange
in %
Variationannuelle
en %
Millions of dollars
Millions dedollars
As % ofcountry's
total
En % du total
du pays
Annualchange
in %
Variationannuelle
en %
Millions of dollars
Millions dedollars
As % ofcountry's
total
En % du total
du pays
Annualchange
in %
Variationannuelle
en %
Republic of Korea - République de Corée 22 529 53.8 31.1 23 877 52.9 6.0 25 858 49.8 8.3China, Hong Kong SAR - Chine (RAS de Hong Kong) 17 358 31.5 25.5 20 319 31.9 17.1 (e)30.8 (e)9.7Singapore - Singapour 17 180 36.8 26.7 19 292 36.6 12.3 20 975 35.5 8.7China - Chine 12 068 19.3 52.6 15 427 20.7 27.8 21 015 22.8 36.2China, Taiwan Province of - Province chinoise de Taiwan 5 294 20.5 20.7 5 924 22.9 11.9 6 259 21.4 5.7India - Inde (5) 4 373 11.4 44.7 5 720 10.2 30.8 7 629 10.1 33.4Turkey - Turquie 3 267 14.2 49.6 4 797 18.0 46.8 4 230 17.2 -11.8Egypt - Égypte 4 016 28.3 21.7 4 746 32.4 18.2 5 489 34.0 15.7Thailand - Thaïlande 4 350 22.8 24.2 4 626 22.9 6.3 5 377 22.3 16.2Chile - Chili 3 457 57.3 24.8 4 272 60.9 23.6 4 469 59.6 4.6Malaysia - Malaisie 3 196 18.7 15.5 4 056 20.7 26.9 4 228 19.4 4.3Brazil - Brésil 2 467 19.6 35.4 3 139 19.6 27.2 3 439 17.7 9.6Indonesia - Indonésie (6) 2 279 18.9 166.3 2 842 22.0 24.7 2 102 18.2 -26.0Kuwait - Koweït 1 683 45.0 11.0 2 211 46.8 31.3 2 323 33.3 5.1Panama 1 519 54.5 12.2 1 779 55.3 17.1 2 218 56.3 24.7Mexico - Mexique 1 362 9.7 22.4 1 753 10.9 28.7 1 913 11.7 9.1Qatar 1 130 67.3 80.0 1 723 53.5 52.5 .. .. ..South Africa - Afrique du Sud 1 417 14.6 12.4 1 534 13.7 8.2 1 488 12.4 -3.0Morocco - Maroc 1 025 15.3 12.6 1 300 16.1 26.8 1 486 15.1 14.3Argentina - Argentine 1 140 21.6 22.3 1 274 19.7 11.7 1 422 18.6 11.7
China - Chine 25 739 41.2 47.9 29 296 39.4 13.8 33 949 36.9 15.9Turkey - Turquie 15 888 69.2 20.3 18 152 68.1 14.2 16 853 68.7 -7.2Mexico - Mexique 10 796 76.9 15.3 11 803 73.1 9.3 12 177 74.3 3.2China, Hong Kong SAR - Chine (RAS de Hong Kong) 8 999 16.3 26.0 10 296 16.1 14.4 (e)15.9 (e)11.5Thailand - Thaïlande 10 043 52.7 27.8 9 577 47.5 -4.6 12 432 51.5 29.8Malaysia - Malaisie 8 203 47.9 39.0 8 846 45.2 7.8 10 427 47.8 17.9China, Macao SAR - Chine (RAS de Macao) 7 479 92.8 45.1 7 979 92.6 6.7 9 828 93.3 23.2India - Inde (5) 6 170 16.1 38.3 7 493 13.4 21.4 8 934 11.9 19.2South Africa - Afrique du Sud 6 322 65.3 13.5 7 335 65.7 16.0 7 876 65.6 7.4Egypt - Égypte 6 125 43.1 33.6 6 851 46.8 11.8 7 591 47.0 10.8Singapore - Singapour 5 226 11.2 38.1 5 903 11.2 13.0 7 069 12.0 19.7Republic of Korea - République de Corée 6 069 14.5 13.3 5 806 12.9 -4.3 5 322 10.3 -8.3Lebanon - Liban 5 411 55.8 -15.1 5 532 50.9 2.2 5 015 43.1 -9.3China, Taiwan Province of - Province chinoise de Taiwan 4 054 15.7 36.2 4 977 19.3 22.8 5 136 17.5 3.2Morocco - Maroc 3 922 58.5 21.8 4 610 56.9 17.5 5 984 60.8 29.8Indonesia - Indonésie (6) 4 798 39.8 18.8 4 522 35.0 -5.8 4 448 38.6 -1.6Brazil - Brésil 3 222 25.6 30.0 3 861 24.1 19.8 4 316 22.2 11.8Dominican Republic - République dominicaine 3 152 89.9 0.8 3 518 89.9 11.6 3 792 89.8 7.8Argentina - Argentine 2 235 42.3 11.4 2 729 42.3 22.1 3 308 43.2 21.2Philippines 2 017 49.9 30.6 2 265 50.1 12.3 3 501 54.3 54.6
India - Inde (5) 1 094 2.9 12.9 1 973 3.5 80.4 2 191 2.9 11.1Kuwait - Koweït 506 13.5 .. 1 295 27.4 156.0 3 398 48.7 162.5Indonesia - Indonésie (6) 835 6.9 >200.0 998 7.7 19.5 1 103 9.6 10.5China, Hong Kong SAR - Chine (RAS de Hong Kong) 852 1.5 12.8 942 1.5 10.5 (e)1.9 (e)46Malaysia - Malaisie 395 2.3 96.1 615 3.1 55.8 641 2.9 4.3Singapore - Singapour 495 1.1 19.8 558 1.1 12.8 614 1.0 10.0Mexico - Mexique 423 3.0 0.0 548 3.4 29.6 466 2.8 -14.9Philippines 487 12.0 12.5 522 11.5 7.2 575 8.9 10.2China - Chine 440 0.7 -31.0 485 0.7 10.2 738 0.8 52.1Morocco - Maroc 342 5.1 36.9 446 5.5 30.6 387 3.9 -13.2Republic of Korea - République de Corée 446 1.1 30.6 443 1.0 -0.6 466 0.9 5.3Turkey - Turquie 346 1.5 54.5 412 1.5 19.1 416 1.7 1.0Egypt - Égypte 405 2.9 31.0 362 2.5 -10.6 496 3.1 36.9China, Taiwan Province of - Province chinoise de Taiwan 333 1.3 -1.5 320 1.2 -3.9 264 0.9 -17.5Pakistan 233 8.5 22.6 284 7.7 21.9 157 4.5 -44.7Thailand - Thaïlande 201 1.1 35.7 258 1.3 28.1 244 1.0 -5.3Lebanon - Liban 229 2.4 41.0 241 2.2 4.8 305 2.6 26.7Brazil - Brésil 243 1.9 -45.8 239 1.5 -1.7 205 1.1 -14.1South Africa - Afrique du Sud 189 1.9 38.4 231 2.1 22.4 305 2.5 32.0Colombia - Colombie 183 8.1 37.1 217 8.2 18.8 252 7.5 16.1
For sources and notes, see end of table. Pour les sources et les notes, se reporter à la fin du tableau.
2004 2005 2006
Ranking based on 2005 exports
Classement d'après les exportations de 2005
TRANSPORT (1) - TRANSPORTS (1)
TRAVEL (2) - VOYAGES (2)
COMMUNICATIONS (3)
5.2 Trade in services by category:Leading exporters among developingeconomies
5.2 Commerce des services par catégories :Principaux exportateurs parmi les économies en développement
(e)22 298
(e)11 475
(e)1 375
254
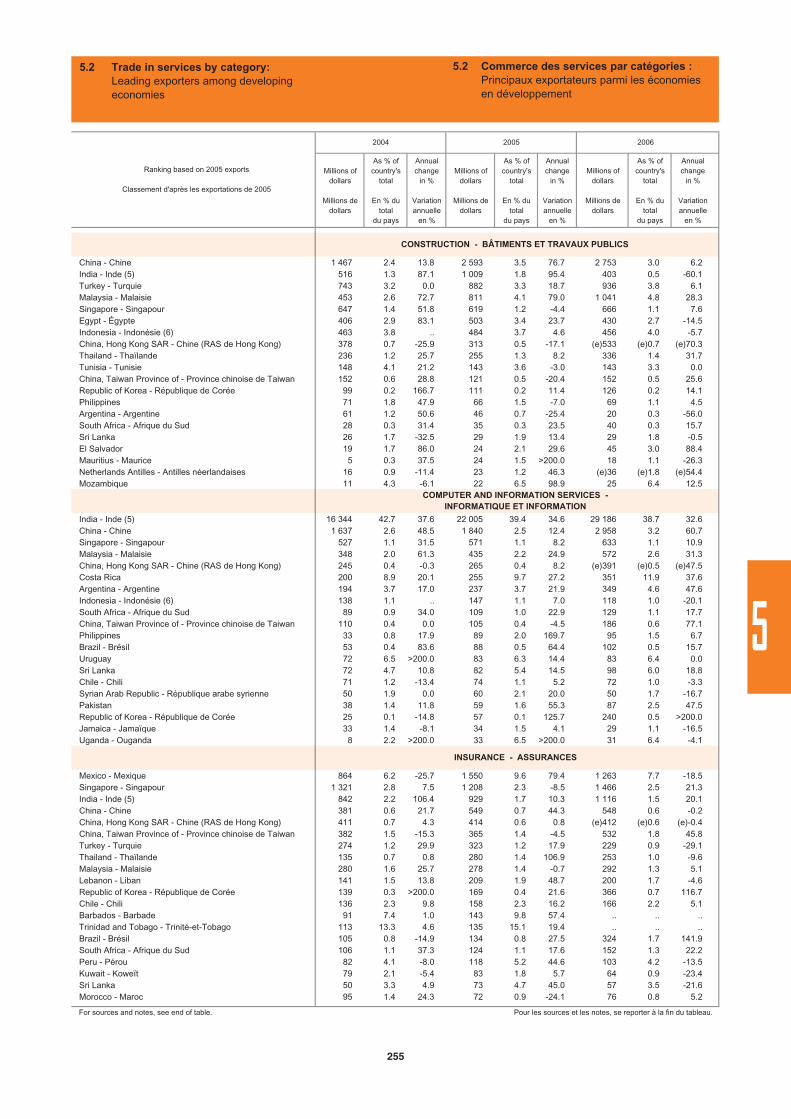
Millions of dollars
Millions dedollars
As % ofcountry's
total
En % du total
du pays
Annualchange
in %
Variationannuelle
en %
Millions of dollars
Millions dedollars
As % ofcountry's
total
En % du total
du pays
Annualchange
in %
Variationannuelle
en %
Millions of dollars
Millions dedollars
As % ofcountry's
total
En % du total
du pays
Annualchange
in %
Variationannuelle
en %
China - Chine 1 467 2.4 13.8 2 593 3.5 76.7 2 753 3.0 6.2India - Inde (5) 516 1.3 87.1 1 009 1.8 95.4 403 0.5 -60.1Turkey - Turquie 743 3.2 0.0 882 3.3 18.7 936 3.8 6.1Malaysia - Malaisie 453 2.6 72.7 811 4.1 79.0 1 041 4.8 28.3Singapore - Singapour 647 1.4 51.8 619 1.2 -4.4 666 1.1 7.6Egypt - Égypte 406 2.9 83.1 503 3.4 23.7 430 2.7 -14.5Indonesia - Indonésie (6) 463 3.8 .. 484 3.7 4.6 456 4.0 -5.7China, Hong Kong SAR - Chine (RAS de Hong Kong) 378 0.7 -25.9 313 0.5 -17.1 (e)533 (e)0.7 (e)70.3Thailand - Thaïlande 236 1.2 25.7 255 1.3 8.2 336 1.4 31.7Tunisia - Tunisie 148 4.1 21.2 143 3.6 -3.0 143 3.3 0.0China, Taiwan Province of - Province chinoise de Taiwan 152 0.6 28.8 121 0.5 -20.4 152 0.5 25.6Republic of Korea - République de Corée 99 0.2 166.7 111 0.2 11.4 126 0.2 14.1Philippines 71 1.8 47.9 66 1.5 -7.0 69 1.1 4.5Argentina - Argentine 61 1.2 50.6 46 0.7 -25.4 20 0.3 -56.0South Africa - Afrique du Sud 28 0.3 31.4 35 0.3 23.5 40 0.3 15.7Sri Lanka 26 1.7 -32.5 29 1.9 13.4 29 1.8 -0.5El Salvador 19 1.7 86.0 24 2.1 29.6 45 3.0 88.4Mauritius - Maurice 5 0.3 37.5 24 1.5 >200.0 18 1.1 -26.3Netherlands Antilles - Antilles néerlandaises 16 0.9 -11.4 23 1.2 46.3 (e)36 (e)1.8 (e)54.4Mozambique 11 4.3 -6.1 22 6.5 98.9 25 6.4 12.5
India - Inde (5) 16 344 42.7 37.6 22 005 39.4 34.6 29 186 38.7 32.6China - Chine 1 637 2.6 48.5 1 840 2.5 12.4 2 958 3.2 60.7Singapore - Singapour 527 1.1 31.5 571 1.1 8.2 633 1.1 10.9Malaysia - Malaisie 348 2.0 61.3 435 2.2 24.9 572 2.6 31.3China, Hong Kong SAR - Chine (RAS de Hong Kong) 245 0.4 -0.3 265 0.4 8.2 (e)391 (e)0.5 (e)47.5Costa Rica 200 8.9 20.1 255 9.7 27.2 351 11.9 37.6Argentina - Argentine 194 3.7 17.0 237 3.7 21.9 349 4.6 47.6Indonesia - Indonésie (6) 138 1.1 .. 147 1.1 7.0 118 1.0 -20.1South Africa - Afrique du Sud 89 0.9 34.0 109 1.0 22.9 129 1.1 17.7China, Taiwan Province of - Province chinoise de Taiwan 110 0.4 0.0 105 0.4 -4.5 186 0.6 77.1Philippines 33 0.8 17.9 89 2.0 169.7 95 1.5 6.7Brazil - Brésil 53 0.4 83.6 88 0.5 64.4 102 0.5 15.7Uruguay 72 6.5 >200.0 83 6.3 14.4 83 6.4 0.0Sri Lanka 72 4.7 10.8 82 5.4 14.5 98 6.0 18.8Chile - Chili 71 1.2 -13.4 74 1.1 5.2 72 1.0 -3.3Syrian Arab Republic - République arabe syrienne 50 1.9 0.0 60 2.1 20.0 50 1.7 -16.7Pakistan 38 1.4 11.8 59 1.6 55.3 87 2.5 47.5Republic of Korea - République de Corée 25 0.1 -14.8 57 0.1 125.7 240 0.5 >200.0Jamaica - Jamaïque 33 1.4 -8.1 34 1.5 4.1 29 1.1 -16.5Uganda - Ouganda 8 2.2 >200.0 33 6.5 >200.0 31 6.4 -4.1
Mexico - Mexique 864 6.2 -25.7 1 550 9.6 79.4 1 263 7.7 -18.5Singapore - Singapour 1 321 2.8 7.5 1 208 2.3 -8.5 1 466 2.5 21.3India - Inde (5) 842 2.2 106.4 929 1.7 10.3 1 116 1.5 20.1China - Chine 381 0.6 21.7 549 0.7 44.3 548 0.6 -0.2China, Hong Kong SAR - Chine (RAS de Hong Kong) 411 0.7 4.3 414 0.6 0.8 (e)412 (e)0.6 (e)-0.4China, Taiwan Province of - Province chinoise de Taiwan 382 1.5 -15.3 365 1.4 -4.5 532 1.8 45.8Turkey - Turquie 274 1.2 29.9 323 1.2 17.9 229 0.9 -29.1Thailand - Thaïlande 135 0.7 0.8 280 1.4 106.9 253 1.0 -9.6Malaysia - Malaisie 280 1.6 25.7 278 1.4 -0.7 292 1.3 5.1Lebanon - Liban 141 1.5 13.8 209 1.9 48.7 200 1.7 -4.6Republic of Korea - République de Corée 139 0.3 >200.0 169 0.4 21.6 366 0.7 116.7Chile - Chili 136 2.3 9.8 158 2.3 16.2 166 2.2 5.1Barbados - Barbade 91 7.4 1.0 143 9.8 57.4 .. .. ..Trinidad and Tobago - Trinité-et-Tobago 113 13.3 4.6 135 15.1 19.4 .. .. ..Brazil - Brésil 105 0.8 -14.9 134 0.8 27.5 324 1.7 141.9South Africa - Afrique du Sud 106 1.1 37.3 124 1.1 17.6 152 1.3 22.2Peru - Pérou 82 4.1 -8.0 118 5.2 44.6 103 4.2 -13.5Kuwait - Koweït 79 2.1 -5.4 83 1.8 5.7 64 0.9 -23.4Sri Lanka 50 3.3 4.9 73 4.7 45.0 57 3.5 -21.6Morocco - Maroc 95 1.4 24.3 72 0.9 -24.1 76 0.8 5.2
For sources and notes, see end of table. Pour les sources et les notes, se reporter à la fin du tableau.
COMPUTER AND INFORMATION SERVICES - INFORMATIQUE ET INFORMATION
INSURANCE - ASSURANCES
CONSTRUCTION - BÂTIMENTS ET TRAVAUX PUBLICS
Ranking based on 2005 exports
Classement d'après les exportations de 2005
2004 2005 2006
5.2 Trade in services by category:Leading exporters among developingeconomies
5.2 Commerce des services par catégories :Principaux exportateurs parmi les économies en développement
255
5
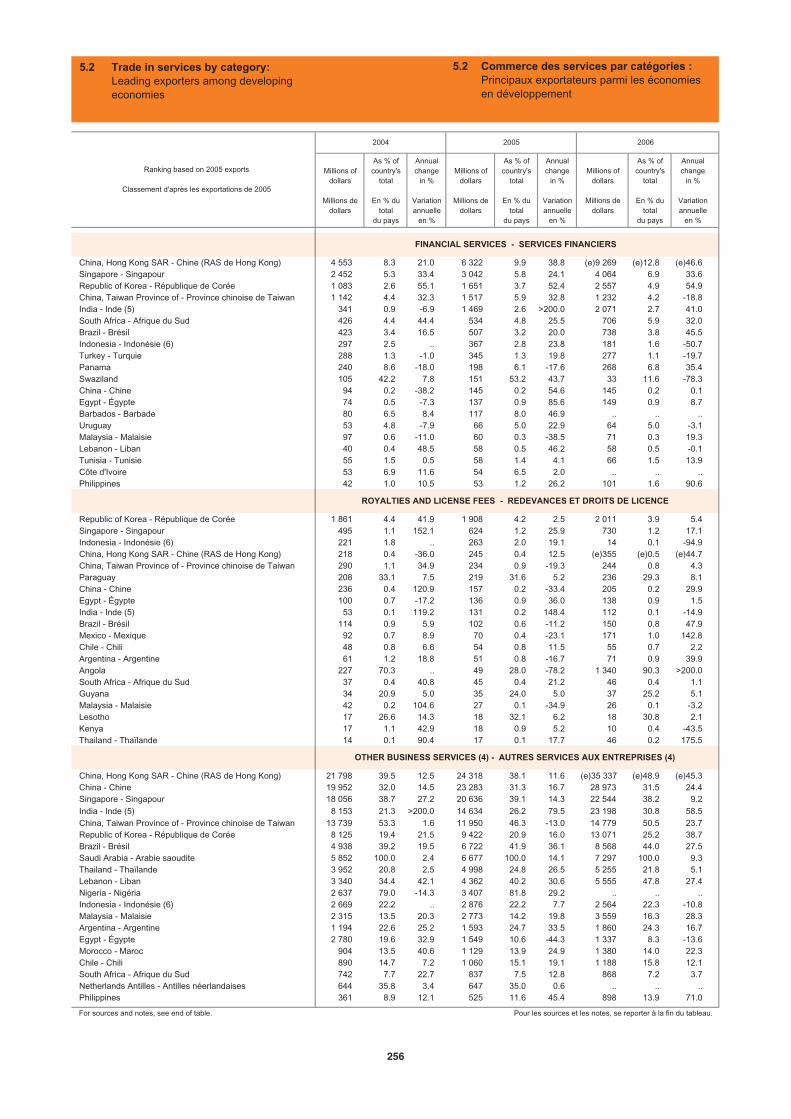
Millions of dollars
Millions dedollars
As % ofcountry's
total
En % du total
du pays
Annualchange
in %
Variationannuelle
en %
Millions of dollars
Millions dedollars
As % ofcountry's
total
En % du total
du pays
Annualchange
in %
Variationannuelle
en %
Millions of dollars
Millions dedollars
As % ofcountry's
total
En % du total
du pays
Annualchange
in %
Variationannuelle
en %
China, Hong Kong SAR - Chine (RAS de Hong Kong) 4 553 8.3 21.0 6 322 9.9 38.8 (e)12.8 (e)46.6Singapore - Singapour 2 452 5.3 33.4 3 042 5.8 24.1 4 064 6.9 33.6Republic of Korea - République de Corée 1 083 2.6 55.1 1 651 3.7 52.4 2 557 4.9 54.9China, Taiwan Province of - Province chinoise de Taiwan 1 142 4.4 32.3 1 517 5.9 32.8 1 232 4.2 -18.8India - Inde (5) 341 0.9 -6.9 1 469 2.6 >200.0 2 071 2.7 41.0South Africa - Afrique du Sud 426 4.4 44.4 534 4.8 25.5 706 5.9 32.0Brazil - Brésil 423 3.4 16.5 507 3.2 20.0 738 3.8 45.5Indonesia - Indonésie (6) 297 2.5 .. 367 2.8 23.8 181 1.6 -50.7Turkey - Turquie 288 1.3 -1.0 345 1.3 19.8 277 1.1 -19.7Panama 240 8.6 -18.0 198 6.1 -17.6 268 6.8 35.4Swaziland 105 42.2 7.8 151 53.2 43.7 33 11.6 -78.3China - Chine 94 0.2 -38.2 145 0.2 54.6 145 0.2 0.1Egypt - Égypte 74 0.5 -7.3 137 0.9 85.6 149 0.9 8.7Barbados - Barbade 80 6.5 8.4 117 8.0 46.9 .. .. ..Uruguay 53 4.8 -7.9 66 5.0 22.9 64 5.0 -3.1Malaysia - Malaisie 97 0.6 -11.0 60 0.3 -38.5 71 0.3 19.3Lebanon - Liban 40 0.4 48.5 58 0.5 46.2 58 0.5 -0.1Tunisia - Tunisie 55 1.5 0.5 58 1.4 4.1 66 1.5 13.9Côte d'Ivoire 53 6.9 11.6 54 6.5 2.0 .. .. ..Philippines 42 1.0 10.5 53 1.2 26.2 101 1.6 90.6
Republic of Korea - République de Corée 1 861 4.4 41.9 1 908 4.2 2.5 2 011 3.9 5.4Singapore - Singapour 495 1.1 152.1 624 1.2 25.9 730 1.2 17.1Indonesia - Indonésie (6) 221 1.8 .. 263 2.0 19.1 14 0.1 -94.9China, Hong Kong SAR - Chine (RAS de Hong Kong) 218 0.4 -36.0 245 0.4 12.5 (e)355 (e)0.5 (e)44.7China, Taiwan Province of - Province chinoise de Taiwan 290 1.1 34.9 234 0.9 -19.3 244 0.8 4.3Paraguay 208 33.1 7.5 219 31.6 5.2 236 29.3 8.1China - Chine 236 0.4 120.9 157 0.2 -33.4 205 0.2 29.9Egypt - Égypte 100 0.7 -17.2 136 0.9 36.0 138 0.9 1.5India - Inde (5) 53 0.1 119.2 131 0.2 148.4 112 0.1 -14.9Brazil - Brésil 114 0.9 5.9 102 0.6 -11.2 150 0.8 47.9Mexico - Mexique 92 0.7 8.9 70 0.4 -23.1 171 1.0 142.8Chile - Chili 48 0.8 6.6 54 0.8 11.5 55 0.7 2.2Argentina - Argentine 61 1.2 18.8 51 0.8 -16.7 71 0.9 39.9Angola 227 70.3 .. 49 28.0 -78.2 1 340 90.3 >200.0South Africa - Afrique du Sud 37 0.4 40.8 45 0.4 21.2 46 0.4 1.1Guyana 34 20.9 5.0 35 24.0 5.0 37 25.2 5.1Malaysia - Malaisie 42 0.2 104.6 27 0.1 -34.9 26 0.1 -3.2Lesotho 17 26.6 14.3 18 32.1 6.2 18 30.8 2.1Kenya 17 1.1 42.9 18 0.9 5.2 10 0.4 -43.5Thailand - Thaïlande 14 0.1 90.4 17 0.1 17.7 46 0.2 175.5
China, Hong Kong SAR - Chine (RAS de Hong Kong) 21 798 39.5 12.5 24 318 38.1 11.6 (e)48.9 (e)45.3China - Chine 19 952 32.0 14.5 23 283 31.3 16.7 28 973 31.5 24.4Singapore - Singapour 18 056 38.7 27.2 20 636 39.1 14.3 22 544 38.2 9.2India - Inde (5) 8 153 21.3 >200.0 14 634 26.2 79.5 23 198 30.8 58.5China, Taiwan Province of - Province chinoise de Taiwan 13 739 53.3 1.6 11 950 46.3 -13.0 14 779 50.5 23.7Republic of Korea - République de Corée 8 125 19.4 21.5 9 422 20.9 16.0 13 071 25.2 38.7Brazil - Brésil 4 938 39.2 19.5 6 722 41.9 36.1 8 568 44.0 27.5Saudi Arabia - Arabie saoudite 5 852 100.0 2.4 6 677 100.0 14.1 7 297 100.0 9.3Thailand - Thaïlande 3 952 20.8 2.5 4 998 24.8 26.5 5 255 21.8 5.1Lebanon - Liban 3 340 34.4 42.1 4 362 40.2 30.6 5 555 47.8 27.4Nigeria - Nigéria 2 637 79.0 -14.3 3 407 81.8 29.2 .. .. ..Indonesia - Indonésie (6) 2 669 22.2 .. 2 876 22.2 7.7 2 564 22.3 -10.8Malaysia - Malaisie 2 315 13.5 20.3 2 773 14.2 19.8 3 559 16.3 28.3Argentina - Argentine 1 194 22.6 25.2 1 593 24.7 33.5 1 860 24.3 16.7Egypt - Égypte 2 780 19.6 32.9 1 549 10.6 -44.3 1 337 8.3 -13.6Morocco - Maroc 904 13.5 40.6 1 129 13.9 24.9 1 380 14.0 22.3Chile - Chili 890 14.7 7.2 1 060 15.1 19.1 1 188 15.8 12.1South Africa - Afrique du Sud 742 7.7 22.7 837 7.5 12.8 868 7.2 3.7Netherlands Antilles - Antilles néerlandaises 644 35.8 3.4 647 35.0 0.6 .. .. ..Philippines 361 8.9 12.1 525 11.6 45.4 898 13.9 71.0
For sources and notes, see end of table. Pour les sources et les notes, se reporter à la fin du tableau.
OTHER BUSINESS SERVICES (4) - AUTRES SERVICES AUX ENTREPRISES (4)
FINANCIAL SERVICES - SERVICES FINANCIERS
ROYALTIES AND LICENSE FEES - REDEVANCES ET DROITS DE LICENCE
Ranking based on 2005 exports
Classement d'après les exportations de 2005
2004 2005 2006
5.2 Trade in services by category:Leading exporters among developingeconomies
5.2 Commerce des services par catégories :Principaux exportateurs parmi les économies en développement
(e)9 269
(e)35 337
256
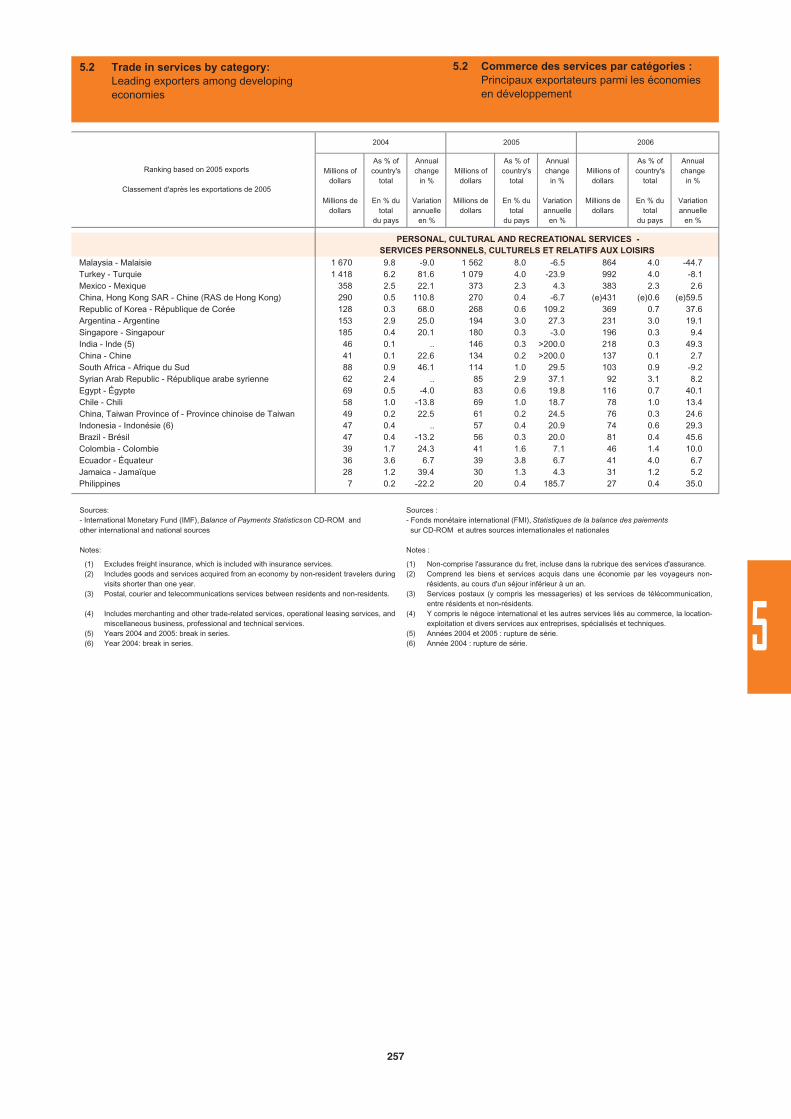
Millions of dollars
Millions dedollars
As % ofcountry's
total
En % du total
du pays
Annualchange
in %
Variationannuelle
en %
Millions of dollars
Millions dedollars
As % ofcountry's
total
En % du total
du pays
Annualchange
in %
Variationannuelle
en %
Millions of dollars
Millions dedollars
As % ofcountry's
total
En % du total
du pays
Annualchange
in %
Variationannuelle
en %
Malaysia - Malaisie 1 670 9.8 -9.0 1 562 8.0 -6.5 864 4.0 -44.7Turkey - Turquie 1 418 6.2 81.6 1 079 4.0 -23.9 992 4.0 -8.1Mexico - Mexique 358 2.5 22.1 373 2.3 4.3 383 2.3 2.6China, Hong Kong SAR - Chine (RAS de Hong Kong) 290 0.5 110.8 270 0.4 -6.7 (e)431 (e)0.6 (e)59.5Republic of Korea - République de Corée 128 0.3 68.0 268 0.6 109.2 369 0.7 37.6Argentina - Argentine 153 2.9 25.0 194 3.0 27.3 231 3.0 19.1Singapore - Singapour 185 0.4 20.1 180 0.3 -3.0 196 0.3 9.4India - Inde (5) 46 0.1 .. 146 0.3 >200.0 218 0.3 49.3China - Chine 41 0.1 22.6 134 0.2 >200.0 137 0.1 2.7South Africa - Afrique du Sud 88 0.9 46.1 114 1.0 29.5 103 0.9 -9.2Syrian Arab Republic - République arabe syrienne 62 2.4 .. 85 2.9 37.1 92 3.1 8.2Egypt - Égypte 69 0.5 -4.0 83 0.6 19.8 116 0.7 40.1Chile - Chili 58 1.0 -13.8 69 1.0 18.7 78 1.0 13.4China, Taiwan Province of - Province chinoise de Taiwan 49 0.2 22.5 61 0.2 24.5 76 0.3 24.6Indonesia - Indonésie (6) 47 0.4 .. 57 0.4 20.9 74 0.6 29.3Brazil - Brésil 47 0.4 -13.2 56 0.3 20.0 81 0.4 45.6Colombia - Colombie 39 1.7 24.3 41 1.6 7.1 46 1.4 10.0Ecuador - Équateur 36 3.6 6.7 39 3.8 6.7 41 4.0 6.7Jamaica - Jamaïque 28 1.2 39.4 30 1.3 4.3 31 1.2 5.2Philippines 7 0.2 -22.2 20 0.4 185.7 27 0.4 35.0
PERSONAL, CULTURAL AND RECREATIONAL SERVICES -SERVICES PERSONNELS, CULTURELS ET RELATIFS AUX LOISIRS
Ranking based on 2005 exports
Classement d'après les exportations de 2005
2004 2005 2006
5.2 Trade in services by category:Leading exporters among developingeconomies
5.2 Commerce des services par catégories :Principaux exportateurs parmi les économies en développement
(1)(2)
(3)
(4)
(5)(6)
Excludes freight insurance, which is included with insurance services.Includes goods and services acquired from an economy by non-resident travelers duringvisits shorter than one year.Postal, courier and telecommunications services between residents and non-residents.
Includes merchanting and other trade-related services, operational leasing services, andmiscellaneous business, professional and technical services.Years 2004 and 2005: break in series.Year 2004: break in series.
Sources:- International Monetary Fund (IMF), Balance of Payments Statisticson CD-ROM and other international and national sources
Notes:
(1)(2)
(3)
(4)
(5)(6)
Non-comprise l'assurance du fret, incluse dans la rubrique des services d'assurance.Comprend les biens et services acquis dans une économie par les voyageurs non-résidents, au cours d'un séjour inférieur à un an.Services postaux (y compris les messageries) et les services de télécommunication,entre résidents et non-résidents.Y compris le négoce international et les autres services liés au commerce, la location-exploitation et divers services aux entreprises, spécialisés et techniques.Années 2004 et 2005 : rupture de série.Année 2004 : rupture de série.
Sources : - Fonds monétaire international (FMI), Statistiques de la balance des paiements sur CD-ROM et autres sources internationales et nationales
Notes :
257
5
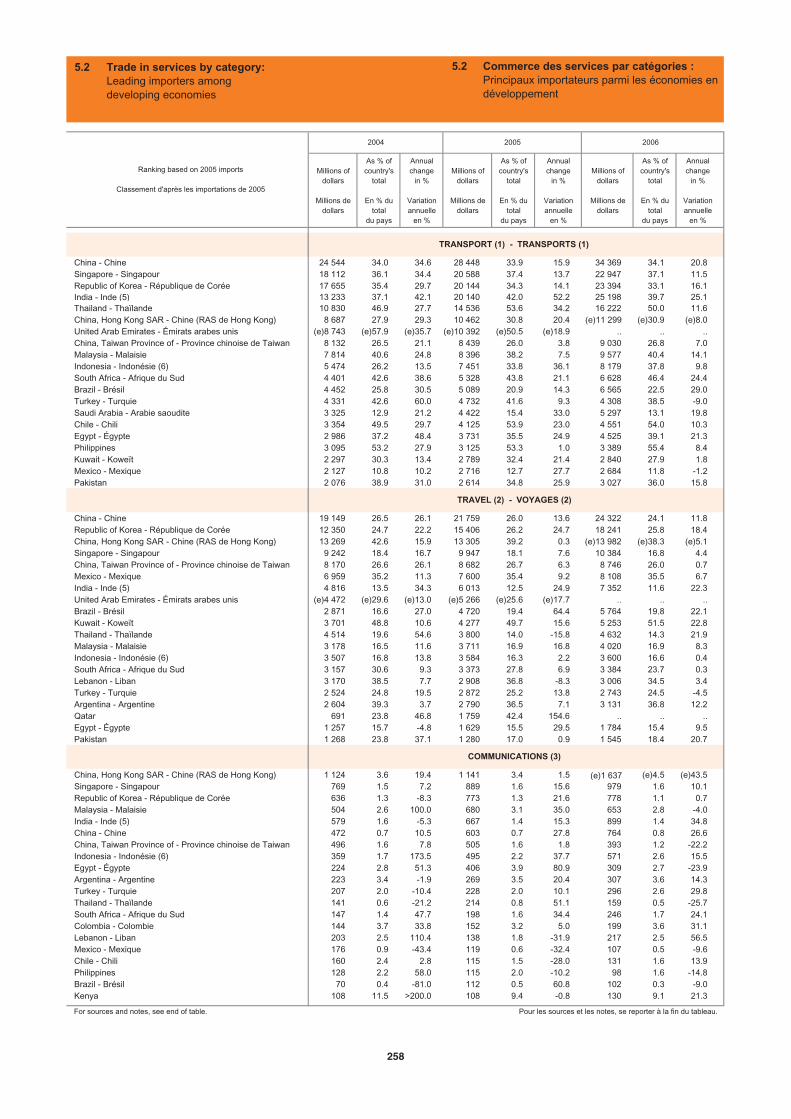
Millions of dollars
Millions dedollars
As % ofcountry's
total
En % du total
du pays
Annualchange
in %
Variationannuelle
en %
Millions of dollars
Millions dedollars
As % ofcountry's
total
En % du total
du pays
Annualchange
in %
Variationannuelle
en %
Millions of dollars
Millions dedollars
As % ofcountry's
total
En % du total
du pays
Annualchange
in %
Variationannuelle
en %
China - Chine 24 544 34.0 34.6 28 448 33.9 15.9 34 369 34.1 20.8Singapore - Singapour 18 112 36.1 34.4 20 588 37.4 13.7 22 947 37.1 11.5Republic of Korea - République de Corée 17 655 35.4 29.7 20 144 34.3 14.1 23 394 33.1 16.1India - Inde (5) 13 233 37.1 42.1 20 140 42.0 52.2 25 198 39.7 25.1Thailand - Thaïlande 10 830 46.9 27.7 14 536 53.6 34.2 16 222 50.0 11.6China, Hong Kong SAR - Chine (RAS de Hong Kong) 8 687 27.9 29.3 10 462 30.8 20.4 (e)30.9 (e)8.0United Arab Emirates - Émirats arabes unis (e)57.9 (e)35.7 (e)50.5 (e)18.9 .. .. ..China, Taiwan Province of - Province chinoise de Taiwan 8 132 26.5 21.1 8 439 26.0 3.8 9 030 26.8 7.0Malaysia - Malaisie 7 814 40.6 24.8 8 396 38.2 7.5 9 577 40.4 14.1Indonesia - Indonésie (6) 5 474 26.2 13.5 7 451 33.8 36.1 8 179 37.8 9.8South Africa - Afrique du Sud 4 401 42.6 38.6 5 328 43.8 21.1 6 628 46.4 24.4Brazil - Brésil 4 452 25.8 30.5 5 089 20.9 14.3 6 565 22.5 29.0Turkey - Turquie 4 331 42.6 60.0 4 732 41.6 9.3 4 308 38.5 -9.0Saudi Arabia - Arabie saoudite 3 325 12.9 21.2 4 422 15.4 33.0 5 297 13.1 19.8Chile - Chili 3 354 49.5 29.7 4 125 53.9 23.0 4 551 54.0 10.3Egypt - Égypte 2 986 37.2 48.4 3 731 35.5 24.9 4 525 39.1 21.3Philippines 3 095 53.2 27.9 3 125 53.3 1.0 3 389 55.4 8.4Kuwait - Koweït 2 297 30.3 13.4 2 789 32.4 21.4 2 840 27.9 1.8Mexico - Mexique 2 127 10.8 10.2 2 716 12.7 27.7 2 684 11.8 -1.2Pakistan 2 076 38.9 31.0 2 614 34.8 25.9 3 027 36.0 15.8
China - Chine 19 149 26.5 26.1 21 759 26.0 13.6 24 322 24.1 11.8Republic of Korea - République de Corée 12 350 24.7 22.2 15 406 26.2 24.7 18 241 25.8 18.4China, Hong Kong SAR - Chine (RAS de Hong Kong) 13 269 42.6 15.9 13 305 39.2 0.3 (e)38.3 (e)5.1Singapore - Singapour 9 242 18.4 16.7 9 947 18.1 7.6 10 384 16.8 4.4China, Taiwan Province of - Province chinoise de Taiwan 8 170 26.6 26.1 8 682 26.7 6.3 8 746 26.0 0.7Mexico - Mexique 6 959 35.2 11.3 7 600 35.4 9.2 8 108 35.5 6.7India - Inde (5) 4 816 13.5 34.3 6 013 12.5 24.9 7 352 11.6 22.3United Arab Emirates - Émirats arabes unis (e)29.6 (e)13.0 (e)25.6 (e)17.7 .. .. ..Brazil - Brésil 2 871 16.6 27.0 4 720 19.4 64.4 5 764 19.8 22.1Kuwait - Koweït 3 701 48.8 10.6 4 277 49.7 15.6 5 253 51.5 22.8Thailand - Thaïlande 4 514 19.6 54.6 3 800 14.0 -15.8 4 632 14.3 21.9Malaysia - Malaisie 3 178 16.5 11.6 3 711 16.9 16.8 4 020 16.9 8.3Indonesia - Indonésie (6) 3 507 16.8 13.8 3 584 16.3 2.2 3 600 16.6 0.4South Africa - Afrique du Sud 3 157 30.6 9.3 3 373 27.8 6.9 3 384 23.7 0.3Lebanon - Liban 3 170 38.5 7.7 2 908 36.8 -8.3 3 006 34.5 3.4Turkey - Turquie 2 524 24.8 19.5 2 872 25.2 13.8 2 743 24.5 -4.5Argentina - Argentine 2 604 39.3 3.7 2 790 36.5 7.1 3 131 36.8 12.2Qatar 691 23.8 46.8 1 759 42.4 154.6 .. .. ..Egypt - Égypte 1 257 15.7 -4.8 1 629 15.5 29.5 1 784 15.4 9.5Pakistan 1 268 23.8 37.1 1 280 17.0 0.9 1 545 18.4 20.7
China, Hong Kong SAR - Chine (RAS de Hong Kong) 1 124 3.6 19.4 1 141 3.4 1.5 (e)4.5 (e)43.5Singapore - Singapour 769 1.5 7.2 889 1.6 15.6 979 1.6 10.1Republic of Korea - République de Corée 636 1.3 -8.3 773 1.3 21.6 778 1.1 0.7Malaysia - Malaisie 504 2.6 100.0 680 3.1 35.0 653 2.8 -4.0India - Inde (5) 579 1.6 -5.3 667 1.4 15.3 899 1.4 34.8China - Chine 472 0.7 10.5 603 0.7 27.8 764 0.8 26.6China, Taiwan Province of - Province chinoise de Taiwan 496 1.6 7.8 505 1.6 1.8 393 1.2 -22.2Indonesia - Indonésie (6) 359 1.7 173.5 495 2.2 37.7 571 2.6 15.5Egypt - Égypte 224 2.8 51.3 406 3.9 80.9 309 2.7 -23.9Argentina - Argentine 223 3.4 -1.9 269 3.5 20.4 307 3.6 14.3Turkey - Turquie 207 2.0 -10.4 228 2.0 10.1 296 2.6 29.8Thailand - Thaïlande 141 0.6 -21.2 214 0.8 51.1 159 0.5 -25.7South Africa - Afrique du Sud 147 1.4 47.7 198 1.6 34.4 246 1.7 24.1Colombia - Colombie 144 3.7 33.8 152 3.2 5.0 199 3.6 31.1Lebanon - Liban 203 2.5 110.4 138 1.8 -31.9 217 2.5 56.5Mexico - Mexique 176 0.9 -43.4 119 0.6 -32.4 107 0.5 -9.6Chile - Chili 160 2.4 2.8 115 1.5 -28.0 131 1.6 13.9Philippines 128 2.2 58.0 115 2.0 -10.2 98 1.6 -14.8Brazil - Brésil 70 0.4 -81.0 112 0.5 60.8 102 0.3 -9.0Kenya 108 11.5 >200.0 108 9.4 -0.8 130 9.1 21.3
For sources and notes, see end of table. Pour les sources et les notes, se reporter à la fin du tableau.
2004 2005 2006
Ranking based on 2005 imports
Classement d'après les importations de 2005
TRANSPORT (1) - TRANSPORTS (1)
TRAVEL (2) - VOYAGES (2)
COMMUNICATIONS (3)
5.2 Trade in services by category:Leading importers among developing economies
5.2 Commerce des services par catégories :Principaux importateurs parmi les économies en développement
(e)11 299(e)8 743 (e)10 392
(e)13 982
(e)4 472 (e)5 266
(e)1 637
258
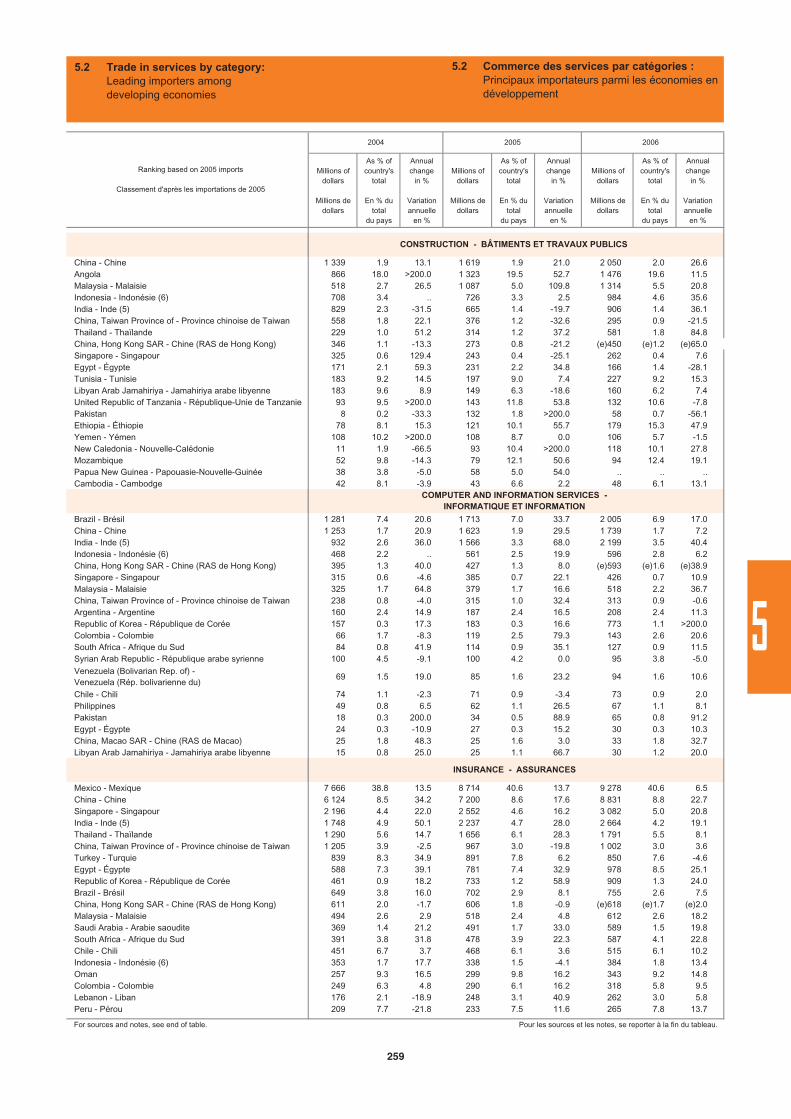
Millions of dollars
Millions dedollars
As % ofcountry's
total
En % du total
du pays
Annualchange
in %
Variationannuelle
en %
Millions of dollars
Millions dedollars
As % ofcountry's
total
En % du total
du pays
Annualchange
in %
Variationannuelle
en %
Millions of dollars
Millions dedollars
As % ofcountry's
total
En % du total
du pays
Annualchange
in %
Variationannuelle
en %
China - Chine 1 339 1.9 13.1 1 619 1.9 21.0 2 050 2.0 26.6Angola 866 18.0 >200.0 1 323 19.5 52.7 1 476 19.6 11.5Malaysia - Malaisie 518 2.7 26.5 1 087 5.0 109.8 1 314 5.5 20.8Indonesia - Indonésie (6) 708 3.4 .. 726 3.3 2.5 984 4.6 35.6India - Inde (5) 829 2.3 -31.5 665 1.4 -19.7 906 1.4 36.1China, Taiwan Province of - Province chinoise de Taiwan 558 1.8 22.1 376 1.2 -32.6 295 0.9 -21.5Thailand - Thaïlande 229 1.0 51.2 314 1.2 37.2 581 1.8 84.8China, Hong Kong SAR - Chine (RAS de Hong Kong) 346 1.1 -13.3 273 0.8 -21.2 (e)450 (e)1.2 (e)65.0Singapore - Singapour 325 0.6 129.4 243 0.4 -25.1 262 0.4 7.6Egypt - Égypte 171 2.1 59.3 231 2.2 34.8 166 1.4 -28.1Tunisia - Tunisie 183 9.2 14.5 197 9.0 7.4 227 9.2 15.3Libyan Arab Jamahiriya - Jamahiriya arabe libyenne 183 9.6 8.9 149 6.3 -18.6 160 6.2 7.4United Republic of Tanzania - République-Unie de Tanzanie 93 9.5 >200.0 143 11.8 53.8 132 10.6 -7.8Pakistan 8 0.2 -33.3 132 1.8 >200.0 58 0.7 -56.1Ethiopia - Éthiopie 78 8.1 15.3 121 10.1 55.7 179 15.3 47.9Yemen - Yémen 108 10.2 >200.0 108 8.7 0.0 106 5.7 -1.5New Caledonia - Nouvelle-Calédonie 11 1.9 -66.5 93 10.4 >200.0 118 10.1 27.8Mozambique 52 9.8 -14.3 79 12.1 50.6 94 12.4 19.1Papua New Guinea - Papouasie-Nouvelle-Guinée 38 3.8 -5.0 58 5.0 54.0 .. .. ..Cambodia - Cambodge 42 8.1 -3.9 43 6.6 2.2 48 6.1 13.1
Brazil - Brésil 1 281 7.4 20.6 1 713 7.0 33.7 2 005 6.9 17.0China - Chine 1 253 1.7 20.9 1 623 1.9 29.5 1 739 1.7 7.2India - Inde (5) 932 2.6 36.0 1 566 3.3 68.0 2 199 3.5 40.4Indonesia - Indonésie (6) 468 2.2 .. 561 2.5 19.9 596 2.8 6.2China, Hong Kong SAR - Chine (RAS de Hong Kong) 395 1.3 40.0 427 1.3 8.0 (e)593 (e)1.6 (e)38.9Singapore - Singapour 315 0.6 -4.6 385 0.7 22.1 426 0.7 10.9Malaysia - Malaisie 325 1.7 64.8 379 1.7 16.6 518 2.2 36.7China, Taiwan Province of - Province chinoise de Taiwan 238 0.8 -4.0 315 1.0 32.4 313 0.9 -0.6Argentina - Argentine 160 2.4 14.9 187 2.4 16.5 208 2.4 11.3Republic of Korea - République de Corée 157 0.3 17.3 183 0.3 16.6 773 1.1 >200.0Colombia - Colombie 66 1.7 -8.3 119 2.5 79.3 143 2.6 20.6South Africa - Afrique du Sud 84 0.8 41.9 114 0.9 35.1 127 0.9 11.5Syrian Arab Republic - République arabe syrienne 100 4.5 -9.1 100 4.2 0.0 95 3.8 -5.0Venezuela (Bolivarian Rep. of) - Venezuela (Rép. bolivarienne du)
69 1.5 19.0 85 1.6 23.2 94 1.6 10.6
Chile - Chili 74 1.1 -2.3 71 0.9 -3.4 73 0.9 2.0Philippines 49 0.8 6.5 62 1.1 26.5 67 1.1 8.1Pakistan 18 0.3 200.0 34 0.5 88.9 65 0.8 91.2Egypt - Égypte 24 0.3 -10.9 27 0.3 15.2 30 0.3 10.3China, Macao SAR - Chine (RAS de Macao) 25 1.8 48.3 25 1.6 3.0 33 1.8 32.7Libyan Arab Jamahiriya - Jamahiriya arabe libyenne 15 0.8 25.0 25 1.1 66.7 30 1.2 20.0
Mexico - Mexique 7 666 38.8 13.5 8 714 40.6 13.7 9 278 40.6 6.5China - Chine 6 124 8.5 34.2 7 200 8.6 17.6 8 831 8.8 22.7Singapore - Singapour 2 196 4.4 22.0 2 552 4.6 16.2 3 082 5.0 20.8India - Inde (5) 1 748 4.9 50.1 2 237 4.7 28.0 2 664 4.2 19.1Thailand - Thaïlande 1 290 5.6 14.7 1 656 6.1 28.3 1 791 5.5 8.1China, Taiwan Province of - Province chinoise de Taiwan 1 205 3.9 -2.5 967 3.0 -19.8 1 002 3.0 3.6Turkey - Turquie 839 8.3 34.9 891 7.8 6.2 850 7.6 -4.6Egypt - Égypte 588 7.3 39.1 781 7.4 32.9 978 8.5 25.1Republic of Korea - République de Corée 461 0.9 18.2 733 1.2 58.9 909 1.3 24.0Brazil - Brésil 649 3.8 16.0 702 2.9 8.1 755 2.6 7.5China, Hong Kong SAR - Chine (RAS de Hong Kong) 611 2.0 -1.7 606 1.8 -0.9 (e)618 (e)1.7 (e)2.0Malaysia - Malaisie 494 2.6 2.9 518 2.4 4.8 612 2.6 18.2Saudi Arabia - Arabie saoudite 369 1.4 21.2 491 1.7 33.0 589 1.5 19.8South Africa - Afrique du Sud 391 3.8 31.8 478 3.9 22.3 587 4.1 22.8Chile - Chili 451 6.7 3.7 468 6.1 3.6 515 6.1 10.2Indonesia - Indonésie (6) 353 1.7 17.7 338 1.5 -4.1 384 1.8 13.4Oman 257 9.3 16.5 299 9.8 16.2 343 9.2 14.8Colombia - Colombie 249 6.3 4.8 290 6.1 16.2 318 5.8 9.5Lebanon - Liban 176 2.1 -18.9 248 3.1 40.9 262 3.0 5.8Peru - Pérou 209 7.7 -21.8 233 7.5 11.6 265 7.8 13.7
For sources and notes, see end of table. Pour les sources et les notes, se reporter à la fin du tableau.
2006
COMPUTER AND INFORMATION SERVICES - INFORMATIQUE ET INFORMATION
INSURANCE - ASSURANCES
CONSTRUCTION - BÂTIMENTS ET TRAVAUX PUBLICS
Ranking based on 2005 imports
Classement d'après les importations de 2005
2004 2005
5.2 Trade in services by category:Leading importers among developing economies
5.2 Commerce des services par catégories :Principaux importateurs parmi les économies en développement
259
5
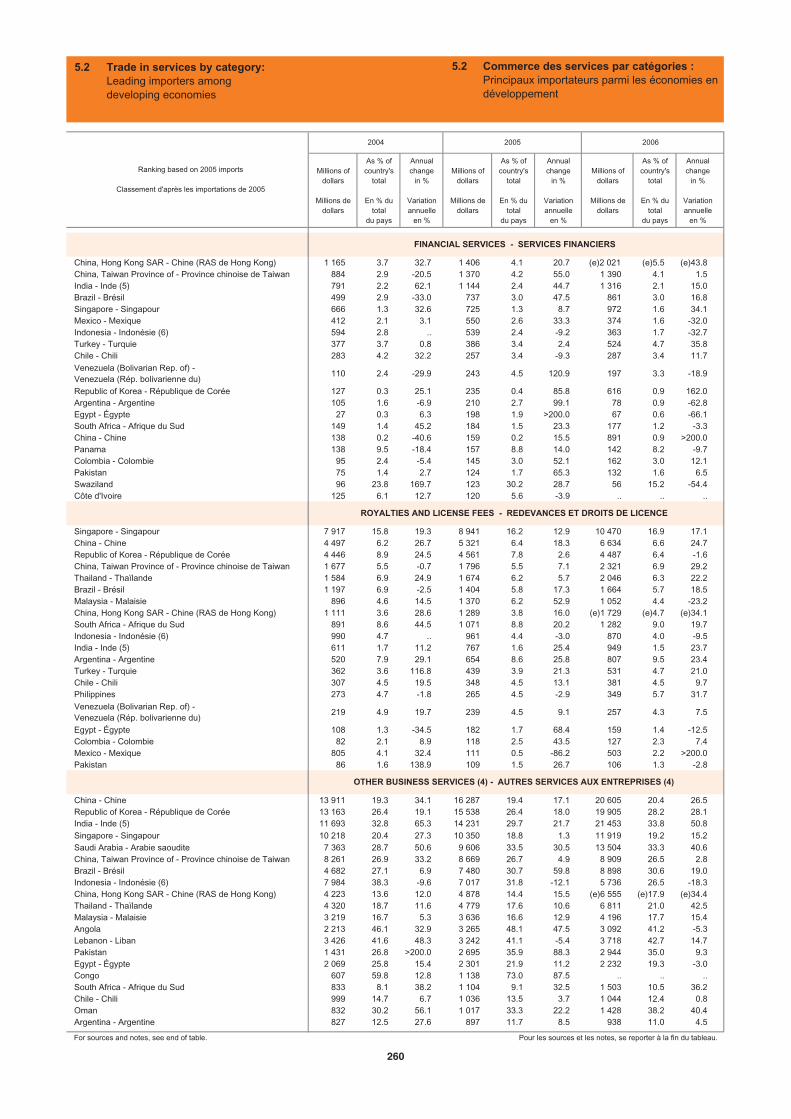
Millions of dollars
Millions dedollars
As % ofcountry's
total
En % du total
du pays
Annualchange
in %
Variationannuelle
en %
Millions of dollars
Millions dedollars
As % ofcountry's
total
En % du total
du pays
Annualchange
in %
Variationannuelle
en %
Millions of dollars
Millions dedollars
As % ofcountry's
total
En % du total
du pays
Annualchange
in %
Variationannuelle
en %
China, Hong Kong SAR - Chine (RAS de Hong Kong) 1 165 3.7 32.7 1 406 4.1 20.7 (e)5.5 (e)43.8China, Taiwan Province of - Province chinoise de Taiwan 884 2.9 -20.5 1 370 4.2 55.0 1 390 4.1 1.5India - Inde (5) 791 2.2 62.1 1 144 2.4 44.7 1 316 2.1 15.0Brazil - Brésil 499 2.9 -33.0 737 3.0 47.5 861 3.0 16.8Singapore - Singapour 666 1.3 32.6 725 1.3 8.7 972 1.6 34.1Mexico - Mexique 412 2.1 3.1 550 2.6 33.3 374 1.6 -32.0Indonesia - Indonésie (6) 594 2.8 .. 539 2.4 -9.2 363 1.7 -32.7Turkey - Turquie 377 3.7 0.8 386 3.4 2.4 524 4.7 35.8Chile - Chili 283 4.2 32.2 257 3.4 -9.3 287 3.4 11.7Venezuela (Bolivarian Rep. of) - Venezuela (Rép. bolivarienne du)
110 2.4 -29.9 243 4.5 120.9 197 3.3 -18.9
Republic of Korea - République de Corée 127 0.3 25.1 235 0.4 85.8 616 0.9 162.0Argentina - Argentine 105 1.6 -6.9 210 2.7 99.1 78 0.9 -62.8Egypt - Égypte 27 0.3 6.3 198 1.9 >200.0 67 0.6 -66.1South Africa - Afrique du Sud 149 1.4 45.2 184 1.5 23.3 177 1.2 -3.3China - Chine 138 0.2 -40.6 159 0.2 15.5 891 0.9 >200.0Panama 138 9.5 -18.4 157 8.8 14.0 142 8.2 -9.7Colombia - Colombie 95 2.4 -5.4 145 3.0 52.1 162 3.0 12.1Pakistan 75 1.4 2.7 124 1.7 65.3 132 1.6 6.5Swaziland 96 23.8 169.7 123 30.2 28.7 56 15.2 -54.4Côte d'Ivoire 125 6.1 12.7 120 5.6 -3.9 .. .. ..
Singapore - Singapour 7 917 15.8 19.3 8 941 16.2 12.9 10 470 16.9 17.1China - Chine 4 497 6.2 26.7 5 321 6.4 18.3 6 634 6.6 24.7Republic of Korea - République de Corée 4 446 8.9 24.5 4 561 7.8 2.6 4 487 6.4 -1.6China, Taiwan Province of - Province chinoise de Taiwan 1 677 5.5 -0.7 1 796 5.5 7.1 2 321 6.9 29.2Thailand - Thaïlande 1 584 6.9 24.9 1 674 6.2 5.7 2 046 6.3 22.2Brazil - Brésil 1 197 6.9 -2.5 1 404 5.8 17.3 1 664 5.7 18.5Malaysia - Malaisie 896 4.6 14.5 1 370 6.2 52.9 1 052 4.4 -23.2China, Hong Kong SAR - Chine (RAS de Hong Kong) 1 111 3.6 28.6 1 289 3.8 16.0 (e)4.7 (e)34.1South Africa - Afrique du Sud 891 8.6 44.5 1 071 8.8 20.2 1 282 9.0 19.7Indonesia - Indonésie (6) 990 4.7 .. 961 4.4 -3.0 870 4.0 -9.5India - Inde (5) 611 1.7 11.2 767 1.6 25.4 949 1.5 23.7Argentina - Argentine 520 7.9 29.1 654 8.6 25.8 807 9.5 23.4Turkey - Turquie 362 3.6 116.8 439 3.9 21.3 531 4.7 21.0Chile - Chili 307 4.5 19.5 348 4.5 13.1 381 4.5 9.7Philippines 273 4.7 -1.8 265 4.5 -2.9 349 5.7 31.7Venezuela (Bolivarian Rep. of) - Venezuela (Rép. bolivarienne du)
219 4.9 19.7 239 4.5 9.1 257 4.3 7.5
Egypt - Égypte 108 1.3 -34.5 182 1.7 68.4 159 1.4 -12.5Colombia - Colombie 82 2.1 8.9 118 2.5 43.5 127 2.3 7.4Mexico - Mexique 805 4.1 32.4 111 0.5 -86.2 503 2.2 >200.0Pakistan 86 1.6 138.9 109 1.5 26.7 106 1.3 -2.8
China - Chine 13 911 19.3 34.1 16 287 19.4 17.1 20 605 20.4 26.5Republic of Korea - République de Corée 13 163 26.4 19.1 15 538 26.4 18.0 19 905 28.2 28.1India - Inde (5) 11 693 32.8 65.3 14 231 29.7 21.7 21 453 33.8 50.8Singapore - Singapour 10 218 20.4 27.3 10 350 18.8 1.3 11 919 19.2 15.2Saudi Arabia - Arabie saoudite 7 363 28.7 50.6 9 606 33.5 30.5 13 504 33.3 40.6China, Taiwan Province of - Province chinoise de Taiwan 8 261 26.9 33.2 8 669 26.7 4.9 8 909 26.5 2.8Brazil - Brésil 4 682 27.1 6.9 7 480 30.7 59.8 8 898 30.6 19.0Indonesia - Indonésie (6) 7 984 38.3 -9.6 7 017 31.8 -12.1 5 736 26.5 -18.3China, Hong Kong SAR - Chine (RAS de Hong Kong) 4 223 13.6 12.0 4 878 14.4 15.5 (e)17.9 (e)34.4Thailand - Thaïlande 4 320 18.7 11.6 4 779 17.6 10.6 6 811 21.0 42.5Malaysia - Malaisie 3 219 16.7 5.3 3 636 16.6 12.9 4 196 17.7 15.4Angola 2 213 46.1 32.9 3 265 48.1 47.5 3 092 41.2 -5.3Lebanon - Liban 3 426 41.6 48.3 3 242 41.1 -5.4 3 718 42.7 14.7Pakistan 1 431 26.8 >200.0 2 695 35.9 88.3 2 944 35.0 9.3Egypt - Égypte 2 069 25.8 15.4 2 301 21.9 11.2 2 232 19.3 -3.0Congo 607 59.8 12.8 1 138 73.0 87.5 .. .. ..South Africa - Afrique du Sud 833 8.1 38.2 1 104 9.1 32.5 1 503 10.5 36.2Chile - Chili 999 14.7 6.7 1 036 13.5 3.7 1 044 12.4 0.8Oman 832 30.2 56.1 1 017 33.3 22.2 1 428 38.2 40.4Argentina - Argentine 827 12.5 27.6 897 11.7 8.5 938 11.0 4.5
For sources and notes, see end of table. Pour les sources et les notes, se reporter à la fin du tableau.
Ranking based on 2005 imports
Classement d'après les importations de 2005
2004 2005 2006
OTHER BUSINESS SERVICES (4) - AUTRES SERVICES AUX ENTREPRISES (4)
FINANCIAL SERVICES - SERVICES FINANCIERS
ROYALTIES AND LICENSE FEES - REDEVANCES ET DROITS DE LICENCE
5.2 Trade in services by category:Leading importers among developing economies
5.2 Commerce des services par catégories :Principaux importateurs parmi les économies en développement
(e)2 021
(e)1 729
(e)6 555
260
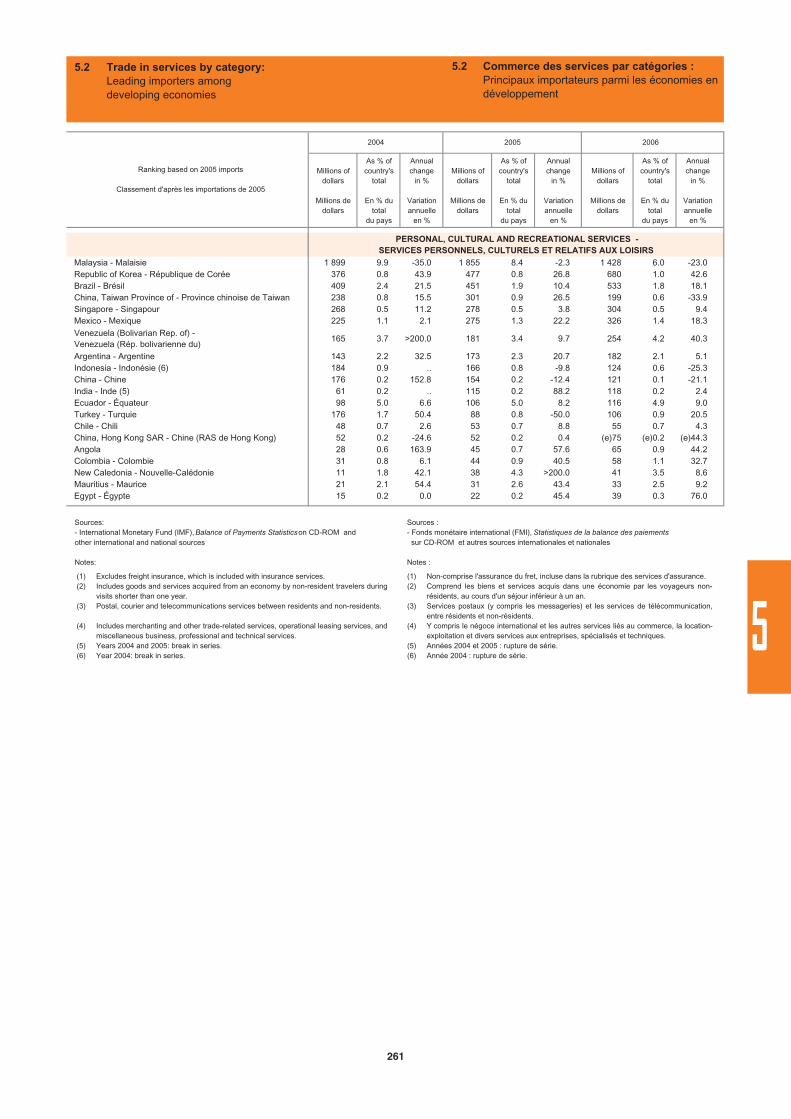
Millions of dollars
Millions dedollars
As % ofcountry's
total
En % du total
du pays
Annualchange
in %
Variationannuelle
en %
Millions of dollars
Millions dedollars
As % ofcountry's
total
En % du total
du pays
Annualchange
in %
Variationannuelle
en %
Millions of dollars
Millions dedollars
As % ofcountry's
total
En % du total
du pays
Annualchange
in %
Variationannuelle
en %
Malaysia - Malaisie 1 899 9.9 -35.0 1 855 8.4 -2.3 1 428 6.0 -23.0Republic of Korea - République de Corée 376 0.8 43.9 477 0.8 26.8 680 1.0 42.6Brazil - Brésil 409 2.4 21.5 451 1.9 10.4 533 1.8 18.1China, Taiwan Province of - Province chinoise de Taiwan 238 0.8 15.5 301 0.9 26.5 199 0.6 -33.9Singapore - Singapour 268 0.5 11.2 278 0.5 3.8 304 0.5 9.4Mexico - Mexique 225 1.1 2.1 275 1.3 22.2 326 1.4 18.3Venezuela (Bolivarian Rep. of) - Venezuela (Rép. bolivarienne du)
165 3.7 >200.0 181 3.4 9.7 254 4.2 40.3
Argentina - Argentine 143 2.2 32.5 173 2.3 20.7 182 2.1 5.1Indonesia - Indonésie (6) 184 0.9 .. 166 0.8 -9.8 124 0.6 -25.3China - Chine 176 0.2 152.8 154 0.2 -12.4 121 0.1 -21.1India - Inde (5) 61 0.2 .. 115 0.2 88.2 118 0.2 2.4Ecuador - Équateur 98 5.0 6.6 106 5.0 8.2 116 4.9 9.0Turkey - Turquie 176 1.7 50.4 88 0.8 -50.0 106 0.9 20.5Chile - Chili 48 0.7 2.6 53 0.7 8.8 55 0.7 4.3China, Hong Kong SAR - Chine (RAS de Hong Kong) 52 0.2 -24.6 52 0.2 0.4 (e)75 (e)0.2 (e)44.3Angola 28 0.6 163.9 45 0.7 57.6 65 0.9 44.2Colombia - Colombie 31 0.8 6.1 44 0.9 40.5 58 1.1 32.7New Caledonia - Nouvelle-Calédonie 11 1.8 42.1 38 4.3 >200.0 41 3.5 8.6Mauritius - Maurice 21 2.1 54.4 31 2.6 43.4 33 2.5 9.2Egypt - Égypte 15 0.2 0.0 22 0.2 45.4 39 0.3 76.0
Ranking based on 2005 imports
Classement d'après les importations de 2005
2004 2005 2006
PERSONAL, CULTURAL AND RECREATIONAL SERVICES -SERVICES PERSONNELS, CULTURELS ET RELATIFS AUX LOISIRS
5.2 Trade in services by category:Leading importers among developing economies
5.2 Commerce des services par catégories :Principaux importateurs parmi les économies en développement
(1)(2)
(3)
(4)
(5)(6)
Excludes freight insurance, which is included with insurance services.Includes goods and services acquired from an economy by non-resident travelers duringvisits shorter than one year.Postal, courier and telecommunications services between residents and non-residents.
Includes merchanting and other trade-related services, operational leasing services, andmiscellaneous business, professional and technical services.Years 2004 and 2005: break in series.Year 2004: break in series.
Sources:- International Monetary Fund (IMF), Balance of Payments Statisticson CD-ROM and other international and national sources
Notes:
(1)(2)
(3)
(4)
(5)(6)
Non-comprise l'assurance du fret, incluse dans la rubrique des services d'assurance.Comprend les biens et services acquis dans une économie par les voyageurs non-résidents, au cours d'un séjour inférieur à un an.Services postaux (y compris les messageries) et les services de télécommunication,entre résidents et non-résidents.Y compris le négoce international et les autres services liés au commerce, la location-exploitation et divers services aux entreprises, spécialisés et techniques.Années 2004 et 2005 : rupture de série.Année 2004 : rupture de série.
Sources : - Fonds monétaire international (FMI), Statistiques de la balance des paiements sur CD-ROM et autres sources internationales et nationales
Notes :
261
5
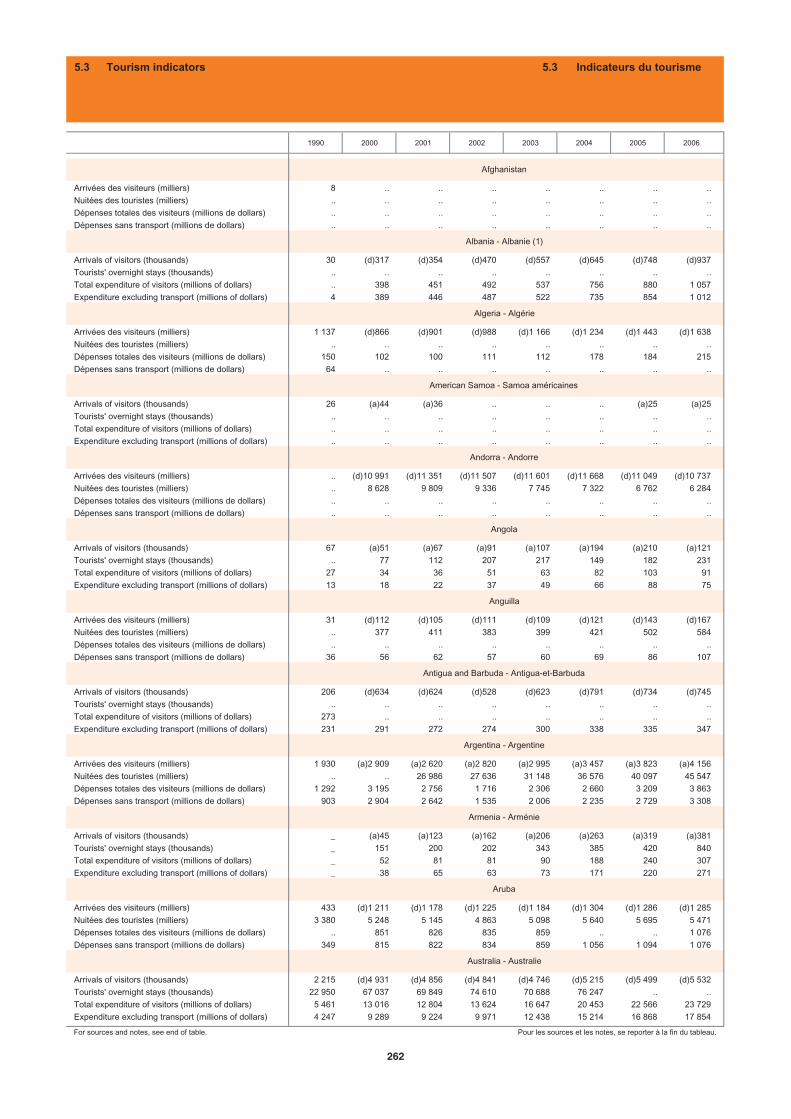
1990 2000 2001 2002 2003 2004 2005 2006
Arrivées des visiteurs (milliers) 8 .. .. .. .. .. .. ..Nuitées des touristes (milliers) .. .. .. .. .. .. .. ..Dépenses totales des visiteurs (millions de dollars) .. .. .. .. .. .. .. ..Dépenses sans transport (millions de dollars) .. .. .. .. .. .. .. ..
Arrivals of visitors (thousands) 30 (d)317 (d)354 (d)470 (d)557 (d)645 (d)748 (d)937Tourists' overnight stays (thousands) .. .. .. .. .. .. .. ..Total expenditure of visitors (millions of dollars) .. 398 451 492 537 756 880 1 057Expenditure excluding transport (millions of dollars) 4 389 446 487 522 735 854 1 012
Arrivées des visiteurs (milliers) 1 137 (d)866 (d)901 (d)988 (d)1 166 (d)1 234 (d)1 443 (d)1 638Nuitées des touristes (milliers) .. .. .. .. .. .. .. ..Dépenses totales des visiteurs (millions de dollars) 150 102 100 111 112 178 184 215Dépenses sans transport (millions de dollars) 64 .. .. .. .. .. .. ..
Arrivals of visitors (thousands) 26 (a)44 (a)36 .. .. .. (a)25 (a)25Tourists' overnight stays (thousands) .. .. .. .. .. .. .. ..Total expenditure of visitors (millions of dollars) .. .. .. .. .. .. .. ..Expenditure excluding transport (millions of dollars) .. .. .. .. .. .. .. ..
Arrivées des visiteurs (milliers) .. (d)10 991 (d)11 351 (d)11 507 (d)11 601 (d)11 668 (d)11 049 (d)10 737Nuitées des touristes (milliers) .. 8 628 9 809 9 336 7 745 7 322 6 762 6 284Dépenses totales des visiteurs (millions de dollars) .. .. .. .. .. .. .. ..Dépenses sans transport (millions de dollars) .. .. .. .. .. .. .. ..
Arrivals of visitors (thousands) 67 (a)51 (a)67 (a)91 (a)107 (a)194 (a)210 (a)121Tourists' overnight stays (thousands) .. 77 112 207 217 149 182 231Total expenditure of visitors (millions of dollars) 27 34 36 51 63 82 103 91Expenditure excluding transport (millions of dollars) 13 18 22 37 49 66 88 75
Arrivées des visiteurs (milliers) 31 (d)112 (d)105 (d)111 (d)109 (d)121 (d)143 (d)167Nuitées des touristes (milliers) .. 377 411 383 399 421 502 584Dépenses totales des visiteurs (millions de dollars) .. .. .. .. .. .. .. ..Dépenses sans transport (millions de dollars) 36 56 62 57 60 69 86 107
Arrivals of visitors (thousands) 206 (d)634 (d)624 (d)528 (d)623 (d)791 (d)734 (d)745Tourists' overnight stays (thousands) .. .. .. .. .. .. .. ..Total expenditure of visitors (millions of dollars) 273 .. .. .. .. .. .. ..Expenditure excluding transport (millions of dollars) 231 291 272 274 300 338 335 347
Arrivées des visiteurs (milliers) 1 930 (a)2 909 (a)2 620 (a)2 820 (a)2 995 (a)3 457 (a)3 823 (a)4 156Nuitées des touristes (milliers) .. .. 26 986 27 636 31 148 36 576 40 097 45 547Dépenses totales des visiteurs (millions de dollars) 1 292 3 195 2 756 1 716 2 306 2 660 3 209 3 863Dépenses sans transport (millions de dollars) 903 2 904 2 642 1 535 2 006 2 235 2 729 3 308
Arrivals of visitors (thousands) _ (a)45 (a)123 (a)162 (a)206 (a)263 (a)319 (a)381Tourists' overnight stays (thousands) _ 151 200 202 343 385 420 840Total expenditure of visitors (millions of dollars) _ 52 81 81 90 188 240 307Expenditure excluding transport (millions of dollars) _ 38 65 63 73 171 220 271
Arrivées des visiteurs (milliers) 433 (d)1 211 (d)1 178 (d)1 225 (d)1 184 (d)1 304 (d)1 286 (d)1 285Nuitées des touristes (milliers) 3 380 5 248 5 145 4 863 5 098 5 640 5 695 5 471Dépenses totales des visiteurs (millions de dollars) .. 851 826 835 859 .. .. 1 076Dépenses sans transport (millions de dollars) 349 815 822 834 859 1 056 1 094 1 076
Arrivals of visitors (thousands) 2 215 (d)4 931 (d)4 856 (d)4 841 (d)4 746 (d)5 215 (d)5 499 (d)5 532Tourists' overnight stays (thousands) 22 950 67 037 69 849 74 610 70 688 76 247 .. ..Total expenditure of visitors (millions of dollars) 5 461 13 016 12 804 13 624 16 647 20 453 22 566 23 729Expenditure excluding transport (millions of dollars) 4 247 9 289 9 224 9 971 12 438 15 214 16 868 17 854
For sources and notes, see end of table. Pour les sources et les notes, se reporter à la fin du tableau.
Afghanistan
Albania - Albanie (1)
Algeria - Algérie
American Samoa - Samoa américaines
Andorra - Andorre
Angola
Anguilla
Antigua and Barbuda - Antigua-et-Barbuda
Argentina - Argentine
Armenia - Arménie
Aruba
Australia - Australie
5.3 Tourism indicators 5.3 Indicateurs du tourisme
262
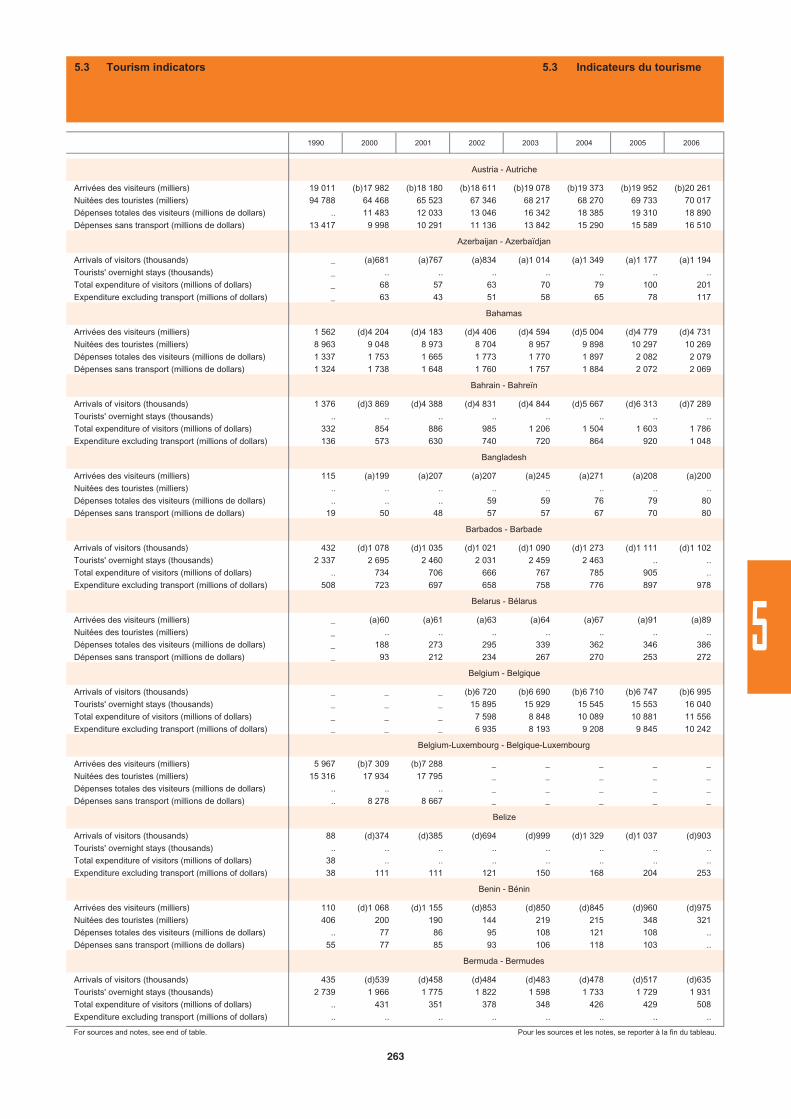
1990 2000 2001 2002 2003 2004 2005 2006
Arrivées des visiteurs (milliers) 19 011 (b)17 982 (b)18 180 (b)18 611 (b)19 078 (b)19 373 (b)19 952 (b)20 261Nuitées des touristes (milliers) 94 788 64 468 65 523 67 346 68 217 68 270 69 733 70 017Dépenses totales des visiteurs (millions de dollars) .. 11 483 12 033 13 046 16 342 18 385 19 310 18 890Dépenses sans transport (millions de dollars) 13 417 9 998 10 291 11 136 13 842 15 290 15 589 16 510
Arrivals of visitors (thousands) _ (a)681 (a)767 (a)834 (a)1 014 (a)1 349 (a)1 177 (a)1 194Tourists' overnight stays (thousands) _ .. .. .. .. .. .. ..Total expenditure of visitors (millions of dollars) _ 68 57 63 70 79 100 201Expenditure excluding transport (millions of dollars) _ 63 43 51 58 65 78 117
Arrivées des visiteurs (milliers) 1 562 (d)4 204 (d)4 183 (d)4 406 (d)4 594 (d)5 004 (d)4 779 (d)4 731Nuitées des touristes (milliers) 8 963 9 048 8 973 8 704 8 957 9 898 10 297 10 269Dépenses totales des visiteurs (millions de dollars) 1 337 1 753 1 665 1 773 1 770 1 897 2 082 2 079Dépenses sans transport (millions de dollars) 1 324 1 738 1 648 1 760 1 757 1 884 2 072 2 069
Arrivals of visitors (thousands) 1 376 (d)3 869 (d)4 388 (d)4 831 (d)4 844 (d)5 667 (d)6 313 (d)7 289Tourists' overnight stays (thousands) .. .. .. .. .. .. .. ..Total expenditure of visitors (millions of dollars) 332 854 886 985 1 206 1 504 1 603 1 786Expenditure excluding transport (millions of dollars) 136 573 630 740 720 864 920 1 048
Arrivées des visiteurs (milliers) 115 (a)199 (a)207 (a)207 (a)245 (a)271 (a)208 (a)200Nuitées des touristes (milliers) .. .. .. .. .. .. .. ..Dépenses totales des visiteurs (millions de dollars) .. .. .. 59 59 76 79 80Dépenses sans transport (millions de dollars) 19 50 48 57 57 67 70 80
Arrivals of visitors (thousands) 432 (d)1 078 (d)1 035 (d)1 021 (d)1 090 (d)1 273 (d)1 111 (d)1 102Tourists' overnight stays (thousands) 2 337 2 695 2 460 2 031 2 459 2 463 .. ..Total expenditure of visitors (millions of dollars) .. 734 706 666 767 785 905 ..Expenditure excluding transport (millions of dollars) 508 723 697 658 758 776 897 978
Arrivées des visiteurs (milliers) _ (a)60 (a)61 (a)63 (a)64 (a)67 (a)91 (a)89Nuitées des touristes (milliers) _ .. .. .. .. .. .. ..Dépenses totales des visiteurs (millions de dollars) _ 188 273 295 339 362 346 386Dépenses sans transport (millions de dollars) _ 93 212 234 267 270 253 272
Arrivals of visitors (thousands) _ _ _ (b)6 720 (b)6 690 (b)6 710 (b)6 747 (b)6 995Tourists' overnight stays (thousands) _ _ _ 15 895 15 929 15 545 15 553 16 040Total expenditure of visitors (millions of dollars) _ _ _ 7 598 8 848 10 089 10 881 11 556Expenditure excluding transport (millions of dollars) _ _ _ 6 935 8 193 9 208 9 845 10 242
Arrivées des visiteurs (milliers) 5 967 (b)7 309 (b)7 288 _ _ _ _ _Nuitées des touristes (milliers) 15 316 17 934 17 795 _ _ _ _ _Dépenses totales des visiteurs (millions de dollars) .. .. .. _ _ _ _ _Dépenses sans transport (millions de dollars) .. 8 278 8 667 _ _ _ _ _
Arrivals of visitors (thousands) 88 (d)374 (d)385 (d)694 (d)999 (d)1 329 (d)1 037 (d)903Tourists' overnight stays (thousands) .. .. .. .. .. .. .. ..Total expenditure of visitors (millions of dollars) 38 .. .. .. .. .. .. ..Expenditure excluding transport (millions of dollars) 38 111 111 121 150 168 204 253
Arrivées des visiteurs (milliers) 110 (d)1 068 (d)1 155 (d)853 (d)850 (d)845 (d)960 (d)975Nuitées des touristes (milliers) 406 200 190 144 219 215 348 321Dépenses totales des visiteurs (millions de dollars) .. 77 86 95 108 121 108 ..Dépenses sans transport (millions de dollars) 55 77 85 93 106 118 103 ..
Arrivals of visitors (thousands) 435 (d)539 (d)458 (d)484 (d)483 (d)478 (d)517 (d)635Tourists' overnight stays (thousands) 2 739 1 966 1 775 1 822 1 598 1 733 1 729 1 931Total expenditure of visitors (millions of dollars) .. 431 351 378 348 426 429 508Expenditure excluding transport (millions of dollars) .. .. .. .. .. .. .. ..
For sources and notes, see end of table. Pour les sources et les notes, se reporter à la fin du tableau.
Belarus - Bélarus
Belgium - Belgique
Austria - Autriche
Azerbaijan - Azerbaïdjan
Bahamas
Bahrain - Bahreïn
Belgium-Luxembourg - Belgique-Luxembourg
Belize
Benin - Bénin
Bermuda - Bermudes
Bangladesh
Barbados - Barbade
5.3 Tourism indicators 5.3 Indicateurs du tourisme
263
5
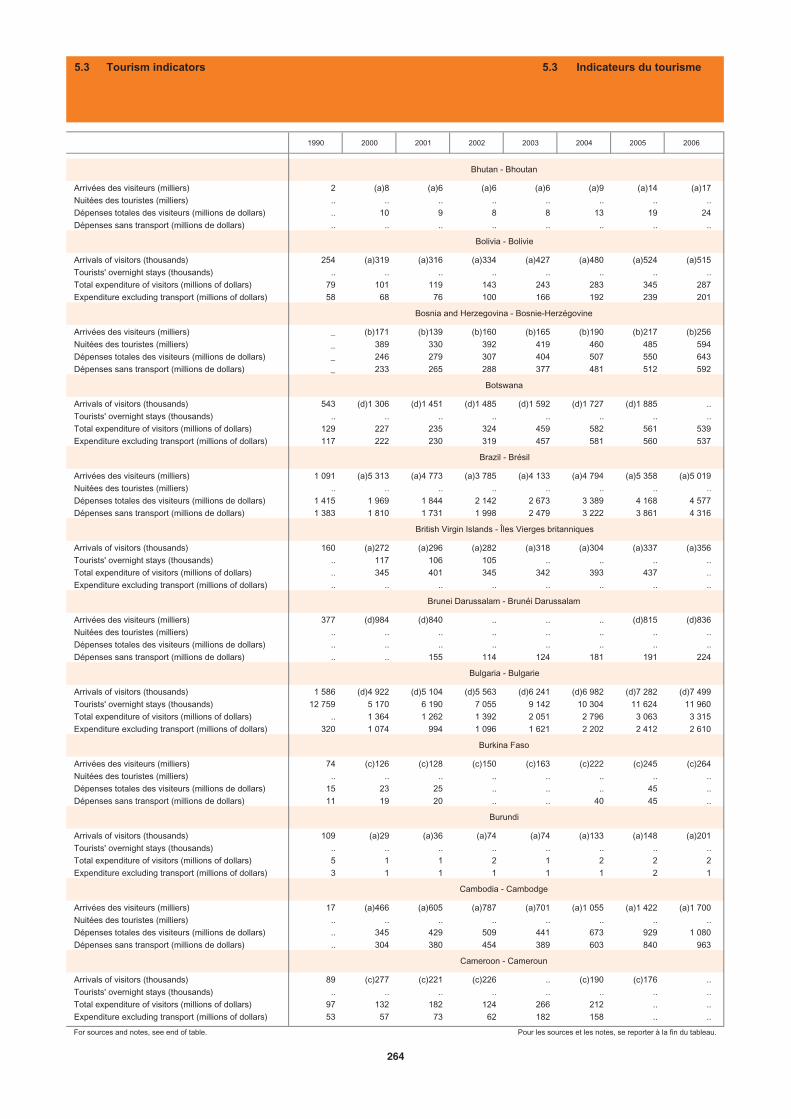
1990 2000 2001 2002 2003 2004 2005 2006
Arrivées des visiteurs (milliers) 2 (a)8 (a)6 (a)6 (a)6 (a)9 (a)14 (a)17Nuitées des touristes (milliers) .. .. .. .. .. .. .. ..Dépenses totales des visiteurs (millions de dollars) .. 10 9 8 8 13 19 24Dépenses sans transport (millions de dollars) .. .. .. .. .. .. .. ..
Arrivals of visitors (thousands) 254 (a)319 (a)316 (a)334 (a)427 (a)480 (a)524 (a)515Tourists' overnight stays (thousands) .. .. .. .. .. .. .. ..Total expenditure of visitors (millions of dollars) 79 101 119 143 243 283 345 287Expenditure excluding transport (millions of dollars) 58 68 76 100 166 192 239 201
Arrivées des visiteurs (milliers) _ (b)171 (b)139 (b)160 (b)165 (b)190 (b)217 (b)256Nuitées des touristes (milliers) _ 389 330 392 419 460 485 594Dépenses totales des visiteurs (millions de dollars) _ 246 279 307 404 507 550 643Dépenses sans transport (millions de dollars) _ 233 265 288 377 481 512 592
Arrivals of visitors (thousands) 543 (d)1 306 (d)1 451 (d)1 485 (d)1 592 (d)1 727 (d)1 885 ..Tourists' overnight stays (thousands) .. .. .. .. .. .. .. ..Total expenditure of visitors (millions of dollars) 129 227 235 324 459 582 561 539Expenditure excluding transport (millions of dollars) 117 222 230 319 457 581 560 537
Arrivées des visiteurs (milliers) 1 091 (a)5 313 (a)4 773 (a)3 785 (a)4 133 (a)4 794 (a)5 358 (a)5 019Nuitées des touristes (milliers) .. .. .. .. .. .. .. ..Dépenses totales des visiteurs (millions de dollars) 1 415 1 969 1 844 2 142 2 673 3 389 4 168 4 577Dépenses sans transport (millions de dollars) 1 383 1 810 1 731 1 998 2 479 3 222 3 861 4 316
Arrivals of visitors (thousands) 160 (a)272 (a)296 (a)282 (a)318 (a)304 (a)337 (a)356Tourists' overnight stays (thousands) .. 117 106 105 .. .. .. ..Total expenditure of visitors (millions of dollars) .. 345 401 345 342 393 437 ..Expenditure excluding transport (millions of dollars) .. .. .. .. .. .. .. ..
Arrivées des visiteurs (milliers) 377 (d)984 (d)840 .. .. .. (d)815 (d)836Nuitées des touristes (milliers) .. .. .. .. .. .. .. ..Dépenses totales des visiteurs (millions de dollars) .. .. .. .. .. .. .. ..Dépenses sans transport (millions de dollars) .. .. 155 114 124 181 191 224
Arrivals of visitors (thousands) 1 586 (d)4 922 (d)5 104 (d)5 563 (d)6 241 (d)6 982 (d)7 282 (d)7 499Tourists' overnight stays (thousands) 12 759 5 170 6 190 7 055 9 142 10 304 11 624 11 960Total expenditure of visitors (millions of dollars) .. 1 364 1 262 1 392 2 051 2 796 3 063 3 315Expenditure excluding transport (millions of dollars) 320 1 074 994 1 096 1 621 2 202 2 412 2 610
Arrivées des visiteurs (milliers) 74 (c)126 (c)128 (c)150 (c)163 (c)222 (c)245 (c)264Nuitées des touristes (milliers) .. .. .. .. .. .. .. ..Dépenses totales des visiteurs (millions de dollars) 15 23 25 .. .. .. 45 ..Dépenses sans transport (millions de dollars) 11 19 20 .. .. 40 45 ..
Arrivals of visitors (thousands) 109 (a)29 (a)36 (a)74 (a)74 (a)133 (a)148 (a)201Tourists' overnight stays (thousands) .. .. .. .. .. .. .. ..Total expenditure of visitors (millions of dollars) 5 1 1 2 1 2 2 2Expenditure excluding transport (millions of dollars) 3 1 1 1 1 1 2 1
Arrivées des visiteurs (milliers) 17 (a)466 (a)605 (a)787 (a)701 (a)1 055 (a)1 422 (a)1 700Nuitées des touristes (milliers) .. .. .. .. .. .. .. ..Dépenses totales des visiteurs (millions de dollars) .. 345 429 509 441 673 929 1 080Dépenses sans transport (millions de dollars) .. 304 380 454 389 603 840 963
Arrivals of visitors (thousands) 89 (c)277 (c)221 (c)226 .. (c)190 (c)176 ..Tourists' overnight stays (thousands) .. .. .. .. .. .. .. ..Total expenditure of visitors (millions of dollars) 97 132 182 124 266 212 .. ..Expenditure excluding transport (millions of dollars) 53 57 73 62 182 158 .. ..
For sources and notes, see end of table. Pour les sources et les notes, se reporter à la fin du tableau.
Bhutan - Bhoutan
Bolivia - Bolivie
Bosnia and Herzegovina - Bosnie-Herzégovine
Botswana
Brazil - Brésil
British Virgin Islands - Îles Vierges britanniques
Brunei Darussalam - Brunéi Darussalam
Bulgaria - Bulgarie
Burkina Faso
Burundi
Cambodia - Cambodge
Cameroon - Cameroun
5.3 Tourism indicators 5.3 Indicateurs du tourisme
264
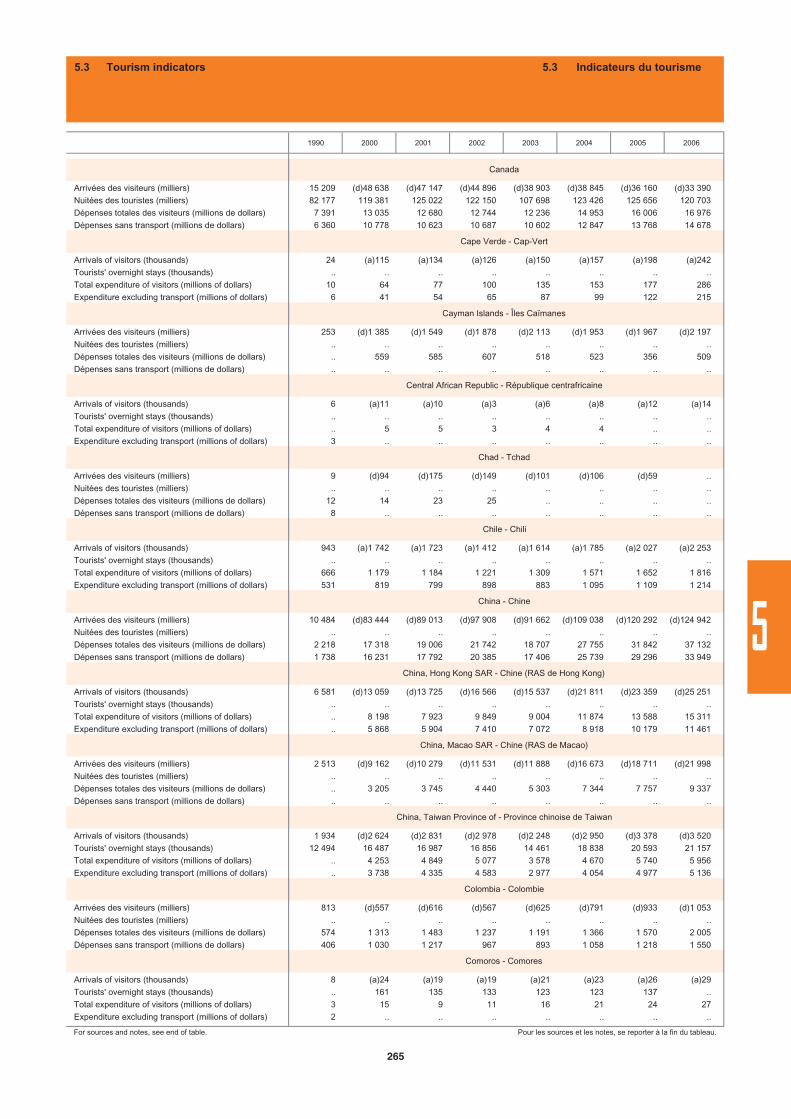
1990 2000 2001 2002 2003 2004 2005 2006
Arrivées des visiteurs (milliers) 15 209 (d)48 638 (d)47 147 (d)44 896 (d)38 903 (d)38 845 (d)36 160 (d)33 390Nuitées des touristes (milliers) 82 177 119 381 125 022 122 150 107 698 123 426 125 656 120 703Dépenses totales des visiteurs (millions de dollars) 7 391 13 035 12 680 12 744 12 236 14 953 16 006 16 976Dépenses sans transport (millions de dollars) 6 360 10 778 10 623 10 687 10 602 12 847 13 768 14 678
Arrivals of visitors (thousands) 24 (a)115 (a)134 (a)126 (a)150 (a)157 (a)198 (a)242Tourists' overnight stays (thousands) .. .. .. .. .. .. .. ..Total expenditure of visitors (millions of dollars) 10 64 77 100 135 153 177 286Expenditure excluding transport (millions of dollars) 6 41 54 65 87 99 122 215
Arrivées des visiteurs (milliers) 253 (d)1 385 (d)1 549 (d)1 878 (d)2 113 (d)1 953 (d)1 967 (d)2 197Nuitées des touristes (milliers) .. .. .. .. .. .. .. ..Dépenses totales des visiteurs (millions de dollars) .. 559 585 607 518 523 356 509Dépenses sans transport (millions de dollars) .. .. .. .. .. .. .. ..
Arrivals of visitors (thousands) 6 (a)11 (a)10 (a)3 (a)6 (a)8 (a)12 (a)14Tourists' overnight stays (thousands) .. .. .. .. .. .. .. ..Total expenditure of visitors (millions of dollars) .. 5 5 3 4 4 .. ..Expenditure excluding transport (millions of dollars) 3 .. .. .. .. .. .. ..
Arrivées des visiteurs (milliers) 9 (d)94 (d)175 (d)149 (d)101 (d)106 (d)59 ..Nuitées des touristes (milliers) .. .. .. .. .. .. .. ..Dépenses totales des visiteurs (millions de dollars) 12 14 23 25 .. .. .. ..Dépenses sans transport (millions de dollars) 8 .. .. .. .. .. .. ..
Arrivals of visitors (thousands) 943 (a)1 742 (a)1 723 (a)1 412 (a)1 614 (a)1 785 (a)2 027 (a)2 253Tourists' overnight stays (thousands) .. .. .. .. .. .. .. ..Total expenditure of visitors (millions of dollars) 666 1 179 1 184 1 221 1 309 1 571 1 652 1 816Expenditure excluding transport (millions of dollars) 531 819 799 898 883 1 095 1 109 1 214
Arrivées des visiteurs (milliers) 10 484 (d)83 444 (d)89 013 (d)97 908 (d)91 662 (d)109 038 (d)120 292 (d)124 942Nuitées des touristes (milliers) .. .. .. .. .. .. .. ..Dépenses totales des visiteurs (millions de dollars) 2 218 17 318 19 006 21 742 18 707 27 755 31 842 37 132Dépenses sans transport (millions de dollars) 1 738 16 231 17 792 20 385 17 406 25 739 29 296 33 949
Arrivals of visitors (thousands) 6 581 (d)13 059 (d)13 725 (d)16 566 (d)15 537 (d)21 811 (d)23 359 (d)25 251Tourists' overnight stays (thousands) .. .. .. .. .. .. .. ..Total expenditure of visitors (millions of dollars) .. 8 198 7 923 9 849 9 004 11 874 13 588 15 311Expenditure excluding transport (millions of dollars) .. 5 868 5 904 7 410 7 072 8 918 10 179 11 461
Arrivées des visiteurs (milliers) 2 513 (d)9 162 (d)10 279 (d)11 531 (d)11 888 (d)16 673 (d)18 711 (d)21 998Nuitées des touristes (milliers) .. .. .. .. .. .. .. ..Dépenses totales des visiteurs (millions de dollars) .. 3 205 3 745 4 440 5 303 7 344 7 757 9 337Dépenses sans transport (millions de dollars) .. .. .. .. .. .. .. ..
Arrivals of visitors (thousands) 1 934 (d)2 624 (d)2 831 (d)2 978 (d)2 248 (d)2 950 (d)3 378 (d)3 520Tourists' overnight stays (thousands) 12 494 16 487 16 987 16 856 14 461 18 838 20 593 21 157Total expenditure of visitors (millions of dollars) .. 4 253 4 849 5 077 3 578 4 670 5 740 5 956Expenditure excluding transport (millions of dollars) .. 3 738 4 335 4 583 2 977 4 054 4 977 5 136
Arrivées des visiteurs (milliers) 813 (d)557 (d)616 (d)567 (d)625 (d)791 (d)933 (d)1 053Nuitées des touristes (milliers) .. .. .. .. .. .. .. ..Dépenses totales des visiteurs (millions de dollars) 574 1 313 1 483 1 237 1 191 1 366 1 570 2 005Dépenses sans transport (millions de dollars) 406 1 030 1 217 967 893 1 058 1 218 1 550
Arrivals of visitors (thousands) 8 (a)24 (a)19 (a)19 (a)21 (a)23 (a)26 (a)29Tourists' overnight stays (thousands) .. 161 135 133 123 123 137 ..Total expenditure of visitors (millions of dollars) 3 15 9 11 16 21 24 27Expenditure excluding transport (millions of dollars) 2 .. .. .. .. .. .. ..
For sources and notes, see end of table. Pour les sources et les notes, se reporter à la fin du tableau.
Canada
Cape Verde - Cap-Vert
Cayman Islands - Îles Caïmanes
Central African Republic - République centrafricaine
China, Macao SAR - Chine (RAS de Macao)
China, Taiwan Province of - Province chinoise de Taiwan
Colombia - Colombie
Comoros - Comores
Chad - Tchad
Chile - Chili
China - Chine
China, Hong Kong SAR - Chine (RAS de Hong Kong)
5.3 Tourism indicators 5.3 Indicateurs du tourisme
265
5
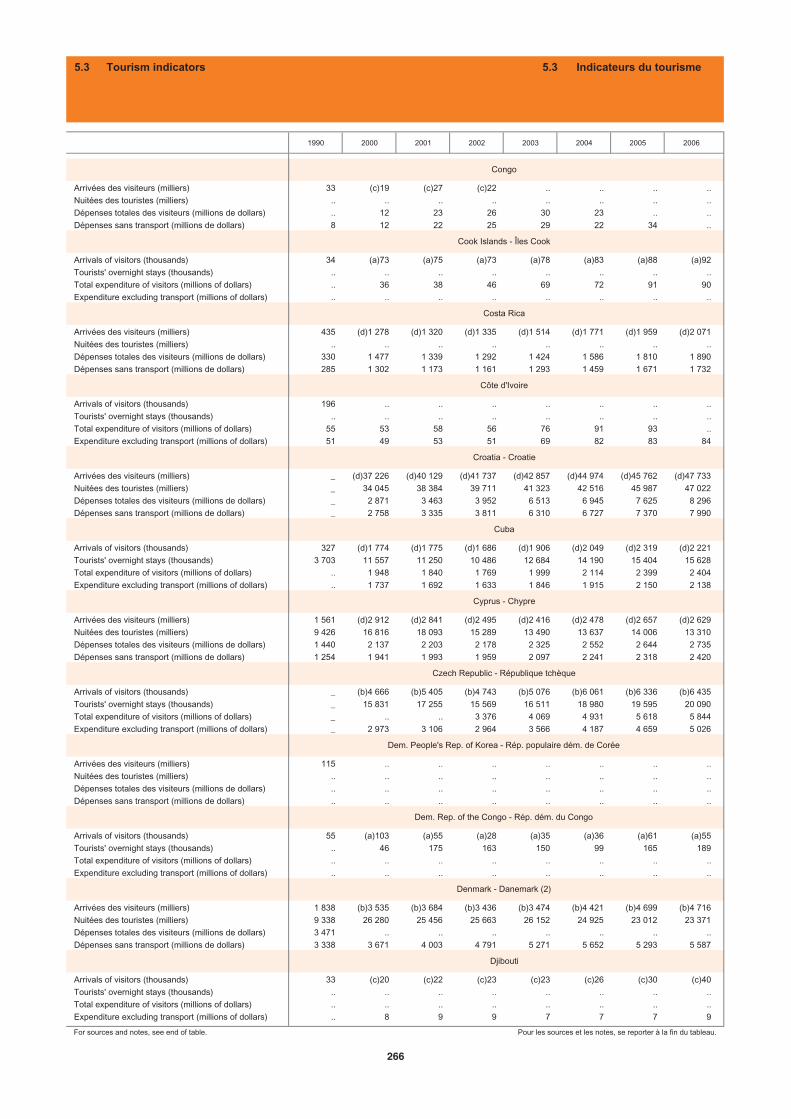
1990 2000 2001 2002 2003 2004 2005 2006
Arrivées des visiteurs (milliers) 33 (c)19 (c)27 (c)22 .. .. .. ..Nuitées des touristes (milliers) .. .. .. .. .. .. .. ..Dépenses totales des visiteurs (millions de dollars) .. 12 23 26 30 23 .. ..Dépenses sans transport (millions de dollars) 8 12 22 25 29 22 34 ..
Arrivals of visitors (thousands) 34 (a)73 (a)75 (a)73 (a)78 (a)83 (a)88 (a)92Tourists' overnight stays (thousands) .. .. .. .. .. .. .. ..Total expenditure of visitors (millions of dollars) .. 36 38 46 69 72 91 90Expenditure excluding transport (millions of dollars) .. .. .. .. .. .. .. ..
Arrivées des visiteurs (milliers) 435 (d)1 278 (d)1 320 (d)1 335 (d)1 514 (d)1 771 (d)1 959 (d)2 071Nuitées des touristes (milliers) .. .. .. .. .. .. .. ..Dépenses totales des visiteurs (millions de dollars) 330 1 477 1 339 1 292 1 424 1 586 1 810 1 890Dépenses sans transport (millions de dollars) 285 1 302 1 173 1 161 1 293 1 459 1 671 1 732
Arrivals of visitors (thousands) 196 .. .. .. .. .. .. ..Tourists' overnight stays (thousands) .. .. .. .. .. .. .. ..Total expenditure of visitors (millions of dollars) 55 53 58 56 76 91 93 ..Expenditure excluding transport (millions of dollars) 51 49 53 51 69 82 83 84
Arrivées des visiteurs (milliers) _ (d)37 226 (d)40 129 (d)41 737 (d)42 857 (d)44 974 (d)45 762 (d)47 733Nuitées des touristes (milliers) _ 34 045 38 384 39 711 41 323 42 516 45 987 47 022Dépenses totales des visiteurs (millions de dollars) _ 2 871 3 463 3 952 6 513 6 945 7 625 8 296Dépenses sans transport (millions de dollars) _ 2 758 3 335 3 811 6 310 6 727 7 370 7 990
Arrivals of visitors (thousands) 327 (d)1 774 (d)1 775 (d)1 686 (d)1 906 (d)2 049 (d)2 319 (d)2 221Tourists' overnight stays (thousands) 3 703 11 557 11 250 10 486 12 684 14 190 15 404 15 628Total expenditure of visitors (millions of dollars) .. 1 948 1 840 1 769 1 999 2 114 2 399 2 404Expenditure excluding transport (millions of dollars) .. 1 737 1 692 1 633 1 846 1 915 2 150 2 138
Arrivées des visiteurs (milliers) 1 561 (d)2 912 (d)2 841 (d)2 495 (d)2 416 (d)2 478 (d)2 657 (d)2 629Nuitées des touristes (milliers) 9 426 16 816 18 093 15 289 13 490 13 637 14 006 13 310Dépenses totales des visiteurs (millions de dollars) 1 440 2 137 2 203 2 178 2 325 2 552 2 644 2 735Dépenses sans transport (millions de dollars) 1 254 1 941 1 993 1 959 2 097 2 241 2 318 2 420
Arrivals of visitors (thousands) _ (b)4 666 (b)5 405 (b)4 743 (b)5 076 (b)6 061 (b)6 336 (b)6 435Tourists' overnight stays (thousands) _ 15 831 17 255 15 569 16 511 18 980 19 595 20 090Total expenditure of visitors (millions of dollars) _ .. .. 3 376 4 069 4 931 5 618 5 844Expenditure excluding transport (millions of dollars) _ 2 973 3 106 2 964 3 566 4 187 4 659 5 026
Arrivées des visiteurs (milliers) 115 .. .. .. .. .. .. ..Nuitées des touristes (milliers) .. .. .. .. .. .. .. ..Dépenses totales des visiteurs (millions de dollars) .. .. .. .. .. .. .. ..Dépenses sans transport (millions de dollars) .. .. .. .. .. .. .. ..
Arrivals of visitors (thousands) 55 (a)103 (a)55 (a)28 (a)35 (a)36 (a)61 (a)55Tourists' overnight stays (thousands) .. 46 175 163 150 99 165 189Total expenditure of visitors (millions of dollars) .. .. .. .. .. .. .. ..Expenditure excluding transport (millions of dollars) .. .. .. .. .. .. .. ..
Arrivées des visiteurs (milliers) 1 838 (b)3 535 (b)3 684 (b)3 436 (b)3 474 (b)4 421 (b)4 699 (b)4 716Nuitées des touristes (milliers) 9 338 26 280 25 456 25 663 26 152 24 925 23 012 23 371Dépenses totales des visiteurs (millions de dollars) 3 471 .. .. .. .. .. .. ..Dépenses sans transport (millions de dollars) 3 338 3 671 4 003 4 791 5 271 5 652 5 293 5 587
Arrivals of visitors (thousands) 33 (c)20 (c)22 (c)23 (c)23 (c)26 (c)30 (c)40Tourists' overnight stays (thousands) .. .. .. .. .. .. .. ..Total expenditure of visitors (millions of dollars) .. .. .. .. .. .. .. ..Expenditure excluding transport (millions of dollars) .. 8 9 9 7 7 7 9
For sources and notes, see end of table. Pour les sources et les notes, se reporter à la fin du tableau.
Croatia - Croatie
Cuba
Congo
Cook Islands - Îles Cook
Costa Rica
Côte d'Ivoire
Cyprus - Chypre
Czech Republic - République tchèque
Dem. People's Rep. of Korea - Rép. populaire dém. de Corée
Dem. Rep. of the Congo - Rép. dém. du Congo
Denmark - Danemark (2)
Djibouti
5.3 Tourism indicators 5.3 Indicateurs du tourisme
266
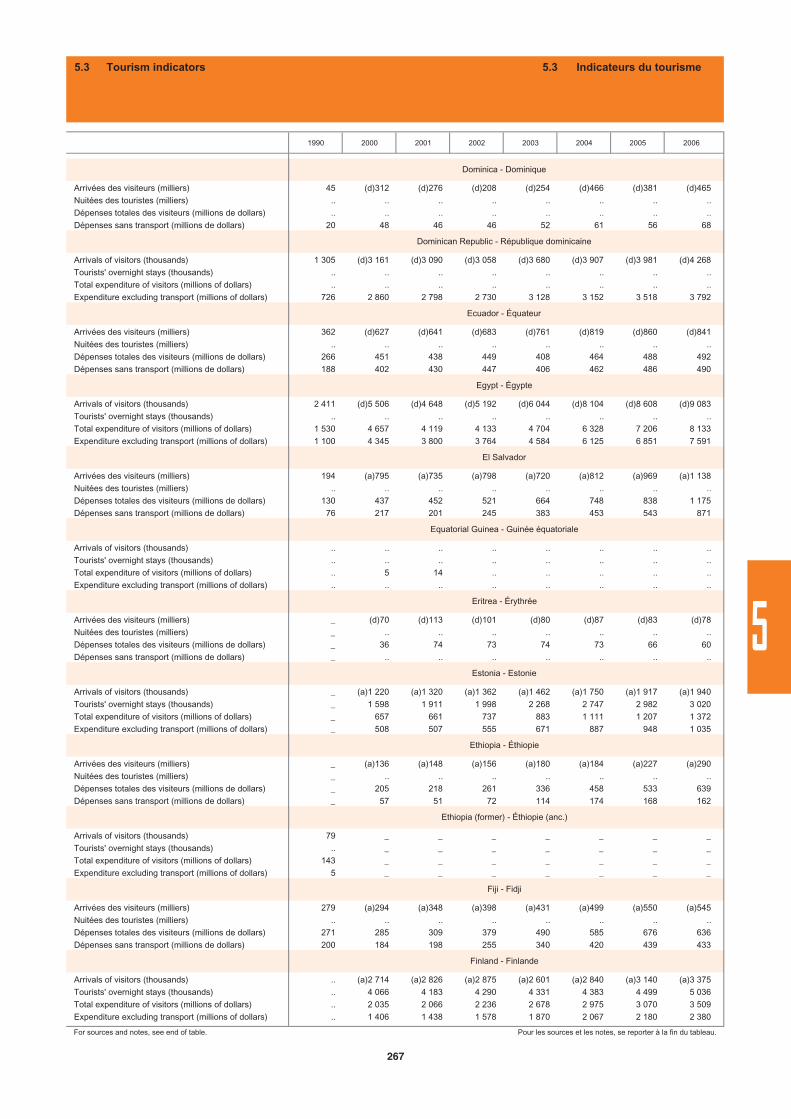
1990 2000 2001 2002 2003 2004 2005 2006
Arrivées des visiteurs (milliers) 45 (d)312 (d)276 (d)208 (d)254 (d)466 (d)381 (d)465Nuitées des touristes (milliers) .. .. .. .. .. .. .. ..Dépenses totales des visiteurs (millions de dollars) .. .. .. .. .. .. .. ..Dépenses sans transport (millions de dollars) 20 48 46 46 52 61 56 68
Arrivals of visitors (thousands) 1 305 (d)3 161 (d)3 090 (d)3 058 (d)3 680 (d)3 907 (d)3 981 (d)4 268Tourists' overnight stays (thousands) .. .. .. .. .. .. .. ..Total expenditure of visitors (millions of dollars) .. .. .. .. .. .. .. ..Expenditure excluding transport (millions of dollars) 726 2 860 2 798 2 730 3 128 3 152 3 518 3 792
Arrivées des visiteurs (milliers) 362 (d)627 (d)641 (d)683 (d)761 (d)819 (d)860 (d)841Nuitées des touristes (milliers) .. .. .. .. .. .. .. ..Dépenses totales des visiteurs (millions de dollars) 266 451 438 449 408 464 488 492Dépenses sans transport (millions de dollars) 188 402 430 447 406 462 486 490
Arrivals of visitors (thousands) 2 411 (d)5 506 (d)4 648 (d)5 192 (d)6 044 (d)8 104 (d)8 608 (d)9 083Tourists' overnight stays (thousands) .. .. .. .. .. .. .. ..Total expenditure of visitors (millions of dollars) 1 530 4 657 4 119 4 133 4 704 6 328 7 206 8 133Expenditure excluding transport (millions of dollars) 1 100 4 345 3 800 3 764 4 584 6 125 6 851 7 591
Arrivées des visiteurs (milliers) 194 (a)795 (a)735 (a)798 (a)720 (a)812 (a)969 (a)1 138Nuitées des touristes (milliers) .. .. .. .. .. .. .. ..Dépenses totales des visiteurs (millions de dollars) 130 437 452 521 664 748 838 1 175Dépenses sans transport (millions de dollars) 76 217 201 245 383 453 543 871
Arrivals of visitors (thousands) .. .. .. .. .. .. .. ..Tourists' overnight stays (thousands) .. .. .. .. .. .. .. ..Total expenditure of visitors (millions of dollars) .. 5 14 .. .. .. .. ..Expenditure excluding transport (millions of dollars) .. .. .. .. .. .. .. ..
Arrivées des visiteurs (milliers) _ (d)70 (d)113 (d)101 (d)80 (d)87 (d)83 (d)78Nuitées des touristes (milliers) _ .. .. .. .. .. .. ..Dépenses totales des visiteurs (millions de dollars) _ 36 74 73 74 73 66 60Dépenses sans transport (millions de dollars) _ .. .. .. .. .. .. ..
Arrivals of visitors (thousands) _ (a)1 220 (a)1 320 (a)1 362 (a)1 462 (a)1 750 (a)1 917 (a)1 940Tourists' overnight stays (thousands) _ 1 598 1 911 1 998 2 268 2 747 2 982 3 020Total expenditure of visitors (millions of dollars) _ 657 661 737 883 1 111 1 207 1 372Expenditure excluding transport (millions of dollars) _ 508 507 555 671 887 948 1 035
Arrivées des visiteurs (milliers) _ (a)136 (a)148 (a)156 (a)180 (a)184 (a)227 (a)290Nuitées des touristes (milliers) _ .. .. .. .. .. .. ..Dépenses totales des visiteurs (millions de dollars) _ 205 218 261 336 458 533 639Dépenses sans transport (millions de dollars) _ 57 51 72 114 174 168 162
Arrivals of visitors (thousands) 79 _ _ _ _ _ _ _Tourists' overnight stays (thousands) .. _ _ _ _ _ _ _Total expenditure of visitors (millions of dollars) 143 _ _ _ _ _ _ _Expenditure excluding transport (millions of dollars) 5 _ _ _ _ _ _ _
Arrivées des visiteurs (milliers) 279 (a)294 (a)348 (a)398 (a)431 (a)499 (a)550 (a)545Nuitées des touristes (milliers) .. .. .. .. .. .. .. ..Dépenses totales des visiteurs (millions de dollars) 271 285 309 379 490 585 676 636Dépenses sans transport (millions de dollars) 200 184 198 255 340 420 439 433
Arrivals of visitors (thousands) .. (a)2 714 (a)2 826 (a)2 875 (a)2 601 (a)2 840 (a)3 140 (a)3 375Tourists' overnight stays (thousands) .. 4 066 4 183 4 290 4 331 4 383 4 499 5 036Total expenditure of visitors (millions of dollars) .. 2 035 2 066 2 236 2 678 2 975 3 070 3 509Expenditure excluding transport (millions of dollars) .. 1 406 1 438 1 578 1 870 2 067 2 180 2 380
For sources and notes, see end of table. Pour les sources et les notes, se reporter à la fin du tableau.
Dominica - Dominique
Dominican Republic - République dominicaine
Ecuador - Équateur
Egypt - Égypte
El Salvador
Equatorial Guinea - Guinée équatoriale
Eritrea - Érythrée
Estonia - Estonie
Ethiopia - Éthiopie
Ethiopia (former) - Éthiopie (anc.)
Fiji - Fidji
Finland - Finlande
5.3 Tourism indicators 5.3 Indicateurs du tourisme
267
5
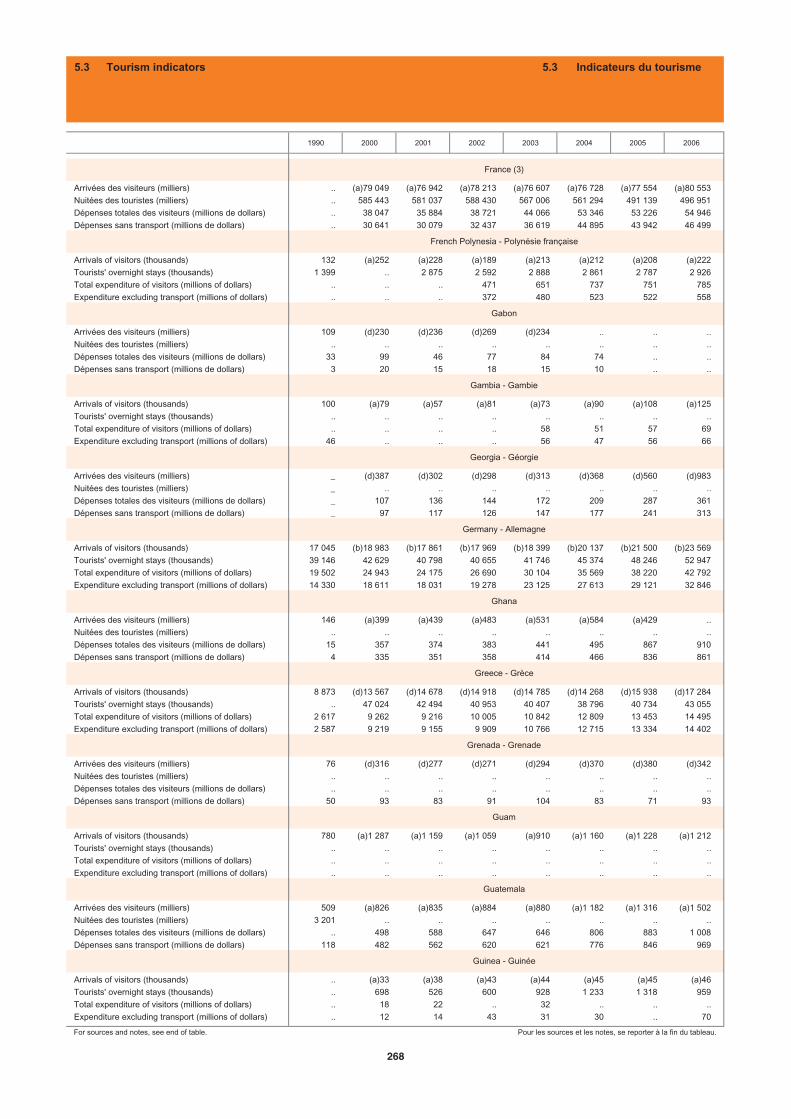
1990 2000 2001 2002 2003 2004 2005 2006
Arrivées des visiteurs (milliers) .. (a)79 049 (a)76 942 (a)78 213 (a)76 607 (a)76 728 (a)77 554 (a)80 553Nuitées des touristes (milliers) .. 585 443 581 037 588 430 567 006 561 294 491 139 496 951Dépenses totales des visiteurs (millions de dollars) .. 38 047 35 884 38 721 44 066 53 346 53 226 54 946Dépenses sans transport (millions de dollars) .. 30 641 30 079 32 437 36 619 44 895 43 942 46 499
Arrivals of visitors (thousands) 132 (a)252 (a)228 (a)189 (a)213 (a)212 (a)208 (a)222Tourists' overnight stays (thousands) 1 399 .. 2 875 2 592 2 888 2 861 2 787 2 926Total expenditure of visitors (millions of dollars) .. .. .. 471 651 737 751 785Expenditure excluding transport (millions of dollars) .. .. .. 372 480 523 522 558
Arrivées des visiteurs (milliers) 109 (d)230 (d)236 (d)269 (d)234 .. .. ..Nuitées des touristes (milliers) .. .. .. .. .. .. .. ..Dépenses totales des visiteurs (millions de dollars) 33 99 46 77 84 74 .. ..Dépenses sans transport (millions de dollars) 3 20 15 18 15 10 .. ..
Arrivals of visitors (thousands) 100 (a)79 (a)57 (a)81 (a)73 (a)90 (a)108 (a)125Tourists' overnight stays (thousands) .. .. .. .. .. .. .. ..Total expenditure of visitors (millions of dollars) .. .. .. .. 58 51 57 69Expenditure excluding transport (millions of dollars) 46 .. .. .. 56 47 56 66
Arrivées des visiteurs (milliers) _ (d)387 (d)302 (d)298 (d)313 (d)368 (d)560 (d)983Nuitées des touristes (milliers) _ .. .. .. .. .. .. ..Dépenses totales des visiteurs (millions de dollars) _ 107 136 144 172 209 287 361Dépenses sans transport (millions de dollars) _ 97 117 126 147 177 241 313
Arrivals of visitors (thousands) 17 045 (b)18 983 (b)17 861 (b)17 969 (b)18 399 (b)20 137 (b)21 500 (b)23 569Tourists' overnight stays (thousands) 39 146 42 629 40 798 40 655 41 746 45 374 48 246 52 947Total expenditure of visitors (millions of dollars) 19 502 24 943 24 175 26 690 30 104 35 569 38 220 42 792Expenditure excluding transport (millions of dollars) 14 330 18 611 18 031 19 278 23 125 27 613 29 121 32 846
Arrivées des visiteurs (milliers) 146 (a)399 (a)439 (a)483 (a)531 (a)584 (a)429 ..Nuitées des touristes (milliers) .. .. .. .. .. .. .. ..Dépenses totales des visiteurs (millions de dollars) 15 357 374 383 441 495 867 910Dépenses sans transport (millions de dollars) 4 335 351 358 414 466 836 861
Arrivals of visitors (thousands) 8 873 (d)13 567 (d)14 678 (d)14 918 (d)14 785 (d)14 268 (d)15 938 (d)17 284Tourists' overnight stays (thousands) .. 47 024 42 494 40 953 40 407 38 796 40 734 43 055Total expenditure of visitors (millions of dollars) 2 617 9 262 9 216 10 005 10 842 12 809 13 453 14 495Expenditure excluding transport (millions of dollars) 2 587 9 219 9 155 9 909 10 766 12 715 13 334 14 402
Arrivées des visiteurs (milliers) 76 (d)316 (d)277 (d)271 (d)294 (d)370 (d)380 (d)342Nuitées des touristes (milliers) .. .. .. .. .. .. .. ..Dépenses totales des visiteurs (millions de dollars) .. .. .. .. .. .. .. ..Dépenses sans transport (millions de dollars) 50 93 83 91 104 83 71 93
Arrivals of visitors (thousands) 780 (a)1 287 (a)1 159 (a)1 059 (a)910 (a)1 160 (a)1 228 (a)1 212Tourists' overnight stays (thousands) .. .. .. .. .. .. .. ..Total expenditure of visitors (millions of dollars) .. .. .. .. .. .. .. ..Expenditure excluding transport (millions of dollars) .. .. .. .. .. .. .. ..
Arrivées des visiteurs (milliers) 509 (a)826 (a)835 (a)884 (a)880 (a)1 182 (a)1 316 (a)1 502Nuitées des touristes (milliers) 3 201 .. .. .. .. .. .. ..Dépenses totales des visiteurs (millions de dollars) .. 498 588 647 646 806 883 1 008Dépenses sans transport (millions de dollars) 118 482 562 620 621 776 846 969
Arrivals of visitors (thousands) .. (a)33 (a)38 (a)43 (a)44 (a)45 (a)45 (a)46Tourists' overnight stays (thousands) .. 698 526 600 928 1 233 1 318 959Total expenditure of visitors (millions of dollars) .. 18 22 .. 32 .. .. ..Expenditure excluding transport (millions of dollars) .. 12 14 43 31 30 .. 70
For sources and notes, see end of table. Pour les sources et les notes, se reporter à la fin du tableau.
France (3)
French Polynesia - Polynésie française
Gabon
Gambia - Gambie
Georgia - Géorgie
Germany - Allemagne
Ghana
Greece - Grèce
Grenada - Grenade
Guam
Guatemala
Guinea - Guinée
5.3 Tourism indicators 5.3 Indicateurs du tourisme
268
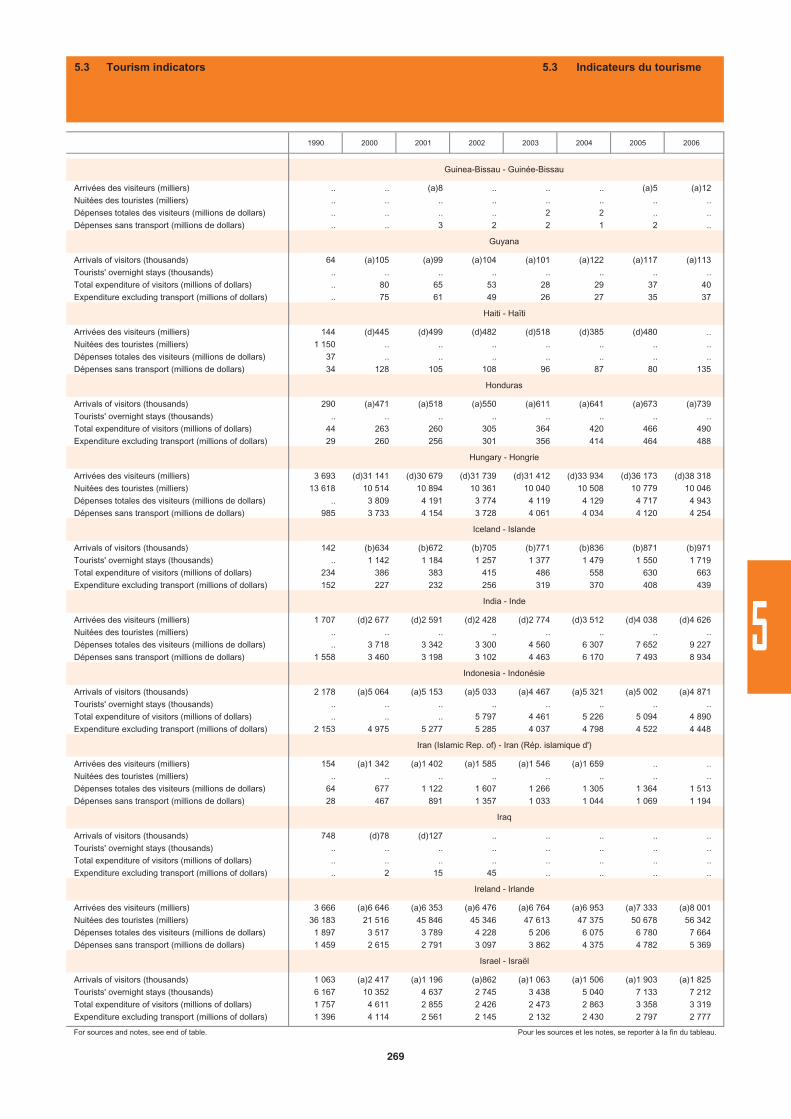
1990 2000 2001 2002 2003 2004 2005 2006
Arrivées des visiteurs (milliers) .. .. (a)8 .. .. .. (a)5 (a)12Nuitées des touristes (milliers) .. .. .. .. .. .. .. ..Dépenses totales des visiteurs (millions de dollars) .. .. .. .. 2 2 .. ..Dépenses sans transport (millions de dollars) .. .. 3 2 2 1 2 ..
Arrivals of visitors (thousands) 64 (a)105 (a)99 (a)104 (a)101 (a)122 (a)117 (a)113Tourists' overnight stays (thousands) .. .. .. .. .. .. .. ..Total expenditure of visitors (millions of dollars) .. 80 65 53 28 29 37 40Expenditure excluding transport (millions of dollars) .. 75 61 49 26 27 35 37
Arrivées des visiteurs (milliers) 144 (d)445 (d)499 (d)482 (d)518 (d)385 (d)480 ..Nuitées des touristes (milliers) 1 150 .. .. .. .. .. .. ..Dépenses totales des visiteurs (millions de dollars) 37 .. .. .. .. .. .. ..Dépenses sans transport (millions de dollars) 34 128 105 108 96 87 80 135
Arrivals of visitors (thousands) 290 (a)471 (a)518 (a)550 (a)611 (a)641 (a)673 (a)739Tourists' overnight stays (thousands) .. .. .. .. .. .. .. ..Total expenditure of visitors (millions of dollars) 44 263 260 305 364 420 466 490Expenditure excluding transport (millions of dollars) 29 260 256 301 356 414 464 488
Arrivées des visiteurs (milliers) 3 693 (d)31 141 (d)30 679 (d)31 739 (d)31 412 (d)33 934 (d)36 173 (d)38 318Nuitées des touristes (milliers) 13 618 10 514 10 894 10 361 10 040 10 508 10 779 10 046Dépenses totales des visiteurs (millions de dollars) .. 3 809 4 191 3 774 4 119 4 129 4 717 4 943Dépenses sans transport (millions de dollars) 985 3 733 4 154 3 728 4 061 4 034 4 120 4 254
Arrivals of visitors (thousands) 142 (b)634 (b)672 (b)705 (b)771 (b)836 (b)871 (b)971Tourists' overnight stays (thousands) .. 1 142 1 184 1 257 1 377 1 479 1 550 1 719Total expenditure of visitors (millions of dollars) 234 386 383 415 486 558 630 663Expenditure excluding transport (millions of dollars) 152 227 232 256 319 370 408 439
Arrivées des visiteurs (milliers) 1 707 (d)2 677 (d)2 591 (d)2 428 (d)2 774 (d)3 512 (d)4 038 (d)4 626Nuitées des touristes (milliers) .. .. .. .. .. .. .. ..Dépenses totales des visiteurs (millions de dollars) .. 3 718 3 342 3 300 4 560 6 307 7 652 9 227Dépenses sans transport (millions de dollars) 1 558 3 460 3 198 3 102 4 463 6 170 7 493 8 934
Arrivals of visitors (thousands) 2 178 (a)5 064 (a)5 153 (a)5 033 (a)4 467 (a)5 321 (a)5 002 (a)4 871Tourists' overnight stays (thousands) .. .. .. .. .. .. .. ..Total expenditure of visitors (millions of dollars) .. .. .. 5 797 4 461 5 226 5 094 4 890Expenditure excluding transport (millions of dollars) 2 153 4 975 5 277 5 285 4 037 4 798 4 522 4 448
Arrivées des visiteurs (milliers) 154 (a)1 342 (a)1 402 (a)1 585 (a)1 546 (a)1 659 .. ..Nuitées des touristes (milliers) .. .. .. .. .. .. .. ..Dépenses totales des visiteurs (millions de dollars) 64 677 1 122 1 607 1 266 1 305 1 364 1 513Dépenses sans transport (millions de dollars) 28 467 891 1 357 1 033 1 044 1 069 1 194
Arrivals of visitors (thousands) 748 (d)78 (d)127 .. .. .. .. ..Tourists' overnight stays (thousands) .. .. .. .. .. .. .. ..Total expenditure of visitors (millions of dollars) .. .. .. .. .. .. .. ..Expenditure excluding transport (millions of dollars) .. 2 15 45 .. .. .. ..
Arrivées des visiteurs (milliers) 3 666 (a)6 646 (a)6 353 (a)6 476 (a)6 764 (a)6 953 (a)7 333 (a)8 001Nuitées des touristes (milliers) 36 183 21 516 45 846 45 346 47 613 47 375 50 678 56 342Dépenses totales des visiteurs (millions de dollars) 1 897 3 517 3 789 4 228 5 206 6 075 6 780 7 664Dépenses sans transport (millions de dollars) 1 459 2 615 2 791 3 097 3 862 4 375 4 782 5 369
Arrivals of visitors (thousands) 1 063 (a)2 417 (a)1 196 (a)862 (a)1 063 (a)1 506 (a)1 903 (a)1 825Tourists' overnight stays (thousands) 6 167 10 352 4 637 2 745 3 438 5 040 7 133 7 212Total expenditure of visitors (millions of dollars) 1 757 4 611 2 855 2 426 2 473 2 863 3 358 3 319Expenditure excluding transport (millions of dollars) 1 396 4 114 2 561 2 145 2 132 2 430 2 797 2 777
For sources and notes, see end of table. Pour les sources et les notes, se reporter à la fin du tableau.
Guinea-Bissau - Guinée-Bissau
Guyana
Haiti - Haïti
Honduras
Hungary - Hongrie
Iceland - Islande
India - Inde
Indonesia - Indonésie
Iran (Islamic Rep. of) - Iran (Rép. islamique d')
Iraq
Ireland - Irlande
Israel - Israël
5.3 Tourism indicators 5.3 Indicateurs du tourisme
269
5
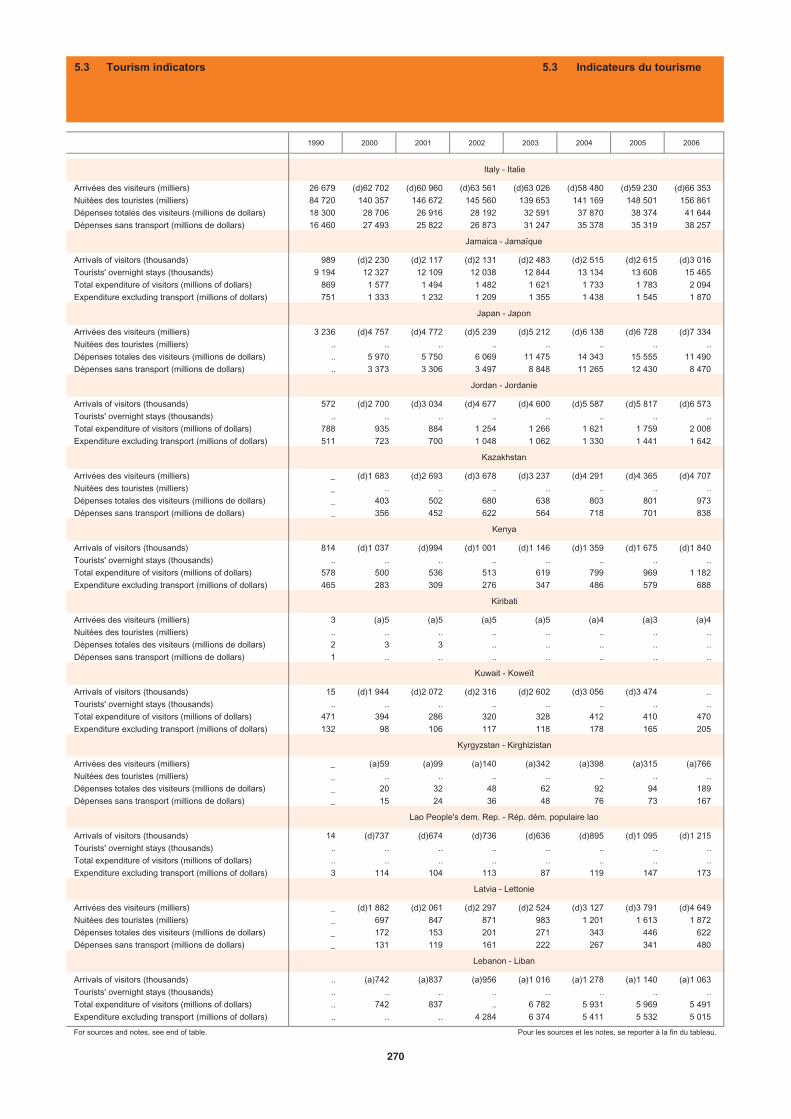
1990 2000 2001 2002 2003 2004 2005 2006
Arrivées des visiteurs (milliers) 26 679 (d)62 702 (d)60 960 (d)63 561 (d)63 026 (d)58 480 (d)59 230 (d)66 353Nuitées des touristes (milliers) 84 720 140 357 146 672 145 560 139 653 141 169 148 501 156 861Dépenses totales des visiteurs (millions de dollars) 18 300 28 706 26 916 28 192 32 591 37 870 38 374 41 644Dépenses sans transport (millions de dollars) 16 460 27 493 25 822 26 873 31 247 35 378 35 319 38 257
Arrivals of visitors (thousands) 989 (d)2 230 (d)2 117 (d)2 131 (d)2 483 (d)2 515 (d)2 615 (d)3 016Tourists' overnight stays (thousands) 9 194 12 327 12 109 12 038 12 844 13 134 13 608 15 465Total expenditure of visitors (millions of dollars) 869 1 577 1 494 1 482 1 621 1 733 1 783 2 094Expenditure excluding transport (millions of dollars) 751 1 333 1 232 1 209 1 355 1 438 1 545 1 870
Arrivées des visiteurs (milliers) 3 236 (d)4 757 (d)4 772 (d)5 239 (d)5 212 (d)6 138 (d)6 728 (d)7 334Nuitées des touristes (milliers) .. .. .. .. .. .. .. ..Dépenses totales des visiteurs (millions de dollars) .. 5 970 5 750 6 069 11 475 14 343 15 555 11 490Dépenses sans transport (millions de dollars) .. 3 373 3 306 3 497 8 848 11 265 12 430 8 470
Arrivals of visitors (thousands) 572 (d)2 700 (d)3 034 (d)4 677 (d)4 600 (d)5 587 (d)5 817 (d)6 573Tourists' overnight stays (thousands) .. .. .. .. .. .. .. ..Total expenditure of visitors (millions of dollars) 788 935 884 1 254 1 266 1 621 1 759 2 008Expenditure excluding transport (millions of dollars) 511 723 700 1 048 1 062 1 330 1 441 1 642
Arrivées des visiteurs (milliers) _ (d)1 683 (d)2 693 (d)3 678 (d)3 237 (d)4 291 (d)4 365 (d)4 707Nuitées des touristes (milliers) _ .. .. .. .. .. .. ..Dépenses totales des visiteurs (millions de dollars) _ 403 502 680 638 803 801 973Dépenses sans transport (millions de dollars) _ 356 452 622 564 718 701 838
Arrivals of visitors (thousands) 814 (d)1 037 (d)994 (d)1 001 (d)1 146 (d)1 359 (d)1 675 (d)1 840Tourists' overnight stays (thousands) .. .. .. .. .. .. .. ..Total expenditure of visitors (millions of dollars) 578 500 536 513 619 799 969 1 182Expenditure excluding transport (millions of dollars) 465 283 309 276 347 486 579 688
Arrivées des visiteurs (milliers) 3 (a)5 (a)5 (a)5 (a)5 (a)4 (a)3 (a)4Nuitées des touristes (milliers) .. .. .. .. .. .. .. ..Dépenses totales des visiteurs (millions de dollars) 2 3 3 .. .. .. .. ..Dépenses sans transport (millions de dollars) 1 .. .. .. .. .. .. ..
Arrivals of visitors (thousands) 15 (d)1 944 (d)2 072 (d)2 316 (d)2 602 (d)3 056 (d)3 474 ..Tourists' overnight stays (thousands) .. .. .. .. .. .. .. ..Total expenditure of visitors (millions of dollars) 471 394 286 320 328 412 410 470Expenditure excluding transport (millions of dollars) 132 98 106 117 118 178 165 205
Arrivées des visiteurs (milliers) _ (a)59 (a)99 (a)140 (a)342 (a)398 (a)315 (a)766Nuitées des touristes (milliers) _ .. .. .. .. .. .. ..Dépenses totales des visiteurs (millions de dollars) _ 20 32 48 62 92 94 189Dépenses sans transport (millions de dollars) _ 15 24 36 48 76 73 167
Arrivals of visitors (thousands) 14 (d)737 (d)674 (d)736 (d)636 (d)895 (d)1 095 (d)1 215Tourists' overnight stays (thousands) .. .. .. .. .. .. .. ..Total expenditure of visitors (millions of dollars) .. .. .. .. .. .. .. ..Expenditure excluding transport (millions of dollars) 3 114 104 113 87 119 147 173
Arrivées des visiteurs (milliers) _ (d)1 882 (d)2 061 (d)2 297 (d)2 524 (d)3 127 (d)3 791 (d)4 649Nuitées des touristes (milliers) _ 697 847 871 983 1 201 1 613 1 872Dépenses totales des visiteurs (millions de dollars) _ 172 153 201 271 343 446 622Dépenses sans transport (millions de dollars) _ 131 119 161 222 267 341 480
Arrivals of visitors (thousands) .. (a)742 (a)837 (a)956 (a)1 016 (a)1 278 (a)1 140 (a)1 063Tourists' overnight stays (thousands) .. .. .. .. .. .. .. ..Total expenditure of visitors (millions of dollars) .. 742 837 .. 6 782 5 931 5 969 5 491Expenditure excluding transport (millions of dollars) .. .. .. 4 284 6 374 5 411 5 532 5 015
For sources and notes, see end of table. Pour les sources et les notes, se reporter à la fin du tableau.
Italy - Italie
Jamaica - Jamaïque
Japan - Japon
Jordan - Jordanie
Kazakhstan
Kenya
Kiribati
Kuwait - Koweït
Kyrgyzstan - Kirghizistan
Lao People's dem. Rep. - Rép. dém. populaire lao
Latvia - Lettonie
Lebanon - Liban
5.3 Tourism indicators 5.3 Indicateurs du tourisme
270
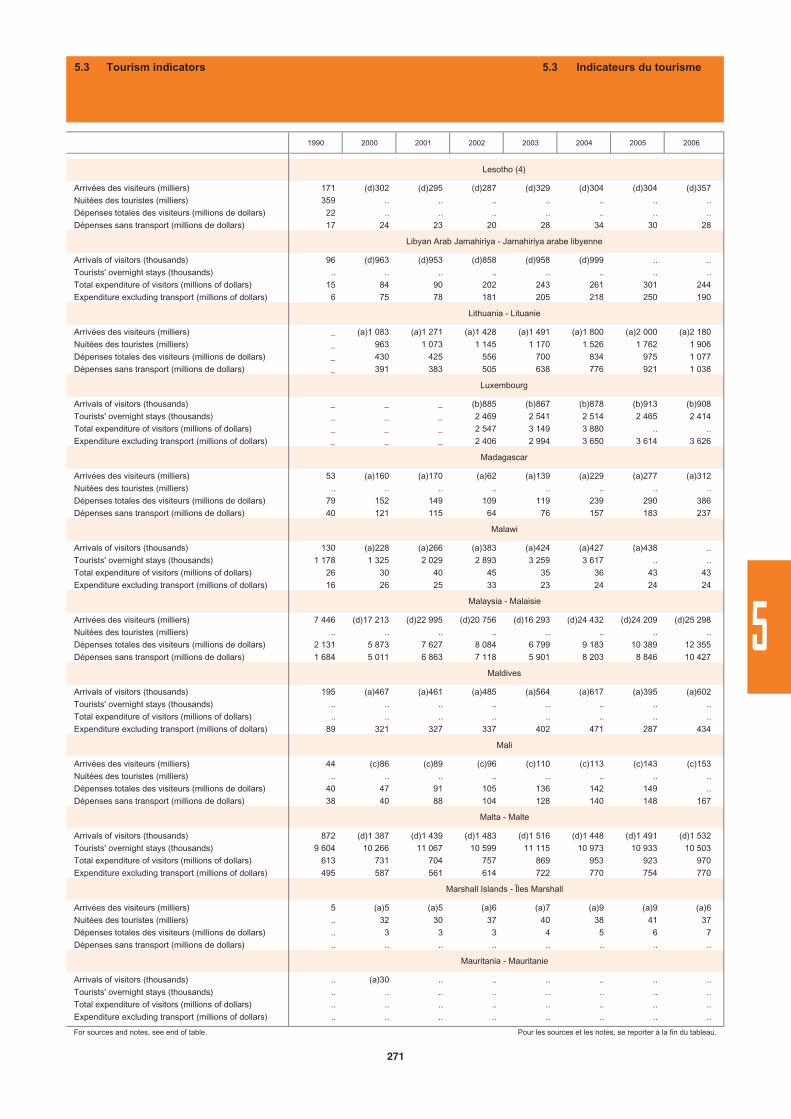
1990 2000 2001 2002 2003 2004 2005 2006
Arrivées des visiteurs (milliers) 171 (d)302 (d)295 (d)287 (d)329 (d)304 (d)304 (d)357Nuitées des touristes (milliers) 359 .. .. .. .. .. .. ..Dépenses totales des visiteurs (millions de dollars) 22 .. .. .. .. .. .. ..Dépenses sans transport (millions de dollars) 17 24 23 20 28 34 30 28
Arrivals of visitors (thousands) 96 (d)963 (d)953 (d)858 (d)958 (d)999 .. ..Tourists' overnight stays (thousands) .. .. .. .. .. .. .. ..Total expenditure of visitors (millions of dollars) 15 84 90 202 243 261 301 244Expenditure excluding transport (millions of dollars) 6 75 78 181 205 218 250 190
Arrivées des visiteurs (milliers) _ (a)1 083 (a)1 271 (a)1 428 (a)1 491 (a)1 800 (a)2 000 (a)2 180Nuitées des touristes (milliers) _ 963 1 073 1 145 1 170 1 526 1 762 1 906Dépenses totales des visiteurs (millions de dollars) _ 430 425 556 700 834 975 1 077Dépenses sans transport (millions de dollars) _ 391 383 505 638 776 921 1 038
Arrivals of visitors (thousands) _ _ _ (b)885 (b)867 (b)878 (b)913 (b)908Tourists' overnight stays (thousands) _ _ _ 2 469 2 541 2 514 2 465 2 414Total expenditure of visitors (millions of dollars) _ _ _ 2 547 3 149 3 880 .. ..Expenditure excluding transport (millions of dollars) _ _ _ 2 406 2 994 3 650 3 614 3 626
Arrivées des visiteurs (milliers) 53 (a)160 (a)170 (a)62 (a)139 (a)229 (a)277 (a)312Nuitées des touristes (milliers) .. .. .. .. .. .. .. ..Dépenses totales des visiteurs (millions de dollars) 79 152 149 109 119 239 290 386Dépenses sans transport (millions de dollars) 40 121 115 64 76 157 183 237
Arrivals of visitors (thousands) 130 (a)228 (a)266 (a)383 (a)424 (a)427 (a)438 ..Tourists' overnight stays (thousands) 1 178 1 325 2 029 2 893 3 259 3 617 .. ..Total expenditure of visitors (millions of dollars) 26 30 40 45 35 36 43 43Expenditure excluding transport (millions of dollars) 16 26 25 33 23 24 24 24
Arrivées des visiteurs (milliers) 7 446 (d)17 213 (d)22 995 (d)20 756 (d)16 293 (d)24 432 (d)24 209 (d)25 298Nuitées des touristes (milliers) .. .. .. .. .. .. .. ..Dépenses totales des visiteurs (millions de dollars) 2 131 5 873 7 627 8 084 6 799 9 183 10 389 12 355Dépenses sans transport (millions de dollars) 1 684 5 011 6 863 7 118 5 901 8 203 8 846 10 427
Arrivals of visitors (thousands) 195 (a)467 (a)461 (a)485 (a)564 (a)617 (a)395 (a)602Tourists' overnight stays (thousands) .. .. .. .. .. .. .. ..Total expenditure of visitors (millions of dollars) .. .. .. .. .. .. .. ..Expenditure excluding transport (millions of dollars) 89 321 327 337 402 471 287 434
Arrivées des visiteurs (milliers) 44 (c)86 (c)89 (c)96 (c)110 (c)113 (c)143 (c)153Nuitées des touristes (milliers) .. .. .. .. .. .. .. ..Dépenses totales des visiteurs (millions de dollars) 40 47 91 105 136 142 149 ..Dépenses sans transport (millions de dollars) 38 40 88 104 128 140 148 167
Arrivals of visitors (thousands) 872 (d)1 387 (d)1 439 (d)1 483 (d)1 516 (d)1 448 (d)1 491 (d)1 532Tourists' overnight stays (thousands) 9 604 10 266 11 067 10 599 11 115 10 973 10 933 10 503Total expenditure of visitors (millions of dollars) 613 731 704 757 869 953 923 970Expenditure excluding transport (millions of dollars) 495 587 561 614 722 770 754 770
Arrivées des visiteurs (milliers) 5 (a)5 (a)5 (a)6 (a)7 (a)9 (a)9 (a)6Nuitées des touristes (milliers) .. 32 30 37 40 38 41 37Dépenses totales des visiteurs (millions de dollars) .. 3 3 3 4 5 6 7Dépenses sans transport (millions de dollars) .. .. .. .. .. .. .. ..
Arrivals of visitors (thousands) .. (a)30 .. .. .. .. .. ..Tourists' overnight stays (thousands) .. .. .. .. .. .. .. ..Total expenditure of visitors (millions of dollars) .. .. .. .. .. .. .. ..Expenditure excluding transport (millions of dollars) .. .. .. .. .. .. .. ..
For sources and notes, see end of table. Pour les sources et les notes, se reporter à la fin du tableau.
Lesotho (4)
Libyan Arab Jamahiriya - Jamahiriya arabe libyenne
Lithuania - Lituanie
Luxembourg
Madagascar
Malawi
Malaysia - Malaisie
Maldives
Mali
Malta - Malte
Marshall Islands - Îles Marshall
Mauritania - Mauritanie
5.3 Tourism indicators 5.3 Indicateurs du tourisme
271
5
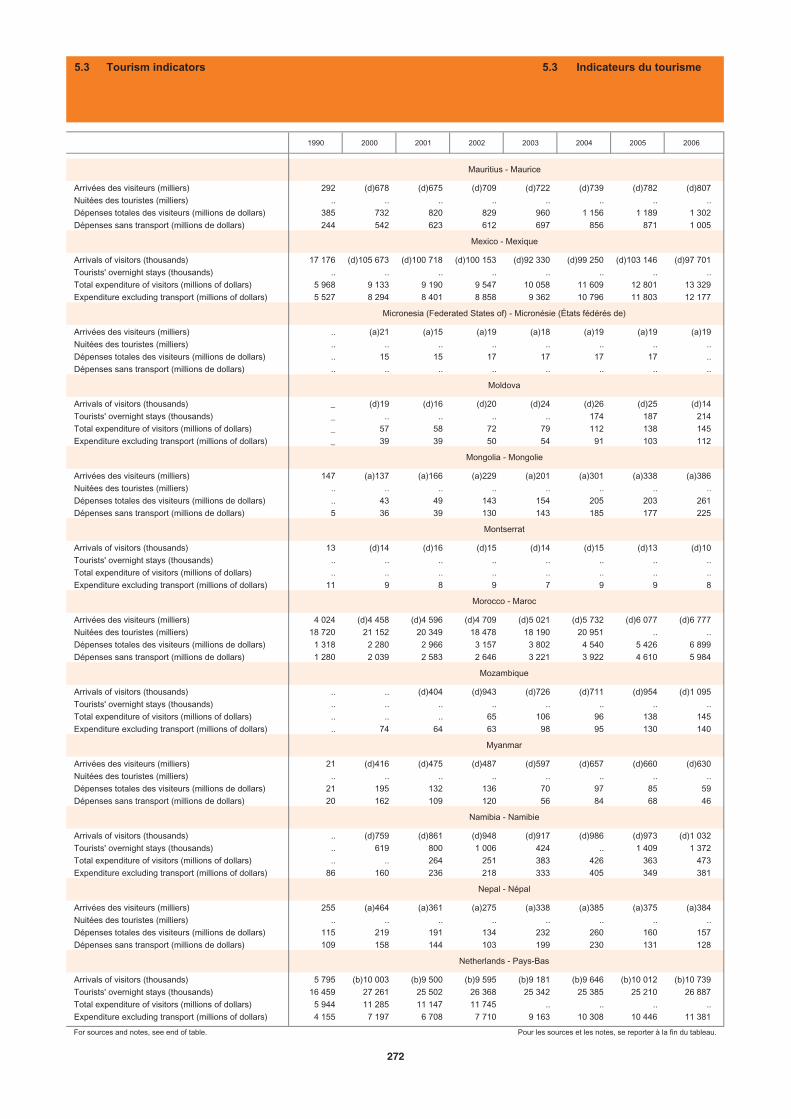
1990 2000 2001 2002 2003 2004 2005 2006
Arrivées des visiteurs (milliers) 292 (d)678 (d)675 (d)709 (d)722 (d)739 (d)782 (d)807Nuitées des touristes (milliers) .. .. .. .. .. .. .. ..Dépenses totales des visiteurs (millions de dollars) 385 732 820 829 960 1 156 1 189 1 302Dépenses sans transport (millions de dollars) 244 542 623 612 697 856 871 1 005
Arrivals of visitors (thousands) 17 176 (d)105 673 (d)100 718 (d)100 153 (d)92 330 (d)99 250 (d)103 146 (d)97 701Tourists' overnight stays (thousands) .. .. .. .. .. .. .. ..Total expenditure of visitors (millions of dollars) 5 968 9 133 9 190 9 547 10 058 11 609 12 801 13 329Expenditure excluding transport (millions of dollars) 5 527 8 294 8 401 8 858 9 362 10 796 11 803 12 177
Arrivées des visiteurs (milliers) .. (a)21 (a)15 (a)19 (a)18 (a)19 (a)19 (a)19Nuitées des touristes (milliers) .. .. .. .. .. .. .. ..Dépenses totales des visiteurs (millions de dollars) .. 15 15 17 17 17 17 ..Dépenses sans transport (millions de dollars) .. .. .. .. .. .. .. ..
Arrivals of visitors (thousands) _ (d)19 (d)16 (d)20 (d)24 (d)26 (d)25 (d)14Tourists' overnight stays (thousands) _ .. .. .. .. 174 187 214Total expenditure of visitors (millions of dollars) _ 57 58 72 79 112 138 145Expenditure excluding transport (millions of dollars) _ 39 39 50 54 91 103 112
Arrivées des visiteurs (milliers) 147 (a)137 (a)166 (a)229 (a)201 (a)301 (a)338 (a)386Nuitées des touristes (milliers) .. .. .. .. .. .. .. ..Dépenses totales des visiteurs (millions de dollars) .. 43 49 143 154 205 203 261Dépenses sans transport (millions de dollars) 5 36 39 130 143 185 177 225
Arrivals of visitors (thousands) 13 (d)14 (d)16 (d)15 (d)14 (d)15 (d)13 (d)10Tourists' overnight stays (thousands) .. .. .. .. .. .. .. ..Total expenditure of visitors (millions of dollars) .. .. .. .. .. .. .. ..Expenditure excluding transport (millions of dollars) 11 9 8 9 7 9 9 8
Arrivées des visiteurs (milliers) 4 024 (d)4 458 (d)4 596 (d)4 709 (d)5 021 (d)5 732 (d)6 077 (d)6 777Nuitées des touristes (milliers) 18 720 21 152 20 349 18 478 18 190 20 951 .. ..Dépenses totales des visiteurs (millions de dollars) 1 318 2 280 2 966 3 157 3 802 4 540 5 426 6 899Dépenses sans transport (millions de dollars) 1 280 2 039 2 583 2 646 3 221 3 922 4 610 5 984
Arrivals of visitors (thousands) .. .. (d)404 (d)943 (d)726 (d)711 (d)954 (d)1 095Tourists' overnight stays (thousands) .. .. .. .. .. .. .. ..Total expenditure of visitors (millions of dollars) .. .. .. 65 106 96 138 145Expenditure excluding transport (millions of dollars) .. 74 64 63 98 95 130 140
Arrivées des visiteurs (milliers) 21 (d)416 (d)475 (d)487 (d)597 (d)657 (d)660 (d)630Nuitées des touristes (milliers) .. .. .. .. .. .. .. ..Dépenses totales des visiteurs (millions de dollars) 21 195 132 136 70 97 85 59Dépenses sans transport (millions de dollars) 20 162 109 120 56 84 68 46
Arrivals of visitors (thousands) .. (d)759 (d)861 (d)948 (d)917 (d)986 (d)973 (d)1 032Tourists' overnight stays (thousands) .. 619 800 1 006 424 .. 1 409 1 372Total expenditure of visitors (millions of dollars) .. .. 264 251 383 426 363 473Expenditure excluding transport (millions of dollars) 86 160 236 218 333 405 349 381
Arrivées des visiteurs (milliers) 255 (a)464 (a)361 (a)275 (a)338 (a)385 (a)375 (a)384Nuitées des touristes (milliers) .. .. .. .. .. .. .. ..Dépenses totales des visiteurs (millions de dollars) 115 219 191 134 232 260 160 157Dépenses sans transport (millions de dollars) 109 158 144 103 199 230 131 128
Arrivals of visitors (thousands) 5 795 (b)10 003 (b)9 500 (b)9 595 (b)9 181 (b)9 646 (b)10 012 (b)10 739Tourists' overnight stays (thousands) 16 459 27 261 25 502 26 368 25 342 25 385 25 210 26 887Total expenditure of visitors (millions of dollars) 5 944 11 285 11 147 11 745 .. .. .. ..Expenditure excluding transport (millions of dollars) 4 155 7 197 6 708 7 710 9 163 10 308 10 446 11 381
For sources and notes, see end of table. Pour les sources et les notes, se reporter à la fin du tableau.
Mauritius - Maurice
Mexico - Mexique
Micronesia (Federated States of) - Micronésie (États fédérés de)
Moldova
Mongolia - Mongolie
Montserrat
Morocco - Maroc
Mozambique
Myanmar
Namibia - Namibie
Nepal - Népal
Netherlands - Pays-Bas
5.3 Tourism indicators 5.3 Indicateurs du tourisme
272
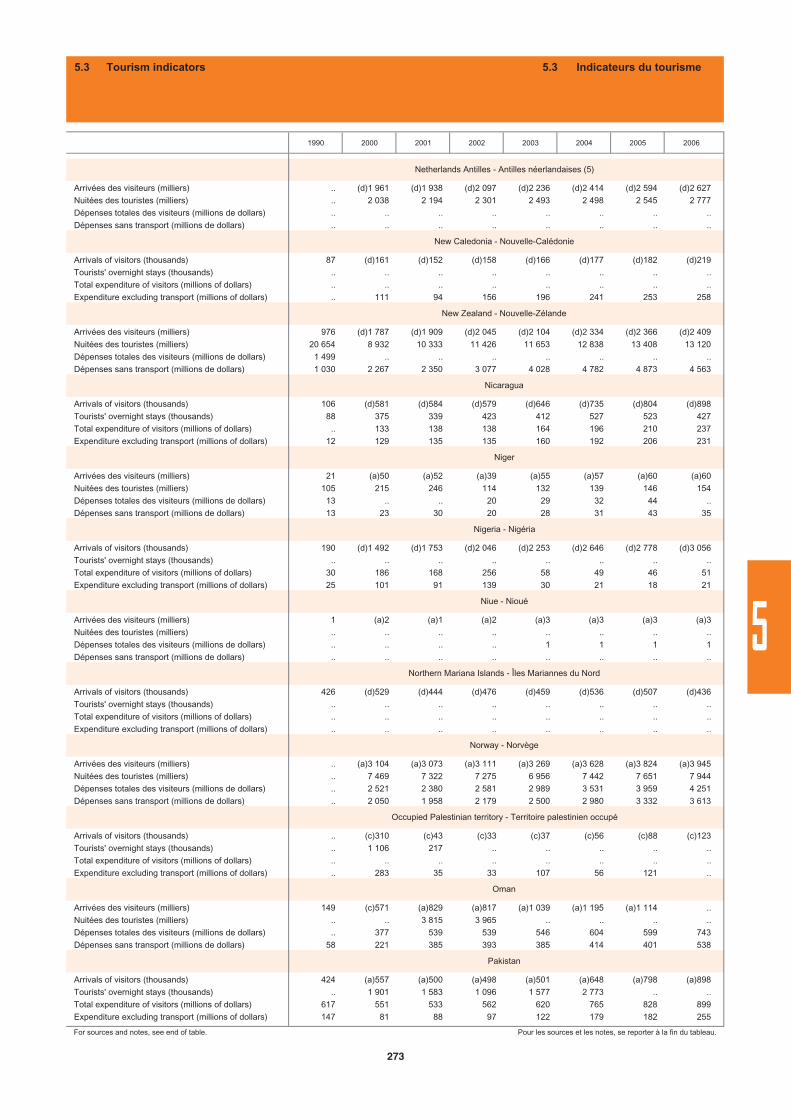
1990 2000 2001 2002 2003 2004 2005 2006
Arrivées des visiteurs (milliers) .. (d)1 961 (d)1 938 (d)2 097 (d)2 236 (d)2 414 (d)2 594 (d)2 627Nuitées des touristes (milliers) .. 2 038 2 194 2 301 2 493 2 498 2 545 2 777Dépenses totales des visiteurs (millions de dollars) .. .. .. .. .. .. .. ..Dépenses sans transport (millions de dollars) .. .. .. .. .. .. .. ..
Arrivals of visitors (thousands) 87 (d)161 (d)152 (d)158 (d)166 (d)177 (d)182 (d)219Tourists' overnight stays (thousands) .. .. .. .. .. .. .. ..Total expenditure of visitors (millions of dollars) .. .. .. .. .. .. .. ..Expenditure excluding transport (millions of dollars) .. 111 94 156 196 241 253 258
Arrivées des visiteurs (milliers) 976 (d)1 787 (d)1 909 (d)2 045 (d)2 104 (d)2 334 (d)2 366 (d)2 409Nuitées des touristes (milliers) 20 654 8 932 10 333 11 426 11 653 12 838 13 408 13 120Dépenses totales des visiteurs (millions de dollars) 1 499 .. .. .. .. .. .. ..Dépenses sans transport (millions de dollars) 1 030 2 267 2 350 3 077 4 028 4 782 4 873 4 563
Arrivals of visitors (thousands) 106 (d)581 (d)584 (d)579 (d)646 (d)735 (d)804 (d)898Tourists' overnight stays (thousands) 88 375 339 423 412 527 523 427Total expenditure of visitors (millions of dollars) .. 133 138 138 164 196 210 237Expenditure excluding transport (millions of dollars) 12 129 135 135 160 192 206 231
Arrivées des visiteurs (milliers) 21 (a)50 (a)52 (a)39 (a)55 (a)57 (a)60 (a)60Nuitées des touristes (milliers) 105 215 246 114 132 139 146 154Dépenses totales des visiteurs (millions de dollars) 13 .. .. 20 29 32 44 ..Dépenses sans transport (millions de dollars) 13 23 30 20 28 31 43 35
Arrivals of visitors (thousands) 190 (d)1 492 (d)1 753 (d)2 046 (d)2 253 (d)2 646 (d)2 778 (d)3 056Tourists' overnight stays (thousands) .. .. .. .. .. .. .. ..Total expenditure of visitors (millions of dollars) 30 186 168 256 58 49 46 51Expenditure excluding transport (millions of dollars) 25 101 91 139 30 21 18 21
Arrivées des visiteurs (milliers) 1 (a)2 (a)1 (a)2 (a)3 (a)3 (a)3 (a)3Nuitées des touristes (milliers) .. .. .. .. .. .. .. ..Dépenses totales des visiteurs (millions de dollars) .. .. .. .. 1 1 1 1Dépenses sans transport (millions de dollars) .. .. .. .. .. .. .. ..
Arrivals of visitors (thousands) 426 (d)529 (d)444 (d)476 (d)459 (d)536 (d)507 (d)436Tourists' overnight stays (thousands) .. .. .. .. .. .. .. ..Total expenditure of visitors (millions of dollars) .. .. .. .. .. .. .. ..Expenditure excluding transport (millions of dollars) .. .. .. .. .. .. .. ..
Arrivées des visiteurs (milliers) .. (a)3 104 (a)3 073 (a)3 111 (a)3 269 (a)3 628 (a)3 824 (a)3 945Nuitées des touristes (milliers) .. 7 469 7 322 7 275 6 956 7 442 7 651 7 944Dépenses totales des visiteurs (millions de dollars) .. 2 521 2 380 2 581 2 989 3 531 3 959 4 251Dépenses sans transport (millions de dollars) .. 2 050 1 958 2 179 2 500 2 980 3 332 3 613
Arrivals of visitors (thousands) .. (c)310 (c)43 (c)33 (c)37 (c)56 (c)88 (c)123Tourists' overnight stays (thousands) .. 1 106 217 .. .. .. .. ..Total expenditure of visitors (millions of dollars) .. .. .. .. .. .. .. ..Expenditure excluding transport (millions of dollars) .. 283 35 33 107 56 121 ..
Arrivées des visiteurs (milliers) 149 (c)571 (a)829 (a)817 (a)1 039 (a)1 195 (a)1 114 ..Nuitées des touristes (milliers) .. .. 3 815 3 965 .. .. .. ..Dépenses totales des visiteurs (millions de dollars) .. 377 539 539 546 604 599 743Dépenses sans transport (millions de dollars) 58 221 385 393 385 414 401 538
Arrivals of visitors (thousands) 424 (a)557 (a)500 (a)498 (a)501 (a)648 (a)798 (a)898Tourists' overnight stays (thousands) .. 1 901 1 583 1 096 1 577 2 773 .. ..Total expenditure of visitors (millions of dollars) 617 551 533 562 620 765 828 899Expenditure excluding transport (millions of dollars) 147 81 88 97 122 179 182 255
For sources and notes, see end of table. Pour les sources et les notes, se reporter à la fin du tableau.
Oman
Pakistan
Niue - Nioué
Northern Mariana Islands - Îles Mariannes du Nord
Norway - Norvège
Occupied Palestinian territory - Territoire palestinien occupé
New Zealand - Nouvelle-Zélande
Nicaragua
Niger
Nigeria - Nigéria
Netherlands Antilles - Antilles néerlandaises (5)
New Caledonia - Nouvelle-Calédonie
5.3 Tourism indicators 5.3 Indicateurs du tourisme
273
5
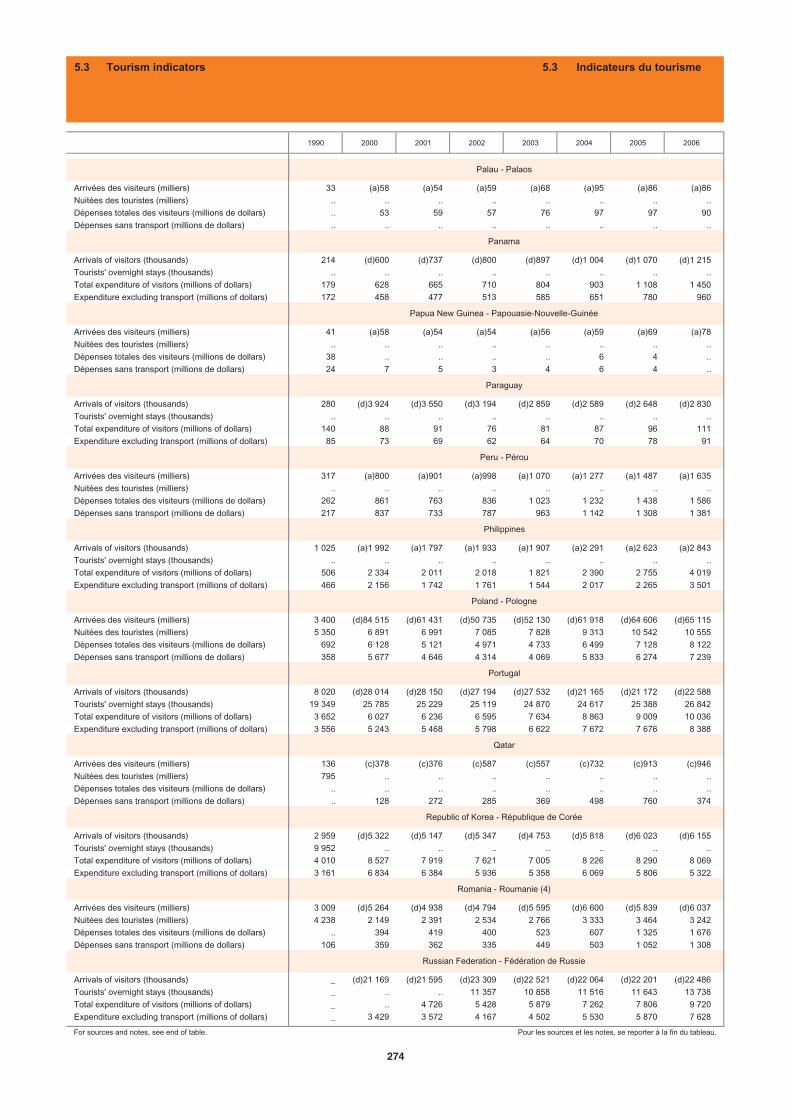
1990 2000 2001 2002 2003 2004 2005 2006
Arrivées des visiteurs (milliers) 33 (a)58 (a)54 (a)59 (a)68 (a)95 (a)86 (a)86Nuitées des touristes (milliers) .. .. .. .. .. .. .. ..Dépenses totales des visiteurs (millions de dollars) .. 53 59 57 76 97 97 90Dépenses sans transport (millions de dollars) .. .. .. .. .. .. .. ..
Arrivals of visitors (thousands) 214 (d)600 (d)737 (d)800 (d)897 (d)1 004 (d)1 070 (d)1 215Tourists' overnight stays (thousands) .. .. .. .. .. .. .. ..Total expenditure of visitors (millions of dollars) 179 628 665 710 804 903 1 108 1 450Expenditure excluding transport (millions of dollars) 172 458 477 513 585 651 780 960
Arrivées des visiteurs (milliers) 41 (a)58 (a)54 (a)54 (a)56 (a)59 (a)69 (a)78Nuitées des touristes (milliers) .. .. .. .. .. .. .. ..Dépenses totales des visiteurs (millions de dollars) 38 .. .. .. .. 6 4 ..Dépenses sans transport (millions de dollars) 24 7 5 3 4 6 4 ..
Arrivals of visitors (thousands) 280 (d)3 924 (d)3 550 (d)3 194 (d)2 859 (d)2 589 (d)2 648 (d)2 830Tourists' overnight stays (thousands) .. .. .. .. .. .. .. ..Total expenditure of visitors (millions of dollars) 140 88 91 76 81 87 96 111Expenditure excluding transport (millions of dollars) 85 73 69 62 64 70 78 91
Arrivées des visiteurs (milliers) 317 (a)800 (a)901 (a)998 (a)1 070 (a)1 277 (a)1 487 (a)1 635Nuitées des touristes (milliers) .. .. .. .. .. .. .. ..Dépenses totales des visiteurs (millions de dollars) 262 861 763 836 1 023 1 232 1 438 1 586Dépenses sans transport (millions de dollars) 217 837 733 787 963 1 142 1 308 1 381
Arrivals of visitors (thousands) 1 025 (a)1 992 (a)1 797 (a)1 933 (a)1 907 (a)2 291 (a)2 623 (a)2 843Tourists' overnight stays (thousands) .. .. .. .. .. .. .. ..Total expenditure of visitors (millions of dollars) 506 2 334 2 011 2 018 1 821 2 390 2 755 4 019Expenditure excluding transport (millions of dollars) 466 2 156 1 742 1 761 1 544 2 017 2 265 3 501
Arrivées des visiteurs (milliers) 3 400 (d)84 515 (d)61 431 (d)50 735 (d)52 130 (d)61 918 (d)64 606 (d)65 115Nuitées des touristes (milliers) 5 350 6 891 6 991 7 085 7 828 9 313 10 542 10 555Dépenses totales des visiteurs (millions de dollars) 692 6 128 5 121 4 971 4 733 6 499 7 128 8 122Dépenses sans transport (millions de dollars) 358 5 677 4 646 4 314 4 069 5 833 6 274 7 239
Arrivals of visitors (thousands) 8 020 (d)28 014 (d)28 150 (d)27 194 (d)27 532 (d)21 165 (d)21 172 (d)22 588Tourists' overnight stays (thousands) 19 349 25 785 25 229 25 119 24 870 24 617 25 388 26 842Total expenditure of visitors (millions of dollars) 3 652 6 027 6 236 6 595 7 634 8 863 9 009 10 036Expenditure excluding transport (millions of dollars) 3 556 5 243 5 468 5 798 6 622 7 672 7 676 8 388
Arrivées des visiteurs (milliers) 136 (c)378 (c)376 (c)587 (c)557 (c)732 (c)913 (c)946Nuitées des touristes (milliers) 795 .. .. .. .. .. .. ..Dépenses totales des visiteurs (millions de dollars) .. .. .. .. .. .. .. ..Dépenses sans transport (millions de dollars) .. 128 272 285 369 498 760 374
Arrivals of visitors (thousands) 2 959 (d)5 322 (d)5 147 (d)5 347 (d)4 753 (d)5 818 (d)6 023 (d)6 155Tourists' overnight stays (thousands) 9 952 .. .. .. .. .. .. ..Total expenditure of visitors (millions of dollars) 4 010 8 527 7 919 7 621 7 005 8 226 8 290 8 069Expenditure excluding transport (millions of dollars) 3 161 6 834 6 384 5 936 5 358 6 069 5 806 5 322
Arrivées des visiteurs (milliers) 3 009 (d)5 264 (d)4 938 (d)4 794 (d)5 595 (d)6 600 (d)5 839 (d)6 037Nuitées des touristes (milliers) 4 238 2 149 2 391 2 534 2 766 3 333 3 464 3 242Dépenses totales des visiteurs (millions de dollars) .. 394 419 400 523 607 1 325 1 676Dépenses sans transport (millions de dollars) 106 359 362 335 449 503 1 052 1 308
Arrivals of visitors (thousands) _ (d)21 169 (d)21 595 (d)23 309 (d)22 521 (d)22 064 (d)22 201 (d)22 486Tourists' overnight stays (thousands) _ .. .. 11 357 10 858 11 516 11 643 13 738Total expenditure of visitors (millions of dollars) _ .. 4 726 5 428 5 879 7 262 7 806 9 720Expenditure excluding transport (millions of dollars) _ 3 429 3 572 4 167 4 502 5 530 5 870 7 628
For sources and notes, see end of table. Pour les sources et les notes, se reporter à la fin du tableau.
Romania - Roumanie (4)
Russian Federation - Fédération de Russie
Poland - Pologne
Portugal
Qatar
Republic of Korea - République de Corée
Papua New Guinea - Papouasie-Nouvelle-Guinée
Paraguay
Peru - Pérou
Philippines
Palau - Palaos
Panama
5.3 Tourism indicators 5.3 Indicateurs du tourisme
274
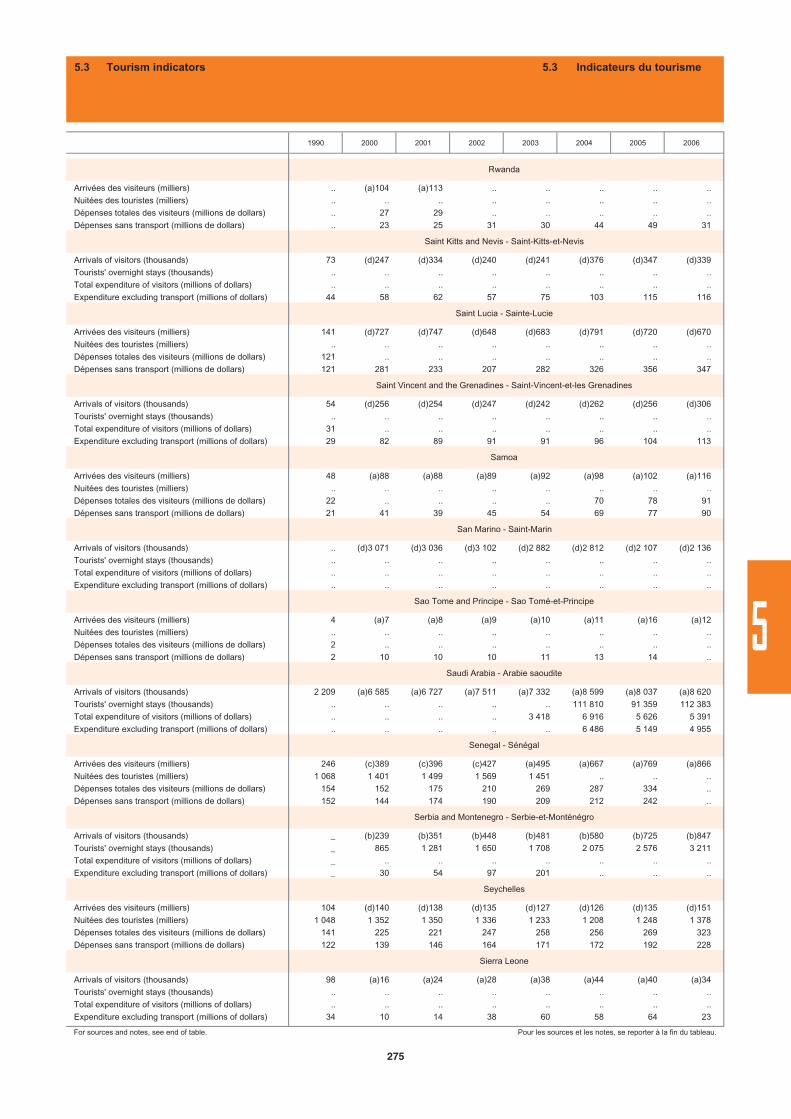
1990 2000 2001 2002 2003 2004 2005 2006
Arrivées des visiteurs (milliers) .. (a)104 (a)113 .. .. .. .. ..Nuitées des touristes (milliers) .. .. .. .. .. .. .. ..Dépenses totales des visiteurs (millions de dollars) .. 27 29 .. .. .. .. ..Dépenses sans transport (millions de dollars) .. 23 25 31 30 44 49 31
Arrivals of visitors (thousands) 73 (d)247 (d)334 (d)240 (d)241 (d)376 (d)347 (d)339Tourists' overnight stays (thousands) .. .. .. .. .. .. .. ..Total expenditure of visitors (millions of dollars) .. .. .. .. .. .. .. ..Expenditure excluding transport (millions of dollars) 44 58 62 57 75 103 115 116
Arrivées des visiteurs (milliers) 141 (d)727 (d)747 (d)648 (d)683 (d)791 (d)720 (d)670Nuitées des touristes (milliers) .. .. .. .. .. .. .. ..Dépenses totales des visiteurs (millions de dollars) 121 .. .. .. .. .. .. ..Dépenses sans transport (millions de dollars) 121 281 233 207 282 326 356 347
Arrivals of visitors (thousands) 54 (d)256 (d)254 (d)247 (d)242 (d)262 (d)256 (d)306Tourists' overnight stays (thousands) .. .. .. .. .. .. .. ..Total expenditure of visitors (millions of dollars) 31 .. .. .. .. .. .. ..Expenditure excluding transport (millions of dollars) 29 82 89 91 91 96 104 113
Arrivées des visiteurs (milliers) 48 (a)88 (a)88 (a)89 (a)92 (a)98 (a)102 (a)116Nuitées des touristes (milliers) .. .. .. .. .. .. .. ..Dépenses totales des visiteurs (millions de dollars) 22 .. .. .. .. 70 78 91Dépenses sans transport (millions de dollars) 21 41 39 45 54 69 77 90
Arrivals of visitors (thousands) .. (d)3 071 (d)3 036 (d)3 102 (d)2 882 (d)2 812 (d)2 107 (d)2 136Tourists' overnight stays (thousands) .. .. .. .. .. .. .. ..Total expenditure of visitors (millions of dollars) .. .. .. .. .. .. .. ..Expenditure excluding transport (millions of dollars) .. .. .. .. .. .. .. ..
Arrivées des visiteurs (milliers) 4 (a)7 (a)8 (a)9 (a)10 (a)11 (a)16 (a)12Nuitées des touristes (milliers) .. .. .. .. .. .. .. ..Dépenses totales des visiteurs (millions de dollars) 2 .. .. .. .. .. .. ..Dépenses sans transport (millions de dollars) 2 10 10 10 11 13 14 ..
Arrivals of visitors (thousands) 2 209 (a)6 585 (a)6 727 (a)7 511 (a)7 332 (a)8 599 (a)8 037 (a)8 620Tourists' overnight stays (thousands) .. .. .. .. .. 111 810 91 359 112 383Total expenditure of visitors (millions of dollars) .. .. .. .. 3 418 6 916 5 626 5 391Expenditure excluding transport (millions of dollars) .. .. .. .. .. 6 486 5 149 4 955
Arrivées des visiteurs (milliers) 246 (c)389 (c)396 (c)427 (a)495 (a)667 (a)769 (a)866Nuitées des touristes (milliers) 1 068 1 401 1 499 1 569 1 451 .. .. ..Dépenses totales des visiteurs (millions de dollars) 154 152 175 210 269 287 334 ..Dépenses sans transport (millions de dollars) 152 144 174 190 209 212 242 ..
Arrivals of visitors (thousands) _ (b)239 (b)351 (b)448 (b)481 (b)580 (b)725 (b)847Tourists' overnight stays (thousands) _ 865 1 281 1 650 1 708 2 075 2 576 3 211Total expenditure of visitors (millions of dollars) _ .. .. .. .. .. .. ..Expenditure excluding transport (millions of dollars) _ 30 54 97 201 .. .. ..
Arrivées des visiteurs (milliers) 104 (d)140 (d)138 (d)135 (d)127 (d)126 (d)135 (d)151Nuitées des touristes (milliers) 1 048 1 352 1 350 1 336 1 233 1 208 1 248 1 378Dépenses totales des visiteurs (millions de dollars) 141 225 221 247 258 256 269 323Dépenses sans transport (millions de dollars) 122 139 146 164 171 172 192 228
Arrivals of visitors (thousands) 98 (a)16 (a)24 (a)28 (a)38 (a)44 (a)40 (a)34Tourists' overnight stays (thousands) .. .. .. .. .. .. .. ..Total expenditure of visitors (millions of dollars) .. .. .. .. .. .. .. ..Expenditure excluding transport (millions of dollars) 34 10 14 38 60 58 64 23
For sources and notes, see end of table. Pour les sources et les notes, se reporter à la fin du tableau.
Seychelles
Sierra Leone
Sao Tome and Principe - Sao Tomé-et-Principe
Saudi Arabia - Arabie saoudite
Senegal - Sénégal
Serbia and Montenegro - Serbie-et-Monténégro
Saint Lucia - Sainte-Lucie
Saint Vincent and the Grenadines - Saint-Vincent-et-les Grenadines
Samoa
San Marino - Saint-Marin
Rwanda
Saint Kitts and Nevis - Saint-Kitts-et-Nevis
5.3 Tourism indicators 5.3 Indicateurs du tourisme
275
5
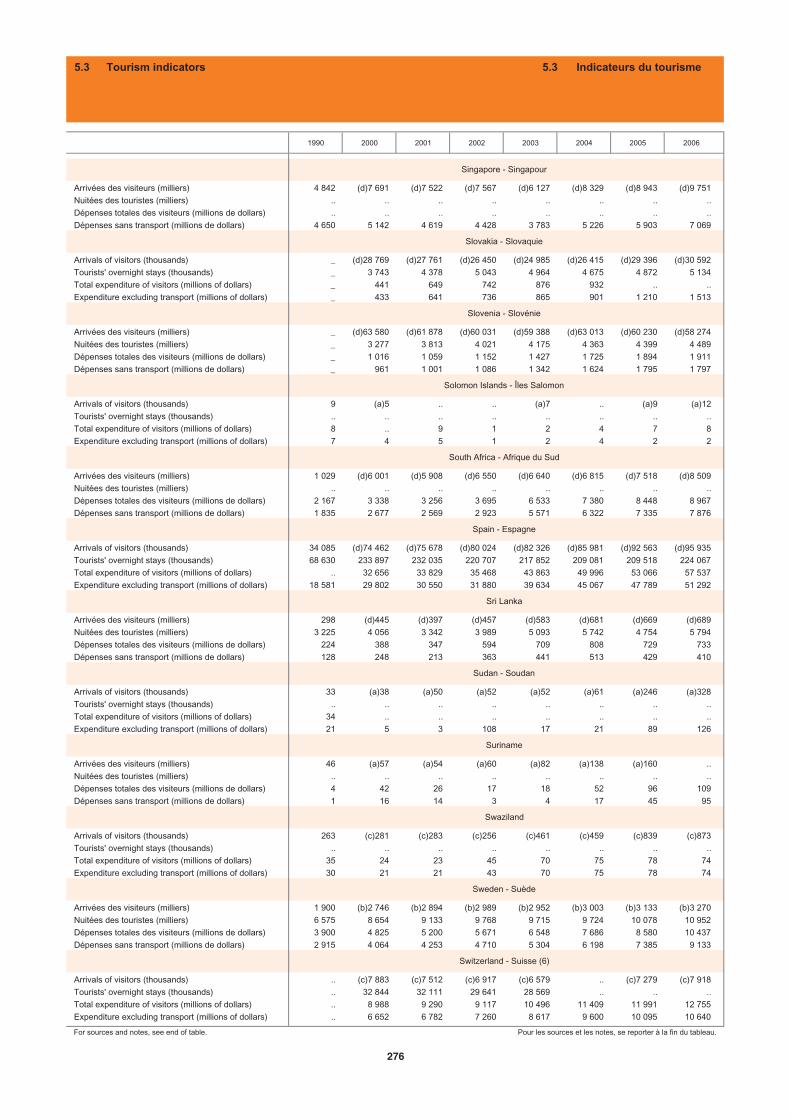
1990 2000 2001 2002 2003 2004 2005 2006
Arrivées des visiteurs (milliers) 4 842 (d)7 691 (d)7 522 (d)7 567 (d)6 127 (d)8 329 (d)8 943 (d)9 751Nuitées des touristes (milliers) .. .. .. .. .. .. .. ..Dépenses totales des visiteurs (millions de dollars) .. .. .. .. .. .. .. ..Dépenses sans transport (millions de dollars) 4 650 5 142 4 619 4 428 3 783 5 226 5 903 7 069
Arrivals of visitors (thousands) _ (d)28 769 (d)27 761 (d)26 450 (d)24 985 (d)26 415 (d)29 396 (d)30 592Tourists' overnight stays (thousands) _ 3 743 4 378 5 043 4 964 4 675 4 872 5 134Total expenditure of visitors (millions of dollars) _ 441 649 742 876 932 .. ..Expenditure excluding transport (millions of dollars) _ 433 641 736 865 901 1 210 1 513
Arrivées des visiteurs (milliers) _ (d)63 580 (d)61 878 (d)60 031 (d)59 388 (d)63 013 (d)60 230 (d)58 274Nuitées des touristes (milliers) _ 3 277 3 813 4 021 4 175 4 363 4 399 4 489Dépenses totales des visiteurs (millions de dollars) _ 1 016 1 059 1 152 1 427 1 725 1 894 1 911Dépenses sans transport (millions de dollars) _ 961 1 001 1 086 1 342 1 624 1 795 1 797
Arrivals of visitors (thousands) 9 (a)5 .. .. (a)7 .. (a)9 (a)12Tourists' overnight stays (thousands) .. .. .. .. .. .. .. ..Total expenditure of visitors (millions of dollars) 8 .. 9 1 2 4 7 8Expenditure excluding transport (millions of dollars) 7 4 5 1 2 4 2 2
Arrivées des visiteurs (milliers) 1 029 (d)6 001 (d)5 908 (d)6 550 (d)6 640 (d)6 815 (d)7 518 (d)8 509Nuitées des touristes (milliers) .. .. .. .. .. .. .. ..Dépenses totales des visiteurs (millions de dollars) 2 167 3 338 3 256 3 695 6 533 7 380 8 448 8 967Dépenses sans transport (millions de dollars) 1 835 2 677 2 569 2 923 5 571 6 322 7 335 7 876
Arrivals of visitors (thousands) 34 085 (d)74 462 (d)75 678 (d)80 024 (d)82 326 (d)85 981 (d)92 563 (d)95 935Tourists' overnight stays (thousands) 68 630 233 897 232 035 220 707 217 852 209 081 209 518 224 067Total expenditure of visitors (millions of dollars) .. 32 656 33 829 35 468 43 863 49 996 53 066 57 537Expenditure excluding transport (millions of dollars) 18 581 29 802 30 550 31 880 39 634 45 067 47 789 51 292
Arrivées des visiteurs (milliers) 298 (d)445 (d)397 (d)457 (d)583 (d)681 (d)669 (d)689Nuitées des touristes (milliers) 3 225 4 056 3 342 3 989 5 093 5 742 4 754 5 794Dépenses totales des visiteurs (millions de dollars) 224 388 347 594 709 808 729 733Dépenses sans transport (millions de dollars) 128 248 213 363 441 513 429 410
Arrivals of visitors (thousands) 33 (a)38 (a)50 (a)52 (a)52 (a)61 (a)246 (a)328Tourists' overnight stays (thousands) .. .. .. .. .. .. .. ..Total expenditure of visitors (millions of dollars) 34 .. .. .. .. .. .. ..Expenditure excluding transport (millions of dollars) 21 5 3 108 17 21 89 126
Arrivées des visiteurs (milliers) 46 (a)57 (a)54 (a)60 (a)82 (a)138 (a)160 ..Nuitées des touristes (milliers) .. .. .. .. .. .. .. ..Dépenses totales des visiteurs (millions de dollars) 4 42 26 17 18 52 96 109Dépenses sans transport (millions de dollars) 1 16 14 3 4 17 45 95
Arrivals of visitors (thousands) 263 (c)281 (c)283 (c)256 (c)461 (c)459 (c)839 (c)873Tourists' overnight stays (thousands) .. .. .. .. .. .. .. ..Total expenditure of visitors (millions of dollars) 35 24 23 45 70 75 78 74Expenditure excluding transport (millions of dollars) 30 21 21 43 70 75 78 74
Arrivées des visiteurs (milliers) 1 900 (b)2 746 (b)2 894 (b)2 989 (b)2 952 (b)3 003 (b)3 133 (b)3 270Nuitées des touristes (milliers) 6 575 8 654 9 133 9 768 9 715 9 724 10 078 10 952Dépenses totales des visiteurs (millions de dollars) 3 900 4 825 5 200 5 671 6 548 7 686 8 580 10 437Dépenses sans transport (millions de dollars) 2 915 4 064 4 253 4 710 5 304 6 198 7 385 9 133
Arrivals of visitors (thousands) .. (c)7 883 (c)7 512 (c)6 917 (c)6 579 .. (c)7 279 (c)7 918Tourists' overnight stays (thousands) .. 32 844 32 111 29 641 28 569 .. .. ..Total expenditure of visitors (millions of dollars) .. 8 988 9 290 9 117 10 496 11 409 11 991 12 755Expenditure excluding transport (millions of dollars) .. 6 652 6 782 7 260 8 617 9 600 10 095 10 640
For sources and notes, see end of table. Pour les sources et les notes, se reporter à la fin du tableau.
Sweden - Suède
Switzerland - Suisse (6)
Sri Lanka
Sudan - Soudan
Suriname
Swaziland
Slovenia - Slovénie
Solomon Islands - Îles Salomon
South Africa - Afrique du Sud
Spain - Espagne
Singapore - Singapour
Slovakia - Slovaquie
5.3 Tourism indicators 5.3 Indicateurs du tourisme
276

1990 2000 2001 2002 2003 2004 2005 2006
Arrivées des visiteurs (milliers) 562 (d)3 015 (d)3 327 (d)4 273 (d)4 388 (d)6 154 (d)5 838 (d)6 009Nuitées des touristes (milliers) .. 5 997 .. .. 20 700 27 930 30 948 48 482Dépenses totales des visiteurs (millions de dollars) .. .. .. .. 877 1 883 2 035 2 113Dépenses sans transport (millions de dollars) 320 1 082 1 150 970 773 1 800 1 944 2 025
Arrivals of visitors (thousands) _ (d)8 (d)5 .. .. .. .. ..Tourists' overnight stays (thousands) _ .. .. .. .. .. .. ..Total expenditure of visitors (millions of dollars) _ .. .. 5 7 9 10 11Expenditure excluding transport (millions of dollars) _ .. .. 2 2 1 2 2
Arrivées des visiteurs (milliers) 5 299 (a)9 579 (a)10 133 (a)10 873 (a)10 082 (a)11 737 (a)11 567 (a)13 822Nuitées des touristes (milliers) .. .. .. .. .. .. .. ..Dépenses totales des visiteurs (millions de dollars) 4 987 9 936 9 380 10 388 10 456 13 054 12 102 15 653Dépenses sans transport (millions de dollars) 4 325 7 483 7 076 7 901 7 856 10 043 9 577 12 432
Arrivals of visitors (thousands) _ (d)2 865 (d)1 730 (d)2 079 (d)2 183 (d)2 594 (d)3 246 (d)3 369Tourists' overnight stays (thousands) _ 494 213 275 346 361 443 443Total expenditure of visitors (millions of dollars) _ 88 49 55 65 77 92 156Expenditure excluding transport (millions of dollars) _ 38 26 39 57 72 84 129
Arrivées des visiteurs (milliers) 103 (c)60 (c)57 (c)58 (c)61 (c)83 (c)81 (c)94Nuitées des touristes (milliers) .. .. .. .. .. .. .. ..Dépenses totales des visiteurs (millions de dollars) .. 11 14 16 26 25 27 26Dépenses sans transport (millions de dollars) 58 8 11 13 15 19 20 10
Arrivals of visitors (thousands) 21 (d)43 (d)38 (d)45 (d)51 (d)51 (d)60 (d)54Tourists' overnight stays (thousands) 328 .. .. .. .. .. .. ..Total expenditure of visitors (millions of dollars) 7 .. .. .. .. .. .. ..Expenditure excluding transport (millions of dollars) 7 7 7 6 10 13 15 16
Arrivées des visiteurs (milliers) 195 (d)503 (d)465 (d)444 (d)465 (d)497 (d)530 (d)543Nuitées des touristes (milliers) .. .. .. .. .. .. .. ..Dépenses totales des visiteurs (millions de dollars) 221 371 361 402 437 568 593 357Dépenses sans transport (millions de dollars) 95 213 201 242 249 341 453 177
Arrivals of visitors (thousands) 3 204 (d)5 244 (d)5 663 (d)5 322 (d)5 492 (d)6 419 (d)6 975 (d)7 176Tourists' overnight stays (thousands) .. .. .. .. .. .. .. ..Total expenditure of visitors (millions of dollars) 1 197 1 978 2 061 1 831 1 935 2 432 2 800 2 999Expenditure excluding transport (millions of dollars) 1 020 1 682 1 751 1 523 1 583 1 970 2 143 2 275
Arrivées des visiteurs (milliers) 4 799 (d)10 428 (d)11 619 (d)13 256 (d)14 030 (d)17 517 (d)21 125 (d)19 820Nuitées des touristes (milliers) 13 271 28 511 36 368 43 312 40 866 49 728 56 108 46 640Dépenses totales des visiteurs (millions de dollars) .. .. .. .. .. .. 19 720 18 520Dépenses sans transport (millions de dollars) 3 225 7 636 10 067 11 901 13 203 15 888 18 152 16 853
Arrivals of visitors (thousands) _ (a)3 (a)5 (a)11 (a)8 (a)15 (a)12 ..Tourists' overnight stays (thousands) _ .. .. .. .. .. .. ..Total expenditure of visitors (millions of dollars) _ .. .. .. .. .. .. ..Expenditure excluding transport (millions of dollars) _ .. .. .. .. .. .. ..
Arrivées des visiteurs (milliers) 49 (a)152 (a)166 (a)155 (a)164 (a)173 (a)176 (a)248Nuitées des touristes (milliers) .. 1 142 1 239 1 172 .. .. .. ..Dépenses totales des visiteurs (millions de dollars) .. 285 311 292 .. .. .. ..Dépenses sans transport (millions de dollars) .. .. .. .. .. .. .. ..
Arrivals of visitors (thousands) 1 (a)1 (a)1 (a)1 (a)1 (a)1 (a)1 (a)1Tourists' overnight stays (thousands) .. .. .. .. .. .. .. ..Total expenditure of visitors (millions of dollars) .. .. .. .. .. .. .. ..Expenditure excluding transport (millions of dollars) .. .. .. .. .. .. .. ..
For sources and notes, see end of table. Pour les sources et les notes, se reporter à la fin du tableau.
Turks and Caicos Islands - Îles Turques et Caïques
Tuvalu
Trinidad and Tobago - Trinité-et-Tobago
Tunisia - Tunisie
Turkey - Turquie
Turkmenistan - Turkménistan
Thailand - Thaïlande
TFY Rep. of Macedonia - ERY de Macédoine
Togo
Tonga
Syrian Arab Republic - République arabe syrienne
Tajikistan - Tadjikistan
5.3 Tourism indicators 5.3 Indicateurs du tourisme
277
5
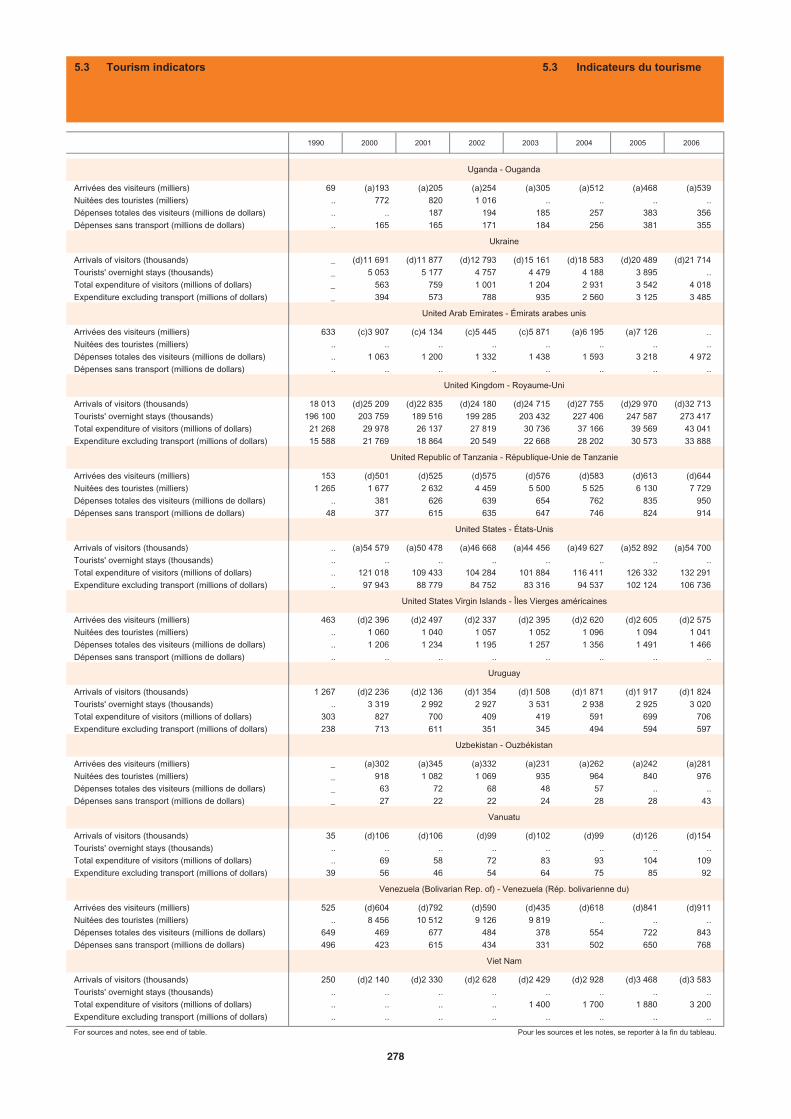
1990 2000 2001 2002 2003 2004 2005 2006
Arrivées des visiteurs (milliers) 69 (a)193 (a)205 (a)254 (a)305 (a)512 (a)468 (a)539Nuitées des touristes (milliers) .. 772 820 1 016 .. .. .. ..Dépenses totales des visiteurs (millions de dollars) .. .. 187 194 185 257 383 356Dépenses sans transport (millions de dollars) .. 165 165 171 184 256 381 355
Arrivals of visitors (thousands) _ (d)11 691 (d)11 877 (d)12 793 (d)15 161 (d)18 583 (d)20 489 (d)21 714Tourists' overnight stays (thousands) _ 5 053 5 177 4 757 4 479 4 188 3 895 ..Total expenditure of visitors (millions of dollars) _ 563 759 1 001 1 204 2 931 3 542 4 018Expenditure excluding transport (millions of dollars) _ 394 573 788 935 2 560 3 125 3 485
Arrivées des visiteurs (milliers) 633 (c)3 907 (c)4 134 (c)5 445 (c)5 871 (a)6 195 (a)7 126 ..Nuitées des touristes (milliers) .. .. .. .. .. .. .. ..Dépenses totales des visiteurs (millions de dollars) .. 1 063 1 200 1 332 1 438 1 593 3 218 4 972Dépenses sans transport (millions de dollars) .. .. .. .. .. .. .. ..
Arrivals of visitors (thousands) 18 013 (d)25 209 (d)22 835 (d)24 180 (d)24 715 (d)27 755 (d)29 970 (d)32 713Tourists' overnight stays (thousands) 196 100 203 759 189 516 199 285 203 432 227 406 247 587 273 417Total expenditure of visitors (millions of dollars) 21 268 29 978 26 137 27 819 30 736 37 166 39 569 43 041Expenditure excluding transport (millions of dollars) 15 588 21 769 18 864 20 549 22 668 28 202 30 573 33 888
Arrivées des visiteurs (milliers) 153 (d)501 (d)525 (d)575 (d)576 (d)583 (d)613 (d)644Nuitées des touristes (milliers) 1 265 1 677 2 632 4 459 5 500 5 525 6 130 7 729Dépenses totales des visiteurs (millions de dollars) .. 381 626 639 654 762 835 950Dépenses sans transport (millions de dollars) 48 377 615 635 647 746 824 914
Arrivals of visitors (thousands) .. (a)54 579 (a)50 478 (a)46 668 (a)44 456 (a)49 627 (a)52 892 (a)54 700Tourists' overnight stays (thousands) .. .. .. .. .. .. .. ..Total expenditure of visitors (millions of dollars) .. 121 018 109 433 104 284 101 884 116 411 126 332 132 291Expenditure excluding transport (millions of dollars) .. 97 943 88 779 84 752 83 316 94 537 102 124 106 736
Arrivées des visiteurs (milliers) 463 (d)2 396 (d)2 497 (d)2 337 (d)2 395 (d)2 620 (d)2 605 (d)2 575Nuitées des touristes (milliers) .. 1 060 1 040 1 057 1 052 1 096 1 094 1 041Dépenses totales des visiteurs (millions de dollars) .. 1 206 1 234 1 195 1 257 1 356 1 491 1 466Dépenses sans transport (millions de dollars) .. .. .. .. .. .. .. ..
Arrivals of visitors (thousands) 1 267 (d)2 236 (d)2 136 (d)1 354 (d)1 508 (d)1 871 (d)1 917 (d)1 824Tourists' overnight stays (thousands) .. 3 319 2 992 2 927 3 531 2 938 2 925 3 020Total expenditure of visitors (millions of dollars) 303 827 700 409 419 591 699 706Expenditure excluding transport (millions of dollars) 238 713 611 351 345 494 594 597
Arrivées des visiteurs (milliers) _ (a)302 (a)345 (a)332 (a)231 (a)262 (a)242 (a)281Nuitées des touristes (milliers) _ 918 1 082 1 069 935 964 840 976Dépenses totales des visiteurs (millions de dollars) _ 63 72 68 48 57 .. ..Dépenses sans transport (millions de dollars) _ 27 22 22 24 28 28 43
Arrivals of visitors (thousands) 35 (d)106 (d)106 (d)99 (d)102 (d)99 (d)126 (d)154Tourists' overnight stays (thousands) .. .. .. .. .. .. .. ..Total expenditure of visitors (millions of dollars) .. 69 58 72 83 93 104 109Expenditure excluding transport (millions of dollars) 39 56 46 54 64 75 85 92
Arrivées des visiteurs (milliers) 525 (d)604 (d)792 (d)590 (d)435 (d)618 (d)841 (d)911Nuitées des touristes (milliers) .. 8 456 10 512 9 126 9 819 .. .. ..Dépenses totales des visiteurs (millions de dollars) 649 469 677 484 378 554 722 843Dépenses sans transport (millions de dollars) 496 423 615 434 331 502 650 768
Arrivals of visitors (thousands) 250 (d)2 140 (d)2 330 (d)2 628 (d)2 429 (d)2 928 (d)3 468 (d)3 583Tourists' overnight stays (thousands) .. .. .. .. .. .. .. ..Total expenditure of visitors (millions of dollars) .. .. .. .. 1 400 1 700 1 880 3 200Expenditure excluding transport (millions of dollars) .. .. .. .. .. .. .. ..
For sources and notes, see end of table. Pour les sources et les notes, se reporter à la fin du tableau.
Venezuela (Bolivarian Rep. of) - Venezuela (Rép. bolivarienne du)
Viet Nam
United States Virgin Islands - Îles Vierges américaines
Uruguay
Uzbekistan - Ouzbékistan
Vanuatu
United Kingdom - Royaume-Uni
United Republic of Tanzania - République-Unie de Tanzanie
United States - États-Unis
United Arab Emirates - Émirats arabes unis
Uganda - Ouganda
Ukraine
5.3 Tourism indicators 5.3 Indicateurs du tourisme
278
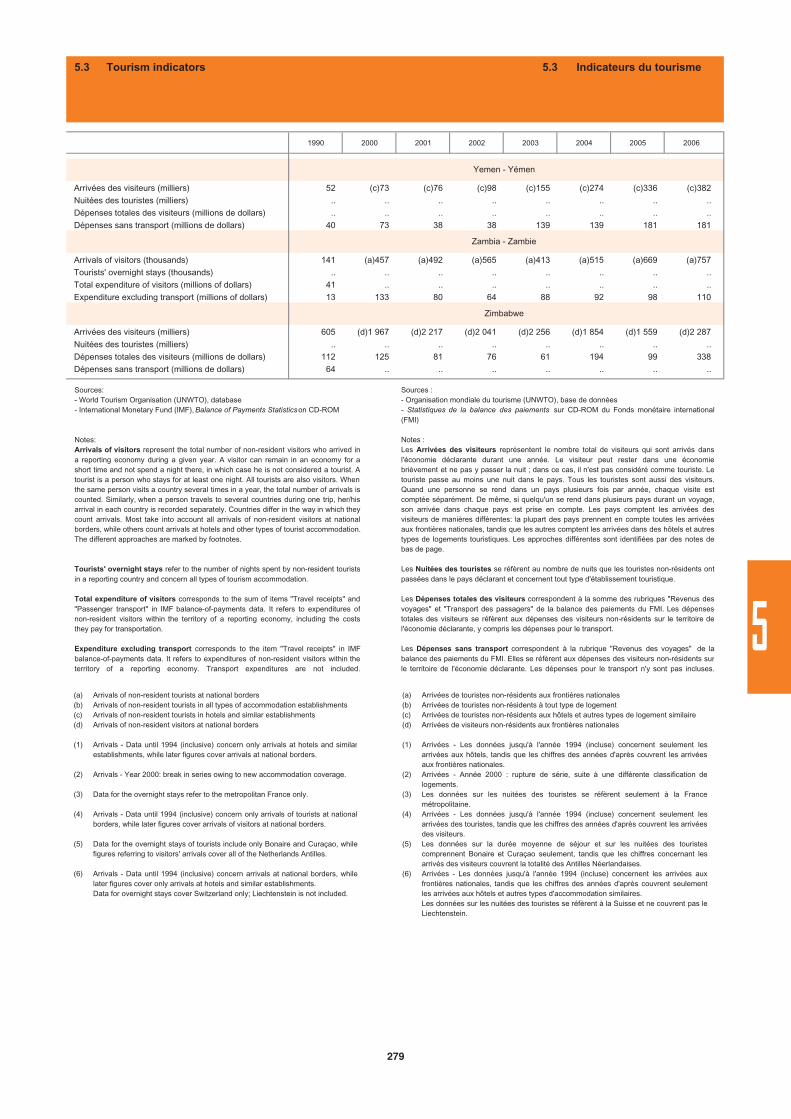
1990 2000 2001 2002 2003 2004 2005 2006
Arrivées des visiteurs (milliers) 52 (c)73 (c)76 (c)98 (c)155 (c)274 (c)336 (c)382Nuitées des touristes (milliers) .. .. .. .. .. .. .. ..Dépenses totales des visiteurs (millions de dollars) .. .. .. .. .. .. .. ..Dépenses sans transport (millions de dollars) 40 73 38 38 139 139 181 181
Arrivals of visitors (thousands) 141 (a)457 (a)492 (a)565 (a)413 (a)515 (a)669 (a)757Tourists' overnight stays (thousands) .. .. .. .. .. .. .. ..Total expenditure of visitors (millions of dollars) 41 .. .. .. .. .. .. ..Expenditure excluding transport (millions of dollars) 13 133 80 64 88 92 98 110
Arrivées des visiteurs (milliers) 605 (d)1 967 (d)2 217 (d)2 041 (d)2 256 (d)1 854 (d)1 559 (d)2 287Nuitées des touristes (milliers) .. .. .. .. .. .. .. ..Dépenses totales des visiteurs (millions de dollars) 112 125 81 76 61 194 99 338Dépenses sans transport (millions de dollars) 64 .. .. .. .. .. .. ..
Zimbabwe
Yemen - Yémen
Zambia - Zambie
5.3 Tourism indicators 5.3 Indicateurs du tourisme
(a)(b)(c)(d)
(1)
(2)
(3)
(4)
(5)
(6)
Arrivals of non-resident tourists at national bordersArrivals of non-resident tourists in all types of accommodation establishmentsArrivals of non-resident tourists in hotels and similar establishmentsArrivals of non-resident visitors at national borders
Arrivals - Data until 1994 (inclusive) concern only arrivals at hotels and similarestablishments, while later figures cover arrivals at national borders.
Arrivals - Year 2000: break in series owing to new accommodation coverage.
Data for the overnight stays refer to the metropolitan France only.
Arrivals - Data until 1994 (inclusive) concern only arrivals of tourists at nationalborders, while later figures cover arrivals of visitors at national borders.
Data for the overnight stays of tourists include only Bonaire and Curaçao, whilefigures referring to visitors' arrivals cover all of the Netherlands Antilles.
Arrivals - Data until 1994 (inclusive) concern arrivals at national borders, whilelater figures cover only arrivals at hotels and similar establishments.Data for overnight stays cover Switzerland only; Liechtenstein is not included.
Sources:- World Tourism Organisation (UNWTO), database- International Monetary Fund (IMF), Balance of Payments Statisticson CD-ROM
Notes:Arrivals of visitors represent the total number of non-resident visitors who arrived ina reporting economy during a given year. A visitor can remain in an economy for ashort time and not spend a night there, in which case he is not considered a tourist. Atourist is a person who stays for at least one night. All tourists are also visitors. Whenthe same person visits a country several times in a year, the total number of arrivals iscounted. Similarly, when a person travels to several countries during one trip, her/hisarrival in each country is recorded separately. Countries differ in the way in which theycount arrivals. Most take into account all arrivals of non-resident visitors at nationalborders, while others count arrivals at hotels and other types of tourist accommodation.The different approaches are marked by footnotes.
Tourists' overnight stays refer to the number of nights spent by non-resident touristsin a reporting country and concern all types of tourism accommodation.
Total expenditure of visitors corresponds to the sum of items "Travel receipts" and"Passenger transport" in IMF balance-of-payments data. It refers to expenditures ofnon-resident visitors within the territory of a reporting economy, including the coststhey pay for transportation.
Expenditure excluding transport corresponds to the item "Travel receipts" in IMFbalance-of-payments data. It refers to expenditures of non-resident visitors within theterritory of a reporting economy. Transport expenditures are not included.
(a)(b)(c)(d)
(1)
(2)
(3)
(4)
(5)
(6)
Arrivées de touristes non-résidents aux frontières nationalesArrivées de touristes non-résidents à tout type de logementArrivées de touristes non-résidents aux hôtels et autres types de logement similaireArrivées de visiteurs non-résidents aux frontières nationales
Arrivées - Les données jusqu'à l'année 1994 (incluse) concernent seulement lesarrivées aux hôtels, tandis que les chiffres des années d'après couvrent les arrivéesaux frontières nationales.Arrivées - Année 2000 : rupture de série, suite à une différente classification delogements.Les données sur les nuitées des touristes se réfèrent seulement à la Francemétropolitaine.Arrivées - Les données jusqu'à l'année 1994 (incluse) concernent seulement lesarrivées des touristes, tandis que les chiffres des années d'après couvrent les arrivéesdes visiteurs.Les données sur la durée moyenne de séjour et sur les nuitées des touristescomprennent Bonaire et Curaçao seulement, tandis que les chiffres concernant lesarrivés des visiteurs couvrent la totalité des Antilles Néerlandaises. Arrivées - Les données jusqu'à l'année 1994 (incluse) concernent les arrivées auxfrontières nationales, tandis que les chiffres des années d'après couvrent seulementles arrivées aux hôtels et autres types d'accommodation similaires.Les données sur les nuitées des touristes se réfèrent à la Suisse et ne couvrent pas leLiechtenstein.
Sources : - Organisation mondiale du tourisme (UNWTO), base de données- Statistiques de la balance des paiements sur CD-ROM du Fonds monétaire international(FMI)
Notes :Les Arrivées des visiteurs représentent le nombre total de visiteurs qui sont arrivés dansl'économie déclarante durant une année. Le visiteur peut rester dans une économiebrièvement et ne pas y passer la nuit ; dans ce cas, il n'est pas considéré comme touriste. Letouriste passe au moins une nuit dans le pays. Tous les touristes sont aussi des visiteurs.Quand une personne se rend dans un pays plusieurs fois par année, chaque visite estcomptée séparément. De même, si quelqu'un se rend dans plusieurs pays durant un voyage,son arrivée dans chaque pays est prise en compte. Les pays comptent les arrivées desvisiteurs de manières différentes: la plupart des pays prennent en compte toutes les arrivéesaux frontières nationales, tandis que les autres comptent les arrivées dans des hôtels et autrestypes de logements touristiques. Les approches différentes sont identifiées par des notes debas de page.
Les Nuitées des touristes se réfèrent au nombre de nuits que les touristes non-résidents ontpassées dans le pays déclarant et concernent tout type d'établissement touristique.
Les Dépenses totales des visiteurs correspondent à la somme des rubriques "Revenus desvoyages" et "Transport des passagers" de la balance des paiements du FMI. Les dépensestotales des visiteurs se réfèrent aux dépenses des visiteurs non-résidents sur le territoire del'économie déclarante, y compris les dépenses pour le transport.
Les Dépenses sans transport correspondent à la rubrique "Revenus des voyages" de labalance des paiements du FMI. Elles se réfèrent aux dépenses des visiteurs non-résidents surle territoire de l'économie déclarante. Les dépenses pour le transport n'y sont pas incluses.
279
5
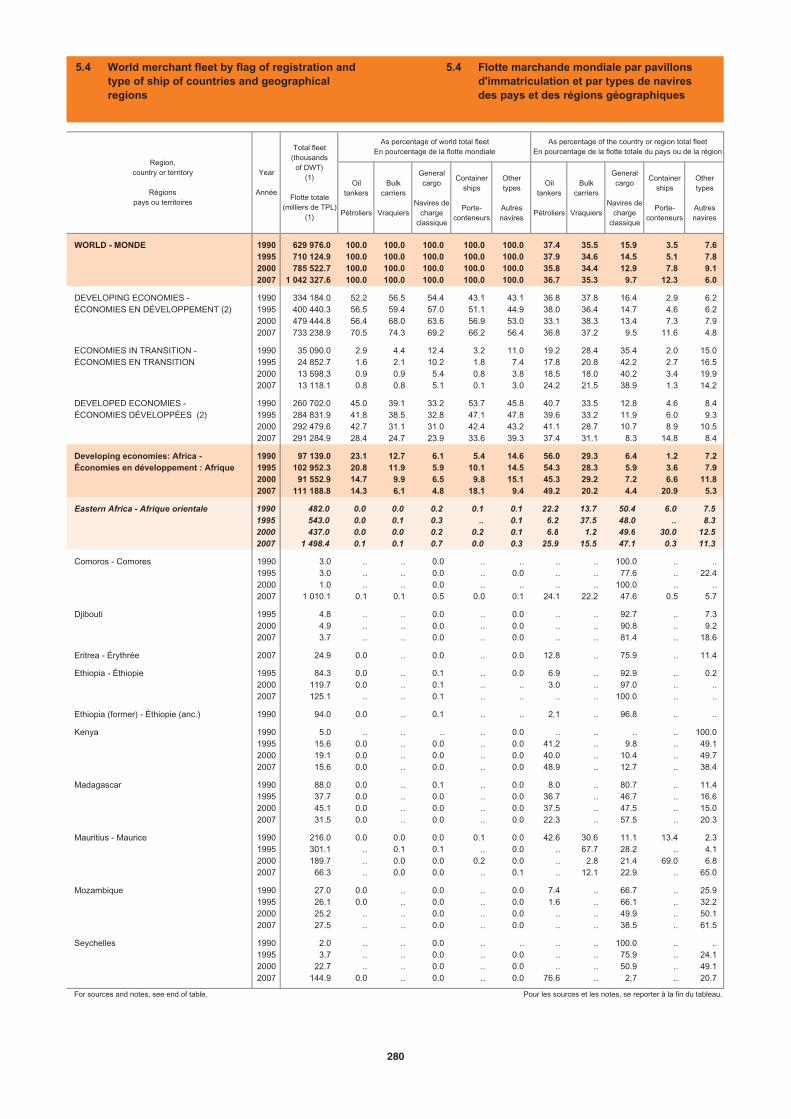
Oiltankers
Pétroliers
Bulkcarriers
Vraquiers
Generalcargo
Navires de charge
classique
Containerships
Porte-conteneurs
Othertypes
Autresnavires
Oiltankers
Pétroliers
Bulkcarriers
Vraquiers
Generalcargo
Navires de charge
classique
Containerships
Porte-conteneurs
Othertypes
Autresnavires
WORLD - MONDE 1990 629 976.0 100.0 100.0 100.0 100.0 100.0 37.4 35.5 15.9 3.5 7.61995 710 124.9 100.0 100.0 100.0 100.0 100.0 37.9 34.6 14.5 5.1 7.82000 785 522.7 100.0 100.0 100.0 100.0 100.0 35.8 34.4 12.9 7.8 9.12007 1 042 327.6 100.0 100.0 100.0 100.0 100.0 36.7 35.3 9.7 12.3 6.0
DEVELOPING ECONOMIES - 1990 334 184.0 52.2 56.5 54.4 43.1 43.1 36.8 37.8 16.4 2.9 6.2ÉCONOMIES EN DÉVELOPPEMENT (2) 1995 400 440.3 56.5 59.4 57.0 51.1 44.9 38.0 36.4 14.7 4.6 6.2
2000 479 444.8 56.4 68.0 63.6 56.9 53.0 33.1 38.3 13.4 7.3 7.92007 733 238.9 70.5 74.3 69.2 66.2 56.4 36.8 37.2 9.5 11.6 4.8
ECONOMIES IN TRANSITION - 1990 35 090.0 2.9 4.4 12.4 3.2 11.0 19.2 28.4 35.4 2.0 15.0ÉCONOMIES EN TRANSITION 1995 24 852.7 1.6 2.1 10.2 1.8 7.4 17.8 20.8 42.2 2.7 16.5
2000 13 598.3 0.9 0.9 5.4 0.8 3.8 18.5 18.0 40.2 3.4 19.92007 13 118.1 0.8 0.8 5.1 0.1 3.0 24.2 21.5 38.9 1.3 14.2
DEVELOPED ECONOMIES - 1990 260 702.0 45.0 39.1 33.2 53.7 45.8 40.7 33.5 12.8 4.6 8.4ÉCONOMIES DÉVELOPPÉES (2) 1995 284 831.9 41.8 38.5 32.8 47.1 47.8 39.6 33.2 11.9 6.0 9.3
2000 292 479.6 42.7 31.1 31.0 42.4 43.2 41.1 28.7 10.7 8.9 10.52007 291 284.9 28.4 24.7 23.9 33.6 39.3 37.4 31.1 8.3 14.8 8.4
Developing economies: Africa - 1990 97 139.0 23.1 12.7 6.1 5.4 14.6 56.0 29.3 6.4 1.2 7.2Économies en développement : Afrique 1995 102 952.3 20.8 11.9 5.9 10.1 14.5 54.3 28.3 5.9 3.6 7.9
2000 91 552.9 14.7 9.9 6.5 9.8 15.1 45.3 29.2 7.2 6.6 11.82007 111 188.8 14.3 6.1 4.8 18.1 9.4 49.2 20.2 4.4 20.9 5.3
Eastern Africa - Afrique orientale 1990 482.0 0.0 0.0 0.2 0.1 0.1 22.2 13.7 50.4 6.0 7.51995 543.0 0.0 0.1 0.3 .. 0.1 6.2 37.5 48.0 .. 8.32000 437.0 0.0 0.0 0.2 0.2 0.1 6.8 1.2 49.6 30.0 12.52007 1 498.4 0.1 0.1 0.7 0.0 0.3 25.9 15.5 47.1 0.3 11.3
Comoros - Comores 1990 3.0 .. .. 0.0 .. .. .. .. 100.0 .. ..1995 3.0 .. .. 0.0 .. 0.0 .. .. 77.6 .. 22.42000 1.0 .. .. 0.0 .. .. .. .. 100.0 .. ..2007 1 010.1 0.1 0.1 0.5 0.0 0.1 24.1 22.2 47.6 0.5 5.7
Djibouti 1995 4.8 .. .. 0.0 .. 0.0 .. .. 92.7 .. 7.32000 4.9 .. .. 0.0 .. 0.0 .. .. 90.8 .. 9.22007 3.7 .. .. 0.0 .. 0.0 .. .. 81.4 .. 18.6
Eritrea - Érythrée 2007 24.9 0.0 .. 0.0 .. 0.0 12.8 .. 75.9 .. 11.4
Ethiopia - Éthiopie 1995 84.3 0.0 .. 0.1 .. 0.0 6.9 .. 92.9 .. 0.22000 119.7 0.0 .. 0.1 .. .. 3.0 .. 97.0 .. ..2007 125.1 .. .. 0.1 .. .. .. .. 100.0 .. ..
Ethiopia (former) - Éthiopie (anc.) 1990 94.0 0.0 .. 0.1 .. .. 2.1 .. 96.8 .. ..
Kenya 1990 5.0 .. .. .. .. 0.0 .. .. .. .. 100.01995 15.6 0.0 .. 0.0 .. 0.0 41.2 .. 9.8 .. 49.12000 19.1 0.0 .. 0.0 .. 0.0 40.0 .. 10.4 .. 49.72007 15.6 0.0 .. 0.0 .. 0.0 48.9 .. 12.7 .. 38.4
Madagascar 1990 88.0 0.0 .. 0.1 .. 0.0 8.0 .. 80.7 .. 11.41995 37.7 0.0 .. 0.0 .. 0.0 36.7 .. 46.7 .. 16.62000 45.1 0.0 .. 0.0 .. 0.0 37.5 .. 47.5 .. 15.02007 31.5 0.0 .. 0.0 .. 0.0 22.3 .. 57.5 .. 20.3
Mauritius - Maurice 1990 216.0 0.0 0.0 0.0 0.1 0.0 42.6 30.6 11.1 13.4 2.31995 301.1 .. 0.1 0.1 .. 0.0 .. 67.7 28.2 .. 4.12000 189.7 .. 0.0 0.0 0.2 0.0 .. 2.8 21.4 69.0 6.82007 66.3 .. 0.0 0.0 .. 0.1 .. 12.1 22.9 .. 65.0
Mozambique 1990 27.0 0.0 .. 0.0 .. 0.0 7.4 .. 66.7 .. 25.91995 26.1 0.0 .. 0.0 .. 0.0 1.6 .. 66.1 .. 32.22000 25.2 .. .. 0.0 .. 0.0 .. .. 49.9 .. 50.12007 27.5 .. .. 0.0 .. 0.0 .. .. 38.5 .. 61.5
Seychelles 1990 2.0 .. .. 0.0 .. .. .. .. 100.0 .. ..1995 3.7 .. .. 0.0 .. 0.0 .. .. 75.9 .. 24.12000 22.7 .. .. 0.0 .. 0.0 .. .. 50.9 .. 49.12007 144.9 0.0 .. 0.0 .. 0.0 76.6 .. 2.7 .. 20.7
For sources and notes, see end of table. Pour les sources et les notes, se reporter à la fin du tableau.
As percentage of world total fleetEn pourcentage de la flotte mondialeTotal fleet
(thousandsof DWT)
(1)
Flotte totale (milliers de TPL)
(1)
Year
Année
Region,country or territory
Régionspays ou territoires
As percentage of the country or region total fleetEn pourcentage de la flotte totale du pays ou de la région
5.4 World merchant fleet by flag of registration and type of ship of countries and geographical regions
5.4 Flotte marchande mondiale par pavillons d'immatriculation et par types de naviresdes pays et des régions géographiques
280
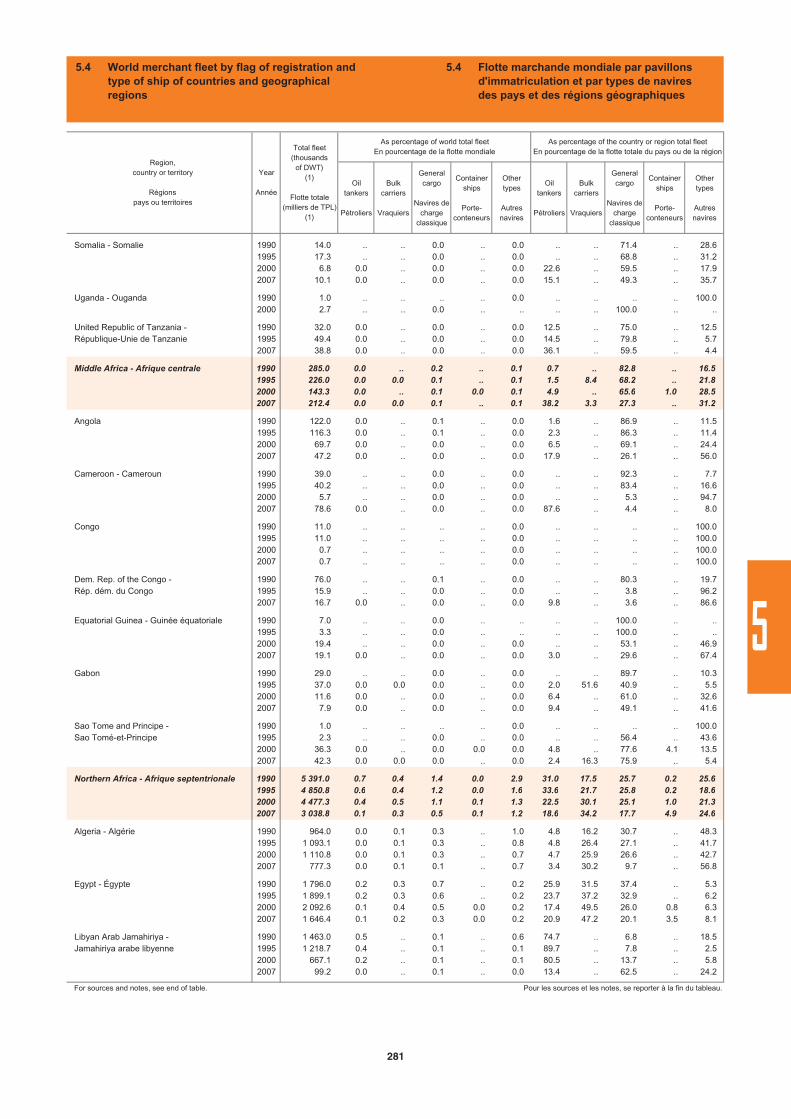
Oiltankers
Pétroliers
Bulkcarriers
Vraquiers
Generalcargo
Navires de charge
classique
Containerships
Porte-conteneurs
Othertypes
Autresnavires
Oiltankers
Pétroliers
Bulkcarriers
Vraquiers
Generalcargo
Navires de charge
classique
Containerships
Porte-conteneurs
Othertypes
Autresnavires
Somalia - Somalie 1990 14.0 .. .. 0.0 .. 0.0 .. .. 71.4 .. 28.61995 17.3 .. .. 0.0 .. 0.0 .. .. 68.8 .. 31.22000 6.8 0.0 .. 0.0 .. 0.0 22.6 .. 59.5 .. 17.92007 10.1 0.0 .. 0.0 .. 0.0 15.1 .. 49.3 .. 35.7
Uganda - Ouganda 1990 1.0 .. .. .. .. 0.0 .. .. .. .. 100.02000 2.7 .. .. 0.0 .. .. .. .. 100.0 .. ..
United Republic of Tanzania - 1990 32.0 0.0 .. 0.0 .. 0.0 12.5 .. 75.0 .. 12.5République-Unie de Tanzanie 1995 49.4 0.0 .. 0.0 .. 0.0 14.5 .. 79.8 .. 5.7
2007 38.8 0.0 .. 0.0 .. 0.0 36.1 .. 59.5 .. 4.4
Middle Africa - Afrique centrale 1990 285.0 0.0 .. 0.2 .. 0.1 0.7 .. 82.8 .. 16.51995 226.0 0.0 0.0 0.1 .. 0.1 1.5 8.4 68.2 .. 21.82000 143.3 0.0 .. 0.1 0.0 0.1 4.9 .. 65.6 1.0 28.52007 212.4 0.0 0.0 0.1 .. 0.1 38.2 3.3 27.3 .. 31.2
Angola 1990 122.0 0.0 .. 0.1 .. 0.0 1.6 .. 86.9 .. 11.51995 116.3 0.0 .. 0.1 .. 0.0 2.3 .. 86.3 .. 11.42000 69.7 0.0 .. 0.0 .. 0.0 6.5 .. 69.1 .. 24.42007 47.2 0.0 .. 0.0 .. 0.0 17.9 .. 26.1 .. 56.0
Cameroon - Cameroun 1990 39.0 .. .. 0.0 .. 0.0 .. .. 92.3 .. 7.71995 40.2 .. .. 0.0 .. 0.0 .. .. 83.4 .. 16.62000 5.7 .. .. 0.0 .. 0.0 .. .. 5.3 .. 94.72007 78.6 0.0 .. 0.0 .. 0.0 87.6 .. 4.4 .. 8.0
Congo 1990 11.0 .. .. .. .. 0.0 .. .. .. .. 100.01995 11.0 .. .. .. .. 0.0 .. .. .. .. 100.02000 0.7 .. .. .. .. 0.0 .. .. .. .. 100.02007 0.7 .. .. .. .. 0.0 .. .. .. .. 100.0
Dem. Rep. of the Congo - 1990 76.0 .. .. 0.1 .. 0.0 .. .. 80.3 .. 19.7Rép. dém. du Congo 1995 15.9 .. .. 0.0 .. 0.0 .. .. 3.8 .. 96.2
2007 16.7 0.0 .. 0.0 .. 0.0 9.8 .. 3.6 .. 86.6
Equatorial Guinea - Guinée équatoriale 1990 7.0 .. .. 0.0 .. .. .. .. 100.0 .. ..1995 3.3 .. .. 0.0 .. .. .. .. 100.0 .. ..2000 19.4 .. .. 0.0 .. 0.0 .. .. 53.1 .. 46.92007 19.1 0.0 .. 0.0 .. 0.0 3.0 .. 29.6 .. 67.4
Gabon 1990 29.0 .. .. 0.0 .. 0.0 .. .. 89.7 .. 10.31995 37.0 0.0 0.0 0.0 .. 0.0 2.0 51.6 40.9 .. 5.52000 11.6 0.0 .. 0.0 .. 0.0 6.4 .. 61.0 .. 32.62007 7.9 0.0 .. 0.0 .. 0.0 9.4 .. 49.1 .. 41.6
Sao Tome and Principe - 1990 1.0 .. .. .. .. 0.0 .. .. .. .. 100.0Sao Tomé-et-Principe 1995 2.3 .. .. 0.0 .. 0.0 .. .. 56.4 .. 43.6
2000 36.3 0.0 .. 0.0 0.0 0.0 4.8 .. 77.6 4.1 13.52007 42.3 0.0 0.0 0.0 .. 0.0 2.4 16.3 75.9 .. 5.4
Northern Africa - Afrique septentrionale 1990 5 391.0 0.7 0.4 1.4 0.0 2.9 31.0 17.5 25.7 0.2 25.61995 4 850.8 0.6 0.4 1.2 0.0 1.6 33.6 21.7 25.8 0.2 18.62000 4 477.3 0.4 0.5 1.1 0.1 1.3 22.5 30.1 25.1 1.0 21.32007 3 038.8 0.1 0.3 0.5 0.1 1.2 18.6 34.2 17.7 4.9 24.6
Algeria - Algérie 1990 964.0 0.0 0.1 0.3 .. 1.0 4.8 16.2 30.7 .. 48.31995 1 093.1 0.0 0.1 0.3 .. 0.8 4.8 26.4 27.1 .. 41.72000 1 110.8 0.0 0.1 0.3 .. 0.7 4.7 25.9 26.6 .. 42.72007 777.3 0.0 0.1 0.1 .. 0.7 3.4 30.2 9.7 .. 56.8
Egypt - Égypte 1990 1 796.0 0.2 0.3 0.7 .. 0.2 25.9 31.5 37.4 .. 5.31995 1 899.1 0.2 0.3 0.6 .. 0.2 23.7 37.2 32.9 .. 6.22000 2 092.6 0.1 0.4 0.5 0.0 0.2 17.4 49.5 26.0 0.8 6.32007 1 646.4 0.1 0.2 0.3 0.0 0.2 20.9 47.2 20.1 3.5 8.1
Libyan Arab Jamahiriya - 1990 1 463.0 0.5 .. 0.1 .. 0.6 74.7 .. 6.8 .. 18.5Jamahiriya arabe libyenne 1995 1 218.7 0.4 .. 0.1 .. 0.1 89.7 .. 7.8 .. 2.5
2000 667.1 0.2 .. 0.1 .. 0.1 80.5 .. 13.7 .. 5.82007 99.2 0.0 .. 0.1 .. 0.0 13.4 .. 62.5 .. 24.2
For sources and notes, see end of table. Pour les sources et les notes, se reporter à la fin du tableau.
Region,country or territory
Régionspays ou territoires
Year
Année
Total fleet (thousands
of DWT)(1)
Flotte totale (milliers de TPL)
(1)
As percentage of world total fleetEn pourcentage de la flotte mondiale
As percentage of the country or region total fleetEn pourcentage de la flotte totale du pays ou de la région
5.4 World merchant fleet by flag of registration and type of ship of countries and geographical regions
5.4 Flotte marchande mondiale par pavillons d'immatriculation et par types de naviresdes pays et des régions géographiques
281
5
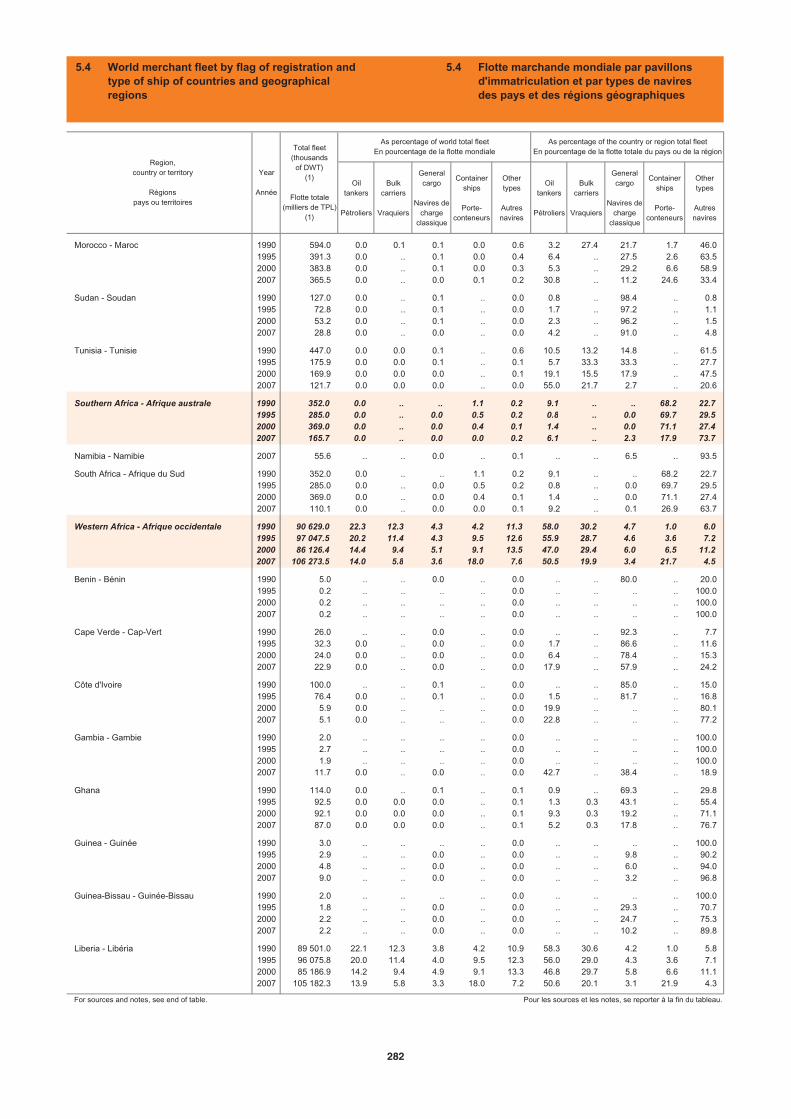
Oiltankers
Pétroliers
Bulkcarriers
Vraquiers
Generalcargo
Navires de charge
classique
Containerships
Porte-conteneurs
Othertypes
Autresnavires
Oiltankers
Pétroliers
Bulkcarriers
Vraquiers
Generalcargo
Navires de charge
classique
Containerships
Porte-conteneurs
Othertypes
Autresnavires
Morocco - Maroc 1990 594.0 0.0 0.1 0.1 0.0 0.6 3.2 27.4 21.7 1.7 46.01995 391.3 0.0 .. 0.1 0.0 0.4 6.4 .. 27.5 2.6 63.52000 383.8 0.0 .. 0.1 0.0 0.3 5.3 .. 29.2 6.6 58.92007 365.5 0.0 .. 0.0 0.1 0.2 30.8 .. 11.2 24.6 33.4
Sudan - Soudan 1990 127.0 0.0 .. 0.1 .. 0.0 0.8 .. 98.4 .. 0.81995 72.8 0.0 .. 0.1 .. 0.0 1.7 .. 97.2 .. 1.12000 53.2 0.0 .. 0.1 .. 0.0 2.3 .. 96.2 .. 1.52007 28.8 0.0 .. 0.0 .. 0.0 4.2 .. 91.0 .. 4.8
Tunisia - Tunisie 1990 447.0 0.0 0.0 0.1 .. 0.6 10.5 13.2 14.8 .. 61.51995 175.9 0.0 0.0 0.1 .. 0.1 5.7 33.3 33.3 .. 27.72000 169.9 0.0 0.0 0.0 .. 0.1 19.1 15.5 17.9 .. 47.52007 121.7 0.0 0.0 0.0 .. 0.0 55.0 21.7 2.7 .. 20.6
Southern Africa - Afrique australe 1990 352.0 0.0 .. .. 1.1 0.2 9.1 .. .. 68.2 22.71995 285.0 0.0 .. 0.0 0.5 0.2 0.8 .. 0.0 69.7 29.52000 369.0 0.0 .. 0.0 0.4 0.1 1.4 .. 0.0 71.1 27.42007 165.7 0.0 .. 0.0 0.0 0.2 6.1 .. 2.3 17.9 73.7
Namibia - Namibie 2007 55.6 .. .. 0.0 .. 0.1 .. .. 6.5 .. 93.5
South Africa - Afrique du Sud 1990 352.0 0.0 .. .. 1.1 0.2 9.1 .. .. 68.2 22.71995 285.0 0.0 .. 0.0 0.5 0.2 0.8 .. 0.0 69.7 29.52000 369.0 0.0 .. 0.0 0.4 0.1 1.4 .. 0.0 71.1 27.42007 110.1 0.0 .. 0.0 0.0 0.1 9.2 .. 0.1 26.9 63.7
Western Africa - Afrique occidentale 1990 90 629.0 22.3 12.3 4.3 4.2 11.3 58.0 30.2 4.7 1.0 6.01995 97 047.5 20.2 11.4 4.3 9.5 12.6 55.9 28.7 4.6 3.6 7.22000 86 126.4 14.4 9.4 5.1 9.1 13.5 47.0 29.4 6.0 6.5 11.22007 106 273.5 14.0 5.8 3.6 18.0 7.6 50.5 19.9 3.4 21.7 4.5
Benin - Bénin 1990 5.0 .. .. 0.0 .. 0.0 .. .. 80.0 .. 20.01995 0.2 .. .. .. .. 0.0 .. .. .. .. 100.02000 0.2 .. .. .. .. 0.0 .. .. .. .. 100.02007 0.2 .. .. .. .. 0.0 .. .. .. .. 100.0
Cape Verde - Cap-Vert 1990 26.0 .. .. 0.0 .. 0.0 .. .. 92.3 .. 7.71995 32.3 0.0 .. 0.0 .. 0.0 1.7 .. 86.6 .. 11.62000 24.0 0.0 .. 0.0 .. 0.0 6.4 .. 78.4 .. 15.32007 22.9 0.0 .. 0.0 .. 0.0 17.9 .. 57.9 .. 24.2
Côte d'Ivoire 1990 100.0 .. .. 0.1 .. 0.0 .. .. 85.0 .. 15.01995 76.4 0.0 .. 0.1 .. 0.0 1.5 .. 81.7 .. 16.82000 5.9 0.0 .. .. .. 0.0 19.9 .. .. .. 80.12007 5.1 0.0 .. .. .. 0.0 22.8 .. .. .. 77.2
Gambia - Gambie 1990 2.0 .. .. .. .. 0.0 .. .. .. .. 100.01995 2.7 .. .. .. .. 0.0 .. .. .. .. 100.02000 1.9 .. .. .. .. 0.0 .. .. .. .. 100.02007 11.7 0.0 .. 0.0 .. 0.0 42.7 .. 38.4 .. 18.9
Ghana 1990 114.0 0.0 .. 0.1 .. 0.1 0.9 .. 69.3 .. 29.81995 92.5 0.0 0.0 0.0 .. 0.1 1.3 0.3 43.1 .. 55.42000 92.1 0.0 0.0 0.0 .. 0.1 9.3 0.3 19.2 .. 71.12007 87.0 0.0 0.0 0.0 .. 0.1 5.2 0.3 17.8 .. 76.7
Guinea - Guinée 1990 3.0 .. .. .. .. 0.0 .. .. .. .. 100.01995 2.9 .. .. 0.0 .. 0.0 .. .. 9.8 .. 90.22000 4.8 .. .. 0.0 .. 0.0 .. .. 6.0 .. 94.02007 9.0 .. .. 0.0 .. 0.0 .. .. 3.2 .. 96.8
Guinea-Bissau - Guinée-Bissau 1990 2.0 .. .. .. .. 0.0 .. .. .. .. 100.01995 1.8 .. .. 0.0 .. 0.0 .. .. 29.3 .. 70.72000 2.2 .. .. 0.0 .. 0.0 .. .. 24.7 .. 75.32007 2.2 .. .. 0.0 .. 0.0 .. .. 10.2 .. 89.8
Liberia - Libéria 1990 89 501.0 22.1 12.3 3.8 4.2 10.9 58.3 30.6 4.2 1.0 5.81995 96 075.8 20.0 11.4 4.0 9.5 12.3 56.0 29.0 4.3 3.6 7.12000 85 186.9 14.2 9.4 4.9 9.1 13.3 46.8 29.7 5.8 6.6 11.12007 105 182.3 13.9 5.8 3.3 18.0 7.2 50.6 20.1 3.1 21.9 4.3
For sources and notes, see end of table. Pour les sources et les notes, se reporter à la fin du tableau.
Region,country or territory
Régionspays ou territoires
Year
Année
Total fleet (thousands
of DWT)(1)
Flotte totale (milliers de TPL)
(1)
As percentage of world total fleetEn pourcentage de la flotte mondiale
As percentage of the country or region total fleetEn pourcentage de la flotte totale du pays ou de la région
5.4 World merchant fleet by flag of registration and type of ship of countries and geographical regions
5.4 Flotte marchande mondiale par pavillons d'immatriculation et par types de naviresdes pays et des régions géographiques
282
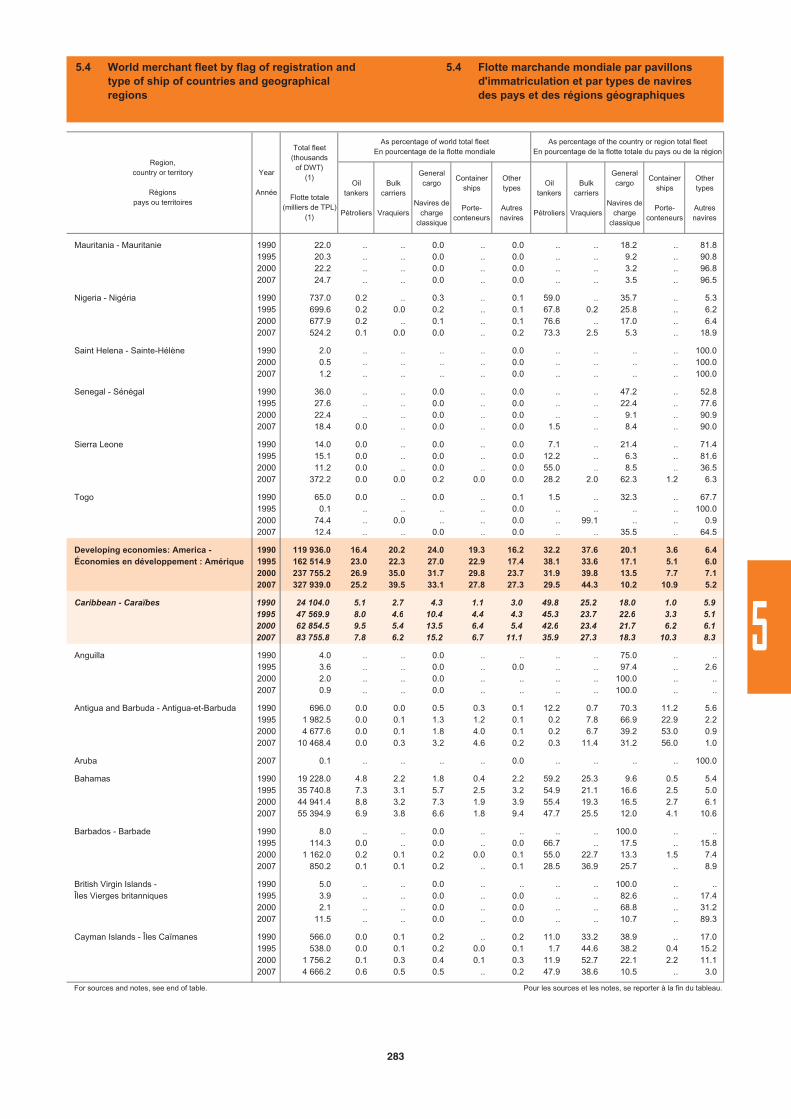
Oiltankers
Pétroliers
Bulkcarriers
Vraquiers
Generalcargo
Navires de charge
classique
Containerships
Porte-conteneurs
Othertypes
Autresnavires
Oiltankers
Pétroliers
Bulkcarriers
Vraquiers
Generalcargo
Navires de charge
classique
Containerships
Porte-conteneurs
Othertypes
Autresnavires
Mauritania - Mauritanie 1990 22.0 .. .. 0.0 .. 0.0 .. .. 18.2 .. 81.81995 20.3 .. .. 0.0 .. 0.0 .. .. 9.2 .. 90.82000 22.2 .. .. 0.0 .. 0.0 .. .. 3.2 .. 96.82007 24.7 .. .. 0.0 .. 0.0 .. .. 3.5 .. 96.5
Nigeria - Nigéria 1990 737.0 0.2 .. 0.3 .. 0.1 59.0 .. 35.7 .. 5.31995 699.6 0.2 0.0 0.2 .. 0.1 67.8 0.2 25.8 .. 6.22000 677.9 0.2 .. 0.1 .. 0.1 76.6 .. 17.0 .. 6.42007 524.2 0.1 0.0 0.0 .. 0.2 73.3 2.5 5.3 .. 18.9
Saint Helena - Sainte-Hélène 1990 2.0 .. .. .. .. 0.0 .. .. .. .. 100.02000 0.5 .. .. .. .. 0.0 .. .. .. .. 100.02007 1.2 .. .. .. .. 0.0 .. .. .. .. 100.0
Senegal - Sénégal 1990 36.0 .. .. 0.0 .. 0.0 .. .. 47.2 .. 52.81995 27.6 .. .. 0.0 .. 0.0 .. .. 22.4 .. 77.62000 22.4 .. .. 0.0 .. 0.0 .. .. 9.1 .. 90.92007 18.4 0.0 .. 0.0 .. 0.0 1.5 .. 8.4 .. 90.0
Sierra Leone 1990 14.0 0.0 .. 0.0 .. 0.0 7.1 .. 21.4 .. 71.41995 15.1 0.0 .. 0.0 .. 0.0 12.2 .. 6.3 .. 81.62000 11.2 0.0 .. 0.0 .. 0.0 55.0 .. 8.5 .. 36.52007 372.2 0.0 0.0 0.2 0.0 0.0 28.2 2.0 62.3 1.2 6.3
Togo 1990 65.0 0.0 .. 0.0 .. 0.1 1.5 .. 32.3 .. 67.71995 0.1 .. .. .. .. 0.0 .. .. .. .. 100.02000 74.4 .. 0.0 .. .. 0.0 .. 99.1 .. .. 0.92007 12.4 .. .. 0.0 .. 0.0 .. .. 35.5 .. 64.5
Developing economies: America - 1990 119 936.0 16.4 20.2 24.0 19.3 16.2 32.2 37.6 20.1 3.6 6.4Économies en développement : Amérique 1995 162 514.9 23.0 22.3 27.0 22.9 17.4 38.1 33.6 17.1 5.1 6.0
2000 237 755.2 26.9 35.0 31.7 29.8 23.7 31.9 39.8 13.5 7.7 7.12007 327 939.0 25.2 39.5 33.1 27.8 27.3 29.5 44.3 10.2 10.9 5.2
Caribbean - Caraïbes 1990 24 104.0 5.1 2.7 4.3 1.1 3.0 49.8 25.2 18.0 1.0 5.91995 47 569.9 8.0 4.6 10.4 4.4 4.3 45.3 23.7 22.6 3.3 5.12000 62 854.5 9.5 5.4 13.5 6.4 5.4 42.6 23.4 21.7 6.2 6.12007 83 755.8 7.8 6.2 15.2 6.7 11.1 35.9 27.3 18.3 10.3 8.3
Anguilla 1990 4.0 .. .. 0.0 .. .. .. .. 75.0 .. ..1995 3.6 .. .. 0.0 .. 0.0 .. .. 97.4 .. 2.62000 2.0 .. .. 0.0 .. .. .. .. 100.0 .. ..2007 0.9 .. .. 0.0 .. .. .. .. 100.0 .. ..
Antigua and Barbuda - Antigua-et-Barbuda 1990 696.0 0.0 0.0 0.5 0.3 0.1 12.2 0.7 70.3 11.2 5.61995 1 982.5 0.0 0.1 1.3 1.2 0.1 0.2 7.8 66.9 22.9 2.22000 4 677.6 0.0 0.1 1.8 4.0 0.1 0.2 6.7 39.2 53.0 0.92007 10 468.4 0.0 0.3 3.2 4.6 0.2 0.3 11.4 31.2 56.0 1.0
Aruba 2007 0.1 .. .. .. .. 0.0 .. .. .. .. 100.0
Bahamas 1990 19 228.0 4.8 2.2 1.8 0.4 2.2 59.2 25.3 9.6 0.5 5.41995 35 740.8 7.3 3.1 5.7 2.5 3.2 54.9 21.1 16.6 2.5 5.02000 44 941.4 8.8 3.2 7.3 1.9 3.9 55.4 19.3 16.5 2.7 6.12007 55 394.9 6.9 3.8 6.6 1.8 9.4 47.7 25.5 12.0 4.1 10.6
Barbados - Barbade 1990 8.0 .. .. 0.0 .. .. .. .. 100.0 .. ..1995 114.3 0.0 .. 0.0 .. 0.0 66.7 .. 17.5 .. 15.82000 1 162.0 0.2 0.1 0.2 0.0 0.1 55.0 22.7 13.3 1.5 7.42007 850.2 0.1 0.1 0.2 .. 0.1 28.5 36.9 25.7 .. 8.9
British Virgin Islands - 1990 5.0 .. .. 0.0 .. .. .. .. 100.0 .. ..Îles Vierges britanniques 1995 3.9 .. .. 0.0 .. 0.0 .. .. 82.6 .. 17.4
2000 2.1 .. .. 0.0 .. 0.0 .. .. 68.8 .. 31.22007 11.5 .. .. 0.0 .. 0.0 .. .. 10.7 .. 89.3
Cayman Islands - Îles Caïmanes 1990 566.0 0.0 0.1 0.2 .. 0.2 11.0 33.2 38.9 .. 17.01995 538.0 0.0 0.1 0.2 0.0 0.1 1.7 44.6 38.2 0.4 15.22000 1 756.2 0.1 0.3 0.4 0.1 0.3 11.9 52.7 22.1 2.2 11.12007 4 666.2 0.6 0.5 0.5 .. 0.2 47.9 38.6 10.5 .. 3.0
For sources and notes, see end of table. Pour les sources et les notes, se reporter à la fin du tableau.
Region,country or territory
Régionspays ou territoires
Year
Année
Total fleet (thousands
of DWT)(1)
Flotte totale (milliers de TPL)
(1)
As percentage of world total fleetEn pourcentage de la flotte mondiale
As percentage of the country or region total fleetEn pourcentage de la flotte totale du pays ou de la région
5.4 World merchant fleet by flag of registration and type of ship of countries and geographical regions
5.4 Flotte marchande mondiale par pavillons d'immatriculation et par types de naviresdes pays et des régions géographiques
283
5
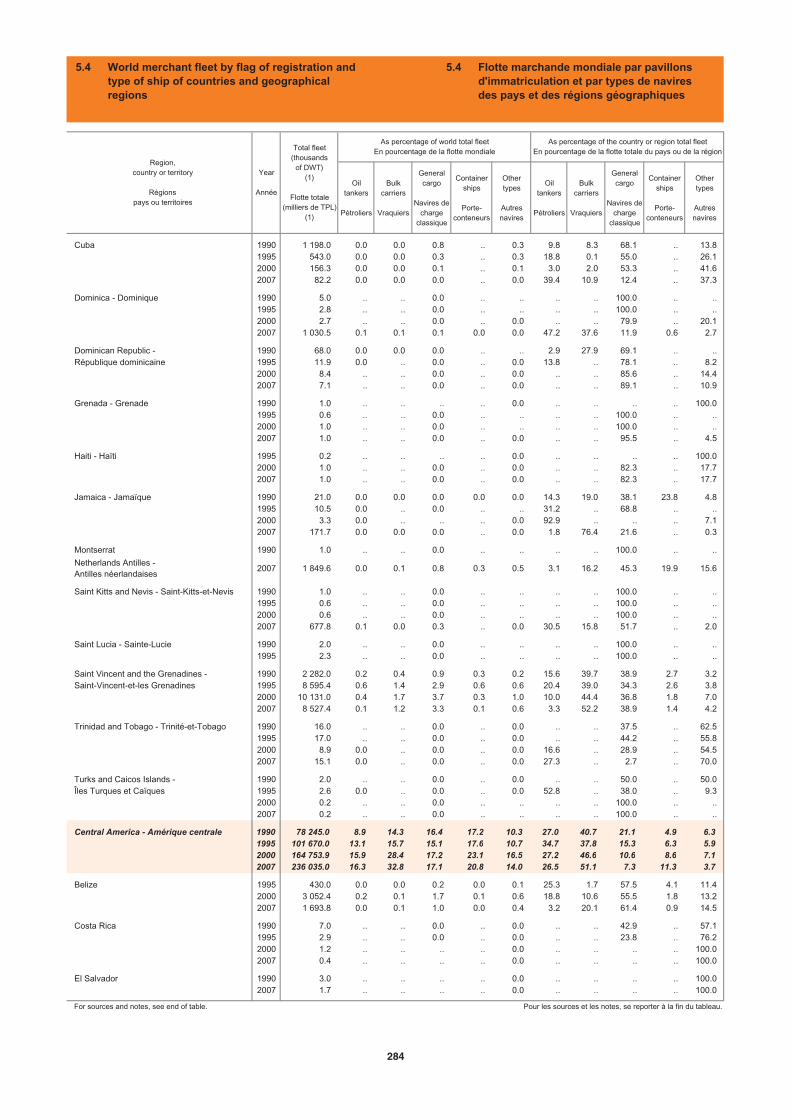
Oiltankers
Pétroliers
Bulkcarriers
Vraquiers
Generalcargo
Navires de charge
classique
Containerships
Porte-conteneurs
Othertypes
Autresnavires
Oiltankers
Pétroliers
Bulkcarriers
Vraquiers
Generalcargo
Navires de charge
classique
Containerships
Porte-conteneurs
Othertypes
Autresnavires
Cuba 1990 1 198.0 0.0 0.0 0.8 .. 0.3 9.8 8.3 68.1 .. 13.81995 543.0 0.0 0.0 0.3 .. 0.3 18.8 0.1 55.0 .. 26.12000 156.3 0.0 0.0 0.1 .. 0.1 3.0 2.0 53.3 .. 41.62007 82.2 0.0 0.0 0.0 .. 0.0 39.4 10.9 12.4 .. 37.3
Dominica - Dominique 1990 5.0 .. .. 0.0 .. .. .. .. 100.0 .. ..1995 2.8 .. .. 0.0 .. .. .. .. 100.0 .. ..2000 2.7 .. .. 0.0 .. 0.0 .. .. 79.9 .. 20.12007 1 030.5 0.1 0.1 0.1 0.0 0.0 47.2 37.6 11.9 0.6 2.7
Dominican Republic - 1990 68.0 0.0 0.0 0.0 .. .. 2.9 27.9 69.1 .. ..République dominicaine 1995 11.9 0.0 .. 0.0 .. 0.0 13.8 .. 78.1 .. 8.2
2000 8.4 .. .. 0.0 .. 0.0 .. .. 85.6 .. 14.42007 7.1 .. .. 0.0 .. 0.0 .. .. 89.1 .. 10.9
Grenada - Grenade 1990 1.0 .. .. .. .. 0.0 .. .. .. .. 100.01995 0.6 .. .. 0.0 .. .. .. .. 100.0 .. ..2000 1.0 .. .. 0.0 .. .. .. .. 100.0 .. ..2007 1.0 .. .. 0.0 .. 0.0 .. .. 95.5 .. 4.5
Haiti - Haïti 1995 0.2 .. .. .. .. 0.0 .. .. .. .. 100.02000 1.0 .. .. 0.0 .. 0.0 .. .. 82.3 .. 17.72007 1.0 .. .. 0.0 .. 0.0 .. .. 82.3 .. 17.7
Jamaica - Jamaïque 1990 21.0 0.0 0.0 0.0 0.0 0.0 14.3 19.0 38.1 23.8 4.81995 10.5 0.0 .. 0.0 .. .. 31.2 .. 68.8 .. ..2000 3.3 0.0 .. .. .. 0.0 92.9 .. .. .. 7.12007 171.7 0.0 0.0 0.0 .. 0.0 1.8 76.4 21.6 .. 0.3
Montserrat 1990 1.0 .. .. 0.0 .. .. .. .. 100.0 .. ..
Netherlands Antilles - Antilles néerlandaises
2007 1 849.6 0.0 0.1 0.8 0.3 0.5 3.1 16.2 45.3 19.9 15.6
Saint Kitts and Nevis - Saint-Kitts-et-Nevis 1990 1.0 .. .. 0.0 .. .. .. .. 100.0 .. ..1995 0.6 .. .. 0.0 .. .. .. .. 100.0 .. ..2000 0.6 .. .. 0.0 .. .. .. .. 100.0 .. ..2007 677.8 0.1 0.0 0.3 .. 0.0 30.5 15.8 51.7 .. 2.0
Saint Lucia - Sainte-Lucie 1990 2.0 .. .. 0.0 .. .. .. .. 100.0 .. ..1995 2.3 .. .. 0.0 .. .. .. .. 100.0 .. ..
Saint Vincent and the Grenadines - 1990 2 282.0 0.2 0.4 0.9 0.3 0.2 15.6 39.7 38.9 2.7 3.2Saint-Vincent-et-les Grenadines 1995 8 595.4 0.6 1.4 2.9 0.6 0.6 20.4 39.0 34.3 2.6 3.8
2000 10 131.0 0.4 1.7 3.7 0.3 1.0 10.0 44.4 36.8 1.8 7.02007 8 527.4 0.1 1.2 3.3 0.1 0.6 3.3 52.2 38.9 1.4 4.2
Trinidad and Tobago - Trinité-et-Tobago 1990 16.0 .. .. 0.0 .. 0.0 .. .. 37.5 .. 62.51995 17.0 .. .. 0.0 .. 0.0 .. .. 44.2 .. 55.82000 8.9 0.0 .. 0.0 .. 0.0 16.6 .. 28.9 .. 54.52007 15.1 0.0 .. 0.0 .. 0.0 27.3 .. 2.7 .. 70.0
Turks and Caicos Islands - 1990 2.0 .. .. 0.0 .. 0.0 .. .. 50.0 .. 50.0Îles Turques et Caïques 1995 2.6 0.0 .. 0.0 .. 0.0 52.8 .. 38.0 .. 9.3
2000 0.2 .. .. 0.0 .. .. .. .. 100.0 .. ..2007 0.2 .. .. 0.0 .. .. .. .. 100.0 .. ..
Central America - Amérique centrale 1990 78 245.0 8.9 14.3 16.4 17.2 10.3 27.0 40.7 21.1 4.9 6.31995 101 670.0 13.1 15.7 15.1 17.6 10.7 34.7 37.8 15.3 6.3 5.92000 164 753.9 15.9 28.4 17.2 23.1 16.5 27.2 46.6 10.6 8.6 7.12007 236 035.0 16.3 32.8 17.1 20.8 14.0 26.5 51.1 7.3 11.3 3.7
Belize 1995 430.0 0.0 0.0 0.2 0.0 0.1 25.3 1.7 57.5 4.1 11.42000 3 052.4 0.2 0.1 1.7 0.1 0.6 18.8 10.6 55.5 1.8 13.22007 1 693.8 0.0 0.1 1.0 0.0 0.4 3.2 20.1 61.4 0.9 14.5
Costa Rica 1990 7.0 .. .. 0.0 .. 0.0 .. .. 42.9 .. 57.11995 2.9 .. .. 0.0 .. 0.0 .. .. 23.8 .. 76.22000 1.2 .. .. .. .. 0.0 .. .. .. .. 100.02007 0.4 .. .. .. .. 0.0 .. .. .. .. 100.0
El Salvador 1990 3.0 .. .. .. .. 0.0 .. .. .. .. 100.02007 1.7 .. .. .. .. 0.0 .. .. .. .. 100.0
For sources and notes, see end of table. Pour les sources et les notes, se reporter à la fin du tableau.
Region,country or territory
Régionspays ou territoires
Year
Année
Total fleet (thousands
of DWT)(1)
Flotte totale (milliers de TPL)
(1)
As percentage of world total fleetEn pourcentage de la flotte mondiale
As percentage of the country or region total fleetEn pourcentage de la flotte totale du pays ou de la région
5.4 World merchant fleet by flag of registration and type of ship of countries and geographical regions
5.4 Flotte marchande mondiale par pavillons d'immatriculation et par types de naviresdes pays et des régions géographiques
284
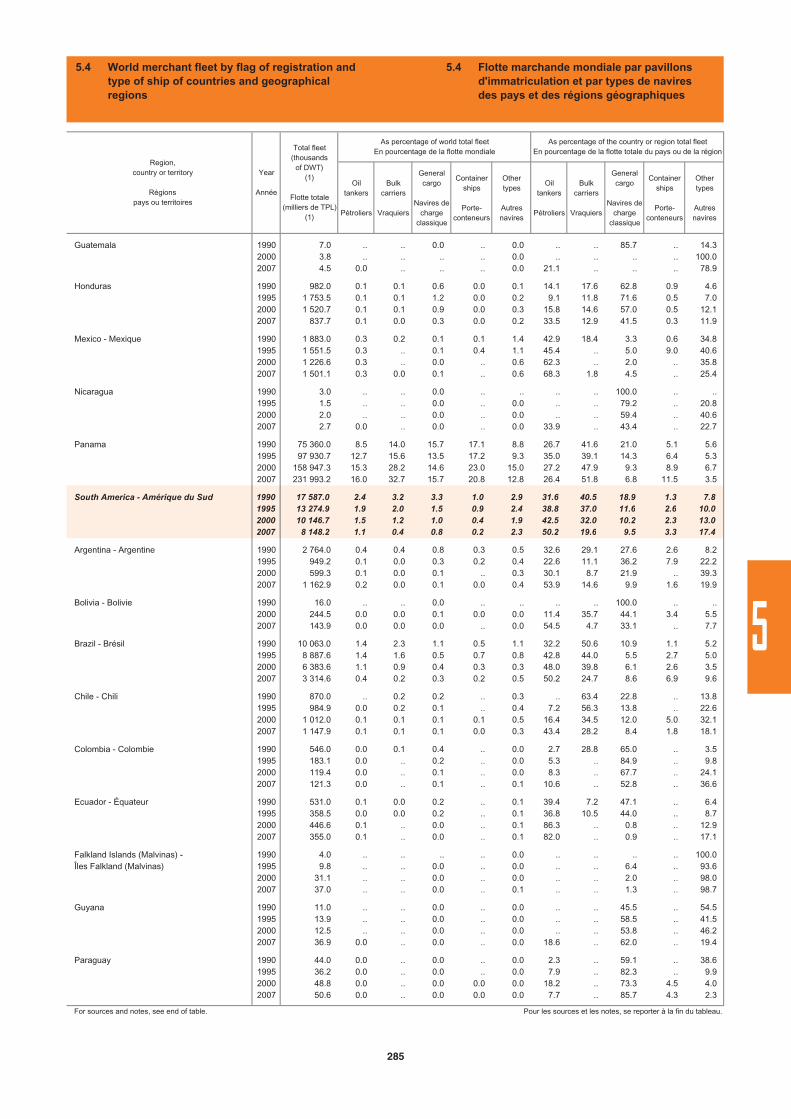
Oiltankers
Pétroliers
Bulkcarriers
Vraquiers
Generalcargo
Navires de charge
classique
Containerships
Porte-conteneurs
Othertypes
Autresnavires
Oiltankers
Pétroliers
Bulkcarriers
Vraquiers
Generalcargo
Navires de charge
classique
Containerships
Porte-conteneurs
Othertypes
Autresnavires
Guatemala 1990 7.0 .. .. 0.0 .. 0.0 .. .. 85.7 .. 14.32000 3.8 .. .. .. .. 0.0 .. .. .. .. 100.02007 4.5 0.0 .. .. .. 0.0 21.1 .. .. .. 78.9
Honduras 1990 982.0 0.1 0.1 0.6 0.0 0.1 14.1 17.6 62.8 0.9 4.61995 1 753.5 0.1 0.1 1.2 0.0 0.2 9.1 11.8 71.6 0.5 7.02000 1 520.7 0.1 0.1 0.9 0.0 0.3 15.8 14.6 57.0 0.5 12.12007 837.7 0.1 0.0 0.3 0.0 0.2 33.5 12.9 41.5 0.3 11.9
Mexico - Mexique 1990 1 883.0 0.3 0.2 0.1 0.1 1.4 42.9 18.4 3.3 0.6 34.81995 1 551.5 0.3 .. 0.1 0.4 1.1 45.4 .. 5.0 9.0 40.62000 1 226.6 0.3 .. 0.0 .. 0.6 62.3 .. 2.0 .. 35.82007 1 501.1 0.3 0.0 0.1 .. 0.6 68.3 1.8 4.5 .. 25.4
Nicaragua 1990 3.0 .. .. 0.0 .. .. .. .. 100.0 .. ..1995 1.5 .. .. 0.0 .. 0.0 .. .. 79.2 .. 20.82000 2.0 .. .. 0.0 .. 0.0 .. .. 59.4 .. 40.62007 2.7 0.0 .. 0.0 .. 0.0 33.9 .. 43.4 .. 22.7
Panama 1990 75 360.0 8.5 14.0 15.7 17.1 8.8 26.7 41.6 21.0 5.1 5.61995 97 930.7 12.7 15.6 13.5 17.2 9.3 35.0 39.1 14.3 6.4 5.32000 158 947.3 15.3 28.2 14.6 23.0 15.0 27.2 47.9 9.3 8.9 6.72007 231 993.2 16.0 32.7 15.7 20.8 12.8 26.4 51.8 6.8 11.5 3.5
South America - Amérique du Sud 1990 17 587.0 2.4 3.2 3.3 1.0 2.9 31.6 40.5 18.9 1.3 7.81995 13 274.9 1.9 2.0 1.5 0.9 2.4 38.8 37.0 11.6 2.6 10.02000 10 146.7 1.5 1.2 1.0 0.4 1.9 42.5 32.0 10.2 2.3 13.02007 8 148.2 1.1 0.4 0.8 0.2 2.3 50.2 19.6 9.5 3.3 17.4
Argentina - Argentine 1990 2 764.0 0.4 0.4 0.8 0.3 0.5 32.6 29.1 27.6 2.6 8.21995 949.2 0.1 0.0 0.3 0.2 0.4 22.6 11.1 36.2 7.9 22.22000 599.3 0.1 0.0 0.1 .. 0.3 30.1 8.7 21.9 .. 39.32007 1 162.9 0.2 0.0 0.1 0.0 0.4 53.9 14.6 9.9 1.6 19.9
Bolivia - Bolivie 1990 16.0 .. .. 0.0 .. .. .. .. 100.0 .. ..2000 244.5 0.0 0.0 0.1 0.0 0.0 11.4 35.7 44.1 3.4 5.52007 143.9 0.0 0.0 0.0 .. 0.0 54.5 4.7 33.1 .. 7.7
Brazil - Brésil 1990 10 063.0 1.4 2.3 1.1 0.5 1.1 32.2 50.6 10.9 1.1 5.21995 8 887.6 1.4 1.6 0.5 0.7 0.8 42.8 44.0 5.5 2.7 5.02000 6 383.6 1.1 0.9 0.4 0.3 0.3 48.0 39.8 6.1 2.6 3.52007 3 314.6 0.4 0.2 0.3 0.2 0.5 50.2 24.7 8.6 6.9 9.6
Chile - Chili 1990 870.0 .. 0.2 0.2 .. 0.3 .. 63.4 22.8 .. 13.81995 984.9 0.0 0.2 0.1 .. 0.4 7.2 56.3 13.8 .. 22.62000 1 012.0 0.1 0.1 0.1 0.1 0.5 16.4 34.5 12.0 5.0 32.12007 1 147.9 0.1 0.1 0.1 0.0 0.3 43.4 28.2 8.4 1.8 18.1
Colombia - Colombie 1990 546.0 0.0 0.1 0.4 .. 0.0 2.7 28.8 65.0 .. 3.51995 183.1 0.0 .. 0.2 .. 0.0 5.3 .. 84.9 .. 9.82000 119.4 0.0 .. 0.1 .. 0.0 8.3 .. 67.7 .. 24.12007 121.3 0.0 .. 0.1 .. 0.1 10.6 .. 52.8 .. 36.6
Ecuador - Équateur 1990 531.0 0.1 0.0 0.2 .. 0.1 39.4 7.2 47.1 .. 6.41995 358.5 0.0 0.0 0.2 .. 0.1 36.8 10.5 44.0 .. 8.72000 446.6 0.1 .. 0.0 .. 0.1 86.3 .. 0.8 .. 12.92007 355.0 0.1 .. 0.0 .. 0.1 82.0 .. 0.9 .. 17.1
Falkland Islands (Malvinas) - 1990 4.0 .. .. .. .. 0.0 .. .. .. .. 100.0Îles Falkland (Malvinas) 1995 9.8 .. .. 0.0 .. 0.0 .. .. 6.4 .. 93.6
2000 31.1 .. .. 0.0 .. 0.0 .. .. 2.0 .. 98.02007 37.0 .. .. 0.0 .. 0.1 .. .. 1.3 .. 98.7
Guyana 1990 11.0 .. .. 0.0 .. 0.0 .. .. 45.5 .. 54.51995 13.9 .. .. 0.0 .. 0.0 .. .. 58.5 .. 41.52000 12.5 .. .. 0.0 .. 0.0 .. .. 53.8 .. 46.22007 36.9 0.0 .. 0.0 .. 0.0 18.6 .. 62.0 .. 19.4
Paraguay 1990 44.0 0.0 .. 0.0 .. 0.0 2.3 .. 59.1 .. 38.61995 36.2 0.0 .. 0.0 .. 0.0 7.9 .. 82.3 .. 9.92000 48.8 0.0 .. 0.0 0.0 0.0 18.2 .. 73.3 4.5 4.02007 50.6 0.0 .. 0.0 0.0 0.0 7.7 .. 85.7 4.3 2.3
For sources and notes, see end of table. Pour les sources et les notes, se reporter à la fin du tableau.
Region,country or territory
Régionspays ou territoires
Year
Année
Total fleet (thousands
of DWT)(1)
Flotte totale (milliers de TPL)
(1)
As percentage of world total fleetEn pourcentage de la flotte mondiale
As percentage of the country or region total fleetEn pourcentage de la flotte totale du pays ou de la région
5.4 World merchant fleet by flag of registration and type of ship of countries and geographical regions
5.4 Flotte marchande mondiale par pavillons d'immatriculation et par types de naviresdes pays et des régions géographiques
285
5
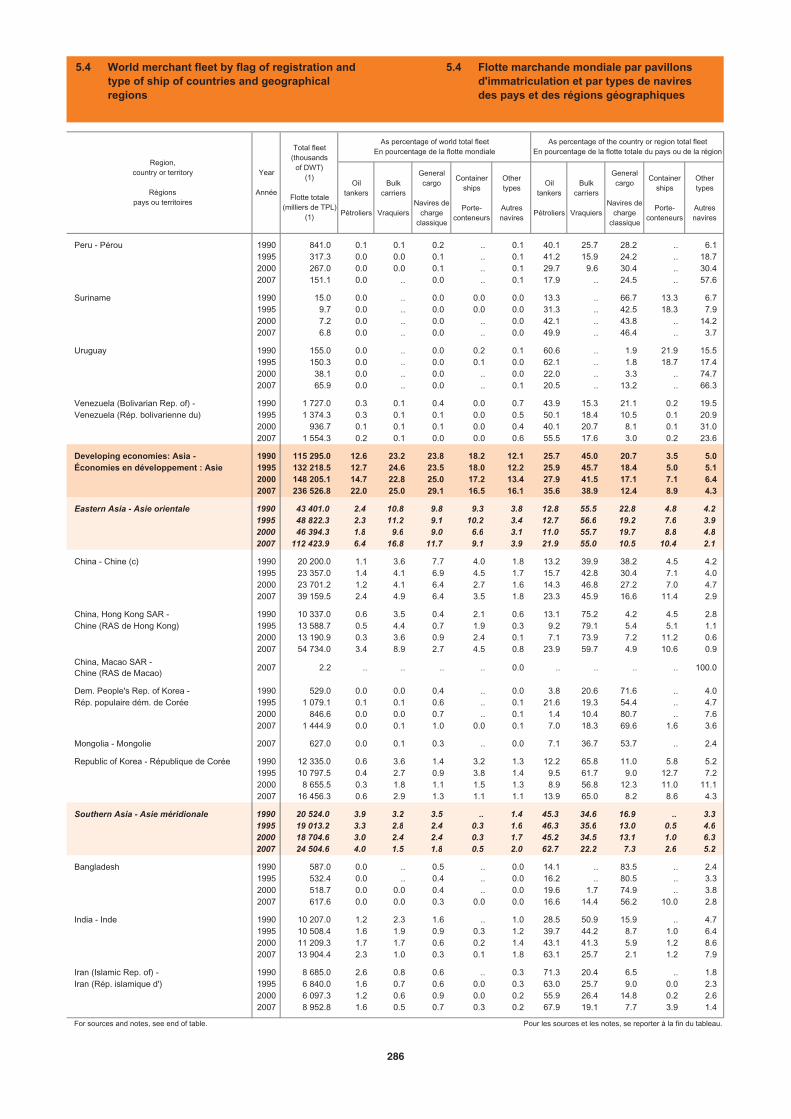
Oiltankers
Pétroliers
Bulkcarriers
Vraquiers
Generalcargo
Navires de charge
classique
Containerships
Porte-conteneurs
Othertypes
Autresnavires
Oiltankers
Pétroliers
Bulkcarriers
Vraquiers
Generalcargo
Navires de charge
classique
Containerships
Porte-conteneurs
Othertypes
Autresnavires
Peru - Pérou 1990 841.0 0.1 0.1 0.2 .. 0.1 40.1 25.7 28.2 .. 6.11995 317.3 0.0 0.0 0.1 .. 0.1 41.2 15.9 24.2 .. 18.72000 267.0 0.0 0.0 0.1 .. 0.1 29.7 9.6 30.4 .. 30.42007 151.1 0.0 .. 0.0 .. 0.1 17.9 .. 24.5 .. 57.6
Suriname 1990 15.0 0.0 .. 0.0 0.0 0.0 13.3 .. 66.7 13.3 6.71995 9.7 0.0 .. 0.0 0.0 0.0 31.3 .. 42.5 18.3 7.92000 7.2 0.0 .. 0.0 .. 0.0 42.1 .. 43.8 .. 14.22007 6.8 0.0 .. 0.0 .. 0.0 49.9 .. 46.4 .. 3.7
Uruguay 1990 155.0 0.0 .. 0.0 0.2 0.1 60.6 .. 1.9 21.9 15.51995 150.3 0.0 .. 0.0 0.1 0.0 62.1 .. 1.8 18.7 17.42000 38.1 0.0 .. 0.0 .. 0.0 22.0 .. 3.3 .. 74.72007 65.9 0.0 .. 0.0 .. 0.1 20.5 .. 13.2 .. 66.3
Venezuela (Bolivarian Rep. of) - 1990 1 727.0 0.3 0.1 0.4 0.0 0.7 43.9 15.3 21.1 0.2 19.5Venezuela (Rép. bolivarienne du) 1995 1 374.3 0.3 0.1 0.1 0.0 0.5 50.1 18.4 10.5 0.1 20.9
2000 936.7 0.1 0.1 0.1 0.0 0.4 40.1 20.7 8.1 0.1 31.02007 1 554.3 0.2 0.1 0.0 0.0 0.6 55.5 17.6 3.0 0.2 23.6
Developing economies: Asia - 1990 115 295.0 12.6 23.2 23.8 18.2 12.1 25.7 45.0 20.7 3.5 5.0Économies en développement : Asie 1995 132 218.5 12.7 24.6 23.5 18.0 12.2 25.9 45.7 18.4 5.0 5.1
2000 148 205.1 14.7 22.8 25.0 17.2 13.4 27.9 41.5 17.1 7.1 6.42007 236 526.8 22.0 25.0 29.1 16.5 16.1 35.6 38.9 12.4 8.9 4.3
Eastern Asia - Asie orientale 1990 43 401.0 2.4 10.8 9.8 9.3 3.8 12.8 55.5 22.8 4.8 4.21995 48 822.3 2.3 11.2 9.1 10.2 3.4 12.7 56.6 19.2 7.6 3.92000 46 394.3 1.8 9.6 9.0 6.6 3.1 11.0 55.7 19.7 8.8 4.82007 112 423.9 6.4 16.8 11.7 9.1 3.9 21.9 55.0 10.5 10.4 2.1
China - Chine (c) 1990 20 200.0 1.1 3.6 7.7 4.0 1.8 13.2 39.9 38.2 4.5 4.21995 23 357.0 1.4 4.1 6.9 4.5 1.7 15.7 42.8 30.4 7.1 4.02000 23 701.2 1.2 4.1 6.4 2.7 1.6 14.3 46.8 27.2 7.0 4.72007 39 159.5 2.4 4.9 6.4 3.5 1.8 23.3 45.9 16.6 11.4 2.9
China, Hong Kong SAR - 1990 10 337.0 0.6 3.5 0.4 2.1 0.6 13.1 75.2 4.2 4.5 2.8Chine (RAS de Hong Kong) 1995 13 588.7 0.5 4.4 0.7 1.9 0.3 9.2 79.1 5.4 5.1 1.1
2000 13 190.9 0.3 3.6 0.9 2.4 0.1 7.1 73.9 7.2 11.2 0.62007 54 734.0 3.4 8.9 2.7 4.5 0.8 23.9 59.7 4.9 10.6 0.9
China, Macao SAR - Chine (RAS de Macao)
2007 2.2 .. .. .. .. 0.0 .. .. .. .. 100.0
Dem. People's Rep. of Korea - 1990 529.0 0.0 0.0 0.4 .. 0.0 3.8 20.6 71.6 .. 4.0Rép. populaire dém. de Corée 1995 1 079.1 0.1 0.1 0.6 .. 0.1 21.6 19.3 54.4 .. 4.7
2000 846.6 0.0 0.0 0.7 .. 0.1 1.4 10.4 80.7 .. 7.62007 1 444.9 0.0 0.1 1.0 0.0 0.1 7.0 18.3 69.6 1.6 3.6
Mongolia - Mongolie 2007 627.0 0.0 0.1 0.3 .. 0.0 7.1 36.7 53.7 .. 2.4
Republic of Korea - République de Corée 1990 12 335.0 0.6 3.6 1.4 3.2 1.3 12.2 65.8 11.0 5.8 5.21995 10 797.5 0.4 2.7 0.9 3.8 1.4 9.5 61.7 9.0 12.7 7.22000 8 655.5 0.3 1.8 1.1 1.5 1.3 8.9 56.8 12.3 11.0 11.12007 16 456.3 0.6 2.9 1.3 1.1 1.1 13.9 65.0 8.2 8.6 4.3
Southern Asia - Asie méridionale 1990 20 524.0 3.9 3.2 3.5 .. 1.4 45.3 34.6 16.9 .. 3.31995 19 013.2 3.3 2.8 2.4 0.3 1.6 46.3 35.6 13.0 0.5 4.62000 18 704.6 3.0 2.4 2.4 0.3 1.7 45.2 34.5 13.1 1.0 6.32007 24 504.6 4.0 1.5 1.8 0.5 2.0 62.7 22.2 7.3 2.6 5.2
Bangladesh 1990 587.0 0.0 .. 0.5 .. 0.0 14.1 .. 83.5 .. 2.41995 532.4 0.0 .. 0.4 .. 0.0 16.2 .. 80.5 .. 3.32000 518.7 0.0 0.0 0.4 .. 0.0 19.6 1.7 74.9 .. 3.82007 617.6 0.0 0.0 0.3 0.0 0.0 16.6 14.4 56.2 10.0 2.8
India - Inde 1990 10 207.0 1.2 2.3 1.6 .. 1.0 28.5 50.9 15.9 .. 4.71995 10 508.4 1.6 1.9 0.9 0.3 1.2 39.7 44.2 8.7 1.0 6.42000 11 209.3 1.7 1.7 0.6 0.2 1.4 43.1 41.3 5.9 1.2 8.62007 13 904.4 2.3 1.0 0.3 0.1 1.8 63.1 25.7 2.1 1.2 7.9
Iran (Islamic Rep. of) - 1990 8 685.0 2.6 0.8 0.6 .. 0.3 71.3 20.4 6.5 .. 1.8Iran (Rép. islamique d') 1995 6 840.0 1.6 0.7 0.6 0.0 0.3 63.0 25.7 9.0 0.0 2.3
2000 6 097.3 1.2 0.6 0.9 0.0 0.2 55.9 26.4 14.8 0.2 2.62007 8 952.8 1.6 0.5 0.7 0.3 0.2 67.9 19.1 7.7 3.9 1.4
For sources and notes, see end of table. Pour les sources et les notes, se reporter à la fin du tableau.
Region,country or territory
Régionspays ou territoires
Year
Année
Total fleet (thousands
of DWT)(1)
Flotte totale (milliers de TPL)
(1)
As percentage of world total fleetEn pourcentage de la flotte mondiale
As percentage of the country or region total fleetEn pourcentage de la flotte totale du pays ou de la région
5.4 World merchant fleet by flag of registration and type of ship of countries and geographical regions
5.4 Flotte marchande mondiale par pavillons d'immatriculation et par types de naviresdes pays et des régions géographiques
286

Oiltankers
Pétroliers
Bulkcarriers
Vraquiers
Generalcargo
Navires de charge
classique
Containerships
Porte-conteneurs
Othertypes
Autresnavires
Oiltankers
Pétroliers
Bulkcarriers
Vraquiers
Generalcargo
Navires de charge
classique
Containerships
Porte-conteneurs
Othertypes
Autresnavires
Maldives 1990 148.0 0.0 0.0 0.1 .. 0.0 6.8 48.6 43.2 .. 1.41995 106.8 0.0 0.0 0.1 .. 0.0 11.9 18.3 62.7 .. 7.22000 132.8 0.0 .. 0.1 .. 0.0 6.5 .. 88.5 .. 4.92007 132.6 0.0 .. 0.1 .. 0.0 13.3 .. 82.7 .. 4.0
Pakistan 1990 526.0 0.0 .. 0.4 .. 0.0 17.1 .. 80.8 .. 2.11995 575.0 0.0 0.1 0.3 .. 0.0 15.8 28.2 54.0 .. 2.12000 458.7 0.0 0.0 0.3 0.1 0.0 19.8 11.4 56.8 9.1 2.92007 673.1 0.1 0.0 0.2 0.0 0.0 57.6 9.8 27.3 3.2 2.1
Sri Lanka 1990 371.0 0.0 0.0 0.3 .. 0.0 4.0 14.8 80.1 .. 1.11995 450.6 0.0 0.1 0.1 .. 0.0 29.2 40.0 29.9 .. 0.92000 287.6 0.0 0.1 0.1 .. 0.0 3.5 52.0 42.2 .. 2.42007 224.1 0.0 0.0 0.2 0.0 0.0 6.5 5.5 68.3 14.3 5.3
South-Eastern Asia - Asie du Sud-Est 1990 35 050.0 2.8 7.9 6.9 6.5 4.9 19.0 50.2 19.9 4.1 6.71995 45 436.4 4.4 8.0 8.3 6.2 5.3 26.3 43.4 18.8 4.9 6.52000 62 945.1 7.7 8.0 9.4 8.3 6.9 34.5 34.5 15.2 8.1 7.82007 83 678.9 9.8 5.6 12.6 5.9 8.8 44.8 24.5 15.2 9.0 6.6
Brunei Darussalam - Brunéi Darussalam 1990 346.0 .. .. 0.0 .. 0.7 .. .. 0.3 .. 99.71995 352.8 0.0 .. 0.0 .. 0.6 0.1 .. 1.4 .. 98.62000 349.6 0.0 .. 0.0 .. 0.5 0.1 .. 0.7 .. 99.22007 420.7 0.0 .. 0.0 .. 0.7 0.4 .. 0.5 .. 99.2
Cambodia - Cambodge 1990 4.0 .. .. 0.0 .. 0.0 .. .. 25.0 .. 75.02007 2 699.1 0.0 0.2 1.7 0.0 0.1 4.8 27.3 64.1 1.8 2.0
Indonesia - Indonésie 1990 2 742.0 0.4 0.1 1.2 0.3 0.5 35.2 7.7 45.4 2.7 9.01995 3 403.6 0.4 0.1 1.6 0.3 0.6 31.4 7.5 49.1 2.7 9.42000 4 153.7 0.5 0.2 1.8 0.1 0.5 32.1 14.8 43.5 1.4 8.22007 6 268.3 0.5 0.2 2.5 0.4 0.7 32.7 12.6 40.4 7.4 6.9
Lao People's dem. Rep. - Rép. dém. populaire lao
2007 4.7 .. .. 0.0 .. .. .. .. 100.0 .. ..
Malaysia - Malaisie 1990 2 364.0 0.1 0.3 0.7 1.0 1.1 12.0 26.9 29.6 9.8 21.81995 4 134.2 0.2 0.6 0.7 1.0 1.8 15.8 35.0 16.7 8.5 24.02000 7 577.5 0.6 1.0 0.9 1.3 2.3 21.6 35.3 11.4 10.5 21.32007 8 570.8 1.2 0.2 0.6 0.7 3.3 52.0 6.9 6.9 9.8 24.3
Myanmar 1990 907.0 0.0 0.3 0.2 .. 0.1 0.4 72.5 23.5 .. 3.51995 934.1 0.0 0.2 0.3 0.1 0.0 0.5 64.3 29.6 2.7 2.92000 792.3 0.0 0.2 0.2 0.0 0.0 0.6 63.7 30.8 3.2 1.72007 574.1 0.0 0.1 0.2 .. 0.0 0.8 63.0 33.8 .. 2.4
Philippines 1990 15 468.0 0.3 5.5 2.1 0.3 0.3 5.0 79.9 13.7 0.4 1.11995 14 765.8 0.3 4.6 2.1 0.5 0.4 5.4 77.0 15.0 1.2 1.42000 11 112.0 0.1 3.1 2.0 0.3 0.5 2.1 74.7 18.5 1.4 3.22007 6 697.9 0.2 1.1 1.6 0.1 0.4 9.7 59.8 23.6 2.7 4.1
Singapore - Singapour 1990 11 888.0 1.9 1.7 1.7 4.6 2.1 37.6 31.2 14.2 8.6 8.41995 18 520.0 3.3 2.3 1.8 4.1 1.1 48.0 30.4 10.2 8.1 3.32000 34 635.5 6.3 3.2 2.6 6.3 2.6 50.9 25.0 7.5 11.2 5.42007 50 981.1 7.6 3.3 2.6 4.3 3.0 56.8 23.6 5.1 10.9 3.6
Thailand - Thaïlande 1990 805.0 0.1 0.0 0.6 0.2 0.1 16.0 2.1 70.2 6.2 5.51995 2 111.7 0.1 0.2 1.1 0.3 0.2 16.8 18.2 55.5 5.3 4.22000 3 068.4 0.2 0.3 1.3 0.3 0.2 22.4 25.6 42.7 5.2 4.12007 4 318.3 0.2 0.4 1.6 0.3 0.2 15.2 35.1 38.3 8.1 3.4
Viet Nam 1990 526.0 0.0 0.0 0.4 .. 0.0 6.5 4.6 85.9 .. 3.01995 1 214.2 0.1 0.0 0.6 .. 0.7 15.5 3.0 51.3 .. 30.32000 1 256.1 0.1 0.1 0.7 0.0 0.3 13.5 12.0 54.3 1.3 18.92007 3 144.0 0.2 0.1 1.8 0.1 0.4 19.5 13.8 57.1 2.5 7.1
Western Asia - Asie occidentale 1990 16 320.0 3.5 1.4 3.5 2.4 1.9 50.2 19.0 21.8 3.3 5.71995 18 946.5 2.7 2.5 3.8 1.3 1.9 38.5 33.0 20.5 2.5 5.42000 20 161.2 2.2 2.8 4.1 1.9 1.7 30.1 37.5 20.5 5.9 6.02007 15 919.4 1.7 1.1 3.0 1.0 1.4 41.5 26.1 18.9 8.0 5.5
Bahrain - Bahreïn 1990 65.0 0.0 0.0 0.0 .. 0.0 3.1 30.8 41.5 .. 24.61995 243.3 0.0 0.0 0.1 .. 0.1 40.4 5.4 40.6 .. 13.62000 369.8 0.0 0.0 0.1 0.2 0.0 26.2 11.9 26.5 27.0 8.32007 410.1 0.0 0.0 0.0 0.1 0.1 37.5 20.8 1.0 24.3 16.3
For sources and notes, see end of table. Pour les sources et les notes, se reporter à la fin du tableau.
Region,country or territory
Régionspays ou territoires
Year
Année
Total fleet (thousands
of DWT)(1)
Flotte totale (milliers de TPL)
(1)
As percentage of world total fleetEn pourcentage de la flotte mondiale
As percentage of the country or region total fleetEn pourcentage de la flotte totale du pays ou de la région
5.4 World merchant fleet by flag of registration and type of ship of countries and geographical regions
5.4 Flotte marchande mondiale par pavillons d'immatriculation et par types de naviresdes pays et des régions géographiques
287
5
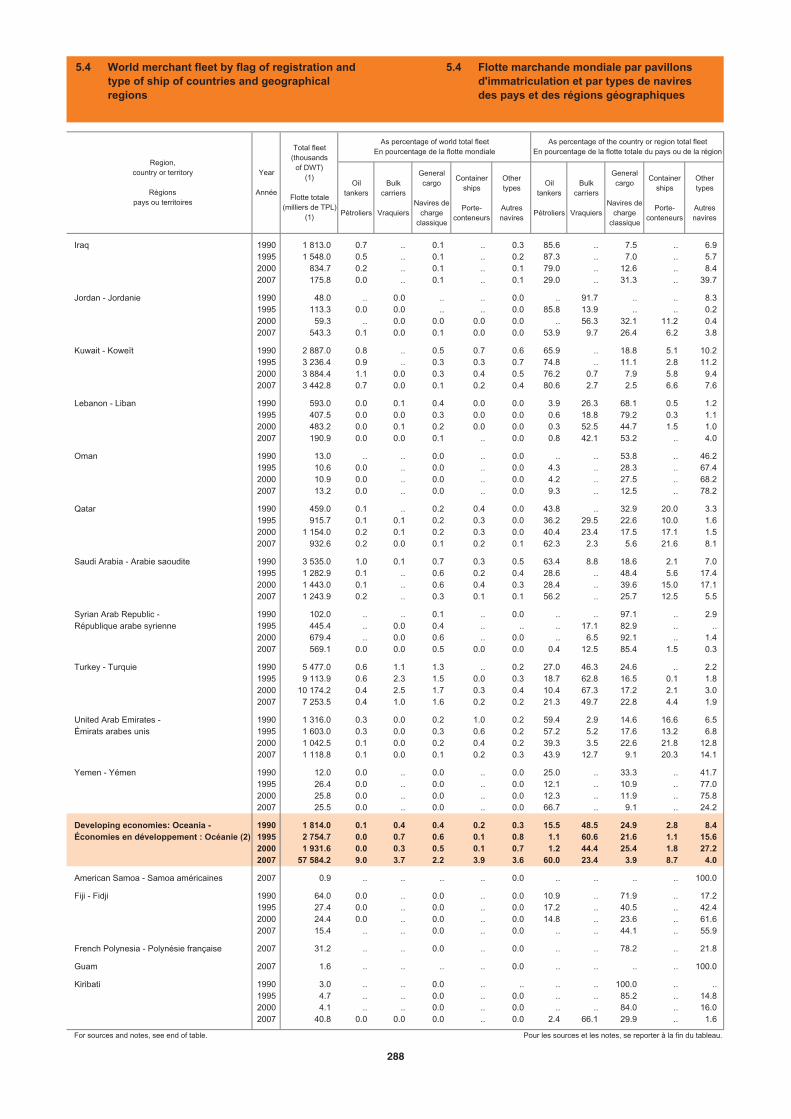
Oiltankers
Pétroliers
Bulkcarriers
Vraquiers
Generalcargo
Navires de charge
classique
Containerships
Porte-conteneurs
Othertypes
Autresnavires
Oiltankers
Pétroliers
Bulkcarriers
Vraquiers
Generalcargo
Navires de charge
classique
Containerships
Porte-conteneurs
Othertypes
Autresnavires
Iraq 1990 1 813.0 0.7 .. 0.1 .. 0.3 85.6 .. 7.5 .. 6.91995 1 548.0 0.5 .. 0.1 .. 0.2 87.3 .. 7.0 .. 5.72000 834.7 0.2 .. 0.1 .. 0.1 79.0 .. 12.6 .. 8.42007 175.8 0.0 .. 0.1 .. 0.1 29.0 .. 31.3 .. 39.7
Jordan - Jordanie 1990 48.0 .. 0.0 .. .. 0.0 .. 91.7 .. .. 8.31995 113.3 0.0 0.0 .. .. 0.0 85.8 13.9 .. .. 0.22000 59.3 .. 0.0 0.0 0.0 0.0 .. 56.3 32.1 11.2 0.42007 543.3 0.1 0.0 0.1 0.0 0.0 53.9 9.7 26.4 6.2 3.8
Kuwait - Koweït 1990 2 887.0 0.8 .. 0.5 0.7 0.6 65.9 .. 18.8 5.1 10.21995 3 236.4 0.9 .. 0.3 0.3 0.7 74.8 .. 11.1 2.8 11.22000 3 884.4 1.1 0.0 0.3 0.4 0.5 76.2 0.7 7.9 5.8 9.42007 3 442.8 0.7 0.0 0.1 0.2 0.4 80.6 2.7 2.5 6.6 7.6
Lebanon - Liban 1990 593.0 0.0 0.1 0.4 0.0 0.0 3.9 26.3 68.1 0.5 1.21995 407.5 0.0 0.0 0.3 0.0 0.0 0.6 18.8 79.2 0.3 1.12000 483.2 0.0 0.1 0.2 0.0 0.0 0.3 52.5 44.7 1.5 1.02007 190.9 0.0 0.0 0.1 .. 0.0 0.8 42.1 53.2 .. 4.0
Oman 1990 13.0 .. .. 0.0 .. 0.0 .. .. 53.8 .. 46.21995 10.6 0.0 .. 0.0 .. 0.0 4.3 .. 28.3 .. 67.42000 10.9 0.0 .. 0.0 .. 0.0 4.2 .. 27.5 .. 68.22007 13.2 0.0 .. 0.0 .. 0.0 9.3 .. 12.5 .. 78.2
Qatar 1990 459.0 0.1 .. 0.2 0.4 0.0 43.8 .. 32.9 20.0 3.31995 915.7 0.1 0.1 0.2 0.3 0.0 36.2 29.5 22.6 10.0 1.62000 1 154.0 0.2 0.1 0.2 0.3 0.0 40.4 23.4 17.5 17.1 1.52007 932.6 0.2 0.0 0.1 0.2 0.1 62.3 2.3 5.6 21.6 8.1
Saudi Arabia - Arabie saoudite 1990 3 535.0 1.0 0.1 0.7 0.3 0.5 63.4 8.8 18.6 2.1 7.01995 1 282.9 0.1 .. 0.6 0.2 0.4 28.6 .. 48.4 5.6 17.42000 1 443.0 0.1 .. 0.6 0.4 0.3 28.4 .. 39.6 15.0 17.12007 1 243.9 0.2 .. 0.3 0.1 0.1 56.2 .. 25.7 12.5 5.5
Syrian Arab Republic - 1990 102.0 .. .. 0.1 .. 0.0 .. .. 97.1 .. 2.9République arabe syrienne 1995 445.4 .. 0.0 0.4 .. .. .. 17.1 82.9 .. ..
2000 679.4 .. 0.0 0.6 .. 0.0 .. 6.5 92.1 .. 1.42007 569.1 0.0 0.0 0.5 0.0 0.0 0.4 12.5 85.4 1.5 0.3
Turkey - Turquie 1990 5 477.0 0.6 1.1 1.3 .. 0.2 27.0 46.3 24.6 .. 2.21995 9 113.9 0.6 2.3 1.5 0.0 0.3 18.7 62.8 16.5 0.1 1.82000 10 174.2 0.4 2.5 1.7 0.3 0.4 10.4 67.3 17.2 2.1 3.02007 7 253.5 0.4 1.0 1.6 0.2 0.2 21.3 49.7 22.8 4.4 1.9
United Arab Emirates - 1990 1 316.0 0.3 0.0 0.2 1.0 0.2 59.4 2.9 14.6 16.6 6.5Émirats arabes unis 1995 1 603.0 0.3 0.0 0.3 0.6 0.2 57.2 5.2 17.6 13.2 6.8
2000 1 042.5 0.1 0.0 0.2 0.4 0.2 39.3 3.5 22.6 21.8 12.82007 1 118.8 0.1 0.0 0.1 0.2 0.3 43.9 12.7 9.1 20.3 14.1
Yemen - Yémen 1990 12.0 0.0 .. 0.0 .. 0.0 25.0 .. 33.3 .. 41.71995 26.4 0.0 .. 0.0 .. 0.0 12.1 .. 10.9 .. 77.02000 25.8 0.0 .. 0.0 .. 0.0 12.3 .. 11.9 .. 75.82007 25.5 0.0 .. 0.0 .. 0.0 66.7 .. 9.1 .. 24.2
Developing economies: Oceania - 1990 1 814.0 0.1 0.4 0.4 0.2 0.3 15.5 48.5 24.9 2.8 8.4Économies en développement : Océanie (2) 1995 2 754.7 0.0 0.7 0.6 0.1 0.8 1.1 60.6 21.6 1.1 15.6
2000 1 931.6 0.0 0.3 0.5 0.1 0.7 1.2 44.4 25.4 1.8 27.22007 57 584.2 9.0 3.7 2.2 3.9 3.6 60.0 23.4 3.9 8.7 4.0
American Samoa - Samoa américaines 2007 0.9 .. .. .. .. 0.0 .. .. .. .. 100.0
Fiji - Fidji 1990 64.0 0.0 .. 0.0 .. 0.0 10.9 .. 71.9 .. 17.21995 27.4 0.0 .. 0.0 .. 0.0 17.2 .. 40.5 .. 42.42000 24.4 0.0 .. 0.0 .. 0.0 14.8 .. 23.6 .. 61.62007 15.4 .. .. 0.0 .. 0.0 .. .. 44.1 .. 55.9
French Polynesia - Polynésie française 2007 31.2 .. .. 0.0 .. 0.0 .. .. 78.2 .. 21.8
Guam 2007 1.6 .. .. .. .. 0.0 .. .. .. .. 100.0
Kiribati 1990 3.0 .. .. 0.0 .. .. .. .. 100.0 .. ..1995 4.7 .. .. 0.0 .. 0.0 .. .. 85.2 .. 14.82000 4.1 .. .. 0.0 .. 0.0 .. .. 84.0 .. 16.02007 40.8 0.0 0.0 0.0 .. 0.0 2.4 66.1 29.9 .. 1.6
For sources and notes, see end of table. Pour les sources et les notes, se reporter à la fin du tableau.
Region,country or territory
Régionspays ou territoires
Year
Année
Total fleet (thousands
of DWT)(1)
Flotte totale (milliers de TPL)
(1)
As percentage of world total fleetEn pourcentage de la flotte mondiale
As percentage of the country or region total fleetEn pourcentage de la flotte totale du pays ou de la région
5.4 World merchant fleet by flag of registration and type of ship of countries and geographical regions
5.4 Flotte marchande mondiale par pavillons d'immatriculation et par types de naviresdes pays et des régions géographiques
288
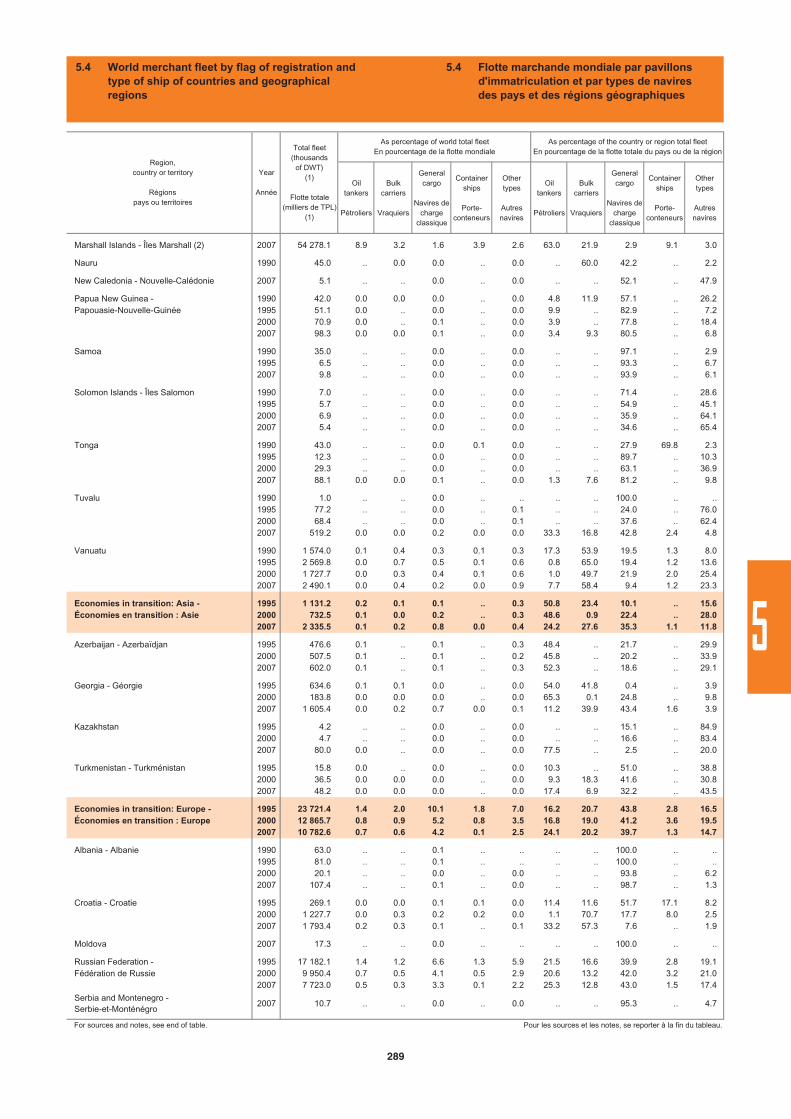
Oiltankers
Pétroliers
Bulkcarriers
Vraquiers
Generalcargo
Navires de charge
classique
Containerships
Porte-conteneurs
Othertypes
Autresnavires
Oiltankers
Pétroliers
Bulkcarriers
Vraquiers
Generalcargo
Navires de charge
classique
Containerships
Porte-conteneurs
Othertypes
Autresnavires
Marshall Islands - Îles Marshall (2) 2007 54 278.1 8.9 3.2 1.6 3.9 2.6 63.0 21.9 2.9 9.1 3.0
Nauru 1990 45.0 .. 0.0 0.0 .. 0.0 .. 60.0 42.2 .. 2.2
New Caledonia - Nouvelle-Calédonie 2007 5.1 .. .. 0.0 .. 0.0 .. .. 52.1 .. 47.9
Papua New Guinea - 1990 42.0 0.0 0.0 0.0 .. 0.0 4.8 11.9 57.1 .. 26.2Papouasie-Nouvelle-Guinée 1995 51.1 0.0 .. 0.0 .. 0.0 9.9 .. 82.9 .. 7.2
2000 70.9 0.0 .. 0.1 .. 0.0 3.9 .. 77.8 .. 18.42007 98.3 0.0 0.0 0.1 .. 0.0 3.4 9.3 80.5 .. 6.8
Samoa 1990 35.0 .. .. 0.0 .. 0.0 .. .. 97.1 .. 2.91995 6.5 .. .. 0.0 .. 0.0 .. .. 93.3 .. 6.72007 9.8 .. .. 0.0 .. 0.0 .. .. 93.9 .. 6.1
Solomon Islands - Îles Salomon 1990 7.0 .. .. 0.0 .. 0.0 .. .. 71.4 .. 28.61995 5.7 .. .. 0.0 .. 0.0 .. .. 54.9 .. 45.12000 6.9 .. .. 0.0 .. 0.0 .. .. 35.9 .. 64.12007 5.4 .. .. 0.0 .. 0.0 .. .. 34.6 .. 65.4
Tonga 1990 43.0 .. .. 0.0 0.1 0.0 .. .. 27.9 69.8 2.31995 12.3 .. .. 0.0 .. 0.0 .. .. 89.7 .. 10.32000 29.3 .. .. 0.0 .. 0.0 .. .. 63.1 .. 36.92007 88.1 0.0 0.0 0.1 .. 0.0 1.3 7.6 81.2 .. 9.8
Tuvalu 1990 1.0 .. .. 0.0 .. .. .. .. 100.0 .. ..1995 77.2 .. .. 0.0 .. 0.1 .. .. 24.0 .. 76.02000 68.4 .. .. 0.0 .. 0.1 .. .. 37.6 .. 62.42007 519.2 0.0 0.0 0.2 0.0 0.0 33.3 16.8 42.8 2.4 4.8
Vanuatu 1990 1 574.0 0.1 0.4 0.3 0.1 0.3 17.3 53.9 19.5 1.3 8.01995 2 569.8 0.0 0.7 0.5 0.1 0.6 0.8 65.0 19.4 1.2 13.62000 1 727.7 0.0 0.3 0.4 0.1 0.6 1.0 49.7 21.9 2.0 25.42007 2 490.1 0.0 0.4 0.2 0.0 0.9 7.7 58.4 9.4 1.2 23.3
Economies in transition: Asia - 1995 1 131.2 0.2 0.1 0.1 .. 0.3 50.8 23.4 10.1 .. 15.6Économies en transition : Asie 2000 732.5 0.1 0.0 0.2 .. 0.3 48.6 0.9 22.4 .. 28.0
2007 2 335.5 0.1 0.2 0.8 0.0 0.4 24.2 27.6 35.3 1.1 11.8
Azerbaijan - Azerbaïdjan 1995 476.6 0.1 .. 0.1 .. 0.3 48.4 .. 21.7 .. 29.92000 507.5 0.1 .. 0.1 .. 0.2 45.8 .. 20.2 .. 33.92007 602.0 0.1 .. 0.1 .. 0.3 52.3 .. 18.6 .. 29.1
Georgia - Géorgie 1995 634.6 0.1 0.1 0.0 .. 0.0 54.0 41.8 0.4 .. 3.92000 183.8 0.0 0.0 0.0 .. 0.0 65.3 0.1 24.8 .. 9.82007 1 605.4 0.0 0.2 0.7 0.0 0.1 11.2 39.9 43.4 1.6 3.9
Kazakhstan 1995 4.2 .. .. 0.0 .. 0.0 .. .. 15.1 .. 84.92000 4.7 .. .. 0.0 .. 0.0 .. .. 16.6 .. 83.42007 80.0 0.0 .. 0.0 .. 0.0 77.5 .. 2.5 .. 20.0
Turkmenistan - Turkménistan 1995 15.8 0.0 .. 0.0 .. 0.0 10.3 .. 51.0 .. 38.82000 36.5 0.0 0.0 0.0 .. 0.0 9.3 18.3 41.6 .. 30.82007 48.2 0.0 0.0 0.0 .. 0.0 17.4 6.9 32.2 .. 43.5
Economies in transition: Europe - 1995 23 721.4 1.4 2.0 10.1 1.8 7.0 16.2 20.7 43.8 2.8 16.5Économies en transition : Europe 2000 12 865.7 0.8 0.9 5.2 0.8 3.5 16.8 19.0 41.2 3.6 19.5
2007 10 782.6 0.7 0.6 4.2 0.1 2.5 24.1 20.2 39.7 1.3 14.7
Albania - Albanie 1990 63.0 .. .. 0.1 .. .. .. .. 100.0 .. ..1995 81.0 .. .. 0.1 .. .. .. .. 100.0 .. ..2000 20.1 .. .. 0.0 .. 0.0 .. .. 93.8 .. 6.22007 107.4 .. .. 0.1 .. 0.0 .. .. 98.7 .. 1.3
Croatia - Croatie 1995 269.1 0.0 0.0 0.1 0.1 0.0 11.4 11.6 51.7 17.1 8.22000 1 227.7 0.0 0.3 0.2 0.2 0.0 1.1 70.7 17.7 8.0 2.52007 1 793.4 0.2 0.3 0.1 .. 0.1 33.2 57.3 7.6 .. 1.9
Moldova 2007 17.3 .. .. 0.0 .. .. .. .. 100.0 .. ..
Russian Federation - 1995 17 182.1 1.4 1.2 6.6 1.3 5.9 21.5 16.6 39.9 2.8 19.1Fédération de Russie 2000 9 950.4 0.7 0.5 4.1 0.5 2.9 20.6 13.2 42.0 3.2 21.0
2007 7 723.0 0.5 0.3 3.3 0.1 2.2 25.3 12.8 43.0 1.5 17.4
Serbia and Montenegro - Serbie-et-Monténégro
2007 10.7 .. .. 0.0 .. 0.0 .. .. 95.3 .. 4.7
For sources and notes, see end of table. Pour les sources et les notes, se reporter à la fin du tableau.
Region,country or territory
Régionspays ou territoires
Year
Année
Total fleet (thousands
of DWT)(1)
Flotte totale (milliers de TPL)
(1)
As percentage of world total fleetEn pourcentage de la flotte mondiale
As percentage of the country or region total fleetEn pourcentage de la flotte totale du pays ou de la région
5.4 World merchant fleet by flag of registration and type of ship of countries and geographical regions
5.4 Flotte marchande mondiale par pavillons d'immatriculation et par types de naviresdes pays et des régions géographiques
289
5
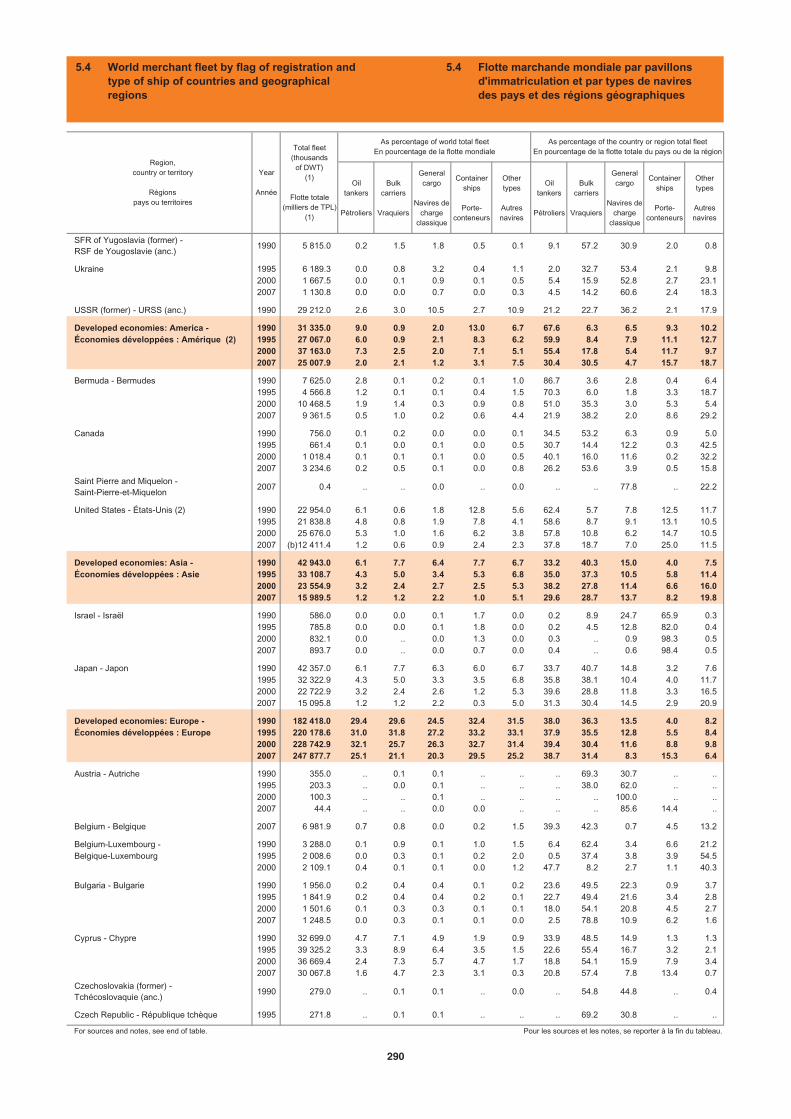
Oiltankers
Pétroliers
Bulkcarriers
Vraquiers
Generalcargo
Navires de charge
classique
Containerships
Porte-conteneurs
Othertypes
Autresnavires
Oiltankers
Pétroliers
Bulkcarriers
Vraquiers
Generalcargo
Navires de charge
classique
Containerships
Porte-conteneurs
Othertypes
Autresnavires
SFR of Yugoslavia (former) - RSF de Yougoslavie (anc.)
1990 5 815.0 0.2 1.5 1.8 0.5 0.1 9.1 57.2 30.9 2.0 0.8
Ukraine 1995 6 189.3 0.0 0.8 3.2 0.4 1.1 2.0 32.7 53.4 2.1 9.82000 1 667.5 0.0 0.1 0.9 0.1 0.5 5.4 15.9 52.8 2.7 23.12007 1 130.8 0.0 0.0 0.7 0.0 0.3 4.5 14.2 60.6 2.4 18.3
USSR (former) - URSS (anc.) 1990 29 212.0 2.6 3.0 10.5 2.7 10.9 21.2 22.7 36.2 2.1 17.9
Developed economies: America - 1990 31 335.0 9.0 0.9 2.0 13.0 6.7 67.6 6.3 6.5 9.3 10.2Économies développées : Amérique (2) 1995 27 067.0 6.0 0.9 2.1 8.3 6.2 59.9 8.4 7.9 11.1 12.7
2000 37 163.0 7.3 2.5 2.0 7.1 5.1 55.4 17.8 5.4 11.7 9.72007 25 007.9 2.0 2.1 1.2 3.1 7.5 30.4 30.5 4.7 15.7 18.7
Bermuda - Bermudes 1990 7 625.0 2.8 0.1 0.2 0.1 1.0 86.7 3.6 2.8 0.4 6.41995 4 566.8 1.2 0.1 0.1 0.4 1.5 70.3 6.0 1.8 3.3 18.72000 10 468.5 1.9 1.4 0.3 0.9 0.8 51.0 35.3 3.0 5.3 5.42007 9 361.5 0.5 1.0 0.2 0.6 4.4 21.9 38.2 2.0 8.6 29.2
Canada 1990 756.0 0.1 0.2 0.0 0.0 0.1 34.5 53.2 6.3 0.9 5.01995 661.4 0.1 0.0 0.1 0.0 0.5 30.7 14.4 12.2 0.3 42.52000 1 018.4 0.1 0.1 0.1 0.0 0.5 40.1 16.0 11.6 0.2 32.22007 3 234.6 0.2 0.5 0.1 0.0 0.8 26.2 53.6 3.9 0.5 15.8
Saint Pierre and Miquelon - Saint-Pierre-et-Miquelon
2007 0.4 .. .. 0.0 .. 0.0 .. .. 77.8 .. 22.2
United States - États-Unis (2) 1990 22 954.0 6.1 0.6 1.8 12.8 5.6 62.4 5.7 7.8 12.5 11.71995 21 838.8 4.8 0.8 1.9 7.8 4.1 58.6 8.7 9.1 13.1 10.52000 25 676.0 5.3 1.0 1.6 6.2 3.8 57.8 10.8 6.2 14.7 10.52007 (b)12 411.4 1.2 0.6 0.9 2.4 2.3 37.8 18.7 7.0 25.0 11.5
Developed economies: Asia - 1990 42 943.0 6.1 7.7 6.4 7.7 6.7 33.2 40.3 15.0 4.0 7.5Économies développées : Asie 1995 33 108.7 4.3 5.0 3.4 5.3 6.8 35.0 37.3 10.5 5.8 11.4
2000 23 554.9 3.2 2.4 2.7 2.5 5.3 38.2 27.8 11.4 6.6 16.02007 15 989.5 1.2 1.2 2.2 1.0 5.1 29.6 28.7 13.7 8.2 19.8
Israel - Israël 1990 586.0 0.0 0.0 0.1 1.7 0.0 0.2 8.9 24.7 65.9 0.31995 785.8 0.0 0.0 0.1 1.8 0.0 0.2 4.5 12.8 82.0 0.42000 832.1 0.0 .. 0.0 1.3 0.0 0.3 .. 0.9 98.3 0.52007 893.7 0.0 .. 0.0 0.7 0.0 0.4 .. 0.6 98.4 0.5
Japan - Japon 1990 42 357.0 6.1 7.7 6.3 6.0 6.7 33.7 40.7 14.8 3.2 7.61995 32 322.9 4.3 5.0 3.3 3.5 6.8 35.8 38.1 10.4 4.0 11.72000 22 722.9 3.2 2.4 2.6 1.2 5.3 39.6 28.8 11.8 3.3 16.52007 15 095.8 1.2 1.2 2.2 0.3 5.0 31.3 30.4 14.5 2.9 20.9
Developed economies: Europe - 1990 182 418.0 29.4 29.6 24.5 32.4 31.5 38.0 36.3 13.5 4.0 8.2Économies développées : Europe 1995 220 178.6 31.0 31.8 27.2 33.2 33.1 37.9 35.5 12.8 5.5 8.4
2000 228 742.9 32.1 25.7 26.3 32.7 31.4 39.4 30.4 11.6 8.8 9.82007 247 877.7 25.1 21.1 20.3 29.5 25.2 38.7 31.4 8.3 15.3 6.4
Austria - Autriche 1990 355.0 .. 0.1 0.1 .. .. .. 69.3 30.7 .. ..1995 203.3 .. 0.0 0.1 .. .. .. 38.0 62.0 .. ..2000 100.3 .. .. 0.1 .. .. .. .. 100.0 .. ..2007 44.4 .. .. 0.0 0.0 .. .. .. 85.6 14.4 ..
Belgium - Belgique 2007 6 981.9 0.7 0.8 0.0 0.2 1.5 39.3 42.3 0.7 4.5 13.2
Belgium-Luxembourg - 1990 3 288.0 0.1 0.9 0.1 1.0 1.5 6.4 62.4 3.4 6.6 21.2Belgique-Luxembourg 1995 2 008.6 0.0 0.3 0.1 0.2 2.0 0.5 37.4 3.8 3.9 54.5
2000 2 109.1 0.4 0.1 0.1 0.0 1.2 47.7 8.2 2.7 1.1 40.3
Bulgaria - Bulgarie 1990 1 956.0 0.2 0.4 0.4 0.1 0.2 23.6 49.5 22.3 0.9 3.71995 1 841.9 0.2 0.4 0.4 0.2 0.1 22.7 49.4 21.6 3.4 2.82000 1 501.6 0.1 0.3 0.3 0.1 0.1 18.0 54.1 20.8 4.5 2.72007 1 248.5 0.0 0.3 0.1 0.1 0.0 2.5 78.8 10.9 6.2 1.6
Cyprus - Chypre 1990 32 699.0 4.7 7.1 4.9 1.9 0.9 33.9 48.5 14.9 1.3 1.31995 39 325.2 3.3 8.9 6.4 3.5 1.5 22.6 55.4 16.7 3.2 2.12000 36 669.4 2.4 7.3 5.7 4.7 1.7 18.8 54.1 15.9 7.9 3.42007 30 067.8 1.6 4.7 2.3 3.1 0.3 20.8 57.4 7.8 13.4 0.7
Czechoslovakia (former) - Tchécoslovaquie (anc.)
1990 279.0 .. 0.1 0.1 .. 0.0 .. 54.8 44.8 .. 0.4
Czech Republic - République tchèque 1995 271.8 .. 0.1 0.1 .. .. .. 69.2 30.8 .. ..
For sources and notes, see end of table. Pour les sources et les notes, se reporter à la fin du tableau.
Region,country or territory
Régionspays ou territoires
Year
Année
Total fleet (thousands
of DWT)(1)
Flotte totale (milliers de TPL)
(1)
As percentage of world total fleetEn pourcentage de la flotte mondiale
As percentage of the country or region total fleetEn pourcentage de la flotte totale du pays ou de la région
5.4 World merchant fleet by flag of registration and type of ship of countries and geographical regions
5.4 Flotte marchande mondiale par pavillons d'immatriculation et par types de naviresdes pays et des régions géographiques
290
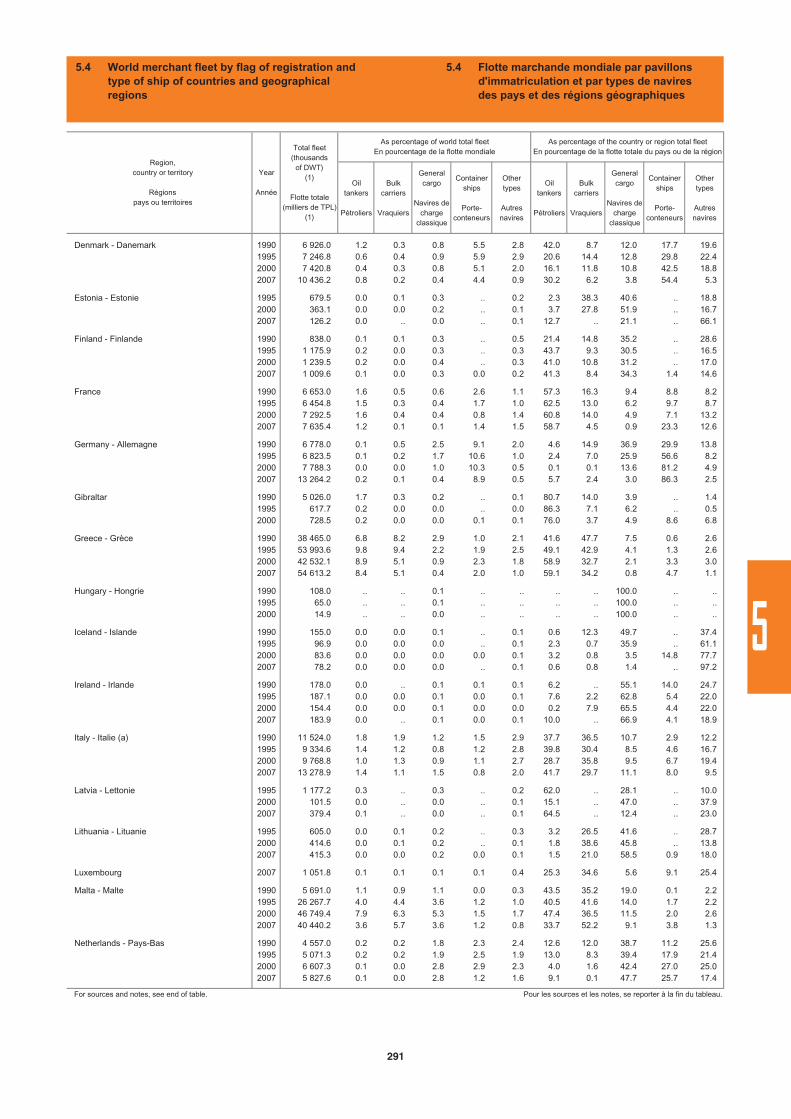
Oiltankers
Pétroliers
Bulkcarriers
Vraquiers
Generalcargo
Navires de charge
classique
Containerships
Porte-conteneurs
Othertypes
Autresnavires
Oiltankers
Pétroliers
Bulkcarriers
Vraquiers
Generalcargo
Navires de charge
classique
Containerships
Porte-conteneurs
Othertypes
Autresnavires
Denmark - Danemark 1990 6 926.0 1.2 0.3 0.8 5.5 2.8 42.0 8.7 12.0 17.7 19.61995 7 246.8 0.6 0.4 0.9 5.9 2.9 20.6 14.4 12.8 29.8 22.42000 7 420.8 0.4 0.3 0.8 5.1 2.0 16.1 11.8 10.8 42.5 18.82007 10 436.2 0.8 0.2 0.4 4.4 0.9 30.2 6.2 3.8 54.4 5.3
Estonia - Estonie 1995 679.5 0.0 0.1 0.3 .. 0.2 2.3 38.3 40.6 .. 18.82000 363.1 0.0 0.0 0.2 .. 0.1 3.7 27.8 51.9 .. 16.72007 126.2 0.0 .. 0.0 .. 0.1 12.7 .. 21.1 .. 66.1
Finland - Finlande 1990 838.0 0.1 0.1 0.3 .. 0.5 21.4 14.8 35.2 .. 28.61995 1 175.9 0.2 0.0 0.3 .. 0.3 43.7 9.3 30.5 .. 16.52000 1 239.5 0.2 0.0 0.4 .. 0.3 41.0 10.8 31.2 .. 17.02007 1 009.6 0.1 0.0 0.3 0.0 0.2 41.3 8.4 34.3 1.4 14.6
France 1990 6 653.0 1.6 0.5 0.6 2.6 1.1 57.3 16.3 9.4 8.8 8.21995 6 454.8 1.5 0.3 0.4 1.7 1.0 62.5 13.0 6.2 9.7 8.72000 7 292.5 1.6 0.4 0.4 0.8 1.4 60.8 14.0 4.9 7.1 13.22007 7 635.4 1.2 0.1 0.1 1.4 1.5 58.7 4.5 0.9 23.3 12.6
Germany - Allemagne 1990 6 778.0 0.1 0.5 2.5 9.1 2.0 4.6 14.9 36.9 29.9 13.81995 6 823.5 0.1 0.2 1.7 10.6 1.0 2.4 7.0 25.9 56.6 8.22000 7 788.3 0.0 0.0 1.0 10.3 0.5 0.1 0.1 13.6 81.2 4.92007 13 264.2 0.2 0.1 0.4 8.9 0.5 5.7 2.4 3.0 86.3 2.5
Gibraltar 1990 5 026.0 1.7 0.3 0.2 .. 0.1 80.7 14.0 3.9 .. 1.41995 617.7 0.2 0.0 0.0 .. 0.0 86.3 7.1 6.2 .. 0.52000 728.5 0.2 0.0 0.0 0.1 0.1 76.0 3.7 4.9 8.6 6.8
Greece - Grèce 1990 38 465.0 6.8 8.2 2.9 1.0 2.1 41.6 47.7 7.5 0.6 2.61995 53 993.6 9.8 9.4 2.2 1.9 2.5 49.1 42.9 4.1 1.3 2.62000 42 532.1 8.9 5.1 0.9 2.3 1.8 58.9 32.7 2.1 3.3 3.02007 54 613.2 8.4 5.1 0.4 2.0 1.0 59.1 34.2 0.8 4.7 1.1
Hungary - Hongrie 1990 108.0 .. .. 0.1 .. .. .. .. 100.0 .. ..1995 65.0 .. .. 0.1 .. .. .. .. 100.0 .. ..2000 14.9 .. .. 0.0 .. .. .. .. 100.0 .. ..
Iceland - Islande 1990 155.0 0.0 0.0 0.1 .. 0.1 0.6 12.3 49.7 .. 37.41995 96.9 0.0 0.0 0.0 .. 0.1 2.3 0.7 35.9 .. 61.12000 83.6 0.0 0.0 0.0 0.0 0.1 3.2 0.8 3.5 14.8 77.72007 78.2 0.0 0.0 0.0 .. 0.1 0.6 0.8 1.4 .. 97.2
Ireland - Irlande 1990 178.0 0.0 .. 0.1 0.1 0.1 6.2 .. 55.1 14.0 24.71995 187.1 0.0 0.0 0.1 0.0 0.1 7.6 2.2 62.8 5.4 22.02000 154.4 0.0 0.0 0.1 0.0 0.0 0.2 7.9 65.5 4.4 22.02007 183.9 0.0 .. 0.1 0.0 0.1 10.0 .. 66.9 4.1 18.9
Italy - Italie (a) 1990 11 524.0 1.8 1.9 1.2 1.5 2.9 37.7 36.5 10.7 2.9 12.21995 9 334.6 1.4 1.2 0.8 1.2 2.8 39.8 30.4 8.5 4.6 16.72000 9 768.8 1.0 1.3 0.9 1.1 2.7 28.7 35.8 9.5 6.7 19.42007 13 278.9 1.4 1.1 1.5 0.8 2.0 41.7 29.7 11.1 8.0 9.5
Latvia - Lettonie 1995 1 177.2 0.3 .. 0.3 .. 0.2 62.0 .. 28.1 .. 10.02000 101.5 0.0 .. 0.0 .. 0.1 15.1 .. 47.0 .. 37.92007 379.4 0.1 .. 0.0 .. 0.1 64.5 .. 12.4 .. 23.0
Lithuania - Lituanie 1995 605.0 0.0 0.1 0.2 .. 0.3 3.2 26.5 41.6 .. 28.72000 414.6 0.0 0.1 0.2 .. 0.1 1.8 38.6 45.8 .. 13.82007 415.3 0.0 0.0 0.2 0.0 0.1 1.5 21.0 58.5 0.9 18.0
Luxembourg 2007 1 051.8 0.1 0.1 0.1 0.1 0.4 25.3 34.6 5.6 9.1 25.4
Malta - Malte 1990 5 691.0 1.1 0.9 1.1 0.0 0.3 43.5 35.2 19.0 0.1 2.21995 26 267.7 4.0 4.4 3.6 1.2 1.0 40.5 41.6 14.0 1.7 2.22000 46 749.4 7.9 6.3 5.3 1.5 1.7 47.4 36.5 11.5 2.0 2.62007 40 440.2 3.6 5.7 3.6 1.2 0.8 33.7 52.2 9.1 3.8 1.3
Netherlands - Pays-Bas 1990 4 557.0 0.2 0.2 1.8 2.3 2.4 12.6 12.0 38.7 11.2 25.61995 5 071.3 0.2 0.2 1.9 2.5 1.9 13.0 8.3 39.4 17.9 21.42000 6 607.3 0.1 0.0 2.8 2.9 2.3 4.0 1.6 42.4 27.0 25.02007 5 827.6 0.1 0.0 2.8 1.2 1.6 9.1 0.1 47.7 25.7 17.4
For sources and notes, see end of table. Pour les sources et les notes, se reporter à la fin du tableau.
Region,country or territory
Régionspays ou territoires
Year
Année
Total fleet (thousands
of DWT)(1)
Flotte totale (milliers de TPL)
(1)
As percentage of world total fleetEn pourcentage de la flotte mondiale
As percentage of the country or region total fleetEn pourcentage de la flotte totale du pays ou de la région
5.4 World merchant fleet by flag of registration and type of ship of countries and geographical regions
5.4 Flotte marchande mondiale par pavillons d'immatriculation et par types de naviresdes pays et des régions géographiques
291
5
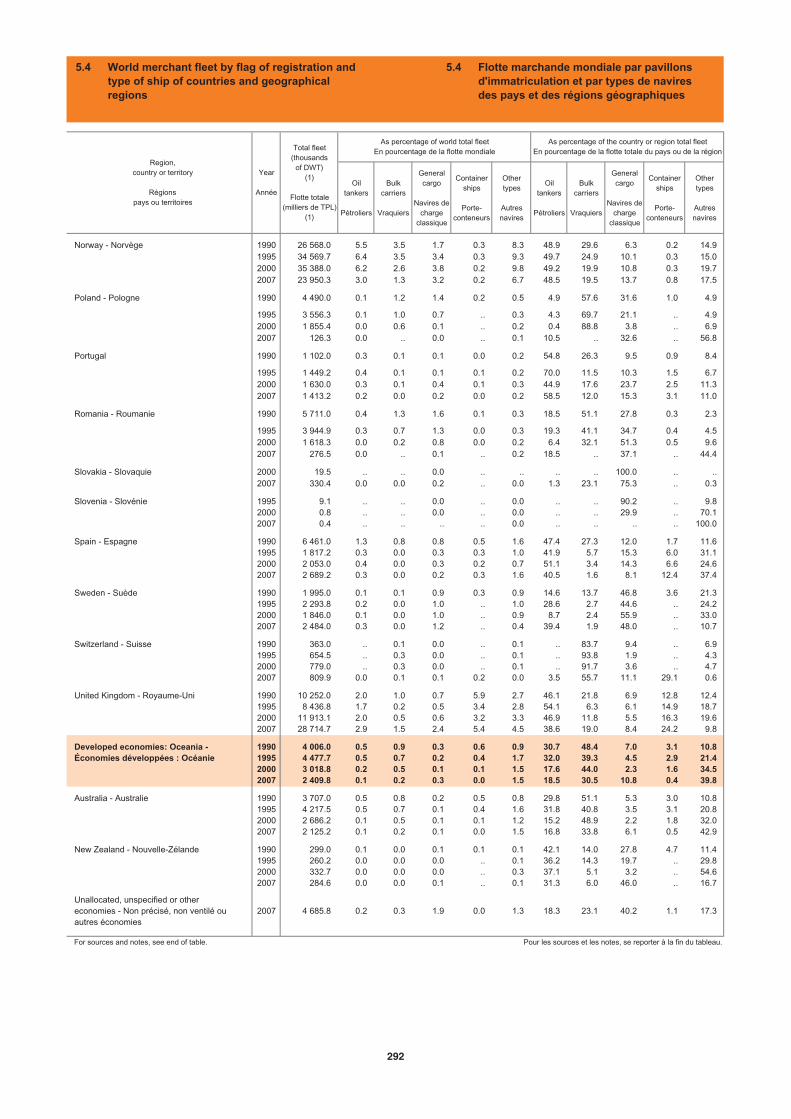
Oiltankers
Pétroliers
Bulkcarriers
Vraquiers
Generalcargo
Navires de charge
classique
Containerships
Porte-conteneurs
Othertypes
Autresnavires
Oiltankers
Pétroliers
Bulkcarriers
Vraquiers
Generalcargo
Navires de charge
classique
Containerships
Porte-conteneurs
Othertypes
Autresnavires
Norway - Norvège 1990 26 568.0 5.5 3.5 1.7 0.3 8.3 48.9 29.6 6.3 0.2 14.91995 34 569.7 6.4 3.5 3.4 0.3 9.3 49.7 24.9 10.1 0.3 15.02000 35 388.0 6.2 2.6 3.8 0.2 9.8 49.2 19.9 10.8 0.3 19.72007 23 950.3 3.0 1.3 3.2 0.2 6.7 48.5 19.5 13.7 0.8 17.5
Poland - Pologne 1990 4 490.0 0.1 1.2 1.4 0.2 0.5 4.9 57.6 31.6 1.0 4.9
1995 3 556.3 0.1 1.0 0.7 .. 0.3 4.3 69.7 21.1 .. 4.92000 1 855.4 0.0 0.6 0.1 .. 0.2 0.4 88.8 3.8 .. 6.92007 126.3 0.0 .. 0.0 .. 0.1 10.5 .. 32.6 .. 56.8
Portugal 1990 1 102.0 0.3 0.1 0.1 0.0 0.2 54.8 26.3 9.5 0.9 8.4
1995 1 449.2 0.4 0.1 0.1 0.1 0.2 70.0 11.5 10.3 1.5 6.72000 1 630.0 0.3 0.1 0.4 0.1 0.3 44.9 17.6 23.7 2.5 11.32007 1 413.2 0.2 0.0 0.2 0.0 0.2 58.5 12.0 15.3 3.1 11.0
Romania - Roumanie 1990 5 711.0 0.4 1.3 1.6 0.1 0.3 18.5 51.1 27.8 0.3 2.3
1995 3 944.9 0.3 0.7 1.3 0.0 0.3 19.3 41.1 34.7 0.4 4.52000 1 618.3 0.0 0.2 0.8 0.0 0.2 6.4 32.1 51.3 0.5 9.62007 276.5 0.0 .. 0.1 .. 0.2 18.5 .. 37.1 .. 44.4
Slovakia - Slovaquie 2000 19.5 .. .. 0.0 .. .. .. .. 100.0 .. ..2007 330.4 0.0 0.0 0.2 .. 0.0 1.3 23.1 75.3 .. 0.3
Slovenia - Slovénie 1995 9.1 .. .. 0.0 .. 0.0 .. .. 90.2 .. 9.82000 0.8 .. .. 0.0 .. 0.0 .. .. 29.9 .. 70.12007 0.4 .. .. .. .. 0.0 .. .. .. .. 100.0
Spain - Espagne 1990 6 461.0 1.3 0.8 0.8 0.5 1.6 47.4 27.3 12.0 1.7 11.61995 1 817.2 0.3 0.0 0.3 0.3 1.0 41.9 5.7 15.3 6.0 31.12000 2 053.0 0.4 0.0 0.3 0.2 0.7 51.1 3.4 14.3 6.6 24.62007 2 689.2 0.3 0.0 0.2 0.3 1.6 40.5 1.6 8.1 12.4 37.4
Sweden - Suède 1990 1 995.0 0.1 0.1 0.9 0.3 0.9 14.6 13.7 46.8 3.6 21.31995 2 293.8 0.2 0.0 1.0 .. 1.0 28.6 2.7 44.6 .. 24.22000 1 846.0 0.1 0.0 1.0 .. 0.9 8.7 2.4 55.9 .. 33.02007 2 484.0 0.3 0.0 1.2 .. 0.4 39.4 1.9 48.0 .. 10.7
Switzerland - Suisse 1990 363.0 .. 0.1 0.0 .. 0.1 .. 83.7 9.4 .. 6.91995 654.5 .. 0.3 0.0 .. 0.1 .. 93.8 1.9 .. 4.32000 779.0 .. 0.3 0.0 .. 0.1 .. 91.7 3.6 .. 4.72007 809.9 0.0 0.1 0.1 0.2 0.0 3.5 55.7 11.1 29.1 0.6
United Kingdom - Royaume-Uni 1990 10 252.0 2.0 1.0 0.7 5.9 2.7 46.1 21.8 6.9 12.8 12.41995 8 436.8 1.7 0.2 0.5 3.4 2.8 54.1 6.3 6.1 14.9 18.72000 11 913.1 2.0 0.5 0.6 3.2 3.3 46.9 11.8 5.5 16.3 19.62007 28 714.7 2.9 1.5 2.4 5.4 4.5 38.6 19.0 8.4 24.2 9.8
Developed economies: Oceania - 1990 4 006.0 0.5 0.9 0.3 0.6 0.9 30.7 48.4 7.0 3.1 10.8Économies développées : Océanie 1995 4 477.7 0.5 0.7 0.2 0.4 1.7 32.0 39.3 4.5 2.9 21.4
2000 3 018.8 0.2 0.5 0.1 0.1 1.5 17.6 44.0 2.3 1.6 34.52007 2 409.8 0.1 0.2 0.3 0.0 1.5 18.5 30.5 10.8 0.4 39.8
Australia - Australie 1990 3 707.0 0.5 0.8 0.2 0.5 0.8 29.8 51.1 5.3 3.0 10.81995 4 217.5 0.5 0.7 0.1 0.4 1.6 31.8 40.8 3.5 3.1 20.82000 2 686.2 0.1 0.5 0.1 0.1 1.2 15.2 48.9 2.2 1.8 32.02007 2 125.2 0.1 0.2 0.1 0.0 1.5 16.8 33.8 6.1 0.5 42.9
New Zealand - Nouvelle-Zélande 1990 299.0 0.1 0.0 0.1 0.1 0.1 42.1 14.0 27.8 4.7 11.41995 260.2 0.0 0.0 0.0 .. 0.1 36.2 14.3 19.7 .. 29.82000 332.7 0.0 0.0 0.0 .. 0.3 37.1 5.1 3.2 .. 54.62007 284.6 0.0 0.0 0.1 .. 0.1 31.3 6.0 46.0 .. 16.7
Unallocated, unspecified or othereconomies - Non précisé, non ventilé ou autres économies
2007 4 685.8 0.2 0.3 1.9 0.0 1.3 18.3 23.1 40.2 1.1 17.3
For sources and notes, see end of table. Pour les sources et les notes, se reporter à la fin du tableau.
Region,country or territory
Régionspays ou territoires
Year
Année
Total fleet (thousands
of DWT)(1)
Flotte totale (milliers de TPL)
(1)
As percentage of world total fleetEn pourcentage de la flotte mondiale
As percentage of the country or region total fleetEn pourcentage de la flotte totale du pays ou de la région
5.4 World merchant fleet by flag of registration and type of ship of countries and geographical regions
5.4 Flotte marchande mondiale par pavillons d'immatriculation et par types de naviresdes pays et des régions géographiques
292
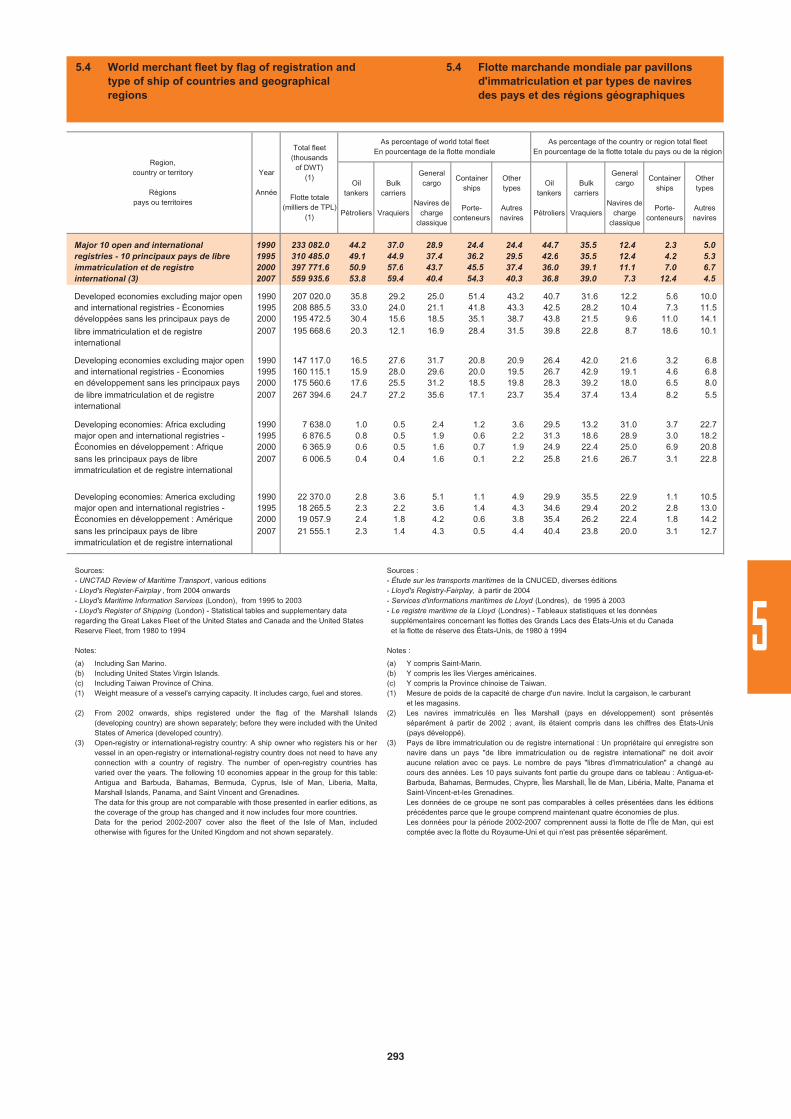
Oiltankers
Pétroliers
Bulkcarriers
Vraquiers
Generalcargo
Navires de charge
classique
Containerships
Porte-conteneurs
Othertypes
Autresnavires
Oiltankers
Pétroliers
Bulkcarriers
Vraquiers
Generalcargo
Navires de charge
classique
Containerships
Porte-conteneurs
Othertypes
Autresnavires
Major 10 open and international 1990 233 082.0 44.2 37.0 28.9 24.4 24.4 44.7 35.5 12.4 2.3 5.0registries - 10 principaux pays de libre 1995 310 485.0 49.1 44.9 37.4 36.2 29.5 42.6 35.5 12.4 4.2 5.3immatriculation et de registre 2000 397 771.6 50.9 57.6 43.7 45.5 37.4 36.0 39.1 11.1 7.0 6.7international (3) 2007 559 935.6 53.8 59.4 40.4 54.3 40.3 36.8 39.0 7.3 12.4 4.5
Developed economies excluding major open 1990 207 020.0 35.8 29.2 25.0 51.4 43.2 40.7 31.6 12.2 5.6 10.0and international registries - Économies 1995 208 885.5 33.0 24.0 21.1 41.8 43.3 42.5 28.2 10.4 7.3 11.5développées sans les principaux pays de 2000 195 472.5 30.4 15.6 18.5 35.1 38.7 43.8 21.5 9.6 11.0 14.1
libre immatriculation et de registreinternational
2007 195 668.6 20.3 12.1 16.9 28.4 31.5 39.8 22.8 8.7 18.6 10.1
Developing economies excluding major open 1990 147 117.0 16.5 27.6 31.7 20.8 20.9 26.4 42.0 21.6 3.2 6.8and international registries - Économies 1995 160 115.1 15.9 28.0 29.6 20.0 19.5 26.7 42.9 19.1 4.6 6.8en développement sans les principaux pays 2000 175 560.6 17.6 25.5 31.2 18.5 19.8 28.3 39.2 18.0 6.5 8.0de libre immatriculation et de registreinternational
2007 267 394.6 24.7 27.2 35.6 17.1 23.7 35.4 37.4 13.4 8.2 5.5
Developing economies: Africa excluding 1990 7 638.0 1.0 0.5 2.4 1.2 3.6 29.5 13.2 31.0 3.7 22.7major open and international registries - 1995 6 876.5 0.8 0.5 1.9 0.6 2.2 31.3 18.6 28.9 3.0 18.2Économies en développement : Afrique 2000 6 365.9 0.6 0.5 1.6 0.7 1.9 24.9 22.4 25.0 6.9 20.8sans les principaux pays de libreimmatriculation et de registre international
2007 6 006.5 0.4 0.4 1.6 0.1 2.2 25.8 21.6 26.7 3.1 22.8
Developing economies: America excluding 1990 22 370.0 2.8 3.6 5.1 1.1 4.9 29.9 35.5 22.9 1.1 10.5major open and international registries - 1995 18 265.5 2.3 2.2 3.6 1.4 4.3 34.6 29.4 20.2 2.8 13.0Économies en développement : Amérique 2000 19 057.9 2.4 1.8 4.2 0.6 3.8 35.4 26.2 22.4 1.8 14.2sans les principaux pays de libreimmatriculation et de registre international
2007 21 555.1 2.3 1.4 4.3 0.5 4.4 40.4 23.8 20.0 3.1 12.7
Region,country or territory
Régionspays ou territoires
Year
Année
Total fleet (thousands
of DWT)(1)
Flotte totale (milliers de TPL)
(1)
As percentage of world total fleetEn pourcentage de la flotte mondiale
As percentage of the country or region total fleetEn pourcentage de la flotte totale du pays ou de la région
5.4 World merchant fleet by flag of registration and type of ship of countries and geographical regions
5.4 Flotte marchande mondiale par pavillons d'immatriculation et par types de naviresdes pays et des régions géographiques
Sources:- UNCTAD Review of Maritime Transport , various editions- Lloyd's Register-Fairplay , from 2004 onwards- Lloyd's Maritime Information Services (London), from 1995 to 2003- Lloyd's Register of Shipping (London) - Statistical tables and supplementary data regarding the Great Lakes Fleet of the United States and Canada and the United States Reserve Fleet, from 1980 to 1994
Notes:
Sources : - Étude sur les transports maritimes de la CNUCED, diverses éditions - Lloyd's Registry-Fairplay, à partir de 2004- Services d'informations maritimes de Lloyd (Londres), de 1995 à 2003- Le registre maritime de la Lloyd (Londres) - Tableaux statistiques et les données supplémentaires concernant les flottes des Grands Lacs des États-Unis et du Canada et la flotte de réserve des États-Unis, de 1980 à 1994
Notes :
(a)(b)(c)(1)
(2)
(3)
Including San Marino.Including United States Virgin Islands.Including Taiwan Province of China.Weight measure of a vessel's carrying capacity. It includes cargo, fuel and stores.
From 2002 onwards, ships registered under the flag of the Marshall Islands(developing country) are shown separately; before they were included with the UnitedStates of America (developed country).Open-registry or international-registry country: A ship owner who registers his or hervessel in an open-registry or international-registry country does not need to have anyconnection with a country of registry. The number of open-registry countries hasvaried over the years. The following 10 economies appear in the group for this table:Antigua and Barbuda, Bahamas, Bermuda, Cyprus, Isle of Man, Liberia, Malta,Marshall Islands, Panama, and Saint Vincent and Grenadines.The data for this group are not comparable with those presented in earlier editions, asthe coverage of the group has changed and it now includes four more countries.Data for the period 2002-2007 cover also the fleet of the Isle of Man, includedotherwise with figures for the United Kingdom and not shown separately.
(a)(b)(c)(1)
(2)
(3)
Y compris Saint-Marin.Y compris les îles Vierges américaines.Y compris la Province chinoise de Taiwan.Mesure de poids de la capacité de charge d'un navire. Inclut la cargaison, le carburant et les magasins.Les navires immatriculés en Îles Marshall (pays en développement) sont présentésséparément à partir de 2002 ; avant, ils étaient compris dans les chiffres des États-Unis(pays développé).Pays de libre immatriculation ou de registre international : Un propriétaire qui enregistre sonnavire dans un pays "de libre immatriculation ou de registre international" ne doit avoiraucune relation avec ce pays. Le nombre de pays "libres d'immatriculation" a changé aucours des années. Les 10 pays suivants font partie du groupe dans ce tableau : Antigua-et-Barbuda, Bahamas, Bermudes, Chypre, Îles Marshall, Île de Man, Libéria, Malte, Panama etSaint-Vincent-et-les Grenadines. Les données de ce groupe ne sont pas comparables à celles présentées dans les éditionsprécédentes parce que le groupe comprend maintenant quatre économies de plus.Les données pour la période 2002-2007 comprennent aussi la flotte de l'Île de Man, qui estcomptée avec la flotte du Royaume-Uni et qui n'est pas présentée séparément.
293
5

PRODUITS DE BASE
COMMODITIES
1
2
3
4
5
6
7
8
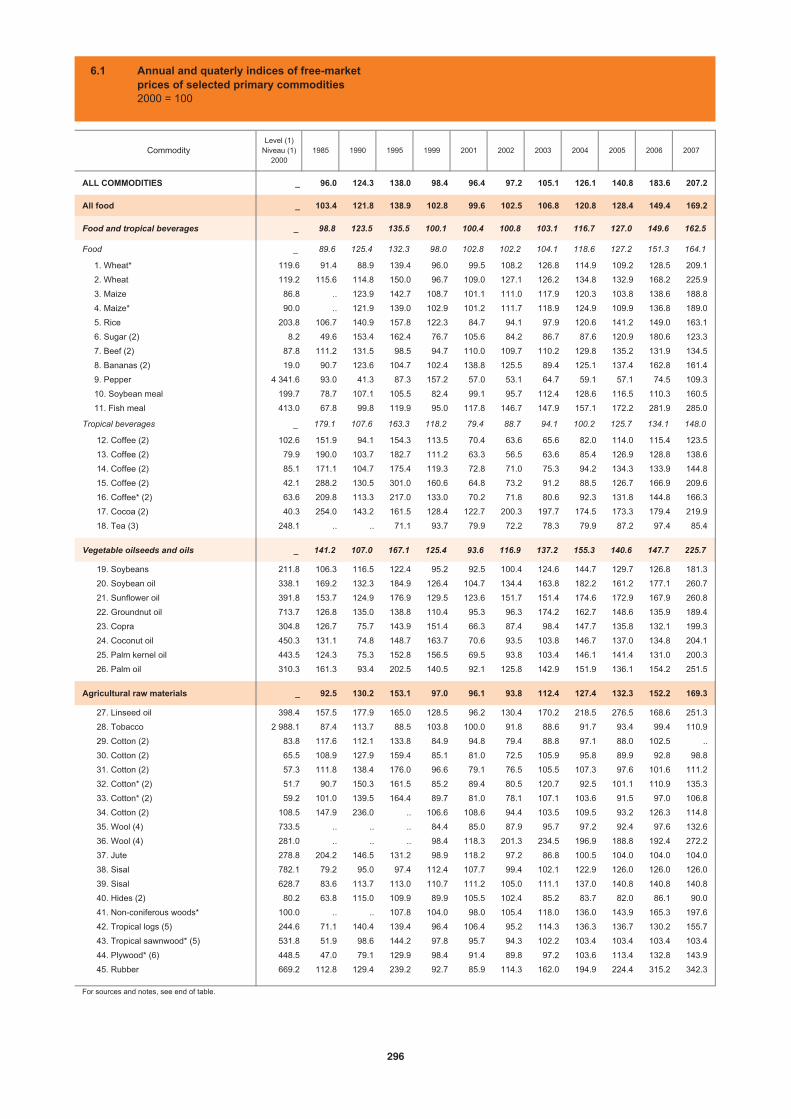
ALL COMMODITIES _ 96.0 124.3 138.0 98.4 96.4 97.2 105.1 126.1 140.8 183.6 207.2
All food _ 103.4 121.8 138.9 102.8 99.6 102.5 106.8 120.8 128.4 149.4 169.2
Food and tropical beverages _ 98.8 123.5 135.5 100.1 100.4 100.8 103.1 116.7 127.0 149.6 162.5
Food _ 89.6 125.4 132.3 98.0 102.8 102.2 104.1 118.6 127.2 151.3 164.1
1. Wheat* 119.6 91.4 88.9 139.4 96.0 99.5 108.2 126.8 114.9 109.2 128.5 209.1
2. Wheat 119.2 115.6 114.8 150.0 96.7 109.0 127.1 126.2 134.8 132.9 168.2 225.9
3. Maize 86.8 .. 123.9 142.7 108.7 101.1 111.0 117.9 120.3 103.8 138.6 188.8
4. Maize* 90.0 .. 121.9 139.0 102.9 101.2 111.7 118.9 124.9 109.9 136.8 189.0
5. Rice 203.8 106.7 140.9 157.8 122.3 84.7 94.1 97.9 120.6 141.2 149.0 163.1
6. Sugar (2) 8.2 49.6 153.4 162.4 76.7 105.6 84.2 86.7 87.6 120.9 180.6 123.3
7. Beef (2) 87.8 111.2 131.5 98.5 94.7 110.0 109.7 110.2 129.8 135.2 131.9 134.5
8. Bananas (2) 19.0 90.7 123.6 104.7 102.4 138.8 125.5 89.4 125.1 137.4 162.8 161.4
9. Pepper 4 341.6 93.0 41.3 87.3 157.2 57.0 53.1 64.7 59.1 57.1 74.5 109.3
10. Soybean meal 199.7 78.7 107.1 105.5 82.4 99.1 95.7 112.4 128.6 116.5 110.3 160.5
11. Fish meal 413.0 67.8 99.8 119.9 95.0 117.8 146.7 147.9 157.1 172.2 281.9 285.0
Tropical beverages _ 179.1 107.6 163.3 118.2 79.4 88.7 94.1 100.2 125.7 134.1 148.0
12. Coffee (2) 102.6 151.9 94.1 154.3 113.5 70.4 63.6 65.6 82.0 114.0 115.4 123.5
13. Coffee (2) 79.9 190.0 103.7 182.7 111.2 63.3 56.5 63.6 85.4 126.9 128.8 138.6
14. Coffee (2) 85.1 171.1 104.7 175.4 119.3 72.8 71.0 75.3 94.2 134.3 133.9 144.8
15. Coffee (2) 42.1 288.2 130.5 301.0 160.6 64.8 73.2 91.2 88.5 126.7 166.9 209.6
16. Coffee* (2) 63.6 209.8 113.3 217.0 133.0 70.2 71.8 80.6 92.3 131.8 144.8 166.3
17. Cocoa (2) 40.3 254.0 143.2 161.5 128.4 122.7 200.3 197.7 174.5 173.3 179.4 219.9
18. Tea (3) 248.1 .. .. 71.1 93.7 79.9 72.2 78.3 79.9 87.2 97.4 85.4
Vegetable oilseeds and oils _ 141.2 107.0 167.1 125.4 93.6 116.9 137.2 155.3 140.6 147.7 225.7
19. Soybeans 211.8 106.3 116.5 122.4 95.2 92.5 100.4 124.6 144.7 129.7 126.8 181.3
20. Soybean oil 338.1 169.2 132.3 184.9 126.4 104.7 134.4 163.8 182.2 161.2 177.1 260.7
21. Sunflower oil 391.8 153.7 124.9 176.9 129.5 123.6 151.7 151.4 174.6 172.9 167.9 260.8
22. Groundnut oil 713.7 126.8 135.0 138.8 110.4 95.3 96.3 174.2 162.7 148.6 135.9 189.4
23. Copra 304.8 126.7 75.7 143.9 151.4 66.3 87.4 98.4 147.7 135.8 132.1 199.3
24. Coconut oil 450.3 131.1 74.8 148.7 163.7 70.6 93.5 103.8 146.7 137.0 134.8 204.1
25. Palm kernel oil 443.5 124.3 75.3 152.8 156.5 69.5 93.8 103.4 146.1 141.4 131.0 200.3
26. Palm oil 310.3 161.3 93.4 202.5 140.5 92.1 125.8 142.9 151.9 136.1 154.2 251.5
Agricultural raw materials _ 92.5 130.2 153.1 97.0 96.1 93.8 112.4 127.4 132.3 152.2 169.3
27. Linseed oil 398.4 157.5 177.9 165.0 128.5 96.2 130.4 170.2 218.5 276.5 168.6 251.3
28. Tobacco 2 988.1 87.4 113.7 88.5 103.8 100.0 91.8 88.6 91.7 93.4 99.4 110.9
29. Cotton (2) 83.8 117.6 112.1 133.8 84.9 94.8 79.4 88.8 97.1 88.0 102.5 ..
30. Cotton (2) 65.5 108.9 127.9 159.4 85.1 81.0 72.5 105.9 95.8 89.9 92.8 98.8
31. Cotton (2) 57.3 111.8 138.4 176.0 96.6 79.1 76.5 105.5 107.3 97.6 101.6 111.2
32. Cotton* (2) 51.7 90.7 150.3 161.5 85.2 89.4 80.5 120.7 92.5 101.1 110.9 135.3
33. Cotton* (2) 59.2 101.0 139.5 164.4 89.7 81.0 78.1 107.1 103.6 91.5 97.0 106.8
34. Cotton (2) 108.5 147.9 236.0 .. 106.6 108.6 94.4 103.5 109.5 93.2 126.3 114.8
35. Wool (4) 733.5 .. .. .. 84.4 85.0 87.9 95.7 97.2 92.4 97.6 132.6
36. Wool (4) 281.0 .. .. .. 98.4 118.3 201.3 234.5 196.9 188.8 192.4 272.2
37. Jute 278.8 204.2 146.5 131.2 98.9 118.2 97.2 86.8 100.5 104.0 104.0 104.0
38. Sisal 782.1 79.2 95.0 97.4 112.4 107.7 99.4 102.1 122.9 126.0 126.0 126.0
39. Sisal 628.7 83.6 113.7 113.0 110.7 111.2 105.0 111.1 137.0 140.8 140.8 140.8
40. Hides (2) 80.2 63.8 115.0 109.9 89.9 105.5 102.4 85.2 83.7 82.0 86.1 90.0
41. Non-coniferous woods* 100.0 .. .. 107.8 104.0 98.0 105.4 118.0 136.0 143.9 165.3 197.6
42. Tropical logs (5) 244.6 71.1 140.4 139.4 96.4 106.4 95.2 114.3 136.3 136.7 130.2 155.7
43. Tropical sawnwood* (5) 531.8 51.9 98.6 144.2 97.8 95.7 94.3 102.2 103.4 103.4 103.4 103.4
44. Plywood* (6) 448.5 47.0 79.1 129.9 98.4 91.4 89.8 97.2 103.6 113.4 132.8 143.9
45. Rubber 669.2 112.8 129.4 239.2 92.7 85.9 114.3 162.0 194.9 224.4 315.2 342.3
For sources and notes, see end of table.
Commodity 2004 2006 200720051999 2001 2002 2003Level (1)
Niveau (1)2000
1985 1990 1995
6.1 Annual and quaterly indices of free-market prices of selected primary commodities2000 = 100
296
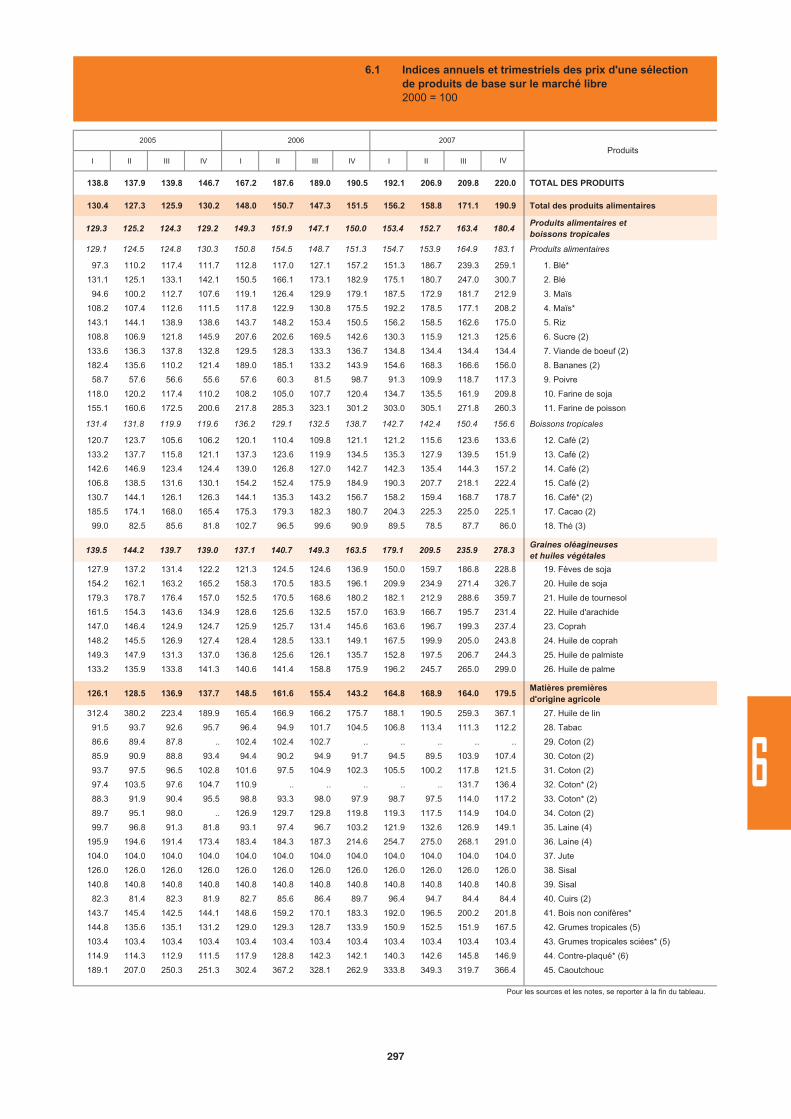
I II III IV I II III IV I II III
138.8 137.9 139.8 146.7 167.2 187.6 189.0 190.5 192.1 206.9 209.8 220.0 TOTAL DES PRODUITS
130.4 127.3 125.9 130.2 148.0 150.7 147.3 151.5 156.2 158.8 171.1 190.9 Total des produits alimentaires
129.3 125.2 124.3 129.2 149.3 151.9 147.1 150.0 153.4 152.7 163.4 180.4Produits alimentaires et boissons tropicales
129.1 124.5 124.8 130.3 150.8 154.5 148.7 151.3 154.7 153.9 164.9 183.1 Produits alimentaires
97.3 110.2 117.4 111.7 112.8 117.0 127.1 157.2 151.3 186.7 239.3 259.1 1. Blé*
131.1 125.1 133.1 142.1 150.5 166.1 173.1 182.9 175.1 180.7 247.0 300.7 2. Blé
94.6 100.2 112.7 107.6 119.1 126.4 129.9 179.1 187.5 172.9 181.7 212.9 3. Maïs
108.2 107.4 112.6 111.5 117.8 122.9 130.8 175.5 192.2 178.5 177.1 208.2 4. Maïs*
143.1 144.1 138.9 138.6 143.7 148.2 153.4 150.5 156.2 158.5 162.6 175.0 5. Riz
108.8 106.9 121.8 145.9 207.6 202.6 169.5 142.6 130.3 115.9 121.3 125.6 6. Sucre (2)
133.6 136.3 137.8 132.8 129.5 128.3 133.3 136.7 134.8 134.4 134.4 134.4 7. Viande de boeuf (2)
182.4 135.6 110.2 121.4 189.0 185.1 133.2 143.9 154.6 168.3 166.6 156.0 8. Bananes (2)
58.7 57.6 56.6 55.6 57.6 60.3 81.5 98.7 91.3 109.9 118.7 117.3 9. Poivre
118.0 120.2 117.4 110.2 108.2 105.0 107.7 120.4 134.7 135.5 161.9 209.8 10. Farine de soja
155.1 160.6 172.5 200.6 217.8 285.3 323.1 301.2 303.0 305.1 271.8 260.3 11. Farine de poisson
131.4 131.8 119.9 119.6 136.2 129.1 132.5 138.7 142.7 142.4 150.4 156.6 Boissons tropicales
120.7 123.7 105.6 106.2 120.1 110.4 109.8 121.1 121.2 115.6 123.6 133.6 12. Café (2)
133.2 137.7 115.8 121.1 137.3 123.6 119.9 134.5 135.3 127.9 139.5 151.9 13. Café (2)
142.6 146.9 123.4 124.4 139.0 126.8 127.0 142.7 142.3 135.4 144.3 157.2 14. Café (2)
106.8 138.5 131.6 130.1 154.2 152.4 175.9 184.9 190.3 207.7 218.1 222.4 15. Café (2)
130.7 144.1 126.1 126.3 144.1 135.3 143.2 156.7 158.2 159.4 168.7 178.7 16. Café* (2)
185.5 174.1 168.0 165.4 175.3 179.3 182.3 180.7 204.3 225.3 225.0 225.1 17. Cacao (2)
99.0 82.5 85.6 81.8 102.7 96.5 99.6 90.9 89.5 78.5 87.7 86.0 18. Thé (3)
139.5 144.2 139.7 139.0 137.1 140.7 149.3 163.5 179.1 209.5 235.9 278.3Graines oléagineuses et huiles végétales
127.9 137.2 131.4 122.2 121.3 124.5 124.6 136.9 150.0 159.7 186.8 228.8 19. Fèves de soja
154.2 162.1 163.2 165.2 158.3 170.5 183.5 196.1 209.9 234.9 271.4 326.7 20. Huile de soja
179.3 178.7 176.4 157.0 152.5 170.5 168.6 180.2 182.1 212.9 288.6 359.7 21. Huile de tournesol
161.5 154.3 143.6 134.9 128.6 125.6 132.5 157.0 163.9 166.7 195.7 231.4 22. Huile d'arachide
147.0 146.4 124.9 124.7 125.9 125.7 131.4 145.6 163.6 196.7 199.3 237.4 23. Coprah
148.2 145.5 126.9 127.4 128.4 128.5 133.1 149.1 167.5 199.9 205.0 243.8 24. Huile de coprah
149.3 147.9 131.3 137.0 136.8 125.6 126.1 135.7 152.8 197.5 206.7 244.3 25. Huile de palmiste
133.2 135.9 133.8 141.3 140.6 141.4 158.8 175.9 196.2 245.7 265.0 299.0 26. Huile de palme
126.1 128.5 136.9 137.7 148.5 161.6 155.4 143.2 164.8 168.9 164.0 179.5Matières premières d'origine agricole
312.4 380.2 223.4 189.9 165.4 166.9 166.2 175.7 188.1 190.5 259.3 367.1 27. Huile de lin
91.5 93.7 92.6 95.7 96.4 94.9 101.7 104.5 106.8 113.4 111.3 112.2 28. Tabac
86.6 89.4 87.8 .. 102.4 102.4 102.7 .. .. .. .. .. 29. Coton (2)
85.9 90.9 88.8 93.4 94.4 90.2 94.9 91.7 94.5 89.5 103.9 107.4 30. Coton (2)
93.7 97.5 96.5 102.8 101.6 97.5 104.9 102.3 105.5 100.2 117.8 121.5 31. Coton (2)
97.4 103.5 97.6 104.7 110.9 .. .. .. .. .. 131.7 136.4 32. Coton* (2)
88.3 91.9 90.4 95.5 98.8 93.3 98.0 97.9 98.7 97.5 114.0 117.2 33. Coton* (2)
89.7 95.1 98.0 .. 126.9 129.7 129.8 119.8 119.3 117.5 114.9 104.0 34. Coton (2)
99.7 96.8 91.3 81.8 93.1 97.4 96.7 103.2 121.9 132.6 126.9 149.1 35. Laine (4)
195.9 194.6 191.4 173.4 183.4 184.3 187.3 214.6 254.7 275.0 268.1 291.0 36. Laine (4)
104.0 104.0 104.0 104.0 104.0 104.0 104.0 104.0 104.0 104.0 104.0 104.0 37. Jute
126.0 126.0 126.0 126.0 126.0 126.0 126.0 126.0 126.0 126.0 126.0 126.0 38. Sisal
140.8 140.8 140.8 140.8 140.8 140.8 140.8 140.8 140.8 140.8 140.8 140.8 39. Sisal
82.3 81.4 82.3 81.9 82.7 85.6 86.4 89.7 96.4 94.7 84.4 84.4 40. Cuirs (2)
143.7 145.4 142.5 144.1 148.6 159.2 170.1 183.3 192.0 196.5 200.2 201.8 41. Bois non conifères*
144.8 135.6 135.1 131.2 129.0 129.3 128.7 133.9 150.9 152.5 151.9 167.5 42. Grumes tropicales (5)
103.4 103.4 103.4 103.4 103.4 103.4 103.4 103.4 103.4 103.4 103.4 103.4 43. Grumes tropicales sciées* (5)
114.9 114.3 112.9 111.5 117.9 128.8 142.3 142.1 140.3 142.6 145.8 146.9 44. Contre-plaqué* (6)
189.1 207.0 250.3 251.3 302.4 367.2 328.1 262.9 333.8 349.3 319.7 366.4 45. Caoutchouc
Pour les sources et les notes, se reporter à la fin du tableau.
IV
2005 2006 2007
Produits
6.1 Indices annuels et trimestriels des prix d'une sélection de produits de base sur le marché libre2000 = 100
297
6
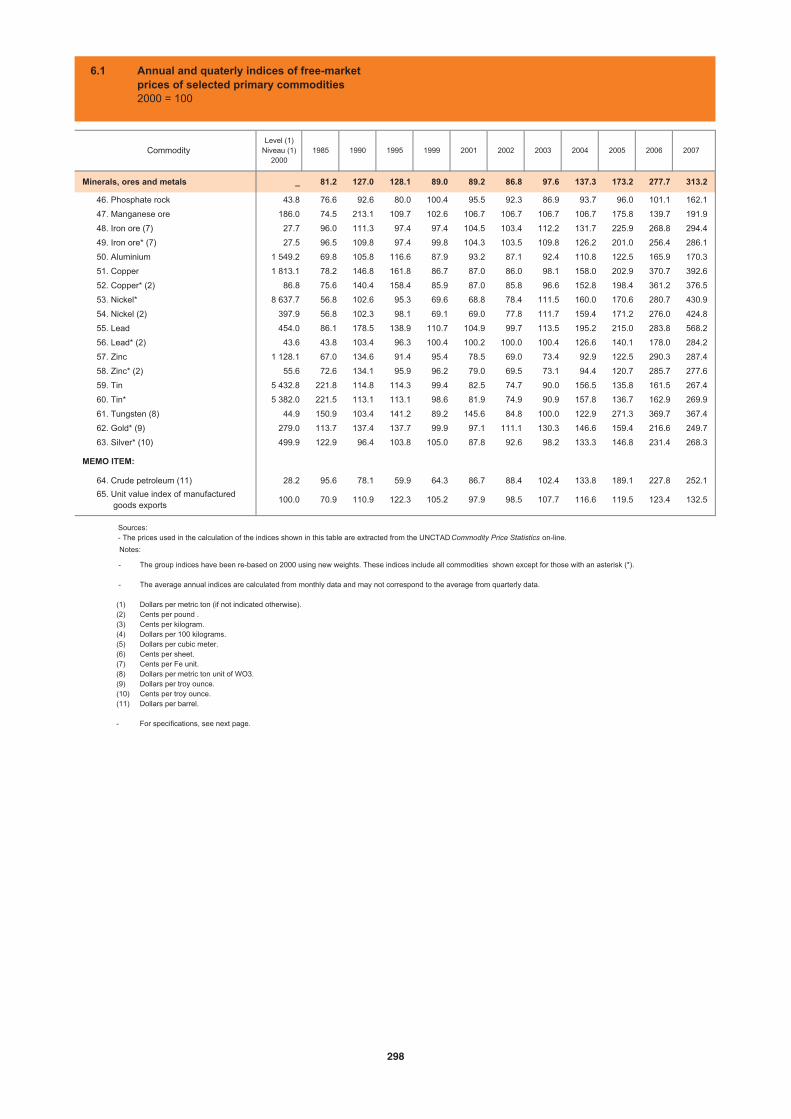
Minerals, ores and metals _ 81.2 127.0 128.1 89.0 89.2 86.8 97.6 137.3 173.2 277.7 313.2
46. Phosphate rock 43.8 76.6 92.6 80.0 100.4 95.5 92.3 86.9 93.7 96.0 101.1 162.1
47. Manganese ore 186.0 74.5 213.1 109.7 102.6 106.7 106.7 106.7 106.7 175.8 139.7 191.9
48. Iron ore (7) 27.7 96.0 111.3 97.4 97.4 104.5 103.4 112.2 131.7 225.9 268.8 294.4
49. Iron ore* (7) 27.5 96.5 109.8 97.4 99.8 104.3 103.5 109.8 126.2 201.0 256.4 286.1
50. Aluminium 1 549.2 69.8 105.8 116.6 87.9 93.2 87.1 92.4 110.8 122.5 165.9 170.3
51. Copper 1 813.1 78.2 146.8 161.8 86.7 87.0 86.0 98.1 158.0 202.9 370.7 392.6
52. Copper* (2) 86.8 75.6 140.4 158.4 85.9 87.0 85.8 96.6 152.8 198.4 361.2 376.5
53. Nickel* 8 637.7 56.8 102.6 95.3 69.6 68.8 78.4 111.5 160.0 170.6 280.7 430.9
54. Nickel (2) 397.9 56.8 102.3 98.1 69.1 69.0 77.8 111.7 159.4 171.2 276.0 424.8
55. Lead 454.0 86.1 178.5 138.9 110.7 104.9 99.7 113.5 195.2 215.0 283.8 568.2
56. Lead* (2) 43.6 43.8 103.4 96.3 100.4 100.2 100.0 100.4 126.6 140.1 178.0 284.2
57. Zinc 1 128.1 67.0 134.6 91.4 95.4 78.5 69.0 73.4 92.9 122.5 290.3 287.4
58. Zinc* (2) 55.6 72.6 134.1 95.9 96.2 79.0 69.5 73.1 94.4 120.7 285.7 277.6
59. Tin 5 432.8 221.8 114.8 114.3 99.4 82.5 74.7 90.0 156.5 135.8 161.5 267.4
60. Tin* 5 382.0 221.5 113.1 113.1 98.6 81.9 74.9 90.9 157.8 136.7 162.9 269.9
61. Tungsten (8) 44.9 150.9 103.4 141.2 89.2 145.6 84.8 100.0 122.9 271.3 369.7 367.4
62. Gold* (9) 279.0 113.7 137.4 137.7 99.9 97.1 111.1 130.3 146.6 159.4 216.6 249.7
63. Silver* (10) 499.9 122.9 96.4 103.8 105.0 87.8 92.6 98.2 133.3 146.8 231.4 268.3
MEMO ITEM:
64. Crude petroleum (11) 28.2 95.6 78.1 59.9 64.3 86.7 88.4 102.4 133.8 189.1 227.8 252.1
65. Unit value index of manufactured goods exports
100.0 70.9 110.9 122.3 105.2 97.9 98.5 107.7 116.6 119.5 123.4 132.5
CommodityLevel (1)
Niveau (1)2000
1985 1990 1995 1999 2001 2002 2003 2004 2005 2006 2007
6.1 Annual and quaterly indices of free-market prices of selected primary commodities2000 = 100
-
-
(1)(2)(3)(4)(5)(6)(7)(8)(9)(10)(11)
-
The group indices have been re-based on 2000 using new weights. These indices include all commodities shown except for those with an asterisk (*).
The average annual indices are calculated from monthly data and may not correspond to the average from quarterly data.
Dollars per metric ton (if not indicated otherwise).Cents per pound .Cents per kilogram.Dollars per 100 kilograms. Dollars per cubic meter. Cents per sheet. Cents per Fe unit. Dollars per metric ton unit of WO3. Dollars per troy ounce. Cents per troy ounce.Dollars per barrel.
For specifications, see next page.
Notes:
Sources:- The prices used in the calculation of the indices shown in this table are extracted from the UNCTAD Commodity Price Statistics on-line.
298
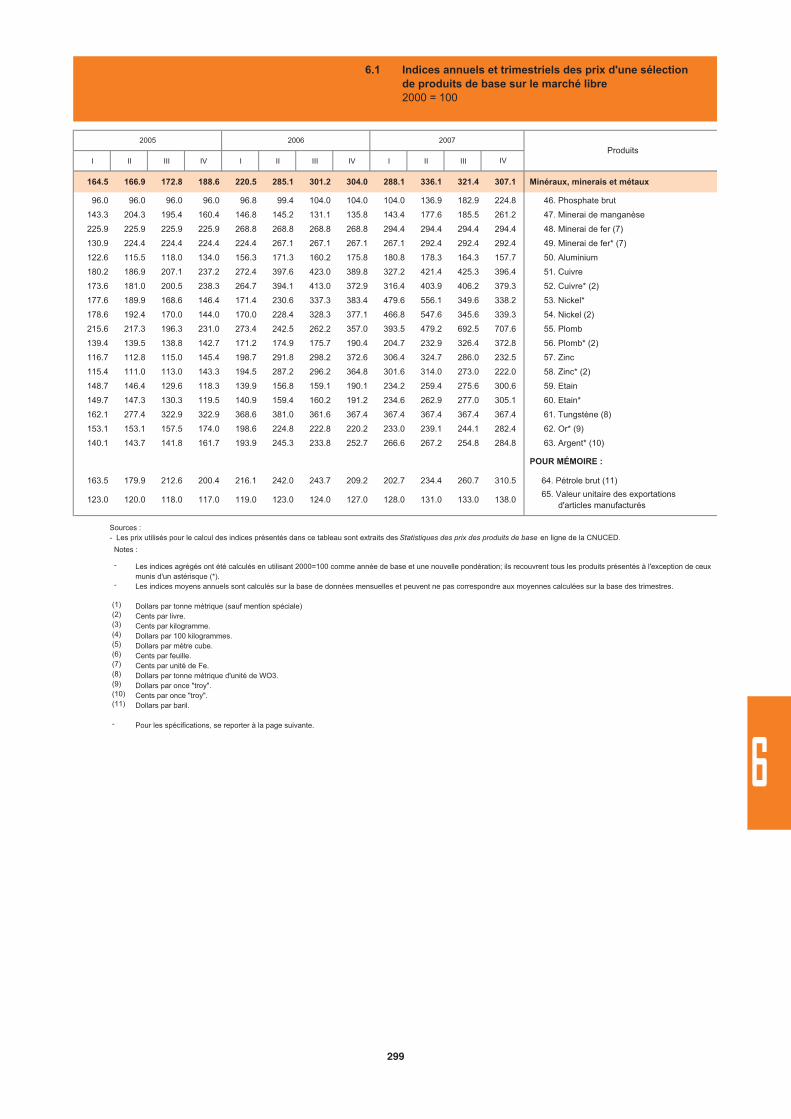
I II III IV I II III IV I II III
164.5 166.9 172.8 188.6 220.5 285.1 301.2 304.0 288.1 336.1 321.4 307.1 Minéraux, minerais et métaux
96.0 96.0 96.0 96.0 96.8 99.4 104.0 104.0 104.0 136.9 182.9 224.8 46. Phosphate brut
143.3 204.3 195.4 160.4 146.8 145.2 131.1 135.8 143.4 177.6 185.5 261.2 47. Minerai de manganèse
225.9 225.9 225.9 225.9 268.8 268.8 268.8 268.8 294.4 294.4 294.4 294.4 48. Minerai de fer (7)
130.9 224.4 224.4 224.4 224.4 267.1 267.1 267.1 267.1 292.4 292.4 292.4 49. Minerai de fer* (7)
122.6 115.5 118.0 134.0 156.3 171.3 160.2 175.8 180.8 178.3 164.3 157.7 50. Aluminium
180.2 186.9 207.1 237.2 272.4 397.6 423.0 389.8 327.2 421.4 425.3 396.4 51. Cuivre
173.6 181.0 200.5 238.3 264.7 394.1 413.0 372.9 316.4 403.9 406.2 379.3 52. Cuivre* (2)
177.6 189.9 168.6 146.4 171.4 230.6 337.3 383.4 479.6 556.1 349.6 338.2 53. Nickel*
178.6 192.4 170.0 144.0 170.0 228.4 328.3 377.1 466.8 547.6 345.6 339.3 54. Nickel (2)
215.6 217.3 196.3 231.0 273.4 242.5 262.2 357.0 393.5 479.2 692.5 707.6 55. Plomb
139.4 139.5 138.8 142.7 171.2 174.9 175.7 190.4 204.7 232.9 326.4 372.8 56. Plomb* (2)
116.7 112.8 115.0 145.4 198.7 291.8 298.2 372.6 306.4 324.7 286.0 232.5 57. Zinc
115.4 111.0 113.0 143.3 194.5 287.2 296.2 364.8 301.6 314.0 273.0 222.0 58. Zinc* (2)
148.7 146.4 129.6 118.3 139.9 156.8 159.1 190.1 234.2 259.4 275.6 300.6 59. Etain
149.7 147.3 130.3 119.5 140.9 159.4 160.2 191.2 234.6 262.9 277.0 305.1 60. Etain*
162.1 277.4 322.9 322.9 368.6 381.0 361.6 367.4 367.4 367.4 367.4 367.4 61. Tungstène (8)
153.1 153.1 157.5 174.0 198.6 224.8 222.8 220.2 233.0 239.1 244.1 282.4 62. Or* (9)
140.1 143.7 141.8 161.7 193.9 245.3 233.8 252.7 266.6 267.2 254.8 284.8 63. Argent* (10)
POUR MÉMOIRE :
163.5 179.9 212.6 200.4 216.1 242.0 243.7 209.2 202.7 234.4 260.7 310.5 64. Pétrole brut (11)
123.0 120.0 118.0 117.0 119.0 123.0 124.0 127.0 128.0 131.0 133.0 138.0 65. Valeur unitaire des exportations d'articles manufacturés
ProduitsIV
2005 2006 2007
6.1 Indices annuels et trimestriels des prix d'une sélection de produits de base sur le marché libre2000 = 100
-
-
(1)(2)(3)(4)(5)(6)(7)(8)(9)(10)(11)
-
Les indices agrégés ont été calculés en utilisant 2000=100 comme année de base et une nouvelle pondération; ils recouvrent tous les produits présentés à l'exception de ceux munis d'un astérisque (*).Les indices moyens annuels sont calculés sur la base de données mensuelles et peuvent ne pas correspondre aux moyennes calculées sur la base des trimestres.
Dollars par tonne métrique (sauf mention spéciale)Cents par livre.Cents par kilogramme.Dollars par 100 kilogrammes.Dollars par mètre cube.Cents par feuille.Cents par unité de Fe.Dollars par tonne métrique d'unité de WO3.Dollars par once "troy".Cents par once "troy".Dollars par baril.
Pour les spécifications, se reporter à la page suivante.
Notes :
Sources : - Les prix utilisés pour le calcul des indices présentés dans ce tableau sont extraits des Statistiques des prix des produits de base en ligne de la CNUCED.
299
6
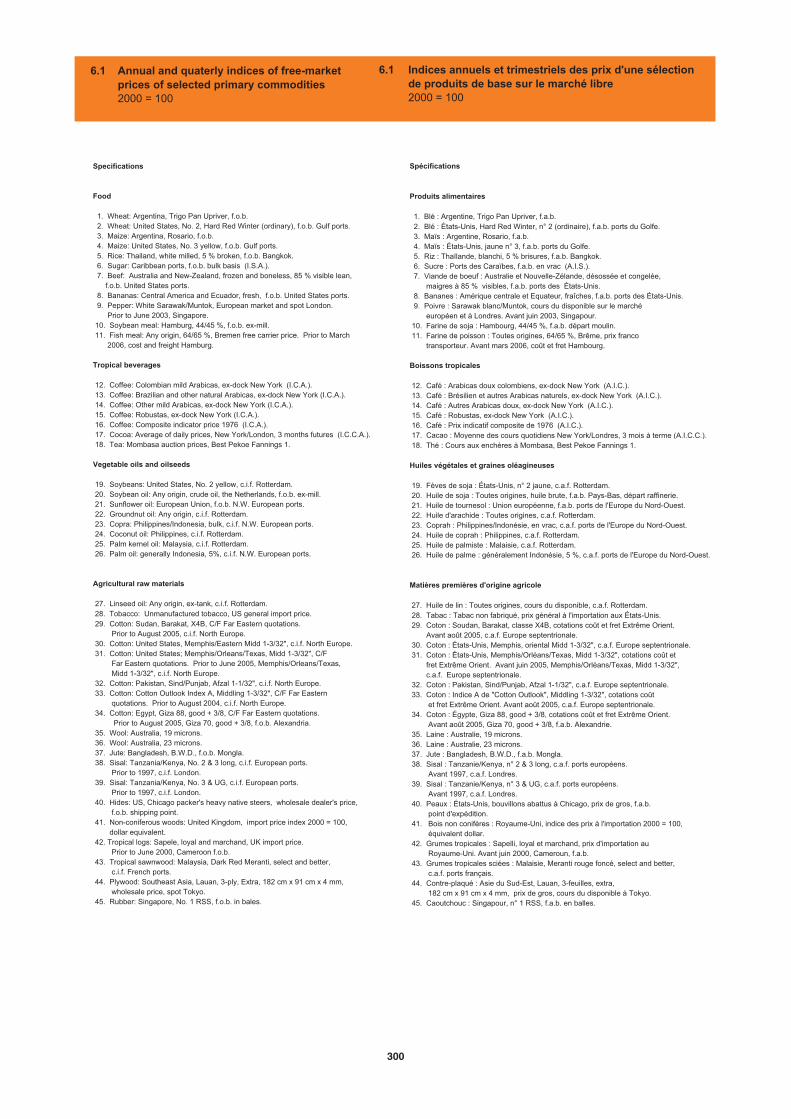
6.1 Annual and quaterly indices of free-marketprices of selected primary commodities2000 = 100
6.1 Indices annuels et trimestriels des prix d'une sélection de produits de base sur le marché libre2000 = 100
Specifications
Food
1. Wheat: Argentina, Trigo Pan Upriver, f.o.b. 2. Wheat: United States, No. 2, Hard Red Winter (ordinary), f.o.b. Gulf ports. 3. Maize: Argentina, Rosario, f.o.b. 4. Maize: United States, No. 3 yellow, f.o.b. Gulf ports. 5. Rice: Thailand, white milled, 5 % broken, f.o.b. Bangkok. 6. Sugar: Caribbean ports, f.o.b. bulk basis (I.S.A.). 7. Beef: Australia and New-Zealand, frozen and boneless, 85 % visible lean, f.o.b. United States ports. 8. Bananas: Central America and Ecuador, fresh, f.o.b. United States ports. 9. Pepper: White Sarawak/Muntok, European market and spot London. Prior to June 2003, Singapore. 10. Soybean meal: Hamburg, 44/45 %, f.o.b. ex-mill. 11. Fish meal: Any origin, 64/65 %, Bremen free carrier price. Prior to March 2006, cost and freight Hamburg.
Tropical beverages
12. Coffee: Colombian mild Arabicas, ex-dock New York (I.C.A.). 13. Coffee: Brazilian and other natural Arabicas, ex-dock New York (I.C.A.). 14. Coffee: Other mild Arabicas, ex-dock New York (I.C.A.). 15. Coffee: Robustas, ex-dock New York (I.C.A.). 16. Coffee: Composite indicator price 1976 (I.C.A.). 17. Cocoa: Average of daily prices, New York/London, 3 months futures (I.C.C.A.). 18. Tea: Mombasa auction prices, Best Pekoe Fannings 1.
Vegetable oils and oilseeds
19. Soybeans: United States, No. 2 yellow, c.i.f. Rotterdam. 20. Soybean oil: Any origin, crude oil, the Netherlands, f.o.b. ex-mill. 21. Sunflower oil: European Union, f.o.b. N.W. European ports. 22. Groundnut oil: Any origin, c.i.f. Rotterdam. 23. Copra: Philippines/Indonesia, bulk, c.i.f. N.W. European ports. 24. Coconut oil: Philippines, c.i.f. Rotterdam. 25. Palm kernel oil: Malaysia, c.i.f. Rotterdam. 26. Palm oil: generally Indonesia, 5%, c.i.f. N.W. European ports.
Agricultural raw materials
27. Linseed oil: Any origin, ex-tank, c.i.f. Rotterdam. 28. Tobacco: Unmanufactured tobacco, US general import price. 29. Cotton: Sudan, Barakat, X4B, C/F Far Eastern quotations. Prior to August 2005, c.i.f. North Europe. 30. Cotton: United States, Memphis/Eastern Midd 1-3/32", c.i.f. North Europe. 31. Cotton: United States; Memphis/Orleans/Texas, Midd 1-3/32", C/F Far Eastern quotations. Prior to June 2005, Memphis/Orleans/Texas, Midd 1-3/32", c.i.f. North Europe. 32. Cotton: Pakistan, Sind/Punjab, Afzal 1-1/32", c.i.f. North Europe. 33. Cotton: Cotton Outlook Index A, Middling 1-3/32", C/F Far Eastern quotations. Prior to August 2004, c.i.f. North Europe. 34. Cotton: Egypt, Giza 88, good + 3/8, C/F Far Eastern quotations. Prior to August 2005, Giza 70, good + 3/8, f.o.b. Alexandria. 35. Wool: Australia, 19 microns. 36. Wool: Australia, 23 microns. 37. Jute: Bangladesh, B.W.D., f.o.b. Mongla. 38. Sisal: Tanzania/Kenya, No. 2 & 3 long, c.i.f. European ports. Prior to 1997, c.i.f. London. 39. Sisal: Tanzania/Kenya, No. 3 & UG, c.i.f. European ports. Prior to 1997, c.i.f. London. 40. Hides: US, Chicago packer's heavy native steers, wholesale dealer's price, f.o.b. shipping point. 41. Non-coniferous woods: United Kingdom, import price index 2000 = 100, dollar equivalent. 42. Tropical logs: Sapele, loyal and marchand, UK import price. Prior to June 2000, Cameroon f.o.b. 43. Tropical sawnwood: Malaysia, Dark Red Meranti, select and better, c.i.f. French ports. 44. Plywood: Southeast Asia, Lauan, 3-ply, Extra, 182 cm x 91 cm x 4 mm, wholesale price, spot Tokyo. 45. Rubber: Singapore, No. 1 RSS, f.o.b. in bales.
Spécifications
Produits alimentaires
1. Blé : Argentine, Trigo Pan Upriver, f.a.b. 2. Blé : États-Unis, Hard Red Winter, n° 2 (ordinaire), f.a.b. ports du Golfe. 3. Maïs : Argentine, Rosario, f.a.b. 4. Maïs : États-Unis, jaune n° 3, f.a.b. ports du Golfe. 5. Riz : Thaïlande, blanchi, 5 % brisures, f.a.b. Bangkok. 6. Sucre : Ports des Caraïbes, f.a.b. en vrac (A.I.S.). 7. Viande de boeuf : Australie et Nouvelle-Zélande, désossée et congelée, maigres à 85 % visibles, f.a.b. ports des États-Unis. 8. Bananes : Amérique centrale et Equateur, fraîches, f.a.b. ports des États-Unis. 9. Poivre : Sarawak blanc/Muntok, cours du disponible sur le marché européen et à Londres. Avant juin 2003, Singapour. 10. Farine de soja : Hambourg, 44/45 %, f.a.b. départ moulin. 11. Farine de poisson : Toutes origines, 64/65 %, Brême, prix franco transporteur. Avant mars 2006, coût et fret Hambourg.
Boissons tropicales
12. Café : Arabicas doux colombiens, ex-dock New York (A.I.C.). 13. Café : Brésilien et autres Arabicas naturels, ex-dock New York (A.I.C.). 14. Café : Autres Arabicas doux, ex-dock New York (A.I.C.). 15. Café : Robustas, ex-dock New York (A.I.C.). 16. Café : Prix indicatif composite de 1976 (A.I.C.).17. Cacao : Moyenne des cours quotidiens New York/Londres, 3 mois à terme (A.I.C.C.).
18. Thé : Cours aux enchères à Mombasa, Best Pekoe Fannings 1.
Huiles végétales et graines oléagineuses
19. Fèves de soja : États-Unis, n° 2 jaune, c.a.f. Rotterdam. 20. Huile de soja : Toutes origines, huile brute, f.a.b. Pays-Bas, départ raffinerie. 21. Huile de tournesol : Union européenne, f.a.b. ports de l'Europe du Nord-Ouest. 22. Huile d'arachide : Toutes origines, c.a.f. Rotterdam. 23. Coprah : Philippines/Indonésie, en vrac, c.a.f. ports de l'Europe du Nord-Ouest. 24. Huile de coprah : Philippines, c.a.f. Rotterdam. 25. Huile de palmiste : Malaisie, c.a.f. Rotterdam. 26. Huile de palme : généralement Indonésie, 5 %, c.a.f. ports de l'Europe du Nord-Ouest.
Matières premières d'origine agricole
27. Huile de lin : Toutes origines, cours du disponible, c.a.f. Rotterdam. 28. Tabac : Tabac non fabriqué, prix général à l'importation aux États-Unis. 29. Coton : Soudan, Barakat, classe X4B, cotations coût et fret Extrême Orient. Avant août 2005, c.a.f. Europe septentrionale. 30. Coton : États-Unis, Memphis, oriental Midd 1-3/32", c.a.f. Europe septentrionale. 31. Coton : États-Unis, Memphis/Orléans/Texas, Midd 1-3/32", cotations coût et fret Extrême Orient. Avant juin 2005, Memphis/Orléans/Texas, Midd 1-3/32", c.a.f. Europe septentrionale. 32. Coton : Pakistan, Sind/Punjab, Afzal 1-1/32", c.a.f. Europe septentrionale. 33. Coton : Indice A de "Cotton Outlook", Middling 1-3/32", cotations coût et fret Extrême Orient. Avant août 2005, c.a.f. Europe septentrionale. 34. Coton : Égypte, Giza 88, good + 3/8, cotations coût et fret Extrême Orient. Avant août 2005, Giza 70, good + 3/8, f.a.b. Alexandrie. 35. Laine : Australie, 19 microns. 36. Laine : Australie, 23 microns. 37. Jute : Bangladesh, B.W.D., f.a.b. Mongla. 38. Sisal : Tanzanie/Kenya, n° 2 & 3 long, c.a.f. ports européens. Avant 1997, c.a.f. Londres. 39. Sisal : Tanzanie/Kenya, n° 3 & UG, c.a.f. ports européens. Avant 1997, c.a.f. Londres. 40. Peaux : États-Unis, bouvillons abattus à Chicago, prix de gros, f.a.b. point d'expédition. 41. Bois non conifères : Royaume-Uni, indice des prix à l'importation 2000 = 100, équivalent dollar. 42. Grumes tropicales : Sapelli, loyal et marchand, prix d'importation au Royaume-Uni. Avant juin 2000, Cameroun, f.a.b. 43. Grumes tropicales sciées : Malaisie, Meranti rouge foncé, select and better, c.a.f. ports français. 44. Contre-plaqué : Asie du Sud-Est, Lauan, 3-feuilles, extra, 182 cm x 91 cm x 4 mm, prix de gros, cours du disponible à Tokyo. 45. Caoutchouc : Singapour, n° 1 RSS, f.a.b. en balles.
300
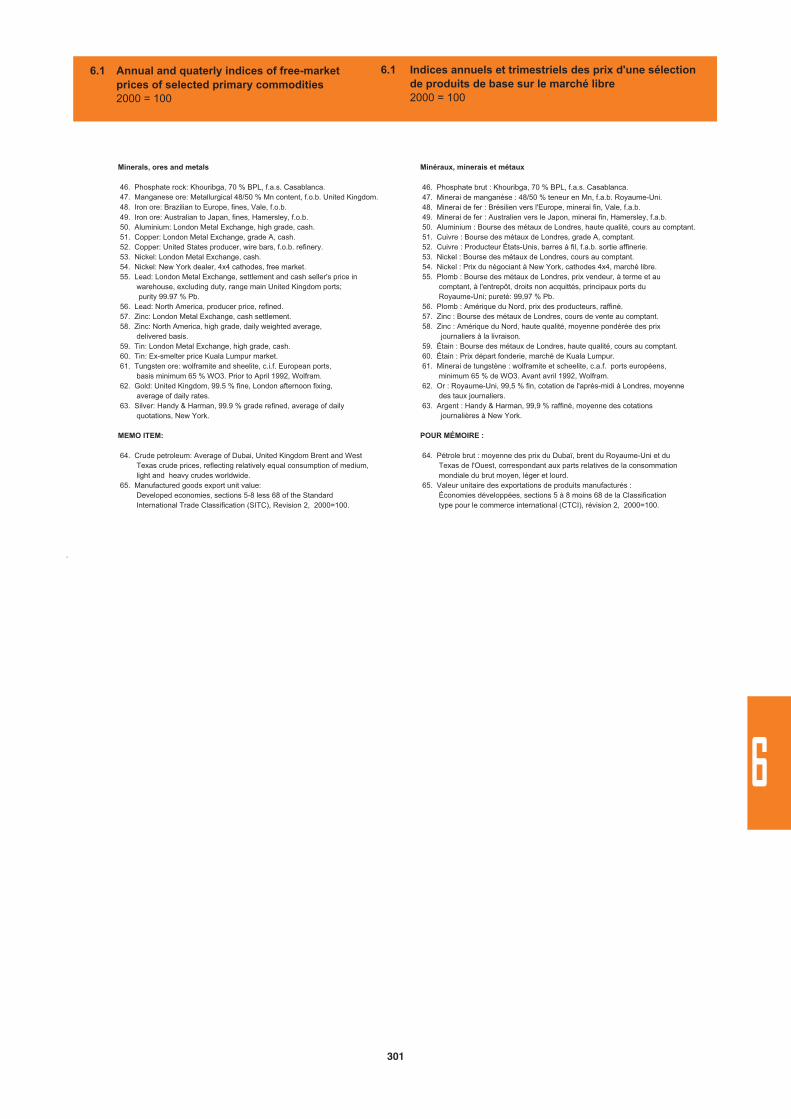
6.1 Annual and quaterly indices of free-marketprices of selected primary commodities2000 = 100
6.1 Indices annuels et trimestriels des prix d'une sélectionde produits de base sur le marché libre2000 = 100
t.
Minerals, ores and metals
46. Phosphate rock: Khouribga, 70 % BPL, f.a.s. Casablanca. 47. Manganese ore: Metallurgical 48/50 % Mn content, f.o.b. United Kingdom.48. Iron ore: Brazilian to Europe, fines, Vale, f.o.b. 49. Iron ore: Australian to Japan, fines, Hamersley, f.o.b. 50. Aluminium: London Metal Exchange, high grade, cash. 51. Copper: London Metal Exchange, grade A, cash. 52. Copper: United States producer, wire bars, f.o.b. refinery. 53. Nickel: London Metal Exchange, cash. 54. Nickel: New York dealer, 4x4 cathodes, free market. 55. Lead: London Metal Exchange, settlement and cash seller's price in warehouse, excluding duty, range main United Kingdom ports; purity 99.97 % Pb. 56. Lead: North America, producer price, refined. 57. Zinc: London Metal Exchange, cash settlement. 58. Zinc: North America, high grade, daily weighted average, delivered basis. 59. Tin: London Metal Exchange, high grade, cash. 60. Tin: Ex-smelter price Kuala Lumpur market. 61. Tungsten ore: wolframite and sheelite, c.i.f. European ports, basis minimum 65 % WO3. Prior to April 1992, Wolfram. 62. Gold: United Kingdom, 99.5 % fine, London afternoon fixing, average of daily rates. 63. Silver: Handy & Harman, 99.9 % grade refined, average of daily quotations, New York.
MEMO ITEM:
64. Crude petroleum: Average of Dubai, United Kingdom Brent and West Texas crude prices, reflecting relatively equal consumption of medium, light and heavy crudes worldwide. 65. Manufactured goods export unit value: Developed economies, sections 5-8 less 68 of the Standard International Trade Classification (SITC), Revision 2, 2000=100.
Minéraux, minerais et métaux
46. Phosphate brut : Khouribga, 70 % BPL, f.a.s. Casablanca. 47. Minerai de manganèse : 48/50 % teneur en Mn, f.a.b. Royaume-Uni. 48. Minerai de fer : Brésilien vers l'Europe, minerai fin, Vale, f.a.b. 49. Minerai de fer : Australien vers le Japon, minerai fin, Hamersley, f.a.b. 50. Aluminium : Bourse des métaux de Londres, haute qualité, cours au comptant. 51. Cuivre : Bourse des métaux de Londres, grade A, comptant. 52. Cuivre : Producteur États-Unis, barres à fil, f.a.b. sortie affinerie. 53. Nickel : Bourse des métaux de Londres, cours au comptant. 54. Nickel : Prix du négociant à New York, cathodes 4x4, marché libre. 55. Plomb : Bourse des métaux de Londres, prix vendeur, à terme et au comptant, à l'entrepôt, droits non acquittés, principaux ports du Royaume-Uni; pureté: 99,97 % Pb. 56. Plomb : Amérique du Nord, prix des producteurs, raffiné. 57. Zinc : Bourse des métaux de Londres, cours de vente au comptant. 58. Zinc : Amérique du Nord, haute qualité, moyenne pondérée des prix journaliers à la livraison. 59. Étain : Bourse des métaux de Londres, haute qualité, cours au comptant. 60. Étain : Prix départ fonderie, marché de Kuala Lumpur. 61. Minerai de tungstène : wolframite et scheelite, c.a.f. ports européens, minimum 65 % de WO3. Avant avril 1992, Wolfram. 62. Or : Royaume-Uni, 99,5 % fin, cotation de l'après-midi à Londres, moyenne des taux journaliers. 63. Argent : Handy & Harman, 99,9 % raffiné, moyenne des cotations journalières à New York.
POUR MÉMOIRE :
64. Pétrole brut : moyenne des prix du Dubaï, brent du Royaume-Uni et du Texas de l'Ouest, correspondant aux parts relatives de la consommation mondiale du brut moyen, léger et lourd. 65. Valeur unitaire des exportations de produits manufacturés : Économies développées, sections 5 à 8 moins 68 de la Classification type pour le commerce international (CTCI), révision 2, 2000=100.
301
6
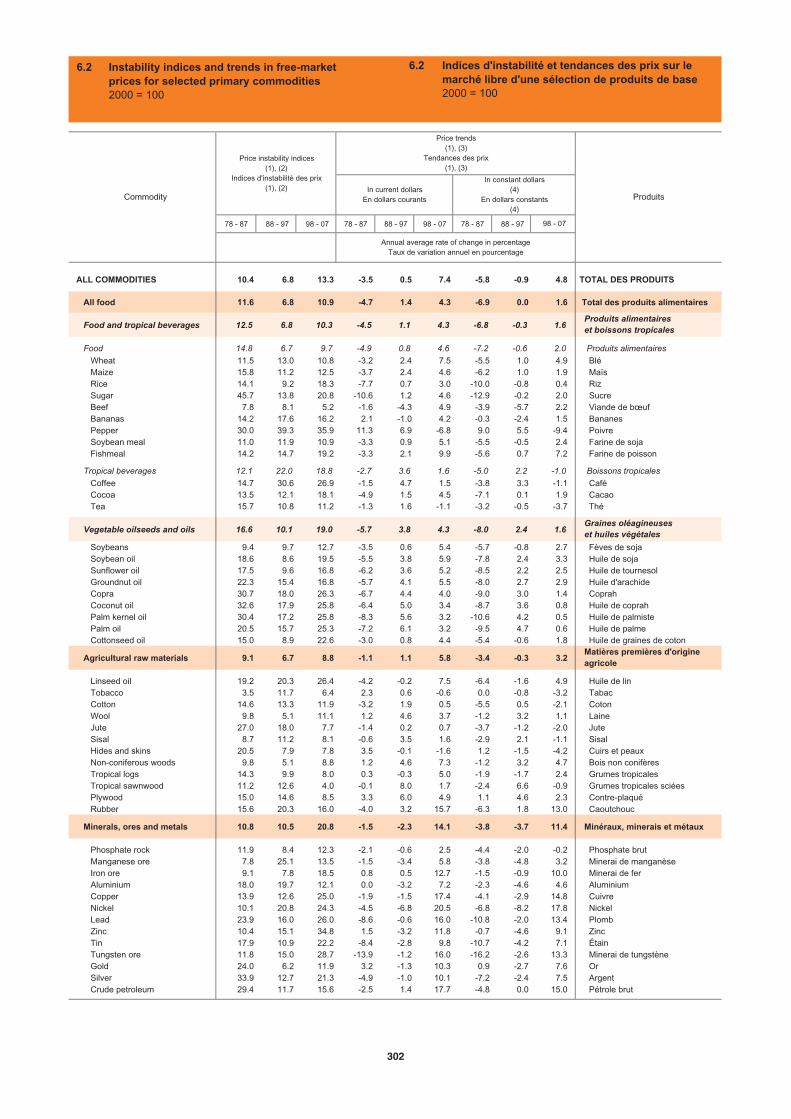
78 - 87 88 - 97 98 - 07 78 - 87 88 - 97 98 - 07 78 - 87 88 - 97
ALL COMMODITIES 10.4 6.8 13.3 -3.5 0.5 7.4 -5.8 -0.9 4.8 TOTAL DES PRODUITS
All food 11.6 6.8 10.9 -4.7 1.4 4.3 -6.9 0.0 1.6 Total des produits alimentaires
Food and tropical beverages 12.5 6.8 10.3 -4.5 1.1 4.3 -6.8 -0.3 1.6 Produits alimentaires et boissons tropicales
Food 14.8 6.7 9.7 -4.9 0.8 4.6 -7.2 -0.6 2.0 Produits alimentaires
Wheat 11.5 13.0 10.8 -3.2 2.4 7.5 -5.5 1.0 4.9 Blé Maize 15.8 11.2 12.5 -3.7 2.4 4.6 -6.2 1.0 1.9 Maïs Rice 14.1 9.2 18.3 -7.7 0.7 3.0 -10.0 -0.8 0.4 Riz Sugar 45.7 13.8 20.8 -10.6 1.2 4.6 -12.9 -0.2 2.0 Sucre Beef 7.8 8.1 5.2 -1.6 -4.3 4.9 -3.9 -5.7 2.2 Viande de bœuf Bananas 14.2 17.6 16.2 2.1 -1.0 4.2 -0.3 -2.4 1.5 Bananes Pepper 30.0 39.3 35.9 11.3 6.9 -6.8 9.0 5.5 -9.4 Poivre Soybean meal 11.0 11.9 10.9 -3.3 0.9 5.1 -5.5 -0.5 2.4 Farine de soja Fishmeal 14.2 14.7 19.2 -3.3 2.1 9.9 -5.6 0.7 7.2 Farine de poisson
Tropical beverages 12.1 22.0 18.8 -2.7 3.6 1.6 -5.0 2.2 -1.0 Boissons tropicales
Coffee 14.7 30.6 26.9 -1.5 4.7 1.5 -3.8 3.3 -1.1 Café Cocoa 13.5 12.1 18.1 -4.9 1.5 4.5 -7.1 0.1 1.9 Cacao Tea 15.7 10.8 11.2 -1.3 1.6 -1.1 -3.2 -0.5 -3.7 Thé
Vegetable oilseeds and oils 16.6 10.1 19.0 -5.7 3.8 4.3 -8.0 2.4 1.6 Graines oléagineuses et huiles végétales
Soybeans 9.4 9.7 12.7 -3.5 0.6 5.4 -5.7 -0.8 2.7 Fèves de soja Soybean oil 18.6 8.6 19.5 -5.5 3.8 5.9 -7.8 2.4 3.3 Huile de soja Sunflower oil 17.5 9.6 16.8 -6.2 3.6 5.2 -8.5 2.2 2.5 Huile de tournesol Groundnut oil 22.3 15.4 16.8 -5.7 4.1 5.5 -8.0 2.7 2.9 Huile d'arachide Copra 30.7 18.0 26.3 -6.7 4.4 4.0 -9.0 3.0 1.4 Coprah Coconut oil 32.6 17.9 25.8 -6.4 5.0 3.4 -8.7 3.6 0.8 Huile de coprah Palm kernel oil 30.4 17.2 25.8 -8.3 5.6 3.2 -10.6 4.2 0.5 Huile de palmiste Palm oil 20.5 15.7 25.3 -7.2 6.1 3.2 -9.5 4.7 0.6 Huile de palme Cottonseed oil 15.0 8.9 22.6 -3.0 0.8 4.4 -5.4 -0.6 1.8 Huile de graines de coton
Agricultural raw materials 9.1 6.7 8.8 -1.1 1.1 5.8 -3.4 -0.3 3.2 Matières premières d'origine agricole
Linseed oil 19.2 20.3 26.4 -4.2 -0.2 7.5 -6.4 -1.6 4.9 Huile de lin Tobacco 3.5 11.7 6.4 2.3 0.6 -0.6 0.0 -0.8 -3.2 Tabac Cotton 14.6 13.3 11.9 -3.2 1.9 0.5 -5.5 0.5 -2.1 Coton Wool 9.8 5.1 11.1 1.2 4.6 3.7 -1.2 3.2 1.1 Laine Jute 27.0 18.0 7.7 -1.4 0.2 0.7 -3.7 -1.2 -2.0 Jute Sisal 8.7 11.2 8.1 -0.6 3.5 1.6 -2.9 2.1 -1.1 Sisal Hides and skins 20.5 7.9 7.8 3.5 -0.1 -1.6 1.2 -1.5 -4.2 Cuirs et peaux Non-coniferous woods 9.8 5.1 8.8 1.2 4.6 7.3 -1.2 3.2 4.7 Bois non conifères Tropical logs 14.3 9.9 8.0 0.3 -0.3 5.0 -1.9 -1.7 2.4 Grumes tropicales Tropical sawnwood 11.2 12.6 4.0 -0.1 8.0 1.7 -2.4 6.6 -0.9 Grumes tropicales sciées Plywood 15.0 14.6 8.5 3.3 6.0 4.9 1.1 4.6 2.3 Contre-plaqué Rubber 15.6 20.3 16.0 -4.0 3.2 15.7 -6.3 1.8 13.0 Caoutchouc
Minerals, ores and metals 10.8 10.5 20.8 -1.5 -2.3 14.1 -3.8 -3.7 11.4 Minéraux, minerais et métaux
Phosphate rock 11.9 8.4 12.3 -2.1 -0.6 2.5 -4.4 -2.0 -0.2 Phosphate brut Manganese ore 7.8 25.1 13.5 -1.5 -3.4 5.8 -3.8 -4.8 3.2 Minerai de manganèse Iron ore 9.1 7.8 18.5 0.8 0.5 12.7 -1.5 -0.9 10.0 Minerai de fer Aluminium 18.0 19.7 12.1 0.0 -3.2 7.2 -2.3 -4.6 4.6 Aluminium Copper 13.9 12.6 25.0 -1.9 -1.5 17.4 -4.1 -2.9 14.8 Cuivre Nickel 10.1 20.8 24.3 -4.5 -6.8 20.5 -6.8 -8.2 17.8 Nickel Lead 23.9 16.0 26.0 -8.6 -0.6 16.0 -10.8 -2.0 13.4 Plomb Zinc 10.4 15.1 34.8 1.5 -3.2 11.8 -0.7 -4.6 9.1 Zinc Tin 17.9 10.9 22.2 -8.4 -2.8 9.8 -10.7 -4.2 7.1 Étain Tungsten ore 11.8 15.0 28.7 -13.9 -1.2 16.0 -16.2 -2.6 13.3 Minerai de tungstène Gold 24.0 6.2 11.9 3.2 -1.3 10.3 0.9 -2.7 7.6 Or Silver 33.9 12.7 21.3 -4.9 -1.0 10.1 -7.2 -2.4 7.5 Argent Crude petroleum 29.4 11.7 15.6 -2.5 1.4 17.7 -4.8 0.0 15.0 Pétrole brut
Price trends(1), (3)
Tendances des prix(1), (3)
In constant dollars(4)
En dollars constants(4)
Commodity Produits
Price instability indices(1), (2)
Indices d'instabilité des prix(1), (2) In current dollars
En dollars courants
Annual average rate of change in percentageTaux de variation annuel en pourcentage
98 - 07
6.2 Instability indices and trends in free-market prices for selected primary commodities 2000 = 100
6.2 Indices d'instabilité et tendances des prix sur le marché libre d'une sélection de produits de base2000 = 100
302
6.2 Instability indices and trends in free-market prices for selected primary commodities 2000 = 100
6.2 Indices d'instabilité et tendances des prix sur le marché libre d'une sélection de produits de base2000 = 100
Sources : - Calculs du secrétariat de la CNUCED fondés sur les Statistiques des prix des produits de base en ligne de la CNUCED.
Notes :
(1)
(2)
(3)
(4)
Les indices d'instabilité et les tendances des prix présentés ici ne correpondent pas à ceux publiés dans les versions antérieures du Manuel de Statistiques , car les indices des prix ont été révisés en utilisant 2000=100 comme année de base.
L'indice d'instabilité des prix est calculé selon
où
L'instabilité est le pourcentage de déviation des variables en question par rapport à la ligne de tendance exponentielle pour une période donnée.
Le taux de croissance de chaque période a été calculé selon la formule :
où
Dollars constants 2000 (dollar courant divisé par l'index des Nations Unies de la valeur unitaire des exportations des produits manufacturés par les économies développées)
p est l'indice de prix et t le temps.
Sources:- UNCTAD calculations based on UNCTAD Commodity Price Statistics on-line
Notes:
(1)
(2)
(3)
(4)
Price instability indices and price trends reported here may not correspond tothose published in the earlier issues of the Handbook of Statistics , since revised price indices, with a base year (2000=100), have been used for their calculations.
The measure of price instability is
where
Accordingly, instability is measured as the percentage deviation of the variables concerned from their exponential trend levels for a given period.
The growth rate of each period has been calculated using the formula:
where
Constant 2000 dollars (current dollars divided by the United Nations unit value index of manufactured goods exported by developed economies)
100*)(/)()(/11
n
t
tytytYn
p is the price index and t is time.
100*)(/)()(/11
n
t
tytytYn
)()log( tbap)()log( tbap
)(tY is the observed magnitude of the variable.
)(ty is the magnitude estimated by fitting an exponential trend
to the observed value and
n is the number of observations.
)(tY est la valeur observée de la variable.
)(ty est la valeur estimée par ajustement à la tendance exponentielle
des valeurs observées et
n est le nombre d'observations.
303
6
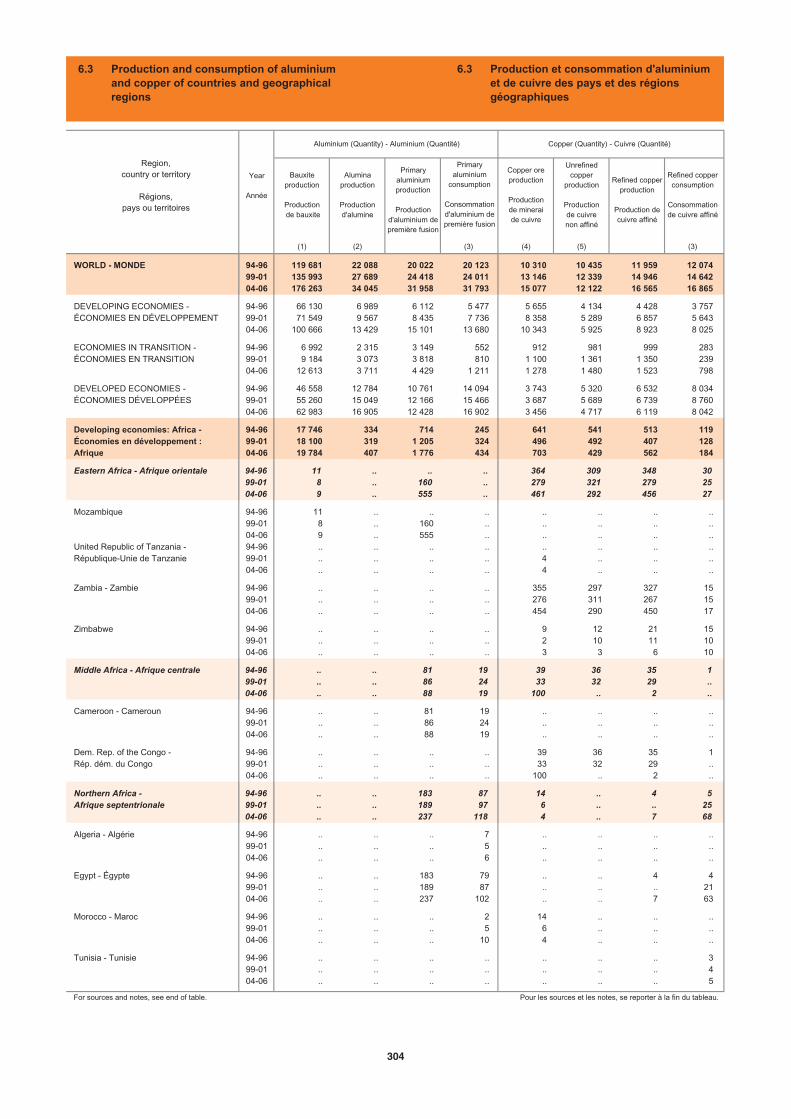
Bauxiteproduction
Production de bauxite
Aluminaproduction
Productiond'alumine
Primaryaluminiumproduction
Productiond'aluminium de première fusion
Copper oreproduction
Productionde mineraide cuivre
Unrefinedcopper
production
Productionde cuivrenon affiné
Refined copperproduction
Production decuivre affiné
Refined copper consumption
Consommationde cuivre affiné
(1) (2) (3) (4) (5) (3)
WORLD - MONDE 94-96 119 681 22 088 20 022 20 123 10 310 10 435 11 959 12 07499-01 135 993 27 689 24 418 24 011 13 146 12 339 14 946 14 64204-06 176 263 34 045 31 958 31 793 15 077 12 122 16 565 16 865
DEVELOPING ECONOMIES - 94-96 66 130 6 989 6 112 5 477 5 655 4 134 4 428 3 757ÉCONOMIES EN DÉVELOPPEMENT 99-01 71 549 9 567 8 435 7 736 8 358 5 289 6 857 5 643
04-06 100 666 13 429 15 101 13 680 10 343 5 925 8 923 8 025
ECONOMIES IN TRANSITION - 94-96 6 992 2 315 3 149 552 912 981 999 283ÉCONOMIES EN TRANSITION 99-01 9 184 3 073 3 818 810 1 100 1 361 1 350 239
04-06 12 613 3 711 4 429 1 211 1 278 1 480 1 523 798
DEVELOPED ECONOMIES - 94-96 46 558 12 784 10 761 14 094 3 743 5 320 6 532 8 034ÉCONOMIES DÉVELOPPÉES 99-01 55 260 15 049 12 166 15 466 3 687 5 689 6 739 8 760
04-06 62 983 16 905 12 428 16 902 3 456 4 717 6 119 8 042
Developing economies: Africa - 94-96 17 746 334 714 245 641 541 513 119Économies en développement : 99-01 18 100 319 1 205 324 496 492 407 128Afrique 04-06 19 784 407 1 776 434 703 429 562 184
Eastern Africa - Afrique orientale 94-96 11 .. .. .. 364 309 348 3099-01 8 .. 160 .. 279 321 279 2504-06 9 .. 555 .. 461 292 456 27
Mozambique 94-96 11 .. .. .. .. .. .. ..99-01 8 .. 160 .. .. .. .. ..04-06 9 .. 555 .. .. .. .. ..
United Republic of Tanzania - 94-96 .. .. .. .. .. .. .. ..République-Unie de Tanzanie 99-01 .. .. .. .. 4 .. .. ..
04-06 .. .. .. .. 4 .. .. ..
Zambia - Zambie 94-96 .. .. .. .. 355 297 327 1599-01 .. .. .. .. 276 311 267 1504-06 .. .. .. .. 454 290 450 17
Zimbabwe 94-96 .. .. .. .. 9 12 21 1599-01 .. .. .. .. 2 10 11 1004-06 .. .. .. .. 3 3 6 10
Middle Africa - Afrique centrale 94-96 .. .. 81 19 39 36 35 199-01 .. .. 86 24 33 32 29 ..04-06 .. .. 88 19 100 .. 2 ..
Cameroon - Cameroun 94-96 .. .. 81 19 .. .. .. ..99-01 .. .. 86 24 .. .. .. ..04-06 .. .. 88 19 .. .. .. ..
Dem. Rep. of the Congo - 94-96 .. .. .. .. 39 36 35 1Rép. dém. du Congo 99-01 .. .. .. .. 33 32 29 ..
04-06 .. .. .. .. 100 .. 2 ..
Northern Africa - 94-96 .. .. 183 87 14 .. 4 5Afrique septentrionale 99-01 .. .. 189 97 6 .. .. 25
04-06 .. .. 237 118 4 .. 7 68
Algeria - Algérie 94-96 .. .. .. 7 .. .. .. ..99-01 .. .. .. 5 .. .. .. ..04-06 .. .. .. 6 .. .. .. ..
Egypt - Égypte 94-96 .. .. 183 79 .. .. 4 499-01 .. .. 189 87 .. .. .. 2104-06 .. .. 237 102 .. .. 7 63
Morocco - Maroc 94-96 .. .. .. 2 14 .. .. ..99-01 .. .. .. 5 6 .. .. ..04-06 .. .. .. 10 4 .. .. ..
Tunisia - Tunisie 94-96 .. .. .. .. .. .. .. 399-01 .. .. .. .. .. .. .. 404-06 .. .. .. .. .. .. .. 5
For sources and notes, see end of table. Pour les sources et les notes, se reporter à la fin du tableau.
Year
Année
Aluminium (Quantity) - Aluminium (Quantité) Copper (Quantity) - Cuivre (Quantité)
Region,country or territory
Régions,pays ou territoires
Primaryaluminium
consumption
Consommationd'aluminium de première fusion
6.3 Production et consommation d'aluminiumet de cuivre des pays et des régions géographiques
6.3 Production and consumption of aluminium and copper of countries and geographical regions
304
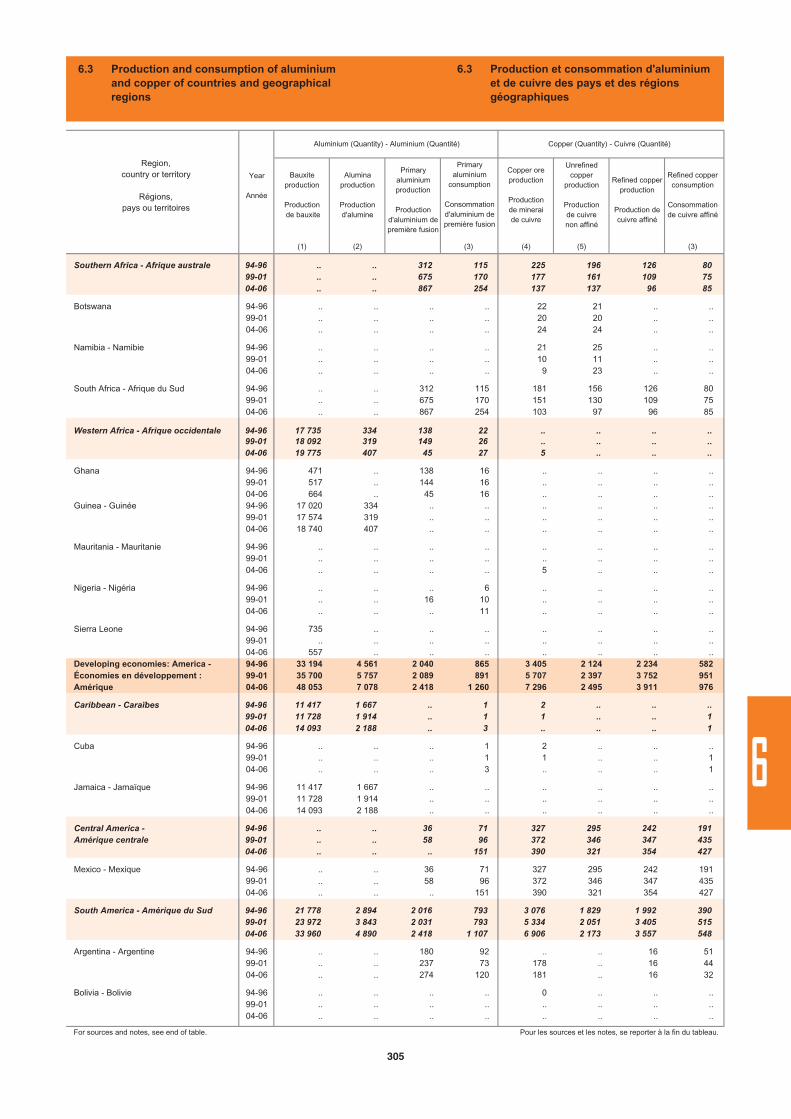
Bauxiteproduction
Production de bauxite
Aluminaproduction
Productiond'alumine
Primaryaluminiumproduction
Productiond'aluminium de première fusion
Copper oreproduction
Productionde mineraide cuivre
Unrefinedcopper
production
Productionde cuivrenon affiné
Refined copperproduction
Production decuivre affiné
Refined copper consumption
Consommationde cuivre affiné
(1) (2) (3) (4) (5) (3)
Southern Africa - Afrique australe 94-96 .. .. 312 115 225 196 126 8099-01 .. .. 675 170 177 161 109 7504-06 .. .. 867 254 137 137 96 85
Botswana 94-96 .. .. .. .. 22 21 .. ..99-01 .. .. .. .. 20 20 .. ..04-06 .. .. .. .. 24 24 .. ..
Namibia - Namibie 94-96 .. .. .. .. 21 25 .. ..99-01 .. .. .. .. 10 11 .. ..04-06 .. .. .. .. 9 23 .. ..
South Africa - Afrique du Sud 94-96 .. .. 312 115 181 156 126 8099-01 .. .. 675 170 151 130 109 7504-06 .. .. 867 254 103 97 96 85
Western Africa - Afrique occidentale 94-96 17 735 334 138 22 .. .. .. ..99-01 18 092 319 149 26 .. .. .. ..04-06 19 775 407 45 27 5 .. .. ..
Ghana 94-96 471 .. 138 16 .. .. .. ..99-01 517 .. 144 16 .. .. .. ..04-06 664 .. 45 16 .. .. .. ..
Guinea - Guinée 94-96 17 020 334 .. .. .. .. .. ..99-01 17 574 319 .. .. .. .. .. ..04-06 18 740 407 .. .. .. .. .. ..
Mauritania - Mauritanie 94-96 .. .. .. .. .. .. .. ..99-01 .. .. .. .. .. .. .. ..04-06 .. .. .. .. 5 .. .. ..
Nigeria - Nigéria 94-96 .. .. .. 6 .. .. .. ..99-01 .. .. 16 10 .. .. .. ..04-06 .. .. .. 11 .. .. .. ..
Sierra Leone 94-96 735 .. .. .. .. .. .. ..99-01 .. .. .. .. .. .. .. ..04-06 557 .. .. .. .. .. .. ..
Developing economies: America - 94-96 33 194 4 561 2 040 865 3 405 2 124 2 234 582Économies en développement : 99-01 35 700 5 757 2 089 891 5 707 2 397 3 752 951Amérique 04-06 48 053 7 078 2 418 1 260 7 296 2 495 3 911 976
Caribbean - Caraïbes 94-96 11 417 1 667 .. 1 2 .. .. ..99-01 11 728 1 914 .. 1 1 .. .. 104-06 14 093 2 188 .. 3 .. .. .. 1
Cuba 94-96 .. .. .. 1 2 .. .. ..99-01 .. .. .. 1 1 .. .. 104-06 .. .. .. 3 .. .. .. 1
Jamaica - Jamaïque 94-96 11 417 1 667 .. .. .. .. .. ..99-01 11 728 1 914 .. .. .. .. .. ..04-06 14 093 2 188 .. .. .. .. .. ..
Central America - 94-96 .. .. 36 71 327 295 242 191Amérique centrale 99-01 .. .. 58 96 372 346 347 435
04-06 .. .. .. 151 390 321 354 427
Mexico - Mexique 94-96 .. .. 36 71 327 295 242 19199-01 .. .. 58 96 372 346 347 43504-06 .. .. .. 151 390 321 354 427
South America - Amérique du Sud 94-96 21 778 2 894 2 016 793 3 076 1 829 1 992 39099-01 23 972 3 843 2 031 793 5 334 2 051 3 405 51504-06 33 960 4 890 2 418 1 107 6 906 2 173 3 557 548
Argentina - Argentine 94-96 .. .. 180 92 .. .. 16 5199-01 .. .. 237 73 178 .. 16 4404-06 .. .. 274 120 181 .. 16 32
Bolivia - Bolivie 94-96 .. .. .. .. 0 .. .. ..99-01 .. .. .. .. .. .. .. ..04-06 .. .. .. .. .. .. .. ..
For sources and notes, see end of table. Pour les sources et les notes, se reporter à la fin du tableau.
Region,country or territory
Régions,pays ou territoires
Year
Année
Aluminium (Quantity) - Aluminium (Quantité) Copper (Quantity) - Cuivre (Quantité)
Primaryaluminium
consumption
Consommationd'aluminium de première fusion
6.3 Production et consommation d'aluminiumet de cuivre des pays et des régions géographiques
6.3 Production and consumption of aluminium and copper of countries and geographical regions
305
6
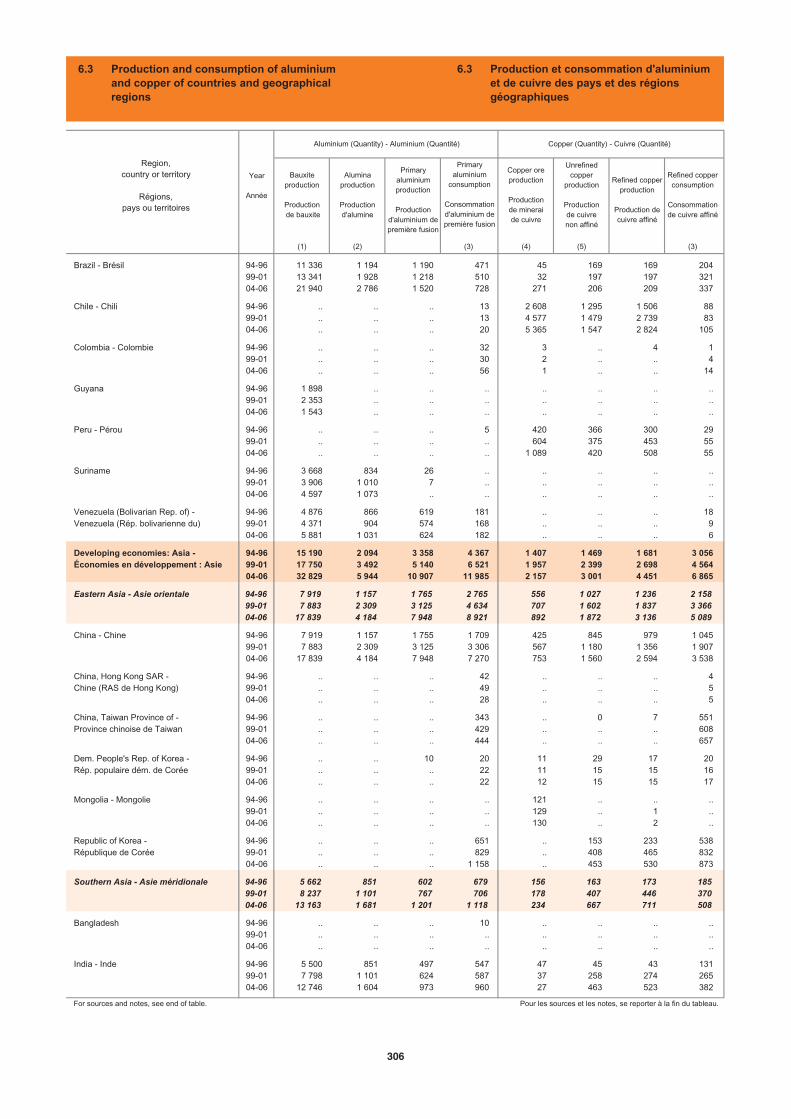
Bauxiteproduction
Production de bauxite
Aluminaproduction
Productiond'alumine
Primaryaluminiumproduction
Productiond'aluminium de première fusion
Copper oreproduction
Productionde mineraide cuivre
Unrefinedcopper
production
Productionde cuivrenon affiné
Refined copperproduction
Production decuivre affiné
Refined copper consumption
Consommationde cuivre affiné
(1) (2) (3) (4) (5) (3)
Brazil - Brésil 94-96 11 336 1 194 1 190 471 45 169 169 20499-01 13 341 1 928 1 218 510 32 197 197 32104-06 21 940 2 786 1 520 728 271 206 209 337
Chile - Chili 94-96 .. .. .. 13 2 608 1 295 1 506 8899-01 .. .. .. 13 4 577 1 479 2 739 8304-06 .. .. .. 20 5 365 1 547 2 824 105
Colombia - Colombie 94-96 .. .. .. 32 3 .. 4 199-01 .. .. .. 30 2 .. .. 404-06 .. .. .. 56 1 .. .. 14
Guyana 94-96 1 898 .. .. .. .. .. .. ..99-01 2 353 .. .. .. .. .. .. ..04-06 1 543 .. .. .. .. .. .. ..
Peru - Pérou 94-96 .. .. .. 5 420 366 300 2999-01 .. .. .. .. 604 375 453 5504-06 .. .. .. .. 1 089 420 508 55
Suriname 94-96 3 668 834 26 .. .. .. .. ..99-01 3 906 1 010 7 .. .. .. .. ..04-06 4 597 1 073 .. .. .. .. .. ..
Venezuela (Bolivarian Rep. of) - 94-96 4 876 866 619 181 .. .. .. 18Venezuela (Rép. bolivarienne du) 99-01 4 371 904 574 168 .. .. .. 9
04-06 5 881 1 031 624 182 .. .. .. 6
Developing economies: Asia - 94-96 15 190 2 094 3 358 4 367 1 407 1 469 1 681 3 056Économies en développement : Asie 99-01 17 750 3 492 5 140 6 521 1 957 2 399 2 698 4 564
04-06 32 829 5 944 10 907 11 985 2 157 3 001 4 451 6 865
Eastern Asia - Asie orientale 94-96 7 919 1 157 1 765 2 765 556 1 027 1 236 2 15899-01 7 883 2 309 3 125 4 634 707 1 602 1 837 3 36604-06 17 839 4 184 7 948 8 921 892 1 872 3 136 5 089
China - Chine 94-96 7 919 1 157 1 755 1 709 425 845 979 1 04599-01 7 883 2 309 3 125 3 306 567 1 180 1 356 1 90704-06 17 839 4 184 7 948 7 270 753 1 560 2 594 3 538
China, Hong Kong SAR - 94-96 .. .. .. 42 .. .. .. 4Chine (RAS de Hong Kong) 99-01 .. .. .. 49 .. .. .. 5
04-06 .. .. .. 28 .. .. .. 5
China, Taiwan Province of - 94-96 .. .. .. 343 .. 0 7 551Province chinoise de Taiwan 99-01 .. .. .. 429 .. .. .. 608
04-06 .. .. .. 444 .. .. .. 657
Dem. People's Rep. of Korea - 94-96 .. .. 10 20 11 29 17 20Rép. populaire dém. de Corée 99-01 .. .. .. 22 11 15 15 16
04-06 .. .. .. 22 12 15 15 17
Mongolia - Mongolie 94-96 .. .. .. .. 121 .. .. ..99-01 .. .. .. .. 129 .. 1 ..04-06 .. .. .. .. 130 .. 2 ..
Republic of Korea - 94-96 .. .. .. 651 .. 153 233 538République de Corée 99-01 .. .. .. 829 .. 408 465 832
04-06 .. .. .. 1 158 .. 453 530 873
Southern Asia - Asie méridionale 94-96 5 662 851 602 679 156 163 173 18599-01 8 237 1 101 767 706 178 407 446 37004-06 13 163 1 681 1 201 1 118 234 667 711 508
Bangladesh 94-96 .. .. .. 10 .. .. .. ..99-01 .. .. .. .. .. .. .. ..04-06 .. .. .. .. .. .. .. ..
India - Inde 94-96 5 500 851 497 547 47 45 43 13199-01 7 798 1 101 624 587 37 258 274 26504-06 12 746 1 604 973 960 27 463 523 382
For sources and notes, see end of table. Pour les sources et les notes, se reporter à la fin du tableau.
Region,country or territory
Régions,pays ou territoires
Year
Année
Aluminium (Quantity) - Aluminium (Quantité) Copper (Quantity) - Cuivre (Quantité)
Primaryaluminium
consumption
Consommationd'aluminium de première fusion
6.3 Production et consommation d'aluminiumet de cuivre des pays et des régions géographiques
6.3 Production and consumption of aluminium and copper of countries and geographical regions
306
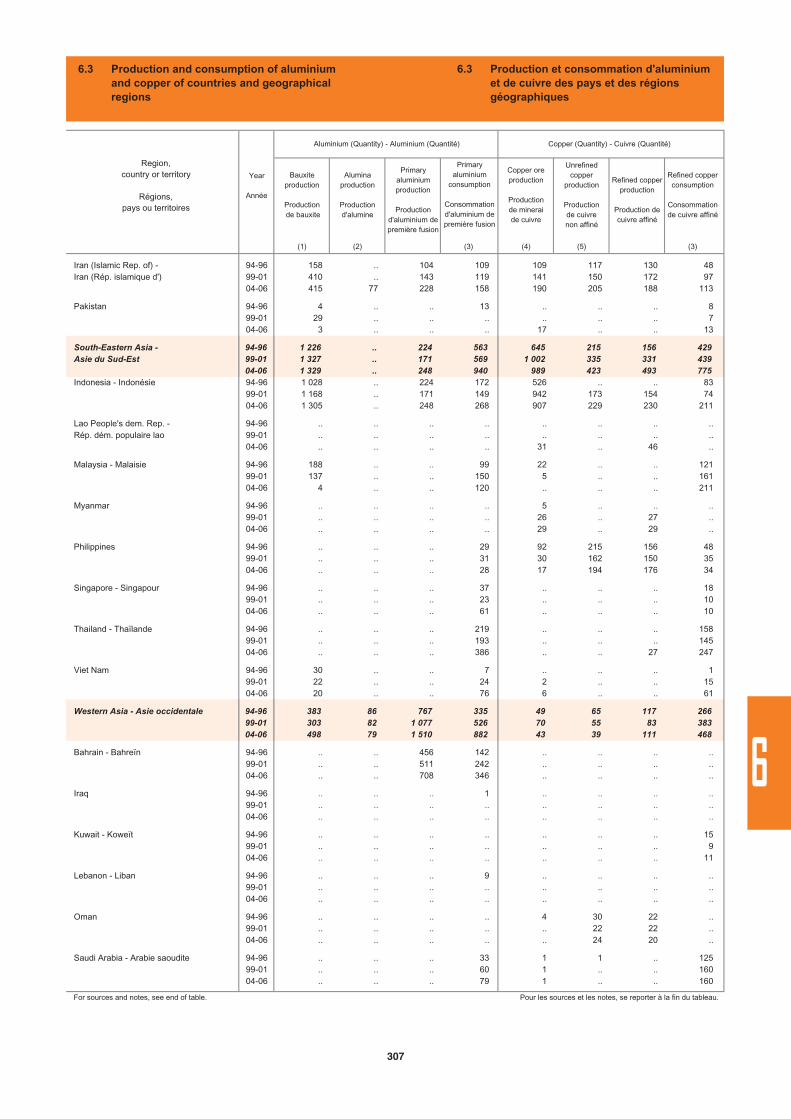
Bauxiteproduction
Production de bauxite
Aluminaproduction
Productiond'alumine
Primaryaluminiumproduction
Productiond'aluminium de première fusion
Copper oreproduction
Productionde mineraide cuivre
Unrefinedcopper
production
Productionde cuivrenon affiné
Refined copperproduction
Production decuivre affiné
Refined copper consumption
Consommationde cuivre affiné
(1) (2) (3) (4) (5) (3)
Iran (Islamic Rep. of) - 94-96 158 .. 104 109 109 117 130 48Iran (Rép. islamique d') 99-01 410 .. 143 119 141 150 172 97
04-06 415 77 228 158 190 205 188 113
Pakistan 94-96 4 .. .. 13 .. .. .. 899-01 29 .. .. .. .. .. .. 704-06 3 .. .. .. 17 .. .. 13
South-Eastern Asia - 94-96 1 226 .. 224 563 645 215 156 429Asie du Sud-Est 99-01 1 327 .. 171 569 1 002 335 331 439
04-06 1 329 .. 248 940 989 423 493 775Indonesia - Indonésie 94-96 1 028 .. 224 172 526 .. .. 83
99-01 1 168 .. 171 149 942 173 154 7404-06 1 305 .. 248 268 907 229 230 211
Lao People's dem. Rep. - 94-96 .. .. .. .. .. .. .. ..Rép. dém. populaire lao 99-01 .. .. .. .. .. .. .. ..
04-06 .. .. .. .. 31 .. 46 ..
Malaysia - Malaisie 94-96 188 .. .. 99 22 .. .. 12199-01 137 .. .. 150 5 .. .. 16104-06 4 .. .. 120 .. .. .. 211
Myanmar 94-96 .. .. .. .. 5 .. .. ..99-01 .. .. .. .. 26 .. 27 ..04-06 .. .. .. .. 29 .. 29 ..
Philippines 94-96 .. .. .. 29 92 215 156 4899-01 .. .. .. 31 30 162 150 3504-06 .. .. .. 28 17 194 176 34
Singapore - Singapour 94-96 .. .. .. 37 .. .. .. 1899-01 .. .. .. 23 .. .. .. 1004-06 .. .. .. 61 .. .. .. 10
Thailand - Thaïlande 94-96 .. .. .. 219 .. .. .. 15899-01 .. .. .. 193 .. .. .. 14504-06 .. .. .. 386 .. .. 27 247
Viet Nam 94-96 30 .. .. 7 .. .. .. 199-01 22 .. .. 24 2 .. .. 1504-06 20 .. .. 76 6 .. .. 61
Western Asia - Asie occidentale 94-96 383 86 767 335 49 65 117 26699-01 303 82 1 077 526 70 55 83 38304-06 498 79 1 510 882 43 39 111 468
Bahrain - Bahreïn 94-96 .. .. 456 142 .. .. .. ..99-01 .. .. 511 242 .. .. .. ..04-06 .. .. 708 346 .. .. .. ..
Iraq 94-96 .. .. .. 1 .. .. .. ..99-01 .. .. .. .. .. .. .. ..04-06 .. .. .. .. .. .. .. ..
Kuwait - Koweït 94-96 .. .. .. .. .. .. .. 1599-01 .. .. .. .. .. .. .. 904-06 .. .. .. .. .. .. .. 11
Lebanon - Liban 94-96 .. .. .. 9 .. .. .. ..99-01 .. .. .. .. .. .. .. ..04-06 .. .. .. .. .. .. .. ..
Oman 94-96 .. .. .. .. 4 30 22 ..99-01 .. .. .. .. .. 22 22 ..04-06 .. .. .. .. .. 24 20 ..
Saudi Arabia - Arabie saoudite 94-96 .. .. .. 33 1 1 .. 12599-01 .. .. .. 60 1 .. .. 16004-06 .. .. .. 79 1 .. .. 160
For sources and notes, see end of table. Pour les sources et les notes, se reporter à la fin du tableau.
Region,country or territory
Régions,pays ou territoires
Year
Année
Aluminium (Quantity) - Aluminium (Quantité) Copper (Quantity) - Cuivre (Quantité)
Primaryaluminium
consumption
Consommationd'aluminium de première fusion
6.3 Production et consommation d'aluminiumet de cuivre des pays et des régions géographiques
6.3 Production and consumption of aluminium and copper of countries and geographical regions
307
6
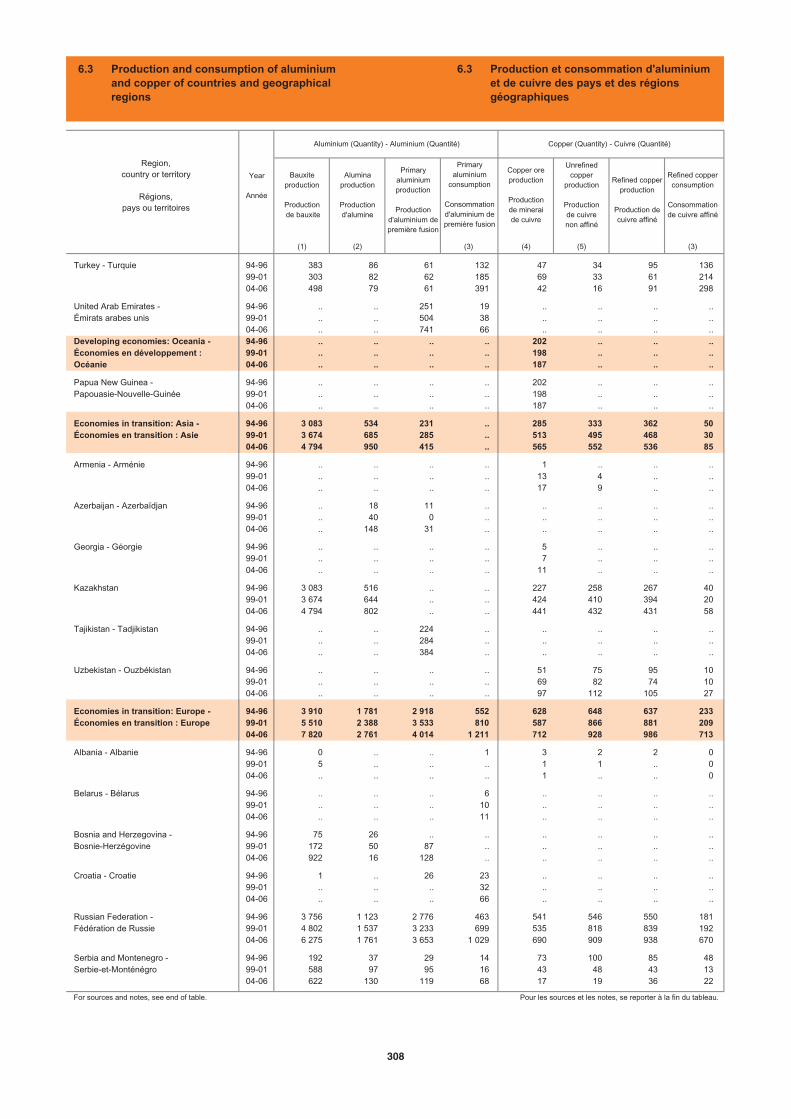
Bauxiteproduction
Production de bauxite
Aluminaproduction
Productiond'alumine
Primaryaluminiumproduction
Productiond'aluminium de première fusion
Copper oreproduction
Productionde mineraide cuivre
Unrefinedcopper
production
Productionde cuivrenon affiné
Refined copperproduction
Production decuivre affiné
Refined copper consumption
Consommationde cuivre affiné
(1) (2) (3) (4) (5) (3)
Turkey - Turquie 94-96 383 86 61 132 47 34 95 13699-01 303 82 62 185 69 33 61 21404-06 498 79 61 391 42 16 91 298
United Arab Emirates - 94-96 .. .. 251 19 .. .. .. ..Émirats arabes unis 99-01 .. .. 504 38 .. .. .. ..
04-06 .. .. 741 66 .. .. .. ..Developing economies: Oceania - 94-96 .. .. .. .. 202 .. .. ..Économies en développement : 99-01 .. .. .. .. 198 .. .. ..Océanie 04-06 .. .. .. .. 187 .. .. ..
Papua New Guinea - 94-96 .. .. .. .. 202 .. .. ..Papouasie-Nouvelle-Guinée 99-01 .. .. .. .. 198 .. .. ..
04-06 .. .. .. .. 187 .. .. ..
Economies in transition: Asia - 94-96 3 083 534 231 .. 285 333 362 50Économies en transition : Asie 99-01 3 674 685 285 .. 513 495 468 30
04-06 4 794 950 415 .. 565 552 536 85
Armenia - Arménie 94-96 .. .. .. .. 1 .. .. ..99-01 .. .. .. .. 13 4 .. ..04-06 .. .. .. .. 17 9 .. ..
Azerbaijan - Azerbaïdjan 94-96 .. 18 11 .. .. .. .. ..99-01 .. 40 0 .. .. .. .. ..04-06 .. 148 31 .. .. .. .. ..
Georgia - Géorgie 94-96 .. .. .. .. 5 .. .. ..99-01 .. .. .. .. 7 .. .. ..04-06 .. .. .. .. 11 .. .. ..
Kazakhstan 94-96 3 083 516 .. .. 227 258 267 4099-01 3 674 644 .. .. 424 410 394 2004-06 4 794 802 .. .. 441 432 431 58
Tajikistan - Tadjikistan 94-96 .. .. 224 .. .. .. .. ..99-01 .. .. 284 .. .. .. .. ..04-06 .. .. 384 .. .. .. .. ..
Uzbekistan - Ouzbékistan 94-96 .. .. .. .. 51 75 95 1099-01 .. .. .. .. 69 82 74 1004-06 .. .. .. .. 97 112 105 27
Economies in transition: Europe - 94-96 3 910 1 781 2 918 552 628 648 637 233Économies en transition : Europe 99-01 5 510 2 388 3 533 810 587 866 881 209
04-06 7 820 2 761 4 014 1 211 712 928 986 713
Albania - Albanie 94-96 0 .. .. 1 3 2 2 099-01 5 .. .. .. 1 1 .. 004-06 .. .. .. .. 1 .. .. 0
Belarus - Bélarus 94-96 .. .. .. 6 .. .. .. ..99-01 .. .. .. 10 .. .. .. ..04-06 .. .. .. 11 .. .. .. ..
Bosnia and Herzegovina - 94-96 75 26 .. .. .. .. .. ..Bosnie-Herzégovine 99-01 172 50 87 .. .. .. .. ..
04-06 922 16 128 .. .. .. .. ..
Croatia - Croatie 94-96 1 .. 26 23 .. .. .. ..99-01 .. .. .. 32 .. .. .. ..04-06 .. .. .. 66 .. .. .. ..
Russian Federation - 94-96 3 756 1 123 2 776 463 541 546 550 181Fédération de Russie 99-01 4 802 1 537 3 233 699 535 818 839 192
04-06 6 275 1 761 3 653 1 029 690 909 938 670
Serbia and Montenegro - 94-96 192 37 29 14 73 100 85 48Serbie-et-Monténégro 99-01 588 97 95 16 43 48 43 13
04-06 622 130 119 68 17 19 36 22
For sources and notes, see end of table. Pour les sources et les notes, se reporter à la fin du tableau.
Region,country or territory
Régions,pays ou territoires
Year
Année
Aluminium (Quantity) - Aluminium (Quantité) Copper (Quantity) - Cuivre (Quantité)
Primaryaluminium
consumption
Consommationd'aluminium de première fusion
6.3 Production et consommation d'aluminiumet de cuivre des pays et des régions géographiques
6.3 Production and consumption of aluminium and copper of countries and geographical regions
308
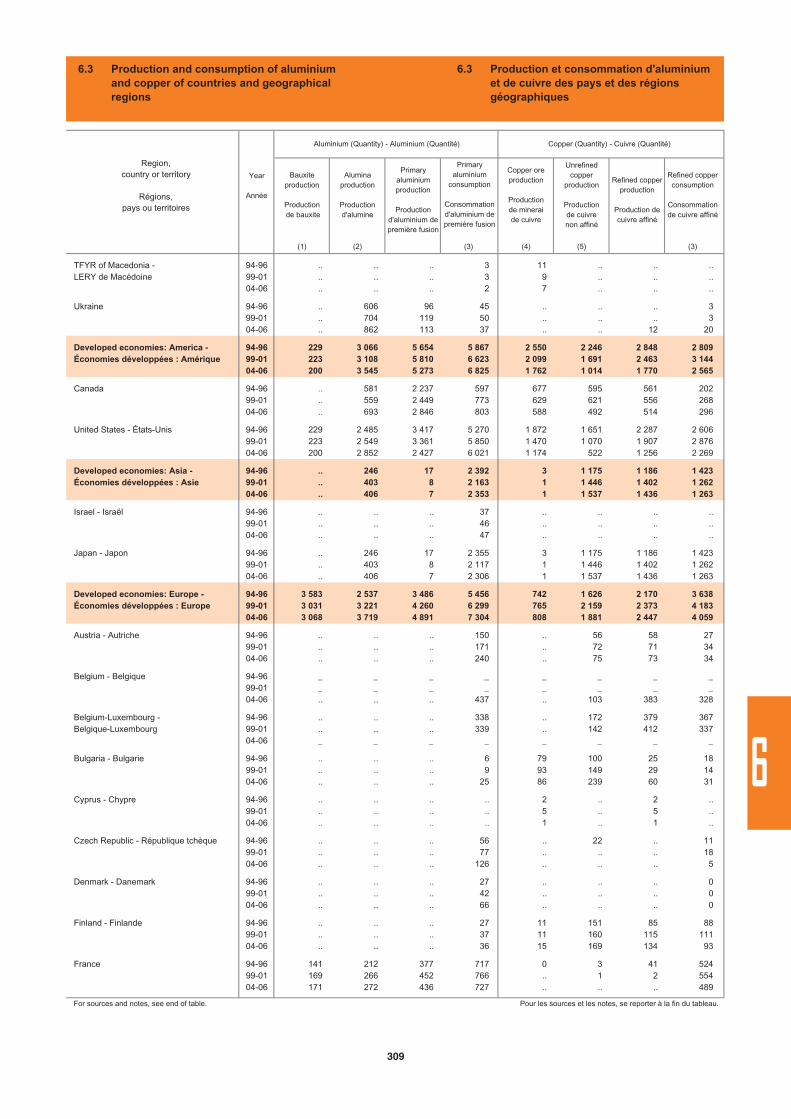
Bauxiteproduction
Production de bauxite
Aluminaproduction
Productiond'alumine
Primaryaluminiumproduction
Productiond'aluminium de première fusion
Copper oreproduction
Productionde mineraide cuivre
Unrefinedcopper
production
Productionde cuivrenon affiné
Refined copperproduction
Production decuivre affiné
Refined copper consumption
Consommationde cuivre affiné
(1) (2) (3) (4) (5) (3)
TFYR of Macedonia - 94-96 .. .. .. 3 11 .. .. ..LERY de Macédoine 99-01 .. .. .. 3 9 .. .. ..
04-06 .. .. .. 2 7 .. .. ..
Ukraine 94-96 .. 606 96 45 .. .. .. 399-01 .. 704 119 50 .. .. .. 304-06 .. 862 113 37 .. .. 12 20
Developed economies: America - 94-96 229 3 066 5 654 5 867 2 550 2 246 2 848 2 809Économies développées : Amérique 99-01 223 3 108 5 810 6 623 2 099 1 691 2 463 3 144
04-06 200 3 545 5 273 6 825 1 762 1 014 1 770 2 565
Canada 94-96 .. 581 2 237 597 677 595 561 20299-01 .. 559 2 449 773 629 621 556 26804-06 .. 693 2 846 803 588 492 514 296
United States - États-Unis 94-96 229 2 485 3 417 5 270 1 872 1 651 2 287 2 60699-01 223 2 549 3 361 5 850 1 470 1 070 1 907 2 87604-06 200 2 852 2 427 6 021 1 174 522 1 256 2 269
Developed economies: Asia - 94-96 .. 246 17 2 392 3 1 175 1 186 1 423Économies développées : Asie 99-01 .. 403 8 2 163 1 1 446 1 402 1 262
04-06 .. 406 7 2 353 1 1 537 1 436 1 263
Israel - Israël 94-96 .. .. .. 37 .. .. .. ..99-01 .. .. .. 46 .. .. .. ..04-06 .. .. .. 47 .. .. .. ..
Japan - Japon 94-96 .. 246 17 2 355 3 1 175 1 186 1 42399-01 .. 403 8 2 117 1 1 446 1 402 1 26204-06 .. 406 7 2 306 1 1 537 1 436 1 263
Developed economies: Europe - 94-96 3 583 2 537 3 486 5 456 742 1 626 2 170 3 638Économies développées : Europe 99-01 3 031 3 221 4 260 6 299 765 2 159 2 373 4 183
04-06 3 068 3 719 4 891 7 304 808 1 881 2 447 4 059
Austria - Autriche 94-96 .. .. .. 150 .. 56 58 2799-01 .. .. .. 171 .. 72 71 3404-06 .. .. .. 240 .. 75 73 34
Belgium - Belgique 94-96 _ _ _ _ _ _ _ _99-01 _ _ _ _ _ _ _ _04-06 .. .. .. 437 .. 103 383 328
Belgium-Luxembourg - 94-96 .. .. .. 338 .. 172 379 367Belgique-Luxembourg 99-01 .. .. .. 339 .. 142 412 337
04-06 _ _ _ _ _ _ _ _
Bulgaria - Bulgarie 94-96 .. .. .. 6 79 100 25 1899-01 .. .. .. 9 93 149 29 1404-06 .. .. .. 25 86 239 60 31
Cyprus - Chypre 94-96 .. .. .. .. 2 .. 2 ..99-01 .. .. .. .. 5 .. 5 ..04-06 .. .. .. .. 1 .. 1 ..
Czech Republic - République tchèque 94-96 .. .. .. 56 .. 22 .. 1199-01 .. .. .. 77 .. .. .. 1804-06 .. .. .. 126 .. .. .. 5
Denmark - Danemark 94-96 .. .. .. 27 .. .. .. 099-01 .. .. .. 42 .. .. .. 004-06 .. .. .. 66 .. .. .. 0
Finland - Finlande 94-96 .. .. .. 27 11 151 85 8899-01 .. .. .. 37 11 160 115 11104-06 .. .. .. 36 15 169 134 93
France 94-96 141 212 377 717 0 3 41 52499-01 169 266 452 766 .. 1 2 55404-06 171 272 436 727 .. .. .. 489
For sources and notes, see end of table. Pour les sources et les notes, se reporter à la fin du tableau.
Region,country or territory
Régions,pays ou territoires
Year
Année
Aluminium (Quantity) - Aluminium (Quantité) Copper (Quantity) - Cuivre (Quantité)
Primaryaluminium
consumption
Consommationd'aluminium de première fusion
6.3 Production et consommation d'aluminiumet de cuivre des pays et des régions géographiques
6.3 Production and consumption of aluminium and copper of countries and geographical regions
309
6
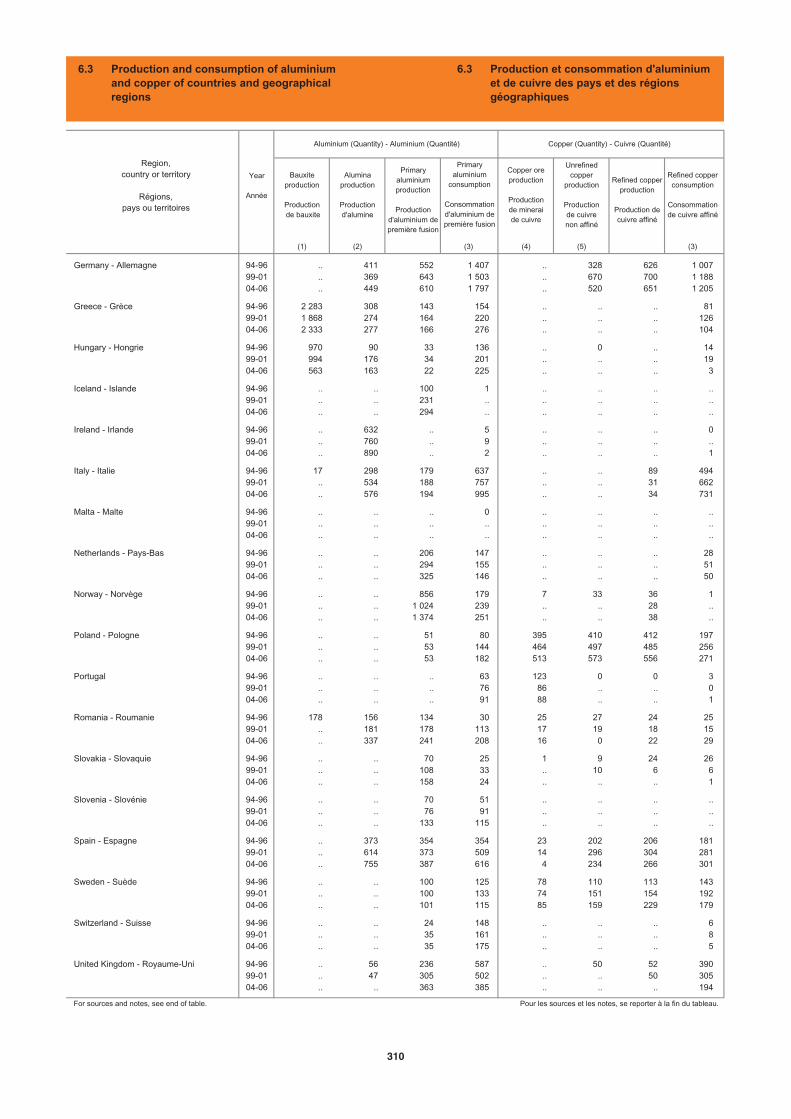
Bauxiteproduction
Production de bauxite
Aluminaproduction
Productiond'alumine
Primaryaluminiumproduction
Productiond'aluminium de première fusion
Copper oreproduction
Productionde mineraide cuivre
Unrefinedcopper
production
Productionde cuivrenon affiné
Refined copperproduction
Production decuivre affiné
Refined copper consumption
Consommationde cuivre affiné
(1) (2) (3) (4) (5) (3)
Germany - Allemagne 94-96 .. 411 552 1 407 .. 328 626 1 00799-01 .. 369 643 1 503 .. 670 700 1 18804-06 .. 449 610 1 797 .. 520 651 1 205
Greece - Grèce 94-96 2 283 308 143 154 .. .. .. 8199-01 1 868 274 164 220 .. .. .. 12604-06 2 333 277 166 276 .. .. .. 104
Hungary - Hongrie 94-96 970 90 33 136 .. 0 .. 1499-01 994 176 34 201 .. .. .. 1904-06 563 163 22 225 .. .. .. 3
Iceland - Islande 94-96 .. .. 100 1 .. .. .. ..99-01 .. .. 231 .. .. .. .. ..04-06 .. .. 294 .. .. .. .. ..
Ireland - Irlande 94-96 .. 632 .. 5 .. .. .. 099-01 .. 760 .. 9 .. .. .. ..04-06 .. 890 .. 2 .. .. .. 1
Italy - Italie 94-96 17 298 179 637 .. .. 89 49499-01 .. 534 188 757 .. .. 31 66204-06 .. 576 194 995 .. .. 34 731
Malta - Malte 94-96 .. .. .. 0 .. .. .. ..99-01 .. .. .. .. .. .. .. ..04-06 .. .. .. .. .. .. .. ..
Netherlands - Pays-Bas 94-96 .. .. 206 147 .. .. .. 2899-01 .. .. 294 155 .. .. .. 5104-06 .. .. 325 146 .. .. .. 50
Norway - Norvège 94-96 .. .. 856 179 7 33 36 199-01 .. .. 1 024 239 .. .. 28 ..04-06 .. .. 1 374 251 .. .. 38 ..
Poland - Pologne 94-96 .. .. 51 80 395 410 412 19799-01 .. .. 53 144 464 497 485 25604-06 .. .. 53 182 513 573 556 271
Portugal 94-96 .. .. .. 63 123 0 0 399-01 .. .. .. 76 86 .. .. 004-06 .. .. .. 91 88 .. .. 1
Romania - Roumanie 94-96 178 156 134 30 25 27 24 2599-01 .. 181 178 113 17 19 18 1504-06 .. 337 241 208 16 0 22 29
Slovakia - Slovaquie 94-96 .. .. 70 25 1 9 24 2699-01 .. .. 108 33 .. 10 6 604-06 .. .. 158 24 .. .. .. 1
Slovenia - Slovénie 94-96 .. .. 70 51 .. .. .. ..99-01 .. .. 76 91 .. .. .. ..04-06 .. .. 133 115 .. .. .. ..
Spain - Espagne 94-96 .. 373 354 354 23 202 206 18199-01 .. 614 373 509 14 296 304 28104-06 .. 755 387 616 4 234 266 301
Sweden - Suède 94-96 .. .. 100 125 78 110 113 14399-01 .. .. 100 133 74 151 154 19204-06 .. .. 101 115 85 159 229 179
Switzerland - Suisse 94-96 .. .. 24 148 .. .. .. 699-01 .. .. 35 161 .. .. .. 804-06 .. .. 35 175 .. .. .. 5
United Kingdom - Royaume-Uni 94-96 .. 56 236 587 .. 50 52 39099-01 .. 47 305 502 .. .. 50 30504-06 .. .. 363 385 .. .. .. 194
For sources and notes, see end of table. Pour les sources et les notes, se reporter à la fin du tableau.
Region,country or territory
Régions,pays ou territoires
Year
Année
Aluminium (Quantity) - Aluminium (Quantité) Copper (Quantity) - Cuivre (Quantité)
Primaryaluminium
consumption
Consommationd'aluminium de première fusion
6.3 Production et consommation d'aluminiumet de cuivre des pays et des régions géographiques
6.3 Production and consumption of aluminium and copper of countries and geographical regions
310
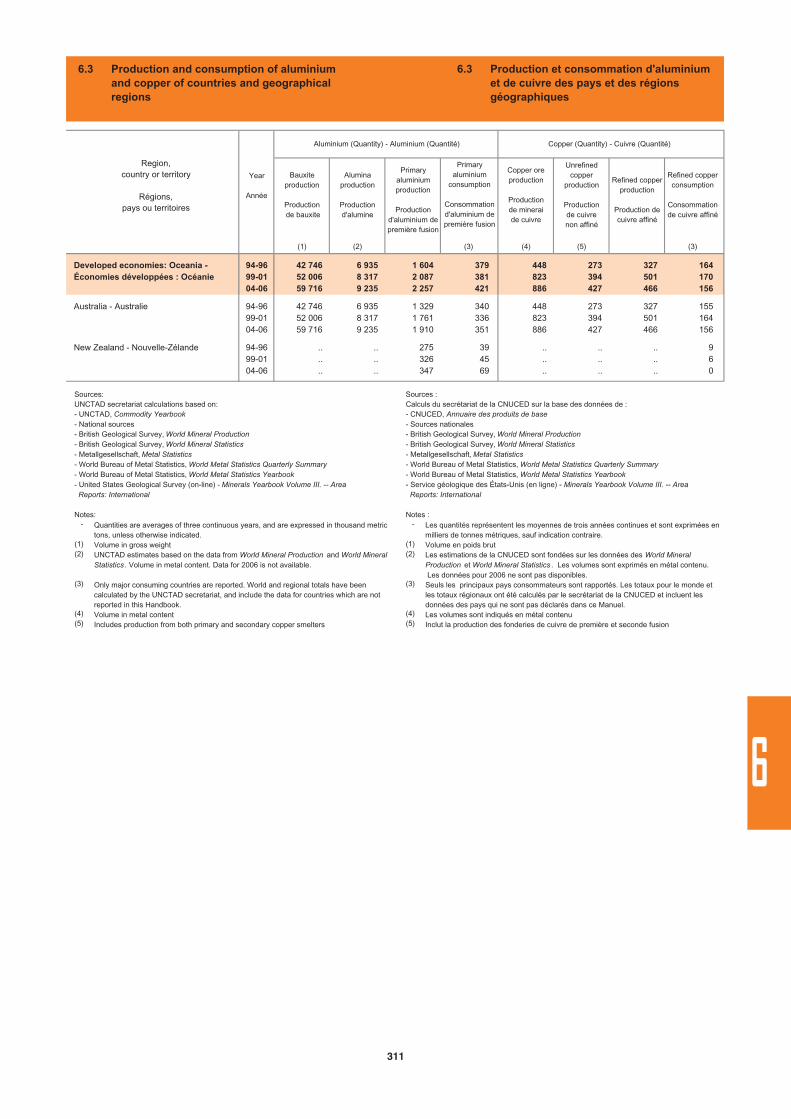
Bauxiteproduction
Production de bauxite
Aluminaproduction
Productiond'alumine
Primaryaluminiumproduction
Productiond'aluminium de première fusion
Copper oreproduction
Productionde mineraide cuivre
Unrefinedcopper
production
Productionde cuivrenon affiné
Refined copperproduction
Production decuivre affiné
Refined copper consumption
Consommationde cuivre affiné
(1) (2) (3) (4) (5) (3)
Developed economies: Oceania - 94-96 42 746 6 935 1 604 379 448 273 327 164Économies développées : Océanie 99-01 52 006 8 317 2 087 381 823 394 501 170
04-06 59 716 9 235 2 257 421 886 427 466 156
Australia - Australie 94-96 42 746 6 935 1 329 340 448 273 327 15599-01 52 006 8 317 1 761 336 823 394 501 16404-06 59 716 9 235 1 910 351 886 427 466 156
New Zealand - Nouvelle-Zélande 94-96 .. .. 275 39 .. .. .. 999-01 .. .. 326 45 .. .. .. 604-06 .. .. 347 69 .. .. .. 0
Region,country or territory
Régions,pays ou territoires
Year
Année
Aluminium (Quantity) - Aluminium (Quantité) Copper (Quantity) - Cuivre (Quantité)
Primaryaluminium
consumption
Consommationd'aluminium de première fusion
6.3 Production et consommation d'aluminiumet de cuivre des pays et des régions géographiques
6.3 Production and consumption of aluminium and copper of countries and geographical regions
-
(1)(2)
(3)
(4)(5)
Quantities are averages of three continuous years, and are expressed in thousand metric tons, unless otherwise indicated.Volume in gross weightUNCTAD estimates based on the data from World Mineral Production and World Mineral Statistics . Volume in metal content. Data for 2006 is not available.
Only major consuming countries are reported. World and regional totals have been calculated by the UNCTAD secretariat, and include the data for countries which are not reported in this Handbook.Volume in metal contentIncludes production from both primary and secondary copper smelters
Sources:UNCTAD secretariat calculations based on:- UNCTAD, Commodity Yearbook- National sources- British Geological Survey, World Mineral Production- British Geological Survey, World Mineral Statistics- Metallgesellschaft, Metal Statistics- World Bureau of Metal Statistics, World Metal Statistics Quarterly Summary- World Bureau of Metal Statistics, World Metal Statistics Yearbook- United States Geological Survey (on-line) - Minerals Yearbook Volume III. -- Area Reports: International
Notes: -
(1)(2)
(3)
(4)(5)
Les quantités représentent les moyennes de trois années continues et sont exprimées en milliers de tonnes métriques, sauf indication contraire.Volume en poids brutLes estimations de la CNUCED sont fondées sur les données des World Mineral Production et World Mineral Statistics . Les volumes sont exprimés en métal contenu. Les données pour 2006 ne sont pas disponibles.Seuls les principaux pays consommateurs sont rapportés. Les totaux pour le monde et les totaux régionaux ont été calculés par le secrétariat de la CNUCED et incluent les données des pays qui ne sont pas déclarés dans ce Manuel.Les volumes sont indiqués en métal contenuInclut la production des fonderies de cuivre de première et seconde fusion
Sources :Calculs du secrétariat de la CNUCED sur la base des données de :- CNUCED, Annuaire des produits de base- Sources nationales- British Geological Survey, World Mineral Production- British Geological Survey, World Mineral Statistics- Metallgesellschaft, Metal Statistics- World Bureau of Metal Statistics, World Metal Statistics Quarterly Summary- World Bureau of Metal Statistics, World Metal Statistics Yearbook- Service géologique des États-Unis (en ligne) - Minerals Yearbook Volume III. -- Area Reports: International
Notes :
311
6

FINANCE
FINANCE
1
2
3
4
5
6
7
8
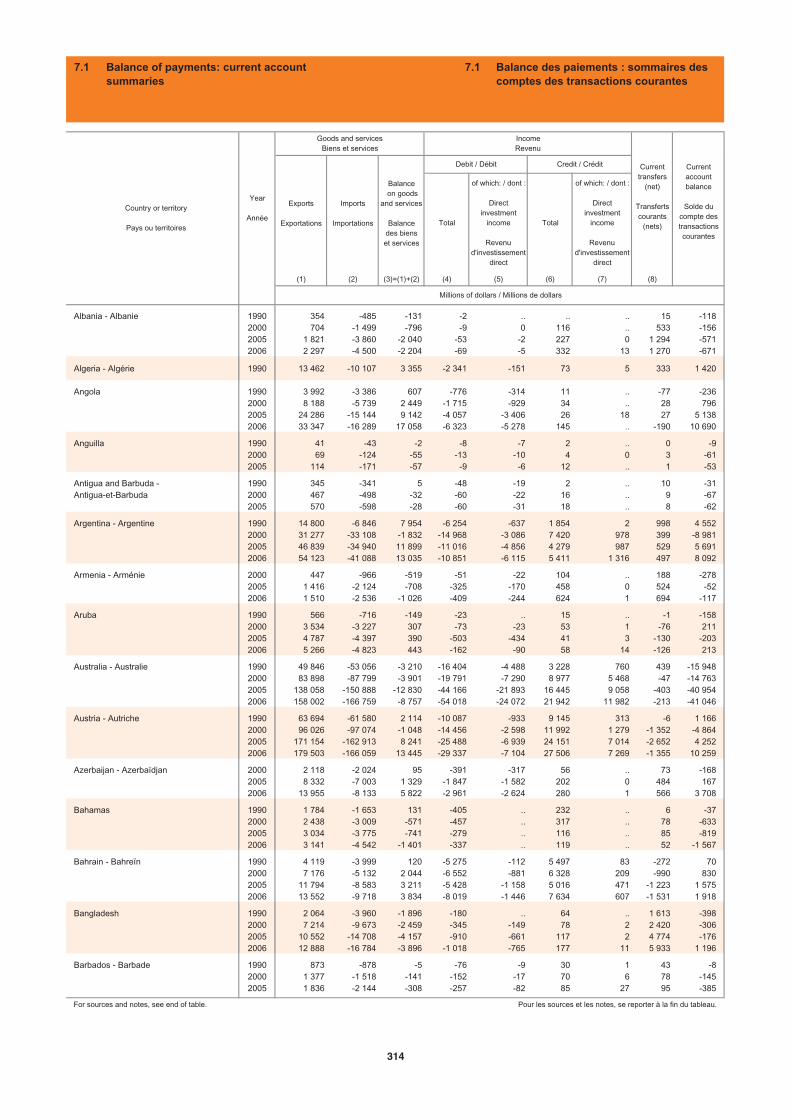
Total
of which: / dont :
Directinvestment
income
Revenud'investissement
direct
Total
of which: / dont :
Directinvestment
income
Revenud'investissement
direct
(1) (2) (3)=(1)+(2) (4) (5) (6) (7) (8)
Albania - Albanie 1990 354 -485 -131 -2 .. .. .. 15 -1182000 704 -1 499 -796 -9 0 116 .. 533 -1562005 1 821 -3 860 -2 040 -53 -2 227 0 1 294 -5712006 2 297 -4 500 -2 204 -69 -5 332 13 1 270 -671
Algeria - Algérie 1990 13 462 -10 107 3 355 -2 341 -151 73 5 333 1 420
Angola 1990 3 992 -3 386 607 -776 -314 11 .. -77 -2362000 8 188 -5 739 2 449 -1 715 -929 34 .. 28 7962005 24 286 -15 144 9 142 -4 057 -3 406 26 18 27 5 1382006 33 347 -16 289 17 058 -6 323 -5 278 145 .. -190 10 690
Anguilla 1990 41 -43 -2 -8 -7 2 .. 0 -92000 69 -124 -55 -13 -10 4 0 3 -612005 114 -171 -57 -9 -6 12 .. 1 -53
Antigua and Barbuda - 1990 345 -341 5 -48 -19 2 .. 10 -31Antigua-et-Barbuda 2000 467 -498 -32 -60 -22 16 .. 9 -67
2005 570 -598 -28 -60 -31 18 .. 8 -62
Argentina - Argentine 1990 14 800 -6 846 7 954 -6 254 -637 1 854 2 998 4 5522000 31 277 -33 108 -1 832 -14 968 -3 086 7 420 978 399 -8 9812005 46 839 -34 940 11 899 -11 016 -4 856 4 279 987 529 5 6912006 54 123 -41 088 13 035 -10 851 -6 115 5 411 1 316 497 8 092
Armenia - Arménie 2000 447 -966 -519 -51 -22 104 .. 188 -2782005 1 416 -2 124 -708 -325 -170 458 0 524 -522006 1 510 -2 536 -1 026 -409 -244 624 1 694 -117
Aruba 1990 566 -716 -149 -23 .. 15 .. -1 -1582000 3 534 -3 227 307 -73 -23 53 1 -76 2112005 4 787 -4 397 390 -503 -434 41 3 -130 -2032006 5 266 -4 823 443 -162 -90 58 14 -126 213
Australia - Australie 1990 49 846 -53 056 -3 210 -16 404 -4 488 3 228 760 439 -15 9482000 83 898 -87 799 -3 901 -19 791 -7 290 8 977 5 468 -47 -14 7632005 138 058 -150 888 -12 830 -44 166 -21 893 16 445 9 058 -403 -40 9542006 158 002 -166 759 -8 757 -54 018 -24 072 21 942 11 982 -213 -41 046
Austria - Autriche 1990 63 694 -61 580 2 114 -10 087 -933 9 145 313 -6 1 1662000 96 026 -97 074 -1 048 -14 456 -2 598 11 992 1 279 -1 352 -4 8642005 171 154 -162 913 8 241 -25 488 -6 939 24 151 7 014 -2 652 4 2522006 179 503 -166 059 13 445 -29 337 -7 104 27 506 7 269 -1 355 10 259
Azerbaijan - Azerbaïdjan 2000 2 118 -2 024 95 -391 -317 56 .. 73 -1682005 8 332 -7 003 1 329 -1 847 -1 582 202 0 484 1672006 13 955 -8 133 5 822 -2 961 -2 624 280 1 566 3 708
Bahamas 1990 1 784 -1 653 131 -405 .. 232 .. 6 -372000 2 438 -3 009 -571 -457 .. 317 .. 78 -6332005 3 034 -3 775 -741 -279 .. 116 .. 85 -8192006 3 141 -4 542 -1 401 -337 .. 119 .. 52 -1 567
Bahrain - Bahreïn 1990 4 119 -3 999 120 -5 275 -112 5 497 83 -272 702000 7 176 -5 132 2 044 -6 552 -881 6 328 209 -990 8302005 11 794 -8 583 3 211 -5 428 -1 158 5 016 471 -1 223 1 5752006 13 552 -9 718 3 834 -8 019 -1 446 7 634 607 -1 531 1 918
Bangladesh 1990 2 064 -3 960 -1 896 -180 .. 64 .. 1 613 -3982000 7 214 -9 673 -2 459 -345 -149 78 2 2 420 -3062005 10 552 -14 708 -4 157 -910 -661 117 2 4 774 -1762006 12 888 -16 784 -3 896 -1 018 -765 177 11 5 933 1 196
Barbados - Barbade 1990 873 -878 -5 -76 -9 30 1 43 -82000 1 377 -1 518 -141 -152 -17 70 6 78 -1452005 1 836 -2 144 -308 -257 -82 85 27 95 -385
For sources and notes, see end of table. Pour les sources et les notes, se reporter à la fin du tableau.
Credit / Crédit
IncomeRevenu
Exports
Exportations
Imports
Importations
Millions of dollars / Millions de dollars
Country or territory
Pays ou territoires
Year
Année
Currentaccountbalance
Solde du compte des transactionscourantes
Currenttransfers
(net)
Transfertscourants
(nets)
Goods and servicesBiens et services
Balance on goods
and services
Balancedes bienset services
Debit / Débit
7.1 Balance of payments: current account summaries
7.1 Balance des paiements : sommaires des comptes des transactions courantes
314
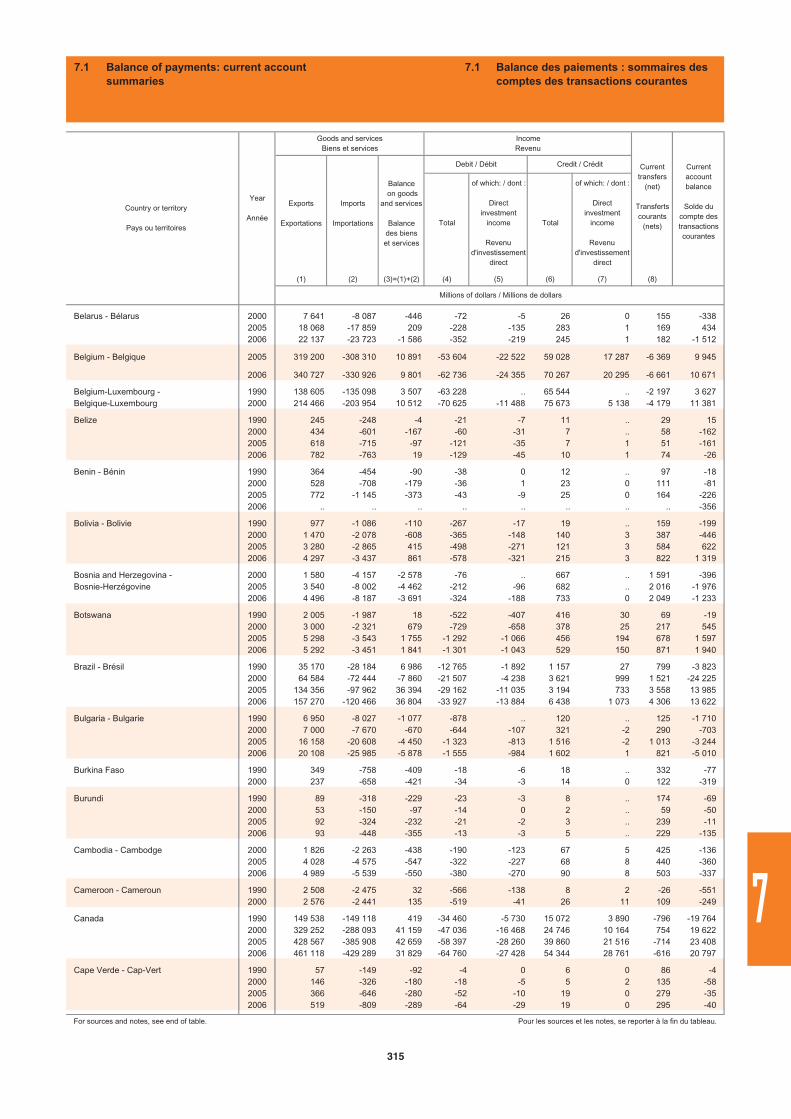
Total
of which: / dont :
Directinvestment
income
Revenud'investissement
direct
Total
of which: / dont :
Directinvestment
income
Revenud'investissement
direct
(1) (2) (3)=(1)+(2) (4) (5) (6) (7) (8)
Belarus - Bélarus 2000 7 641 -8 087 -446 -72 -5 26 0 155 -3382005 18 068 -17 859 209 -228 -135 283 1 169 4342006 22 137 -23 723 -1 586 -352 -219 245 1 182 -1 512
Belgium - Belgique 2005 319 200 -308 310 10 891 -53 604 -22 522 59 028 17 287 -6 369 9 945
2006 340 727 -330 926 9 801 -62 736 -24 355 70 267 20 295 -6 661 10 671
Belgium-Luxembourg - 1990 138 605 -135 098 3 507 -63 228 .. 65 544 .. -2 197 3 627Belgique-Luxembourg 2000 214 466 -203 954 10 512 -70 625 -11 488 75 673 5 138 -4 179 11 381
Belize 1990 245 -248 -4 -21 -7 11 .. 29 152000 434 -601 -167 -60 -31 7 .. 58 -1622005 618 -715 -97 -121 -35 7 1 51 -1612006 782 -763 19 -129 -45 10 1 74 -26
Benin - Bénin 1990 364 -454 -90 -38 0 12 .. 97 -182000 528 -708 -179 -36 1 23 0 111 -812005 772 -1 145 -373 -43 -9 25 0 164 -2262006 .. .. .. .. .. .. .. .. -356
Bolivia - Bolivie 1990 977 -1 086 -110 -267 -17 19 .. 159 -1992000 1 470 -2 078 -608 -365 -148 140 3 387 -4462005 3 280 -2 865 415 -498 -271 121 3 584 6222006 4 297 -3 437 861 -578 -321 215 3 822 1 319
Bosnia and Herzegovina - 2000 1 580 -4 157 -2 578 -76 .. 667 .. 1 591 -396Bosnie-Herzégovine 2005 3 540 -8 002 -4 462 -212 -96 682 .. 2 016 -1 976
2006 4 496 -8 187 -3 691 -324 -188 733 0 2 049 -1 233
Botswana 1990 2 005 -1 987 18 -522 -407 416 30 69 -192000 3 000 -2 321 679 -729 -658 378 25 217 5452005 5 298 -3 543 1 755 -1 292 -1 066 456 194 678 1 5972006 5 292 -3 451 1 841 -1 301 -1 043 529 150 871 1 940
Brazil - Brésil 1990 35 170 -28 184 6 986 -12 765 -1 892 1 157 27 799 -3 8232000 64 584 -72 444 -7 860 -21 507 -4 238 3 621 999 1 521 -24 2252005 134 356 -97 962 36 394 -29 162 -11 035 3 194 733 3 558 13 9852006 157 270 -120 466 36 804 -33 927 -13 884 6 438 1 073 4 306 13 622
Bulgaria - Bulgarie 1990 6 950 -8 027 -1 077 -878 .. 120 .. 125 -1 7102000 7 000 -7 670 -670 -644 -107 321 -2 290 -7032005 16 158 -20 608 -4 450 -1 323 -813 1 516 -2 1 013 -3 2442006 20 108 -25 985 -5 878 -1 555 -984 1 602 1 821 -5 010
Burkina Faso 1990 349 -758 -409 -18 -6 18 .. 332 -772000 237 -658 -421 -34 -3 14 0 122 -319
Burundi 1990 89 -318 -229 -23 -3 8 .. 174 -692000 53 -150 -97 -14 0 2 .. 59 -502005 92 -324 -232 -21 -2 3 .. 239 -112006 93 -448 -355 -13 -3 5 .. 229 -135
Cambodia - Cambodge 2000 1 826 -2 263 -438 -190 -123 67 5 425 -1362005 4 028 -4 575 -547 -322 -227 68 8 440 -3602006 4 989 -5 539 -550 -380 -270 90 8 503 -337
Cameroon - Cameroun 1990 2 508 -2 475 32 -566 -138 8 2 -26 -5512000 2 576 -2 441 135 -519 -41 26 11 109 -249
Canada 1990 149 538 -149 118 419 -34 460 -5 730 15 072 3 890 -796 -19 7642000 329 252 -288 093 41 159 -47 036 -16 468 24 746 10 164 754 19 6222005 428 567 -385 908 42 659 -58 397 -28 260 39 860 21 516 -714 23 4082006 461 118 -429 289 31 829 -64 760 -27 428 54 344 28 761 -616 20 797
Cape Verde - Cap-Vert 1990 57 -149 -92 -4 0 6 0 86 -42000 146 -326 -180 -18 -5 5 2 135 -582005 366 -646 -280 -52 -10 19 0 279 -352006 519 -809 -289 -64 -29 19 0 295 -40
For sources and notes, see end of table. Pour les sources et les notes, se reporter à la fin du tableau.
Balance on goods
and services
Balancedes bienset services
Debit / Débit Credit / Crédit
Millions of dollars / Millions de dollars
Country or territory
Pays ou territoires
Year
Année
Goods and servicesBiens et services
IncomeRevenu
Currenttransfers
(net)
Transfertscourants
(nets)
Currentaccountbalance
Solde du compte des transactionscourantes
Exports
Exportations
Imports
Importations
7.1 Balance of payments: current account summaries
7.1 Balance des paiements : sommaires des comptes des transactions courantes
315
7
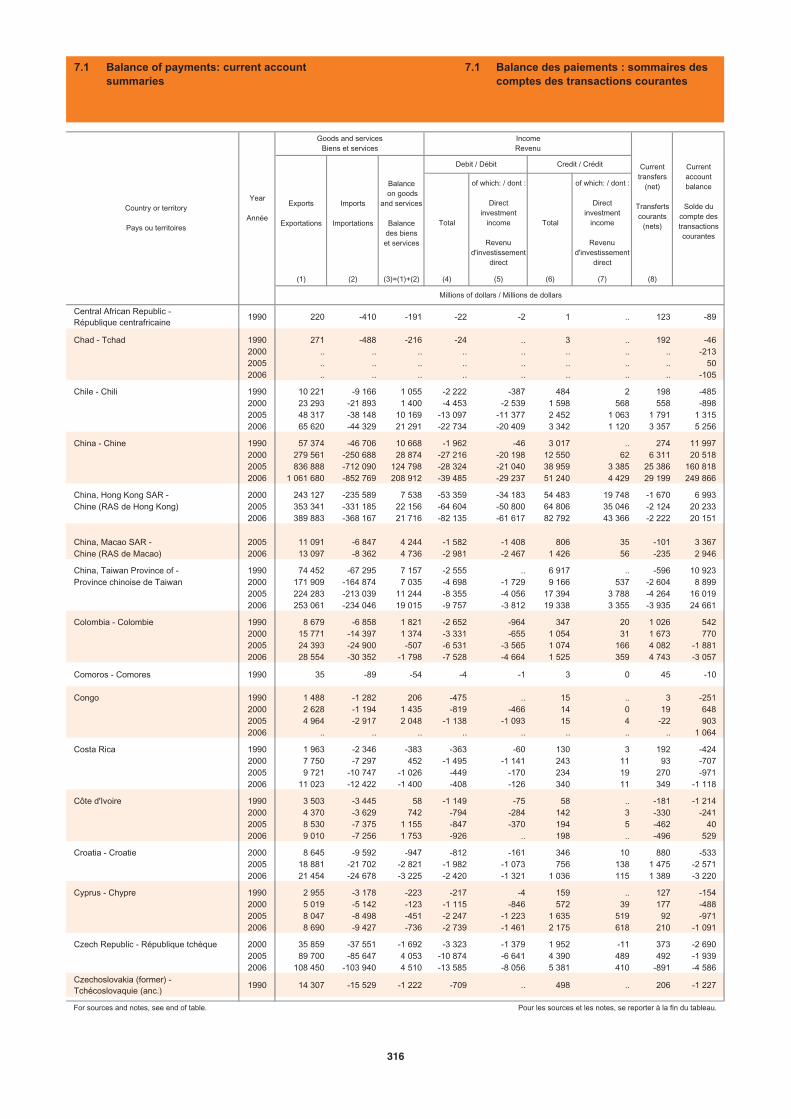
Total
of which: / dont :
Directinvestment
income
Revenud'investissement
direct
Total
of which: / dont :
Directinvestment
income
Revenud'investissement
direct
(1) (2) (3)=(1)+(2) (4) (5) (6) (7) (8)
Central African Republic - République centrafricaine
1990 220 -410 -191 -22 -2 1 .. 123 -89
Chad - Tchad 1990 271 -488 -216 -24 .. 3 .. 192 -462000 .. .. .. .. .. .. .. .. -2132005 .. .. .. .. .. .. .. .. 502006 .. .. .. .. .. .. .. .. -105
Chile - Chili 1990 10 221 -9 166 1 055 -2 222 -387 484 2 198 -4852000 23 293 -21 893 1 400 -4 453 -2 539 1 598 568 558 -8982005 48 317 -38 148 10 169 -13 097 -11 377 2 452 1 063 1 791 1 3152006 65 620 -44 329 21 291 -22 734 -20 409 3 342 1 120 3 357 5 256
China - Chine 1990 57 374 -46 706 10 668 -1 962 -46 3 017 .. 274 11 9972000 279 561 -250 688 28 874 -27 216 -20 198 12 550 62 6 311 20 5182005 836 888 -712 090 124 798 -28 324 -21 040 38 959 3 385 25 386 160 8182006 1 061 680 -852 769 208 912 -39 485 -29 237 51 240 4 429 29 199 249 866
China, Hong Kong SAR - 2000 243 127 -235 589 7 538 -53 359 -34 183 54 483 19 748 -1 670 6 993Chine (RAS de Hong Kong) 2005 353 341 -331 185 22 156 -64 604 -50 800 64 806 35 046 -2 124 20 233
2006 389 883 -368 167 21 716 -82 135 -61 617 82 792 43 366 -2 222 20 151
China, Macao SAR - 2005 11 091 -6 847 4 244 -1 582 -1 408 806 35 -101 3 367Chine (RAS de Macao) 2006 13 097 -8 362 4 736 -2 981 -2 467 1 426 56 -235 2 946
China, Taiwan Province of - 1990 74 452 -67 295 7 157 -2 555 .. 6 917 .. -596 10 923Province chinoise de Taiwan 2000 171 909 -164 874 7 035 -4 698 -1 729 9 166 537 -2 604 8 899
2005 224 283 -213 039 11 244 -8 355 -4 056 17 394 3 788 -4 264 16 0192006 253 061 -234 046 19 015 -9 757 -3 812 19 338 3 355 -3 935 24 661
Colombia - Colombie 1990 8 679 -6 858 1 821 -2 652 -964 347 20 1 026 5422000 15 771 -14 397 1 374 -3 331 -655 1 054 31 1 673 7702005 24 393 -24 900 -507 -6 531 -3 565 1 074 166 4 082 -1 8812006 28 554 -30 352 -1 798 -7 528 -4 664 1 525 359 4 743 -3 057
Comoros - Comores 1990 35 -89 -54 -4 -1 3 0 45 -10
Congo 1990 1 488 -1 282 206 -475 .. 15 .. 3 -2512000 2 628 -1 194 1 435 -819 -466 14 0 19 6482005 4 964 -2 917 2 048 -1 138 -1 093 15 4 -22 9032006 .. .. .. .. .. .. .. .. 1 064
Costa Rica 1990 1 963 -2 346 -383 -363 -60 130 3 192 -4242000 7 750 -7 297 452 -1 495 -1 141 243 11 93 -7072005 9 721 -10 747 -1 026 -449 -170 234 19 270 -9712006 11 023 -12 422 -1 400 -408 -126 340 11 349 -1 118
Côte d'Ivoire 1990 3 503 -3 445 58 -1 149 -75 58 .. -181 -1 2142000 4 370 -3 629 742 -794 -284 142 3 -330 -2412005 8 530 -7 375 1 155 -847 -370 194 5 -462 402006 9 010 -7 256 1 753 -926 .. 198 .. -496 529
Croatia - Croatie 2000 8 645 -9 592 -947 -812 -161 346 10 880 -5332005 18 881 -21 702 -2 821 -1 982 -1 073 756 138 1 475 -2 5712006 21 454 -24 678 -3 225 -2 420 -1 321 1 036 115 1 389 -3 220
Cyprus - Chypre 1990 2 955 -3 178 -223 -217 -4 159 .. 127 -1542000 5 019 -5 142 -123 -1 115 -846 572 39 177 -4882005 8 047 -8 498 -451 -2 247 -1 223 1 635 519 92 -9712006 8 690 -9 427 -736 -2 739 -1 461 2 175 618 210 -1 091
Czech Republic - République tchèque 2000 35 859 -37 551 -1 692 -3 323 -1 379 1 952 -11 373 -2 6902005 89 700 -85 647 4 053 -10 874 -6 641 4 390 489 492 -1 9392006 108 450 -103 940 4 510 -13 585 -8 056 5 381 410 -891 -4 586
Czechoslovakia (former) - Tchécoslovaquie (anc.)
1990 14 307 -15 529 -1 222 -709 .. 498 .. 206 -1 227
For sources and notes, see end of table. Pour les sources et les notes, se reporter à la fin du tableau.
Balance on goods
and services
Balancedes bienset services
Debit / Débit Credit / Crédit
Millions of dollars / Millions de dollars
Country or territory
Pays ou territoires
Year
Année
Goods and servicesBiens et services
IncomeRevenu
Currenttransfers
(net)
Transfertscourants
(nets)
Currentaccountbalance
Solde du compte des transactionscourantes
Exports
Exportations
Imports
Importations
7.1 Balance of payments: current account summaries
7.1 Balance des paiements : sommaires des comptes des transactions courantes
316
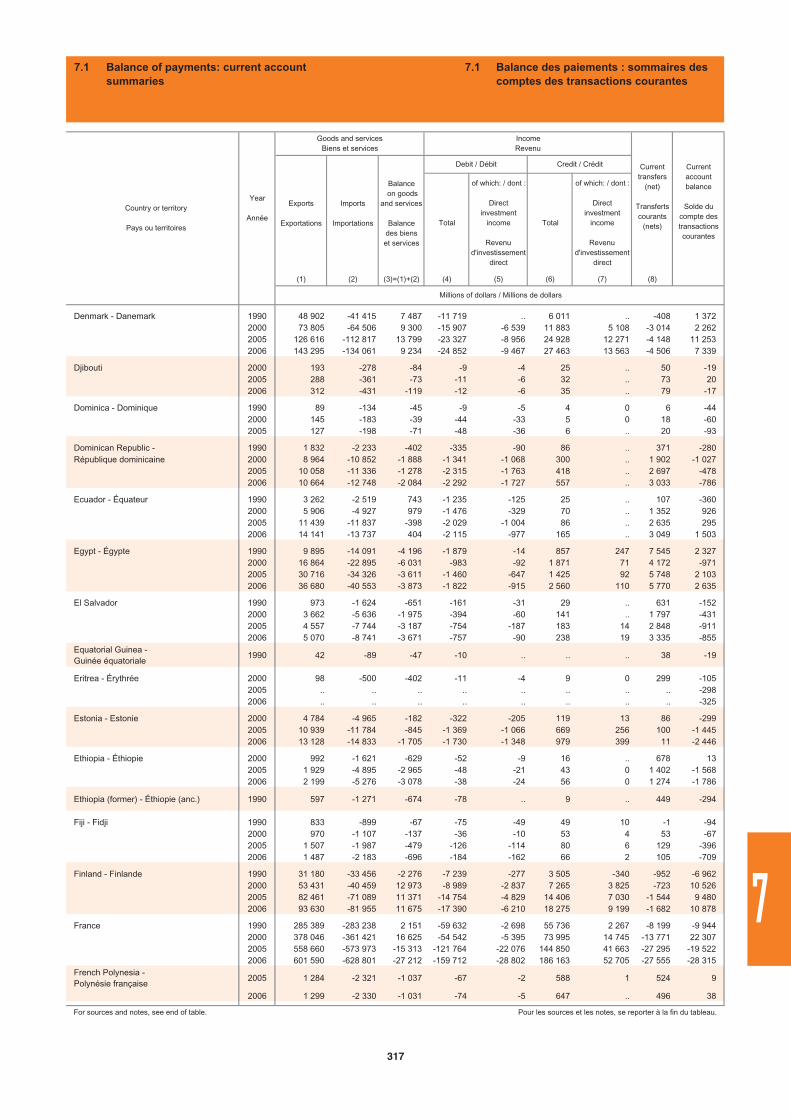
Total
of which: / dont :
Directinvestment
income
Revenud'investissement
direct
Total
of which: / dont :
Directinvestment
income
Revenud'investissement
direct
(1) (2) (3)=(1)+(2) (4) (5) (6) (7) (8)
Denmark - Danemark 1990 48 902 -41 415 7 487 -11 719 .. 6 011 .. -408 1 3722000 73 805 -64 506 9 300 -15 907 -6 539 11 883 5 108 -3 014 2 2622005 126 616 -112 817 13 799 -23 327 -8 956 24 928 12 271 -4 148 11 2532006 143 295 -134 061 9 234 -24 852 -9 467 27 463 13 563 -4 506 7 339
Djibouti 2000 193 -278 -84 -9 -4 25 .. 50 -192005 288 -361 -73 -11 -6 32 .. 73 202006 312 -431 -119 -12 -6 35 .. 79 -17
Dominica - Dominique 1990 89 -134 -45 -9 -5 4 0 6 -442000 145 -183 -39 -44 -33 5 0 18 -602005 127 -198 -71 -48 -36 6 .. 20 -93
Dominican Republic - 1990 1 832 -2 233 -402 -335 -90 86 .. 371 -280République dominicaine 2000 8 964 -10 852 -1 888 -1 341 -1 068 300 .. 1 902 -1 027
2005 10 058 -11 336 -1 278 -2 315 -1 763 418 .. 2 697 -4782006 10 664 -12 748 -2 084 -2 292 -1 727 557 .. 3 033 -786
Ecuador - Équateur 1990 3 262 -2 519 743 -1 235 -125 25 .. 107 -3602000 5 906 -4 927 979 -1 476 -329 70 .. 1 352 9262005 11 439 -11 837 -398 -2 029 -1 004 86 .. 2 635 2952006 14 141 -13 737 404 -2 115 -977 165 .. 3 049 1 503
Egypt - Égypte 1990 9 895 -14 091 -4 196 -1 879 -14 857 247 7 545 2 3272000 16 864 -22 895 -6 031 -983 -92 1 871 71 4 172 -9712005 30 716 -34 326 -3 611 -1 460 -647 1 425 92 5 748 2 1032006 36 680 -40 553 -3 873 -1 822 -915 2 560 110 5 770 2 635
El Salvador 1990 973 -1 624 -651 -161 -31 29 .. 631 -1522000 3 662 -5 636 -1 975 -394 -60 141 .. 1 797 -4312005 4 557 -7 744 -3 187 -754 -187 183 14 2 848 -9112006 5 070 -8 741 -3 671 -757 -90 238 19 3 335 -855
Equatorial Guinea -Guinée équatoriale
1990 42 -89 -47 -10 .. .. .. 38 -19
Eritrea - Érythrée 2000 98 -500 -402 -11 -4 9 0 299 -1052005 .. .. .. .. .. .. .. .. -2982006 .. .. .. .. .. .. .. .. -325
Estonia - Estonie 2000 4 784 -4 965 -182 -322 -205 119 13 86 -2992005 10 939 -11 784 -845 -1 369 -1 066 669 256 100 -1 4452006 13 128 -14 833 -1 705 -1 730 -1 348 979 399 11 -2 446
Ethiopia - Éthiopie 2000 992 -1 621 -629 -52 -9 16 .. 678 132005 1 929 -4 895 -2 965 -48 -21 43 0 1 402 -1 5682006 2 199 -5 276 -3 078 -38 -24 56 0 1 274 -1 786
Ethiopia (former) - Éthiopie (anc.) 1990 597 -1 271 -674 -78 .. 9 .. 449 -294
Fiji - Fidji 1990 833 -899 -67 -75 -49 49 10 -1 -942000 970 -1 107 -137 -36 -10 53 4 53 -672005 1 507 -1 987 -479 -126 -114 80 6 129 -3962006 1 487 -2 183 -696 -184 -162 66 2 105 -709
Finland - Finlande 1990 31 180 -33 456 -2 276 -7 239 -277 3 505 -340 -952 -6 9622000 53 431 -40 459 12 973 -8 989 -2 837 7 265 3 825 -723 10 5262005 82 461 -71 089 11 371 -14 754 -4 829 14 406 7 030 -1 544 9 4802006 93 630 -81 955 11 675 -17 390 -6 210 18 275 9 199 -1 682 10 878
France 1990 285 389 -283 238 2 151 -59 632 -2 698 55 736 2 267 -8 199 -9 9442000 378 046 -361 421 16 625 -54 542 -5 395 73 995 14 745 -13 771 22 3072005 558 660 -573 973 -15 313 -121 764 -22 076 144 850 41 663 -27 295 -19 5222006 601 590 -628 801 -27 212 -159 712 -28 802 186 163 52 705 -27 555 -28 315
French Polynesia -Polynésie française
2005 1 284 -2 321 -1 037 -67 -2 588 1 524 9
2006 1 299 -2 330 -1 031 -74 -5 647 .. 496 38
For sources and notes, see end of table. Pour les sources et les notes, se reporter à la fin du tableau.
Balance on goods
and services
Balancedes bienset services
Debit / Débit Credit / Crédit
Millions of dollars / Millions de dollars
Country or territory
Pays ou territoires
Year
Année
Goods and servicesBiens et services
IncomeRevenu
Currenttransfers
(net)
Transfertscourants
(nets)
Currentaccountbalance
Solde du compte des transactionscourantes
Exports
Exportations
Imports
Importations
7.1 Balance of payments: current account summaries
7.1 Balance des paiements : sommaires des comptes des transactions courantes
317
7
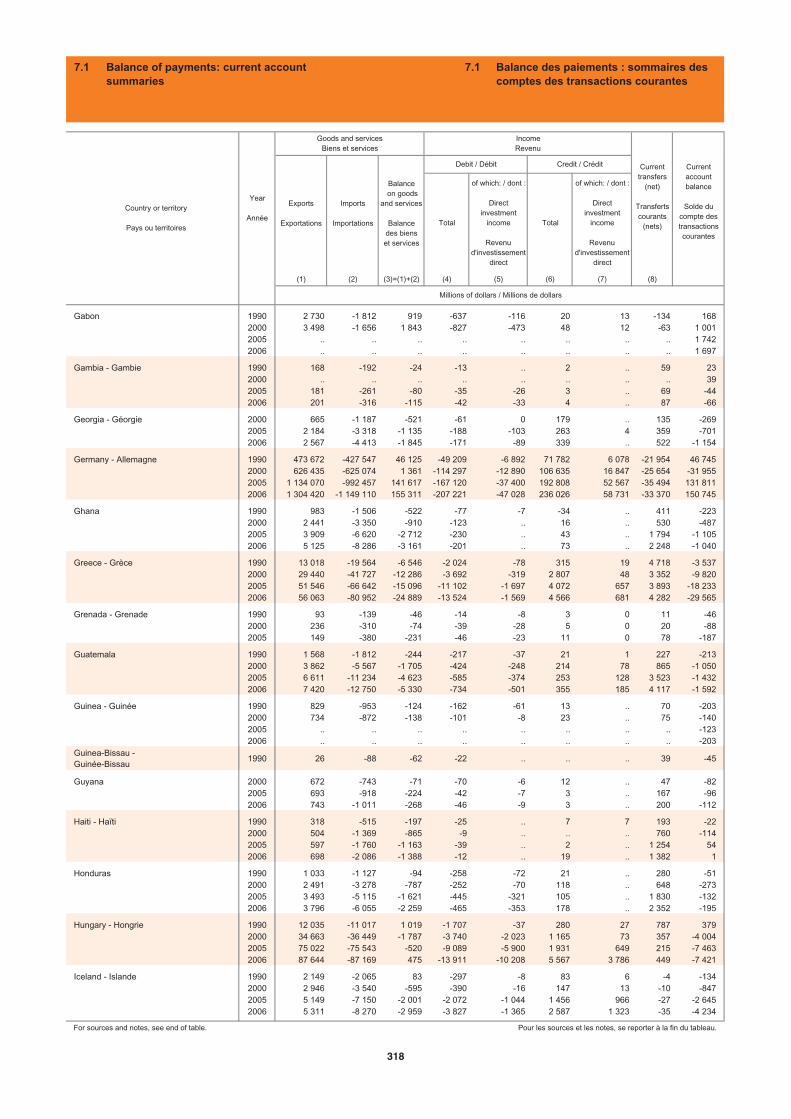
Total
of which: / dont :
Directinvestment
income
Revenud'investissement
direct
Total
of which: / dont :
Directinvestment
income
Revenud'investissement
direct
(1) (2) (3)=(1)+(2) (4) (5) (6) (7) (8)
Gabon 1990 2 730 -1 812 919 -637 -116 20 13 -134 1682000 3 498 -1 656 1 843 -827 -473 48 12 -63 1 0012005 .. .. .. .. .. .. .. .. 1 7422006 .. .. .. .. .. .. .. .. 1 697
Gambia - Gambie 1990 168 -192 -24 -13 .. 2 .. 59 232000 .. .. .. .. .. .. .. .. 392005 181 -261 -80 -35 -26 3 .. 69 -442006 201 -316 -115 -42 -33 4 .. 87 -66
Georgia - Géorgie 2000 665 -1 187 -521 -61 0 179 .. 135 -2692005 2 184 -3 318 -1 135 -188 -103 263 4 359 -7012006 2 567 -4 413 -1 845 -171 -89 339 .. 522 -1 154
Germany - Allemagne 1990 473 672 -427 547 46 125 -49 209 -6 892 71 782 6 078 -21 954 46 7452000 626 435 -625 074 1 361 -114 297 -12 890 106 635 16 847 -25 654 -31 9552005 1 134 070 -992 457 141 617 -167 120 -37 400 192 808 52 567 -35 494 131 8112006 1 304 420 -1 149 110 155 311 -207 221 -47 028 236 026 58 731 -33 370 150 745
Ghana 1990 983 -1 506 -522 -77 -7 -34 .. 411 -2232000 2 441 -3 350 -910 -123 .. 16 .. 530 -4872005 3 909 -6 620 -2 712 -230 .. 43 .. 1 794 -1 1052006 5 125 -8 286 -3 161 -201 .. 73 .. 2 248 -1 040
Greece - Grèce 1990 13 018 -19 564 -6 546 -2 024 -78 315 19 4 718 -3 5372000 29 440 -41 727 -12 286 -3 692 -319 2 807 48 3 352 -9 8202005 51 546 -66 642 -15 096 -11 102 -1 697 4 072 657 3 893 -18 2332006 56 063 -80 952 -24 889 -13 524 -1 569 4 566 681 4 282 -29 565
Grenada - Grenade 1990 93 -139 -46 -14 -8 3 0 11 -462000 236 -310 -74 -39 -28 5 0 20 -882005 149 -380 -231 -46 -23 11 0 78 -187
Guatemala 1990 1 568 -1 812 -244 -217 -37 21 1 227 -2132000 3 862 -5 567 -1 705 -424 -248 214 78 865 -1 0502005 6 611 -11 234 -4 623 -585 -374 253 128 3 523 -1 4322006 7 420 -12 750 -5 330 -734 -501 355 185 4 117 -1 592
Guinea - Guinée 1990 829 -953 -124 -162 -61 13 .. 70 -2032000 734 -872 -138 -101 -8 23 .. 75 -1402005 .. .. .. .. .. .. .. .. -1232006 .. .. .. .. .. .. .. .. -203
Guinea-Bissau -Guinée-Bissau
1990 26 -88 -62 -22 .. .. .. 39 -45
Guyana 2000 672 -743 -71 -70 -6 12 .. 47 -822005 693 -918 -224 -42 -7 3 .. 167 -962006 743 -1 011 -268 -46 -9 3 .. 200 -112
Haiti - Haïti 1990 318 -515 -197 -25 .. 7 7 193 -222000 504 -1 369 -865 -9 .. .. .. 760 -1142005 597 -1 760 -1 163 -39 .. 2 .. 1 254 542006 698 -2 086 -1 388 -12 .. 19 .. 1 382 1
Honduras 1990 1 033 -1 127 -94 -258 -72 21 .. 280 -512000 2 491 -3 278 -787 -252 -70 118 .. 648 -2732005 3 493 -5 115 -1 621 -445 -321 105 .. 1 830 -1322006 3 796 -6 055 -2 259 -465 -353 178 .. 2 352 -195
Hungary - Hongrie 1990 12 035 -11 017 1 019 -1 707 -37 280 27 787 3792000 34 663 -36 449 -1 787 -3 740 -2 023 1 165 73 357 -4 0042005 75 022 -75 543 -520 -9 089 -5 900 1 931 649 215 -7 4632006 87 644 -87 169 475 -13 911 -10 208 5 567 3 786 449 -7 421
Iceland - Islande 1990 2 149 -2 065 83 -297 -8 83 6 -4 -1342000 2 946 -3 540 -595 -390 -16 147 13 -10 -8472005 5 149 -7 150 -2 001 -2 072 -1 044 1 456 966 -27 -2 6452006 5 311 -8 270 -2 959 -3 827 -1 365 2 587 1 323 -35 -4 234
For sources and notes, see end of table. Pour les sources et les notes, se reporter à la fin du tableau.
Balance on goods
and services
Balancedes bienset services
Debit / Débit Credit / Crédit
Millions of dollars / Millions de dollars
Country or territory
Pays ou territoires
Year
Année
Goods and servicesBiens et services
IncomeRevenu
Currenttransfers
(net)
Transfertscourants
(nets)
Currentaccountbalance
Solde du compte des transactionscourantes
Exports
Exportations
Imports
Importations
7.1 Balance of payments: current account summaries
7.1 Balance des paiements : sommaires des comptes des transactions courantes
318
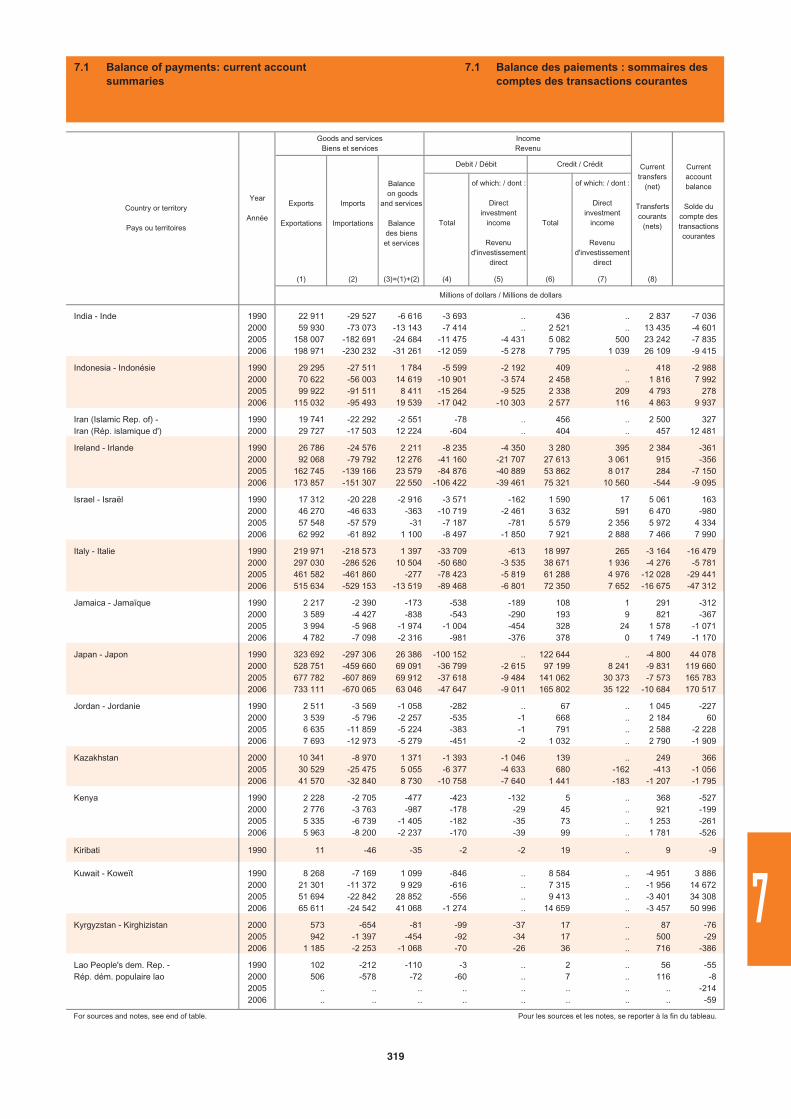
Total
of which: / dont :
Directinvestment
income
Revenud'investissement
direct
Total
of which: / dont :
Directinvestment
income
Revenud'investissement
direct
(1) (2) (3)=(1)+(2) (4) (5) (6) (7) (8)
India - Inde 1990 22 911 -29 527 -6 616 -3 693 .. 436 .. 2 837 -7 0362000 59 930 -73 073 -13 143 -7 414 .. 2 521 .. 13 435 -4 6012005 158 007 -182 691 -24 684 -11 475 -4 431 5 082 500 23 242 -7 8352006 198 971 -230 232 -31 261 -12 059 -5 278 7 795 1 039 26 109 -9 415
Indonesia - Indonésie 1990 29 295 -27 511 1 784 -5 599 -2 192 409 .. 418 -2 9882000 70 622 -56 003 14 619 -10 901 -3 574 2 458 .. 1 816 7 9922005 99 922 -91 511 8 411 -15 264 -9 525 2 338 209 4 793 2782006 115 032 -95 493 19 539 -17 042 -10 303 2 577 116 4 863 9 937
Iran (Islamic Rep. of) - 1990 19 741 -22 292 -2 551 -78 .. 456 .. 2 500 327Iran (Rép. islamique d') 2000 29 727 -17 503 12 224 -604 .. 404 .. 457 12 481
Ireland - Irlande 1990 26 786 -24 576 2 211 -8 235 -4 350 3 280 395 2 384 -3612000 92 068 -79 792 12 276 -41 160 -21 707 27 613 3 061 915 -3562005 162 745 -139 166 23 579 -84 876 -40 889 53 862 8 017 284 -7 1502006 173 857 -151 307 22 550 -106 422 -39 461 75 321 10 560 -544 -9 095
Israel - Israël 1990 17 312 -20 228 -2 916 -3 571 -162 1 590 17 5 061 1632000 46 270 -46 633 -363 -10 719 -2 461 3 632 591 6 470 -9802005 57 548 -57 579 -31 -7 187 -781 5 579 2 356 5 972 4 3342006 62 992 -61 892 1 100 -8 497 -1 850 7 921 2 888 7 466 7 990
Italy - Italie 1990 219 971 -218 573 1 397 -33 709 -613 18 997 265 -3 164 -16 4792000 297 030 -286 526 10 504 -50 680 -3 535 38 671 1 936 -4 276 -5 7812005 461 582 -461 860 -277 -78 423 -5 819 61 288 4 976 -12 028 -29 4412006 515 634 -529 153 -13 519 -89 468 -6 801 72 350 7 652 -16 675 -47 312
Jamaica - Jamaïque 1990 2 217 -2 390 -173 -538 -189 108 1 291 -3122000 3 589 -4 427 -838 -543 -290 193 9 821 -3672005 3 994 -5 968 -1 974 -1 004 -454 328 24 1 578 -1 0712006 4 782 -7 098 -2 316 -981 -376 378 0 1 749 -1 170
Japan - Japon 1990 323 692 -297 306 26 386 -100 152 .. 122 644 .. -4 800 44 0782000 528 751 -459 660 69 091 -36 799 -2 615 97 199 8 241 -9 831 119 6602005 677 782 -607 869 69 912 -37 618 -9 484 141 062 30 373 -7 573 165 7832006 733 111 -670 065 63 046 -47 647 -9 011 165 802 35 122 -10 684 170 517
Jordan - Jordanie 1990 2 511 -3 569 -1 058 -282 .. 67 .. 1 045 -2272000 3 539 -5 796 -2 257 -535 -1 668 .. 2 184 602005 6 635 -11 859 -5 224 -383 -1 791 .. 2 588 -2 2282006 7 693 -12 973 -5 279 -451 -2 1 032 .. 2 790 -1 909
Kazakhstan 2000 10 341 -8 970 1 371 -1 393 -1 046 139 .. 249 3662005 30 529 -25 475 5 055 -6 377 -4 633 680 -162 -413 -1 0562006 41 570 -32 840 8 730 -10 758 -7 640 1 441 -183 -1 207 -1 795
Kenya 1990 2 228 -2 705 -477 -423 -132 5 .. 368 -5272000 2 776 -3 763 -987 -178 -29 45 .. 921 -1992005 5 335 -6 739 -1 405 -182 -35 73 .. 1 253 -2612006 5 963 -8 200 -2 237 -170 -39 99 .. 1 781 -526
Kiribati 1990 11 -46 -35 -2 -2 19 .. 9 -9
Kuwait - Koweït 1990 8 268 -7 169 1 099 -846 .. 8 584 .. -4 951 3 8862000 21 301 -11 372 9 929 -616 .. 7 315 .. -1 956 14 6722005 51 694 -22 842 28 852 -556 .. 9 413 .. -3 401 34 3082006 65 611 -24 542 41 068 -1 274 .. 14 659 .. -3 457 50 996
Kyrgyzstan - Kirghizistan 2000 573 -654 -81 -99 -37 17 .. 87 -762005 942 -1 397 -454 -92 -34 17 .. 500 -292006 1 185 -2 253 -1 068 -70 -26 36 .. 716 -386
Lao People's dem. Rep. - 1990 102 -212 -110 -3 .. 2 .. 56 -55Rép. dém. populaire lao 2000 506 -578 -72 -60 .. 7 .. 116 -8
2005 .. .. .. .. .. .. .. .. -2142006 .. .. .. .. .. .. .. .. -59
For sources and notes, see end of table. Pour les sources et les notes, se reporter à la fin du tableau.
Balance on goods
and services
Balancedes bienset services
Debit / Débit Credit / Crédit
Millions of dollars / Millions de dollars
Country or territory
Pays ou territoires
Year
Année
Goods and servicesBiens et services
IncomeRevenu
Currenttransfers
(net)
Transfertscourants
(nets)
Currentaccountbalance
Solde du compte des transactionscourantes
Exports
Exportations
Imports
Importations
7.1 Balance of payments: current account summaries
7.1 Balance des paiements : sommaires des comptes des transactions courantes
319
7
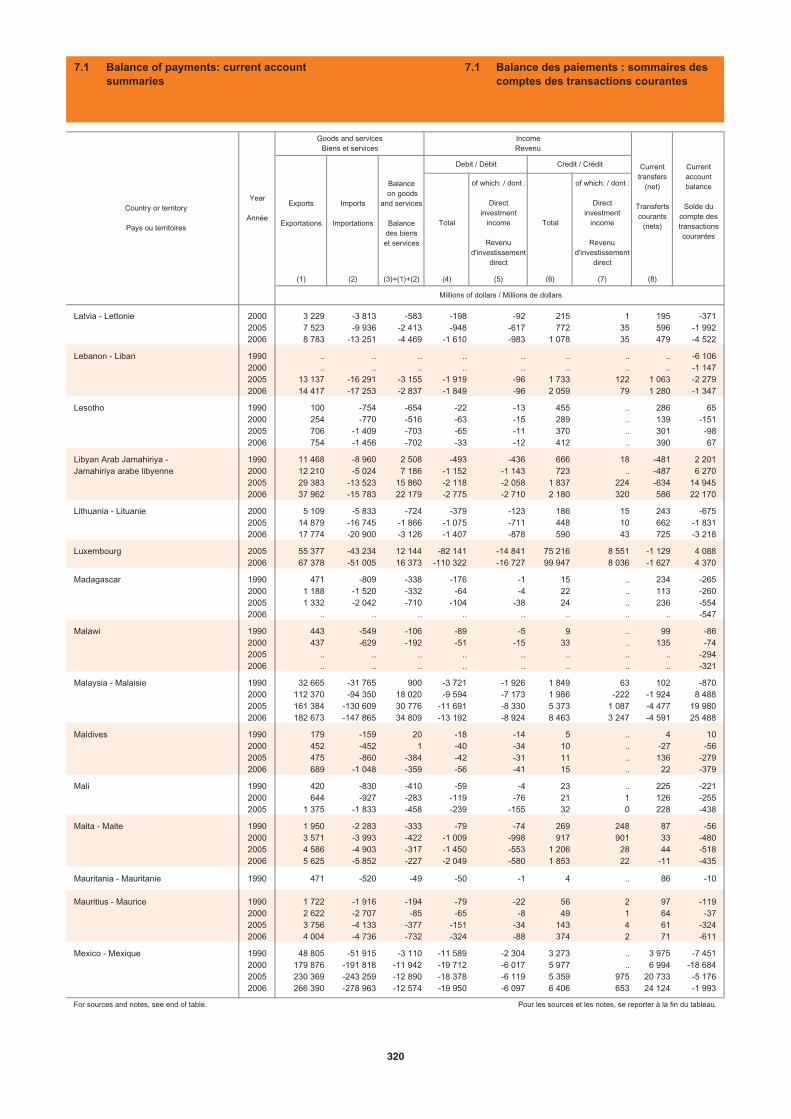
Total
of which: / dont :
Directinvestment
income
Revenud'investissement
direct
Total
of which: / dont :
Directinvestment
income
Revenud'investissement
direct
(1) (2) (3)=(1)+(2) (4) (5) (6) (7) (8)
Latvia - Lettonie 2000 3 229 -3 813 -583 -198 -92 215 1 195 -3712005 7 523 -9 936 -2 413 -948 -617 772 35 596 -1 9922006 8 783 -13 251 -4 469 -1 610 -983 1 078 35 479 -4 522
Lebanon - Liban 1990 .. .. .. .. .. .. .. .. -6 1062000 .. .. .. .. .. .. .. .. -1 1472005 13 137 -16 291 -3 155 -1 919 -96 1 733 122 1 063 -2 2792006 14 417 -17 253 -2 837 -1 849 -96 2 059 79 1 280 -1 347
Lesotho 1990 100 -754 -654 -22 -13 455 .. 286 652000 254 -770 -516 -63 -15 289 .. 139 -1512005 706 -1 409 -703 -65 -11 370 .. 301 -982006 754 -1 456 -702 -33 -12 412 .. 390 67
Libyan Arab Jamahiriya - 1990 11 468 -8 960 2 508 -493 -436 666 18 -481 2 201Jamahiriya arabe libyenne 2000 12 210 -5 024 7 186 -1 152 -1 143 723 .. -487 6 270
2005 29 383 -13 523 15 860 -2 118 -2 058 1 837 224 -634 14 9452006 37 962 -15 783 22 179 -2 775 -2 710 2 180 320 586 22 170
Lithuania - Lituanie 2000 5 109 -5 833 -724 -379 -123 186 15 243 -6752005 14 879 -16 745 -1 866 -1 075 -711 448 10 662 -1 8312006 17 774 -20 900 -3 126 -1 407 -878 590 43 725 -3 218
Luxembourg 2005 55 377 -43 234 12 144 -82 141 -14 841 75 216 8 551 -1 129 4 0882006 67 378 -51 005 16 373 -110 322 -16 727 99 947 8 036 -1 627 4 370
Madagascar 1990 471 -809 -338 -176 -1 15 .. 234 -2652000 1 188 -1 520 -332 -64 -4 22 .. 113 -2602005 1 332 -2 042 -710 -104 -38 24 .. 236 -5542006 .. .. .. .. .. .. .. .. -547
Malawi 1990 443 -549 -106 -89 -5 9 .. 99 -862000 437 -629 -192 -51 -15 33 .. 135 -742005 .. .. .. .. .. .. .. .. -2942006 .. .. .. .. .. .. .. .. -321
Malaysia - Malaisie 1990 32 665 -31 765 900 -3 721 -1 926 1 849 63 102 -8702000 112 370 -94 350 18 020 -9 594 -7 173 1 986 -222 -1 924 8 4882005 161 384 -130 609 30 776 -11 691 -8 330 5 373 1 087 -4 477 19 9802006 182 673 -147 865 34 809 -13 192 -8 924 8 463 3 247 -4 591 25 488
Maldives 1990 179 -159 20 -18 -14 5 .. 4 102000 452 -452 1 -40 -34 10 .. -27 -562005 475 -860 -384 -42 -31 11 .. 136 -2792006 689 -1 048 -359 -56 -41 15 .. 22 -379
Mali 1990 420 -830 -410 -59 -4 23 .. 225 -2212000 644 -927 -283 -119 -76 21 1 126 -2552005 1 375 -1 833 -458 -239 -155 32 0 228 -438
Malta - Malte 1990 1 950 -2 283 -333 -79 -74 269 248 87 -562000 3 571 -3 993 -422 -1 009 -998 917 901 33 -4802005 4 586 -4 903 -317 -1 450 -553 1 206 28 44 -5182006 5 625 -5 852 -227 -2 049 -580 1 853 22 -11 -435
Mauritania - Mauritanie 1990 471 -520 -49 -50 -1 4 .. 86 -10
Mauritius - Maurice 1990 1 722 -1 916 -194 -79 -22 56 2 97 -1192000 2 622 -2 707 -85 -65 -8 49 1 64 -372005 3 756 -4 133 -377 -151 -34 143 4 61 -3242006 4 004 -4 736 -732 -324 -88 374 2 71 -611
Mexico - Mexique 1990 48 805 -51 915 -3 110 -11 589 -2 304 3 273 .. 3 975 -7 4512000 179 876 -191 818 -11 942 -19 712 -6 017 5 977 .. 6 994 -18 6842005 230 369 -243 259 -12 890 -18 378 -6 119 5 359 975 20 733 -5 1762006 266 390 -278 963 -12 574 -19 950 -6 097 6 406 653 24 124 -1 993
For sources and notes, see end of table. Pour les sources et les notes, se reporter à la fin du tableau.
Balance on goods
and services
Balancedes bienset services
Debit / Débit Credit / Crédit
Millions of dollars / Millions de dollars
Country or territory
Pays ou territoires
Year
Année
Goods and servicesBiens et services
IncomeRevenu
Currenttransfers
(net)
Transfertscourants
(nets)
Currentaccountbalance
Solde du compte des transactionscourantes
Exports
Exportations
Imports
Importations
7.1 Balance of payments: current account summaries
7.1 Balance des paiements : sommaires des comptes des transactions courantes
320
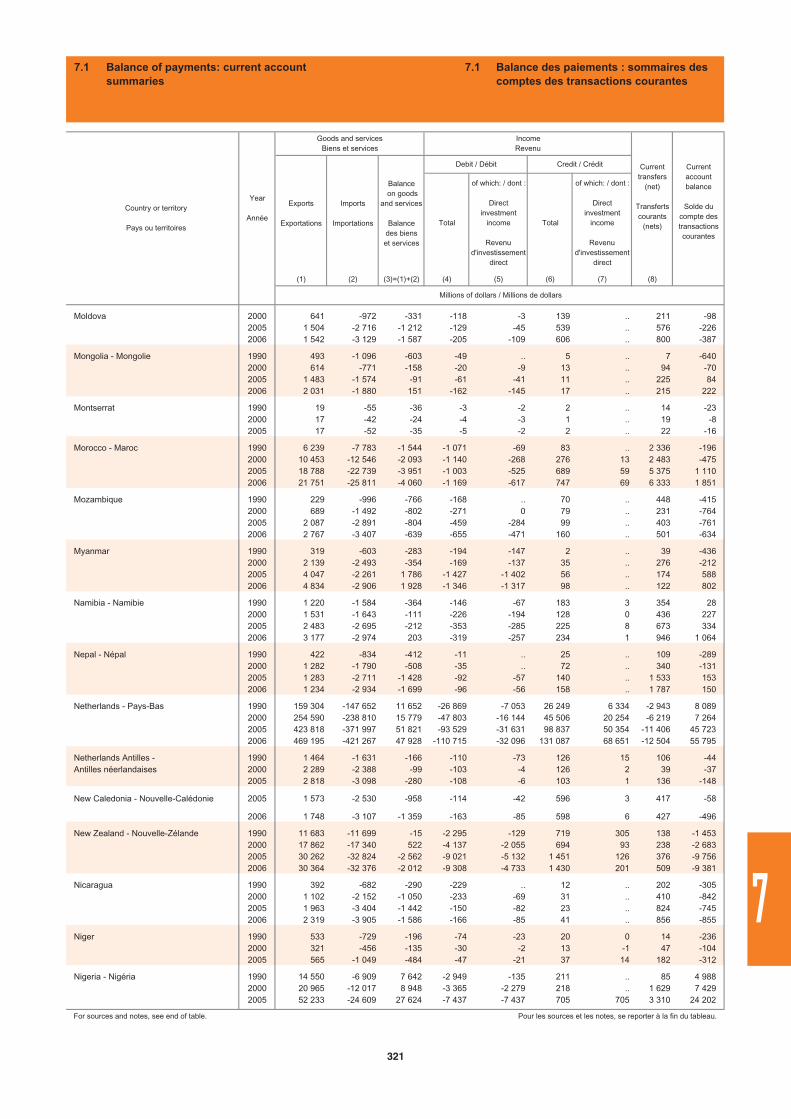
Total
of which: / dont :
Directinvestment
income
Revenud'investissement
direct
Total
of which: / dont :
Directinvestment
income
Revenud'investissement
direct
(1) (2) (3)=(1)+(2) (4) (5) (6) (7) (8)
Moldova 2000 641 -972 -331 -118 -3 139 .. 211 -982005 1 504 -2 716 -1 212 -129 -45 539 .. 576 -2262006 1 542 -3 129 -1 587 -205 -109 606 .. 800 -387
Mongolia - Mongolie 1990 493 -1 096 -603 -49 .. 5 .. 7 -6402000 614 -771 -158 -20 -9 13 .. 94 -702005 1 483 -1 574 -91 -61 -41 11 .. 225 842006 2 031 -1 880 151 -162 -145 17 .. 215 222
Montserrat 1990 19 -55 -36 -3 -2 2 .. 14 -232000 17 -42 -24 -4 -3 1 .. 19 -82005 17 -52 -35 -5 -2 2 .. 22 -16
Morocco - Maroc 1990 6 239 -7 783 -1 544 -1 071 -69 83 .. 2 336 -1962000 10 453 -12 546 -2 093 -1 140 -268 276 13 2 483 -4752005 18 788 -22 739 -3 951 -1 003 -525 689 59 5 375 1 1102006 21 751 -25 811 -4 060 -1 169 -617 747 69 6 333 1 851
Mozambique 1990 229 -996 -766 -168 .. 70 .. 448 -4152000 689 -1 492 -802 -271 0 79 .. 231 -7642005 2 087 -2 891 -804 -459 -284 99 .. 403 -7612006 2 767 -3 407 -639 -655 -471 160 .. 501 -634
Myanmar 1990 319 -603 -283 -194 -147 2 .. 39 -4362000 2 139 -2 493 -354 -169 -137 35 .. 276 -2122005 4 047 -2 261 1 786 -1 427 -1 402 56 .. 174 5882006 4 834 -2 906 1 928 -1 346 -1 317 98 .. 122 802
Namibia - Namibie 1990 1 220 -1 584 -364 -146 -67 183 3 354 282000 1 531 -1 643 -111 -226 -194 128 0 436 2272005 2 483 -2 695 -212 -353 -285 225 8 673 3342006 3 177 -2 974 203 -319 -257 234 1 946 1 064
Nepal - Népal 1990 422 -834 -412 -11 .. 25 .. 109 -2892000 1 282 -1 790 -508 -35 .. 72 .. 340 -1312005 1 283 -2 711 -1 428 -92 -57 140 .. 1 533 1532006 1 234 -2 934 -1 699 -96 -56 158 .. 1 787 150
Netherlands - Pays-Bas 1990 159 304 -147 652 11 652 -26 869 -7 053 26 249 6 334 -2 943 8 0892000 254 590 -238 810 15 779 -47 803 -16 144 45 506 20 254 -6 219 7 2642005 423 818 -371 997 51 821 -93 529 -31 631 98 837 50 354 -11 406 45 7232006 469 195 -421 267 47 928 -110 715 -32 096 131 087 68 651 -12 504 55 795
Netherlands Antilles - 1990 1 464 -1 631 -166 -110 -73 126 15 106 -44Antilles néerlandaises 2000 2 289 -2 388 -99 -103 -4 126 2 39 -37
2005 2 818 -3 098 -280 -108 -6 103 1 136 -148
New Caledonia - Nouvelle-Calédonie 2005 1 573 -2 530 -958 -114 -42 596 3 417 -58
2006 1 748 -3 107 -1 359 -163 -85 598 6 427 -496
New Zealand - Nouvelle-Zélande 1990 11 683 -11 699 -15 -2 295 -129 719 305 138 -1 4532000 17 862 -17 340 522 -4 137 -2 055 694 93 238 -2 6832005 30 262 -32 824 -2 562 -9 021 -5 132 1 451 126 376 -9 7562006 30 364 -32 376 -2 012 -9 308 -4 733 1 430 201 509 -9 381
Nicaragua 1990 392 -682 -290 -229 .. 12 .. 202 -3052000 1 102 -2 152 -1 050 -233 -69 31 .. 410 -8422005 1 963 -3 404 -1 442 -150 -82 23 .. 824 -7452006 2 319 -3 905 -1 586 -166 -85 41 .. 856 -855
Niger 1990 533 -729 -196 -74 -23 20 0 14 -2362000 321 -456 -135 -30 -2 13 -1 47 -1042005 565 -1 049 -484 -47 -21 37 14 182 -312
Nigeria - Nigéria 1990 14 550 -6 909 7 642 -2 949 -135 211 .. 85 4 9882000 20 965 -12 017 8 948 -3 365 -2 279 218 .. 1 629 7 4292005 52 233 -24 609 27 624 -7 437 -7 437 705 705 3 310 24 202
For sources and notes, see end of table. Pour les sources et les notes, se reporter à la fin du tableau.
Balance on goods
and services
Balancedes bienset services
Debit / Débit Credit / Crédit
Millions of dollars / Millions de dollars
Country or territory
Pays ou territoires
Year
Année
Goods and servicesBiens et services
IncomeRevenu
Currenttransfers
(net)
Transfertscourants
(nets)
Currentaccountbalance
Solde du compte des transactionscourantes
Exports
Exportations
Imports
Importations
7.1 Balance of payments: current account summaries
7.1 Balance des paiements : sommaires des comptes des transactions courantes
321
7
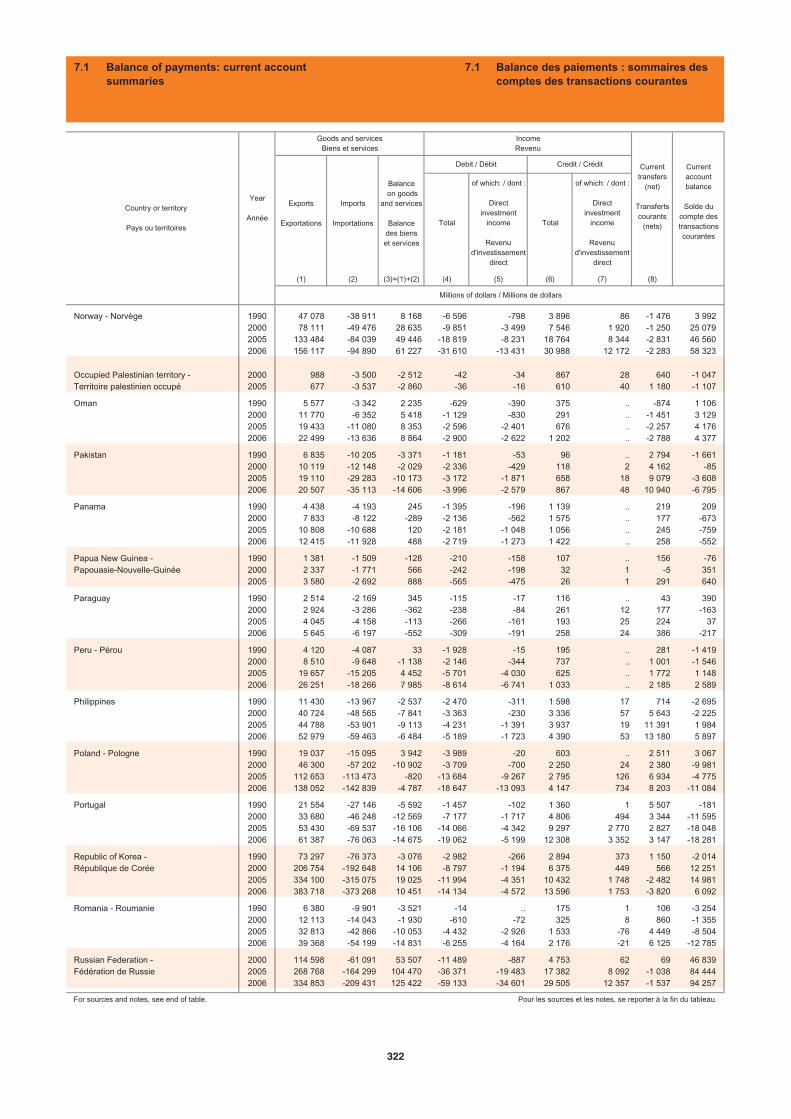
Total
of which: / dont :
Directinvestment
income
Revenud'investissement
direct
Total
of which: / dont :
Directinvestment
income
Revenud'investissement
direct
(1) (2) (3)=(1)+(2) (4) (5) (6) (7) (8)
Norway - Norvège 1990 47 078 -38 911 8 168 -6 596 -798 3 896 86 -1 476 3 9922000 78 111 -49 476 28 635 -9 851 -3 499 7 546 1 920 -1 250 25 0792005 133 484 -84 039 49 446 -18 819 -8 231 18 764 8 344 -2 831 46 5602006 156 117 -94 890 61 227 -31 610 -13 431 30 988 12 172 -2 283 58 323
Occupied Palestinian territory - 2000 988 -3 500 -2 512 -42 -34 867 28 640 -1 047Territoire palestinien occupé 2005 677 -3 537 -2 860 -36 -16 610 40 1 180 -1 107
Oman 1990 5 577 -3 342 2 235 -629 -390 375 .. -874 1 1062000 11 770 -6 352 5 418 -1 129 -830 291 .. -1 451 3 1292005 19 433 -11 080 8 353 -2 596 -2 401 676 .. -2 257 4 1762006 22 499 -13 636 8 864 -2 900 -2 622 1 202 .. -2 788 4 377
Pakistan 1990 6 835 -10 205 -3 371 -1 181 -53 96 .. 2 794 -1 6612000 10 119 -12 148 -2 029 -2 336 -429 118 2 4 162 -852005 19 110 -29 283 -10 173 -3 172 -1 871 658 18 9 079 -3 6082006 20 507 -35 113 -14 606 -3 996 -2 579 867 48 10 940 -6 795
Panama 1990 4 438 -4 193 245 -1 395 -196 1 139 .. 219 2092000 7 833 -8 122 -289 -2 136 -562 1 575 .. 177 -6732005 10 808 -10 688 120 -2 181 -1 048 1 056 .. 245 -7592006 12 415 -11 928 488 -2 719 -1 273 1 422 .. 258 -552
Papua New Guinea - 1990 1 381 -1 509 -128 -210 -158 107 .. 156 -76Papouasie-Nouvelle-Guinée 2000 2 337 -1 771 566 -242 -198 32 1 -5 351
2005 3 580 -2 692 888 -565 -475 26 1 291 640
Paraguay 1990 2 514 -2 169 345 -115 -17 116 .. 43 3902000 2 924 -3 286 -362 -238 -84 261 12 177 -1632005 4 045 -4 158 -113 -266 -161 193 25 224 372006 5 645 -6 197 -552 -309 -191 258 24 386 -217
Peru - Pérou 1990 4 120 -4 087 33 -1 928 -15 195 .. 281 -1 4192000 8 510 -9 648 -1 138 -2 146 -344 737 .. 1 001 -1 5462005 19 657 -15 205 4 452 -5 701 -4 030 625 .. 1 772 1 1482006 26 251 -18 266 7 985 -8 614 -6 741 1 033 .. 2 185 2 589
Philippines 1990 11 430 -13 967 -2 537 -2 470 -311 1 598 17 714 -2 6952000 40 724 -48 565 -7 841 -3 363 -230 3 336 57 5 643 -2 2252005 44 788 -53 901 -9 113 -4 231 -1 391 3 937 19 11 391 1 9842006 52 979 -59 463 -6 484 -5 189 -1 723 4 390 53 13 180 5 897
Poland - Pologne 1990 19 037 -15 095 3 942 -3 989 -20 603 .. 2 511 3 0672000 46 300 -57 202 -10 902 -3 709 -700 2 250 24 2 380 -9 9812005 112 653 -113 473 -820 -13 684 -9 267 2 795 126 6 934 -4 7752006 138 052 -142 839 -4 787 -18 647 -13 093 4 147 734 8 203 -11 084
Portugal 1990 21 554 -27 146 -5 592 -1 457 -102 1 360 1 5 507 -1812000 33 680 -46 248 -12 569 -7 177 -1 717 4 806 494 3 344 -11 5952005 53 430 -69 537 -16 106 -14 066 -4 342 9 297 2 770 2 827 -18 0482006 61 387 -76 063 -14 675 -19 062 -5 199 12 308 3 352 3 147 -18 281
Republic of Korea - 1990 73 297 -76 373 -3 076 -2 982 -266 2 894 373 1 150 -2 014République de Corée 2000 206 754 -192 648 14 106 -8 797 -1 194 6 375 449 566 12 251
2005 334 100 -315 075 19 025 -11 994 -4 351 10 432 1 748 -2 482 14 9812006 383 718 -373 268 10 451 -14 134 -4 572 13 596 1 753 -3 820 6 092
Romania - Roumanie 1990 6 380 -9 901 -3 521 -14 .. 175 1 106 -3 2542000 12 113 -14 043 -1 930 -610 -72 325 8 860 -1 3552005 32 813 -42 866 -10 053 -4 432 -2 926 1 533 -76 4 449 -8 5042006 39 368 -54 199 -14 831 -6 255 -4 164 2 176 -21 6 125 -12 785
Russian Federation - 2000 114 598 -61 091 53 507 -11 489 -887 4 753 62 69 46 839Fédération de Russie 2005 268 768 -164 299 104 470 -36 371 -19 483 17 382 8 092 -1 038 84 444
2006 334 853 -209 431 125 422 -59 133 -34 601 29 505 12 357 -1 537 94 257
For sources and notes, see end of table. Pour les sources et les notes, se reporter à la fin du tableau.
Balance on goods
and services
Balancedes bienset services
Debit / Débit Credit / Crédit
Millions of dollars / Millions de dollars
Country or territory
Pays ou territoires
Year
Année
Goods and servicesBiens et services
IncomeRevenu
Currenttransfers
(net)
Transfertscourants
(nets)
Currentaccountbalance
Solde du compte des transactionscourantes
Exports
Exportations
Imports
Importations
7.1 Balance of payments: current account summaries
7.1 Balance des paiements : sommaires des comptes des transactions courantes
322
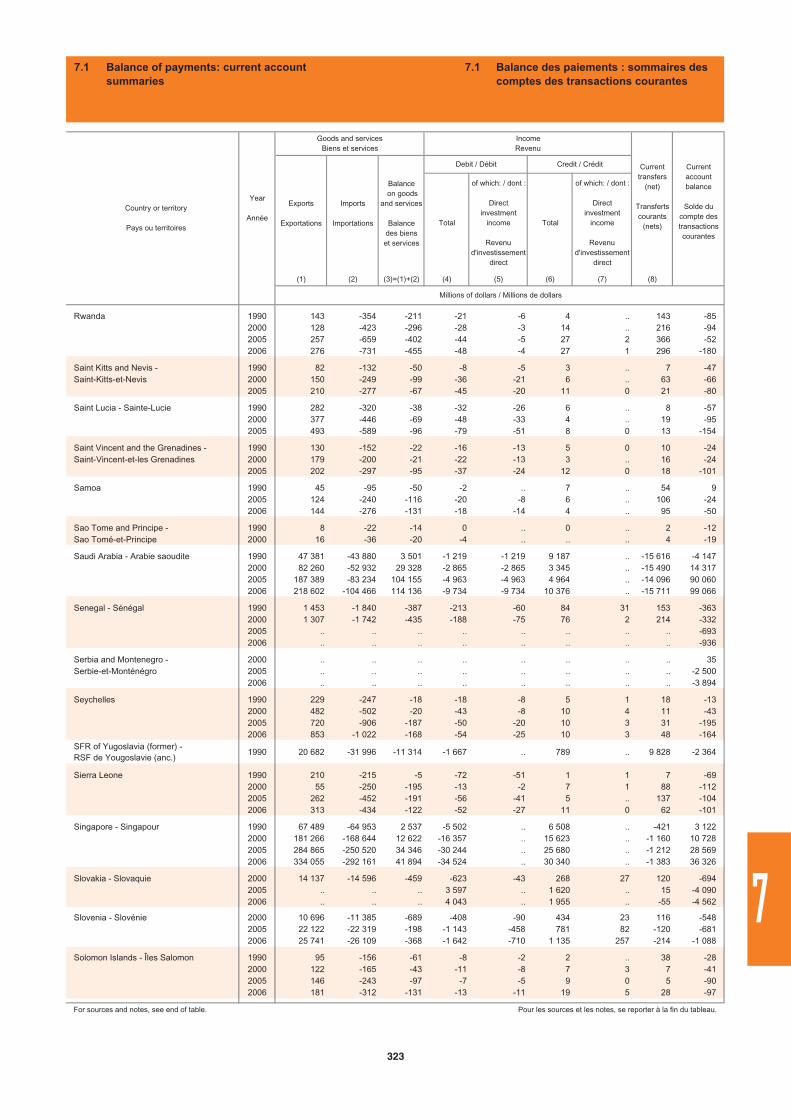
Total
of which: / dont :
Directinvestment
income
Revenud'investissement
direct
Total
of which: / dont :
Directinvestment
income
Revenud'investissement
direct
(1) (2) (3)=(1)+(2) (4) (5) (6) (7) (8)
Rwanda 1990 143 -354 -211 -21 -6 4 .. 143 -852000 128 -423 -296 -28 -3 14 .. 216 -942005 257 -659 -402 -44 -5 27 2 366 -522006 276 -731 -455 -48 -4 27 1 296 -180
Saint Kitts and Nevis - 1990 82 -132 -50 -8 -5 3 .. 7 -47Saint-Kitts-et-Nevis 2000 150 -249 -99 -36 -21 6 .. 63 -66
2005 210 -277 -67 -45 -20 11 0 21 -80
Saint Lucia - Sainte-Lucie 1990 282 -320 -38 -32 -26 6 .. 8 -572000 377 -446 -69 -48 -33 4 .. 19 -952005 493 -589 -96 -79 -51 8 0 13 -154
Saint Vincent and the Grenadines - 1990 130 -152 -22 -16 -13 5 0 10 -24Saint-Vincent-et-les Grenadines 2000 179 -200 -21 -22 -13 3 .. 16 -24
2005 202 -297 -95 -37 -24 12 0 18 -101
Samoa 1990 45 -95 -50 -2 .. 7 .. 54 92005 124 -240 -116 -20 -8 6 .. 106 -242006 144 -276 -131 -18 -14 4 .. 95 -50
Sao Tome and Principe - 1990 8 -22 -14 0 .. 0 .. 2 -12Sao Tomé-et-Principe 2000 16 -36 -20 -4 .. .. .. 4 -19
Saudi Arabia - Arabie saoudite 1990 47 381 -43 880 3 501 -1 219 -1 219 9 187 .. -15 616 -4 1472000 82 260 -52 932 29 328 -2 865 -2 865 3 345 .. -15 490 14 3172005 187 389 -83 234 104 155 -4 963 -4 963 4 964 .. -14 096 90 0602006 218 602 -104 466 114 136 -9 734 -9 734 10 376 .. -15 711 99 066
Senegal - Sénégal 1990 1 453 -1 840 -387 -213 -60 84 31 153 -3632000 1 307 -1 742 -435 -188 -75 76 2 214 -3322005 .. .. .. .. .. .. .. .. -6932006 .. .. .. .. .. .. .. .. -936
Serbia and Montenegro - 2000 .. .. .. .. .. .. .. .. 35Serbie-et-Monténégro 2005 .. .. .. .. .. .. .. .. -2 500
2006 .. .. .. .. .. .. .. .. -3 894
Seychelles 1990 229 -247 -18 -18 -8 5 1 18 -132000 482 -502 -20 -43 -8 10 4 11 -432005 720 -906 -187 -50 -20 10 3 31 -1952006 853 -1 022 -168 -54 -25 10 3 48 -164
SFR of Yugoslavia (former) - RSF de Yougoslavie (anc.)
1990 20 682 -31 996 -11 314 -1 667 .. 789 .. 9 828 -2 364
Sierra Leone 1990 210 -215 -5 -72 -51 1 1 7 -692000 55 -250 -195 -13 -2 7 1 88 -1122005 262 -452 -191 -56 -41 5 .. 137 -1042006 313 -434 -122 -52 -27 11 0 62 -101
Singapore - Singapour 1990 67 489 -64 953 2 537 -5 502 .. 6 508 .. -421 3 1222000 181 266 -168 644 12 622 -16 357 .. 15 623 .. -1 160 10 7282005 284 865 -250 520 34 346 -30 244 .. 25 680 .. -1 212 28 5692006 334 055 -292 161 41 894 -34 524 .. 30 340 .. -1 383 36 326
Slovakia - Slovaquie 2000 14 137 -14 596 -459 -623 -43 268 27 120 -6942005 .. .. .. 3 597 .. 1 620 .. 15 -4 0902006 .. .. .. 4 043 .. 1 955 .. -55 -4 562
Slovenia - Slovénie 2000 10 696 -11 385 -689 -408 -90 434 23 116 -5482005 22 122 -22 319 -198 -1 143 -458 781 82 -120 -6812006 25 741 -26 109 -368 -1 642 -710 1 135 257 -214 -1 088
Solomon Islands - Îles Salomon 1990 95 -156 -61 -8 -2 2 .. 38 -282000 122 -165 -43 -11 -8 7 3 7 -412005 146 -243 -97 -7 -5 9 0 5 -902006 181 -312 -131 -13 -11 19 5 28 -97
For sources and notes, see end of table. Pour les sources et les notes, se reporter à la fin du tableau.
Balance on goods
and services
Balancedes bienset services
Debit / Débit Credit / Crédit
Millions of dollars / Millions de dollars
Country or territory
Pays ou territoires
Year
Année
Goods and servicesBiens et services
IncomeRevenu
Currenttransfers
(net)
Transfertscourants
(nets)
Currentaccountbalance
Solde du compte des transactionscourantes
Exports
Exportations
Imports
Importations
7.1 Balance of payments: current account summaries
7.1 Balance des paiements : sommaires des comptes des transactions courantes
323
7
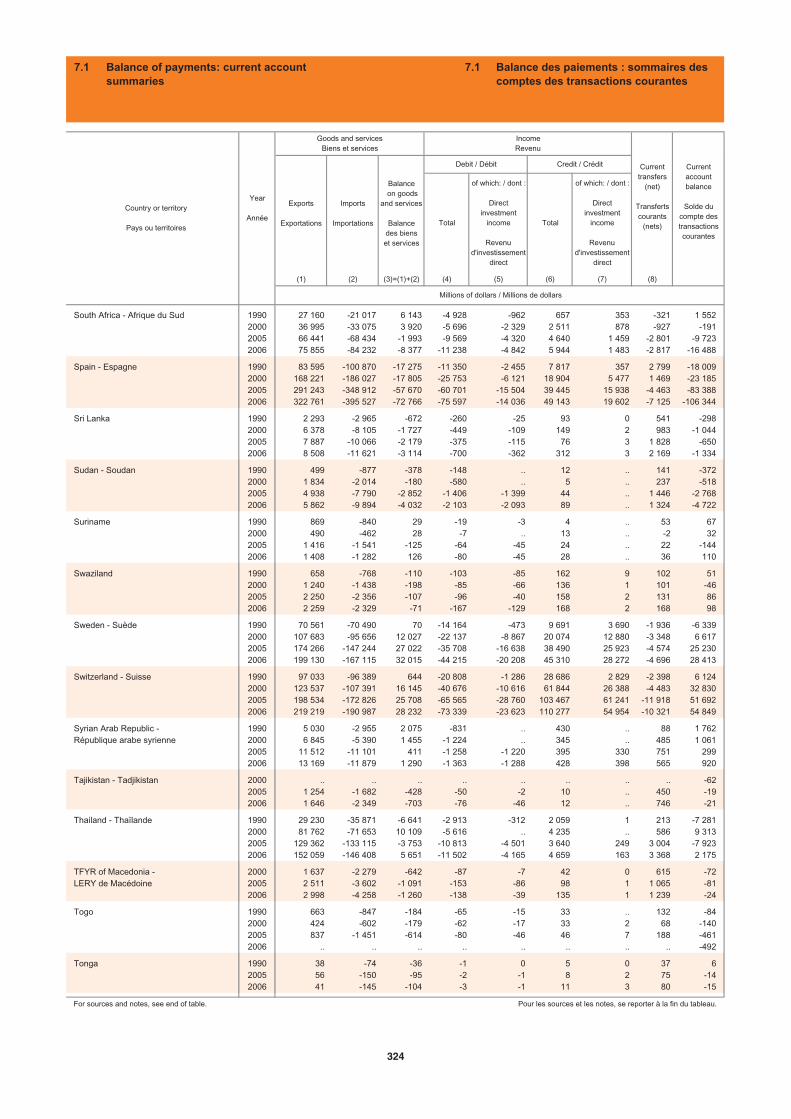
Total
of which: / dont :
Directinvestment
income
Revenud'investissement
direct
Total
of which: / dont :
Directinvestment
income
Revenud'investissement
direct
(1) (2) (3)=(1)+(2) (4) (5) (6) (7) (8)
South Africa - Afrique du Sud 1990 27 160 -21 017 6 143 -4 928 -962 657 353 -321 1 5522000 36 995 -33 075 3 920 -5 696 -2 329 2 511 878 -927 -1912005 66 441 -68 434 -1 993 -9 569 -4 320 4 640 1 459 -2 801 -9 7232006 75 855 -84 232 -8 377 -11 238 -4 842 5 944 1 483 -2 817 -16 488
Spain - Espagne 1990 83 595 -100 870 -17 275 -11 350 -2 455 7 817 357 2 799 -18 0092000 168 221 -186 027 -17 805 -25 753 -6 121 18 904 5 477 1 469 -23 1852005 291 243 -348 912 -57 670 -60 701 -15 504 39 445 15 938 -4 463 -83 3882006 322 761 -395 527 -72 766 -75 597 -14 036 49 143 19 602 -7 125 -106 344
Sri Lanka 1990 2 293 -2 965 -672 -260 -25 93 0 541 -2982000 6 378 -8 105 -1 727 -449 -109 149 2 983 -1 0442005 7 887 -10 066 -2 179 -375 -115 76 3 1 828 -6502006 8 508 -11 621 -3 114 -700 -362 312 3 2 169 -1 334
Sudan - Soudan 1990 499 -877 -378 -148 .. 12 .. 141 -3722000 1 834 -2 014 -180 -580 .. 5 .. 237 -5182005 4 938 -7 790 -2 852 -1 406 -1 399 44 .. 1 446 -2 7682006 5 862 -9 894 -4 032 -2 103 -2 093 89 .. 1 324 -4 722
Suriname 1990 869 -840 29 -19 -3 4 .. 53 672000 490 -462 28 -7 .. 13 .. -2 322005 1 416 -1 541 -125 -64 -45 24 .. 22 -1442006 1 408 -1 282 126 -80 -45 28 .. 36 110
Swaziland 1990 658 -768 -110 -103 -85 162 9 102 512000 1 240 -1 438 -198 -85 -66 136 1 101 -462005 2 250 -2 356 -107 -96 -40 158 2 131 862006 2 259 -2 329 -71 -167 -129 168 2 168 98
Sweden - Suède 1990 70 561 -70 490 70 -14 164 -473 9 691 3 690 -1 936 -6 3392000 107 683 -95 656 12 027 -22 137 -8 867 20 074 12 880 -3 348 6 6172005 174 266 -147 244 27 022 -35 708 -16 638 38 490 25 923 -4 574 25 2302006 199 130 -167 115 32 015 -44 215 -20 208 45 310 28 272 -4 696 28 413
Switzerland - Suisse 1990 97 033 -96 389 644 -20 808 -1 286 28 686 2 829 -2 398 6 1242000 123 537 -107 391 16 145 -40 676 -10 616 61 844 26 388 -4 483 32 8302005 198 534 -172 826 25 708 -65 565 -28 760 103 467 61 241 -11 918 51 6922006 219 219 -190 987 28 232 -73 339 -23 623 110 277 54 954 -10 321 54 849
Syrian Arab Republic - 1990 5 030 -2 955 2 075 -831 .. 430 .. 88 1 762République arabe syrienne 2000 6 845 -5 390 1 455 -1 224 .. 345 .. 485 1 061
2005 11 512 -11 101 411 -1 258 -1 220 395 330 751 2992006 13 169 -11 879 1 290 -1 363 -1 288 428 398 565 920
Tajikistan - Tadjikistan 2000 .. .. .. .. .. .. .. .. -622005 1 254 -1 682 -428 -50 -2 10 .. 450 -192006 1 646 -2 349 -703 -76 -46 12 .. 746 -21
Thailand - Thaïlande 1990 29 230 -35 871 -6 641 -2 913 -312 2 059 1 213 -7 2812000 81 762 -71 653 10 109 -5 616 .. 4 235 .. 586 9 3132005 129 362 -133 115 -3 753 -10 813 -4 501 3 640 249 3 004 -7 9232006 152 059 -146 408 5 651 -11 502 -4 165 4 659 163 3 368 2 175
TFYR of Macedonia - 2000 1 637 -2 279 -642 -87 -7 42 0 615 -72LERY de Macédoine 2005 2 511 -3 602 -1 091 -153 -86 98 1 1 065 -81
2006 2 998 -4 258 -1 260 -138 -39 135 1 1 239 -24
Togo 1990 663 -847 -184 -65 -15 33 .. 132 -842000 424 -602 -179 -62 -17 33 2 68 -1402005 837 -1 451 -614 -80 -46 46 7 188 -4612006 .. .. .. .. .. .. .. .. -492
Tonga 1990 38 -74 -36 -1 0 5 0 37 62005 56 -150 -95 -2 -1 8 2 75 -142006 41 -145 -104 -3 -1 11 3 80 -15
For sources and notes, see end of table. Pour les sources et les notes, se reporter à la fin du tableau.
Balance on goods
and services
Balancedes bienset services
Debit / Débit Credit / Crédit
Millions of dollars / Millions de dollars
Country or territory
Pays ou territoires
Year
Année
Goods and servicesBiens et services
IncomeRevenu
Currenttransfers
(net)
Transfertscourants
(nets)
Currentaccountbalance
Solde du compte des transactionscourantes
Exports
Exportations
Imports
Importations
7.1 Balance of payments: current account summaries
7.1 Balance des paiements : sommaires des comptes des transactions courantes
324
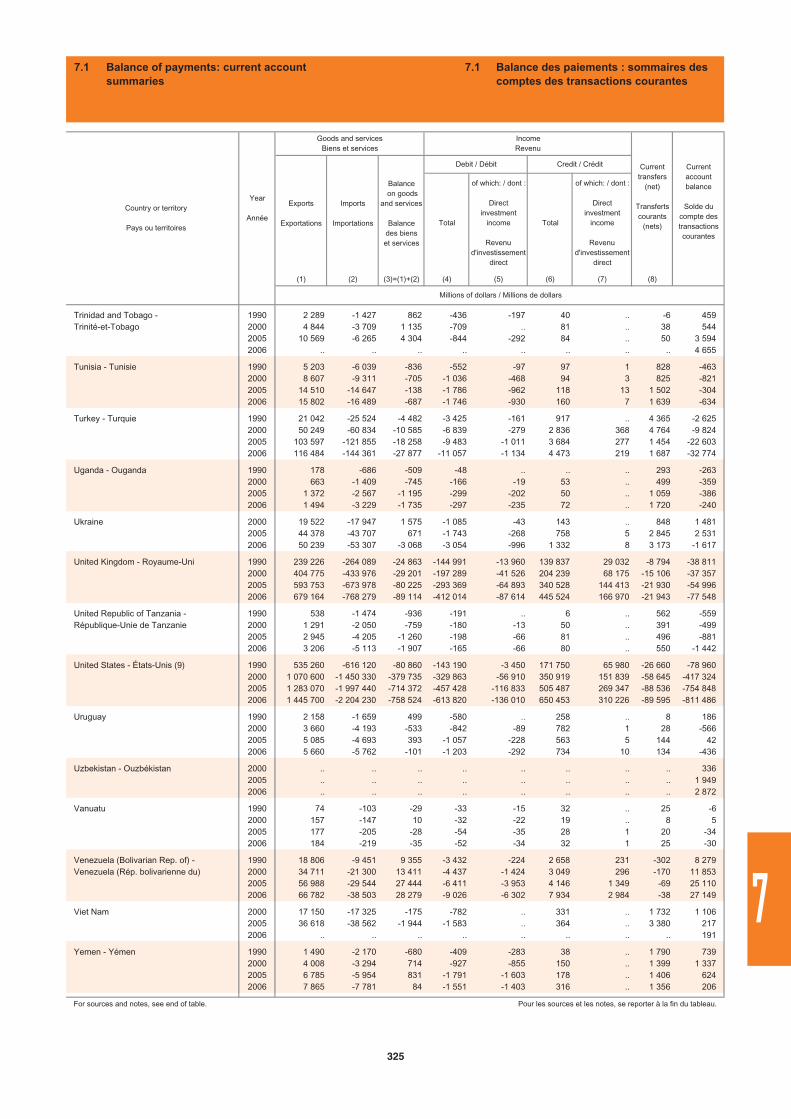
Total
of which: / dont :
Directinvestment
income
Revenud'investissement
direct
Total
of which: / dont :
Directinvestment
income
Revenud'investissement
direct
(1) (2) (3)=(1)+(2) (4) (5) (6) (7) (8)
Trinidad and Tobago - 1990 2 289 -1 427 862 -436 -197 40 .. -6 459Trinité-et-Tobago 2000 4 844 -3 709 1 135 -709 .. 81 .. 38 544
2005 10 569 -6 265 4 304 -844 -292 84 .. 50 3 5942006 .. .. .. .. .. .. .. .. 4 655
Tunisia - Tunisie 1990 5 203 -6 039 -836 -552 -97 97 1 828 -4632000 8 607 -9 311 -705 -1 036 -468 94 3 825 -8212005 14 510 -14 647 -138 -1 786 -962 118 13 1 502 -3042006 15 802 -16 489 -687 -1 746 -930 160 7 1 639 -634
Turkey - Turquie 1990 21 042 -25 524 -4 482 -3 425 -161 917 .. 4 365 -2 6252000 50 249 -60 834 -10 585 -6 839 -279 2 836 368 4 764 -9 8242005 103 597 -121 855 -18 258 -9 483 -1 011 3 684 277 1 454 -22 6032006 116 484 -144 361 -27 877 -11 057 -1 134 4 473 219 1 687 -32 774
Uganda - Ouganda 1990 178 -686 -509 -48 .. .. .. 293 -2632000 663 -1 409 -745 -166 -19 53 .. 499 -3592005 1 372 -2 567 -1 195 -299 -202 50 .. 1 059 -3862006 1 494 -3 229 -1 735 -297 -235 72 .. 1 720 -240
Ukraine 2000 19 522 -17 947 1 575 -1 085 -43 143 .. 848 1 4812005 44 378 -43 707 671 -1 743 -268 758 5 2 845 2 5312006 50 239 -53 307 -3 068 -3 054 -996 1 332 8 3 173 -1 617
United Kingdom - Royaume-Uni 1990 239 226 -264 089 -24 863 -144 991 -13 960 139 837 29 032 -8 794 -38 8112000 404 775 -433 976 -29 201 -197 289 -41 526 204 239 68 175 -15 106 -37 3572005 593 753 -673 978 -80 225 -293 369 -64 893 340 528 144 413 -21 930 -54 9962006 679 164 -768 279 -89 114 -412 014 -87 614 445 524 166 970 -21 943 -77 548
United Republic of Tanzania - 1990 538 -1 474 -936 -191 .. 6 .. 562 -559République-Unie de Tanzanie 2000 1 291 -2 050 -759 -180 -13 50 .. 391 -499
2005 2 945 -4 205 -1 260 -198 -66 81 .. 496 -8812006 3 206 -5 113 -1 907 -165 -66 80 .. 550 -1 442
United States - États-Unis (9) 1990 535 260 -616 120 -80 860 -143 190 -3 450 171 750 65 980 -26 660 -78 9602000 1 070 600 -1 450 330 -379 735 -329 863 -56 910 350 919 151 839 -58 645 -417 3242005 1 283 070 -1 997 440 -714 372 -457 428 -116 833 505 487 269 347 -88 536 -754 8482006 1 445 700 -2 204 230 -758 524 -613 820 -136 010 650 453 310 226 -89 595 -811 486
Uruguay 1990 2 158 -1 659 499 -580 .. 258 .. 8 1862000 3 660 -4 193 -533 -842 -89 782 1 28 -5662005 5 085 -4 693 393 -1 057 -228 563 5 144 422006 5 660 -5 762 -101 -1 203 -292 734 10 134 -436
Uzbekistan - Ouzbékistan 2000 .. .. .. .. .. .. .. .. 3362005 .. .. .. .. .. .. .. .. 1 9492006 .. .. .. .. .. .. .. .. 2 872
Vanuatu 1990 74 -103 -29 -33 -15 32 .. 25 -62000 157 -147 10 -32 -22 19 .. 8 52005 177 -205 -28 -54 -35 28 1 20 -342006 184 -219 -35 -52 -34 32 1 25 -30
Venezuela (Bolivarian Rep. of) - 1990 18 806 -9 451 9 355 -3 432 -224 2 658 231 -302 8 279Venezuela (Rép. bolivarienne du) 2000 34 711 -21 300 13 411 -4 437 -1 424 3 049 296 -170 11 853
2005 56 988 -29 544 27 444 -6 411 -3 953 4 146 1 349 -69 25 1102006 66 782 -38 503 28 279 -9 026 -6 302 7 934 2 984 -38 27 149
Viet Nam 2000 17 150 -17 325 -175 -782 .. 331 .. 1 732 1 1062005 36 618 -38 562 -1 944 -1 583 .. 364 .. 3 380 2172006 .. .. .. .. .. .. .. .. 191
Yemen - Yémen 1990 1 490 -2 170 -680 -409 -283 38 .. 1 790 7392000 4 008 -3 294 714 -927 -855 150 .. 1 399 1 3372005 6 785 -5 954 831 -1 791 -1 603 178 .. 1 406 6242006 7 865 -7 781 84 -1 551 -1 403 316 .. 1 356 206
For sources and notes, see end of table. Pour les sources et les notes, se reporter à la fin du tableau.
Balance on goods
and services
Balancedes bienset services
Debit / Débit Credit / Crédit
Millions of dollars / Millions de dollars
Country or territory
Pays ou territoires
Year
Année
Goods and servicesBiens et services
IncomeRevenu
Currenttransfers
(net)
Transfertscourants
(nets)
Currentaccountbalance
Solde du compte des transactionscourantes
Exports
Exportations
Imports
Importations
7.1 Balance of payments: current account summaries
7.1 Balance des paiements : sommaires des comptes des transactions courantes
325
7
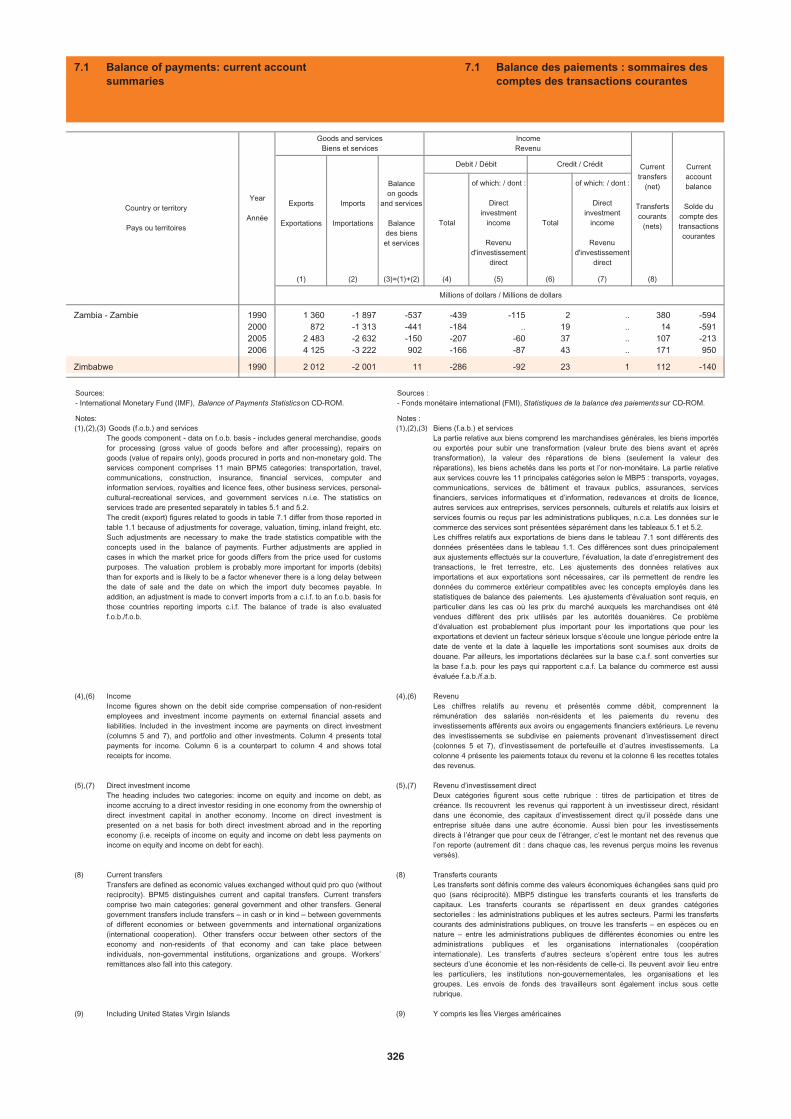
Total
of which: / dont :
Directinvestment
income
Revenud'investissement
direct
Total
of which: / dont :
Directinvestment
income
Revenud'investissement
direct
(1) (2) (3)=(1)+(2) (4) (5) (6) (7) (8)
Zambia - Zambie 1990 1 360 -1 897 -537 -439 -115 2 .. 380 -5942000 872 -1 313 -441 -184 .. 19 .. 14 -5912005 2 483 -2 632 -150 -207 -60 37 .. 107 -2132006 4 125 -3 222 902 -166 -87 43 .. 171 950
Zimbabwe 1990 2 012 -2 001 11 -286 -92 23 1 112 -140
Balance on goods
and services
Balancedes bienset services
Debit / Débit Credit / Crédit
Millions of dollars / Millions de dollars
Country or territory
Pays ou territoires
Year
Année
Goods and servicesBiens et services
IncomeRevenu
Currenttransfers
(net)
Transfertscourants
(nets)
Currentaccountbalance
Solde du compte des transactionscourantes
Exports
Exportations
Imports
Importations
7.1 Balance of payments: current account summaries
7.1 Balance des paiements : sommaires des comptes des transactions courantes
(1),(2),(3)
(4),(6)
(5),(7)
(8)
(9)
Goods (f.o.b.) and servicesThe goods component - data on f.o.b. basis - includes general merchandise, goodsfor processing (gross value of goods before and after processing), repairs ongoods (value of repairs only), goods procured in ports and non-monetary gold. Theservices component comprises 11 main BPM5 categories: transportation, travel,communications, construction, insurance, financial services, computer andinformation services, royalties and licence fees, other business services, personal-cultural-recreational services, and government services n.i.e. The statistics onservices trade are presented separately in tables 5.1 and 5.2.The credit (export) figures related to goods in table 7.1 differ from those reported intable 1.1 because of adjustments for coverage, valuation, timing, inland freight, etc.Such adjustments are necessary to make the trade statistics compatible with theconcepts used in the balance of payments. Further adjustments are applied incases in which the market price for goods differs from the price used for customspurposes. The valuation problem is probably more important for imports (debits)than for exports and is likely to be a factor whenever there is a long delay betweenthe date of sale and the date on which the import duty becomes payable. Inaddition, an adjustment is made to convert imports from a c.i.f. to an f.o.b. basis forthose countries reporting imports c.i.f. The balance of trade is also evaluatedf.o.b./f.o.b.
IncomeIncome figures shown on the debit side comprise compensation of non-residentemployees and investment income payments on external financial assets andliabilities. Included in the investment income are payments on direct investment(columns 5 and 7), and portfolio and other investments. Column 4 presents totalpayments for income. Column 6 is a counterpart to column 4 and shows totalreceipts for income.
Direct investment incomeThe heading includes two categories: income on equity and income on debt, asincome accruing to a direct investor residing in one economy from the ownership ofdirect investment capital in another economy. Income on direct investment ispresented on a net basis for both direct investment abroad and in the reportingeconomy (i.e. receipts of income on equity and income on debt less payments onincome on equity and income on debt for each).
Current transfersTransfers are defined as economic values exchanged without quid pro quo (withoutreciprocity). BPM5 distinguishes current and capital transfers. Current transferscomprise two main categories: general government and other transfers. Generalgovernment transfers include transfers – in cash or in kind – between governmentsof different economies or between governments and international organizations(international cooperation). Other transfers occur between other sectors of theeconomy and non-residents of that economy and can take place betweenindividuals, non-governmental institutions, organizations and groups. Workers’remittances also fall into this category.
Including United States Virgin Islands
Sources:- International Monetary Fund (IMF), Balance of Payments Statisticson CD-ROM.
Notes:(1),(2),(3)
(4),(6)
(5),(7)
(8)
(9)
Biens (f.a.b.) et servicesLa partie relative aux biens comprend les marchandises générales, les biens importésou exportés pour subir une transformation (valeur brute des biens avant et aprèstransformation), la valeur des réparations de biens (seulement la valeur desréparations), les biens achetés dans les ports et l’or non-monétaire. La partie relativeaux services couvre les 11 principales catégories selon le MBP5 : transports, voyages,communications, services de bâtiment et travaux publics, assurances, servicesfinanciers, services informatiques et d’information, redevances et droits de licence,autres services aux entreprises, services personnels, culturels et relatifs aux loisirs etservices fournis ou reçus par les administrations publiques, n.c.a. Les données sur lecommerce des services sont présentées séparément dans les tableaux 5.1 et 5.2. Les chiffres relatifs aux exportations de biens dans le tableau 7.1 sont différents desdonnées présentées dans le tableau 1.1. Ces différences sont dues principalementaux ajustements effectués sur la couverture, l’évaluation, la date d’enregistrement destransactions, le fret terrestre, etc. Les ajustements des données relatives auximportations et aux exportations sont nécessaires, car ils permettent de rendre lesdonnées du commerce extérieur compatibles avec les concepts employés dans lesstatistiques de balance des paiements. Les ajustements d’évaluation sont requis, enparticulier dans les cas où les prix du marché auxquels les marchandises ont étévendues diffèrent des prix utilisés par les autorités douanières. Ce problèmed’évaluation est probablement plus important pour les importations que pour lesexportations et devient un facteur sérieux lorsque s’écoule une longue période entre ladate de vente et la date à laquelle les importations sont soumises aux droits dedouane. Par ailleurs, les importations déclarées sur la base c.a.f. sont converties surla base f.a.b. pour les pays qui rapportent c.a.f. La balance du commerce est aussiévaluée f.a.b./f.a.b.
RevenuLes chiffres relatifs au revenu et présentés comme débit, comprennent larémunération des salariés non-résidents et les paiements du revenu desinvestissements afférents aux avoirs ou engagements financiers extérieurs. Le revenudes investissements se subdivise en paiements provenant d’investissement direct(colonnes 5 et 7), d’investissement de portefeuille et d’autres investissements. Lacolonne 4 présente les paiements totaux du revenu et la colonne 6 les recettes totalesdes revenus.
Revenu d’investissement directDeux catégories figurent sous cette rubrique : titres de participation et titres decréance. Ils recouvrent les revenus qui rapportent à un investisseur direct, résidantdans une économie, des capitaux d’investissement direct qu’il possède dans uneentreprise située dans une autre économie. Aussi bien pour les investissementsdirects à l’étranger que pour ceux de l’étranger, c’est le montant net des revenus quel’on reporte (autrement dit : dans chaque cas, les revenus perçus moins les revenusversés).
Transferts courantsLes transferts sont définis comme des valeurs économiques échangées sans quid proquo (sans réciprocité). MBP5 distingue les transferts courants et les transferts decapitaux. Les transferts courants se répartissent en deux grandes catégoriessectorielles : les administrations publiques et les autres secteurs. Parmi les transfertscourants des administrations publiques, on trouve les transferts – en espèces ou ennature – entre les administrations publiques de différentes économies ou entre lesadministrations publiques et les organisations internationales (coopérationinternationale). Les transferts d’autres secteurs s’opèrent entre tous les autressecteurs d’une économie et les non-résidents de celle-ci. Ils peuvent avoir lieu entreles particuliers, les institutions non-gouvernementales, les organisations et lesgroupes. Les envois de fonds des travailleurs sont également inclus sous cetterubrique.
Y compris les Îles Vierges américaines
Sources : - Fonds monétaire international (FMI), Statistiques de la balance des paiements sur CD-ROM.
Notes :
326
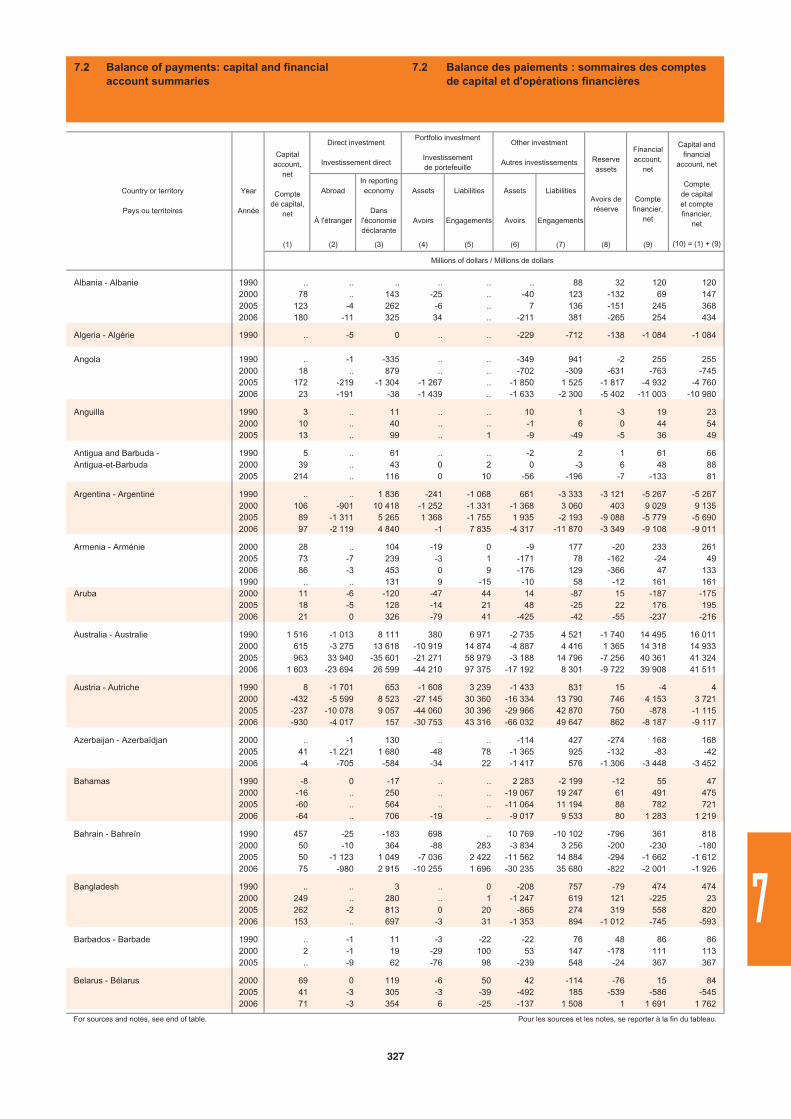
Abroad
À l'étranger
In reporting economy
Dansl'économiedéclarante
Assets
Avoirs
Liabilities
Engagements
Assets
Avoirs
Liabilities
Engagements
(1) (2) (3) (4) (5) (6) (7) (8) (9)
Albania - Albanie 1990 .. .. .. .. .. .. 88 32 120 1202000 78 .. 143 -25 .. -40 123 -132 69 1472005 123 -4 262 -6 .. 7 136 -151 245 3682006 180 -11 325 34 .. -211 381 -265 254 434
Algeria - Algérie 1990 .. -5 0 .. .. -229 -712 -138 -1 084 -1 084
Angola 1990 .. -1 -335 .. .. -349 941 -2 255 2552000 18 .. 879 .. .. -702 -309 -631 -763 -7452005 172 -219 -1 304 -1 267 .. -1 850 1 525 -1 817 -4 932 -4 7602006 23 -191 -38 -1 439 .. -1 633 -2 300 -5 402 -11 003 -10 980
Anguilla 1990 3 .. 11 .. .. 10 1 -3 19 232000 10 .. 40 .. .. -1 6 0 44 542005 13 .. 99 .. 1 -9 -49 -5 36 49
Antigua and Barbuda - 1990 5 .. 61 .. .. -2 2 1 61 66Antigua-et-Barbuda 2000 39 .. 43 0 2 0 -3 6 48 88
2005 214 .. 116 0 10 -56 -196 -7 -133 81
Argentina - Argentine 1990 .. .. 1 836 -241 -1 068 661 -3 333 -3 121 -5 267 -5 2672000 106 -901 10 418 -1 252 -1 331 -1 368 3 060 403 9 029 9 1352005 89 -1 311 5 265 1 368 -1 755 1 935 -2 193 -9 088 -5 779 -5 6902006 97 -2 119 4 840 -1 7 835 -4 317 -11 870 -3 349 -9 108 -9 011
Armenia - Arménie 2000 28 .. 104 -19 0 -9 177 -20 233 2612005 73 -7 239 -3 1 -171 78 -162 -24 492006 86 -3 453 0 9 -176 129 -366 47 1331990 .. .. 131 9 -15 -10 58 -12 161 161
Aruba 2000 11 -6 -120 -47 44 14 -87 15 -187 -1752005 18 -5 128 -14 21 48 -25 22 176 1952006 21 0 326 -79 41 -425 -42 -55 -237 -216
Australia - Australie 1990 1 516 -1 013 8 111 380 6 971 -2 735 4 521 -1 740 14 495 16 0112000 615 -3 275 13 618 -10 919 14 874 -4 887 4 416 1 365 14 318 14 9332005 963 33 940 -35 601 -21 271 58 979 -3 188 14 796 -7 256 40 361 41 3242006 1 603 -23 694 26 599 -44 210 97 375 -17 192 8 301 -9 722 39 908 41 511
Austria - Autriche 1990 8 -1 701 653 -1 608 3 239 -1 433 831 15 -4 42000 -432 -5 599 8 523 -27 145 30 360 -16 334 13 790 746 4 153 3 7212005 -237 -10 078 9 057 -44 060 30 396 -29 966 42 870 750 -878 -1 1152006 -930 -4 017 157 -30 753 43 316 -66 032 49 647 862 -8 187 -9 117
Azerbaijan - Azerbaïdjan 2000 .. -1 130 .. .. -114 427 -274 168 1682005 41 -1 221 1 680 -48 78 -1 365 925 -132 -83 -422006 -4 -705 -584 -34 22 -1 417 576 -1 306 -3 448 -3 452
Bahamas 1990 -8 0 -17 .. .. 2 283 -2 199 -12 55 472000 -16 .. 250 .. .. -19 067 19 247 61 491 4752005 -60 .. 564 .. .. -11 064 11 194 88 782 7212006 -64 .. 706 -19 .. -9 017 9 533 80 1 283 1 219
Bahrain - Bahreïn 1990 457 -25 -183 698 .. 10 769 -10 102 -796 361 8182000 50 -10 364 -88 283 -3 834 3 256 -200 -230 -1802005 50 -1 123 1 049 -7 036 2 422 -11 562 14 884 -294 -1 662 -1 6122006 75 -980 2 915 -10 255 1 696 -30 235 35 680 -822 -2 001 -1 926
Bangladesh 1990 .. .. 3 .. 0 -208 757 -79 474 4742000 249 .. 280 .. 1 -1 247 619 121 -225 232005 262 -2 813 0 20 -865 274 319 558 8202006 153 .. 697 -3 31 -1 353 894 -1 012 -745 -593
Barbados - Barbade 1990 .. -1 11 -3 -22 -22 76 48 86 862000 2 -1 19 -29 100 53 147 -178 111 1132005 .. -9 62 -76 98 -239 548 -24 367 367
Belarus - Bélarus 2000 69 0 119 -6 50 42 -114 -76 15 842005 41 -3 305 -3 -39 -492 185 -539 -586 -5452006 71 -3 354 6 -25 -137 1 508 1 1 691 1 762
For sources and notes, see end of table. Pour les sources et les notes, se reporter à la fin du tableau.
Financialaccount,
net
Comptefinancier,
net
Reserveassets
Avoirs de réserve
Year
Année
Country or territory
Pays ou territoires
Direct investment
Investissement direct
Capital and financial
account, net
Comptede capital et compte financier,
net
(10) = (1) + (9)
Other investment
Autres investissements
Portfolio investment
Investissementde portefeuille
Capitalaccount,
net
Comptede capital,
net
Millions of dollars / Millions de dollars
7.2 Balance of payments: capital and financial account summaries
7.2 Balance des paiements : sommaires des comptes de capital et d'opérations financières
327
7
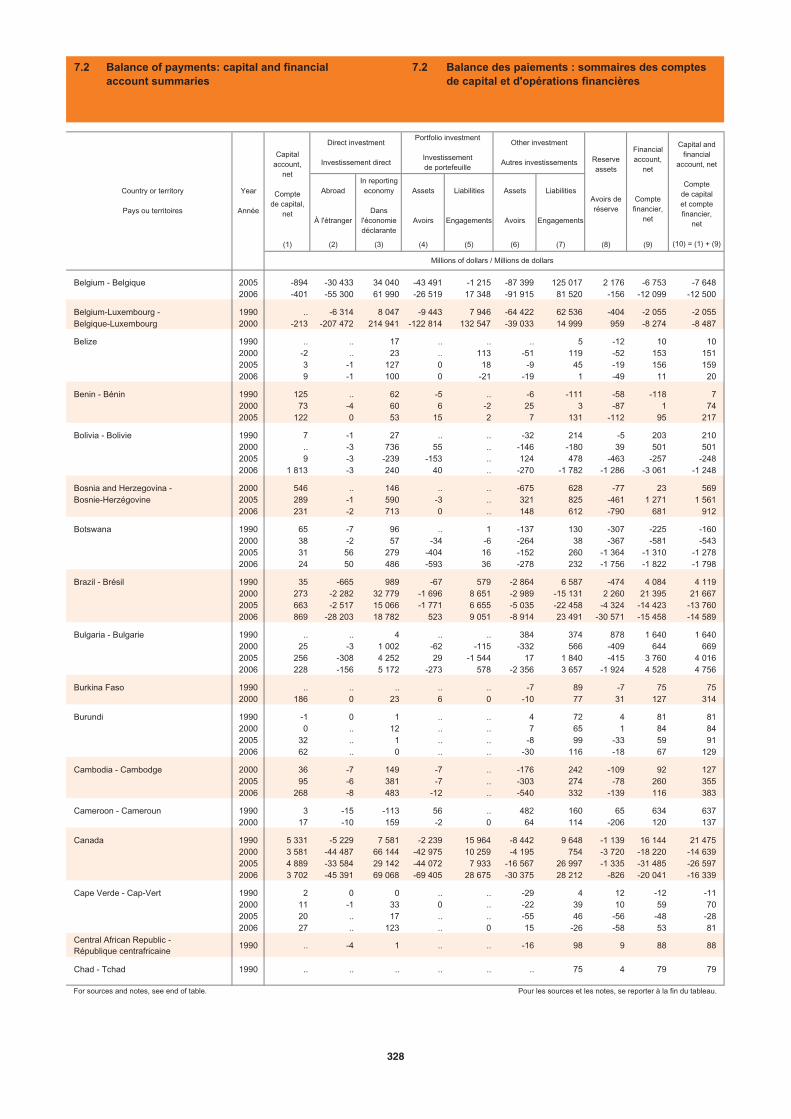
Abroad
À l'étranger
In reporting economy
Dansl'économiedéclarante
Assets
Avoirs
Liabilities
Engagements
Assets
Avoirs
Liabilities
Engagements
(1) (2) (3) (4) (5) (6) (7) (8) (9)
Belgium - Belgique 2005 -894 -30 433 34 040 -43 491 -1 215 -87 399 125 017 2 176 -6 753 -7 6482006 -401 -55 300 61 990 -26 519 17 348 -91 915 81 520 -156 -12 099 -12 500
Belgium-Luxembourg - 1990 .. -6 314 8 047 -9 443 7 946 -64 422 62 536 -404 -2 055 -2 055Belgique-Luxembourg 2000 -213 -207 472 214 941 -122 814 132 547 -39 033 14 999 959 -8 274 -8 487
Belize 1990 .. .. 17 .. .. .. 5 -12 10 102000 -2 .. 23 .. 113 -51 119 -52 153 1512005 3 -1 127 0 18 -9 45 -19 156 1592006 9 -1 100 0 -21 -19 1 -49 11 20
Benin - Bénin 1990 125 .. 62 -5 .. -6 -111 -58 -118 72000 73 -4 60 6 -2 25 3 -87 1 742005 122 0 53 15 2 7 131 -112 95 217
Bolivia - Bolivie 1990 7 -1 27 .. .. -32 214 -5 203 2102000 .. -3 736 55 .. -146 -180 39 501 5012005 9 -3 -239 -153 .. 124 478 -463 -257 -2482006 1 813 -3 240 40 .. -270 -1 782 -1 286 -3 061 -1 248
Bosnia and Herzegovina - 2000 546 .. 146 .. .. -675 628 -77 23 569Bosnie-Herzégovine 2005 289 -1 590 -3 .. 321 825 -461 1 271 1 561
2006 231 -2 713 0 .. 148 612 -790 681 912
Botswana 1990 65 -7 96 .. 1 -137 130 -307 -225 -1602000 38 -2 57 -34 -6 -264 38 -367 -581 -5432005 31 56 279 -404 16 -152 260 -1 364 -1 310 -1 2782006 24 50 486 -593 36 -278 232 -1 756 -1 822 -1 798
Brazil - Brésil 1990 35 -665 989 -67 579 -2 864 6 587 -474 4 084 4 1192000 273 -2 282 32 779 -1 696 8 651 -2 989 -15 131 2 260 21 395 21 6672005 663 -2 517 15 066 -1 771 6 655 -5 035 -22 458 -4 324 -14 423 -13 7602006 869 -28 203 18 782 523 9 051 -8 914 23 491 -30 571 -15 458 -14 589
Bulgaria - Bulgarie 1990 .. .. 4 .. .. 384 374 878 1 640 1 6402000 25 -3 1 002 -62 -115 -332 566 -409 644 6692005 256 -308 4 252 29 -1 544 17 1 840 -415 3 760 4 0162006 228 -156 5 172 -273 578 -2 356 3 657 -1 924 4 528 4 756
Burkina Faso 1990 .. .. .. .. .. -7 89 -7 75 752000 186 0 23 6 0 -10 77 31 127 314
Burundi 1990 -1 0 1 .. .. 4 72 4 81 812000 0 .. 12 .. .. 7 65 1 84 842005 32 .. 1 .. .. -8 99 -33 59 912006 62 .. 0 .. .. -30 116 -18 67 129
Cambodia - Cambodge 2000 36 -7 149 -7 .. -176 242 -109 92 1272005 95 -6 381 -7 .. -303 274 -78 260 3552006 268 -8 483 -12 .. -540 332 -139 116 383
Cameroon - Cameroun 1990 3 -15 -113 56 .. 482 160 65 634 6372000 17 -10 159 -2 0 64 114 -206 120 137
Canada 1990 5 331 -5 229 7 581 -2 239 15 964 -8 442 9 648 -1 139 16 144 21 4752000 3 581 -44 487 66 144 -42 975 10 259 -4 195 754 -3 720 -18 220 -14 6392005 4 889 -33 584 29 142 -44 072 7 933 -16 567 26 997 -1 335 -31 485 -26 5972006 3 702 -45 391 69 068 -69 405 28 675 -30 375 28 212 -826 -20 041 -16 339
Cape Verde - Cap-Vert 1990 2 0 0 .. .. -29 4 12 -12 -112000 11 -1 33 0 .. -22 39 10 59 702005 20 .. 17 .. .. -55 46 -56 -48 -282006 27 .. 123 .. 0 15 -26 -58 53 81
Central African Republic - République centrafricaine
1990 .. -4 1 .. .. -16 98 9 88 88
Chad - Tchad 1990 .. .. .. .. .. .. 75 4 79 79
For sources and notes, see end of table. Pour les sources et les notes, se reporter à la fin du tableau.
Capital and financial
account, net
Comptede capital et compte financier,
net
(10) = (1) + (9)
Millions of dollars / Millions de dollars
Portfolio investment
Investissementde portefeuille
Other investment
Autres investissements Reserveassets
Avoirs de réserve
Financialaccount,
net
Comptefinancier,
net
Country or territory
Pays ou territoires
Year
Année
Capitalaccount,
net
Comptede capital,
net
Direct investment
Investissement direct
7.2 Balance of payments: capital and financial account summaries
7.2 Balance des paiements : sommaires des comptes de capital et d'opérations financières
328
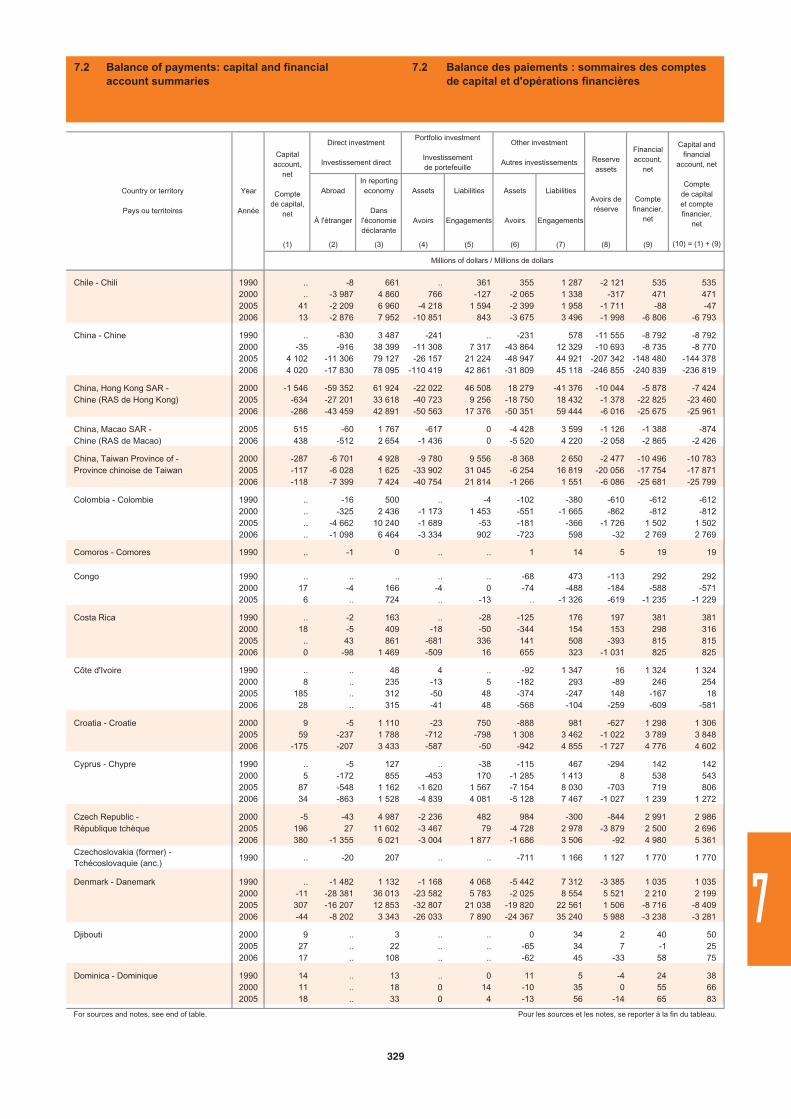
Abroad
À l'étranger
In reporting economy
Dansl'économiedéclarante
Assets
Avoirs
Liabilities
Engagements
Assets
Avoirs
Liabilities
Engagements
(1) (2) (3) (4) (5) (6) (7) (8) (9)
Chile - Chili 1990 .. -8 661 .. 361 355 1 287 -2 121 535 5352000 .. -3 987 4 860 766 -127 -2 065 1 338 -317 471 4712005 41 -2 209 6 960 -4 218 1 594 -2 399 1 958 -1 711 -88 -472006 13 -2 876 7 952 -10 851 843 -3 675 3 496 -1 998 -6 806 -6 793
China - Chine 1990 .. -830 3 487 -241 .. -231 578 -11 555 -8 792 -8 7922000 -35 -916 38 399 -11 308 7 317 -43 864 12 329 -10 693 -8 735 -8 7702005 4 102 -11 306 79 127 -26 157 21 224 -48 947 44 921 -207 342 -148 480 -144 3782006 4 020 -17 830 78 095 -110 419 42 861 -31 809 45 118 -246 855 -240 839 -236 819
China, Hong Kong SAR - 2000 -1 546 -59 352 61 924 -22 022 46 508 18 279 -41 376 -10 044 -5 878 -7 424Chine (RAS de Hong Kong) 2005 -634 -27 201 33 618 -40 723 9 256 -18 750 18 432 -1 378 -22 825 -23 460
2006 -286 -43 459 42 891 -50 563 17 376 -50 351 59 444 -6 016 -25 675 -25 961
China, Macao SAR - 2005 515 -60 1 767 -617 0 -4 428 3 599 -1 126 -1 388 -874Chine (RAS de Macao) 2006 438 -512 2 654 -1 436 0 -5 520 4 220 -2 058 -2 865 -2 426
China, Taiwan Province of - 2000 -287 -6 701 4 928 -9 780 9 556 -8 368 2 650 -2 477 -10 496 -10 783Province chinoise de Taiwan 2005 -117 -6 028 1 625 -33 902 31 045 -6 254 16 819 -20 056 -17 754 -17 871
2006 -118 -7 399 7 424 -40 754 21 814 -1 266 1 551 -6 086 -25 681 -25 799
Colombia - Colombie 1990 .. -16 500 .. -4 -102 -380 -610 -612 -6122000 .. -325 2 436 -1 173 1 453 -551 -1 665 -862 -812 -8122005 .. -4 662 10 240 -1 689 -53 -181 -366 -1 726 1 502 1 5022006 .. -1 098 6 464 -3 334 902 -723 598 -32 2 769 2 769
Comoros - Comores 1990 .. -1 0 .. .. 1 14 5 19 19
Congo 1990 .. .. .. .. .. -68 473 -113 292 2922000 17 -4 166 -4 0 -74 -488 -184 -588 -5712005 6 .. 724 .. -13 .. -1 326 -619 -1 235 -1 229
Costa Rica 1990 .. -2 163 .. -28 -125 176 197 381 3812000 18 -5 409 -18 -50 -344 154 153 298 3162005 .. 43 861 -681 336 141 508 -393 815 8152006 0 -98 1 469 -509 16 655 323 -1 031 825 825
Côte d'Ivoire 1990 .. .. 48 4 .. -92 1 347 16 1 324 1 3242000 8 .. 235 -13 5 -182 293 -89 246 2542005 185 .. 312 -50 48 -374 -247 148 -167 182006 28 .. 315 -41 48 -568 -104 -259 -609 -581
Croatia - Croatie 2000 9 -5 1 110 -23 750 -888 981 -627 1 298 1 3062005 59 -237 1 788 -712 -798 1 308 3 462 -1 022 3 789 3 8482006 -175 -207 3 433 -587 -50 -942 4 855 -1 727 4 776 4 602
Cyprus - Chypre 1990 .. -5 127 .. -38 -115 467 -294 142 1422000 5 -172 855 -453 170 -1 285 1 413 8 538 5432005 87 -548 1 162 -1 620 1 567 -7 154 8 030 -703 719 8062006 34 -863 1 528 -4 839 4 081 -5 128 7 467 -1 027 1 239 1 272
Czech Republic - 2000 -5 -43 4 987 -2 236 482 984 -300 -844 2 991 2 986République tchèque 2005 196 27 11 602 -3 467 79 -4 728 2 978 -3 879 2 500 2 696
2006 380 -1 355 6 021 -3 004 1 877 -1 686 3 506 -92 4 980 5 361Czechoslovakia (former) - Tchécoslovaquie (anc.)
1990 .. -20 207 .. .. -711 1 166 1 127 1 770 1 770
Denmark - Danemark 1990 .. -1 482 1 132 -1 168 4 068 -5 442 7 312 -3 385 1 035 1 0352000 -11 -28 381 36 013 -23 582 5 783 -2 025 8 554 5 521 2 210 2 1992005 307 -16 207 12 853 -32 807 21 038 -19 820 22 561 1 506 -8 716 -8 4092006 -44 -8 202 3 343 -26 033 7 890 -24 367 35 240 5 988 -3 238 -3 281
Djibouti 2000 9 .. 3 .. .. 0 34 2 40 502005 27 .. 22 .. .. -65 34 7 -1 252006 17 .. 108 .. .. -62 45 -33 58 75
Dominica - Dominique 1990 14 .. 13 .. 0 11 5 -4 24 382000 11 .. 18 0 14 -10 35 0 55 662005 18 .. 33 0 4 -13 56 -14 65 83
For sources and notes, see end of table. Pour les sources et les notes, se reporter à la fin du tableau.
Reserveassets
Avoirs de réserve
Financialaccount,
net
Comptefinancier,
net
Country or territory
Pays ou territoires
Year
Année
Capitalaccount,
net
Comptede capital,
net
Direct investment
Investissement direct
Capital and financial
account, net
Comptede capital et compte financier,
net
(10) = (1) + (9)
Millions of dollars / Millions de dollars
Portfolio investment
Investissementde portefeuille
Other investment
Autres investissements
7.2 Balance of payments: capital and financial account summaries
7.2 Balance des paiements : sommaires des comptes de capital et d'opérations financières
329
7
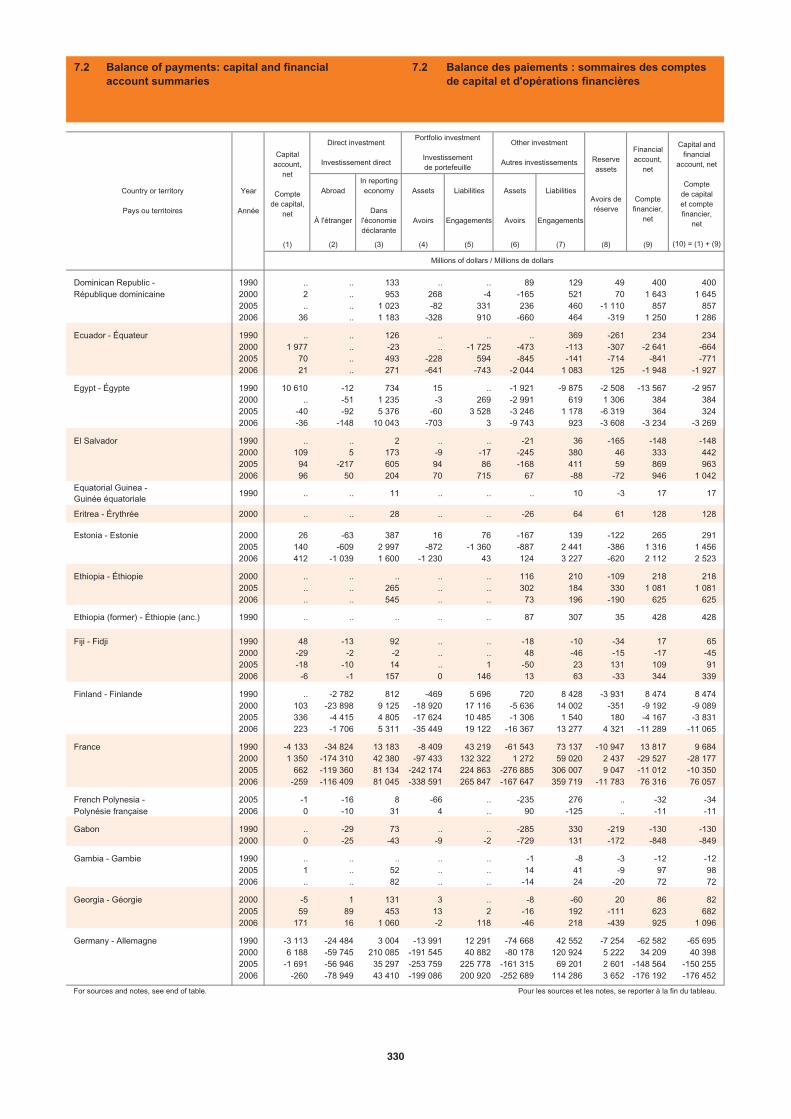
Abroad
À l'étranger
In reporting economy
Dansl'économiedéclarante
Assets
Avoirs
Liabilities
Engagements
Assets
Avoirs
Liabilities
Engagements
(1) (2) (3) (4) (5) (6) (7) (8) (9)
Dominican Republic - 1990 .. .. 133 .. .. 89 129 49 400 400République dominicaine 2000 2 .. 953 268 -4 -165 521 70 1 643 1 645
2005 .. .. 1 023 -82 331 236 460 -1 110 857 8572006 36 .. 1 183 -328 910 -660 464 -319 1 250 1 286
Ecuador - Équateur 1990 .. .. 126 .. .. .. 369 -261 234 2342000 1 977 .. -23 .. -1 725 -473 -113 -307 -2 641 -6642005 70 .. 493 -228 594 -845 -141 -714 -841 -7712006 21 .. 271 -641 -743 -2 044 1 083 125 -1 948 -1 927
Egypt - Égypte 1990 10 610 -12 734 15 .. -1 921 -9 875 -2 508 -13 567 -2 9572000 .. -51 1 235 -3 269 -2 991 619 1 306 384 3842005 -40 -92 5 376 -60 3 528 -3 246 1 178 -6 319 364 3242006 -36 -148 10 043 -703 3 -9 743 923 -3 608 -3 234 -3 269
El Salvador 1990 .. .. 2 .. .. -21 36 -165 -148 -1482000 109 5 173 -9 -17 -245 380 46 333 4422005 94 -217 605 94 86 -168 411 59 869 9632006 96 50 204 70 715 67 -88 -72 946 1 042
Equatorial Guinea - Guinée équatoriale
1990 .. .. 11 .. .. .. 10 -3 17 17
Eritrea - Érythrée 2000 .. .. 28 .. .. -26 64 61 128 128
Estonia - Estonie 2000 26 -63 387 16 76 -167 139 -122 265 2912005 140 -609 2 997 -872 -1 360 -887 2 441 -386 1 316 1 4562006 412 -1 039 1 600 -1 230 43 124 3 227 -620 2 112 2 523
Ethiopia - Éthiopie 2000 .. .. .. .. .. 116 210 -109 218 2182005 .. .. 265 .. .. 302 184 330 1 081 1 0812006 .. .. 545 .. .. 73 196 -190 625 625
Ethiopia (former) - Éthiopie (anc.) 1990 .. .. .. .. .. 87 307 35 428 428
Fiji - Fidji 1990 48 -13 92 .. .. -18 -10 -34 17 652000 -29 -2 -2 .. .. 48 -46 -15 -17 -452005 -18 -10 14 .. 1 -50 23 131 109 912006 -6 -1 157 0 146 13 63 -33 344 339
Finland - Finlande 1990 .. -2 782 812 -469 5 696 720 8 428 -3 931 8 474 8 4742000 103 -23 898 9 125 -18 920 17 116 -5 636 14 002 -351 -9 192 -9 0892005 336 -4 415 4 805 -17 624 10 485 -1 306 1 540 180 -4 167 -3 8312006 223 -1 706 5 311 -35 449 19 122 -16 367 13 277 4 321 -11 289 -11 065
France 1990 -4 133 -34 824 13 183 -8 409 43 219 -61 543 73 137 -10 947 13 817 9 6842000 1 350 -174 310 42 380 -97 433 132 322 1 272 59 020 2 437 -29 527 -28 1772005 662 -119 360 81 134 -242 174 224 863 -276 885 306 007 9 047 -11 012 -10 3502006 -259 -116 409 81 045 -338 591 265 847 -167 647 359 719 -11 783 76 316 76 057
French Polynesia - 2005 -1 -16 8 -66 .. -235 276 .. -32 -34Polynésie française 2006 0 -10 31 4 .. 90 -125 .. -11 -11
Gabon 1990 .. -29 73 .. .. -285 330 -219 -130 -1302000 0 -25 -43 -9 -2 -729 131 -172 -848 -849
Gambia - Gambie 1990 .. .. .. .. .. -1 -8 -3 -12 -122005 1 .. 52 .. .. 14 41 -9 97 982006 .. .. 82 .. .. -14 24 -20 72 72
Georgia - Géorgie 2000 -5 1 131 3 .. -8 -60 20 86 822005 59 89 453 13 2 -16 192 -111 623 6822006 171 16 1 060 -2 118 -46 218 -439 925 1 096
Germany - Allemagne 1990 -3 113 -24 484 3 004 -13 991 12 291 -74 668 42 552 -7 254 -62 582 -65 6952000 6 188 -59 745 210 085 -191 545 40 882 -80 178 120 924 5 222 34 209 40 3982005 -1 691 -56 946 35 297 -253 759 225 778 -161 315 69 201 2 601 -148 564 -150 2552006 -260 -78 949 43 410 -199 086 200 920 -252 689 114 286 3 652 -176 192 -176 452
For sources and notes, see end of table. Pour les sources et les notes, se reporter à la fin du tableau.
Year
Année
Capitalaccount,
net
Comptede capital,
net
Direct investment
Investissement direct
Capital and financial
account, net
Comptede capital et compte financier,
net
(10) = (1) + (9)
Millions of dollars / Millions de dollars
Portfolio investment
Investissementde portefeuille
Other investment
Autres investissements Reserveassets
Avoirs de réserve
Financialaccount,
net
Comptefinancier,
net
Country or territory
Pays ou territoires
7.2 Balance of payments: capital and financial account summaries
7.2 Balance des paiements : sommaires des comptes de capital et d'opérations financières
330
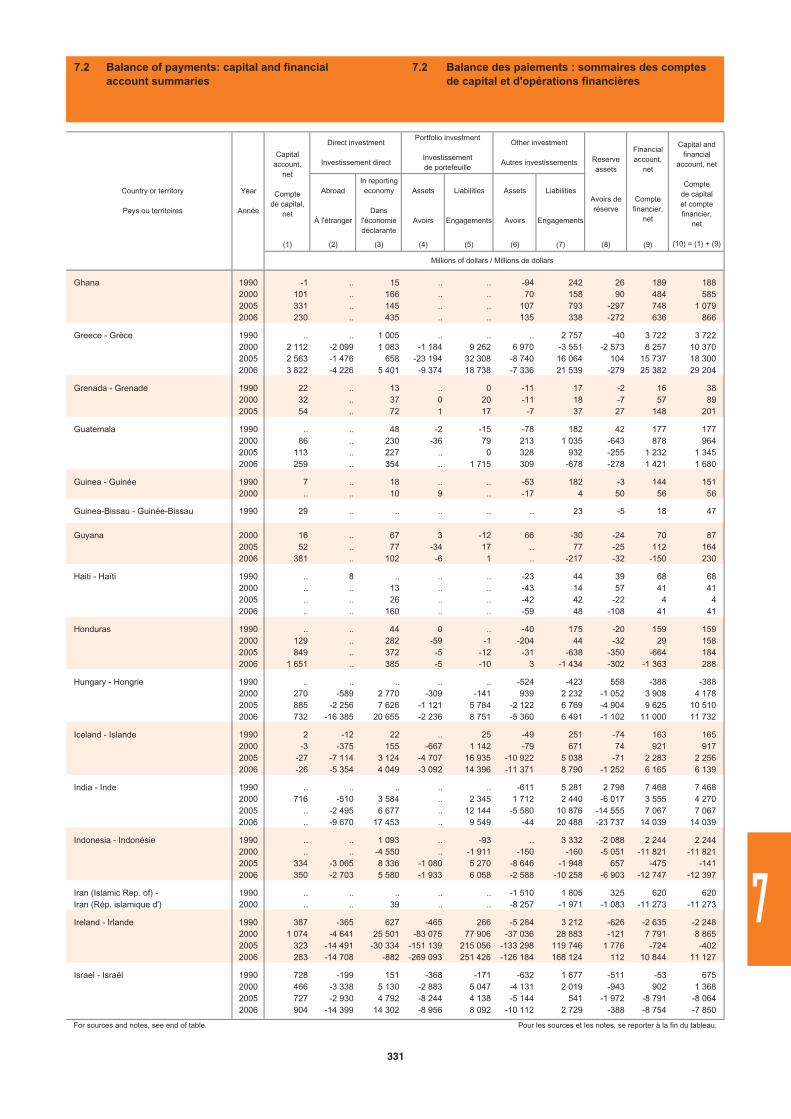
Abroad
À l'étranger
In reporting economy
Dansl'économiedéclarante
Assets
Avoirs
Liabilities
Engagements
Assets
Avoirs
Liabilities
Engagements
(1) (2) (3) (4) (5) (6) (7) (8) (9)
Ghana 1990 -1 .. 15 .. .. -94 242 26 189 1882000 101 .. 166 .. .. 70 158 90 484 5852005 331 .. 145 .. .. 107 793 -297 748 1 0792006 230 .. 435 .. .. 135 338 -272 636 866
Greece - Grèce 1990 .. .. 1 005 .. .. .. 2 757 -40 3 722 3 7222000 2 112 -2 099 1 083 -1 184 9 262 6 970 -3 551 -2 573 8 257 10 3702005 2 563 -1 476 658 -23 194 32 308 -8 740 16 064 104 15 737 18 3002006 3 822 -4 226 5 401 -9 374 18 738 -7 336 21 539 -279 25 382 29 204
Grenada - Grenade 1990 22 .. 13 .. 0 -11 17 -2 16 382000 32 .. 37 0 20 -11 18 -7 57 892005 54 .. 72 1 17 -7 37 27 148 201
Guatemala 1990 .. .. 48 -2 -15 -78 182 42 177 1772000 86 .. 230 -36 79 213 1 035 -643 878 9642005 113 .. 227 .. 0 328 932 -255 1 232 1 3452006 259 .. 354 .. 1 715 309 -678 -278 1 421 1 680
Guinea - Guinée 1990 7 .. 18 .. .. -53 182 -3 144 1512000 .. .. 10 9 .. -17 4 50 56 56
Guinea-Bissau - Guinée-Bissau 1990 29 .. .. .. .. .. 23 -5 18 47
Guyana 2000 16 .. 67 3 -12 66 -30 -24 70 872005 52 .. 77 -34 17 .. 77 -25 112 1642006 381 .. 102 -6 1 .. -217 -32 -150 230
Haiti - Haïti 1990 .. 8 .. .. .. -23 44 39 68 682000 .. .. 13 .. .. -43 14 57 41 412005 .. .. 26 .. .. -42 42 -22 4 42006 .. .. 160 .. .. -59 48 -108 41 41
Honduras 1990 .. .. 44 0 .. -40 175 -20 159 1592000 129 .. 282 -59 -1 -204 44 -32 29 1582005 849 .. 372 -5 -12 -31 -638 -350 -664 1842006 1 651 .. 385 -5 -10 3 -1 434 -302 -1 363 288
Hungary - Hongrie 1990 .. .. .. .. .. -524 -423 558 -388 -3882000 270 -589 2 770 -309 -141 939 2 232 -1 052 3 908 4 1782005 885 -2 256 7 626 -1 121 5 784 -2 122 6 769 -4 904 9 625 10 5102006 732 -16 385 20 655 -2 236 8 751 -5 360 6 491 -1 102 11 000 11 732
Iceland - Islande 1990 2 -12 22 .. 25 -49 251 -74 163 1652000 -3 -375 155 -667 1 142 -79 671 74 921 9172005 -27 -7 114 3 124 -4 707 16 935 -10 922 5 038 -71 2 283 2 2562006 -26 -5 354 4 049 -3 092 14 396 -11 371 8 790 -1 252 6 165 6 139
India - Inde 1990 .. .. .. .. .. -611 5 281 2 798 7 468 7 4682000 716 -510 3 584 .. 2 345 1 712 2 440 -6 017 3 555 4 2702005 .. -2 495 6 677 .. 12 144 -5 580 10 876 -14 555 7 067 7 0672006 .. -9 670 17 453 .. 9 549 -44 20 488 -23 737 14 039 14 039
Indonesia - Indonésie 1990 .. .. 1 093 .. -93 .. 3 332 -2 088 2 244 2 2442000 .. .. -4 550 .. -1 911 -150 -160 -5 051 -11 821 -11 8212005 334 -3 065 8 336 -1 080 5 270 -8 646 -1 948 657 -475 -1412006 350 -2 703 5 580 -1 933 6 058 -2 588 -10 258 -6 903 -12 747 -12 397
Iran (Islamic Rep. of) - 1990 .. .. .. .. .. -1 510 1 805 325 620 620Iran (Rép. islamique d') 2000 .. .. 39 .. .. -8 257 -1 971 -1 083 -11 273 -11 273
Ireland - Irlande 1990 387 -365 627 -465 266 -5 284 3 212 -626 -2 635 -2 2482000 1 074 -4 641 25 501 -83 075 77 906 -37 036 28 883 -121 7 791 8 8652005 323 -14 491 -30 334 -151 139 215 056 -133 298 119 746 1 776 -724 -4022006 283 -14 708 -882 -269 093 251 426 -126 184 168 124 112 10 844 11 127
Israel - Israël 1990 728 -199 151 -368 -171 -632 1 677 -511 -53 6752000 466 -3 338 5 130 -2 883 5 047 -4 131 2 019 -943 902 1 3682005 727 -2 930 4 792 -8 244 4 138 -5 144 541 -1 972 -8 791 -8 0642006 904 -14 399 14 302 -8 956 8 092 -10 112 2 729 -388 -8 754 -7 850
For sources and notes, see end of table. Pour les sources et les notes, se reporter à la fin du tableau.
Reserveassets
Avoirs de réserve
Financialaccount,
net
Comptefinancier,
net
Country or territory
Pays ou territoires
Year
Année
Capitalaccount,
net
Comptede capital,
net
Direct investment
Investissement direct
Capital and financial
account, net
Comptede capital et compte financier,
net
(10) = (1) + (9)
Millions of dollars / Millions de dollars
Portfolio investment
Investissementde portefeuille
Other investment
Autres investissements
7.2 Balance of payments: capital and financial account summaries
7.2 Balance des paiements : sommaires des comptes de capital et d'opérations financières
331
7
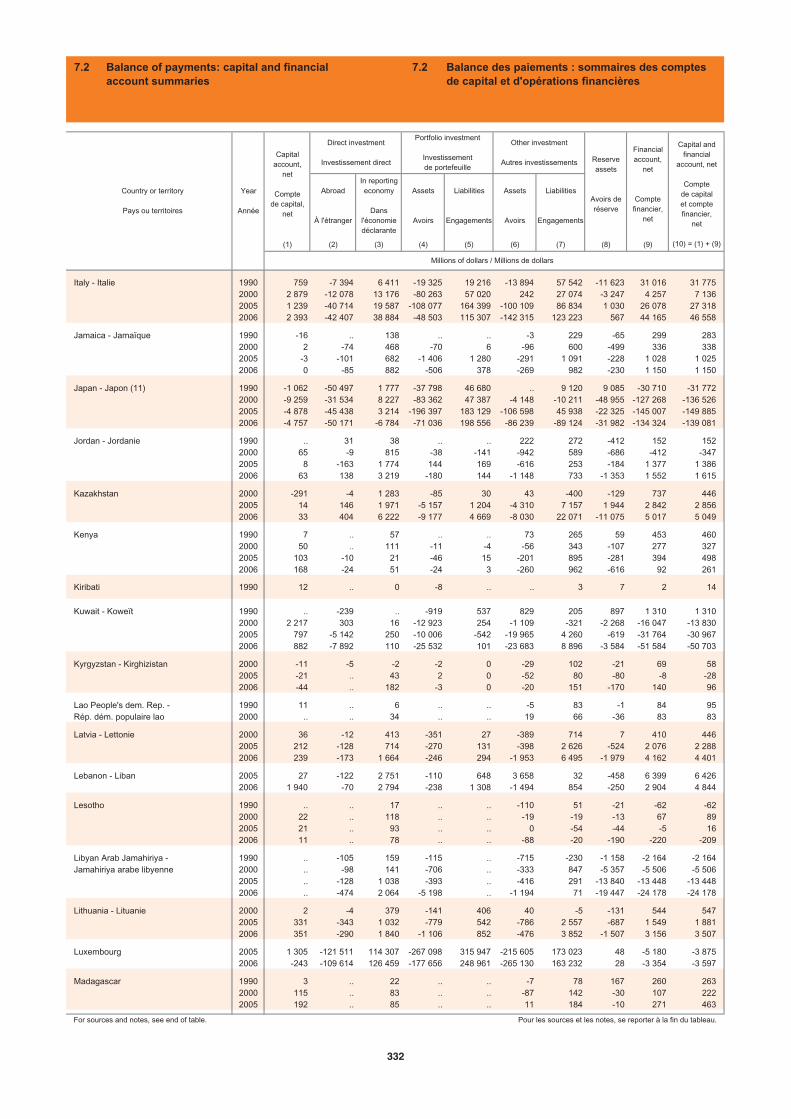
Abroad
À l'étranger
In reporting economy
Dansl'économiedéclarante
Assets
Avoirs
Liabilities
Engagements
Assets
Avoirs
Liabilities
Engagements
(1) (2) (3) (4) (5) (6) (7) (8) (9)
Italy - Italie 1990 759 -7 394 6 411 -19 325 19 216 -13 894 57 542 -11 623 31 016 31 7752000 2 879 -12 078 13 176 -80 263 57 020 242 27 074 -3 247 4 257 7 1362005 1 239 -40 714 19 587 -108 077 164 399 -100 109 86 834 1 030 26 078 27 3182006 2 393 -42 407 38 884 -48 503 115 307 -142 315 123 223 567 44 165 46 558
Jamaica - Jamaïque 1990 -16 .. 138 .. .. -3 229 -65 299 2832000 2 -74 468 -70 6 -96 600 -499 336 3382005 -3 -101 682 -1 406 1 280 -291 1 091 -228 1 028 1 0252006 0 -85 882 -506 378 -269 982 -230 1 150 1 150
Japan - Japon (11) 1990 -1 062 -50 497 1 777 -37 798 46 680 .. 9 120 9 085 -30 710 -31 7722000 -9 259 -31 534 8 227 -83 362 47 387 -4 148 -10 211 -48 955 -127 268 -136 5262005 -4 878 -45 438 3 214 -196 397 183 129 -106 598 45 938 -22 325 -145 007 -149 8852006 -4 757 -50 171 -6 784 -71 036 198 556 -86 239 -89 124 -31 982 -134 324 -139 081
Jordan - Jordanie 1990 .. 31 38 .. .. 222 272 -412 152 1522000 65 -9 815 -38 -141 -942 589 -686 -412 -3472005 8 -163 1 774 144 169 -616 253 -184 1 377 1 3862006 63 138 3 219 -180 144 -1 148 733 -1 353 1 552 1 615
Kazakhstan 2000 -291 -4 1 283 -85 30 43 -400 -129 737 4462005 14 146 1 971 -5 157 1 204 -4 310 7 157 1 944 2 842 2 8562006 33 404 6 222 -9 177 4 669 -8 030 22 071 -11 075 5 017 5 049
Kenya 1990 7 .. 57 .. .. 73 265 59 453 4602000 50 .. 111 -11 -4 -56 343 -107 277 3272005 103 -10 21 -46 15 -201 895 -281 394 4982006 168 -24 51 -24 3 -260 962 -616 92 261
Kiribati 1990 12 .. 0 -8 .. .. 3 7 2 14
Kuwait - Koweït 1990 .. -239 .. -919 537 829 205 897 1 310 1 3102000 2 217 303 16 -12 923 254 -1 109 -321 -2 268 -16 047 -13 8302005 797 -5 142 250 -10 006 -542 -19 965 4 260 -619 -31 764 -30 9672006 882 -7 892 110 -25 532 101 -23 683 8 896 -3 584 -51 584 -50 703
Kyrgyzstan - Kirghizistan 2000 -11 -5 -2 -2 0 -29 102 -21 69 582005 -21 .. 43 2 0 -52 80 -80 -8 -282006 -44 .. 182 -3 0 -20 151 -170 140 96
Lao People's dem. Rep. - 1990 11 .. 6 .. .. -5 83 -1 84 95Rép. dém. populaire lao 2000 .. .. 34 .. .. 19 66 -36 83 83
Latvia - Lettonie 2000 36 -12 413 -351 27 -389 714 7 410 4462005 212 -128 714 -270 131 -398 2 626 -524 2 076 2 2882006 239 -173 1 664 -246 294 -1 953 6 495 -1 979 4 162 4 401
Lebanon - Liban 2005 27 -122 2 751 -110 648 3 658 32 -458 6 399 6 4262006 1 940 -70 2 794 -238 1 308 -1 494 854 -250 2 904 4 844
Lesotho 1990 .. .. 17 .. .. -110 51 -21 -62 -622000 22 .. 118 .. .. -19 -19 -13 67 892005 21 .. 93 .. .. 0 -54 -44 -5 162006 11 .. 78 .. .. -88 -20 -190 -220 -209
Libyan Arab Jamahiriya - 1990 .. -105 159 -115 .. -715 -230 -1 158 -2 164 -2 164Jamahiriya arabe libyenne 2000 .. -98 141 -706 .. -333 847 -5 357 -5 506 -5 506
2005 .. -128 1 038 -393 .. -416 291 -13 840 -13 448 -13 4482006 .. -474 2 064 -5 198 .. -1 194 71 -19 447 -24 178 -24 178
Lithuania - Lituanie 2000 2 -4 379 -141 406 40 -5 -131 544 5472005 331 -343 1 032 -779 542 -786 2 557 -687 1 549 1 8812006 351 -290 1 840 -1 106 852 -476 3 852 -1 507 3 156 3 507
Luxembourg 2005 1 305 -121 511 114 307 -267 098 315 947 -215 605 173 023 48 -5 180 -3 8752006 -243 -109 614 126 459 -177 656 248 961 -265 130 163 232 28 -3 354 -3 597
Madagascar 1990 3 .. 22 .. .. -7 78 167 260 2632000 115 .. 83 .. .. -87 142 -30 107 2222005 192 .. 85 .. .. 11 184 -10 271 463
For sources and notes, see end of table. Pour les sources et les notes, se reporter à la fin du tableau.
Year
Année
Capitalaccount,
net
Comptede capital,
net
Direct investment
Investissement direct
Capital and financial
account, net
Comptede capital et compte financier,
net
(10) = (1) + (9)
Millions of dollars / Millions de dollars
Portfolio investment
Investissementde portefeuille
Other investment
Autres investissements Reserveassets
Avoirs de réserve
Financialaccount,
net
Comptefinancier,
net
Country or territory
Pays ou territoires
7.2 Balance of payments: capital and financial account summaries
7.2 Balance des paiements : sommaires des comptes de capital et d'opérations financières
332
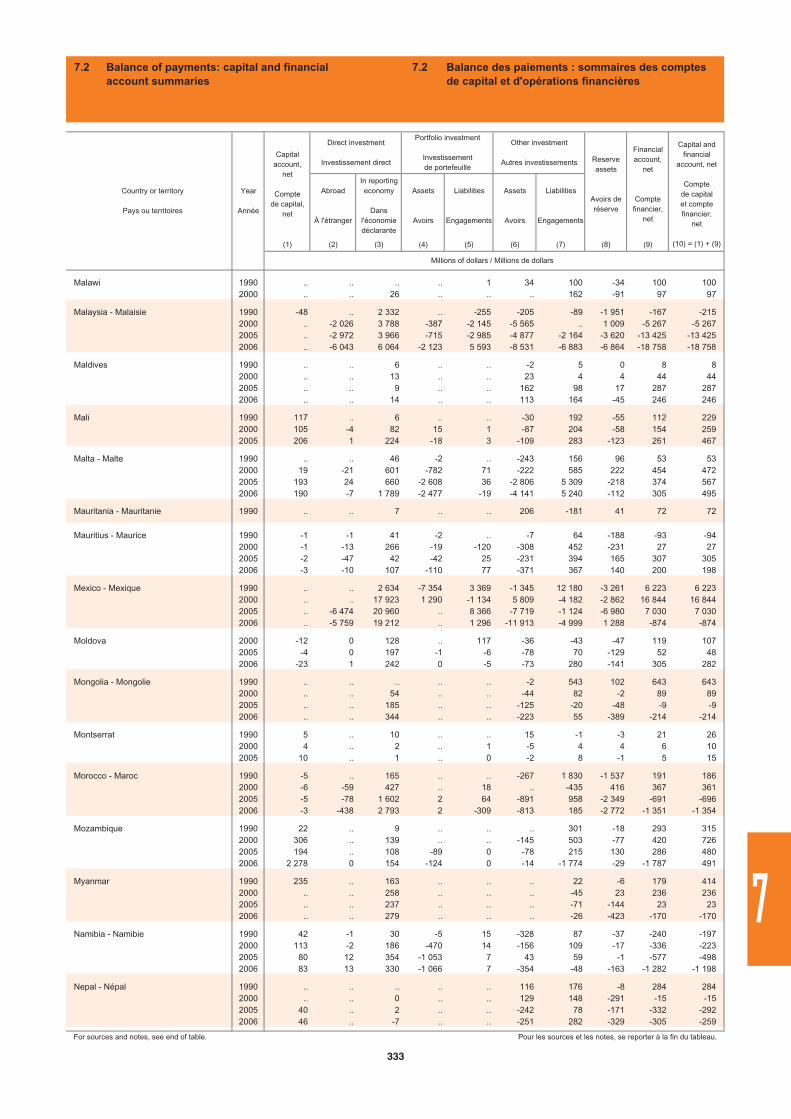
Abroad
À l'étranger
In reporting economy
Dansl'économiedéclarante
Assets
Avoirs
Liabilities
Engagements
Assets
Avoirs
Liabilities
Engagements
(1) (2) (3) (4) (5) (6) (7) (8) (9)
Malawi 1990 .. .. .. .. 1 34 100 -34 100 1002000 .. .. 26 .. .. .. 162 -91 97 97
Malaysia - Malaisie 1990 -48 .. 2 332 .. -255 -205 -89 -1 951 -167 -2152000 .. -2 026 3 788 -387 -2 145 -5 565 .. 1 009 -5 267 -5 2672005 .. -2 972 3 966 -715 -2 985 -4 877 -2 164 -3 620 -13 425 -13 4252006 .. -6 043 6 064 -2 123 5 593 -8 531 -6 883 -6 864 -18 758 -18 758
Maldives 1990 .. .. 6 .. .. -2 5 0 8 82000 .. .. 13 .. .. 23 4 4 44 442005 .. .. 9 .. .. 162 98 17 287 2872006 .. .. 14 .. .. 113 164 -45 246 246
Mali 1990 117 .. 6 .. .. -30 192 -55 112 2292000 105 -4 82 15 1 -87 204 -58 154 2592005 206 1 224 -18 3 -109 283 -123 261 467
Malta - Malte 1990 .. .. 46 -2 .. -243 156 96 53 532000 19 -21 601 -782 71 -222 585 222 454 4722005 193 24 660 -2 608 36 -2 806 5 309 -218 374 5672006 190 -7 1 789 -2 477 -19 -4 141 5 240 -112 305 495
Mauritania - Mauritanie 1990 .. .. 7 .. .. 206 -181 41 72 72
Mauritius - Maurice 1990 -1 -1 41 -2 .. -7 64 -188 -93 -942000 -1 -13 266 -19 -120 -308 452 -231 27 272005 -2 -47 42 -42 25 -231 394 165 307 3052006 -3 -10 107 -110 77 -371 367 140 200 198
Mexico - Mexique 1990 .. .. 2 634 -7 354 3 369 -1 345 12 180 -3 261 6 223 6 2232000 .. .. 17 923 1 290 -1 134 5 809 -4 182 -2 862 16 844 16 8442005 .. -6 474 20 960 .. 8 366 -7 719 -1 124 -6 980 7 030 7 0302006 .. -5 759 19 212 .. 1 296 -11 913 -4 999 1 288 -874 -874
Moldova 2000 -12 0 128 .. 117 -36 -43 -47 119 1072005 -4 0 197 -1 -6 -78 70 -129 52 482006 -23 1 242 0 -5 -73 280 -141 305 282
Mongolia - Mongolie 1990 .. .. .. .. .. -2 543 102 643 6432000 .. .. 54 .. .. -44 82 -2 89 892005 .. .. 185 .. .. -125 -20 -48 -9 -92006 .. .. 344 .. .. -223 55 -389 -214 -214
Montserrat 1990 5 .. 10 .. .. 15 -1 -3 21 262000 4 .. 2 .. 1 -5 4 4 6 102005 10 .. 1 .. 0 -2 8 -1 5 15
Morocco - Maroc 1990 -5 .. 165 .. .. -267 1 830 -1 537 191 1862000 -6 -59 427 .. 18 .. -435 416 367 3612005 -5 -78 1 602 2 64 -891 958 -2 349 -691 -6962006 -3 -438 2 793 2 -309 -813 185 -2 772 -1 351 -1 354
Mozambique 1990 22 .. 9 .. .. .. 301 -18 293 3152000 306 .. 139 .. .. -145 503 -77 420 7262005 194 .. 108 -89 0 -78 215 130 286 4802006 2 278 0 154 -124 0 -14 -1 774 -29 -1 787 491
Myanmar 1990 235 .. 163 .. .. .. 22 -6 179 4142000 .. .. 258 .. .. .. -45 23 236 2362005 .. .. 237 .. .. .. -71 -144 23 232006 .. .. 279 .. .. .. -26 -423 -170 -170
Namibia - Namibie 1990 42 -1 30 -5 15 -328 87 -37 -240 -1972000 113 -2 186 -470 14 -156 109 -17 -336 -2232005 80 12 354 -1 053 7 43 59 -1 -577 -4982006 83 13 330 -1 066 7 -354 -48 -163 -1 282 -1 198
Nepal - Népal 1990 .. .. .. .. .. 116 176 -8 284 2842000 .. .. 0 .. .. 129 148 -291 -15 -152005 40 .. 2 .. .. -242 78 -171 -332 -2922006 46 .. -7 .. .. -251 282 -329 -305 -259
For sources and notes, see end of table. Pour les sources et les notes, se reporter à la fin du tableau.
Reserveassets
Avoirs de réserve
Financialaccount,
net
Comptefinancier,
net
Country or territory
Pays ou territoires
Year
Année
Capitalaccount,
net
Comptede capital,
net
Direct investment
Investissement direct
Capital and financial
account, net
Comptede capital et compte financier,
net
(10) = (1) + (9)
Millions of dollars / Millions de dollars
Portfolio investment
Investissementde portefeuille
Other investment
Autres investissements
7.2 Balance of payments: capital and financial account summaries
7.2 Balance des paiements : sommaires des comptes de capital et d'opérations financières
333
7
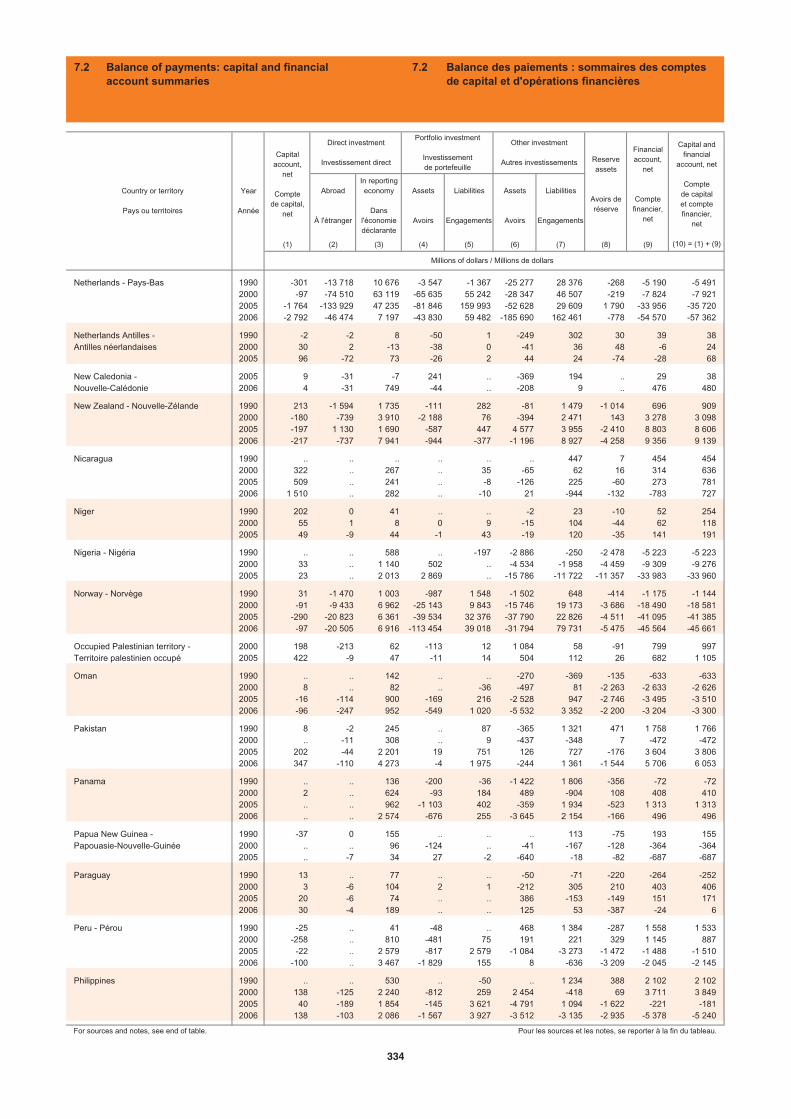
Abroad
À l'étranger
In reporting economy
Dansl'économiedéclarante
Assets
Avoirs
Liabilities
Engagements
Assets
Avoirs
Liabilities
Engagements
(1) (2) (3) (4) (5) (6) (7) (8) (9)
Netherlands - Pays-Bas 1990 -301 -13 718 10 676 -3 547 -1 367 -25 277 28 376 -268 -5 190 -5 4912000 -97 -74 510 63 119 -65 635 55 242 -28 347 46 507 -219 -7 824 -7 9212005 -1 764 -133 929 47 235 -81 846 159 993 -52 628 29 609 1 790 -33 956 -35 7202006 -2 792 -46 474 7 197 -43 830 59 482 -185 690 162 461 -778 -54 570 -57 362
Netherlands Antilles - 1990 -2 -2 8 -50 1 -249 302 30 39 38Antilles néerlandaises 2000 30 2 -13 -38 0 -41 36 48 -6 24
2005 96 -72 73 -26 2 44 24 -74 -28 68
New Caledonia - 2005 9 -31 -7 241 .. -369 194 .. 29 38Nouvelle-Calédonie 2006 4 -31 749 -44 .. -208 9 .. 476 480
New Zealand - Nouvelle-Zélande 1990 213 -1 594 1 735 -111 282 -81 1 479 -1 014 696 9092000 -180 -739 3 910 -2 188 76 -394 2 471 143 3 278 3 0982005 -197 1 130 1 690 -587 447 4 577 3 955 -2 410 8 803 8 6062006 -217 -737 7 941 -944 -377 -1 196 8 927 -4 258 9 356 9 139
Nicaragua 1990 .. .. .. .. .. .. 447 7 454 4542000 322 .. 267 .. 35 -65 62 16 314 6362005 509 .. 241 .. -8 -126 225 -60 273 7812006 1 510 .. 282 .. -10 21 -944 -132 -783 727
Niger 1990 202 0 41 .. .. -2 23 -10 52 2542000 55 1 8 0 9 -15 104 -44 62 1182005 49 -9 44 -1 43 -19 120 -35 141 191
Nigeria - Nigéria 1990 .. .. 588 .. -197 -2 886 -250 -2 478 -5 223 -5 2232000 33 .. 1 140 502 .. -4 534 -1 958 -4 459 -9 309 -9 2762005 23 .. 2 013 2 869 .. -15 786 -11 722 -11 357 -33 983 -33 960
Norway - Norvège 1990 31 -1 470 1 003 -987 1 548 -1 502 648 -414 -1 175 -1 1442000 -91 -9 433 6 962 -25 143 9 843 -15 746 19 173 -3 686 -18 490 -18 5812005 -290 -20 823 6 361 -39 534 32 376 -37 790 22 826 -4 511 -41 095 -41 3852006 -97 -20 505 6 916 -113 454 39 018 -31 794 79 731 -5 475 -45 564 -45 661
Occupied Palestinian territory - 2000 198 -213 62 -113 12 1 084 58 -91 799 997Territoire palestinien occupé 2005 422 -9 47 -11 14 504 112 26 682 1 105
Oman 1990 .. .. 142 .. .. -270 -369 -135 -633 -6332000 8 .. 82 .. -36 -497 81 -2 263 -2 633 -2 6262005 -16 -114 900 -169 216 -2 528 947 -2 746 -3 495 -3 5102006 -96 -247 952 -549 1 020 -5 532 3 352 -2 200 -3 204 -3 300
Pakistan 1990 8 -2 245 .. 87 -365 1 321 471 1 758 1 7662000 .. -11 308 .. 9 -437 -348 7 -472 -4722005 202 -44 2 201 19 751 126 727 -176 3 604 3 8062006 347 -110 4 273 -4 1 975 -244 1 361 -1 544 5 706 6 053
Panama 1990 .. .. 136 -200 -36 -1 422 1 806 -356 -72 -722000 2 .. 624 -93 184 489 -904 108 408 4102005 .. .. 962 -1 103 402 -359 1 934 -523 1 313 1 3132006 .. .. 2 574 -676 255 -3 645 2 154 -166 496 496
Papua New Guinea - 1990 -37 0 155 .. .. .. 113 -75 193 155Papouasie-Nouvelle-Guinée 2000 .. .. 96 -124 .. -41 -167 -128 -364 -364
2005 .. -7 34 27 -2 -640 -18 -82 -687 -687
Paraguay 1990 13 .. 77 .. .. -50 -71 -220 -264 -2522000 3 -6 104 2 1 -212 305 210 403 4062005 20 -6 74 .. .. 386 -153 -149 151 1712006 30 -4 189 .. .. 125 53 -387 -24 6
Peru - Pérou 1990 -25 .. 41 -48 .. 468 1 384 -287 1 558 1 5332000 -258 .. 810 -481 75 191 221 329 1 145 8872005 -22 .. 2 579 -817 2 579 -1 084 -3 273 -1 472 -1 488 -1 5102006 -100 .. 3 467 -1 829 155 8 -636 -3 209 -2 045 -2 145
Philippines 1990 .. .. 530 .. -50 .. 1 234 388 2 102 2 1022000 138 -125 2 240 -812 259 2 454 -418 69 3 711 3 8492005 40 -189 1 854 -145 3 621 -4 791 1 094 -1 622 -221 -1812006 138 -103 2 086 -1 567 3 927 -3 512 -3 135 -2 935 -5 378 -5 240
For sources and notes, see end of table. Pour les sources et les notes, se reporter à la fin du tableau.
Year
Année
Capitalaccount,
net
Comptede capital,
net
Direct investment
Investissement direct
Capital and financial
account, net
Comptede capital et compte financier,
net
(10) = (1) + (9)
Millions of dollars / Millions de dollars
Portfolio investment
Investissementde portefeuille
Other investment
Autres investissements Reserveassets
Avoirs de réserve
Financialaccount,
net
Comptefinancier,
net
Country or territory
Pays ou territoires
7.2 Balance of payments: capital and financial account summaries
7.2 Balance des paiements : sommaires des comptes de capital et d'opérations financières
334
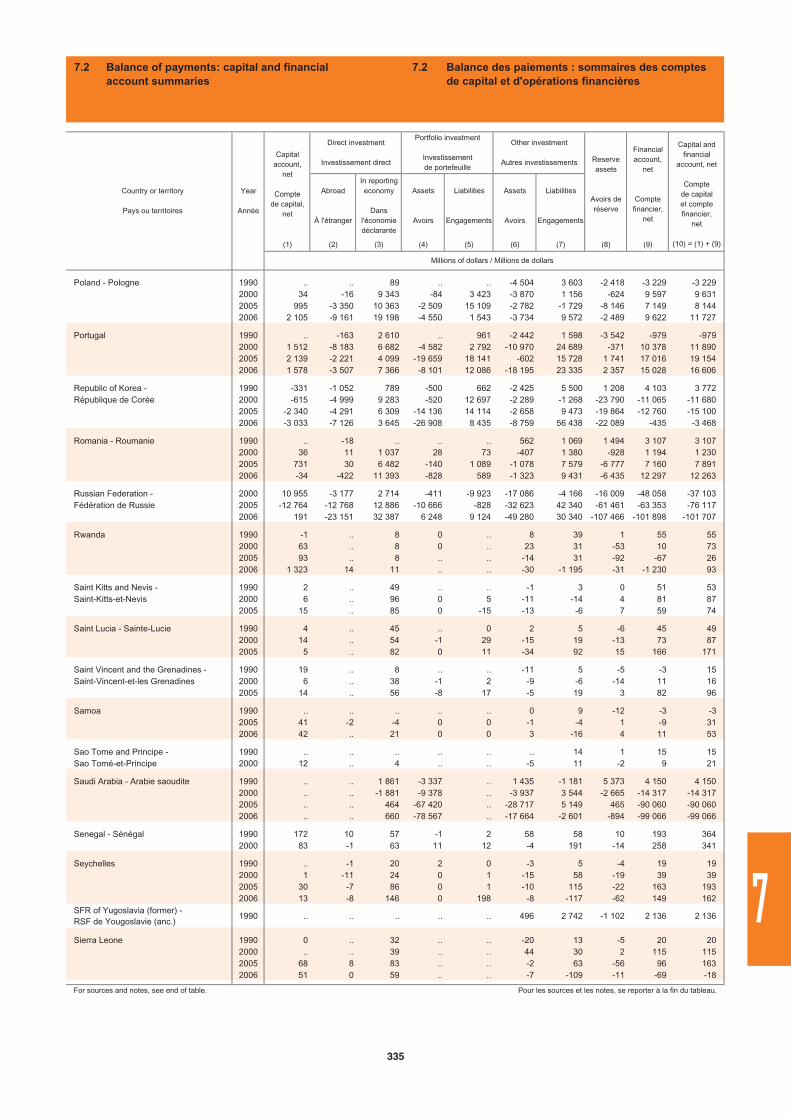
Abroad
À l'étranger
In reporting economy
Dansl'économiedéclarante
Assets
Avoirs
Liabilities
Engagements
Assets
Avoirs
Liabilities
Engagements
(1) (2) (3) (4) (5) (6) (7) (8) (9)
Poland - Pologne 1990 .. .. 89 .. .. -4 504 3 603 -2 418 -3 229 -3 2292000 34 -16 9 343 -84 3 423 -3 870 1 156 -624 9 597 9 6312005 995 -3 350 10 363 -2 509 15 109 -2 782 -1 729 -8 146 7 149 8 1442006 2 105 -9 161 19 198 -4 550 1 543 -3 734 9 572 -2 489 9 622 11 727
Portugal 1990 .. -163 2 610 .. 961 -2 442 1 598 -3 542 -979 -9792000 1 512 -8 183 6 682 -4 582 2 792 -10 970 24 689 -371 10 378 11 8902005 2 139 -2 221 4 099 -19 659 18 141 -602 15 728 1 741 17 016 19 1542006 1 578 -3 507 7 366 -8 101 12 086 -18 195 23 335 2 357 15 028 16 606
Republic of Korea - 1990 -331 -1 052 789 -500 662 -2 425 5 500 1 208 4 103 3 772République de Corée 2000 -615 -4 999 9 283 -520 12 697 -2 289 -1 268 -23 790 -11 065 -11 680
2005 -2 340 -4 291 6 309 -14 136 14 114 -2 658 9 473 -19 864 -12 760 -15 1002006 -3 033 -7 126 3 645 -26 908 8 435 -8 759 56 438 -22 089 -435 -3 468
Romania - Roumanie 1990 .. -18 .. .. .. 562 1 069 1 494 3 107 3 1072000 36 11 1 037 28 73 -407 1 380 -928 1 194 1 2302005 731 30 6 482 -140 1 089 -1 078 7 579 -6 777 7 160 7 8912006 -34 -422 11 393 -828 589 -1 323 9 431 -6 435 12 297 12 263
Russian Federation - 2000 10 955 -3 177 2 714 -411 -9 923 -17 086 -4 166 -16 009 -48 058 -37 103Fédération de Russie 2005 -12 764 -12 768 12 886 -10 666 -828 -32 623 42 340 -61 461 -63 353 -76 117
2006 191 -23 151 32 387 6 248 9 124 -49 280 30 340 -107 466 -101 898 -101 707
Rwanda 1990 -1 .. 8 0 .. 8 39 1 55 552000 63 .. 8 0 .. 23 31 -53 10 732005 93 .. 8 .. .. -14 31 -92 -67 262006 1 323 14 11 .. .. -30 -1 195 -31 -1 230 93
Saint Kitts and Nevis - 1990 2 .. 49 .. .. -1 3 0 51 53Saint-Kitts-et-Nevis 2000 6 .. 96 0 5 -11 -14 4 81 87
2005 15 .. 85 0 -15 -13 -6 7 59 74
Saint Lucia - Sainte-Lucie 1990 4 .. 45 .. 0 2 5 -6 45 492000 14 .. 54 -1 29 -15 19 -13 73 872005 5 .. 82 0 11 -34 92 15 166 171
Saint Vincent and the Grenadines - 1990 19 .. 8 .. .. -11 5 -5 -3 15Saint-Vincent-et-les Grenadines 2000 6 .. 38 -1 2 -9 -6 -14 11 16
2005 14 .. 56 -8 17 -5 19 3 82 96
Samoa 1990 .. .. .. .. .. 0 9 -12 -3 -32005 41 -2 -4 0 0 -1 -4 1 -9 312006 42 .. 21 0 0 3 -16 4 11 53
Sao Tome and Principe - 1990 .. .. .. .. .. .. 14 1 15 15Sao Tomé-et-Principe 2000 12 .. 4 .. .. -5 11 -2 9 21
Saudi Arabia - Arabie saoudite 1990 .. .. 1 861 -3 337 .. 1 435 -1 181 5 373 4 150 4 1502000 .. .. -1 881 -9 378 .. -3 937 3 544 -2 665 -14 317 -14 3172005 .. .. 464 -67 420 .. -28 717 5 149 465 -90 060 -90 0602006 .. .. 660 -78 567 .. -17 664 -2 601 -894 -99 066 -99 066
Senegal - Sénégal 1990 172 10 57 -1 2 58 58 10 193 3642000 83 -1 63 11 12 -4 191 -14 258 341
Seychelles 1990 .. -1 20 2 0 -3 5 -4 19 192000 1 -11 24 0 1 -15 58 -19 39 392005 30 -7 86 0 1 -10 115 -22 163 1932006 13 -8 146 0 198 -8 -117 -62 149 162
SFR of Yugoslavia (former) - RSF de Yougoslavie (anc.)
1990 .. .. .. .. .. 496 2 742 -1 102 2 136 2 136
Sierra Leone 1990 0 .. 32 .. .. -20 13 -5 20 202000 .. .. 39 .. .. 44 30 2 115 1152005 68 8 83 .. .. -2 63 -56 96 1632006 51 0 59 .. .. -7 -109 -11 -69 -18
For sources and notes, see end of table. Pour les sources et les notes, se reporter à la fin du tableau.
Reserveassets
Avoirs de réserve
Financialaccount,
net
Comptefinancier,
net
Country or territory
Pays ou territoires
Year
Année
Capitalaccount,
net
Comptede capital,
net
Direct investment
Investissement direct
Capital and financial
account, net
Comptede capital et compte financier,
net
(10) = (1) + (9)
Millions of dollars / Millions de dollars
Portfolio investment
Investissementde portefeuille
Other investment
Autres investissements
7.2 Balance of payments: capital and financial account summaries
7.2 Balance des paiements : sommaires des comptes de capital et d'opérations financières
335
7
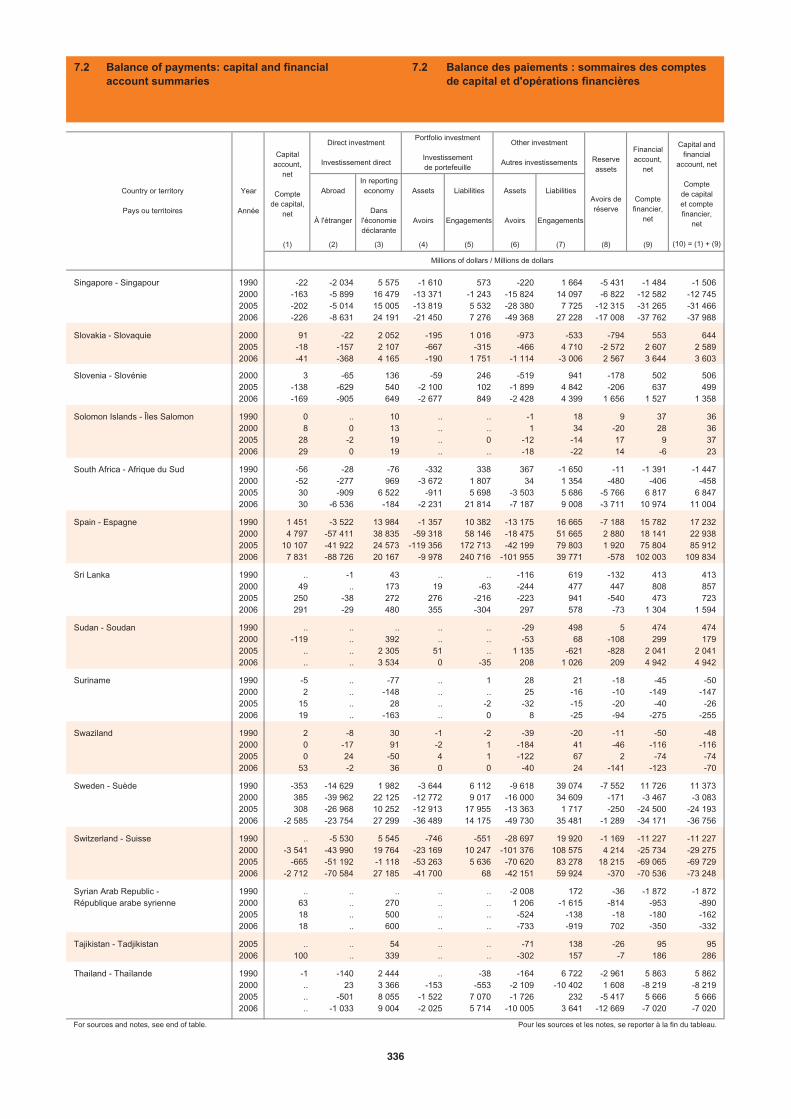
Abroad
À l'étranger
In reporting economy
Dansl'économiedéclarante
Assets
Avoirs
Liabilities
Engagements
Assets
Avoirs
Liabilities
Engagements
(1) (2) (3) (4) (5) (6) (7) (8) (9)
Singapore - Singapour 1990 -22 -2 034 5 575 -1 610 573 -220 1 664 -5 431 -1 484 -1 5062000 -163 -5 899 16 479 -13 371 -1 243 -15 824 14 097 -6 822 -12 582 -12 7452005 -202 -5 014 15 005 -13 819 5 532 -28 380 7 725 -12 315 -31 265 -31 4662006 -226 -8 631 24 191 -21 450 7 276 -49 368 27 228 -17 008 -37 762 -37 988
Slovakia - Slovaquie 2000 91 -22 2 052 -195 1 016 -973 -533 -794 553 6442005 -18 -157 2 107 -667 -315 -466 4 710 -2 572 2 607 2 5892006 -41 -368 4 165 -190 1 751 -1 114 -3 006 2 567 3 644 3 603
Slovenia - Slovénie 2000 3 -65 136 -59 246 -519 941 -178 502 5062005 -138 -629 540 -2 100 102 -1 899 4 842 -206 637 4992006 -169 -905 649 -2 677 849 -2 428 4 399 1 656 1 527 1 358
Solomon Islands - Îles Salomon 1990 0 .. 10 .. .. -1 18 9 37 362000 8 0 13 .. .. 1 34 -20 28 362005 28 -2 19 .. 0 -12 -14 17 9 372006 29 0 19 .. .. -18 -22 14 -6 23
South Africa - Afrique du Sud 1990 -56 -28 -76 -332 338 367 -1 650 -11 -1 391 -1 4472000 -52 -277 969 -3 672 1 807 34 1 354 -480 -406 -4582005 30 -909 6 522 -911 5 698 -3 503 5 686 -5 766 6 817 6 8472006 30 -6 536 -184 -2 231 21 814 -7 187 9 008 -3 711 10 974 11 004
Spain - Espagne 1990 1 451 -3 522 13 984 -1 357 10 382 -13 175 16 665 -7 188 15 782 17 2322000 4 797 -57 411 38 835 -59 318 58 146 -18 475 51 665 2 880 18 141 22 9382005 10 107 -41 922 24 573 -119 356 172 713 -42 199 79 803 1 920 75 804 85 9122006 7 831 -88 726 20 167 -9 978 240 716 -101 955 39 771 -578 102 003 109 834
Sri Lanka 1990 .. -1 43 .. .. -116 619 -132 413 4132000 49 .. 173 19 -63 -244 477 447 808 8572005 250 -38 272 276 -216 -223 941 -540 473 7232006 291 -29 480 355 -304 297 578 -73 1 304 1 594
Sudan - Soudan 1990 .. .. .. .. .. -29 498 5 474 4742000 -119 .. 392 .. .. -53 68 -108 299 1792005 .. .. 2 305 51 .. 1 135 -621 -828 2 041 2 0412006 .. .. 3 534 0 -35 208 1 026 209 4 942 4 942
Suriname 1990 -5 .. -77 .. 1 28 21 -18 -45 -502000 2 .. -148 .. .. 25 -16 -10 -149 -1472005 15 .. 28 .. -2 -32 -15 -20 -40 -262006 19 .. -163 .. 0 8 -25 -94 -275 -255
Swaziland 1990 2 -8 30 -1 -2 -39 -20 -11 -50 -482000 0 -17 91 -2 1 -184 41 -46 -116 -1162005 0 24 -50 4 1 -122 67 2 -74 -742006 53 -2 36 0 0 -40 24 -141 -123 -70
Sweden - Suède 1990 -353 -14 629 1 982 -3 644 6 112 -9 618 39 074 -7 552 11 726 11 3732000 385 -39 962 22 125 -12 772 9 017 -16 000 34 609 -171 -3 467 -3 0832005 308 -26 968 10 252 -12 913 17 955 -13 363 1 717 -250 -24 500 -24 1932006 -2 585 -23 754 27 299 -36 489 14 175 -49 730 35 481 -1 289 -34 171 -36 756
Switzerland - Suisse 1990 .. -5 530 5 545 -746 -551 -28 697 19 920 -1 169 -11 227 -11 2272000 -3 541 -43 990 19 764 -23 169 10 247 -101 376 108 575 4 214 -25 734 -29 2752005 -665 -51 192 -1 118 -53 263 5 636 -70 620 83 278 18 215 -69 065 -69 7292006 -2 712 -70 584 27 185 -41 700 68 -42 151 59 924 -370 -70 536 -73 248
Syrian Arab Republic - 1990 .. .. .. .. .. -2 008 172 -36 -1 872 -1 872République arabe syrienne 2000 63 .. 270 .. .. 1 206 -1 615 -814 -953 -890
2005 18 .. 500 .. .. -524 -138 -18 -180 -1622006 18 .. 600 .. .. -733 -919 702 -350 -332
Tajikistan - Tadjikistan 2005 .. .. 54 .. .. -71 138 -26 95 952006 100 .. 339 .. .. -302 157 -7 186 286
Thailand - Thaïlande 1990 -1 -140 2 444 .. -38 -164 6 722 -2 961 5 863 5 8622000 .. 23 3 366 -153 -553 -2 109 -10 402 1 608 -8 219 -8 2192005 .. -501 8 055 -1 522 7 070 -1 726 232 -5 417 5 666 5 6662006 .. -1 033 9 004 -2 025 5 714 -10 005 3 641 -12 669 -7 020 -7 020
For sources and notes, see end of table. Pour les sources et les notes, se reporter à la fin du tableau.
Year
Année
Capitalaccount,
net
Comptede capital,
net
Direct investment
Investissement direct
Capital and financial
account, net
Comptede capital et compte financier,
net
(10) = (1) + (9)
Millions of dollars / Millions de dollars
Portfolio investment
Investissementde portefeuille
Other investment
Autres investissements Reserveassets
Avoirs de réserve
Financialaccount,
net
Comptefinancier,
net
Country or territory
Pays ou territoires
7.2 Balance of payments: capital and financial account summaries
7.2 Balance des paiements : sommaires des comptes de capital et d'opérations financières
336
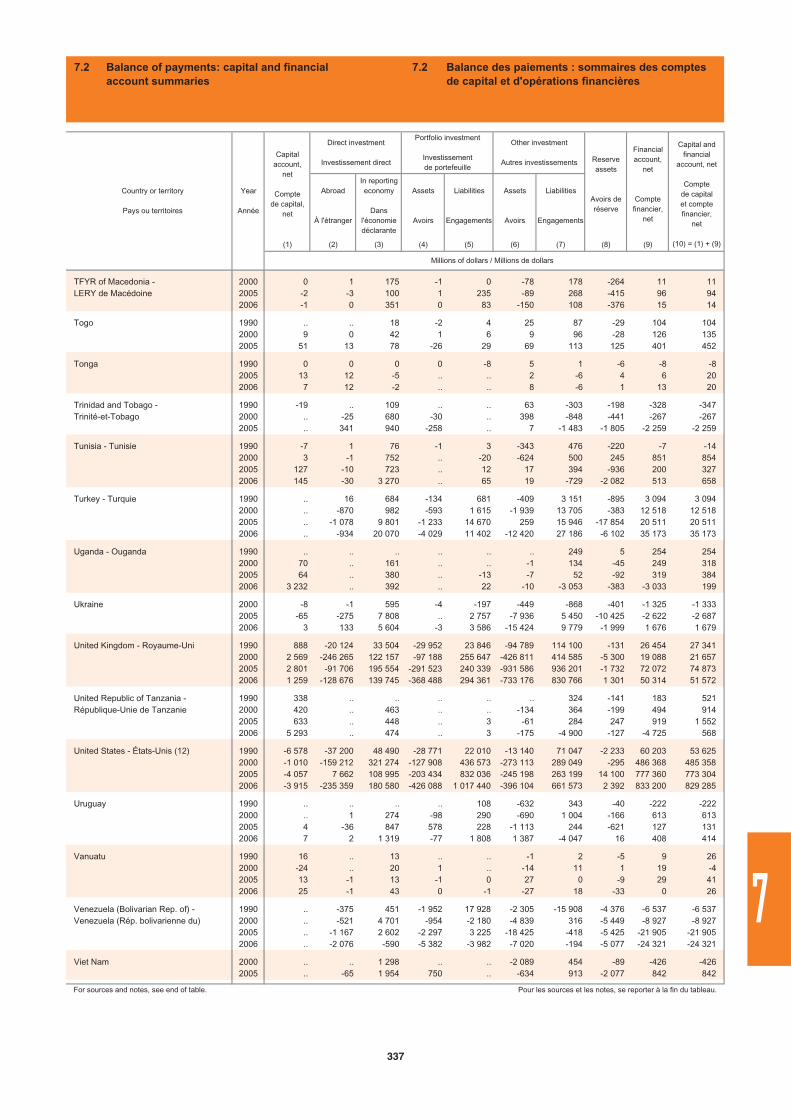
Abroad
À l'étranger
In reporting economy
Dansl'économiedéclarante
Assets
Avoirs
Liabilities
Engagements
Assets
Avoirs
Liabilities
Engagements
(1) (2) (3) (4) (5) (6) (7) (8) (9)
TFYR of Macedonia - 2000 0 1 175 -1 0 -78 178 -264 11 11LERY de Macédoine 2005 -2 -3 100 1 235 -89 268 -415 96 94
2006 -1 0 351 0 83 -150 108 -376 15 14
Togo 1990 .. .. 18 -2 4 25 87 -29 104 1042000 9 0 42 1 6 9 96 -28 126 1352005 51 13 78 -26 29 69 113 125 401 452
Tonga 1990 0 0 0 0 -8 5 1 -6 -8 -82005 13 12 -5 .. .. 2 -6 4 6 202006 7 12 -2 .. .. 8 -6 1 13 20
Trinidad and Tobago - 1990 -19 .. 109 .. .. 63 -303 -198 -328 -347Trinité-et-Tobago 2000 .. -25 680 -30 .. 398 -848 -441 -267 -267
2005 .. 341 940 -258 .. 7 -1 483 -1 805 -2 259 -2 259
Tunisia - Tunisie 1990 -7 1 76 -1 3 -343 476 -220 -7 -142000 3 -1 752 .. -20 -624 500 245 851 8542005 127 -10 723 .. 12 17 394 -936 200 3272006 145 -30 3 270 .. 65 19 -729 -2 082 513 658
Turkey - Turquie 1990 .. 16 684 -134 681 -409 3 151 -895 3 094 3 0942000 .. -870 982 -593 1 615 -1 939 13 705 -383 12 518 12 5182005 .. -1 078 9 801 -1 233 14 670 259 15 946 -17 854 20 511 20 5112006 .. -934 20 070 -4 029 11 402 -12 420 27 186 -6 102 35 173 35 173
Uganda - Ouganda 1990 .. .. .. .. .. .. 249 5 254 2542000 70 .. 161 .. .. -1 134 -45 249 3182005 64 .. 380 .. -13 -7 52 -92 319 3842006 3 232 .. 392 .. 22 -10 -3 053 -383 -3 033 199
Ukraine 2000 -8 -1 595 -4 -197 -449 -868 -401 -1 325 -1 3332005 -65 -275 7 808 .. 2 757 -7 936 5 450 -10 425 -2 622 -2 6872006 3 133 5 604 -3 3 586 -15 424 9 779 -1 999 1 676 1 679
United Kingdom - Royaume-Uni 1990 888 -20 124 33 504 -29 952 23 846 -94 789 114 100 -131 26 454 27 3412000 2 569 -246 265 122 157 -97 188 255 647 -426 811 414 585 -5 300 19 088 21 6572005 2 801 -91 706 195 554 -291 523 240 339 -931 586 936 201 -1 732 72 072 74 8732006 1 259 -128 676 139 745 -368 488 294 361 -733 176 830 766 1 301 50 314 51 572
United Republic of Tanzania - 1990 338 .. .. .. .. .. 324 -141 183 521République-Unie de Tanzanie 2000 420 .. 463 .. .. -134 364 -199 494 914
2005 633 .. 448 .. 3 -61 284 247 919 1 5522006 5 293 .. 474 .. 3 -175 -4 900 -127 -4 725 568
United States - États-Unis (12) 1990 -6 578 -37 200 48 490 -28 771 22 010 -13 140 71 047 -2 233 60 203 53 6252000 -1 010 -159 212 321 274 -127 908 436 573 -273 113 289 049 -295 486 368 485 3582005 -4 057 7 662 108 995 -203 434 832 036 -245 198 263 199 14 100 777 360 773 3042006 -3 915 -235 359 180 580 -426 088 1 017 440 -396 104 661 573 2 392 833 200 829 285
Uruguay 1990 .. .. .. .. 108 -632 343 -40 -222 -2222000 .. 1 274 -98 290 -690 1 004 -166 613 6132005 4 -36 847 578 228 -1 113 244 -621 127 1312006 7 2 1 319 -77 1 808 1 387 -4 047 16 408 414
Vanuatu 1990 16 .. 13 .. .. -1 2 -5 9 262000 -24 .. 20 1 .. -14 11 1 19 -42005 13 -1 13 -1 0 27 0 -9 29 412006 25 -1 43 0 -1 -27 18 -33 0 26
Venezuela (Bolivarian Rep. of) - 1990 .. -375 451 -1 952 17 928 -2 305 -15 908 -4 376 -6 537 -6 537Venezuela (Rép. bolivarienne du) 2000 .. -521 4 701 -954 -2 180 -4 839 316 -5 449 -8 927 -8 927
2005 .. -1 167 2 602 -2 297 3 225 -18 425 -418 -5 425 -21 905 -21 9052006 .. -2 076 -590 -5 382 -3 982 -7 020 -194 -5 077 -24 321 -24 321
Viet Nam 2000 .. .. 1 298 .. .. -2 089 454 -89 -426 -4262005 .. -65 1 954 750 .. -634 913 -2 077 842 842
For sources and notes, see end of table. Pour les sources et les notes, se reporter à la fin du tableau.
Reserveassets
Avoirs de réserve
Financialaccount,
net
Comptefinancier,
net
Country or territory
Pays ou territoires
Year
Année
Capitalaccount,
net
Comptede capital,
net
Direct investment
Investissement direct
Capital and financial
account, net
Comptede capital et compte financier,
net
(10) = (1) + (9)
Millions of dollars / Millions de dollars
Portfolio investment
Investissementde portefeuille
Other investment
Autres investissements
7.2 Balance of payments: capital and financial account summaries
7.2 Balance des paiements : sommaires des comptes de capital et d'opérations financières
337
7
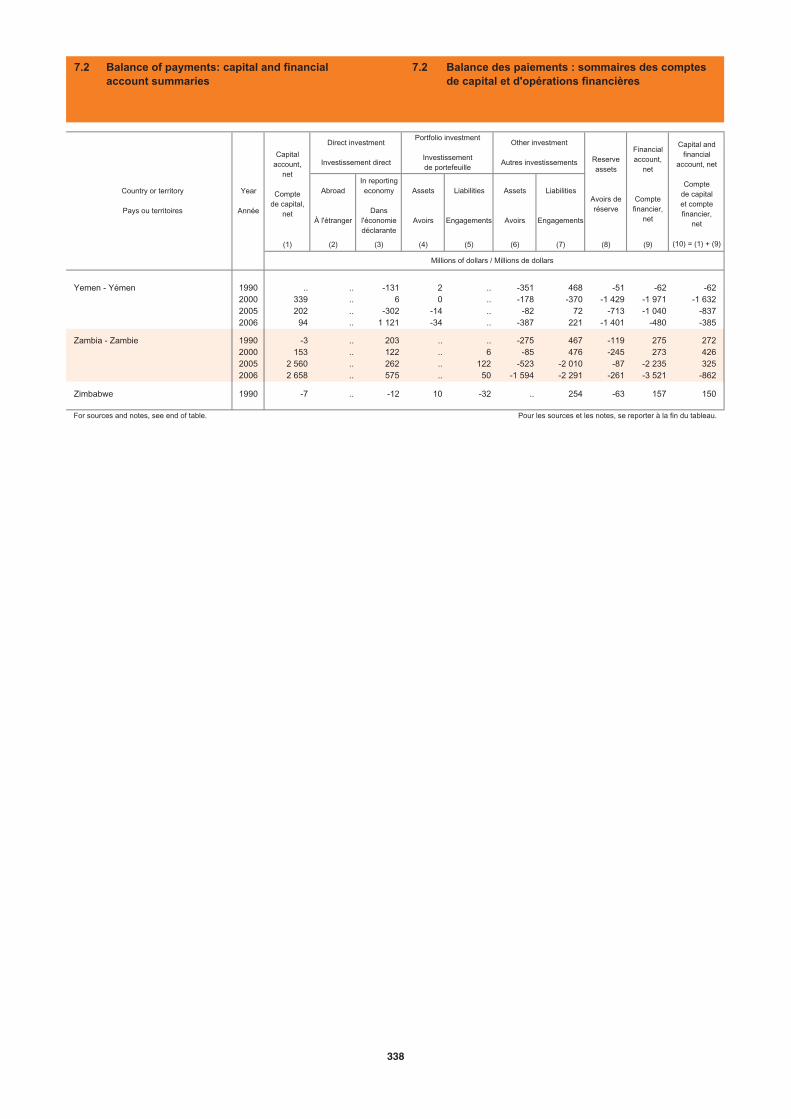
Abroad
À l'étranger
In reporting economy
Dansl'économiedéclarante
Assets
Avoirs
Liabilities
Engagements
Assets
Avoirs
Liabilities
Engagements
(1) (2) (3) (4) (5) (6) (7) (8) (9)
Yemen - Yémen 1990 .. .. -131 2 .. -351 468 -51 -62 -622000 339 .. 6 0 .. -178 -370 -1 429 -1 971 -1 6322005 202 .. -302 -14 .. -82 72 -713 -1 040 -8372006 94 .. 1 121 -34 .. -387 221 -1 401 -480 -385
Zambia - Zambie 1990 -3 .. 203 .. .. -275 467 -119 275 2722000 153 .. 122 .. 6 -85 476 -245 273 4262005 2 560 .. 262 .. 122 -523 -2 010 -87 -2 235 3252006 2 658 .. 575 .. 50 -1 594 -2 291 -261 -3 521 -862
Zimbabwe 1990 -7 .. -12 10 -32 .. 254 -63 157 150
For sources and notes, see end of table. Pour les sources et les notes, se reporter à la fin du tableau.
Year
Année
Capitalaccount,
net
Comptede capital,
net
Direct investment
Investissement direct
Capital and financial
account, net
Comptede capital et compte financier,
net
(10) = (1) + (9)
Millions of dollars / Millions de dollars
Portfolio investment
Investissementde portefeuille
Other investment
Autres investissements Reserveassets
Avoirs de réserve
Financialaccount,
net
Comptefinancier,
net
Country or territory
Pays ou territoires
7.2 Balance of payments: capital and financial account summaries
7.2 Balance des paiements : sommaires des comptes de capital et d'opérations financières
338

7.2 Balance of payments: capital and financial account summaries
7.2 Balance des paiements : sommaires des comptes de capital et d'opérations financières
(1)
(2),(3)
(4),(5)
(6),(7)
(8)
(9)
(11)
(12)
Capital accountThe capital account consists of capital transfers and of acquisition or disposal of non-produced, non-financial assets. Transfers refer to transactions exchanged without quid-pro-quo (without reciprocity). Capital transfers include transfers of ownership of fixedassets or of funds linked to acquisition or disposal of fixed assets. They further incorporatecancellations of liabilities by creditors, where the later receive no counterpart value.Acquisitions/disposals of non-produced, non-financial assets mainly refer to intangibles,such as patents, leases, and goodwill. Items are entered in capital account as net creditsor debits. Column 1, as presented here, shows the total net amounts (net credits less netdebits).
Direct investment Within the financial account, direct investment is firstly split according to its direction intodirect investment abroad (column 2) and direct investment in reporting economy (column3). Further subdivisions include: direct investment in equity capital, reinvested earningsand other direct investment capital (inter-company transactions.) Direct investment is defined as investment that reflects a lasting interest of a residententity of one economy (direct investor) in an entity resident in another economy (directinvestment enterprise). It covers all the transactions between direct investors and directinvestment enterprises. Direct investment implies a significant degree of influence by theinvestor on the management of the direct investment enterprise.
Portfolio investmentWithin portfolio investment the distinction is being made between assets (column 4) andliabilities (column 5). Assets are claims on the rest of the world and liabilities representindebtedness to the rest of the world. Portfolio investment covers transactions in equitysecurities and debt securities. The later are subdivided into bonds, notes, money marketinstruments and financial derivatives (when the derivatives generate financial claims orliabilities).
Other investmentOther investment is a residual category that covers all financial transactions not includedunder direct investment, portfolio investment or reserve assets. Assets (column 6) andliabilities (column 7) in this category are classified primarily on an instrument bases, suchas trade credits, loans, currency and deposits.
Reserve assetsIncludes: monetary gold, special drawing rights, reserve position in the IMF, foreignexchange and other claims.
Financial accountThe financial account constituents are classified according to the type of investment or bya functional breakdown into four main components: direct investment, portfolio investment,other investment and reserve assets. Each component is further divided into relevantsubcomponents. The sum of figures in columns 2 to 8 is equal to column 9 (financialaccount balance). Where the financial account subcomponents do not add up to the totalnet financial account, the difference can be attributed to financial derivatives that are notshown within this table.
The financial account total for the year 1990 does not add up to the total of its sub-components owing to data revision by the Japanese authorities; it is recommended to usethe financial account sum as given rather than to sum up the sub-components for thisyear.
Including United States Virgin Islands
Sources:- International Monetary Fund (IMF), Balance of Payments Statistics on CD-ROM.
Notes:
(1)
(2),(3)
(4),(5)
(6),(7)
(8)
(9)
(11)
(12)
Compte de capitalLe compte de capital est subdivisé en transferts de capital et en acquisitions oucessions d'avoirs non-financiers non-produits. Les transferts sont les transactionséchangées sans quid-pro-quo (sans réciprocité.) Les transferts de capitauxcomprennent les transferts de propriété d'un actif fixe ou les transferts de fonds liés àl'acquisition ou à la cession d'un actif fixe. De plus, ils incorporent la remise d'unedette par un créancier, sans que celui-ci ne reçoive une valeur équivalente. Lesacquisitions ou cession d'avoirs non-financiers non-produits se réfèrent aux avoirsincorporels tels que les brevets, les contrats de location et marques. Les éléments ducompte de capital sont reportés comme les crédits ou les débits nets. La colonne (1)présente les totaux (crédits nets moins débits nets).
Investissement directDans le Compte financier, l'investissement direct est d'abord divisé en fonction dusens des mouvements de capitaux entre investissement de l'économie déclarante àl'étranger (colonne 2) et celui en provenance de l'étranger investi dans l'économiedéclarante (colonne 3). Les subdivisions suivantes incluent : capital social, bénéficesréinvestis et autres transactions. L'investissement direct étranger est accompagnéd'un intérêt durable de la part d'une entité résidente d'une économie (l'investisseurdirect) pour une entité résidente d'une autre économie (l'entreprise d'investissementdirect.) Il recouvre toutes les transactions entre les investisseurs directs et lesentreprises d'investissement direct. L'investissement direct donne à l'investisseur leprivilège d'exercer une influence significative sur la gestion de l'entreprise danslaquelle il a investi.
Investissement de portefeuilleEn investissement de portefeuille on distingue les avoirs (colonne 4) et lesengagements (colonne 5). Les avoirs représentent les créances sur les non-résidentset les engagements les endettements envers les non-résidents. Les investissementsde portefeuille couvrent les transactions portant sur les titres de participation et lestitres de créances, ces dernières étant subdivisées en trois catégories : obligations etautres titres d'emprunt, instruments du marché monétaire et produits financiersdérivés (lorsque les dérivés résultent en créances ou en engagements financiers).
Autres investissementsLes autres investissements constituent une catégorie résiduelle qui comprend toutesles opérations sur actifs et passifs financiers qui ne figurent pas parmi lesinvestissements directs, les investissements de portefeuille ou les avoirs de réserve.Les avoirs (colonne 6) et les engagements (colonne 7) sont répartis par instrumentstels que les crédits commerciaux, les prêts, la monnaie fiduciaire et les dépôts.
Avoirs de réserveComprend : l'or monétaire, droits de tirage spéciaux, position de réserve dans le FMI,devises et autres créances.
Compte financierLes éléments qui constituent le compte financier se divisent selon le typed'investissement ou selon une ventilation fonctionnelle en quatre principauxcomposants : investissements directs, investissements de portefeuille, autresinvestissements et avoirs de réserve. Chaque composant comprend plusieurs sous-groupes. La somme de tous les chiffres des colonnes 2 à 8 est égale à la colonne 9(balance du compte financier). Dans le cas où la somme des éléments du comptefinancier ne correspond pas au total, la différence peut être attribuée aux instrumentsfinanciers dérivés, qui ne sont pas présentés dans ce tableau.
Les données du compte financier net pour l'année 1990 ne correspondent pas à lasomme des composants du compte financier à cause de révision des statistiquesnationales du Japon ; il est préconisé d'utiliser les chiffres fournis pour ladite série,plutôt que de calculer la somme d'éléments composants pour cette année.
Y compris les Îles Vierges américaines
Sources : - Fonds monétaire international (FMI), Statistiques de la balance des paiements sur CD-ROM.
Notes :
339
7
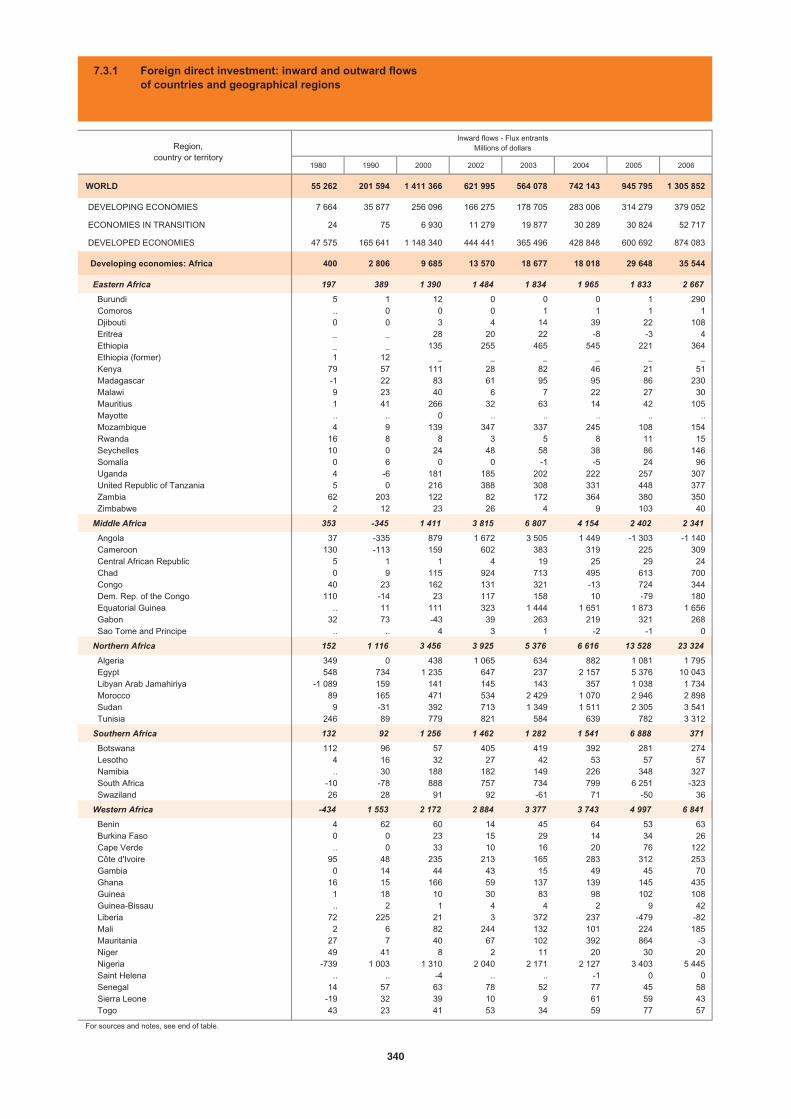
1980 1990 2000 2002 2003 2004 2005 2006
WORLD 55 262 201 594 1 411 366 621 995 564 078 742 143 945 795 1 305 852
DEVELOPING ECONOMIES 7 664 35 877 256 096 166 275 178 705 283 006 314 279 379 052
ECONOMIES IN TRANSITION 24 75 6 930 11 279 19 877 30 289 30 824 52 717
DEVELOPED ECONOMIES 47 575 165 641 1 148 340 444 441 365 496 428 848 600 692 874 083
Developing economies: Africa 400 2 806 9 685 13 570 18 677 18 018 29 648 35 544
Eastern Africa 197 389 1 390 1 484 1 834 1 965 1 833 2 667
Burundi 5 1 12 0 0 0 1 290 Comoros .. 0 0 0 1 1 1 1 Djibouti 0 0 3 4 14 39 22 108 Eritrea _ _ 28 20 22 -8 -3 4 Ethiopia _ _ 135 255 465 545 221 364 Ethiopia (former) 1 12 _ _ _ _ _ _ Kenya 79 57 111 28 82 46 21 51 Madagascar -1 22 83 61 95 95 86 230 Malawi 9 23 40 6 7 22 27 30 Mauritius 1 41 266 32 63 14 42 105 Mayotte .. .. 0 .. .. .. .. .. Mozambique 4 9 139 347 337 245 108 154 Rwanda 16 8 8 3 5 8 11 15 Seychelles 10 0 24 48 58 38 86 146 Somalia 0 6 0 0 -1 -5 24 96 Uganda 4 -6 181 185 202 222 257 307 United Republic of Tanzania 5 0 216 388 308 331 448 377 Zambia 62 203 122 82 172 364 380 350 Zimbabwe 2 12 23 26 4 9 103 40
Middle Africa 353 -345 1 411 3 815 6 807 4 154 2 402 2 341
Angola 37 -335 879 1 672 3 505 1 449 -1 303 -1 140 Cameroon 130 -113 159 602 383 319 225 309 Central African Republic 5 1 1 4 19 25 29 24 Chad 0 9 115 924 713 495 613 700 Congo 40 23 162 131 321 -13 724 344 Dem. Rep. of the Congo 110 -14 23 117 158 10 -79 180 Equatorial Guinea .. 11 111 323 1 444 1 651 1 873 1 656 Gabon 32 73 -43 39 263 219 321 268 Sao Tome and Principe .. .. 4 3 1 -2 -1 0
Northern Africa 152 1 116 3 456 3 925 5 376 6 616 13 528 23 324
Algeria 349 0 438 1 065 634 882 1 081 1 795 Egypt 548 734 1 235 647 237 2 157 5 376 10 043 Libyan Arab Jamahiriya -1 089 159 141 145 143 357 1 038 1 734 Morocco 89 165 471 534 2 429 1 070 2 946 2 898 Sudan 9 -31 392 713 1 349 1 511 2 305 3 541 Tunisia 246 89 779 821 584 639 782 3 312
Southern Africa 132 92 1 256 1 462 1 282 1 541 6 888 371
Botswana 112 96 57 405 419 392 281 274 Lesotho 4 16 32 27 42 53 57 57 Namibia .. 30 188 182 149 226 348 327 South Africa -10 -78 888 757 734 799 6 251 -323 Swaziland 26 28 91 92 -61 71 -50 36
Western Africa -434 1 553 2 172 2 884 3 377 3 743 4 997 6 841
Benin 4 62 60 14 45 64 53 63 Burkina Faso 0 0 23 15 29 14 34 26 Cape Verde .. 0 33 10 16 20 76 122 Côte d'Ivoire 95 48 235 213 165 283 312 253 Gambia 0 14 44 43 15 49 45 70 Ghana 16 15 166 59 137 139 145 435 Guinea 1 18 10 30 83 98 102 108 Guinea-Bissau .. 2 1 4 4 2 9 42 Liberia 72 225 21 3 372 237 -479 -82 Mali 2 6 82 244 132 101 224 185 Mauritania 27 7 40 67 102 392 864 -3 Niger 49 41 8 2 11 20 30 20 Nigeria -739 1 003 1 310 2 040 2 171 2 127 3 403 5 445 Saint Helena .. .. -4 .. .. -1 0 0 Senegal 14 57 63 78 52 77 45 58 Sierra Leone -19 32 39 10 9 61 59 43 Togo 43 23 41 53 34 59 77 57
For sources and notes, see end of table.
Inward flows - Flux entrantsMillions of dollarsRegion,
country or territory
7.3.1 Foreign direct investment: inward and outward flowsof countries and geographical regions
340
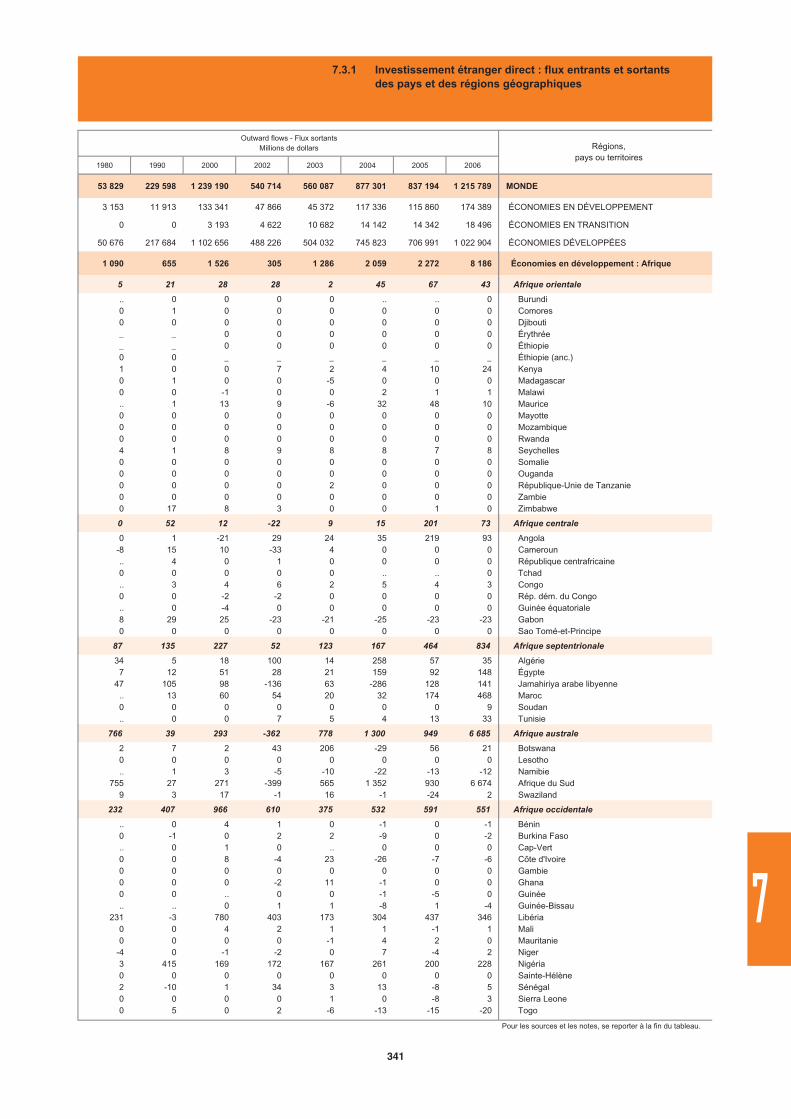
1980 1990 2000 2002 2003 2004 2005 2006
53 829 229 598 1 239 190 540 714 560 087 877 301 837 194 1 215 789 MONDE
3 153 11 913 133 341 47 866 45 372 117 336 115 860 174 389 ÉCONOMIES EN DÉVELOPPEMENT
0 0 3 193 4 622 10 682 14 142 14 342 18 496 ÉCONOMIES EN TRANSITION
50 676 217 684 1 102 656 488 226 504 032 745 823 706 991 1 022 904 ÉCONOMIES DÉVELOPPÉES
1 090 655 1 526 305 1 286 2 059 2 272 8 186 Économies en développement : Afrique
5 21 28 28 2 45 67 43 Afrique orientale
.. 0 0 0 0 .. .. 0 Burundi0 1 0 0 0 0 0 0 Comores0 0 0 0 0 0 0 0 Djibouti_ _ 0 0 0 0 0 0 Érythrée_ _ 0 0 0 0 0 0 Éthiopie0 0 _ _ _ _ _ _ Éthiopie (anc.)1 0 0 7 2 4 10 24 Kenya0 1 0 0 -5 0 0 0 Madagascar0 0 -1 0 0 2 1 1 Malawi.. 1 13 9 -6 32 48 10 Maurice0 0 0 0 0 0 0 0 Mayotte0 0 0 0 0 0 0 0 Mozambique0 0 0 0 0 0 0 0 Rwanda4 1 8 9 8 8 7 8 Seychelles0 0 0 0 0 0 0 0 Somalie0 0 0 0 0 0 0 0 Ouganda0 0 0 0 2 0 0 0 République-Unie de Tanzanie0 0 0 0 0 0 0 0 Zambie0 17 8 3 0 0 1 0 Zimbabwe
0 52 12 -22 9 15 201 73 Afrique centrale
0 1 -21 29 24 35 219 93 Angola-8 15 10 -33 4 0 0 0 Cameroun.. 4 0 1 0 0 0 0 République centrafricaine0 0 0 0 0 .. .. 0 Tchad.. 3 4 6 2 5 4 3 Congo0 0 -2 -2 0 0 0 0 Rép. dém. du Congo.. 0 -4 0 0 0 0 0 Guinée équatoriale8 29 25 -23 -21 -25 -23 -23 Gabon0 0 0 0 0 0 0 0 Sao Tomé-et-Principe
87 135 227 52 123 167 464 834 Afrique septentrionale
34 5 18 100 14 258 57 35 Algérie7 12 51 28 21 159 92 148 Égypte
47 105 98 -136 63 -286 128 141 Jamahiriya arabe libyenne.. 13 60 54 20 32 174 468 Maroc0 0 0 0 0 0 0 9 Soudan.. 0 0 7 5 4 13 33 Tunisie
766 39 293 -362 778 1 300 949 6 685 Afrique australe
2 7 2 43 206 -29 56 21 Botswana0 0 0 0 0 0 0 0 Lesotho.. 1 3 -5 -10 -22 -13 -12 Namibie
755 27 271 -399 565 1 352 930 6 674 Afrique du Sud9 3 17 -1 16 -1 -24 2 Swaziland
232 407 966 610 375 532 591 551 Afrique occidentale
.. 0 4 1 0 -1 0 -1 Bénin0 -1 0 2 2 -9 0 -2 Burkina Faso.. 0 1 0 .. 0 0 0 Cap-Vert0 0 8 -4 23 -26 -7 -6 Côte d'Ivoire0 0 0 0 0 0 0 0 Gambie0 0 0 -2 11 -1 0 0 Ghana0 0 .. 0 0 -1 -5 0 Guinée.. .. 0 1 1 -8 1 -4 Guinée-Bissau
231 -3 780 403 173 304 437 346 Libéria0 0 4 2 1 1 -1 1 Mali0 0 0 0 -1 4 2 0 Mauritanie
-4 0 -1 -2 0 7 -4 2 Niger3 415 169 172 167 261 200 228 Nigéria0 0 0 0 0 0 0 0 Sainte-Hélène2 -10 1 34 3 13 -8 5 Sénégal0 0 0 0 1 0 -8 3 Sierra Leone0 5 0 2 -6 -13 -15 -20 Togo
Pour les sources et les notes, se reporter à la fin du tableau.
Régions,pays ou territoires
Outward flows - Flux sortantsMillions de dollars
7.3.1 Investissement étranger direct : flux entrants et sortantsdes pays et des régions géographiques
341
7
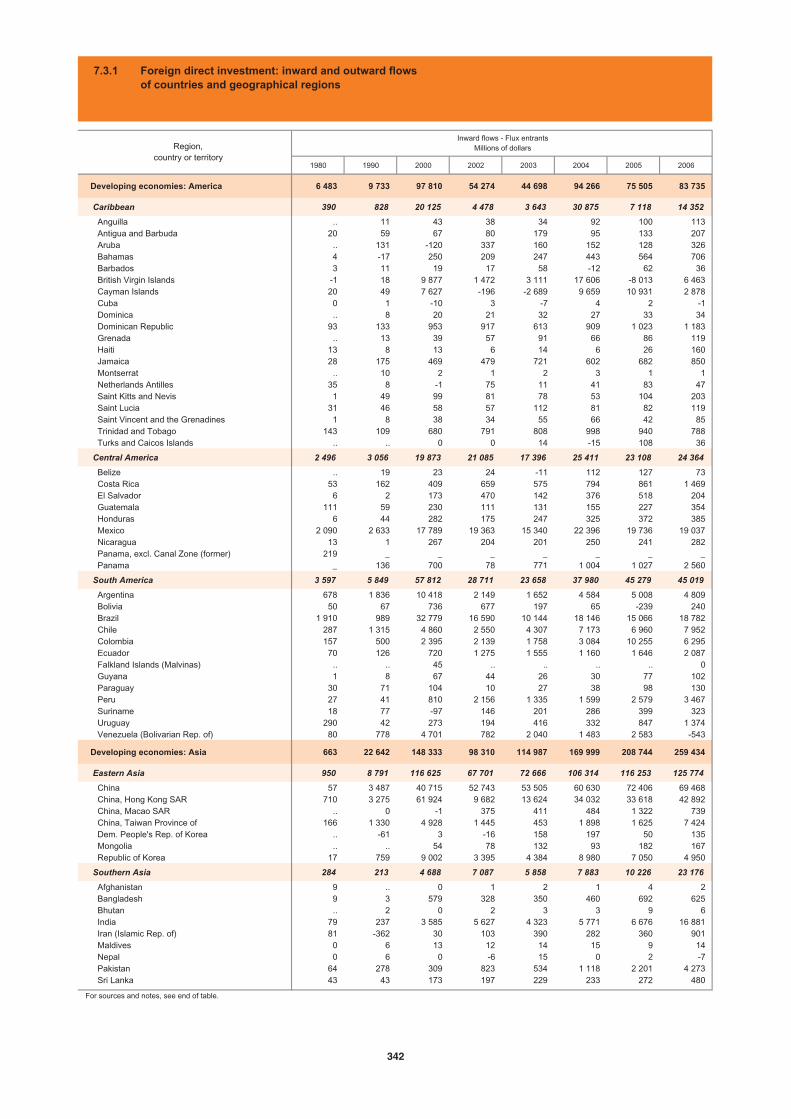
1980 1990 2000 2002 2003 2004 2005 2006
Developing economies: America 6 483 9 733 97 810 54 274 44 698 94 266 75 505 83 735
Caribbean 390 828 20 125 4 478 3 643 30 875 7 118 14 352
Anguilla .. 11 43 38 34 92 100 113 Antigua and Barbuda 20 59 67 80 179 95 133 207 Aruba .. 131 -120 337 160 152 128 326 Bahamas 4 -17 250 209 247 443 564 706 Barbados 3 11 19 17 58 -12 62 36 British Virgin Islands -1 18 9 877 1 472 3 111 17 606 -8 013 6 463 Cayman Islands 20 49 7 627 -196 -2 689 9 659 10 931 2 878 Cuba 0 1 -10 3 -7 4 2 -1 Dominica .. 8 20 21 32 27 33 34 Dominican Republic 93 133 953 917 613 909 1 023 1 183 Grenada .. 13 39 57 91 66 86 119 Haiti 13 8 13 6 14 6 26 160 Jamaica 28 175 469 479 721 602 682 850 Montserrat .. 10 2 1 2 3 1 1 Netherlands Antilles 35 8 -1 75 11 41 83 47 Saint Kitts and Nevis 1 49 99 81 78 53 104 203 Saint Lucia 31 46 58 57 112 81 82 119 Saint Vincent and the Grenadines 1 8 38 34 55 66 42 85 Trinidad and Tobago 143 109 680 791 808 998 940 788 Turks and Caicos Islands .. .. 0 0 14 -15 108 36
Central America 2 496 3 056 19 873 21 085 17 396 25 411 23 108 24 364
Belize .. 19 23 24 -11 112 127 73 Costa Rica 53 162 409 659 575 794 861 1 469 El Salvador 6 2 173 470 142 376 518 204 Guatemala 111 59 230 111 131 155 227 354 Honduras 6 44 282 175 247 325 372 385 Mexico 2 090 2 633 17 789 19 363 15 340 22 396 19 736 19 037 Nicaragua 13 1 267 204 201 250 241 282 Panama, excl. Canal Zone (former) 219 _ _ _ _ _ _ _ Panama _ 136 700 78 771 1 004 1 027 2 560
South America 3 597 5 849 57 812 28 711 23 658 37 980 45 279 45 019
Argentina 678 1 836 10 418 2 149 1 652 4 584 5 008 4 809 Bolivia 50 67 736 677 197 65 -239 240 Brazil 1 910 989 32 779 16 590 10 144 18 146 15 066 18 782 Chile 287 1 315 4 860 2 550 4 307 7 173 6 960 7 952 Colombia 157 500 2 395 2 139 1 758 3 084 10 255 6 295 Ecuador 70 126 720 1 275 1 555 1 160 1 646 2 087 Falkland Islands (Malvinas) .. .. 45 .. .. .. .. 0 Guyana 1 8 67 44 26 30 77 102 Paraguay 30 71 104 10 27 38 98 130 Peru 27 41 810 2 156 1 335 1 599 2 579 3 467 Suriname 18 77 -97 146 201 286 399 323 Uruguay 290 42 273 194 416 332 847 1 374 Venezuela (Bolivarian Rep. of) 80 778 4 701 782 2 040 1 483 2 583 -543
Developing economies: Asia 663 22 642 148 333 98 310 114 987 169 999 208 744 259 434
Eastern Asia 950 8 791 116 625 67 701 72 666 106 314 116 253 125 774
China 57 3 487 40 715 52 743 53 505 60 630 72 406 69 468 China, Hong Kong SAR 710 3 275 61 924 9 682 13 624 34 032 33 618 42 892 China, Macao SAR .. 0 -1 375 411 484 1 322 739 China, Taiwan Province of 166 1 330 4 928 1 445 453 1 898 1 625 7 424 Dem. People's Rep. of Korea .. -61 3 -16 158 197 50 135 Mongolia .. .. 54 78 132 93 182 167 Republic of Korea 17 759 9 002 3 395 4 384 8 980 7 050 4 950
Southern Asia 284 213 4 688 7 087 5 858 7 883 10 226 23 176
Afghanistan 9 .. 0 1 2 1 4 2 Bangladesh 9 3 579 328 350 460 692 625 Bhutan .. 2 0 2 3 3 9 6 India 79 237 3 585 5 627 4 323 5 771 6 676 16 881 Iran (Islamic Rep. of) 81 -362 30 103 390 282 360 901 Maldives 0 6 13 12 14 15 9 14 Nepal 0 6 0 -6 15 0 2 -7 Pakistan 64 278 309 823 534 1 118 2 201 4 273 Sri Lanka 43 43 173 197 229 233 272 480
For sources and notes, see end of table.
Region,country or territory
Inward flows - Flux entrantsMillions of dollars
7.3.1 Foreign direct investment: inward and outward flowsof countries and geographical regions
342
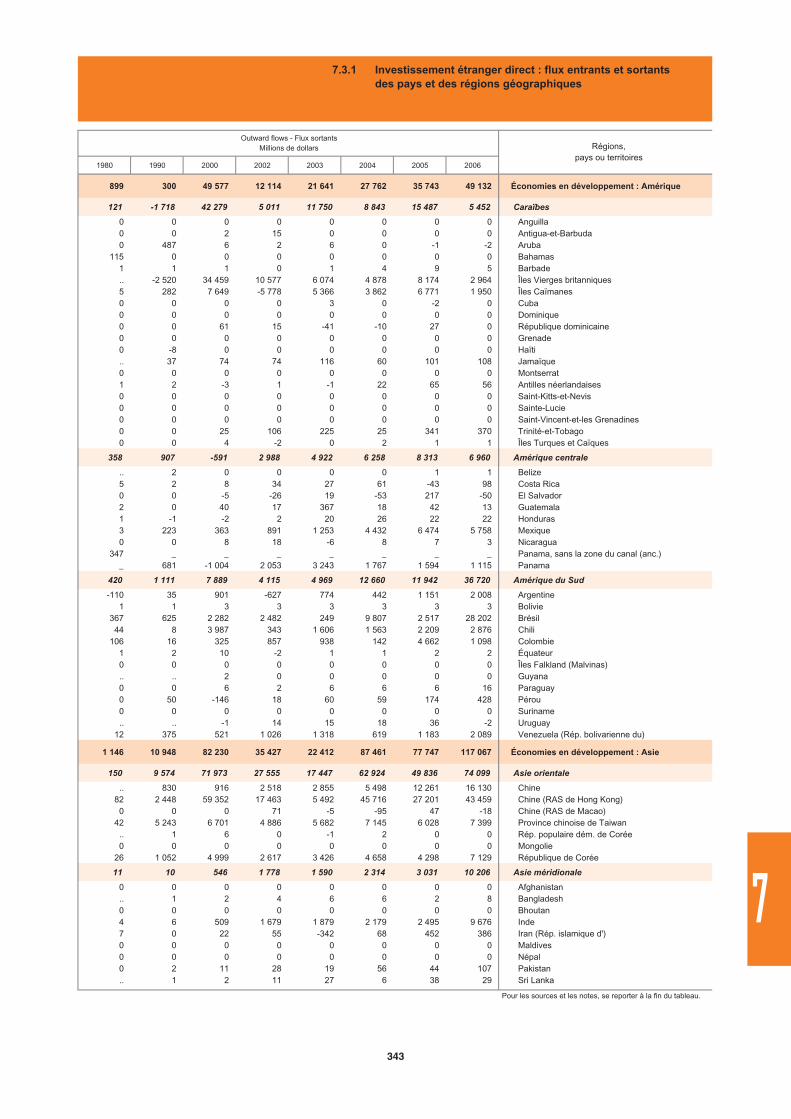
1980 1990 2000 2002 2003 2004 2005 2006
899 300 49 577 12 114 21 641 27 762 35 743 49 132 Économies en développement : Amérique
121 -1 718 42 279 5 011 11 750 8 843 15 487 5 452 Caraïbes
0 0 0 0 0 0 0 0 Anguilla0 0 2 15 0 0 0 0 Antigua-et-Barbuda0 487 6 2 6 0 -1 -2 Aruba
115 0 0 0 0 0 0 0 Bahamas1 1 1 0 1 4 9 5 Barbade.. -2 520 34 459 10 577 6 074 4 878 8 174 2 964 Îles Vierges britanniques5 282 7 649 -5 778 5 366 3 862 6 771 1 950 Îles Caïmanes0 0 0 0 3 0 -2 0 Cuba0 0 0 0 0 0 0 0 Dominique0 0 61 15 -41 -10 27 0 République dominicaine0 0 0 0 0 0 0 0 Grenade0 -8 0 0 0 0 0 0 Haïti.. 37 74 74 116 60 101 108 Jamaïque0 0 0 0 0 0 0 0 Montserrat1 2 -3 1 -1 22 65 56 Antilles néerlandaises0 0 0 0 0 0 0 0 Saint-Kitts-et-Nevis0 0 0 0 0 0 0 0 Sainte-Lucie0 0 0 0 0 0 0 0 Saint-Vincent-et-les Grenadines0 0 25 106 225 25 341 370 Trinité-et-Tobago0 0 4 -2 0 2 1 1 Îles Turques et Caïques
358 907 -591 2 988 4 922 6 258 8 313 6 960 Amérique centrale
.. 2 0 0 0 0 1 1 Belize5 2 8 34 27 61 -43 98 Costa Rica0 0 -5 -26 19 -53 217 -50 El Salvador2 0 40 17 367 18 42 13 Guatemala1 -1 -2 2 20 26 22 22 Honduras3 223 363 891 1 253 4 432 6 474 5 758 Mexique0 0 8 18 -6 8 7 3 Nicaragua
347 _ _ _ _ _ _ _ Panama, sans la zone du canal (anc.)_ 681 -1 004 2 053 3 243 1 767 1 594 1 115 Panama
420 1 111 7 889 4 115 4 969 12 660 11 942 36 720 Amérique du Sud
-110 35 901 -627 774 442 1 151 2 008 Argentine1 1 3 3 3 3 3 3 Bolivie
367 625 2 282 2 482 249 9 807 2 517 28 202 Brésil44 8 3 987 343 1 606 1 563 2 209 2 876 Chili
106 16 325 857 938 142 4 662 1 098 Colombie1 2 10 -2 1 1 2 2 Équateur0 0 0 0 0 0 0 0 Îles Falkland (Malvinas).. .. 2 0 0 0 0 0 Guyana0 0 6 2 6 6 6 16 Paraguay0 50 -146 18 60 59 174 428 Pérou0 0 0 0 0 0 0 0 Suriname.. .. -1 14 15 18 36 -2 Uruguay
12 375 521 1 026 1 318 619 1 183 2 089 Venezuela (Rép. bolivarienne du)
1 146 10 948 82 230 35 427 22 412 87 461 77 747 117 067 Économies en développement : Asie
150 9 574 71 973 27 555 17 447 62 924 49 836 74 099 Asie orientale
.. 830 916 2 518 2 855 5 498 12 261 16 130 Chine82 2 448 59 352 17 463 5 492 45 716 27 201 43 459 Chine (RAS de Hong Kong)
0 0 0 71 -5 -95 47 -18 Chine (RAS de Macao)42 5 243 6 701 4 886 5 682 7 145 6 028 7 399 Province chinoise de Taiwan
.. 1 6 0 -1 2 0 0 Rép. populaire dém. de Corée0 0 0 0 0 0 0 0 Mongolie
26 1 052 4 999 2 617 3 426 4 658 4 298 7 129 République de Corée
11 10 546 1 778 1 590 2 314 3 031 10 206 Asie méridionale
0 0 0 0 0 0 0 0 Afghanistan.. 1 2 4 6 6 2 8 Bangladesh0 0 0 0 0 0 0 0 Bhoutan4 6 509 1 679 1 879 2 179 2 495 9 676 Inde7 0 22 55 -342 68 452 386 Iran (Rép. islamique d')0 0 0 0 0 0 0 0 Maldives0 0 0 0 0 0 0 0 Népal0 2 11 28 19 56 44 107 Pakistan.. 1 2 11 27 6 38 29 Sri Lanka
Pour les sources et les notes, se reporter à la fin du tableau.
Outward flows - Flux sortantsMillions de dollars Régions,
pays ou territoires
7.3.1 Investissement étranger direct : flux entrants et sortantsdes pays et des régions géographiques
343
7
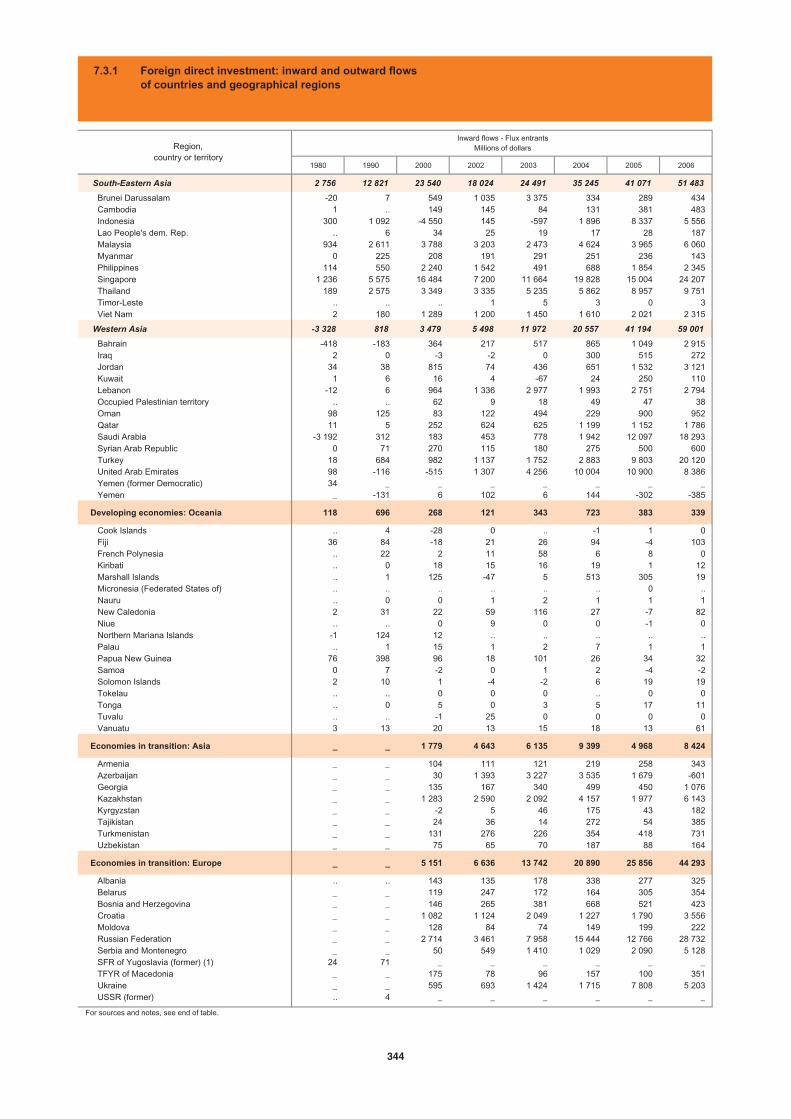
1980 1990 2000 2002 2003 2004 2005 2006
South-Eastern Asia 2 756 12 821 23 540 18 024 24 491 35 245 41 071 51 483
Brunei Darussalam -20 7 549 1 035 3 375 334 289 434 Cambodia 1 .. 149 145 84 131 381 483 Indonesia 300 1 092 -4 550 145 -597 1 896 8 337 5 556 Lao People's dem. Rep. .. 6 34 25 19 17 28 187 Malaysia 934 2 611 3 788 3 203 2 473 4 624 3 965 6 060 Myanmar 0 225 208 191 291 251 236 143 Philippines 114 550 2 240 1 542 491 688 1 854 2 345 Singapore 1 236 5 575 16 484 7 200 11 664 19 828 15 004 24 207 Thailand 189 2 575 3 349 3 335 5 235 5 862 8 957 9 751 Timor-Leste .. .. .. 1 5 3 0 3 Viet Nam 2 180 1 289 1 200 1 450 1 610 2 021 2 315
Western Asia -3 328 818 3 479 5 498 11 972 20 557 41 194 59 001
Bahrain -418 -183 364 217 517 865 1 049 2 915 Iraq 2 0 -3 -2 0 300 515 272 Jordan 34 38 815 74 436 651 1 532 3 121 Kuwait 1 6 16 4 -67 24 250 110 Lebanon -12 6 964 1 336 2 977 1 993 2 751 2 794 Occupied Palestinian territory .. .. 62 9 18 49 47 38 Oman 98 125 83 122 494 229 900 952 Qatar 11 5 252 624 625 1 199 1 152 1 786 Saudi Arabia -3 192 312 183 453 778 1 942 12 097 18 293 Syrian Arab Republic 0 71 270 115 180 275 500 600 Turkey 18 684 982 1 137 1 752 2 883 9 803 20 120 United Arab Emirates 98 -116 -515 1 307 4 256 10 004 10 900 8 386 Yemen (former Democratic) 34 _ _ _ _ _ _ _ Yemen _ -131 6 102 6 144 -302 -385
Developing economies: Oceania 118 696 268 121 343 723 383 339
Cook Islands .. 4 -28 0 .. -1 1 0 Fiji 36 84 -18 21 26 94 -4 103 French Polynesia .. 22 2 11 58 6 8 0 Kiribati .. 0 18 15 16 19 1 12 Marshall Islands .. 1 125 -47 5 513 305 19 Micronesia (Federated States of) .. .. .. .. .. .. 0 .. Nauru .. 0 0 1 2 1 1 1 New Caledonia 2 31 22 59 116 27 -7 82 Niue .. .. 0 9 0 0 -1 0 Northern Mariana Islands -1 124 12 .. .. .. .. .. Palau .. 1 15 1 2 7 1 1 Papua New Guinea 76 398 96 18 101 26 34 32 Samoa 0 7 -2 0 1 2 -4 -2 Solomon Islands 2 10 1 -4 -2 6 19 19 Tokelau .. .. 0 0 0 .. 0 0 Tonga .. 0 5 0 3 5 17 11 Tuvalu .. .. -1 25 0 0 0 0 Vanuatu 3 13 20 13 15 18 13 61
Economies in transition: Asia _ _ 1 779 4 643 6 135 9 399 4 968 8 424
Armenia _ _ 104 111 121 219 258 343 Azerbaijan _ _ 30 1 393 3 227 3 535 1 679 -601 Georgia _ _ 135 167 340 499 450 1 076 Kazakhstan _ _ 1 283 2 590 2 092 4 157 1 977 6 143 Kyrgyzstan _ _ -2 5 46 175 43 182 Tajikistan _ _ 24 36 14 272 54 385 Turkmenistan _ _ 131 276 226 354 418 731 Uzbekistan _ _ 75 65 70 187 88 164
Economies in transition: Europe _ _ 5 151 6 636 13 742 20 890 25 856 44 293
Albania .. .. 143 135 178 338 277 325 Belarus _ _ 119 247 172 164 305 354 Bosnia and Herzegovina _ _ 146 265 381 668 521 423 Croatia _ _ 1 082 1 124 2 049 1 227 1 790 3 556 Moldova _ _ 128 84 74 149 199 222 Russian Federation _ _ 2 714 3 461 7 958 15 444 12 766 28 732 Serbia and Montenegro _ _ 50 549 1 410 1 029 2 090 5 128 SFR of Yugoslavia (former) (1) 24 71 _ _ _ _ _ _ TFYR of Macedonia _ _ 175 78 96 157 100 351 Ukraine _ _ 595 693 1 424 1 715 7 808 5 203 USSR (former) .. 4 _ _ _ _ _ _
For sources and notes, see end of table.
Region,country or territory
Inward flows - Flux entrantsMillions of dollars
7.3.1 Foreign direct investment: inward and outward flowsof countries and geographical regions
344
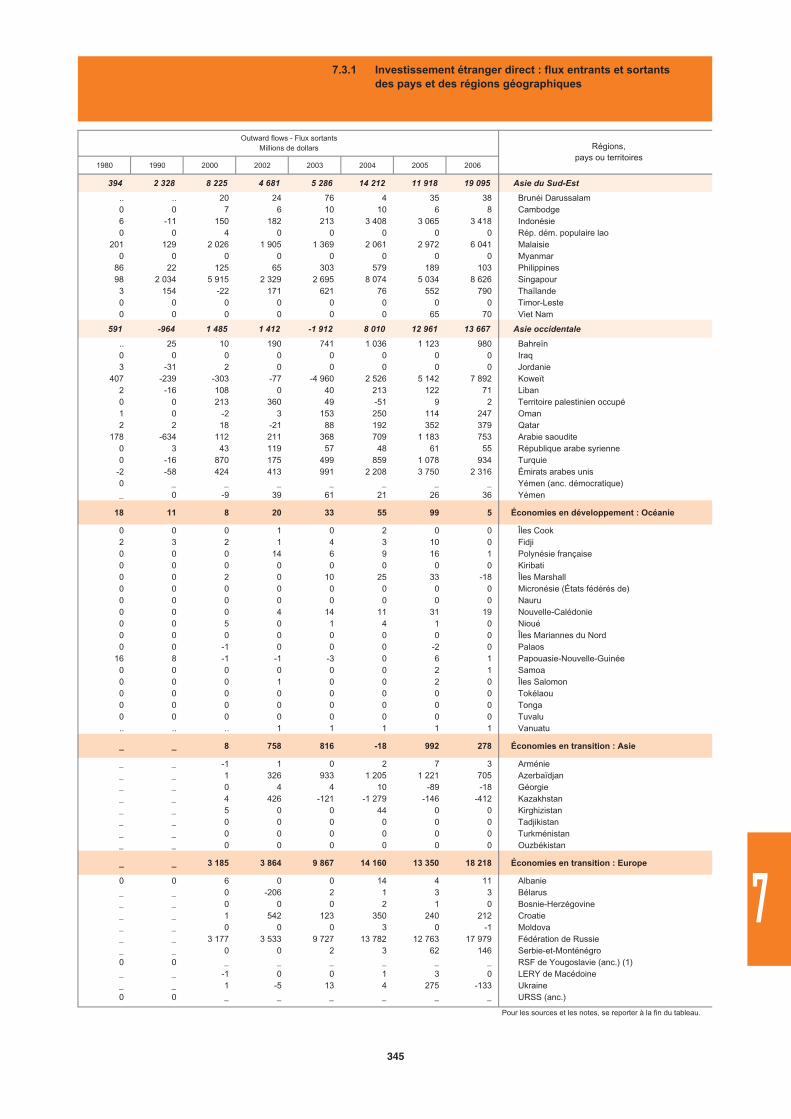
1980 1990 2000 2002 2003 2004 2005 2006
394 2 328 8 225 4 681 5 286 14 212 11 918 19 095 Asie du Sud-Est
.. .. 20 24 76 4 35 38 Brunéi Darussalam0 0 7 6 10 10 6 8 Cambodge6 -11 150 182 213 3 408 3 065 3 418 Indonésie0 0 4 0 0 0 0 0 Rép. dém. populaire lao
201 129 2 026 1 905 1 369 2 061 2 972 6 041 Malaisie0 0 0 0 0 0 0 0 Myanmar
86 22 125 65 303 579 189 103 Philippines98 2 034 5 915 2 329 2 695 8 074 5 034 8 626 Singapour
3 154 -22 171 621 76 552 790 Thaïlande0 0 0 0 0 0 0 0 Timor-Leste0 0 0 0 0 0 65 70 Viet Nam
591 -964 1 485 1 412 -1 912 8 010 12 961 13 667 Asie occidentale
.. 25 10 190 741 1 036 1 123 980 Bahreïn0 0 0 0 0 0 0 0 Iraq3 -31 2 0 0 0 0 0 Jordanie
407 -239 -303 -77 -4 960 2 526 5 142 7 892 Koweït2 -16 108 0 40 213 122 71 Liban0 0 213 360 49 -51 9 2 Territoire palestinien occupé1 0 -2 3 153 250 114 247 Oman2 2 18 -21 88 192 352 379 Qatar
178 -634 112 211 368 709 1 183 753 Arabie saoudite0 3 43 119 57 48 61 55 République arabe syrienne0 -16 870 175 499 859 1 078 934 Turquie
-2 -58 424 413 991 2 208 3 750 2 316 Émirats arabes unis0 _ _ _ _ _ _ _ Yémen (anc. démocratique)_ 0 -9 39 61 21 26 36 Yémen
18 11 8 20 33 55 99 5 Économies en développement : Océanie
0 0 0 1 0 2 0 0 Îles Cook2 3 2 1 4 3 10 0 Fidji0 0 0 14 6 9 16 1 Polynésie française0 0 0 0 0 0 0 0 Kiribati0 0 2 0 10 25 33 -18 Îles Marshall0 0 0 0 0 0 0 0 Micronésie (États fédérés de)0 0 0 0 0 0 0 0 Nauru0 0 0 4 14 11 31 19 Nouvelle-Calédonie0 0 5 0 1 4 1 0 Nioué0 0 0 0 0 0 0 0 Îles Mariannes du Nord0 0 -1 0 0 0 -2 0 Palaos
16 8 -1 -1 -3 0 6 1 Papouasie-Nouvelle-Guinée0 0 0 0 0 0 2 1 Samoa0 0 0 1 0 0 2 0 Îles Salomon0 0 0 0 0 0 0 0 Tokélaou0 0 0 0 0 0 0 0 Tonga0 0 0 0 0 0 0 0 Tuvalu.. .. .. 1 1 1 1 1 Vanuatu
_ _ 8 758 816 -18 992 278 Économies en transition : Asie
_ _ -1 1 0 2 7 3 Arménie_ _ 1 326 933 1 205 1 221 705 Azerbaïdjan_ _ 0 4 4 10 -89 -18 Géorgie_ _ 4 426 -121 -1 279 -146 -412 Kazakhstan_ _ 5 0 0 44 0 0 Kirghizistan_ _ 0 0 0 0 0 0 Tadjikistan_ _ 0 0 0 0 0 0 Turkménistan_ _ 0 0 0 0 0 0 Ouzbékistan
_ _ 3 185 3 864 9 867 14 160 13 350 18 218 Économies en transition : Europe
0 0 6 0 0 14 4 11 Albanie_ _ 0 -206 2 1 3 3 Bélarus_ _ 0 0 0 2 1 0 Bosnie-Herzégovine_ _ 1 542 123 350 240 212 Croatie_ _ 0 0 0 3 0 -1 Moldova_ _ 3 177 3 533 9 727 13 782 12 763 17 979 Fédération de Russie_ _ 0 0 2 3 62 146 Serbie-et-Monténégro0 0 _ _ _ _ _ _ RSF de Yougoslavie (anc.) (1)_ _ -1 0 0 1 3 0 LERY de Macédoine_ _ 1 -5 13 4 275 -133 Ukraine0 0 _ _ _ _ _ _ URSS (anc.)
Pour les sources et les notes, se reporter à la fin du tableau.
Outward flows - Flux sortantsMillions de dollars Régions,
pays ou territoires
7.3.1 Investissement étranger direct : flux entrants et sortantsdes pays et des régions géographiques
345
7
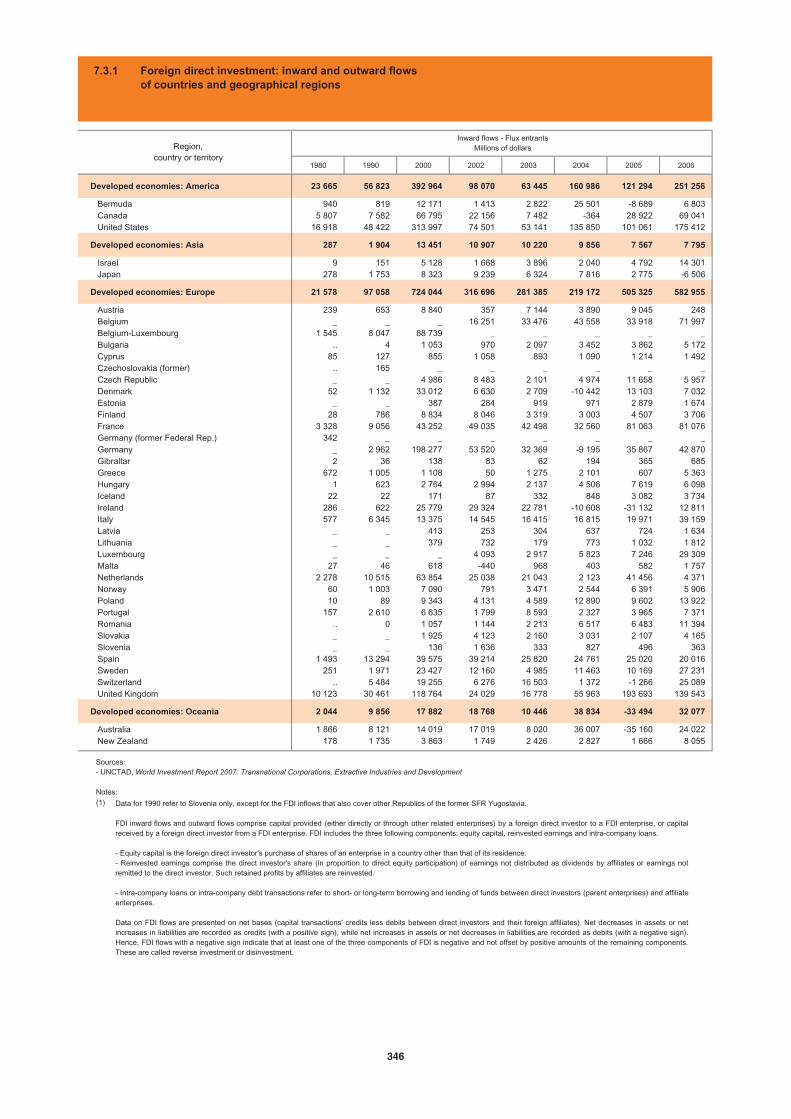
1980 1990 2000 2002 2003 2004 2005 2006
Developed economies: America 23 665 56 823 392 964 98 070 63 445 160 986 121 294 251 256
Bermuda 940 819 12 171 1 413 2 822 25 501 -8 689 6 803 Canada 5 807 7 582 66 795 22 156 7 482 -364 28 922 69 041 United States 16 918 48 422 313 997 74 501 53 141 135 850 101 061 175 412
Developed economies: Asia 287 1 904 13 451 10 907 10 220 9 856 7 567 7 795
Israel 9 151 5 128 1 668 3 896 2 040 4 792 14 301 Japan 278 1 753 8 323 9 239 6 324 7 816 2 775 -6 506
Developed economies: Europe 21 578 97 058 724 044 316 696 281 385 219 172 505 325 582 955
Austria 239 653 8 840 357 7 144 3 890 9 045 248 Belgium _ _ _ 16 251 33 476 43 558 33 918 71 997 Belgium-Luxembourg 1 545 8 047 88 739 _ _ _ _ _ Bulgaria .. 4 1 053 970 2 097 3 452 3 862 5 172 Cyprus 85 127 855 1 058 893 1 090 1 214 1 492 Czechoslovakia (former) .. 165 _ _ _ _ _ _ Czech Republic _ _ 4 986 8 483 2 101 4 974 11 658 5 957 Denmark 52 1 132 33 012 6 630 2 709 -10 442 13 103 7 032 Estonia _ _ 387 284 919 971 2 879 1 674 Finland 28 786 8 834 8 046 3 319 3 003 4 507 3 706 France 3 328 9 056 43 252 49 035 42 498 32 560 81 063 81 076 Germany (former Federal Rep.) 342 _ _ _ _ _ _ _ Germany _ 2 962 198 277 53 520 32 369 -9 195 35 867 42 870 Gibraltar 2 36 138 83 62 194 365 685 Greece 672 1 005 1 108 50 1 275 2 101 607 5 363 Hungary 1 623 2 764 2 994 2 137 4 506 7 619 6 098 Iceland 22 22 171 87 332 848 3 082 3 734 Ireland 286 622 25 779 29 324 22 781 -10 608 -31 132 12 811 Italy 577 6 345 13 375 14 545 16 415 16 815 19 971 39 159 Latvia _ _ 413 253 304 637 724 1 634 Lithuania _ _ 379 732 179 773 1 032 1 812 Luxembourg _ _ _ 4 093 2 917 5 823 7 246 29 309 Malta 27 46 618 -440 968 403 582 1 757 Netherlands 2 278 10 515 63 854 25 038 21 043 2 123 41 456 4 371 Norway 60 1 003 7 090 791 3 471 2 544 6 391 5 906 Poland 10 89 9 343 4 131 4 589 12 890 9 602 13 922 Portugal 157 2 610 6 635 1 799 8 593 2 327 3 965 7 371 Romania .. 0 1 057 1 144 2 213 6 517 6 483 11 394 Slovakia _ _ 1 925 4 123 2 160 3 031 2 107 4 165 Slovenia _ _ 136 1 636 333 827 496 363 Spain 1 493 13 294 39 575 39 214 25 820 24 761 25 020 20 016 Sweden 251 1 971 23 427 12 160 4 985 11 463 10 169 27 231 Switzerland .. 5 484 19 255 6 276 16 503 1 372 -1 266 25 089 United Kingdom 10 123 30 461 118 764 24 029 16 778 55 963 193 693 139 543
Developed economies: Oceania 2 044 9 856 17 882 18 768 10 446 38 834 -33 494 32 077
Australia 1 866 8 121 14 019 17 019 8 020 36 007 -35 160 24 022 New Zealand 178 1 735 3 863 1 749 2 426 2 827 1 666 8 055
Region,country or territory
Inward flows - Flux entrantsMillions of dollars
7.3.1 Foreign direct investment: inward and outward flowsof countries and geographical regions
(1) Data for 1990 refer to Slovenia only, except for the FDI inflows that also cover other Republics of the former SFR Yugoslavia.
FDI inward flows and outward flows comprise capital provided (either directly or through other related enterprises) by a foreign direct investor to a FDI enterprise, or capitalreceived by a foreign direct investor from a FDI enterprise. FDI includes the three following components: equity capital, reinvested earnings and intra-company loans.
- Equity capital is the foreign direct investor's purchase of shares of an enterprise in a country other than that of its residence.- Reinvested earnings comprise the direct investor's share (in proportion to direct equity participation) of earnings not distributed as dividends by affiliates or earnings notremitted to the direct investor. Such retained profits by affiliates are reinvested.
- Intra-company loans or intra-company debt transactions refer to short- or long-term borrowing and lending of funds between direct investors (parent enterprises) and affiliateenterprises.
Data on FDI flows are presented on net bases (capital transactions' credits less debits between direct investors and their foreign affiliates). Net decreases in assets or netincreases in liabilities are recorded as credits (with a positive sign), while net increases in assets or net decreases in liabilities are recorded as debits (with a negative sign).Hence, FDI flows with a negative sign indicate that at least one of the three components of FDI is negative and not offset by positive amounts of the remaining components.These are called reverse investment or disinvestment.
Sources:- UNCTAD, World Investment Report 2007: Transnational Corporations, Extractive Industries and Development
Notes:
346
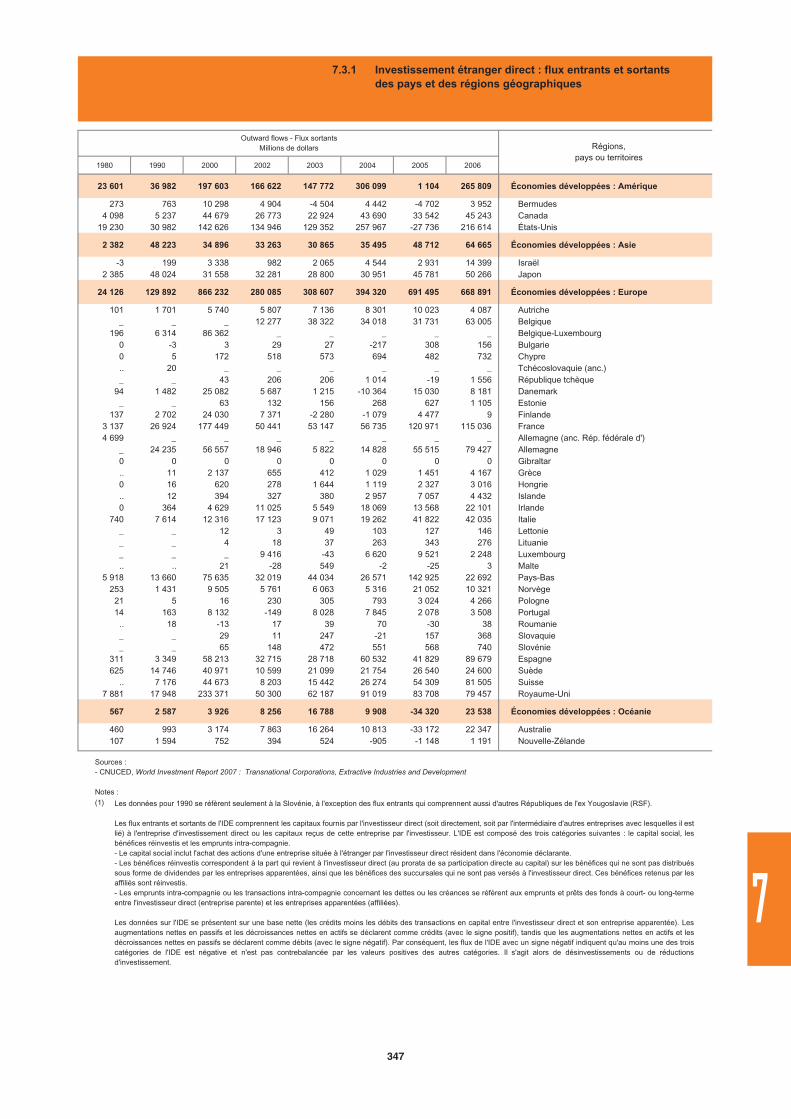
1980 1990 2000 2002 2003 2004 2005 2006
23 601 36 982 197 603 166 622 147 772 306 099 1 104 265 809 Économies développées : Amérique
273 763 10 298 4 904 -4 504 4 442 -4 702 3 952 Bermudes4 098 5 237 44 679 26 773 22 924 43 690 33 542 45 243 Canada
19 230 30 982 142 626 134 946 129 352 257 967 -27 736 216 614 États-Unis
2 382 48 223 34 896 33 263 30 865 35 495 48 712 64 665 Économies développées : Asie
-3 199 3 338 982 2 065 4 544 2 931 14 399 Israël2 385 48 024 31 558 32 281 28 800 30 951 45 781 50 266 Japon
24 126 129 892 866 232 280 085 308 607 394 320 691 495 668 891 Économies développées : Europe
101 1 701 5 740 5 807 7 136 8 301 10 023 4 087 Autriche_ _ _ 12 277 38 322 34 018 31 731 63 005 Belgique
196 6 314 86 362 _ _ _ _ _ Belgique-Luxembourg0 -3 3 29 27 -217 308 156 Bulgarie0 5 172 518 573 694 482 732 Chypre.. 20 _ _ _ _ _ _ Tchécoslovaquie (anc.)_ _ 43 206 206 1 014 -19 1 556 République tchèque
94 1 482 25 082 5 687 1 215 -10 364 15 030 8 181 Danemark_ _ 63 132 156 268 627 1 105 Estonie
137 2 702 24 030 7 371 -2 280 -1 079 4 477 9 Finlande3 137 26 924 177 449 50 441 53 147 56 735 120 971 115 036 France4 699 _ _ _ _ _ _ _ Allemagne (anc. Rép. fédérale d')
_ 24 235 56 557 18 946 5 822 14 828 55 515 79 427 Allemagne0 0 0 0 0 0 0 0 Gibraltar.. 11 2 137 655 412 1 029 1 451 4 167 Grèce0 16 620 278 1 644 1 119 2 327 3 016 Hongrie.. 12 394 327 380 2 957 7 057 4 432 Islande0 364 4 629 11 025 5 549 18 069 13 568 22 101 Irlande
740 7 614 12 316 17 123 9 071 19 262 41 822 42 035 Italie_ _ 12 3 49 103 127 146 Lettonie_ _ 4 18 37 263 343 276 Lituanie_ _ _ 9 416 -43 6 620 9 521 2 248 Luxembourg.. .. 21 -28 549 -2 -25 3 Malte
5 918 13 660 75 635 32 019 44 034 26 571 142 925 22 692 Pays-Bas253 1 431 9 505 5 761 6 063 5 316 21 052 10 321 Norvège
21 5 16 230 305 793 3 024 4 266 Pologne14 163 8 132 -149 8 028 7 845 2 078 3 508 Portugal
.. 18 -13 17 39 70 -30 38 Roumanie_ _ 29 11 247 -21 157 368 Slovaquie_ _ 65 148 472 551 568 740 Slovénie
311 3 349 58 213 32 715 28 718 60 532 41 829 89 679 Espagne625 14 746 40 971 10 599 21 099 21 754 26 540 24 600 Suède
.. 7 176 44 673 8 203 15 442 26 274 54 309 81 505 Suisse7 881 17 948 233 371 50 300 62 187 91 019 83 708 79 457 Royaume-Uni
567 2 587 3 926 8 256 16 788 9 908 -34 320 23 538 Économies développées : Océanie
460 993 3 174 7 863 16 264 10 813 -33 172 22 347 Australie107 1 594 752 394 524 -905 -1 148 1 191 Nouvelle-Zélande
Outward flows - Flux sortantsMillions de dollars Régions,
pays ou territoires
7.3.1 Investissement étranger direct : flux entrants et sortantsdes pays et des régions géographiques
(1) Les données pour 1990 se réfèrent seulement à la Slovénie, à l'exception des flux entrants qui comprennent aussi d'autres Républiques de l'ex Yougoslavie (RSF).
Les flux entrants et sortants de l'IDE comprennent les capitaux fournis par l'investisseur direct (soit directement, soit par l'intermédiaire d'autres entreprises avec lesquelles il estlié) à l'entreprise d'investissement direct ou les capitaux reçus de cette entreprise par l'investisseur. L'IDE est composé des trois catégories suivantes : le capital social, lesbénéfices réinvestis et les emprunts intra-compagnie. - Le capital social inclut l'achat des actions d'une entreprise située à l'étranger par l'investisseur direct résident dans l'économie déclarante. - Les bénéfices réinvestis correspondent à la part qui revient à l'investisseur direct (au prorata de sa participation directe au capital) sur les bénéfices qui ne sont pas distribuéssous forme de dividendes par les entreprises apparentées, ainsi que les bénéfices des succursales qui ne sont pas versés à l'investisseur direct. Ces bénéfices retenus par lesaffiliés sont réinvestis. - Les emprunts intra-compagnie ou les transactions intra-compagnie concernant les dettes ou les créances se référent aux emprunts et prêts des fonds à court- ou long-termeentre l'investisseur direct (entreprise parente) et les entreprises apparentées (affiliées).
Les données sur l'IDE se présentent sur une base nette (les crédits moins les débits des transactions en capital entre l'investisseur direct et son entreprise apparentée). Lesaugmentations nettes en passifs et les décroissances nettes en actifs se déclarent comme crédits (avec le signe positif), tandis que les augmentations nettes en actifs et lesdécroissances nettes en passifs se déclarent comme débits (avec le signe négatif). Par conséquent, les flux de l'IDE avec un signe négatif indiquent qu'au moins une des troiscatégories de l'IDE est négative et n'est pas contrebalancée par les valeurs positives des autres catégories. Il s'agit alors de désinvestissements ou de réductionsd'investissement.
Sources : - CNUCED, World Investment Report 2007 : Transnational Corporations, Extractive Industries and Development
Notes :
347
7
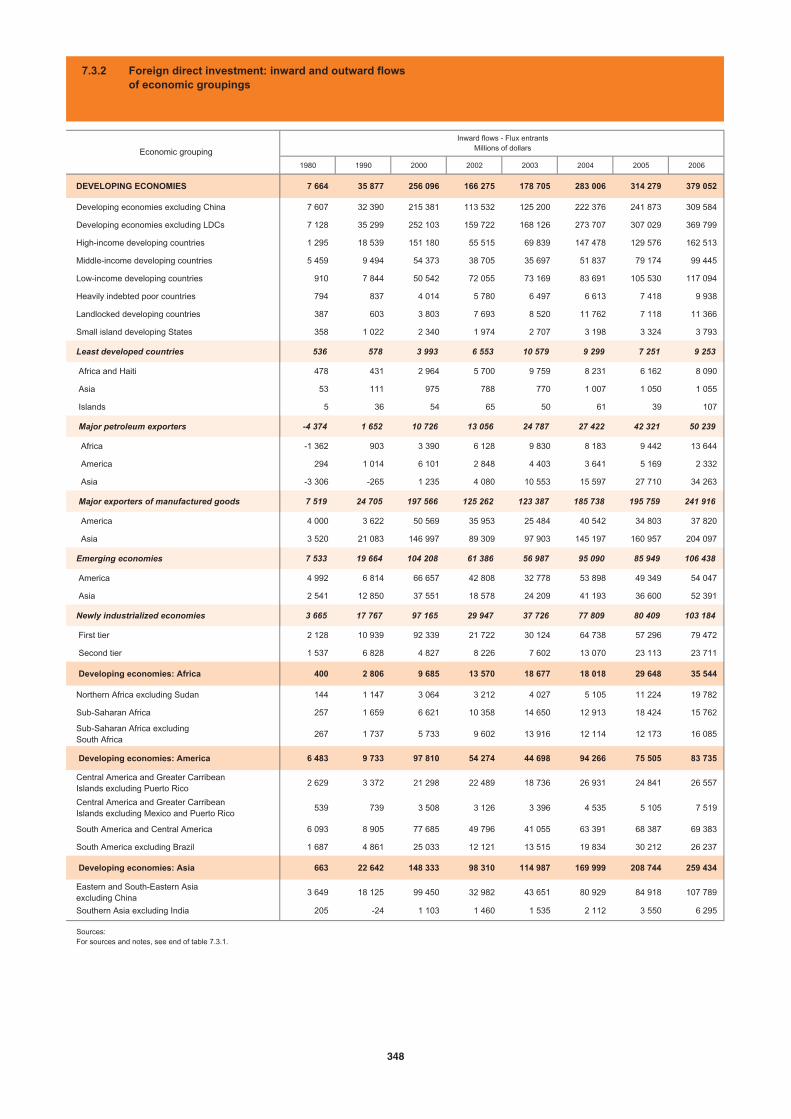
1980 1990 2000 2002 2003 2004 2005 2006
DEVELOPING ECONOMIES 7 664 35 877 256 096 166 275 178 705 283 006 314 279 379 052
Developing economies excluding China 7 607 32 390 215 381 113 532 125 200 222 376 241 873 309 584
Developing economies excluding LDCs 7 128 35 299 252 103 159 722 168 126 273 707 307 029 369 799
High-income developing countries 1 295 18 539 151 180 55 515 69 839 147 478 129 576 162 513
Middle-income developing countries 5 459 9 494 54 373 38 705 35 697 51 837 79 174 99 445
Low-income developing countries 910 7 844 50 542 72 055 73 169 83 691 105 530 117 094
Heavily indebted poor countries 794 837 4 014 5 780 6 497 6 613 7 418 9 938
Landlocked developing countries 387 603 3 803 7 693 8 520 11 762 7 118 11 366
Small island developing States 358 1 022 2 340 1 974 2 707 3 198 3 324 3 793
Least developed countries 536 578 3 993 6 553 10 579 9 299 7 251 9 253
Africa and Haiti 478 431 2 964 5 700 9 759 8 231 6 162 8 090
Asia 53 111 975 788 770 1 007 1 050 1 055
Islands 5 36 54 65 50 61 39 107
Major petroleum exporters -4 374 1 652 10 726 13 056 24 787 27 422 42 321 50 239
Africa -1 362 903 3 390 6 128 9 830 8 183 9 442 13 644
America 294 1 014 6 101 2 848 4 403 3 641 5 169 2 332
Asia -3 306 -265 1 235 4 080 10 553 15 597 27 710 34 263
Major exporters of manufactured goods 7 519 24 705 197 566 125 262 123 387 185 738 195 759 241 916
America 4 000 3 622 50 569 35 953 25 484 40 542 34 803 37 820
Asia 3 520 21 083 146 997 89 309 97 903 145 197 160 957 204 097
Emerging economies 7 533 19 664 104 208 61 386 56 987 95 090 85 949 106 438
America 4 992 6 814 66 657 42 808 32 778 53 898 49 349 54 047
Asia 2 541 12 850 37 551 18 578 24 209 41 193 36 600 52 391
Newly industrialized economies 3 665 17 767 97 165 29 947 37 726 77 809 80 409 103 184
First tier 2 128 10 939 92 339 21 722 30 124 64 738 57 296 79 472
Second tier 1 537 6 828 4 827 8 226 7 602 13 070 23 113 23 711
Developing economies: Africa 400 2 806 9 685 13 570 18 677 18 018 29 648 35 544
Northern Africa excluding Sudan 144 1 147 3 064 3 212 4 027 5 105 11 224 19 782
Sub-Saharan Africa 257 1 659 6 621 10 358 14 650 12 913 18 424 15 762
Sub-Saharan Africa excluding South Africa
267 1 737 5 733 9 602 13 916 12 114 12 173 16 085
Developing economies: America 6 483 9 733 97 810 54 274 44 698 94 266 75 505 83 735
Central America and Greater Carribean Islands excluding Puerto Rico
2 629 3 372 21 298 22 489 18 736 26 931 24 841 26 557
Central America and Greater Carribean Islands excluding Mexico and Puerto Rico
539 739 3 508 3 126 3 396 4 535 5 105 7 519
South America and Central America 6 093 8 905 77 685 49 796 41 055 63 391 68 387 69 383
South America excluding Brazil 1 687 4 861 25 033 12 121 13 515 19 834 30 212 26 237
Developing economies: Asia 663 22 642 148 333 98 310 114 987 169 999 208 744 259 434
Eastern and South-Eastern Asia excluding China
3 649 18 125 99 450 32 982 43 651 80 929 84 918 107 789
Southern Asia excluding India 205 -24 1 103 1 460 1 535 2 112 3 550 6 295
Inward flows - Flux entrantsMillions of dollarsEconomic grouping
7.3.2 Foreign direct investment: inward and outward flowsof economic groupings
Sources:For sources and notes, see end of table 7.3.1.
348
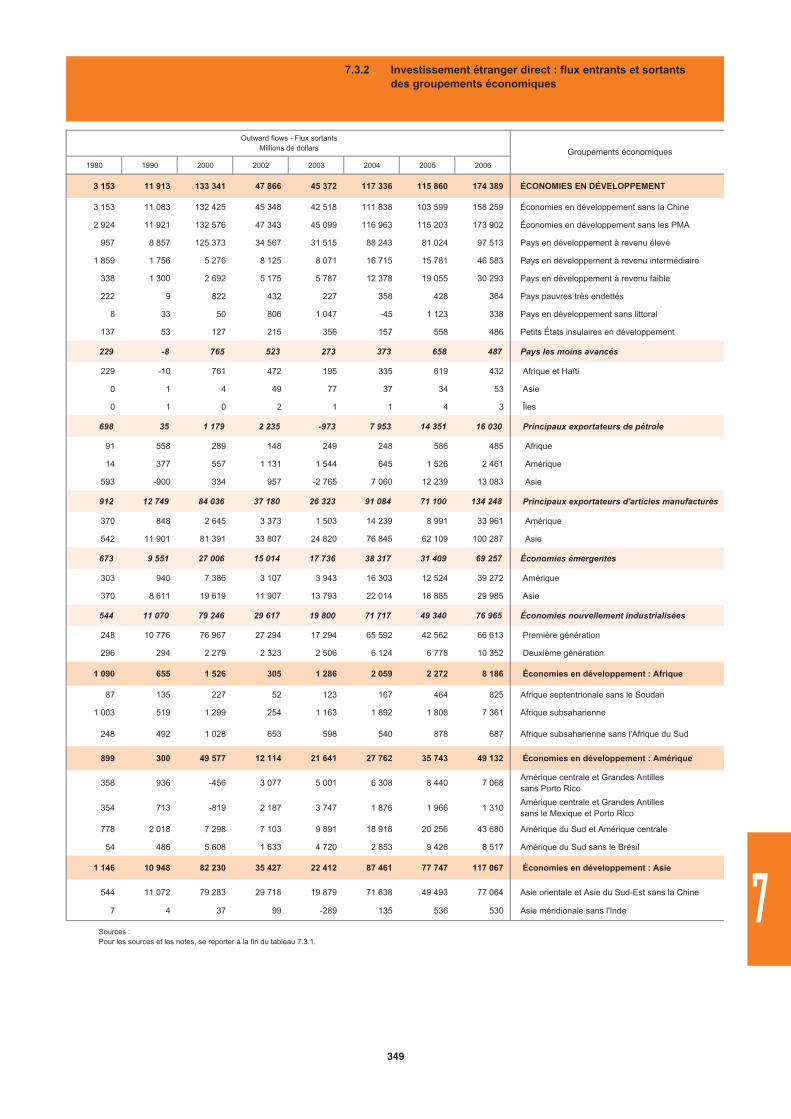
1980 1990 2000 2002 2003 2004 2005 2006
3 153 11 913 133 341 47 866 45 372 117 336 115 860 174 389 ÉCONOMIES EN DÉVELOPPEMENT
3 153 11 083 132 425 45 348 42 518 111 838 103 599 158 259 Économies en développement sans la Chine
2 924 11 921 132 576 47 343 45 099 116 963 115 203 173 902 Économies en développement sans les PMA
957 8 857 125 373 34 567 31 515 88 243 81 024 97 513 Pays en développement à revenu élevé
1 859 1 756 5 276 8 125 8 071 16 715 15 781 46 583 Pays en développement à revenu intermédiaire
338 1 300 2 692 5 175 5 787 12 378 19 055 30 293 Pays en développement à revenu faible
222 9 822 432 227 358 428 364 Pays pauvres très endettés
8 33 50 806 1 047 -45 1 123 338 Pays en développement sans littoral
137 53 127 215 356 157 558 486 Petits États insulaires en développement
229 -8 765 523 273 373 658 487 Pays les moins avancés
229 -10 761 472 195 335 619 432 Afrique et Haïti
0 1 4 49 77 37 34 53 Asie
0 1 0 2 1 1 4 3 Îles
698 35 1 179 2 235 -973 7 953 14 351 16 030 Principaux exportateurs de pétrole
91 558 289 148 249 248 586 485 Afrique
14 377 557 1 131 1 544 645 1 526 2 461 Amérique
593 -900 334 957 -2 765 7 060 12 239 13 083 Asie
912 12 749 84 036 37 180 26 323 91 084 71 100 134 248 Principaux exportateurs d'articles manufacturés
370 848 2 645 3 373 1 503 14 239 8 991 33 961 Amérique
542 11 901 81 391 33 807 24 820 76 845 62 109 100 287 Asie
673 9 551 27 006 15 014 17 736 38 317 31 409 69 257 Économies émergentes
303 940 7 386 3 107 3 943 16 303 12 524 39 272 Amérique
370 8 611 19 619 11 907 13 793 22 014 18 885 29 985 Asie
544 11 070 79 246 29 617 19 800 71 717 49 340 76 965 Économies nouvellement industrialisées
248 10 776 76 967 27 294 17 294 65 592 42 562 66 613 Première génération
296 294 2 279 2 323 2 506 6 124 6 778 10 352 Deuxième génération
1 090 655 1 526 305 1 286 2 059 2 272 8 186 Économies en développement : Afrique
87 135 227 52 123 167 464 825 Afrique septentrionale sans le Soudan
1 003 519 1 299 254 1 163 1 892 1 808 7 361 Afrique subsaharienne
248 492 1 028 653 598 540 878 687 Afrique subsaharienne sans l'Afrique du Sud
899 300 49 577 12 114 21 641 27 762 35 743 49 132 Économies en développement : Amérique
358 936 -456 3 077 5 001 6 308 8 440 7 068 Amérique centrale et Grandes Antilles sans Porto Rico
354 713 -819 2 187 3 747 1 876 1 966 1 310 Amérique centrale et Grandes Antilles sans le Mexique et Porto Rico
778 2 018 7 298 7 103 9 891 18 918 20 256 43 680 Amérique du Sud et Amérique centrale
54 486 5 608 1 633 4 720 2 853 9 426 8 517 Amérique du Sud sans le Brésil
1 146 10 948 82 230 35 427 22 412 87 461 77 747 117 067 Économies en développement : Asie
544 11 072 79 283 29 718 19 879 71 638 49 493 77 064 Asie orientale et Asie du Sud-Est sans la Chine
7 4 37 99 -289 135 536 530 Asie méridionale sans l'Inde
Groupements économiques
Outward flows - Flux sortantsMillions de dollars
7.3.2 Investissement étranger direct : flux entrants et sortantsdes groupements économiques
Sources : Pour les sources et les notes, se reporter à la fin du tableau 7.3.1.
349
7
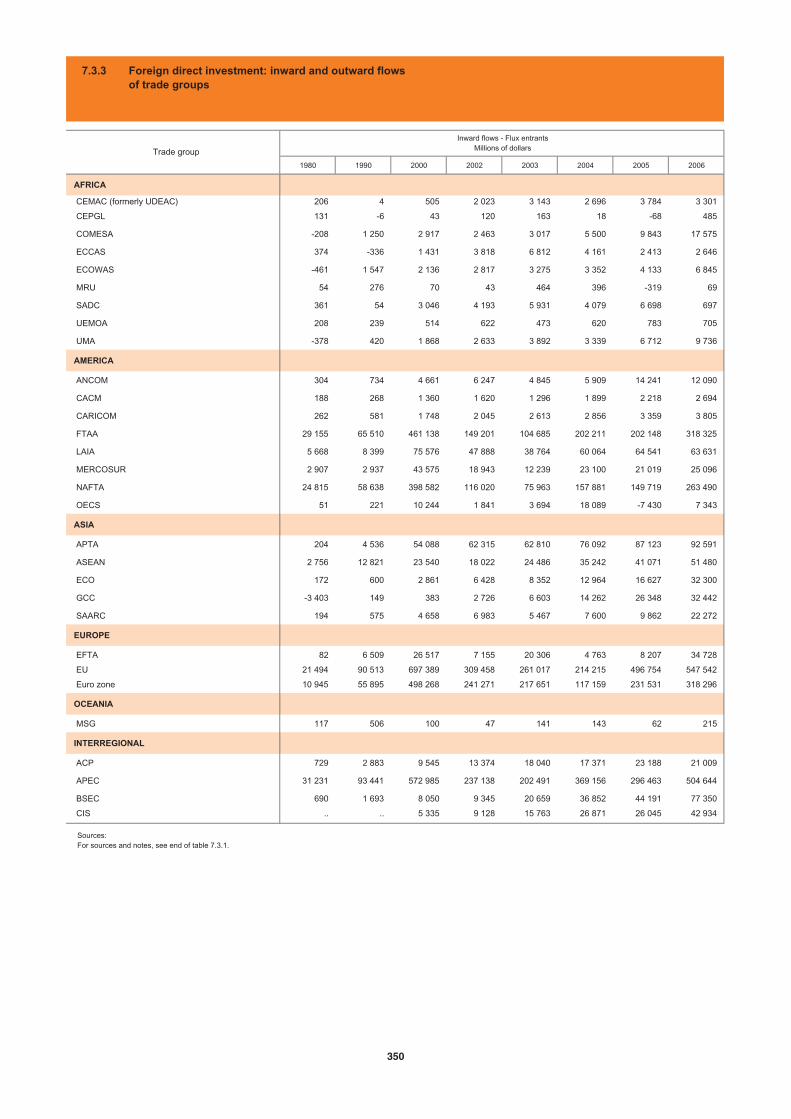
1980 1990 2000 2002 2003 2004 2005 2006
AFRICA
CEMAC (formerly UDEAC) 206 4 505 2 023 3 143 2 696 3 784 3 301
CEPGL 131 -6 43 120 163 18 -68 485
COMESA -208 1 250 2 917 2 463 3 017 5 500 9 843 17 575
ECCAS 374 -336 1 431 3 818 6 812 4 161 2 413 2 646
ECOWAS -461 1 547 2 136 2 817 3 275 3 352 4 133 6 845
MRU 54 276 70 43 464 396 -319 69
SADC 361 54 3 046 4 193 5 931 4 079 6 698 697
UEMOA 208 239 514 622 473 620 783 705
UMA -378 420 1 868 2 633 3 892 3 339 6 712 9 736
AMERICA
ANCOM 304 734 4 661 6 247 4 845 5 909 14 241 12 090
CACM 188 268 1 360 1 620 1 296 1 899 2 218 2 694
CARICOM 262 581 1 748 2 045 2 613 2 856 3 359 3 805
FTAA 29 155 65 510 461 138 149 201 104 685 202 211 202 148 318 325
LAIA 5 668 8 399 75 576 47 888 38 764 60 064 64 541 63 631
MERCOSUR 2 907 2 937 43 575 18 943 12 239 23 100 21 019 25 096
NAFTA 24 815 58 638 398 582 116 020 75 963 157 881 149 719 263 490
OECS 51 221 10 244 1 841 3 694 18 089 -7 430 7 343
ASIA
APTA 204 4 536 54 088 62 315 62 810 76 092 87 123 92 591
ASEAN 2 756 12 821 23 540 18 022 24 486 35 242 41 071 51 480
ECO 172 600 2 861 6 428 8 352 12 964 16 627 32 300
GCC -3 403 149 383 2 726 6 603 14 262 26 348 32 442
SAARC 194 575 4 658 6 983 5 467 7 600 9 862 22 272
EUROPE
EFTA 82 6 509 26 517 7 155 20 306 4 763 8 207 34 728
EU 21 494 90 513 697 389 309 458 261 017 214 215 496 754 547 542
Euro zone 10 945 55 895 498 268 241 271 217 651 117 159 231 531 318 296
OCEANIA
MSG 117 506 100 47 141 143 62 215
INTERREGIONAL
ACP 729 2 883 9 545 13 374 18 040 17 371 23 188 21 009
APEC 31 231 93 441 572 985 237 138 202 491 369 156 296 463 504 644
BSEC 690 1 693 8 050 9 345 20 659 36 852 44 191 77 350
CIS .. .. 5 335 9 128 15 763 26 871 26 045 42 934
Inward flows - Flux entrantsMillions of dollarsTrade group
7.3.3 Foreign direct investment: inward and outward flowsof trade groups
Sources:For sources and notes, see end of table 7.3.1.
350
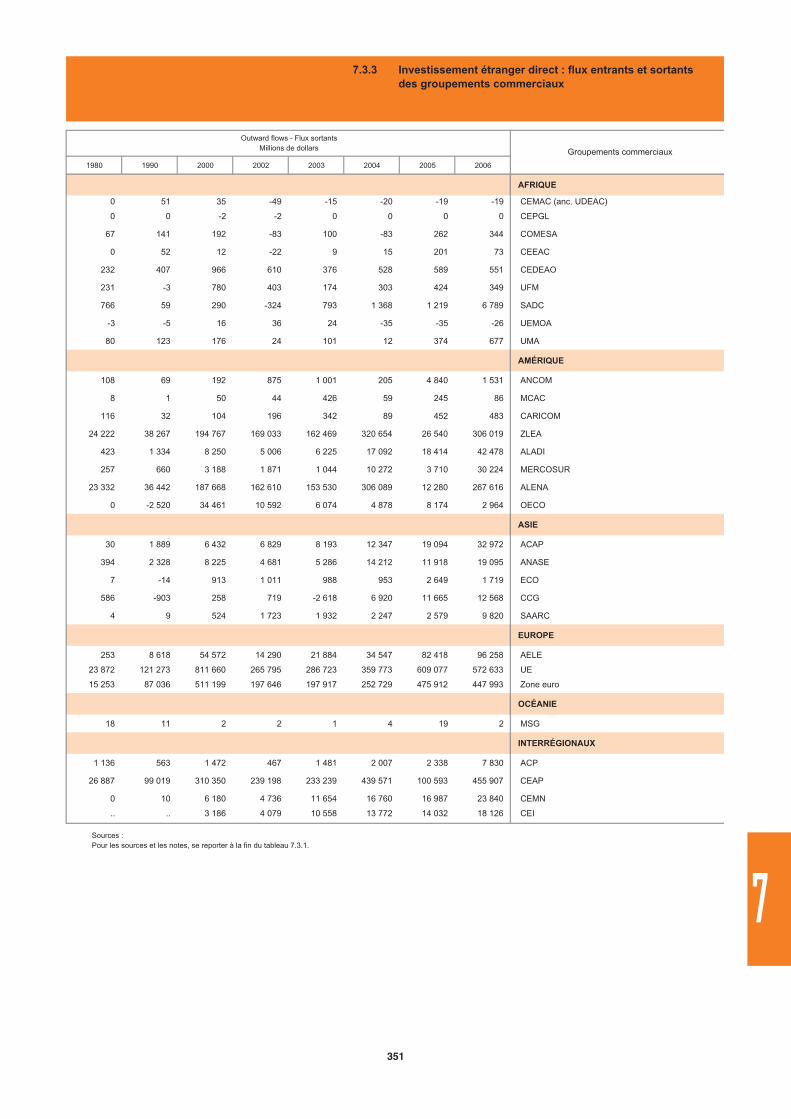
1980 1990 2000 2002 2003 2004 2005 2006
AFRIQUE
0 51 35 -49 -15 -20 -19 -19 CEMAC (anc. UDEAC)
0 0 -2 -2 0 0 0 0 CEPGL
67 141 192 -83 100 -83 262 344 COMESA
0 52 12 -22 9 15 201 73 CEEAC
232 407 966 610 376 528 589 551 CEDEAO
231 -3 780 403 174 303 424 349 UFM
766 59 290 -324 793 1 368 1 219 6 789 SADC
-3 -5 16 36 24 -35 -35 -26 UEMOA
80 123 176 24 101 12 374 677 UMA
AMÉRIQUE
108 69 192 875 1 001 205 4 840 1 531 ANCOM
8 1 50 44 426 59 245 86 MCAC
116 32 104 196 342 89 452 483 CARICOM
24 222 38 267 194 767 169 033 162 469 320 654 26 540 306 019 ZLEA
423 1 334 8 250 5 006 6 225 17 092 18 414 42 478 ALADI
257 660 3 188 1 871 1 044 10 272 3 710 30 224 MERCOSUR
23 332 36 442 187 668 162 610 153 530 306 089 12 280 267 616 ALENA
0 -2 520 34 461 10 592 6 074 4 878 8 174 2 964 OECO
ASIE
30 1 889 6 432 6 829 8 193 12 347 19 094 32 972 ACAP
394 2 328 8 225 4 681 5 286 14 212 11 918 19 095 ANASE
7 -14 913 1 011 988 953 2 649 1 719 ECO
586 -903 258 719 -2 618 6 920 11 665 12 568 CCG
4 9 524 1 723 1 932 2 247 2 579 9 820 SAARC
EUROPE
253 8 618 54 572 14 290 21 884 34 547 82 418 96 258 AELE
23 872 121 273 811 660 265 795 286 723 359 773 609 077 572 633 UE
15 253 87 036 511 199 197 646 197 917 252 729 475 912 447 993 Zone euro
OCÉANIE
18 11 2 2 1 4 19 2 MSG
INTERRÉGIONAUX
1 136 563 1 472 467 1 481 2 007 2 338 7 830 ACP
26 887 99 019 310 350 239 198 233 239 439 571 100 593 455 907 CEAP
0 10 6 180 4 736 11 654 16 760 16 987 23 840 CEMN
.. .. 3 186 4 079 10 558 13 772 14 032 18 126 CEI
Groupements commerciaux
Outward flows - Flux sortantsMillions de dollars
7.3.3 Investissement étranger direct : flux entrants et sortantsdes groupements commerciaux
Sources : Pour les sources et les notes, se reporter à la fin du tableau 7.3.1.
351
7
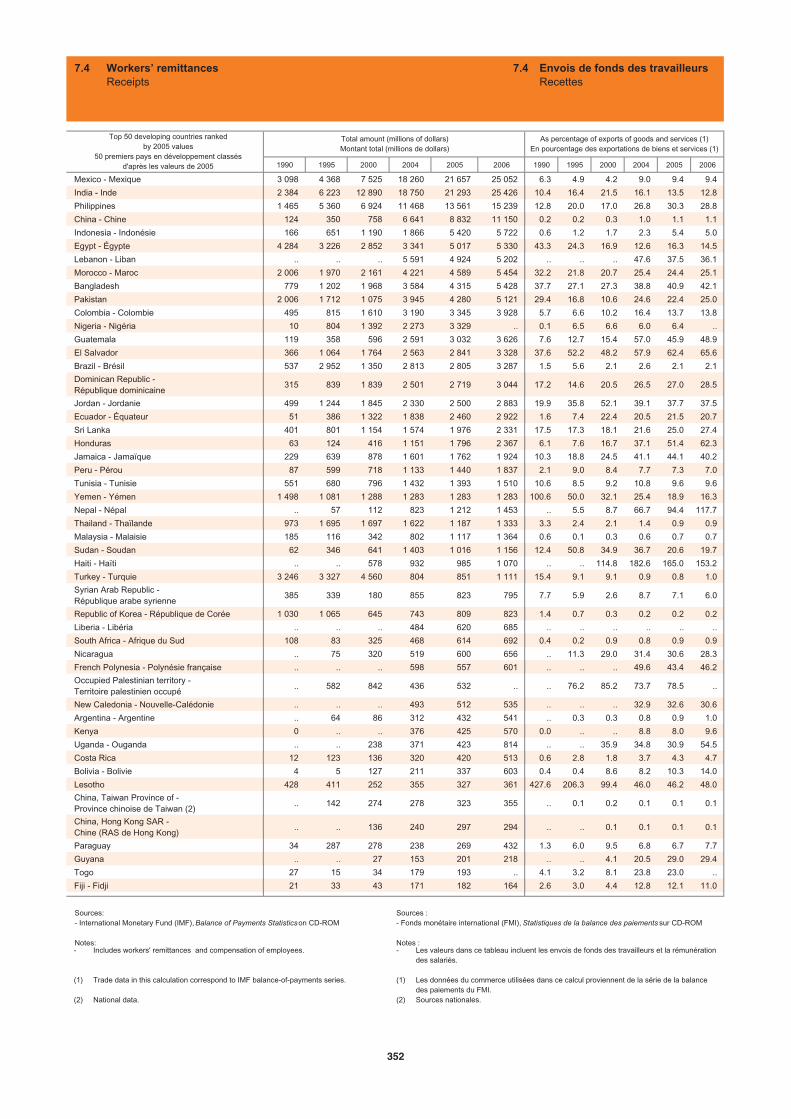
1990 1995 2000 2004 2005 2006 1990 1995 2000 2004 2005 2006
Mexico - Mexique 3 098 4 368 7 525 18 260 21 657 25 052 6.3 4.9 4.2 9.0 9.4 9.4
India - Inde 2 384 6 223 12 890 18 750 21 293 25 426 10.4 16.4 21.5 16.1 13.5 12.8
Philippines 1 465 5 360 6 924 11 468 13 561 15 239 12.8 20.0 17.0 26.8 30.3 28.8
China - Chine 124 350 758 6 641 8 832 11 150 0.2 0.2 0.3 1.0 1.1 1.1
Indonesia - Indonésie 166 651 1 190 1 866 5 420 5 722 0.6 1.2 1.7 2.3 5.4 5.0
Egypt - Égypte 4 284 3 226 2 852 3 341 5 017 5 330 43.3 24.3 16.9 12.6 16.3 14.5
Lebanon - Liban .. .. .. 5 591 4 924 5 202 .. .. .. 47.6 37.5 36.1
Morocco - Maroc 2 006 1 970 2 161 4 221 4 589 5 454 32.2 21.8 20.7 25.4 24.4 25.1
Bangladesh 779 1 202 1 968 3 584 4 315 5 428 37.7 27.1 27.3 38.8 40.9 42.1
Pakistan 2 006 1 712 1 075 3 945 4 280 5 121 29.4 16.8 10.6 24.6 22.4 25.0
Colombia - Colombie 495 815 1 610 3 190 3 345 3 928 5.7 6.6 10.2 16.4 13.7 13.8
Nigeria - Nigéria 10 804 1 392 2 273 3 329 .. 0.1 6.5 6.6 6.0 6.4 ..
Guatemala 119 358 596 2 591 3 032 3 626 7.6 12.7 15.4 57.0 45.9 48.9
El Salvador 366 1 064 1 764 2 563 2 841 3 328 37.6 52.2 48.2 57.9 62.4 65.6
Brazil - Brésil 537 2 952 1 350 2 813 2 805 3 287 1.5 5.6 2.1 2.6 2.1 2.1
Dominican Republic - République dominicaine
315 839 1 839 2 501 2 719 3 044 17.2 14.6 20.5 26.5 27.0 28.5
Jordan - Jordanie 499 1 244 1 845 2 330 2 500 2 883 19.9 35.8 52.1 39.1 37.7 37.5
Ecuador - Équateur 51 386 1 322 1 838 2 460 2 922 1.6 7.4 22.4 20.5 21.5 20.7
Sri Lanka 401 801 1 154 1 574 1 976 2 331 17.5 17.3 18.1 21.6 25.0 27.4
Honduras 63 124 416 1 151 1 796 2 367 6.1 7.6 16.7 37.1 51.4 62.3
Jamaica - Jamaïque 229 639 878 1 601 1 762 1 924 10.3 18.8 24.5 41.1 44.1 40.2
Peru - Pérou 87 599 718 1 133 1 440 1 837 2.1 9.0 8.4 7.7 7.3 7.0
Tunisia - Tunisie 551 680 796 1 432 1 393 1 510 10.6 8.5 9.2 10.8 9.6 9.6
Yemen - Yémen 1 498 1 081 1 288 1 283 1 283 1 283 100.6 50.0 32.1 25.4 18.9 16.3
Nepal - Népal .. 57 112 823 1 212 1 453 .. 5.5 8.7 66.7 94.4 117.7
Thailand - Thaïlande 973 1 695 1 697 1 622 1 187 1 333 3.3 2.4 2.1 1.4 0.9 0.9
Malaysia - Malaisie 185 116 342 802 1 117 1 364 0.6 0.1 0.3 0.6 0.7 0.7
Sudan - Soudan 62 346 641 1 403 1 016 1 156 12.4 50.8 34.9 36.7 20.6 19.7
Haiti - Haïti .. .. 578 932 985 1 070 .. .. 114.8 182.6 165.0 153.2
Turkey - Turquie 3 246 3 327 4 560 804 851 1 111 15.4 9.1 9.1 0.9 0.8 1.0
Syrian Arab Republic - République arabe syrienne
385 339 180 855 823 795 7.7 5.9 2.6 8.7 7.1 6.0
Republic of Korea - République de Corée 1 030 1 065 645 743 809 823 1.4 0.7 0.3 0.2 0.2 0.2
Liberia - Libéria .. .. .. 484 620 685 .. .. .. .. .. ..
South Africa - Afrique du Sud 108 83 325 468 614 692 0.4 0.2 0.9 0.8 0.9 0.9
Nicaragua .. 75 320 519 600 656 .. 11.3 29.0 31.4 30.6 28.3
French Polynesia - Polynésie française .. .. .. 598 557 601 .. .. .. 49.6 43.4 46.2
Occupied Palestinian territory - Territoire palestinien occupé
.. 582 842 436 532 .. .. 76.2 85.2 73.7 78.5 ..
New Caledonia - Nouvelle-Calédonie .. .. .. 493 512 535 .. .. .. 32.9 32.6 30.6
Argentina - Argentine .. 64 86 312 432 541 .. 0.3 0.3 0.8 0.9 1.0
Kenya 0 .. .. 376 425 570 0.0 .. .. 8.8 8.0 9.6
Uganda - Ouganda .. .. 238 371 423 814 .. .. 35.9 34.8 30.9 54.5
Costa Rica 12 123 136 320 420 513 0.6 2.8 1.8 3.7 4.3 4.7
Bolivia - Bolivie 4 5 127 211 337 603 0.4 0.4 8.6 8.2 10.3 14.0
Lesotho 428 411 252 355 327 361 427.6 206.3 99.4 46.0 46.2 48.0
China, Taiwan Province of - Province chinoise de Taiwan (2)
.. 142 274 278 323 355 .. 0.1 0.2 0.1 0.1 0.1
China, Hong Kong SAR - Chine (RAS de Hong Kong)
.. .. 136 240 297 294 .. .. 0.1 0.1 0.1 0.1
Paraguay 34 287 278 238 269 432 1.3 6.0 9.5 6.8 6.7 7.7
Guyana .. .. 27 153 201 218 .. .. 4.1 20.5 29.0 29.4
Togo 27 15 34 179 193 .. 4.1 3.2 8.1 23.8 23.0 ..
Fiji - Fidji 21 33 43 171 182 164 2.6 3.0 4.4 12.8 12.1 11.0
Top 50 developing countries ranked by 2005 values
50 premiers pays en développement classés d'après les valeurs de 2005
Total amount (millions of dollars)Montant total (millions de dollars)
As percentage of exports of goods and services (1)En pourcentage des exportations de biens et services (1)
7.4 Workers’ remittancesReceipts
7.4 Envois de fonds des travailleursRecettes
-
(1)
(2)
Includes workers' remittances and compensation of employees.
Trade data in this calculation correspond to IMF balance-of-payments series.
National data.
Sources:- International Monetary Fund (IMF), Balance of Payments Statisticson CD-ROM
Notes:-
(1)
(2)
Les valeurs dans ce tableau incluent les envois de fonds des travailleurs et la rémunération des salariés.
Les données du commerce utilisées dans ce calcul proviennent de la série de la balance des paiements du FMI.Sources nationales.
Sources : - Fonds monétaire international (FMI), Statistiques de la balance des paiements sur CD-ROM
Notes :
352

1990 1995 2000 2004 2005 2006 1990 1995 2000 2004 2005 2006
Saudi Arabia - Arabie saoudite 11 221 16 594 15 390 13 555 13 996 15 611 25.6 37.0 29.1 20.3 16.8 14.9
Malaysia - Malaisie (2) 182 1 329 599 5 064 5 679 5 560 0.6 1.5 0.6 4.3 4.3 3.8
Lebanon - Liban .. .. .. 4 233 4 012 4 134 .. .. .. 25.3 24.6 24.0
Kuwait - Koweït 770 1 354 1 734 2 403 2 648 3 021 10.7 10.7 15.3 12.5 11.6 12.3
China - Chine 5 .. 754 1 998 2 550 3 025 0.0 .. 0.3 0.3 0.4 0.4
Oman 856 1 537 1 451 1 826 2 257 2 788 25.6 30.5 22.8 17.2 20.4 20.4
China, Taiwan Province of - Province chinoise de Taiwan (3)
.. 945 1 544 1 251 1 342 1 370 .. 0.8 0.9 0.6 0.6 0.6
India - Inde 106 419 486 1 653 1 341 1 580 0.4 0.9 0.7 1.3 0.7 0.7
Bahrain - Bahreïn 332 500 1 013 1 120 1 223 1 531 8.3 12.1 19.7 15.8 14.3 15.8
Indonesia - Indonésie .. .. .. 913 1 179 1 359 .. .. .. 1.3 1.3 1.4
South Africa - Afrique du Sud 1 116 567 614 935 1 041 1 055 5.3 1.7 1.9 1.6 1.5 1.3
Republic of Korea - République de Corée 26 132 278 685 958 1 124 0.0 0.1 0.1 0.3 0.3 0.3
Libyan Arab Jamahiriya - Jamahiriya arabe libyenne
446 222 463 975 914 945 5.0 3.9 9.2 9.1 6.8 6.0
Liberia - Libéria .. .. .. 443 621 639 .. .. .. .. .. ..
Côte d'Ivoire 471 457 390 591 597 17 13.7 12.0 10.7 9.4 8.1 0.2
Brunei Darussalam - Brunéi Darussalam .. .. .. 323 376 405 .. .. .. .. .. ..
Brazil - Brésil 11 336 338 340 374 529 0.0 0.5 0.5 0.4 0.4 0.4
Jamaica - Jamaïque 11 50 152 391 369 358 0.5 1.3 3.4 7.4 6.2 5.0
Uganda - Ouganda .. .. 353 236 359 322 .. .. 25.1 11.2 14.0 10.0
Jordan - Jordanie 71 107 197 272 349 402 2.0 2.2 3.4 2.9 2.9 3.1
China, Hong Kong SAR - Chine (RAS de Hong Kong)
.. .. 225 321 348 377 .. .. 0.1 0.1 0.1 0.1
Argentina - Argentine .. 195 268 234 314 366 .. 0.7 0.8 0.8 0.9 0.9
Sri Lanka .. 13 14 230 249 274 .. 0.2 0.2 2.5 2.5 2.4
Angola 150 210 266 296 215 413 4.4 6.0 4.6 2.8 1.4 2.5
Venezuela (Bolivarian Rep. of) - Venezuela (Rép. bolivarienne du)
701 203 331 214 211 253 7.4 1.2 1.6 1.0 0.7 0.7
China, Macao SAR - Chine (RAS de Macao) .. .. .. 132 210 476 .. .. .. 2.2 3.1 5.7
Costa Rica .. 36 142 192 209 246 .. 0.8 2.0 2.1 1.9 2.0
Papua New Guinea - Papouasie-Nouvelle-Guinée
.. .. 11 117 128 .. .. .. 0.6 4.8 4.8 ..
Yemen - Yémen 106 61 61 108 110 120 4.9 2.5 1.8 2.2 1.8 1.5
Botswana 118 199 134 99 102 97 5.9 9.7 5.8 2.7 2.9 2.8
Turkey - Turquie .. .. .. .. 96 107 .. .. .. .. 0.1 0.1
Zambia - Zambie 15 .. 24 76 94 115 0.8 .. 1.8 3.6 3.6 3.6
Cambodia - Cambodge .. 52 60 56 88 105 .. 3.8 2.6 1.5 1.9 1.9
Panama 22 20 22 72 88 121 0.5 0.3 0.3 0.8 0.8 1.0
Bahamas 39 32 56 71 84 100 2.3 1.8 1.9 2.3 2.2 2.2
Maldives 8 27 46 62 70 84 5.2 8.6 10.3 8.5 8.1 8.0
Mali 45 42 26 64 69 .. 5.5 4.3 2.8 3.9 3.8 ..
Bolivia - Bolivie 8 9 37 51 67 73 0.7 0.6 1.8 2.2 2.3 2.1
Nepal - Népal .. 9 17 64 66 79 .. 0.6 0.9 2.8 2.4 2.7
Aruba .. 5 44 49 64 73 .. 0.2 1.4 1.3 1.5 1.5
Haiti - Haïti .. .. 11 39 59 68 .. .. 0.8 2.5 3.4 3.3
Netherlands Antilles - Antilles néerlandaises
8 9 46 52 59 .. 0.5 0.4 1.9 1.9 1.9 ..
Egypt - Égypte 27 223 32 13 57 135 0.2 1.3 0.1 0.0 0.2 0.3
Kenya 6 4 .. 34 56 25 0.2 0.1 .. 0.6 0.8 0.3
Colombia - Colombie 44 150 219 50 56 66 0.6 0.9 1.5 0.3 0.2 0.2
Guyana .. 9 27 81 55 48 .. 1.3 3.7 10.1 6.0 4.8
Ecuador - Équateur 2 4 6 7 54 62 0.1 0.1 0.1 0.1 0.5 0.5
French Polynesia - Polynésie française .. .. .. 46 47 51 .. .. .. 2.2 2.0 2.2
Congo 55 27 37 49 45 .. 4.3 2.0 3.1 2.5 1.5 ..
Mongolia - Mongolie .. .. 3 49 40 77 .. .. 0.4 3.5 2.6 4.1
Top 50 developing countries ranked by 2005 values
50 premiers pays en développement classés d'après les valeurs de 2005
Total amount (millions of dollars)Montant total (millions de dollars)
As percentage of imports of goods and services (1)En pourcentage des importations de biens et services (1)
7.4 Workers’ remittancesPayments
7.4 Envois de fonds des travailleursPaiements
-
(1)
(2)
(3)
Includes workers' remittances and compensation of employees.
Trade data in this calculation correspond to IMF balance-of-payments series.
For years 1990 and 2000, data include compensation of employees only;workers' remittances were not available.National data.
Sources:- International Monetary Fund (IMF), Balance of Payments Statisticson CD-ROM
Notes:-
(1)
(2)
(3)
Les valeurs dans ce tableau incluent les envois de fonds des travailleurs et la rémunération des salariés.
Les données du commerce utilisées dans ce calcul proviennent de la série de la balance des paiements du FMI.Pour les années 1990 et 2000, les données comprennent seulement la rémunération des salariés ; les envois de fonds des travailleurs n'étaient pas disponibles.Sources nationales.
Sources : - Fonds monétaire international (FMI), Statistiques de la balance des paiements sur CD-ROM
Notes :
353
7
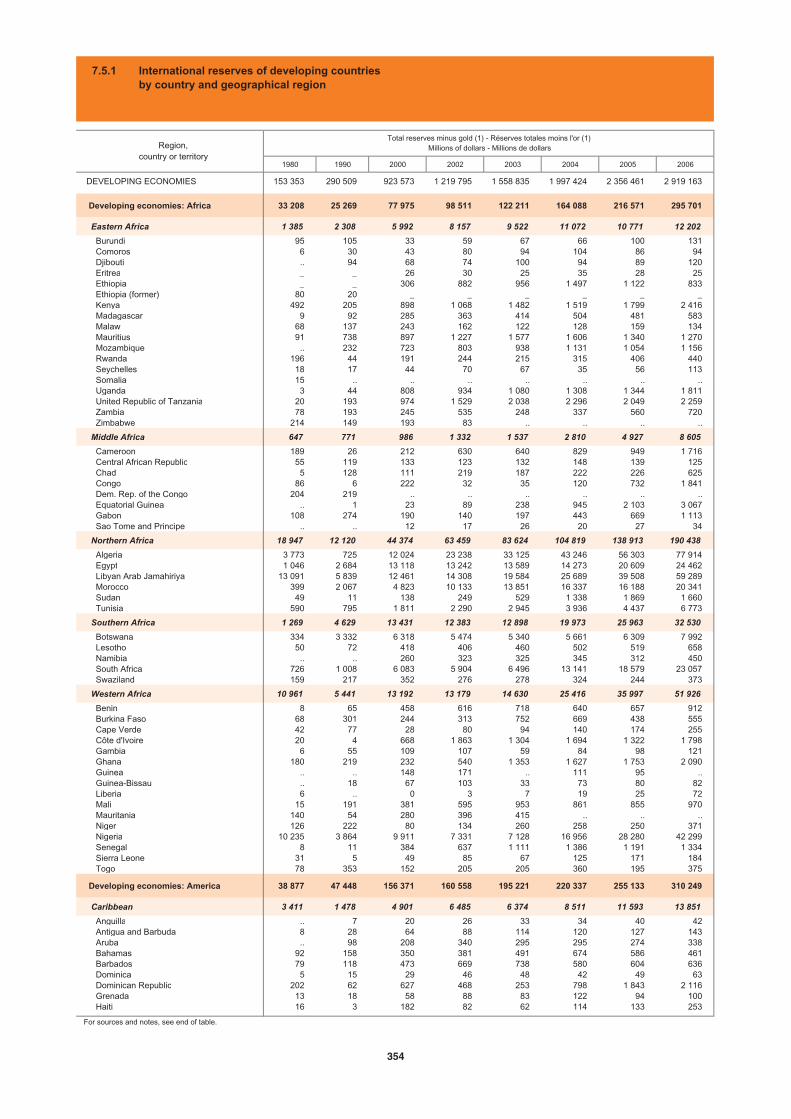
1980 1990 2000 2002 2003 2004 2005 2006
DEVELOPING ECONOMIES 153 353 290 509 923 573 1 219 795 1 558 835 1 997 424 2 356 461 2 919 163
Developing economies: Africa 33 208 25 269 77 975 98 511 122 211 164 088 216 571 295 701
Eastern Africa 1 385 2 308 5 992 8 157 9 522 11 072 10 771 12 202
Burundi 95 105 33 59 67 66 100 131 Comoros 6 30 43 80 94 104 86 94 Djibouti .. 94 68 74 100 94 89 120 Eritrea _ _ 26 30 25 35 28 25 Ethiopia _ _ 306 882 956 1 497 1 122 833 Ethiopia (former) 80 20 _ _ _ _ _ _ Kenya 492 205 898 1 068 1 482 1 519 1 799 2 416 Madagascar 9 92 285 363 414 504 481 583 Malawi 68 137 243 162 122 128 159 134 Mauritius 91 738 897 1 227 1 577 1 606 1 340 1 270 Mozambique .. 232 723 803 938 1 131 1 054 1 156 Rwanda 196 44 191 244 215 315 406 440 Seychelles 18 17 44 70 67 35 56 113 Somalia 15 .. .. .. .. .. .. .. Uganda 3 44 808 934 1 080 1 308 1 344 1 811 United Republic of Tanzania 20 193 974 1 529 2 038 2 296 2 049 2 259 Zambia 78 193 245 535 248 337 560 720 Zimbabwe 214 149 193 83 .. .. .. ..
Middle Africa 647 771 986 1 332 1 537 2 810 4 927 8 605
Cameroon 189 26 212 630 640 829 949 1 716 Central African Republic 55 119 133 123 132 148 139 125 Chad 5 128 111 219 187 222 226 625 Congo 86 6 222 32 35 120 732 1 841 Dem. Rep. of the Congo 204 219 .. .. .. .. .. .. Equatorial Guinea .. 1 23 89 238 945 2 103 3 067 Gabon 108 274 190 140 197 443 669 1 113 Sao Tome and Principe .. .. 12 17 26 20 27 34
Northern Africa 18 947 12 120 44 374 63 459 83 624 104 819 138 913 190 438
Algeria 3 773 725 12 024 23 238 33 125 43 246 56 303 77 914 Egypt 1 046 2 684 13 118 13 242 13 589 14 273 20 609 24 462 Libyan Arab Jamahiriya 13 091 5 839 12 461 14 308 19 584 25 689 39 508 59 289 Morocco 399 2 067 4 823 10 133 13 851 16 337 16 188 20 341 Sudan 49 11 138 249 529 1 338 1 869 1 660 Tunisia 590 795 1 811 2 290 2 945 3 936 4 437 6 773
Southern Africa 1 269 4 629 13 431 12 383 12 898 19 973 25 963 32 530
Botswana 334 3 332 6 318 5 474 5 340 5 661 6 309 7 992 Lesotho 50 72 418 406 460 502 519 658 Namibia .. .. 260 323 325 345 312 450 South Africa 726 1 008 6 083 5 904 6 496 13 141 18 579 23 057 Swaziland 159 217 352 276 278 324 244 373
Western Africa 10 961 5 441 13 192 13 179 14 630 25 416 35 997 51 926
Benin 8 65 458 616 718 640 657 912 Burkina Faso 68 301 244 313 752 669 438 555 Cape Verde 42 77 28 80 94 140 174 255 Côte d'Ivoire 20 4 668 1 863 1 304 1 694 1 322 1 798 Gambia 6 55 109 107 59 84 98 121 Ghana 180 219 232 540 1 353 1 627 1 753 2 090 Guinea .. .. 148 171 .. 111 95 .. Guinea-Bissau .. 18 67 103 33 73 80 82 Liberia 6 .. 0 3 7 19 25 72 Mali 15 191 381 595 953 861 855 970 Mauritania 140 54 280 396 415 .. .. .. Niger 126 222 80 134 260 258 250 371 Nigeria 10 235 3 864 9 911 7 331 7 128 16 956 28 280 42 299 Senegal 8 11 384 637 1 111 1 386 1 191 1 334 Sierra Leone 31 5 49 85 67 125 171 184 Togo 78 353 152 205 205 360 195 375
Developing economies: America 38 877 47 448 156 371 160 558 195 221 220 337 255 133 310 249
Caribbean 3 411 1 478 4 901 6 485 6 374 8 511 11 593 13 851
Anguilla .. 7 20 26 33 34 40 42 Antigua and Barbuda 8 28 64 88 114 120 127 143 Aruba .. 98 208 340 295 295 274 338 Bahamas 92 158 350 381 491 674 586 461 Barbados 79 118 473 669 738 580 604 636 Dominica 5 15 29 46 48 42 49 63 Dominican Republic 202 62 627 468 253 798 1 843 2 116 Grenada 13 18 58 88 83 122 94 100 Haiti 16 3 182 82 62 114 133 253
For sources and notes, see end of table.
Total reserves minus gold (1) - Réserves totales moins l'or (1)Millions of dollars - Millions de dollarsRegion,
country or territory
7.5.1 International reserves of developing countries by country and geographical region
354

2002-2003 2003-2004 2004-2005 2005-2006 1980 1990 2000 2002 2003 2004 2005 2006
339 040 438 589 359 037 562 703 4.2 5.1 6.7 8.8 9.6 9.5 9.5 10.0 ÉCONOMIES EN DÉVELOPPEMENT
23 699 41 878 52 483 79 130 4.4 3.2 7.4 8.5 8.7 9.3 10.2 12.2 Économies en développement : Afrique
1 365 1 550 -301 1 431 1.7 2.2 4.3 5.4 5.5 5.1 4.1 3.9 Afrique orientale
8 -1 34 30 6.8 5.5 2.7 5.5 5.1 4.5 4.5 3.6 Burundi14 9 -18 8 2.6 6.9 12.0 18.2 16.3 14.6 10.4 9.7 Comores26 -6 -5 31 .. 5.2 3.9 4.5 5.0 4.3 3.9 4.2 Djibouti-6 10 -7 -3 _ _ 0.6 0.7 0.7 0.9 0.7 (e)0.5 Érythrée74 541 -375 -289 _ _ 2.9 6.5 5.4 5.8 3.3 2.1 Éthiopie
_ _ _ _ 1.3 0.2 _ _ _ _ _ _ Éthiopie (anc.)414 37 280 617 2.8 1.1 3.5 3.9 4.8 4.0 3.5 4.0 Kenya
51 89 -22 102 0.1 2.0 3.4 7.2 3.8 3.6 3.4 3.9 Madagascar-40 6 31 -25 1.9 2.9 5.5 2.8 1.9 1.6 1.6 1.3 Malawi350 29 -266 -70 1.8 5.5 4.9 6.8 8.0 7.0 5.1 4.2 Maurice135 194 -77 102 .. 3.2 7.5 6.2 6.4 6.7 5.3 4.8 Mozambique-29 100 91 34 9.0 1.9 10.7 11.8 9.9 13.3 12.1 10.6 Rwanda
-2 -33 22 57 2.2 1.1 1.5 2.0 2.0 0.8 1.0 1.8 Seychelles .. .. .. .. 0.4 .. .. .. .. .. .. .. Somalie
146 228 36 467 0.1 1.8 6.3 10.1 10.4 7.8 8.5 8.7 Ouganda510 257 -247 211 0.2 1.7 7.7 11.0 11.3 10.8 7.5 6.1 République-Unie de Tanzanie
-287 89 223 160 0.9 1.9 3.3 5.8 1.9 1.9 2.6 2.8 Zambie .. .. .. .. 1.8 1.0 1.2 0.4 .. .. .. .. Zimbabwe
205 1 273 2 117 3 678 1.7 1.8 2.6 2.3 2.4 3.7 5.3 7.5 Afrique centrale
10 190 120 767 1.4 0.2 1.7 4.0 3.5 4.1 4.2 6.5 Cameroun9 16 -9 -14 8.1 9.2 13.7 12.3 13.5 12.0 9.8 7.4 République centrafricaine
-32 35 4 400 0.8 5.4 4.2 1.6 2.9 2.8 2.8 5.7 Tchad3 85 612 1 109 1.8 0.1 5.6 0.5 0.5 1.6 6.0 11.9 Congo .. .. .. .. 1.6 1.5 .. .. .. .. .. .. Rép. dém. du Congo
149 707 1 158 964 .. 0.1 0.6 2.1 2.3 7.2 11.9 12.9 Guinée équatoriale57 247 225 445 1.9 3.6 2.4 1.8 2.3 4.4 5.9 8.6 Gabon
8 -6 7 8 .. .. 4.7 6.7 7.5 5.7 6.0 5.6 Sao Tomé-et-Principe
20 165 21 195 34 094 51 526 7.2 3.2 10.9 14.3 17.2 16.8 18.2 22.8 Afrique septentrionale
9 888 10 121 13 057 21 611 4.3 0.9 15.7 24.4 30.8 27.4 32.6 44.5 Algérie346 685 6 336 3 852 2.6 1.9 11.2 12.7 14.6 13.3 12.5 14.2 Égypte
5 277 6 105 13 819 19 781 23.2 13.1 37.2 31.2 38.3 35.3 42.4 53.8 Jamahiriya arabe libyenne3 718 2 486 -149 4 153 1.1 3.6 5.0 10.2 11.7 11.1 10.0 10.8 Maroc
281 809 531 -209 0.4 0.2 1.1 1.2 2.2 4.0 3.0 2.5 Soudan655 990 501 2 337 2.0 1.7 2.5 2.9 3.2 3.7 4.0 5.5 Tunisie
515 7 075 5 991 6 567 0.8 3.0 4.5 4.3 3.2 3.8 4.4 4.5 Afrique australe
-134 322 648 1 683 .. .. 30.7 35.6 26.2 21.0 24.1 31.3 Botswana54 41 18 139 .. .. 6.2 6.0 5.0 4.3 4.3 5.3 Lesotho
2 20 -33 138 .. .. 2.0 3.0 2.0 1.7 1.5 2.0 Namibie591 6 646 5 438 4 478 (a)0.8 (a)3.0 2.5 2.4 1.9 2.9 3.6 3.6 Afrique du Sud
2 46 -80 129 .. .. 4.0 3.5 2.1 2.1 1.4 2.0 Swaziland
1 450 10 786 10 582 15 929 5.1 4.8 7.4 6.0 5.4 7.9 8.9 11.6 Afrique occidentale
102 -78 17 255 0.3 2.9 9.0 10.2 9.7 8.6 8.8 10.9 Bénin439 -83 -231 117 2.3 6.7 4.8 5.1 9.8 6.3 3.8 4.7 Burkina Faso
14 46 35 81 7.5 6.8 1.5 3.5 3.2 4.3 4.8 5.6 Cap-Vert-559 390 -372 476 0.1 0.0 2.9 9.1 4.8 4.7 3.1 3.7 Côte d'Ivoire
-48 25 15 22 0.4 3.5 7.0 8.0 4.6 4.4 5.0 5.9 Gambie813 274 126 337 1.9 2.2 0.9 2.4 5.0 4.5 3.9 3.7 Ghana
.. .. -15 .. .. .. 2.9 3.1 .. 1.9 1.4 .. Guinée-70 40 7 2 .. 2.5 16.3 21.1 6.0 10.6 9.1 10.0 Guinée-Bissau
4 11 7 47 0.1 .. 0.0 0.2 0.5 0.7 0.9 1.9 Libéria358 -92 -6 115 0.4 3.8 5.7 7.7 9.1 8.0 6.4 6.6 Mali
19 .. .. .. 5.9 2.9 7.4 11.0 9.2 .. .. .. Mauritanie126 -2 -9 121 2.5 6.9 2.4 3.4 5.0 4.1 3.1 4.5 Niger
-203 9 827 11 324 14 019 7.4 8.2 13.6 6.5 5.0 10.5 13.4 18.5 Nigéria474 276 -195 143 0.1 0.1 3.0 3.8 5.6 5.9 4.5 4.7 Sénégal-18 59 45 13 0.9 0.4 4.0 3.8 2.6 5.2 5.9 5.7 Sierra Leone
0 155 -165 180 1.7 7.3 3.3 4.2 (e)3.2 (e)4.9 (e)2.1 (e)3.7 Togo
34 664 25 115 34 796 55 117 4.0 4.7 4.8 5.5 6.4 6.0 5.9 6.0 Économies en développement : Amérique
-111 2 137 3 082 2 258 2.0 1.5 2.1 3.0 2.9 3.5 4.0 4.2 Caraïbes
7 1 5 2 .. .. 2.6 4.5 5.2 4.0 3.7 (e)2.9 Anguilla26 6 7 15 1.1 1.3 1.9 2.6 3.2 3.2 3.1 3.1 Antigua-et-Barbuda
-45 0 -22 64 .. 2.0 1.0 2.0 1.5 1.2 0.9 1.1 Aruba111 183 -88 -125 0.1 1.7 2.0 2.6 3.3 4.2 2.9 2.0 Bahamas
69 -158 24 33 1.8 2.0 4.9 7.5 7.4 4.9 4.5 4.8 Barbade2 -5 7 14 1.3 1.5 2.4 4.7 4.5 3.5 3.6 4.5 Dominique
-215 545 1 045 272 1.2 0.2 0.8 0.6 0.4 1.2 2.2 2.3 République dominicaine-5 39 -27 6 3.1 2.0 2.8 5.3 3.9 5.8 3.9 4.2 Grenade
-20 52 19 120 0.5 0.1 2.1 0.9 0.6 1.1 1.1 1.6 Haïti
Pour les sources et les notes, se reporter à la fin du tableau.
Régions,pays ou territoires
Annual change in reserves (millions of dollars)Variations annuelles des réserves (millions de dollars)
Number of months of imports (2)Nombre de mois d'importations (2)
7.5.1 Réserves internationales des économies en développementpar pays et régions géographiques
355
7
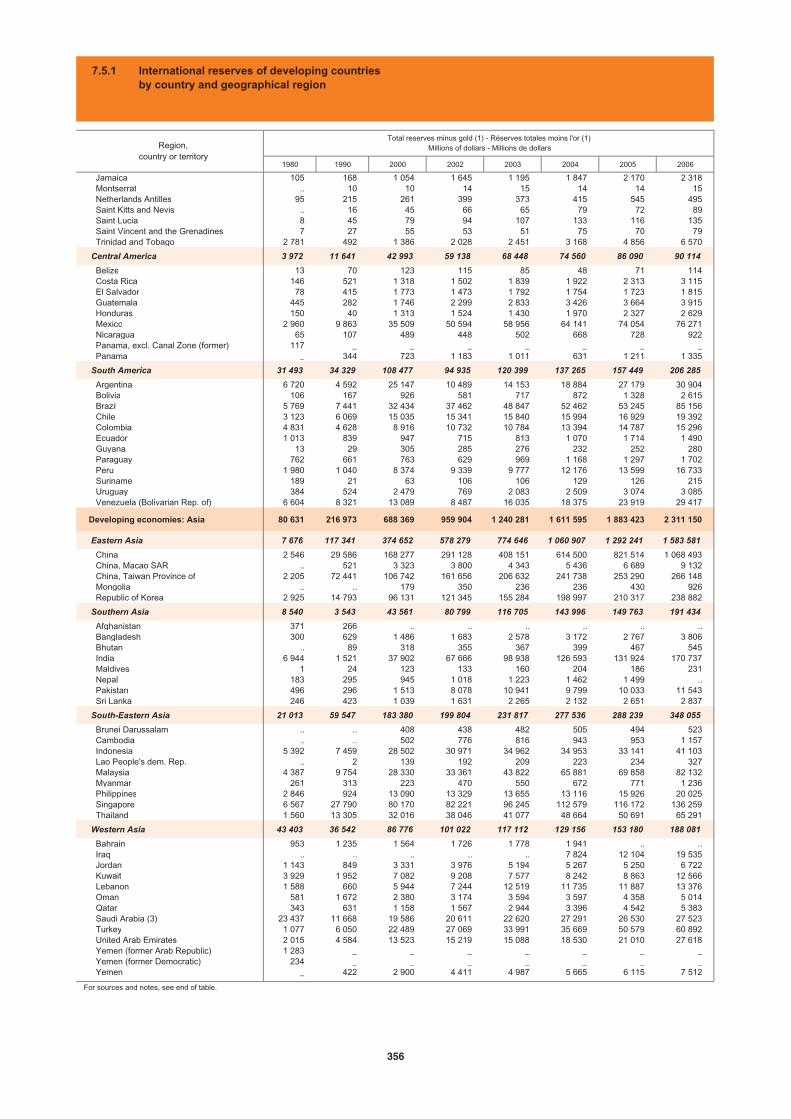
1980 1990 2000 2002 2003 2004 2005 2006
Jamaica 105 168 1 054 1 645 1 195 1 847 2 170 2 318 Montserrat .. 10 10 14 15 14 14 15 Netherlands Antilles 95 215 261 399 373 415 545 495 Saint Kitts and Nevis .. 16 45 66 65 79 72 89 Saint Lucia 8 45 79 94 107 133 116 135 Saint Vincent and the Grenadines 7 27 55 53 51 75 70 79 Trinidad and Tobago 2 781 492 1 386 2 028 2 451 3 168 4 856 6 570
Central America 3 972 11 641 42 993 59 138 68 448 74 560 86 090 90 114
Belize 13 70 123 115 85 48 71 114 Costa Rica 146 521 1 318 1 502 1 839 1 922 2 313 3 115 El Salvador 78 415 1 773 1 473 1 792 1 754 1 723 1 815 Guatemala 445 282 1 746 2 299 2 833 3 426 3 664 3 915 Honduras 150 40 1 313 1 524 1 430 1 970 2 327 2 629 Mexico 2 960 9 863 35 509 50 594 58 956 64 141 74 054 76 271 Nicaragua 65 107 489 448 502 668 728 922 Panama, excl. Canal Zone (former) 117 _ _ _ _ _ _ _ Panama _ 344 723 1 183 1 011 631 1 211 1 335
South America 31 493 34 329 108 477 94 935 120 399 137 265 157 449 206 285
Argentina 6 720 4 592 25 147 10 489 14 153 18 884 27 179 30 904 Bolivia 106 167 926 581 717 872 1 328 2 615 Brazil 5 769 7 441 32 434 37 462 48 847 52 462 53 245 85 156 Chile 3 123 6 069 15 035 15 341 15 840 15 994 16 929 19 392 Colombia 4 831 4 628 8 916 10 732 10 784 13 394 14 787 15 296 Ecuador 1 013 839 947 715 813 1 070 1 714 1 490 Guyana 13 29 305 285 276 232 252 280 Paraguay 762 661 763 629 969 1 168 1 297 1 702 Peru 1 980 1 040 8 374 9 339 9 777 12 176 13 599 16 733 Suriname 189 21 63 106 106 129 126 215 Uruguay 384 524 2 479 769 2 083 2 509 3 074 3 085 Venezuela (Bolivarian Rep. of) 6 604 8 321 13 089 8 487 16 035 18 375 23 919 29 417
Developing economies: Asia 80 631 216 973 688 369 959 904 1 240 281 1 611 595 1 883 423 2 311 150
Eastern Asia 7 676 117 341 374 652 578 279 774 646 1 060 907 1 292 241 1 583 581
China 2 546 29 586 168 277 291 128 408 151 614 500 821 514 1 068 493 China, Macao SAR .. 521 3 323 3 800 4 343 5 436 6 689 9 132 China, Taiwan Province of 2 205 72 441 106 742 161 656 206 632 241 738 253 290 266 148 Mongolia .. .. 179 350 236 236 430 926 Republic of Korea 2 925 14 793 96 131 121 345 155 284 198 997 210 317 238 882
Southern Asia 8 540 3 543 43 561 80 799 116 705 143 996 149 763 191 434
Afghanistan 371 266 .. .. .. .. .. .. Bangladesh 300 629 1 486 1 683 2 578 3 172 2 767 3 806 Bhutan .. 89 318 355 367 399 467 545 India 6 944 1 521 37 902 67 666 98 938 126 593 131 924 170 737 Maldives 1 24 123 133 160 204 186 231 Nepal 183 295 945 1 018 1 223 1 462 1 499 .. Pakistan 496 296 1 513 8 078 10 941 9 799 10 033 11 543 Sri Lanka 246 423 1 039 1 631 2 265 2 132 2 651 2 837
South-Eastern Asia 21 013 59 547 183 380 199 804 231 817 277 536 288 239 348 055
Brunei Darussalam .. .. 408 438 482 505 494 523 Cambodia .. .. 502 776 816 943 953 1 157 Indonesia 5 392 7 459 28 502 30 971 34 962 34 953 33 141 41 103 Lao People's dem. Rep. .. 2 139 192 209 223 234 327 Malaysia 4 387 9 754 28 330 33 361 43 822 65 881 69 858 82 132 Myanmar 261 313 223 470 550 672 771 1 236 Philippines 2 846 924 13 090 13 329 13 655 13 116 15 926 20 025 Singapore 6 567 27 790 80 170 82 221 96 245 112 579 116 172 136 259 Thailand 1 560 13 305 32 016 38 046 41 077 48 664 50 691 65 291
Western Asia 43 403 36 542 86 776 101 022 117 112 129 156 153 180 188 081
Bahrain 953 1 235 1 564 1 726 1 778 1 941 .. .. Iraq .. .. .. .. .. 7 824 12 104 19 535 Jordan 1 143 849 3 331 3 976 5 194 5 267 5 250 6 722 Kuwait 3 929 1 952 7 082 9 208 7 577 8 242 8 863 12 566 Lebanon 1 588 660 5 944 7 244 12 519 11 735 11 887 13 376 Oman 581 1 672 2 380 3 174 3 594 3 597 4 358 5 014 Qatar 343 631 1 158 1 567 2 944 3 396 4 542 5 383 Saudi Arabia (3) 23 437 11 668 19 586 20 611 22 620 27 291 26 530 27 523 Turkey 1 077 6 050 22 489 27 069 33 991 35 669 50 579 60 892 United Arab Emirates 2 015 4 584 13 523 15 219 15 088 18 530 21 010 27 618 Yemen (former Arab Republic) 1 283 _ _ _ _ _ _ _ Yemen (former Democratic) 234 _ _ _ _ _ _ _ Yemen _ 422 2 900 4 411 4 987 5 665 6 115 7 512
For sources and notes, see end of table.
Region,country or territory
Total reserves minus gold (1) - Réserves totales moins l'or (1)Millions of dollars - Millions de dollars
7.5.1 International reserves of developing countries by country and geographical region
356

2002-2003 2003-2004 2004-2005 2005-2006 1980 1990 2000 2002 2003 2004 2005 2006
-450 652 323 149 1.1 1.0 3.8 5.6 3.9 5.9 5.8 5.2 Jamaïque1 -1 0 1 .. 2.5 5.8 6.8 6.4 6.7 6.4 5.8 Montserrat
-26 43 130 -50 0.2 1.2 1.1 2.1 1.7 1.6 1.9 1.5 Antilles néerlandaises-1 14 -7 17 .. 1.8 3.1 4.4 4.4 5.4 4.6 (e)4.9 Saint-Kitts-et-Nevis13 26 -16 18 0.8 2.0 2.7 3.6 3.2 3.5 2.5 2.7 Sainte-Lucie-2 24 -6 9 1.5 2.3 4.1 3.6 3.1 4.0 3.5 3.8 Saint-Vincent-et-les Grenadines
423 717 1 688 1 713 10.5 5.3 5.0 6.7 7.6 7.8 10.2 12.1 Trinité-et-Tobago
9 311 6 112 11 530 4 024 1.6 2.7 2.5 3.5 4.0 3.7 3.8 3.5 Amérique centrale
-30 -36 23 42 1.0 4.0 2.8 2.6 1.8 1.1 1.4 2.0 Belize338 83 391 802 1.1 3.1 2.5 2.5 2.9 2.8 2.8 3.2 Costa Rica320 -38 -31 92 1.0 3.9 4.3 3.4 3.7 3.3 3.0 2.9 El Salvador534 593 238 251 3.3 2.1 4.1 4.4 5.1 5.3 5.0 4.6 Guatemala-94 540 357 301 1.8 0.5 5.5 6.1 5.2 6.0 6.1 5.8 Honduras
8 361 5 185 9 914 2 216 1.6 2.7 2.3 3.4 4.0 3.7 3.8 3.4 Mexique54 166 60 194 0.9 2.0 3.2 3.1 3.2 3.6 3.3 3.7 Nicaragua
_ _ _ _ 1.0 _ _ _ _ _ _ _ Panama, sans la zone du canal (anc.)-172 -380 580 125 _ 2.7 2.6 4.8 3.9 2.1 3.5 3.3 Panama
25 464 16 867 20 184 48 836 5.7 7.3 8.6 9.4 11.0 9.4 8.6 9.1 Amérique du Sud
3 664 4 731 8 295 3 725 7.6 13.5 11.9 14.0 12.3 10.1 11.4 10.9 Argentine136 156 455 1 287 1.9 2.9 6.1 3.9 5.3 5.7 6.8 11.1 Bolivie
11 385 3 615 783 31 911 2.8 4.0 6.6 9.0 11.5 9.5 8.2 10.7 Brésil498 154 936 2 463 6.5 9.4 9.7 10.8 9.8 7.7 6.2 6.1 Chili
52 2 610 1 393 509 12.2 9.9 9.3 10.1 9.3 9.6 8.4 7.0 Colombie98 257 645 -225 5.4 5.4 3.1 1.3 1.5 1.6 2.0 1.5 Équateur-8 -45 20 28 0.4 1.1 5.6 5.9 5.8 4.3 3.8 3.9 Guyana
340 199 129 405 14.9 5.9 4.2 4.5 5.2 4.5 4.2 3.4 Paraguay438 2 400 1 423 3 134 9.5 3.6 11.3 15.0 13.9 14.5 13.1 13.1 Pérou
0 24 -4 90 4.5 0.5 1.4 2.6 1.8 2.1 1.6 2.7 Suriname1 314 425 566 11 2.7 4.7 8.6 4.7 11.4 9.7 9.5 7.8 Uruguay7 548 2 341 5 543 5 499 6.7 13.6 9.7 8.6 18.4 13.2 11.9 10.5 Venezuela (Rép. bolivarienne du)
280 377 371 314 271 828 427 727 4.2 5.7 7.3 9.9 10.6 10.4 10.2 10.7 Économies en développement : Asie
196 367 286 261 231 334 291 340 1.5 7.8 8.5 12.3 12.9 13.3 14.0 14.5 Asie orientale
117 024 206 348 207 015 246 978 1.5 6.7 9.0 11.8 11.9 13.1 14.9 16.2 Chine543 1 093 1 253 2 443 .. 4.1 17.6 18.0 18.9 18.8 20.5 24.0 Chine (RAS de Macao)
44 975 35 107 11 551 12 858 1.3 15.9 9.2 17.2 19.5 17.3 16.6 15.8 Province chinoise de Taiwan-114 0 194 496 .. .. 3.5 6.1 3.5 2.8 4.4 7.5 Mongolie
33 939 43 713 11 321 28 565 1.6 2.5 7.2 9.6 10.4 10.6 9.7 9.3 République de Corée
35 907 27 291 5 767 41 671 3.9 1.1 6.5 11.2 13.1 12.1 9.1 9.7 Asie méridionale
.. .. .. .. 5.3 3.4 .. .. .. .. .. .. Afghanistan895 595 -405 1 038 1.4 2.1 2.0 2.4 3.0 3.2 2.4 2.8 Bangladesh
12 32 69 78 .. 13.1 21.8 21.7 17.7 11.6 14.5 15.6 Bhoutan31 273 27 655 5 331 38 813 5.6 0.8 8.8 14.4 16.4 15.2 11.1 11.7 Inde
26 44 -17 45 0.4 2.1 3.8 4.1 4.1 3.8 3.0 3.0 Maldives205 240 37 .. 6.4 5.3 7.2 8.6 8.4 9.4 9.7 .. Népal
2 863 -1 142 234 1 510 1.1 0.5 1.7 8.6 10.1 6.6 4.7 4.6 Pakistan634 -133 519 186 1.4 1.9 2.0 3.2 4.1 3.2 3.6 3.3 Sri Lanka
32 013 45 719 10 703 59 816 4.0 4.5 6.1 7.0 7.5 7.2 6.2 6.5 Asie du Sud-Est
44 24 -11 29 .. .. 4.4 3.4 4.4 4.3 4.0 3.6 Brunéi Darussalam39 128 10 204 .. .. 3.1 3.9 3.7 3.5 2.9 2.9 Cambodge
3 992 -10 -1 812 7 963 6.0 4.1 8.5 10.4 10.6 8.3 5.7 6.5 Indonésie17 15 11 93 .. 0.1 3.1 5.1 5.4 3.8 3.2 3.7 Rép. dém. populaire lao
10 461 22 059 3 977 12 274 4.9 4.0 4.1 5.0 6.4 7.5 7.3 7.5 Malaisie80 122 99 465 8.8 13.8 1.1 2.4 3.2 3.7 4.8 7.0 Myanmar
326 -539 2 810 4 100 4.1 0.9 4.2 4.3 4.1 3.7 4.1 4.4 Philippines14 024 16 334 3 593 20 087 3.3 5.5 7.2 8.5 9.0 8.2 7.0 6.8 Singapour
3 031 7 587 2 027 14 601 2.0 4.8 6.2 7.1 6.5 6.2 5.1 6.1 Thaïlande
16 090 12 044 24 025 34 901 6.7 5.3 6.3 7.0 6.7 5.4 5.3 5.6 Asie occidentale
53 162 .. .. 3.3 4.0 4.1 4.1 3.8 3.5 .. .. Bahreïn .. .. 4 280 7 431 .. .. .. .. .. 4.7 6.2 11.2 Iraq
1 218 72 -16 1 472 5.7 3.9 8.7 9.4 10.9 7.8 6.0 7.0 Jordanie-1 631 665 621 3 703 7.2 5.9 11.9 12.3 8.3 7.8 6.1 9.4 Koweït5 276 -785 153 1 489 5.2 3.1 11.4 13.3 20.5 14.7 14.8 16.6 Liban
420 4 761 656 4.0 7.5 5.7 6.3 6.6 4.9 5.9 5.5 Oman1 377 452 1 147 840 2.8 4.5 4.3 4.6 7.2 6.8 5.4 3.9 Qatar2 010 4 671 -761 993 9.3 5.8 7.8 7.7 7.4 7.3 5.4 4.7 Arabie saoudite (3)6 922 1 678 14 910 10 313 1.6 3.3 5.0 6.5 6.2 4.4 6.1 5.5 Turquie-132 3 442 2 480 6 607 2.8 4.9 4.6 4.3 3.5 3.1 2.8 3.4 Émirats arabes unis
_ _ _ _ 10.1 _ _ _ _ _ _ _ Yémen (anc. République arabe du)_ _ _ _ 2.9 _ _ _ _ _ _ _ Yémen (anc. démocratique)
576 678 451 1 396 _ 3.2 15.0 18.1 16.3 17.6 15.6 14.7 Yémen
Pour les sources et les notes, se reporter à la fin du tableau.
Régions,pays ou territoires
Annual change in reserves (millions of dollars)Variations annuelles des réserves (millions de dollars)
Number of months of imports (2)Nombre de mois d'importations (2)
7.5.1 Réserves internationales des économies en développementpar pays et régions géographiques
357
7
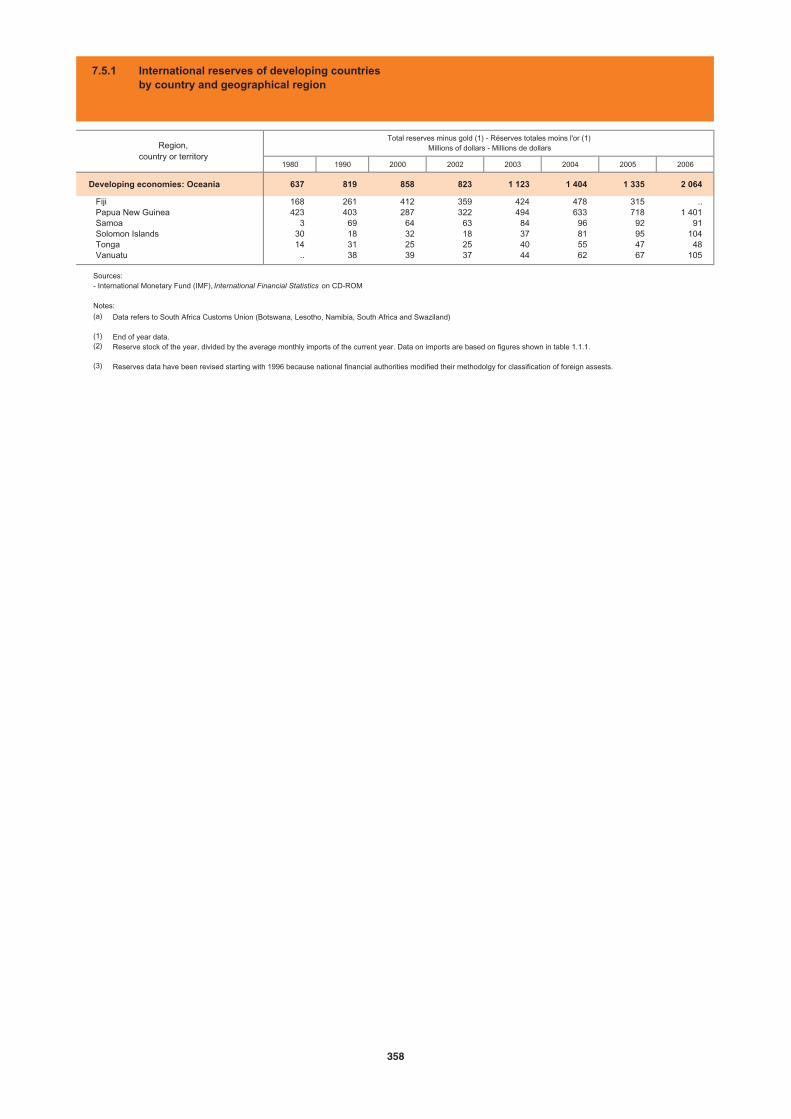
1980 1990 2000 2002 2003 2004 2005 2006
Developing economies: Oceania 637 819 858 823 1 123 1 404 1 335 2 064
Fiji 168 261 412 359 424 478 315 .. Papua New Guinea 423 403 287 322 494 633 718 1 401 Samoa 3 69 64 63 84 96 92 91 Solomon Islands 30 18 32 18 37 81 95 104 Tonga 14 31 25 25 40 55 47 48 Vanuatu .. 38 39 37 44 62 67 105
Region,country or territory
Total reserves minus gold (1) - Réserves totales moins l'or (1)Millions of dollars - Millions de dollars
7.5.1 International reserves of developing countries by country and geographical region
(a)
(1)(2)
(3)
Data refers to South Africa Customs Union (Botswana, Lesotho, Namibia, South Africa and Swaziland)
End of year data.Reserve stock of the year, divided by the average monthly imports of the current year. Data on imports are based on figures shown in table 1.1.1.
Reserves data have been revised starting with 1996 because national financial authorities modified their methodolgy for classification of foreign assests.
Sources:- International Monetary Fund (IMF), International Financial Statistics on CD-ROM
Notes:
358
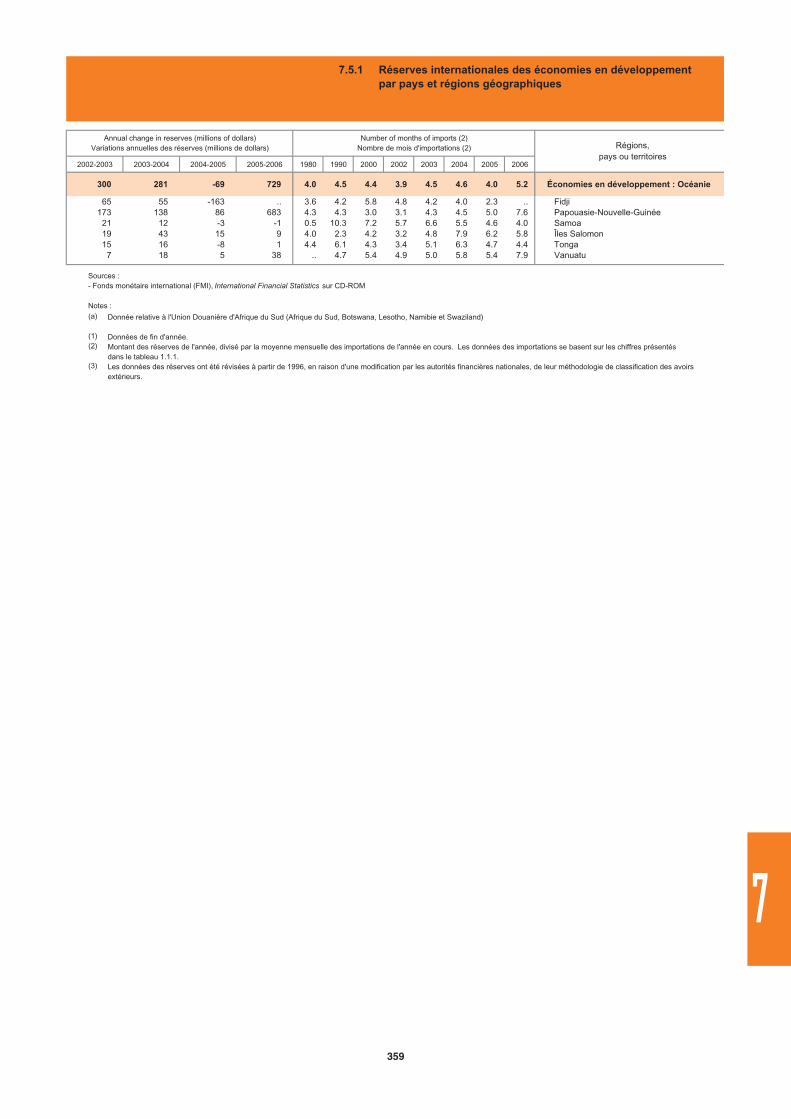
2002-2003 2003-2004 2004-2005 2005-2006 1980 1990 2000 2002 2003 2004 2005 2006
300 281 -69 729 4.0 4.5 4.4 3.9 4.5 4.6 4.0 5.2 Économies en développement : Océanie
65 55 -163 .. 3.6 4.2 5.8 4.8 4.2 4.0 2.3 .. Fidji173 138 86 683 4.3 4.3 3.0 3.1 4.3 4.5 5.0 7.6 Papouasie-Nouvelle-Guinée
21 12 -3 -1 0.5 10.3 7.2 5.7 6.6 5.5 4.6 4.0 Samoa19 43 15 9 4.0 2.3 4.2 3.2 4.8 7.9 6.2 5.8 Îles Salomon15 16 -8 1 4.4 6.1 4.3 3.4 5.1 6.3 4.7 4.4 Tonga
7 18 5 38 .. 4.7 5.4 4.9 5.0 5.8 5.4 7.9 Vanuatu
Annual change in reserves (millions of dollars)Variations annuelles des réserves (millions de dollars)
Number of months of imports (2)Nombre de mois d'importations (2) Régions,
pays ou territoires
7.5.1 Réserves internationales des économies en développementpar pays et régions géographiques
(a)
(1)(2)
(3)
Donnée relative à l'Union Douanière d'Afrique du Sud (Afrique du Sud, Botswana, Lesotho, Namibie et Swaziland)
Données de fin d'année.Montant des réserves de l'année, divisé par la moyenne mensuelle des importations de l'année en cours. Les données des importations se basent sur les chiffres présentésdans le tableau 1.1.1.Les données des réserves ont été révisées à partir de 1996, en raison d'une modification par les autorités financières nationales, de leur méthodologie de classification des avoirs extérieurs.
Sources : - Fonds monétaire international (FMI), International Financial Statistics sur CD-ROM
Notes :
359
7
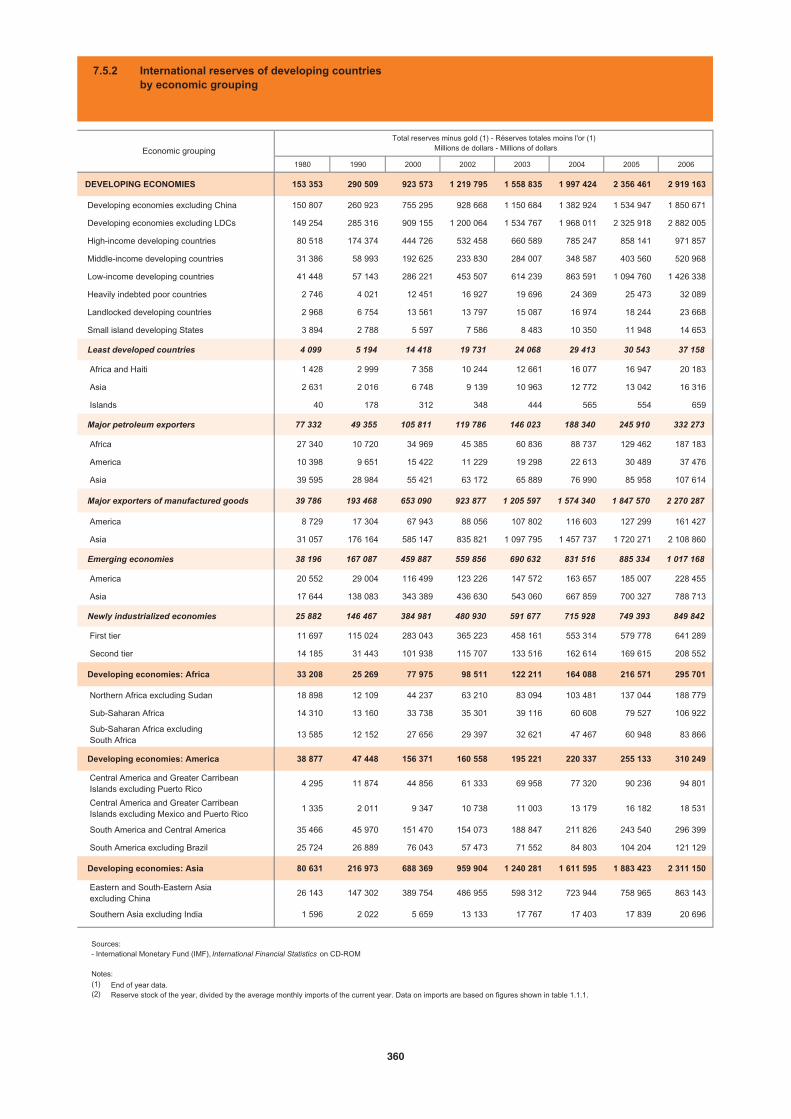
1980 1990 2000 2002 2003 2004 2005 2006
DEVELOPING ECONOMIES 153 353 290 509 923 573 1 219 795 1 558 835 1 997 424 2 356 461 2 919 163
Developing economies excluding China 150 807 260 923 755 295 928 668 1 150 684 1 382 924 1 534 947 1 850 671
Developing economies excluding LDCs 149 254 285 316 909 155 1 200 064 1 534 767 1 968 011 2 325 918 2 882 005
High-income developing countries 80 518 174 374 444 726 532 458 660 589 785 247 858 141 971 857
Middle-income developing countries 31 386 58 993 192 625 233 830 284 007 348 587 403 560 520 968
Low-income developing countries 41 448 57 143 286 221 453 507 614 239 863 591 1 094 760 1 426 338
Heavily indebted poor countries 2 746 4 021 12 451 16 927 19 696 24 369 25 473 32 089
Landlocked developing countries 2 968 6 754 13 561 13 797 15 087 16 974 18 244 23 668
Small island developing States 3 894 2 788 5 597 7 586 8 483 10 350 11 948 14 653
Least developed countries 4 099 5 194 14 418 19 731 24 068 29 413 30 543 37 158
Africa and Haiti 1 428 2 999 7 358 10 244 12 661 16 077 16 947 20 183
Asia 2 631 2 016 6 748 9 139 10 963 12 772 13 042 16 316
Islands 40 178 312 348 444 565 554 659
Major petroleum exporters 77 332 49 355 105 811 119 786 146 023 188 340 245 910 332 273
Africa 27 340 10 720 34 969 45 385 60 836 88 737 129 462 187 183
America 10 398 9 651 15 422 11 229 19 298 22 613 30 489 37 476
Asia 39 595 28 984 55 421 63 172 65 889 76 990 85 958 107 614
Major exporters of manufactured goods 39 786 193 468 653 090 923 877 1 205 597 1 574 340 1 847 570 2 270 287
America 8 729 17 304 67 943 88 056 107 802 116 603 127 299 161 427
Asia 31 057 176 164 585 147 835 821 1 097 795 1 457 737 1 720 271 2 108 860
Emerging economies 38 196 167 087 459 887 559 856 690 632 831 516 885 334 1 017 168
America 20 552 29 004 116 499 123 226 147 572 163 657 185 007 228 455
Asia 17 644 138 083 343 389 436 630 543 060 667 859 700 327 788 713
Newly industrialized economies 25 882 146 467 384 981 480 930 591 677 715 928 749 393 849 842
First tier 11 697 115 024 283 043 365 223 458 161 553 314 579 778 641 289
Second tier 14 185 31 443 101 938 115 707 133 516 162 614 169 615 208 552
Developing economies: Africa 33 208 25 269 77 975 98 511 122 211 164 088 216 571 295 701
Northern Africa excluding Sudan 18 898 12 109 44 237 63 210 83 094 103 481 137 044 188 779
Sub-Saharan Africa 14 310 13 160 33 738 35 301 39 116 60 608 79 527 106 922
Sub-Saharan Africa excluding South Africa
13 585 12 152 27 656 29 397 32 621 47 467 60 948 83 866
Developing economies: America 38 877 47 448 156 371 160 558 195 221 220 337 255 133 310 249
Central America and Greater Carribean Islands excluding Puerto Rico
4 295 11 874 44 856 61 333 69 958 77 320 90 236 94 801
Central America and Greater Carribean Islands excluding Mexico and Puerto Rico
1 335 2 011 9 347 10 738 11 003 13 179 16 182 18 531
South America and Central America 35 466 45 970 151 470 154 073 188 847 211 826 243 540 296 399
South America excluding Brazil 25 724 26 889 76 043 57 473 71 552 84 803 104 204 121 129
Developing economies: Asia 80 631 216 973 688 369 959 904 1 240 281 1 611 595 1 883 423 2 311 150
Eastern and South-Eastern Asia excluding China
26 143 147 302 389 754 486 955 598 312 723 944 758 965 863 143
Southern Asia excluding India 1 596 2 022 5 659 13 133 17 767 17 403 17 839 20 696
Total reserves minus gold (1) - Réserves totales moins l'or (1) Millions de dollars - Millions of dollarsEconomic grouping
7.5.2 International reserves of developing countries by economic grouping
(1)(2)
End of year data.Reserve stock of the year, divided by the average monthly imports of the current year. Data on imports are based on figures shown in table 1.1.1.
Sources:- International Monetary Fund (IMF), International Financial Statistics on CD-ROM
Notes:
360
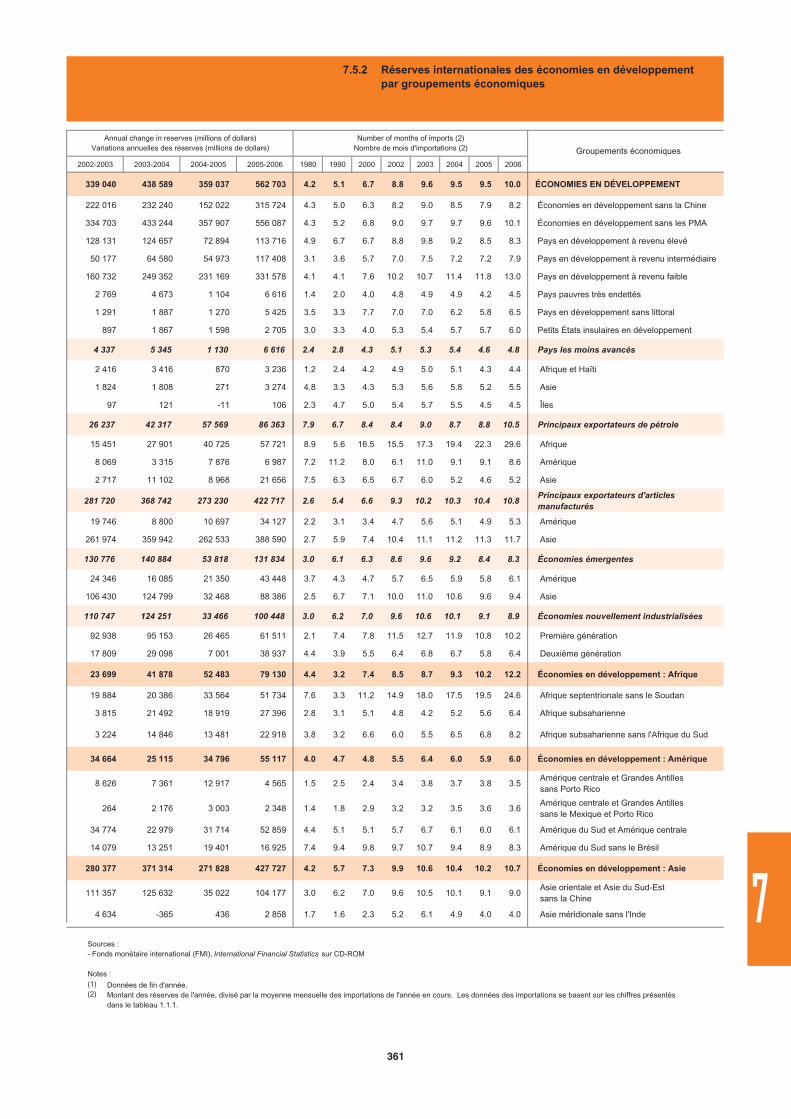
2002-2003 2003-2004 2004-2005 2005-2006 1980 1990 2000 2002 2003 2004 2005 2006
339 040 438 589 359 037 562 703 4.2 5.1 6.7 8.8 9.6 9.5 9.5 10.0 ÉCONOMIES EN DÉVELOPPEMENT
222 016 232 240 152 022 315 724 4.3 5.0 6.3 8.2 9.0 8.5 7.9 8.2 Économies en développement sans la Chine
334 703 433 244 357 907 556 087 4.3 5.2 6.8 9.0 9.7 9.7 9.6 10.1 Économies en développement sans les PMA
128 131 124 657 72 894 113 716 4.9 6.7 6.7 8.8 9.8 9.2 8.5 8.3 Pays en développement à revenu élevé
50 177 64 580 54 973 117 408 3.1 3.6 5.7 7.0 7.5 7.2 7.2 7.9 Pays en développement à revenu intermédiaire
160 732 249 352 231 169 331 578 4.1 4.1 7.6 10.2 10.7 11.4 11.8 13.0 Pays en développement à revenu faible
2 769 4 673 1 104 6 616 1.4 2.0 4.0 4.8 4.9 4.9 4.2 4.5 Pays pauvres très endettés
1 291 1 887 1 270 5 425 3.5 3.3 7.7 7.0 7.0 6.2 5.8 6.5 Pays en développement sans littoral
897 1 867 1 598 2 705 3.0 3.3 4.0 5.3 5.4 5.7 5.7 6.0 Petits États insulaires en développement
4 337 5 345 1 130 6 616 2.4 2.8 4.3 5.1 5.3 5.4 4.6 4.8 Pays les moins avancés
2 416 3 416 870 3 236 1.2 2.4 4.2 4.9 5.0 5.1 4.3 4.4 Afrique et Haïti
1 824 1 808 271 3 274 4.8 3.3 4.3 5.3 5.6 5.8 5.2 5.5 Asie
97 121 -11 106 2.3 4.7 5.0 5.4 5.7 5.5 4.5 4.5 Îles
26 237 42 317 57 569 86 363 7.9 6.7 8.4 8.4 9.0 8.7 8.8 10.5 Principaux exportateurs de pétrole
15 451 27 901 40 725 57 721 8.9 5.6 16.5 15.5 17.3 19.4 22.3 29.6 Afrique
8 069 3 315 7 876 6 987 7.2 11.2 8.0 6.1 11.0 9.1 9.1 8.6 Amérique
2 717 11 102 8 968 21 656 7.5 6.3 6.5 6.7 6.0 5.2 4.6 5.2 Asie
281 720 368 742 273 230 422 717 2.6 5.4 6.6 9.3 10.2 10.3 10.4 10.8 Principaux exportateurs d'articles manufacturés
19 746 8 800 10 697 34 127 2.2 3.1 3.4 4.7 5.6 5.1 4.9 5.3 Amérique
261 974 359 942 262 533 388 590 2.7 5.9 7.4 10.4 11.1 11.2 11.3 11.7 Asie
130 776 140 884 53 818 131 834 3.0 6.1 6.3 8.6 9.6 9.2 8.4 8.3 Économies émergentes
24 346 16 085 21 350 43 448 3.7 4.3 4.7 5.7 6.5 5.9 5.8 6.1 Amérique
106 430 124 799 32 468 88 386 2.5 6.7 7.1 10.0 11.0 10.6 9.6 9.4 Asie
110 747 124 251 33 466 100 448 3.0 6.2 7.0 9.6 10.6 10.1 9.1 8.9 Économies nouvellement industrialisées
92 938 95 153 26 465 61 511 2.1 7.4 7.8 11.5 12.7 11.9 10.8 10.2 Première génération
17 809 29 098 7 001 38 937 4.4 3.9 5.5 6.4 6.8 6.7 5.8 6.4 Deuxième génération
23 699 41 878 52 483 79 130 4.4 3.2 7.4 8.5 8.7 9.3 10.2 12.2 Économies en développement : Afrique
19 884 20 386 33 564 51 734 7.6 3.3 11.2 14.9 18.0 17.5 19.5 24.6 Afrique septentrionale sans le Soudan
3 815 21 492 18 919 27 396 2.8 3.1 5.1 4.8 4.2 5.2 5.6 6.4 Afrique subsaharienne
3 224 14 846 13 481 22 918 3.8 3.2 6.6 6.0 5.5 6.5 6.8 8.2 Afrique subsaharienne sans l'Afrique du Sud
34 664 25 115 34 796 55 117 4.0 4.7 4.8 5.5 6.4 6.0 5.9 6.0 Économies en développement : Amérique
8 626 7 361 12 917 4 565 1.5 2.5 2.4 3.4 3.8 3.7 3.8 3.5 Amérique centrale et Grandes Antilles sans Porto Rico
264 2 176 3 003 2 348 1.4 1.8 2.9 3.2 3.2 3.5 3.6 3.6 Amérique centrale et Grandes Antilles sans le Mexique et Porto Rico
34 774 22 979 31 714 52 859 4.4 5.1 5.1 5.7 6.7 6.1 6.0 6.1 Amérique du Sud et Amérique centrale
14 079 13 251 19 401 16 925 7.4 9.4 9.8 9.7 10.7 9.4 8.9 8.3 Amérique du Sud sans le Brésil
280 377 371 314 271 828 427 727 4.2 5.7 7.3 9.9 10.6 10.4 10.2 10.7 Économies en développement : Asie
111 357 125 632 35 022 104 177 3.0 6.2 7.0 9.6 10.5 10.1 9.1 9.0 Asie orientale et Asie du Sud-Est sans la Chine
4 634 -365 436 2 858 1.7 1.6 2.3 5.2 6.1 4.9 4.0 4.0 Asie méridionale sans l'Inde
Groupements économiques
Annual change in reserves (millions of dollars)Variations annuelles des réserves (millions de dollars)
Number of months of imports (2)Nombre de mois d'importations (2)
7.5.2 Réserves internationales des économies en développementpar groupements économiques
(1)(2)
Données de fin d'année.Montant des réserves de l'année, divisé par la moyenne mensuelle des importations de l'année en cours. Les données des importations se basent sur les chiffres présentésdans le tableau 1.1.1.
Sources : - Fonds monétaire international (FMI), International Financial Statistics sur CD-ROM
Notes :
361
7
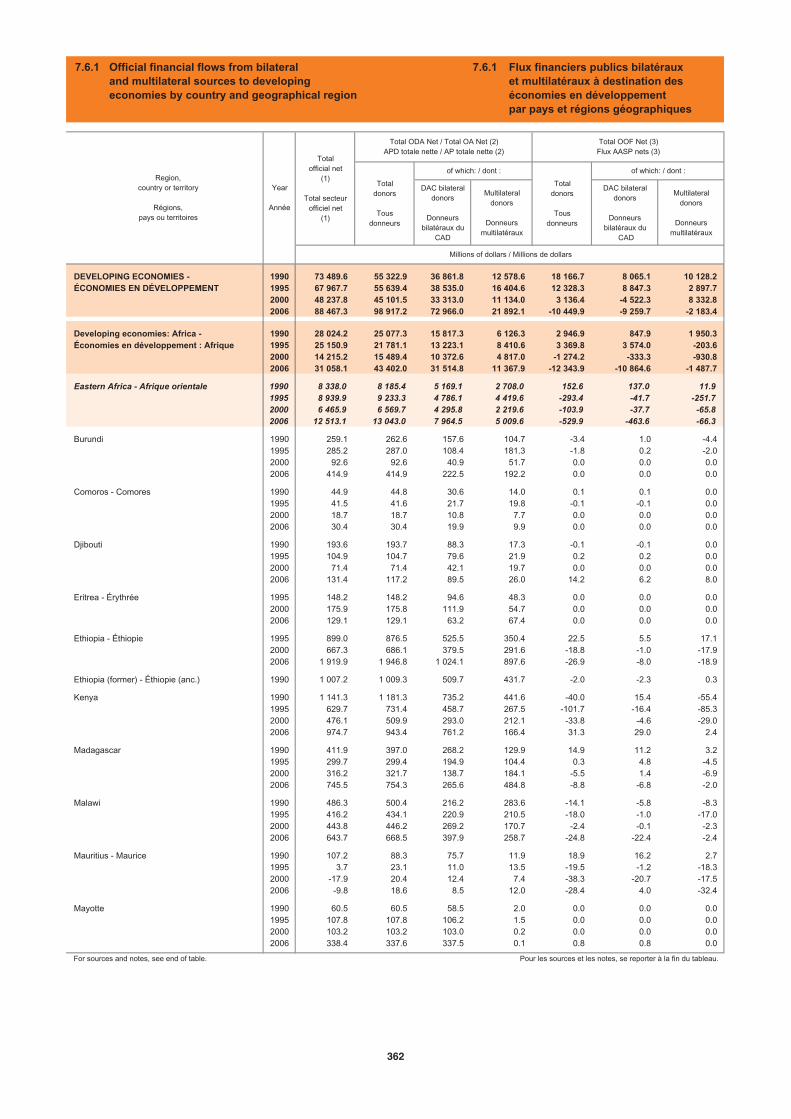
DAC bilateraldonors
Donneursbilatéraux du
CAD
Multilateraldonors
Donneursmultilatéraux
DAC bilateraldonors
Donneursbilatéraux du
CAD
Multilateraldonors
Donneursmultilatéraux
DEVELOPING ECONOMIES - 1990 73 489.6 55 322.9 36 861.8 12 578.6 18 166.7 8 065.1 10 128.2ÉCONOMIES EN DÉVELOPPEMENT 1995 67 967.7 55 639.4 38 535.0 16 404.6 12 328.3 8 847.3 2 897.7
2000 48 237.8 45 101.5 33 313.0 11 134.0 3 136.4 -4 522.3 8 332.82006 88 467.3 98 917.2 72 966.0 21 892.1 -10 449.9 -9 259.7 -2 183.4
Developing economies: Africa - 1990 28 024.2 25 077.3 15 817.3 6 126.3 2 946.9 847.9 1 950.3Économies en développement : Afrique 1995 25 150.9 21 781.1 13 223.1 8 410.6 3 369.8 3 574.0 -203.6
2000 14 215.2 15 489.4 10 372.6 4 817.0 -1 274.2 -333.3 -930.82006 31 058.1 43 402.0 31 514.8 11 367.9 -12 343.9 -10 864.6 -1 487.7
Eastern Africa - Afrique orientale 1990 8 338.0 8 185.4 5 169.1 2 708.0 152.6 137.0 11.91995 8 939.9 9 233.3 4 786.1 4 419.6 -293.4 -41.7 -251.72000 6 465.9 6 569.7 4 295.8 2 219.6 -103.9 -37.7 -65.82006 12 513.1 13 043.0 7 964.5 5 009.6 -529.9 -463.6 -66.3
Burundi 1990 259.1 262.6 157.6 104.7 -3.4 1.0 -4.41995 285.2 287.0 108.4 181.3 -1.8 0.2 -2.02000 92.6 92.6 40.9 51.7 0.0 0.0 0.02006 414.9 414.9 222.5 192.2 0.0 0.0 0.0
Comoros - Comores 1990 44.9 44.8 30.6 14.0 0.1 0.1 0.01995 41.5 41.6 21.7 19.8 -0.1 -0.1 0.02000 18.7 18.7 10.8 7.7 0.0 0.0 0.02006 30.4 30.4 19.9 9.9 0.0 0.0 0.0
Djibouti 1990 193.6 193.7 88.3 17.3 -0.1 -0.1 0.01995 104.9 104.7 79.6 21.9 0.2 0.2 0.02000 71.4 71.4 42.1 19.7 0.0 0.0 0.02006 131.4 117.2 89.5 26.0 14.2 6.2 8.0
Eritrea - Érythrée 1995 148.2 148.2 94.6 48.3 0.0 0.0 0.02000 175.9 175.8 111.9 54.7 0.0 0.0 0.02006 129.1 129.1 63.2 67.4 0.0 0.0 0.0
Ethiopia - Éthiopie 1995 899.0 876.5 525.5 350.4 22.5 5.5 17.12000 667.3 686.1 379.5 291.6 -18.8 -1.0 -17.92006 1 919.9 1 946.8 1 024.1 897.6 -26.9 -8.0 -18.9
Ethiopia (former) - Éthiopie (anc.) 1990 1 007.2 1 009.3 509.7 431.7 -2.0 -2.3 0.3
Kenya 1990 1 141.3 1 181.3 735.2 441.6 -40.0 15.4 -55.41995 629.7 731.4 458.7 267.5 -101.7 -16.4 -85.32000 476.1 509.9 293.0 212.1 -33.8 -4.6 -29.02006 974.7 943.4 761.2 166.4 31.3 29.0 2.4
Madagascar 1990 411.9 397.0 268.2 129.9 14.9 11.2 3.21995 299.7 299.4 194.9 104.4 0.3 4.8 -4.52000 316.2 321.7 138.7 184.1 -5.5 1.4 -6.92006 745.5 754.3 265.6 484.8 -8.8 -6.8 -2.0
Malawi 1990 486.3 500.4 216.2 283.6 -14.1 -5.8 -8.31995 416.2 434.1 220.9 210.5 -18.0 -1.0 -17.02000 443.8 446.2 269.2 170.7 -2.4 -0.1 -2.32006 643.7 668.5 397.9 258.7 -24.8 -22.4 -2.4
Mauritius - Maurice 1990 107.2 88.3 75.7 11.9 18.9 16.2 2.71995 3.7 23.1 11.0 13.5 -19.5 -1.2 -18.32000 -17.9 20.4 12.4 7.4 -38.3 -20.7 -17.52006 -9.8 18.6 8.5 12.0 -28.4 4.0 -32.4
Mayotte 1990 60.5 60.5 58.5 2.0 0.0 0.0 0.01995 107.8 107.8 106.2 1.5 0.0 0.0 0.02000 103.2 103.2 103.0 0.2 0.0 0.0 0.02006 338.4 337.6 337.5 0.1 0.8 0.8 0.0
For sources and notes, see end of table. Pour les sources et les notes, se reporter à la fin du tableau.
Totaldonors
Tousdonneurs
of which: / dont : of which: / dont :
Totalofficial net
(1)
Total secteurofficiel net
(1)
Totaldonors
Tousdonneurs
Total ODA Net / Total OA Net (2)APD totale nette / AP totale nette (2)
Total OOF Net (3)Flux AASP nets (3)
Millions of dollars / Millions de dollars
Year
Année
Region,country or territory
Régions,pays ou territoires
7.6.1 Official financial flows from bilateral and multilateral sources to developing economies by country and geographical region
7.6.1 Flux financiers publics bilatéraux et multilatéraux à destination des économies en développement par pays et régions géographiques
362
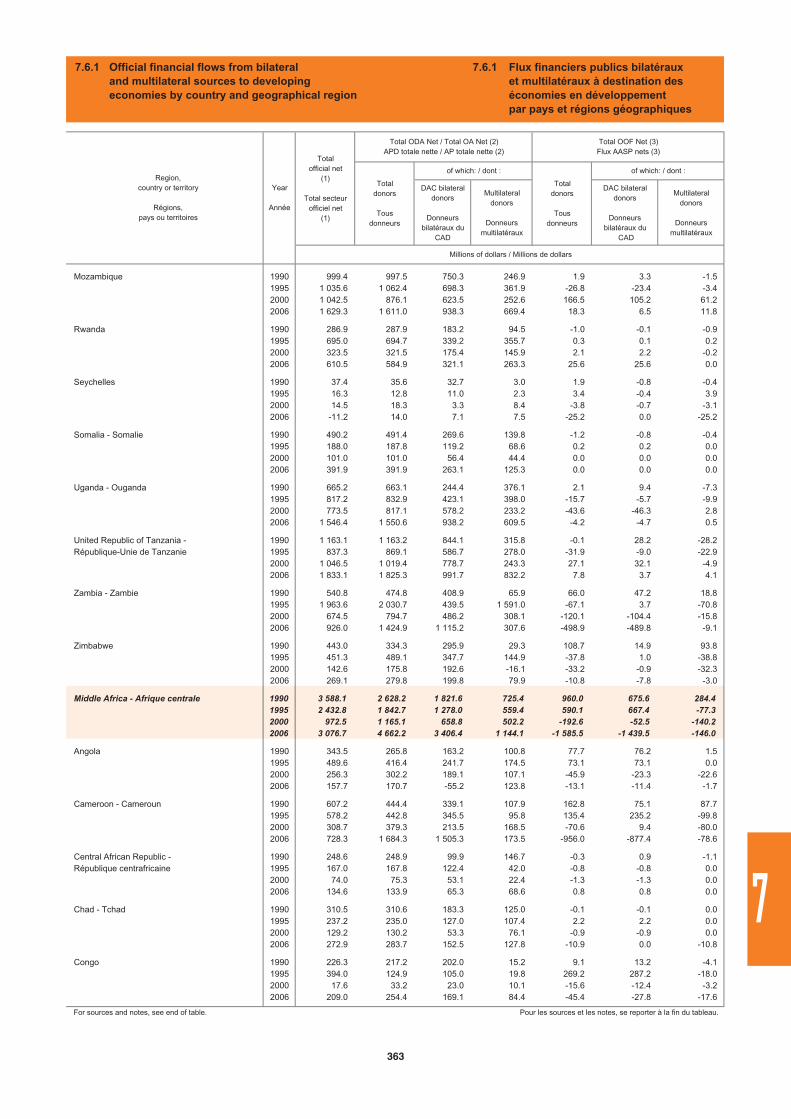
DAC bilateraldonors
Donneursbilatéraux du
CAD
Multilateraldonors
Donneursmultilatéraux
DAC bilateraldonors
Donneursbilatéraux du
CAD
Multilateraldonors
Donneursmultilatéraux
Mozambique 1990 999.4 997.5 750.3 246.9 1.9 3.3 -1.51995 1 035.6 1 062.4 698.3 361.9 -26.8 -23.4 -3.42000 1 042.5 876.1 623.5 252.6 166.5 105.2 61.22006 1 629.3 1 611.0 938.3 669.4 18.3 6.5 11.8
Rwanda 1990 286.9 287.9 183.2 94.5 -1.0 -0.1 -0.91995 695.0 694.7 339.2 355.7 0.3 0.1 0.22000 323.5 321.5 175.4 145.9 2.1 2.2 -0.22006 610.5 584.9 321.1 263.3 25.6 25.6 0.0
Seychelles 1990 37.4 35.6 32.7 3.0 1.9 -0.8 -0.41995 16.3 12.8 11.0 2.3 3.4 -0.4 3.92000 14.5 18.3 3.3 8.4 -3.8 -0.7 -3.12006 -11.2 14.0 7.1 7.5 -25.2 0.0 -25.2
Somalia - Somalie 1990 490.2 491.4 269.6 139.8 -1.2 -0.8 -0.41995 188.0 187.8 119.2 68.6 0.2 0.2 0.02000 101.0 101.0 56.4 44.4 0.0 0.0 0.02006 391.9 391.9 263.1 125.3 0.0 0.0 0.0
Uganda - Ouganda 1990 665.2 663.1 244.4 376.1 2.1 9.4 -7.31995 817.2 832.9 423.1 398.0 -15.7 -5.7 -9.92000 773.5 817.1 578.2 233.2 -43.6 -46.3 2.82006 1 546.4 1 550.6 938.2 609.5 -4.2 -4.7 0.5
United Republic of Tanzania - 1990 1 163.1 1 163.2 844.1 315.8 -0.1 28.2 -28.2République-Unie de Tanzanie 1995 837.3 869.1 586.7 278.0 -31.9 -9.0 -22.9
2000 1 046.5 1 019.4 778.7 243.3 27.1 32.1 -4.92006 1 833.1 1 825.3 991.7 832.2 7.8 3.7 4.1
Zambia - Zambie 1990 540.8 474.8 408.9 65.9 66.0 47.2 18.81995 1 963.6 2 030.7 439.5 1 591.0 -67.1 3.7 -70.82000 674.5 794.7 486.2 308.1 -120.1 -104.4 -15.82006 926.0 1 424.9 1 115.2 307.6 -498.9 -489.8 -9.1
Zimbabwe 1990 443.0 334.3 295.9 29.3 108.7 14.9 93.81995 451.3 489.1 347.7 144.9 -37.8 1.0 -38.82000 142.6 175.8 192.6 -16.1 -33.2 -0.9 -32.32006 269.1 279.8 199.8 79.9 -10.8 -7.8 -3.0
Middle Africa - Afrique centrale 1990 3 588.1 2 628.2 1 821.6 725.4 960.0 675.6 284.41995 2 432.8 1 842.7 1 278.0 559.4 590.1 667.4 -77.32000 972.5 1 165.1 658.8 502.2 -192.6 -52.5 -140.22006 3 076.7 4 662.2 3 406.4 1 144.1 -1 585.5 -1 439.5 -146.0
Angola 1990 343.5 265.8 163.2 100.8 77.7 76.2 1.51995 489.6 416.4 241.7 174.5 73.1 73.1 0.02000 256.3 302.2 189.1 107.1 -45.9 -23.3 -22.62006 157.7 170.7 -55.2 123.8 -13.1 -11.4 -1.7
Cameroon - Cameroun 1990 607.2 444.4 339.1 107.9 162.8 75.1 87.71995 578.2 442.8 345.5 95.8 135.4 235.2 -99.82000 308.7 379.3 213.5 168.5 -70.6 9.4 -80.02006 728.3 1 684.3 1 505.3 173.5 -956.0 -877.4 -78.6
Central African Republic - 1990 248.6 248.9 99.9 146.7 -0.3 0.9 -1.1République centrafricaine 1995 167.0 167.8 122.4 42.0 -0.8 -0.8 0.0
2000 74.0 75.3 53.1 22.4 -1.3 -1.3 0.02006 134.6 133.9 65.3 68.6 0.8 0.8 0.0
Chad - Tchad 1990 310.5 310.6 183.3 125.0 -0.1 -0.1 0.01995 237.2 235.0 127.0 107.4 2.2 2.2 0.02000 129.2 130.2 53.3 76.1 -0.9 -0.9 0.02006 272.9 283.7 152.5 127.8 -10.9 0.0 -10.8
Congo 1990 226.3 217.2 202.0 15.2 9.1 13.2 -4.11995 394.0 124.9 105.0 19.8 269.2 287.2 -18.02000 17.6 33.2 23.0 10.1 -15.6 -12.4 -3.22006 209.0 254.4 169.1 84.4 -45.4 -27.8 -17.6
For sources and notes, see end of table. Pour les sources et les notes, se reporter à la fin du tableau.
Region,country or territory
Régions,pays ou territoires
Year
Année
Totalofficial net
(1)
Total secteurofficiel net
(1)
Total ODA Net / Total OA Net (2)APD totale nette / AP totale nette (2)
Millions of dollars / Millions de dollars
Total OOF Net (3)Flux AASP nets (3)
Totaldonors
Tousdonneurs
of which: / dont :
Totaldonors
Tousdonneurs
of which: / dont :
7.6.1 Official financial flows from bilateral and multilateral sources to developing economies by country and geographical region
7.6.1 Flux financiers publics bilatéraux et multilatéraux à destination des économies en développement par pays et régions géographiques
363
7
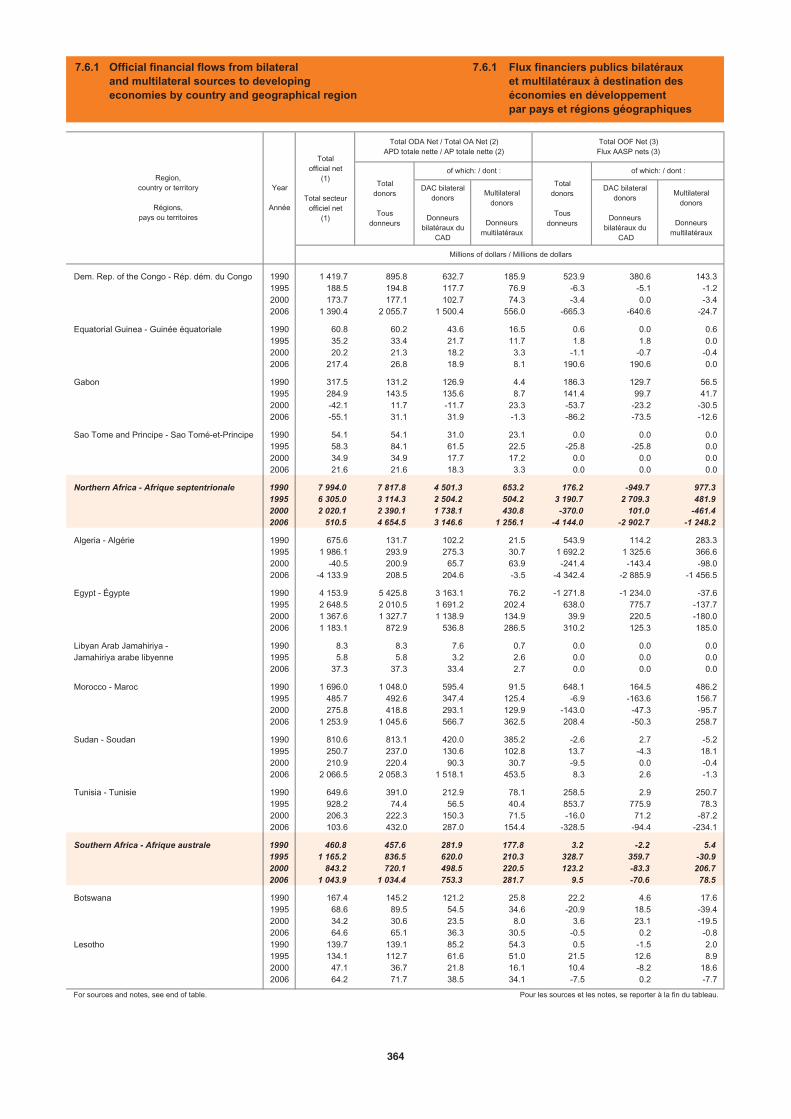
DAC bilateraldonors
Donneursbilatéraux du
CAD
Multilateraldonors
Donneursmultilatéraux
DAC bilateraldonors
Donneursbilatéraux du
CAD
Multilateraldonors
Donneursmultilatéraux
Dem. Rep. of the Congo - Rép. dém. du Congo 1990 1 419.7 895.8 632.7 185.9 523.9 380.6 143.31995 188.5 194.8 117.7 76.9 -6.3 -5.1 -1.22000 173.7 177.1 102.7 74.3 -3.4 0.0 -3.42006 1 390.4 2 055.7 1 500.4 556.0 -665.3 -640.6 -24.7
Equatorial Guinea - Guinée équatoriale 1990 60.8 60.2 43.6 16.5 0.6 0.0 0.61995 35.2 33.4 21.7 11.7 1.8 1.8 0.02000 20.2 21.3 18.2 3.3 -1.1 -0.7 -0.42006 217.4 26.8 18.9 8.1 190.6 190.6 0.0
Gabon 1990 317.5 131.2 126.9 4.4 186.3 129.7 56.51995 284.9 143.5 135.6 8.7 141.4 99.7 41.72000 -42.1 11.7 -11.7 23.3 -53.7 -23.2 -30.52006 -55.1 31.1 31.9 -1.3 -86.2 -73.5 -12.6
Sao Tome and Principe - Sao Tomé-et-Principe 1990 54.1 54.1 31.0 23.1 0.0 0.0 0.01995 58.3 84.1 61.5 22.5 -25.8 -25.8 0.02000 34.9 34.9 17.7 17.2 0.0 0.0 0.02006 21.6 21.6 18.3 3.3 0.0 0.0 0.0
Northern Africa - Afrique septentrionale 1990 7 994.0 7 817.8 4 501.3 653.2 176.2 -949.7 977.31995 6 305.0 3 114.3 2 504.2 504.2 3 190.7 2 709.3 481.92000 2 020.1 2 390.1 1 738.1 430.8 -370.0 101.0 -461.42006 510.5 4 654.5 3 146.6 1 256.1 -4 144.0 -2 902.7 -1 248.2
Algeria - Algérie 1990 675.6 131.7 102.2 21.5 543.9 114.2 283.31995 1 986.1 293.9 275.3 30.7 1 692.2 1 325.6 366.62000 -40.5 200.9 65.7 63.9 -241.4 -143.4 -98.02006 -4 133.9 208.5 204.6 -3.5 -4 342.4 -2 885.9 -1 456.5
Egypt - Égypte 1990 4 153.9 5 425.8 3 163.1 76.2 -1 271.8 -1 234.0 -37.61995 2 648.5 2 010.5 1 691.2 202.4 638.0 775.7 -137.72000 1 367.6 1 327.7 1 138.9 134.9 39.9 220.5 -180.02006 1 183.1 872.9 536.8 286.5 310.2 125.3 185.0
Libyan Arab Jamahiriya - 1990 8.3 8.3 7.6 0.7 0.0 0.0 0.0Jamahiriya arabe libyenne 1995 5.8 5.8 3.2 2.6 0.0 0.0 0.0
2006 37.3 37.3 33.4 2.7 0.0 0.0 0.0
Morocco - Maroc 1990 1 696.0 1 048.0 595.4 91.5 648.1 164.5 486.21995 485.7 492.6 347.4 125.4 -6.9 -163.6 156.72000 275.8 418.8 293.1 129.9 -143.0 -47.3 -95.72006 1 253.9 1 045.6 566.7 362.5 208.4 -50.3 258.7
Sudan - Soudan 1990 810.6 813.1 420.0 385.2 -2.6 2.7 -5.21995 250.7 237.0 130.6 102.8 13.7 -4.3 18.12000 210.9 220.4 90.3 30.7 -9.5 0.0 -0.42006 2 066.5 2 058.3 1 518.1 453.5 8.3 2.6 -1.3
Tunisia - Tunisie 1990 649.6 391.0 212.9 78.1 258.5 2.9 250.71995 928.2 74.4 56.5 40.4 853.7 775.9 78.32000 206.3 222.3 150.3 71.5 -16.0 71.2 -87.22006 103.6 432.0 287.0 154.4 -328.5 -94.4 -234.1
Southern Africa - Afrique australe 1990 460.8 457.6 281.9 177.8 3.2 -2.2 5.41995 1 165.2 836.5 620.0 210.3 328.7 359.7 -30.92000 843.2 720.1 498.5 220.5 123.2 -83.3 206.72006 1 043.9 1 034.4 753.3 281.7 9.5 -70.6 78.5
Botswana 1990 167.4 145.2 121.2 25.8 22.2 4.6 17.61995 68.6 89.5 54.5 34.6 -20.9 18.5 -39.42000 34.2 30.6 23.5 8.0 3.6 23.1 -19.52006 64.6 65.1 36.3 30.5 -0.5 0.2 -0.8
Lesotho 1990 139.7 139.1 85.2 54.3 0.5 -1.5 2.01995 134.1 112.7 61.6 51.0 21.5 12.6 8.92000 47.1 36.7 21.8 16.1 10.4 -8.2 18.62006 64.2 71.7 38.5 34.1 -7.5 0.2 -7.7
For sources and notes, see end of table. Pour les sources et les notes, se reporter à la fin du tableau.
Region,country or territory
Régions,pays ou territoires
Year
Année
Totalofficial net
(1)
Total secteurofficiel net
(1)
Total ODA Net / Total OA Net (2)APD totale nette / AP totale nette (2)
Total OOF Net (3)Flux AASP nets (3)
Totaldonors
Tousdonneurs
of which: / dont :
Totaldonors
Tousdonneurs
of which: / dont :
Millions of dollars / Millions de dollars
7.6.1 Official financial flows from bilateral and multilateral sources to developing economies by country and geographical region
7.6.1 Flux financiers publics bilatéraux et multilatéraux à destination des économies en développement par pays et régions géographiques
364
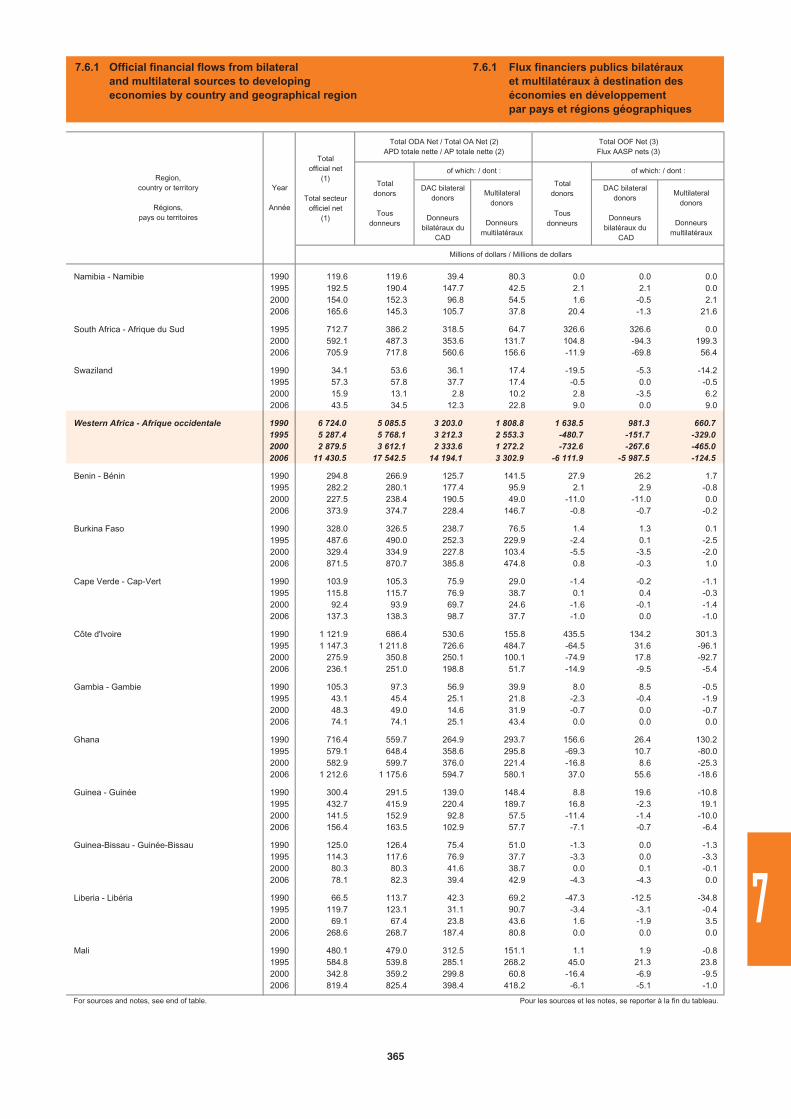
DAC bilateraldonors
Donneursbilatéraux du
CAD
Multilateraldonors
Donneursmultilatéraux
DAC bilateraldonors
Donneursbilatéraux du
CAD
Multilateraldonors
Donneursmultilatéraux
Namibia - Namibie 1990 119.6 119.6 39.4 80.3 0.0 0.0 0.01995 192.5 190.4 147.7 42.5 2.1 2.1 0.02000 154.0 152.3 96.8 54.5 1.6 -0.5 2.12006 165.6 145.3 105.7 37.8 20.4 -1.3 21.6
South Africa - Afrique du Sud 1995 712.7 386.2 318.5 64.7 326.6 326.6 0.02000 592.1 487.3 353.6 131.7 104.8 -94.3 199.32006 705.9 717.8 560.6 156.6 -11.9 -69.8 56.4
Swaziland 1990 34.1 53.6 36.1 17.4 -19.5 -5.3 -14.21995 57.3 57.8 37.7 17.4 -0.5 0.0 -0.52000 15.9 13.1 2.8 10.2 2.8 -3.5 6.22006 43.5 34.5 12.3 22.8 9.0 0.0 9.0
Western Africa - Afrique occidentale 1990 6 724.0 5 085.5 3 203.0 1 808.8 1 638.5 981.3 660.71995 5 287.4 5 768.1 3 212.3 2 553.3 -480.7 -151.7 -329.02000 2 879.5 3 612.1 2 333.6 1 272.2 -732.6 -267.6 -465.02006 11 430.5 17 542.5 14 194.1 3 302.9 -6 111.9 -5 987.5 -124.5
Benin - Bénin 1990 294.8 266.9 125.7 141.5 27.9 26.2 1.71995 282.2 280.1 177.4 95.9 2.1 2.9 -0.82000 227.5 238.4 190.5 49.0 -11.0 -11.0 0.02006 373.9 374.7 228.4 146.7 -0.8 -0.7 -0.2
Burkina Faso 1990 328.0 326.5 238.7 76.5 1.4 1.3 0.11995 487.6 490.0 252.3 229.9 -2.4 0.1 -2.52000 329.4 334.9 227.8 103.4 -5.5 -3.5 -2.02006 871.5 870.7 385.8 474.8 0.8 -0.3 1.0
Cape Verde - Cap-Vert 1990 103.9 105.3 75.9 29.0 -1.4 -0.2 -1.11995 115.8 115.7 76.9 38.7 0.1 0.4 -0.32000 92.4 93.9 69.7 24.6 -1.6 -0.1 -1.42006 137.3 138.3 98.7 37.7 -1.0 0.0 -1.0
Côte d'Ivoire 1990 1 121.9 686.4 530.6 155.8 435.5 134.2 301.31995 1 147.3 1 211.8 726.6 484.7 -64.5 31.6 -96.12000 275.9 350.8 250.1 100.1 -74.9 17.8 -92.72006 236.1 251.0 198.8 51.7 -14.9 -9.5 -5.4
Gambia - Gambie 1990 105.3 97.3 56.9 39.9 8.0 8.5 -0.51995 43.1 45.4 25.1 21.8 -2.3 -0.4 -1.92000 48.3 49.0 14.6 31.9 -0.7 0.0 -0.72006 74.1 74.1 25.1 43.4 0.0 0.0 0.0
Ghana 1990 716.4 559.7 264.9 293.7 156.6 26.4 130.21995 579.1 648.4 358.6 295.8 -69.3 10.7 -80.02000 582.9 599.7 376.0 221.4 -16.8 8.6 -25.32006 1 212.6 1 175.6 594.7 580.1 37.0 55.6 -18.6
Guinea - Guinée 1990 300.4 291.5 139.0 148.4 8.8 19.6 -10.81995 432.7 415.9 220.4 189.7 16.8 -2.3 19.12000 141.5 152.9 92.8 57.5 -11.4 -1.4 -10.02006 156.4 163.5 102.9 57.7 -7.1 -0.7 -6.4
Guinea-Bissau - Guinée-Bissau 1990 125.0 126.4 75.4 51.0 -1.3 0.0 -1.31995 114.3 117.6 76.9 37.7 -3.3 0.0 -3.32000 80.3 80.3 41.6 38.7 0.0 0.1 -0.12006 78.1 82.3 39.4 42.9 -4.3 -4.3 0.0
Liberia - Libéria 1990 66.5 113.7 42.3 69.2 -47.3 -12.5 -34.81995 119.7 123.1 31.1 90.7 -3.4 -3.1 -0.42000 69.1 67.4 23.8 43.6 1.6 -1.9 3.52006 268.6 268.7 187.4 80.8 0.0 0.0 0.0
Mali 1990 480.1 479.0 312.5 151.1 1.1 1.9 -0.81995 584.8 539.8 285.1 268.2 45.0 21.3 23.82000 342.8 359.2 299.8 60.8 -16.4 -6.9 -9.52006 819.4 825.4 398.4 418.2 -6.1 -5.1 -1.0
For sources and notes, see end of table. Pour les sources et les notes, se reporter à la fin du tableau.
Region,country or territory
Régions,pays ou territoires
Year
Année
Totalofficial net
(1)
Total secteurofficiel net
(1)
Total ODA Net / Total OA Net (2)APD totale nette / AP totale nette (2)
Millions of dollars / Millions de dollars
Total OOF Net (3)Flux AASP nets (3)
Totaldonors
Tousdonneurs
of which: / dont :
Totaldonors
Tousdonneurs
of which: / dont :
7.6.1 Official financial flows from bilateral and multilateral sources to developing economies by country and geographical region
7.6.1 Flux financiers publics bilatéraux et multilatéraux à destination des économies en développement par pays et régions géographiques
365
7
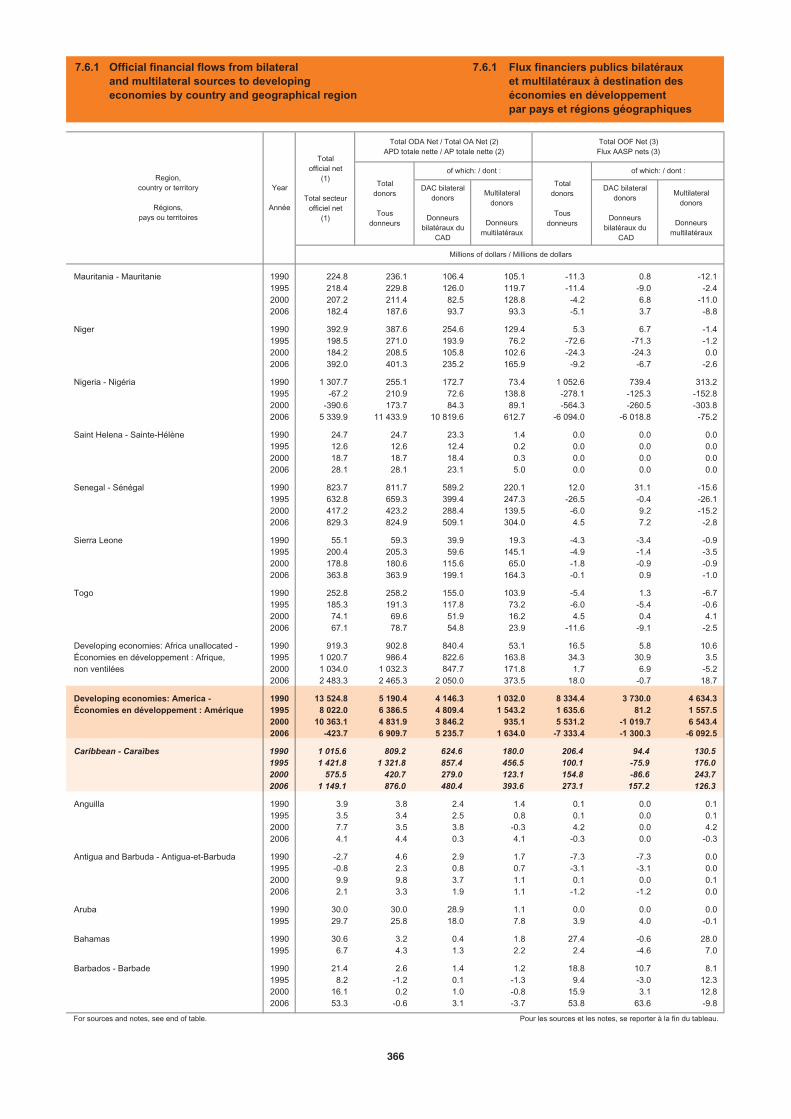
DAC bilateraldonors
Donneursbilatéraux du
CAD
Multilateraldonors
Donneursmultilatéraux
DAC bilateraldonors
Donneursbilatéraux du
CAD
Multilateraldonors
Donneursmultilatéraux
Mauritania - Mauritanie 1990 224.8 236.1 106.4 105.1 -11.3 0.8 -12.11995 218.4 229.8 126.0 119.7 -11.4 -9.0 -2.42000 207.2 211.4 82.5 128.8 -4.2 6.8 -11.02006 182.4 187.6 93.7 93.3 -5.1 3.7 -8.8
Niger 1990 392.9 387.6 254.6 129.4 5.3 6.7 -1.41995 198.5 271.0 193.9 76.2 -72.6 -71.3 -1.22000 184.2 208.5 105.8 102.6 -24.3 -24.3 0.02006 392.0 401.3 235.2 165.9 -9.2 -6.7 -2.6
Nigeria - Nigéria 1990 1 307.7 255.1 172.7 73.4 1 052.6 739.4 313.21995 -67.2 210.9 72.6 138.8 -278.1 -125.3 -152.82000 -390.6 173.7 84.3 89.1 -564.3 -260.5 -303.82006 5 339.9 11 433.9 10 819.6 612.7 -6 094.0 -6 018.8 -75.2
Saint Helena - Sainte-Hélène 1990 24.7 24.7 23.3 1.4 0.0 0.0 0.01995 12.6 12.6 12.4 0.2 0.0 0.0 0.02000 18.7 18.7 18.4 0.3 0.0 0.0 0.02006 28.1 28.1 23.1 5.0 0.0 0.0 0.0
Senegal - Sénégal 1990 823.7 811.7 589.2 220.1 12.0 31.1 -15.61995 632.8 659.3 399.4 247.3 -26.5 -0.4 -26.12000 417.2 423.2 288.4 139.5 -6.0 9.2 -15.22006 829.3 824.9 509.1 304.0 4.5 7.2 -2.8
Sierra Leone 1990 55.1 59.3 39.9 19.3 -4.3 -3.4 -0.91995 200.4 205.3 59.6 145.1 -4.9 -1.4 -3.52000 178.8 180.6 115.6 65.0 -1.8 -0.9 -0.92006 363.8 363.9 199.1 164.3 -0.1 0.9 -1.0
Togo 1990 252.8 258.2 155.0 103.9 -5.4 1.3 -6.71995 185.3 191.3 117.8 73.2 -6.0 -5.4 -0.62000 74.1 69.6 51.9 16.2 4.5 0.4 4.12006 67.1 78.7 54.8 23.9 -11.6 -9.1 -2.5
Developing economies: Africa unallocated - 1990 919.3 902.8 840.4 53.1 16.5 5.8 10.6Économies en développement : Afrique, 1995 1 020.7 986.4 822.6 163.8 34.3 30.9 3.5non ventilées 2000 1 034.0 1 032.3 847.7 171.8 1.7 6.9 -5.2
2006 2 483.3 2 465.3 2 050.0 373.5 18.0 -0.7 18.7
Developing economies: America - 1990 13 524.8 5 190.4 4 146.3 1 032.0 8 334.4 3 730.0 4 634.3Économies en développement : Amérique 1995 8 022.0 6 386.5 4 809.4 1 543.2 1 635.6 81.2 1 557.5
2000 10 363.1 4 831.9 3 846.2 935.1 5 531.2 -1 019.7 6 543.42006 -423.7 6 909.7 5 235.7 1 634.0 -7 333.4 -1 300.3 -6 092.5
Caribbean - Caraïbes 1990 1 015.6 809.2 624.6 180.0 206.4 94.4 130.51995 1 421.8 1 321.8 857.4 456.5 100.1 -75.9 176.02000 575.5 420.7 279.0 123.1 154.8 -86.6 243.72006 1 149.1 876.0 480.4 393.6 273.1 157.2 126.3
Anguilla 1990 3.9 3.8 2.4 1.4 0.1 0.0 0.11995 3.5 3.4 2.5 0.8 0.1 0.0 0.12000 7.7 3.5 3.8 -0.3 4.2 0.0 4.22006 4.1 4.4 0.3 4.1 -0.3 0.0 -0.3
Antigua and Barbuda - Antigua-et-Barbuda 1990 -2.7 4.6 2.9 1.7 -7.3 -7.3 0.01995 -0.8 2.3 0.8 0.7 -3.1 -3.1 0.02000 9.9 9.8 3.7 1.1 0.1 0.0 0.12006 2.1 3.3 1.9 1.1 -1.2 -1.2 0.0
Aruba 1990 30.0 30.0 28.9 1.1 0.0 0.0 0.01995 29.7 25.8 18.0 7.8 3.9 4.0 -0.1
Bahamas 1990 30.6 3.2 0.4 1.8 27.4 -0.6 28.01995 6.7 4.3 1.3 2.2 2.4 -4.6 7.0
Barbados - Barbade 1990 21.4 2.6 1.4 1.2 18.8 10.7 8.11995 8.2 -1.2 0.1 -1.3 9.4 -3.0 12.32000 16.1 0.2 1.0 -0.8 15.9 3.1 12.82006 53.3 -0.6 3.1 -3.7 53.8 63.6 -9.8
For sources and notes, see end of table. Pour les sources et les notes, se reporter à la fin du tableau.
Region,country or territory
Régions,pays ou territoires
Year
Année
Totalofficial net
(1)
Total secteurofficiel net
(1)
Total ODA Net / Total OA Net (2)APD totale nette / AP totale nette (2)
Total OOF Net (3)Flux AASP nets (3)
Totaldonors
Tousdonneurs
of which: / dont :
Totaldonors
Tousdonneurs
of which: / dont :
Millions of dollars / Millions de dollars
7.6.1 Official financial flows from bilateral and multilateral sources to developing economies by country and geographical region
7.6.1 Flux financiers publics bilatéraux et multilatéraux à destination des économies en développement par pays et régions géographiques
366
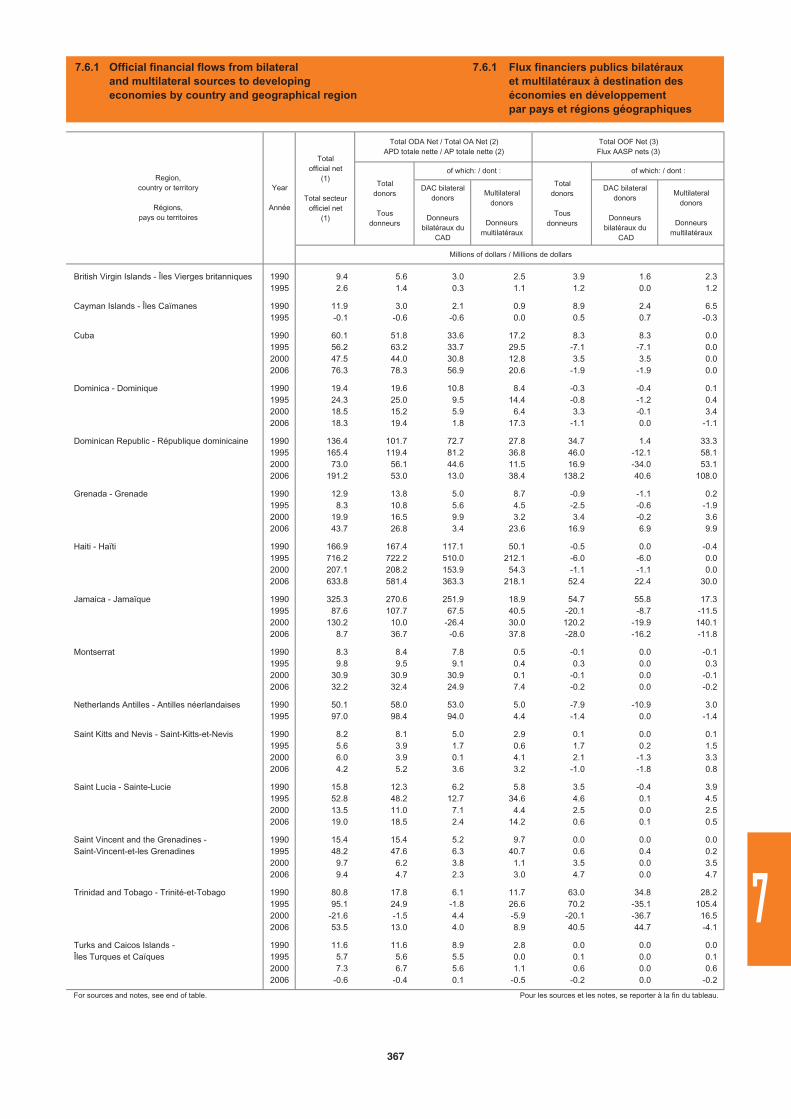
DAC bilateraldonors
Donneursbilatéraux du
CAD
Multilateraldonors
Donneursmultilatéraux
DAC bilateraldonors
Donneursbilatéraux du
CAD
Multilateraldonors
Donneursmultilatéraux
British Virgin Islands - Îles Vierges britanniques 1990 9.4 5.6 3.0 2.5 3.9 1.6 2.31995 2.6 1.4 0.3 1.1 1.2 0.0 1.2
Cayman Islands - Îles Caïmanes 1990 11.9 3.0 2.1 0.9 8.9 2.4 6.51995 -0.1 -0.6 -0.6 0.0 0.5 0.7 -0.3
Cuba 1990 60.1 51.8 33.6 17.2 8.3 8.3 0.01995 56.2 63.2 33.7 29.5 -7.1 -7.1 0.02000 47.5 44.0 30.8 12.8 3.5 3.5 0.02006 76.3 78.3 56.9 20.6 -1.9 -1.9 0.0
Dominica - Dominique 1990 19.4 19.6 10.8 8.4 -0.3 -0.4 0.11995 24.3 25.0 9.5 14.4 -0.8 -1.2 0.42000 18.5 15.2 5.9 6.4 3.3 -0.1 3.42006 18.3 19.4 1.8 17.3 -1.1 0.0 -1.1
Dominican Republic - République dominicaine 1990 136.4 101.7 72.7 27.8 34.7 1.4 33.31995 165.4 119.4 81.2 36.8 46.0 -12.1 58.12000 73.0 56.1 44.6 11.5 16.9 -34.0 53.12006 191.2 53.0 13.0 38.4 138.2 40.6 108.0
Grenada - Grenade 1990 12.9 13.8 5.0 8.7 -0.9 -1.1 0.21995 8.3 10.8 5.6 4.5 -2.5 -0.6 -1.92000 19.9 16.5 9.9 3.2 3.4 -0.2 3.62006 43.7 26.8 3.4 23.6 16.9 6.9 9.9
Haiti - Haïti 1990 166.9 167.4 117.1 50.1 -0.5 0.0 -0.41995 716.2 722.2 510.0 212.1 -6.0 -6.0 0.02000 207.1 208.2 153.9 54.3 -1.1 -1.1 0.02006 633.8 581.4 363.3 218.1 52.4 22.4 30.0
Jamaica - Jamaïque 1990 325.3 270.6 251.9 18.9 54.7 55.8 17.31995 87.6 107.7 67.5 40.5 -20.1 -8.7 -11.52000 130.2 10.0 -26.4 30.0 120.2 -19.9 140.12006 8.7 36.7 -0.6 37.8 -28.0 -16.2 -11.8
Montserrat 1990 8.3 8.4 7.8 0.5 -0.1 0.0 -0.11995 9.8 9.5 9.1 0.4 0.3 0.0 0.32000 30.9 30.9 30.9 0.1 -0.1 0.0 -0.12006 32.2 32.4 24.9 7.4 -0.2 0.0 -0.2
Netherlands Antilles - Antilles néerlandaises 1990 50.1 58.0 53.0 5.0 -7.9 -10.9 3.01995 97.0 98.4 94.0 4.4 -1.4 0.0 -1.4
Saint Kitts and Nevis - Saint-Kitts-et-Nevis 1990 8.2 8.1 5.0 2.9 0.1 0.0 0.11995 5.6 3.9 1.7 0.6 1.7 0.2 1.52000 6.0 3.9 0.1 4.1 2.1 -1.3 3.32006 4.2 5.2 3.6 3.2 -1.0 -1.8 0.8
Saint Lucia - Sainte-Lucie 1990 15.8 12.3 6.2 5.8 3.5 -0.4 3.91995 52.8 48.2 12.7 34.6 4.6 0.1 4.52000 13.5 11.0 7.1 4.4 2.5 0.0 2.52006 19.0 18.5 2.4 14.2 0.6 0.1 0.5
Saint Vincent and the Grenadines - 1990 15.4 15.4 5.2 9.7 0.0 0.0 0.0Saint-Vincent-et-les Grenadines 1995 48.2 47.6 6.3 40.7 0.6 0.4 0.2
2000 9.7 6.2 3.8 1.1 3.5 0.0 3.52006 9.4 4.7 2.3 3.0 4.7 0.0 4.7
Trinidad and Tobago - Trinité-et-Tobago 1990 80.8 17.8 6.1 11.7 63.0 34.8 28.21995 95.1 24.9 -1.8 26.6 70.2 -35.1 105.42000 -21.6 -1.5 4.4 -5.9 -20.1 -36.7 16.52006 53.5 13.0 4.0 8.9 40.5 44.7 -4.1
Turks and Caicos Islands - 1990 11.6 11.6 8.9 2.8 0.0 0.0 0.0Îles Turques et Caïques 1995 5.7 5.6 5.5 0.0 0.1 0.0 0.1
2000 7.3 6.7 5.6 1.1 0.6 0.0 0.62006 -0.6 -0.4 0.1 -0.5 -0.2 0.0 -0.2
For sources and notes, see end of table. Pour les sources et les notes, se reporter à la fin du tableau.
Region,country or territory
Régions,pays ou territoires
Year
Année
Totalofficial net
(1)
Total secteurofficiel net
(1)
Total ODA Net / Total OA Net (2)APD totale nette / AP totale nette (2)
Millions of dollars / Millions de dollars
Total OOF Net (3)Flux AASP nets (3)
Totaldonors
Tousdonneurs
of which: / dont :
Totaldonors
Tousdonneurs
of which: / dont :
7.6.1 Official financial flows from bilateral and multilateral sources to developing economies by country and geographical region
7.6.1 Flux financiers publics bilatéraux et multilatéraux à destination des économies en développement par pays et régions géographiques
367
7
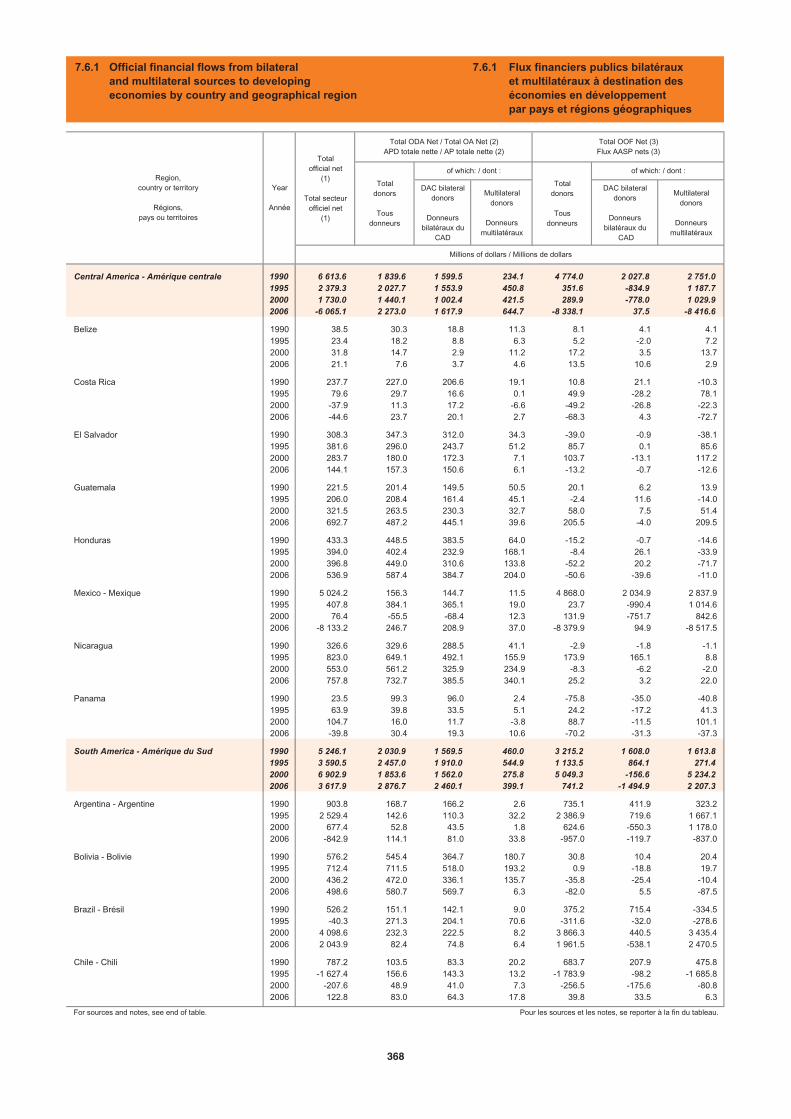
DAC bilateraldonors
Donneursbilatéraux du
CAD
Multilateraldonors
Donneursmultilatéraux
DAC bilateraldonors
Donneursbilatéraux du
CAD
Multilateraldonors
Donneursmultilatéraux
Central America - Amérique centrale 1990 6 613.6 1 839.6 1 599.5 234.1 4 774.0 2 027.8 2 751.01995 2 379.3 2 027.7 1 553.9 450.8 351.6 -834.9 1 187.72000 1 730.0 1 440.1 1 002.4 421.5 289.9 -778.0 1 029.92006 -6 065.1 2 273.0 1 617.9 644.7 -8 338.1 37.5 -8 416.6
Belize 1990 38.5 30.3 18.8 11.3 8.1 4.1 4.11995 23.4 18.2 8.8 6.3 5.2 -2.0 7.22000 31.8 14.7 2.9 11.2 17.2 3.5 13.72006 21.1 7.6 3.7 4.6 13.5 10.6 2.9
Costa Rica 1990 237.7 227.0 206.6 19.1 10.8 21.1 -10.31995 79.6 29.7 16.6 0.1 49.9 -28.2 78.12000 -37.9 11.3 17.2 -6.6 -49.2 -26.8 -22.32006 -44.6 23.7 20.1 2.7 -68.3 4.3 -72.7
El Salvador 1990 308.3 347.3 312.0 34.3 -39.0 -0.9 -38.11995 381.6 296.0 243.7 51.2 85.7 0.1 85.62000 283.7 180.0 172.3 7.1 103.7 -13.1 117.22006 144.1 157.3 150.6 6.1 -13.2 -0.7 -12.6
Guatemala 1990 221.5 201.4 149.5 50.5 20.1 6.2 13.91995 206.0 208.4 161.4 45.1 -2.4 11.6 -14.02000 321.5 263.5 230.3 32.7 58.0 7.5 51.42006 692.7 487.2 445.1 39.6 205.5 -4.0 209.5
Honduras 1990 433.3 448.5 383.5 64.0 -15.2 -0.7 -14.61995 394.0 402.4 232.9 168.1 -8.4 26.1 -33.92000 396.8 449.0 310.6 133.8 -52.2 20.2 -71.72006 536.9 587.4 384.7 204.0 -50.6 -39.6 -11.0
Mexico - Mexique 1990 5 024.2 156.3 144.7 11.5 4 868.0 2 034.9 2 837.91995 407.8 384.1 365.1 19.0 23.7 -990.4 1 014.62000 76.4 -55.5 -68.4 12.3 131.9 -751.7 842.62006 -8 133.2 246.7 208.9 37.0 -8 379.9 94.9 -8 517.5
Nicaragua 1990 326.6 329.6 288.5 41.1 -2.9 -1.8 -1.11995 823.0 649.1 492.1 155.9 173.9 165.1 8.82000 553.0 561.2 325.9 234.9 -8.3 -6.2 -2.02006 757.8 732.7 385.5 340.1 25.2 3.2 22.0
Panama 1990 23.5 99.3 96.0 2.4 -75.8 -35.0 -40.81995 63.9 39.8 33.5 5.1 24.2 -17.2 41.32000 104.7 16.0 11.7 -3.8 88.7 -11.5 101.12006 -39.8 30.4 19.3 10.6 -70.2 -31.3 -37.3
South America - Amérique du Sud 1990 5 246.1 2 030.9 1 569.5 460.0 3 215.2 1 608.0 1 613.81995 3 590.5 2 457.0 1 910.0 544.9 1 133.5 864.1 271.42000 6 902.9 1 853.6 1 562.0 275.8 5 049.3 -156.6 5 234.22006 3 617.9 2 876.7 2 460.1 399.1 741.2 -1 494.9 2 207.3
Argentina - Argentine 1990 903.8 168.7 166.2 2.6 735.1 411.9 323.21995 2 529.4 142.6 110.3 32.2 2 386.9 719.6 1 667.12000 677.4 52.8 43.5 1.8 624.6 -550.3 1 178.02006 -842.9 114.1 81.0 33.8 -957.0 -119.7 -837.0
Bolivia - Bolivie 1990 576.2 545.4 364.7 180.7 30.8 10.4 20.41995 712.4 711.5 518.0 193.2 0.9 -18.8 19.72000 436.2 472.0 336.1 135.7 -35.8 -25.4 -10.42006 498.6 580.7 569.7 6.3 -82.0 5.5 -87.5
Brazil - Brésil 1990 526.2 151.1 142.1 9.0 375.2 715.4 -334.51995 -40.3 271.3 204.1 70.6 -311.6 -32.0 -278.62000 4 098.6 232.3 222.5 8.2 3 866.3 440.5 3 435.42006 2 043.9 82.4 74.8 6.4 1 961.5 -538.1 2 470.5
Chile - Chili 1990 787.2 103.5 83.3 20.2 683.7 207.9 475.81995 -1 627.4 156.6 143.3 13.2 -1 783.9 -98.2 -1 685.82000 -207.6 48.9 41.0 7.3 -256.5 -175.6 -80.82006 122.8 83.0 64.3 17.8 39.8 33.5 6.3
For sources and notes, see end of table. Pour les sources et les notes, se reporter à la fin du tableau.
Region,country or territory
Régions,pays ou territoires
Year
Année
Totalofficial net
(1)
Total secteurofficiel net
(1)
Total ODA Net / Total OA Net (2)APD totale nette / AP totale nette (2)
Total OOF Net (3)Flux AASP nets (3)
Totaldonors
Tousdonneurs
of which: / dont :
Totaldonors
Tousdonneurs
of which: / dont :
Millions of dollars / Millions de dollars
7.6.1 Official financial flows from bilateral and multilateral sources to developing economies by country and geographical region
7.6.1 Flux financiers publics bilatéraux et multilatéraux à destination des économies en développement par pays et régions géographiques
368
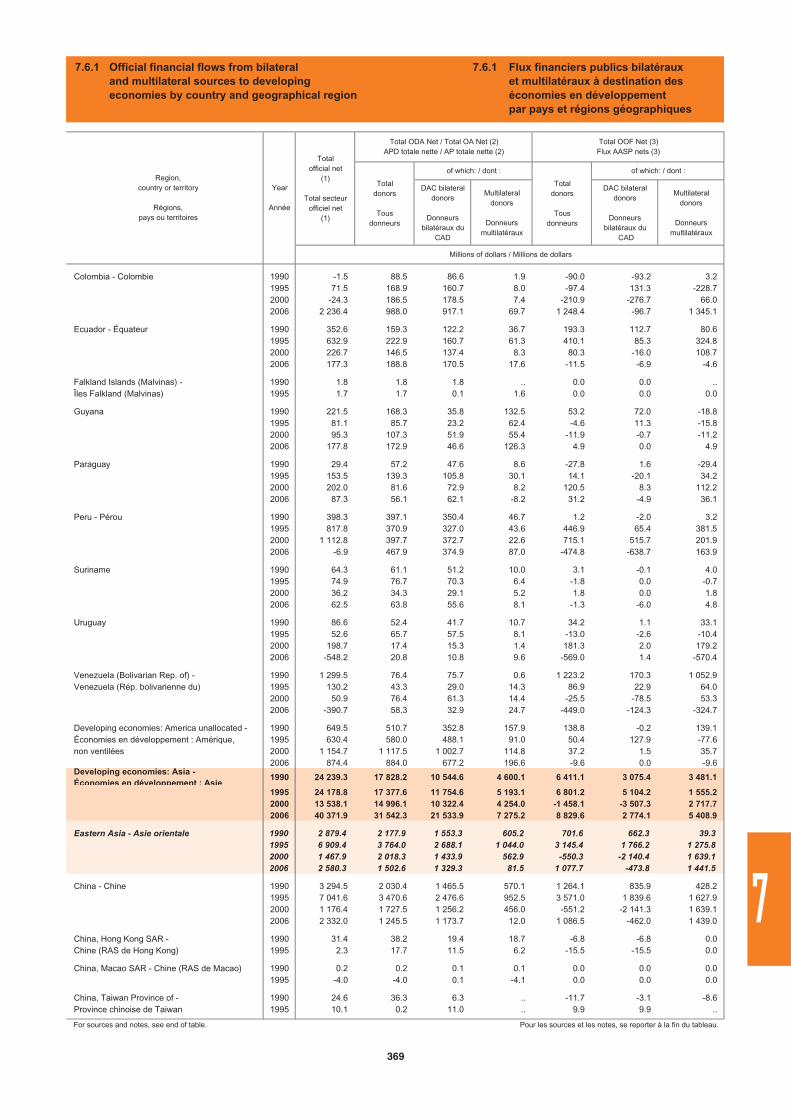
DAC bilateraldonors
Donneursbilatéraux du
CAD
Multilateraldonors
Donneursmultilatéraux
DAC bilateraldonors
Donneursbilatéraux du
CAD
Multilateraldonors
Donneursmultilatéraux
Colombia - Colombie 1990 -1.5 88.5 86.6 1.9 -90.0 -93.2 3.21995 71.5 168.9 160.7 8.0 -97.4 131.3 -228.72000 -24.3 186.5 178.5 7.4 -210.9 -276.7 66.02006 2 236.4 988.0 917.1 69.7 1 248.4 -96.7 1 345.1
Ecuador - Équateur 1990 352.6 159.3 122.2 36.7 193.3 112.7 80.61995 632.9 222.9 160.7 61.3 410.1 85.3 324.82000 226.7 146.5 137.4 8.3 80.3 -16.0 108.72006 177.3 188.8 170.5 17.6 -11.5 -6.9 -4.6
Falkland Islands (Malvinas) - 1990 1.8 1.8 1.8 .. 0.0 0.0 ..Îles Falkland (Malvinas) 1995 1.7 1.7 0.1 1.6 0.0 0.0 0.0
Guyana 1990 221.5 168.3 35.8 132.5 53.2 72.0 -18.81995 81.1 85.7 23.2 62.4 -4.6 11.3 -15.82000 95.3 107.3 51.9 55.4 -11.9 -0.7 -11.22006 177.8 172.9 46.6 126.3 4.9 0.0 4.9
Paraguay 1990 29.4 57.2 47.6 8.6 -27.8 1.6 -29.41995 153.5 139.3 105.8 30.1 14.1 -20.1 34.22000 202.0 81.6 72.9 8.2 120.5 8.3 112.22006 87.3 56.1 62.1 -8.2 31.2 -4.9 36.1
Peru - Pérou 1990 398.3 397.1 350.4 46.7 1.2 -2.0 3.21995 817.8 370.9 327.0 43.6 446.9 65.4 381.52000 1 112.8 397.7 372.7 22.6 715.1 515.7 201.92006 -6.9 467.9 374.9 87.0 -474.8 -638.7 163.9
Suriname 1990 64.3 61.1 51.2 10.0 3.1 -0.1 4.01995 74.9 76.7 70.3 6.4 -1.8 0.0 -0.72000 36.2 34.3 29.1 5.2 1.8 0.0 1.82006 62.5 63.8 55.6 8.1 -1.3 -6.0 4.8
Uruguay 1990 86.6 52.4 41.7 10.7 34.2 1.1 33.11995 52.6 65.7 57.5 8.1 -13.0 -2.6 -10.42000 198.7 17.4 15.3 1.4 181.3 2.0 179.22006 -548.2 20.8 10.8 9.6 -569.0 1.4 -570.4
Venezuela (Bolivarian Rep. of) - 1990 1 299.5 76.4 75.7 0.6 1 223.2 170.3 1 052.9Venezuela (Rép. bolivarienne du) 1995 130.2 43.3 29.0 14.3 86.9 22.9 64.0
2000 50.9 76.4 61.3 14.4 -25.5 -78.5 53.32006 -390.7 58.3 32.9 24.7 -449.0 -124.3 -324.7
Developing economies: America unallocated - 1990 649.5 510.7 352.8 157.9 138.8 -0.2 139.1Économies en développement : Amérique, 1995 630.4 580.0 488.1 91.0 50.4 127.9 -77.6non ventilées 2000 1 154.7 1 117.5 1 002.7 114.8 37.2 1.5 35.7
2006 874.4 884.0 677.2 196.6 -9.6 0.0 -9.6Developing economies: Asia - Économies en développement : Asie
1990 24 239.3 17 828.2 10 544.6 4 600.1 6 411.1 3 075.4 3 481.1
1995 24 178.8 17 377.6 11 754.6 5 193.1 6 801.2 5 104.2 1 555.22000 13 538.1 14 996.1 10 322.4 4 254.0 -1 458.1 -3 507.3 2 717.72006 40 371.9 31 542.3 21 533.9 7 275.2 8 829.6 2 774.1 5 408.9
Eastern Asia - Asie orientale 1990 2 879.4 2 177.9 1 553.3 605.2 701.6 662.3 39.31995 6 909.4 3 764.0 2 688.1 1 044.0 3 145.4 1 766.2 1 275.82000 1 467.9 2 018.3 1 433.9 562.9 -550.3 -2 140.4 1 639.12006 2 580.3 1 502.6 1 329.3 81.5 1 077.7 -473.8 1 441.5
China - Chine 1990 3 294.5 2 030.4 1 465.5 570.1 1 264.1 835.9 428.21995 7 041.6 3 470.6 2 476.6 952.5 3 571.0 1 839.6 1 627.92000 1 176.4 1 727.5 1 256.2 456.0 -551.2 -2 141.3 1 639.12006 2 332.0 1 245.5 1 173.7 12.0 1 086.5 -462.0 1 439.0
China, Hong Kong SAR - 1990 31.4 38.2 19.4 18.7 -6.8 -6.8 0.0Chine (RAS de Hong Kong) 1995 2.3 17.7 11.5 6.2 -15.5 -15.5 0.0
China, Macao SAR - Chine (RAS de Macao) 1990 0.2 0.2 0.1 0.1 0.0 0.0 0.01995 -4.0 -4.0 0.1 -4.1 0.0 0.0 0.0
China, Taiwan Province of - 1990 24.6 36.3 6.3 .. -11.7 -3.1 -8.6Province chinoise de Taiwan 1995 10.1 0.2 11.0 .. 9.9 9.9 ..
For sources and notes, see end of table. Pour les sources et les notes, se reporter à la fin du tableau.
Region,country or territory
Régions,pays ou territoires
Year
Année
Totalofficial net
(1)
Total secteurofficiel net
(1)
Total ODA Net / Total OA Net (2)APD totale nette / AP totale nette (2)
Millions of dollars / Millions de dollars
Total OOF Net (3)Flux AASP nets (3)
Totaldonors
Tousdonneurs
of which: / dont :
Totaldonors
Tousdonneurs
of which: / dont :
7.6.1 Official financial flows from bilateral and multilateral sources to developing economies by country and geographical region
7.6.1 Flux financiers publics bilatéraux et multilatéraux à destination des économies en développement par pays et régions géographiques
369
7
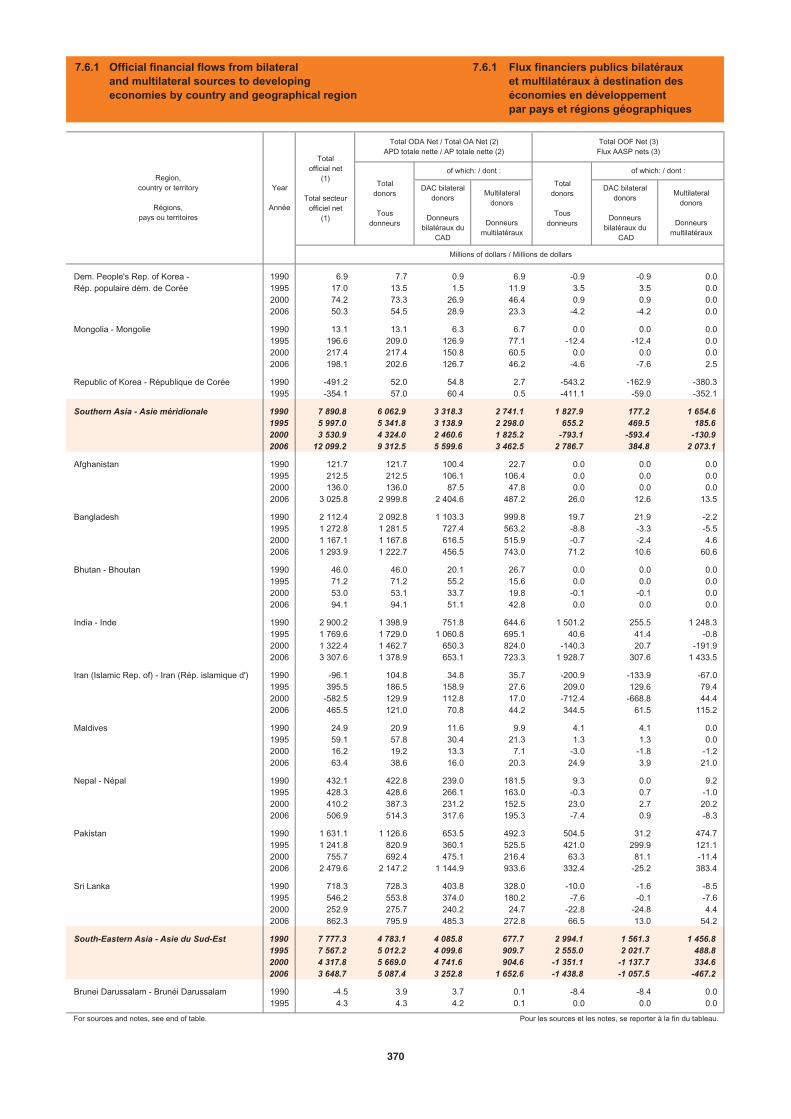
DAC bilateraldonors
Donneursbilatéraux du
CAD
Multilateraldonors
Donneursmultilatéraux
DAC bilateraldonors
Donneursbilatéraux du
CAD
Multilateraldonors
Donneursmultilatéraux
Dem. People's Rep. of Korea - 1990 6.9 7.7 0.9 6.9 -0.9 -0.9 0.0Rép. populaire dém. de Corée 1995 17.0 13.5 1.5 11.9 3.5 3.5 0.0
2000 74.2 73.3 26.9 46.4 0.9 0.9 0.02006 50.3 54.5 28.9 23.3 -4.2 -4.2 0.0
Mongolia - Mongolie 1990 13.1 13.1 6.3 6.7 0.0 0.0 0.01995 196.6 209.0 126.9 77.1 -12.4 -12.4 0.02000 217.4 217.4 150.8 60.5 0.0 0.0 0.02006 198.1 202.6 126.7 46.2 -4.6 -7.6 2.5
Republic of Korea - République de Corée 1990 -491.2 52.0 54.8 2.7 -543.2 -162.9 -380.31995 -354.1 57.0 60.4 0.5 -411.1 -59.0 -352.1
Southern Asia - Asie méridionale 1990 7 890.8 6 062.9 3 318.3 2 741.1 1 827.9 177.2 1 654.61995 5 997.0 5 341.8 3 138.9 2 298.0 655.2 469.5 185.62000 3 530.9 4 324.0 2 460.6 1 825.2 -793.1 -593.4 -130.92006 12 099.2 9 312.5 5 599.6 3 462.5 2 786.7 384.8 2 073.1
Afghanistan 1990 121.7 121.7 100.4 22.7 0.0 0.0 0.01995 212.5 212.5 106.1 106.4 0.0 0.0 0.02000 136.0 136.0 87.5 47.8 0.0 0.0 0.02006 3 025.8 2 999.8 2 404.6 487.2 26.0 12.6 13.5
Bangladesh 1990 2 112.4 2 092.8 1 103.3 999.8 19.7 21.9 -2.21995 1 272.8 1 281.5 727.4 563.2 -8.8 -3.3 -5.52000 1 167.1 1 167.8 616.5 515.9 -0.7 -2.4 4.62006 1 293.9 1 222.7 456.5 743.0 71.2 10.6 60.6
Bhutan - Bhoutan 1990 46.0 46.0 20.1 26.7 0.0 0.0 0.01995 71.2 71.2 55.2 15.6 0.0 0.0 0.02000 53.0 53.1 33.7 19.8 -0.1 -0.1 0.02006 94.1 94.1 51.1 42.8 0.0 0.0 0.0
India - Inde 1990 2 900.2 1 398.9 751.8 644.6 1 501.2 255.5 1 248.31995 1 769.6 1 729.0 1 060.8 695.1 40.6 41.4 -0.82000 1 322.4 1 462.7 650.3 824.0 -140.3 20.7 -191.92006 3 307.6 1 378.9 653.1 723.3 1 928.7 307.6 1 433.5
Iran (Islamic Rep. of) - Iran (Rép. islamique d') 1990 -96.1 104.8 34.8 35.7 -200.9 -133.9 -67.01995 395.5 186.5 158.9 27.6 209.0 129.6 79.42000 -582.5 129.9 112.8 17.0 -712.4 -668.8 44.42006 465.5 121.0 70.8 44.2 344.5 61.5 115.2
Maldives 1990 24.9 20.9 11.6 9.9 4.1 4.1 0.01995 59.1 57.8 30.4 21.3 1.3 1.3 0.02000 16.2 19.2 13.3 7.1 -3.0 -1.8 -1.22006 63.4 38.6 16.0 20.3 24.9 3.9 21.0
Nepal - Népal 1990 432.1 422.8 239.0 181.5 9.3 0.0 9.21995 428.3 428.6 266.1 163.0 -0.3 0.7 -1.02000 410.2 387.3 231.2 152.5 23.0 2.7 20.22006 506.9 514.3 317.6 195.3 -7.4 0.9 -8.3
Pakistan 1990 1 631.1 1 126.6 653.5 492.3 504.5 31.2 474.71995 1 241.8 820.9 360.1 525.5 421.0 299.9 121.12000 755.7 692.4 475.1 216.4 63.3 81.1 -11.42006 2 479.6 2 147.2 1 144.9 933.6 332.4 -25.2 383.4
Sri Lanka 1990 718.3 728.3 403.8 328.0 -10.0 -1.6 -8.51995 546.2 553.8 374.0 180.2 -7.6 -0.1 -7.62000 252.9 275.7 240.2 24.7 -22.8 -24.8 4.42006 862.3 795.9 485.3 272.8 66.5 13.0 54.2
South-Eastern Asia - Asie du Sud-Est 1990 7 777.3 4 783.1 4 085.8 677.7 2 994.1 1 561.3 1 456.81995 7 567.2 5 012.2 4 099.6 909.7 2 555.0 2 021.7 488.82000 4 317.8 5 669.0 4 741.6 904.6 -1 351.1 -1 137.7 334.62006 3 648.7 5 087.4 3 252.8 1 652.6 -1 438.8 -1 057.5 -467.2
Brunei Darussalam - Brunéi Darussalam 1990 -4.5 3.9 3.7 0.1 -8.4 -8.4 0.01995 4.3 4.3 4.2 0.1 0.0 0.0 0.0
For sources and notes, see end of table. Pour les sources et les notes, se reporter à la fin du tableau.
Region,country or territory
Régions,pays ou territoires
Year
Année
Totalofficial net
(1)
Total secteurofficiel net
(1)
Total ODA Net / Total OA Net (2)APD totale nette / AP totale nette (2)
Total OOF Net (3)Flux AASP nets (3)
Totaldonors
Tousdonneurs
of which: / dont :
Totaldonors
Tousdonneurs
of which: / dont :
Millions of dollars / Millions de dollars
7.6.1 Official financial flows from bilateral and multilateral sources to developing economies by country and geographical region
7.6.1 Flux financiers publics bilatéraux et multilatéraux à destination des économies en développement par pays et régions géographiques
370
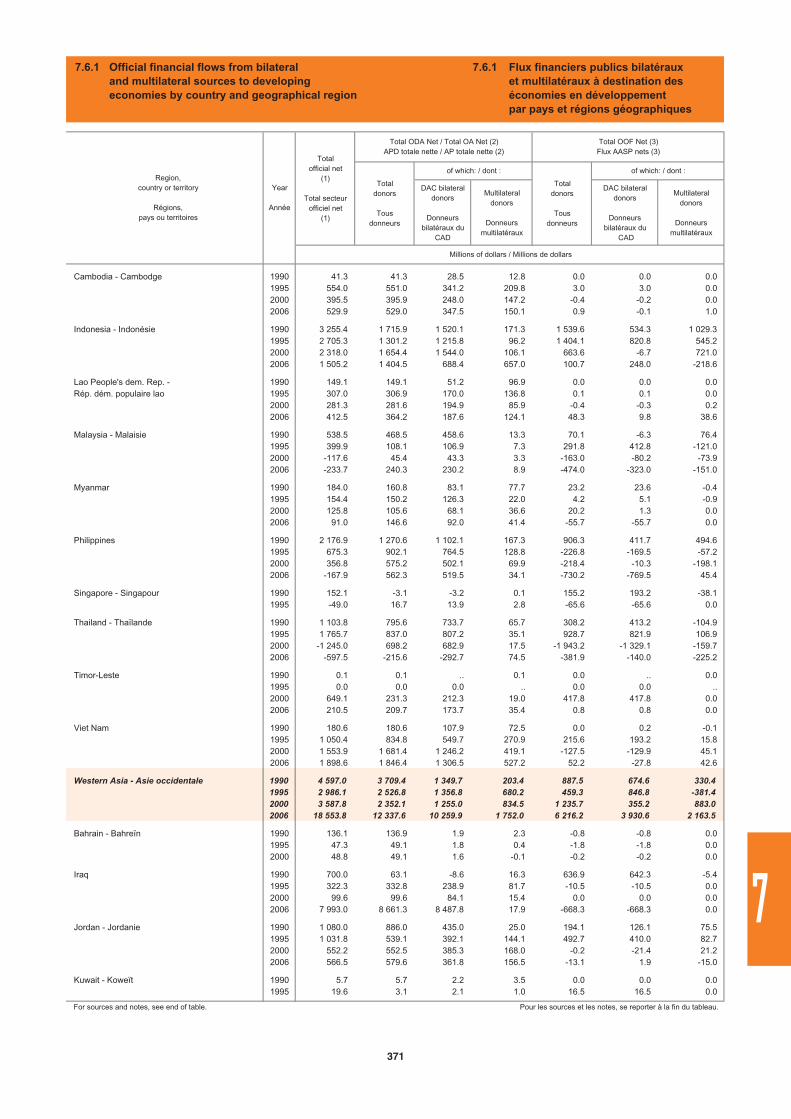
DAC bilateraldonors
Donneursbilatéraux du
CAD
Multilateraldonors
Donneursmultilatéraux
DAC bilateraldonors
Donneursbilatéraux du
CAD
Multilateraldonors
Donneursmultilatéraux
Cambodia - Cambodge 1990 41.3 41.3 28.5 12.8 0.0 0.0 0.01995 554.0 551.0 341.2 209.8 3.0 3.0 0.02000 395.5 395.9 248.0 147.2 -0.4 -0.2 0.02006 529.9 529.0 347.5 150.1 0.9 -0.1 1.0
Indonesia - Indonésie 1990 3 255.4 1 715.9 1 520.1 171.3 1 539.6 534.3 1 029.31995 2 705.3 1 301.2 1 215.8 96.2 1 404.1 820.8 545.22000 2 318.0 1 654.4 1 544.0 106.1 663.6 -6.7 721.02006 1 505.2 1 404.5 688.4 657.0 100.7 248.0 -218.6
Lao People's dem. Rep. - 1990 149.1 149.1 51.2 96.9 0.0 0.0 0.0Rép. dém. populaire lao 1995 307.0 306.9 170.0 136.8 0.1 0.1 0.0
2000 281.3 281.6 194.9 85.9 -0.4 -0.3 0.22006 412.5 364.2 187.6 124.1 48.3 9.8 38.6
Malaysia - Malaisie 1990 538.5 468.5 458.6 13.3 70.1 -6.3 76.41995 399.9 108.1 106.9 7.3 291.8 412.8 -121.02000 -117.6 45.4 43.3 3.3 -163.0 -80.2 -73.92006 -233.7 240.3 230.2 8.9 -474.0 -323.0 -151.0
Myanmar 1990 184.0 160.8 83.1 77.7 23.2 23.6 -0.41995 154.4 150.2 126.3 22.0 4.2 5.1 -0.92000 125.8 105.6 68.1 36.6 20.2 1.3 0.02006 91.0 146.6 92.0 41.4 -55.7 -55.7 0.0
Philippines 1990 2 176.9 1 270.6 1 102.1 167.3 906.3 411.7 494.61995 675.3 902.1 764.5 128.8 -226.8 -169.5 -57.22000 356.8 575.2 502.1 69.9 -218.4 -10.3 -198.12006 -167.9 562.3 519.5 34.1 -730.2 -769.5 45.4
Singapore - Singapour 1990 152.1 -3.1 -3.2 0.1 155.2 193.2 -38.11995 -49.0 16.7 13.9 2.8 -65.6 -65.6 0.0
Thailand - Thaïlande 1990 1 103.8 795.6 733.7 65.7 308.2 413.2 -104.91995 1 765.7 837.0 807.2 35.1 928.7 821.9 106.92000 -1 245.0 698.2 682.9 17.5 -1 943.2 -1 329.1 -159.72006 -597.5 -215.6 -292.7 74.5 -381.9 -140.0 -225.2
Timor-Leste 1990 0.1 0.1 .. 0.1 0.0 .. 0.01995 0.0 0.0 0.0 .. 0.0 0.0 ..2000 649.1 231.3 212.3 19.0 417.8 417.8 0.02006 210.5 209.7 173.7 35.4 0.8 0.8 0.0
Viet Nam 1990 180.6 180.6 107.9 72.5 0.0 0.2 -0.11995 1 050.4 834.8 549.7 270.9 215.6 193.2 15.82000 1 553.9 1 681.4 1 246.2 419.1 -127.5 -129.9 45.12006 1 898.6 1 846.4 1 306.5 527.2 52.2 -27.8 42.6
Western Asia - Asie occidentale 1990 4 597.0 3 709.4 1 349.7 203.4 887.5 674.6 330.41995 2 986.1 2 526.8 1 356.8 680.2 459.3 846.8 -381.42000 3 587.8 2 352.1 1 255.0 834.5 1 235.7 355.2 883.02006 18 553.8 12 337.6 10 259.9 1 752.0 6 216.2 3 930.6 2 163.5
Bahrain - Bahreïn 1990 136.1 136.9 1.9 2.3 -0.8 -0.8 0.01995 47.3 49.1 1.8 0.4 -1.8 -1.8 0.02000 48.8 49.1 1.6 -0.1 -0.2 -0.2 0.0
Iraq 1990 700.0 63.1 -8.6 16.3 636.9 642.3 -5.41995 322.3 332.8 238.9 81.7 -10.5 -10.5 0.02000 99.6 99.6 84.1 15.4 0.0 0.0 0.02006 7 993.0 8 661.3 8 487.8 17.9 -668.3 -668.3 0.0
Jordan - Jordanie 1990 1 080.0 886.0 435.0 25.0 194.1 126.1 75.51995 1 031.8 539.1 392.1 144.1 492.7 410.0 82.72000 552.2 552.5 385.3 168.0 -0.2 -21.4 21.22006 566.5 579.6 361.8 156.5 -13.1 1.9 -15.0
Kuwait - Koweït 1990 5.7 5.7 2.2 3.5 0.0 0.0 0.01995 19.6 3.1 2.1 1.0 16.5 16.5 0.0
For sources and notes, see end of table. Pour les sources et les notes, se reporter à la fin du tableau.
Region,country or territory
Régions,pays ou territoires
Year
Année
Totalofficial net
(1)
Total secteurofficiel net
(1)
Total ODA Net / Total OA Net (2)APD totale nette / AP totale nette (2)
Millions of dollars / Millions de dollars
Total OOF Net (3)Flux AASP nets (3)
Totaldonors
Tousdonneurs
of which: / dont :
Totaldonors
Tousdonneurs
of which: / dont :
7.6.1 Official financial flows from bilateral and multilateral sources to developing economies by country and geographical region
7.6.1 Flux financiers publics bilatéraux et multilatéraux à destination des économies en développement par pays et régions géographiques
371
7
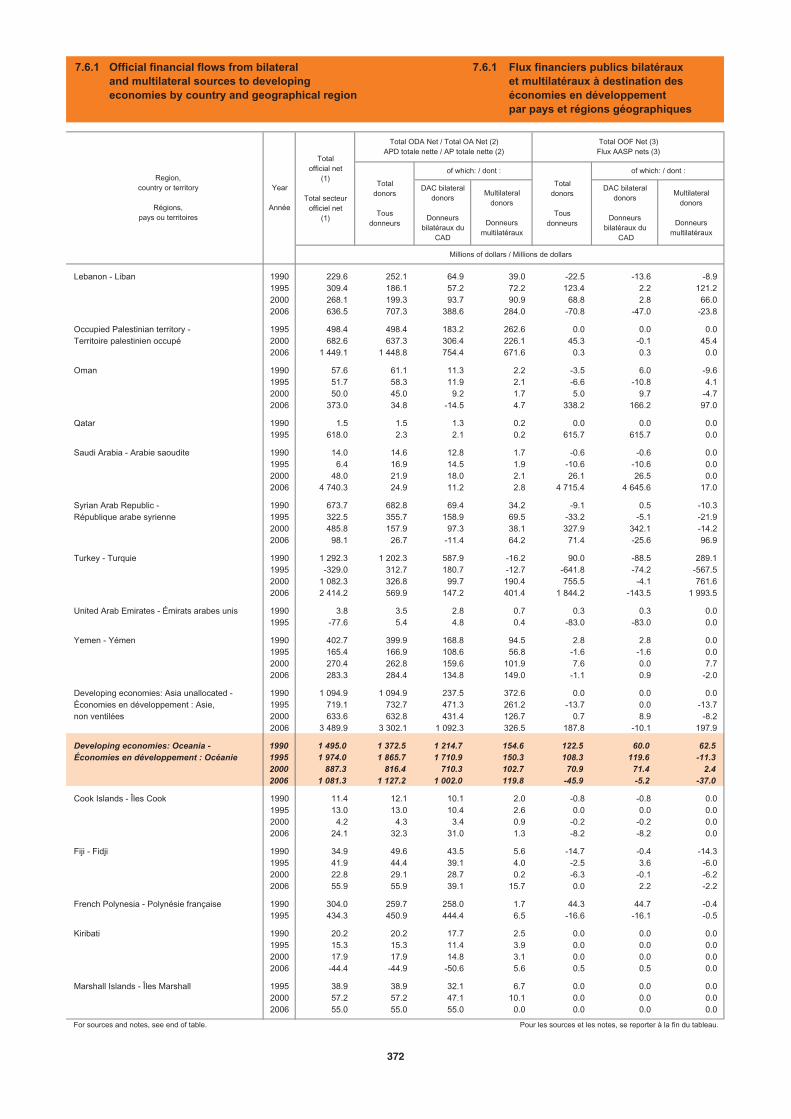
DAC bilateraldonors
Donneursbilatéraux du
CAD
Multilateraldonors
Donneursmultilatéraux
DAC bilateraldonors
Donneursbilatéraux du
CAD
Multilateraldonors
Donneursmultilatéraux
Lebanon - Liban 1990 229.6 252.1 64.9 39.0 -22.5 -13.6 -8.91995 309.4 186.1 57.2 72.2 123.4 2.2 121.22000 268.1 199.3 93.7 90.9 68.8 2.8 66.02006 636.5 707.3 388.6 284.0 -70.8 -47.0 -23.8
Occupied Palestinian territory - 1995 498.4 498.4 183.2 262.6 0.0 0.0 0.0Territoire palestinien occupé 2000 682.6 637.3 306.4 226.1 45.3 -0.1 45.4
2006 1 449.1 1 448.8 754.4 671.6 0.3 0.3 0.0
Oman 1990 57.6 61.1 11.3 2.2 -3.5 6.0 -9.61995 51.7 58.3 11.9 2.1 -6.6 -10.8 4.12000 50.0 45.0 9.2 1.7 5.0 9.7 -4.72006 373.0 34.8 -14.5 4.7 338.2 166.2 97.0
Qatar 1990 1.5 1.5 1.3 0.2 0.0 0.0 0.01995 618.0 2.3 2.1 0.2 615.7 615.7 0.0
Saudi Arabia - Arabie saoudite 1990 14.0 14.6 12.8 1.7 -0.6 -0.6 0.01995 6.4 16.9 14.5 1.9 -10.6 -10.6 0.02000 48.0 21.9 18.0 2.1 26.1 26.5 0.02006 4 740.3 24.9 11.2 2.8 4 715.4 4 645.6 17.0
Syrian Arab Republic - 1990 673.7 682.8 69.4 34.2 -9.1 0.5 -10.3République arabe syrienne 1995 322.5 355.7 158.9 69.5 -33.2 -5.1 -21.9
2000 485.8 157.9 97.3 38.1 327.9 342.1 -14.22006 98.1 26.7 -11.4 64.2 71.4 -25.6 96.9
Turkey - Turquie 1990 1 292.3 1 202.3 587.9 -16.2 90.0 -88.5 289.11995 -329.0 312.7 180.7 -12.7 -641.8 -74.2 -567.52000 1 082.3 326.8 99.7 190.4 755.5 -4.1 761.62006 2 414.2 569.9 147.2 401.4 1 844.2 -143.5 1 993.5
United Arab Emirates - Émirats arabes unis 1990 3.8 3.5 2.8 0.7 0.3 0.3 0.01995 -77.6 5.4 4.8 0.4 -83.0 -83.0 0.0
Yemen - Yémen 1990 402.7 399.9 168.8 94.5 2.8 2.8 0.01995 165.4 166.9 108.6 56.8 -1.6 -1.6 0.02000 270.4 262.8 159.6 101.9 7.6 0.0 7.72006 283.3 284.4 134.8 149.0 -1.1 0.9 -2.0
Developing economies: Asia unallocated - 1990 1 094.9 1 094.9 237.5 372.6 0.0 0.0 0.0Économies en développement : Asie, 1995 719.1 732.7 471.3 261.2 -13.7 0.0 -13.7non ventilées 2000 633.6 632.8 431.4 126.7 0.7 8.9 -8.2
2006 3 489.9 3 302.1 1 092.3 326.5 187.8 -10.1 197.9
Developing economies: Oceania - 1990 1 495.0 1 372.5 1 214.7 154.6 122.5 60.0 62.5Économies en développement : Océanie 1995 1 974.0 1 865.7 1 710.9 150.3 108.3 119.6 -11.3
2000 887.3 816.4 710.3 102.7 70.9 71.4 2.42006 1 081.3 1 127.2 1 002.0 119.8 -45.9 -5.2 -37.0
Cook Islands - Îles Cook 1990 11.4 12.1 10.1 2.0 -0.8 -0.8 0.01995 13.0 13.0 10.4 2.6 0.0 0.0 0.02000 4.2 4.3 3.4 0.9 -0.2 -0.2 0.02006 24.1 32.3 31.0 1.3 -8.2 -8.2 0.0
Fiji - Fidji 1990 34.9 49.6 43.5 5.6 -14.7 -0.4 -14.31995 41.9 44.4 39.1 4.0 -2.5 3.6 -6.02000 22.8 29.1 28.7 0.2 -6.3 -0.1 -6.22006 55.9 55.9 39.1 15.7 0.0 2.2 -2.2
French Polynesia - Polynésie française 1990 304.0 259.7 258.0 1.7 44.3 44.7 -0.41995 434.3 450.9 444.4 6.5 -16.6 -16.1 -0.5
Kiribati 1990 20.2 20.2 17.7 2.5 0.0 0.0 0.01995 15.3 15.3 11.4 3.9 0.0 0.0 0.02000 17.9 17.9 14.8 3.1 0.0 0.0 0.02006 -44.4 -44.9 -50.6 5.6 0.5 0.5 0.0
Marshall Islands - Îles Marshall 1995 38.9 38.9 32.1 6.7 0.0 0.0 0.02000 57.2 57.2 47.1 10.1 0.0 0.0 0.02006 55.0 55.0 55.0 0.0 0.0 0.0 0.0
For sources and notes, see end of table. Pour les sources et les notes, se reporter à la fin du tableau.
Region,country or territory
Régions,pays ou territoires
Year
Année
Totalofficial net
(1)
Total secteurofficiel net
(1)
Total ODA Net / Total OA Net (2)APD totale nette / AP totale nette (2)
Total OOF Net (3)Flux AASP nets (3)
Totaldonors
Tousdonneurs
of which: / dont :
Totaldonors
Tousdonneurs
of which: / dont :
Millions of dollars / Millions de dollars
7.6.1 Official financial flows from bilateral and multilateral sources to developing economies by country and geographical region
7.6.1 Flux financiers publics bilatéraux et multilatéraux à destination des économies en développement par pays et régions géographiques
372
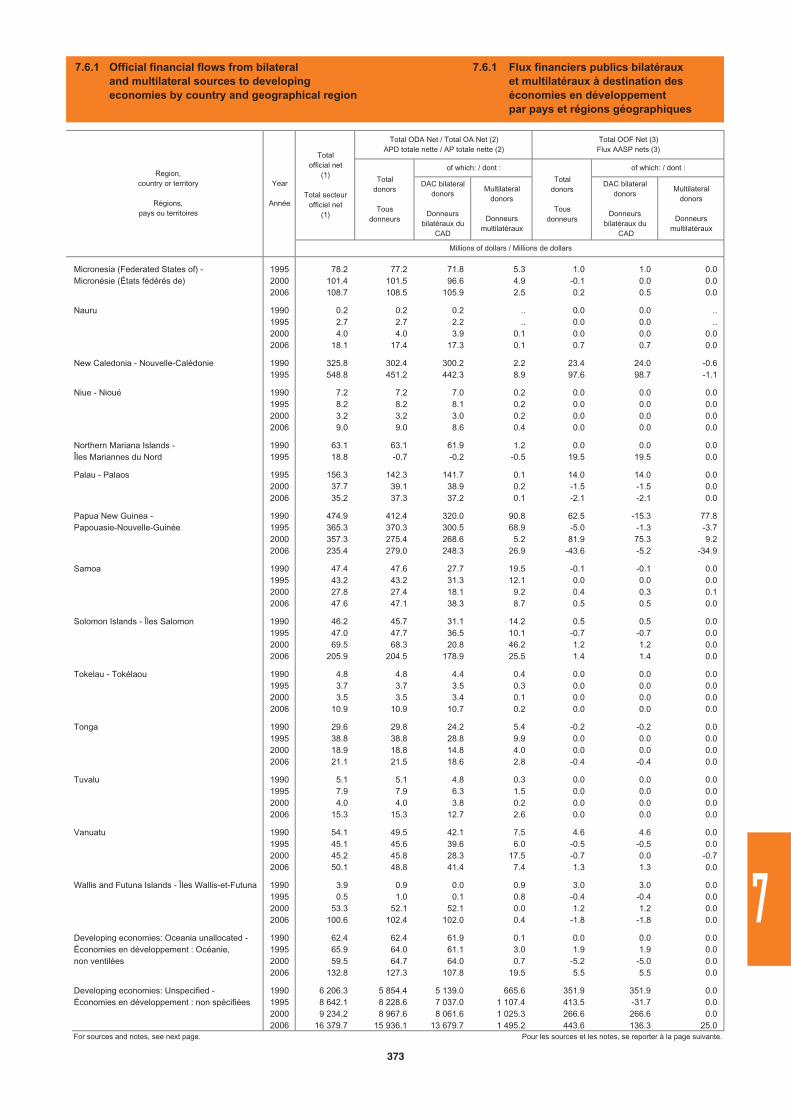
DAC bilateraldonors
Donneursbilatéraux du
CAD
Multilateraldonors
Donneursmultilatéraux
DAC bilateraldonors
Donneursbilatéraux du
CAD
Multilateraldonors
Donneursmultilatéraux
Micronesia (Federated States of) - 1995 78.2 77.2 71.8 5.3 1.0 1.0 0.0Micronésie (États fédérés de) 2000 101.4 101.5 96.6 4.9 -0.1 0.0 0.0
2006 108.7 108.5 105.9 2.5 0.2 0.5 0.0
Nauru 1990 0.2 0.2 0.2 .. 0.0 0.0 ..1995 2.7 2.7 2.2 .. 0.0 0.0 ..2000 4.0 4.0 3.9 0.1 0.0 0.0 0.02006 18.1 17.4 17.3 0.1 0.7 0.7 0.0
New Caledonia - Nouvelle-Calédonie 1990 325.8 302.4 300.2 2.2 23.4 24.0 -0.61995 548.8 451.2 442.3 8.9 97.6 98.7 -1.1
Niue - Nioué 1990 7.2 7.2 7.0 0.2 0.0 0.0 0.01995 8.2 8.2 8.1 0.2 0.0 0.0 0.02000 3.2 3.2 3.0 0.2 0.0 0.0 0.02006 9.0 9.0 8.6 0.4 0.0 0.0 0.0
Northern Mariana Islands - 1990 63.1 63.1 61.9 1.2 0.0 0.0 0.0Îles Mariannes du Nord 1995 18.8 -0.7 -0.2 -0.5 19.5 19.5 0.0
Palau - Palaos 1995 156.3 142.3 141.7 0.1 14.0 14.0 0.02000 37.7 39.1 38.9 0.2 -1.5 -1.5 0.02006 35.2 37.3 37.2 0.1 -2.1 -2.1 0.0
Papua New Guinea - 1990 474.9 412.4 320.0 90.8 62.5 -15.3 77.8Papouasie-Nouvelle-Guinée 1995 365.3 370.3 300.5 68.9 -5.0 -1.3 -3.7
2000 357.3 275.4 268.6 5.2 81.9 75.3 9.22006 235.4 279.0 248.3 26.9 -43.6 -5.2 -34.9
Samoa 1990 47.4 47.6 27.7 19.5 -0.1 -0.1 0.01995 43.2 43.2 31.3 12.1 0.0 0.0 0.02000 27.8 27.4 18.1 9.2 0.4 0.3 0.12006 47.6 47.1 38.3 8.7 0.5 0.5 0.0
Solomon Islands - Îles Salomon 1990 46.2 45.7 31.1 14.2 0.5 0.5 0.01995 47.0 47.7 36.5 10.1 -0.7 -0.7 0.02000 69.5 68.3 20.8 46.2 1.2 1.2 0.02006 205.9 204.5 178.9 25.5 1.4 1.4 0.0
Tokelau - Tokélaou 1990 4.8 4.8 4.4 0.4 0.0 0.0 0.01995 3.7 3.7 3.5 0.3 0.0 0.0 0.02000 3.5 3.5 3.4 0.1 0.0 0.0 0.02006 10.9 10.9 10.7 0.2 0.0 0.0 0.0
Tonga 1990 29.6 29.8 24.2 5.4 -0.2 -0.2 0.01995 38.8 38.8 28.8 9.9 0.0 0.0 0.02000 18.9 18.8 14.8 4.0 0.0 0.0 0.02006 21.1 21.5 18.6 2.8 -0.4 -0.4 0.0
Tuvalu 1990 5.1 5.1 4.8 0.3 0.0 0.0 0.01995 7.9 7.9 6.3 1.5 0.0 0.0 0.02000 4.0 4.0 3.8 0.2 0.0 0.0 0.02006 15.3 15.3 12.7 2.6 0.0 0.0 0.0
Vanuatu 1990 54.1 49.5 42.1 7.5 4.6 4.6 0.01995 45.1 45.6 39.6 6.0 -0.5 -0.5 0.02000 45.2 45.8 28.3 17.5 -0.7 0.0 -0.72006 50.1 48.8 41.4 7.4 1.3 1.3 0.0
Wallis and Futuna Islands - Îles Wallis-et-Futuna 1990 3.9 0.9 0.0 0.9 3.0 3.0 0.01995 0.5 1.0 0.1 0.8 -0.4 -0.4 0.02000 53.3 52.1 52.1 0.0 1.2 1.2 0.02006 100.6 102.4 102.0 0.4 -1.8 -1.8 0.0
Developing economies: Oceania unallocated - 1990 62.4 62.4 61.9 0.1 0.0 0.0 0.0Économies en développement : Océanie, 1995 65.9 64.0 61.1 3.0 1.9 1.9 0.0non ventilées 2000 59.5 64.7 64.0 0.7 -5.2 -5.0 0.0
2006 132.8 127.3 107.8 19.5 5.5 5.5 0.0
Developing economies: Unspecified - 1990 6 206.3 5 854.4 5 139.0 665.6 351.9 351.9 0.0Économies en développement : non spécifiées 1995 8 642.1 8 228.6 7 037.0 1 107.4 413.5 -31.7 0.0
2000 9 234.2 8 967.6 8 061.6 1 025.3 266.6 266.6 0.02006 16 379.7 15 936.1 13 679.7 1 495.2 443.6 136.3 25.0
For sources and notes, see next page. Pour les sources et les notes, se reporter à la page suivante.
Totaldonors
Tousdonneurs
of which: / dont :Region,
country or territory
Régions,pays ou territoires
Year
Année
Totalofficial net
(1)
Total secteurofficiel net
(1)
Total ODA Net / Total OA Net (2)APD totale nette / AP totale nette (2)
Millions of dollars / Millions de dollars
Total OOF Net (3)Flux AASP nets (3)
Totaldonors
Tousdonneurs
of which: / dont :
7.6.1 Official financial flows from bilateral and multilateral sources to developing economies by country and geographical region
7.6.1 Flux financiers publics bilatéraux et multilatéraux à destination des économies en développement par pays et régions géographiques
373
7
(1)
(2)
(3)
Sum of "Total ODA/OA Net; total donors" and "Total OOF Net; total donors". Itrepresents the total net disbursements by the official sector at large to the recipientcountry.
Total ODA Net; total donors:The Total Official Development Assistance (ODA) includes grants and loans to countriesand territories on Part I of the "DAC List of Aid Recipients" which are:undertaken by the official sector; with promotion of economic development and welfareas the main objective and at concessional financial terms (if a loan, have a grantelement of at least 25 per cent). Grants, loans and credits for military purposes are excluded.
"Total donors" is the sum of the three following donor types:- DAC Bilateral donors: The Development Assistance Committee (DAC) is theCommittee of the OECD which deals with development co-operation matters. It consistsof 23 Member countries.- Multilateral donors (i.e. African Development Bank, International Bank forReconstruction and Development, International Monetary Fund, United NationsDevelopment Programme).- Other donors: the non-DAC Bilateral donors (i.e Hungary, Lithuania, Turkey).
Total OOF Net; total donors:The Other Official Flows (OOF) are transactions by the official sector whose mainobjective is other than development motivated, or, if development motivated, whosegrant element is below the 25% threshold which would make them eligible to berecorded as ODA. The main classes of transactions included here are official exportcredits, official sector equity and portfolio investment, and debt reorganisationundertaken by the official sector at non-concessional terms (irrespective of the nature orthe identity of the original creditor).
Total donors is the sum of the three following donor types:- DAC Bilateral donors: The Development Assistance Committee (DAC) is theCommittee of the OECD which deals with development co-operation matters. It consistsof 23 Member countries.- Multilateral donors (i.e. African Development Bank, International Bank forReconstruction and Development, International Monetary Fund, United NationsDevelopment Programme).- Other donors: the non-DAC Bilateral donors (i.e Hungary, Lithuania, Turkey).
Sources:- International Developement Statistics, Organisation for Economic Co-operation and Development (OECD)
Notes:
(1)
(2)
(3)
Somme de "APD/AP totale nette ; tous donneurs" et de "Flux AASP nets ; tousdonneurs". Cet agrégat correspond aux versements nets effectués par le secteur publicdans son ensemble aux pays bénéficiaires considérés.
AP totale nette ; tous donneurs :Par aide publique (AP), on entend l'ensemble des apports de ressources qui sontfournis aux pays qui figurent à la Partie II de la "Liste des bénéficiaires de l'aide établiepar le CAD" et qui répondent aux critères suivants :a) être dispensés dans le but essentiel de favoriser le développement économique etl'amélioration du niveau de vie dans les pays en développement ; etb) revêtir un caractère de faveur et comporter un élément de libéralité d'au moins 25pour cent.
"Tous donneurs" est la somme des 3 types de donneurs suivants :- Donneurs bilatéraux du CAD : Le Comité d'aide au développement (CAD) est laprincipale instance chargée, à l'OCDE, des questions relatives à la coopération avec lespays en développement. Le CAD regroupe 23 pays membres.- Donneurs multilatéraux (i.e. Banque africaine de développpement, Banqueinternationale pour la reconstruction et le développement, Fonds monétaireinternational, Programme des Nations Unies pour le développement).- Autres donneurs : les donneurs bilatéraux non-membres du CAD (i.e. Hongrie,Lituanie, Turquie).
Flux AASP nets ; tous donneurs :Autres apports du secteur public (AASP) : il s'agit des opérations du secteur public dontle but essentiel est autre que le développement ou qui, tout en visant à favoriser ledéveloppement, sont assorties d'un élément de libéralité inférieur au seuil de 25 pourcent à partir duquel elles auraient pu être notifiées comme de l'APD. Les principalescatégories d'opérations couvertes dans les AASP sont les crédits publics à l'exportation,les prises de participation et les investissements de portefeuille du secteur public et leréaménagement de la dette effectué par le secteur public aux conditions du marché (etce, quelle que soit la nature ou l'identité du créancier initial).
Tous donneurs est la somme des 3 types de donneurs suivants :- Donneurs bilatéraux du CAD : Le Comité d'aide au développement (CAD) est laprincipale instance chargée, à l'OCDE, des questions relatives à la coopération avec lespays en développement. Le CAD regroupe 23 pays membres.- Donneurs multilatéraux (i.e. Banque africaine de développpement, Banqueinternationale pour la reconstruction et le développement, Fonds monétaireinternational, Programme des Nations Unies pour le développement).- Autres donneurs : les donneurs bilatéraux non-membres du CAD (i.e. Hongrie,Lituanie, Turquie).
Sources : - Statistiques sur le développement international, Organisation de coopération et de développement économique (OCDE)
Notes :
7.6.1 Official financial flows from bilateral and multilateral sources to developing economies by country and geographical region
7.6.1 Flux financiers publics bilatéraux et multilatéraux à destination des économies en développement par pays et régions géographiques
374
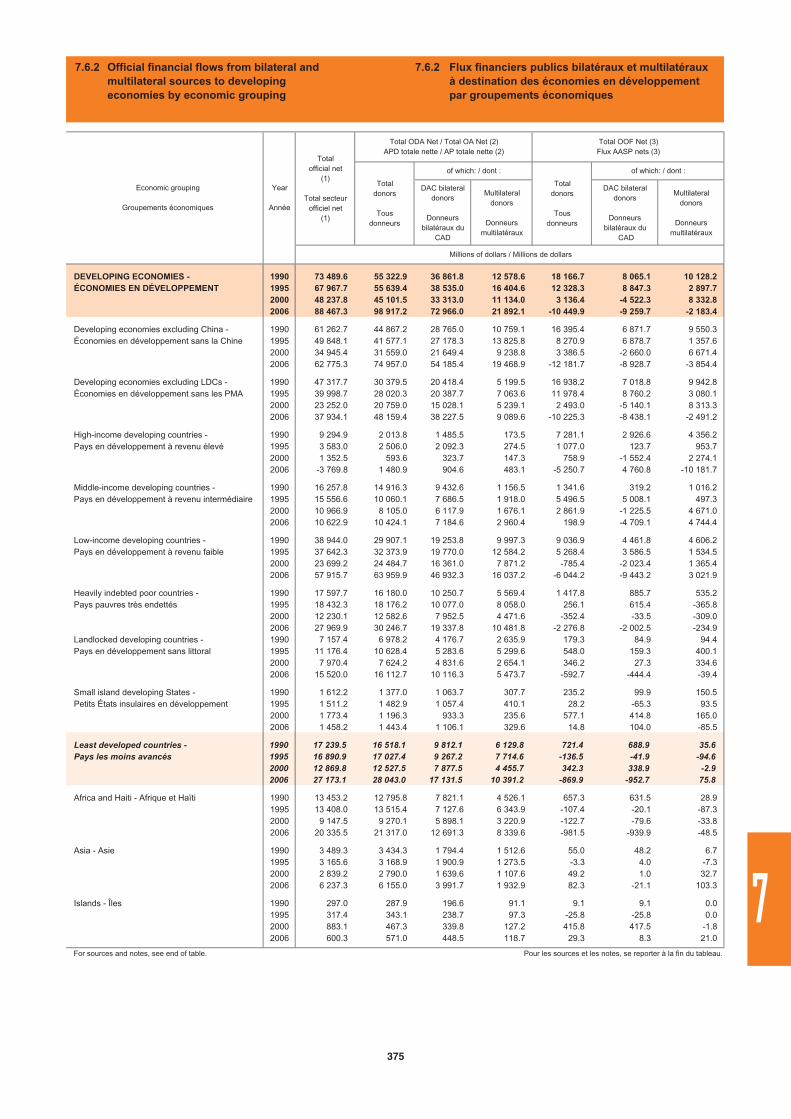
DAC bilateraldonors
Donneursbilatéraux du
CAD
Multilateraldonors
Donneursmultilatéraux
DAC bilateraldonors
Donneursbilatéraux du
CAD
Multilateraldonors
Donneursmultilatéraux
DEVELOPING ECONOMIES - 1990 73 489.6 55 322.9 36 861.8 12 578.6 18 166.7 8 065.1 10 128.2ÉCONOMIES EN DÉVELOPPEMENT 1995 67 967.7 55 639.4 38 535.0 16 404.6 12 328.3 8 847.3 2 897.7
2000 48 237.8 45 101.5 33 313.0 11 134.0 3 136.4 -4 522.3 8 332.82006 88 467.3 98 917.2 72 966.0 21 892.1 -10 449.9 -9 259.7 -2 183.4
Developing economies excluding China - 1990 61 262.7 44 867.2 28 765.0 10 759.1 16 395.4 6 871.7 9 550.3Économies en développement sans la Chine 1995 49 848.1 41 577.1 27 178.3 13 825.8 8 270.9 6 878.7 1 357.6
2000 34 945.4 31 559.0 21 649.4 9 238.8 3 386.5 -2 660.0 6 671.42006 62 775.3 74 957.0 54 185.4 19 468.9 -12 181.7 -8 928.7 -3 854.4
Developing economies excluding LDCs - 1990 47 317.7 30 379.5 20 418.4 5 199.5 16 938.2 7 018.8 9 942.8Économies en développement sans les PMA 1995 39 998.7 28 020.3 20 387.7 7 063.6 11 978.4 8 760.2 3 080.1
2000 23 252.0 20 759.0 15 028.1 5 239.1 2 493.0 -5 140.1 8 313.32006 37 934.1 48 159.4 38 227.5 9 089.6 -10 225.3 -8 438.1 -2 491.2
High-income developing countries - 1990 9 294.9 2 013.8 1 485.5 173.5 7 281.1 2 926.6 4 356.2Pays en développement à revenu élevé 1995 3 583.0 2 506.0 2 092.3 274.5 1 077.0 123.7 953.7
2000 1 352.5 593.6 323.7 147.3 758.9 -1 552.4 2 274.12006 -3 769.8 1 480.9 904.6 483.1 -5 250.7 4 760.8 -10 181.7
Middle-income developing countries - 1990 16 257.8 14 916.3 9 432.6 1 156.5 1 341.6 319.2 1 016.2Pays en développement à revenu intermédiaire 1995 15 556.6 10 060.1 7 686.5 1 918.0 5 496.5 5 008.1 497.3
2000 10 966.9 8 105.0 6 117.9 1 676.1 2 861.9 -1 225.5 4 671.02006 10 622.9 10 424.1 7 184.6 2 960.4 198.9 -4 709.1 4 744.4
Low-income developing countries - 1990 38 944.0 29 907.1 19 253.8 9 997.3 9 036.9 4 461.8 4 606.2Pays en développement à revenu faible 1995 37 642.3 32 373.9 19 770.0 12 584.2 5 268.4 3 586.5 1 534.5
2000 23 699.2 24 484.7 16 361.0 7 871.2 -785.4 -2 023.4 1 365.42006 57 915.7 63 959.9 46 932.3 16 037.2 -6 044.2 -9 443.2 3 021.9
Heavily indebted poor countries - 1990 17 597.7 16 180.0 10 250.7 5 569.4 1 417.8 885.7 535.2Pays pauvres très endettés 1995 18 432.3 18 176.2 10 077.0 8 058.0 256.1 615.4 -365.8
2000 12 230.1 12 582.6 7 952.5 4 471.6 -352.4 -33.5 -309.02006 27 969.9 30 246.7 19 337.8 10 481.8 -2 276.8 -2 002.5 -234.9
Landlocked developing countries - 1990 7 157.4 6 978.2 4 176.7 2 635.9 179.3 84.9 94.4Pays en développement sans littoral 1995 11 176.4 10 628.4 5 283.6 5 299.6 548.0 159.3 400.1
2000 7 970.4 7 624.2 4 831.6 2 654.1 346.2 27.3 334.62006 15 520.0 16 112.7 10 116.3 5 473.7 -592.7 -444.4 -39.4
Small island developing States - 1990 1 612.2 1 377.0 1 063.7 307.7 235.2 99.9 150.5Petits États insulaires en développement 1995 1 511.2 1 482.9 1 057.4 410.1 28.2 -65.3 93.5
2000 1 773.4 1 196.3 933.3 235.6 577.1 414.8 165.02006 1 458.2 1 443.4 1 106.1 329.6 14.8 104.0 -85.5
Least developed countries - 1990 17 239.5 16 518.1 9 812.1 6 129.8 721.4 688.9 35.6Pays les moins avancés 1995 16 890.9 17 027.4 9 267.2 7 714.6 -136.5 -41.9 -94.6
2000 12 869.8 12 527.5 7 877.5 4 455.7 342.3 338.9 -2.92006 27 173.1 28 043.0 17 131.5 10 391.2 -869.9 -952.7 75.8
Africa and Haiti - Afrique et Haïti 1990 13 453.2 12 795.8 7 821.1 4 526.1 657.3 631.5 28.91995 13 408.0 13 515.4 7 127.6 6 343.9 -107.4 -20.1 -87.32000 9 147.5 9 270.1 5 898.1 3 220.9 -122.7 -79.6 -33.82006 20 335.5 21 317.0 12 691.3 8 339.6 -981.5 -939.9 -48.5
Asia - Asie 1990 3 489.3 3 434.3 1 794.4 1 512.6 55.0 48.2 6.71995 3 165.6 3 168.9 1 900.9 1 273.5 -3.3 4.0 -7.32000 2 839.2 2 790.0 1 639.6 1 107.6 49.2 1.0 32.72006 6 237.3 6 155.0 3 991.7 1 932.9 82.3 -21.1 103.3
Islands - Îles 1990 297.0 287.9 196.6 91.1 9.1 9.1 0.01995 317.4 343.1 238.7 97.3 -25.8 -25.8 0.02000 883.1 467.3 339.8 127.2 415.8 417.5 -1.82006 600.3 571.0 448.5 118.7 29.3 8.3 21.0
For sources and notes, see end of table. Pour les sources et les notes, se reporter à la fin du tableau.
Totaldonors
Tousdonneurs
of which: / dont : of which: / dont :
Totalofficial net
(1)
Total secteurofficiel net
(1)
Totaldonors
Tousdonneurs
Total ODA Net / Total OA Net (2)APD totale nette / AP totale nette (2)
Total OOF Net (3)Flux AASP nets (3)
Millions of dollars / Millions de dollars
Year
Année
Economic grouping
Groupements économiques
7.6.2 Official financial flows from bilateral andmultilateral sources to developing economies by economic grouping
7.6.2 Flux financiers publics bilatéraux et multilatérauxà destination des économies en développement par groupements économiques
375
7
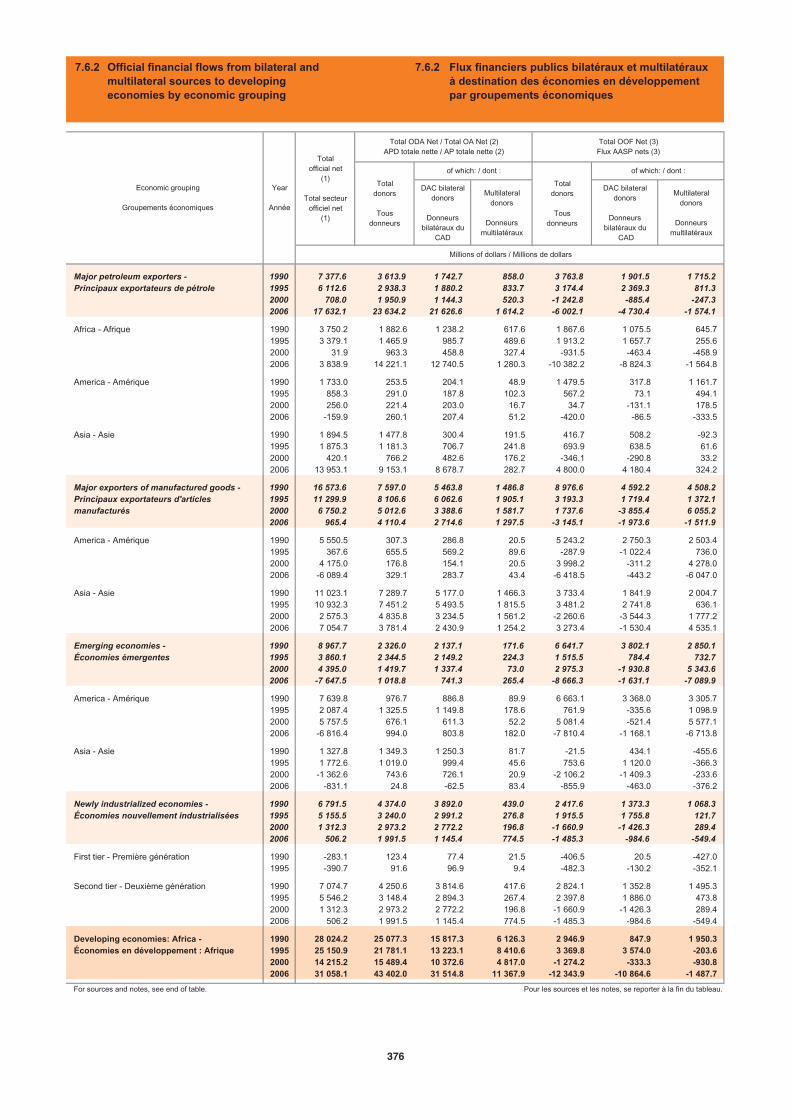
DAC bilateraldonors
Donneursbilatéraux du
CAD
Multilateraldonors
Donneursmultilatéraux
DAC bilateraldonors
Donneursbilatéraux du
CAD
Multilateraldonors
Donneursmultilatéraux
Major petroleum exporters - 1990 7 377.6 3 613.9 1 742.7 858.0 3 763.8 1 901.5 1 715.2Principaux exportateurs de pétrole 1995 6 112.6 2 938.3 1 880.2 833.7 3 174.4 2 369.3 811.3
2000 708.0 1 950.9 1 144.3 520.3 -1 242.8 -885.4 -247.32006 17 632.1 23 634.2 21 626.6 1 614.2 -6 002.1 -4 730.4 -1 574.1
Africa - Afrique 1990 3 750.2 1 882.6 1 238.2 617.6 1 867.6 1 075.5 645.71995 3 379.1 1 465.9 985.7 489.6 1 913.2 1 657.7 255.62000 31.9 963.3 458.8 327.4 -931.5 -463.4 -458.92006 3 838.9 14 221.1 12 740.5 1 280.3 -10 382.2 -8 824.3 -1 564.8
America - Amérique 1990 1 733.0 253.5 204.1 48.9 1 479.5 317.8 1 161.71995 858.3 291.0 187.8 102.3 567.2 73.1 494.12000 256.0 221.4 203.0 16.7 34.7 -131.1 178.52006 -159.9 260.1 207.4 51.2 -420.0 -86.5 -333.5
Asia - Asie 1990 1 894.5 1 477.8 300.4 191.5 416.7 508.2 -92.31995 1 875.3 1 181.3 706.7 241.8 693.9 638.5 61.62000 420.1 766.2 482.6 176.2 -346.1 -290.8 33.22006 13 953.1 9 153.1 8 678.7 282.7 4 800.0 4 180.4 324.2
Major exporters of manufactured goods - 1990 16 573.6 7 597.0 5 463.8 1 486.8 8 976.6 4 592.2 4 508.2Principaux exportateurs d'articles 1995 11 299.9 8 106.6 6 062.6 1 905.1 3 193.3 1 719.4 1 372.1manufacturés 2000 6 750.2 5 012.6 3 388.6 1 581.7 1 737.6 -3 855.4 6 055.2
2006 965.4 4 110.4 2 714.6 1 297.5 -3 145.1 -1 973.6 -1 511.9
America - Amérique 1990 5 550.5 307.3 286.8 20.5 5 243.2 2 750.3 2 503.41995 367.6 655.5 569.2 89.6 -287.9 -1 022.4 736.02000 4 175.0 176.8 154.1 20.5 3 998.2 -311.2 4 278.02006 -6 089.4 329.1 283.7 43.4 -6 418.5 -443.2 -6 047.0
Asia - Asie 1990 11 023.1 7 289.7 5 177.0 1 466.3 3 733.4 1 841.9 2 004.71995 10 932.3 7 451.2 5 493.5 1 815.5 3 481.2 2 741.8 636.12000 2 575.3 4 835.8 3 234.5 1 561.2 -2 260.6 -3 544.3 1 777.22006 7 054.7 3 781.4 2 430.9 1 254.2 3 273.4 -1 530.4 4 535.1
Emerging economies - 1990 8 967.7 2 326.0 2 137.1 171.6 6 641.7 3 802.1 2 850.1Économies émergentes 1995 3 860.1 2 344.5 2 149.2 224.3 1 515.5 784.4 732.7
2000 4 395.0 1 419.7 1 337.4 73.0 2 975.3 -1 930.8 5 343.62006 -7 647.5 1 018.8 741.3 265.4 -8 666.3 -1 631.1 -7 089.9
America - Amérique 1990 7 639.8 976.7 886.8 89.9 6 663.1 3 368.0 3 305.71995 2 087.4 1 325.5 1 149.8 178.6 761.9 -335.6 1 098.92000 5 757.5 676.1 611.3 52.2 5 081.4 -521.4 5 577.12006 -6 816.4 994.0 803.8 182.0 -7 810.4 -1 168.1 -6 713.8
Asia - Asie 1990 1 327.8 1 349.3 1 250.3 81.7 -21.5 434.1 -455.61995 1 772.6 1 019.0 999.4 45.6 753.6 1 120.0 -366.32000 -1 362.6 743.6 726.1 20.9 -2 106.2 -1 409.3 -233.62006 -831.1 24.8 -62.5 83.4 -855.9 -463.0 -376.2
Newly industrialized economies - 1990 6 791.5 4 374.0 3 892.0 439.0 2 417.6 1 373.3 1 068.3Économies nouvellement industrialisées 1995 5 155.5 3 240.0 2 991.2 276.8 1 915.5 1 755.8 121.7
2000 1 312.3 2 973.2 2 772.2 196.8 -1 660.9 -1 426.3 289.42006 506.2 1 991.5 1 145.4 774.5 -1 485.3 -984.6 -549.4
First tier - Première génération 1990 -283.1 123.4 77.4 21.5 -406.5 20.5 -427.01995 -390.7 91.6 96.9 9.4 -482.3 -130.2 -352.1
Second tier - Deuxième génération 1990 7 074.7 4 250.6 3 814.6 417.6 2 824.1 1 352.8 1 495.31995 5 546.2 3 148.4 2 894.3 267.4 2 397.8 1 886.0 473.82000 1 312.3 2 973.2 2 772.2 196.8 -1 660.9 -1 426.3 289.42006 506.2 1 991.5 1 145.4 774.5 -1 485.3 -984.6 -549.4
Developing economies: Africa - 1990 28 024.2 25 077.3 15 817.3 6 126.3 2 946.9 847.9 1 950.3Économies en développement : Afrique 1995 25 150.9 21 781.1 13 223.1 8 410.6 3 369.8 3 574.0 -203.6
2000 14 215.2 15 489.4 10 372.6 4 817.0 -1 274.2 -333.3 -930.82006 31 058.1 43 402.0 31 514.8 11 367.9 -12 343.9 -10 864.6 -1 487.7
For sources and notes, see end of table. Pour les sources et les notes, se reporter à la fin du tableau.
Economic grouping
Groupements économiques
Year
Année
Totalofficial net
(1)
Total secteurofficiel net
(1)
Total ODA Net / Total OA Net (2)APD totale nette / AP totale nette (2)
Millions of dollars / Millions de dollars
Total OOF Net (3)Flux AASP nets (3)
Totaldonors
Tousdonneurs
of which: / dont :
Totaldonors
Tousdonneurs
of which: / dont :
7.6.2 Official financial flows from bilateral andmultilateral sources to developing economies by economic grouping
7.6.2 Flux financiers publics bilatéraux et multilatérauxà destination des économies en développement par groupements économiques
376
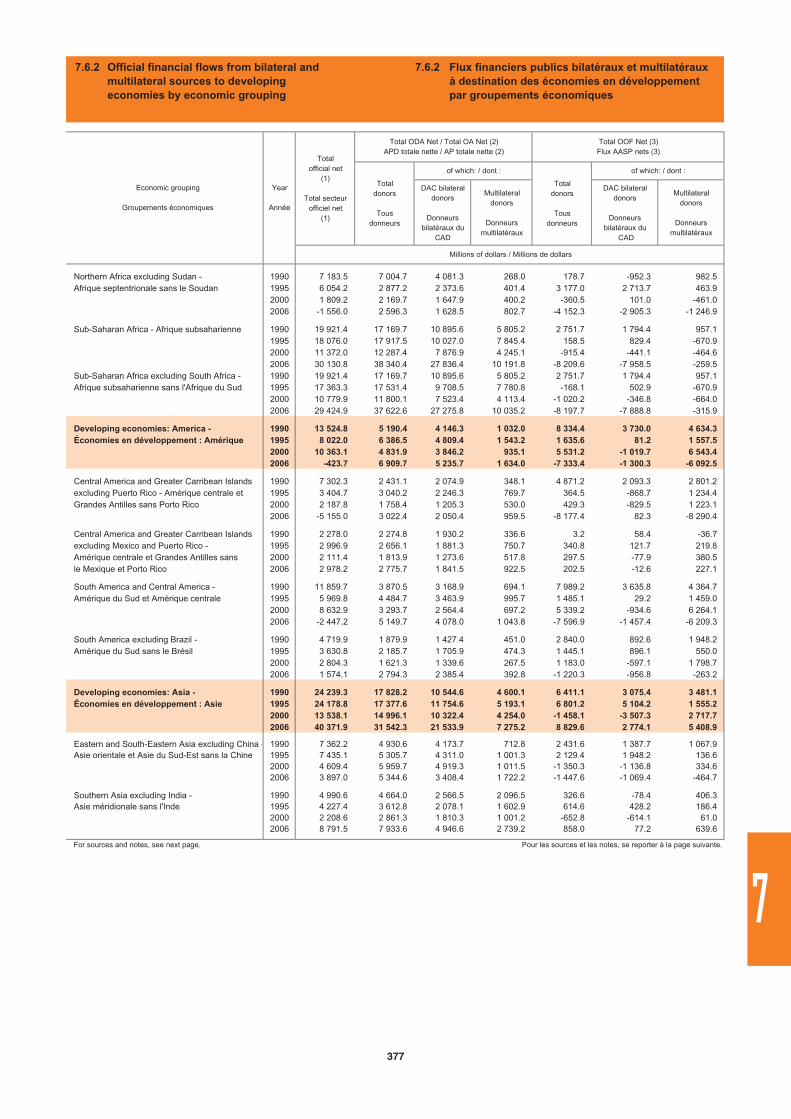
DAC bilateraldonors
Donneursbilatéraux du
CAD
Multilateraldonors
Donneursmultilatéraux
DAC bilateraldonors
Donneursbilatéraux du
CAD
Multilateraldonors
Donneursmultilatéraux
Northern Africa excluding Sudan - 1990 7 183.5 7 004.7 4 081.3 268.0 178.7 -952.3 982.5Afrique septentrionale sans le Soudan 1995 6 054.2 2 877.2 2 373.6 401.4 3 177.0 2 713.7 463.9
2000 1 809.2 2 169.7 1 647.9 400.2 -360.5 101.0 -461.02006 -1 556.0 2 596.3 1 628.5 802.7 -4 152.3 -2 905.3 -1 246.9
Sub-Saharan Africa - Afrique subsaharienne 1990 19 921.4 17 169.7 10 895.6 5 805.2 2 751.7 1 794.4 957.11995 18 076.0 17 917.5 10 027.0 7 845.4 158.5 829.4 -670.92000 11 372.0 12 287.4 7 876.9 4 245.1 -915.4 -441.1 -464.62006 30 130.8 38 340.4 27 836.4 10 191.8 -8 209.6 -7 958.5 -259.5
Sub-Saharan Africa excluding South Africa - 1990 19 921.4 17 169.7 10 895.6 5 805.2 2 751.7 1 794.4 957.1Afrique subsaharienne sans l'Afrique du Sud 1995 17 363.3 17 531.4 9 708.5 7 780.8 -168.1 502.9 -670.9
2000 10 779.9 11 800.1 7 523.4 4 113.4 -1 020.2 -346.8 -664.02006 29 424.9 37 622.6 27 275.8 10 035.2 -8 197.7 -7 888.8 -315.9
Developing economies: America - 1990 13 524.8 5 190.4 4 146.3 1 032.0 8 334.4 3 730.0 4 634.3Économies en développement : Amérique 1995 8 022.0 6 386.5 4 809.4 1 543.2 1 635.6 81.2 1 557.5
2000 10 363.1 4 831.9 3 846.2 935.1 5 531.2 -1 019.7 6 543.42006 -423.7 6 909.7 5 235.7 1 634.0 -7 333.4 -1 300.3 -6 092.5
Central America and Greater Carribean Islands 1990 7 302.3 2 431.1 2 074.9 348.1 4 871.2 2 093.3 2 801.2excluding Puerto Rico - Amérique centrale et 1995 3 404.7 3 040.2 2 246.3 769.7 364.5 -868.7 1 234.4Grandes Antilles sans Porto Rico 2000 2 187.8 1 758.4 1 205.3 530.0 429.3 -829.5 1 223.1
2006 -5 155.0 3 022.4 2 050.4 959.5 -8 177.4 82.3 -8 290.4
Central America and Greater Carribean Islands 1990 2 278.0 2 274.8 1 930.2 336.6 3.2 58.4 -36.7excluding Mexico and Puerto Rico - 1995 2 996.9 2 656.1 1 881.3 750.7 340.8 121.7 219.8Amérique centrale et Grandes Antilles sans 2000 2 111.4 1 813.9 1 273.6 517.8 297.5 -77.9 380.5le Mexique et Porto Rico 2006 2 978.2 2 775.7 1 841.5 922.5 202.5 -12.6 227.1
South America and Central America - 1990 11 859.7 3 870.5 3 168.9 694.1 7 989.2 3 635.8 4 364.7Amérique du Sud et Amérique centrale 1995 5 969.8 4 484.7 3 463.9 995.7 1 485.1 29.2 1 459.0
2000 8 632.9 3 293.7 2 564.4 697.2 5 339.2 -934.6 6 264.12006 -2 447.2 5 149.7 4 078.0 1 043.8 -7 596.9 -1 457.4 -6 209.3
South America excluding Brazil - 1990 4 719.9 1 879.9 1 427.4 451.0 2 840.0 892.6 1 948.2Amérique du Sud sans le Brésil 1995 3 630.8 2 185.7 1 705.9 474.3 1 445.1 896.1 550.0
2000 2 804.3 1 621.3 1 339.6 267.5 1 183.0 -597.1 1 798.72006 1 574.1 2 794.3 2 385.4 392.8 -1 220.3 -956.8 -263.2
Developing economies: Asia - 1990 24 239.3 17 828.2 10 544.6 4 600.1 6 411.1 3 075.4 3 481.1Économies en développement : Asie 1995 24 178.8 17 377.6 11 754.6 5 193.1 6 801.2 5 104.2 1 555.2
2000 13 538.1 14 996.1 10 322.4 4 254.0 -1 458.1 -3 507.3 2 717.72006 40 371.9 31 542.3 21 533.9 7 275.2 8 829.6 2 774.1 5 408.9
Eastern and South-Eastern Asia excluding China - 1990 7 362.2 4 930.6 4 173.7 712.8 2 431.6 1 387.7 1 067.9Asie orientale et Asie du Sud-Est sans la Chine 1995 7 435.1 5 305.7 4 311.0 1 001.3 2 129.4 1 948.2 136.6
2000 4 609.4 5 959.7 4 919.3 1 011.5 -1 350.3 -1 136.8 334.62006 3 897.0 5 344.6 3 408.4 1 722.2 -1 447.6 -1 069.4 -464.7
Southern Asia excluding India - 1990 4 990.6 4 664.0 2 566.5 2 096.5 326.6 -78.4 406.3Asie méridionale sans l'Inde 1995 4 227.4 3 612.8 2 078.1 1 602.9 614.6 428.2 186.4
2000 2 208.6 2 861.3 1 810.3 1 001.2 -652.8 -614.1 61.02006 8 791.5 7 933.6 4 946.6 2 739.2 858.0 77.2 639.6
For sources and notes, see next page. Pour les sources et les notes, se reporter à la page suivante.
Economic grouping
Groupements économiques
Year
Année
Totalofficial net
(1)
Total secteurofficiel net
(1)
Total ODA Net / Total OA Net (2)APD totale nette / AP totale nette (2)
Total OOF Net (3)Flux AASP nets (3)
Totaldonors
Tousdonneurs
of which: / dont :
Totaldonors
Tousdonneurs
of which: / dont :
Millions of dollars / Millions de dollars
7.6.2 Official financial flows from bilateral andmultilateral sources to developing economies by economic grouping
7.6.2 Flux financiers publics bilatéraux et multilatérauxà destination des économies en développement par groupements économiques
377
7
-
(1)
(2)
(3)
The groupings presented in this table do not include Unallocated/Unspecified recipientcountries.
Sum of "Total ODA/OA Net; total donors" and "Total OOF Net; total donors". Itrepresents the total net disbursements by the official sector at large to the recipientcountry.
Total ODA Net; total donors:The Total Official Development Assistance (ODA) includes grants and loans to countriesand territories on Part I of the "DAC List of Aid Recipients" which are:undertaken by the official sector; with promotion of economic development and welfareas the main objective and at concessional financial terms (if a loan, have a grantelement of at least 25 per cent). Grants, loans and credits for military purposes are excluded.
"Total Donors" is the sum of the three following donor types:- DAC Bilateral Donors: The Development Assistance Committee (DAC) is theCommittee of the OECD which deals with development co-operation matters. It consistsof 23 Member countries.- Multilateral Donors (i.e. African Development Bank, International Bank forReconstruction and Development, International Monetary Fund, United NationsDevelopment Programme).- Other Donors: the Non-DAC Bilateral Donors (i.e Hungary, Lithuania, Turkey).
Total OOF Net; total donors:The Other Official Flows (OOF) are transactions by the official sector whose mainobjective is other than development motivated, or, if development motivated, whosegrant element is below the 25% threshold which would make them eligible to berecorded as ODA. The main classes of transactions included here are official exportcredits, official sector equity and ortfolio investment, and debt reorganisation undertakenby the official sector at non-concessional terms (irrespective of the nature or the identityof the original creditor).
Total Donors is the sum of the three following donor types:- DAC Bilateral Donors: The Development Assistance Committee (DAC) is theCommittee of the OECD which deals with development co-operation matters. It consistsof 23 Member countries.- Multilateral Donors (i.e. African Development Bank, International Bank forReconstruction and Development, International Monetary Fund, United NationsDevelopment Programme).- Other Donors: the Non-DAC Bilateral Donors (i.e Hungary, Lithuania, Turkey).
Sources:- International Developement Statistics, Organisation for Economic Co-operation and Development (OECD)
Notes:
-
(1)
(2)
(3)
Les groupements présentés dans ce tableau n'incluent pas les pays bénéficiaires non-ventilé/non-spécifié.
Somme de "APD/AP totale nette ; tous donneurs" et de "Flux AASP nets ; tousdonneurs". Cet agrégat correspond aux versements nets effectués par le secteur publicdans son ensemble aux pays bénéficiaires considérés.
AP totale nette ; tous donneurs :Par aide publique (AP), on entend l'ensemble des apports de ressources qui sontfournis aux pays qui figurent à la Partie II de la "Liste des bénéficiaires de l'aide établiepar le CAD" et qui répondent aux critères suivants :a) être dispensés dans le but essentiel de favoriser le développement économique etl'amélioration du niveau de vie dans les pays en développement ; etb) revêtir un caractère de faveur et comporter un élément de libéralité d'au moins 25pour cent.
"Tous Donneurs" est la somme des 3 types de donneurs suivants :- Donneurs Bilatéraux du CAD : Le Comité d'aide au développement (CAD) est laprincipale instance chargée, à l'OCDE, des questions relatives à la coopération avec lespays en développement. Le CAD regroupe 23 pays membres.- Donneurs Multilatéraux (i.e. Banque africaine de développpement, Banqueinternationale pour la reconstruction et le développement, Fonds monétaireinternational, Programme des Nations Unies pour le développement).- Autres Donneurs : les Donneurs Bilatéraux non-membres du CAD (i.e. Hongrie,Lituanie, Turquie).
Flux AASP nets ; tous donneurs :Autres apports du secteur public (AASP) : il s'agit des opérations du secteur public dontle but essentiel est autre que le développement ou qui, tout en visant à favoriser ledéveloppement, sont assorties d'un élément de libéralité inférieur au seuil de 25 pourcent à partir duquel elles auraient pu être notifiées comme de l'APD. Les principalescatégories d'opérations couvertes dans les AASP sont les crédits publics à l'exportation,les prises de participation et les investissements de portefeuille du secteur public et leréaménagement de la dette effectué par le secteur public aux conditions du marché (etce, quelle que soit la nature ou l'identité du créancier initial).
Tous Donneurs est la somme des 3 types de donneurs suivants :- Donneurs Bilatéraux du CAD : Le Comité d'aide au développement (CAD) est laprincipale instance chargée, à l'OCDE, des questions relatives à la coopération avec lespays en développement. Le CAD regroupe 23 pays membres.- Donneurs Multilatéraux (i.e. Banque africaine de développpement, Banqueinternationale pour la reconstruction et le développement, Fonds monétaireinternational, Programme des Nations Unies pour le développement).- Autres Donneurs : les Donneurs Bilatéraux non-membres du CAD (i.e. Hongrie,Lituanie, Turquie).
Sources : - Statistiques sur le développement international, Organisation de coopération et de développement économique (OCDE)
Notes :
7.6.2 Official financial flows from bilateral and multilateral sources to developing economies by economic grouping
7.6.2 Flux financiers publics bilatéraux et multilatéraux à destination des économies en développement par groupements économiques
378

TotalDAC
CAD
OPEC
OPEP
Other
Autres
1990
Debt outstanding (5) 905 658 505 210 308 920 209 326 18 380 81 214 196 290 400 448 97 364 196 392 56 129Disbursments (6) 79 625 45 284 19 141 16 306 572 2 263 26 143 34 340 3 862 13 507 16 053Debt service (7) 95 232 39 018 17 759 13 423 1 123 3 213 21 259 56 214 8 389 29 113 10 264 Principal repayments 54 704 21 827 10 562 7 544 871 2 147 11 265 32 876 4 367 15 145 6 069 Interest payments 40 529 17 191 7 197 5 879 253 1 066 9 994 23 337 4 022 13 969 4 195Net transfers on debt (8) -15 608 6 266 1 382 2 883 -551 -950 4 884 -21 874 -4 527 -15 607 5 789
1995
Dette totale (5) 1 125 823 684 064 414 238 307 450 13 897 92 891 269 826 441 759 213 046 128 888 208 335Décaissements (6) 120 668 60 484 32 124 26 182 535 5 407 28 360 60 184 22 001 21 916 53 384Service de la dette (7) 134 428 66 484 34 696 26 209 944 7 543 31 788 67 944 24 241 22 619 37 275 Remboursement du principal 81 578 41 088 22 140 15 501 735 5 905 18 948 40 490 10 039 15 272 26 211 Paiement des intérêts 52 850 25 396 12 555 10 708 209 1 638 12 840 27 454 14 202 7 347 11 064Transfers nets (8) -13 760 -6 000 -2 572 -27 -409 -2 136 -3 428 -7 760 -2 240 -703 16 110
2000
Debt outstanding (5) 1 141 257 660 317 353 538 253 639 14 580 85 318 306 779 480 941 294 233 121 872 446 380Disbursments (6) 124 020 48 626 17 251 14 748 457 2 046 31 375 75 393 49 098 17 881 84 510Debt service (7) 165 333 67 080 32 057 24 779 777 6 501 35 024 98 253 53 720 29 101 122 995 Principal repayments 107 633 43 175 22 273 16 819 593 4 861 20 903 64 457 31 577 20 953 94 358 Interest payments 57 700 23 905 9 784 7 960 184 1 640 14 121 33 795 22 143 8 149 28 637Net transfers on debt (8) -41 313 -18 454 -14 806 -10 031 -320 -4 454 -3 648 -22 859 -4 623 -11 221 -38 485
2002
Dette totale (5) 1 183 991 667 185 338 664 246 121 14 365 78 178 328 521 516 808 319 272 141 662 415 688Décaissements (6) 103 743 42 326 12 745 11 517 381 847 29 581 61 416 35 947 20 422 85 082Service de la dette (7) 152 362 65 515 27 627 20 825 728 6 074 37 888 86 847 41 377 33 519 118 959 Remboursement du principal 105 096 45 642 20 226 14 996 575 4 656 25 416 59 454 23 549 26 007 97 972 Paiement des intérêts 47 266 19 872 7 401 5 829 153 1 418 12 472 27 393 17 828 7 512 20 988Transfers nets (8) -48 619 -23 188 -14 882 -9 308 -346 -5 227 -8 307 -25 431 -5 430 -13 097 -33 878
2003
Debt outstanding (5) 1 240 807 699 176 357 198 286 390 13 664 57 144 341 977 541 633 345 052 145 617 416 920Disbursments (6) 113 363 44 671 10 728 9 500 373 856 33 943 68 692 39 670 24 831 94 979Debt service (7) 169 148 76 308 30 167 25 184 720 4 263 46 142 92 840 46 080 35 499 120 359 Principal repayments 120 683 56 728 21 880 18 329 571 2 981 34 848 63 955 26 201 28 660 99 211 Interest payments 48 465 19 580 8 286 6 855 149 1 282 11 294 28 885 19 879 6 838 21 149Net transfers on debt (8) -55 785 -31 637 -19 438 -15 684 -347 -3 407 -12 199 -24 148 -6 410 -10 668 -25 380
2004
Dette totale (5) 1 268 393 704 921 355 875 287 713 13 334 54 827 349 046 563 474 361 760 153 703 425 176Décaissements (6) 125 446 41 540 12 030 8 882 746 2 402 29 510 83 906 50 599 28 609 114 448Service de la dette (7) 165 863 69 661 29 919 25 174 1 140 3 605 39 742 96 202 55 080 32 640 128 964 Remboursement du principal 115 938 51 693 21 923 18 694 1 000 2 229 29 769 64 245 32 572 24 945 109 553 Paiement des intérêts 49 925 17 969 7 996 6 480 140 1 376 9 973 31 956 22 507 7 695 19 411Transfers nets (8) -40 416 -28 121 -17 889 -16 292 -394 -1 203 -10 232 -12 295 -4 481 -4 031 -14 517
2005
Debt outstanding (5) 1 166 240 636 887 294 449 241 154 13 435 39 860 342 438 529 353 331 092 156 222 444 415Disbursments (6) 125 149 40 542 10 563 7 951 665 1 946 29 979 84 607 48 212 32 353 146 401Debt service (7) 164 857 67 134 34 178 30 218 822 3 139 32 956 97 723 52 555 36 022 130 920 Principal repayments 113 002 47 046 23 593 20 717 694 2 183 23 452 65 956 29 240 28 970 112 812 Interest payments 51 855 20 088 10 585 9 501 128 956 9 503 31 767 23 315 7 053 18 108Net transfers on debt (8) -39 708 -26 592 -23 616 -22 267 -156 -1 192 -2 976 -13 116 -4 344 -3 669 15 481
2006
Dette totale (5) 1 095 928 581 261 267 734 209 482 13 794 44 458 313 527 514 667 321 371 155 982 529 199Décaissements (6) 119 997 53 300 11 944 6 778 1 045 4 121 41 356 66 697 40 680 21 468 193 431Service de la dette (7) 209 513 80 045 36 439 32 982 765 2 692 43 607 129 468 87 342 32 101 142 709 Remboursement du principal 158 509 63 937 30 641 28 248 630 1 763 33 297 94 572 61 458 24 457 116 810 Paiement des intérêts 51 004 16 108 5 798 4 735 134 929 10 310 34 896 25 884 7 644 25 900Transfers nets (8) -89 516 -26 745 -24 494 -26 204 281 1 430 -2 251 -62 771 -46 662 -10 633 50 722For sources and notes, see end of table 7.7.G. Pour les sources et les notes, se reporter à la fin du tableau 7.7.G.
Millions of dollars / Millions de dollars
Official creditors (2) / Créanciers publics (2)
Total
Bilateral / Bilatéraux
Multilateral
MultilatérauxTotal
Commercialbanks
Banquescommerciales
Bonds
Obligations
Private creditors (3) / Créanciers (3)
Private non-guaranteed
debt(4)
Dette privéenon
garantie(4)
Public and publicly guaranteed debt (1)Dette publique et garantie par l'état (1)
Totalcreditors
Totalcréanciers
7.7.A External long-term debt by lending sourceDeveloping economies
7.7.A Dette extérieure à long terme par catégories de prêtÉconomies en développement
379
7
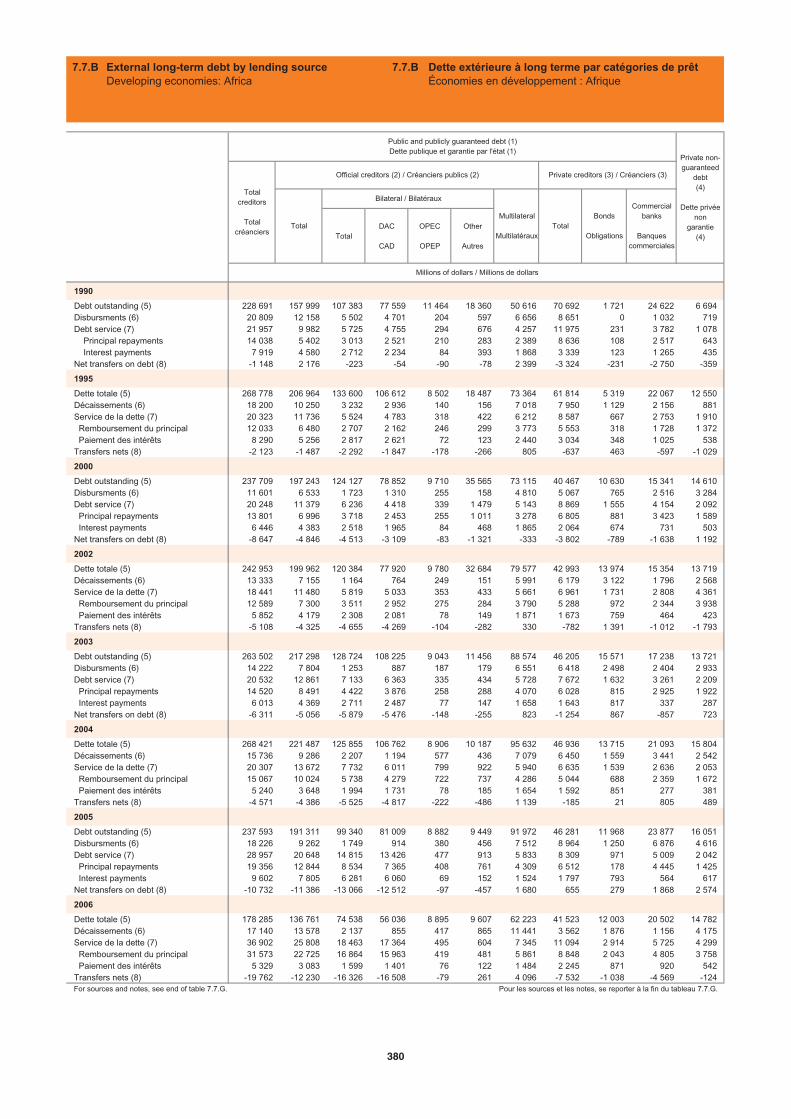
TotalDAC
CAD
OPEC
OPEP
Other
Autres
1990
Debt outstanding (5) 228 691 157 999 107 383 77 559 11 464 18 360 50 616 70 692 1 721 24 622 6 694Disbursments (6) 20 809 12 158 5 502 4 701 204 597 6 656 8 651 0 1 032 719Debt service (7) 21 957 9 982 5 725 4 755 294 676 4 257 11 975 231 3 782 1 078 Principal repayments 14 038 5 402 3 013 2 521 210 283 2 389 8 636 108 2 517 643 Interest payments 7 919 4 580 2 712 2 234 84 393 1 868 3 339 123 1 265 435Net transfers on debt (8) -1 148 2 176 -223 -54 -90 -78 2 399 -3 324 -231 -2 750 -359
1995
Dette totale (5) 268 778 206 964 133 600 106 612 8 502 18 487 73 364 61 814 5 319 22 067 12 550Décaissements (6) 18 200 10 250 3 232 2 936 140 156 7 018 7 950 1 129 2 156 881Service de la dette (7) 20 323 11 736 5 524 4 783 318 422 6 212 8 587 667 2 753 1 910 Remboursement du principal 12 033 6 480 2 707 2 162 246 299 3 773 5 553 318 1 728 1 372 Paiement des intérêts 8 290 5 256 2 817 2 621 72 123 2 440 3 034 348 1 025 538Transfers nets (8) -2 123 -1 487 -2 292 -1 847 -178 -266 805 -637 463 -597 -1 029
2000
Debt outstanding (5) 237 709 197 243 124 127 78 852 9 710 35 565 73 115 40 467 10 630 15 341 14 610Disbursments (6) 11 601 6 533 1 723 1 310 255 158 4 810 5 067 765 2 516 3 284Debt service (7) 20 248 11 379 6 236 4 418 339 1 479 5 143 8 869 1 555 4 154 2 092 Principal repayments 13 801 6 996 3 718 2 453 255 1 011 3 278 6 805 881 3 423 1 589 Interest payments 6 446 4 383 2 518 1 965 84 468 1 865 2 064 674 731 503Net transfers on debt (8) -8 647 -4 846 -4 513 -3 109 -83 -1 321 -333 -3 802 -789 -1 638 1 192
2002
Dette totale (5) 242 953 199 962 120 384 77 920 9 780 32 684 79 577 42 993 13 974 15 354 13 719Décaissements (6) 13 333 7 155 1 164 764 249 151 5 991 6 179 3 122 1 796 2 568Service de la dette (7) 18 441 11 480 5 819 5 033 353 433 5 661 6 961 1 731 2 808 4 361 Remboursement du principal 12 589 7 300 3 511 2 952 275 284 3 790 5 288 972 2 344 3 938 Paiement des intérêts 5 852 4 179 2 308 2 081 78 149 1 871 1 673 759 464 423Transfers nets (8) -5 108 -4 325 -4 655 -4 269 -104 -282 330 -782 1 391 -1 012 -1 793
2003
Debt outstanding (5) 263 502 217 298 128 724 108 225 9 043 11 456 88 574 46 205 15 571 17 238 13 721Disbursments (6) 14 222 7 804 1 253 887 187 179 6 551 6 418 2 498 2 404 2 933Debt service (7) 20 532 12 861 7 133 6 363 335 434 5 728 7 672 1 632 3 261 2 209 Principal repayments 14 520 8 491 4 422 3 876 258 288 4 070 6 028 815 2 925 1 922 Interest payments 6 013 4 369 2 711 2 487 77 147 1 658 1 643 817 337 287Net transfers on debt (8) -6 311 -5 056 -5 879 -5 476 -148 -255 823 -1 254 867 -857 723
2004
Dette totale (5) 268 421 221 487 125 855 106 762 8 906 10 187 95 632 46 936 13 715 21 093 15 804Décaissements (6) 15 736 9 286 2 207 1 194 577 436 7 079 6 450 1 559 3 441 2 542Service de la dette (7) 20 307 13 672 7 732 6 011 799 922 5 940 6 635 1 539 2 636 2 053 Remboursement du principal 15 067 10 024 5 738 4 279 722 737 4 286 5 044 688 2 359 1 672 Paiement des intérêts 5 240 3 648 1 994 1 731 78 185 1 654 1 592 851 277 381Transfers nets (8) -4 571 -4 386 -5 525 -4 817 -222 -486 1 139 -185 21 805 489
2005
Debt outstanding (5) 237 593 191 311 99 340 81 009 8 882 9 449 91 972 46 281 11 968 23 877 16 051Disbursments (6) 18 226 9 262 1 749 914 380 456 7 512 8 964 1 250 6 876 4 616Debt service (7) 28 957 20 648 14 815 13 426 477 913 5 833 8 309 971 5 009 2 042 Principal repayments 19 356 12 844 8 534 7 365 408 761 4 309 6 512 178 4 445 1 425 Interest payments 9 602 7 805 6 281 6 060 69 152 1 524 1 797 793 564 617Net transfers on debt (8) -10 732 -11 386 -13 066 -12 512 -97 -457 1 680 655 279 1 868 2 574
2006
Dette totale (5) 178 285 136 761 74 538 56 036 8 895 9 607 62 223 41 523 12 003 20 502 14 782Décaissements (6) 17 140 13 578 2 137 855 417 865 11 441 3 562 1 876 1 156 4 175Service de la dette (7) 36 902 25 808 18 463 17 364 495 604 7 345 11 094 2 914 5 725 4 299 Remboursement du principal 31 573 22 725 16 864 15 963 419 481 5 861 8 848 2 043 4 805 3 758 Paiement des intérêts 5 329 3 083 1 599 1 401 76 122 1 484 2 245 871 920 542Transfers nets (8) -19 762 -12 230 -16 326 -16 508 -79 261 4 096 -7 532 -1 038 -4 569 -124For sources and notes, see end of table 7.7.G. Pour les sources et les notes, se reporter à la fin du tableau 7.7.G.
Bilateral / Bilatéraux
Multilateral
Multilatéraux
Millions of dollars / Millions de dollars
Total
Commercialbanks
Banquescommerciales
Bonds
Obligations
Private creditors (3) / Créanciers (3)
Private non-guaranteed
debt(4)
Dette privéenon
garantie(4)
Public and publicly guaranteed debt (1)Dette publique et garantie par l'état (1)
Totalcreditors
Totalcréanciers
Official creditors (2) / Créanciers publics (2)
Total
7.7.B External long-term debt by lending sourceDeveloping economies: Africa
7.7.B Dette extérieure à long terme par catégories de prêtÉconomies en développement : Afrique
380
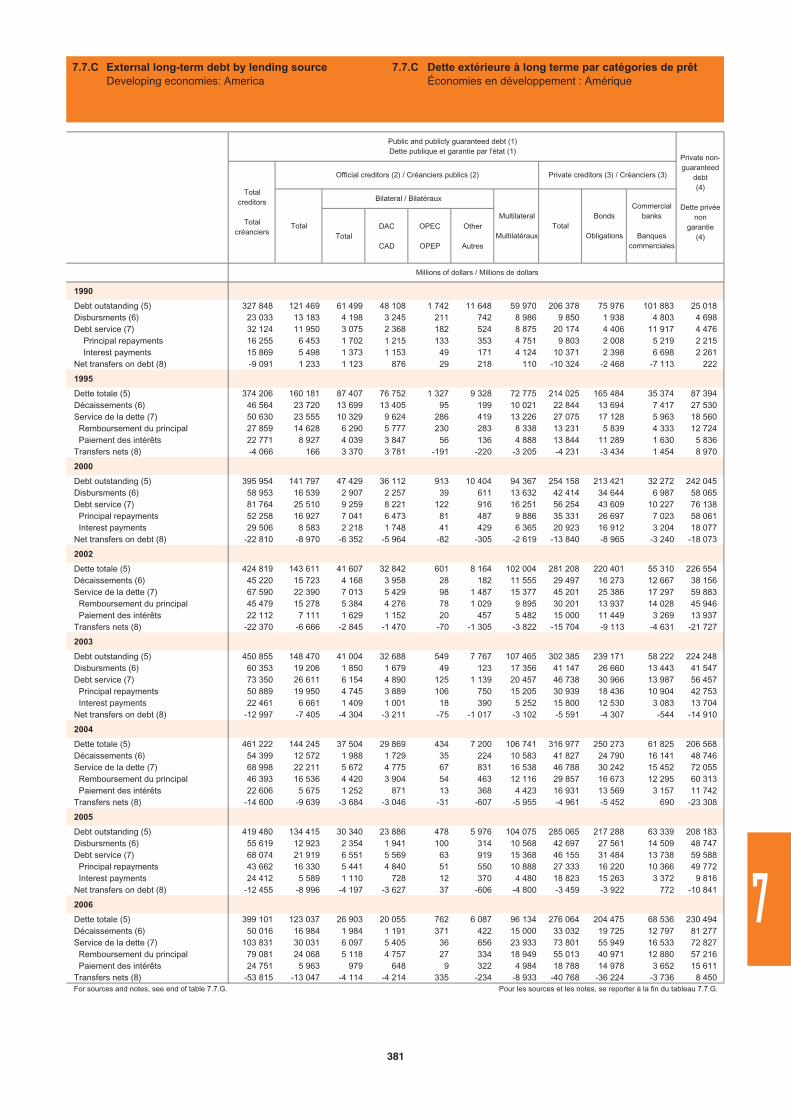
TotalDAC
CAD
OPEC
OPEP
Other
Autres
1990
Debt outstanding (5) 327 848 121 469 61 499 48 108 1 742 11 648 59 970 206 378 75 976 101 883 25 018Disbursments (6) 23 033 13 183 4 198 3 245 211 742 8 986 9 850 1 938 4 803 4 698Debt service (7) 32 124 11 950 3 075 2 368 182 524 8 875 20 174 4 406 11 917 4 476 Principal repayments 16 255 6 453 1 702 1 215 133 353 4 751 9 803 2 008 5 219 2 215 Interest payments 15 869 5 498 1 373 1 153 49 171 4 124 10 371 2 398 6 698 2 261Net transfers on debt (8) -9 091 1 233 1 123 876 29 218 110 -10 324 -2 468 -7 113 222
1995
Dette totale (5) 374 206 160 181 87 407 76 752 1 327 9 328 72 775 214 025 165 484 35 374 87 394Décaissements (6) 46 564 23 720 13 699 13 405 95 199 10 021 22 844 13 694 7 417 27 530Service de la dette (7) 50 630 23 555 10 329 9 624 286 419 13 226 27 075 17 128 5 963 18 560 Remboursement du principal 27 859 14 628 6 290 5 777 230 283 8 338 13 231 5 839 4 333 12 724 Paiement des intérêts 22 771 8 927 4 039 3 847 56 136 4 888 13 844 11 289 1 630 5 836Transfers nets (8) -4 066 166 3 370 3 781 -191 -220 -3 205 -4 231 -3 434 1 454 8 970
2000
Debt outstanding (5) 395 954 141 797 47 429 36 112 913 10 404 94 367 254 158 213 421 32 272 242 045Disbursments (6) 58 953 16 539 2 907 2 257 39 611 13 632 42 414 34 644 6 987 58 065Debt service (7) 81 764 25 510 9 259 8 221 122 916 16 251 56 254 43 609 10 227 76 138 Principal repayments 52 258 16 927 7 041 6 473 81 487 9 886 35 331 26 697 7 023 58 061 Interest payments 29 506 8 583 2 218 1 748 41 429 6 365 20 923 16 912 3 204 18 077Net transfers on debt (8) -22 810 -8 970 -6 352 -5 964 -82 -305 -2 619 -13 840 -8 965 -3 240 -18 073
2002
Dette totale (5) 424 819 143 611 41 607 32 842 601 8 164 102 004 281 208 220 401 55 310 226 554Décaissements (6) 45 220 15 723 4 168 3 958 28 182 11 555 29 497 16 273 12 667 38 156Service de la dette (7) 67 590 22 390 7 013 5 429 98 1 487 15 377 45 201 25 386 17 297 59 883 Remboursement du principal 45 479 15 278 5 384 4 276 78 1 029 9 895 30 201 13 937 14 028 45 946 Paiement des intérêts 22 112 7 111 1 629 1 152 20 457 5 482 15 000 11 449 3 269 13 937Transfers nets (8) -22 370 -6 666 -2 845 -1 470 -70 -1 305 -3 822 -15 704 -9 113 -4 631 -21 727
2003
Debt outstanding (5) 450 855 148 470 41 004 32 688 549 7 767 107 465 302 385 239 171 58 222 224 248Disbursments (6) 60 353 19 206 1 850 1 679 49 123 17 356 41 147 26 660 13 443 41 547Debt service (7) 73 350 26 611 6 154 4 890 125 1 139 20 457 46 738 30 966 13 987 56 457 Principal repayments 50 889 19 950 4 745 3 889 106 750 15 205 30 939 18 436 10 904 42 753 Interest payments 22 461 6 661 1 409 1 001 18 390 5 252 15 800 12 530 3 083 13 704Net transfers on debt (8) -12 997 -7 405 -4 304 -3 211 -75 -1 017 -3 102 -5 591 -4 307 -544 -14 910
2004
Dette totale (5) 461 222 144 245 37 504 29 869 434 7 200 106 741 316 977 250 273 61 825 206 568Décaissements (6) 54 399 12 572 1 988 1 729 35 224 10 583 41 827 24 790 16 141 48 746Service de la dette (7) 68 998 22 211 5 672 4 775 67 831 16 538 46 788 30 242 15 452 72 055 Remboursement du principal 46 393 16 536 4 420 3 904 54 463 12 116 29 857 16 673 12 295 60 313 Paiement des intérêts 22 606 5 675 1 252 871 13 368 4 423 16 931 13 569 3 157 11 742Transfers nets (8) -14 600 -9 639 -3 684 -3 046 -31 -607 -5 955 -4 961 -5 452 690 -23 308
2005
Debt outstanding (5) 419 480 134 415 30 340 23 886 478 5 976 104 075 285 065 217 288 63 339 208 183Disbursments (6) 55 619 12 923 2 354 1 941 100 314 10 568 42 697 27 561 14 509 48 747Debt service (7) 68 074 21 919 6 551 5 569 63 919 15 368 46 155 31 484 13 738 59 588 Principal repayments 43 662 16 330 5 441 4 840 51 550 10 888 27 333 16 220 10 366 49 772 Interest payments 24 412 5 589 1 110 728 12 370 4 480 18 823 15 263 3 372 9 816Net transfers on debt (8) -12 455 -8 996 -4 197 -3 627 37 -606 -4 800 -3 459 -3 922 772 -10 841
2006
Dette totale (5) 399 101 123 037 26 903 20 055 762 6 087 96 134 276 064 204 475 68 536 230 494Décaissements (6) 50 016 16 984 1 984 1 191 371 422 15 000 33 032 19 725 12 797 81 277Service de la dette (7) 103 831 30 031 6 097 5 405 36 656 23 933 73 801 55 949 16 533 72 827 Remboursement du principal 79 081 24 068 5 118 4 757 27 334 18 949 55 013 40 971 12 880 57 216 Paiement des intérêts 24 751 5 963 979 648 9 322 4 984 18 788 14 978 3 652 15 611Transfers nets (8) -53 815 -13 047 -4 114 -4 214 335 -234 -8 933 -40 768 -36 224 -3 736 8 450For sources and notes, see end of table 7.7.G. Pour les sources et les notes, se reporter à la fin du tableau 7.7.G.
Totalcreditors
Totalcréanciers
Official creditors (2) / Créanciers publics (2)
Total
Bilateral / Bilatéraux
Multilateral
Multilatéraux
Millions of dollars / Millions de dollars
Total
Commercialbanks
Banquescommerciales
Bonds
Obligations
Private creditors (3) / Créanciers (3)
Private non-guaranteed
debt(4)
Dette privéenon
garantie(4)
Public and publicly guaranteed debt (1)Dette publique et garantie par l'état (1)
7.7.C External long-term debt by lending sourceDeveloping economies: America
7.7.C Dette extérieure à long terme par catégories de prêtÉconomies en développement : Amérique
381
7
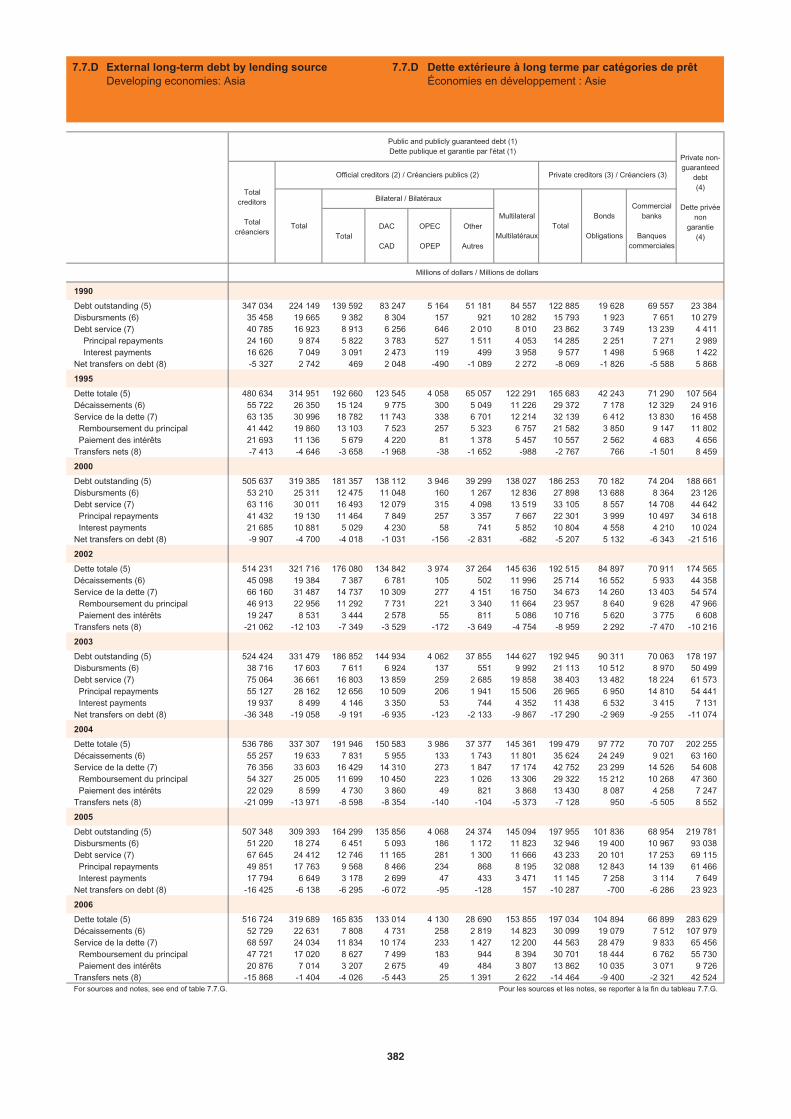
TotalDAC
CAD
OPEC
OPEP
Other
Autres
1990
Debt outstanding (5) 347 034 224 149 139 592 83 247 5 164 51 181 84 557 122 885 19 628 69 557 23 384Disbursments (6) 35 458 19 665 9 382 8 304 157 921 10 282 15 793 1 923 7 651 10 279Debt service (7) 40 785 16 923 8 913 6 256 646 2 010 8 010 23 862 3 749 13 239 4 411 Principal repayments 24 160 9 874 5 822 3 783 527 1 511 4 053 14 285 2 251 7 271 2 989 Interest payments 16 626 7 049 3 091 2 473 119 499 3 958 9 577 1 498 5 968 1 422Net transfers on debt (8) -5 327 2 742 469 2 048 -490 -1 089 2 272 -8 069 -1 826 -5 588 5 868
1995
Dette totale (5) 480 634 314 951 192 660 123 545 4 058 65 057 122 291 165 683 42 243 71 290 107 564Décaissements (6) 55 722 26 350 15 124 9 775 300 5 049 11 226 29 372 7 178 12 329 24 916Service de la dette (7) 63 135 30 996 18 782 11 743 338 6 701 12 214 32 139 6 412 13 830 16 458 Remboursement du principal 41 442 19 860 13 103 7 523 257 5 323 6 757 21 582 3 850 9 147 11 802 Paiement des intérêts 21 693 11 136 5 679 4 220 81 1 378 5 457 10 557 2 562 4 683 4 656Transfers nets (8) -7 413 -4 646 -3 658 -1 968 -38 -1 652 -988 -2 767 766 -1 501 8 459
2000
Debt outstanding (5) 505 637 319 385 181 357 138 112 3 946 39 299 138 027 186 253 70 182 74 204 188 661Disbursments (6) 53 210 25 311 12 475 11 048 160 1 267 12 836 27 898 13 688 8 364 23 126Debt service (7) 63 116 30 011 16 493 12 079 315 4 098 13 519 33 105 8 557 14 708 44 642 Principal repayments 41 432 19 130 11 464 7 849 257 3 357 7 667 22 301 3 999 10 497 34 618 Interest payments 21 685 10 881 5 029 4 230 58 741 5 852 10 804 4 558 4 210 10 024Net transfers on debt (8) -9 907 -4 700 -4 018 -1 031 -156 -2 831 -682 -5 207 5 132 -6 343 -21 516
2002
Dette totale (5) 514 231 321 716 176 080 134 842 3 974 37 264 145 636 192 515 84 897 70 911 174 565Décaissements (6) 45 098 19 384 7 387 6 781 105 502 11 996 25 714 16 552 5 933 44 358Service de la dette (7) 66 160 31 487 14 737 10 309 277 4 151 16 750 34 673 14 260 13 403 54 574 Remboursement du principal 46 913 22 956 11 292 7 731 221 3 340 11 664 23 957 8 640 9 628 47 966 Paiement des intérêts 19 247 8 531 3 444 2 578 55 811 5 086 10 716 5 620 3 775 6 608Transfers nets (8) -21 062 -12 103 -7 349 -3 529 -172 -3 649 -4 754 -8 959 2 292 -7 470 -10 216
2003
Debt outstanding (5) 524 424 331 479 186 852 144 934 4 062 37 855 144 627 192 945 90 311 70 063 178 197Disbursments (6) 38 716 17 603 7 611 6 924 137 551 9 992 21 113 10 512 8 970 50 499Debt service (7) 75 064 36 661 16 803 13 859 259 2 685 19 858 38 403 13 482 18 224 61 573 Principal repayments 55 127 28 162 12 656 10 509 206 1 941 15 506 26 965 6 950 14 810 54 441 Interest payments 19 937 8 499 4 146 3 350 53 744 4 352 11 438 6 532 3 415 7 131Net transfers on debt (8) -36 348 -19 058 -9 191 -6 935 -123 -2 133 -9 867 -17 290 -2 969 -9 255 -11 074
2004
Dette totale (5) 536 786 337 307 191 946 150 583 3 986 37 377 145 361 199 479 97 772 70 707 202 255Décaissements (6) 55 257 19 633 7 831 5 955 133 1 743 11 801 35 624 24 249 9 021 63 160Service de la dette (7) 76 356 33 603 16 429 14 310 273 1 847 17 174 42 752 23 299 14 526 54 608 Remboursement du principal 54 327 25 005 11 699 10 450 223 1 026 13 306 29 322 15 212 10 268 47 360 Paiement des intérêts 22 029 8 599 4 730 3 860 49 821 3 868 13 430 8 087 4 258 7 247Transfers nets (8) -21 099 -13 971 -8 598 -8 354 -140 -104 -5 373 -7 128 950 -5 505 8 552
2005
Debt outstanding (5) 507 348 309 393 164 299 135 856 4 068 24 374 145 094 197 955 101 836 68 954 219 781Disbursments (6) 51 220 18 274 6 451 5 093 186 1 172 11 823 32 946 19 400 10 967 93 038Debt service (7) 67 645 24 412 12 746 11 165 281 1 300 11 666 43 233 20 101 17 253 69 115 Principal repayments 49 851 17 763 9 568 8 466 234 868 8 195 32 088 12 843 14 139 61 466 Interest payments 17 794 6 649 3 178 2 699 47 433 3 471 11 145 7 258 3 114 7 649Net transfers on debt (8) -16 425 -6 138 -6 295 -6 072 -95 -128 157 -10 287 -700 -6 286 23 923
2006
Dette totale (5) 516 724 319 689 165 835 133 014 4 130 28 690 153 855 197 034 104 894 66 899 283 629Décaissements (6) 52 729 22 631 7 808 4 731 258 2 819 14 823 30 099 19 079 7 512 107 979Service de la dette (7) 68 597 24 034 11 834 10 174 233 1 427 12 200 44 563 28 479 9 833 65 456 Remboursement du principal 47 721 17 020 8 627 7 499 183 944 8 394 30 701 18 444 6 762 55 730 Paiement des intérêts 20 876 7 014 3 207 2 675 49 484 3 807 13 862 10 035 3 071 9 726Transfers nets (8) -15 868 -1 404 -4 026 -5 443 25 1 391 2 622 -14 464 -9 400 -2 321 42 524For sources and notes, see end of table 7.7.G. Pour les sources et les notes, se reporter à la fin du tableau 7.7.G.
Bonds
Obligations
Private creditors (3) / Créanciers (3)
Private non-guaranteed
debt(4)
Dette privéenon
garantie(4)
Public and publicly guaranteed debt (1)Dette publique et garantie par l'état (1)
Totalcreditors
Totalcréanciers
Millions of dollars / Millions de dollars
Official creditors (2) / Créanciers publics (2)
Total
Bilateral / Bilatéraux
Multilateral
MultilatérauxTotal
Commercialbanks
Banquescommerciales
7.7.D External long-term debt by lending sourceDeveloping economies: Asia
7.7.D Dette extérieure à long terme par catégories de prêtÉconomies en développement : Asie
382
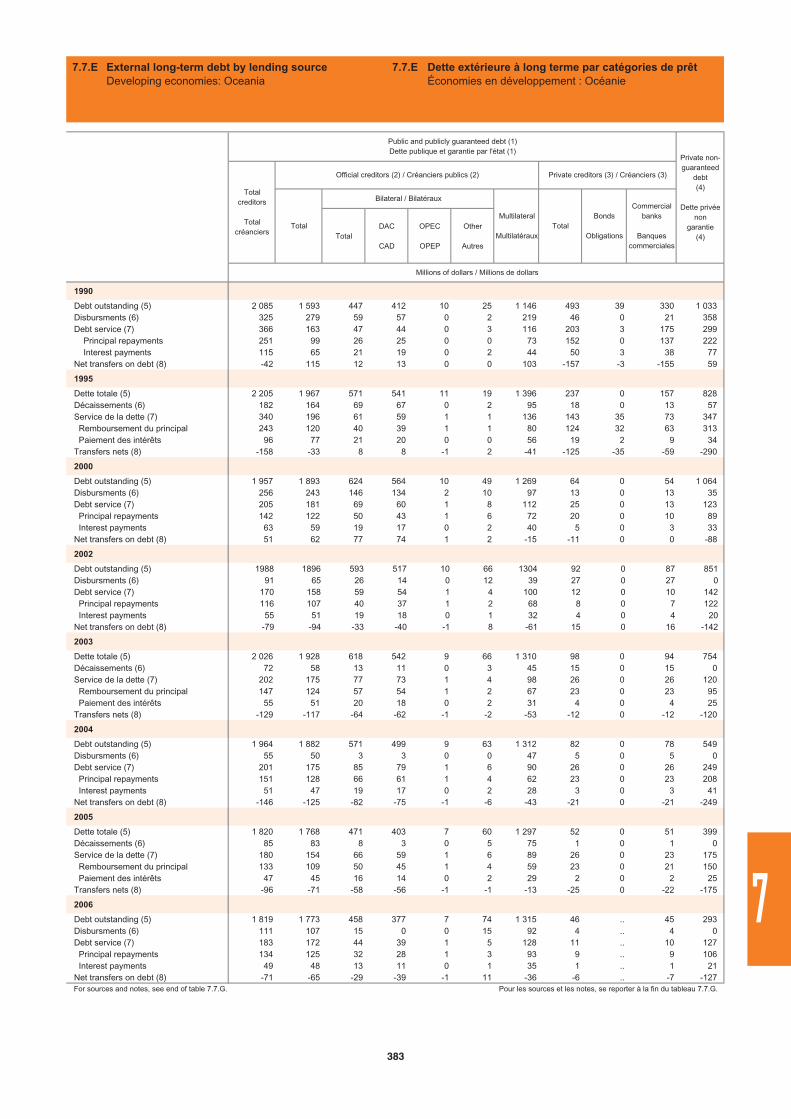
TotalDAC
CAD
OPEC
OPEP
Other
Autres
1990
Debt outstanding (5) 2 085 1 593 447 412 10 25 1 146 493 39 330 1 033Disbursments (6) 325 279 59 57 0 2 219 46 0 21 358Debt service (7) 366 163 47 44 0 3 116 203 3 175 299 Principal repayments 251 99 26 25 0 0 73 152 0 137 222 Interest payments 115 65 21 19 0 2 44 50 3 38 77Net transfers on debt (8) -42 115 12 13 0 0 103 -157 -3 -155 59
1995
Dette totale (5) 2 205 1 967 571 541 11 19 1 396 237 0 157 828Décaissements (6) 182 164 69 67 0 2 95 18 0 13 57Service de la dette (7) 340 196 61 59 1 1 136 143 35 73 347 Remboursement du principal 243 120 40 39 1 1 80 124 32 63 313 Paiement des intérêts 96 77 21 20 0 0 56 19 2 9 34Transfers nets (8) -158 -33 8 8 -1 2 -41 -125 -35 -59 -290
2000
Debt outstanding (5) 1 957 1 893 624 564 10 49 1 269 64 0 54 1 064Disbursments (6) 256 243 146 134 2 10 97 13 0 13 35Debt service (7) 205 181 69 60 1 8 112 25 0 13 123 Principal repayments 142 122 50 43 1 6 72 20 0 10 89 Interest payments 63 59 19 17 0 2 40 5 0 3 33Net transfers on debt (8) 51 62 77 74 1 2 -15 -11 0 0 -88
2002
Debt outstanding (5) 1988 1896 593 517 10 66 1304 92 0 87 851Disbursments (6) 91 65 26 14 0 12 39 27 0 27 0Debt service (7) 170 158 59 54 1 4 100 12 0 10 142 Principal repayments 116 107 40 37 1 2 68 8 0 7 122 Interest payments 55 51 19 18 0 1 32 4 0 4 20Net transfers on debt (8) -79 -94 -33 -40 -1 8 -61 15 0 16 -142
2003
Dette totale (5) 2 026 1 928 618 542 9 66 1 310 98 0 94 754Décaissements (6) 72 58 13 11 0 3 45 15 0 15 0Service de la dette (7) 202 175 77 73 1 4 98 26 0 26 120 Remboursement du principal 147 124 57 54 1 2 67 23 0 23 95 Paiement des intérêts 55 51 20 18 0 2 31 4 0 4 25Transfers nets (8) -129 -117 -64 -62 -1 -2 -53 -12 0 -12 -120
2004
Debt outstanding (5) 1 964 1 882 571 499 9 63 1 312 82 0 78 549Disbursments (6) 55 50 3 3 0 0 47 5 0 5 0Debt service (7) 201 175 85 79 1 6 90 26 0 26 249 Principal repayments 151 128 66 61 1 4 62 23 0 23 208 Interest payments 51 47 19 17 0 2 28 3 0 3 41Net transfers on debt (8) -146 -125 -82 -75 -1 -6 -43 -21 0 -21 -249
2005
Dette totale (5) 1 820 1 768 471 403 7 60 1 297 52 0 51 399Décaissements (6) 85 83 8 3 0 5 75 1 0 1 0Service de la dette (7) 180 154 66 59 1 6 89 26 0 23 175 Remboursement du principal 133 109 50 45 1 4 59 23 0 21 150 Paiement des intérêts 47 45 16 14 0 2 29 2 0 2 25Transfers nets (8) -96 -71 -58 -56 -1 -1 -13 -25 0 -22 -175
2006
Debt outstanding (5) 1 819 1 773 458 377 7 74 1 315 46 .. 45 293Disbursments (6) 111 107 15 0 0 15 92 4 .. 4 0Debt service (7) 183 172 44 39 1 5 128 11 .. 10 127 Principal repayments 134 125 32 28 1 3 93 9 .. 9 106 Interest payments 49 48 13 11 0 1 35 1 .. 1 21Net transfers on debt (8) -71 -65 -29 -39 -1 11 -36 -6 .. -7 -127For sources and notes, see end of table 7.7.G. Pour les sources et les notes, se reporter à la fin du tableau 7.7.G.
Bilateral / Bilatéraux
Multilateral
Multilatéraux
Millions of dollars / Millions de dollars
Total
Commercialbanks
Banquescommerciales
Bonds
Obligations
Private creditors (3) / Créanciers (3)
Private non-guaranteed
debt(4)
Dette privéenon
garantie(4)
Public and publicly guaranteed debt (1)Dette publique et garantie par l'état (1)
Totalcreditors
Totalcréanciers
Official creditors (2) / Créanciers publics (2)
Total
7.7.E External long-term debt by lending sourceDeveloping economies: Oceania
7.7.E Dette extérieure à long terme par catégories de prêtÉconomies en développement : Océanie
383
7
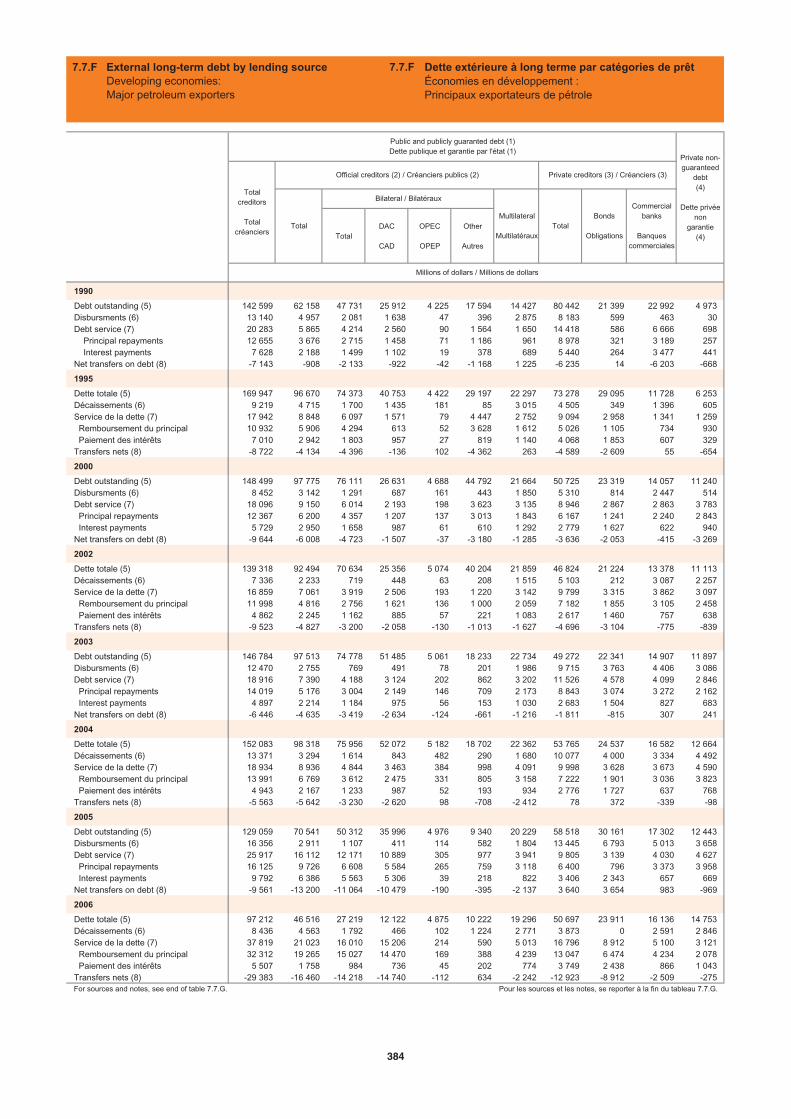
TotalDAC
CAD
OPEC
OPEP
Other
Autres
1990
Debt outstanding (5) 142 599 62 158 47 731 25 912 4 225 17 594 14 427 80 442 21 399 22 992 4 973Disbursments (6) 13 140 4 957 2 081 1 638 47 396 2 875 8 183 599 463 30Debt service (7) 20 283 5 865 4 214 2 560 90 1 564 1 650 14 418 586 6 666 698 Principal repayments 12 655 3 676 2 715 1 458 71 1 186 961 8 978 321 3 189 257 Interest payments 7 628 2 188 1 499 1 102 19 378 689 5 440 264 3 477 441Net transfers on debt (8) -7 143 -908 -2 133 -922 -42 -1 168 1 225 -6 235 14 -6 203 -668
1995
Dette totale (5) 169 947 96 670 74 373 40 753 4 422 29 197 22 297 73 278 29 095 11 728 6 253Décaissements (6) 9 219 4 715 1 700 1 435 181 85 3 015 4 505 349 1 396 605Service de la dette (7) 17 942 8 848 6 097 1 571 79 4 447 2 752 9 094 2 958 1 341 1 259 Remboursement du principal 10 932 5 906 4 294 613 52 3 628 1 612 5 026 1 105 734 930 Paiement des intérêts 7 010 2 942 1 803 957 27 819 1 140 4 068 1 853 607 329Transfers nets (8) -8 722 -4 134 -4 396 -136 102 -4 362 263 -4 589 -2 609 55 -654
2000
Debt outstanding (5) 148 499 97 775 76 111 26 631 4 688 44 792 21 664 50 725 23 319 14 057 11 240Disbursments (6) 8 452 3 142 1 291 687 161 443 1 850 5 310 814 2 447 514Debt service (7) 18 096 9 150 6 014 2 193 198 3 623 3 135 8 946 2 867 2 863 3 783 Principal repayments 12 367 6 200 4 357 1 207 137 3 013 1 843 6 167 1 241 2 240 2 843 Interest payments 5 729 2 950 1 658 987 61 610 1 292 2 779 1 627 622 940Net transfers on debt (8) -9 644 -6 008 -4 723 -1 507 -37 -3 180 -1 285 -3 636 -2 053 -415 -3 269
2002
Dette totale (5) 139 318 92 494 70 634 25 356 5 074 40 204 21 859 46 824 21 224 13 378 11 113Décaissements (6) 7 336 2 233 719 448 63 208 1 515 5 103 212 3 087 2 257Service de la dette (7) 16 859 7 061 3 919 2 506 193 1 220 3 142 9 799 3 315 3 862 3 097 Remboursement du principal 11 998 4 816 2 756 1 621 136 1 000 2 059 7 182 1 855 3 105 2 458 Paiement des intérêts 4 862 2 245 1 162 885 57 221 1 083 2 617 1 460 757 638Transfers nets (8) -9 523 -4 827 -3 200 -2 058 -130 -1 013 -1 627 -4 696 -3 104 -775 -839
2003
Debt outstanding (5) 146 784 97 513 74 778 51 485 5 061 18 233 22 734 49 272 22 341 14 907 11 897Disbursments (6) 12 470 2 755 769 491 78 201 1 986 9 715 3 763 4 406 3 086Debt service (7) 18 916 7 390 4 188 3 124 202 862 3 202 11 526 4 578 4 099 2 846 Principal repayments 14 019 5 176 3 004 2 149 146 709 2 173 8 843 3 074 3 272 2 162 Interest payments 4 897 2 214 1 184 975 56 153 1 030 2 683 1 504 827 683Net transfers on debt (8) -6 446 -4 635 -3 419 -2 634 -124 -661 -1 216 -1 811 -815 307 241
2004
Dette totale (5) 152 083 98 318 75 956 52 072 5 182 18 702 22 362 53 765 24 537 16 582 12 664Décaissements (6) 13 371 3 294 1 614 843 482 290 1 680 10 077 4 000 3 334 4 492Service de la dette (7) 18 934 8 936 4 844 3 463 384 998 4 091 9 998 3 628 3 673 4 590 Remboursement du principal 13 991 6 769 3 612 2 475 331 805 3 158 7 222 1 901 3 036 3 823 Paiement des intérêts 4 943 2 167 1 233 987 52 193 934 2 776 1 727 637 768Transfers nets (8) -5 563 -5 642 -3 230 -2 620 98 -708 -2 412 78 372 -339 -98
2005
Debt outstanding (5) 129 059 70 541 50 312 35 996 4 976 9 340 20 229 58 518 30 161 17 302 12 443Disbursments (6) 16 356 2 911 1 107 411 114 582 1 804 13 445 6 793 5 013 3 658Debt service (7) 25 917 16 112 12 171 10 889 305 977 3 941 9 805 3 139 4 030 4 627 Principal repayments 16 125 9 726 6 608 5 584 265 759 3 118 6 400 796 3 373 3 958 Interest payments 9 792 6 386 5 563 5 306 39 218 822 3 406 2 343 657 669Net transfers on debt (8) -9 561 -13 200 -11 064 -10 479 -190 -395 -2 137 3 640 3 654 983 -969
2006
Dette totale (5) 97 212 46 516 27 219 12 122 4 875 10 222 19 296 50 697 23 911 16 136 14 753Décaissements (6) 8 436 4 563 1 792 466 102 1 224 2 771 3 873 0 2 591 2 846Service de la dette (7) 37 819 21 023 16 010 15 206 214 590 5 013 16 796 8 912 5 100 3 121 Remboursement du principal 32 312 19 265 15 027 14 470 169 388 4 239 13 047 6 474 4 234 2 078 Paiement des intérêts 5 507 1 758 984 736 45 202 774 3 749 2 438 866 1 043Transfers nets (8) -29 383 -16 460 -14 218 -14 740 -112 634 -2 242 -12 923 -8 912 -2 509 -275For sources and notes, see end of table 7.7.G. Pour les sources et les notes, se reporter à la fin du tableau 7.7.G.
Bonds
Obligations
Private creditors (3) / Créanciers (3)
Private non-guaranteed
debt(4)
Dette privéenon
garantie(4)
Public and publicly guaranted debt (1)Dette publique et garantie par l'état (1)
Totalcreditors
Totalcréanciers
Millions of dollars / Millions de dollars
Official creditors (2) / Créanciers publics (2)
Total
Bilateral / Bilatéraux
Multilateral
MultilatérauxTotal
Commercialbanks
Banquescommerciales
7.7.F External long-term debt by lending sourceDeveloping economies:Major petroleum exporters
7.7.F Dette extérieure à long terme par catégories de prêtÉconomies en développement : Principaux exportateurs de pétrole
384
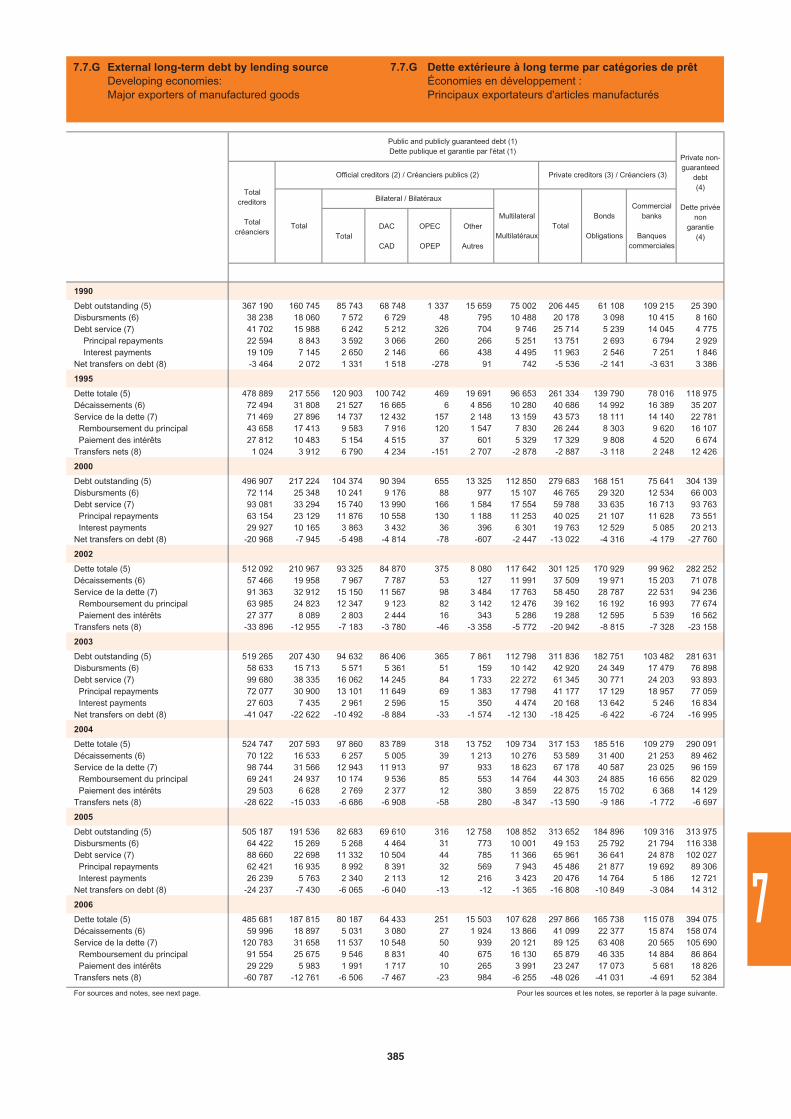
TotalDAC
CAD
OPEC
OPEP
Other
Autres
1990
Debt outstanding (5) 367 190 160 745 85 743 68 748 1 337 15 659 75 002 206 445 61 108 109 215 25 390Disbursments (6) 38 238 18 060 7 572 6 729 48 795 10 488 20 178 3 098 10 415 8 160Debt service (7) 41 702 15 988 6 242 5 212 326 704 9 746 25 714 5 239 14 045 4 775 Principal repayments 22 594 8 843 3 592 3 066 260 266 5 251 13 751 2 693 6 794 2 929 Interest payments 19 109 7 145 2 650 2 146 66 438 4 495 11 963 2 546 7 251 1 846Net transfers on debt (8) -3 464 2 072 1 331 1 518 -278 91 742 -5 536 -2 141 -3 631 3 386
1995
Dette totale (5) 478 889 217 556 120 903 100 742 469 19 691 96 653 261 334 139 790 78 016 118 975Décaissements (6) 72 494 31 808 21 527 16 665 6 4 856 10 280 40 686 14 992 16 389 35 207Service de la dette (7) 71 469 27 896 14 737 12 432 157 2 148 13 159 43 573 18 111 14 140 22 781 Remboursement du principal 43 658 17 413 9 583 7 916 120 1 547 7 830 26 244 8 303 9 620 16 107 Paiement des intérêts 27 812 10 483 5 154 4 515 37 601 5 329 17 329 9 808 4 520 6 674Transfers nets (8) 1 024 3 912 6 790 4 234 -151 2 707 -2 878 -2 887 -3 118 2 248 12 426
2000
Debt outstanding (5) 496 907 217 224 104 374 90 394 655 13 325 112 850 279 683 168 151 75 641 304 139Disbursments (6) 72 114 25 348 10 241 9 176 88 977 15 107 46 765 29 320 12 534 66 003Debt service (7) 93 081 33 294 15 740 13 990 166 1 584 17 554 59 788 33 635 16 713 93 763 Principal repayments 63 154 23 129 11 876 10 558 130 1 188 11 253 40 025 21 107 11 628 73 551 Interest payments 29 927 10 165 3 863 3 432 36 396 6 301 19 763 12 529 5 085 20 213Net transfers on debt (8) -20 968 -7 945 -5 498 -4 814 -78 -607 -2 447 -13 022 -4 316 -4 179 -27 760
2002
Dette totale (5) 512 092 210 967 93 325 84 870 375 8 080 117 642 301 125 170 929 99 962 282 252Décaissements (6) 57 466 19 958 7 967 7 787 53 127 11 991 37 509 19 971 15 203 71 078Service de la dette (7) 91 363 32 912 15 150 11 567 98 3 484 17 763 58 450 28 787 22 531 94 236 Remboursement du principal 63 985 24 823 12 347 9 123 82 3 142 12 476 39 162 16 192 16 993 77 674 Paiement des intérêts 27 377 8 089 2 803 2 444 16 343 5 286 19 288 12 595 5 539 16 562Transfers nets (8) -33 896 -12 955 -7 183 -3 780 -46 -3 358 -5 772 -20 942 -8 815 -7 328 -23 158
2003
Debt outstanding (5) 519 265 207 430 94 632 86 406 365 7 861 112 798 311 836 182 751 103 482 281 631Disbursments (6) 58 633 15 713 5 571 5 361 51 159 10 142 42 920 24 349 17 479 76 898Debt service (7) 99 680 38 335 16 062 14 245 84 1 733 22 272 61 345 30 771 24 203 93 893 Principal repayments 72 077 30 900 13 101 11 649 69 1 383 17 798 41 177 17 129 18 957 77 059 Interest payments 27 603 7 435 2 961 2 596 15 350 4 474 20 168 13 642 5 246 16 834Net transfers on debt (8) -41 047 -22 622 -10 492 -8 884 -33 -1 574 -12 130 -18 425 -6 422 -6 724 -16 995
2004
Dette totale (5) 524 747 207 593 97 860 83 789 318 13 752 109 734 317 153 185 516 109 279 290 091Décaissements (6) 70 122 16 533 6 257 5 005 39 1 213 10 276 53 589 31 400 21 253 89 462Service de la dette (7) 98 744 31 566 12 943 11 913 97 933 18 623 67 178 40 587 23 025 96 159 Remboursement du principal 69 241 24 937 10 174 9 536 85 553 14 764 44 303 24 885 16 656 82 029 Paiement des intérêts 29 503 6 628 2 769 2 377 12 380 3 859 22 875 15 702 6 368 14 129Transfers nets (8) -28 622 -15 033 -6 686 -6 908 -58 280 -8 347 -13 590 -9 186 -1 772 -6 697
2005
Debt outstanding (5) 505 187 191 536 82 683 69 610 316 12 758 108 852 313 652 184 896 109 316 313 975Disbursments (6) 64 422 15 269 5 268 4 464 31 773 10 001 49 153 25 792 21 794 116 338Debt service (7) 88 660 22 698 11 332 10 504 44 785 11 366 65 961 36 641 24 878 102 027 Principal repayments 62 421 16 935 8 992 8 391 32 569 7 943 45 486 21 877 19 692 89 306 Interest payments 26 239 5 763 2 340 2 113 12 216 3 423 20 476 14 764 5 186 12 721Net transfers on debt (8) -24 237 -7 430 -6 065 -6 040 -13 -12 -1 365 -16 808 -10 849 -3 084 14 312
2006
Dette totale (5) 485 681 187 815 80 187 64 433 251 15 503 107 628 297 866 165 738 115 078 394 075Décaissements (6) 59 996 18 897 5 031 3 080 27 1 924 13 866 41 099 22 377 15 874 158 074Service de la dette (7) 120 783 31 658 11 537 10 548 50 939 20 121 89 125 63 408 20 565 105 690 Remboursement du principal 91 554 25 675 9 546 8 831 40 675 16 130 65 879 46 335 14 884 86 864 Paiement des intérêts 29 229 5 983 1 991 1 717 10 265 3 991 23 247 17 073 5 681 18 826Transfers nets (8) -60 787 -12 761 -6 506 -7 467 -23 984 -6 255 -48 026 -41 031 -4 691 52 384
For sources and notes, see next page. Pour les sources et les notes, se reporter à la page suivante.
Bonds
Obligations
Private creditors (3) / Créanciers (3)
Private non-guaranteed
debt(4)
Dette privéenon
garantie(4)
Public and publicly guaranteed debt (1)Dette publique et garantie par l'état (1)
Totalcreditors
Totalcréanciers
Official creditors (2) / Créanciers publics (2)
Total
Bilateral / Bilatéraux
Multilateral
MultilatérauxTotal
Commercialbanks
Banquescommerciales
7.7.G External long-term debt by lending sourceDeveloping economies:Major exporters of manufactured goods
7.7.G Dette extérieure à long terme par catégories de prêtÉconomies en développement : Principaux exportateurs d'articles manufacturés
385
7
(1)
(2)
(3)
(4)
(5)
(6)
(7)
(8)
Public and publicly guaranteed debt (PPG) are aggregated.- Public debt is an obligation of a public debtor, including the national government, apolitical subdivision (or an agency of either), and autonomous public bodies.- Publicly guaranteed debt is an external obligation of a private debtor that isguaranteed for repayment by a public entity.Data is shown by type of creditor: official creditors and private creditors.
Public and publicly guaranteed debt from official creditors includes loans fromGovernments and loans from international organizations .Government loans include loans from governments and their agencies (includingcentral banks), loans from autonomous bodies, and direct loans from official exportcredit agencies. Loans from international organizations include loans and credits from the World Bank,regional development banks, and other multilateral and intergovernmental agencies.Excluded are loans from funds administered by an international organization on behalfof a single donor Government; these are classified as loans from Governments.In this table, Governments are treated as bilateral creditors and internationalorganizations are treated as multilateral creditors.
Public and publicly guaranteed debt from private creditors includes:- Bonds that are either publicly issued or privately placed;- Commercial bank loans from private banks and other private financial institutions; - Other private credits from manufacturers, exporters, and other suppliers of goods, andbank credits covered by a guarantee of an export credit agency.
Private nonguaranteed debt (PNG) is an obligation of a private debtor that is notguaranteed for repayment by a public entity.
Long-term debt is defined as debt that has an original or extended maturity of more thanone year and that is owed to nonresidents and repayable in foreign currency, goods, orservices. Long-term debt has three components: Public debt, Publicly guaranteed debt,and Private nonguaranteed debt.Total outstanding long term debt at year end is long-term debt outstanding anddisbursed.
Disbursements on long-term debt are drawings on loan commitments during the yearspecified.
Long-term debt service payments are the sum of principal repayments and interestpayments in the year specified.
Net transfers are disbursements minus debt service payments.
Sources:- World Bank, Global Development Finance 2008
Notes:
(1)
(2)
(3)
(4)
(5)
(6)
(7)
(8)
La dette publique et garantie par l'État est une aggrégation de 2 composantes :- La dette publique qui est une dette contractée par le secteur public, y compris le gouvernement, une entité politique et d'autres organismes publics autonomes.- La dette garantie par l'État qui est une dette contractée par le secteur privé, dont l'amortissement est garanti par une entité publique.Les données sont indiquées par type de créanciers : créanciers publics et créanciersprivés.
La dette publique et garantie par l'État octroyée par les créanciers publics inclut les prêts des gouvernements et les prêts des organisations internationales.Les prêts des gouvernements incluent les prêts des gouvernements et des organismes publics (y compris les banques centrales), les prêts provenant d'entités autonomes et les prêts octroyés directement par des organismes publics de crédits à l'exportation.Les prêts des organisations internationales incluent les prêts et les crédits de la Banque mondiale, des banques régionales de développement, et d'autres organismes multilatéraux et intergouvernementaux. Ne sont pas compris les prêts provenant des fonds administrés par une organisation internationale, pour le compte d'un gouvernement ; ceux-ci sont classés sous la rubrique des prêts des gouvernements.Dans ce tableau, les gouvernements sont appelés créditeurs bilatéraux et les organisationsinternationales sont appelées créditeurs multilatéraux.
La dette publique et garantie par l'État octroyée par les créanciers privés, comprend :- Les obligations qui sont soit des émissions publiques, soit des placements privés ;- Les prêts des banques commerciales octroyés par des banques privées et par d'autresentités financières ;- Les autres crédits privés provenant du secteur manufacturier, du secteur des exportations, et d'autres fournisseurs de biens, ainsi que des crédits bancaires couverts par un organisme de crédits à l'exportation.
La dette du secteur privé non garantie est une dette contractée par le secteur privé, dont l'amortissement n'est pas garanti par une entité publique.
La dette à long terme a une durée de remboursement (d'origine ou différée) supérieure à une année, et son amortissement est dû, en monnaies convertibles ou en nature, à des créanciers non-résidents. La dette à long terme a trois composantes : dette publique, dette garantie par l'État et dette du secteur privé non garantie.L'encours total de la dette à long terme à la fin de l'année est la somme de l'encours de la dette à long terme et de la dette décaissée à long terme.
Les décaissements de la dette à long terme sont les tirages sur les engagements de la dette effectués au cours de l'année spécifiée.
Les paiements du service de la dette à long terme sont la somme du remboursement du principal et du paiement des intérêts, effectués au cours de l'année spécifiée.
Les transferts nets sont les décaissements moins les paiements du service de la dette.
Sources : - Banque mondiale, Global Development Finance 2008
Notes :
7.7.G External long-term debt by lending sourceDeveloping economies:Major exporters of manufactured goods
7.7.G Dette extérieure à long terme par catégories de prêtÉconomies en développement : Principaux exportateurs d'articles manufacturés
386
DÉVELOPPEMENT
DEVELOPMENT
1
2
3
4
5
6
7
8
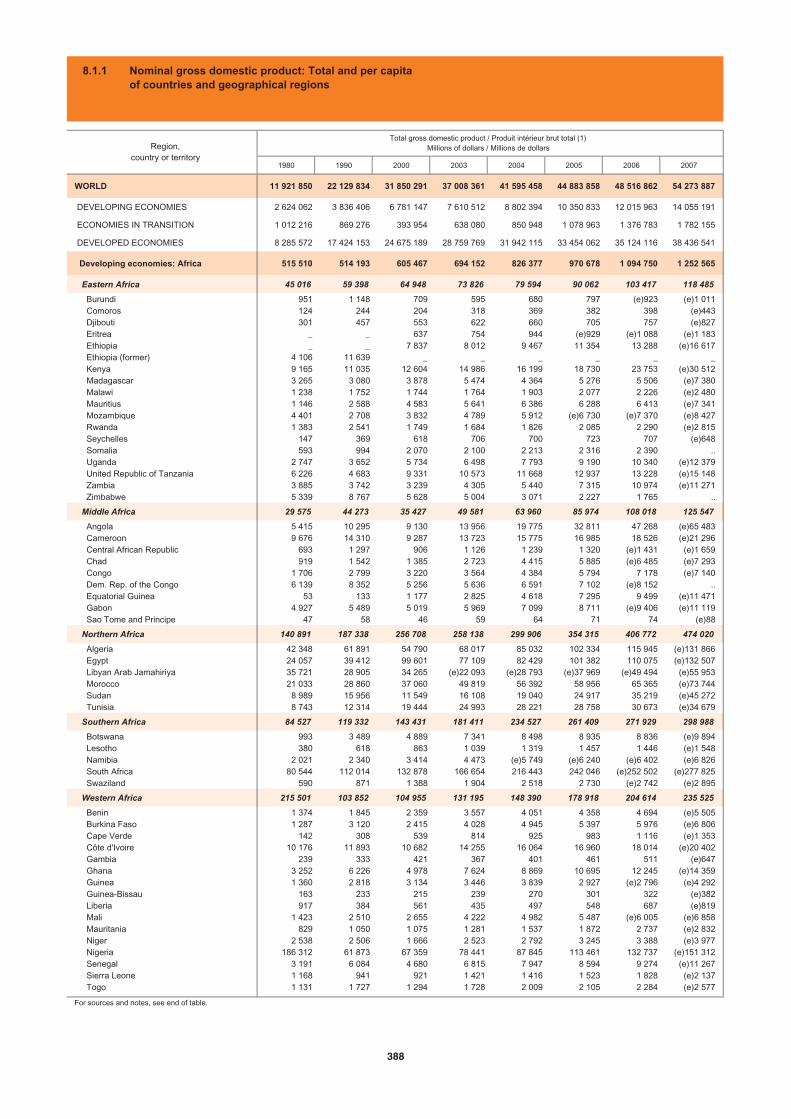
1980 1990 2000 2003 2004 2005 2006 2007
WORLD 11 921 850 22 129 834 31 850 291 37 008 361 41 595 458 44 883 858 48 516 862 54 273 887
DEVELOPING ECONOMIES 2 624 062 3 836 406 6 781 147 7 610 512 8 802 394 10 350 833 12 015 963 14 055 191
ECONOMIES IN TRANSITION 1 012 216 869 276 393 954 638 080 850 948 1 078 963 1 376 783 1 782 155
DEVELOPED ECONOMIES 8 285 572 17 424 153 24 675 189 28 759 769 31 942 115 33 454 062 35 124 116 38 436 541
Developing economies: Africa 515 510 514 193 605 467 694 152 826 377 970 678 1 094 750 1 252 565
Eastern Africa 45 016 59 398 64 948 73 826 79 594 90 062 103 417 118 485
Burundi 951 1 148 709 595 680 797 (e)923 (e)1 011 Comoros 124 244 204 318 369 382 398 (e)443 Djibouti 301 457 553 622 660 705 757 (e)827 Eritrea _ _ 637 754 944 (e)929 (e)1 088 (e)1 183 Ethiopia _ _ 7 837 8 012 9 467 11 354 13 288 (e)16 617 Ethiopia (former) 4 106 11 639 _ _ _ _ _ _ Kenya 9 165 11 035 12 604 14 986 16 199 18 730 23 753 (e)30 512 Madagascar 3 265 3 080 3 878 5 474 4 364 5 276 5 506 (e)7 380 Malawi 1 238 1 752 1 744 1 764 1 903 2 077 2 226 (e)2 480 Mauritius 1 146 2 588 4 583 5 641 6 386 6 288 6 413 (e)7 341 Mozambique 4 401 2 708 3 832 4 789 5 912 (e)6 730 (e)7 370 (e)8 427 Rwanda 1 383 2 541 1 749 1 684 1 826 2 085 2 290 (e)2 815 Seychelles 147 369 618 706 700 723 707 (e)648 Somalia 593 994 2 070 2 100 2 213 2 316 2 390 .. Uganda 2 747 3 652 5 734 6 498 7 793 9 190 10 340 (e)12 379 United Republic of Tanzania 6 226 4 683 9 331 10 573 11 668 12 937 13 228 (e)15 148 Zambia 3 885 3 742 3 239 4 305 5 440 7 315 10 974 (e)11 271 Zimbabwe 5 339 8 767 5 628 5 004 3 071 2 227 1 765 ..
Middle Africa 29 575 44 273 35 427 49 581 63 960 85 974 108 018 125 547
Angola 5 415 10 295 9 130 13 956 19 775 32 811 47 268 (e)65 483 Cameroon 9 676 14 310 9 287 13 723 15 775 16 985 18 526 (e)21 296 Central African Republic 693 1 297 906 1 126 1 239 1 320 (e)1 431 (e)1 659 Chad 919 1 542 1 385 2 723 4 415 5 885 (e)6 485 (e)7 293 Congo 1 706 2 799 3 220 3 564 4 384 5 794 7 178 (e)7 140 Dem. Rep. of the Congo 6 139 8 352 5 256 5 636 6 591 7 102 (e)8 152 .. Equatorial Guinea 53 133 1 177 2 825 4 618 7 295 9 499 (e)11 471 Gabon 4 927 5 489 5 019 5 969 7 099 8 711 (e)9 406 (e)11 119 Sao Tome and Principe 47 58 46 59 64 71 74 (e)88
Northern Africa 140 891 187 338 256 708 258 138 299 906 354 315 406 772 474 020
Algeria 42 348 61 891 54 790 68 017 85 032 102 334 115 945 (e)131 866 Egypt 24 057 39 412 99 601 77 109 82 429 101 382 110 075 (e)132 507 Libyan Arab Jamahiriya 35 721 28 905 34 265 (e)22 093 (e)28 793 (e)37 969 (e)49 494 (e)55 953 Morocco 21 033 28 860 37 060 49 819 56 392 58 956 65 365 (e)73 744 Sudan 8 989 15 956 11 549 16 108 19 040 24 917 35 219 (e)45 272 Tunisia 8 743 12 314 19 444 24 993 28 221 28 758 30 673 (e)34 679
Southern Africa 84 527 119 332 143 431 181 411 234 527 261 409 271 929 298 988
Botswana 993 3 489 4 889 7 341 8 498 8 935 8 836 (e)9 894 Lesotho 380 618 863 1 039 1 319 1 457 1 446 (e)1 548 Namibia 2 021 2 340 3 414 4 473 (e)5 749 (e)6 240 (e)6 402 (e)6 826 South Africa 80 544 112 014 132 878 166 654 216 443 242 046 (e)252 502 (e)277 825 Swaziland 590 871 1 388 1 904 2 518 2 730 (e)2 742 (e)2 895
Western Africa 215 501 103 852 104 955 131 195 148 390 178 918 204 614 235 525
Benin 1 374 1 845 2 359 3 557 4 051 4 358 4 694 (e)5 505 Burkina Faso 1 287 3 120 2 415 4 028 4 945 5 397 5 976 (e)6 806 Cape Verde 142 308 539 814 925 983 1 116 (e)1 353 Côte d'Ivoire 10 176 11 893 10 682 14 255 16 064 16 960 18 014 (e)20 402 Gambia 239 333 421 367 401 461 511 (e)647 Ghana 3 252 6 226 4 978 7 624 8 869 10 695 12 245 (e)14 359 Guinea 1 360 2 818 3 134 3 446 3 839 2 927 (e)2 796 (e)4 292 Guinea-Bissau 163 233 215 239 270 301 322 (e)382 Liberia 917 384 561 435 497 548 687 (e)819 Mali 1 423 2 510 2 655 4 222 4 982 5 487 (e)6 005 (e)6 858 Mauritania 829 1 050 1 075 1 281 1 537 1 872 2 737 (e)2 832 Niger 2 538 2 506 1 666 2 523 2 792 3 245 3 388 (e)3 977 Nigeria 186 312 61 873 67 359 78 441 87 845 113 461 132 737 (e)151 312 Senegal 3 191 6 084 4 680 6 815 7 947 8 594 9 274 (e)11 267 Sierra Leone 1 168 941 921 1 421 1 416 1 523 1 828 (e)2 137 Togo 1 131 1 727 1 294 1 728 2 009 2 105 2 284 (e)2 577
For sources and notes, see end of table.
Total gross domestic product / Produit intérieur brut total (1)Millions of dollars / Millions de dollarsRegion,
country or territory
8.1.1 Nominal gross domestic product: Total and per capitaof countries and geographical regions
388
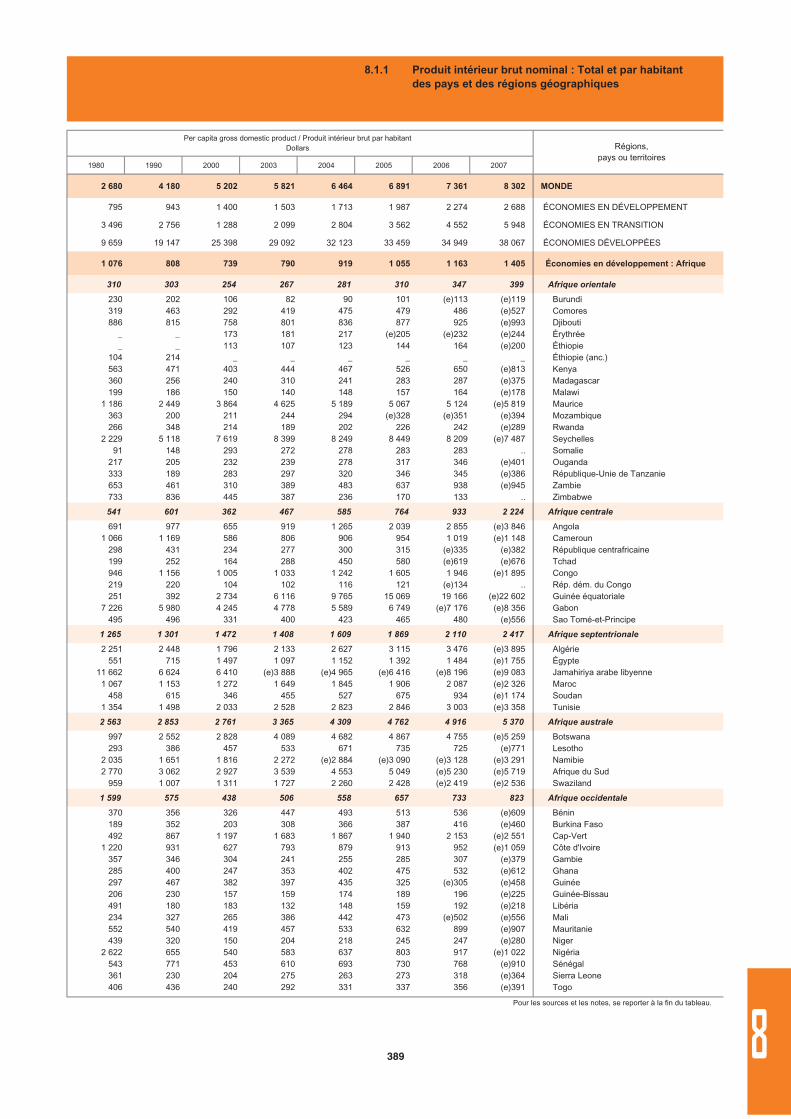
1980 1990 2000 2003 2004 2005 2006 2007
2 680 4 180 5 202 5 821 6 464 6 891 7 361 8 302 MONDE
795 943 1 400 1 503 1 713 1 987 2 274 2 688 ÉCONOMIES EN DÉVELOPPEMENT
3 496 2 756 1 288 2 099 2 804 3 562 4 552 5 948 ÉCONOMIES EN TRANSITION
9 659 19 147 25 398 29 092 32 123 33 459 34 949 38 067 ÉCONOMIES DÉVELOPPÉES
1 076 808 739 790 919 1 055 1 163 1 405 Économies en développement : Afrique
310 303 254 267 281 310 347 399 Afrique orientale
230 202 106 82 90 101 (e)113 (e)119 Burundi319 463 292 419 475 479 486 (e)527 Comores886 815 758 801 836 877 925 (e)993 Djibouti
_ _ 173 181 217 (e)205 (e)232 (e)244 Érythrée_ _ 113 107 123 144 164 (e)200 Éthiopie
104 214 _ _ _ _ _ _ Éthiopie (anc.)563 471 403 444 467 526 650 (e)813 Kenya360 256 240 310 241 283 287 (e)375 Madagascar199 186 150 140 148 157 164 (e)178 Malawi
1 186 2 449 3 864 4 625 5 189 5 067 5 124 (e)5 819 Maurice363 200 211 244 294 (e)328 (e)351 (e)394 Mozambique266 348 214 189 202 226 242 (e)289 Rwanda
2 229 5 118 7 619 8 399 8 249 8 449 8 209 (e)7 487 Seychelles91 148 293 272 278 283 283 .. Somalie
217 205 232 239 278 317 346 (e)401 Ouganda333 189 283 297 320 346 345 (e)386 République-Unie de Tanzanie653 461 310 389 483 637 938 (e)945 Zambie733 836 445 387 236 170 133 .. Zimbabwe
541 601 362 467 585 764 933 2 224 Afrique centrale
691 977 655 919 1 265 2 039 2 855 (e)3 846 Angola1 066 1 169 586 806 906 954 1 019 (e)1 148 Cameroun
298 431 234 277 300 315 (e)335 (e)382 République centrafricaine199 252 164 288 450 580 (e)619 (e)676 Tchad946 1 156 1 005 1 033 1 242 1 605 1 946 (e)1 895 Congo219 220 104 102 116 121 (e)134 .. Rép. dém. du Congo251 392 2 734 6 116 9 765 15 069 19 166 (e)22 602 Guinée équatoriale
7 226 5 980 4 245 4 778 5 589 6 749 (e)7 176 (e)8 356 Gabon495 496 331 400 423 465 480 (e)556 Sao Tomé-et-Principe
1 265 1 301 1 472 1 408 1 609 1 869 2 110 2 417 Afrique septentrionale
2 251 2 448 1 796 2 133 2 627 3 115 3 476 (e)3 895 Algérie551 715 1 497 1 097 1 152 1 392 1 484 (e)1 755 Égypte
11 662 6 624 6 410 (e)3 888 (e)4 965 (e)6 416 (e)8 196 (e)9 083 Jamahiriya arabe libyenne1 067 1 153 1 272 1 649 1 845 1 906 2 087 (e)2 326 Maroc
458 615 346 455 527 675 934 (e)1 174 Soudan1 354 1 498 2 033 2 528 2 823 2 846 3 003 (e)3 358 Tunisie
2 563 2 853 2 761 3 365 4 309 4 762 4 916 5 370 Afrique australe
997 2 552 2 828 4 089 4 682 4 867 4 755 (e)5 259 Botswana293 386 457 533 671 735 725 (e)771 Lesotho
2 035 1 651 1 816 2 272 (e)2 884 (e)3 090 (e)3 128 (e)3 291 Namibie2 770 3 062 2 927 3 539 4 553 5 049 (e)5 230 (e)5 719 Afrique du Sud
959 1 007 1 311 1 727 2 260 2 428 (e)2 419 (e)2 536 Swaziland
1 599 575 438 506 558 657 733 823 Afrique occidentale
370 356 326 447 493 513 536 (e)609 Bénin189 352 203 308 366 387 416 (e)460 Burkina Faso492 867 1 197 1 683 1 867 1 940 2 153 (e)2 551 Cap-Vert
1 220 931 627 793 879 913 952 (e)1 059 Côte d'Ivoire357 346 304 241 255 285 307 (e)379 Gambie285 400 247 353 402 475 532 (e)612 Ghana297 467 382 397 435 325 (e)305 (e)458 Guinée206 230 157 159 174 189 196 (e)225 Guinée-Bissau491 180 183 132 148 159 192 (e)218 Libéria234 327 265 386 442 473 (e)502 (e)556 Mali552 540 419 457 533 632 899 (e)907 Mauritanie439 320 150 204 218 245 247 (e)280 Niger
2 622 655 540 583 637 803 917 (e)1 022 Nigéria543 771 453 610 693 730 768 (e)910 Sénégal361 230 204 275 263 273 318 (e)364 Sierra Leone406 436 240 292 331 337 356 (e)391 Togo
Pour les sources et les notes, se reporter à la fin du tableau.
Régions,pays ou territoires
Per capita gross domestic product / Produit intérieur brut par habitantDollars
8.1.1 Produit intérieur brut nominal : Total et par habitant des pays et des régions géographiques
389 8
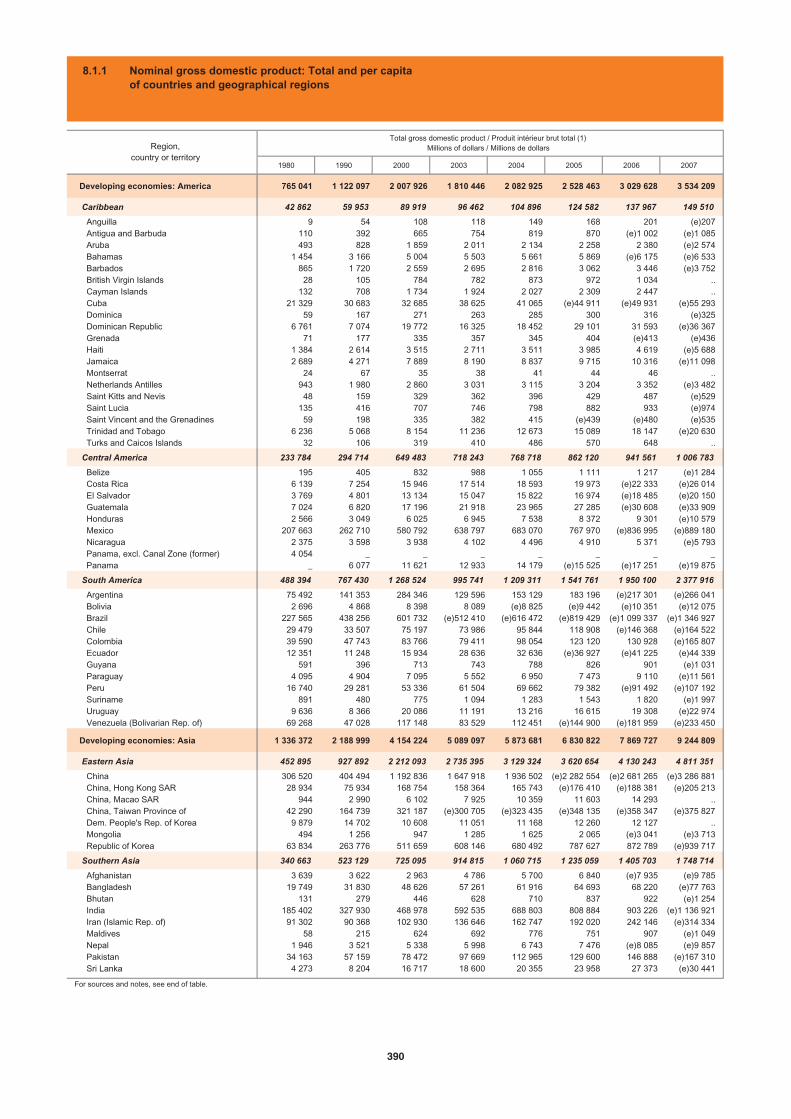
1980 1990 2000 2003 2004 2005 2006 2007
Developing economies: America 765 041 1 122 097 2 007 926 1 810 446 2 082 925 2 528 463 3 029 628 3 534 209
Caribbean 42 862 59 953 89 919 96 462 104 896 124 582 137 967 149 510
Anguilla 9 54 108 118 149 168 201 (e)207 Antigua and Barbuda 110 392 665 754 819 870 (e)1 002 (e)1 085 Aruba 493 828 1 859 2 011 2 134 2 258 2 380 (e)2 574 Bahamas 1 454 3 166 5 004 5 503 5 661 5 869 (e)6 175 (e)6 533 Barbados 865 1 720 2 559 2 695 2 816 3 062 3 446 (e)3 752 British Virgin Islands 28 105 784 782 873 972 1 034 .. Cayman Islands 132 708 1 734 1 924 2 027 2 309 2 447 .. Cuba 21 329 30 683 32 685 38 625 41 065 (e)44 911 (e)49 931 (e)55 293 Dominica 59 167 271 263 285 300 316 (e)325 Dominican Republic 6 761 7 074 19 772 16 325 18 452 29 101 31 593 (e)36 367 Grenada 71 177 335 357 345 404 (e)413 (e)436 Haiti 1 384 2 614 3 515 2 711 3 511 3 985 4 619 (e)5 688 Jamaica 2 689 4 271 7 889 8 190 8 837 9 715 10 316 (e)11 098 Montserrat 24 67 35 38 41 44 46 .. Netherlands Antilles 943 1 980 2 860 3 031 3 115 3 204 3 352 (e)3 482 Saint Kitts and Nevis 48 159 329 362 396 429 487 (e)529 Saint Lucia 135 416 707 746 798 882 933 (e)974 Saint Vincent and the Grenadines 59 198 335 382 415 (e)439 (e)480 (e)535 Trinidad and Tobago 6 236 5 068 8 154 11 236 12 673 15 089 18 147 (e)20 630 Turks and Caicos Islands 32 106 319 410 486 570 648 ..
Central America 233 784 294 714 649 483 718 243 768 718 862 120 941 561 1 006 783
Belize 195 405 832 988 1 055 1 111 1 217 (e)1 284 Costa Rica 6 139 7 254 15 946 17 514 18 593 19 973 (e)22 333 (e)26 014 El Salvador 3 769 4 801 13 134 15 047 15 822 16 974 (e)18 485 (e)20 150 Guatemala 7 024 6 820 17 196 21 918 23 965 27 285 (e)30 608 (e)33 909 Honduras 2 566 3 049 6 025 6 945 7 538 8 372 9 301 (e)10 579 Mexico 207 663 262 710 580 792 638 797 683 070 767 970 (e)836 995 (e)889 180 Nicaragua 2 375 3 598 3 938 4 102 4 496 4 910 5 371 (e)5 793 Panama, excl. Canal Zone (former) 4 054 _ _ _ _ _ _ _ Panama _ 6 077 11 621 12 933 14 179 (e)15 525 (e)17 251 (e)19 875
South America 488 394 767 430 1 268 524 995 741 1 209 311 1 541 761 1 950 100 2 377 916
Argentina 75 492 141 353 284 346 129 596 153 129 183 196 (e)217 301 (e)266 041 Bolivia 2 696 4 868 8 398 8 089 (e)8 825 (e)9 442 (e)10 351 (e)12 075 Brazil 227 565 438 256 601 732 (e)512 410 (e)616 472 (e)819 429 (e)1 099 337 (e)1 346 927 Chile 29 479 33 507 75 197 73 986 95 844 118 908 (e)146 368 (e)164 522 Colombia 39 590 47 743 83 766 79 411 98 054 123 120 130 928 (e)165 807 Ecuador 12 351 11 248 15 934 28 636 32 636 (e)36 927 (e)41 225 (e)44 339 Guyana 591 396 713 743 788 826 901 (e)1 031 Paraguay 4 095 4 904 7 095 5 552 6 950 7 473 9 110 (e)11 561 Peru 16 740 29 281 53 336 61 504 69 662 79 382 (e)91 492 (e)107 192 Suriname 891 480 775 1 094 1 283 1 543 1 820 (e)1 997 Uruguay 9 636 8 366 20 086 11 191 13 216 16 615 19 308 (e)22 974 Venezuela (Bolivarian Rep. of) 69 268 47 028 117 148 83 529 112 451 (e)144 900 (e)181 959 (e)233 450
Developing economies: Asia 1 336 372 2 188 999 4 154 224 5 089 097 5 873 681 6 830 822 7 869 727 9 244 809
Eastern Asia 452 895 927 892 2 212 093 2 735 395 3 129 324 3 620 654 4 130 243 4 811 351
China 306 520 404 494 1 192 836 1 647 918 1 936 502 (e)2 282 554 (e)2 681 265 (e)3 286 881 China, Hong Kong SAR 28 934 75 934 168 754 158 364 165 743 (e)176 410 (e)188 381 (e)205 213 China, Macao SAR 944 2 990 6 102 7 925 10 359 11 603 14 293 .. China, Taiwan Province of 42 290 164 739 321 187 (e)300 705 (e)323 435 (e)348 135 (e)358 347 (e)375 827 Dem. People's Rep. of Korea 9 879 14 702 10 608 11 051 11 168 12 260 12 127 .. Mongolia 494 1 256 947 1 285 1 625 2 065 (e)3 041 (e)3 713 Republic of Korea 63 834 263 776 511 659 608 146 680 492 787 627 872 789 (e)939 717
Southern Asia 340 663 523 129 725 095 914 815 1 060 715 1 235 059 1 405 703 1 748 714
Afghanistan 3 639 3 622 2 963 4 786 5 700 6 840 (e)7 935 (e)9 785 Bangladesh 19 749 31 830 48 626 57 261 61 916 64 693 68 220 (e)77 763 Bhutan 131 279 446 628 710 837 922 (e)1 254 India 185 402 327 930 468 978 592 535 688 803 808 884 903 226 (e)1 136 921 Iran (Islamic Rep. of) 91 302 90 368 102 930 136 646 162 747 192 020 242 146 (e)314 334 Maldives 58 215 624 692 776 751 907 (e)1 049 Nepal 1 946 3 521 5 338 5 998 6 743 7 476 (e)8 085 (e)9 857 Pakistan 34 163 57 159 78 472 97 669 112 965 129 600 146 888 (e)167 310 Sri Lanka 4 273 8 204 16 717 18 600 20 355 23 958 27 373 (e)30 441
For sources and notes, see end of table.
Region,country or territory
Total gross domestic product / Produit intérieur brut total (1)Millions of dollars / Millions de dollars
8.1.1 Nominal gross domestic product: Total and per capitaof countries and geographical regions
390
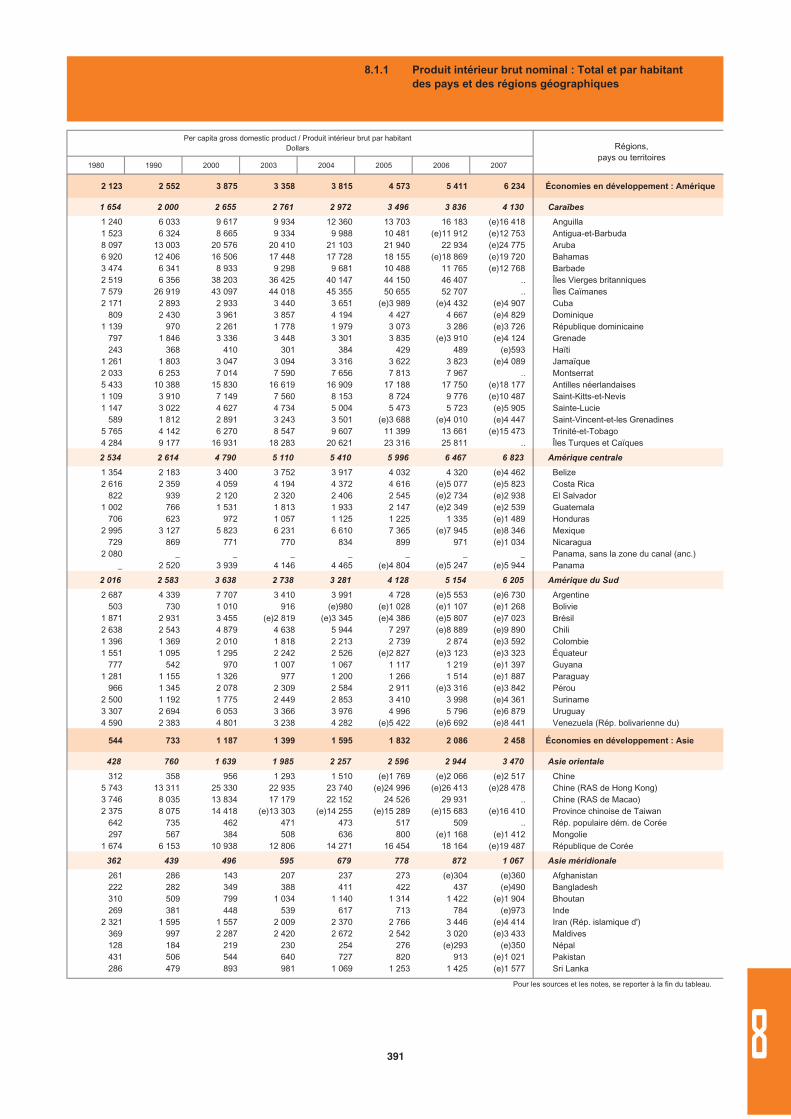
1980 1990 2000 2003 2004 2005 2006 2007
2 123 2 552 3 875 3 358 3 815 4 573 5 411 6 234 Économies en développement : Amérique
1 654 2 000 2 655 2 761 2 972 3 496 3 836 4 130 Caraïbes
1 240 6 033 9 617 9 934 12 360 13 703 16 183 (e)16 418 Anguilla1 523 6 324 8 665 9 334 9 988 10 481 (e)11 912 (e)12 753 Antigua-et-Barbuda8 097 13 003 20 576 20 410 21 103 21 940 22 934 (e)24 775 Aruba6 920 12 406 16 506 17 448 17 728 18 155 (e)18 869 (e)19 720 Bahamas3 474 6 341 8 933 9 298 9 681 10 488 11 765 (e)12 768 Barbade2 519 6 356 38 203 36 425 40 147 44 150 46 407 .. Îles Vierges britanniques7 579 26 919 43 097 44 018 45 355 50 655 52 707 .. Îles Caïmanes2 171 2 893 2 933 3 440 3 651 (e)3 989 (e)4 432 (e)4 907 Cuba
809 2 430 3 961 3 857 4 194 4 427 4 667 (e)4 829 Dominique1 139 970 2 261 1 778 1 979 3 073 3 286 (e)3 726 République dominicaine
797 1 846 3 336 3 448 3 301 3 835 (e)3 910 (e)4 124 Grenade243 368 410 301 384 429 489 (e)593 Haïti
1 261 1 803 3 047 3 094 3 316 3 622 3 823 (e)4 089 Jamaïque2 033 6 253 7 014 7 590 7 656 7 813 7 967 .. Montserrat5 433 10 388 15 830 16 619 16 909 17 188 17 750 (e)18 177 Antilles néerlandaises1 109 3 910 7 149 7 560 8 153 8 724 9 776 (e)10 487 Saint-Kitts-et-Nevis1 147 3 022 4 627 4 734 5 004 5 473 5 723 (e)5 905 Sainte-Lucie
589 1 812 2 891 3 243 3 501 (e)3 688 (e)4 010 (e)4 447 Saint-Vincent-et-les Grenadines5 765 4 142 6 270 8 547 9 607 11 399 13 661 (e)15 473 Trinité-et-Tobago4 284 9 177 16 931 18 283 20 621 23 316 25 811 .. Îles Turques et Caïques
2 534 2 614 4 790 5 110 5 410 5 996 6 467 6 823 Amérique centrale
1 354 2 183 3 400 3 752 3 917 4 032 4 320 (e)4 462 Belize2 616 2 359 4 059 4 194 4 372 4 616 (e)5 077 (e)5 823 Costa Rica
822 939 2 120 2 320 2 406 2 545 (e)2 734 (e)2 938 El Salvador1 002 766 1 531 1 813 1 933 2 147 (e)2 349 (e)2 539 Guatemala
706 623 972 1 057 1 125 1 225 1 335 (e)1 489 Honduras2 995 3 127 5 823 6 231 6 610 7 365 (e)7 945 (e)8 346 Mexique
729 869 771 770 834 899 971 (e)1 034 Nicaragua2 080 _ _ _ _ _ _ _ Panama, sans la zone du canal (anc.)
_ 2 520 3 939 4 146 4 465 (e)4 804 (e)5 247 (e)5 944 Panama
2 016 2 583 3 638 2 738 3 281 4 128 5 154 6 205 Amérique du Sud
2 687 4 339 7 707 3 410 3 991 4 728 (e)5 553 (e)6 730 Argentine503 730 1 010 916 (e)980 (e)1 028 (e)1 107 (e)1 268 Bolivie
1 871 2 931 3 455 (e)2 819 (e)3 345 (e)4 386 (e)5 807 (e)7 023 Brésil2 638 2 543 4 879 4 638 5 944 7 297 (e)8 889 (e)9 890 Chili1 396 1 369 2 010 1 818 2 213 2 739 2 874 (e)3 592 Colombie1 551 1 095 1 295 2 242 2 526 (e)2 827 (e)3 123 (e)3 323 Équateur
777 542 970 1 007 1 067 1 117 1 219 (e)1 397 Guyana1 281 1 155 1 326 977 1 200 1 266 1 514 (e)1 887 Paraguay
966 1 345 2 078 2 309 2 584 2 911 (e)3 316 (e)3 842 Pérou2 500 1 192 1 775 2 449 2 853 3 410 3 998 (e)4 361 Suriname3 307 2 694 6 053 3 366 3 976 4 996 5 796 (e)6 879 Uruguay4 590 2 383 4 801 3 238 4 282 (e)5 422 (e)6 692 (e)8 441 Venezuela (Rép. bolivarienne du)
544 733 1 187 1 399 1 595 1 832 2 086 2 458 Économies en développement : Asie
428 760 1 639 1 985 2 257 2 596 2 944 3 470 Asie orientale
312 358 956 1 293 1 510 (e)1 769 (e)2 066 (e)2 517 Chine5 743 13 311 25 330 22 935 23 740 (e)24 996 (e)26 413 (e)28 478 Chine (RAS de Hong Kong)3 746 8 035 13 834 17 179 22 152 24 526 29 931 .. Chine (RAS de Macao)2 375 8 075 14 418 (e)13 303 (e)14 255 (e)15 289 (e)15 683 (e)16 410 Province chinoise de Taiwan
642 735 462 471 473 517 509 .. Rép. populaire dém. de Corée297 567 384 508 636 800 (e)1 168 (e)1 412 Mongolie
1 674 6 153 10 938 12 806 14 271 16 454 18 164 (e)19 487 République de Corée
362 439 496 595 679 778 872 1 067 Asie méridionale
261 286 143 207 237 273 (e)304 (e)360 Afghanistan222 282 349 388 411 422 437 (e)490 Bangladesh310 509 799 1 034 1 140 1 314 1 422 (e)1 904 Bhoutan269 381 448 539 617 713 784 (e)973 Inde
2 321 1 595 1 557 2 009 2 370 2 766 3 446 (e)4 414 Iran (Rép. islamique d')369 997 2 287 2 420 2 672 2 542 3 020 (e)3 433 Maldives128 184 219 230 254 276 (e)293 (e)350 Népal431 506 544 640 727 820 913 (e)1 021 Pakistan286 479 893 981 1 069 1 253 1 425 (e)1 577 Sri Lanka
Pour les sources et les notes, se reporter à la fin du tableau.
Per capita gross domestic product / Produit intérieur brut par habitantDollars Régions,
pays ou territoires
8.1.1 Produit intérieur brut nominal : Total et par habitant des pays et des régions géographiques
391 8
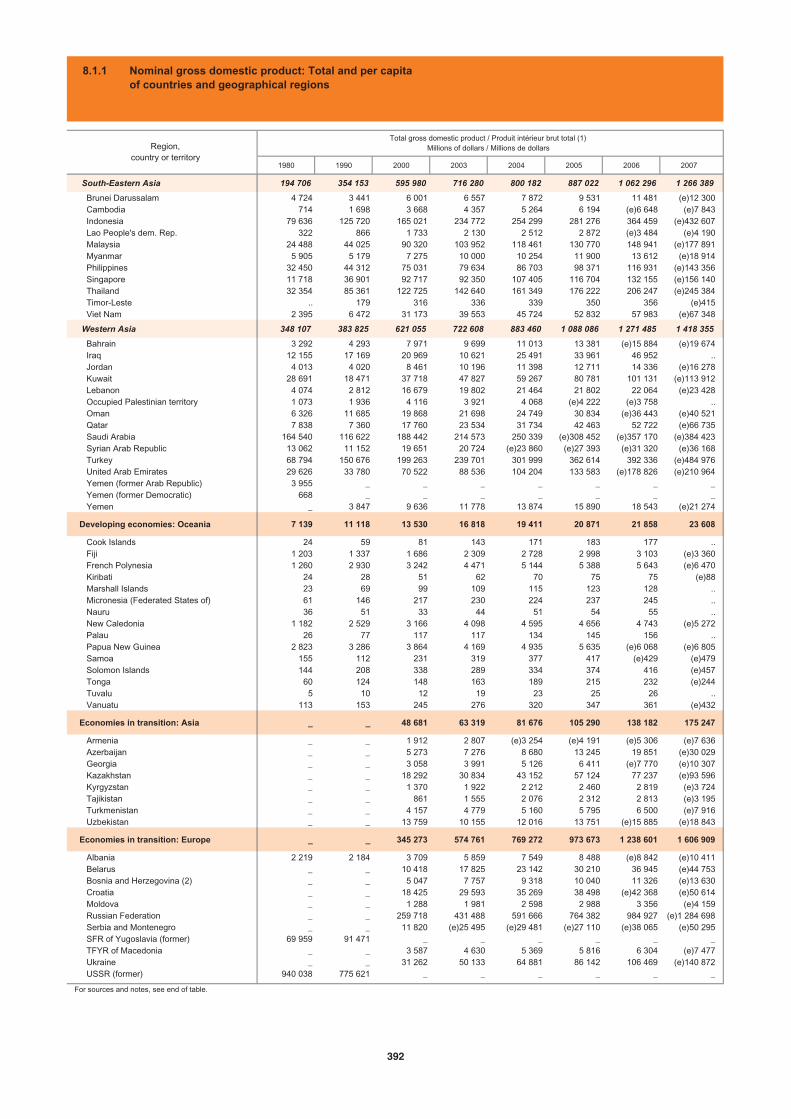
1980 1990 2000 2003 2004 2005 2006 2007
South-Eastern Asia 194 706 354 153 595 980 716 280 800 182 887 022 1 062 296 1 266 389
Brunei Darussalam 4 724 3 441 6 001 6 557 7 872 9 531 11 481 (e)12 300 Cambodia 714 1 698 3 668 4 357 5 264 6 194 (e)6 648 (e)7 843 Indonesia 79 636 125 720 165 021 234 772 254 299 281 276 364 459 (e)432 607 Lao People's dem. Rep. 322 866 1 733 2 130 2 512 2 872 (e)3 484 (e)4 190 Malaysia 24 488 44 025 90 320 103 952 118 461 130 770 148 941 (e)177 891 Myanmar 5 905 5 179 7 275 10 000 10 254 11 900 13 612 (e)18 914 Philippines 32 450 44 312 75 031 79 634 86 703 98 371 116 931 (e)143 356 Singapore 11 718 36 901 92 717 92 350 107 405 116 704 132 155 (e)156 140 Thailand 32 354 85 361 122 725 142 640 161 349 176 222 206 247 (e)245 384 Timor-Leste .. 179 316 336 339 350 356 (e)415 Viet Nam 2 395 6 472 31 173 39 553 45 724 52 832 57 983 (e)67 348
Western Asia 348 107 383 825 621 055 722 608 883 460 1 088 086 1 271 485 1 418 355
Bahrain 3 292 4 293 7 971 9 699 11 013 13 381 (e)15 884 (e)19 674 Iraq 12 155 17 169 20 969 10 621 25 491 33 961 46 952 .. Jordan 4 013 4 020 8 461 10 196 11 398 12 711 14 336 (e)16 278 Kuwait 28 691 18 471 37 718 47 827 59 267 80 781 101 131 (e)113 912 Lebanon 4 074 2 812 16 679 19 802 21 464 21 802 22 064 (e)23 428 Occupied Palestinian territory 1 073 1 936 4 116 3 921 4 068 (e)4 222 (e)3 758 .. Oman 6 326 11 685 19 868 21 698 24 749 30 834 (e)36 443 (e)40 521 Qatar 7 838 7 360 17 760 23 534 31 734 42 463 52 722 (e)66 735 Saudi Arabia 164 540 116 622 188 442 214 573 250 339 (e)308 452 (e)357 170 (e)384 423 Syrian Arab Republic 13 062 11 152 19 651 20 724 (e)23 860 (e)27 393 (e)31 320 (e)36 168 Turkey 68 794 150 676 199 263 239 701 301 999 362 614 392 336 (e)484 976 United Arab Emirates 29 626 33 780 70 522 88 536 104 204 133 583 (e)178 826 (e)210 964 Yemen (former Arab Republic) 3 955 _ _ _ _ _ _ _ Yemen (former Democratic) 668 _ _ _ _ _ _ _ Yemen _ 3 847 9 636 11 778 13 874 15 890 18 543 (e)21 274
Developing economies: Oceania 7 139 11 118 13 530 16 818 19 411 20 871 21 858 23 608
Cook Islands 24 59 81 143 171 183 177 .. Fiji 1 203 1 337 1 686 2 309 2 728 2 998 3 103 (e)3 360 French Polynesia 1 260 2 930 3 242 4 471 5 144 5 388 5 643 (e)6 470 Kiribati 24 28 51 62 70 75 75 (e)88 Marshall Islands 23 69 99 109 115 123 128 .. Micronesia (Federated States of) 61 146 217 230 224 237 245 .. Nauru 36 51 33 44 51 54 55 .. New Caledonia 1 182 2 529 3 166 4 098 4 595 4 656 4 743 (e)5 272 Palau 26 77 117 117 134 145 156 .. Papua New Guinea 2 823 3 286 3 864 4 169 4 935 5 635 (e)6 068 (e)6 805 Samoa 155 112 231 319 377 417 (e)429 (e)479 Solomon Islands 144 208 338 289 334 374 416 (e)457 Tonga 60 124 148 163 189 215 232 (e)244 Tuvalu 5 10 12 19 23 25 26 .. Vanuatu 113 153 245 276 320 347 361 (e)432
Economies in transition: Asia _ _ 48 681 63 319 81 676 105 290 138 182 175 247
Armenia _ _ 1 912 2 807 (e)3 254 (e)4 191 (e)5 306 (e)7 636 Azerbaijan _ _ 5 273 7 276 8 680 13 245 19 851 (e)30 029 Georgia _ _ 3 058 3 991 5 126 6 411 (e)7 770 (e)10 307 Kazakhstan _ _ 18 292 30 834 43 152 57 124 77 237 (e)93 596 Kyrgyzstan _ _ 1 370 1 922 2 212 2 460 2 819 (e)3 724 Tajikistan _ _ 861 1 555 2 076 2 312 2 813 (e)3 195 Turkmenistan _ _ 4 157 4 779 5 160 5 795 6 500 (e)7 916 Uzbekistan _ _ 13 759 10 155 12 016 13 751 (e)15 885 (e)18 843
Economies in transition: Europe _ _ 345 273 574 761 769 272 973 673 1 238 601 1 606 909
Albania 2 219 2 184 3 709 5 859 7 549 8 488 (e)8 842 (e)10 411 Belarus _ _ 10 418 17 825 23 142 30 210 36 945 (e)44 753 Bosnia and Herzegovina (2) _ _ 5 047 7 757 9 318 10 040 11 326 (e)13 630 Croatia _ _ 18 425 29 593 35 269 38 498 (e)42 368 (e)50 614 Moldova _ _ 1 288 1 981 2 598 2 988 3 356 (e)4 159 Russian Federation _ _ 259 718 431 488 591 666 764 382 984 927 (e)1 284 698 Serbia and Montenegro _ _ 11 820 (e)25 495 (e)29 481 (e)27 110 (e)38 065 (e)50 295 SFR of Yugoslavia (former) 69 959 91 471 _ _ _ _ _ _ TFYR of Macedonia _ _ 3 587 4 630 5 369 5 816 6 304 (e)7 477 Ukraine _ _ 31 262 50 133 64 881 86 142 106 469 (e)140 872 USSR (former) 940 038 775 621 _ _ _ _ _ _
For sources and notes, see end of table.
Region,country or territory
Total gross domestic product / Produit intérieur brut total (1)Millions of dollars / Millions de dollars
8.1.1 Nominal gross domestic product: Total and per capitaof countries and geographical regions
392
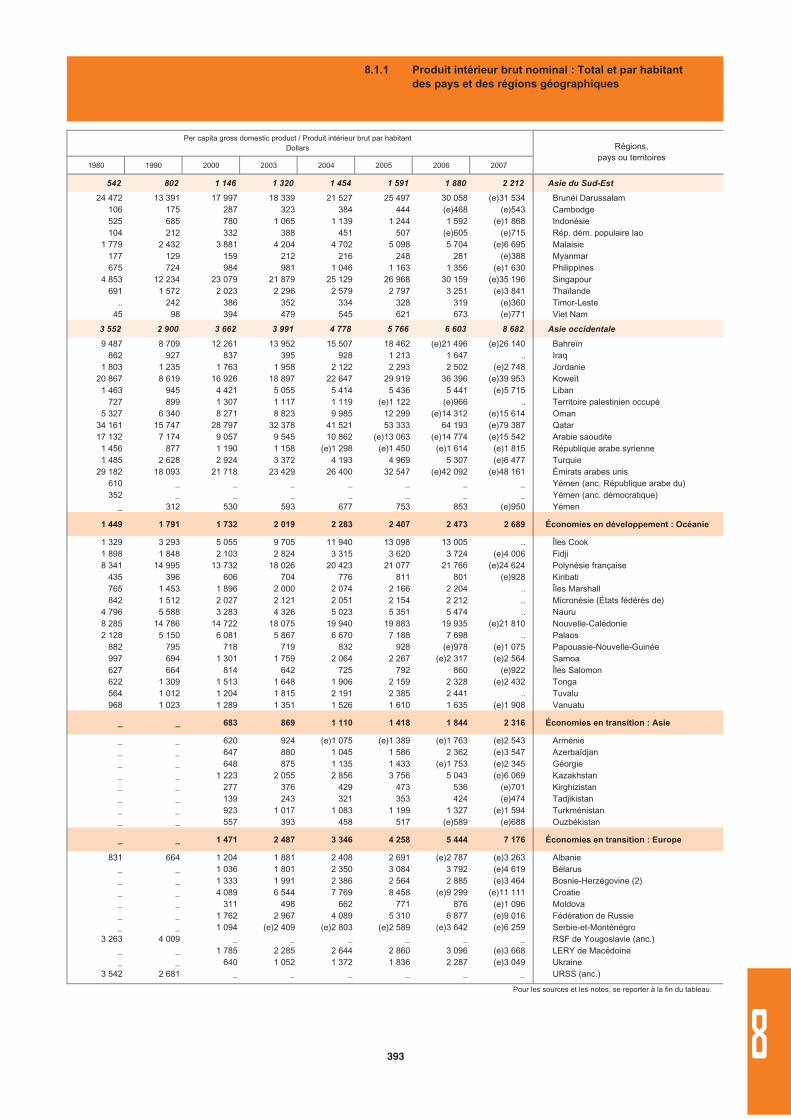
1980 1990 2000 2003 2004 2005 2006 2007
542 802 1 146 1 320 1 454 1 591 1 880 2 212 Asie du Sud-Est
24 472 13 391 17 997 18 339 21 527 25 497 30 058 (e)31 534 Brunéi Darussalam106 175 287 323 384 444 (e)468 (e)543 Cambodge525 685 780 1 065 1 139 1 244 1 592 (e)1 868 Indonésie104 212 332 388 451 507 (e)605 (e)715 Rép. dém. populaire lao
1 779 2 432 3 881 4 204 4 702 5 098 5 704 (e)6 695 Malaisie177 129 159 212 216 248 281 (e)388 Myanmar675 724 984 981 1 046 1 163 1 356 (e)1 630 Philippines
4 853 12 234 23 079 21 879 25 129 26 968 30 159 (e)35 196 Singapour691 1 572 2 023 2 296 2 579 2 797 3 251 (e)3 841 Thaïlande
.. 242 386 352 334 328 319 (e)360 Timor-Leste45 98 394 479 545 621 673 (e)771 Viet Nam
3 552 2 900 3 662 3 991 4 778 5 766 6 603 8 682 Asie occidentale
9 487 8 709 12 261 13 952 15 507 18 462 (e)21 496 (e)26 140 Bahreïn862 927 837 395 928 1 213 1 647 .. Iraq
1 803 1 235 1 763 1 958 2 122 2 293 2 502 (e)2 748 Jordanie20 867 8 619 16 926 18 897 22 647 29 919 36 396 (e)39 953 Koweït
1 463 945 4 421 5 055 5 414 5 436 5 441 (e)5 715 Liban727 899 1 307 1 117 1 119 (e)1 122 (e)966 .. Territoire palestinien occupé
5 327 6 340 8 271 8 823 9 985 12 299 (e)14 312 (e)15 614 Oman34 161 15 747 28 797 32 378 41 521 53 333 64 193 (e)79 387 Qatar17 132 7 174 9 057 9 545 10 862 (e)13 063 (e)14 774 (e)15 542 Arabie saoudite
1 456 877 1 190 1 158 (e)1 298 (e)1 450 (e)1 614 (e)1 815 République arabe syrienne1 485 2 628 2 924 3 372 4 193 4 969 5 307 (e)6 477 Turquie
29 182 18 093 21 718 23 429 26 400 32 547 (e)42 092 (e)48 161 Émirats arabes unis610 _ _ _ _ _ _ _ Yémen (anc. République arabe du)352 _ _ _ _ _ _ _ Yémen (anc. démocratique)
_ 312 530 593 677 753 853 (e)950 Yémen
1 449 1 791 1 732 2 019 2 283 2 407 2 473 2 689 Économies en développement : Océanie
1 329 3 293 5 055 9 705 11 940 13 098 13 005 .. Îles Cook1 898 1 848 2 103 2 824 3 315 3 620 3 724 (e)4 006 Fidji8 341 14 995 13 732 18 026 20 423 21 077 21 766 (e)24 624 Polynésie française
435 396 606 704 776 811 801 (e)928 Kiribati765 1 453 1 896 2 000 2 074 2 166 2 204 .. Îles Marshall842 1 512 2 027 2 121 2 051 2 154 2 212 .. Micronésie (États fédérés de)
4 796 5 588 3 283 4 326 5 023 5 351 5 474 .. Nauru8 285 14 786 14 722 18 075 19 940 19 883 19 935 (e)21 810 Nouvelle-Calédonie2 128 5 150 6 081 5 867 6 670 7 188 7 698 .. Palaos
882 795 718 719 832 928 (e)978 (e)1 075 Papouasie-Nouvelle-Guinée997 694 1 301 1 759 2 064 2 267 (e)2 317 (e)2 564 Samoa627 664 814 642 725 792 860 (e)922 Îles Salomon622 1 309 1 513 1 648 1 906 2 159 2 328 (e)2 432 Tonga564 1 012 1 204 1 815 2 191 2 385 2 441 .. Tuvalu968 1 023 1 289 1 351 1 526 1 610 1 635 (e)1 908 Vanuatu
_ _ 683 869 1 110 1 418 1 844 2 316 Économies en transition : Asie
_ _ 620 924 (e)1 075 (e)1 389 (e)1 763 (e)2 543 Arménie_ _ 647 880 1 045 1 586 2 362 (e)3 547 Azerbaïdjan_ _ 648 875 1 135 1 433 (e)1 753 (e)2 345 Géorgie_ _ 1 223 2 055 2 856 3 756 5 043 (e)6 069 Kazakhstan_ _ 277 376 429 473 536 (e)701 Kirghizistan_ _ 139 243 321 353 424 (e)474 Tadjikistan_ _ 923 1 017 1 083 1 199 1 327 (e)1 594 Turkménistan_ _ 557 393 458 517 (e)589 (e)688 Ouzbékistan
_ _ 1 471 2 487 3 346 4 258 5 444 7 176 Économies en transition : Europe
831 664 1 204 1 881 2 408 2 691 (e)2 787 (e)3 263 Albanie_ _ 1 036 1 801 2 350 3 084 3 792 (e)4 619 Bélarus_ _ 1 333 1 991 2 386 2 564 2 885 (e)3 464 Bosnie-Herzégovine (2)_ _ 4 089 6 544 7 769 8 458 (e)9 299 (e)11 111 Croatie_ _ 311 498 662 771 876 (e)1 096 Moldova_ _ 1 762 2 967 4 089 5 310 6 877 (e)9 016 Fédération de Russie_ _ 1 094 (e)2 409 (e)2 803 (e)2 589 (e)3 642 (e)6 259 Serbie-et-Monténégro
3 263 4 009 _ _ _ _ _ _ RSF de Yougoslavie (anc.)_ _ 1 785 2 285 2 644 2 860 3 096 (e)3 668 LERY de Macédoine_ _ 640 1 052 1 372 1 836 2 287 (e)3 049 Ukraine
3 542 2 681 _ _ _ _ _ _ URSS (anc.)
Pour les sources et les notes, se reporter à la fin du tableau.
Per capita gross domestic product / Produit intérieur brut par habitantDollars Régions,
pays ou territoires
8.1.1 Produit intérieur brut nominal : Total et par habitant des pays et des régions géographiques
393 8
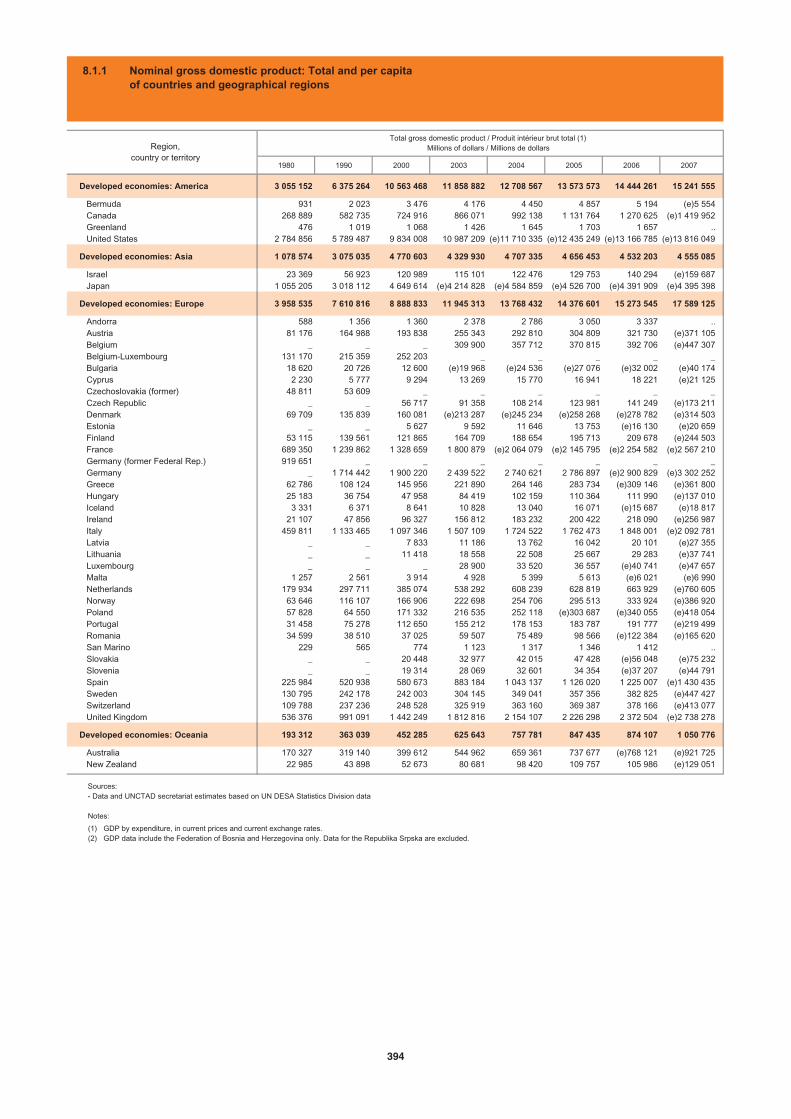
1980 1990 2000 2003 2004 2005 2006 2007
Developed economies: America 3 055 152 6 375 264 10 563 468 11 858 882 12 708 567 13 573 573 14 444 261 15 241 555
Bermuda 931 2 023 3 476 4 176 4 450 4 857 5 194 (e)5 554 Canada 268 889 582 735 724 916 866 071 992 138 1 131 764 1 270 625 (e)1 419 952 Greenland 476 1 019 1 068 1 426 1 645 1 703 1 657 .. United States 2 784 856 5 789 487 9 834 008 10 987 209 (e)11 710 335 (e)12 435 249 (e)13 166 785 (e)13 816 049
Developed economies: Asia 1 078 574 3 075 035 4 770 603 4 329 930 4 707 335 4 656 453 4 532 203 4 555 085
Israel 23 369 56 923 120 989 115 101 122 476 129 753 140 294 (e)159 687 Japan 1 055 205 3 018 112 4 649 614 (e)4 214 828 (e)4 584 859 (e)4 526 700 (e)4 391 909 (e)4 395 398
Developed economies: Europe 3 958 535 7 610 816 8 888 833 11 945 313 13 768 432 14 376 601 15 273 545 17 589 125
Andorra 588 1 356 1 360 2 378 2 786 3 050 3 337 .. Austria 81 176 164 988 193 838 255 343 292 810 304 809 321 730 (e)371 105 Belgium _ _ _ 309 900 357 712 370 815 392 706 (e)447 307 Belgium-Luxembourg 131 170 215 359 252 203 _ _ _ _ _ Bulgaria 18 620 20 726 12 600 (e)19 968 (e)24 536 (e)27 076 (e)32 002 (e)40 174 Cyprus 2 230 5 777 9 294 13 269 15 770 16 941 18 221 (e)21 125 Czechoslovakia (former) 48 811 53 609 _ _ _ _ _ _ Czech Republic _ _ 56 717 91 358 108 214 123 981 141 249 (e)173 211 Denmark 69 709 135 839 160 081 (e)213 287 (e)245 234 (e)258 268 (e)278 782 (e)314 503 Estonia _ _ 5 627 9 592 11 646 13 753 (e)16 130 (e)20 659 Finland 53 115 139 561 121 865 164 709 188 654 195 713 209 678 (e)244 503 France 689 350 1 239 862 1 328 659 1 800 879 (e)2 064 079 (e)2 145 795 (e)2 254 582 (e)2 567 210 Germany (former Federal Rep.) 919 651 _ _ _ _ _ _ _ Germany _ 1 714 442 1 900 220 2 439 522 2 740 621 2 786 897 (e)2 900 829 (e)3 302 252 Greece 62 786 108 124 145 956 221 890 264 146 283 734 (e)309 146 (e)361 800 Hungary 25 183 36 754 47 958 84 419 102 159 110 364 111 990 (e)137 010 Iceland 3 331 6 371 8 641 10 828 13 040 16 071 (e)15 687 (e)18 817 Ireland 21 107 47 856 96 327 156 812 183 232 200 422 218 090 (e)256 987 Italy 459 811 1 133 465 1 097 346 1 507 109 1 724 522 1 762 473 1 848 001 (e)2 092 781 Latvia _ _ 7 833 11 186 13 762 16 042 20 101 (e)27 355 Lithuania _ _ 11 418 18 558 22 508 25 667 29 283 (e)37 741 Luxembourg _ _ _ 28 900 33 520 36 557 (e)40 741 (e)47 657 Malta 1 257 2 561 3 914 4 928 5 399 5 613 (e)6 021 (e)6 990 Netherlands 179 934 297 711 385 074 538 292 608 239 628 819 663 929 (e)760 605 Norway 63 646 116 107 166 906 222 698 254 706 295 513 333 924 (e)386 920 Poland 57 828 64 550 171 332 216 535 252 118 (e)303 687 (e)340 055 (e)418 054 Portugal 31 458 75 278 112 650 155 212 178 153 183 787 191 777 (e)219 499 Romania 34 599 38 510 37 025 59 507 75 489 98 566 (e)122 384 (e)165 620 San Marino 229 565 774 1 123 1 317 1 346 1 412 .. Slovakia _ _ 20 448 32 977 42 015 47 428 (e)56 048 (e)75 232 Slovenia _ _ 19 314 28 069 32 601 34 354 (e)37 207 (e)44 791 Spain 225 984 520 938 580 673 883 184 1 043 137 1 126 020 1 225 007 (e)1 430 435 Sweden 130 795 242 178 242 003 304 145 349 041 357 356 382 825 (e)447 427 Switzerland 109 788 237 236 248 528 325 919 363 160 369 387 378 166 (e)413 077 United Kingdom 536 376 991 091 1 442 249 1 812 816 2 154 107 2 226 298 2 372 504 (e)2 738 278
Developed economies: Oceania 193 312 363 039 452 285 625 643 757 781 847 435 874 107 1 050 776
Australia 170 327 319 140 399 612 544 962 659 361 737 677 (e)768 121 (e)921 725 New Zealand 22 985 43 898 52 673 80 681 98 420 109 757 105 986 (e)129 051
Region,country or territory
Total gross domestic product / Produit intérieur brut total (1)Millions of dollars / Millions de dollars
8.1.1 Nominal gross domestic product: Total and per capitaof countries and geographical regions
(1)(2)
GDP by expenditure, in current prices and current exchange rates.GDP data include the Federation of Bosnia and Herzegovina only. Data for the Republika Srpska are excluded.
Sources:- Data and UNCTAD secretariat estimates based on UN DESA Statistics Division data
Notes:
394
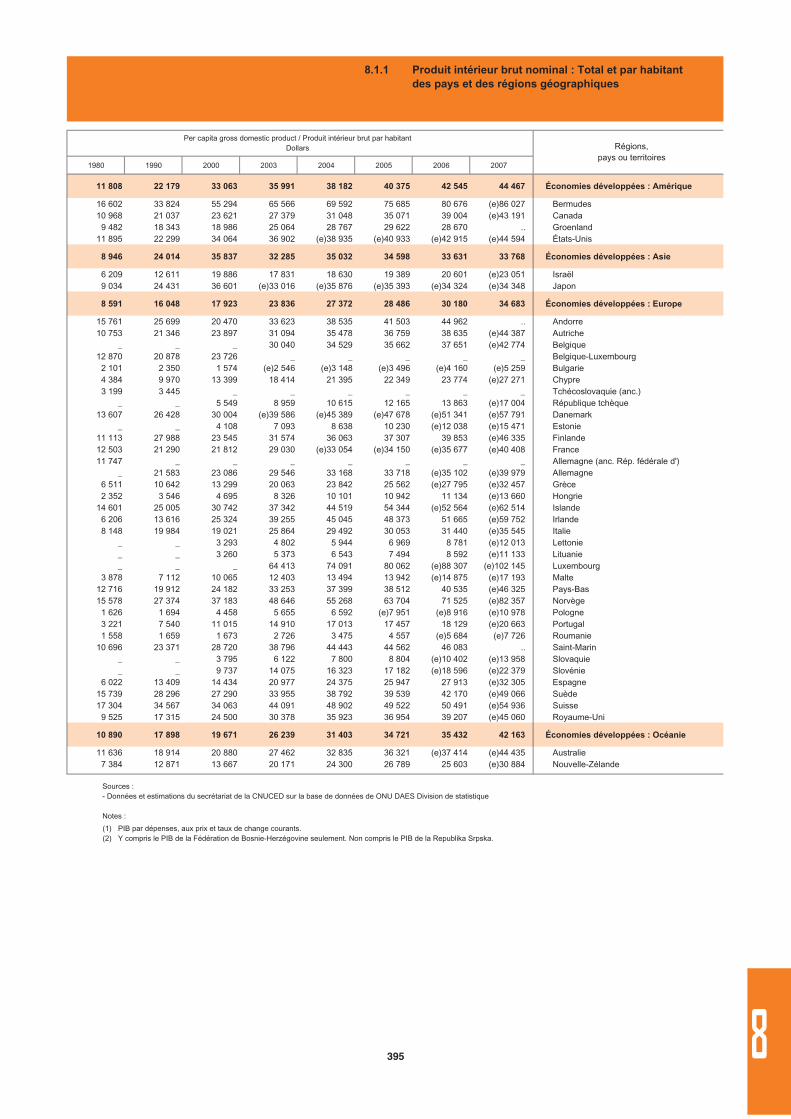
1980 1990 2000 2003 2004 2005 2006 2007
11 808 22 179 33 063 35 991 38 182 40 375 42 545 44 467 Économies développées : Amérique
16 602 33 824 55 294 65 566 69 592 75 685 80 676 (e)86 027 Bermudes10 968 21 037 23 621 27 379 31 048 35 071 39 004 (e)43 191 Canada
9 482 18 343 18 986 25 064 28 767 29 622 28 670 .. Groenland11 895 22 299 34 064 36 902 (e)38 935 (e)40 933 (e)42 915 (e)44 594 États-Unis
8 946 24 014 35 837 32 285 35 032 34 598 33 631 33 768 Économies développées : Asie
6 209 12 611 19 886 17 831 18 630 19 389 20 601 (e)23 051 Israël9 034 24 431 36 601 (e)33 016 (e)35 876 (e)35 393 (e)34 324 (e)34 348 Japon
8 591 16 048 17 923 23 836 27 372 28 486 30 180 34 683 Économies développées : Europe
15 761 25 699 20 470 33 623 38 535 41 503 44 962 .. Andorre10 753 21 346 23 897 31 094 35 478 36 759 38 635 (e)44 387 Autriche
_ _ _ 30 040 34 529 35 662 37 651 (e)42 774 Belgique12 870 20 878 23 726 _ _ _ _ _ Belgique-Luxembourg
2 101 2 350 1 574 (e)2 546 (e)3 148 (e)3 496 (e)4 160 (e)5 259 Bulgarie4 384 9 970 13 399 18 414 21 395 22 349 23 774 (e)27 271 Chypre3 199 3 445 _ _ _ _ _ _ Tchécoslovaquie (anc.)
_ _ 5 549 8 959 10 615 12 165 13 863 (e)17 004 République tchèque13 607 26 428 30 004 (e)39 586 (e)45 389 (e)47 678 (e)51 341 (e)57 791 Danemark
_ _ 4 108 7 093 8 638 10 230 (e)12 038 (e)15 471 Estonie11 113 27 988 23 545 31 574 36 063 37 307 39 853 (e)46 335 Finlande12 503 21 290 21 812 29 030 (e)33 054 (e)34 150 (e)35 677 (e)40 408 France11 747 _ _ _ _ _ _ _ Allemagne (anc. Rép. fédérale d')
_ 21 583 23 086 29 546 33 168 33 718 (e)35 102 (e)39 979 Allemagne6 511 10 642 13 299 20 063 23 842 25 562 (e)27 795 (e)32 457 Grèce2 352 3 546 4 695 8 326 10 101 10 942 11 134 (e)13 660 Hongrie
14 601 25 005 30 742 37 342 44 519 54 344 (e)52 564 (e)62 514 Islande6 206 13 616 25 324 39 255 45 045 48 373 51 665 (e)59 752 Irlande8 148 19 984 19 021 25 864 29 492 30 053 31 440 (e)35 545 Italie
_ _ 3 293 4 802 5 944 6 969 8 781 (e)12 013 Lettonie_ _ 3 260 5 373 6 543 7 494 8 592 (e)11 133 Lituanie_ _ _ 64 413 74 091 80 062 (e)88 307 (e)102 145 Luxembourg
3 878 7 112 10 065 12 403 13 494 13 942 (e)14 875 (e)17 193 Malte12 716 19 912 24 182 33 253 37 399 38 512 40 535 (e)46 325 Pays-Bas15 578 27 374 37 183 48 646 55 268 63 704 71 525 (e)82 357 Norvège
1 626 1 694 4 458 5 655 6 592 (e)7 951 (e)8 916 (e)10 978 Pologne3 221 7 540 11 015 14 910 17 013 17 457 18 129 (e)20 663 Portugal1 558 1 659 1 673 2 726 3 475 4 557 (e)5 684 (e)7 726 Roumanie
10 696 23 371 28 720 38 796 44 443 44 562 46 083 .. Saint-Marin_ _ 3 795 6 122 7 800 8 804 (e)10 402 (e)13 958 Slovaquie_ _ 9 737 14 075 16 323 17 182 (e)18 596 (e)22 379 Slovénie
6 022 13 409 14 434 20 977 24 375 25 947 27 913 (e)32 305 Espagne15 739 28 296 27 290 33 955 38 792 39 539 42 170 (e)49 066 Suède17 304 34 567 34 063 44 091 48 902 49 522 50 491 (e)54 936 Suisse
9 525 17 315 24 500 30 378 35 923 36 954 39 207 (e)45 060 Royaume-Uni
10 890 17 898 19 671 26 239 31 403 34 721 35 432 42 163 Économies développées : Océanie
11 636 18 914 20 880 27 462 32 835 36 321 (e)37 414 (e)44 435 Australie7 384 12 871 13 667 20 171 24 300 26 789 25 603 (e)30 884 Nouvelle-Zélande
Per capita gross domestic product / Produit intérieur brut par habitantDollars Régions,
pays ou territoires
8.1.1 Produit intérieur brut nominal : Total et par habitant des pays et des régions géographiques
(1)(2)
PIB par dépenses, aux prix et taux de change courants.Y compris le PIB de la Fédération de Bosnie-Herzégovine seulement. Non compris le PIB de la Republika Srpska.
Sources : - Données et estimations du secrétariat de la CNUCED sur la base de données de ONU DAES Division de statistique
Notes :
395 8
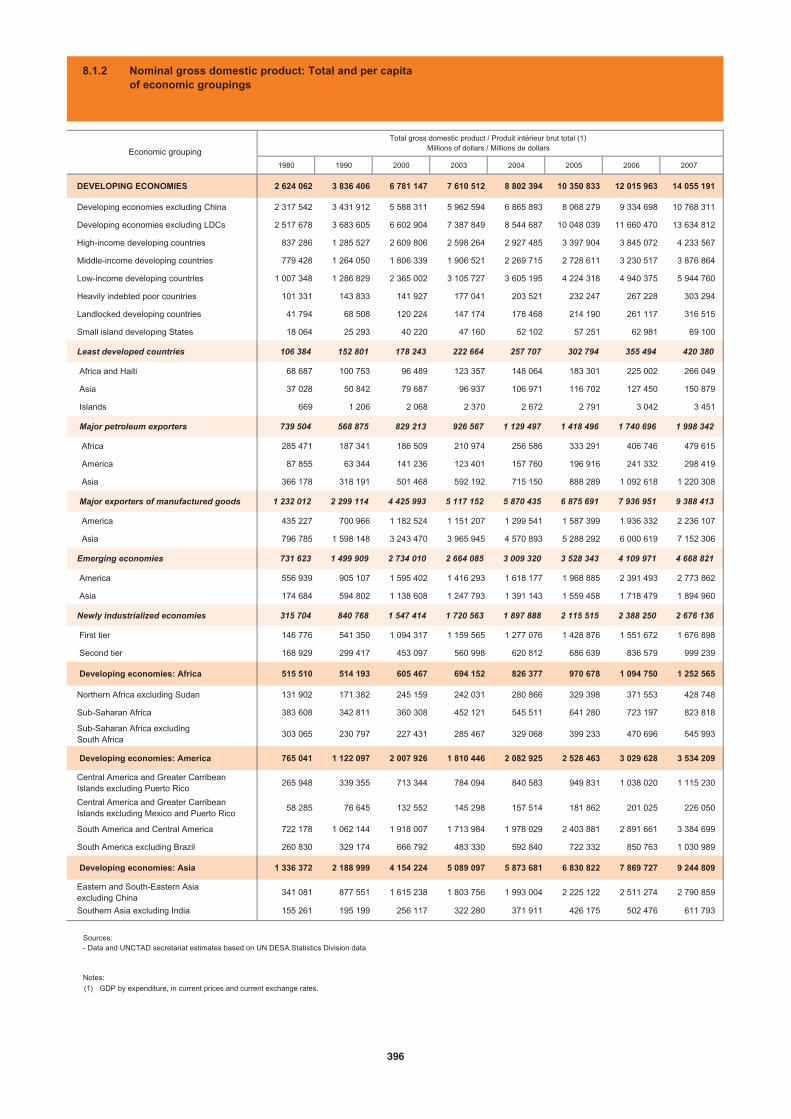
1980 1990 2000 2003 2004 2005 2006 2007
DEVELOPING ECONOMIES 2 624 062 3 836 406 6 781 147 7 610 512 8 802 394 10 350 833 12 015 963 14 055 191
Developing economies excluding China 2 317 542 3 431 912 5 588 311 5 962 594 6 865 893 8 068 279 9 334 698 10 768 311
Developing economies excluding LDCs 2 517 678 3 683 605 6 602 904 7 387 849 8 544 687 10 048 039 11 660 470 13 634 812
High-income developing countries 837 286 1 285 527 2 609 806 2 598 264 2 927 485 3 397 904 3 845 072 4 233 567
Middle-income developing countries 779 428 1 264 050 1 806 339 1 906 521 2 269 715 2 728 611 3 230 517 3 876 864
Low-income developing countries 1 007 348 1 286 829 2 365 002 3 105 727 3 605 195 4 224 318 4 940 375 5 944 760
Heavily indebted poor countries 101 331 143 833 141 927 177 041 203 521 232 247 267 228 303 294
Landlocked developing countries 41 794 68 508 120 224 147 174 178 468 214 190 261 117 316 515
Small island developing States 18 064 25 293 40 220 47 160 52 102 57 251 62 981 69 100
Least developed countries 106 384 152 801 178 243 222 664 257 707 302 794 355 494 420 380
Africa and Haiti 68 687 100 753 96 489 123 357 148 064 183 301 225 002 266 049
Asia 37 028 50 842 79 687 96 937 106 971 116 702 127 450 150 879
Islands 669 1 206 2 068 2 370 2 672 2 791 3 042 3 451
Major petroleum exporters 739 504 568 875 829 213 926 567 1 129 497 1 418 496 1 740 696 1 998 342
Africa 285 471 187 341 186 509 210 974 256 586 333 291 406 746 479 615
America 87 855 63 344 141 236 123 401 157 760 196 916 241 332 298 419
Asia 366 178 318 191 501 468 592 192 715 150 888 289 1 092 618 1 220 308
Major exporters of manufactured goods 1 232 012 2 299 114 4 425 993 5 117 152 5 870 435 6 875 691 7 936 951 9 388 413
America 435 227 700 966 1 182 524 1 151 207 1 299 541 1 587 399 1 936 332 2 236 107
Asia 796 785 1 598 148 3 243 470 3 965 945 4 570 893 5 288 292 6 000 619 7 152 306
Emerging economies 731 623 1 499 909 2 734 010 2 664 085 3 009 320 3 528 343 4 109 971 4 668 821
America 556 939 905 107 1 595 402 1 416 293 1 618 177 1 968 885 2 391 493 2 773 862
Asia 174 684 594 802 1 138 608 1 247 793 1 391 143 1 559 458 1 718 479 1 894 960
Newly industrialized economies 315 704 840 768 1 547 414 1 720 563 1 897 888 2 115 515 2 388 250 2 676 136
First tier 146 776 541 350 1 094 317 1 159 565 1 277 076 1 428 876 1 551 672 1 676 898
Second tier 168 929 299 417 453 097 560 998 620 812 686 639 836 579 999 239
Developing economies: Africa 515 510 514 193 605 467 694 152 826 377 970 678 1 094 750 1 252 565
Northern Africa excluding Sudan 131 902 171 382 245 159 242 031 280 866 329 398 371 553 428 748
Sub-Saharan Africa 383 608 342 811 360 308 452 121 545 511 641 280 723 197 823 818
Sub-Saharan Africa excluding South Africa
303 065 230 797 227 431 285 467 329 068 399 233 470 696 545 993
Developing economies: America 765 041 1 122 097 2 007 926 1 810 446 2 082 925 2 528 463 3 029 628 3 534 209
Central America and Greater Carribean Islands excluding Puerto Rico
265 948 339 355 713 344 784 094 840 583 949 831 1 038 020 1 115 230
Central America and Greater Carribean Islands excluding Mexico and Puerto Rico
58 285 76 645 132 552 145 298 157 514 181 862 201 025 226 050
South America and Central America 722 178 1 062 144 1 918 007 1 713 984 1 978 029 2 403 881 2 891 661 3 384 699
South America excluding Brazil 260 830 329 174 666 792 483 330 592 840 722 332 850 763 1 030 989
Developing economies: Asia 1 336 372 2 188 999 4 154 224 5 089 097 5 873 681 6 830 822 7 869 727 9 244 809
Eastern and South-Eastern Asia excluding China
341 081 877 551 1 615 238 1 803 756 1 993 004 2 225 122 2 511 274 2 790 859
Southern Asia excluding India 155 261 195 199 256 117 322 280 371 911 426 175 502 476 611 793
Total gross domestic product / Produit intérieur brut total (1)Millions of dollars / Millions de dollarsEconomic grouping
8.1.2 Nominal gross domestic product: Total and per capita of economic groupings
(1) GDP by expenditure, in current prices and current exchange rates.
Sources:- Data and UNCTAD secretariat estimates based on UN DESA Statistics Division data
Notes:
396
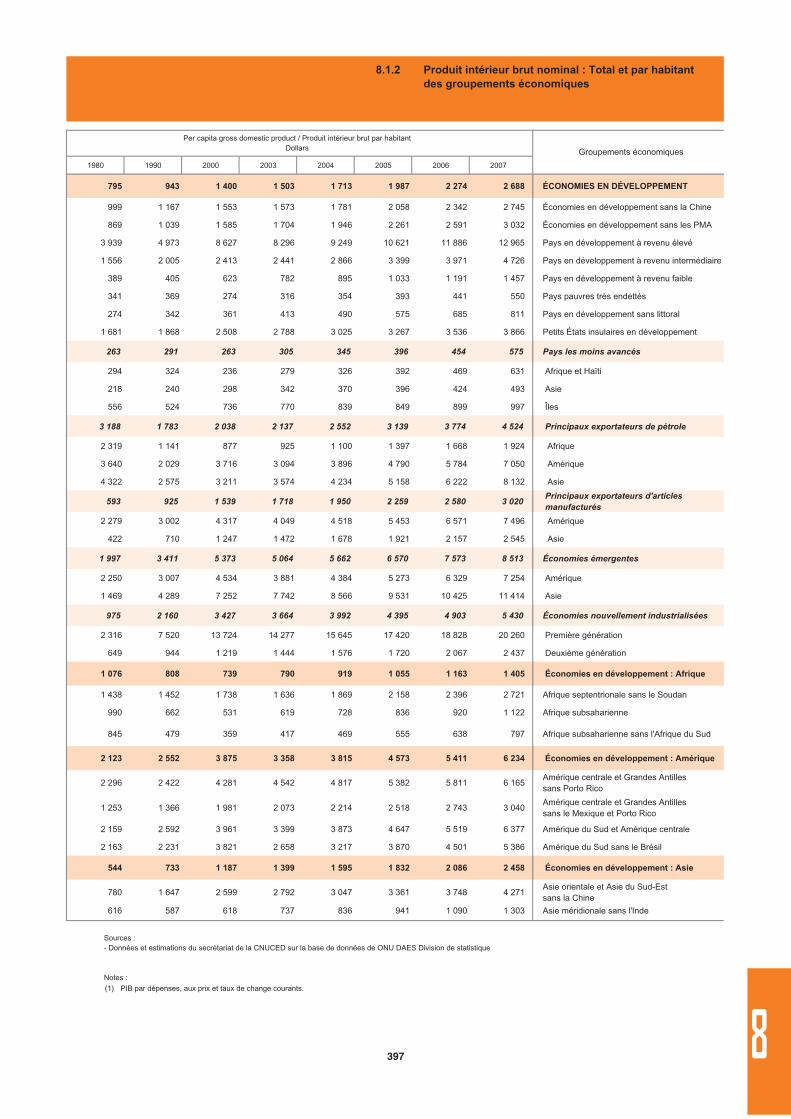
1980 1990 2000 2003 2004 2005 2006 2007
795 943 1 400 1 503 1 713 1 987 2 274 2 688 ÉCONOMIES EN DÉVELOPPEMENT
999 1 167 1 553 1 573 1 781 2 058 2 342 2 745 Économies en développement sans la Chine
869 1 039 1 585 1 704 1 946 2 261 2 591 3 032 Économies en développement sans les PMA
3 939 4 973 8 627 8 296 9 249 10 621 11 886 12 965 Pays en développement à revenu élevé
1 556 2 005 2 413 2 441 2 866 3 399 3 971 4 726 Pays en développement à revenu intermédiaire
389 405 623 782 895 1 033 1 191 1 457 Pays en développement à revenu faible
341 369 274 316 354 393 441 550 Pays pauvres très endettés
274 342 361 413 490 575 685 811 Pays en développement sans littoral
1 681 1 868 2 508 2 788 3 025 3 267 3 536 3 866 Petits États insulaires en développement
263 291 263 305 345 396 454 575 Pays les moins avancés
294 324 236 279 326 392 469 631 Afrique et Haïti
218 240 298 342 370 396 424 493 Asie
556 524 736 770 839 849 899 997 Îles
3 188 1 783 2 038 2 137 2 552 3 139 3 774 4 524 Principaux exportateurs de pétrole
2 319 1 141 877 925 1 100 1 397 1 668 1 924 Afrique
3 640 2 029 3 716 3 094 3 896 4 790 5 784 7 050 Amérique
4 322 2 575 3 211 3 574 4 234 5 158 6 222 8 132 Asie
593 925 1 539 1 718 1 950 2 259 2 580 3 020 Principaux exportateurs d'articles manufacturés
2 279 3 002 4 317 4 049 4 518 5 453 6 571 7 496 Amérique
422 710 1 247 1 472 1 678 1 921 2 157 2 545 Asie
1 997 3 411 5 373 5 064 5 662 6 570 7 573 8 513 Économies émergentes
2 250 3 007 4 534 3 881 4 384 5 273 6 329 7 254 Amérique
1 469 4 289 7 252 7 742 8 566 9 531 10 425 11 414 Asie
975 2 160 3 427 3 664 3 992 4 395 4 903 5 430 Économies nouvellement industrialisées
2 316 7 520 13 724 14 277 15 645 17 420 18 828 20 260 Première génération
649 944 1 219 1 444 1 576 1 720 2 067 2 437 Deuxième génération
1 076 808 739 790 919 1 055 1 163 1 405 Économies en développement : Afrique
1 438 1 452 1 738 1 636 1 869 2 158 2 396 2 721 Afrique septentrionale sans le Soudan
990 662 531 619 728 836 920 1 122 Afrique subsaharienne
845 479 359 417 469 555 638 797 Afrique subsaharienne sans l'Afrique du Sud
2 123 2 552 3 875 3 358 3 815 4 573 5 411 6 234 Économies en développement : Amérique
2 296 2 422 4 281 4 542 4 817 5 382 5 811 6 165 Amérique centrale et Grandes Antilles sans Porto Rico
1 253 1 366 1 981 2 073 2 214 2 518 2 743 3 040 Amérique centrale et Grandes Antilles sans le Mexique et Porto Rico
2 159 2 592 3 961 3 399 3 873 4 647 5 519 6 377 Amérique du Sud et Amérique centrale
2 163 2 231 3 821 2 658 3 217 3 870 4 501 5 386 Amérique du Sud sans le Brésil
544 733 1 187 1 399 1 595 1 832 2 086 2 458 Économies en développement : Asie
780 1 647 2 599 2 792 3 047 3 361 3 748 4 271 Asie orientale et Asie du Sud-Est sans la Chine
616 587 618 737 836 941 1 090 1 303 Asie méridionale sans l'Inde
Groupements économiques
Per capita gross domestic product / Produit intérieur brut par habitantDollars
8.1.2 Produit intérieur brut nominal : Total et par habitantdes groupements économiques
(1) PIB par dépenses, aux prix et taux de change courants.
Sources : - Données et estimations du secrétariat de la CNUCED sur la base de données de ONU DAES Division de statistique
Notes :
397 8
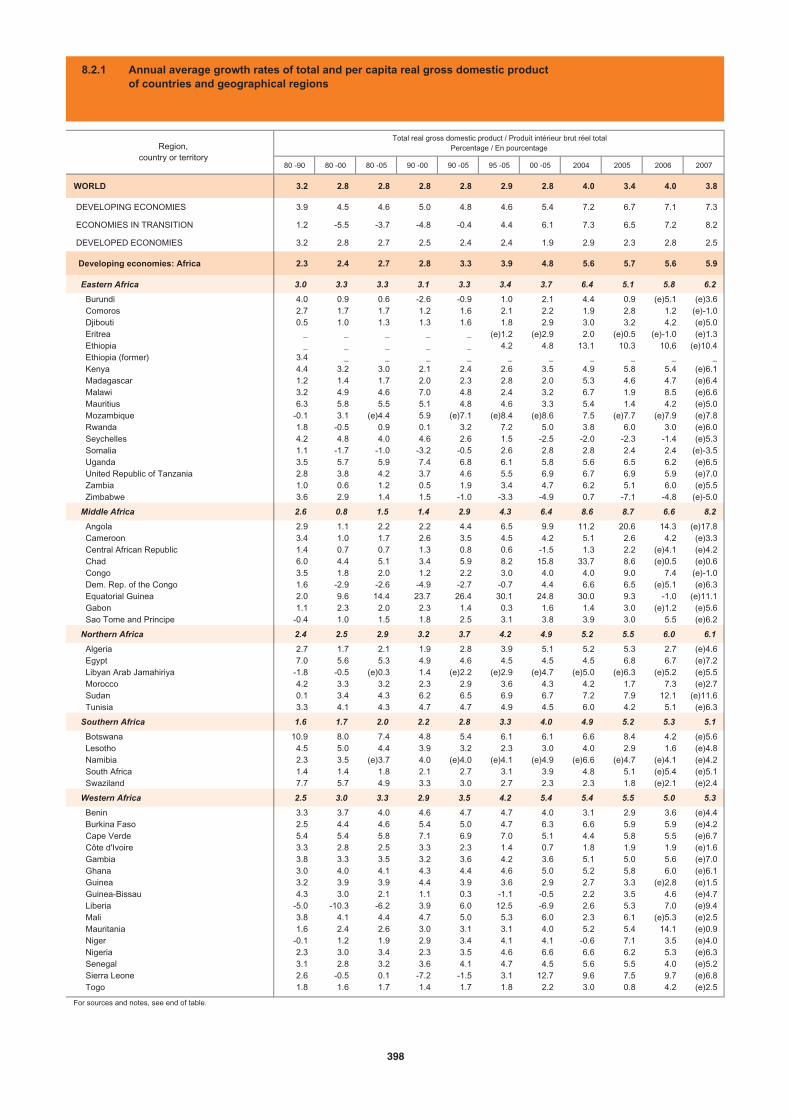
80 -90 80 -00 80 -05 90 -00 90 -05 95 -05 00 -05 2004 2005 2006 2007
WORLD 3.2 2.8 2.8 2.8 2.8 2.9 2.8 4.0 3.4 4.0 3.8
DEVELOPING ECONOMIES 3.9 4.5 4.6 5.0 4.8 4.6 5.4 7.2 6.7 7.1 7.3
ECONOMIES IN TRANSITION 1.2 -5.5 -3.7 -4.8 -0.4 4.4 6.1 7.3 6.5 7.2 8.2
DEVELOPED ECONOMIES 3.2 2.8 2.7 2.5 2.4 2.4 1.9 2.9 2.3 2.8 2.5
Developing economies: Africa 2.3 2.4 2.7 2.8 3.3 3.9 4.8 5.6 5.7 5.6 5.9
Eastern Africa 3.0 3.3 3.3 3.1 3.3 3.4 3.7 6.4 5.1 5.8 6.2
Burundi 4.0 0.9 0.6 -2.6 -0.9 1.0 2.1 4.4 0.9 (e)5.1 (e)3.6 Comoros 2.7 1.7 1.7 1.2 1.6 2.1 2.2 1.9 2.8 1.2 (e)-1.0 Djibouti 0.5 1.0 1.3 1.3 1.6 1.8 2.9 3.0 3.2 4.2 (e)5.0 Eritrea _ _ _ _ _ (e)1.2 (e)2.9 2.0 (e)0.5 (e)-1.0 (e)1.3 Ethiopia _ _ _ _ _ 4.2 4.8 13.1 10.3 10.6 (e)10.4 Ethiopia (former) 3.4 _ _ _ _ _ _ _ _ _ _ Kenya 4.4 3.2 3.0 2.1 2.4 2.6 3.5 4.9 5.8 5.4 (e)6.1 Madagascar 1.2 1.4 1.7 2.0 2.3 2.8 2.0 5.3 4.6 4.7 (e)6.4 Malawi 3.2 4.9 4.6 7.0 4.8 2.4 3.2 6.7 1.9 8.5 (e)6.6 Mauritius 6.3 5.8 5.5 5.1 4.8 4.6 3.3 5.4 1.4 4.2 (e)5.0 Mozambique -0.1 3.1 (e)4.4 5.9 (e)7.1 (e)8.4 (e)8.6 7.5 (e)7.7 (e)7.9 (e)7.8 Rwanda 1.8 -0.5 0.9 0.1 3.2 7.2 5.0 3.8 6.0 3.0 (e)6.0 Seychelles 4.2 4.8 4.0 4.6 2.6 1.5 -2.5 -2.0 -2.3 -1.4 (e)5.3 Somalia 1.1 -1.7 -1.0 -3.2 -0.5 2.6 2.8 2.8 2.4 2.4 (e)-3.5 Uganda 3.5 5.7 5.9 7.4 6.8 6.1 5.8 5.6 6.5 6.2 (e)6.5 United Republic of Tanzania 2.8 3.8 4.2 3.7 4.6 5.5 6.9 6.7 6.9 5.9 (e)7.0 Zambia 1.0 0.6 1.2 0.5 1.9 3.4 4.7 6.2 5.1 6.0 (e)5.5 Zimbabwe 3.6 2.9 1.4 1.5 -1.0 -3.3 -4.9 0.7 -7.1 -4.8 (e)-5.0
Middle Africa 2.6 0.8 1.5 1.4 2.9 4.3 6.4 8.6 8.7 6.6 8.2
Angola 2.9 1.1 2.2 2.2 4.4 6.5 9.9 11.2 20.6 14.3 (e)17.8 Cameroon 3.4 1.0 1.7 2.6 3.5 4.5 4.2 5.1 2.6 4.2 (e)3.3 Central African Republic 1.4 0.7 0.7 1.3 0.8 0.6 -1.5 1.3 2.2 (e)4.1 (e)4.2 Chad 6.0 4.4 5.1 3.4 5.9 8.2 15.8 33.7 8.6 (e)0.5 (e)0.6 Congo 3.5 1.8 2.0 1.2 2.2 3.0 4.0 4.0 9.0 7.4 (e)-1.0 Dem. Rep. of the Congo 1.6 -2.9 -2.6 -4.9 -2.7 -0.7 4.4 6.6 6.5 (e)5.1 (e)6.3 Equatorial Guinea 2.0 9.6 14.4 23.7 26.4 30.1 24.8 30.0 9.3 -1.0 (e)11.1 Gabon 1.1 2.3 2.0 2.3 1.4 0.3 1.6 1.4 3.0 (e)1.2 (e)5.6 Sao Tome and Principe -0.4 1.0 1.5 1.8 2.5 3.1 3.8 3.9 3.0 5.5 (e)6.2
Northern Africa 2.4 2.5 2.9 3.2 3.7 4.2 4.9 5.2 5.5 6.0 6.1
Algeria 2.7 1.7 2.1 1.9 2.8 3.9 5.1 5.2 5.3 2.7 (e)4.6 Egypt 7.0 5.6 5.3 4.9 4.6 4.5 4.5 4.5 6.8 6.7 (e)7.2 Libyan Arab Jamahiriya -1.8 -0.5 (e)0.3 1.4 (e)2.2 (e)2.9 (e)4.7 (e)5.0 (e)6.3 (e)5.2 (e)5.5 Morocco 4.2 3.3 3.2 2.3 2.9 3.6 4.3 4.2 1.7 7.3 (e)2.7 Sudan 0.1 3.4 4.3 6.2 6.5 6.9 6.7 7.2 7.9 12.1 (e)11.6 Tunisia 3.3 4.1 4.3 4.7 4.7 4.9 4.5 6.0 4.2 5.1 (e)6.3
Southern Africa 1.6 1.7 2.0 2.2 2.8 3.3 4.0 4.9 5.2 5.3 5.1
Botswana 10.9 8.0 7.4 4.8 5.4 6.1 6.1 6.6 8.4 4.2 (e)5.6 Lesotho 4.5 5.0 4.4 3.9 3.2 2.3 3.0 4.0 2.9 1.6 (e)4.8 Namibia 2.3 3.5 (e)3.7 4.0 (e)4.0 (e)4.1 (e)4.9 (e)6.6 (e)4.7 (e)4.1 (e)4.2 South Africa 1.4 1.4 1.8 2.1 2.7 3.1 3.9 4.8 5.1 (e)5.4 (e)5.1 Swaziland 7.7 5.7 4.9 3.3 3.0 2.7 2.3 2.3 1.8 (e)2.1 (e)2.4
Western Africa 2.5 3.0 3.3 2.9 3.5 4.2 5.4 5.4 5.5 5.0 5.3
Benin 3.3 3.7 4.0 4.6 4.7 4.7 4.0 3.1 2.9 3.6 (e)4.4 Burkina Faso 2.5 4.4 4.6 5.4 5.0 4.7 6.3 6.6 5.9 5.9 (e)4.2 Cape Verde 5.4 5.4 5.8 7.1 6.9 7.0 5.1 4.4 5.8 5.5 (e)6.7 Côte d'Ivoire 3.3 2.8 2.5 3.3 2.3 1.4 0.7 1.8 1.9 1.9 (e)1.6 Gambia 3.8 3.3 3.5 3.2 3.6 4.2 3.6 5.1 5.0 5.6 (e)7.0 Ghana 3.0 4.0 4.1 4.3 4.4 4.6 5.0 5.2 5.8 6.0 (e)6.1 Guinea 3.2 3.9 3.9 4.4 3.9 3.6 2.9 2.7 3.3 (e)2.8 (e)1.5 Guinea-Bissau 4.3 3.0 2.1 1.1 0.3 -1.1 -0.5 2.2 3.5 4.6 (e)4.7 Liberia -5.0 -10.3 -6.2 3.9 6.0 12.5 -6.9 2.6 5.3 7.0 (e)9.4 Mali 3.8 4.1 4.4 4.7 5.0 5.3 6.0 2.3 6.1 (e)5.3 (e)2.5 Mauritania 1.6 2.4 2.6 3.0 3.1 3.1 4.0 5.2 5.4 14.1 (e)0.9 Niger -0.1 1.2 1.9 2.9 3.4 4.1 4.1 -0.6 7.1 3.5 (e)4.0 Nigeria 2.3 3.0 3.4 2.3 3.5 4.6 6.6 6.6 6.2 5.3 (e)6.3 Senegal 3.1 2.8 3.2 3.6 4.1 4.7 4.5 5.6 5.5 4.0 (e)5.2 Sierra Leone 2.6 -0.5 0.1 -7.2 -1.5 3.1 12.7 9.6 7.5 9.7 (e)6.8 Togo 1.8 1.6 1.7 1.4 1.7 1.8 2.2 3.0 0.8 4.2 (e)2.5
For sources and notes, see end of table.
Total real gross domestic product / Produit intérieur brut réel totalPercentage / En pourcentageRegion,
country or territory
8.2.1 Annual average growth rates of total and per capita real gross domestic productof countries and geographical regions
398
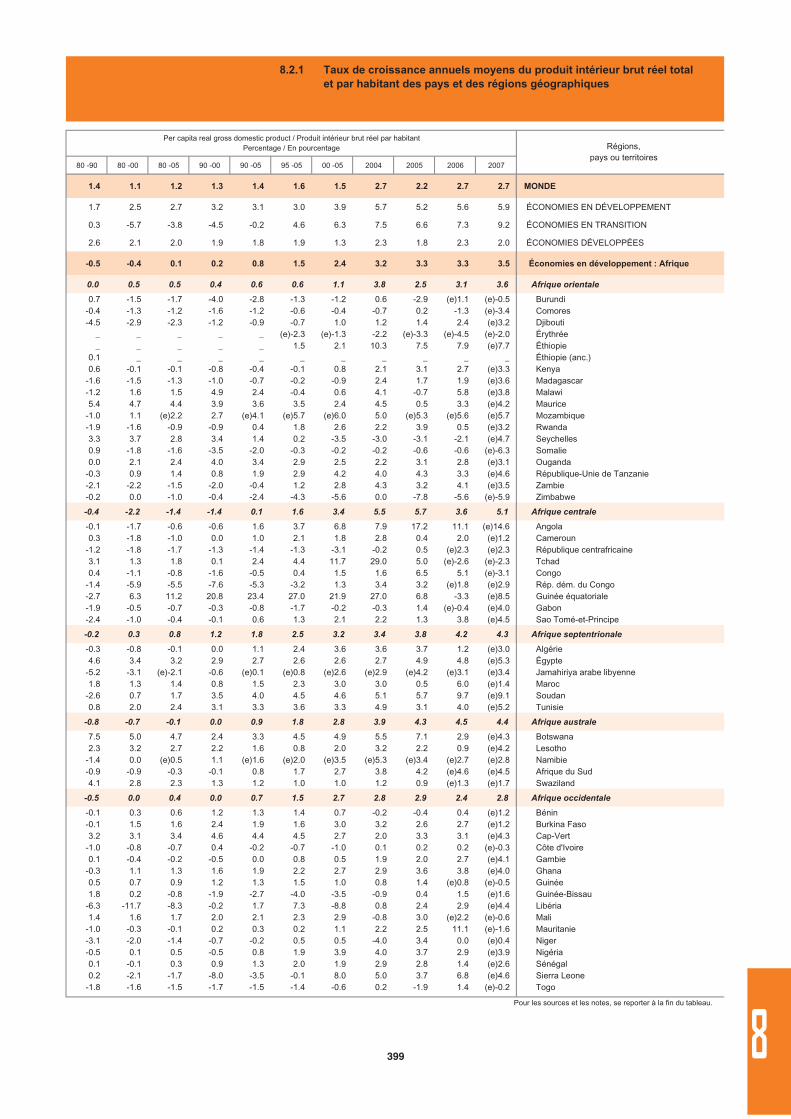
80 -90 80 -00 80 -05 90 -00 90 -05 95 -05 00 -05 2004 2005 2006 2007
1.4 1.1 1.2 1.3 1.4 1.6 1.5 2.7 2.2 2.7 2.7 MONDE
1.7 2.5 2.7 3.2 3.1 3.0 3.9 5.7 5.2 5.6 5.9 ÉCONOMIES EN DÉVELOPPEMENT
0.3 -5.7 -3.8 -4.5 -0.2 4.6 6.3 7.5 6.6 7.3 9.2 ÉCONOMIES EN TRANSITION
2.6 2.1 2.0 1.9 1.8 1.9 1.3 2.3 1.8 2.3 2.0 ÉCONOMIES DÉVELOPPÉES
-0.5 -0.4 0.1 0.2 0.8 1.5 2.4 3.2 3.3 3.3 3.5 Économies en développement : Afrique
0.0 0.5 0.5 0.4 0.6 0.6 1.1 3.8 2.5 3.1 3.6 Afrique orientale
0.7 -1.5 -1.7 -4.0 -2.8 -1.3 -1.2 0.6 -2.9 (e)1.1 (e)-0.5 Burundi-0.4 -1.3 -1.2 -1.6 -1.2 -0.6 -0.4 -0.7 0.2 -1.3 (e)-3.4 Comores-4.5 -2.9 -2.3 -1.2 -0.9 -0.7 1.0 1.2 1.4 2.4 (e)3.2 Djibouti
_ _ _ _ _ (e)-2.3 (e)-1.3 -2.2 (e)-3.3 (e)-4.5 (e)-2.0 Érythrée_ _ _ _ _ 1.5 2.1 10.3 7.5 7.9 (e)7.7 Éthiopie
0.1 _ _ _ _ _ _ _ _ _ _ Éthiopie (anc.)0.6 -0.1 -0.1 -0.8 -0.4 -0.1 0.8 2.1 3.1 2.7 (e)3.3 Kenya
-1.6 -1.5 -1.3 -1.0 -0.7 -0.2 -0.9 2.4 1.7 1.9 (e)3.6 Madagascar-1.2 1.6 1.5 4.9 2.4 -0.4 0.6 4.1 -0.7 5.8 (e)3.8 Malawi5.4 4.7 4.4 3.9 3.6 3.5 2.4 4.5 0.5 3.3 (e)4.2 Maurice
-1.0 1.1 (e)2.2 2.7 (e)4.1 (e)5.7 (e)6.0 5.0 (e)5.3 (e)5.6 (e)5.7 Mozambique-1.9 -1.6 -0.9 -0.9 0.4 1.8 2.6 2.2 3.9 0.5 (e)3.2 Rwanda3.3 3.7 2.8 3.4 1.4 0.2 -3.5 -3.0 -3.1 -2.1 (e)4.7 Seychelles0.9 -1.8 -1.6 -3.5 -2.0 -0.3 -0.2 -0.2 -0.6 -0.6 (e)-6.3 Somalie0.0 2.1 2.4 4.0 3.4 2.9 2.5 2.2 3.1 2.8 (e)3.1 Ouganda
-0.3 0.9 1.4 0.8 1.9 2.9 4.2 4.0 4.3 3.3 (e)4.6 République-Unie de Tanzanie-2.1 -2.2 -1.5 -2.0 -0.4 1.2 2.8 4.3 3.2 4.1 (e)3.5 Zambie-0.2 0.0 -1.0 -0.4 -2.4 -4.3 -5.6 0.0 -7.8 -5.6 (e)-5.9 Zimbabwe
-0.4 -2.2 -1.4 -1.4 0.1 1.6 3.4 5.5 5.7 3.6 5.1 Afrique centrale
-0.1 -1.7 -0.6 -0.6 1.6 3.7 6.8 7.9 17.2 11.1 (e)14.6 Angola0.3 -1.8 -1.0 0.0 1.0 2.1 1.8 2.8 0.4 2.0 (e)1.2 Cameroun
-1.2 -1.8 -1.7 -1.3 -1.4 -1.3 -3.1 -0.2 0.5 (e)2.3 (e)2.3 République centrafricaine3.1 1.3 1.8 0.1 2.4 4.4 11.7 29.0 5.0 (e)-2.6 (e)-2.3 Tchad0.4 -1.1 -0.8 -1.6 -0.5 0.4 1.5 1.6 6.5 5.1 (e)-3.1 Congo
-1.4 -5.9 -5.5 -7.6 -5.3 -3.2 1.3 3.4 3.2 (e)1.8 (e)2.9 Rép. dém. du Congo-2.7 6.3 11.2 20.8 23.4 27.0 21.9 27.0 6.8 -3.3 (e)8.5 Guinée équatoriale-1.9 -0.5 -0.7 -0.3 -0.8 -1.7 -0.2 -0.3 1.4 (e)-0.4 (e)4.0 Gabon-2.4 -1.0 -0.4 -0.1 0.6 1.3 2.1 2.2 1.3 3.8 (e)4.5 Sao Tomé-et-Principe
-0.2 0.3 0.8 1.2 1.8 2.5 3.2 3.4 3.8 4.2 4.3 Afrique septentrionale
-0.3 -0.8 -0.1 0.0 1.1 2.4 3.6 3.6 3.7 1.2 (e)3.0 Algérie4.6 3.4 3.2 2.9 2.7 2.6 2.6 2.7 4.9 4.8 (e)5.3 Égypte
-5.2 -3.1 (e)-2.1 -0.6 (e)0.1 (e)0.8 (e)2.6 (e)2.9 (e)4.2 (e)3.1 (e)3.4 Jamahiriya arabe libyenne1.8 1.3 1.4 0.8 1.5 2.3 3.0 3.0 0.5 6.0 (e)1.4 Maroc
-2.6 0.7 1.7 3.5 4.0 4.5 4.6 5.1 5.7 9.7 (e)9.1 Soudan0.8 2.0 2.4 3.1 3.3 3.6 3.3 4.9 3.1 4.0 (e)5.2 Tunisie
-0.8 -0.7 -0.1 0.0 0.9 1.8 2.8 3.9 4.3 4.5 4.4 Afrique australe
7.5 5.0 4.7 2.4 3.3 4.5 4.9 5.5 7.1 2.9 (e)4.3 Botswana2.3 3.2 2.7 2.2 1.6 0.8 2.0 3.2 2.2 0.9 (e)4.2 Lesotho
-1.4 0.0 (e)0.5 1.1 (e)1.6 (e)2.0 (e)3.5 (e)5.3 (e)3.4 (e)2.7 (e)2.8 Namibie-0.9 -0.9 -0.3 -0.1 0.8 1.7 2.7 3.8 4.2 (e)4.6 (e)4.5 Afrique du Sud4.1 2.8 2.3 1.3 1.2 1.0 1.0 1.2 0.9 (e)1.3 (e)1.7 Swaziland
-0.5 0.0 0.4 0.0 0.7 1.5 2.7 2.8 2.9 2.4 2.8 Afrique occidentale
-0.1 0.3 0.6 1.2 1.3 1.4 0.7 -0.2 -0.4 0.4 (e)1.2 Bénin-0.1 1.5 1.6 2.4 1.9 1.6 3.0 3.2 2.6 2.7 (e)1.2 Burkina Faso3.2 3.1 3.4 4.6 4.4 4.5 2.7 2.0 3.3 3.1 (e)4.3 Cap-Vert
-1.0 -0.8 -0.7 0.4 -0.2 -0.7 -1.0 0.1 0.2 0.2 (e)-0.3 Côte d'Ivoire0.1 -0.4 -0.2 -0.5 0.0 0.8 0.5 1.9 2.0 2.7 (e)4.1 Gambie
-0.3 1.1 1.3 1.6 1.9 2.2 2.7 2.9 3.6 3.8 (e)4.0 Ghana0.5 0.7 0.9 1.2 1.3 1.5 1.0 0.8 1.4 (e)0.8 (e)-0.5 Guinée1.8 0.2 -0.8 -1.9 -2.7 -4.0 -3.5 -0.9 0.4 1.5 (e)1.6 Guinée-Bissau
-6.3 -11.7 -8.3 -0.2 1.7 7.3 -8.8 0.8 2.4 2.9 (e)4.4 Libéria1.4 1.6 1.7 2.0 2.1 2.3 2.9 -0.8 3.0 (e)2.2 (e)-0.6 Mali
-1.0 -0.3 -0.1 0.2 0.3 0.2 1.1 2.2 2.5 11.1 (e)-1.6 Mauritanie-3.1 -2.0 -1.4 -0.7 -0.2 0.5 0.5 -4.0 3.4 0.0 (e)0.4 Niger-0.5 0.1 0.5 -0.5 0.8 1.9 3.9 4.0 3.7 2.9 (e)3.9 Nigéria0.1 -0.1 0.3 0.9 1.3 2.0 1.9 2.9 2.8 1.4 (e)2.6 Sénégal0.2 -2.1 -1.7 -8.0 -3.5 -0.1 8.0 5.0 3.7 6.8 (e)4.6 Sierra Leone
-1.8 -1.6 -1.5 -1.7 -1.5 -1.4 -0.6 0.2 -1.9 1.4 (e)-0.2 Togo
Pour les sources et les notes, se reporter à la fin du tableau.
Régions,pays ou territoires
Per capita real gross domestic product / Produit intérieur brut réel par habitantPercentage / En pourcentage
8.2.1 Taux de croissance annuels moyens du produit intérieur brut réel totalet par habitant des pays et des régions géographiques
399 8
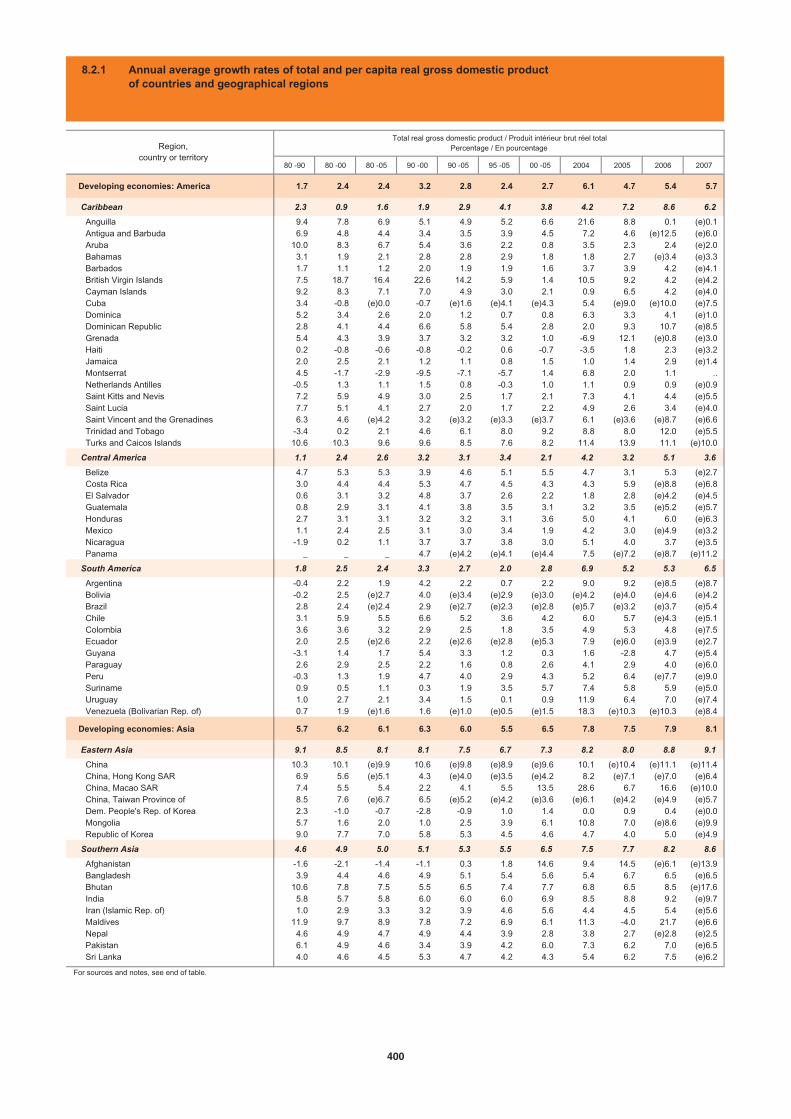
80 -90 80 -00 80 -05 90 -00 90 -05 95 -05 00 -05 2004 2005 2006 2007
Developing economies: America 1.7 2.4 2.4 3.2 2.8 2.4 2.7 6.1 4.7 5.4 5.7
Caribbean 2.3 0.9 1.6 1.9 2.9 4.1 3.8 4.2 7.2 8.6 6.2
Anguilla 9.4 7.8 6.9 5.1 4.9 5.2 6.6 21.6 8.8 0.1 (e)0.1 Antigua and Barbuda 6.9 4.8 4.4 3.4 3.5 3.9 4.5 7.2 4.6 (e)12.5 (e)6.0 Aruba 10.0 8.3 6.7 5.4 3.6 2.2 0.8 3.5 2.3 2.4 (e)2.0 Bahamas 3.1 1.9 2.1 2.8 2.8 2.9 1.8 1.8 2.7 (e)3.4 (e)3.3 Barbados 1.7 1.1 1.2 2.0 1.9 1.9 1.6 3.7 3.9 4.2 (e)4.1 British Virgin Islands 7.5 18.7 16.4 22.6 14.2 5.9 1.4 10.5 9.2 4.2 (e)4.2 Cayman Islands 9.2 8.3 7.1 7.0 4.9 3.0 2.1 0.9 6.5 4.2 (e)4.0 Cuba 3.4 -0.8 (e)0.0 -0.7 (e)1.6 (e)4.1 (e)4.3 5.4 (e)9.0 (e)10.0 (e)7.5 Dominica 5.2 3.4 2.6 2.0 1.2 0.7 0.8 6.3 3.3 4.1 (e)1.0 Dominican Republic 2.8 4.1 4.4 6.6 5.8 5.4 2.8 2.0 9.3 10.7 (e)8.5 Grenada 5.4 4.3 3.9 3.7 3.2 3.2 1.0 -6.9 12.1 (e)0.8 (e)3.0 Haiti 0.2 -0.8 -0.6 -0.8 -0.2 0.6 -0.7 -3.5 1.8 2.3 (e)3.2 Jamaica 2.0 2.5 2.1 1.2 1.1 0.8 1.5 1.0 1.4 2.9 (e)1.4 Montserrat 4.5 -1.7 -2.9 -9.5 -7.1 -5.7 1.4 6.8 2.0 1.1 .. Netherlands Antilles -0.5 1.3 1.1 1.5 0.8 -0.3 1.0 1.1 0.9 0.9 (e)0.9 Saint Kitts and Nevis 7.2 5.9 4.9 3.0 2.5 1.7 2.1 7.3 4.1 4.4 (e)5.5 Saint Lucia 7.7 5.1 4.1 2.7 2.0 1.7 2.2 4.9 2.6 3.4 (e)4.0 Saint Vincent and the Grenadines 6.3 4.6 (e)4.2 3.2 (e)3.2 (e)3.3 (e)3.7 6.1 (e)3.6 (e)8.7 (e)6.6 Trinidad and Tobago -3.4 0.2 2.1 4.6 6.1 8.0 9.2 8.8 8.0 12.0 (e)5.5 Turks and Caicos Islands 10.6 10.3 9.6 9.6 8.5 7.6 8.2 11.4 13.9 11.1 (e)10.0
Central America 1.1 2.4 2.6 3.2 3.1 3.4 2.1 4.2 3.2 5.1 3.6
Belize 4.7 5.3 5.3 3.9 4.6 5.1 5.5 4.7 3.1 5.3 (e)2.7 Costa Rica 3.0 4.4 4.4 5.3 4.7 4.5 4.3 4.3 5.9 (e)8.8 (e)6.8 El Salvador 0.6 3.1 3.2 4.8 3.7 2.6 2.2 1.8 2.8 (e)4.2 (e)4.5 Guatemala 0.8 2.9 3.1 4.1 3.8 3.5 3.1 3.2 3.5 (e)5.2 (e)5.7 Honduras 2.7 3.1 3.1 3.2 3.2 3.1 3.6 5.0 4.1 6.0 (e)6.3 Mexico 1.1 2.4 2.5 3.1 3.0 3.4 1.9 4.2 3.0 (e)4.9 (e)3.2 Nicaragua -1.9 0.2 1.1 3.7 3.7 3.8 3.0 5.1 4.0 3.7 (e)3.5 Panama _ _ _ 4.7 (e)4.2 (e)4.1 (e)4.4 7.5 (e)7.2 (e)8.7 (e)11.2
South America 1.8 2.5 2.4 3.3 2.7 2.0 2.8 6.9 5.2 5.3 6.5
Argentina -0.4 2.2 1.9 4.2 2.2 0.7 2.2 9.0 9.2 (e)8.5 (e)8.7 Bolivia -0.2 2.5 (e)2.7 4.0 (e)3.4 (e)2.9 (e)3.0 (e)4.2 (e)4.0 (e)4.6 (e)4.2 Brazil 2.8 2.4 (e)2.4 2.9 (e)2.7 (e)2.3 (e)2.8 (e)5.7 (e)3.2 (e)3.7 (e)5.4 Chile 3.1 5.9 5.5 6.6 5.2 3.6 4.2 6.0 5.7 (e)4.3 (e)5.1 Colombia 3.6 3.6 3.2 2.9 2.5 1.8 3.5 4.9 5.3 4.8 (e)7.5 Ecuador 2.0 2.5 (e)2.6 2.2 (e)2.6 (e)2.8 (e)5.3 7.9 (e)6.0 (e)3.9 (e)2.7 Guyana -3.1 1.4 1.7 5.4 3.3 1.2 0.3 1.6 -2.8 4.7 (e)5.4 Paraguay 2.6 2.9 2.5 2.2 1.6 0.8 2.6 4.1 2.9 4.0 (e)6.0 Peru -0.3 1.3 1.9 4.7 4.0 2.9 4.3 5.2 6.4 (e)7.7 (e)9.0 Suriname 0.9 0.5 1.1 0.3 1.9 3.5 5.7 7.4 5.8 5.9 (e)5.0 Uruguay 1.0 2.7 2.1 3.4 1.5 0.1 0.9 11.9 6.4 7.0 (e)7.4 Venezuela (Bolivarian Rep. of) 0.7 1.9 (e)1.6 1.6 (e)1.0 (e)0.5 (e)1.5 18.3 (e)10.3 (e)10.3 (e)8.4
Developing economies: Asia 5.7 6.2 6.1 6.3 6.0 5.5 6.5 7.8 7.5 7.9 8.1
Eastern Asia 9.1 8.5 8.1 8.1 7.5 6.7 7.3 8.2 8.0 8.8 9.1
China 10.3 10.1 (e)9.9 10.6 (e)9.8 (e)8.9 (e)9.6 10.1 (e)10.4 (e)11.1 (e)11.4 China, Hong Kong SAR 6.9 5.6 (e)5.1 4.3 (e)4.0 (e)3.5 (e)4.2 8.2 (e)7.1 (e)7.0 (e)6.4 China, Macao SAR 7.4 5.5 5.4 2.2 4.1 5.5 13.5 28.6 6.7 16.6 (e)10.0 China, Taiwan Province of 8.5 7.6 (e)6.7 6.5 (e)5.2 (e)4.2 (e)3.6 (e)6.1 (e)4.2 (e)4.9 (e)5.7 Dem. People's Rep. of Korea 2.3 -1.0 -0.7 -2.8 -0.9 1.0 1.4 0.0 0.9 0.4 (e)0.0 Mongolia 5.7 1.6 2.0 1.0 2.5 3.9 6.1 10.8 7.0 (e)8.6 (e)9.9 Republic of Korea 9.0 7.7 7.0 5.8 5.3 4.5 4.6 4.7 4.0 5.0 (e)4.9
Southern Asia 4.6 4.9 5.0 5.1 5.3 5.5 6.5 7.5 7.7 8.2 8.6
Afghanistan -1.6 -2.1 -1.4 -1.1 0.3 1.8 14.6 9.4 14.5 (e)6.1 (e)13.9 Bangladesh 3.9 4.4 4.6 4.9 5.1 5.4 5.6 5.4 6.7 6.5 (e)6.5 Bhutan 10.6 7.8 7.5 5.5 6.5 7.4 7.7 6.8 6.5 8.5 (e)17.6 India 5.8 5.7 5.8 6.0 6.0 6.0 6.9 8.5 8.8 9.2 (e)9.7 Iran (Islamic Rep. of) 1.0 2.9 3.3 3.2 3.9 4.6 5.6 4.4 4.5 5.4 (e)5.6 Maldives 11.9 9.7 8.9 7.8 7.2 6.9 6.1 11.3 -4.0 21.7 (e)6.6 Nepal 4.6 4.9 4.7 4.9 4.4 3.9 2.8 3.8 2.7 (e)2.8 (e)2.5 Pakistan 6.1 4.9 4.6 3.4 3.9 4.2 6.0 7.3 6.2 7.0 (e)6.5 Sri Lanka 4.0 4.6 4.5 5.3 4.7 4.2 4.3 5.4 6.2 7.5 (e)6.2
For sources and notes, see end of table.
Region,country or territory
Total real gross domestic product / Produit intérieur brut réel totalPercentage / En pourcentage
8.2.1 Annual average growth rates of total and per capita real gross domestic productof countries and geographical regions
400
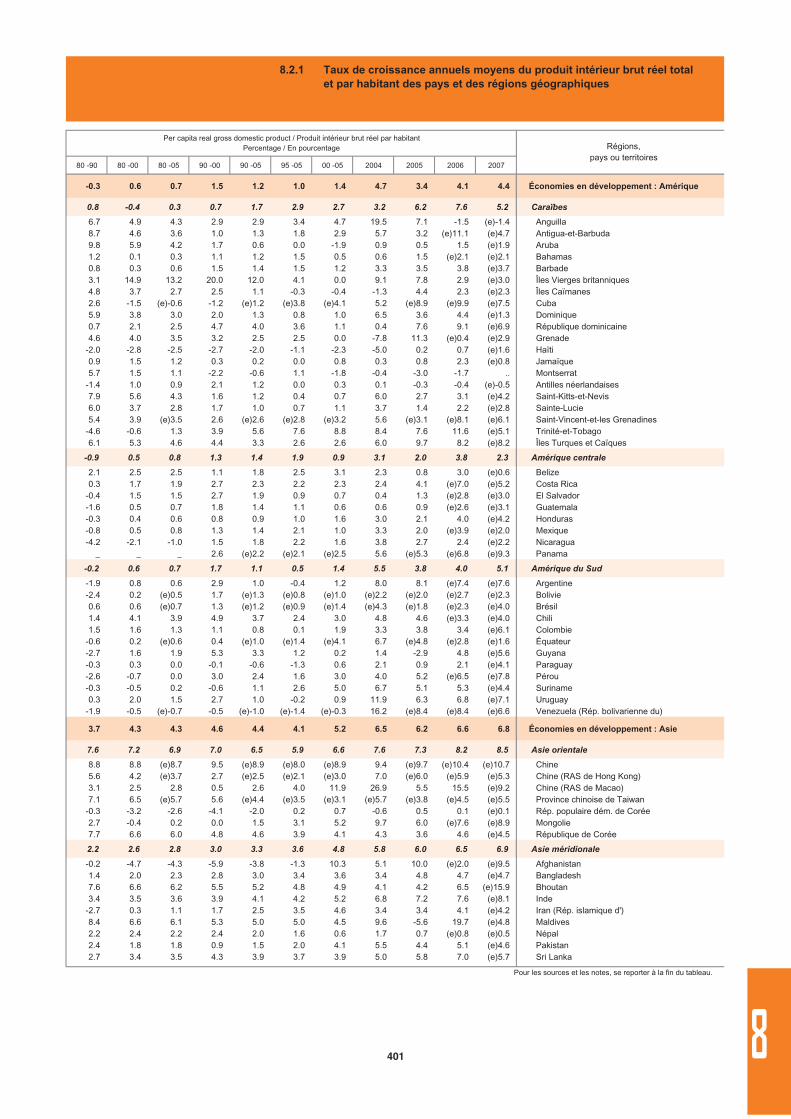
80 -90 80 -00 80 -05 90 -00 90 -05 95 -05 00 -05 2004 2005 2006 2007
-0.3 0.6 0.7 1.5 1.2 1.0 1.4 4.7 3.4 4.1 4.4 Économies en développement : Amérique
0.8 -0.4 0.3 0.7 1.7 2.9 2.7 3.2 6.2 7.6 5.2 Caraïbes
6.7 4.9 4.3 2.9 2.9 3.4 4.7 19.5 7.1 -1.5 (e)-1.4 Anguilla8.7 4.6 3.6 1.0 1.3 1.8 2.9 5.7 3.2 (e)11.1 (e)4.7 Antigua-et-Barbuda9.8 5.9 4.2 1.7 0.6 0.0 -1.9 0.9 0.5 1.5 (e)1.9 Aruba1.2 0.1 0.3 1.1 1.2 1.5 0.5 0.6 1.5 (e)2.1 (e)2.1 Bahamas0.8 0.3 0.6 1.5 1.4 1.5 1.2 3.3 3.5 3.8 (e)3.7 Barbade3.1 14.9 13.2 20.0 12.0 4.1 0.0 9.1 7.8 2.9 (e)3.0 Îles Vierges britanniques4.8 3.7 2.7 2.5 1.1 -0.3 -0.4 -1.3 4.4 2.3 (e)2.3 Îles Caïmanes2.6 -1.5 (e)-0.6 -1.2 (e)1.2 (e)3.8 (e)4.1 5.2 (e)8.9 (e)9.9 (e)7.5 Cuba5.9 3.8 3.0 2.0 1.3 0.8 1.0 6.5 3.6 4.4 (e)1.3 Dominique0.7 2.1 2.5 4.7 4.0 3.6 1.1 0.4 7.6 9.1 (e)6.9 République dominicaine4.6 4.0 3.5 3.2 2.5 2.5 0.0 -7.8 11.3 (e)0.4 (e)2.9 Grenade
-2.0 -2.8 -2.5 -2.7 -2.0 -1.1 -2.3 -5.0 0.2 0.7 (e)1.6 Haïti0.9 1.5 1.2 0.3 0.2 0.0 0.8 0.3 0.8 2.3 (e)0.8 Jamaïque5.7 1.5 1.1 -2.2 -0.6 1.1 -1.8 -0.4 -3.0 -1.7 .. Montserrat
-1.4 1.0 0.9 2.1 1.2 0.0 0.3 0.1 -0.3 -0.4 (e)-0.5 Antilles néerlandaises7.9 5.6 4.3 1.6 1.2 0.4 0.7 6.0 2.7 3.1 (e)4.2 Saint-Kitts-et-Nevis6.0 3.7 2.8 1.7 1.0 0.7 1.1 3.7 1.4 2.2 (e)2.8 Sainte-Lucie5.4 3.9 (e)3.5 2.6 (e)2.6 (e)2.8 (e)3.2 5.6 (e)3.1 (e)8.1 (e)6.1 Saint-Vincent-et-les Grenadines
-4.6 -0.6 1.3 3.9 5.6 7.6 8.8 8.4 7.6 11.6 (e)5.1 Trinité-et-Tobago6.1 5.3 4.6 4.4 3.3 2.6 2.6 6.0 9.7 8.2 (e)8.2 Îles Turques et Caïques
-0.9 0.5 0.8 1.3 1.4 1.9 0.9 3.1 2.0 3.8 2.3 Amérique centrale
2.1 2.5 2.5 1.1 1.8 2.5 3.1 2.3 0.8 3.0 (e)0.6 Belize0.3 1.7 1.9 2.7 2.3 2.2 2.3 2.4 4.1 (e)7.0 (e)5.2 Costa Rica
-0.4 1.5 1.5 2.7 1.9 0.9 0.7 0.4 1.3 (e)2.8 (e)3.0 El Salvador-1.6 0.5 0.7 1.8 1.4 1.1 0.6 0.6 0.9 (e)2.6 (e)3.1 Guatemala-0.3 0.4 0.6 0.8 0.9 1.0 1.6 3.0 2.1 4.0 (e)4.2 Honduras-0.8 0.5 0.8 1.3 1.4 2.1 1.0 3.3 2.0 (e)3.9 (e)2.0 Mexique-4.2 -2.1 -1.0 1.5 1.8 2.2 1.6 3.8 2.7 2.4 (e)2.2 Nicaragua
_ _ _ 2.6 (e)2.2 (e)2.1 (e)2.5 5.6 (e)5.3 (e)6.8 (e)9.3 Panama
-0.2 0.6 0.7 1.7 1.1 0.5 1.4 5.5 3.8 4.0 5.1 Amérique du Sud
-1.9 0.8 0.6 2.9 1.0 -0.4 1.2 8.0 8.1 (e)7.4 (e)7.6 Argentine-2.4 0.2 (e)0.5 1.7 (e)1.3 (e)0.8 (e)1.0 (e)2.2 (e)2.0 (e)2.7 (e)2.3 Bolivie0.6 0.6 (e)0.7 1.3 (e)1.2 (e)0.9 (e)1.4 (e)4.3 (e)1.8 (e)2.3 (e)4.0 Brésil1.4 4.1 3.9 4.9 3.7 2.4 3.0 4.8 4.6 (e)3.3 (e)4.0 Chili1.5 1.6 1.3 1.1 0.8 0.1 1.9 3.3 3.8 3.4 (e)6.1 Colombie
-0.6 0.2 (e)0.6 0.4 (e)1.0 (e)1.4 (e)4.1 6.7 (e)4.8 (e)2.8 (e)1.6 Équateur-2.7 1.6 1.9 5.3 3.3 1.2 0.2 1.4 -2.9 4.8 (e)5.6 Guyana-0.3 0.3 0.0 -0.1 -0.6 -1.3 0.6 2.1 0.9 2.1 (e)4.1 Paraguay-2.6 -0.7 0.0 3.0 2.4 1.6 3.0 4.0 5.2 (e)6.5 (e)7.8 Pérou-0.3 -0.5 0.2 -0.6 1.1 2.6 5.0 6.7 5.1 5.3 (e)4.4 Suriname0.3 2.0 1.5 2.7 1.0 -0.2 0.9 11.9 6.3 6.8 (e)7.1 Uruguay
-1.9 -0.5 (e)-0.7 -0.5 (e)-1.0 (e)-1.4 (e)-0.3 16.2 (e)8.4 (e)8.4 (e)6.6 Venezuela (Rép. bolivarienne du)
3.7 4.3 4.3 4.6 4.4 4.1 5.2 6.5 6.2 6.6 6.8 Économies en développement : Asie
7.6 7.2 6.9 7.0 6.5 5.9 6.6 7.6 7.3 8.2 8.5 Asie orientale
8.8 8.8 (e)8.7 9.5 (e)8.9 (e)8.0 (e)8.9 9.4 (e)9.7 (e)10.4 (e)10.7 Chine5.6 4.2 (e)3.7 2.7 (e)2.5 (e)2.1 (e)3.0 7.0 (e)6.0 (e)5.9 (e)5.3 Chine (RAS de Hong Kong)3.1 2.5 2.8 0.5 2.6 4.0 11.9 26.9 5.5 15.5 (e)9.2 Chine (RAS de Macao)7.1 6.5 (e)5.7 5.6 (e)4.4 (e)3.5 (e)3.1 (e)5.7 (e)3.8 (e)4.5 (e)5.5 Province chinoise de Taiwan
-0.3 -3.2 -2.6 -4.1 -2.0 0.2 0.7 -0.6 0.5 0.1 (e)0.1 Rép. populaire dém. de Corée2.7 -0.4 0.2 0.0 1.5 3.1 5.2 9.7 6.0 (e)7.6 (e)8.9 Mongolie7.7 6.6 6.0 4.8 4.6 3.9 4.1 4.3 3.6 4.6 (e)4.5 République de Corée
2.2 2.6 2.8 3.0 3.3 3.6 4.8 5.8 6.0 6.5 6.9 Asie méridionale
-0.2 -4.7 -4.3 -5.9 -3.8 -1.3 10.3 5.1 10.0 (e)2.0 (e)9.5 Afghanistan1.4 2.0 2.3 2.8 3.0 3.4 3.6 3.4 4.8 4.7 (e)4.7 Bangladesh7.6 6.6 6.2 5.5 5.2 4.8 4.9 4.1 4.2 6.5 (e)15.9 Bhoutan3.4 3.5 3.6 3.9 4.1 4.2 5.2 6.8 7.2 7.6 (e)8.1 Inde
-2.7 0.3 1.1 1.7 2.5 3.5 4.6 3.4 3.4 4.1 (e)4.2 Iran (Rép. islamique d')8.4 6.6 6.1 5.3 5.0 5.0 4.5 9.6 -5.6 19.7 (e)4.8 Maldives2.2 2.4 2.2 2.4 2.0 1.6 0.6 1.7 0.7 (e)0.8 (e)0.5 Népal2.4 1.8 1.8 0.9 1.5 2.0 4.1 5.5 4.4 5.1 (e)4.6 Pakistan2.7 3.4 3.5 4.3 3.9 3.7 3.9 5.0 5.8 7.0 (e)5.7 Sri Lanka
Pour les sources et les notes, se reporter à la fin du tableau.
Per capita real gross domestic product / Produit intérieur brut réel par habitantPercentage / En pourcentage Régions,
pays ou territoires
8.2.1 Taux de croissance annuels moyens du produit intérieur brut réel totalet par habitant des pays et des régions géographiques
401 8
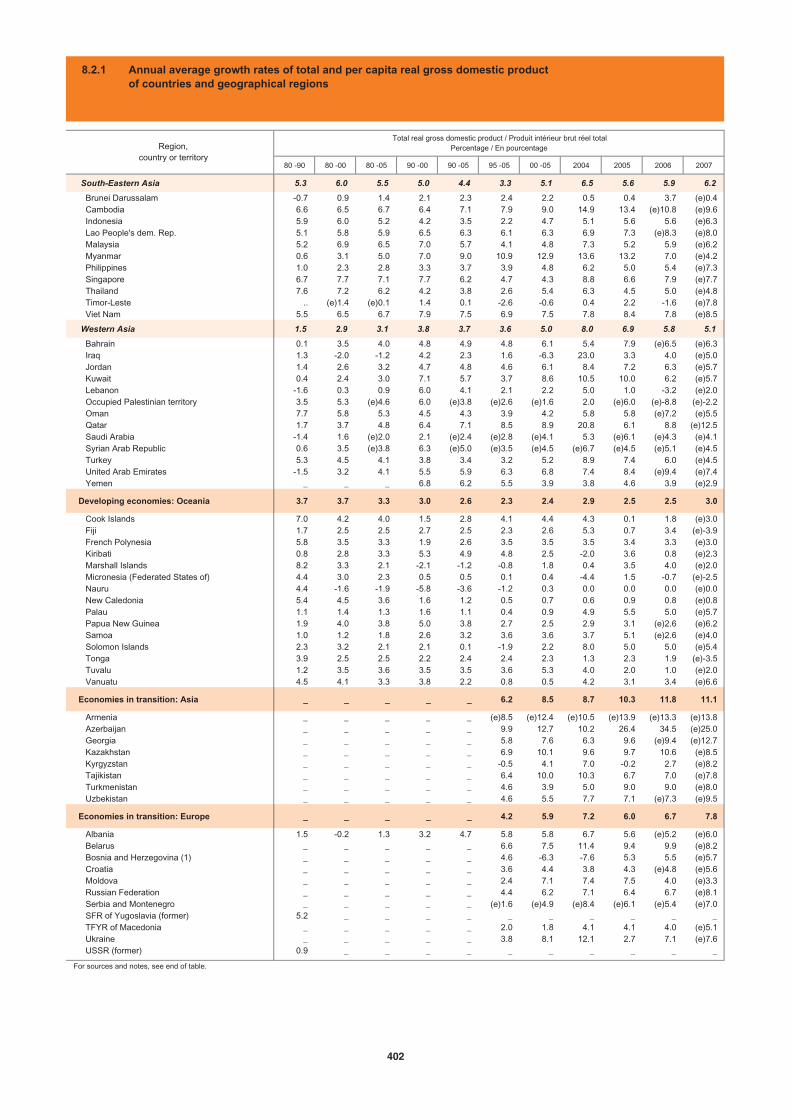
80 -90 80 -00 80 -05 90 -00 90 -05 95 -05 00 -05 2004 2005 2006 2007
South-Eastern Asia 5.3 6.0 5.5 5.0 4.4 3.3 5.1 6.5 5.6 5.9 6.2
Brunei Darussalam -0.7 0.9 1.4 2.1 2.3 2.4 2.2 0.5 0.4 3.7 (e)0.4 Cambodia 6.6 6.5 6.7 6.4 7.1 7.9 9.0 14.9 13.4 (e)10.8 (e)9.6 Indonesia 5.9 6.0 5.2 4.2 3.5 2.2 4.7 5.1 5.6 5.6 (e)6.3 Lao People's dem. Rep. 5.1 5.8 5.9 6.5 6.3 6.1 6.3 6.9 7.3 (e)8.3 (e)8.0 Malaysia 5.2 6.9 6.5 7.0 5.7 4.1 4.8 7.3 5.2 5.9 (e)6.2 Myanmar 0.6 3.1 5.0 7.0 9.0 10.9 12.9 13.6 13.2 7.0 (e)4.2 Philippines 1.0 2.3 2.8 3.3 3.7 3.9 4.8 6.2 5.0 5.4 (e)7.3 Singapore 6.7 7.7 7.1 7.7 6.2 4.7 4.3 8.8 6.6 7.9 (e)7.7 Thailand 7.6 7.2 6.2 4.2 3.8 2.6 5.4 6.3 4.5 5.0 (e)4.8 Timor-Leste .. (e)1.4 (e)0.1 1.4 0.1 -2.6 -0.6 0.4 2.2 -1.6 (e)7.8 Viet Nam 5.5 6.5 6.7 7.9 7.5 6.9 7.5 7.8 8.4 7.8 (e)8.5
Western Asia 1.5 2.9 3.1 3.8 3.7 3.6 5.0 8.0 6.9 5.8 5.1
Bahrain 0.1 3.5 4.0 4.8 4.9 4.8 6.1 5.4 7.9 (e)6.5 (e)6.3 Iraq 1.3 -2.0 -1.2 4.2 2.3 1.6 -6.3 23.0 3.3 4.0 (e)5.0 Jordan 1.4 2.6 3.2 4.7 4.8 4.6 6.1 8.4 7.2 6.3 (e)5.7 Kuwait 0.4 2.4 3.0 7.1 5.7 3.7 8.6 10.5 10.0 6.2 (e)5.7 Lebanon -1.6 0.3 0.9 6.0 4.1 2.1 2.2 5.0 1.0 -3.2 (e)2.0 Occupied Palestinian territory 3.5 5.3 (e)4.6 6.0 (e)3.8 (e)2.6 (e)1.6 2.0 (e)6.0 (e)-8.8 (e)-2.2 Oman 7.7 5.8 5.3 4.5 4.3 3.9 4.2 5.8 5.8 (e)7.2 (e)5.5 Qatar 1.7 3.7 4.8 6.4 7.1 8.5 8.9 20.8 6.1 8.8 (e)12.5 Saudi Arabia -1.4 1.6 (e)2.0 2.1 (e)2.4 (e)2.8 (e)4.1 5.3 (e)6.1 (e)4.3 (e)4.1 Syrian Arab Republic 0.6 3.5 (e)3.8 6.3 (e)5.0 (e)3.5 (e)4.5 (e)6.7 (e)4.5 (e)5.1 (e)4.5 Turkey 5.3 4.5 4.1 3.8 3.4 3.2 5.2 8.9 7.4 6.0 (e)4.5 United Arab Emirates -1.5 3.2 4.1 5.5 5.9 6.3 6.8 7.4 8.4 (e)9.4 (e)7.4 Yemen _ _ _ 6.8 6.2 5.5 3.9 3.8 4.6 3.9 (e)2.9
Developing economies: Oceania 3.7 3.7 3.3 3.0 2.6 2.3 2.4 2.9 2.5 2.5 3.0
Cook Islands 7.0 4.2 4.0 1.5 2.8 4.1 4.4 4.3 0.1 1.8 (e)3.0 Fiji 1.7 2.5 2.5 2.7 2.5 2.3 2.6 5.3 0.7 3.4 (e)-3.9 French Polynesia 5.8 3.5 3.3 1.9 2.6 3.5 3.5 3.5 3.4 3.3 (e)3.0 Kiribati 0.8 2.8 3.3 5.3 4.9 4.8 2.5 -2.0 3.6 0.8 (e)2.3 Marshall Islands 8.2 3.3 2.1 -2.1 -1.2 -0.8 1.8 0.4 3.5 4.0 (e)2.0 Micronesia (Federated States of) 4.4 3.0 2.3 0.5 0.5 0.1 0.4 -4.4 1.5 -0.7 (e)-2.5 Nauru 4.4 -1.6 -1.9 -5.8 -3.6 -1.2 0.3 0.0 0.0 0.0 (e)0.0 New Caledonia 5.4 4.5 3.6 1.6 1.2 0.5 0.7 0.6 0.9 0.8 (e)0.8 Palau 1.1 1.4 1.3 1.6 1.1 0.4 0.9 4.9 5.5 5.0 (e)5.7 Papua New Guinea 1.9 4.0 3.8 5.0 3.8 2.7 2.5 2.9 3.1 (e)2.6 (e)6.2 Samoa 1.0 1.2 1.8 2.6 3.2 3.6 3.6 3.7 5.1 (e)2.6 (e)4.0 Solomon Islands 2.3 3.2 2.1 2.1 0.1 -1.9 2.2 8.0 5.0 5.0 (e)5.4 Tonga 3.9 2.5 2.5 2.2 2.4 2.4 2.3 1.3 2.3 1.9 (e)-3.5 Tuvalu 1.2 3.5 3.6 3.5 3.5 3.6 5.3 4.0 2.0 1.0 (e)2.0 Vanuatu 4.5 4.1 3.3 3.8 2.2 0.8 0.5 4.2 3.1 3.4 (e)6.6
Economies in transition: Asia _ _ _ _ _ 6.2 8.5 8.7 10.3 11.8 11.1
Armenia _ _ _ _ _ (e)8.5 (e)12.4 (e)10.5 (e)13.9 (e)13.3 (e)13.8 Azerbaijan _ _ _ _ _ 9.9 12.7 10.2 26.4 34.5 (e)25.0 Georgia _ _ _ _ _ 5.8 7.6 6.3 9.6 (e)9.4 (e)12.7 Kazakhstan _ _ _ _ _ 6.9 10.1 9.6 9.7 10.6 (e)8.5 Kyrgyzstan _ _ _ _ _ -0.5 4.1 7.0 -0.2 2.7 (e)8.2 Tajikistan _ _ _ _ _ 6.4 10.0 10.3 6.7 7.0 (e)7.8 Turkmenistan _ _ _ _ _ 4.6 3.9 5.0 9.0 9.0 (e)8.0 Uzbekistan _ _ _ _ _ 4.6 5.5 7.7 7.1 (e)7.3 (e)9.5
Economies in transition: Europe _ _ _ _ _ 4.2 5.9 7.2 6.0 6.7 7.8
Albania 1.5 -0.2 1.3 3.2 4.7 5.8 5.8 6.7 5.6 (e)5.2 (e)6.0 Belarus _ _ _ _ _ 6.6 7.5 11.4 9.4 9.9 (e)8.2 Bosnia and Herzegovina (1) _ _ _ _ _ 4.6 -6.3 -7.6 5.3 5.5 (e)5.7 Croatia _ _ _ _ _ 3.6 4.4 3.8 4.3 (e)4.8 (e)5.6 Moldova _ _ _ _ _ 2.4 7.1 7.4 7.5 4.0 (e)3.3 Russian Federation _ _ _ _ _ 4.4 6.2 7.1 6.4 6.7 (e)8.1 Serbia and Montenegro _ _ _ _ _ (e)1.6 (e)4.9 (e)8.4 (e)6.1 (e)5.4 (e)7.0 SFR of Yugoslavia (former) 5.2 _ _ _ _ _ _ _ _ _ _ TFYR of Macedonia _ _ _ _ _ 2.0 1.8 4.1 4.1 4.0 (e)5.1 Ukraine _ _ _ _ _ 3.8 8.1 12.1 2.7 7.1 (e)7.6 USSR (former) 0.9 _ _ _ _ _ _ _ _ _ _
For sources and notes, see end of table.
Region,country or territory
Total real gross domestic product / Produit intérieur brut réel totalPercentage / En pourcentage
8.2.1 Annual average growth rates of total and per capita real gross domestic productof countries and geographical regions
402
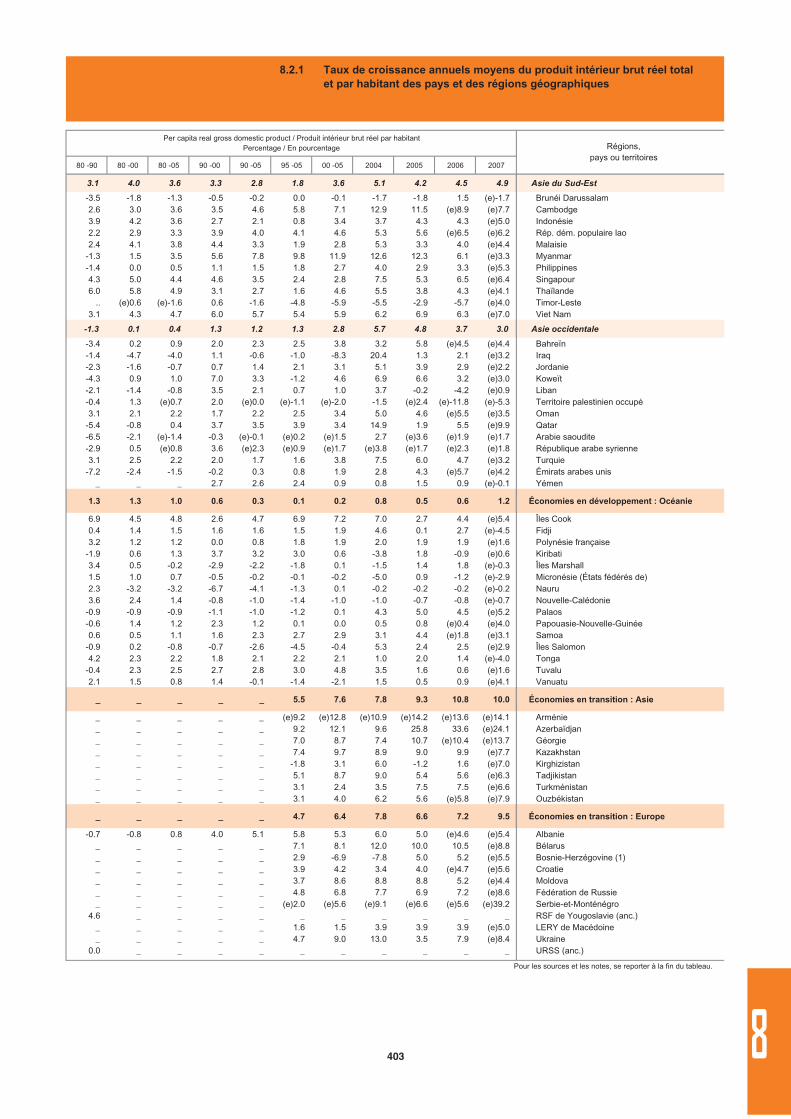
80 -90 80 -00 80 -05 90 -00 90 -05 95 -05 00 -05 2004 2005 2006 2007
3.1 4.0 3.6 3.3 2.8 1.8 3.6 5.1 4.2 4.5 4.9 Asie du Sud-Est
-3.5 -1.8 -1.3 -0.5 -0.2 0.0 -0.1 -1.7 -1.8 1.5 (e)-1.7 Brunéi Darussalam2.6 3.0 3.6 3.5 4.6 5.8 7.1 12.9 11.5 (e)8.9 (e)7.7 Cambodge3.9 4.2 3.6 2.7 2.1 0.8 3.4 3.7 4.3 4.3 (e)5.0 Indonésie2.2 2.9 3.3 3.9 4.0 4.1 4.6 5.3 5.6 (e)6.5 (e)6.2 Rép. dém. populaire lao2.4 4.1 3.8 4.4 3.3 1.9 2.8 5.3 3.3 4.0 (e)4.4 Malaisie
-1.3 1.5 3.5 5.6 7.8 9.8 11.9 12.6 12.3 6.1 (e)3.3 Myanmar-1.4 0.0 0.5 1.1 1.5 1.8 2.7 4.0 2.9 3.3 (e)5.3 Philippines4.3 5.0 4.4 4.6 3.5 2.4 2.8 7.5 5.3 6.5 (e)6.4 Singapour6.0 5.8 4.9 3.1 2.7 1.6 4.6 5.5 3.8 4.3 (e)4.1 Thaïlande
.. (e)0.6 (e)-1.6 0.6 -1.6 -4.8 -5.9 -5.5 -2.9 -5.7 (e)4.0 Timor-Leste3.1 4.3 4.7 6.0 5.7 5.4 5.9 6.2 6.9 6.3 (e)7.0 Viet Nam
-1.3 0.1 0.4 1.3 1.2 1.3 2.8 5.7 4.8 3.7 3.0 Asie occidentale
-3.4 0.2 0.9 2.0 2.3 2.5 3.8 3.2 5.8 (e)4.5 (e)4.4 Bahreïn-1.4 -4.7 -4.0 1.1 -0.6 -1.0 -8.3 20.4 1.3 2.1 (e)3.2 Iraq-2.3 -1.6 -0.7 0.7 1.4 2.1 3.1 5.1 3.9 2.9 (e)2.2 Jordanie-4.3 0.9 1.0 7.0 3.3 -1.2 4.6 6.9 6.6 3.2 (e)3.0 Koweït-2.1 -1.4 -0.8 3.5 2.1 0.7 1.0 3.7 -0.2 -4.2 (e)0.9 Liban-0.4 1.3 (e)0.7 2.0 (e)0.0 (e)-1.1 (e)-2.0 -1.5 (e)2.4 (e)-11.8 (e)-5.3 Territoire palestinien occupé3.1 2.1 2.2 1.7 2.2 2.5 3.4 5.0 4.6 (e)5.5 (e)3.5 Oman
-5.4 -0.8 0.4 3.7 3.5 3.9 3.4 14.9 1.9 5.5 (e)9.9 Qatar-6.5 -2.1 (e)-1.4 -0.3 (e)-0.1 (e)0.2 (e)1.5 2.7 (e)3.6 (e)1.9 (e)1.7 Arabie saoudite-2.9 0.5 (e)0.8 3.6 (e)2.3 (e)0.9 (e)1.7 (e)3.8 (e)1.7 (e)2.3 (e)1.8 République arabe syrienne3.1 2.5 2.2 2.0 1.7 1.6 3.8 7.5 6.0 4.7 (e)3.2 Turquie
-7.2 -2.4 -1.5 -0.2 0.3 0.8 1.9 2.8 4.3 (e)5.7 (e)4.2 Émirats arabes unis_ _ _ 2.7 2.6 2.4 0.9 0.8 1.5 0.9 (e)-0.1 Yémen
1.3 1.3 1.0 0.6 0.3 0.1 0.2 0.8 0.5 0.6 1.2 Économies en développement : Océanie
6.9 4.5 4.8 2.6 4.7 6.9 7.2 7.0 2.7 4.4 (e)5.4 Îles Cook0.4 1.4 1.5 1.6 1.6 1.5 1.9 4.6 0.1 2.7 (e)-4.5 Fidji3.2 1.2 1.2 0.0 0.8 1.8 1.9 2.0 1.9 1.9 (e)1.6 Polynésie française
-1.9 0.6 1.3 3.7 3.2 3.0 0.6 -3.8 1.8 -0.9 (e)0.6 Kiribati3.4 0.5 -0.2 -2.9 -2.2 -1.8 0.1 -1.5 1.4 1.8 (e)-0.3 Îles Marshall1.5 1.0 0.7 -0.5 -0.2 -0.1 -0.2 -5.0 0.9 -1.2 (e)-2.9 Micronésie (États fédérés de)2.3 -3.2 -3.2 -6.7 -4.1 -1.3 0.1 -0.2 -0.2 -0.2 (e)-0.2 Nauru3.6 2.4 1.4 -0.8 -1.0 -1.4 -1.0 -1.0 -0.7 -0.8 (e)-0.7 Nouvelle-Calédonie
-0.9 -0.9 -0.9 -1.1 -1.0 -1.2 0.1 4.3 5.0 4.5 (e)5.2 Palaos-0.6 1.4 1.2 2.3 1.2 0.1 0.0 0.5 0.8 (e)0.4 (e)4.0 Papouasie-Nouvelle-Guinée0.6 0.5 1.1 1.6 2.3 2.7 2.9 3.1 4.4 (e)1.8 (e)3.1 Samoa
-0.9 0.2 -0.8 -0.7 -2.6 -4.5 -0.4 5.3 2.4 2.5 (e)2.9 Îles Salomon4.2 2.3 2.2 1.8 2.1 2.2 2.1 1.0 2.0 1.4 (e)-4.0 Tonga
-0.4 2.3 2.5 2.7 2.8 3.0 4.8 3.5 1.6 0.6 (e)1.6 Tuvalu2.1 1.5 0.8 1.4 -0.1 -1.4 -2.1 1.5 0.5 0.9 (e)4.1 Vanuatu
_ _ _ _ _ 5.5 7.6 7.8 9.3 10.8 10.0 Économies en transition : Asie
_ _ _ _ _ (e)9.2 (e)12.8 (e)10.9 (e)14.2 (e)13.6 (e)14.1 Arménie_ _ _ _ _ 9.2 12.1 9.6 25.8 33.6 (e)24.1 Azerbaïdjan_ _ _ _ _ 7.0 8.7 7.4 10.7 (e)10.4 (e)13.7 Géorgie_ _ _ _ _ 7.4 9.7 8.9 9.0 9.9 (e)7.7 Kazakhstan_ _ _ _ _ -1.8 3.1 6.0 -1.2 1.6 (e)7.0 Kirghizistan_ _ _ _ _ 5.1 8.7 9.0 5.4 5.6 (e)6.3 Tadjikistan_ _ _ _ _ 3.1 2.4 3.5 7.5 7.5 (e)6.6 Turkménistan_ _ _ _ _ 3.1 4.0 6.2 5.6 (e)5.8 (e)7.9 Ouzbékistan
_ _ _ _ _ 4.7 6.4 7.8 6.6 7.2 9.5 Économies en transition : Europe
-0.7 -0.8 0.8 4.0 5.1 5.8 5.3 6.0 5.0 (e)4.6 (e)5.4 Albanie_ _ _ _ _ 7.1 8.1 12.0 10.0 10.5 (e)8.8 Bélarus_ _ _ _ _ 2.9 -6.9 -7.8 5.0 5.2 (e)5.5 Bosnie-Herzégovine (1)_ _ _ _ _ 3.9 4.2 3.4 4.0 (e)4.7 (e)5.6 Croatie_ _ _ _ _ 3.7 8.6 8.8 8.8 5.2 (e)4.4 Moldova_ _ _ _ _ 4.8 6.8 7.7 6.9 7.2 (e)8.6 Fédération de Russie_ _ _ _ _ (e)2.0 (e)5.6 (e)9.1 (e)6.6 (e)5.6 (e)39.2 Serbie-et-Monténégro
4.6 _ _ _ _ _ _ _ _ _ _ RSF de Yougoslavie (anc.)_ _ _ _ _ 1.6 1.5 3.9 3.9 3.9 (e)5.0 LERY de Macédoine_ _ _ _ _ 4.7 9.0 13.0 3.5 7.9 (e)8.4 Ukraine
0.0 _ _ _ _ _ _ _ _ _ _ URSS (anc.)
Pour les sources et les notes, se reporter à la fin du tableau.
Per capita real gross domestic product / Produit intérieur brut réel par habitantPercentage / En pourcentage Régions,
pays ou territoires
8.2.1 Taux de croissance annuels moyens du produit intérieur brut réel totalet par habitant des pays et des régions géographiques
403 8
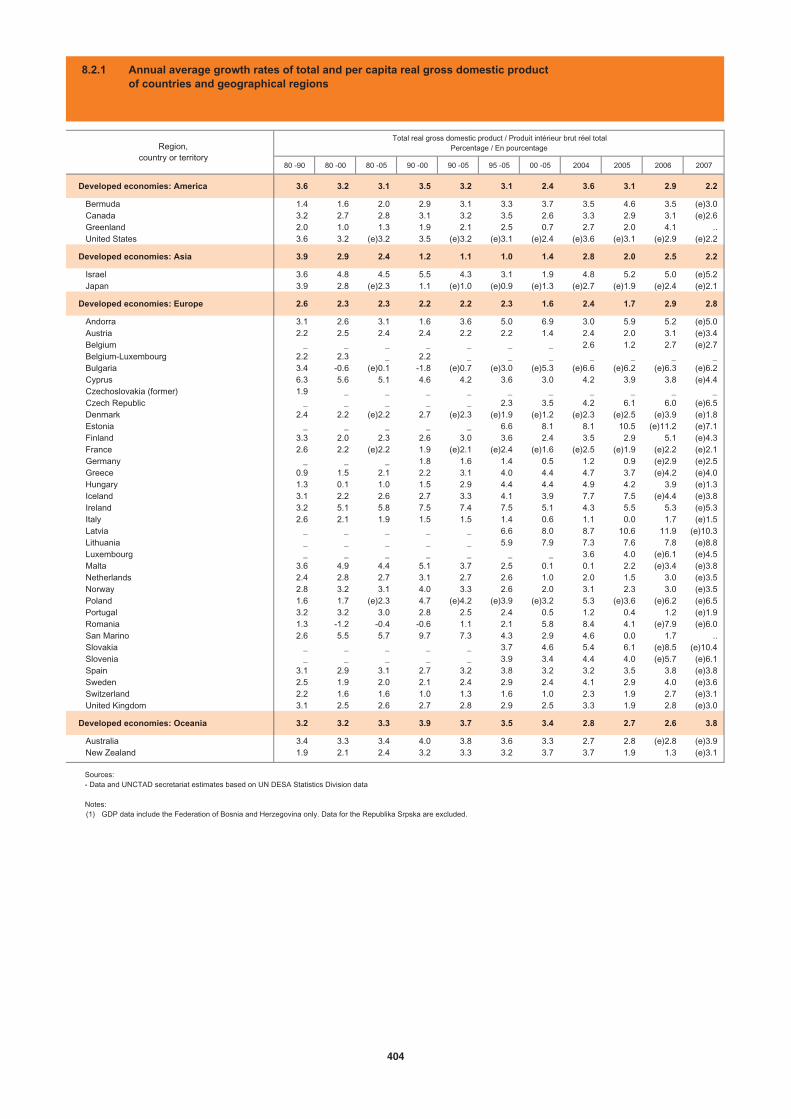
80 -90 80 -00 80 -05 90 -00 90 -05 95 -05 00 -05 2004 2005 2006 2007
Developed economies: America 3.6 3.2 3.1 3.5 3.2 3.1 2.4 3.6 3.1 2.9 2.2
Bermuda 1.4 1.6 2.0 2.9 3.1 3.3 3.7 3.5 4.6 3.5 (e)3.0 Canada 3.2 2.7 2.8 3.1 3.2 3.5 2.6 3.3 2.9 3.1 (e)2.6 Greenland 2.0 1.0 1.3 1.9 2.1 2.5 0.7 2.7 2.0 4.1 .. United States 3.6 3.2 (e)3.2 3.5 (e)3.2 (e)3.1 (e)2.4 (e)3.6 (e)3.1 (e)2.9 (e)2.2
Developed economies: Asia 3.9 2.9 2.4 1.2 1.1 1.0 1.4 2.8 2.0 2.5 2.2
Israel 3.6 4.8 4.5 5.5 4.3 3.1 1.9 4.8 5.2 5.0 (e)5.2 Japan 3.9 2.8 (e)2.3 1.1 (e)1.0 (e)0.9 (e)1.3 (e)2.7 (e)1.9 (e)2.4 (e)2.1
Developed economies: Europe 2.6 2.3 2.3 2.2 2.2 2.3 1.6 2.4 1.7 2.9 2.8
Andorra 3.1 2.6 3.1 1.6 3.6 5.0 6.9 3.0 5.9 5.2 (e)5.0 Austria 2.2 2.5 2.4 2.4 2.2 2.2 1.4 2.4 2.0 3.1 (e)3.4 Belgium _ _ _ _ _ _ _ 2.6 1.2 2.7 (e)2.7 Belgium-Luxembourg 2.2 2.3 _ 2.2 _ _ _ _ _ _ _ Bulgaria 3.4 -0.6 (e)0.1 -1.8 (e)0.7 (e)3.0 (e)5.3 (e)6.6 (e)6.2 (e)6.3 (e)6.2 Cyprus 6.3 5.6 5.1 4.6 4.2 3.6 3.0 4.2 3.9 3.8 (e)4.4 Czechoslovakia (former) 1.9 _ _ _ _ _ _ _ _ _ _ Czech Republic _ _ _ _ _ 2.3 3.5 4.2 6.1 6.0 (e)6.5 Denmark 2.4 2.2 (e)2.2 2.7 (e)2.3 (e)1.9 (e)1.2 (e)2.3 (e)2.5 (e)3.9 (e)1.8 Estonia _ _ _ _ _ 6.6 8.1 8.1 10.5 (e)11.2 (e)7.1 Finland 3.3 2.0 2.3 2.6 3.0 3.6 2.4 3.5 2.9 5.1 (e)4.3 France 2.6 2.2 (e)2.2 1.9 (e)2.1 (e)2.4 (e)1.6 (e)2.5 (e)1.9 (e)2.2 (e)2.1 Germany _ _ _ 1.8 1.6 1.4 0.5 1.2 0.9 (e)2.9 (e)2.5 Greece 0.9 1.5 2.1 2.2 3.1 4.0 4.4 4.7 3.7 (e)4.2 (e)4.0 Hungary 1.3 0.1 1.0 1.5 2.9 4.4 4.4 4.9 4.2 3.9 (e)1.3 Iceland 3.1 2.2 2.6 2.7 3.3 4.1 3.9 7.7 7.5 (e)4.4 (e)3.8 Ireland 3.2 5.1 5.8 7.5 7.4 7.5 5.1 4.3 5.5 5.3 (e)5.3 Italy 2.6 2.1 1.9 1.5 1.5 1.4 0.6 1.1 0.0 1.7 (e)1.5 Latvia _ _ _ _ _ 6.6 8.0 8.7 10.6 11.9 (e)10.3 Lithuania _ _ _ _ _ 5.9 7.9 7.3 7.6 7.8 (e)8.8 Luxembourg _ _ _ _ _ _ _ 3.6 4.0 (e)6.1 (e)4.5 Malta 3.6 4.9 4.4 5.1 3.7 2.5 0.1 0.1 2.2 (e)3.4 (e)3.8 Netherlands 2.4 2.8 2.7 3.1 2.7 2.6 1.0 2.0 1.5 3.0 (e)3.5 Norway 2.8 3.2 3.1 4.0 3.3 2.6 2.0 3.1 2.3 3.0 (e)3.5 Poland 1.6 1.7 (e)2.3 4.7 (e)4.2 (e)3.9 (e)3.2 5.3 (e)3.6 (e)6.2 (e)6.5 Portugal 3.2 3.2 3.0 2.8 2.5 2.4 0.5 1.2 0.4 1.2 (e)1.9 Romania 1.3 -1.2 -0.4 -0.6 1.1 2.1 5.8 8.4 4.1 (e)7.9 (e)6.0 San Marino 2.6 5.5 5.7 9.7 7.3 4.3 2.9 4.6 0.0 1.7 .. Slovakia _ _ _ _ _ 3.7 4.6 5.4 6.1 (e)8.5 (e)10.4 Slovenia _ _ _ _ _ 3.9 3.4 4.4 4.0 (e)5.7 (e)6.1 Spain 3.1 2.9 3.1 2.7 3.2 3.8 3.2 3.2 3.5 3.8 (e)3.8 Sweden 2.5 1.9 2.0 2.1 2.4 2.9 2.4 4.1 2.9 4.0 (e)3.6 Switzerland 2.2 1.6 1.6 1.0 1.3 1.6 1.0 2.3 1.9 2.7 (e)3.1 United Kingdom 3.1 2.5 2.6 2.7 2.8 2.9 2.5 3.3 1.9 2.8 (e)3.0
Developed economies: Oceania 3.2 3.2 3.3 3.9 3.7 3.5 3.4 2.8 2.7 2.6 3.8
Australia 3.4 3.3 3.4 4.0 3.8 3.6 3.3 2.7 2.8 (e)2.8 (e)3.9 New Zealand 1.9 2.1 2.4 3.2 3.3 3.2 3.7 3.7 1.9 1.3 (e)3.1
Region,country or territory
Total real gross domestic product / Produit intérieur brut réel totalPercentage / En pourcentage
8.2.1 Annual average growth rates of total and per capita real gross domestic productof countries and geographical regions
(1) GDP data include the Federation of Bosnia and Herzegovina only. Data for the Republika Srpska are excluded.
Sources:- Data and UNCTAD secretariat estimates based on UN DESA Statistics Division data
Notes:
404
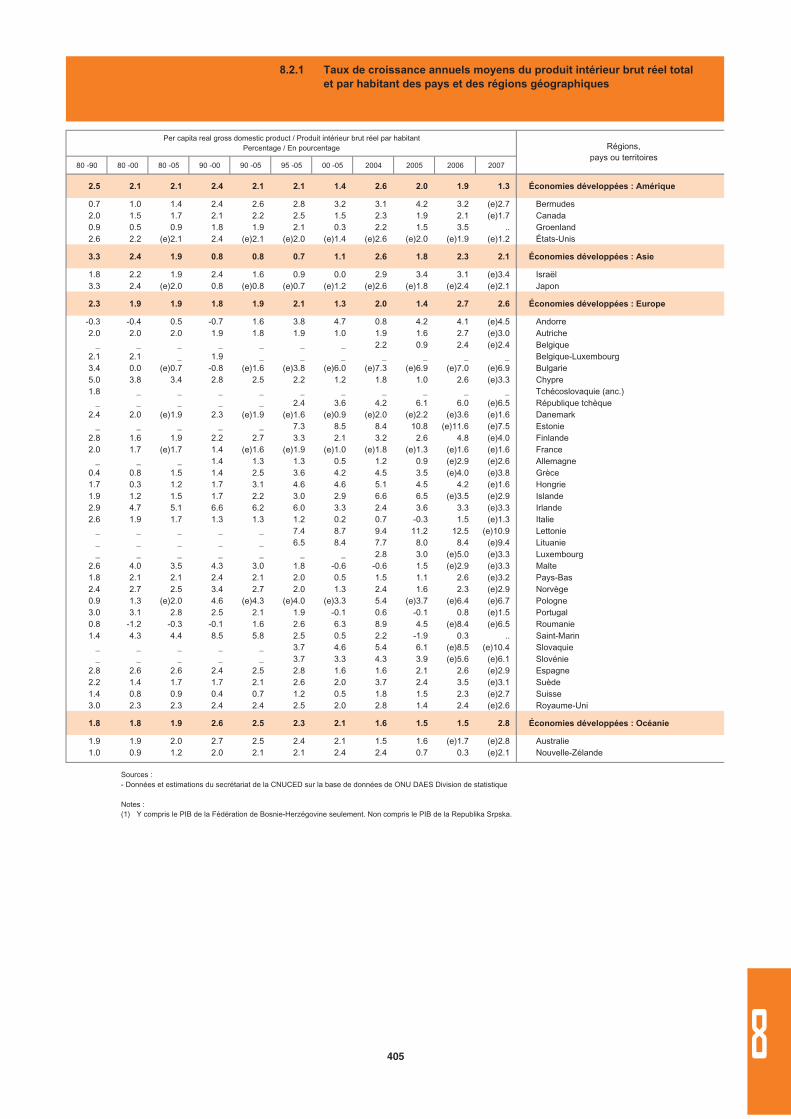
80 -90 80 -00 80 -05 90 -00 90 -05 95 -05 00 -05 2004 2005 2006 2007
2.5 2.1 2.1 2.4 2.1 2.1 1.4 2.6 2.0 1.9 1.3 Économies développées : Amérique
0.7 1.0 1.4 2.4 2.6 2.8 3.2 3.1 4.2 3.2 (e)2.7 Bermudes2.0 1.5 1.7 2.1 2.2 2.5 1.5 2.3 1.9 2.1 (e)1.7 Canada0.9 0.5 0.9 1.8 1.9 2.1 0.3 2.2 1.5 3.5 .. Groenland2.6 2.2 (e)2.1 2.4 (e)2.1 (e)2.0 (e)1.4 (e)2.6 (e)2.0 (e)1.9 (e)1.2 États-Unis
3.3 2.4 1.9 0.8 0.8 0.7 1.1 2.6 1.8 2.3 2.1 Économies développées : Asie
1.8 2.2 1.9 2.4 1.6 0.9 0.0 2.9 3.4 3.1 (e)3.4 Israël3.3 2.4 (e)2.0 0.8 (e)0.8 (e)0.7 (e)1.2 (e)2.6 (e)1.8 (e)2.4 (e)2.1 Japon
2.3 1.9 1.9 1.8 1.9 2.1 1.3 2.0 1.4 2.7 2.6 Économies développées : Europe
-0.3 -0.4 0.5 -0.7 1.6 3.8 4.7 0.8 4.2 4.1 (e)4.5 Andorre2.0 2.0 2.0 1.9 1.8 1.9 1.0 1.9 1.6 2.7 (e)3.0 Autriche
_ _ _ _ _ _ _ 2.2 0.9 2.4 (e)2.4 Belgique2.1 2.1 _ 1.9 _ _ _ _ _ _ _ Belgique-Luxembourg3.4 0.0 (e)0.7 -0.8 (e)1.6 (e)3.8 (e)6.0 (e)7.3 (e)6.9 (e)7.0 (e)6.9 Bulgarie5.0 3.8 3.4 2.8 2.5 2.2 1.2 1.8 1.0 2.6 (e)3.3 Chypre1.8 _ _ _ _ _ _ _ _ _ _ Tchécoslovaquie (anc.)
_ _ _ _ _ 2.4 3.6 4.2 6.1 6.0 (e)6.5 République tchèque2.4 2.0 (e)1.9 2.3 (e)1.9 (e)1.6 (e)0.9 (e)2.0 (e)2.2 (e)3.6 (e)1.6 Danemark
_ _ _ _ _ 7.3 8.5 8.4 10.8 (e)11.6 (e)7.5 Estonie2.8 1.6 1.9 2.2 2.7 3.3 2.1 3.2 2.6 4.8 (e)4.0 Finlande2.0 1.7 (e)1.7 1.4 (e)1.6 (e)1.9 (e)1.0 (e)1.8 (e)1.3 (e)1.6 (e)1.6 France
_ _ _ 1.4 1.3 1.3 0.5 1.2 0.9 (e)2.9 (e)2.6 Allemagne0.4 0.8 1.5 1.4 2.5 3.6 4.2 4.5 3.5 (e)4.0 (e)3.8 Grèce1.7 0.3 1.2 1.7 3.1 4.6 4.6 5.1 4.5 4.2 (e)1.6 Hongrie1.9 1.2 1.5 1.7 2.2 3.0 2.9 6.6 6.5 (e)3.5 (e)2.9 Islande2.9 4.7 5.1 6.6 6.2 6.0 3.3 2.4 3.6 3.3 (e)3.3 Irlande2.6 1.9 1.7 1.3 1.3 1.2 0.2 0.7 -0.3 1.5 (e)1.3 Italie
_ _ _ _ _ 7.4 8.7 9.4 11.2 12.5 (e)10.9 Lettonie_ _ _ _ _ 6.5 8.4 7.7 8.0 8.4 (e)9.4 Lituanie_ _ _ _ _ _ _ 2.8 3.0 (e)5.0 (e)3.3 Luxembourg
2.6 4.0 3.5 4.3 3.0 1.8 -0.6 -0.6 1.5 (e)2.9 (e)3.3 Malte1.8 2.1 2.1 2.4 2.1 2.0 0.5 1.5 1.1 2.6 (e)3.2 Pays-Bas2.4 2.7 2.5 3.4 2.7 2.0 1.3 2.4 1.6 2.3 (e)2.9 Norvège0.9 1.3 (e)2.0 4.6 (e)4.3 (e)4.0 (e)3.3 5.4 (e)3.7 (e)6.4 (e)6.7 Pologne3.0 3.1 2.8 2.5 2.1 1.9 -0.1 0.6 -0.1 0.8 (e)1.5 Portugal0.8 -1.2 -0.3 -0.1 1.6 2.6 6.3 8.9 4.5 (e)8.4 (e)6.5 Roumanie1.4 4.3 4.4 8.5 5.8 2.5 0.5 2.2 -1.9 0.3 .. Saint-Marin
_ _ _ _ _ 3.7 4.6 5.4 6.1 (e)8.5 (e)10.4 Slovaquie_ _ _ _ _ 3.7 3.3 4.3 3.9 (e)5.6 (e)6.1 Slovénie
2.8 2.6 2.6 2.4 2.5 2.8 1.6 1.6 2.1 2.6 (e)2.9 Espagne2.2 1.4 1.7 1.7 2.1 2.6 2.0 3.7 2.4 3.5 (e)3.1 Suède1.4 0.8 0.9 0.4 0.7 1.2 0.5 1.8 1.5 2.3 (e)2.7 Suisse3.0 2.3 2.3 2.4 2.4 2.5 2.0 2.8 1.4 2.4 (e)2.6 Royaume-Uni
1.8 1.8 1.9 2.6 2.5 2.3 2.1 1.6 1.5 1.5 2.8 Économies développées : Océanie
1.9 1.9 2.0 2.7 2.5 2.4 2.1 1.5 1.6 (e)1.7 (e)2.8 Australie1.0 0.9 1.2 2.0 2.1 2.1 2.4 2.4 0.7 0.3 (e)2.1 Nouvelle-Zélande
Per capita real gross domestic product / Produit intérieur brut réel par habitantPercentage / En pourcentage Régions,
pays ou territoires
8.2.1 Taux de croissance annuels moyens du produit intérieur brut réel totalet par habitant des pays et des régions géographiques
(1) Y compris le PIB de la Fédération de Bosnie-Herzégovine seulement. Non compris le PIB de la Republika Srpska.
Sources : - Données et estimations du secrétariat de la CNUCED sur la base de données de ONU DAES Division de statistique
Notes :
405 8

80 - 90 80 - 00 80 - 05 90 - 00 90 - 05 95 - 05 00 - 05 2004 2005 2006 2007
DEVELOPING ECONOMIES 3.9 4.5 4.6 5.0 4.8 4.6 5.4 7.2 6.7 7.1 7.3
Developing economies excluding China 3.3 3.8 3.8 4.1 3.9 3.7 4.4 6.4 5.7 6.0 6.2
Developing economies excluding LDCs 3.9 4.6 4.6 5.0 4.8 4.6 5.4 7.2 6.6 7.1 7.3
High-income developing countries 2.9 4.2 4.1 4.6 4.0 3.5 3.7 6.4 5.3 5.9 5.5
Middle-income developing countries 3.1 3.1 3.2 3.3 3.3 3.1 4.1 5.9 4.8 5.0 5.5
Low-income developing countries 5.8 6.2 6.3 6.8 6.7 6.5 7.6 8.6 8.8 9.3 9.7
Heavily indebted poor countries 1.9 2.4 2.8 3.4 3.8 4.2 4.8 6.0 5.7 6.4 6.2
Landlocked developing countries 2.8 6.5 6.0 6.1 5.2 4.3 5.7 7.5 7.2 7.7 7.7
Small island developing States 1.4 2.6 2.9 3.5 3.6 3.8 4.0 4.6 3.8 6.0 4.3
Least developed countries 2.2 2.8 3.4 4.0 4.7 5.4 6.3 7.3 7.9 7.4 7.6
Africa and Haiti 1.9 2.4 3.1 3.4 4.2 5.1 6.0 7.6 7.9 8.1 8.6
Asia 2.7 3.5 4.1 5.1 5.5 6.0 6.8 6.9 7.9 6.4 6.2
Islands 4.4 4.9 4.3 3.5 2.9 2.1 3.0 5.8 1.1 8.2 5.0
Major petroleum exporters 0.5 2.1 2.6 3.0 3.5 3.9 5.2 7.1 6.6 6.1 6.2
Africa 1.4 1.8 2.4 2.4 3.4 4.4 6.0 6.3 6.9 5.8 7.1
America 0.5 1.8 1.8 2.0 1.8 1.6 3.1 14.9 9.2 9.3 7.0
Asia -0.1 2.3 2.8 3.6 3.8 4.1 5.1 6.5 6.0 5.8 5.5
Major exporters of manufactured goods 5.5 5.7 5.7 6.0 5.7 5.3 5.9 7.6 6.8 7.6 7.9
America 2.1 2.4 2.4 3.0 2.8 2.7 2.5 5.1 3.1 4.2 4.5
Asia 7.5 7.3 7.1 7.1 6.6 6.0 6.8 8.2 7.8 8.4 8.7
Emerging economies 3.7 4.3 4.1 4.5 3.9 3.2 3.4 5.8 4.3 5.1 5.4
America 1.6 2.4 2.5 3.4 2.8 2.4 2.6 5.8 4.3 5.0 5.4
Asia 8.2 7.5 6.8 6.0 5.2 4.1 4.4 5.8 4.4 5.3 5.4
Newly industrialized economies 7.2 6.8 6.2 5.5 4.8 3.8 4.4 5.9 4.8 5.4 5.7
First tier 8.3 7.4 6.6 5.9 5.2 4.3 4.2 5.9 4.6 5.4 5.6
Second tier 5.3 5.9 5.3 4.5 4.0 2.8 5.0 6.0 5.1 5.4 6.0
Developing economies: Africa 2.3 2.4 2.7 2.8 3.3 3.9 4.8 5.6 5.7 5.6 5.9
Northern Africa excluding Sudan 2.7 2.5 2.8 2.8 3.3 3.9 4.7 4.9 5.2 5.1 5.3
Sub-Saharan Africa 2.1 2.3 2.7 2.7 3.3 3.9 4.8 5.9 5.9 5.9 6.2
Sub-Saharan Africa excluding South Africa
2.6 2.8 3.1 3.0 3.6 4.3 5.2 6.4 6.2 6.1 6.7
Developing economies: America 1.7 2.4 2.4 3.2 2.8 2.4 2.7 6.1 4.7 5.4 5.7
Central America and Greater Carribean Islands excluding Puerto Rico
1.3 2.2 2.4 3.0 3.0 3.5 2.2 4.1 3.7 5.6 4.0
Central America and Greater Carribean Islands excluding Mexico and Puerto Rico
2.2 1.7 2.1 2.7 3.2 3.8 3.5 4.0 6.4 7.9 6.9
South America and Central America 1.6 2.5 2.5 3.3 2.8 2.4 2.6 6.1 4.6 5.3 5.7
South America excluding Brazil 0.7 2.6 2.4 3.9 2.6 1.5 2.8 8.5 7.7 7.3 7.7
Developing economies: Asia 5.7 6.2 6.1 6.3 6.0 5.5 6.5 7.8 7.5 7.9 8.1
Eastern and South-Eastern Asia excluding China
7.0 6.6 6.0 5.4 4.8 3.9 4.6 6.0 4.9 5.5 5.7
Southern Asia excluding India 2.9 3.7 3.9 3.6 4.1 4.6 5.7 5.5 5.5 6.1 6.1
Total real gross domestic product / Produit intérieur brut réel totalPercentage / En pourcentageRegion,
country or territory
8.2.2 Annual average growth rates of total and per capita real gross domestic productof economic groupings
Sources:- Data and UNCTAD secretariat estimates based on UN DESA Statistics Division data
406
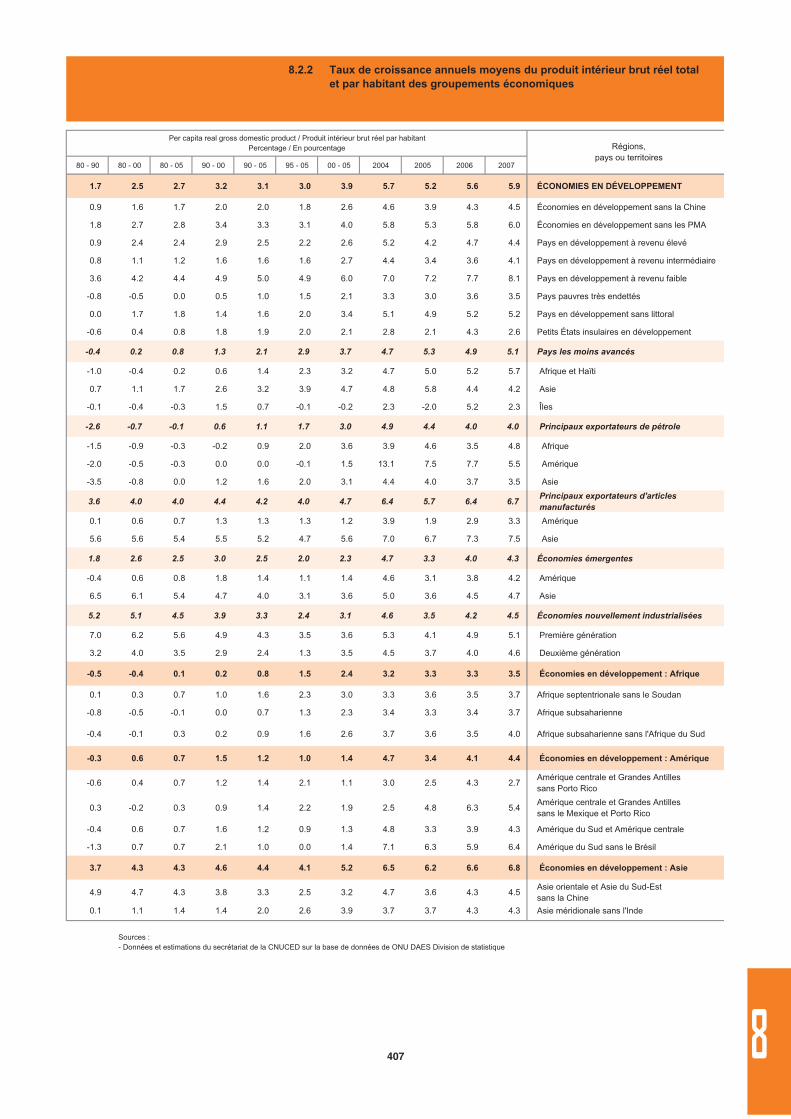
80 - 90 80 - 00 80 - 05 90 - 00 90 - 05 95 - 05 00 - 05 2004 2005 2006 2007
1.7 2.5 2.7 3.2 3.1 3.0 3.9 5.7 5.2 5.6 5.9 ÉCONOMIES EN DÉVELOPPEMENT
0.9 1.6 1.7 2.0 2.0 1.8 2.6 4.6 3.9 4.3 4.5 Économies en développement sans la Chine
1.8 2.7 2.8 3.4 3.3 3.1 4.0 5.8 5.3 5.8 6.0 Économies en développement sans les PMA
0.9 2.4 2.4 2.9 2.5 2.2 2.6 5.2 4.2 4.7 4.4 Pays en développement à revenu élevé
0.8 1.1 1.2 1.6 1.6 1.6 2.7 4.4 3.4 3.6 4.1 Pays en développement à revenu intermédiaire
3.6 4.2 4.4 4.9 5.0 4.9 6.0 7.0 7.2 7.7 8.1 Pays en développement à revenu faible
-0.8 -0.5 0.0 0.5 1.0 1.5 2.1 3.3 3.0 3.6 3.5 Pays pauvres très endettés
0.0 1.7 1.8 1.4 1.6 2.0 3.4 5.1 4.9 5.2 5.2 Pays en développement sans littoral
-0.6 0.4 0.8 1.8 1.9 2.0 2.1 2.8 2.1 4.3 2.6 Petits États insulaires en développement
-0.4 0.2 0.8 1.3 2.1 2.9 3.7 4.7 5.3 4.9 5.1 Pays les moins avancés
-1.0 -0.4 0.2 0.6 1.4 2.3 3.2 4.7 5.0 5.2 5.7 Afrique et Haïti
0.7 1.1 1.7 2.6 3.2 3.9 4.7 4.8 5.8 4.4 4.2 Asie
-0.1 -0.4 -0.3 1.5 0.7 -0.1 -0.2 2.3 -2.0 5.2 2.3 Îles
-2.6 -0.7 -0.1 0.6 1.1 1.7 3.0 4.9 4.4 4.0 4.0 Principaux exportateurs de pétrole
-1.5 -0.9 -0.3 -0.2 0.9 2.0 3.6 3.9 4.6 3.5 4.8 Afrique
-2.0 -0.5 -0.3 0.0 0.0 -0.1 1.5 13.1 7.5 7.7 5.5 Amérique
-3.5 -0.8 0.0 1.2 1.6 2.0 3.1 4.4 4.0 3.7 3.5 Asie
3.6 4.0 4.0 4.4 4.2 4.0 4.7 6.4 5.7 6.4 6.7 Principaux exportateurs d'articles manufacturés
0.1 0.6 0.7 1.3 1.3 1.3 1.2 3.9 1.9 2.9 3.3 Amérique
5.6 5.6 5.4 5.5 5.2 4.7 5.6 7.0 6.7 7.3 7.5 Asie
1.8 2.6 2.5 3.0 2.5 2.0 2.3 4.7 3.3 4.0 4.3 Économies émergentes
-0.4 0.6 0.8 1.8 1.4 1.1 1.4 4.6 3.1 3.8 4.2 Amérique
6.5 6.1 5.4 4.7 4.0 3.1 3.6 5.0 3.6 4.5 4.7 Asie
5.2 5.1 4.5 3.9 3.3 2.4 3.1 4.6 3.5 4.2 4.5 Économies nouvellement industrialisées
7.0 6.2 5.6 4.9 4.3 3.5 3.6 5.3 4.1 4.9 5.1 Première génération
3.2 4.0 3.5 2.9 2.4 1.3 3.5 4.5 3.7 4.0 4.6 Deuxième génération
-0.5 -0.4 0.1 0.2 0.8 1.5 2.4 3.2 3.3 3.3 3.5 Économies en développement : Afrique
0.1 0.3 0.7 1.0 1.6 2.3 3.0 3.3 3.6 3.5 3.7 Afrique septentrionale sans le Soudan
-0.8 -0.5 -0.1 0.0 0.7 1.3 2.3 3.4 3.3 3.4 3.7 Afrique subsaharienne
-0.4 -0.1 0.3 0.2 0.9 1.6 2.6 3.7 3.6 3.5 4.0 Afrique subsaharienne sans l'Afrique du Sud
-0.3 0.6 0.7 1.5 1.2 1.0 1.4 4.7 3.4 4.1 4.4 Économies en développement : Amérique
-0.6 0.4 0.7 1.2 1.4 2.1 1.1 3.0 2.5 4.3 2.7 Amérique centrale et Grandes Antilles sans Porto Rico
0.3 -0.2 0.3 0.9 1.4 2.2 1.9 2.5 4.8 6.3 5.4 Amérique centrale et Grandes Antilles sans le Mexique et Porto Rico
-0.4 0.6 0.7 1.6 1.2 0.9 1.3 4.8 3.3 3.9 4.3 Amérique du Sud et Amérique centrale
-1.3 0.7 0.7 2.1 1.0 0.0 1.4 7.1 6.3 5.9 6.4 Amérique du Sud sans le Brésil
3.7 4.3 4.3 4.6 4.4 4.1 5.2 6.5 6.2 6.6 6.8 Économies en développement : Asie
4.9 4.7 4.3 3.8 3.3 2.5 3.2 4.7 3.6 4.3 4.5 Asie orientale et Asie du Sud-Est sans la Chine
0.1 1.1 1.4 1.4 2.0 2.6 3.9 3.7 3.7 4.3 4.3 Asie méridionale sans l'Inde
Régions,pays ou territoires
Per capita real gross domestic product / Produit intérieur brut réel par habitantPercentage / En pourcentage
8.2.2 Taux de croissance annuels moyens du produit intérieur brut réel totalet par habitant des groupements économiques
Sources : - Données et estimations du secrétariat de la CNUCED sur la base de données de ONU DAES Division de statistique
407 8
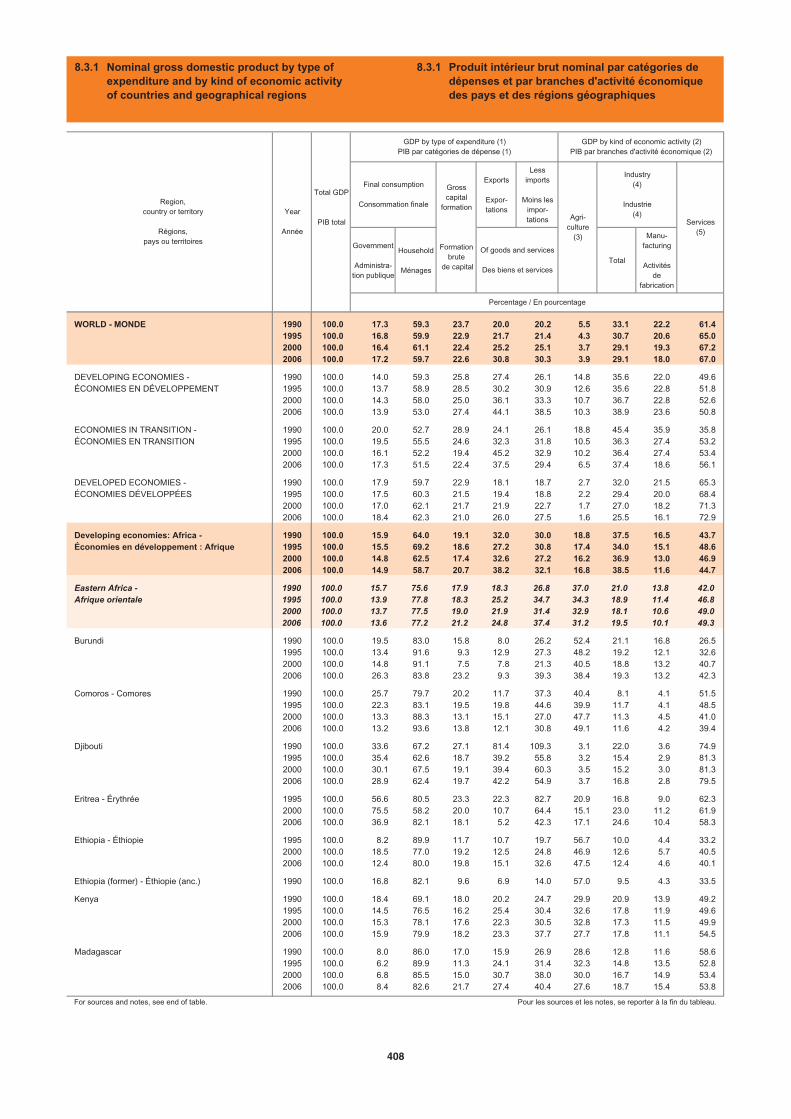
Exports
Expor-tations
Lessimports
Moins les impor-tations
Government
Administra-tion publique
Household
MénagesTotal
Manu-facturing
Activitésde
fabrication
WORLD - MONDE 1990 100.0 17.3 59.3 23.7 20.0 20.2 5.5 33.1 22.2 61.41995 100.0 16.8 59.9 22.9 21.7 21.4 4.3 30.7 20.6 65.02000 100.0 16.4 61.1 22.4 25.2 25.1 3.7 29.1 19.3 67.22006 100.0 17.2 59.7 22.6 30.8 30.3 3.9 29.1 18.0 67.0
DEVELOPING ECONOMIES - 1990 100.0 14.0 59.3 25.8 27.4 26.1 14.8 35.6 22.0 49.6ÉCONOMIES EN DÉVELOPPEMENT 1995 100.0 13.7 58.9 28.5 30.2 30.9 12.6 35.6 22.8 51.8
2000 100.0 14.3 58.0 25.0 36.1 33.3 10.7 36.7 22.8 52.62006 100.0 13.9 53.0 27.4 44.1 38.5 10.3 38.9 23.6 50.8
ECONOMIES IN TRANSITION - 1990 100.0 20.0 52.7 28.9 24.1 26.1 18.8 45.4 35.9 35.8ÉCONOMIES EN TRANSITION 1995 100.0 19.5 55.5 24.6 32.3 31.8 10.5 36.3 27.4 53.2
2000 100.0 16.1 52.2 19.4 45.2 32.9 10.2 36.4 27.4 53.42006 100.0 17.3 51.5 22.4 37.5 29.4 6.5 37.4 18.6 56.1
DEVELOPED ECONOMIES - 1990 100.0 17.9 59.7 22.9 18.1 18.7 2.7 32.0 21.5 65.3ÉCONOMIES DÉVELOPPÉES 1995 100.0 17.5 60.3 21.5 19.4 18.8 2.2 29.4 20.0 68.4
2000 100.0 17.0 62.1 21.7 21.9 22.7 1.7 27.0 18.2 71.32006 100.0 18.4 62.3 21.0 26.0 27.5 1.6 25.5 16.1 72.9
Developing economies: Africa - 1990 100.0 15.9 64.0 19.1 32.0 30.0 18.8 37.5 16.5 43.7Économies en développement : Afrique 1995 100.0 15.5 69.2 18.6 27.2 30.8 17.4 34.0 15.1 48.6
2000 100.0 14.8 62.5 17.4 32.6 27.2 16.2 36.9 13.0 46.92006 100.0 14.9 58.7 20.7 38.2 32.1 16.8 38.5 11.6 44.7
Eastern Africa - 1990 100.0 15.7 75.6 17.9 18.3 26.8 37.0 21.0 13.8 42.0Afrique orientale 1995 100.0 13.9 77.8 18.3 25.2 34.7 34.3 18.9 11.4 46.8
2000 100.0 13.7 77.5 19.0 21.9 31.4 32.9 18.1 10.6 49.02006 100.0 13.6 77.2 21.2 24.8 37.4 31.2 19.5 10.1 49.3
Burundi 1990 100.0 19.5 83.0 15.8 8.0 26.2 52.4 21.1 16.8 26.51995 100.0 13.4 91.6 9.3 12.9 27.3 48.2 19.2 12.1 32.62000 100.0 14.8 91.1 7.5 7.8 21.3 40.5 18.8 13.2 40.72006 100.0 26.3 83.8 23.2 9.3 39.3 38.4 19.3 13.2 42.3
Comoros - Comores 1990 100.0 25.7 79.7 20.2 11.7 37.3 40.4 8.1 4.1 51.51995 100.0 22.3 83.1 19.5 19.8 44.6 39.9 11.7 4.1 48.52000 100.0 13.3 88.3 13.1 15.1 27.0 47.7 11.3 4.5 41.02006 100.0 13.2 93.6 13.8 12.1 30.8 49.1 11.6 4.2 39.4
Djibouti 1990 100.0 33.6 67.2 27.1 81.4 109.3 3.1 22.0 3.6 74.91995 100.0 35.4 62.6 18.7 39.2 55.8 3.2 15.4 2.9 81.32000 100.0 30.1 67.5 19.1 39.4 60.3 3.5 15.2 3.0 81.32006 100.0 28.9 62.4 19.7 42.2 54.9 3.7 16.8 2.8 79.5
Eritrea - Érythrée 1995 100.0 56.6 80.5 23.3 22.3 82.7 20.9 16.8 9.0 62.32000 100.0 75.5 58.2 20.0 10.7 64.4 15.1 23.0 11.2 61.92006 100.0 36.9 82.1 18.1 5.2 42.3 17.1 24.6 10.4 58.3
Ethiopia - Éthiopie 1995 100.0 8.2 89.9 11.7 10.7 19.7 56.7 10.0 4.4 33.22000 100.0 18.5 77.0 19.2 12.5 24.8 46.9 12.6 5.7 40.52006 100.0 12.4 80.0 19.8 15.1 32.6 47.5 12.4 4.6 40.1
Ethiopia (former) - Éthiopie (anc.) 1990 100.0 16.8 82.1 9.6 6.9 14.0 57.0 9.5 4.3 33.5
Kenya 1990 100.0 18.4 69.1 18.0 20.2 24.7 29.9 20.9 13.9 49.21995 100.0 14.5 76.5 16.2 25.4 30.4 32.6 17.8 11.9 49.62000 100.0 15.3 78.1 17.6 22.3 30.5 32.8 17.3 11.5 49.92006 100.0 15.9 79.9 18.2 23.3 37.7 27.7 17.8 11.1 54.5
Madagascar 1990 100.0 8.0 86.0 17.0 15.9 26.9 28.6 12.8 11.6 58.61995 100.0 6.2 89.9 11.3 24.1 31.4 32.3 14.8 13.5 52.82000 100.0 6.8 85.5 15.0 30.7 38.0 30.0 16.7 14.9 53.42006 100.0 8.4 82.6 21.7 27.4 40.4 27.6 18.7 15.4 53.8
For sources and notes, see end of table. Pour les sources et les notes, se reporter à la fin du tableau.
Year
Année
GDP by kind of economic activity (2)PIB par branches d'activité économique (2)
Industry(4)
Industrie(4)
Region,country or territory
Régions,pays ou territoires
Final consumption
Consommation finale
GDP by type of expenditure (1)PIB par catégories de dépense (1)
Total GDP
PIB total
Percentage / En pourcentage
Of goods and services
Des biens et services
Grosscapital
formation
Formationbrute
de capital
Agri-culture
(3)
Services(5)
8.3.1 Nominal gross domestic product by type ofexpenditure and by kind of economic activityof countries and geographical regions
8.3.1 Produit intérieur brut nominal par catégories de dépenses et par branches d'activité économiquedes pays et des régions géographiques
408

Exports
Expor-tations
Lessimports
Moins les impor-tations
Government
Administra-tion publique
Household
MénagesTotal
Manu-facturing
Activitésde
fabrication
Malawi 1990 100.0 16.2 91.6 17.1 25.3 36.2 45.0 28.9 19.5 26.11995 100.0 20.6 76.1 17.1 33.0 46.7 30.4 19.6 15.8 50.02000 100.0 14.6 81.1 14.5 25.1 35.3 39.5 17.9 12.9 42.52006 100.0 16.2 104.3 10.5 24.3 55.3 38.3 17.1 11.6 44.6
Mauritius - Maurice 1990 100.0 12.7 64.6 30.3 66.8 74.3 12.1 33.7 25.9 54.31995 100.0 13.1 63.7 25.6 58.6 61.1 10.0 30.9 22.2 59.12000 100.0 14.1 60.3 26.1 61.4 61.9 6.6 29.3 22.2 64.12006 100.0 14.3 72.4 23.4 61.8 71.9 5.1 25.8 18.5 69.1
Mozambique 1990 100.0 12.0 102.3 19.7 6.1 38.3 37.1 18.4 11.7 44.51995 100.0 9.7 99.4 30.6 12.6 52.4 33.9 14.2 7.4 51.92000 100.0 11.5 80.1 33.5 12.7 37.8 23.6 24.1 12.0 52.32006 100.0 11.6 60.7 24.8 42.3 37.5 21.5 26.5 13.0 52.0
Rwanda 1990 100.0 10.2 84.4 13.9 5.7 14.1 43.6 23.6 15.8 32.81995 100.0 9.2 100.6 13.5 5.8 29.1 44.0 16.0 10.2 40.02000 100.0 8.9 90.2 18.0 6.3 23.4 40.7 19.7 10.0 39.72006 100.0 13.8 90.4 20.8 9.6 34.5 41.8 20.3 9.2 37.9
Seychelles 1990 100.0 27.7 52.0 24.6 62.5 66.7 5.7 19.1 11.9 75.21995 100.0 27.7 51.0 30.1 53.4 60.1 4.5 24.4 13.6 71.12000 100.0 26.2 38.2 35.1 77.7 79.6 3.0 31.0 20.5 66.02006 100.0 22.1 50.0 15.6 106.1 95.7 2.6 27.7 15.1 69.6
Somalia - Somalie 1990 100.0 10.3 71.0 23.6 0.9 5.7 69.3 6.0 2.0 24.71995 100.0 8.5 72.2 20.7 0.3 1.7 60.1 7.3 2.5 32.62000 100.0 8.6 72.4 20.4 0.3 1.7 60.1 7.3 2.5 32.62006 100.0 8.7 72.4 20.3 0.3 1.7 60.1 7.3 2.5 32.6
Uganda - Ouganda 1990 100.0 9.7 82.0 14.7 6.9 17.7 52.8 12.5 6.4 34.71995 100.0 11.6 77.4 16.8 10.9 19.4 46.5 16.0 7.9 37.52000 100.0 13.7 80.6 18.9 10.7 23.6 36.9 20.1 9.3 43.02006 100.0 13.7 78.1 24.8 14.4 32.2 32.2 21.4 9.0 46.4
United Republic of Tanzania - 1990 100.0 10.3 76.0 35.0 11.8 33.5 44.2 15.3 8.3 40.6République-Unie de Tanzanie 1995 100.0 15.3 83.9 19.8 24.1 41.5 44.9 14.1 6.9 41.0
2000 100.0 6.6 83.4 17.6 14.6 23.0 43.7 15.3 7.3 41.02006 100.0 7.7 81.3 22.5 23.5 32.9 44.5 16.3 6.9 39.2
Zambia - Zambie 1990 100.0 19.0 64.4 17.3 35.9 36.6 20.6 51.3 36.1 28.11995 100.0 15.5 72.3 15.9 36.1 39.8 17.3 33.6 10.6 49.12000 100.0 9.5 82.2 18.7 21.1 31.4 21.0 23.8 10.8 55.22006 100.0 13.5 68.2 25.9 18.8 26.7 21.8 26.8 11.2 51.3
Zimbabwe 1990 100.0 19.4 63.1 17.4 22.9 22.8 16.1 32.4 22.3 51.51995 100.0 17.9 59.3 25.4 38.0 40.7 14.9 28.5 21.4 56.62000 100.0 16.4 70.7 13.1 32.7 32.9 20.2 16.5 11.7 63.32006 100.0 31.2 73.3 9.6 49.8 60.7 15.2 25.7 17.3 59.1
Middle Africa - 1990 100.0 20.8 60.1 16.8 39.1 37.6 20.1 34.5 11.2 45.4Afrique centrale 1995 100.0 18.8 56.0 20.1 41.9 36.9 25.2 38.1 11.0 36.8
2000 100.0 19.1 47.1 17.8 52.1 36.1 19.2 49.6 8.8 31.32006 100.0 14.3 42.3 18.7 63.8 39.2 14.5 56.8 7.5 28.6
Angola 1990 100.0 28.6 44.8 11.7 39.0 23.7 18.0 40.8 4.9 41.21995 100.0 52.3 21.9 27.9 76.2 78.2 7.4 67.4 4.0 25.22000 100.0 42.5 15.6 15.1 89.6 62.8 5.7 73.1 2.9 21.22006 100.0 20.4 39.1 13.1 74.2 46.8 8.0 66.1 3.8 26.0
Cameroon - Cameroun 1990 100.0 11.4 76.7 15.0 17.9 21.1 18.2 32.9 19.2 48.91995 100.0 8.7 72.2 13.3 23.6 17.8 23.5 31.1 21.5 45.42000 100.0 9.5 70.2 16.7 23.3 19.7 22.0 35.5 20.7 42.52006 100.0 10.7 66.8 21.5 27.2 26.1 22.2 31.9 20.5 45.9
For sources and notes, see end of table. Pour les sources et les notes, se reporter à la fin du tableau.
Region,country or territory
Régions,pays ou territoires
Year
Année
Total GDP
PIB total
GDP by type of expenditure (1)PIB par catégories de dépense (1)
GDP by kind of economic activity (2)PIB par branches d'activité économique (2)
Final consumption
Consommation finale
Grosscapital
formation
Formationbrute
de capital
Agri-culture
(3)
Industry(4)
Industrie(4)
Services(5)
Of goods and services
Des biens et services
Percentage / En pourcentage
8.3.1 Nominal gross domestic product by type ofexpenditure and by kind of economic activityof countries and geographical regions
8.3.1 Produit intérieur brut nominal par catégories de dépenses et par branches d'activité économiquedes pays et des régions géographiques
409 8
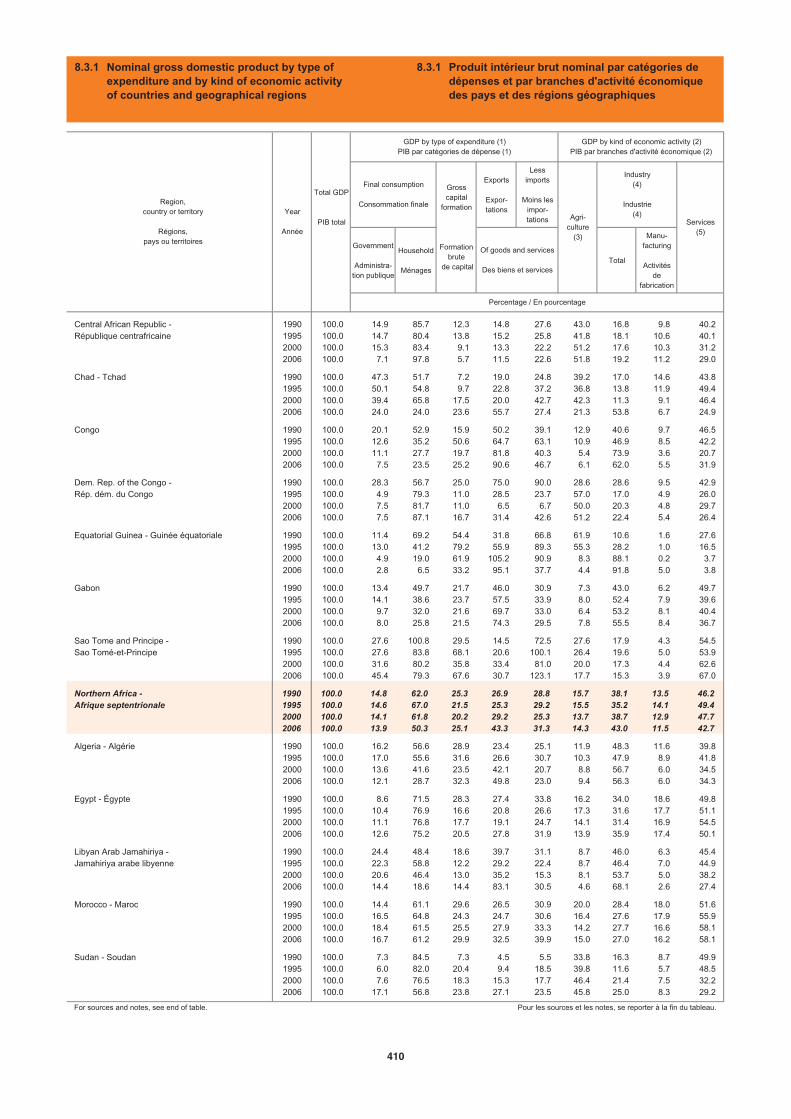
Exports
Expor-tations
Lessimports
Moins les impor-tations
Government
Administra-tion publique
Household
MénagesTotal
Manu-facturing
Activitésde
fabrication
Central African Republic - 1990 100.0 14.9 85.7 12.3 14.8 27.6 43.0 16.8 9.8 40.2République centrafricaine 1995 100.0 14.7 80.4 13.8 15.2 25.8 41.8 18.1 10.6 40.1
2000 100.0 15.3 83.4 9.1 13.3 22.2 51.2 17.6 10.3 31.22006 100.0 7.1 97.8 5.7 11.5 22.6 51.8 19.2 11.2 29.0
Chad - Tchad 1990 100.0 47.3 51.7 7.2 19.0 24.8 39.2 17.0 14.6 43.81995 100.0 50.1 54.8 9.7 22.8 37.2 36.8 13.8 11.9 49.42000 100.0 39.4 65.8 17.5 20.0 42.7 42.3 11.3 9.1 46.42006 100.0 24.0 24.0 23.6 55.7 27.4 21.3 53.8 6.7 24.9
Congo 1990 100.0 20.1 52.9 15.9 50.2 39.1 12.9 40.6 9.7 46.51995 100.0 12.6 35.2 50.6 64.7 63.1 10.9 46.9 8.5 42.22000 100.0 11.1 27.7 19.7 81.8 40.3 5.4 73.9 3.6 20.72006 100.0 7.5 23.5 25.2 90.6 46.7 6.1 62.0 5.5 31.9
Dem. Rep. of the Congo - 1990 100.0 28.3 56.7 25.0 75.0 90.0 28.6 28.6 9.5 42.9Rép. dém. du Congo 1995 100.0 4.9 79.3 11.0 28.5 23.7 57.0 17.0 4.9 26.0
2000 100.0 7.5 81.7 11.0 6.5 6.7 50.0 20.3 4.8 29.72006 100.0 7.5 87.1 16.7 31.4 42.6 51.2 22.4 5.4 26.4
Equatorial Guinea - Guinée équatoriale 1990 100.0 11.4 69.2 54.4 31.8 66.8 61.9 10.6 1.6 27.61995 100.0 13.0 41.2 79.2 55.9 89.3 55.3 28.2 1.0 16.52000 100.0 4.9 19.0 61.9 105.2 90.9 8.3 88.1 0.2 3.72006 100.0 2.8 6.5 33.2 95.1 37.7 4.4 91.8 5.0 3.8
Gabon 1990 100.0 13.4 49.7 21.7 46.0 30.9 7.3 43.0 6.2 49.71995 100.0 14.1 38.6 23.7 57.5 33.9 8.0 52.4 7.9 39.62000 100.0 9.7 32.0 21.6 69.7 33.0 6.4 53.2 8.1 40.42006 100.0 8.0 25.8 21.5 74.3 29.5 7.8 55.5 8.4 36.7
Sao Tome and Principe - 1990 100.0 27.6 100.8 29.5 14.5 72.5 27.6 17.9 4.3 54.5Sao Tomé-et-Principe 1995 100.0 27.6 83.8 68.1 20.6 100.1 26.4 19.6 5.0 53.9
2000 100.0 31.6 80.2 35.8 33.4 81.0 20.0 17.3 4.4 62.62006 100.0 45.4 79.3 67.6 30.7 123.1 17.7 15.3 3.9 67.0
Northern Africa - 1990 100.0 14.8 62.0 25.3 26.9 28.8 15.7 38.1 13.5 46.2Afrique septentrionale 1995 100.0 14.6 67.0 21.5 25.3 29.2 15.5 35.2 14.1 49.4
2000 100.0 14.1 61.8 20.2 29.2 25.3 13.7 38.7 12.9 47.72006 100.0 13.9 50.3 25.1 43.3 31.3 14.3 43.0 11.5 42.7
Algeria - Algérie 1990 100.0 16.2 56.6 28.9 23.4 25.1 11.9 48.3 11.6 39.81995 100.0 17.0 55.6 31.6 26.6 30.7 10.3 47.9 8.9 41.82000 100.0 13.6 41.6 23.5 42.1 20.7 8.8 56.7 6.0 34.52006 100.0 12.1 28.7 32.3 49.8 23.0 9.4 56.3 6.0 34.3
Egypt - Égypte 1990 100.0 8.6 71.5 28.3 27.4 33.8 16.2 34.0 18.6 49.81995 100.0 10.4 76.9 16.6 20.8 26.6 17.3 31.6 17.7 51.12000 100.0 11.1 76.8 17.7 19.1 24.7 14.1 31.4 16.9 54.52006 100.0 12.6 75.2 20.5 27.8 31.9 13.9 35.9 17.4 50.1
Libyan Arab Jamahiriya - 1990 100.0 24.4 48.4 18.6 39.7 31.1 8.7 46.0 6.3 45.4Jamahiriya arabe libyenne 1995 100.0 22.3 58.8 12.2 29.2 22.4 8.7 46.4 7.0 44.9
2000 100.0 20.6 46.4 13.0 35.2 15.3 8.1 53.7 5.0 38.22006 100.0 14.4 18.6 14.4 83.1 30.5 4.6 68.1 2.6 27.4
Morocco - Maroc 1990 100.0 14.4 61.1 29.6 26.5 30.9 20.0 28.4 18.0 51.61995 100.0 16.5 64.8 24.3 24.7 30.6 16.4 27.6 17.9 55.92000 100.0 18.4 61.5 25.5 27.9 33.3 14.2 27.7 16.6 58.12006 100.0 16.7 61.2 29.9 32.5 39.9 15.0 27.0 16.2 58.1
Sudan - Soudan 1990 100.0 7.3 84.5 7.3 4.5 5.5 33.8 16.3 8.7 49.91995 100.0 6.0 82.0 20.4 9.4 18.5 39.8 11.6 5.7 48.52000 100.0 7.6 76.5 18.3 15.3 17.7 46.4 21.4 7.5 32.22006 100.0 17.1 56.8 23.8 27.1 23.5 45.8 25.0 8.3 29.2
For sources and notes, see end of table. Pour les sources et les notes, se reporter à la fin du tableau.
Region,country or territory
Régions,pays ou territoires
Year
Année
Total GDP
PIB total
GDP by type of expenditure (1)PIB par catégories de dépense (1)
GDP by kind of economic activity (2)PIB par branches d'activité économique (2)
Final consumption
Consommation finale
Grosscapital
formation
Formationbrute
de capital
Agri-culture
(3)
Industry(4)
Industrie(4)
Services(5)
Of goods and services
Des biens et services
Percentage / En pourcentage
8.3.1 Nominal gross domestic product by type ofexpenditure and by kind of economic activityof countries and geographical regions
8.3.1 Produit intérieur brut nominal par catégories de dépenses et par branches d'activité économiquedes pays et des régions géographiques
410
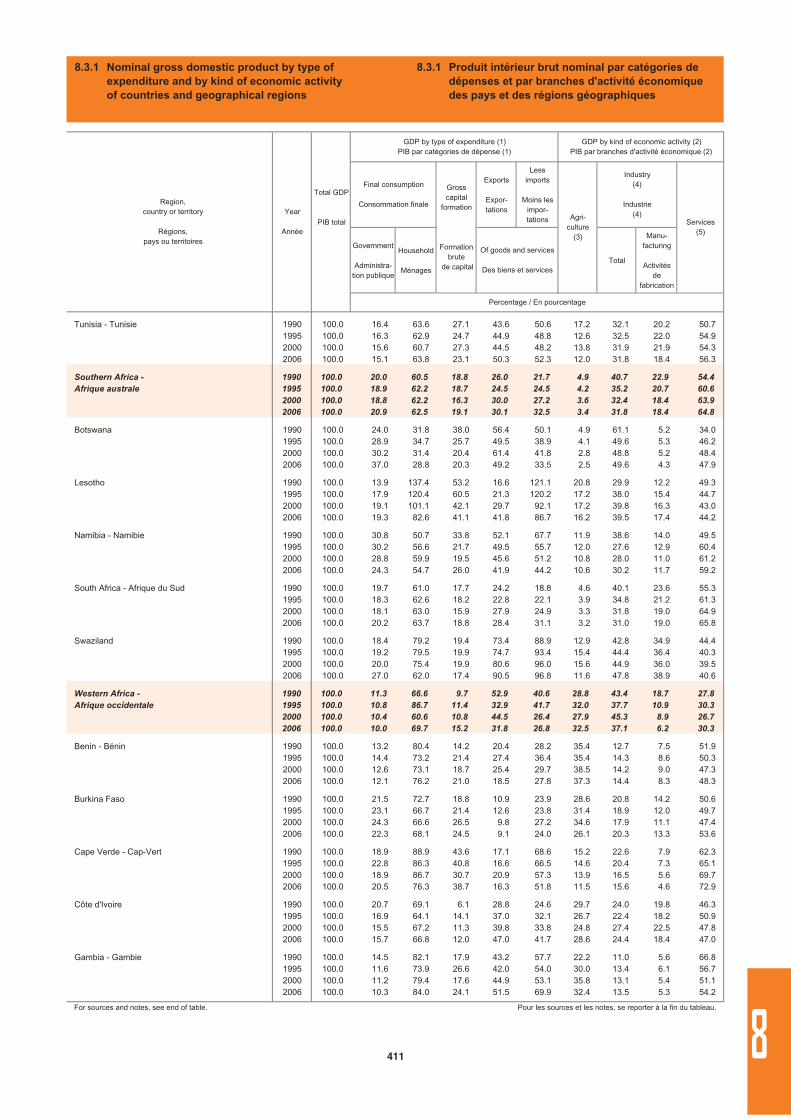
Exports
Expor-tations
Lessimports
Moins les impor-tations
Government
Administra-tion publique
Household
MénagesTotal
Manu-facturing
Activitésde
fabrication
Tunisia - Tunisie 1990 100.0 16.4 63.6 27.1 43.6 50.6 17.2 32.1 20.2 50.71995 100.0 16.3 62.9 24.7 44.9 48.8 12.6 32.5 22.0 54.92000 100.0 15.6 60.7 27.3 44.5 48.2 13.8 31.9 21.9 54.32006 100.0 15.1 63.8 23.1 50.3 52.3 12.0 31.8 18.4 56.3
Southern Africa - 1990 100.0 20.0 60.5 18.8 26.0 21.7 4.9 40.7 22.9 54.4Afrique australe 1995 100.0 18.9 62.2 18.7 24.5 24.5 4.2 35.2 20.7 60.6
2000 100.0 18.8 62.2 16.3 30.0 27.2 3.6 32.4 18.4 63.92006 100.0 20.9 62.5 19.1 30.1 32.5 3.4 31.8 18.4 64.8
Botswana 1990 100.0 24.0 31.8 38.0 56.4 50.1 4.9 61.1 5.2 34.01995 100.0 28.9 34.7 25.7 49.5 38.9 4.1 49.6 5.3 46.22000 100.0 30.2 31.4 20.4 61.4 41.8 2.8 48.8 5.2 48.42006 100.0 37.0 28.8 20.3 49.2 33.5 2.5 49.6 4.3 47.9
Lesotho 1990 100.0 13.9 137.4 53.2 16.6 121.1 20.8 29.9 12.2 49.31995 100.0 17.9 120.4 60.5 21.3 120.2 17.2 38.0 15.4 44.72000 100.0 19.1 101.1 42.1 29.7 92.1 17.2 39.8 16.3 43.02006 100.0 19.3 82.6 41.1 41.8 86.7 16.2 39.5 17.4 44.2
Namibia - Namibie 1990 100.0 30.8 50.7 33.8 52.1 67.7 11.9 38.6 14.0 49.51995 100.0 30.2 56.6 21.7 49.5 55.7 12.0 27.6 12.9 60.42000 100.0 28.8 59.9 19.5 45.6 51.2 10.8 28.0 11.0 61.22006 100.0 24.3 54.7 26.0 41.9 44.2 10.6 30.2 11.7 59.2
South Africa - Afrique du Sud 1990 100.0 19.7 61.0 17.7 24.2 18.8 4.6 40.1 23.6 55.31995 100.0 18.3 62.6 18.2 22.8 22.1 3.9 34.8 21.2 61.32000 100.0 18.1 63.0 15.9 27.9 24.9 3.3 31.8 19.0 64.92006 100.0 20.2 63.7 18.8 28.4 31.1 3.2 31.0 19.0 65.8
Swaziland 1990 100.0 18.4 79.2 19.4 73.4 88.9 12.9 42.8 34.9 44.41995 100.0 19.2 79.5 19.9 74.7 93.4 15.4 44.4 36.4 40.32000 100.0 20.0 75.4 19.9 80.6 96.0 15.6 44.9 36.0 39.52006 100.0 27.0 62.0 17.4 90.5 96.8 11.6 47.8 38.9 40.6
Western Africa - 1990 100.0 11.3 66.6 9.7 52.9 40.6 28.8 43.4 18.7 27.8Afrique occidentale 1995 100.0 10.8 86.7 11.4 32.9 41.7 32.0 37.7 10.9 30.3
2000 100.0 10.4 60.6 10.8 44.5 26.4 27.9 45.3 8.9 26.72006 100.0 10.0 69.7 15.2 31.8 26.8 32.5 37.1 6.2 30.3
Benin - Bénin 1990 100.0 13.2 80.4 14.2 20.4 28.2 35.4 12.7 7.5 51.91995 100.0 14.4 73.2 21.4 27.4 36.4 35.4 14.3 8.6 50.32000 100.0 12.6 73.1 18.7 25.4 29.7 38.5 14.2 9.0 47.32006 100.0 12.1 76.2 21.0 18.5 27.8 37.3 14.4 8.3 48.3
Burkina Faso 1990 100.0 21.5 72.7 18.8 10.9 23.9 28.6 20.8 14.2 50.61995 100.0 23.1 66.7 21.4 12.6 23.8 31.4 18.9 12.0 49.72000 100.0 24.3 66.6 26.5 9.8 27.2 34.6 17.9 11.1 47.42006 100.0 22.3 68.1 24.5 9.1 24.0 26.1 20.3 13.3 53.6
Cape Verde - Cap-Vert 1990 100.0 18.9 88.9 43.6 17.1 68.6 15.2 22.6 7.9 62.31995 100.0 22.8 86.3 40.8 16.6 66.5 14.6 20.4 7.3 65.12000 100.0 18.9 86.7 30.7 20.9 57.3 13.9 16.5 5.6 69.72006 100.0 20.5 76.3 38.7 16.3 51.8 11.5 15.6 4.6 72.9
Côte d'Ivoire 1990 100.0 20.7 69.1 6.1 28.8 24.6 29.7 24.0 19.8 46.31995 100.0 16.9 64.1 14.1 37.0 32.1 26.7 22.4 18.2 50.92000 100.0 15.5 67.2 11.3 39.8 33.8 24.8 27.4 22.5 47.82006 100.0 15.7 66.8 12.0 47.0 41.7 28.6 24.4 18.4 47.0
Gambia - Gambie 1990 100.0 14.5 82.1 17.9 43.2 57.7 22.2 11.0 5.6 66.81995 100.0 11.6 73.9 26.6 42.0 54.0 30.0 13.4 6.1 56.72000 100.0 11.2 79.4 17.6 44.9 53.1 35.8 13.1 5.4 51.12006 100.0 10.3 84.0 24.1 51.5 69.9 32.4 13.5 5.3 54.2
For sources and notes, see end of table. Pour les sources et les notes, se reporter à la fin du tableau.
Region,country or territory
Régions,pays ou territoires
Year
Année
Total GDP
PIB total
GDP by type of expenditure (1)PIB par catégories de dépense (1)
GDP by kind of economic activity (2)PIB par branches d'activité économique (2)
Final consumption
Consommation finale
Grosscapital
formation
Formationbrute
de capital
Agri-culture
(3)
Industry(4)
Industrie(4)
Services(5)
Of goods and services
Des biens et services
Percentage / En pourcentage
8.3.1 Nominal gross domestic product by type ofexpenditure and by kind of economic activityof countries and geographical regions
8.3.1 Produit intérieur brut nominal par catégories de dépenses et par branches d'activité économiquedes pays et des régions géographiques
411 8
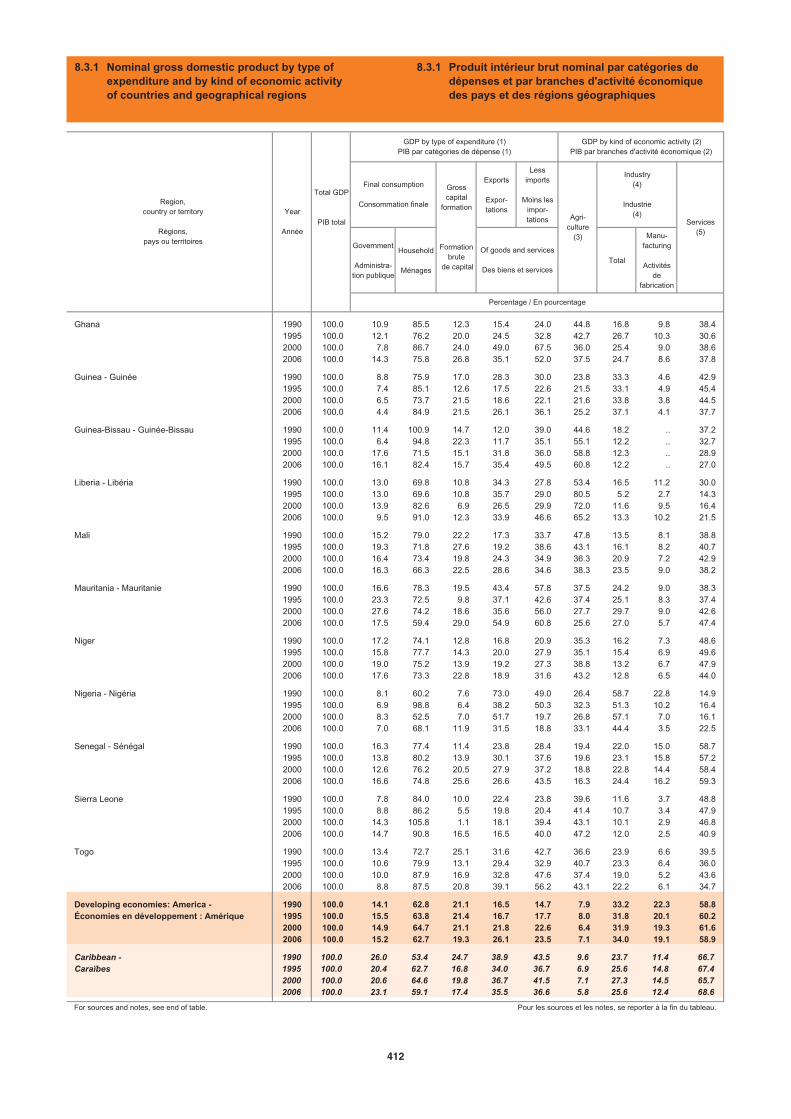
Exports
Expor-tations
Lessimports
Moins les impor-tations
Government
Administra-tion publique
Household
MénagesTotal
Manu-facturing
Activitésde
fabrication
Ghana 1990 100.0 10.9 85.5 12.3 15.4 24.0 44.8 16.8 9.8 38.41995 100.0 12.1 76.2 20.0 24.5 32.8 42.7 26.7 10.3 30.62000 100.0 7.8 86.7 24.0 49.0 67.5 36.0 25.4 9.0 38.62006 100.0 14.3 75.8 26.8 35.1 52.0 37.5 24.7 8.6 37.8
Guinea - Guinée 1990 100.0 8.8 75.9 17.0 28.3 30.0 23.8 33.3 4.6 42.91995 100.0 7.4 85.1 12.6 17.5 22.6 21.5 33.1 4.9 45.42000 100.0 6.5 73.7 21.5 18.6 22.1 21.6 33.8 3.8 44.52006 100.0 4.4 84.9 21.5 26.1 36.1 25.2 37.1 4.1 37.7
Guinea-Bissau - Guinée-Bissau 1990 100.0 11.4 100.9 14.7 12.0 39.0 44.6 18.2 .. 37.21995 100.0 6.4 94.8 22.3 11.7 35.1 55.1 12.2 .. 32.72000 100.0 17.6 71.5 15.1 31.8 36.0 58.8 12.3 .. 28.92006 100.0 16.1 82.4 15.7 35.4 49.5 60.8 12.2 .. 27.0
Liberia - Libéria 1990 100.0 13.0 69.8 10.8 34.3 27.8 53.4 16.5 11.2 30.01995 100.0 13.0 69.6 10.8 35.7 29.0 80.5 5.2 2.7 14.32000 100.0 13.9 82.6 6.9 26.5 29.9 72.0 11.6 9.5 16.42006 100.0 9.5 91.0 12.3 33.9 46.6 65.2 13.3 10.2 21.5
Mali 1990 100.0 15.2 79.0 22.2 17.3 33.7 47.8 13.5 8.1 38.81995 100.0 19.3 71.8 27.6 19.2 38.6 43.1 16.1 8.2 40.72000 100.0 16.4 73.4 19.8 24.3 34.9 36.3 20.9 7.2 42.92006 100.0 16.3 66.3 22.5 28.6 34.6 38.3 23.5 9.0 38.2
Mauritania - Mauritanie 1990 100.0 16.6 78.3 19.5 43.4 57.8 37.5 24.2 9.0 38.31995 100.0 23.3 72.5 9.8 37.1 42.6 37.4 25.1 8.3 37.42000 100.0 27.6 74.2 18.6 35.6 56.0 27.7 29.7 9.0 42.62006 100.0 17.5 59.4 29.0 54.9 60.8 25.6 27.0 5.7 47.4
Niger 1990 100.0 17.2 74.1 12.8 16.8 20.9 35.3 16.2 7.3 48.61995 100.0 15.8 77.7 14.3 20.0 27.9 35.1 15.4 6.9 49.62000 100.0 19.0 75.2 13.9 19.2 27.3 38.8 13.2 6.7 47.92006 100.0 17.6 73.3 22.8 18.9 31.6 43.2 12.8 6.5 44.0
Nigeria - Nigéria 1990 100.0 8.1 60.2 7.6 73.0 49.0 26.4 58.7 22.8 14.91995 100.0 6.9 98.8 6.4 38.2 50.3 32.3 51.3 10.2 16.42000 100.0 8.3 52.5 7.0 51.7 19.7 26.8 57.1 7.0 16.12006 100.0 7.0 68.1 11.9 31.5 18.8 33.1 44.4 3.5 22.5
Senegal - Sénégal 1990 100.0 16.3 77.4 11.4 23.8 28.4 19.4 22.0 15.0 58.71995 100.0 13.8 80.2 13.9 30.1 37.6 19.6 23.1 15.8 57.22000 100.0 12.6 76.2 20.5 27.9 37.2 18.8 22.8 14.4 58.42006 100.0 16.6 74.8 25.6 26.6 43.5 16.3 24.4 16.2 59.3
Sierra Leone 1990 100.0 7.8 84.0 10.0 22.4 23.8 39.6 11.6 3.7 48.81995 100.0 8.8 86.2 5.5 19.8 20.4 41.4 10.7 3.4 47.92000 100.0 14.3 105.8 1.1 18.1 39.4 43.1 10.1 2.9 46.82006 100.0 14.7 90.8 16.5 16.5 40.0 47.2 12.0 2.5 40.9
Togo 1990 100.0 13.4 72.7 25.1 31.6 42.7 36.6 23.9 6.6 39.51995 100.0 10.6 79.9 13.1 29.4 32.9 40.7 23.3 6.4 36.02000 100.0 10.0 87.9 16.9 32.8 47.6 37.4 19.0 5.2 43.62006 100.0 8.8 87.5 20.8 39.1 56.2 43.1 22.2 6.1 34.7
Developing economies: America - 1990 100.0 14.1 62.8 21.1 16.5 14.7 7.9 33.2 22.3 58.8Économies en développement : Amérique 1995 100.0 15.5 63.8 21.4 16.7 17.7 8.0 31.8 20.1 60.2
2000 100.0 14.9 64.7 21.1 21.8 22.6 6.4 31.9 19.3 61.62006 100.0 15.2 62.7 19.3 26.1 23.5 7.1 34.0 19.1 58.9
Caribbean - 1990 100.0 26.0 53.4 24.7 38.9 43.5 9.6 23.7 11.4 66.7Caraïbes 1995 100.0 20.4 62.7 16.8 34.0 36.7 6.9 25.6 14.8 67.4
2000 100.0 20.6 64.6 19.8 36.7 41.5 7.1 27.3 14.5 65.72006 100.0 23.1 59.1 17.4 35.5 36.6 5.8 25.6 12.4 68.6
For sources and notes, see end of table. Pour les sources et les notes, se reporter à la fin du tableau.
Region,country or territory
Régions,pays ou territoires
Year
Année
Total GDP
PIB total
GDP by type of expenditure (1)PIB par catégories de dépense (1)
GDP by kind of economic activity (2)PIB par branches d'activité économique (2)
Final consumption
Consommation finale
Grosscapital
formation
Formationbrute
de capital
Agri-culture
(3)
Industry(4)
Industrie(4)
Services(5)
Of goods and services
Des biens et services
Percentage / En pourcentage
8.3.1 Nominal gross domestic product by type ofexpenditure and by kind of economic activityof countries and geographical regions
8.3.1 Produit intérieur brut nominal par catégories de dépenses et par branches d'activité économiquedes pays et des régions géographiques
412
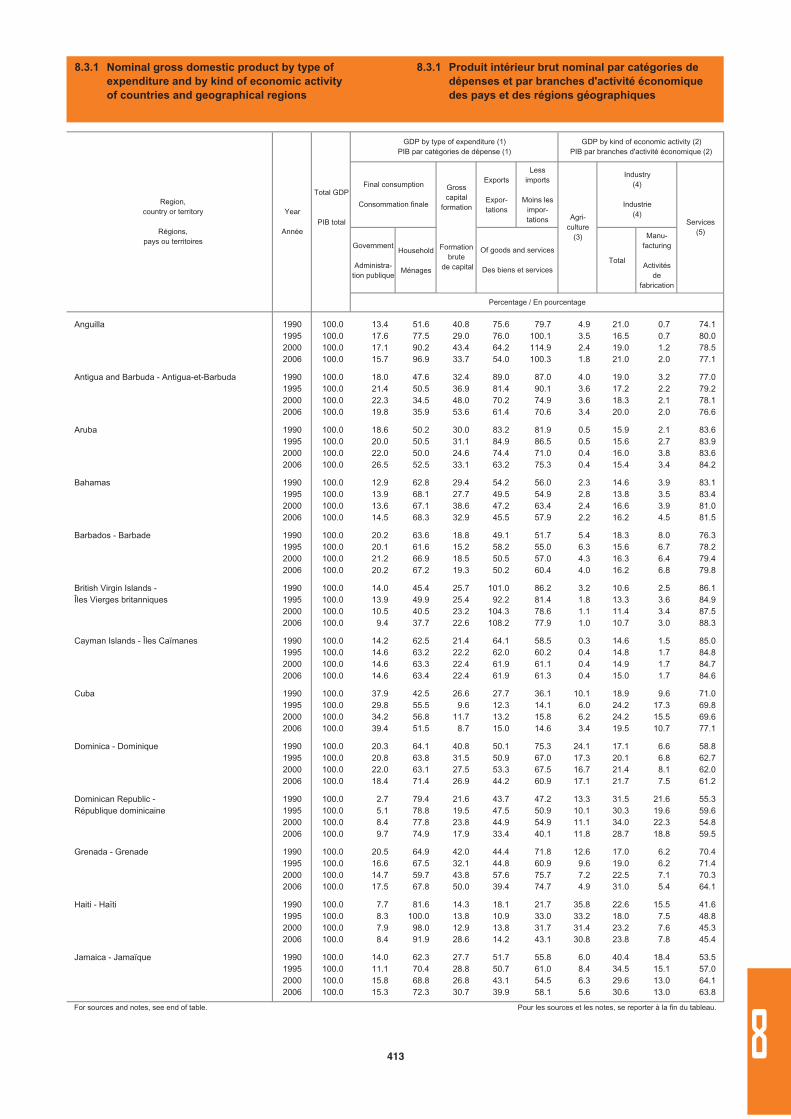
Exports
Expor-tations
Lessimports
Moins les impor-tations
Government
Administra-tion publique
Household
MénagesTotal
Manu-facturing
Activitésde
fabrication
Anguilla 1990 100.0 13.4 51.6 40.8 75.6 79.7 4.9 21.0 0.7 74.11995 100.0 17.6 77.5 29.0 76.0 100.1 3.5 16.5 0.7 80.02000 100.0 17.1 90.2 43.4 64.2 114.9 2.4 19.0 1.2 78.52006 100.0 15.7 96.9 33.7 54.0 100.3 1.8 21.0 2.0 77.1
Antigua and Barbuda - Antigua-et-Barbuda 1990 100.0 18.0 47.6 32.4 89.0 87.0 4.0 19.0 3.2 77.01995 100.0 21.4 50.5 36.9 81.4 90.1 3.6 17.2 2.2 79.22000 100.0 22.3 34.5 48.0 70.2 74.9 3.6 18.3 2.1 78.12006 100.0 19.8 35.9 53.6 61.4 70.6 3.4 20.0 2.0 76.6
Aruba 1990 100.0 18.6 50.2 30.0 83.2 81.9 0.5 15.9 2.1 83.61995 100.0 20.0 50.5 31.1 84.9 86.5 0.5 15.6 2.7 83.92000 100.0 22.0 50.0 24.6 74.4 71.0 0.4 16.0 3.8 83.62006 100.0 26.5 52.5 33.1 63.2 75.3 0.4 15.4 3.4 84.2
Bahamas 1990 100.0 12.9 62.8 29.4 54.2 56.0 2.3 14.6 3.9 83.11995 100.0 13.9 68.1 27.7 49.5 54.9 2.8 13.8 3.5 83.42000 100.0 13.6 67.1 38.6 47.2 63.4 2.4 16.6 3.9 81.02006 100.0 14.5 68.3 32.9 45.5 57.9 2.2 16.2 4.5 81.5
Barbados - Barbade 1990 100.0 20.2 63.6 18.8 49.1 51.7 5.4 18.3 8.0 76.31995 100.0 20.1 61.6 15.2 58.2 55.0 6.3 15.6 6.7 78.22000 100.0 21.2 66.9 18.5 50.5 57.0 4.3 16.3 6.4 79.42006 100.0 20.2 67.2 19.3 50.2 60.4 4.0 16.2 6.8 79.8
British Virgin Islands - 1990 100.0 14.0 45.4 25.7 101.0 86.2 3.2 10.6 2.5 86.1Îles Vierges britanniques 1995 100.0 13.9 49.9 25.4 92.2 81.4 1.8 13.3 3.6 84.9
2000 100.0 10.5 40.5 23.2 104.3 78.6 1.1 11.4 3.4 87.52006 100.0 9.4 37.7 22.6 108.2 77.9 1.0 10.7 3.0 88.3
Cayman Islands - Îles Caïmanes 1990 100.0 14.2 62.5 21.4 64.1 58.5 0.3 14.6 1.5 85.01995 100.0 14.6 63.2 22.2 62.0 60.2 0.4 14.8 1.7 84.82000 100.0 14.6 63.3 22.4 61.9 61.1 0.4 14.9 1.7 84.72006 100.0 14.6 63.4 22.4 61.9 61.3 0.4 15.0 1.7 84.6
Cuba 1990 100.0 37.9 42.5 26.6 27.7 36.1 10.1 18.9 9.6 71.01995 100.0 29.8 55.5 9.6 12.3 14.1 6.0 24.2 17.3 69.82000 100.0 34.2 56.8 11.7 13.2 15.8 6.2 24.2 15.5 69.62006 100.0 39.4 51.5 8.7 15.0 14.6 3.4 19.5 10.7 77.1
Dominica - Dominique 1990 100.0 20.3 64.1 40.8 50.1 75.3 24.1 17.1 6.6 58.81995 100.0 20.8 63.8 31.5 50.9 67.0 17.3 20.1 6.8 62.72000 100.0 22.0 63.1 27.5 53.3 67.5 16.7 21.4 8.1 62.02006 100.0 18.4 71.4 26.9 44.2 60.9 17.1 21.7 7.5 61.2
Dominican Republic - 1990 100.0 2.7 79.4 21.6 43.7 47.2 13.3 31.5 21.6 55.3République dominicaine 1995 100.0 5.1 78.8 19.5 47.5 50.9 10.1 30.3 19.6 59.6
2000 100.0 8.4 77.8 23.8 44.9 54.9 11.1 34.0 22.3 54.82006 100.0 9.7 74.9 17.9 33.4 40.1 11.8 28.7 18.8 59.5
Grenada - Grenade 1990 100.0 20.5 64.9 42.0 44.4 71.8 12.6 17.0 6.2 70.41995 100.0 16.6 67.5 32.1 44.8 60.9 9.6 19.0 6.2 71.42000 100.0 14.7 59.7 43.8 57.6 75.7 7.2 22.5 7.1 70.32006 100.0 17.5 67.8 50.0 39.4 74.7 4.9 31.0 5.4 64.1
Haiti - Haïti 1990 100.0 7.7 81.6 14.3 18.1 21.7 35.8 22.6 15.5 41.61995 100.0 8.3 100.0 13.8 10.9 33.0 33.2 18.0 7.5 48.82000 100.0 7.9 98.0 12.9 13.8 31.7 31.4 23.2 7.6 45.32006 100.0 8.4 91.9 28.6 14.2 43.1 30.8 23.8 7.8 45.4
Jamaica - Jamaïque 1990 100.0 14.0 62.3 27.7 51.7 55.8 6.0 40.4 18.4 53.51995 100.0 11.1 70.4 28.8 50.7 61.0 8.4 34.5 15.1 57.02000 100.0 15.8 68.8 26.8 43.1 54.5 6.3 29.6 13.0 64.12006 100.0 15.3 72.3 30.7 39.9 58.1 5.6 30.6 13.0 63.8
For sources and notes, see end of table. Pour les sources et les notes, se reporter à la fin du tableau.
Region,country or territory
Régions,pays ou territoires
Year
Année
Total GDP
PIB total
GDP by type of expenditure (1)PIB par catégories de dépense (1)
GDP by kind of economic activity (2)PIB par branches d'activité économique (2)
Final consumption
Consommation finale
Grosscapital
formation
Formationbrute
de capital
Agri-culture
(3)
Industry(4)
Industrie(4)
Services(5)
Of goods and services
Des biens et services
Percentage / En pourcentage
8.3.1 Nominal gross domestic product by type ofexpenditure and by kind of economic activityof countries and geographical regions
8.3.1 Produit intérieur brut nominal par catégories de dépenses et par branches d'activité économiquedes pays et des régions géographiques
413 8
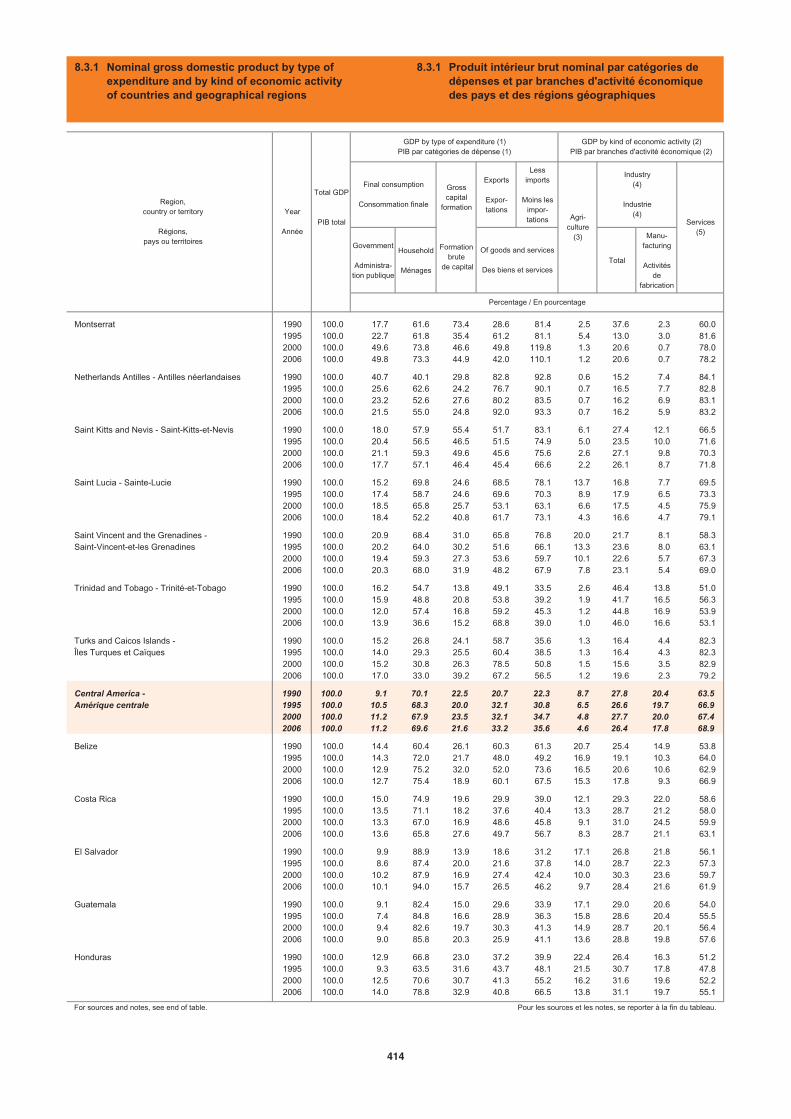
Exports
Expor-tations
Lessimports
Moins les impor-tations
Government
Administra-tion publique
Household
MénagesTotal
Manu-facturing
Activitésde
fabrication
Montserrat 1990 100.0 17.7 61.6 73.4 28.6 81.4 2.5 37.6 2.3 60.01995 100.0 22.7 61.8 35.4 61.2 81.1 5.4 13.0 3.0 81.62000 100.0 49.6 73.8 46.6 49.8 119.8 1.3 20.6 0.7 78.02006 100.0 49.8 73.3 44.9 42.0 110.1 1.2 20.6 0.7 78.2
Netherlands Antilles - Antilles néerlandaises 1990 100.0 40.7 40.1 29.8 82.8 92.8 0.6 15.2 7.4 84.11995 100.0 25.6 62.6 24.2 76.7 90.1 0.7 16.5 7.7 82.82000 100.0 23.2 52.6 27.6 80.2 83.5 0.7 16.2 6.9 83.12006 100.0 21.5 55.0 24.8 92.0 93.3 0.7 16.2 5.9 83.2
Saint Kitts and Nevis - Saint-Kitts-et-Nevis 1990 100.0 18.0 57.9 55.4 51.7 83.1 6.1 27.4 12.1 66.51995 100.0 20.4 56.5 46.5 51.5 74.9 5.0 23.5 10.0 71.62000 100.0 21.1 59.3 49.6 45.6 75.6 2.6 27.1 9.8 70.32006 100.0 17.7 57.1 46.4 45.4 66.6 2.2 26.1 8.7 71.8
Saint Lucia - Sainte-Lucie 1990 100.0 15.2 69.8 24.6 68.5 78.1 13.7 16.8 7.7 69.51995 100.0 17.4 58.7 24.6 69.6 70.3 8.9 17.9 6.5 73.32000 100.0 18.5 65.8 25.7 53.1 63.1 6.6 17.5 4.5 75.92006 100.0 18.4 52.2 40.8 61.7 73.1 4.3 16.6 4.7 79.1
Saint Vincent and the Grenadines - 1990 100.0 20.9 68.4 31.0 65.8 76.8 20.0 21.7 8.1 58.3Saint-Vincent-et-les Grenadines 1995 100.0 20.2 64.0 30.2 51.6 66.1 13.3 23.6 8.0 63.1
2000 100.0 19.4 59.3 27.3 53.6 59.7 10.1 22.6 5.7 67.32006 100.0 20.3 68.0 31.9 48.2 67.9 7.8 23.1 5.4 69.0
Trinidad and Tobago - Trinité-et-Tobago 1990 100.0 16.2 54.7 13.8 49.1 33.5 2.6 46.4 13.8 51.01995 100.0 15.9 48.8 20.8 53.8 39.2 1.9 41.7 16.5 56.32000 100.0 12.0 57.4 16.8 59.2 45.3 1.2 44.8 16.9 53.92006 100.0 13.9 36.6 15.2 68.8 39.0 1.0 46.0 16.6 53.1
Turks and Caicos Islands - 1990 100.0 15.2 26.8 24.1 58.7 35.6 1.3 16.4 4.4 82.3Îles Turques et Caïques 1995 100.0 14.0 29.3 25.5 60.4 38.5 1.3 16.4 4.3 82.3
2000 100.0 15.2 30.8 26.3 78.5 50.8 1.5 15.6 3.5 82.92006 100.0 17.0 33.0 39.2 67.2 56.5 1.2 19.6 2.3 79.2
Central America - 1990 100.0 9.1 70.1 22.5 20.7 22.3 8.7 27.8 20.4 63.5Amérique centrale 1995 100.0 10.5 68.3 20.0 32.1 30.8 6.5 26.6 19.7 66.9
2000 100.0 11.2 67.9 23.5 32.1 34.7 4.8 27.7 20.0 67.42006 100.0 11.2 69.6 21.6 33.2 35.6 4.6 26.4 17.8 68.9
Belize 1990 100.0 14.4 60.4 26.1 60.3 61.3 20.7 25.4 14.9 53.81995 100.0 14.3 72.0 21.7 48.0 49.2 16.9 19.1 10.3 64.02000 100.0 12.9 75.2 32.0 52.0 73.6 16.5 20.6 10.6 62.92006 100.0 12.7 75.4 18.9 60.1 67.5 15.3 17.8 9.3 66.9
Costa Rica 1990 100.0 15.0 74.9 19.6 29.9 39.0 12.1 29.3 22.0 58.61995 100.0 13.5 71.1 18.2 37.6 40.4 13.3 28.7 21.2 58.02000 100.0 13.3 67.0 16.9 48.6 45.8 9.1 31.0 24.5 59.92006 100.0 13.6 65.8 27.6 49.7 56.7 8.3 28.7 21.1 63.1
El Salvador 1990 100.0 9.9 88.9 13.9 18.6 31.2 17.1 26.8 21.8 56.11995 100.0 8.6 87.4 20.0 21.6 37.8 14.0 28.7 22.3 57.32000 100.0 10.2 87.9 16.9 27.4 42.4 10.0 30.3 23.6 59.72006 100.0 10.1 94.0 15.7 26.5 46.2 9.7 28.4 21.6 61.9
Guatemala 1990 100.0 9.1 82.4 15.0 29.6 33.9 17.1 29.0 20.6 54.01995 100.0 7.4 84.8 16.6 28.9 36.3 15.8 28.6 20.4 55.52000 100.0 9.4 82.6 19.7 30.3 41.3 14.9 28.7 20.1 56.42006 100.0 9.0 85.8 20.3 25.9 41.1 13.6 28.8 19.8 57.6
Honduras 1990 100.0 12.9 66.8 23.0 37.2 39.9 22.4 26.4 16.3 51.21995 100.0 9.3 63.5 31.6 43.7 48.1 21.5 30.7 17.8 47.82000 100.0 12.5 70.6 30.7 41.3 55.2 16.2 31.6 19.6 52.22006 100.0 14.0 78.8 32.9 40.8 66.5 13.8 31.1 19.7 55.1
For sources and notes, see end of table. Pour les sources et les notes, se reporter à la fin du tableau.
Region,country or territory
Régions,pays ou territoires
Year
Année
Total GDP
PIB total
GDP by type of expenditure (1)PIB par catégories de dépense (1)
GDP by kind of economic activity (2)PIB par branches d'activité économique (2)
Final consumption
Consommation finale
Grosscapital
formation
Formationbrute
de capital
Agri-culture
(3)
Industry(4)
Industrie(4)
Services(5)
Of goods and services
Des biens et services
Percentage / En pourcentage
8.3.1 Nominal gross domestic product by type ofexpenditure and by kind of economic activityof countries and geographical regions
8.3.1 Produit intérieur brut nominal par catégories de dépenses et par branches d'activité économiquedes pays et des régions géographiques
414

Exports
Expor-tations
Lessimports
Moins les impor-tations
Government
Administra-tion publique
Household
MénagesTotal
Manu-facturing
Activitésde
fabrication
Mexico - Mexique 1990 100.0 8.4 69.6 23.1 18.6 19.7 7.8 28.1 20.6 64.11995 100.0 10.5 67.1 19.8 30.4 27.8 5.2 26.5 19.8 68.32000 100.0 11.2 67.1 23.8 31.0 33.0 4.0 27.7 20.1 68.32006 100.0 11.2 68.4 21.5 33.0 34.1 3.8 26.4 17.8 69.8
Nicaragua 1990 100.0 33.5 66.3 20.5 25.7 46.1 30.0 21.5 16.9 48.51995 100.0 14.9 78.6 22.0 19.1 34.7 22.8 26.6 18.2 50.52000 100.0 17.2 79.0 31.0 23.9 51.1 20.1 27.2 16.4 52.72006 100.0 19.6 80.2 29.1 30.1 59.1 18.9 27.9 17.6 53.2
Panama 1990 100.0 15.7 63.5 14.7 77.9 70.5 9.0 17.7 13.3 73.21995 100.0 13.1 57.4 26.5 90.5 87.8 7.4 19.9 12.5 72.72000 100.0 13.2 59.9 24.1 72.6 69.8 7.0 18.5 9.7 74.52006 100.0 9.9 66.5 21.1 35.9 33.4 6.7 16.3 6.9 77.0
South America - 1990 100.0 15.1 60.7 20.3 13.2 9.5 7.5 35.8 23.8 56.7Amérique du Sud 1995 100.0 16.5 62.7 22.0 11.9 13.3 8.4 33.5 20.5 58.1
2000 100.0 16.4 63.1 19.9 15.4 15.1 7.2 34.4 19.2 58.42006 100.0 16.6 59.6 18.3 22.0 16.6 8.4 38.3 20.2 53.4
Argentina - Argentine 1990 100.0 12.8 66.9 14.0 10.3 4.6 8.0 35.6 26.5 56.41995 100.0 13.3 68.6 17.9 9.7 10.1 5.7 28.0 18.4 66.32000 100.0 13.8 69.3 16.2 11.0 11.6 5.0 27.6 17.5 67.42006 100.0 12.2 63.6 16.4 23.0 15.0 9.3 32.9 21.9 57.9
Bolivia - Bolivie 1990 100.0 11.8 76.9 12.5 22.8 23.9 16.4 34.2 18.2 49.41995 100.0 13.6 75.8 15.2 22.6 27.2 16.4 32.1 18.4 51.52000 100.0 14.5 76.4 18.1 18.3 27.3 14.3 28.3 14.6 57.42006 100.0 15.9 68.6 13.2 30.7 28.4 14.6 29.7 14.0 55.7
Brazil - Brésil 1990 100.0 16.9 58.5 22.9 7.9 6.1 6.0 34.3 24.1 59.71995 100.0 19.6 59.9 22.3 7.7 9.5 8.5 34.5 22.5 57.12000 100.0 19.1 60.9 21.5 10.7 12.2 7.7 36.1 21.6 56.32006 100.0 19.9 60.4 16.8 14.7 11.7 9.0 37.3 23.0 53.7
Chile - Chili 1990 100.0 10.4 60.1 25.6 33.1 29.4 7.1 41.2 18.0 51.71995 100.0 10.5 60.8 26.3 29.2 26.9 6.1 40.8 19.0 53.12000 100.0 12.5 63.8 21.9 31.6 29.7 5.9 37.0 18.7 57.12006 100.0 10.1 55.0 20.4 45.4 30.9 4.1 47.7 13.5 48.2
Colombia - Colombie 1990 100.0 11.4 63.8 22.2 18.6 16.0 18.2 32.6 18.0 49.11995 100.0 14.9 65.7 25.8 14.5 21.0 14.4 30.1 15.2 55.52000 100.0 21.2 63.0 13.7 21.5 19.4 13.5 29.2 15.2 57.32006 100.0 19.0 61.6 21.1 22.5 24.3 11.9 32.0 15.4 56.2
Ecuador - Équateur 1990 100.0 13.0 67.0 17.0 31.4 28.6 13.9 39.5 20.1 46.61995 100.0 12.5 68.5 21.6 25.7 28.3 17.6 26.2 11.9 56.22000 100.0 9.8 64.0 20.1 37.1 31.0 11.5 37.6 5.5 50.92006 100.0 10.8 64.1 23.9 34.0 32.8 6.5 37.5 1.9 56.0
Guyana 1990 100.0 13.6 60.9 42.3 55.1 78.5 43.2 19.7 5.2 37.01995 100.0 16.0 46.3 45.4 79.7 84.9 48.8 25.1 3.8 26.12000 100.0 27.5 49.9 38.5 63.1 81.5 36.1 24.1 3.2 39.92006 100.0 24.6 64.7 45.9 90.1 116.5 34.9 19.4 3.6 45.7
Paraguay 1990 100.0 6.2 77.2 22.9 33.2 39.5 27.8 25.6 17.3 46.61995 100.0 7.2 85.3 23.9 35.0 51.2 24.8 26.2 15.6 49.02000 100.0 12.7 79.2 18.8 38.1 48.8 18.5 24.8 17.2 56.72006 100.0 10.1 65.6 20.3 33.5 35.6 20.5 24.5 16.6 55.0
Peru - Pérou 1990 100.0 11.5 71.2 18.1 15.1 14.5 7.7 30.4 19.4 61.91995 100.0 9.8 71.1 24.8 12.5 18.2 8.8 31.0 16.8 60.22000 100.0 10.6 71.2 20.2 16.0 18.0 8.5 29.9 15.8 61.62006 100.0 9.9 63.1 17.6 27.6 20.7 7.4 32.9 16.1 59.7
For sources and notes, see end of table. Pour les sources et les notes, se reporter à la fin du tableau.
Region,country or territory
Régions,pays ou territoires
Year
Année
Total GDP
PIB total
GDP by type of expenditure (1)PIB par catégories de dépense (1)
GDP by kind of economic activity (2)PIB par branches d'activité économique (2)
Final consumption
Consommation finale
Grosscapital
formation
Formationbrute
de capital
Agri-culture
(3)
Industry(4)
Industrie(4)
Services(5)
Of goods and services
Des biens et services
Percentage / En pourcentage
8.3.1 Nominal gross domestic product by type ofexpenditure and by kind of economic activityof countries and geographical regions
8.3.1 Produit intérieur brut nominal par catégories de dépenses et par branches d'activité économiquedes pays et des régions géographiques
415 8
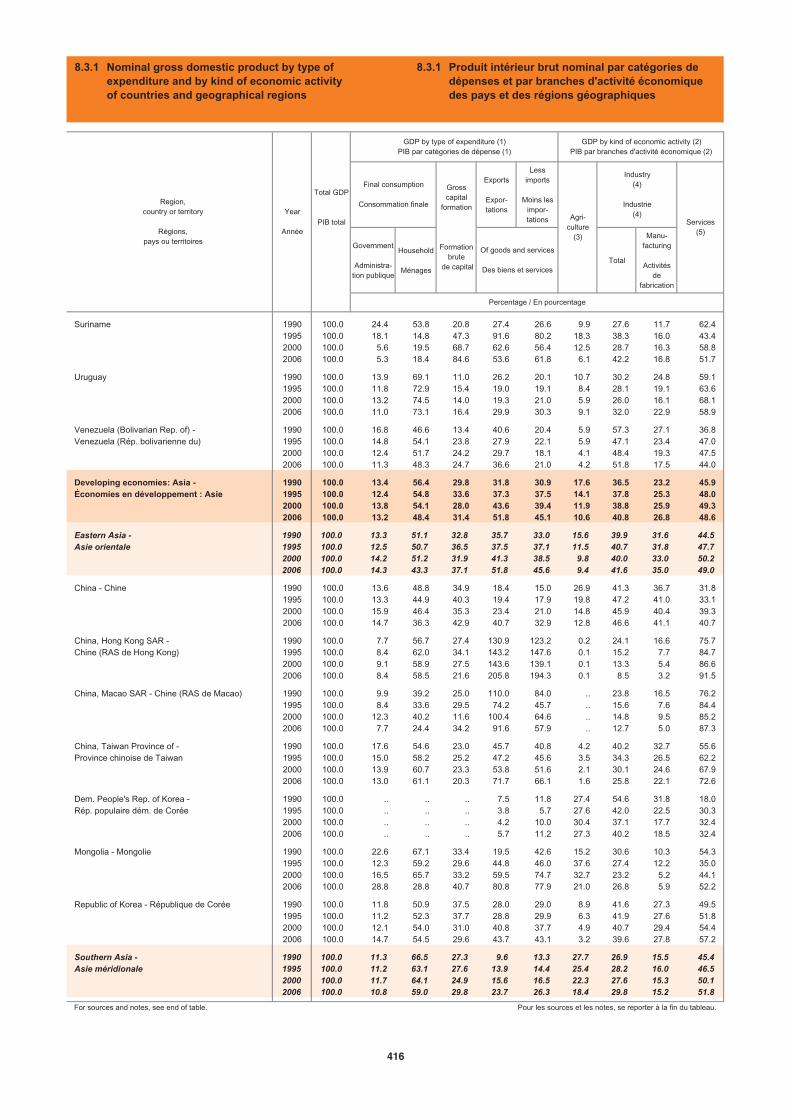
Exports
Expor-tations
Lessimports
Moins les impor-tations
Government
Administra-tion publique
Household
MénagesTotal
Manu-facturing
Activitésde
fabrication
Suriname 1990 100.0 24.4 53.8 20.8 27.4 26.6 9.9 27.6 11.7 62.41995 100.0 18.1 14.8 47.3 91.6 80.2 18.3 38.3 16.0 43.42000 100.0 5.6 19.5 68.7 62.6 56.4 12.5 28.7 16.3 58.82006 100.0 5.3 18.4 84.6 53.6 61.8 6.1 42.2 16.8 51.7
Uruguay 1990 100.0 13.9 69.1 11.0 26.2 20.1 10.7 30.2 24.8 59.11995 100.0 11.8 72.9 15.4 19.0 19.1 8.4 28.1 19.1 63.62000 100.0 13.2 74.5 14.0 19.3 21.0 5.9 26.0 16.1 68.12006 100.0 11.0 73.1 16.4 29.9 30.3 9.1 32.0 22.9 58.9
Venezuela (Bolivarian Rep. of) - 1990 100.0 16.8 46.6 13.4 40.6 20.4 5.9 57.3 27.1 36.8Venezuela (Rép. bolivarienne du) 1995 100.0 14.8 54.1 23.8 27.9 22.1 5.9 47.1 23.4 47.0
2000 100.0 12.4 51.7 24.2 29.7 18.1 4.1 48.4 19.3 47.52006 100.0 11.3 48.3 24.7 36.6 21.0 4.2 51.8 17.5 44.0
Developing economies: Asia - 1990 100.0 13.4 56.4 29.8 31.8 30.9 17.6 36.5 23.2 45.9Économies en développement : Asie 1995 100.0 12.4 54.8 33.6 37.3 37.5 14.1 37.8 25.3 48.0
2000 100.0 13.8 54.1 28.0 43.6 39.4 11.9 38.8 25.9 49.32006 100.0 13.2 48.4 31.4 51.8 45.1 10.6 40.8 26.8 48.6
Eastern Asia - 1990 100.0 13.3 51.1 32.8 35.7 33.0 15.6 39.9 31.6 44.5Asie orientale 1995 100.0 12.5 50.7 36.5 37.5 37.1 11.5 40.7 31.8 47.7
2000 100.0 14.2 51.2 31.9 41.3 38.5 9.8 40.0 33.0 50.22006 100.0 14.3 43.3 37.1 51.8 45.6 9.4 41.6 35.0 49.0
China - Chine 1990 100.0 13.6 48.8 34.9 18.4 15.0 26.9 41.3 36.7 31.81995 100.0 13.3 44.9 40.3 19.4 17.9 19.8 47.2 41.0 33.12000 100.0 15.9 46.4 35.3 23.4 21.0 14.8 45.9 40.4 39.32006 100.0 14.7 36.3 42.9 40.7 32.9 12.8 46.6 41.1 40.7
China, Hong Kong SAR - 1990 100.0 7.7 56.7 27.4 130.9 123.2 0.2 24.1 16.6 75.7Chine (RAS de Hong Kong) 1995 100.0 8.4 62.0 34.1 143.2 147.6 0.1 15.2 7.7 84.7
2000 100.0 9.1 58.9 27.5 143.6 139.1 0.1 13.3 5.4 86.62006 100.0 8.4 58.5 21.6 205.8 194.3 0.1 8.5 3.2 91.5
China, Macao SAR - Chine (RAS de Macao) 1990 100.0 9.9 39.2 25.0 110.0 84.0 .. 23.8 16.5 76.21995 100.0 8.4 33.6 29.5 74.2 45.7 .. 15.6 7.6 84.42000 100.0 12.3 40.2 11.6 100.4 64.6 .. 14.8 9.5 85.22006 100.0 7.7 24.4 34.2 91.6 57.9 .. 12.7 5.0 87.3
China, Taiwan Province of - 1990 100.0 17.6 54.6 23.0 45.7 40.8 4.2 40.2 32.7 55.6Province chinoise de Taiwan 1995 100.0 15.0 58.2 25.2 47.2 45.6 3.5 34.3 26.5 62.2
2000 100.0 13.9 60.7 23.3 53.8 51.6 2.1 30.1 24.6 67.92006 100.0 13.0 61.1 20.3 71.7 66.1 1.6 25.8 22.1 72.6
Dem. People's Rep. of Korea - 1990 100.0 .. .. .. 7.5 11.8 27.4 54.6 31.8 18.0Rép. populaire dém. de Corée 1995 100.0 .. .. .. 3.8 5.7 27.6 42.0 22.5 30.3
2000 100.0 .. .. .. 4.2 10.0 30.4 37.1 17.7 32.42006 100.0 .. .. .. 5.7 11.2 27.3 40.2 18.5 32.4
Mongolia - Mongolie 1990 100.0 22.6 67.1 33.4 19.5 42.6 15.2 30.6 10.3 54.31995 100.0 12.3 59.2 29.6 44.8 46.0 37.6 27.4 12.2 35.02000 100.0 16.5 65.7 33.2 59.5 74.7 32.7 23.2 5.2 44.12006 100.0 28.8 28.8 40.7 80.8 77.9 21.0 26.8 5.9 52.2
Republic of Korea - République de Corée 1990 100.0 11.8 50.9 37.5 28.0 29.0 8.9 41.6 27.3 49.51995 100.0 11.2 52.3 37.7 28.8 29.9 6.3 41.9 27.6 51.82000 100.0 12.1 54.0 31.0 40.8 37.7 4.9 40.7 29.4 54.42006 100.0 14.7 54.5 29.6 43.7 43.1 3.2 39.6 27.8 57.2
Southern Asia - 1990 100.0 11.3 66.5 27.3 9.6 13.3 27.7 26.9 15.5 45.4Asie méridionale 1995 100.0 11.2 63.1 27.6 13.9 14.4 25.4 28.2 16.0 46.5
2000 100.0 11.7 64.1 24.9 15.6 16.5 22.3 27.6 15.3 50.12006 100.0 10.8 59.0 29.8 23.7 26.3 18.4 29.8 15.2 51.8
For sources and notes, see end of table. Pour les sources et les notes, se reporter à la fin du tableau.
Region,country or territory
Régions,pays ou territoires
Year
Année
Total GDP
PIB total
GDP by type of expenditure (1)PIB par catégories de dépense (1)
GDP by kind of economic activity (2)PIB par branches d'activité économique (2)
Final consumption
Consommation finale
Grosscapital
formation
Formationbrute
de capital
Agri-culture
(3)
Industry(4)
Industrie(4)
Services(5)
Of goods and services
Des biens et services
Percentage / En pourcentage
8.3.1 Nominal gross domestic product by type ofexpenditure and by kind of economic activityof countries and geographical regions
8.3.1 Produit intérieur brut nominal par catégories de dépenses et par branches d'activité économiquedes pays et des régions géographiques
416
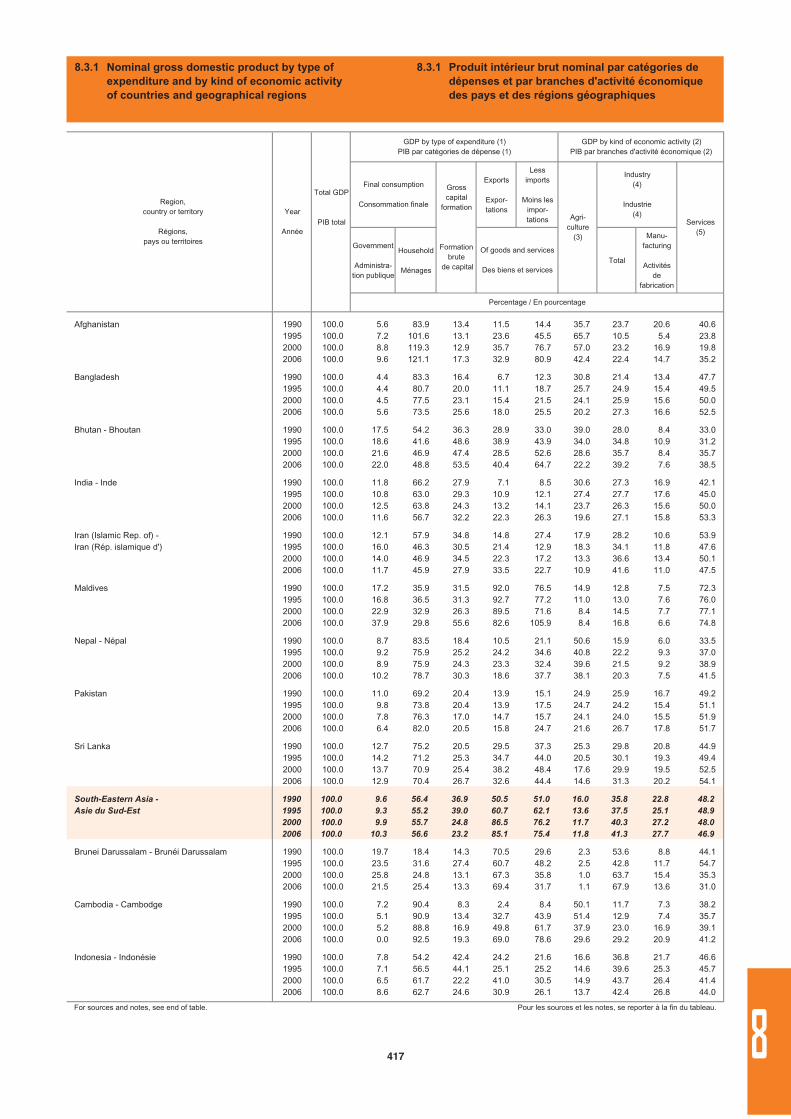
Exports
Expor-tations
Lessimports
Moins les impor-tations
Government
Administra-tion publique
Household
MénagesTotal
Manu-facturing
Activitésde
fabrication
Afghanistan 1990 100.0 5.6 83.9 13.4 11.5 14.4 35.7 23.7 20.6 40.61995 100.0 7.2 101.6 13.1 23.6 45.5 65.7 10.5 5.4 23.82000 100.0 8.8 119.3 12.9 35.7 76.7 57.0 23.2 16.9 19.82006 100.0 9.6 121.1 17.3 32.9 80.9 42.4 22.4 14.7 35.2
Bangladesh 1990 100.0 4.4 83.3 16.4 6.7 12.3 30.8 21.4 13.4 47.71995 100.0 4.4 80.7 20.0 11.1 18.7 25.7 24.9 15.4 49.52000 100.0 4.5 77.5 23.1 15.4 21.5 24.1 25.9 15.6 50.02006 100.0 5.6 73.5 25.6 18.0 25.5 20.2 27.3 16.6 52.5
Bhutan - Bhoutan 1990 100.0 17.5 54.2 36.3 28.9 33.0 39.0 28.0 8.4 33.01995 100.0 18.6 41.6 48.6 38.9 43.9 34.0 34.8 10.9 31.22000 100.0 21.6 46.9 47.4 28.5 52.6 28.6 35.7 8.4 35.72006 100.0 22.0 48.8 53.5 40.4 64.7 22.2 39.2 7.6 38.5
India - Inde 1990 100.0 11.8 66.2 27.9 7.1 8.5 30.6 27.3 16.9 42.11995 100.0 10.8 63.0 29.3 10.9 12.1 27.4 27.7 17.6 45.02000 100.0 12.5 63.8 24.3 13.2 14.1 23.7 26.3 15.6 50.02006 100.0 11.6 56.7 32.2 22.3 26.3 19.6 27.1 15.8 53.3
Iran (Islamic Rep. of) - 1990 100.0 12.1 57.9 34.8 14.8 27.4 17.9 28.2 10.6 53.9Iran (Rép. islamique d') 1995 100.0 16.0 46.3 30.5 21.4 12.9 18.3 34.1 11.8 47.6
2000 100.0 14.0 46.9 34.5 22.3 17.2 13.3 36.6 13.4 50.12006 100.0 11.7 45.9 27.9 33.5 22.7 10.9 41.6 11.0 47.5
Maldives 1990 100.0 17.2 35.9 31.5 92.0 76.5 14.9 12.8 7.5 72.31995 100.0 16.8 36.5 31.3 92.7 77.2 11.0 13.0 7.6 76.02000 100.0 22.9 32.9 26.3 89.5 71.6 8.4 14.5 7.7 77.12006 100.0 37.9 29.8 55.6 82.6 105.9 8.4 16.8 6.6 74.8
Nepal - Népal 1990 100.0 8.7 83.5 18.4 10.5 21.1 50.6 15.9 6.0 33.51995 100.0 9.2 75.9 25.2 24.2 34.6 40.8 22.2 9.3 37.02000 100.0 8.9 75.9 24.3 23.3 32.4 39.6 21.5 9.2 38.92006 100.0 10.2 78.7 30.3 18.6 37.7 38.1 20.3 7.5 41.5
Pakistan 1990 100.0 11.0 69.2 20.4 13.9 15.1 24.9 25.9 16.7 49.21995 100.0 9.8 73.8 20.4 13.9 17.5 24.7 24.2 15.4 51.12000 100.0 7.8 76.3 17.0 14.7 15.7 24.1 24.0 15.5 51.92006 100.0 6.4 82.0 20.5 15.8 24.7 21.6 26.7 17.8 51.7
Sri Lanka 1990 100.0 12.7 75.2 20.5 29.5 37.3 25.3 29.8 20.8 44.91995 100.0 14.2 71.2 25.3 34.7 44.0 20.5 30.1 19.3 49.42000 100.0 13.7 70.9 25.4 38.2 48.4 17.6 29.9 19.5 52.52006 100.0 12.9 70.4 26.7 32.6 44.4 14.6 31.3 20.2 54.1
South-Eastern Asia - 1990 100.0 9.6 56.4 36.9 50.5 51.0 16.0 35.8 22.8 48.2Asie du Sud-Est 1995 100.0 9.3 55.2 39.0 60.7 62.1 13.6 37.5 25.1 48.9
2000 100.0 9.9 55.7 24.8 86.5 76.2 11.7 40.3 27.2 48.02006 100.0 10.3 56.6 23.2 85.1 75.4 11.8 41.3 27.7 46.9
Brunei Darussalam - Brunéi Darussalam 1990 100.0 19.7 18.4 14.3 70.5 29.6 2.3 53.6 8.8 44.11995 100.0 23.5 31.6 27.4 60.7 48.2 2.5 42.8 11.7 54.72000 100.0 25.8 24.8 13.1 67.3 35.8 1.0 63.7 15.4 35.32006 100.0 21.5 25.4 13.3 69.4 31.7 1.1 67.9 13.6 31.0
Cambodia - Cambodge 1990 100.0 7.2 90.4 8.3 2.4 8.4 50.1 11.7 7.3 38.21995 100.0 5.1 90.9 13.4 32.7 43.9 51.4 12.9 7.4 35.72000 100.0 5.2 88.8 16.9 49.8 61.7 37.9 23.0 16.9 39.12006 100.0 0.0 92.5 19.3 69.0 78.6 29.6 29.2 20.9 41.2
Indonesia - Indonésie 1990 100.0 7.8 54.2 42.4 24.2 21.6 16.6 36.8 21.7 46.61995 100.0 7.1 56.5 44.1 25.1 25.2 14.6 39.6 25.3 45.72000 100.0 6.5 61.7 22.2 41.0 30.5 14.9 43.7 26.4 41.42006 100.0 8.6 62.7 24.6 30.9 26.1 13.7 42.4 26.8 44.0
For sources and notes, see end of table. Pour les sources et les notes, se reporter à la fin du tableau.
Region,country or territory
Régions,pays ou territoires
Year
Année
Total GDP
PIB total
GDP by type of expenditure (1)PIB par catégories de dépense (1)
GDP by kind of economic activity (2)PIB par branches d'activité économique (2)
Final consumption
Consommation finale
Grosscapital
formation
Formationbrute
de capital
Agri-culture
(3)
Industry(4)
Industrie(4)
Services(5)
Of goods and services
Des biens et services
Percentage / En pourcentage
8.3.1 Nominal gross domestic product by type ofexpenditure and by kind of economic activityof countries and geographical regions
8.3.1 Produit intérieur brut nominal par catégories de dépenses et par branches d'activité économiquedes pays et des régions géographiques
417 8