Embed Size (px)
Citation preview
http://www.iaeme.com/IJCIET/index.asp 1872 [email protected]
International Journal of Civil Engineering and Technology (IJCIET) Volume 8, Issue 4, April 2017, pp. 1872–1887, Article ID: IJCIET_08_04_214 Available online at http://www.iaeme.com/IJCIET/issues.asp?JType=IJCIET&VType=8&IType=4 ISSN Print: 0976-6308 and ISSN Online: 0976-6316 © IAEME Publication Scopus Indexed
MANUAL ANALYSIS AND DESIGN OF POST TENSIONED PRE-STRESSED CONCRETE
T-BEAM SEGMENT BRIDGE USING PROTO-TYPE MODEL
Palden Humagai, Pavan Kumar Peddineni B. Tech, Department of Civil Engineering, KL University,
Vaddeswaram, Andhra Pradesh, India
C. Raja Mallu Associate Professor, Department of Civil Engineering, KL University,
Vaddeswaram, Andhra Pradesh, India
ABSTRACT The report examines in detail the application of segmental precast T-Beam girder
construction in achieving long spans in bridge structures. Numerous examples from throughout the world indicate that such construction can provide an effective means of achieving long span in the range of 100 to 500 ft. Used segmental pre-cast bridge structure member is manufactured in a number of short units which during erection are joined together, end to end, and post-tensioned to form the completed superstructure. Cantilever concrete T-Beam girder bridges composed of precast reinforced and pre-stressed concrete beams with a T- cross section and a cast-in-place top slab are frequently used for medium spans due to their competitiveness. The service behaviour of such bridges is very much influenced by their segmental construction, due to time-dependent materials behaviour that makes it difficult to accurately predict the stresses, strains, and deflections. A 1:2 scale model of a two-span cantilever bridge was tested in order to study its behaviour during the construction process and under permanent loads. The analysis results were compared with analytical predictions obtained by means of a prototype model developed for the nonlinear and time-dependent analysis of segmentally erected, reinforced and pre-stressed concrete structures. Generally good agreement was obtained, showing the adequacy of the model to reproduce the structural design of the different elements in the post-tensioned pre-stressed bridge structure. Key words: PSC Bridge; Pre-stressed concrete segment; T-beam deck design; Post-tensioned T-beam girder; Post-tensioned deck slab. Cite this Article: Palden Humagai, Pavan Kumar Peddineni and C. Raja Mallu, Manual Analysis and Design of Post Tensioned Pre-Stressed Concrete T-Beam Segment Bridge Using Proto-Type Model. International Journal of Civil Engineering and Technology, 8(4), 2017, pp. 1872–1887. http://www.iaeme.com/IJCIET/issues.asp?JType=IJCIET&VType=8&IType=4

Manual Analysis and Design of Post Tensioned Pre-Stressed Concrete T-Beam Segment Bridge Using Proto-Type Model
http://www.iaeme.com/IJCIET/index.asp 1873 [email protected]
1. INTRODUCTION Precast segmental construction for pre-stressed concrete bridges has been widely used in the world. This method has many advantages, such as quality guaranteed standard precast segments, fast speed construction time and the least site work. Lots of pre-stressed concrete bridges in the world were built by precast segmental construction method in recent 20 years. In Highway Bridge construction there is an increasing trend toward the use of longer spans. This trend is the result of a number of different requirements relating to safety, economy, function, and aesthetics. In 1967 report of the special AASHO Traffic Safety Committee implemented to adopt and use of two-span Bridge for overpasses crossing divided highways in order to eliminate the bridge piers normally placed adjacent to the outside shoulders. The objective of the report is to examine in detail one means of achieving long spans in bridge structures, namely, segmental precast T-beam girder construction.
1.1. Description of the Bridge
Figure 1
1.1. Objective The main aspect of the research is post-tensioned substructures. Relatively few post-tensioned substructures have been used in the past. There are many possible applications in bridge substructures where post-tensioning can provide structural and economical benefits, and can possibly improve durability. Post-tensioning is now being used in cantilever bridge substructures, and it is reasonable to expect the use of post-tensioning to increase in the future as pre-casting of substructure components becomes more prevalent and as foundation sizes increase. This is expected, even though some problems have been encountered in post-tensioned bridges throughout the world as mentioned previously. How to improve durability using post-tensioning, and how to ensure that the post-tensioning system does not introduce new durability problems.
Manual analysis and design of post-tensioned T-beam bridge girder.
A proto-type model developed to define the post-tensioning technique.
To examine the effectiveness use of post-tensioning in bridge substructures.
1.2. Scope The project scope and necessary work plans are:
Extensive Literature Review.

Palden Humagai, Pavan Kumar Peddineni and C. Raja Mallu
http://www.iaeme.com/IJCIET/index.asp 1874 [email protected]
To establish a proto-type model to examine the -effectiveness of post-tensioning under wheel load.
Load consideration as per codal provision (IRC 18-2000, IS 1343-2000).
Analysis and Design of post-tensioned pre-stressed concrete T-beam bridge deck.
3. METHODOLOGY Segmental construction employs precast segments cast of highest quality concrete, in sizes which can be transported and erected. The segments are usually reinforced with mild steel and are designed to be connected by post-tensioning after erection.
3.1. Indian Road Congress Bridge Code (IRC 18-2000) The Indian roads congress (IRC) bridge consists of eight sections as below
Section I - General features of design Section II - Loads and stresses Section III - Cement concrete (plain and reinforced) Section IV- Brick, stone and block masonry Section V - Steel road bridges Section VI - Composite construction Section VII - Foundations and substructure Section VIII - bearings Section I gives the specifications for the preliminary data to be collected, determination of
design discharge, clearances, foundations, etc. section II specifies the loadings for which the bridges have to be designed. The other give rules for guidelines in the design of the bridge superstructure in masonry, reinforced concrete, steel and composite constructions, foundations and bearings.
3.2. Loads to be Considered for Analysis and Design of the Bridge Structure While analysis and designing of road bridges and culverts, the following loads, forces and stresses should be considered, where applicable.
Dead load
Live load
Snow load
Impact or dynamic effect due to vehicles
Impact due to floating bodies or vessels
Wind load
Longitudinal forces caused by the tractive effort of vehicles or by braking of vehicles
Longitudinal forces due to frictional resistance of expansion bridges
Centrifugal force due to curvature
Horizontal force due to water currents
Buoyancy
Earth pressure include live load surcharge
Manual Analysis and Design of Post Tensioned Pre-Stressed Concrete T-Beam Segment Bridge Using Proto-Type Model
http://www.iaeme.com/IJCIET/index.asp 1875 [email protected]
Temperature effects
Deformation effects
Secondary effects
Erection effects
Forces and effects due to earth quake
Grade effect (for design of bearings for bridges built in grade or cross fall)
Wave pressure
3.3. Manual Analysis and Design of Pre-Stressed Concrete T-Beam Bridge Deck Using Proto-Type Model
Assumed Data for the Design (scale1:2) Effective span: 25m.
Clear width of road way: 7.5m.
Foot paths: 1m wide on either side.
Thickness of wearing coat: 100mm at the centre of the road.
Spacing of cross girders: 5m/cc
Live load: IRC class AA tracked vehicle
Type of construction: class-I
Materials: M40 grade concrete for deck slab and M-50 grade concrete for girders, 7mm diameter high strength strands with ultimate tensile strength at 1500 MPa. The cable consists of 12 strands at the end with a suitable diameter anchor block.
Compressive strength of concrete at transfer (fci)= 40 MPa
Permissible stresses and design constants The permissible compressive stresses in the concrete at transfer and at working loads as recommended in IRC-18(2000) are as follows:
fct<0.5 fci= 0.5*40 = 20MPa
Loss ratio = ɳ = 0.8
Permissible compressive stress in concrete under service loads (fcw)=0.33fck(fckis characteristic strength of concrete, in this example, it is 50 MPa, fcw=0.33*50=16.5MPa
Allowable tensile stress in concrete at initial transfer of pre-stress (ftt )=0
Allowable tensile stress in concrete under service loads (fcw)=0 The design constants are computed are as follows: For M40 concrete and Fe 415 steel, as per IRC 21-2000
n =10*200/10*200+13.33= 0.4 j=1-n/3=1-0.4/3=0.4 q = ½*13.33*0.4*0.866=2.3
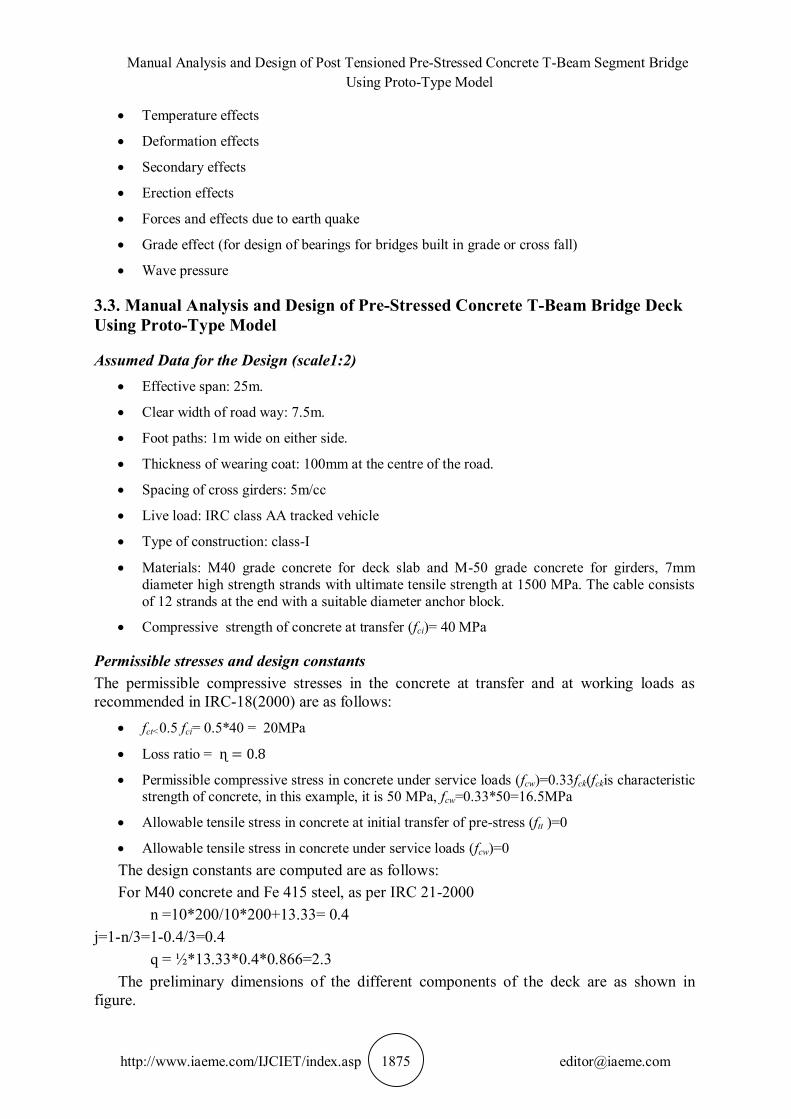
The preliminary dimensions of the different components of the deck are as shown in figure.
Palden Humagai, Pavan Kumar Peddineni and C. Raja Mallu
http://www.iaeme.com/IJCIET/index.asp 1876 [email protected]
Figure 2 Cross-section of Bridge Deck.
Design of interior slab panel
Dead load bending moment and shear force Dead weight of the slab = (1*1*0.25*24)= 6.00KN/m2
Wearing coat = (0.1*22)= 2.2KN/m2 Total design load =8.2 KN/m2
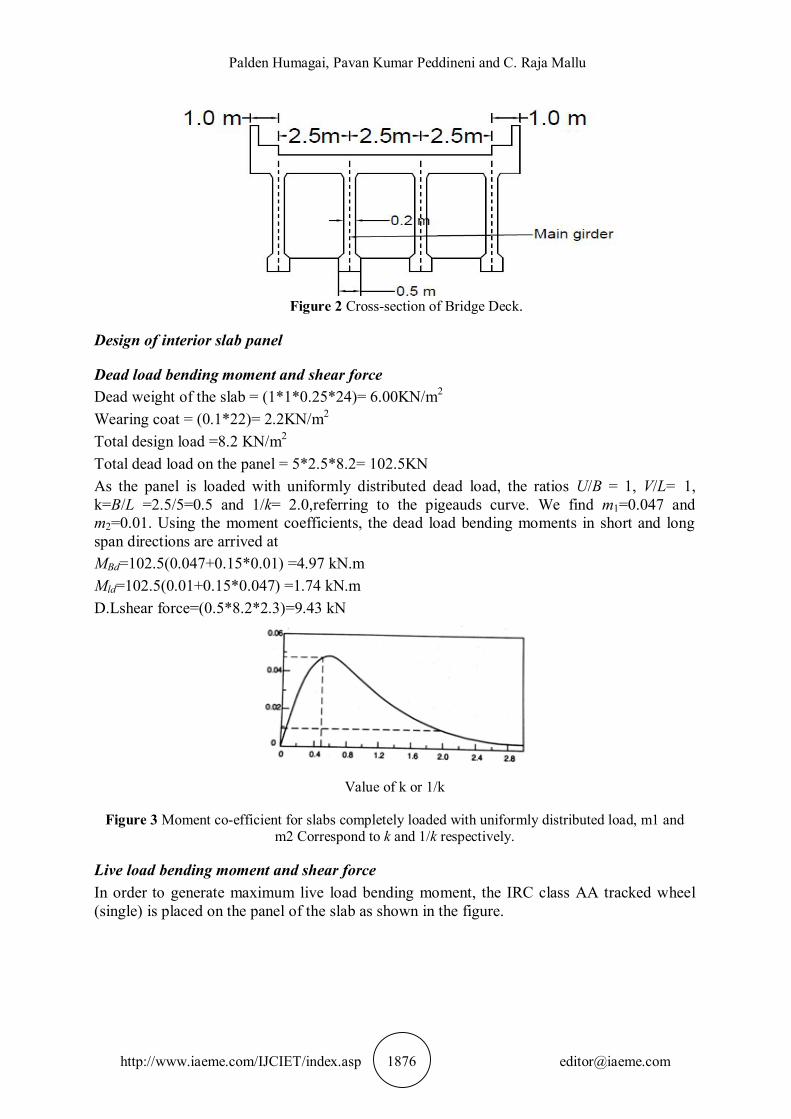
Total dead load on the panel = 5*2.5*8.2= 102.5KN As the panel is loaded with uniformly distributed dead load, the ratios U/B = 1, V/L= 1, k=B/L =2.5/5=0.5 and 1/k= 2.0,referring to the pigeauds curve. We find m1=0.047 and m2=0.01. Using the moment coefficients, the dead load bending moments in short and long span directions are arrived at MBd=102.5(0.047+0.15*0.01) =4.97 kN.m Mld=102.5(0.01+0.15*0.047) =1.74 kN.m D.Lshear force=(0.5*8.2*2.3)=9.43 kN
Value of k or 1/k
Figure 3 Moment co-efficient for slabs completely loaded with uniformly distributed load, m1 and m2 Correspond to k and 1/k respectively.
Live load bending moment and shear force In order to generate maximum live load bending moment, the IRC class AA tracked wheel (single) is placed on the panel of the slab as shown in the figure.
Manual Analysis and Design of Post Tensioned Pre-Stressed Concrete T-Beam Segment Bridge Using Proto-Type Model
http://www.iaeme.com/IJCIET/index.asp 1877 [email protected]
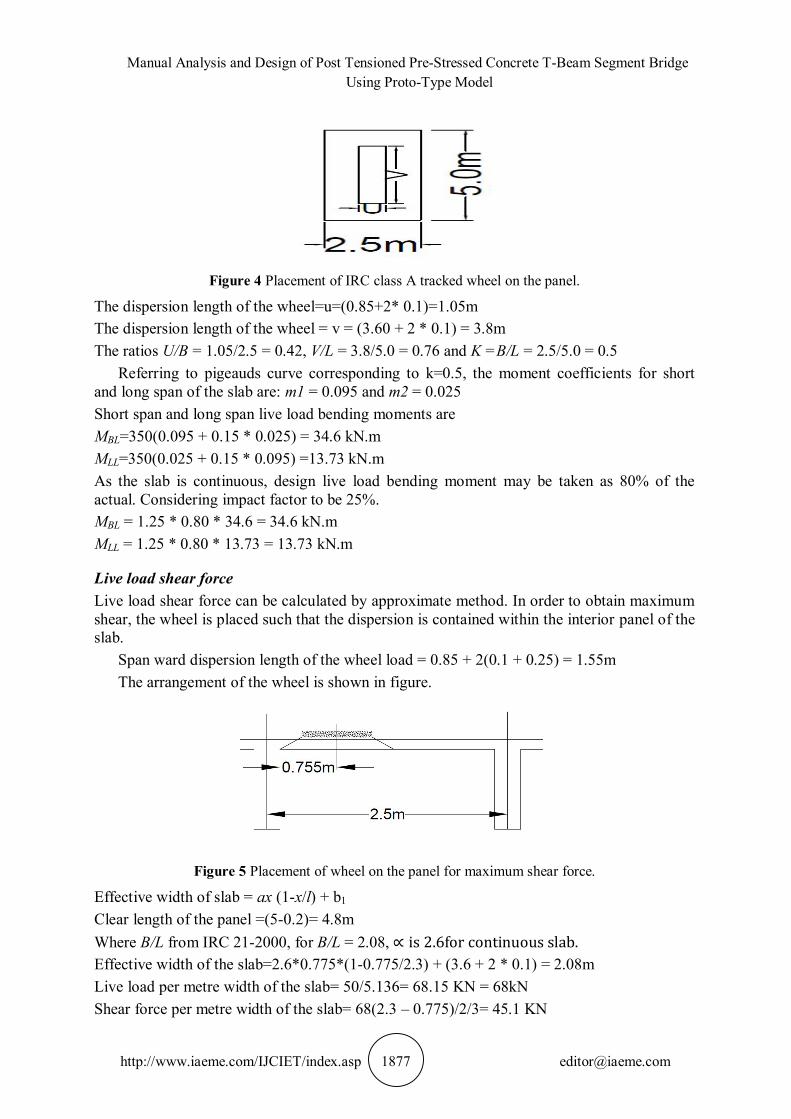
Figure 4 Placement of IRC class A tracked wheel on the panel.
The dispersion length of the wheel=u=(0.85+2* 0.1)=1.05m The dispersion length of the wheel = v = (3.60 + 2 * 0.1) = 3.8m The ratios U/B = 1.05/2.5 = 0.42, V/L = 3.8/5.0 = 0.76 and K =B/L = 2.5/5.0 = 0.5
Referring to pigeauds curve corresponding to k=0.5, the moment coefficients for short and long span of the slab are: m1 = 0.095 and m2 = 0.025 Short span and long span live load bending moments are MBL=350(0.095 + 0.15 * 0.025) = 34.6 kN.m MLL=350(0.025 + 0.15 * 0.095) =13.73 kN.m As the slab is continuous, design live load bending moment may be taken as 80% of the actual. Considering impact factor to be 25%. MBL = 1.25 * 0.80 * 34.6 = 34.6 kN.m MLL = 1.25 * 0.80 * 13.73 = 13.73 kN.m
Live load shear force Live load shear force can be calculated by approximate method. In order to obtain maximum shear, the wheel is placed such that the dispersion is contained within the interior panel of the slab.
Span ward dispersion length of the wheel load = 0.85 + 2(0.1 + 0.25) = 1.55m The arrangement of the wheel is shown in figure.
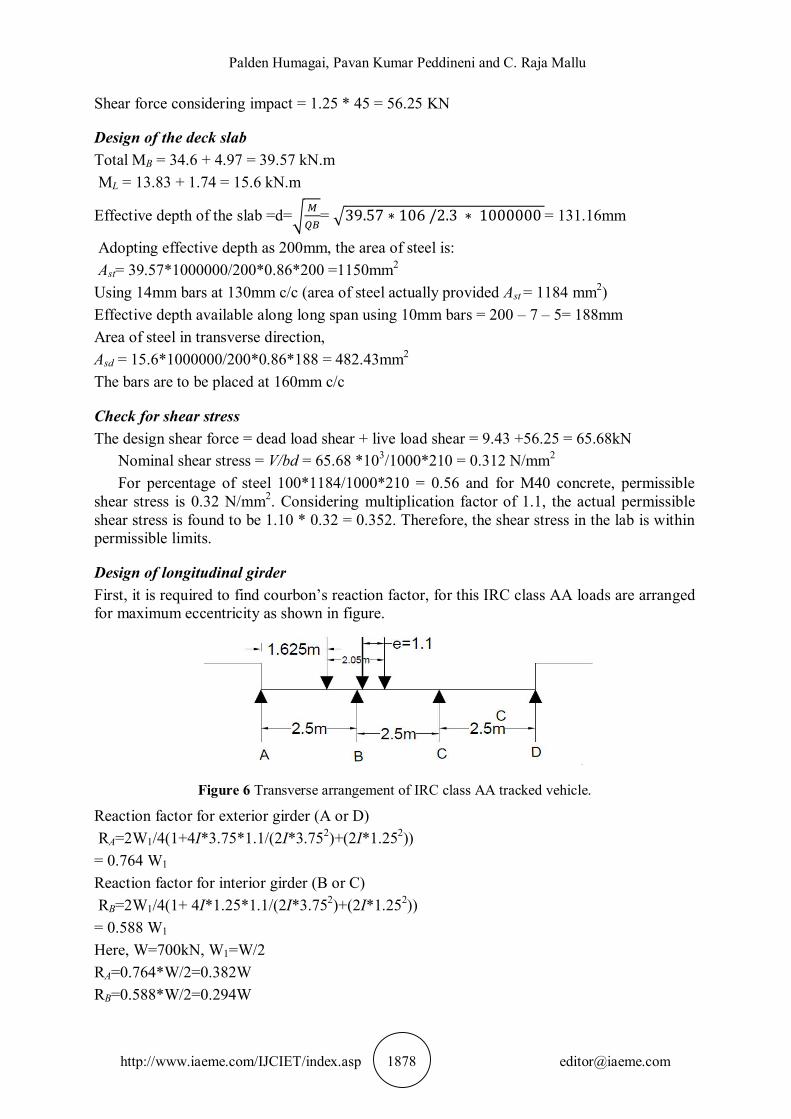
Figure 5 Placement of wheel on the panel for maximum shear force.
Effective width of slab = ax (1-x/l) + b1
Clear length of the panel =(5-0.2)= 4.8m Where B/L from IRC 21-2000, for B/L = 2.08, ∝ is 2.6for continuous slab. Effective width of the slab=2.6*0.775*(1-0.775/2.3) + (3.6 + 2 * 0.1) = 2.08m Live load per metre width of the slab= 50/5.136= 68.15 KN = 68kN Shear force per metre width of the slab= 68(2.3 – 0.775)/2/3= 45.1 KN
Palden Humagai, Pavan Kumar Peddineni and C. Raja Mallu
http://www.iaeme.com/IJCIET/index.asp 1878 [email protected]
Shear force considering impact = 1.25 * 45 = 56.25 KN
Design of the deck slab Total MB = 34.6 + 4.97 = 39.57 kN.m ML = 13.83 + 1.74 = 15.6 kN.m
Effective depth of the slab =d= = 39.57 ∗ 106 /2.3 ∗ 1000000 = 131.16mm
Adopting effective depth as 200mm, the area of steel is: Ast= 39.57*1000000/200*0.86*200 =1150mm2 Using 14mm bars at 130mm c/c (area of steel actually provided Ast = 1184 mm2)
Effective depth available along long span using 10mm bars = 200 – 7 – 5= 188mm Area of steel in transverse direction, Asd = 15.6*1000000/200*0.86*188 = 482.43mm2 The bars are to be placed at 160mm c/c
Check for shear stress The design shear force = dead load shear + live load shear = 9.43 +56.25 = 65.68kN
Nominal shear stress = V/bd = 65.68 *103/1000*210 = 0.312 N/mm2
For percentage of steel 100*1184/1000*210 = 0.56 and for M40 concrete, permissible shear stress is 0.32 N/mm2. Considering multiplication factor of 1.1, the actual permissible shear stress is found to be 1.10 * 0.32 = 0.352. Therefore, the shear stress in the lab is within permissible limits.
Design of longitudinal girder First, it is required to find courbon’s reaction factor, for this IRC class AA loads are arranged for maximum eccentricity as shown in figure.
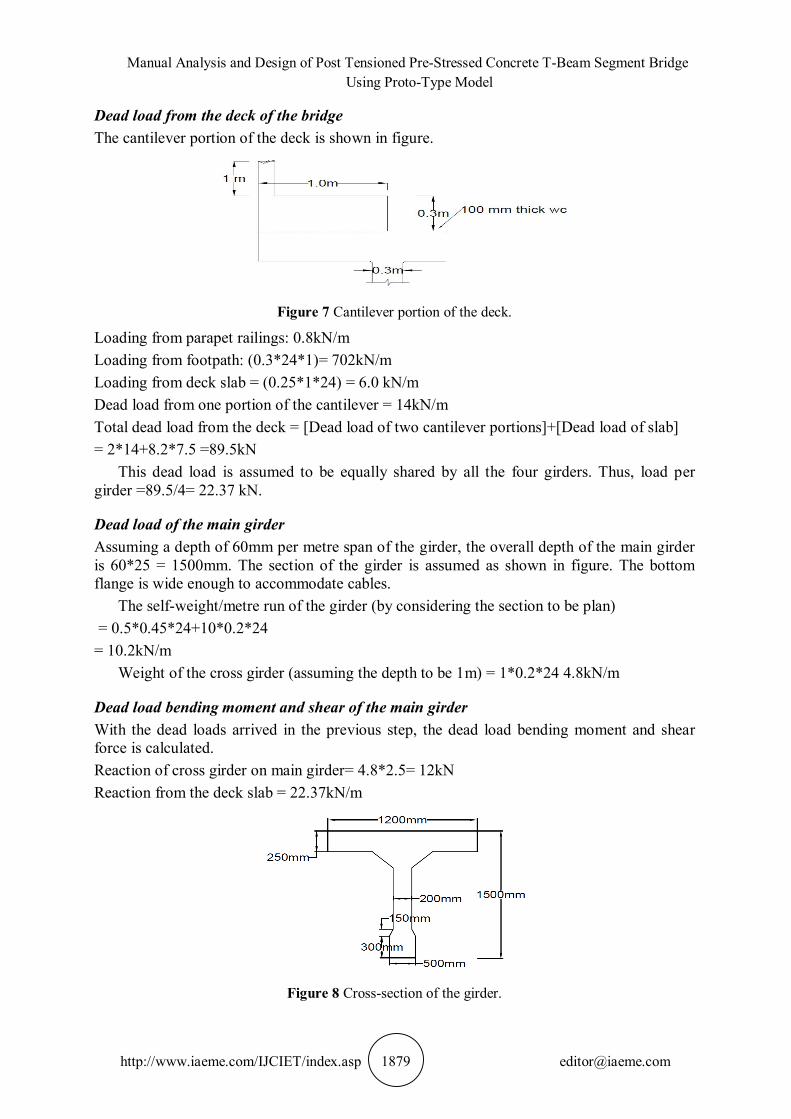
Figure 6 Transverse arrangement of IRC class AA tracked vehicle.
Reaction factor for exterior girder (A or D) RA=2W1/4(1+4I*3.75*1.1/(2I*3.752)+(2I*1.252)) = 0.764 W1
Reaction factor for interior girder (B or C) RB=2W1/4(1+ 4I*1.25*1.1/(2I*3.752)+(2I*1.252)) = 0.588 W1 Here, W=700kN, W1=W/2 RA=0.764*W/2=0.382W RB=0.588*W/2=0.294W
Manual Analysis and Design of Post Tensioned Pre-Stressed Concrete T-Beam Segment Bridge Using Proto-Type Model
http://www.iaeme.com/IJCIET/index.asp 1879 [email protected]
Dead load from the deck of the bridge The cantilever portion of the deck is shown in figure.
Figure 7 Cantilever portion of the deck.
Loading from parapet railings: 0.8kN/m Loading from footpath: (0.3*24*1)= 702kN/m Loading from deck slab = (0.25*1*24) = 6.0 kN/m Dead load from one portion of the cantilever = 14kN/m Total dead load from the deck = [Dead load of two cantilever portions]+[Dead load of slab] = 2*14+8.2*7.5 =89.5kN
This dead load is assumed to be equally shared by all the four girders. Thus, load per girder =89.5/4= 22.37 kN.
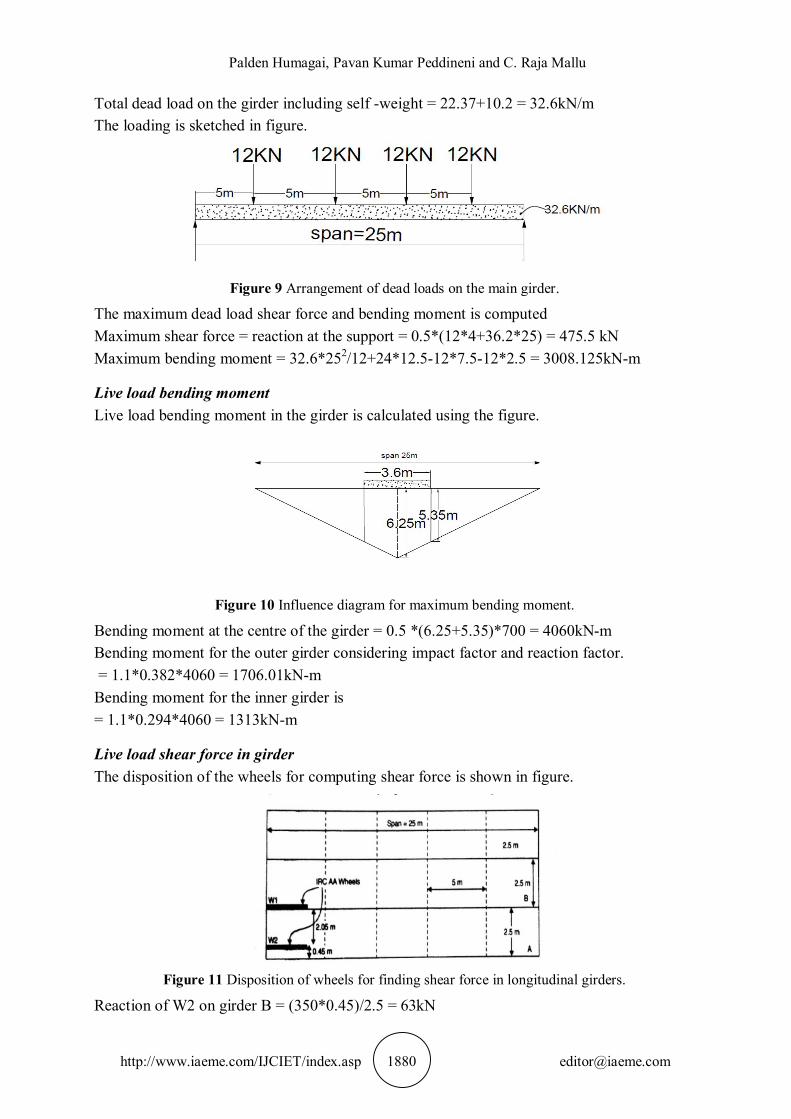
Dead load of the main girder Assuming a depth of 60mm per metre span of the girder, the overall depth of the main girder is 60*25 = 1500mm. The section of the girder is assumed as shown in figure. The bottom flange is wide enough to accommodate cables.
The self-weight/metre run of the girder (by considering the section to be plan) = 0.5*0.45*24+10*0.2*24 = 10.2kN/m
Weight of the cross girder (assuming the depth to be 1m) = 1*0.2*24 4.8kN/m
Dead load bending moment and shear of the main girder With the dead loads arrived in the previous step, the dead load bending moment and shear force is calculated. Reaction of cross girder on main girder= 4.8*2.5= 12kN Reaction from the deck slab = 22.37kN/m
Figure 8 Cross-section of the girder.
Palden Humagai, Pavan Kumar Peddineni and C. Raja Mallu
http://www.iaeme.com/IJCIET/index.asp 1880 [email protected]
Total dead load on the girder including self -weight = 22.37+10.2 = 32.6kN/m The loading is sketched in figure.
Figure 9 Arrangement of dead loads on the main girder.
The maximum dead load shear force and bending moment is computed Maximum shear force = reaction at the support = 0.5*(12*4+36.2*25) = 475.5 kN Maximum bending moment = 32.6*252/12+24*12.5-12*7.5-12*2.5 = 3008.125kN-m
Live load bending moment Live load bending moment in the girder is calculated using the figure.
Figure 10 Influence diagram for maximum bending moment.
Bending moment at the centre of the girder = 0.5 *(6.25+5.35)*700 = 4060kN-m Bending moment for the outer girder considering impact factor and reaction factor. = 1.1*0.382*4060 = 1706.01kN-m Bending moment for the inner girder is = 1.1*0.294*4060 = 1313kN-m
Live load shear force in girder The disposition of the wheels for computing shear force is shown in figure.
Figure 11 Disposition of wheels for finding shear force in longitudinal girders.
Reaction of W2 on girder B = (350*0.45)/2.5 = 63kN
Manual Analysis and Design of Post Tensioned Pre-Stressed Concrete T-Beam Segment Bridge Using Proto-Type Model
http://www.iaeme.com/IJCIET/index.asp 1881 [email protected]
Reaction of W2 on girder A = (350*2.05)/2.5 = 287kN Total load on girder B = (350+63) = 413kN
Using the magnitude of reaction arrived in above steps; maximum react ion (shear force) in the girders is calculated. Maximum reaction on girder B = (413*23.2)/25= 383.26kN Maximum reaction on girder A = (287*23.2)/25 = 266.4kN
The design live load shear force for inner girder considering impact factor = 383.3*1.1 = 421.6kN For outer girder = 1.1*266.4 = 293kN
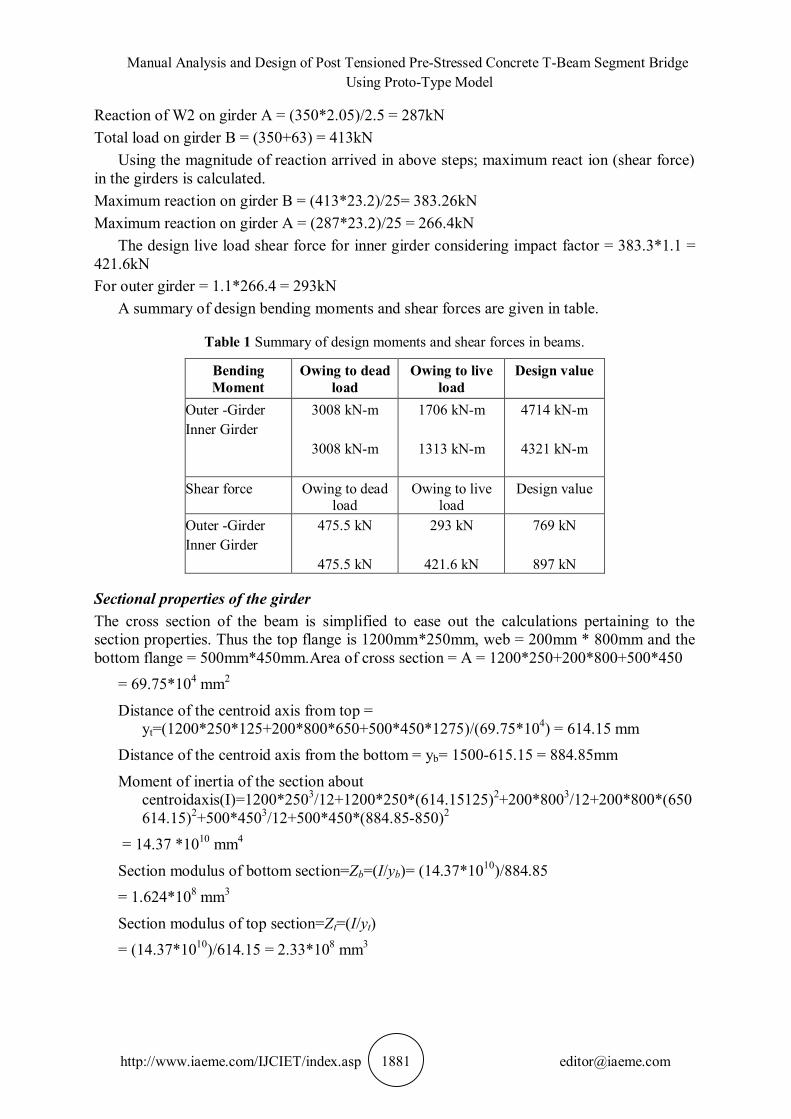
A summary of design bending moments and shear forces are given in table.
Table 1 Summary of design moments and shear forces in beams.
Bending Moment
Owing to dead load
Owing to live load
Design value
Outer -Girder Inner Girder
3008 kN-m
3008 kN-m
1706 kN-m
1313 kN-m
4714 kN-m
4321 kN-m
Shear force Owing to dead load
Owing to live load
Design value
Outer -Girder Inner Girder
475.5 kN
475.5 kN
293 kN
421.6 kN
769 kN
897 kN
Sectional properties of the girder The cross section of the beam is simplified to ease out the calculations pertaining to the section properties. Thus the top flange is 1200mm*250mm, web = 200mm * 800mm and the bottom flange = 500mm*450mm.Area of cross section = A = 1200*250+200*800+500*450
= 69.75*104 mm2
Distance of the centroid axis from top = yt=(1200*250*125+200*800*650+500*450*1275)/(69.75*104) = 614.15 mm
Distance of the centroid axis from the bottom = yb= 1500-615.15 = 884.85mm
Moment of inertia of the section about centroidaxis(I)=1200*2503/12+1200*250*(614.15125)2+200*8003/12+200*800*(650614.15)2+500*4503/12+500*450*(884.85-850)2
= 14.37 *1010 mm4
Section modulus of bottom section=Zb=(I/yb)= (14.37*1010)/884.85 = 1.624*108 mm3
Section modulus of top section=Zt=(I/yt) = (14.37*1010)/614.15 = 2.33*108 mm3
Palden Humagai, Pavan Kumar Peddineni and C. Raja Mallu
http://www.iaeme.com/IJCIET/index.asp 1882 [email protected]
Check for the adequacy of the section adopted Making use of the section properties, the adequacy of the section is verified. Various design parameters to be used are listed. fck=50mpa,n=0.85,fci=40Mpa,fct=20Mpa, fcw=16.5MPa, fbr=(nfct-ftw)=(0.85*20-0)=17MPa,fcr=(fcw-nftt)=16.5MPa,Mq=1706kN-m,Mg=3008kN-m,Md=Mq+Mg=4714kn-m finf=ftw/n+Md/(n*Zb)=0+(4714*106)/(0.85*1.624*108) = 34.14 MPa fsup=ftt-Mg/Zt)=0-(3008*106)/(2.33*108) = -6.45MPa
Required section modulus of the bottom section of the beam Zmin=(Mq+(1-n)Mg/fbr)=(1706+(1-0.85)*3008)*106/17 = 1.268*108< 1.624*108 mm3
Hence, section provided is just adequate.
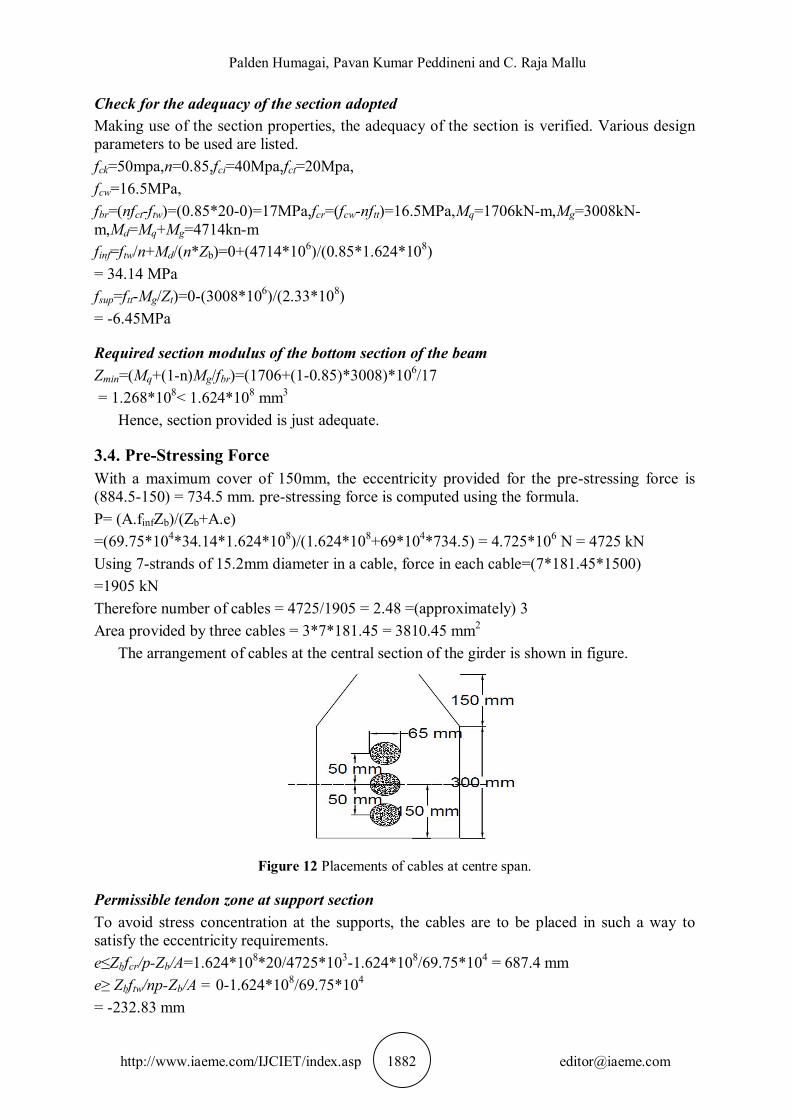
3.4. Pre-Stressing Force With a maximum cover of 150mm, the eccentricity provided for the pre-stressing force is (884.5-150) = 734.5 mm. pre-stressing force is computed using the formula. P= (A.finfZb)/(Zb+A.e) =(69.75*104*34.14*1.624*108)/(1.624*108+69*104*734.5) = 4.725*106 N = 4725 kN Using 7-strands of 15.2mm diameter in a cable, force in each cable=(7*181.45*1500) =1905 kN Therefore number of cables = 4725/1905 = 2.48 =(approximately) 3 Area provided by three cables = 3*7*181.45 = 3810.45 mm2
The arrangement of cables at the central section of the girder is shown in figure.
Figure 12 Placements of cables at centre span.
Permissible tendon zone at support section To avoid stress concentration at the supports, the cables are to be placed in such a way to satisfy the eccentricity requirements. e≤Zbfcr/p-Zb/A=1.624*108*20/4725*103-1.624*108/69.75*104 = 687.4 mm e≥ Zbftw/np-Zb/A = 0-1.624*108/69.75*104 = -232.83 mm
Manual Analysis and Design of Post Tensioned Pre-Stressed Concrete T-Beam Segment Bridge Using Proto-Type Model
http://www.iaeme.com/IJCIET/index.asp 1883 [email protected]
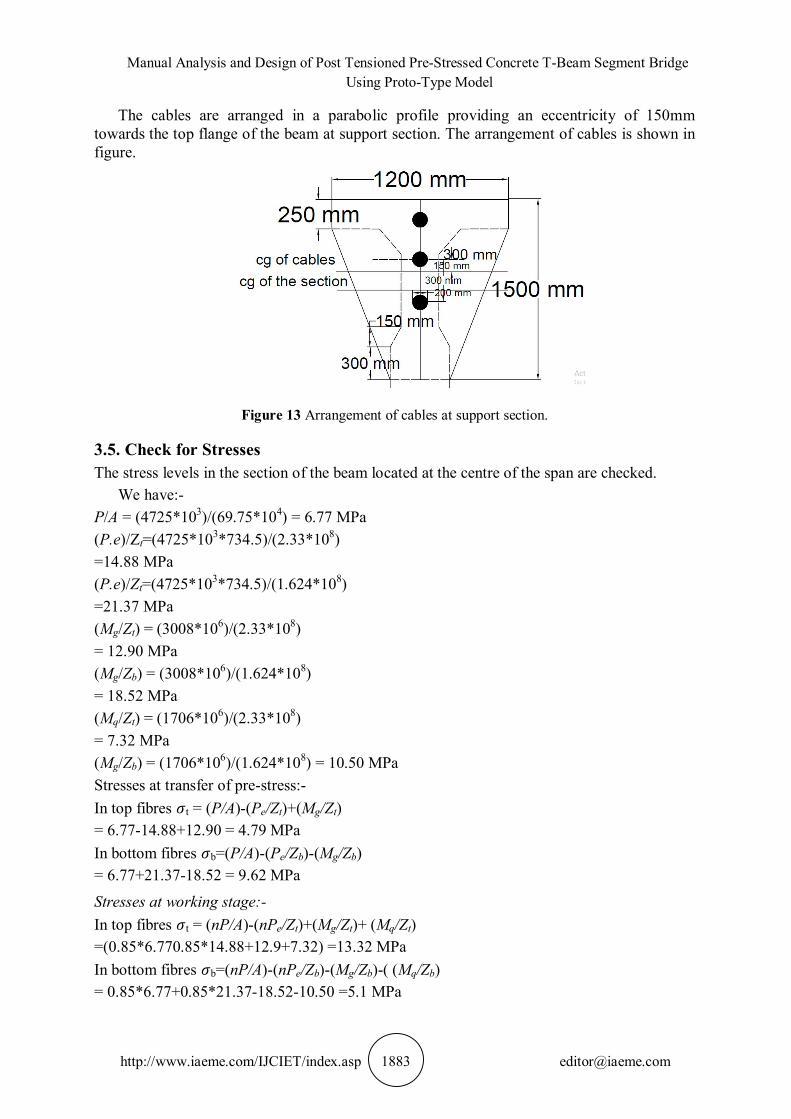
The cables are arranged in a parabolic profile providing an eccentricity of 150mm towards the top flange of the beam at support section. The arrangement of cables is shown in figure.
Figure 13 Arrangement of cables at support section.
3.5. Check for Stresses The stress levels in the section of the beam located at the centre of the span are checked.
We have:- P/A = (4725*103)/(69.75*104) = 6.77 MPa (P.e)/Zt=(4725*103*734.5)/(2.33*108) =14.88 MPa (P.e)/Zt=(4725*103*734.5)/(1.624*108) =21.37 MPa (Mg/Zt) = (3008*106)/(2.33*108) = 12.90 MPa (Mg/Zb) = (3008*106)/(1.624*108) = 18.52 MPa (Mq/Zt) = (1706*106)/(2.33*108) = 7.32 MPa (Mg/Zb) = (1706*106)/(1.624*108) = 10.50 MPa Stresses at transfer of pre-stress:- In top fibres t = (P/A)-(Pe/Zt)+(Mg/Zt) = 6.77-14.88+12.90 = 4.79 MPa In bottom fibres b=(P/A)-(Pe/Zb)-(Mg/Zb) = 6.77+21.37-18.52 = 9.62 MPa
Stresses at working stage:- In top fibres t = (nP/A)-(nPe/Zt)+(Mg/Zt)+ (Mq/Zt) =(0.85*6.770.85*14.88+12.9+7.32) =13.32 MPa In bottom fibres b=(nP/A)-(nPe/Zb)-(Mg/Zb)-( (Mq/Zb) = 0.85*6.77+0.85*21.37-18.52-10.50 =5.1 MPa

Palden Humagai, Pavan Kumar Peddineni and C. Raja Mallu
http://www.iaeme.com/IJCIET/index.asp 1884 [email protected]
It is observed that the stresses at bottom as well as top layers of the girders under the two conditions considered are well within the limits.
Check for ultimate flexural strength of the beam The ultimate moment to be considered (IRC: 18-2000) Mu = 1.5Mg + 2.5Mq
= 1.5*3008+2.5*1706 = 8777 kN-m
Under ultimate load conditions, the failure may either occur by yielding of the steel (under reinforced) or by the crushing of the concrete (over reinforced). Ultimate moment of resistance of the section, under these two alternative conditions of failure is calculated by the following formula and the smaller of the two values shall be taken as the ultimate moment of the resistance of the section for the design. (i) Failure by yielding of steel: Mu = 0.9dbAsfp
Where, As = the area of high tensile steel db = the depth of the beam from the maximum compression edge to the centre of the gravity to the steel tendons. fp= the ultimate tensile strength for steel without definite yield point or the ultimate tensile strength for steel without definite yield point or yield stress at 4% elongation whichever is higher for steel with a definite yield point. fp = 0.9*1350*3810*1860 = 8.61*109 N-mm (ii) failure by crushing of concrete: For T-beam section the ultimate moment is given by:- Mu=0.176bdb
2fck+2/3*0.8(Bf-b)(db-t/2)tfck
Where, b = the width of the web, bf0 = the width of the flange, t = thickness of flange Mu=(0.176*200*13502+2/3*0.8*(1200-200)*(1350-250/2)*250*50) = 8.23*109 N-mm = 8230kN-m (As the required ultimate moment 8230 kN-m< 8777 kN-m of the section is safe.)
Check for ultimate shear strength of the beam The ultimate shear force is to be considered= 1.5Sg+2.5Sq Where, Sg is dead load and Sq is live load shear force. Vu = 1.5*475.5+2.5*421.6 = 1767.25kN
According to IRC 18-2000, the ultimate shear strength of the section, uncracked in failure, Vco corresponds to the occurrence of the maximum principal tensile stresses, at the centroid axis of the section, of ft = 0.24 fck. In the calculation of Vco, the value of pre-stress at the centroid axis has to be taken as 0.8fcp. the value of Vco is given by Where, b = width of rib
Manual Analysis and Design of Post Tensioned Pre-Stressed Concrete T-Beam Segment Bridge Using Proto-Type Model
http://www.iaeme.com/IJCIET/index.asp 1885 [email protected]
d = overall depth of the member ft= maximum principle tensile stress = 0.24√fck= 1.7MPa fcp= compressive stress at centroid axis due to pre-stress taken as positive = (hP/A) =5.75MPa eccentricity of cables of the centre span =734.5 mm eccentricity of cables at support = 150mm no eccentricity = 734.5-150 = 584.5mm Slope of the cable = = 4.e/L= (4*584.5)/(25*1000)= 0.093 Vco=0.67*200*1500+(0.85*4725*103*0.093)*√1.7 ∗ 1.7 + 0.8 ∗ 5.75 ∗ 1.7 = 1031306.6 N = 1032 kN Ultimate shear resistance considered = 1767.25 kN = 1767 kN Ultimate shear capacity of the section = 1032 kN Balance shear = 1767-1032 = 732 kN Shear reinforcement is to be designed to resist the balance shear Using 10mm diameter stirrups the spacing is given by S = 0.87*fy*Asv*d/V =0.87*415*2*79*1450/735*10= 112.53 mm. (Provide 10 mm diameter stirrups at 110 mm c/c near support at a spacing of 220 mm c/c near the centre of the span)
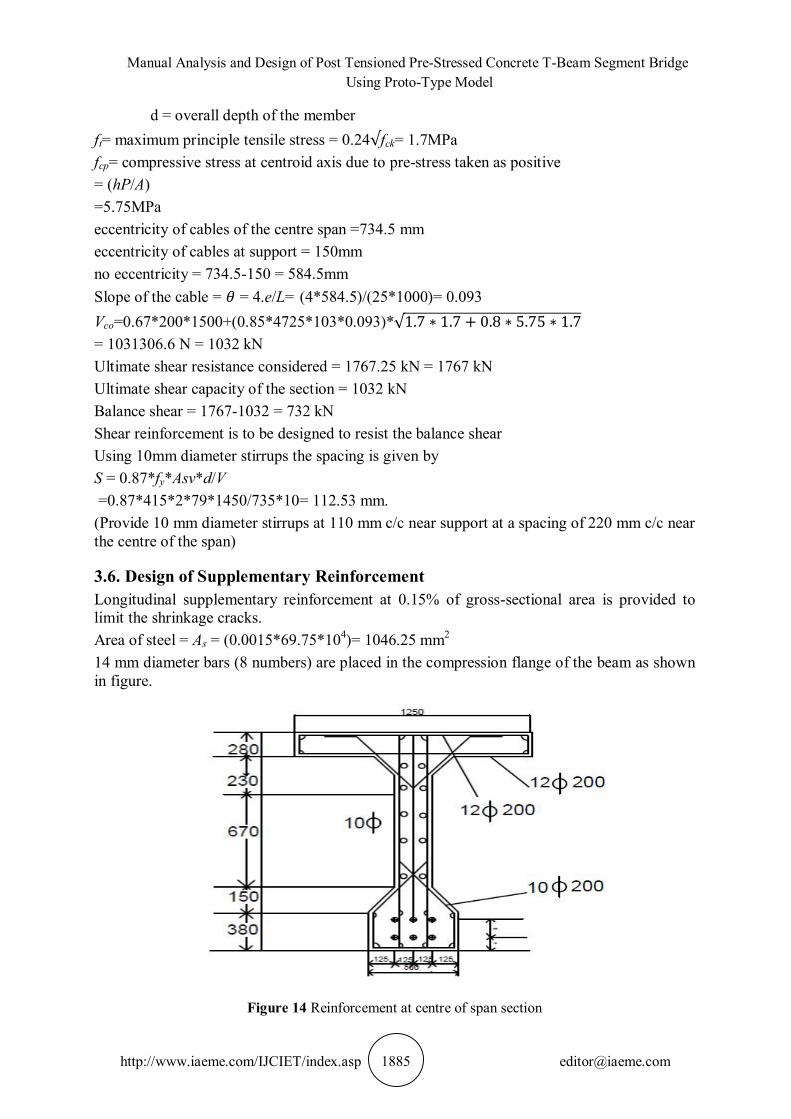
3.6. Design of Supplementary Reinforcement Longitudinal supplementary reinforcement at 0.15% of gross-sectional area is provided to limit the shrinkage cracks. Area of steel = As = (0.0015*69.75*104)= 1046.25 mm2 14 mm diameter bars (8 numbers) are placed in the compression flange of the beam as shown in figure.
Figure 14 Reinforcement at centre of span section
Palden Humagai, Pavan Kumar Peddineni and C. Raja Mallu
http://www.iaeme.com/IJCIET/index.asp 1886 [email protected]
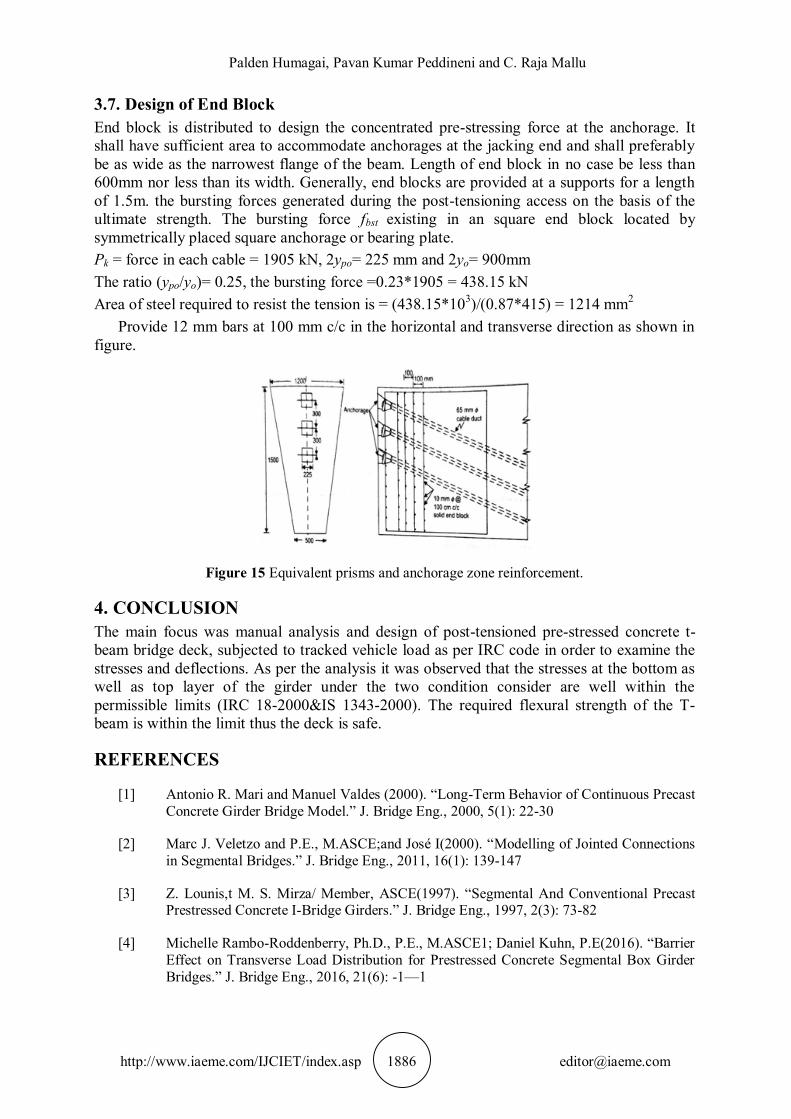
3.7. Design of End Block End block is distributed to design the concentrated pre-stressing force at the anchorage. It shall have sufficient area to accommodate anchorages at the jacking end and shall preferably be as wide as the narrowest flange of the beam. Length of end block in no case be less than 600mm nor less than its width. Generally, end blocks are provided at a supports for a length of 1.5m. the bursting forces generated during the post-tensioning access on the basis of the ultimate strength. The bursting force fbst existing in an square end block located by symmetrically placed square anchorage or bearing plate. Pk = force in each cable = 1905 kN, 2ypo= 225 mm and 2yo= 900mm The ratio (ypo/yo)= 0.25, the bursting force =0.23*1905 = 438.15 kN Area of steel required to resist the tension is = (438.15*103)/(0.87*415) = 1214 mm2
Provide 12 mm bars at 100 mm c/c in the horizontal and transverse direction as shown in figure.
Figure 15 Equivalent prisms and anchorage zone reinforcement.
4. CONCLUSION The main focus was manual analysis and design of post-tensioned pre-stressed concrete t-beam bridge deck, subjected to tracked vehicle load as per IRC code in order to examine the stresses and deflections. As per the analysis it was observed that the stresses at the bottom as well as top layer of the girder under the two condition consider are well within the permissible limits (IRC 18-2000&IS 1343-2000). The required flexural strength of the T-beam is within the limit thus the deck is safe.
REFERENCES
[1] Antonio R. Mari and Manuel Valdes (2000). “Long-Term Behavior of Continuous Precast Concrete Girder Bridge Model.” J. Bridge Eng., 2000, 5(1): 22-30
[2] Marc J. Veletzo and P.E., M.ASCE;and José I(2000). “Modelling of Jointed Connections in Segmental Bridges.” J. Bridge Eng., 2011, 16(1): 139-147
[3] Z. Lounis,t M. S. Mirza/ Member, ASCE(1997). “Segmental And Conventional Precast Prestressed Concrete I-Bridge Girders.” J. Bridge Eng., 1997, 2(3): 73-82
[4] Michelle Rambo-Roddenberry, Ph.D., P.E., M.ASCE1; Daniel Kuhn, P.E(2016). “Barrier Effect on Transverse Load Distribution for Prestressed Concrete Segmental Box Girder Bridges.” J. Bridge Eng., 2016, 21(6): -1—1

Manual Analysis and Design of Post Tensioned Pre-Stressed Concrete T-Beam Segment Bridge Using Proto-Type Model
http://www.iaeme.com/IJCIET/index.asp 1887 [email protected]
[5] Shuqing Wang and Chung C. Fu, F.ASCE(2015). “Simplification of Creep and Shrinkage Analysis of Segmental Bridges.” J. Bridge Eng., 2015, 20(8): -1--1
[6] Campbell TI and KodurVKR (1990). “Deformation controlled nonlinear analysis of pre-stressed concrete continuous beams.” PCI Journal. 35(5), pp. 42-55.
[7] Dunker, K. F., and Rabbat, B. G. (I992). "Performance of pre-stressed concrete highway bridges in the United States-the first 40 years." PCIJ.,37(3), 48-64.
[8] Francis T.K. AU and Cliff C.Y. LEUNG / Procedia Engineering 14 (2011) 1425–1432
[9] Mast, R F. (1993). "Lateral stability of long pre-stressed concrete beams-part 2." PCI J., 38(1),70-88.
[10] Mitchell D, Cook WD, Khan AA and Tham T (1993). “Influence of high strength concrete on transfer and development length of pre-tensioning strand”. PCI Journal. 38(3), pp. 62-74.
[11] Priestley MJN and Park R (1972). “Moment redistribution in continuous pre-stressed concrete beams”. Magazine of Concrete Research. 24(80), pp. 157-166.