Embed Size (px)
Citation preview
Managing The Risks of Climate Legislation
Bruce Braine, Vice PresidentJune 3, 2008
MACRUC ConferenceWilliamsburg, Virginia
Mountaineer Plant - New Haven, WV Northeastern Plant - Oologah, OK
2
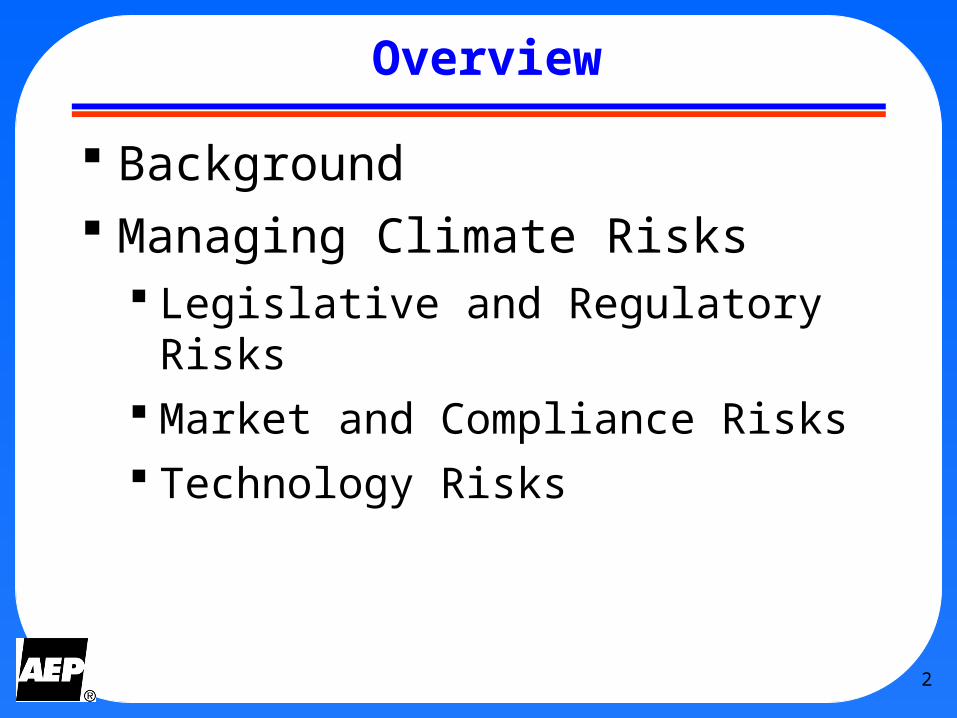
Overview
Background Managing Climate Risks
Legislative and Regulatory Risks Market and Compliance Risks Technology Risks
3
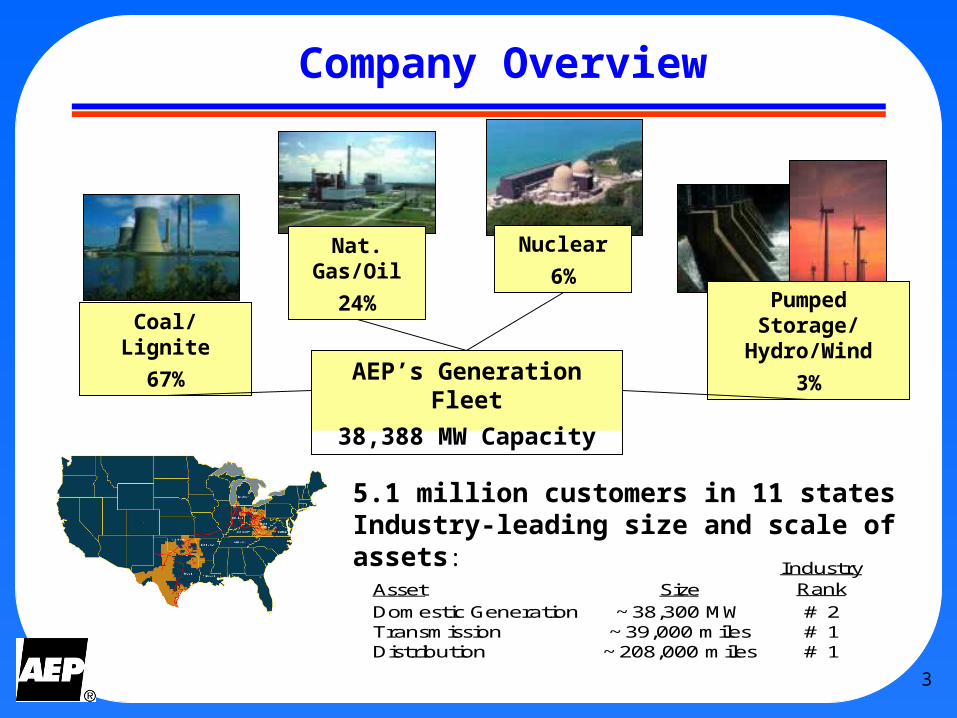
Coal/Lignite
67%
Nat. Gas/Oil
24%
Nuclear
6%Pumped Storage/
Hydro/Wind
3%AEP’s Generation
Fleet
38,388 MW Capacity
Company Overview
5.1 million customers in 11 statesIndustry-leading size and scale of assets:
Asset SizeIndustry
RankDomestic Generation ~38,300 MW # 2Transmission ~39,000 miles # 1Distribution ~208,000 miles # 1
4
AEP’s Climate Strategy
Being proactive and engaged in the development of climate policy
Investing in science/technology R&D
Taking Voluntary action now, making real reductions thru CCX (2003-07: 40 MM Tons reductions); 2011 Voluntary Commitment (additional 5 MM Tons/year reductions).
Investing in long term technology (e.g., IGCC, Ultra-supercritical PC and Carbon Capture and Storage)
AEP must be a leader in addressing climate change
5
AEP Position: A “Reasonable” Approach to Climate Legislation
• Reductions and Timing--Moderate with Adequate Lead Times
• Scope of Program-- Economy Wide
• Flexibility of the Program—Trading, Banking, Unrestricted Offsets, Early Action Credits
• Allowance Allocation And Other Cost Issues—Emissions Based and ”Low” auctions
• Technology Development/Deployment—Bonus allowances for carbon capture and storage
• International Linkage—e.g. AEP-IBEW ProposalAEP Supports Reasonable Legislation on GHG: Bingaman-
Specter “Low Carbon Economy Act of 2007”
6
0
500
1000
1500
2000
2500
3000
3500
1990 1995 2000 2005 2010 2015 2020 2025 2030
U.S
. Ele
ctri
c S
ecto
rC
O2 E
mis
sio
ns
(mill
ion
met
ric
ton
s)
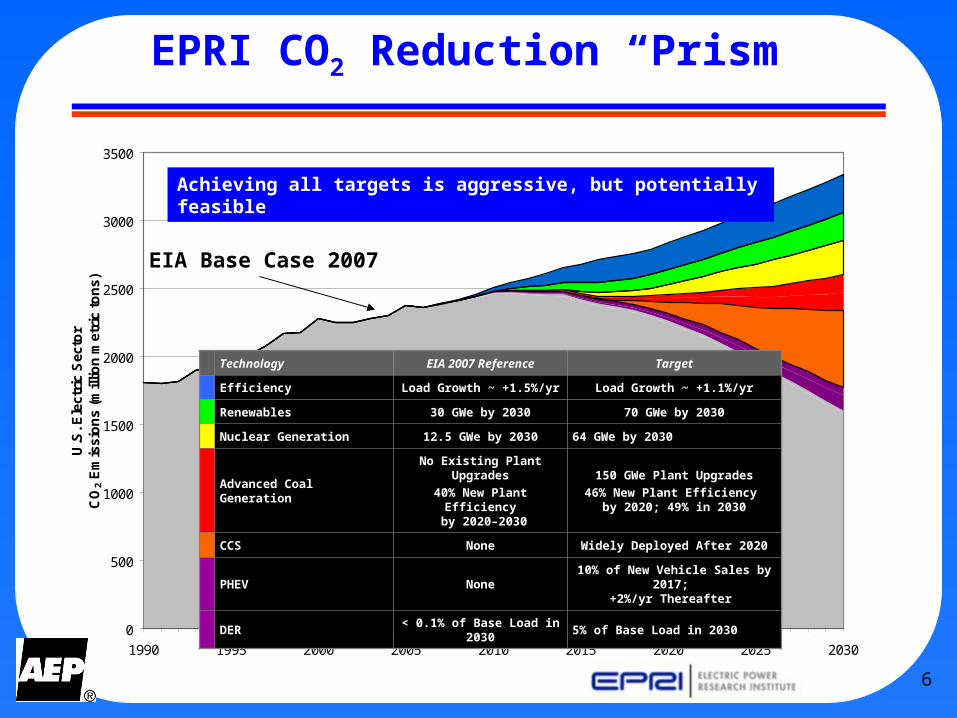
EIA Base Case 2007
EPRI CO2 Reduction “Prism”
Technology EIA 2007 Reference Target
EfficiencyLoad Growth ~
+1.5%/yrLoad Growth ~ +1.1%/yr
Renewables 30 GWe by 2030 70 GWe by 2030
Nuclear Generation 12.5 GWe by 2030 64 GWe by 2030
Advanced Coal Generation
No Existing Plant Upgrades
40% New Plant Efficiency
by 2020–2030
150 GWe Plant Upgrades46% New Plant Efficiency
by 2020; 49% in 2030
CCS None Widely Deployed After 2020
PHEV None10% of New Vehicle Sales by
2017; +2%/yr Thereafter
DER< 0.1% of Base Load in
20305% of Base Load in 2030
Achieving all targets is aggressive, but potentially feasible
7
WA
OR
CA
NV
ID
MT
WY
UT
AZ
CO
NM
TX
ND
SD
NE
KS
OK
MN
IA
MO
AR
LA
MSAL
GA
FL
WI
OHINIL
KY
TNNC
SC
WV
MIPA
NY
VA
MEVTNH
MARI
CTNJ
DEMD
Cost-Regulated
Unbundled/ Deregulated
WA
OR
CA
NV
ID
MT
WY
UT
AZ
CO
NM
TX
ND
SD
NE
KS
OK
MN
IA
MO
AR
LA
MSAL
GA
FL
WI
OHINIL
KY
TNNC
SC
WV
MIPA
NY
VA
MEVTNH
MARI
CTNJ
DEMD
Cost-Regulated
Unbundled/ Deregulated
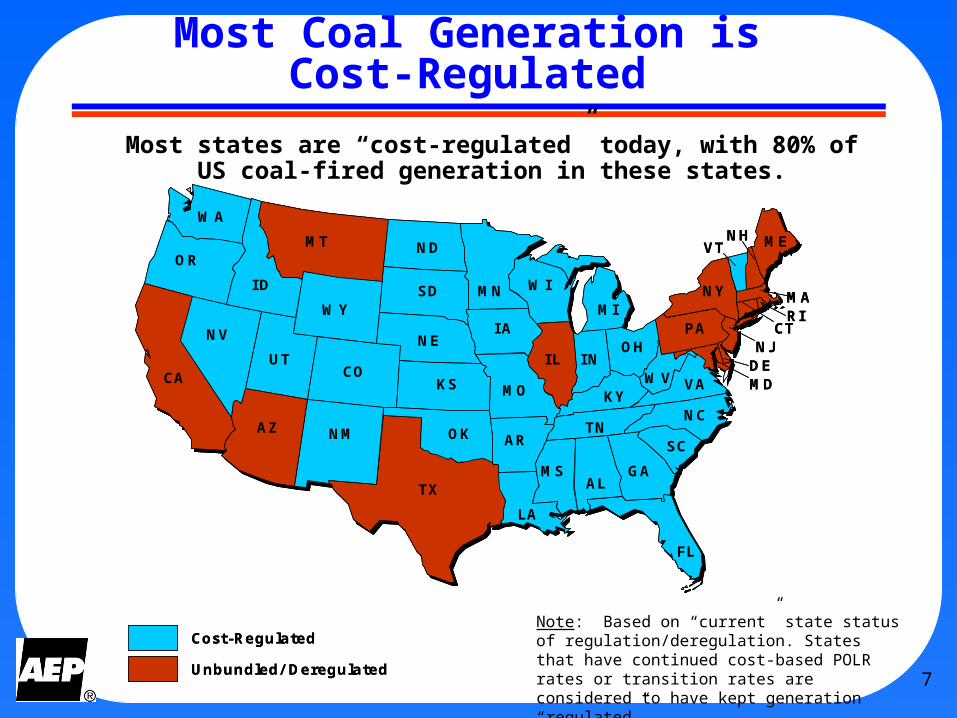
Most states are “cost-regulated” today, with 80% of US coal-fired generation in these states.
Note: Based on “current” state status of regulation/deregulation. States that have continued cost-based POLR rates or transition rates are considered to have kept generation “regulated”.
Most Coal Generation isCost-Regulated
8
$-
$10
$20
$30
$40
$50
$60
$70
$80
100% Allocation 100% Auction
$/M
Wh
Fuel, O&M, Emissions ex. CO2 CO2 Compliance Costs* Auction Costs*
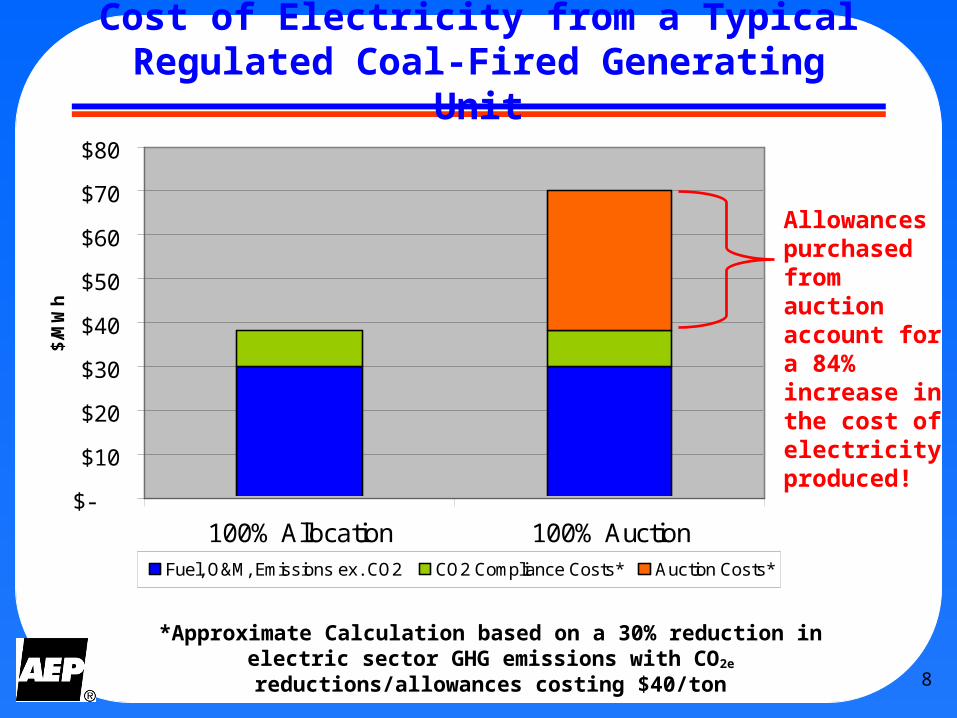
Cost of Electricity from a Typical Regulated Coal-Fired Generating Unit
Allowances purchased from auction account for a 84% increase in the cost of electricity produced!
*Approximate Calculation based on a 30% reduction in electric sector GHG emissions with CO2e reductions/allowances costing $40/ton
9
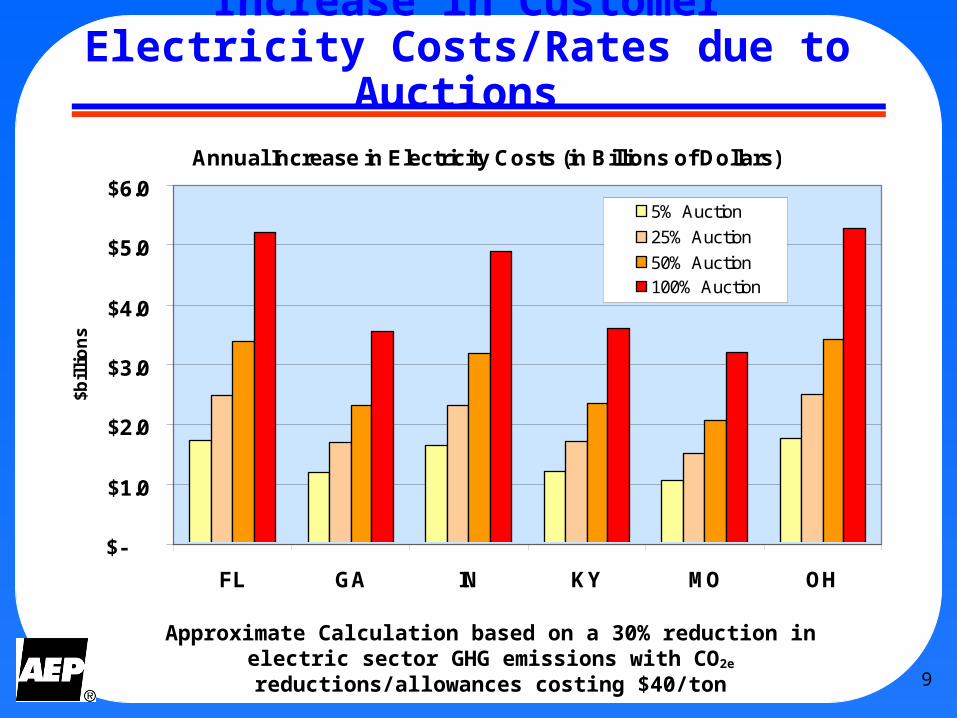
Increase in Customer Electricity Costs/Rates due to Auctions
Approximate Calculation based on a 30% reduction in electric sector GHG emissions with CO2e reductions/allowances costing $40/ton
Annual Increase in Electricity Costs (in Billions of Dollars)
$-
$1.0
$2.0
$3.0
$4.0
$5.0
$6.0
FL GA IN KY MO OH
$bil
lio
ns
5% Auction
25% Auction
50% Auction100% Auction
10
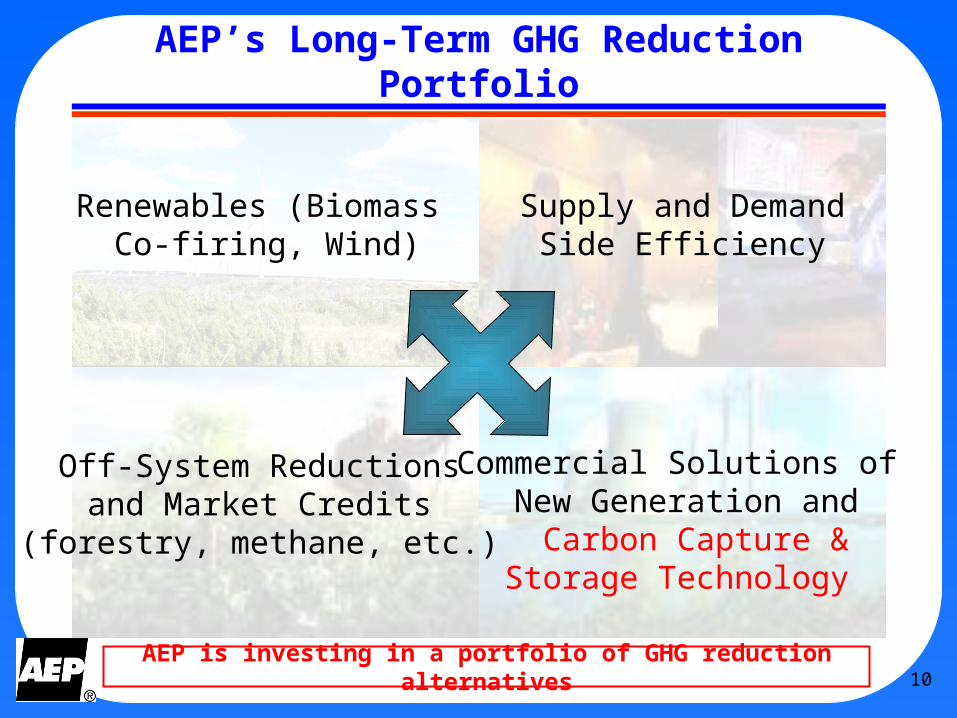
AEP’s Long-Term GHG Reduction Portfolio
Renewables (Biomass Co-firing, Wind)
Off-System Reductionsand Market Credits
(forestry, methane, etc.)
Commercial Solutions of New Generation and Carbon Capture &
Storage Technology
Supply and DemandSide Efficiency
AEP is investing in a portfolio of GHG reduction alternatives
11
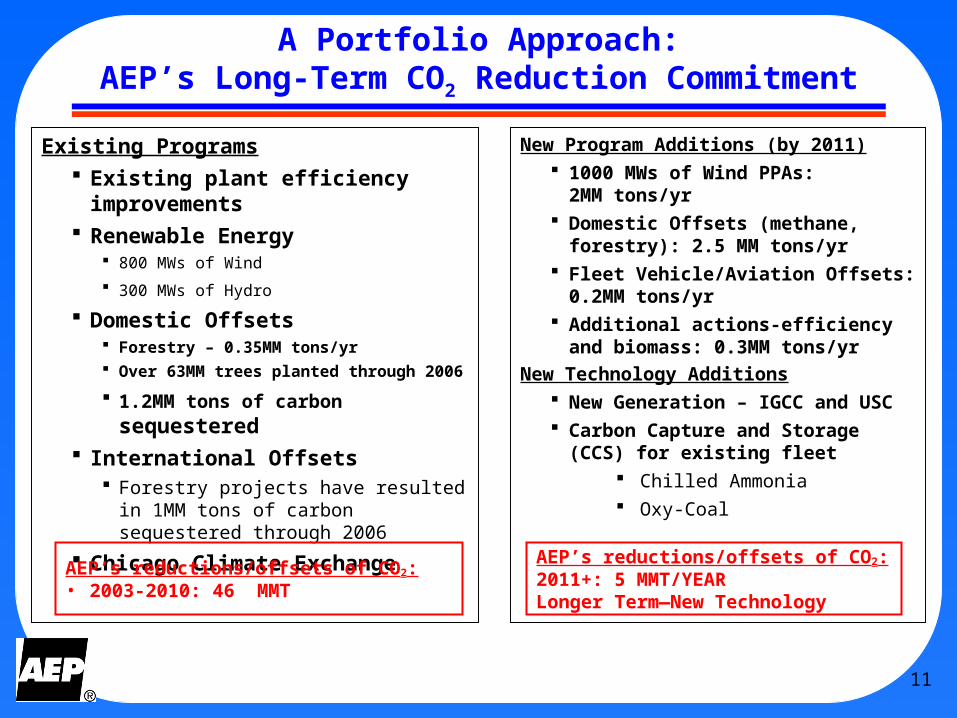
A Portfolio Approach:AEP’s Long-Term CO2 Reduction Commitment
Existing Programs Existing plant efficiency
improvements Renewable Energy
800 MWs of Wind
300 MWs of Hydro
Domestic Offsets Forestry – 0.35MM tons/yr Over 63MM trees planted through
2006
1.2MM tons of carbon sequestered
International Offsets Forestry projects have resulted in
1MM tons of carbon sequestered through 2006
Chicago Climate ExchangeAEP’s reductions/offsets of CO2:• 2003-2010: 46 MMT
New Program Additions (by 2011) 1000 MWs of Wind PPAs:
2MM tons/yr Domestic Offsets (methane,
forestry): 2.5 MM tons/yr Fleet Vehicle/Aviation Offsets:
0.2MM tons/yr Additional actions-efficiency and
biomass: 0.3MM tons/yrNew Technology Additions
New Generation – IGCC and USC Carbon Capture and Storage
(CCS) for existing fleet Chilled Ammonia Oxy-Coal
AEP’s reductions/offsets of CO2:2011+: 5 MMT/YEARLonger Term—New Technology
12
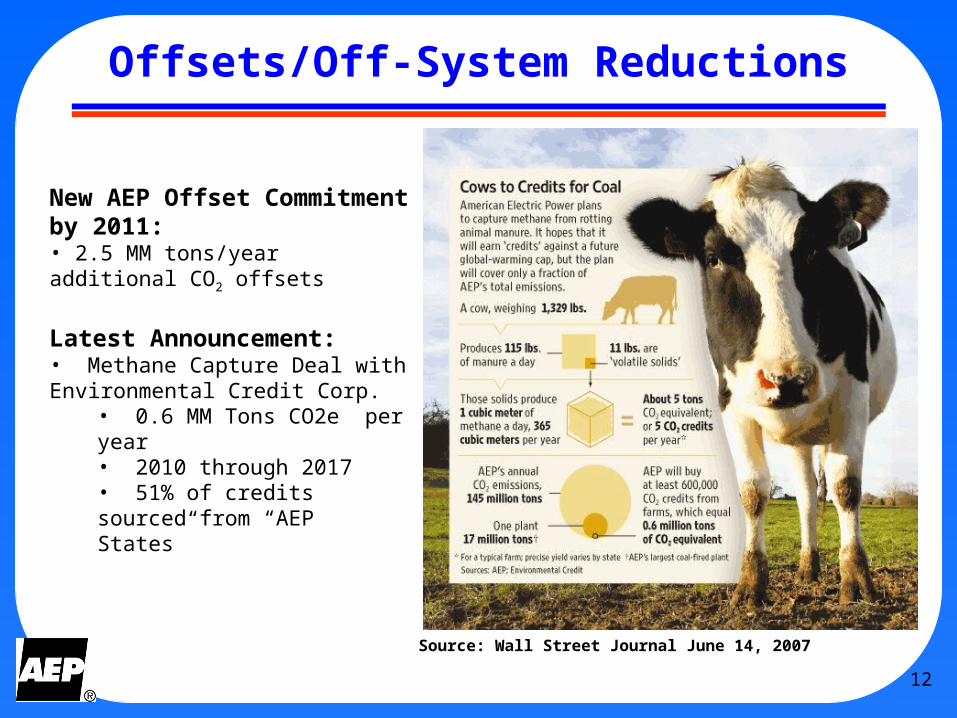
Offsets/Off-System Reductions
New AEP Offset Commitment by 2011:• 2.5 MM tons/year additional CO2 offsets
Latest Announcement:• Methane Capture Deal with Environmental Credit Corp.
• 0.6 MM Tons CO2e per year• 2010 through 2017• 51% of credits sourced from “AEP States”
Source: Wall Street Journal June 14, 2007
13
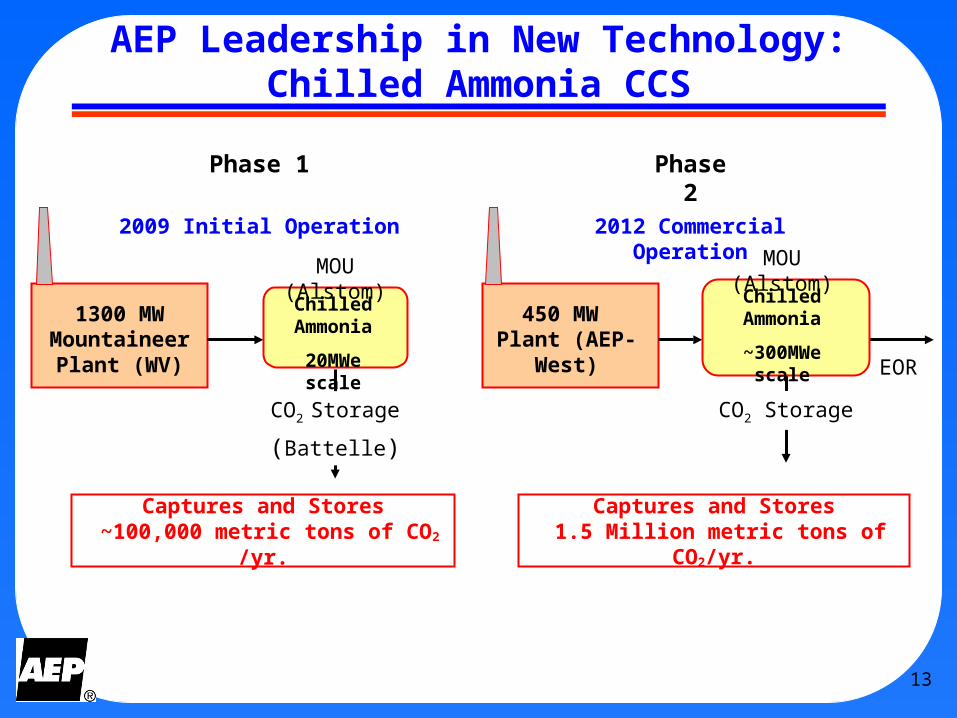
AEP Leadership in New Technology:Chilled Ammonia CCS
1300 MW Mountaineer Plant (WV)
450 MW Plant (AEP-
West)
2009 Initial Operation 2012 Commercial Operation
Chilled Ammonia
20MWe scale
Chilled Ammonia
~300MWe scale
CO2 Storage
(Battelle)
MOU (Alstom) MOU (Alstom)
EOR
CO2 Storage
Captures and Stores 1.5 Million metric tons of
CO2/yr.
Phase 1 Phase 2
Captures and Stores ~100,000 metric tons of
CO2 /yr.
14
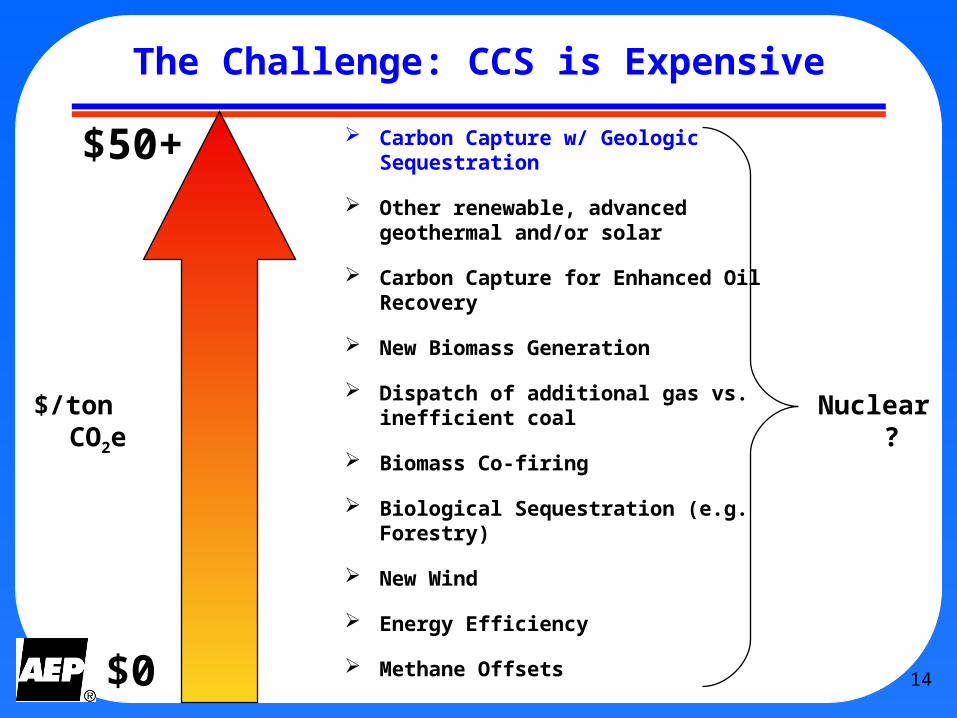
The Challenge: CCS is Expensive
Carbon Capture w/ Geologic Sequestration
Other renewable, advanced geothermal and/or solar
Carbon Capture for Enhanced Oil Recovery
New Biomass Generation
Dispatch of additional gas vs. inefficient coal
Biomass Co-firing
Biological Sequestration (e.g. Forestry)
New Wind
Energy Efficiency
Methane Offsets
$/ton CO2e
$0
$50+
Nuclear?