Embed Size (px)
DESCRIPTION
Caso Estudio de HBS.English Version
Citation preview
A JOINT INITIATIVE OFTHE HARVARD GRADUATE SCHOOL OF EDUCATIONAND HARVARD BUSINESS SCHOOL
PEL-033J U N E 2 0 , 2 0 0 6
________________________________________________________________________________________________________________ Researcher Caroline King prepared this case under the supervision of Professors Richard Elmore and Allen S. Grossman. PELP cases are developed solely as the basis for class discussion. Cases are not intended to serve as endorsements, sources of primary data, or illustrations of effective or ineffective management. Copyright © 2006 Public Education Leadership Project at Harvard College. To order copies or request permission to reproduce materials, call 617-495-6421 or write to PELP, Connell House, Harvard Business School , Boston, MA 02163. No part of this publication may be reproduced, stored in a retrieval system, used in a spreadsheet, or transmitted in any form or by any means�—electronic, mechanical, photocopying, recording, or otherwise�—without the permission of the Public Education Leadership Project at Harvard University.
R I C H A R D E L M O R E
A L L E N S . G R O S S M A N
C A R O L I N E K I N G
Managing the Chicago Public Schools
Each child who fails is our failure�…We can�’t ever accept that -- because of poverty or social issues or family issues �– our kids can�’t learn. They can learn. They�’ve proven it. The question is can we do a better job of teaching? �– not just in a few schools but in every school?
With these words, Mayor Richard M. Daley opened the Chicago Public Schools�’ (CPS) kick-off retreat for the new school year on August 19, 2005. The district�’s senior managers and every principal were in attendance. While Daley�’s remarks acknowledged the district�’s progress under Chief Executive Officer Arne Duncan�’s administration, they also reflected a sense of urgency around sustaining and accelerating these gains at scale.
For the past four years, Duncan and his leadership team had been grappling with the challenge of managing for high-performance in �“every school.�” Scale, however, was not the only challenge. The city�’s 617 schools represented different types, achievement levels and capacities to improve teaching and learning. Duncan, a former professional basketball player, noted, �“There�’s no playbook for how to manage a complex district like CPS. We�’re trying to keep everyone�’s eye on the ball�—producing better outcomes for every child.�”
Background Serving over 426,000 students in 511 elementary and 106 high schools, CPS was the nation�’s third
largest school system in SY06.1 The district employed 45,000 people and operated with a $4.1 billion budget. While the student body was diverse, historic economic and ethnic divisions among the city�’s neighborhoods created schools that largely reflected their surrounding communities. Fully 85% of students came from low-income families (see Exhibits 1 and 2 for CPS facts and figures).
CPS operated under a hybrid governance structure. The state legislature had turned the school system over to Daley in 1995. Daley appointed the district�’s seven-member board of education and
1 SY is a PELP convention that denotes �“school year.�” For example, SY06 refers to the 2005-06 school year.
033 Managing the Chicago Public Schools
2
chief executive officer, tapping Arne Duncan as CEO in 2001. Each school site had an elected local school council (LSC) comprised of staff, parents and community members. LSCs hired, evaluated and fired the principal and approved the budget and curricula. LSCs had been in place since 1988. The Chicago Teachers Union (CTU) represented the district�’s 27,000 teachers.
Duncan�’s Administration
Duncan was one of the longest-serving urban superintendents in the country. Dr. Barbara Eason-Watkins, a former principal credited with turning around one of the district�’s lowest-performing schools, served as chief education officer (CEdO). David Vitale, the ex-Chicago Board of Trade President and CEO, was chief administrative officer.
Reforms Duncan�’s administration focused on three core strategies: advancing literacy, strengthening human capital and providing additional learning opportunities for students. The Chicago Reading Initiative required all elementary students to receive two hours of balanced literacy instruction per day. While schools continued to choose their own reading programs�—85 different programs had previously been in use across the district�—CPS encouraged struggling schools to adopt one of five �“district recommended�” reading programs. The district also identified two high-quality math curricula for K-5 and two for grades 6-8, as well as district recommended curricula in math and science for high schools. District trainings were limited to these programs.
More targeted recruiting efforts now produced 10 applicants for every open teaching position, and 42% of teachers hired in SY06 held master�’s degrees. CPS had created a new office of principal preparation and development and tightened principal eligibility. LSCs now hired principals from a pool of district approved candidates that had demonstrated instructional leadership competencies. After-school, summer school and Kindergarten options had also proliferated across the city.
Area structure Duncan and Eason-Watkin had reorganized the district from six 100-school regions to 24 geographic �“areas.�” There were 18 elementary (PK-8) and six high school (9-12) areas. Area size ranged from 18-44 schools; historically low-performing and high school areas were smaller.
An area instructional officer (AIO) led each area. AIOs were charged with working with principals to improve instruction in schools and, in addition to LSCs, evaluated principals. AIOs held one mandatory meeting for principals per month. As a group, AIOs met with Eason-Watkins and Chief Instructional Officer Domingo Trujillo during monthly �“Area Coherence Meetings�” to determine a city-wide focus for the principals�’ meetings. Literacy, however, was a standing focus. Each AIO designed their principal meeting�’s format and activities; meetings ranged from 2-6 hours.
Each AIO was aided by a staff of three to six content coaches (e.g. literacy, mathematics), a school improvement planning coordinator and a management support director. Coaches held area-wide trainings for teachers and worked directly in schools upon request by the AIO or principal. An AIO-led area team observed instruction in classrooms and monitored school improvement through quarterly school visits known as �“walk-throughs.�”
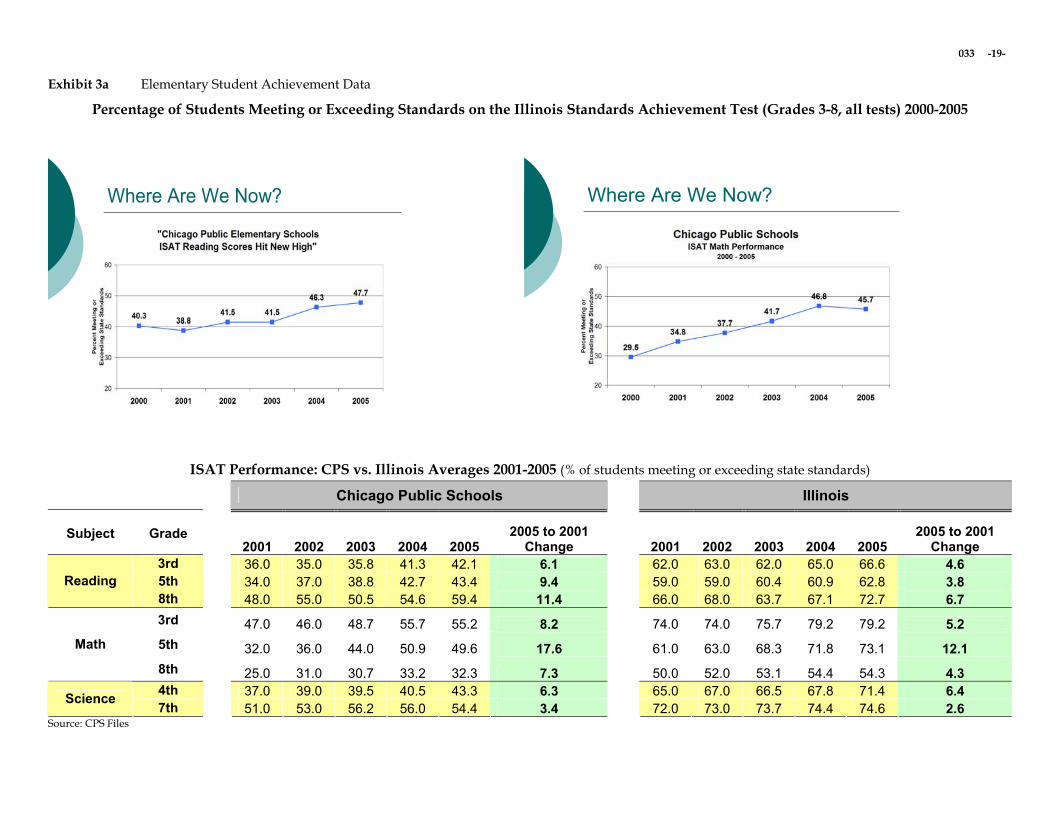
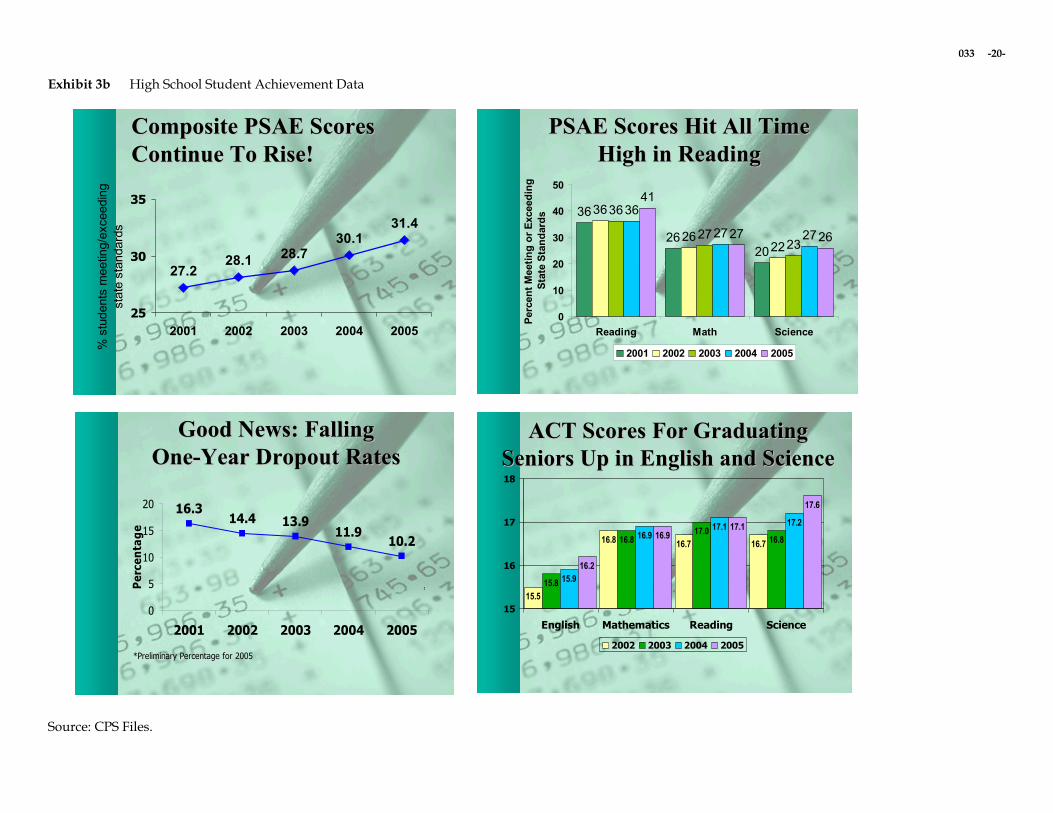
Student achievement Student performance had steadily increased under Duncan (see Exhibits 3a-3b). Between 2001-2005, the percentage of elementary students meeting or exceeding state standards on the Illinois Standards Achievement Test (ISAT) increased by nine percentage points in reading and 11 points in math. By 2005, nearly 50% of elementary students met or exceeded standards and the district�’s ISAT gains outpaced the state averages at every tested grade level. On
Managing the Chicago Public Schools 033
3
the 11-th grade Prairie State Achievement Exam (PSAE) �– which included reading, math, and science �– 31.4% of CPS students met or exceeded standards in 2005 compared with 27.2% in 2001.
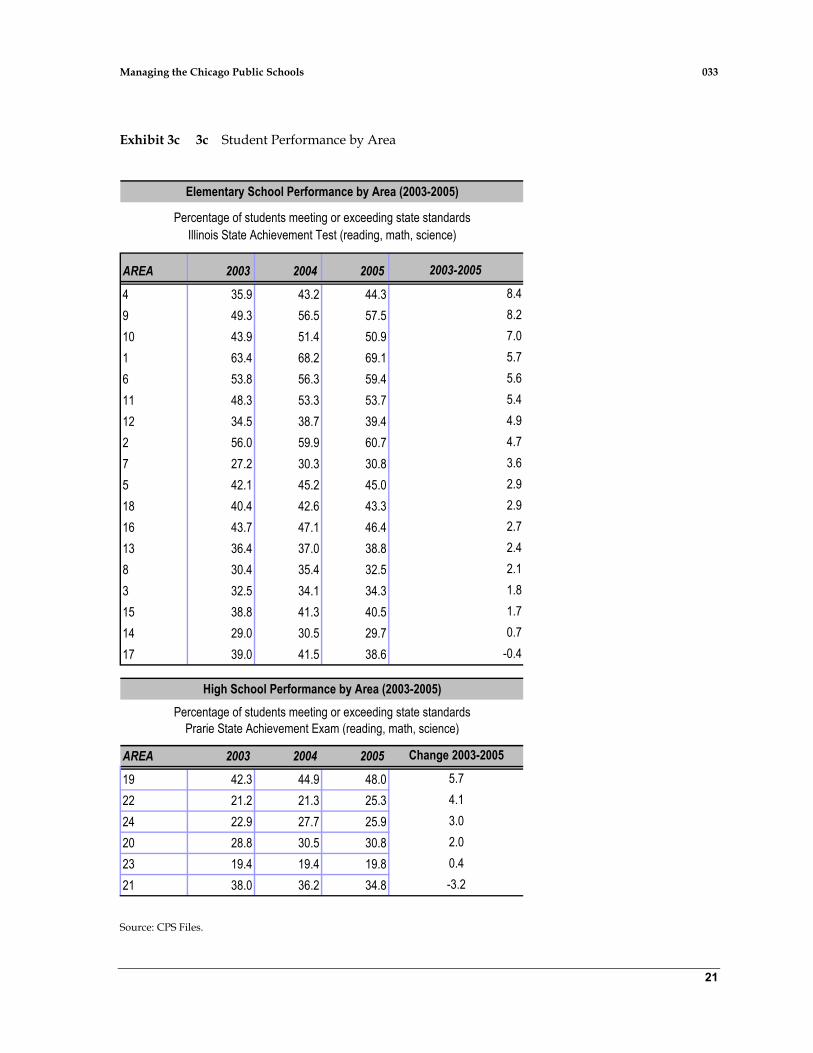
Yet, student performance levels and trends were highly variable across the district (see Exhibits 3c-3e). Between 2003-2005, achievement on state tests rose in some areas, while it stayed flat or declined in others. Over 60% of students met or exceeded state standards in the two northernmost elementary areas in 2005; less than 40% of students met standards in seven other elementary areas.
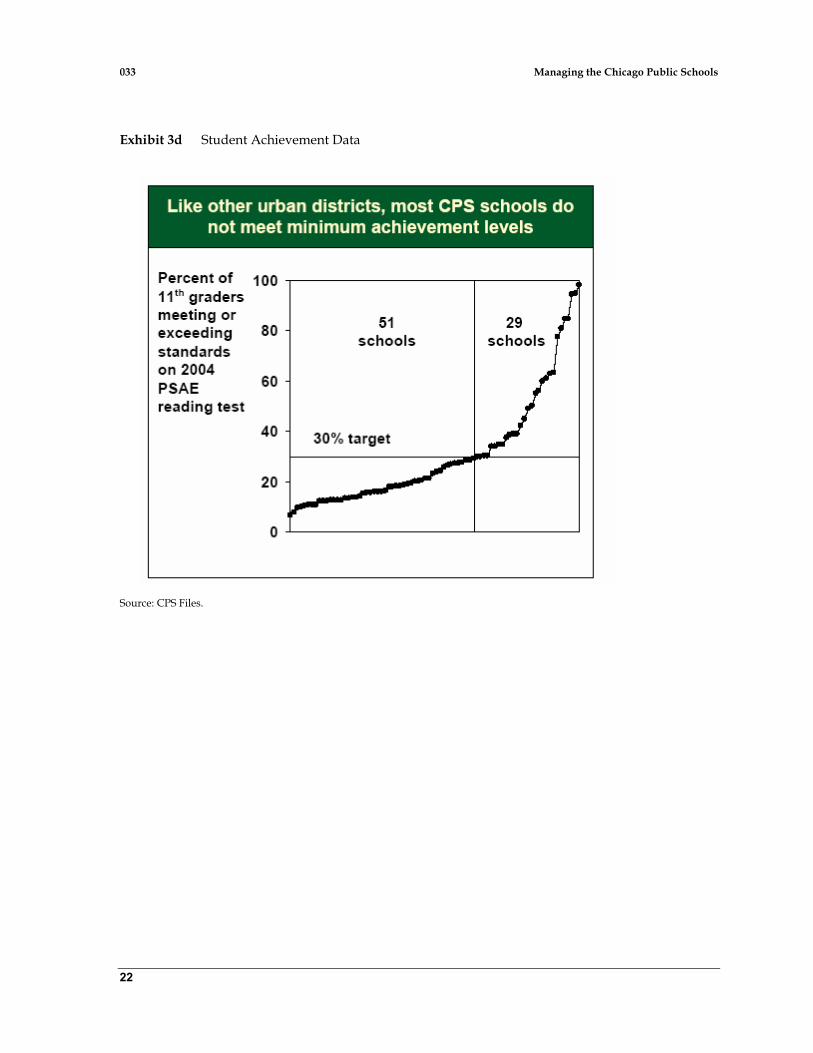
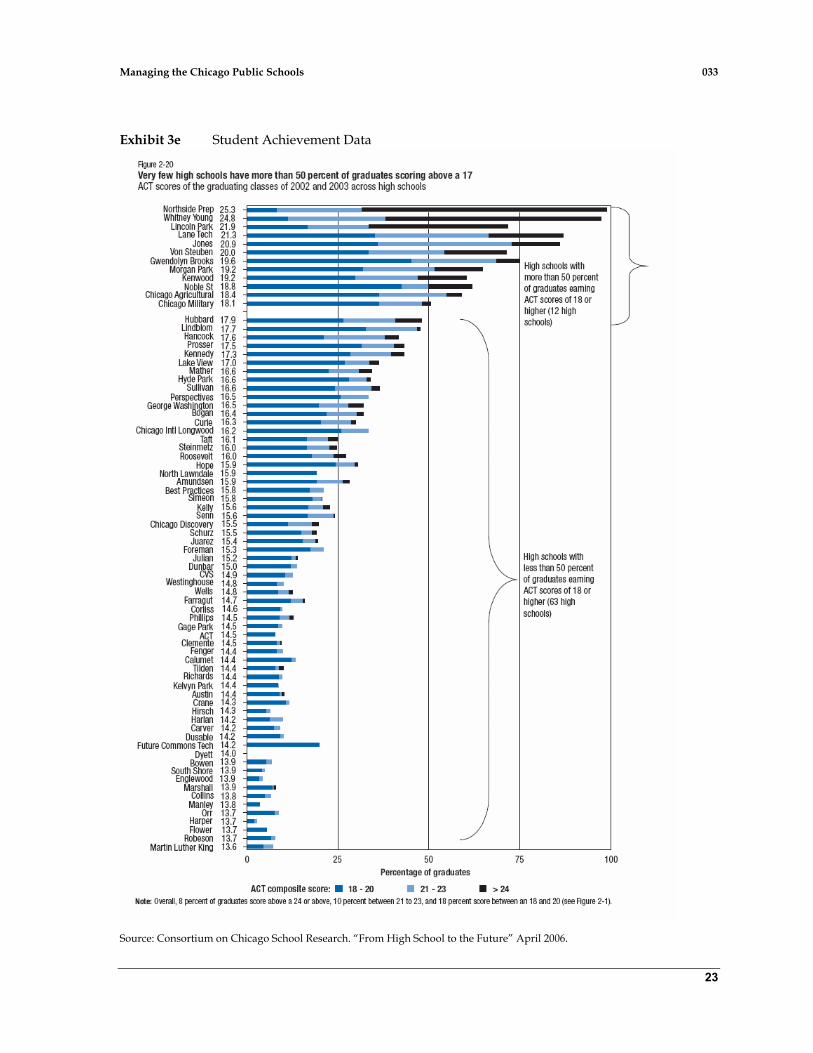
The percentage of high school students meeting or exceeding state standards by area ranged from 48.0% to 19.8%. Only 29 high schools had over 30% of students meeting PSAE standards. And in only 12 high schools did 50% or more students earn an 18 or above on the ACT, the score needed to gain admissions to most four-year public colleges in Illinois.2
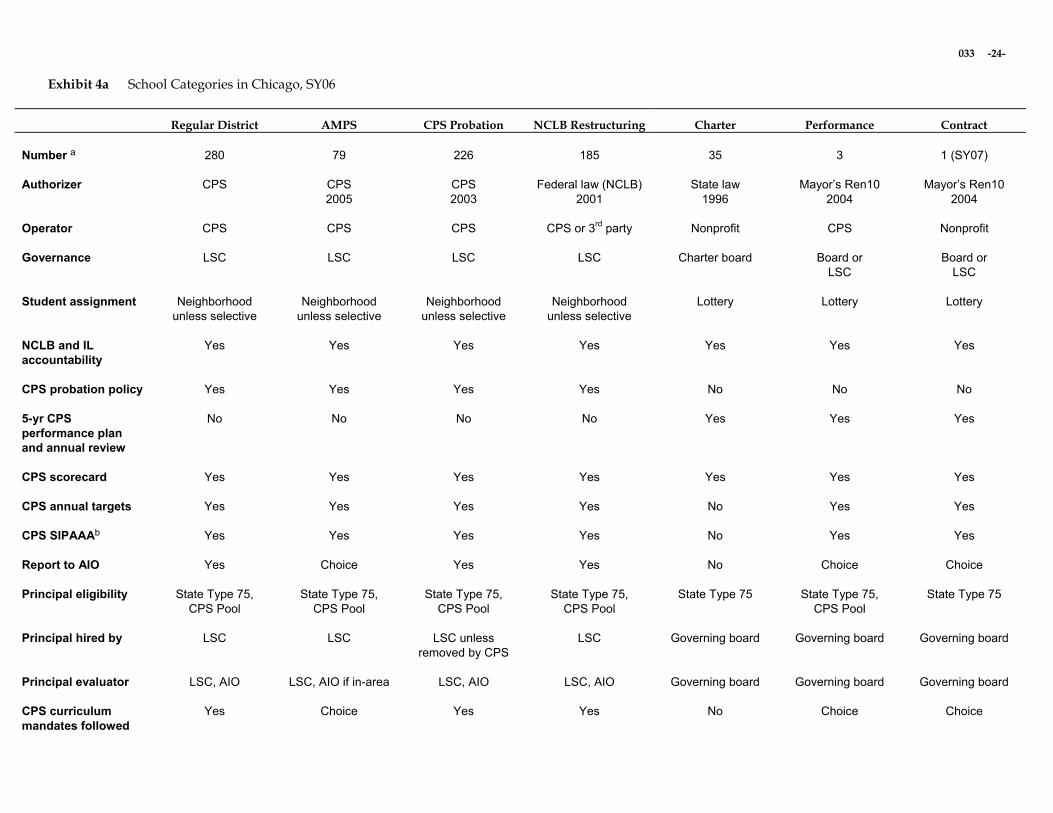
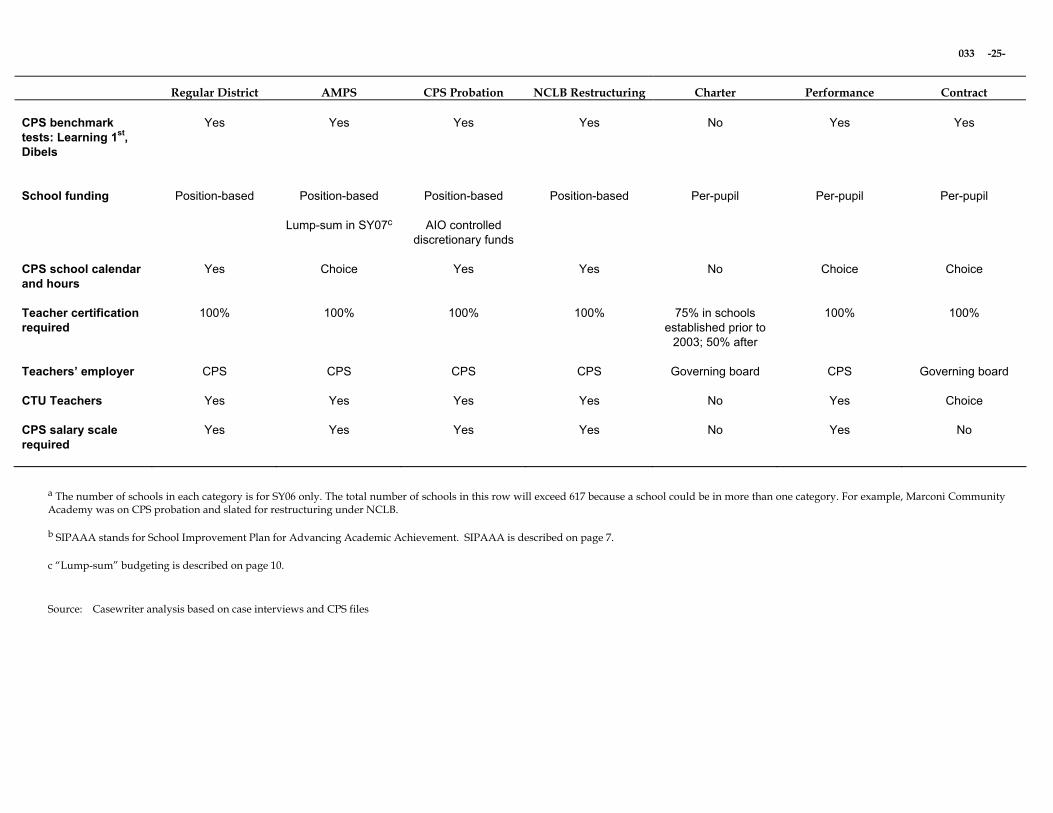
School Categories The district�’s 617 public schools reflected diverse origins, characteristics and management. Brief
descriptions of major school categories follow3 (See Exhibit 4a for a comparison; see Exhibits 4b-4c for performance data).
Regular district schools (280) Regular district schools were required to have elected LSCs, report to an AIO and to hire certified, unionized employees. Budgets were �“position-based,�” meaning that roughly 80% of a school�’s �“general education funds�” were allocated by the central office to positions based on staffing ratios (i.e. 28 students: 1 teacher; 1 engineer per school). Principals controlled the remaining 20%, a discretionary budget of small lines for textbooks and other supplies. Total general education funds averaged $5,200 per elementary pupil and $6,500 per high school pupil. Principals also controlled any state or federal compensatory funds (approximately $1,200 per pupil) based on the number of low-income students enrolled.
Autonomous Management and Performance Schools, AMPS (79) District schools granted 10 �“autonomies�” by CPS in SY06 based on high academic and operational performance.
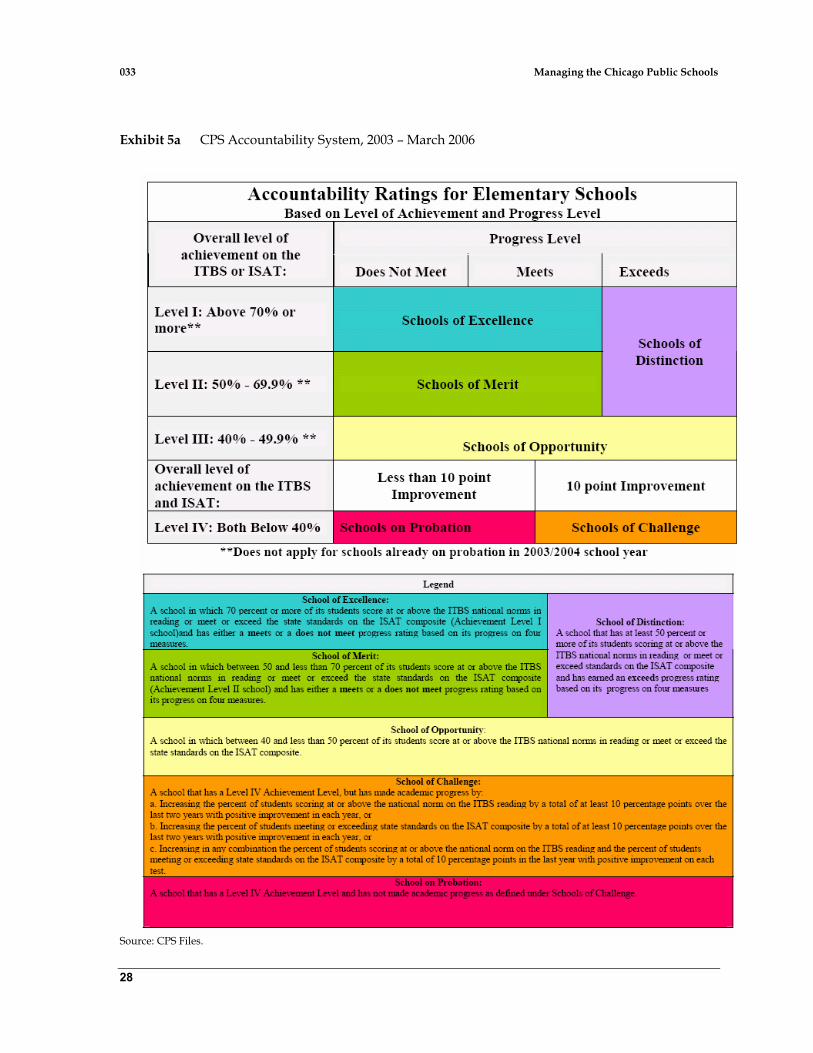
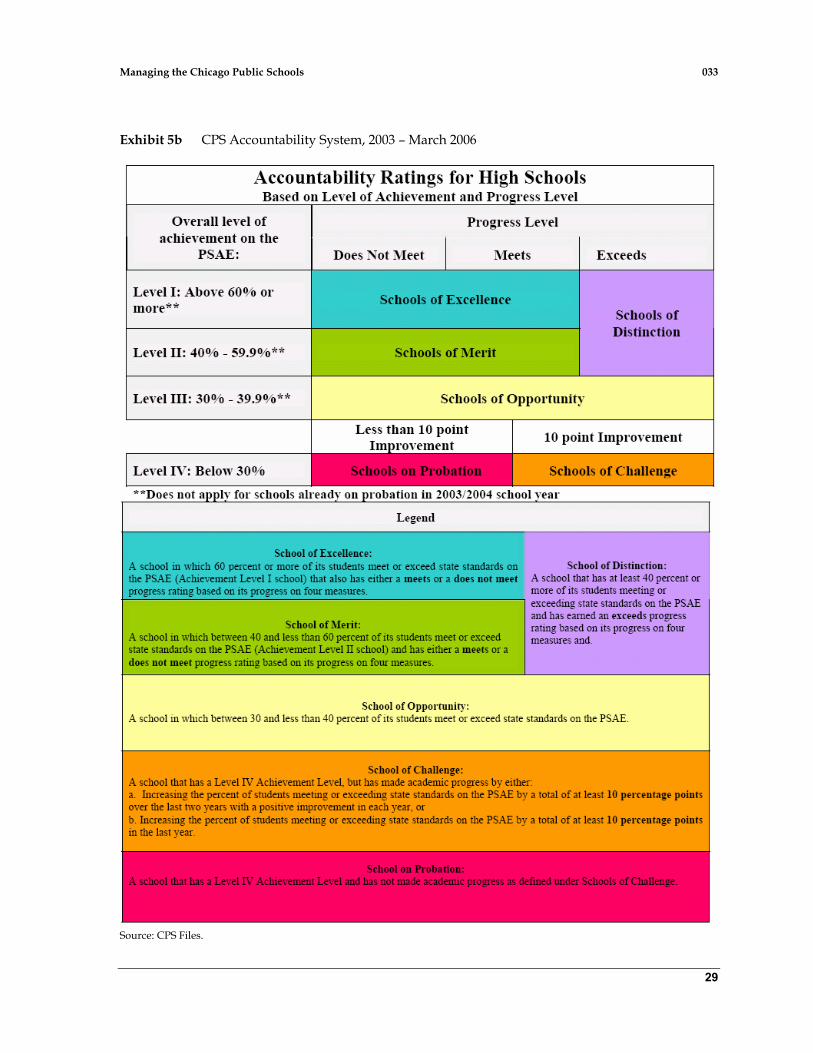
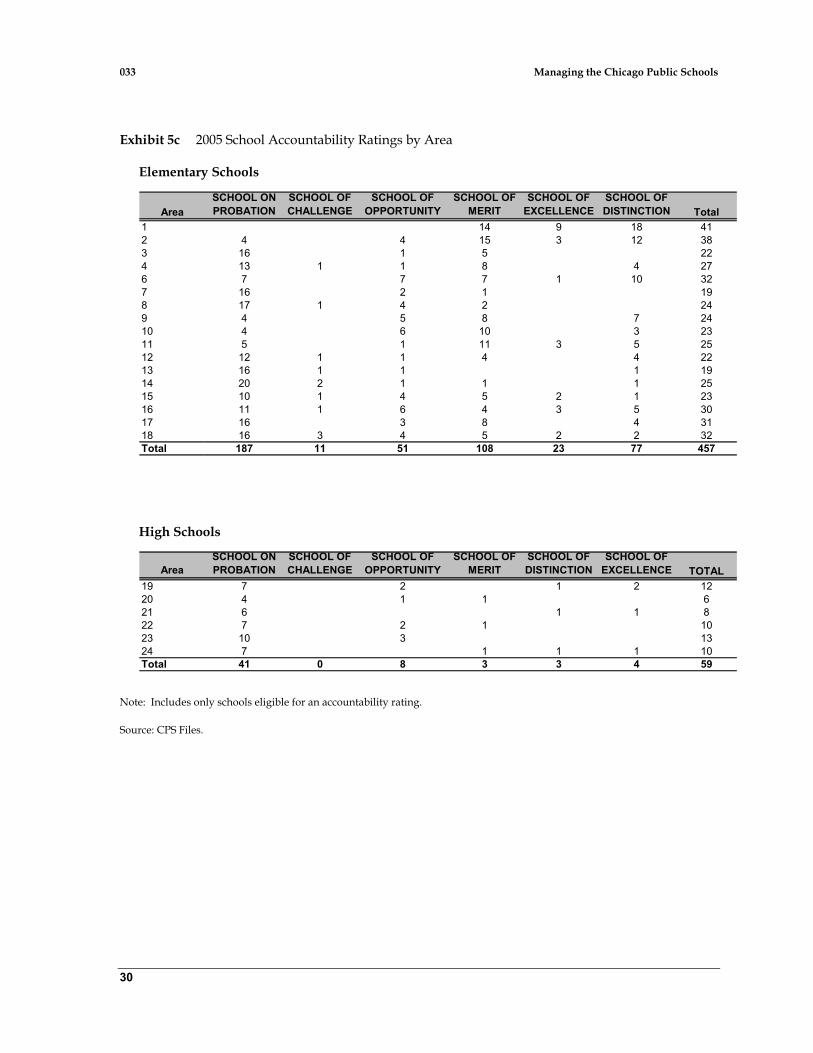
CPS probation schools (226) �“Probation�” was the lowest school rating under the CPS accountability system (see Exhibits 5a and 5b). In probation schools, less than 40% of elementary students (or 30% in high schools) met state standards and performed at national norms on the Iowa Test of Basic Skills (ITBS) and the schools had failed to demonstrate �“academic progress�” as defined by the district. The distribution of probation schools varied by area (see Exhibit 5c).
NCLB restructuring schools (185) Restructuring schools had failed to meet federal Adequate Yearly Progress targets in reading and math for five consecutive years. To comply with the No Child Left Behind Act (NCLB) of 2001, CPS would have to close or restructure the schools in SY07. One-hundred and thirty-seven of the restructuring schools were also on CPS probation.
Charter schools (35) Charter schools were managed and governed by independent organizations and exempt from all CPS policies and initiatives. They received and controlled 100% of district dollars based on the number of students enrolled (�“per pupil budgets�”) and signed five-year
2 Consortium on Chicago School Research. �“From High School to the Future,�” April 2006.
3 The number of schools in each category is for SY06 only. The total number of schools in this section will exceed 617 because a school could belong to more than one category. For example, Ames Elementary was on probation and in restructuring.
033 Managing the Chicago Public Schools
4
performance contracts with the district. A 1996 state law permitted CPS to authorize up to 30 charters; 15 allowed multiple school sites. CPS had authorized 22 charters; 35 sites were operating.
Performance schools (3) and contract schools (1 to open SY07) Performance schools were district-run and hired CTU teachers, while contract schools were run by nonprofits and free to hire non-unionized employees. Both types of schools received per-pupil budgets, had more flexibilities than regular district schools, and signed five-year performance agreements with the district.
The district created the performance and contract school categories in 2004. That year, Daley announced Renaissance 2010 (�“Ren10�”), a campaign to replace the district�’s lowest-performing schools with 100 new schools by 2010. Chief Officer for New Schools Hosanna Mahaley explained, �“The Mayor wanted high-quality, innovative school options available in every part of the city and to offer more choice to parents. We were reaching our charter cap and the Mayor wanted to explore bold new options.�” Ren10 targeted 25 �“priority communities,�” in which 75% of schools were low-performing.
School design teams submitted proposals to open Ren10 schools through an annual competitive RFP process which called for charter, performance or contract school proposals only. As of SY06, the board had closed 27 schools for �“chronically poor performance�” and approved 37 Ren10 schools. By 2010, an estimated 71,000 students, nearly 18% of CPS enrollment, would attend Ren10 schools.
Reactions to the diversity of public schools varied. �“We need all the smart new ideas we can get,�” Duncan said. �“But we�’d be missing the boat if all we do is create great new schools. We�’ve got to learn lessons that help us improve the whole district. Our new schools can be a fantastic catalyst for driving systemic change.�” CTU President Marilyn Stewart cautioned, �“The district is experimenting with kids�’ lives.�” She added, �“Many of these new schools are unproven models. We already have examples of district schools that have made dramatic achievement gains. Why aren�’t we investing resources to learn from what is already working for students?�”
A Strategy to Scale High Performance
Duncan, Eason-Watkins, Vitale, and the other members of the CPS leadership team shared the Mayor�’s concern about increasing the performance of �“every school.�” To that end, they had been refining the district�’s improvement strategy over the past year. During the August 19, 2005 meeting, Eason-Watkins reaffirmed the district�’s commitment to its three core strategies (improving literacy, human capital and student learning opportunities) and presented a �”theory of change�” intended to guide the district�’s work:
Improved student learning requires improved instruction;
Schools are the unit of change for instructional improvement, and principals are the leaders of that change; and
Area and central offices provide critical support for instructional improvement, and differentiate that support based on school performance and need.
Eason-Watkins commented, �“After four years of work, we still believed that improving instruction was the most powerful way to increase student achievement, but we wanted to clarify that there is no �‘one-size-fits-all�’ model that works for 617 schools. Each principal must feel empowered to drive change and receive the support that responds to the school�’s specific needs.�”
Managing the Chicago Public Schools 033
5
During SY06, the district took steps to enact its theory of change by setting clear expectations, differentiating treatment of schools and making accountability more consistent.
Setting Clear Expectations
5-year District Student Outcome Goals
Based on focus groups with district leaders, school staff, students and their families, CPS established the �“ultimate district goal�” of �“graduating all students prepared for success in post-secondary education and employment.�” Eason-Watkins announced the goal at the August 19, 2005 meeting, calling it �“ambitious.�” Indeed, only 54% of CPS students even graduated high school within five years. Historically, only six out of every 100 ninth graders earned a bachelor�’s degree within six years of starting college.4
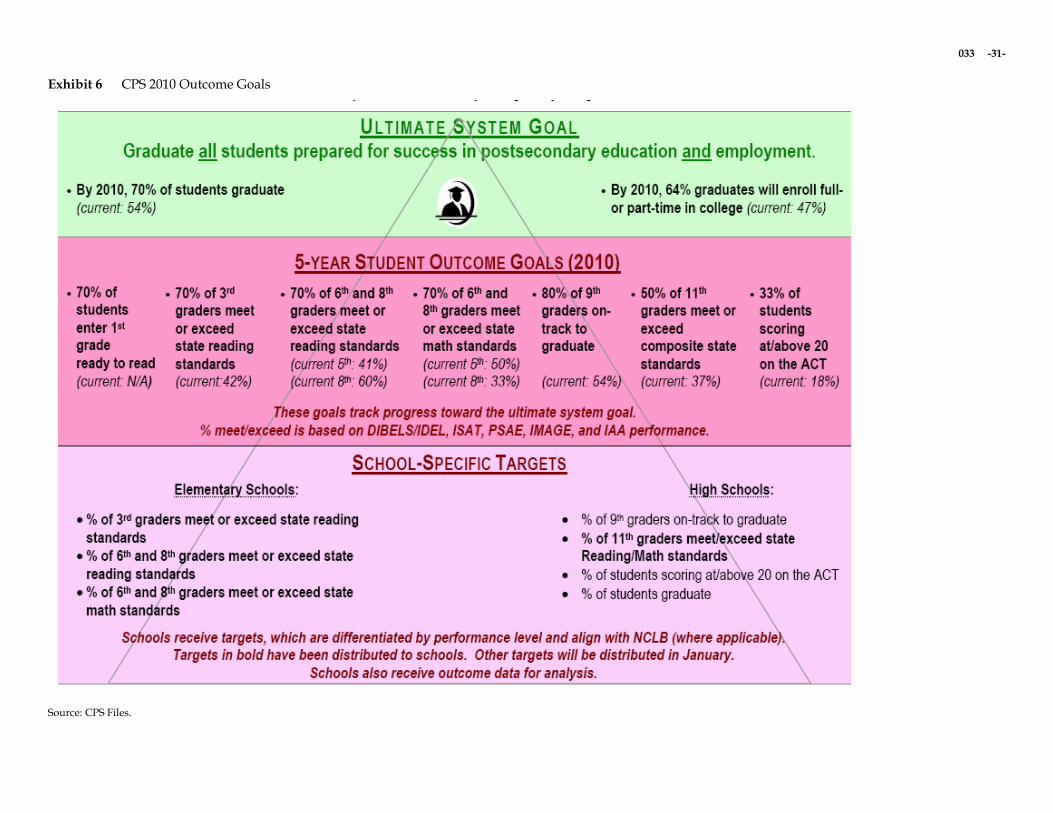
To measure progress towards attaining the ultimate goal, CPS established five-year student outcome goals for 2006-2010. The 2010 outcome goals were:
• At the elementary level, 70% of students will
• Enter the 1st grade ready to read
• Complete the 3rd grade meeting or exceeding state reading standards
• Complete the 6th and 8th grades meeting or exceeding state standards in reading and math
• At the high school level
• 80% of freshmen will be on track to graduate
• 50% of 11th graders are meeting or exceeding state standards in all content areas
• 33% of students are �“college ready�” (score at/above 20 on the ACT)
For each outcome goal, the district established an indicator with the current performance in 2005 and the 2010 goal (see Exhibit 6). Chief Planning Officer Larry Stanton noted, �“We set district and school level student outcome goals because we needed to define success for the district and for schools. Everyone, particularly principals, needs to know what�’s expected of them so they can work toward achieving it. The goals were intended to be ambitious, but achievable.�”
School Annual Performance Targets and the SIPAAA
Annual school targets In fall 2005, CPS set annual school performance targets for 2006-2010. The targets represented each school�’s contribution to meeting the district�’s 2010 outcome goals. Elementary schools received annual targets for the percentage of students expected to meet standards on the ISAT in grades 3, 6 and 8 and schoolwide attendance. High schools received annual targets for
4 Consortium on Chicago School Research.
033 Managing the Chicago Public Schools
6
the percentage of students expected to meet standards on the PSAE, be �“on track to graduate,�” graduate within five years, and complete high school as �“college ready�” (ACT score).
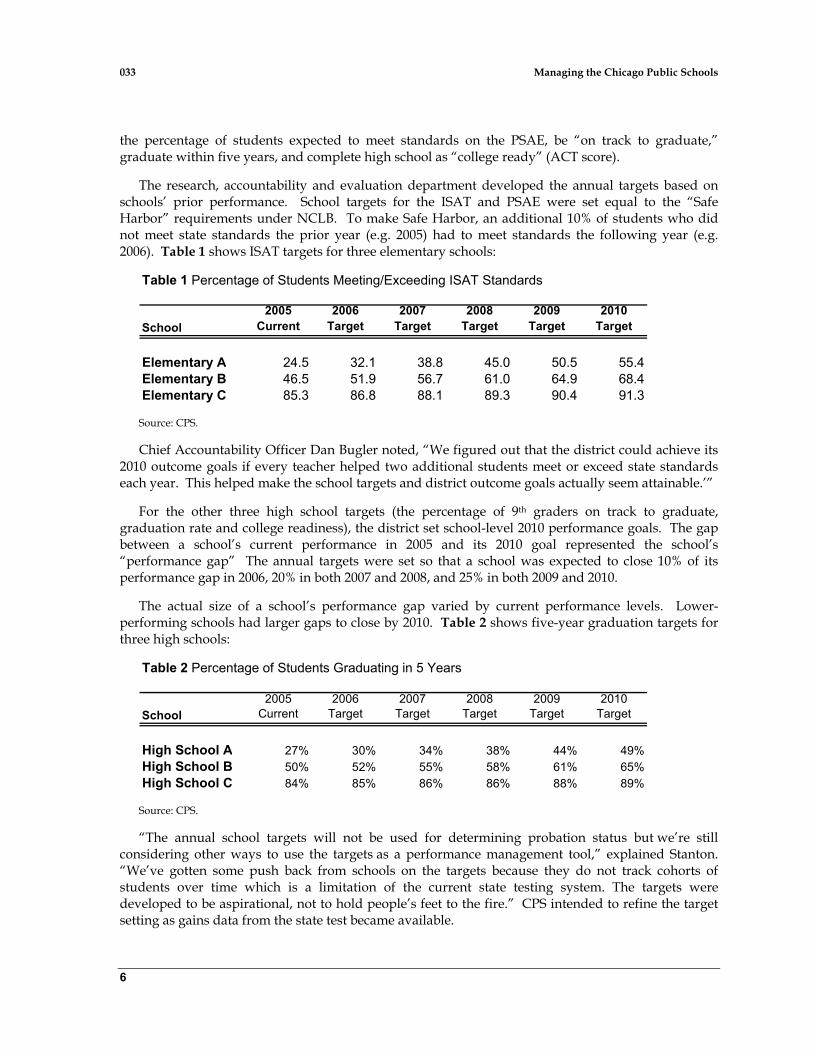
The research, accountability and evaluation department developed the annual targets based on schools�’ prior performance. School targets for the ISAT and PSAE were set equal to the �“Safe Harbor�” requirements under NCLB. To make Safe Harbor, an additional 10% of students who did not meet state standards the prior year (e.g. 2005) had to meet standards the following year (e.g. 2006). Table 1 shows ISAT targets for three elementary schools:
Table 1 Percentage of Students Meeting/Exceeding ISAT Standards
School2005
Current2006
Target2007
Target2008
Target2009
Target2010
Target
Elementary A 24.5 32.1 38.8 45.0 50.5 55.4Elementary B 46.5 51.9 56.7 61.0 64.9 68.4Elementary C 85.3 86.8 88.1 89.3 90.4 91.3
Source: CPS.
Chief Accountability Officer Dan Bugler noted, �“We figured out that the district could achieve its 2010 outcome goals if every teacher helped two additional students meet or exceed state standards each year. This helped make the school targets and district outcome goals actually seem attainable.�’�”
For the other three high school targets (the percentage of 9th graders on track to graduate, graduation rate and college readiness), the district set school-level 2010 performance goals. The gap between a school�’s current performance in 2005 and its 2010 goal represented the school�’s �“performance gap�” The annual targets were set so that a school was expected to close 10% of its performance gap in 2006, 20% in both 2007 and 2008, and 25% in both 2009 and 2010.
The actual size of a school�’s performance gap varied by current performance levels. Lower-performing schools had larger gaps to close by 2010. Table 2 shows five-year graduation targets for three high schools:
Table 2 Percentage of Students Graduating in 5 Years
School2005
Current2006
Target2007
Target2008
Target2009
Target2010
Target
High School A 27% 30% 34% 38% 44% 49%High School B 50% 52% 55% 58% 61% 65%High School C 84% 85% 86% 86% 88% 89%
Source: CPS.
�“The annual school targets will not be used for determining probation status but we�’re still considering other ways to use the targets as a performance management tool,�” explained Stanton. �“We�’ve gotten some push back from schools on the targets because they do not track cohorts of students over time which is a limitation of the current state testing system. The targets were developed to be aspirational, not to hold people�’s feet to the fire.�” CPS intended to refine the target setting as gains data from the state test became available.
Managing the Chicago Public Schools 033
7
School improvement plans CPS introduced a new school improvement planning process for 2006-2008. The Illinois State Board of Education had required school improvement plans since 1993, and since 1998, had allowed CPS schools to use a uniform template entitled the �“School Improvement Plan for Advancing Academic Achievement,�” or SIPAAA. According to Stanton, �“Many of the plans were 200-page documents that did not set specific performance expectations. They mostly sat on a shelf collecting dust.�”
CPS streamlined the template for the 2006-2008, which included annual school targets for the first time. In January 2006, every school in CPS, except charter schools, received a 20-page 2006-2008 SIPAAA populated with its past performance and targets for SY07 and SY08. The SIPAAA outlined a process to help each school develop a plan to achieve its targets. Stanton explained, �“We wanted to provide a structure to help schools design their own roadmaps for raising student achievement.�”
Each school first articulated a mission and vision. School leadership teams and stakeholders then assessed their school�’s strengths and weaknesses. In an �“outcome analysis,�” the SIPAAA team reviewed four data sets: student outcomes, academic progress, student connection and school characteristics.
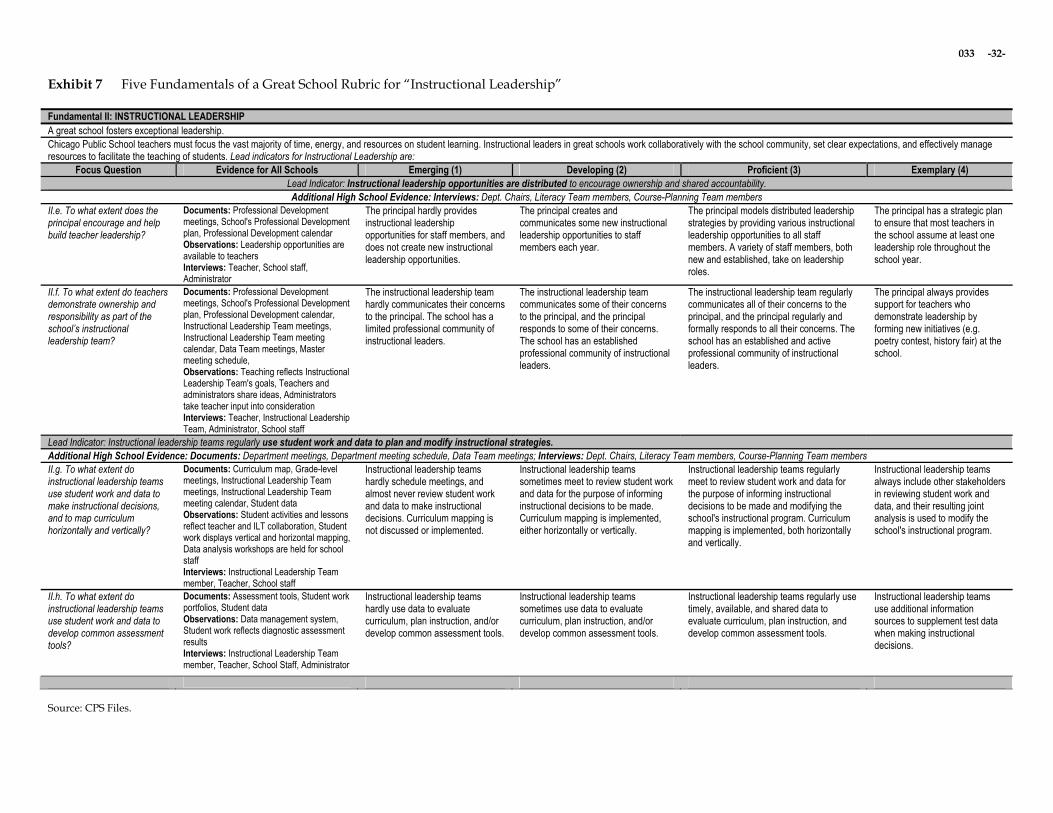
In a �“process analysis,�” schools used rubrics to self-evaluate five elements associated with school improvement referred to as the Five Fundamentals of a Great School (see Exhibit 7). CPS had developed the Five Fundamentals by drawing upon research on reform efforts in Chicago, Boston and other urban districts across the U.S. The Five Fundamentals comprised:
1. Instruction: The classroom activity that directly affects student learning. Includes the capacity of the teacher, the rigor of the content and the engagement of students.
2. Instructional leadership: The school-level activity of principals and leadership teams, including scheduling, resource management and curriculum planning.
3. Professional capacity: The school- or district- level activity that improves instructional practices in the classroom. Includes professional development, coaching and mentoring.
4. Learning climate: The school-level activity that promote a safe and orderly environment.
5. Family and community involvement: The school-level activity that encourages interdependence with the community. This relationship promotes the growth, commitment and sharing of student learning resources.
Finally, each school defined priorities, designed curriculum and instruction interventions and created a budget. Schools submitted SIPAAAs by April 7, 2006. AIOs approved SIPAAAs for the schools under their management. One elementary AIO commented, �“This year produced the tightest alignment between schools�’ plans to improve student achievement and their allocation of resources that I�’ve seen during my 20-plus years as an administrator with CPS.�”
Performance Contracts for All New Schools
CPS required all new charter, performance and contract schools to sign consistent five-year performance contracts beginning in SY06. Prior, each new school had negotiated its own performance agreement with the district, although some schools never had an official agreement. Mahaley commented, �“For the first time, we are holding all new schools accountable for the same
033 Managing the Chicago Public Schools
8
things�—improved student achievement, sound financial and operational management and regulatory compliance�—using the same metrics.�”
During the five-year contract period, the district conducted yearly performance reviews at new schools. At the end of the five years, the district could renew or terminate the contract. The district could close a charter, performance or contract school at any time for poor academic achievement or operational/fiscal mismanagement. The board had closed three charter schools between 1997-2006.
Eason-Watkins noted, �“Over time, we hope to move more of our district schools to the performance contract model in order to facilitate clear dialogue about expectations, accountability, and autonomy.�” The district was considering asking AMPS principals to sign performance contracts and using performance contracts to attract high-potential principals into low-performing schools.
Providing Effective and Targeted Support Citing a desire to �“provide effective, targeted support to schools,�” CPS implemented four
initiatives during SY06: 1) clarifying the AIO role, 2) differentiating treatment of schools, 3) providing better student data and 4) reorganizing the central office.
Clarifying the Area Instructional Officer�’s Role
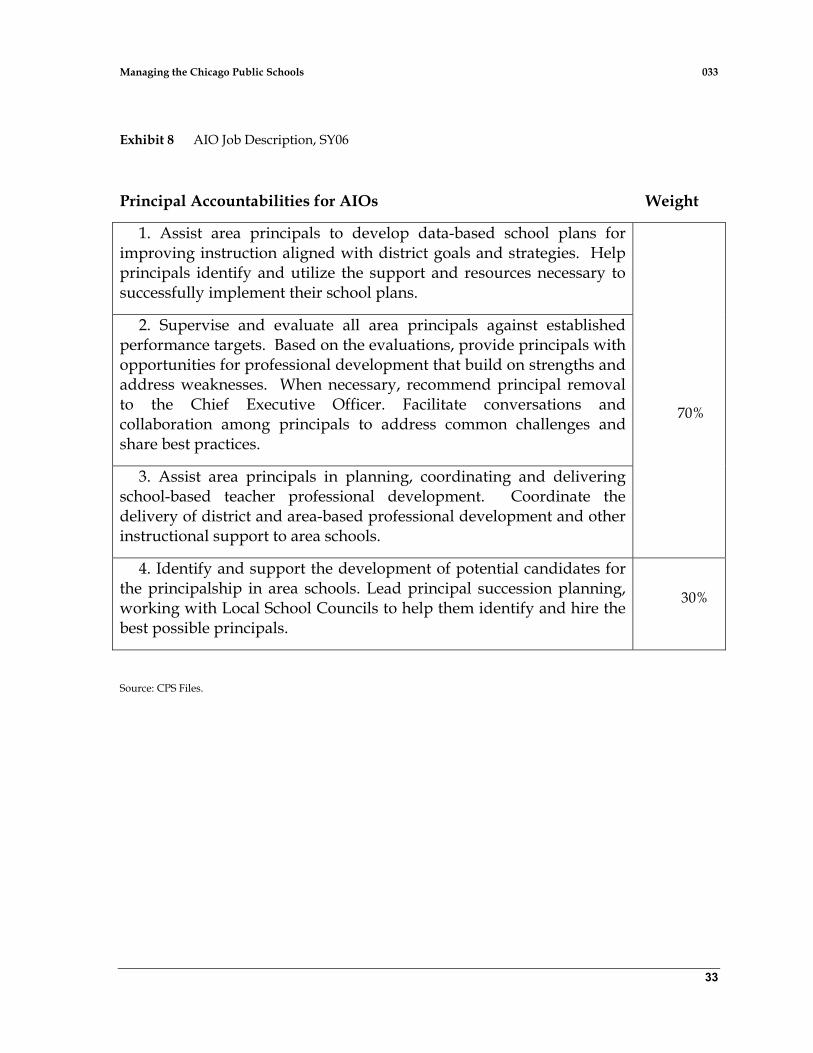
Originally, AIOs were expected to spend 60% of their time improving instruction and 40% resolving school management or operations issues. Starting in SY06, AIOs were expected to spend 70% of their time working with principals to improve instructional leadership; 30% identifying, developing and placing new principals; and 0% on school management or operations (see Exhibit 8). Six new business service centers (see page 14) were being created to help pick up AIOs�’ operations responsibilities. Trujllo explained the rationale behind the AIO role clarification:
We need AIOs to have the time to assist principals to obtain and align the resources that they say they need to be successful. Too often, AIOs find themselves taking on non-instructional issues because we at central office make too many demands of them. All of us must think much more carefully about what we ask AIOs to do. If the task is not an instructional one, we must find another mechanism for working with schools. And, with 50% of our principals eligible to retire by 2010, we want and need AIOs to groom our next school leaders and advise LSCs on hiring.
An elementary AIO who had served in the position since its inception commented, �“The clarification renewed my focus on instruction. I�’m more likely to delegate non-instructional tasks or push back on the central office if they are asking me and my staff to spend time on something that would pull us away from our work in schools.�” �“But, there�’s always challenges,�” she continued. �“Things always crop up�—like parent concerns or a LSC that won�’t meet to approve a budget item.�”
The focus on the AIOs�’ role coincided with the first significant wave of AIO retirements. Eighteen AIOs had occupied their positions since the area structure was created. Five AIOs would retire in June 2006. An additional five were expected to retire at the end of SY07.
Remarking on the retirements, Janet Knupp, director of a Chicago-based venture philanthropy that made investments to strengthen CPS leadership, observed, �“The retirements give the district an opportunity to find the people who fit the newly clarified expectations. A deeper issue remains,
Managing the Chicago Public Schools 033
9
however. Is an AIO�’s job doable? Is it really possible to effectively support more than 20 schools? If it�’s an impossible task, the system may only be setting the AIOs up to fail.�”
Differentiating Treatment of Schools
Duncan elaborated on the component of the district�’s theory of change that called on area and central offices to differentiate support to schools based on performance and need:
Very simply, the approach is based on the reality that kids learn differently. You have to teach kids differently. And schools are no different. Schools are just one step larger than kids. Historically, though, we�’ve had a communistic system. We treated all schools the same. And we treated too many, I argue, relatively poorly. You have to look at each child and each school individually and figure out what�’s best for them.
CPS differentiated support to three types of schools based on performance in SY06: 1) AMPS, 2) CPS probation schools, 3) NCLB restructuring schools. Each of these categories included elementary and high schools. Concurrently, the district designed high school interventions that cut across all performance levels.
1) Autonomous management and performance schools (AMPS) In announcing AMPS, Duncan said, �“We looked hard at all of the factors that go into creating a great school. These schools have obviously got it figured out and they have great principals. We have to build a culture of trust and give them the freedom to innovate. The best thing we can do is get out of their way.�”
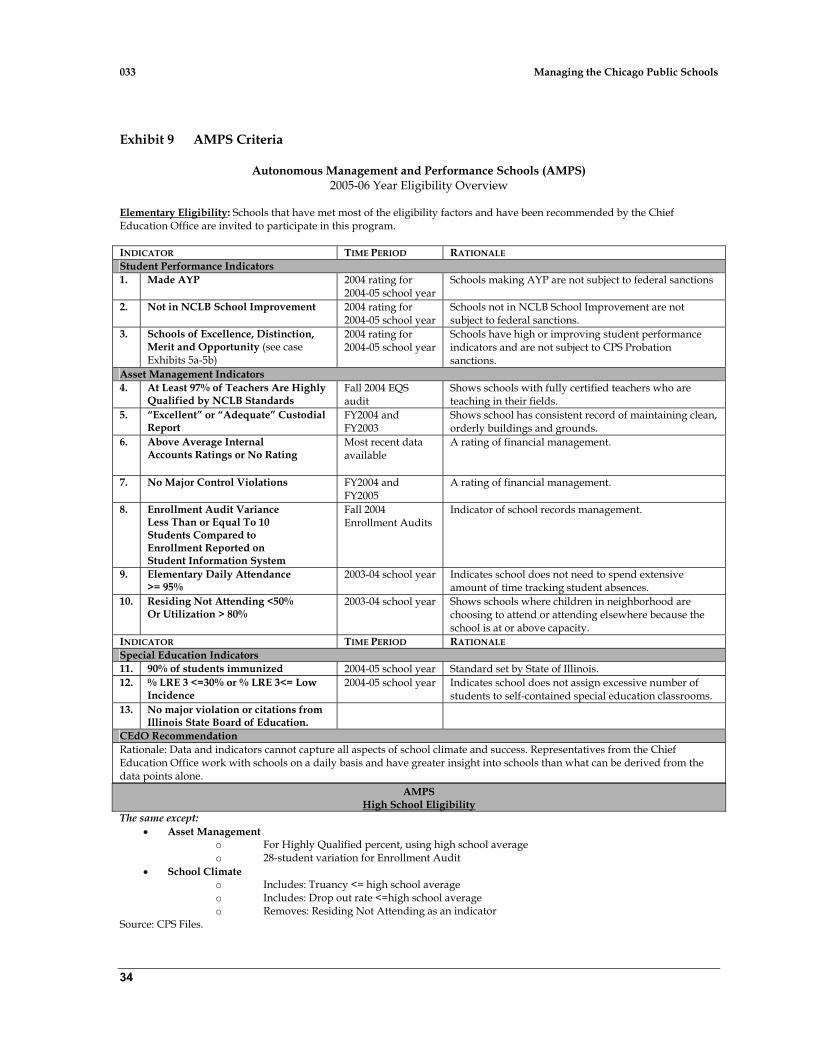
CPS identified AMPS schools using 13 academic, operational and compliance indicators and the Chief Education Office�’s recommendation (see Exhibit 9). The district offered AMPS status to 85 schools; 79 participated (69 elementary and 10 high schools). AMPS mostly represented the district�’s highest-performing schools, although three schools that did not meet the academic criteria were also granted AMPS status. Eason-Watkins explained, �“We had recruited some strong principals to challenging schools and we wanted to use AMPS as an incentive for them to stay.�” Of the 10 AMPS high schools, six were �“selective enrollment�” schools that used academic criteria to admit students.
The district granted AMPS schools the ability to exercise 10 �“autonomies,�” such as opting out of the area structure or the district�’s new teacher induction program. An AMPS principal could select as many of the 10 autonomies as desired (see Exhibit 10 for the autonomies and schools�’ selections).
Melissa Megliola, a former private sector consultant, managed AMPS with assistance from retired CPS principal Tony Jelinek. Megliola described her role: �“My first goal is to make sure AMPS schools are kept in the loop. We have to ensure that life does not feel worse for them. My second goal is to advocate for AMPS schools within the central office so that they can exploit their autonomies in new and creative ways. �”
Fifty percent of AMPS schools opted out of the area structure. Out-of-area AMPS schools lost all access to the area staff, coaches and professional development. These principals did not have to attend area principals�’ meetings, report to an AIO or hold walkthroughs with the area team. AIOs no longer evaluated these principals; the district was in the process of identifying an alternate evaluator.
In-area AMPS schools still reported to and were evaluated by their AIO. These principals attended area principals�’ meetings and, dependent on the AIO, held area walkthroughs. They were able to request support from AIOs and area coaches and send teachers to area trainings.
033 Managing the Chicago Public Schools
10
Two AMPS principals reflected on their decisions:
�“I relish autonomy, but I didn�’t want to jump out of the area this first year of AMPS. My AIO is very supportive and the professional development is valuable. As long as I can use the area supports to continue building the autonomy and capacity of my staff, I�’ll stay.�”
�“I left the area because the AIO was controlling. And everything offered by the area was �‘one-size-fits-all�’�—the principals meetings, the professional development for teachers, the walk-throughs. If differentiated instruction is our goal for students, why not do it with us?�”
Concurrently, CPS eliminated one elementary area and one traditional high school area in SY06. As a result, some AIOs took in additional schools and watched their caseload grow, particularly if AMPS schools elected to remain. For example, an area in which 100% of AMPS schools stayed and merged with a closed area grew from 22 to 34 elementary schools from SY05 to SY06. The AIO said, �“I think the AMPS schools stayed because they get good support from all area staff, especially my coaches. But, I have to be careful because the strong schools would snatch up all of my coaches�’ time if we let them!�”
An AIO in which 86% of the area�’s AMPS schools opted out of the area commented:
At first I was upset. It felt like we were rewarding the principals who had been the most resistant to anything from the central office or the area because in terms of absolute test scores, they were at the high end of the district. But most of these schools had been making little to no gains; the schools�’ performance had flat-lined. Maybe the AMPS schools will work harder this year to increase achievement because they cannot blame anyone else for holding them back.
One elementary principal reflected on AMPS mid-way through SY06:
The biggest difference under AMPS is that I don�’t have to hide anymore if I�’m doing something �‘out-of-the-box�’ to better support my teachers and students. But some of the central offices still don�’t understand that as AMPS schools, we�’re allowed to do things differently. Fortunately, Melissa and Tony are there whenever we need someone to run interference.
All AMPS schools were given two years before their AMPS-status would be reevaluated. Megliola explained, �“We were asking schools to take new risks with us. We did not want anyone to fear being penalized if performance went down as a result.�” The criteria for admitting additional schools into AMPS were still being discussed, but Megliola imagined adding 5-15 schools per year.
The district intended to give AMPS schools more budgetary flexibility in SY07. Instead of receiving position allocations, AMPS schools would receive the dollars to cover the cost of an average district salary for each position previously budgeted to the school (known as �“lump-sum budgeting�”). The principal could then spend the dollars as he/she chose, as long as the school hired enough teachers to maintain class size ratios as specified under CTU contract. Any AMPS school that would have received less money for staff in SY07 as compared to SY06�—which could happen if more experienced, expensive teachers worked at the school�—would be �“held harmless�” in SY07.
2) CPS probation schools Probation schools were treated differently in two respects. First, under board policy, CPS could assign an interim principal to any probation school if the previous principal had been removed due to poor performance.
Second, AIOs were given control over the probation schools�’ discretionary budgets in SY05. That year, the central office paid for a lead literacy teacher (LLT) in every probation school and every
Managing the Chicago Public Schools 033
11
school (dependent on the amount of discretionary funds available) was required to pay for a second LLT, reduced class size in grades 1-3, full-day Kindergarten, and district recommended curricula for literacy and math at specific grade levels. In the summer of 2005, Stanton�’s team held focus groups with AIOs and principals. Participants said that �“uniform school improvement requirements were not effective�” and stressed the need for flexibility to adapt strategies to local school conditions.5
In response, the curriculum offices designed Instructional Support Options (ISOs). ISOs were �“packages�” of interventions that individual schools could choose from in developing their 2006-2008 school improvement plans. Acting Math and Science Curriculum Officer Mike Lach explained, �“ISOs are a menu of curriculum and instructional supports, such as materials, positions and professional development. A school can choose a �‘fully-loaded�’ package or select items a-la-carte style. The idea is to help principals and AIOs select which interventions best fit a school�’s needs�” (see Exhibit 11).
One elementary AIO explained the shift, �“The budget approval process for probation schools was more of a negotiation this year. I sat with each principal and we assessed what was working and what was not. I did not completely throw out the guidelines from last year because in many cases they were effective, but each school was able to adapt and adjust rather than follow a set of rules.�”
�“We needed the one-size-fits-all approach in the beginning so that we could even the playing field,�” reflected another elementary AIO. �“Because we were so structured and had the same expectations of every school, probation school principals have a better understanding of how to improve instruction. Having done that, it makes sense to offer more choices now.�”
One probation school principal commented, �“My AIO is making me budget for a second lead literacy teacher again this year, even though my leadership team and I aren�’t convinced that the position has made a difference. What we really wanted was a second disciplinarian.�”
3) NCLB restructuring schools NCLB required districts to ensure that after a sixth year of missing Adequate Yearly Progress, a restructuring school enacted one of five plans:
1. reopen as a public charter school
2. replace all or most of school staff who are relevant to the school�’s failure to make AYP
3. contract a third party to operate the school
4. turn the operation of the school over to the state
5. implement any other major restructuring of the school�’s governance arrangement that makes fundamental reforms to improves academic achievement
The Illinois State Board of Education ruled out state takeovers and the district�’s charter cap limited that option. Given these constraints, CPS designed several options for its 185 restructuring schools. Implementation costs were estimated at over $7 million.
Forty-four restructuring schools implemented one of the following �“centrally directed initiatives�”:
close and reopen in the future under Ren10 (10 schools)
assign high-potential �“turnaround�” principals (2 schools)
5 CPS Instructional Support Options for Elementary and High Schools, p. 4. 2006.
033 Managing the Chicago Public Schools
12
share management responsibility with CTU for five years, with schools adopting comprehensive school reform models and piloting peer evaluation for teachers (8 schools)
partner with one of three external instructional improvement providers: America�’s Choice, Strategic Learning Initiatives or Learning Point Associates (24 schools)
In the other 141 schools, AIOs were asked to work with principals during the SIPAAA process to identify interventions that would enhance student achievement and satisfy the law�’s restructuring requirements. AIOs were given responsibility for developing school-by-school plans that were then reviewed and approved by the CEdO. Plans had to be supported by data (both performance and qualitative data collected by the AIO through ongoing work in the schools). AIOs were directed to work with the school staff and communities in developing these plans, but ultimately had the authority to decide on the appropriate interventions.
Interventions included staffing changes (e.g. hiring an additional literacy teacher or removing an ineffective teacher), enhancing existing literacy programs or adopting new ones and splitting K-8 schools into K-3 and 4-8 schools, among others. Accountability Officer Xavier Botana commented, �“We believed that these schools could be successful with greater AIO oversight and a mix of other improvements. There is no �‘magic bullet,�’ just a lot of hard work.�”
4) High schools Two major efforts to improve support to high schools were underway.
Area 25 for Small high schools Between 2001-2003, the Bill and Melinda Gates Foundation and local Chicago foundations awarded CPS $25 million to open 32 small high schools by 2007. Five low-performing high schools would be converted into 20 autonomous small high schools and 12 new start-up small high schools would be created. An intermediary, the Chicago High School Redesign Initiative (CHSRI) formed to channel the funding and help manage the effort.
Twenty-four small high schools (23 regular, 1 charter) had opened by SY06. These small schools enrolled less than 500 students and typically formed around a theme, such as medicine or the arts. Small schools received start-up funding and an additional $300 per pupil each year.
CPS created a special area, Area 25, for the district�’s small high schools in SY06. Prior, small high schools had been interspersed across the six different high school areas. Cynthia Barron, a high school AIO since 2002, moved to head up Area 25. Barron commented:
�“Small high school principals are unique. They�’re very entrepreneurial, but they have wide range of instructional knowledge and leadership skills. They also face unique challenges as they are each building a new school vision, staff and structures. Area 25 was created to meet these unique needs. We want to provide the best support we can to these schools so that they are successful and the larger system can learn from their innovations.�”
Although a principal at one of the small start-up high schools reflected mid-year, �“I find myself missing the opportunity to learn from principals of high schools that are very different from mine.�”
High school transformation In April 2006, CPS launched a $75-100 million effort to strengthen high school education, known as the �“High School Transformation�” project. Some aspects applied to all high schools in the district (regular district, small, charter, probation, etc.), such as a new high school scorecard. The scorecard reported school performance in four areas: student outcomes, academic progress, student connections and school characteristics. In each area of measurement, schools also received a ranking against all other schools in the district (see Exhibit 12 for a sample scorecard). There were separate rankings for selective enrollment versus non-selective high schools.
Managing the Chicago Public Schools 033
13
Commenting on the new scorecard, Chief Officer for High Schools Dr. Donald Pittman said:
We're sending a clear message about what high school principals should be focused on. We�’re starting to track things that we�’ve always said are important but are hard to measure, such as personalization. For the first time, we're recognizing the �“value-add�” of each school�—are students making expected gains�—in addition to absolute performance. And we�’ve been able to identify some areas in which charter and other new schools are outperforming district schools. Too often in the past, we've launched new initiatives without a mechanism to evaluate if they are any more effective than the old way of doing things.
Other aspects of the transformation project were designed with an opt-in implementation model. Over a three-year period, 50 of the district�’s high schools would be selected to adopt the project�’s �“instructional development systems.�” For each core subject (English, math and science), participating schools would choose one of three �“packages.�” Each package provided standards-based college preparatory curriculum, materials and assessments; professional development and coaching for teachers; and implementation support for principals. Through a RFP process, the district had selected external vendors to help build the packages.
Assistant Director for Planning and Development Angus Mairs explained, �“We wanted to give participating schools a choice.�” He added, �“And we�’re not going to force this on high schools that feel better off without the district�’s support. We hope that over time, if these approaches are as effective as we designed them to be, more and more high schools will voluntarily adopt them.�”
Any high school, except charters, could apply to participate. CPS reported that 40 high schools applied for the first implementation year, known as �“Wave 1.�” The district chose 14 schools based on leadership strength and teacher buy-in. These Wave 1 schools would begin implementing their selected packages in SY07, starting with 9th grade classrooms. The 14 schools ranged from high- to low-performing. Additional classrooms and new high schools would be added in SY08 and SY09.
Providing Better Student Data
CPS took steps to strengthen the district�’s and schools�’ capacity to assess student performance over time in SY06. Previously, the district relied solely upon the Iowa Test of Basic Skills (ITBS) to measure individual student growth. The ITBS was not aligned to the Illinois state standards or the ISAT and PSAE state assessments. The district discontinued the ITBS in SY06.
Benchmark assessments CPS mandated two new �“benchmark�” assessments in reading: the DIBELS and Learning First. DIBELS assessed first-graders�’ readiness to read and would be expanded to grade K and 2 in probation schools. The Learning First assessment was administered three times per year (October, January and May) in grades 3-8 and was aligned with the Illinois standards and the ISAT�’s format and content. The district provided each school with results by student, teacher, grade and school within 10 days.
Eason-Watkins instituted new �“Quarterly Progress Updates�” with AIOs to track the results of district schools on the new benchmark assessments. She and Trujillo�’s team met with 3-4 neighboring AIOs at a time. AIOs discussed area performance trends and their efforts to help schools identify and target teachers�’ and students�’ weaknesses based on results. Commenting on the new meetings, one elementary AIO reflected, �“These are problem-solving meetings. Barbara asks tough questions about how we are helping our principals use the data to design professional development for teachers or make curriculum changes based on the results.�”
033 Managing the Chicago Public Schools
14
All schools, except charters, had to administer DIBELS. All schools except charters and AMPS had to administer Learning First. Although, some charters and all 79 AMPS schools voluntarily signed up to use Learning First. One veteran AMPS elementary school principal observed, �“Learning First is one of the most helpful tools that the district has provided in a long time. For the first time, we have real-time data about if our students are on track to meet state standards.�” Two areas piloted CPS math benchmark assessments, with districtwide adoption planned for SY07.
IMPACT The district piloted a comprehensive Web-based technology solution, the Instructional Management Program and Communications Tool (IMPACT), in SY06. IMPACT was designed to replace the district�’s 30-plus year-old Legacy student information system; eliminate many paper-based, manual transactions; and provide a one-stop online curriculum and instruction planning resource for schools. IMPACT would allow the district to track the performance of individual or cohorts of students from year-to-year for the first time. Districtwide implementation of IMPACT would occur throughout SY07.
Reorganizing the Central Office
�“We�’re going to flip the pyramid in CPS this year. When I say flip the pyramid, I�’m saying that the job of the central office is to support the schools �– not manage them. Principals run schools and we�’re here to make their job easier and help them succeed in the only place that matters �– in the classroom.�”
�— Arne Duncan, August 19, 2005
Business service centers In the fall of 2005, CPS piloted the first of three business service centers (BSCs). Each BSC would serve roughly 200 schools by providing training, monitoring and support in budgeting, internal accounts, purchasing and contracts, facilities, security and limited human resources support. Vitale commented, �“I wanted a team out there that felt like they owned and were accountable for a set of schools. This cross-functional team provides one point of contact for schools�—no more having to navigate the central office�—and will know each school�’s needs.�”
Central office reorganization CPS unveiled a comprehensive reorganization in June 2006. Central office departments would be oriented to serve five �“school customers�”: early childhood, elementary schools, high schools, AMPS schools and new/charter schools. Vitale explained the rationale for the reorganization. �“It's simple. We wanted the organizational structure--and the way people work-- to reflect our beliefs that schools are the unit of change and everyone else serves the schools. Identifying five types of schools reinforces our message that schools are unique and we cannot treat them like �‘one-size-fits-all.�’�”
In fact, the reorganization worked Vitale out of a job by eliminating the chief administrative officer position. Vitale would phase out by the end of 2006. As a result, all departments would report to either Duncan or Eason-Watkins (see Exhibits 13a-13b for new and old organization charts). The central office streamlining would save the district $25 million in administrative costs.
Creating Consistent Accountability Mechanisms
Consistent Performance Measures for All Schools
School scorecards The high school scorecard represented the district�’s first attempt to rank all schools in Chicago on the same measures (see Exhibit 12). The scorecard was also the first CPS tool
Managing the Chicago Public Schools 033
15
for sharing academic and non-academic school performance data with the public. �“Parents really drove the design of the new high school scorecard. It was such a user-friendly tool for promoting transparency around performance that we decided to create one for elementary schools, too,�” explained Duncan. The district intended to unveil the elementary scorecard in SY07.
Accountability system to probation policy More broadly, the district revamped its accountability system. Under the accountability system enacted in SY03, any non-charter district school open for more than three years received one of six labels�—distinction, excellence, merit, opportunity, challenge or probation--based on student performance (see Exhibits 5a and 5b). The distribution of school ratings varied highly across the areas (see Exhibit 5c). Absolute performance and gains on the Illinois state tests (ISAT and PSAE) and the Iowa Test of Basic Skills (discontinued in SY06) largely determined a school�’s performance rating. Bugler described the system:
Absolute performance far outweighed gains. We had almost created a permanent underclass of schools that could never get out of probation even if they had been making impressive gains every year, but hadn�’t yet gotten above 40% of students meeting standards. And once a school had over 50% of students meeting standards, the labels became irrelevant�—nothing really different happened if you were a school of merit, excellence or distinction.
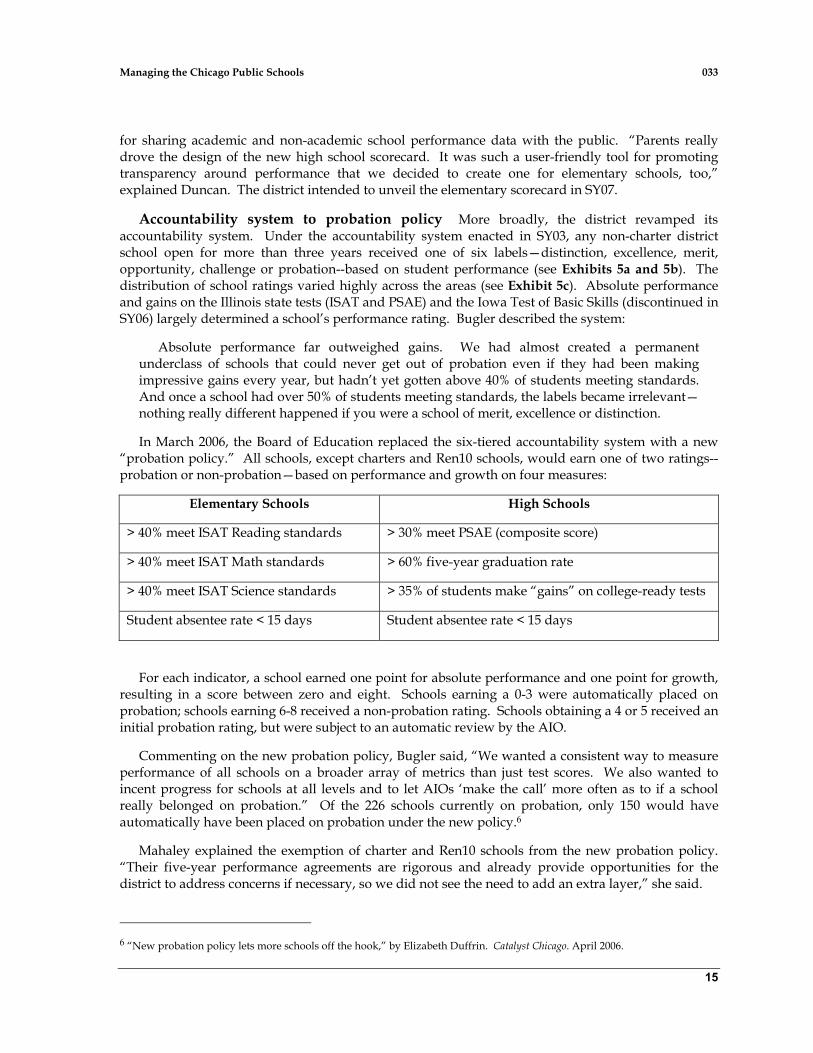
In March 2006, the Board of Education replaced the six-tiered accountability system with a new �“probation policy.�” All schools, except charters and Ren10 schools, would earn one of two ratings-- probation or non-probation�—based on performance and growth on four measures:
Elementary Schools High Schools
> 40% meet ISAT Reading standards > 30% meet PSAE (composite score)
> 40% meet ISAT Math standards > 60% five-year graduation rate
> 40% meet ISAT Science standards > 35% of students make �“gains�” on college-ready tests
Student absentee rate < 15 days Student absentee rate < 15 days
For each indicator, a school earned one point for absolute performance and one point for growth, resulting in a score between zero and eight. Schools earning a 0-3 were automatically placed on probation; schools earning 6-8 received a non-probation rating. Schools obtaining a 4 or 5 received an initial probation rating, but were subject to an automatic review by the AIO.
Commenting on the new probation policy, Bugler said, �“We wanted a consistent way to measure performance of all schools on a broader array of metrics than just test scores. We also wanted to incent progress for schools at all levels and to let AIOs �‘make the call�’ more often as to if a school really belonged on probation.�” Of the 226 schools currently on probation, only 150 would have automatically have been placed on probation under the new policy.6
Mahaley explained the exemption of charter and Ren10 schools from the new probation policy. �“Their five-year performance agreements are rigorous and already provide opportunities for the district to address concerns if necessary, so we did not see the need to add an extra layer,�” she said.
6 �“New probation policy lets more schools off the hook,�” by Elizabeth Duffrin. Catalyst Chicago. April 2006.
033 Managing the Chicago Public Schools
16
Performance Evaluation
CPS was in the process of designing several new tools to strengthen performance evaluation at the end of SY06. These included:
Central office department evaluations based on annual department performance targets and principals�’ evaluation of support and service
AIO evaluations and bonuses based on area school progress
New principal evaluation tool that would include progress towards annual school performance targets as one of the evaluation criteria
The Challenge Ahead As the school year came to a close in June 2006, Duncan reflected:
We recently received our preliminary student achievement data from the state. Our elementary schools made the biggest one-year jump in test score gains ever. That�’s great news. Twenty years ago, Chicago was called the �“worst school system in the country.�” We�’ve made a huge step in the right direction, but we still have a long way to go.
We have to get better at getting good data to schools, helping schools use that data and differentiating in a meaningful way how we teach individual students and support individual schools. Unfortunately, our financial resources continue to get scarcer. I cannot ask people to work any harder. We have to continue to find ways to innovate and work smarter.
Managing the Chicago Public Schools 033
17
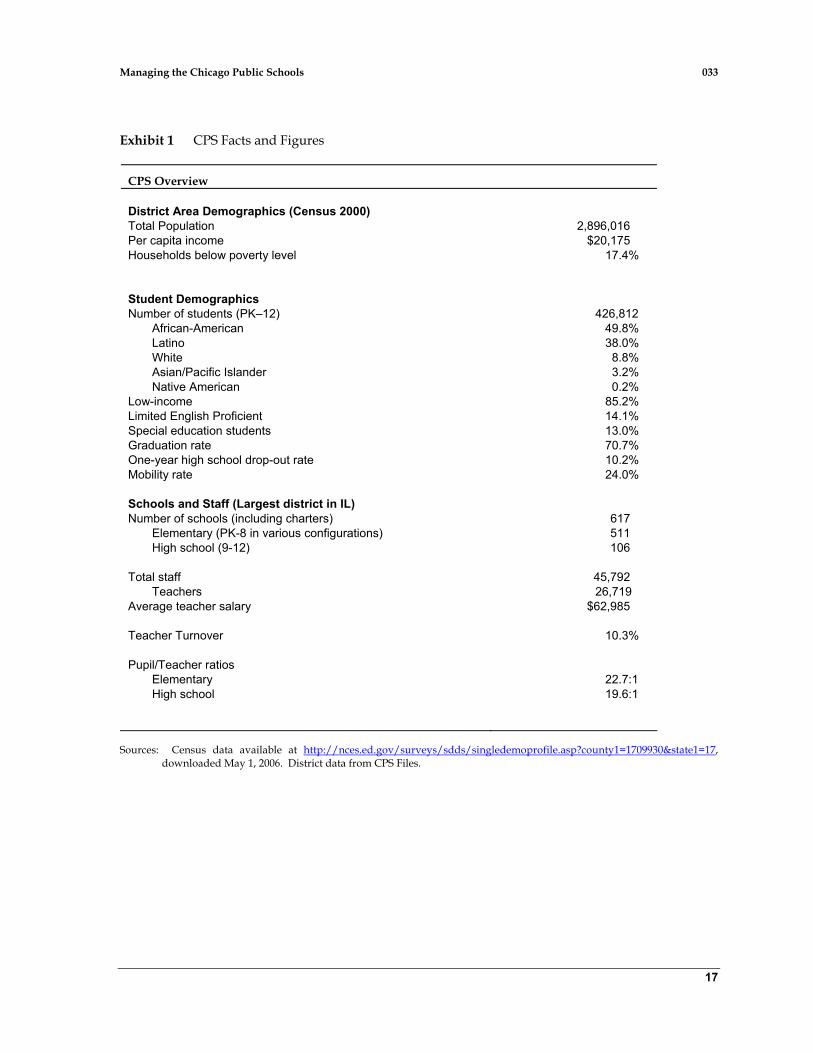
Exhibit 1 CPS Facts and Figures
CPS Overview
District Area Demographics (Census 2000) Total Population 2,896,016 Per capita income $20,175 Households below poverty level 17.4% Student Demographics Number of students (PK–12) 426,812
African-American 49.8% Latino 38.0% White 8.8% Asian/Pacific Islander 3.2% Native American 0.2%
Low-income 85.2% Limited English Proficient 14.1% Special education students 13.0% Graduation rate 70.7% One-year high school drop-out rate 10.2% Mobility rate 24.0% Schools and Staff (Largest district in IL) Number of schools (including charters) 617
Elementary (PK-8 in various configurations) 511 High school (9-12) 106
Total staff 45,792
Teachers 26,719 Average teacher salary $62,985 Teacher Turnover 10.3% Pupil/Teacher ratios
Elementary 22.7:1 High school 19.6:1
Sources: Census data available at http://nces.ed.gov/surveys/sdds/singledemoprofile.asp?county1=1709930&state1=17, downloaded May 1, 2006. District data from CPS Files.
033 -18-
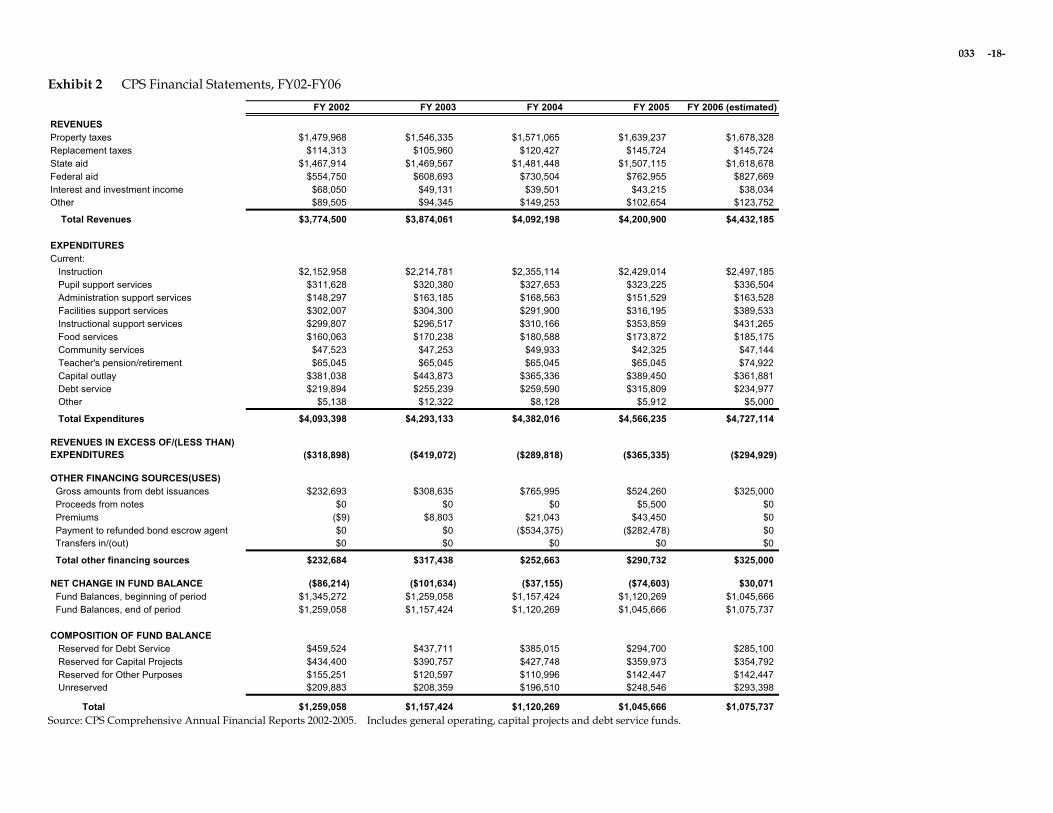
Exhibit 2 CPS Financial Statements, FY02-FY06 FY 2002 FY 2003 FY 2004 FY 2005 FY 2006 (estimated)
REVENUESProperty taxes $1,479,968 $1,546,335 $1,571,065 $1,639,237 $1,678,328Replacement taxes $114,313 $105,960 $120,427 $145,724 $145,724State aid $1,467,914 $1,469,567 $1,481,448 $1,507,115 $1,618,678Federal aid $554,750 $608,693 $730,504 $762,955 $827,669Interest and investment income $68,050 $49,131 $39,501 $43,215 $38,034Other $89,505 $94,345 $149,253 $102,654 $123,752
Total Revenues $3,774,500 $3,874,061 $4,092,198 $4,200,900 $4,432,185
EXPENDITURESCurrent: Instruction $2,152,958 $2,214,781 $2,355,114 $2,429,014 $2,497,185 Pupil support services $311,628 $320,380 $327,653 $323,225 $336,504 Administration support services $148,297 $163,185 $168,563 $151,529 $163,528 Facilities support services $302,007 $304,300 $291,900 $316,195 $389,533 Instructional support services $299,807 $296,517 $310,166 $353,859 $431,265 Food services $160,063 $170,238 $180,588 $173,872 $185,175 Community services $47,523 $47,253 $49,933 $42,325 $47,144 Teacher's pension/retirement $65,045 $65,045 $65,045 $65,045 $74,922 Capital outlay $381,038 $443,873 $365,336 $389,450 $361,881 Debt service $219,894 $255,239 $259,590 $315,809 $234,977 Other $5,138 $12,322 $8,128 $5,912 $5,000
Total Expenditures $4,093,398 $4,293,133 $4,382,016 $4,566,235 $4,727,114
REVENUES IN EXCESS OF/(LESS THAN) EXPENDITURES ($318,898) ($419,072) ($289,818) ($365,335) ($294,929)
OTHER FINANCING SOURCES(USES) Gross amounts from debt issuances $232,693 $308,635 $765,995 $524,260 $325,000 Proceeds from notes $0 $0 $0 $5,500 $0 Premiums ($9) $8,803 $21,043 $43,450 $0 Payment to refunded bond escrow agent $0 $0 ($534,375) ($282,478) $0 Transfers in/(out) $0 $0 $0 $0 $0
Total other financing sources $232,684 $317,438 $252,663 $290,732 $325,000
NET CHANGE IN FUND BALANCE ($86,214) ($101,634) ($37,155) ($74,603) $30,071 Fund Balances, beginning of period $1,345,272 $1,259,058 $1,157,424 $1,120,269 $1,045,666 Fund Balances, end of period $1,259,058 $1,157,424 $1,120,269 $1,045,666 $1,075,737
COMPOSITION OF FUND BALANCE Reserved for Debt Service $459,524 $437,711 $385,015 $294,700 $285,100 Reserved for Capital Projects $434,400 $390,757 $427,748 $359,973 $354,792 Reserved for Other Purposes $155,251 $120,597 $110,996 $142,447 $142,447 Unreserved $209,883 $208,359 $196,510 $248,546 $293,398
Total $1,259,058 $1,157,424 $1,120,269 $1,045,666 $1,075,737 Source: CPS Comprehensive Annual Financial Reports 2002-2005. Includes general operating, capital projects and debt service funds.
033 -19-
Exhibit 3a Elementary Student Achievement Data
Percentage of Students Meeting or Exceeding Standards on the Illinois Standards Achievement Test (Grades 3-8, all tests) 2000-2005
Where Are We Now?
Where Are We Now?
ISAT Performance: CPS vs. Illinois Averages 2001-2005 (% of students meeting or exceeding state standards)
Chicago Public Schools Illinois
Subject Grade 2001 2002 2003 2004 2005
2005 to 2001 Change 2001 2002 2003 2004 2005
2005 to 2001 Change
3rd 36.0 35.0 35.8 41.3 42.1 6.1 62.0 63.0 62.0 65.0 66.6 4.6 5th 34.0 37.0 38.8 42.7 43.4 9.4 59.0 59.0 60.4 60.9 62.8 3.8 Reading 8th 48.0 55.0 50.5 54.6 59.4 11.4 66.0 68.0 63.7 67.1 72.7 6.7 3rd 47.0 46.0 48.7 55.7 55.2 8.2 74.0 74.0 75.7 79.2 79.2 5.2 5th 32.0 36.0 44.0 50.9 49.6 17.6 61.0 63.0 68.3 71.8 73.1 12.1 Math
8th 25.0 31.0 30.7 33.2 32.3 7.3 50.0 52.0 53.1 54.4 54.3 4.3 4th 37.0 39.0 39.5 40.5 43.3 6.3 65.0 67.0 66.5 67.8 71.4 6.4 Science 7th 51.0 53.0 56.2 56.0 54.4 3.4 72.0 73.0 73.7 74.4 74.6 2.6
Source: CPS Files
033 -20-
Exhibit 3b High School Student Achievement Data
Composite PSAE Scores Composite PSAE Scores Continue To Rise!Continue To Rise!
27.228.1 28.7
30.131.4
25
30
35
2001 2002 2003 2004 2005
% s
tude
nts
mee
ting/
exce
edin
g st
ate
stan
dard
s
PSAE Scores Hit All Time PSAE Scores Hit All Time High in ReadingHigh in Reading
36
2620
36
2622
36
2723
36
27 27
41
27 26
0
10
20
30
40
50
Reading Math Science
Perc
ent M
eetin
g or
Exc
eedi
ng
Stat
e St
anda
rds
2001 2002 2003 2004 2005
Good News: Falling Good News: Falling OneOne--Year Dropout RatesYear Dropout Rates
16.314.4 13.9
11.910.2
0
5
10
15
20
2001 2002 2003 2004 2005
Percentage
*
*Preliminary Percentage for 2005
ACT Scores For Graduating ACT Scores For Graduating Seniors Up in English and ScienceSeniors Up in English and Science
15.5
16.7 16.7
15.8
16.817.0
16.8
15.9
17.1 17.2
16.2
17.6
16.8 16.9 16.917.1
15
16
17
18
English Mathematics Reading Science
2002 2003 2004 2005
Source: CPS Files.
Managing the Chicago Public Schools 033
21
Exhibit 3c 3c Student Performance by Area
AREA 2003 2004 2005
4 35.9 43.2 44.3
9 49.3 56.5 57.5
10 43.9 51.4 50.9
1 63.4 68.2 69.1
6 53.8 56.3 59.4
11 48.3 53.3 53.7
12 34.5 38.7 39.4
2 56.0 59.9 60.7
7 27.2 30.3 30.8
5 42.1 45.2 45.0
18 40.4 42.6 43.3
16 43.7 47.1 46.4
13 36.4 37.0 38.8
8 30.4 35.4 32.5
3 32.5 34.1 34.3
15 38.8 41.3 40.5
14 29.0 30.5 29.7
17 39.0 41.5 38.6
Elementary School Performance by Area (2003-2005)
Percentage of students meeting or exceeding state standardsIllinois State Achievement Test (reading, math, science)
0.7
2.9
2.9
2.7
2.1
1.8
8.4
8.2
7.0
5.7
5.6
5.4
4.9
4.7
-0.4
3.6
2.4
1.7
2003-2005
AREA 2003 2004 2005
19 42.3 44.9 48.0
22 21.2 21.3 25.3
24 22.9 27.7 25.9
20 28.8 30.5 30.8
23 19.4 19.4 19.8
21 38.0 36.2 34.8 -3.2
2.0
0.4
4.1
3.0
High School Performance by Area (2003-2005)
Percentage of students meeting or exceeding state standardsPrarie State Achievement Exam (reading, math, science)
Change 2003-2005
5.7
Source: CPS Files.
033 Managing the Chicago Public Schools
22
Exhibit 3d Student Achievement Data
Source: CPS Files.
Managing the Chicago Public Schools 033
23
Exhibit 3e Student Achievement Data
Source: Consortium on Chicago School Research. �“From High School to the Future�” April 2006.
033 -24-
Exhibit 4a School Categories in Chicago, SY06
Regular District AMPS CPS Probation NCLB Restructuring Charter Performance Contract Number a 280 79 226 185 35 3 1 (SY07) Authorizer CPS CPS
2005 CPS 2003
Federal law (NCLB) 2001
State law 1996
Mayor’s Ren10 2004
Mayor’s Ren10 2004
Operator CPS CPS CPS CPS or 3rd party Nonprofit CPS Nonprofit Governance LSC LSC LSC LSC Charter board Board or
LSC Board or
LSC Student assignment Neighborhood
unless selective Neighborhood
unless selective Neighborhood
unless selective Neighborhood
unless selective Lottery Lottery Lottery
NCLB and IL accountability
Yes Yes Yes Yes Yes Yes Yes
CPS probation policy Yes Yes Yes Yes No No No 5-yr CPS performance plan and annual review
No No No No Yes Yes Yes
CPS scorecard Yes Yes Yes Yes Yes Yes Yes CPS annual targets Yes Yes Yes Yes No Yes Yes CPS SIPAAAb Yes Yes Yes Yes No Yes Yes Report to AIO Yes Choice Yes Yes No Choice Choice Principal eligibility State Type 75,
CPS Pool State Type 75,
CPS Pool State Type 75,
CPS Pool State Type 75,
CPS Pool State Type 75 State Type 75,
CPS Pool State Type 75
Principal hired by LSC LSC LSC unless
removed by CPS LSC Governing board Governing board Governing board
Principal evaluator LSC, AIO LSC, AIO if in-area LSC, AIO LSC, AIO Governing board Governing board Governing board CPS curriculum mandates followed
Yes Choice Yes Yes No Choice Choice
033 -25-
Regular District AMPS CPS Probation NCLB Restructuring Charter Performance Contract CPS benchmark tests: Learning 1st, Dibels
Yes Yes Yes Yes No Yes Yes
School funding Position-based
Position-based
Lump-sum in SY07c
Position-based
AIO controlled discretionary funds
Position-based Per-pupil
Per-pupil
Per-pupil
CPS school calendar and hours
Yes Choice Yes Yes No Choice Choice
Teacher certification required
100% 100% 100% 100% 75% in schools established prior to
2003; 50% after
100% 100%
Teachers’ employer CPS CPS CPS CPS Governing board CPS Governing board CTU Teachers Yes Yes Yes Yes No Yes Choice CPS salary scale required
Yes Yes Yes Yes No Yes No
a The number of schools in each category is for SY06 only. The total number of schools in this row will exceed 617 because a school could be in more than one category. For example, Marconi Community Academy was on CPS probation and slated for restructuring under NCLB.
b SIPAAA stands for School Improvement Plan for Advancing Academic Achievement. SIPAAA is described on page 7.
c �“Lump-sum�” budgeting is described on page 10.
Source: Casewriter analysis based on case interviews and CPS files

033 -26-
Exhibit 4b Performance Data by School Category: Elementary Schools
Total AttendanceEnrollment Rate
2005 2005 2003 2004 2005 2003 2004 2005
All Elementary SchoolsHigh 1906 98.5 100.0 100.1 100.0 100.0 100.0 100.0Median 602 94.2 38.7 44.6 46.6 39.4 47.3 46.7Low 91 85.5 0.0 11.5 13.0 0.0 11.5 8.2
Regular District SchoolsHigh 1896 98.5 100.0 100.1 100.0 100.0 100.0 100.0Median 595 95.2 51.1 55.0 57.3 55.4 59.7 58.3Low 120 88.7 0.0 11.5 18.3 0.0 11.5 16.5
AMPSHigh 1796 97.7 96.9 100.0 97.8 99.0 100.0 100.0Median 589 95.8 62.5 65.6 64.4 62.0 67.9 69.7Low 186 93.7 26.8 35.4 42.1 30.1 43.3 44.2
CPS ProbationHigh 1822 96.4 51.7 50.0 53.7 51.3 81.5 63.6Median 613 92.1 29.3 32.4 32.7 28.8 29.7 28.3Low 91 88.6 6.9 15.6 13.0 7.5 12.6 8.2
NCLB RestructuringHigh 1906 96.2 57.4 60.4 68.1 55.2 81.5 57.1Median 598 92.2 28.2 32.2 33.2 28.0 29.8 28.6Low 91 85.5 6.9 15.6 13.0 7.5 12.6 9.4
CharterHigh n/a n/a 59.7 66.7 81.0 62.0 68.2 93.3Median n/a n/a 51.5 49.3 64.7 48.1 63.3 69.3Low n/a n/a 33.3 36.3 40.4 36.2 22.2 29.2
School Type
ISAT Reading% Meet/Exceed Standards
ISAT Math% Meet/Exceed Standards
Notes: "All elementary schools" includes charter schools and other schools not eligible for probation, such as new and special education schools. Therefore, values may be lower than "probation" and different from any district reported data that excludes these schools. Some schools may be in more than one category. (e.g. Marconi Community Academy was on CPS probation and slated for NCLB restructuring). Data not available for performance and contract schools.
Source: Casewriter analysis based on CPS files.
033 -27-
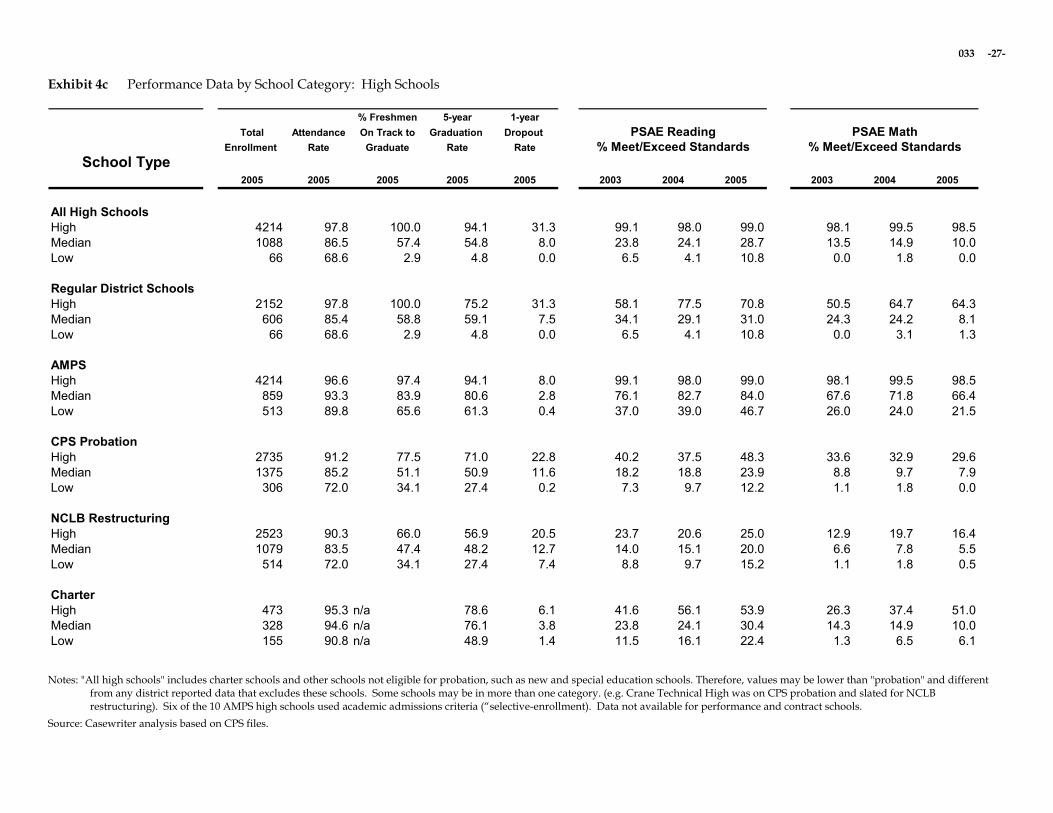
Exhibit 4c Performance Data by School Category: High Schools
% Freshmen 5-year 1-yearTotal Attendance On Track to Graduation Dropout
Enrollment Rate Graduate Rate Rate
2005 2005 2005 2005 2005 2003 2004 2005 2003 2004 2005
All High SchoolsHigh 4214 97.8 100.0 94.1 31.3 99.1 98.0 99.0 98.1 99.5 98.5Median 1088 86.5 57.4 54.8 8.0 23.8 24.1 28.7 13.5 14.9 10.0Low 66 68.6 2.9 4.8 0.0 6.5 4.1 10.8 0.0 1.8 0.0
Regular District SchoolsHigh 2152 97.8 100.0 75.2 31.3 58.1 77.5 70.8 50.5 64.7 64.3Median 606 85.4 58.8 59.1 7.5 34.1 29.1 31.0 24.3 24.2 8.1Low 66 68.6 2.9 4.8 0.0 6.5 4.1 10.8 0.0 3.1 1.3
AMPSHigh 4214 96.6 97.4 94.1 8.0 99.1 98.0 99.0 98.1 99.5 98.5Median 859 93.3 83.9 80.6 2.8 76.1 82.7 84.0 67.6 71.8 66.4Low 513 89.8 65.6 61.3 0.4 37.0 39.0 46.7 26.0 24.0 21.5
CPS ProbationHigh 2735 91.2 77.5 71.0 22.8 40.2 37.5 48.3 33.6 32.9 29.6Median 1375 85.2 51.1 50.9 11.6 18.2 18.8 23.9 8.8 9.7 7.9Low 306 72.0 34.1 27.4 0.2 7.3 9.7 12.2 1.1 1.8 0.0
NCLB RestructuringHigh 2523 90.3 66.0 56.9 20.5 23.7 20.6 25.0 12.9 19.7 16.4Median 1079 83.5 47.4 48.2 12.7 14.0 15.1 20.0 6.6 7.8 5.5Low 514 72.0 34.1 27.4 7.4 8.8 9.7 15.2 1.1 1.8 0.5
CharterHigh 473 95.3 n/a 78.6 6.1 41.6 56.1 53.9 26.3 37.4 51.0Median 328 94.6 n/a 76.1 3.8 23.8 24.1 30.4 14.3 14.9 10.0Low 155 90.8 n/a 48.9 1.4 11.5 16.1 22.4 1.3 6.5 6.1
School Type
PSAE Reading% Meet/Exceed Standards
PSAE Math% Meet/Exceed Standards
Notes: "All high schools" includes charter schools and other schools not eligible for probation, such as new and special education schools. Therefore, values may be lower than "probation" and different from any district reported data that excludes these schools. Some schools may be in more than one category. (e.g. Crane Technical High was on CPS probation and slated for NCLB restructuring). Six of the 10 AMPS high schools used academic admissions criteria (�“selective-enrollment). Data not available for performance and contract schools.
Source: Casewriter analysis based on CPS files.
033 Managing the Chicago Public Schools
28
Exhibit 5a CPS Accountability System, 2003 �– March 2006
Source: CPS Files.
Managing the Chicago Public Schools 033
29
Exhibit 5b CPS Accountability System, 2003 �– March 2006
Source: CPS Files.
033 Managing the Chicago Public Schools
30
Exhibit 5c 2005 School Accountability Ratings by Area
Elementary Schools
AreaSCHOOL ON PROBATION
SCHOOL OF CHALLENGE
SCHOOL OF OPPORTUNITY
SCHOOL OF MERIT
SCHOOL OF EXCELLENCE
SCHOOL OF DISTINCTION Total
1 14 9 18 412 4 4 15 3 12 383 16 1 5 224 13 1 1 8 4 276 7 7 7 1 10 327 16 2 1 198 17 1 4 2 249 4 5 8 7 2410 4 6 10 3 2311 5 1 11 3 5 2512 12 1 1 4 4 2213 16 1 1 1 1914 20 2 1 1 1 2515 10 1 4 5 2 1 2316 11 1 6 4 3 5 3017 16 3 8 4 3118 16 3 4 5 2 2 32Total 187 11 51 108 23 77 457
High Schools
AreaSCHOOL ON PROBATION
SCHOOL OF CHALLENGE
SCHOOL OF OPPORTUNITY
SCHOOL OF MERIT
SCHOOL OF DISTINCTION
SCHOOL OF EXCELLENCE TOTAL
19 7 2 1 2 1220 4 1 1 621 6 1 1 822 7 2 1 1023 10 3 1324 7 1 1 1 10Total 41 0 8 3 3 4 59
Note: Includes only schools eligible for an accountability rating.
Source: CPS Files.
033 -31-
Exhibit 6 CPS 2010 Outcome Goals
Source: CPS Files.
033 -32-
Exhibit 7 Five Fundamentals of a Great School Rubric for �“Instructional Leadership�”
Fundamental II: INSTRUCTIONAL LEADERSHIP A great school fosters exceptional leadership. Chicago Public School teachers must focus the vast majority of time, energy, and resources on student learning. Instructional leaders in great schools work collaboratively with the school community, set clear expectations, and effectively manage resources to facilitate the teaching of students. Lead indicators for Instructional Leadership are:
Focus Question Evidence for All Schools Emerging (1) Developing (2) Proficient (3) Exemplary (4) Lead Indicator: Instructional leadership opportunities are distributed to encourage ownership and shared accountability. Additional High School Evidence: Interviews: Dept. Chairs, Literacy Team members, Course-Planning Team members
II.e. To what extent does the principal encourage and help build teacher leadership?
Documents: Professional Development meetings, School's Professional Development plan, Professional Development calendar Observations: Leadership opportunities are available to teachers Interviews: Teacher, School staff, Administrator
The principal hardly provides instructional leadership opportunities for staff members, and does not create new instructional leadership opportunities.
The principal creates and communicates some new instructional leadership opportunities to staff members each year.
The principal models distributed leadership strategies by providing various instructional leadership opportunities to all staff members. A variety of staff members, both new and established, take on leadership roles.
The principal has a strategic plan to ensure that most teachers in the school assume at least one leadership role throughout the school year.
II.f. To what extent do teachers demonstrate ownership and responsibility as part of the school’s instructional leadership team?
Documents: Professional Development meetings, School's Professional Development plan, Professional Development calendar, Instructional Leadership Team meetings, Instructional Leadership Team meeting calendar, Data Team meetings, Master meeting schedule, Observations: Teaching reflects Instructional Leadership Team's goals, Teachers and administrators share ideas, Administrators take teacher input into consideration Interviews: Teacher, Instructional Leadership Team, Administrator, School staff
The instructional leadership team hardly communicates their concerns to the principal. The school has a limited professional community of instructional leaders.
The instructional leadership team communicates some of their concerns to the principal, and the principal responds to some of their concerns. The school has an established professional community of instructional leaders.
The instructional leadership team regularly communicates all of their concerns to the principal, and the principal regularly and formally responds to all their concerns. The school has an established and active professional community of instructional leaders.
The principal always provides support for teachers who demonstrate leadership by forming new initiatives (e.g. poetry contest, history fair) at the school.
Lead Indicator: Instructional leadership teams regularly use student work and data to plan and modify instructional strategies. Additional High School Evidence: Documents: Department meetings, Department meeting schedule, Data Team meetings; Interviews: Dept. Chairs, Literacy Team members, Course-Planning Team members II.g. To what extent do instructional leadership teams use student work and data to make instructional decisions, and to map curriculum horizontally and vertically?
Documents: Curriculum map, Grade-level meetings, Instructional Leadership Team meetings, Instructional Leadership Team meeting calendar, Student data Observations: Student activities and lessons reflect teacher and ILT collaboration, Student work displays vertical and horizontal mapping, Data analysis workshops are held for school staff Interviews: Instructional Leadership Team member, Teacher, School staff
Instructional leadership teams hardly schedule meetings, and almost never review student work and data to make instructional decisions. Curriculum mapping is not discussed or implemented.
Instructional leadership teams sometimes meet to review student work and data for the purpose of informing instructional decisions to be made. Curriculum mapping is implemented, either horizontally or vertically.
Instructional leadership teams regularly meet to review student work and data for the purpose of informing instructional decisions to be made and modifying the school's instructional program. Curriculum mapping is implemented, both horizontally and vertically.
Instructional leadership teams always include other stakeholders in reviewing student work and data, and their resulting joint analysis is used to modify the school's instructional program.
II.h. To what extent do instructional leadership teams use student work and data to develop common assessment tools?
Documents: Assessment tools, Student work portfolios, Student data Observations: Data management system, Student work reflects diagnostic assessment results Interviews: Instructional Leadership Team member, Teacher, School Staff, Administrator
Instructional leadership teams hardly use data to evaluate curriculum, plan instruction, and/or develop common assessment tools.
Instructional leadership teams sometimes use data to evaluate curriculum, plan instruction, and/or develop common assessment tools.
Instructional leadership teams regularly use timely, available, and shared data to evaluate curriculum, plan instruction, and develop common assessment tools.
Instructional leadership teams use additional information sources to supplement test data when making instructional decisions.
Source: CPS Files.
Managing the Chicago Public Schools 033
33
Exhibit 8 AIO Job Description, SY06
Principal Accountabilities for AIOs Weight
1. Assist area principals to develop data-based school plans for improving instruction aligned with district goals and strategies. Help principals identify and utilize the support and resources necessary to successfully implement their school plans.
2. Supervise and evaluate all area principals against established performance targets. Based on the evaluations, provide principals with opportunities for professional development that build on strengths and address weaknesses. When necessary, recommend principal removal to the Chief Executive Officer. Facilitate conversations and collaboration among principals to address common challenges and share best practices.
3. Assist area principals in planning, coordinating and delivering school-based teacher professional development. Coordinate the delivery of district and area-based professional development and other instructional support to area schools.
70%
4. Identify and support the development of potential candidates for the principalship in area schools. Lead principal succession planning, working with Local School Councils to help them identify and hire the best possible principals.
30%
Source: CPS Files.
033 Managing the Chicago Public Schools
34
Exhibit 9 AMPS Criteria
Autonomous Management and Performance Schools (AMPS) 2005-06 Year Eligibility Overview
Elementary Eligibility: Schools that have met most of the eligibility factors and have been recommended by the Chief Education Office are invited to participate in this program. INDICATOR TIME PERIOD RATIONALE Student Performance Indicators 1. Made AYP 2004 rating for
2004-05 school year Schools making AYP are not subject to federal sanctions
2. Not in NCLB School Improvement 2004 rating for 2004-05 school year
Schools not in NCLB School Improvement are not subject to federal sanctions.
3. Schools of Excellence, Distinction, Merit and Opportunity (see case Exhibits 5a-5b)
2004 rating for 2004-05 school year
Schools have high or improving student performance indicators and are not subject to CPS Probation sanctions.
Asset Management Indicators 4. At Least 97% of Teachers Are Highly
Qualified by NCLB Standards Fall 2004 EQS audit
Shows schools with fully certified teachers who are teaching in their fields.
5. �“Excellent�” or �“Adequate�” Custodial Report
FY2004 and FY2003
Shows school has consistent record of maintaining clean, orderly buildings and grounds.
6. Above Average Internal Accounts Ratings or No Rating
Most recent data available
A rating of financial management.
7.
No Major Control Violations FY2004 and FY2005
A rating of financial management.
8. Enrollment Audit Variance Less Than or Equal To 10 Students Compared to Enrollment Reported on Student Information System
Fall 2004 Enrollment Audits
Indicator of school records management.
9.
Elementary Daily Attendance >= 95%
2003-04 school year
Indicates school does not need to spend extensive amount of time tracking student absences.
10.
Residing Not Attending <50% Or Utilization > 80%
2003-04 school year
Shows schools where children in neighborhood are choosing to attend or attending elsewhere because the school is at or above capacity.
INDICATOR TIME PERIOD RATIONALE Special Education Indicators 11. 90% of students immunized 2004-05 school year Standard set by State of Illinois. 12. % LRE 3 <=30% or % LRE 3<= Low
Incidence 2004-05 school year Indicates school does not assign excessive number of
students to self-contained special education classrooms. 13. No major violation or citations from
Illinois State Board of Education.
CEdO Recommendation Rationale: Data and indicators cannot capture all aspects of school climate and success. Representatives from the Chief Education Office work with schools on a daily basis and have greater insight into schools than what can be derived from the data points alone.
AMPS High School Eligibility
The same except: Asset Management
o For Highly Qualified percent, using high school average o 28-student variation for Enrollment Audit
School Climate o Includes: Truancy <= high school average o Includes: Drop out rate <=high school average o Removes: Residing Not Attending as an indicator
Source: CPS Files.
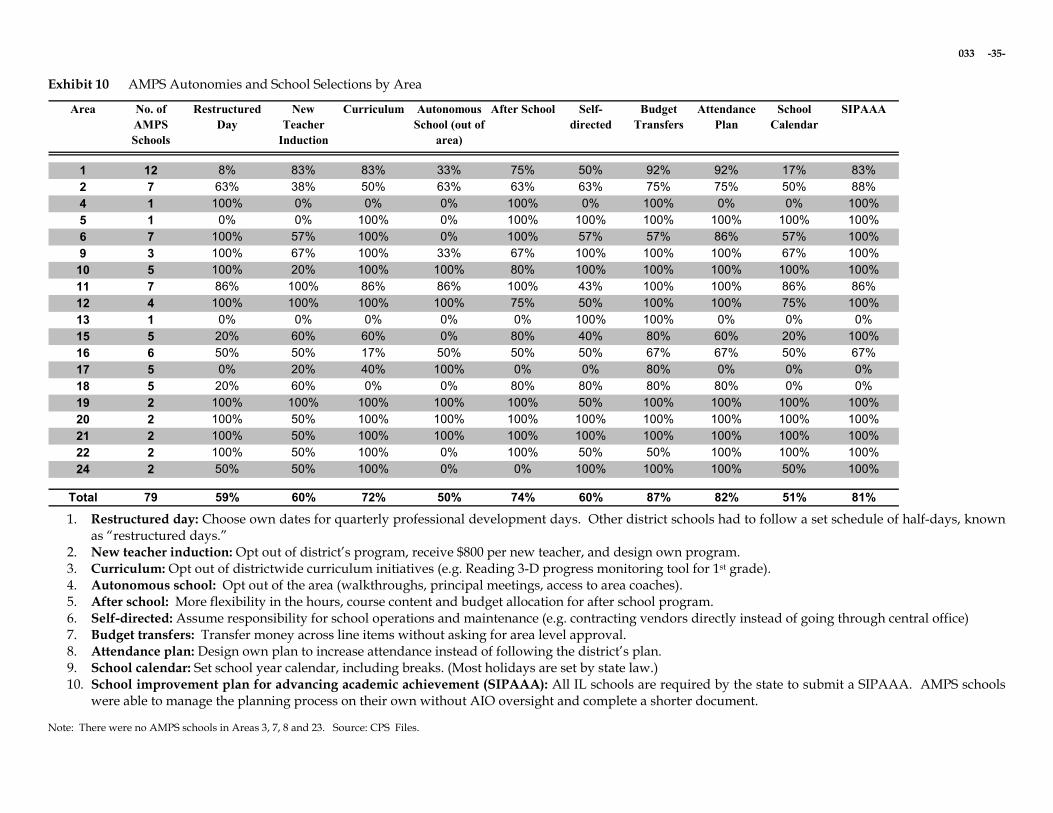
033 -35-
Exhibit 10 AMPS Autonomies and School Selections by Area
Area No. of AMPS Schools
Restructured Day
New Teacher
Induction
Curriculum Autonomous School (out of
area)
After School Self-directed
Budget Transfers
Attendance Plan
School Calendar
SIPAAA
1 12 8% 83% 83% 33% 75% 50% 92% 92% 17% 83%2 7 63% 38% 50% 63% 63% 63% 75% 75% 50% 88%4 1 100% 0% 0% 0% 100% 0% 100% 0% 0% 100%5 1 0% 0% 100% 0% 100% 100% 100% 100% 100% 100%6 7 100% 57% 100% 0% 100% 57% 57% 86% 57% 100%9 3 100% 67% 100% 33% 67% 100% 100% 100% 67% 100%10 5 100% 20% 100% 100% 80% 100% 100% 100% 100% 100%11 7 86% 100% 86% 86% 100% 43% 100% 100% 86% 86%12 4 100% 100% 100% 100% 75% 50% 100% 100% 75% 100%13 1 0% 0% 0% 0% 0% 100% 100% 0% 0% 0%15 5 20% 60% 60% 0% 80% 40% 80% 60% 20% 100%16 6 50% 50% 17% 50% 50% 50% 67% 67% 50% 67%17 5 0% 20% 40% 100% 0% 0% 80% 0% 0% 0%18 5 20% 60% 0% 0% 80% 80% 80% 80% 0% 0%19 2 100% 100% 100% 100% 100% 50% 100% 100% 100% 100%20 2 100% 50% 100% 100% 100% 100% 100% 100% 100% 100%21 2 100% 50% 100% 100% 100% 100% 100% 100% 100% 100%22 2 100% 50% 100% 0% 100% 50% 50% 100% 100% 100%24 2 50% 50% 100% 0% 0% 100% 100% 100% 50% 100%
Total 79 59% 60% 72% 50% 74% 60% 87% 82% 51% 81% 1. Restructured day: Choose own dates for quarterly professional development days. Other district schools had to follow a set schedule of half-days, known
as �“restructured days.�” 2. New teacher induction: Opt out of district�’s program, receive $800 per new teacher, and design own program. 3. Curriculum: Opt out of districtwide curriculum initiatives (e.g. Reading 3-D progress monitoring tool for 1st grade). 4. Autonomous school: Opt out of the area (walkthroughs, principal meetings, access to area coaches). 5. After school: More flexibility in the hours, course content and budget allocation for after school program. 6. Self-directed: Assume responsibility for school operations and maintenance (e.g. contracting vendors directly instead of going through central office) 7. Budget transfers: Transfer money across line items without asking for area level approval. 8. Attendance plan: Design own plan to increase attendance instead of following the district�’s plan. 9. School calendar: Set school year calendar, including breaks. (Most holidays are set by state law.) 10. School improvement plan for advancing academic achievement (SIPAAA): All IL schools are required by the state to submit a SIPAAA. AMPS schools
were able to manage the planning process on their own without AIO oversight and complete a shorter document.
Note: There were no AMPS schools in Areas 3, 7, 8 and 23. Source: CPS Files.
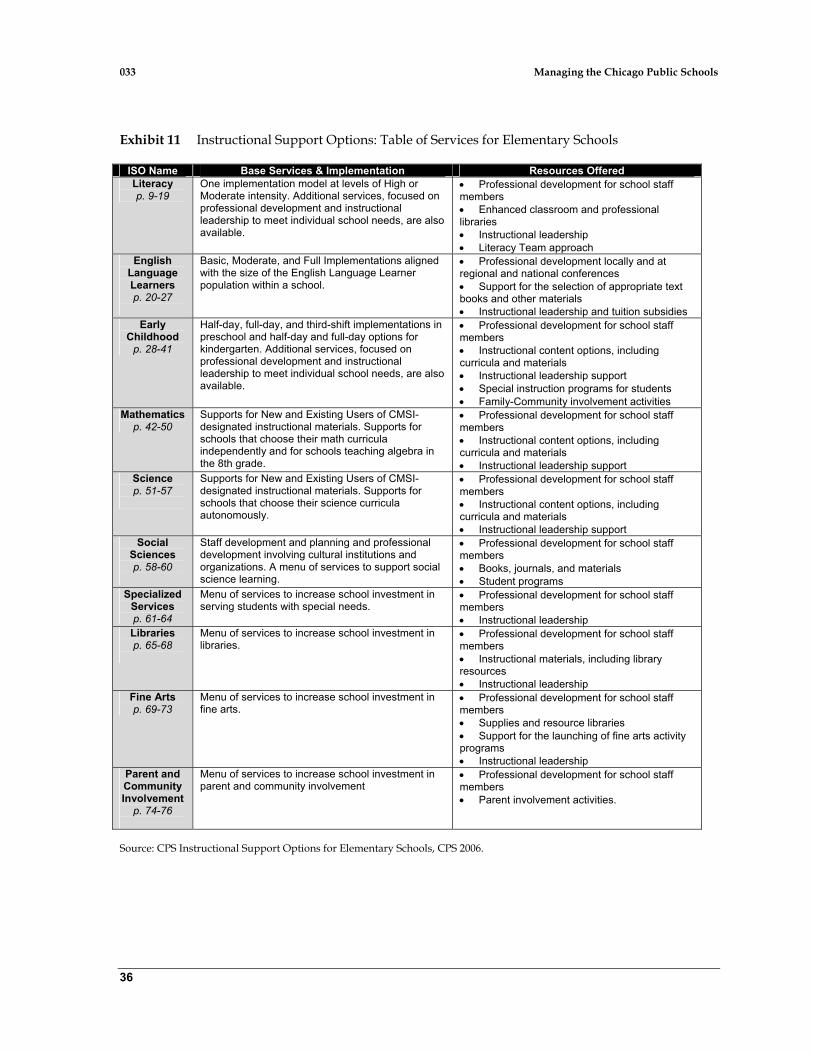
033 Managing the Chicago Public Schools
36
Exhibit 11 Instructional Support Options: Table of Services for Elementary Schools
ISO Name Base Services & Implementation Resources Offered Literacy p. 9-19
One implementation model at levels of High or Moderate intensity. Additional services, focused on professional development and instructional leadership to meet individual school needs, are also available.
Professional development for school staff members Enhanced classroom and professional
libraries Instructional leadership Literacy Team approach
English Language Learners p. 20-27
Basic, Moderate, and Full Implementations aligned with the size of the English Language Learner population within a school.
Professional development locally and at regional and national conferences Support for the selection of appropriate text
books and other materials Instructional leadership and tuition subsidies
Early Childhood
p. 28-41
Half-day, full-day, and third-shift implementations in preschool and half-day and full-day options for kindergarten. Additional services, focused on professional development and instructional leadership to meet individual school needs, are also available.
Professional development for school staff members Instructional content options, including
curricula and materials Instructional leadership support Special instruction programs for students Family-Community involvement activities
Mathematics p. 42-50
Supports for New and Existing Users of CMSI-designated instructional materials. Supports for schools that choose their math curricula independently and for schools teaching algebra in the 8th grade.
Professional development for school staff members Instructional content options, including
curricula and materials Instructional leadership support
Science p. 51-57
Supports for New and Existing Users of CMSI-designated instructional materials. Supports for schools that choose their science curricula autonomously.
Professional development for school staff members Instructional content options, including
curricula and materials Instructional leadership support
Social Sciences p. 58-60
Staff development and planning and professional development involving cultural institutions and organizations. A menu of services to support social science learning.
Professional development for school staff members Books, journals, and materials Student programs
Specialized Services p. 61-64
Menu of services to increase school investment in serving students with special needs.
Professional development for school staff members Instructional leadership
Libraries p. 65-68
Menu of services to increase school investment in libraries.
Professional development for school staff members Instructional materials, including library
resources Instructional leadership
Fine Arts p. 69-73
Menu of services to increase school investment in fine arts.
Professional development for school staff members Supplies and resource libraries Support for the launching of fine arts activity
programs Instructional leadership
Parent and Community Involvement
p. 74-76
Menu of services to increase school investment in parent and community involvement
Professional development for school staff members Parent involvement activities.
Source: CPS Instructional Support Options for Elementary Schools, CPS 2006.
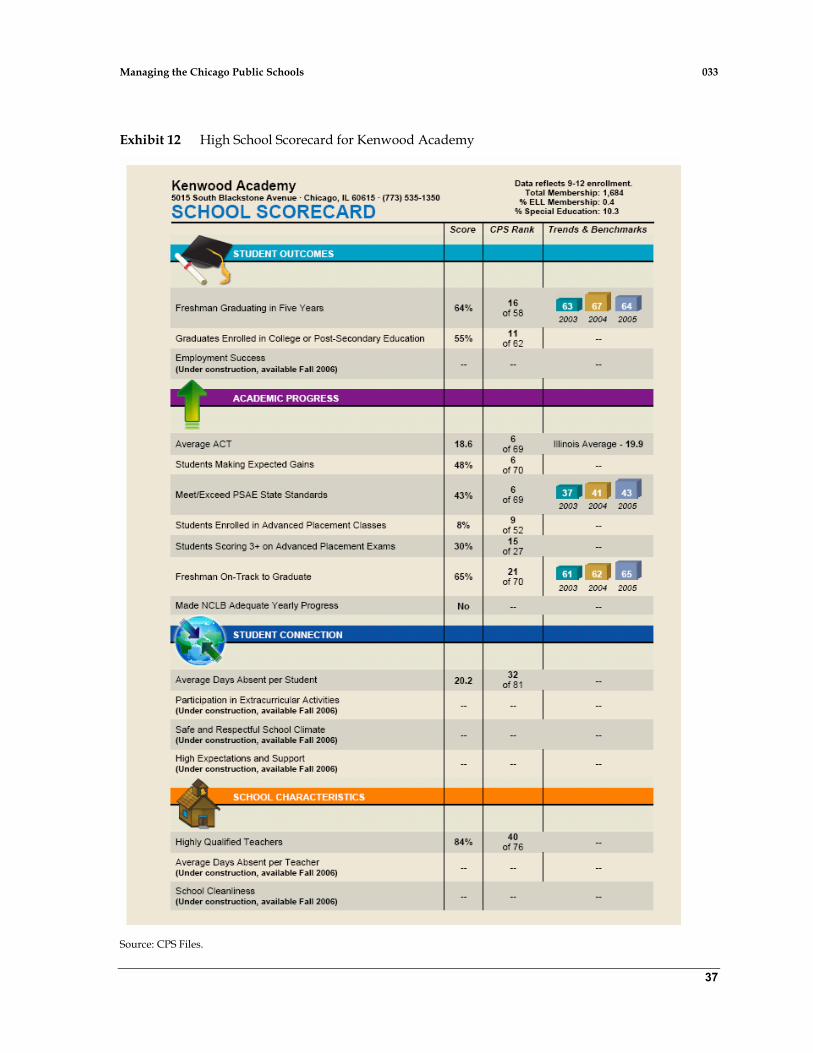
Managing the Chicago Public Schools 033
37
Exhibit 12 High School Scorecard for Kenwood Academy
Source: CPS Files.

033 -38-
Exhibit 13a CPS Organization Chart, April 2003- May 2006
Source: CPS Files.
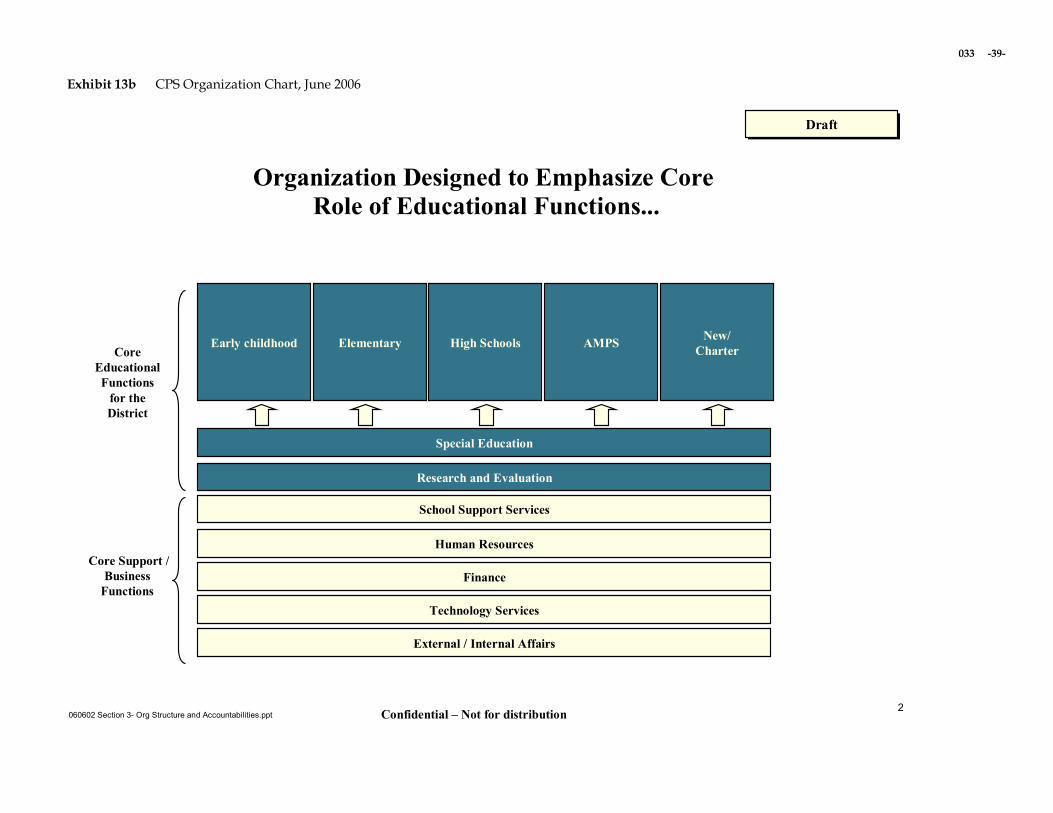
033 -39-
Exhibit 13b CPS Organization Chart, June 2006
2Confidential – Not for distribution060602 Section 3- Org Structure and Accountabilities.ppt
Organization Designed to Emphasize CoreRole of Educational Functions...
High Schools
Research and Evaluation
Finance
School Support Services
Technology Services
New/Charter
Human Resources
Early childhood Elementary
Special Education
AMPSCore
EducationalFunctions
for the District
Core Support / Business
Functions
External / Internal Affairs
DraftDraft
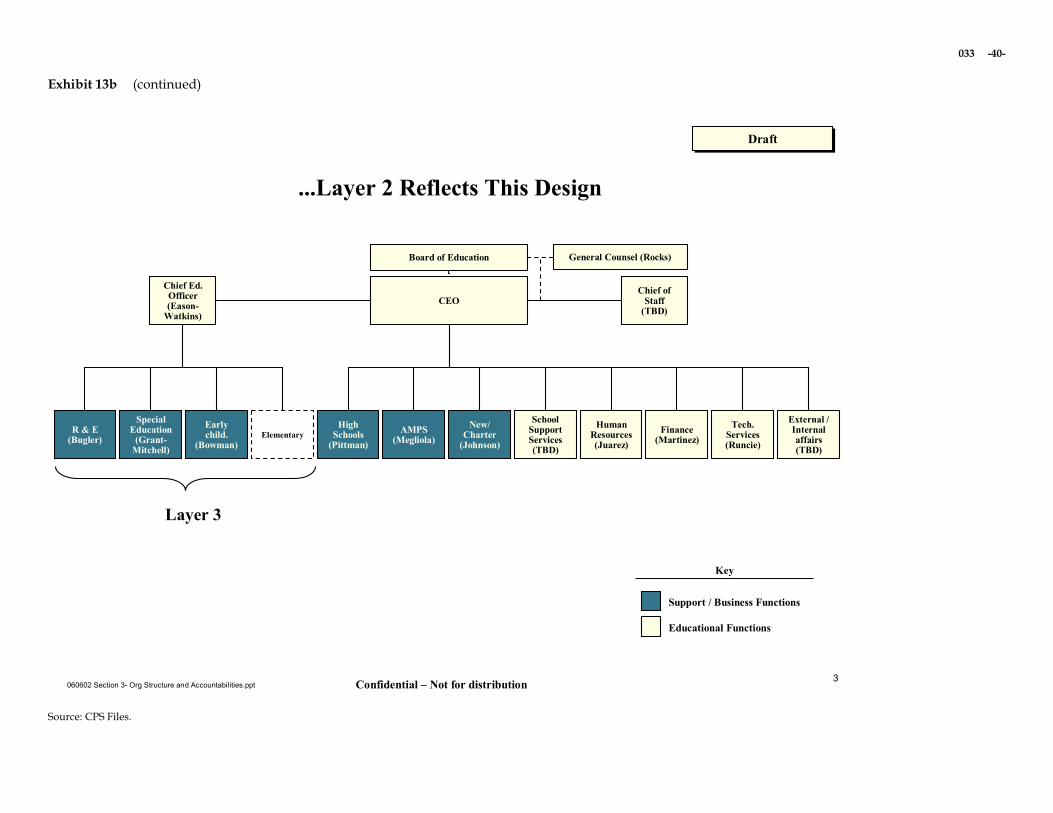
033 -40-
Exhibit 13b (continued)
3Confidential – Not for distribution060602 Section 3- Org Structure and Accountabilities.ppt
...Layer 2 Reflects This Design
CEOChief of
Staff(TBD)
High Schools
(Pittman)R & E
(Bugler)
School Support Services(TBD)
Finance(Martinez)
External / Internal affairs(TBD)
New/Charter
(Johnson)
Human Resources(Juarez)
Early child.
(Bowman)
General Counsel (Rocks)Board of Education
Elementary
Special Education
(Grant-Mitchell)
AMPS(Megliola)
Chief Ed. Officer(Eason-
Watkins)
Layer 3
Tech.Services(Runcie)
Educational Functions
Support / Business Functions
Key
DraftDraft
Source: CPS Files.