Embed Size (px)
Citation preview

Managing Odour Risk at Landfill Sites: Main Report
P McKendry, J H Looney, A McKenzie
MSE

First Published 2002 ISSN 1478-0143 Copyright of this document remains with MSE Ltd & Viridis © 2002 This project was funded by SITA (UK) Ltd under the Landfill Tax Credit Scheme. The full report entitled “Managing Odour Risk at Landfills – Main Report” is available for download from the following web sites: Viridis (www.viridis.co.uk) and MSE (www.mse-environmental.co.uk). Viridis was the Entrust Approved Environmental Body (AEB) responsible for the project and the work was undertaken by Millennium Science & Engineering Ltd (MSE). The authors wish to acknowledge the assistance of the Environment Agency in reviewing the air dispersion modelling aspects of the project. MSE is committed to optimising energy efficiency, reducing waste and promoting recycling and re-use. In support of these goals, this report has been printed on recycled paper, comprising 100% post-consumer waste, manufactured using a TCF (totally chlorine free) process

i
TABLE OF CONTENTS
TABLE OF CONTENTS i
Abbreviations iv
Summary of Conclusions v
1. Preface 1 1.2 History 1 1.3 Related Landfill Tax Funded Projects 1
2. Introduction 1 2.1 Waste Management Context 1 2.2 Regulatory Framework 2 2.3 Planning Controls 2 2.4 Waste Management Licensing 3 2.5 Regulatory Guidance 3 2.6 Public Acceptability 3
3. Odour and Odour Measurement 4 3.1 Olfactory Response and Odour 4 3.2 Odour Measurement 5 3.3 Odorous Compounds in Landfill Gas 5
4. Landfill Odour Sources 7 4.1 Introduction 7 4.2 Waste Transport Vehicles 7 4.3 Landfilled Wastes 8 4.4 Leachate 8 4.5 Landfill Gas 9
5. Site descriptions 9 5.1 Introduction 9 5.2 Waste Input/Waste Types 9 5.3 Site Design and Operational Regime 10 5.4 Terrain 10 5.5 Proximity to Habitation 11 5.6 Potential Off-Site Odour Sources 11
6. Odour Complaints Data and Questionnaire 12 6.1 Odour Complaints 12 6.2 Odour Questionnaire 12 6.3 Analysis of Survey Results 13 6.4 Alternative Potential Odour Sources 14
7. Regional Wind Flow Patterns 14 7.1 Physics of Wind Flow 14 7.2 Terrain 15 7.3 Air Dispersion Models 20 7.4 Application to Landfills 21

ii
8. Monitoring of Emissions 21 8.1 Definition of Source Terms 21 8.2 Monitoring Procedure 22 8.3 Measurement of Emission Rates 22 8.4 Sources Monitored 25 8.5 Monitoring Programme 26
9. Air Dispersion Modelling and Results 26 9.1 Graphical Outputs 26 9.2 General Effects 27 9.3 Location Specific Effects 32 9.4 Site Specific Interactions 39 9.5 Probability of Odour Events 39 9.6 Summary and Conclusions 44
10. Management System Tool 45 10.1 Introduction 45 10.2 Odour Control Guidance 45 10.3 IPPC, BAT and Odour 45 10.4 Mitigation Options -- General 51 10.5 Mitigation Options – Specific 53 10.6 Further Work 55
11. Conclusions 55 11.1 Study Background 55 11.2 Odour, Measurement and Complaints Data 55 11.3 Landfill Odour Sources and Measurement of Emissions 55 11.4 Air Dispersion Modelling 56 11.5 Management Options 56
12. References 57
Appendix 1 Guidance on Odour and Odour Control
Appendix 2 Odours and BAT
Appendix 3 Properties of Selected Mercaptans and Hydrogen Sulphide
Appendix 4 Calculations and Conversions
Appendix 5 Details of Site Characteristics
Appendix 6 Odour Questionnaire
Appendix 7 Emissions Monitoring Protocol
Appendix 8 Measurement of Emission Rates

iii
Figures and Tables
Figure 1: Normal distribution of the sense of smell within a population 4 Figure 2: Comparison of the ODT for selected LFG trace components and their reported
concentration in LFG 6 Figure 3: Two stages of the anaerobic decomposition of complex organic wastes 9 Figures 4 – 7: Regional Wind Flow at Site V2 at a height of 10m 16 Figure 8: Wind Flow over Landfill Flank (or Escarpment) 19 Figure 9: Schematic of Flux Tent 22 Figures 10 – 17: Wind speed variation 28 Figures 18 – 20: Surface Roughness 29 Figures 21 – 26: Wind Direction without Terrain 30 Figure 27: Fluctuations with Terrain 32 Figures 28 – 34: Wind Direction and Terrain H1 33 Figures 35 – 42: Wind Direction and Terrain V2 32 Figures 43 – 48: Wind Speed and Terrain H1 34 Figures 49 – 60: Wind Direction, Wind Speed and Terrain V2 37 Figure 61: Annual Wind Rose, Site P3, 2001. 40 Figure 62: Annual Wind Rose, Site V2, 1997 41 Figure 63: Annual Wind Rose, Site H1, 1999 42 Table 1: ODT of Selected LFG Trace Components 5 Table 2: Selected Sulphur Containing Compounds in LFG (50% methane) 6 Table 3: Waste streams accepted by sites and total annual input (m3) 10 Table 4: Summary of Site Design Characteristics 10 Table 5: Summary of Questionnaire Statistics 13 Table 6: Beaufort Scale-Specifications and Equivalent Speeds 14 Table 7: Roughness values for different land use surfaces 21 Table 8: Measured Emission Values for Methane from Landfill Odour Sources 23 Table 9: Calculated Mass Emission Rate for Methyl Mercaptan 24 Table 10: Combinations of Typical Emission Sources (based on Mercaptans) and the
Cumulative Emission Rates 25 Table 11: Cumulative Effect of Combined Controlling Factors on Percentage
Exposure to Odours 43 Table 12: Odour Risk Assessment Matrix 46 Table 13: Odour Control: Design and Operational Management Options 47 Table 14: Specific Operational Options to Reduce Odour Impacts 54

iv
Abbreviations
BAT Best Available Techniques
EA Environment Agency
EHO Environmental Health Officer
FID Flame Ionisation Detector
IPPC Integrated Pollution Prevention and Control
LFD Landfill Directive
LFG Landfill Gas
MSE Millennium Science & Engineering Ltd
ODT Odour Detection Threshold
ORT Odour Recognition Threshold
OT Odour Threshold
OU Odour Unit
PPC Pollution Prevention and Control
STW Sewage Treatment Works
VFA Volatile Fatty Acids
WMP Waste Management Paper
v
Summary of Conclusions
• The management of odours from landfills is an aspect of landfill operations and management that is of continuing concern to both the public, and the regulatory authorities and waste management companies.
• To identify and assess management techniques for controlling odour risk at potential receptors, a study was initiated comprising the comparison of historic complaints and site operations records; the field measurement of methane emission rates (as a proxy for odorous emissions) from landfill sources; collecting data on public perceptions of odour; and extensive air dispersion modelling using the data gained from the preceding tasks.
• The objective of the study was to produce guidance on odour control for site managers by identifying the key parameters associated with odour and prioritising the effectiveness of existing odour control techniques and practices. Six landfill sites with different waste inputs and geographic locations within England were selected for the study.
• A public questionnaire was used to obtain both generic and site specific information from potential receptors local to the sites about odours and odour events. The common findings within the responses confirmed the basic assumptions used in the subsequent air dispersion modelling that low wind speeds, and early morning/late evening were the atmospheric and temporal conditions most likely to produce odour events. The questionnaire results also presented anecdotal evidence for odour events occurring during damp/foggy conditions.
• The questionnaire findings indicated that landfill gas and leachate were the most common sources of odours and that the public may be experiencing odours more often than actually reported, suggesting that odour is a persistent low level problem with intermittent high levels leading to complaints.
• It was hoped to be able to correlate historic data on odour complaints with the details of contemporaneous site activities and practices. However insufficient data was available from either the regulatory complaints records or records of site activities to enable this approach to be used. The conclusion is that there is a need to improve greatly the level of detail when logging complaints and similarly for the level of detail contained in the Site Diary, if these data are to be of subsequent value when investigating the sources of odour complaints.
• Air dispersion modelling was used to identify the pattern of air movement over the landfill and across the adjacent terrain. The entrainment of landfill derived odours within the air mass can
subsequently produce an off-site odour footprint or plume leading to a complaint.
• To provide input data on odour emission rates for air dispersion modelling, fieldwork was undertaken to measure directly methane emission rates from a range of landfill surface and point sources using flux devices. Equivalent odour omission rates were deduced from published data on the composition of landfill gas and the ratio of methane to odorous compounds. It was assumed that these ratios were constant for the purposes of the dispersion modeling.
• The results of the dispersion modelling confirmed that the key factors associated with odour events are the total odour emission rate from a site, the topographic setting of the site, location of potential receptors and the interaction between wind speed, direction and topography.
• Management of odours by prevention commences at the site selection stage, where the location of sensitive receptors and the interaction between wind speed and direction and the adjacent topography should be taken account using air dispersion modeling.
• Once selected, all site operational activities are potential sources of odours; from the delivery of wastes; delays in burying odorous wastes, trenching into mature waste for installing gas collection pipework and the recirculation of leachate; the number of venting gas wells or open leachate chambers; to the area of side wall flanks and the effectiveness of the gas management system.
• Mitigation measures that limit the extent of the off-site odour footprint are based on reducing the odour emission rate by decreasing the rate of odorous emissions from a source; by increasing the depth of cover materials and/or changing the type of cover material on landfill surfaces; abstracting odorous compounds by connecting all chambers and wells to the active gas management system; by introducing features that increase the surface roughness of the terrain such as bunds, hedges and solid fences to promote the mixing of laminar air flows containing odours providing dilution of odorous air flows.
• Based on site location, wind speed and direction and the specific local terrain, the probability of a fixed receptor experiencing an odour event can be estimated approximately. Application of this process at the impact assessment stage of site selection would significantly mitigate against future odour problems.
• Prevention and mitigation of odours during operations can be achieved by correct site selection

vi
and the combined application of existing site operational and management techniques.
• Suggestions for further work include: establishing a database of emission rates for various landfill surfaces and other emission sources, including leachate aeration lagoons; defining the atmospheric conditions under which this emission rate was
• monitored; direct field measurement of typical odorous compounds; establishing the effectiveness of gas management systems by direct measurement; and assessing the effect of landform design and phasing on the potential for off-site odour events.

1
1. Preface
The work undertaken and reported in this and other supporting documentation was funded through the Landfill Tax Credit Scheme. The project was carried out under the auspices of the Environment Body Viridis, with Landfill Tax funding provided by SITA Trust and the balance by SITA Holding (UK) Ltd. Millennium Science & Engineering Ltd undertook the work
1.2 History
Waste management activities of all types – recycling facilities, transfer stations, composting facilities and landfill sites – are all potential sources of a wide range of amenity complaints, such as dust, noise, vectors, vehicle movements and odour. Of these complaints, odour has become the most common in recent years and a cause of concern for nearby residents. Landfill companies have been in discussion with the Environment Agency (EA) and Local Planning Authorities regarding the issue of odour from landfill sites and the increasing number of public complaints that have been received (TG Trust 2000A).
The potential sources of odour from landfill sites are well documented but accurate and quantitative modelling of these odour sources to enable predictive assessment of their likely impact has not hitherto been rigorously applied. The lack of modelling has been partly due to the inability of existing air dispersion software to cope with the small-scale effects associated with a typical landfill site and the variety of odour emission sources. Appropriate new generation air dispersion modelling software is now available which can deal with a wider range of meteorological conditions; local terrain and topographic features; small-scale odour releases such as point, line and diffuse odour emissions and; specific site-based events, such as a ‘puff’ release of odorous gas.
Millennium Science & Engineering Ltd (MSE) proposed the concept of a formal odour risk management programme to determine effective ways to identify and quantify sources, link transfer paths to receptors and to establish cost-effective solutions for odour mitigation and
management, as applied to the design and the management of landfill sites.
1.3 Related Landfill Tax Funded Projects
Six odour related studies have been funded under the Landfill Tax Credit Scheme at the time of this report (Eventure and TG Trust 2000A - E).
These previous studies have investigated odour aspects such as identifying sources, odour sampling and measurements and developing cost effective means of monitoring odorous constituents.
2. Introduction
2.1 Waste Management Context
Odours have long been associated with waste management activities, a natural and inevitable consequence of the biological and chemical processes that occur during the decomposition of putrescible wastes. While not all odours result from the biological processes occurring in putrescible wastes e.g. odours from inorganic chemical wastes, the majority of odours are associated with the aerobic and anaerobic decomposition processes that organic wastes undergo when either landfilled or treated by processes such as composting.
The dictionary definition of odour is defined in two ways:
• characteristic property of a substance which makes it perceptible to the sense of smell
• a smell, whether pleasant or unpleasant i.e. either a fragrance or stench
It is the perceptibility of an odour, as determined by its concentration in ambient air and its apparent fragrance or stench that causes difficulties. The ability to detect a smell or the sense of smell varies greatly between people, such that some may detect a smell when others cannot. These differences in human response make the determination of acceptable levels of odour or smell, as measured by its concentration in air, difficult to quantify. The limiting concentration in air below which a smell or odour cannot be detected is called the Odour Detection Threshold (ODT) of that substance.
While odours from waste management and other industrial activities may historically have been accepted as a normal part of that activity, this is not the case today. The number of odour complaints arising from a wide range of industrial activities has increased markedly in recent years, especially with respect to waste management facilities and particularly landfill sites.
The term odour as used in the context of this project refers only to its effect on amenity and not as a potential risk to human health via chemical or microbiological

2
toxicity. It is understood that the EA Landfill Gas Task and Finish Group is considering the potential harm to human health of landfill gas. It is also accepted that there are potential health risks from sources other than landfill gas. The modelling here is applicable however to other uses e.g. investigations into health effects.
2.2 Regulatory Framework
European Legislation
The Framework Directive on Waste (Directive 75/442/EEC, as amended by Directive 91/156/EEC) identifies waste management activities that need to be properly controlled so that inter alia waste is recovered and disposed of without endangering human health and without using processes or methods which could harm the environment and in particular:
• without risk to water, air, soil, plants and animals
• without adversely affecting the countryside or places of special interest
• without causing a nuisance through noise or odours
The regulation of odour from waste management facilities is within the remit of the EA and the planning authority (including Environmental Health Officers – EHO’s), where odour nuisance will be a material consideration in the determination of a planning application. Wherever bulk quantities of waste are handled, kept, treated or disposed of there is potential for the generation of offensive odours. Geology, economics, logistics (e.g. transport systems) etc. often result in waste management facilities being situated close to residential, commercial, industrial or amenity areas.
In addition development pressures can and do, result in residential developments being constructed within close proximity to existing waste management facilities. It is reasonable that members of the public going about their normal living, working or leisure activities should expect landfill-site management to minimise odour events, thereby experiencing no adverse impact on amenity.
The EA has a duty to ensure that the deposit, recovery and disposal of controlled waste do not take place in a manner likely to cause pollution of the environment or harm to human health. Links are maintained with other authorities such as local authorities (in their role as planning and environmental health authorities) and the Health and Safety Executive to ensure that all interested parties are involved.
United Kingdom Legislation
The Landfill Directive’s 1999/31/EC (LFD) requirements have been transposed into UK national law via the Environmental Protection Act 1990 (EPA 90) and the Waste Management Licensing Regulations 1994. The
term ‘harm’ is defined in Section 29 of EPA 90 as including, in the case of man, offence to any of his senses or harm to his property. In Schedule 4, Paragraph 4, the Regulations require inter alia in relation to the disposal and recovery of waste, that processes do not cause nuisances through odour.
Part III of the EPA 1990 enables Environmental Health Officers to control any odour that a waste management facility might cause that is prejudicial to health or a nuisance to the public. In Scotland nuisance is dealt with under the Public Health (Scotland) Act 1897.
The LFD introduced measures to prevent or reduce negative effects on the environment and risks posed to human health due to waste and landfills. In particular these effects cover the pollution of surface water, groundwater, soil, air and include impacts on the global environment with respect to emissions of landfill gas as well.
Implementation of the LFD’s requirements in England and Wales took place under the Landfill Regulations 2001, operating under the Pollution Prevention and Control (PPC) Act 1998, which implements the EC Directive 96/61 on IPPC. The objectives of PPC and the LDF are complementary with the reasons for implementing the Directive in this way including:
• A set of regulations and accompanying guidance giving increased consistency and clarity of interpretation and application of the Directive
• Incorporating landfills into an integrated environmental protection regime
• Economies of scale to be achieved by avoiding the need to duplicate effort on operating and maintaining two regimes for landfill sites with the corresponding need for two sets of guidance and training
Landfills come under Section 5.2 of the Pollution Prevention and Control Regulations 2000, “Disposal of Waste by Landfill” if they receive more than 10 tonnes of waste in any day or with a total capacity of more than 25,000 tonnes, excluding landfills taking inert waste only.
The PPC Regulations require the Operator to describe the main activities generating odour and/or sources of odour, the location of the nearest odour-sensitive receptors, describe any relevant environmental surveys which have been undertaken and the techniques for controlling odorous emissions.
2.3 Planning Controls
The potential impacts of odour are raised initially as part of the planning process. On submission of an application for a waste management facility, an environmental impact assessment should be, where applicable, undertaken assessing the possible effects of odour arising from the facility and identify suitable mitigation measures. Operational controls are considered under the

3
Waste Management Licensing regime administered by the EA but amenity effects such as dust, noise and odour are usually also addressed at the planning stage.
The EA is a statutory consultee in the planning process for waste facilities and will make known its comments about the proposed facility, including the possible effects of odour. Detailed descriptions of the operational practices that might lead to odour events and means of providing subsequent controls are dealt with by the EA in the application for a Waste Management Permits, which enables the consented facility to be operated.
2.4 Waste Management Licensing
The EA is responsible for issuing the operational licence for the facility. Guidance on licence requirements is provided in Waste Management Paper 4 (WMP4). WMP4 identifies the expected operational standards. Issuing a licence condition that seeks to eliminate all odours arising from a waste management facility is unlikely to be effective. Adequate and effective odour controls require the combined use of a number of management and operational controls.
The EA issued a Library of Licence Conditions (EA, 1999). Application of a number of these conditions will be required to achieve the desired objective of adequate odour control. The basis of the approach used in setting the Licence Conditions is that of Environmental Risk Assessment and Risk Management. The licence conditions must address the environmental risks arising from site operations and ensure that the objective of prevention of pollution of the environment is achieved. This objective includes prevention of harm to human health and prevention of serious detriment to the amenities of the locality. Condition 6.020, “Control of Odours”, specifically addresses those aspects that need to be covered in the Working Plan to ensure the control of odours.
A Licence requirement is for a site diary to be maintained as a means of demonstrating the adequate running of the site with respect to pollution prevention, harm to human health and serious detriment to the amenity. The diary should be a source of information to enable correlation between odour complaints and site activities undertaken at the time of the event.
2.5 Regulatory Guidance
Guidance on odour control can be found in various documents notably; the WMP series, including WMP 26A and B (Appendix 1), WMP27; IPPC S5.02. In July 2001, draft guidance entitled “Internal Guidance for the Regulation of Odour at Waste Management Facilities under Waste Management Licensing Regulations” was issued for external consultation. Responses were due by 9 November 2001 but at the time of this report, no final guidance had been produced.
IPPC S5.02 was issued in November 2001. Section 1.7 of IPPC S5.02 provides an overview of activities in this
sector and identifies the various stages at which issues associated with odours (from whatever source) need to be addressed i.e. at the landfill development stage where the risks posed by the development must be assessed through waste acceptance, operational controls to landfill gas management. Section 2.3.9 of IPPC S5.02 refers specifically to odour issues (See Appendix 2 for a copy of this section).
The aim of the proposed internal guidance is to provide EA officers with the relevant background to this issue and to engender a nationally consistent approach to the control of odour through the licensing system and subsequent monitoring activities.
The Guidance proposes that: • all new licence applications are assessed with
regard to odours via a risk assessment undertaken by the applicant or operator, bearing in mind that some sites may have already provided odour assessments as part of their planning permission process
• the risk assessment will be used to define the approach to odour control within the licence
• the impact of odour on the surrounding environment is considered as part of routine site inspections
• odour is primarily controlled at source by good operational practices, the correct use and maintenance of plant and operator training
• odour controls are considered in consultation with other relevant regulatory authorities
Details of the practical measures identified in the various guidance documents are presented in Sections 10.2 and 10.3 of this report.
The consultation document recognises that the provision and maintenance of measures to control odours will need to take into consideration a number of factors that are likely to give rise to offensive odours. License conditions seeking to control the detection of odours beyond the site boundary should take account of the location of the nearest odour receptors and of the proximity of commercial or industrial activities adjacent to the landfill site and their potential impacts.
In March 2002, the EA commissioned an R&D Project (Proposal No 1E(02)20) to provide guidance on best practice measurement and assessment of odour (and noise) at waste management facilities with particular reference to amenity issues. At the time of publication of this report, no date had been set for publication of the R&D Project report.
2.6 Public Acceptability
As indicated previously public acceptance of odours from industrial activities has decreased and is especially so in respect of odours from waste management facilities. A recent study of complaints associated with 46 UK landfill

4
sites (TG Trust 4, 2000A) found that odour was by far the most significant cause of complaint, accounting for 59% of all complaints made over a five year period at 20 of the sites surveyed. Notwithstanding these results, not all sites receive odour complaints. The absence of odour complaints could indicate either that adequate controls are in place or that people generally do not complain.
Obnoxious or bad odours emanating from a landfill may have a number of effects, including: general annoyance; loss of amenity (e.g. forcing someone out of their garden); loss of appetite and/or sleep; and may affect social activities (e.g. spoil dinner parties etc.). In addition, the public may link any odour to potential health fears, or perceived effects such as increased awareness of colds, asthma or other respiratory ailments and this may result in fears regarding the nature of ‘toxic’ or ‘dangerous’ inputs into the associated landfill. The public may also associate repeated, or continual, odour episodes with a loss of value in their property.
Human response to odour is highly subjective. Some people are particularly sensitive and may object to odours that others may not be able to detect. People may also become sensitised or de-sensitised to an odour, depending on the nature of the odour itself, the frequency and strength of exposure and their personal associations with the odour. Even nominally pleasant odours can become a nuisance over time.
3. Odour and Odour Measurement
3.1 Olfactory Response and Odour
Measurement of odour is a difficult and complex process. While the concentration of a chemical producing an odour can be quantified, the impact of the odour on human receptors is largely subjective, depending on the type and nature of the smell produced and individual
sensitivities of detection. The sensory perception of odorants involves four components:
• Detectability: the theoretical minimum concentration of odorant stimulus for detection in a specified percentage of the population (usually 50%)
• Intensity: perceived strength of the odour sensation
• Odorant character: what the odour smells like
• Hedonic tone: relative pleasantness or unpleasantness of the odour
Human response to odorant perception follows a number of characteristic patterns associated with sensory functions. For a substance to be detected by the human olfactory system, it must lie within a certain size range, corresponding to a molecular weight (MW) between 15-300 (Environment Agency, July 2001). The substance must also be soluble in water and lipids, to enable it to penetrate the mucous layer covering the smell detector cells. For example, hydrogen sulphide with a MW of 34 is odorous, while sucrose with a MW of 342 is not odorous.
Human response to odorant perception follows a number of characteristic patterns associated with sensory functions. Olfactory acuity in the general population follows a normal distribution with 96% of people having a ‘normal’ sense of smell and 2% each having either an acute sense or a reduced sense of smell. While sensitivity is normally distributed amongst the population it is not constant across odorants or individuals, leading to a wide variation in conditions leading to an odour complaint.
Figure 1: Normal distribution of the sense of smell within a population

5
3.2 Odour Measurement
Measurement of the concentration of an odorant compound is a straightforward process. Samples of LFG are collected and analysed by appropriate chemical methods to identify the particular odorant compound required. However, the perception of odour is more complex. One recognised and established method of assessing odour is the determination of the number of Odour Units (OU) for a substance. OUs are determined using an odour panel, a panel of 5-10 people exposed to changing concentrations of the odorant.
The concentration at which 50% of the panel can detect the smell is deemed the Odour Detection Threshold (ODT) and by definition has an odour unit (OU) value of 1. The concentration at which 50% of the panel can recognise the smell is termed the Odour Recognition Threshold (ORT). Measurement of these thresholds is expressed in OU, the number of dilutions of the starting concentration required before the odour can no longer be detected. It is also possible to measure the actual concentration of the odorant chemical present in the sample at the ODT.
It can be seen that while the OU method takes account of variations in human olfactory acuity, it is a time consuming process and therefore a costly process. The costs incurred involve the collection of gas samples, forming a panel of 5-10 persons and running successive dilutions and panel testing of the odour samples as necessary, until the 50% detection threshold is achieved.
To maximise the quantity of work that could be undertaken for the agreed budget, it was decided to use the technically valid but simpler approach of basing the odour dispersion modelling on the chemical concentration of the odorant species determined at its ODT. This approach is simpler, as is does not require the
establishment of an odour panel or the associated odour sample control measures. A review of olfactory studies produced by the American Industrial Hygiene Association (AIHA, 1997) has produced a list of ‘A’ rated ODT data from the studies reviewed and these data was used in the present study.
The ODT was used in favour of the ORT for two reasons: while an odour may not be identifiable, its characteristics may still be considered to be a nuisance; and the pragmatic reason that there no suitable data on ORT could be sourced compared with ODT data.
The approach of using the chemical concentration at the ODT rather than OUs has the additional benefit of using a parameter that could subsequently be measured in the field with suitable equipment to give real-time measurements. However this approach takes account of any synergistic effects between chemicals.
3.3 Odorous Compounds in Landfill Gas
Over 300 trace compounds have been identified in LFG. Unpleasant odours are usually associated with the sulphur-containing compounds, primarily mercaptans and sulphides. The vast range of trace compounds measured in LFG is a reflection of both the anaerobic decomposition processes taking place in the waste mass and the wide range of chemicals introduced via the industrial and commercial waste streams.
A list of common odorant compounds with low ODTs found typically in LFG, the reported range of concentrations in LFG and their ODT concentrations is presented in Table 1 and Figure 2 below. The range of reported ODT values represents only the minimum value and does not indicate the range of concentrations at which compounds can be detected.
Odorant Compound Reported Concentration in LFG* (mg m-3)
Reported ODT Range** (mg m-3)
Butanoic acid 0.1 - 210 0.0000029 - 9 Butyl Mercaptan 0.01 - 16.1 0.006 - 12 Diethyl disulphide 0.1 - 1.0 0.0003 - 0.02 Dimethyl disulphide 0.02 - 40 0.00023 - 12 Dimethyl sulphide 0.02 - 135 0.00033 - 0.6 Ethyl mercaptan 0.1 - 120 0.00025 - 0.001 Methyl mercaptan 0.005 - 430 0.0000003 - 0.02 Ethyl butanoate 0.1 - 350 0.00003 - 0.28 Hydrogen sulphide 0.0005 - 97,152 0.0001 - 2.8 Methyl butanoate 0.2 - 125 0.0019 - 0.077 Propyl mercaptan 0.05 - 2.1 0.0000025 - 0.00014 Xylene 0.0015 - 1100 0.0002 - 100 * based on average of LFG literature derived values ** AIHA 1999 and AEAT 1994 & 1997
Table 1: ODT of Selected LFG Trace Components

6
0.000
0001
0.000
001
0.000
01
0.000
10.0
01 0.01 0.1 1 10 10
010
0010
000
1000
00
Butyl Mercaptan
Ethyl Mercaptan
Methyl Mercaptan
Propyl Mercaptan
Hydrogen Sulphide
Concentration (mg / m3)
Literature minimum ODT Range
Reported Concentration in LFGNB: Data from Table 1
Figure 2: Comparison of the ODT for selected LFG trace components and their reported concentration in LFG
It can be seen clearly that there is a broad range of reported odorant concentrations and ODT values. Such variations in the range of intrinsic key odour data makes it certain that odour complaints from LFG will vary greatly from one seemingly identical site to another. In addition extrinsic factors such as the extent of capping, the type and extent of the gas control system and its efficacy, the surrounding terrain and features etc. will influence the potential for odour events. As a consequence the comparison of odour issues between sites is a complex matter.
Offensive, sulphur-based odorant compounds found in LFG typically have the lowest ODT concentrations, making them the most likely source of unpleasant odours in LFG (for a given concentration). Table 2 presents the reported concentrations found in LFG for four sulphur-containing compounds, part of the mercaptan series (Appendix 3). The four mercaptans, methyl-. butyl-, ethyl- and propyl mercaptan (also known as methanethiol, butanethiol, ethanethiol and propanethiol), are all found in LFG at concentrations well above their ODT. Hydrogen sulphide, also widely found in LFG, is included for comparison.
Reported Values (mgm-3) Sulphur Containing
Compounds Min Value* Max Value Average Value**
Odorant to Methane Ratio***
Methyl mercaptan 0.01 430 36 3.17 x 10⁻⁶
Ethyl mercaptan 0.10 120 11 2.98 x 10⁻⁶
Butyl mercaptan 0.01 13 2.1 2.95 x 10⁻⁶
Propyl mercaptan 0.05 2.1 0.88 6.45x10⁻⁶
Hydrogen sulphide 0.00 97152 1210 1.62 x 10⁻⁴
* Value <0.01mgm-3 reported as 0.00 ** based on average of literature derived values *** assumes 50% methane and unit concentration of 1mgm-3 (Appendix 4.7)
Table 2: Selected Sulphur Containing Compounds in LFG (50% methane)
Using the reported concentrations of these compounds (or any other compound of interest) in LFG, the ratio of the odorant species to methane can be calculated. Based on
this calculated ratio the equivalent mass emission rate of the odorant can be deduced from the measured methane emission rate. The odorant ratio will change depending

7
on the actual concentration assumed. Comparison with other published data (AEA, 1994; AEA, 1997; AIHA, 1997) shows that there is considerable variation in the reported concentration of the odorant compounds at the ODT, with differences of several orders of magnitude reported for the same compound.
The wide variation in the value of ODT and the range of odorant concentrations measured in LFG highlights the difficulties of investigating odour complaints and analysing odour sources. The reported range of ODT for typical odorant species in landfill odours often overlap, leading to difficulties of identifying whether the odour source was landfill gas or leachate in origin.
In this situation the use of OU has an advantage over the use of chemical concentrations, as OU measure the overall ‘odour’ experienced. However OU do not allow identification of the individual chemicals contributing to the odour, which can be useful information in terms of identifying the specific sources contributing to the odour.
Using this first-order approach of assuming the typical values reported in the literature, enabled reasonable values to be used for this initial dispersion modelling study. However it is recognised that the use of such typical data could result in under- or over-estimation of the actual concentrations and it is strongly recommended that site specific measurements of landfill gas or actual field measurements of odorants be used whenever possible.
It was appreciated that other odorant species will also be present and may interact with the mercaptan compounds assumed for the study. However it was both beyond the scope of the present study to consider possible interactions between different odorants and the resulting cumulative effects and also inappropriate for an initial study of this type.
4. Landfill Odour Sources
4.1 Introduction
All waste management facilities and especially landfill sites produce odours. The collection, transport and handling of wastes combined with the effects of temperature, time and rainfall makes it inevitable that the decomposition of the organic matter will commence before the waste is disposed to landfill.
Landfill sites present many different sources and opportunities for odours to be generated. The application of design, operational and management techniques can reduce the impact of odours. In determining appropriate odour control and mitigation measures, it is imperative that the source of the odour is identified correctly. Remedial action applied to the incorrect source of odour does not achieve the desired result and incurs costs for no benefit.
Landfill odours can vary from ‘pleasant’ to ‘unpleasant’ but it is the impacts of ‘unpleasant’ or ‘offensive’ odours that are the focus of this study.
8
4.2 Waste Transport Vehicles
Odour complaints can begin with the delivery of waste to the site by the collection vehicle. Waste collection schemes, particularly those for household wastes, occur either once a week or once a fortnight. Prior to the waste being collected for disposal, the waste may already be 7 to 14 days old. If the waste is stored within a container, such as wheelie bin, the air temperature within the container can approach 45oC if located in direct sunlight, encouraging the microbiological breakdown of materials and the production of odorous compounds.
Once collected from residential and commercial properties, putrescible wastes may be delivered to transfer stations for bulking up and onward movement to a landfill for disposal. The waste may be stored for some days before final despatch to landfill e.g. Bank Holiday period. Under these conditions the microbiological decomposition processes already commenced in the collection receptacle will develop further and ensure that odorous degradation products will be present during subsequent transport to landfill.
Transport of odorous decaying wastes through residential areas on route to the landfill will create an odour pathway that will sensitise occupants along the route. Subsequent odour complaints generated may in fact be related largely to the delivery of wastes and not solely to the landfilling process.
4.3 Landfilled Wastes
Odours associated with the landfilling of wastes can originate from both the delivery of odorous wastes and the result of decomposition processes taking place in the landfilled waste mass. Identifying correctly the odour source is an essential part of designing appropriate remedial measures. Not all landfill-derived odours are necessarily offensive but in this study only offensive odours are considered. The same dispersion and dilution effects apply equally to both offensive and inoffensive odours.
Fresh waste odours are usually typified by esters and alcohols compared to aged wastes, where putrefaction processes have been established and putrid sulphur-based mercaptans and sulphides tend to dominate the odour mix.
4.4 Leachate
The action of water on putrescible or organic wastes leads to the generation of a liquid effluent termed landfill leachate. Leachate is formed by the gradual breakdown
of large molecules, such as carbohydrates, into smaller molecules via the process of hydrolysis. Under the action of anaerobic processes within the waste mass, the degradation products from hydrolysis undergo further breakdown by acetogenesis.
Acetogenesis produces a series of acids such as butyric, proprionic and acetic acids, termed volatile fatty acids (VFAs). Under the anaerobic conditions existing at this stage, oxidised materials present as, for example sulphates, will be reduced to sulphides, producing another series of odorous compounds.
The conversion of the products of hydrolysis into LFG can be represented as a two stage process, shown schematically in figure 3 below:
These materials are highly odiferous and unless methanogenic processes are established that convert the VFAs into methane and carbon dioxide e.g. LFG, or they are adequately contained, they will themselves act as a potent source of highly odorous emissions. The sulphide degradation are unaffected by methanogenisis and remain odorous, becoming an integral part of the LFG subsequently produced.
The odour characteristics of leachate vary with its age. Leachate at the VFA stage is termed young leachate, typically a black odorous liquid with a high COD and BOD. Over time as methanogenisis is established, the aged leachate loses its COD and BOD, as LFG is formed. In parallel the odorous nature of the leachate also reduces.
In addition to the VFAs, other odiferous compounds have a high solubility in water, allowing dissolution in leachate to a greater or lesser extent. Dissolution in leachate enables the transport of odorous chemicals to locations and situations where they might be released, leading to the odour impacts remote from where leachate is produced. Examples include:
• aeration lagoons that can produce ‘puffs’ of odour as the aerators agitate the leachate and release dissolved odorous compounds
• off-site disposal via a public sewer running through a residential area, where the agitation of the leachate as it passes along the sewer can lead to the release of dissolved odorous compounds, the odour exiting via manholes along the route, unless removed or pre-treated beforehand

9
Complex Organicsi.e. waste
Organic Acids CH4 and CO2
Acid Forming Bacteria
Methane Forming Bacteria
First Stage Second Stage
Figure 3: Two stages of the anaerobic decomposition of complex organic wastes
4.5 Landfill Gas
Young leachate is the feedstock material or precursor for the formation of LFG. Unless methanogenic conditions are established for the subsequent conversion of the VFA’s generated in young leachate, the result will be large quantities of an odiferous leachate, with minimal production of LFG. In most situations sufficient methanogenisis takes place to enable the production of LFG, making emissions of LFG a major source of landfill odours.
The major components of LFG are methane and carbon dioxide, with a small amount of nitrogen. The three bulk components typically total over 99% of LFG, none of which are odorous. Importantly however is the presence of small amounts of trace gases and compounds, which are odorous.
Over 300 compounds have been detected in LFG, consisting of both offensive and inoffensive odorous compounds. The mobile nature of LFG and its generation within the waste mass under pressure provides a driving force for its movement both through and out of the landfilled waste mass, which can be controlled by gas collection and management systems.
The intrinsic characteristics of the daily cover soils/materials, in terms of thickness and soil type, the infiltration of rainfall and the degree of compaction of the waste are all factors that determine how readily LFG will exit the site. Extrinsic factors such as the extent and effectiveness of the gas management system will determine how much LFG is available to exit the site. Typical emission sources are gas wells and leachate chambers not under abstraction, excavations in the waste mass and uncapped landfill surfaces, especially flanks.
Flanks can and often represent a significant area of an active site. Due to the steepness of the slopes (often 1:2 and greater), flanks are difficult to both compact and to place an adequate thickness of daily or temporary cover soils. Placement of gas wells close to the top of flanks is liable to cause the ingress of air into the waste via the porous flank surface, if high abstraction pressures are
used. If adequate abstraction is not achieved, the pressure under which LFG is produced can lead to fugitive surface emissions. For this combination of factors, flanks are suggested as being an important source of fugitive LFG emissions and hence odours. On some sites, flanks may represent the most important source of odours, dependant on the configuration of the active working area.
5. Site descriptions
5.1 Introduction
Six sites form the basis of the study, located to cover England from the north to the south. The six sites are treated separately with regard to emissions data, odour surveys, odour complaints and odour questionnaires,
For dispersion modelling purposes the six sites fall within three simple classification groups determined by the surrounding terrain. Assuming that the final landform is represented as a small hill, the three categories can be described simplistically as:
• hill on a plain
• hill on a hill
• hill in a valley
Three of the sites equated to the hill on a plain scenario (hereon referred to as sites P1, P2 and P3 ); one is a hill on a hill (H1); and two sites are represented by a hill in a valley (V1 and V2). Details of the terrain surrounding the sites and site descriptions is covered in later sections and is included in Appendix 5.
5.2 Waste Input/Waste Types
Table 3 summarises the waste quantities and waste streams accepted by each of the study sites. All sites accepted domestic and non-hazardous commercial or industrial waste. Three of the six accepted special or hazardous waste. Only one of the sites accepted liquid, sludge’s or other waste types. A more detailed discussion

10
of the waste inputs and waste streams is included in Appendix 5.
Site Design Characteristic
P1 P2 P3 H1 V1 V2
Domestic Non-hazardous Commercial / Industrial
Special / Hazardous
Liquids / Sludges Other Annual Input (m3) 350,000 430,000 200,000 130,000 140,000 80,000 Total Site Area (ha) 50 140 26 27 21 9
Table 3: Waste streams accepted by sites and total annual input (m3)
Site Design Characteristic
P1 P2 P3 H1 V1 V2
Dilute & Disperse (Active*/Restored**) / X/ / X/X X/ X/ Engineered Containment with Composite Liner (Active*/Restored**) X/X /X X/X / /X /X
Clay Final Cap X X
Geomembrane Final Cap X
Gas Wells
Power Generation X X X
Flare X Leachate primary treatment and discharge to sewer X X X X
Leachate removed from site by another method X X * Active: The current area of waste disposal and all other areas not as yet restored (including those with final clay, Geomembrane or other capping) ** Restored: Surface capped and returned to planned final cover (grassed)
Table 4: Summary of Site Design Characteristics
5.3 Site Design and Operational Regime
The wide age range of the sites involved in the study meant that site designs included dilute and disperse systems, engineered containment and combinations of the above. All sites conformed to current design standards and operational good practice, including the installation of gas abstraction and leachate collection systems. The site design characteristics are summarized in Table 4 above.
5.4 Terrain
The terrain of the six sites can be classified into three distinct groupings. As indicated previously, for the purposes of dispersion modelling these were a hill on a plain, a hill on a hill and a hill in a valley.
Sites P1, P2 and P3 were all located on river or coastal flood plains. As such, there was little topographic variation surrounding the sites and in all cases, the landfill site forming the largest topographic feature in the proximity of the sites.
H1 was located at an altitude of approximately 50m AOD in an area of rolling hills rising up to 90m AOD. The site was located on a ridge that formed the margin between the coastal plain and the inland hills.
Sites V1 and V2 were both located in an area of rolling terrain with a height of up to 130m AOD. Both of the sites were positioned on the valley floor at approximately 80m AOD.

11
5.5 Proximity to Habitation
The sites selected differed greatly in the extent of and their proximity to sensitive receptors. Receptors included residential, industrial and commercial, including a supermarket and a kindergarten. The closest receptor to any of the sites was a kindergarten located at the entrance to P1. Conversely, complaints had been received over 2 km away from both sites P2 and H1. A more detailed discussion of the proximity of the sites to habitation is included in Appendix 5.
5.6 Potential Off-Site Odour Sources
All of the sites were situated in areas where agricultural practices were undertaken. In particular, V2 was located in close proximity to an area where regular application of slurry to land occurred.
P1 was situated in close proximity to a number of chemical manufacturing facilities and sites that make use of solvents. In addition, odours associated with the estuary were also possible. Similar estuarine odours were possible at P2.
Odour issues are complicated at P2 due to the very close proximity of a sewerage treatment works (STW) located adjacent to the landfill site. Furthermore, the site accepted the sludge-cake from the STW, with the cake being transferred in open containers. Problems had arisen in the past regarding the determination of the odour source as a result of this close proximity. A poultry farm was also located approximately 350m to the north of the site, giving the local area around the site multiple odour sources. Differentiation of the various odours and attribution of the likely (multiple) sources is a complex issue, requiring significant effort.

12
6. Odour Complaints Data and Questionnaire
6.1 Odour Complaints
Management of complaints by and feedback from the public about landfill operations, including odours, are an essential part of ensuring that waste management activities are properly managed. The public have a right to expect facilities to be managed in accordance with good practice and to be compliant with the requirements of the regulatory regime under which they operate. The conventional routes for the public to register complaints are via the Environmental Health Department, the EA and or directly to the site.
Odour complaints should be seen by site operators in a positive light, helping to identify conditions that they may be unaware of either during or outside of normal operating hours. Once alerted to such events, operators can investigate the cause and take appropriate action(s).
Inspections by the regulatory body, the EA, can only obtain a snap-shot in time of site activities and their potential impacts. In terms of odour, a 30-minute inspection once per week (for example) represents less than 0.3% of a year and the likelihood of experiencing an odour event during an inspection is small.
Odour receptors around the site, such as industrial/commercial activities are present for perhaps 25-30% of the year, while residents can be present 100% of the year. Site operators are likely to be present for about 30-35% of the year, making residents the receptors most likely to experience any odour events. The effects of still/calm weather conditions that occur primarily at night or in the early morning, also makes it more likely that residents will experience any odours emanating from the site.
As part of this study it was intended that historic complaints and operational data would be compared via a detailed analysis with meteorological data. However, a number of factors limited this comparison. The lack of definition of the time that a complaint was lodged prevented cross-comparison with meteorological conditions and site activities. The location of the complaint, due to a requirement for maintaining complainant confidentiality, was often limited to a postcode area or road name. The area covered by a postcode or road name varied from few hundred square meters to many thousands e.g. urban versus rural.
All landfill sites are required to maintain a site dairy as part of their Licence. The purpose of the diary is to record major site activities. Details of the Licence requirement are specified as:
• Objective: To provide a daily on-site record that will demonstrate adequate running of the site with respect to pollution prevention, harm
to human health and serious detriment to the amenity.
• Use: The site diary may be required to include details of, for example: times on and off site of the designated Technically Competent Manager(s) for the site; details of complaints received and actions taken; and times/dates of scheduled monitoring and maintenance.
Whilst all the sites diaries were in compliance, the Licence requirements do not specify a level of recorded detail that would be of value to odour investigations. The lack of suitably detailed site records precluded the detailed comparison of site activities with odour complaints and only a limited analysis could usefully be undertaken. To facilitate the investigation of odour complaints and as part of good operational practice, each site should have an operational weather station. The specification of the station should include the logging of wind speed, wind direction, precipitation, relative humidity and the net radiation. The logged data can be used in combination with the full meteorological data set required for air dispersion modelling purposes to provide site specific data.
Of the sites involved in the study, all except Site P1 had received complaints in the previous 12-18 months. The inclusion of Site P1 was to identify what differences may have accounted for the absence of any odour complaints,
6.2 Odour Questionnaire
Central to any investigation of odour complaints is the experience of the receptors and complainants. To obtain information from local residents and complainants about odour issues and odour events, a questionnaire was prepared and sent to a random selection of residents in the areas around four of the sites from where complaints had been received (see Appendix 6).
The purpose of the questionnaire was to obtain a combination of generic and site specific data, to enable a comparison of complaints records with site operations and weather conditions at the time. The format of the questionnaire covered the length of time odour events had been experienced, weather at the time, time of day/year, characteristics of the odour, complaints history, who complained to and any general concerns.
Responses were sent back (return self-addressed, reply-paid envelope) on an anonymous basis, to encourage people to respond frankly. A request was made for a name and contact address if the respondent wished to be involved in any follow-up exercise. The number of questionnaires issued reflected the population density around the sites.
The structure of the questionnaire was designed to attempt to differentiate between the various factors which could contribute to odour, such as weather, time of year etc., to see if odour events were associated with seasonal activities associated with farming i.e. spreading of slurry

13
or fertilisers etc. Similarly for other adjacent industrial activities that could lead to odour events, including specific daily or weekly activities such as the cleaning of plant and equipment, batch processes being loaded/unloaded etc.
6.3 Analysis of Survey Results
Historically responses to mailshot questionnaires are not usually very successful, for a variety of reasons, such as lack of interest, insufficient time to complete, complexity of the questionnaire etc. As with any mailed questionnaire, the respondents understanding of some questions differed from that intended and the lack of replies or non-specific replies to other questions meant that data was incomplete.
It can be concluded that the only means of obtaining complete and full details would be to undertake face-to-face consultations with those sent the questionnaires. In the event, 57% of those responding expressed an interest in becoming involved in any further studies.
Despite the length of the questionnaire – 25 questions (a full analysis of the returned questionnaires is presented in Appendix 6) – the standard of response was good. The overall success of the questionnaire approach in this instance could be judged by an overall 40% return rate against the total of 135 questionnaires despatched to the four locations (Table 5).
While the overall return rate for all the questionnaires was 40%, the return rate varied between the four sites. Unsurprisingly perhaps, the lowest return rate came from Site P1, the site with no odour complaints. The return for Site H1 reflected on-going odour issues currently being dealt with by a joint Operator/EA team. No obvious reason(s) could be identified to explain the lack of odour issues associated with what appear to be similar sites being operated in the same way taking the same waste streams. Once again odour proves to be a complex issue, not always easily delineated by obvious causal factors.
Analysis of the questionnaire returns data provided some useful generic data but also reinforced the confused nature and perception of odour and odour events held by the general public. Listed below are general findings applicable to all the sites:
• Short term odour event (few hours duration)
• Once per week or greater frequency
• Usually a longstanding issue, commencing at site opening
• Worst time of day for odour events are mornings and/or evenings (however this is when more residents are at home or outside)
• Odours detected generally under still/foggy conditions
• Odour strength typically moderate/strong
• Apart from animal manure smell, generally rotten food/putrid/pungent
• Most people do not complain about odours
The survey found that most people did not bother to complain about landfill operations, including odours even when experienced. This suggests possibly either the limited scale of the problem or a feeling that complaining will be of no value. The value of a Site Liaison Committee should not be underestimated. The high questionnaire response rate (85%) at H1, where a liaison committee exists, suggests an openness and willingness to contribute to a programme that seeks to minimise the environmental impact of the landfill operations and where the views of the public are listened to and addressed. Public complaints should be seen as an essential part of ensuring that waste management activities are properly managed.
Questionnaire Statistics Site*
Number Sent
Number of Replies
% Replying % Replying Wishing to be Involved Further
P1 40 8 20 12 P2 50 21 42 57 P3 25 8 32 75 H1 20 17 85 76 TOTAL 135 54 40 57 * Note: Questionnaires were not distributed at either site V1 or V2 due to a number of logistical issues
Table 5: Summary of Questionnaire Statistics

14
6.4 Alternative Potential Odour Sources
Of the sites covered by the study, sites P1, P2, P3 and V2 were located within an agricultural or semi-agricultural environment. Farming activities taking place around the sites included poultry farming, animal grazing, the cultivation of crops and the use and/or storage of farm generated animal slurry and wastes. Each of these activities are likely to produce an odour event period or periods during the course of the year, which may lead to a complaint incorrectly attributed to the landfill site.
At site V2, a regular occurrence was the movement of animal slurry along a road adjacent to the site that ran past a residential area. Immediately after the movement of this material on days when the wind was blowing in the appropriate direction, evidence indicated that odour complaints were recorded.
P1 was located in close proximity to an industrial estate, which included a paint manufacturer, other chemical processes and a range of light industries. P2 was located adjacent to a major Sewage Treatment Works. The presence of this alternative odour source further complicated the issue as the landfill site accepted the sewage cake produced by the Sewage Treatment Works. Two of the sites, V1 and V2, were also situated in a locality with a number of other landfill sites. As such, operational and managerial issues associated with these
other sites could compound and/or confuse odour complaint issues.
The proximity of possible alternative sources of odour makes a clear differentiation of odour sources difficult, especially as the data available from both the EA/EHO complaints records and the landfill site diary contained insufficient detail to enable a clear view to be formed as to the likely cause of the odour.
The lesson to be learnt is that more accurate and detailed records need to be maintained by both the site operator and the regulatory bodies if an objective assessment is to be made as to contributory source or sources of odour complaints.
7. Regional Wind Flow Patterns
7.1 Physics of Wind Flow
Wind is the movement of atmospheric air from a region of high pressure to one of lower pressure. Wind strength is measured in terms of velocity, m/s, but is usually characterized by its visual effects, the two measurements being linked by the Beaufort Scale. Table 6 gives the relationship between wind speed in m/s and the observed visual effects.
Equivalent Speed at 10 m Above Ground
Miles Per Hour Meters Per Second
Force Description Effects
Mean
Limits Mean
Limits
0 calm smoke rises vertically 0 <1 0.0 <0.2 1 light air wind direction shown by smoke drift 2 1 - 3 0.8 0.3 - 1.52 light breeze wind felt on face, leaves rustle 5 4 - 7 2.4 1.6 - 3.33 gentle breeze leaves/small twigs move 10 8 - 12 4.3 3.4 - 5.44 moderate breeze raises dust and loose paper 15 13 - 18 6.7 5.5 - 7.95 fresh breeze small trees begin to sway 21 19 - 24 9.3 8.0 - 10.76 strong breeze large branches move 28 25 - 31 12.3 10.8 - 13.87 near gale whole trees move 35 32 - 38 15.5 13.9 - 17.18 gale breaks twigs off trees 42 39 - 46 18.9 17.2 - 20.79 strong gale slight structural damage 50 47 - 54 22.6 20.8 - 24.4
10 storm trees uprooted considerable damage 59 55 - 63 26.4 24.5 - 28.411 violent storm widespread damage 68 64 - 72 30.5 28.5 - 32.612 hurricane - - >73 - >32.7
Table 6: Beaufort Scale-Specifications and Equivalent Speeds

15
The maximum wind speed likely to occur at a given location is needed for many structural engineering purposes, such as the design of buildings and other structures. The UK Meteorological Office provides wind data based on hourly mean and hourly gust data, for every hour, at each of the 140 anemograph stations across the UK. These records enable the hourly mean and gust data, as determined at a standard height above ground level (10 m), to be calculated. Using this reference wind data a site design wind speed and direction can be calculated, as can the number of days above a specific, or threshold, wind speed.
Based on this site design speed and direction, the effects of height above ground, surface roughness up and down wind of the site and the surrounding terrain can be calculated. This calculation uses a series of factors – K-factors – that are used to determine the design wind speed at the specific site under consideration.
Between ground level and a height well above the surface of the Earth, the gradient height, a wind speed gradient exists. Surface features on the Earth induce drag forces, hindering wind movement but this effect reduces with increasing height until wind moves along lines of equal pressure, the gradient wind speed. The region between ground-level and the gradient height is termed the atmospheric boundary layer (ABL).
As wind speed at any point in the ABL is dependent on the gradient speed, which in turn is influenced by geographical location, it cannot be easily measured. To accommodate this, wind speeds measured near the ground are used as reference values. Factors which affect the wind speed in the ABL include;
• geographical location i.e. the reference wind speed
• surrounding terrain
• surface roughness
• height of the point ground level
Temporal factors are also important, such as the average interval between occurrences of a particular wind speed and the time period over which the maximum wind speed is averaged, which is usually one hour.
7.2 Terrain
Once a reference wind speed has been calculated for the general area of the site, correction factors can be applied to determine a design wind speed for the site. The usual engineering requirement is the extreme mean hourly wind speed at a particular height, calculated using the K-factors, which takes account of surface roughness at and upwind of the site. The design wind speed forms the basis of subsequent engineering calculations when taking account of forces generated due to the wind. The methodology upon which this calculation is based assumes that the wind speed follows a Weibull distribution, which describes the wind speed variation with time at a location. This technique can be applied to specific sectors, enabling threshold exceedance to be determined for particular wind directions that may be of interest e.g. local housing or other sensitive receptors.
The benefit of undertaking this exercise at the site selection stage, is that it provides an indication of the magnitude of possible wind-related effects, such as wind-borne litter problem and odour, enabling mitigation measures to be included at the environmental assessment phase. Whilst on its own this evaluation exercise is unlikely to lead to the de-selection of a proposed landfill site, it may lead to a re-think of the proposed phasing plan for filling and to changes in site operational practices, which could include more effective mitigation and abatement techniques.
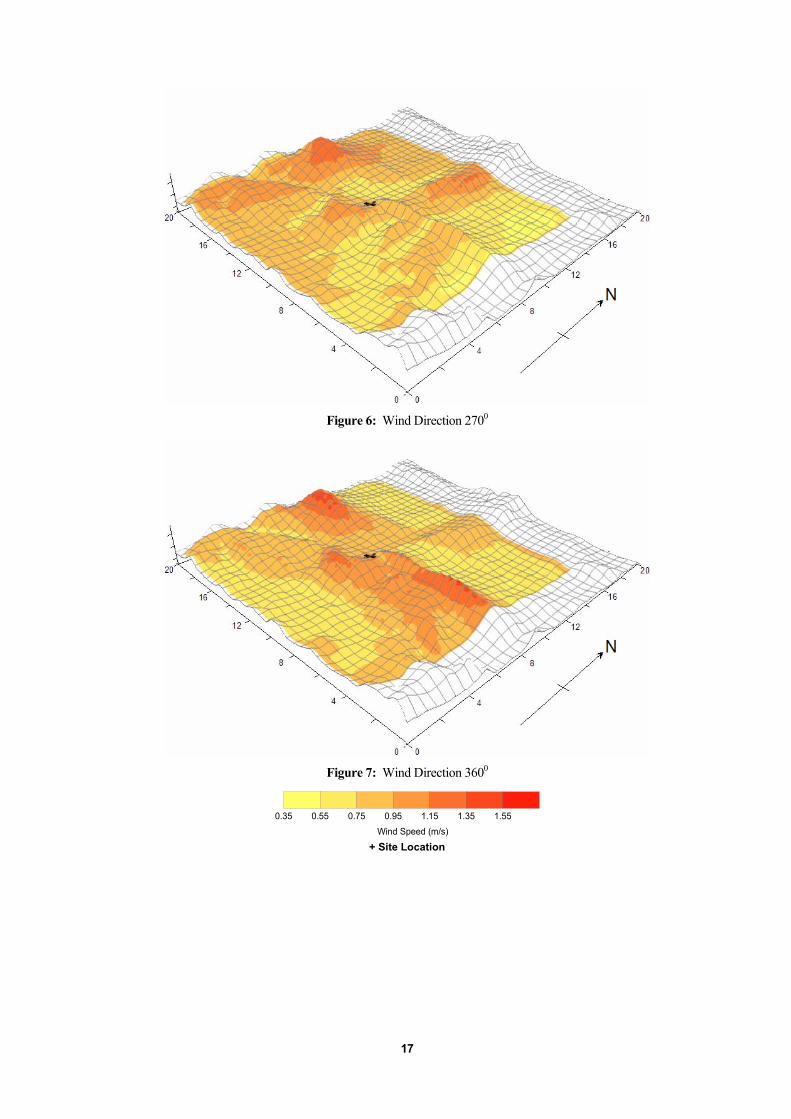
Terrain effects
Terrain features, such as hills and ridges, valleys and escarpments or slopes, have an influence on the wind speed as it passes over them (Figures 4-7). The magnitude of this effect is dependent on the upwind slope of the particular feature:
• for a gradual change, no net effect on the ABL will occur
• for features such as cliffs and slopes, the effects depend on the slope angle, α, with 17o being a break point.

16
Figures 4 – 7: Regional Wind Flow at Site V2 at a height of 10m
Site V2; Wind Speed 0.8ms-1; Surface Roughness: 0.5m. NB Axis in Km
Figure 4: Wind Direction 900
Figure 5: Wind Direction 1800
0.35 0.55 0.75 0.95 1.15 1.35 1.55Wind Speed (m/s)
+ Site Location
17
Figure 6: Wind Direction 2700
Figure 7: Wind Direction 3600
0.35 0.55 0.75 0.95 1.15 1.35 1.55Wind Speed (m/s)
+ Site Location

18
A shallow slope, α<17o, will produce a reduction in the approach wind speed to a minimum value at the foot of the slope, increasing to its maximum value near the crest of the slope, before decelerating to a constant value downwind (Figure 8a). The ratio of the maximum crest speed to the constant downwind speed is 1.6, at a height of 10 m above ground for α = 17o.
As α increases above 17o, flow up the slope produces separation of the air-flow upwind of the base of the slope and upwind of the crest, resulting in a reverse flow of air in each location, or as it is more commonly known, a vortex (Figure 8b). Because the air-flow in a vortex is circulating, it provides an upward force which will tend to cause odorous compounds (or solids such as litter and dust) to become entrained in the air mass. Flow down the slope creates a vortex only at the base and not at the crest (Figure 8c).
In addition to above effects on air flow, the same processes causing changes in the air flow also induce pressure changes over the surface of the land mass. As
the air mass speeds up and moves up a slope, the pressure above the surface is reduced, enhancing the emission of LFG through the porous surface. The vortex effect noted in 7.2.5 ensures that any surface emission is captured within the moving air mass, enabling the trapped odorant compounds to move off-site with the air body moving across the site.
While increasing the velocity of the air moving over the surface also increases the abstraction rate of the surface emission (by increasing the negative pressure over the surface), the resulting increased turbulence enhances the mixing and dilution of any odorant compounds released. The worst-case conditions for odour dispersion will be experienced at low wind speeds, where the mixing effect is reduced but so also is the abstraction effect. The quantification of any enhanced odour abstraction was not part of this study but would be a useful topic for future study.

19
(A) Flow up shallow escarpment
(B) Flow up steep escarpment
(C) Flow down steep escarpment
WIND
WIND
α < 17o
α > 17o
α > 17o
Downwind separation bubble
Upwind separation bubble
Separation bubble
Decelerates
DeceleratesAccelerates
Decelerates
DeceleratesAccelerates
No Change
WIND
Figure 8: Wind Flow over Landfill Flank (or Escarpment)

20
7.3 Air Dispersion Models
Air dispersion models describe the movement of gas and particulate emissions as a function of the prevailing meteorological conditions. New generation air dispersion models, such as AEROMOD and ADMS, use the Monin-Obukhov relationship to describe meteorological conditions rather than relying only on Pasquil atmospheric stability conditions. The new generation model ADMS version 3.1 was the dispersion modelling software used in this study. ADMS has been developed by three organisations, CERC, the Meteorological Office and National Power (subsequently the University of Surrey) and its development has been determined and reviewed in detail by sponsors who have supported part of the development (including the EA, HSE, DEFRA (formerly MAFF) and many more).
The ADMS model has been extensively validated against field data sets and has constantly been supported by a management committee with representatives from industry and government organisations and is widely by industry and regulators alike.
The EA has recently issued its LFG risk assessment software called GASSIM. GASSIM assesses the environmental impact of the bulk and trace species in LFG on the global atmosphere, the local environment and exposure to humans from atmospheric dispersion and lateral migration.
Environmental transport is simulated for terrestrial lateral migration by a one dimensional advection-diffusion equation, and for atmospheric dispersion using the NRPB R91 (Gaussian plume) model. The model determines the concentrations of the various species in the unsaturated subsurface and in the air, including wet and dry deposition for on-site and off-site receptors at various vectors plotted on a wind rose.
The NRPB R91 model does not accommodate the micro and macro-scale terrain effects that new generation air dispersion models (inter alia ADMS or AERMOD) can deal with and which are most applicable to investigating odour effects at landfill sites.
The air dispersion model employed models a wide range of buoyant and passive releases to atmosphere either individually or in combination. The effects of buildings, terrain and coastlines on dispersion can be taken into account. ADMS is unique amongst air dispersion models as it is the only tool of its kind which models short time
scale fluctuations in concentration. The accepted average time period of 15 minutes for modelling SOX emissions, for comparison with the National Air Quality Standards, has been verified by field measurements. The same 15-minute time period has therefore been adopted for the modelling of odours.
Air dispersion models can be used in a variety of ways for design and “what if”, or sensitivity, studies. For example, to:
• calculate the mean hourly and gust speeds at a site for a specific reference wind speed
• determine the effect on selected wind properties of changing the input variables
• reduce/correct measured wind properties to values corresponding to specific standard conditions.
Air dispersion models provide the designer/analyst with the ability to try out several “what if” scenarios, taking full account of local, site specific conditions, such as;
• ground roughness at the site
• upwind variations in ground roughness
• height above the ground
• topographic effects of the location of the site on a hill, ridge, cliff or slope.
Roughness and Terrain Effects
An important modelling option influencing dispersion is Surface Roughness, which represents the characteristic roughness length of the land surrounding the source, based on land use. Roughness reflects the micro-scale effects, which refer to the location and size of buildings and the nature of the ground surface e.g. pastoral, arable, woodland etc (Table 7). The lower the roughness length, the lower the resistance to dispersion or ability to generate turbulence and mixing and therefore the higher the average concentrations experienced.

21
Land Use Roughness Length (m)*
Sea 0.001 Short Grass 0.005 Open Grassland 0.02 Root Crops 0.01 Agricultural Areas 0.2 – 0.3 Parkland, Open Suburbia 0.5 Cities, Woodlands 1.0 Large Urban Areas 1.5 *Roughness length does not equate to the magnitude of the land use feature
Table 7: Roughness values for different land use surfaces
New generation air dispersion models can model complex terrain situations where it is used for estimating airflow and dispersion over hills and changes in surface roughness. Local topographic features include macro-scale effects, such as hills and valleys. The effects of these features on wind speed and wind direction can be seen in Figures 4 to 7.
Meteorological data
Atmospheric pollution is affected by meteorological factors. The key input parameters required for air dispersion modelling are:
• Mean wind speed at specific height • Surface sensible heat flux or cloud cover • Wind direction • Boundary layer height
This data is required in an hourly sequential format.
The meteorological data are entered into the system using a prepared meteorological file supplied by the Meteorological Office. The meteorological input module of ADMS and other air dispersion models reads the data from the meteorological input dataset and uses the pre-processing algorithms to estimate values of the boundary layer and related meteorological quantities required for running the dispersion model.
7.4 Application to Landfills
Emission sources
The ability of new generation air dispersion models to deal with local, small-scale topographic features makes them especially appropriate for dealing with landfills and other waste management sites. The effect of specific features such as landform phases, soil bunds, walls, fences etc. on odour dispersion can all be modelled. The models can deal with point, line and diffuse emissions sources and with constant and ‘puff event’ emissions, typical of many landfill activities that could lead to odour
complaints e.g. timed aeration of leachate, venting LFG via a leachate chamber or gas well, or excavating in waste.
Input data
Three input data are required for modelling as follows: • Source emission • Meteorological • Terrain
The source emission inputs can arise from a combination of landfill emissions i.e. exposed landfill surfaces, gas flares, gas engine exhausts, gas wells etc. Key parameters for these emissions are the velocity and temperature of the emission and the mass concentration of odorant in the gas stream. Both the emission rate and odorant concentration can be either measured or derived from published data. Due to the wide range of surface emission rates that can occur, it is recommended that the actual emission rates for methane are measured, rather than relying on published data.
The meteorological and terrain data for the site are purchased as data packages from the Meteorological Office and Ordinance Survey respectively.
8. Monitoring of Emissions
8.1 Definition of Source Terms
Source term
Dispersion modelling requires the value of the mass emission rate of the gas to be modelled in gs-1, called the source term. The source term defines the mass of material released from the emission source per unit time, which is then dispersed in accordance with the meteorological and terrain conditions.
Comparison of emission rates requires normalisation of the emission rate expressed in gs-1m-2. The emission rate from two sources may be similar in terms of the overall

22
mass emission rate but the contribution per unit area may be significantly different.
8.2 Monitoring Procedure
A standard monitoring procedure was established for on-site visits and the collection of emissions data. The procedure included a methane surface emission and odour site walk-over survey, a site boundary odour survey, measurement of on-site meteorological conditions and the measurement of surface and point emissions using both large- and small-scale flux chambers (Appendix 7).
8.3 Measurement of Emission Rates
Flux measurement
Emissions from surfaces were determined using both a large-scale flux box (4.1m2), termed a flux tent, and a small-scale flux box (0.15m2). The measurement mode can be either static or dynamic, the former being less accurate in absolute terms but providing a result in a much shorter time. To obtain the largest number of measurements in a given timescale, the static mode operation was used (Appendix 8).
Landfill surfaces are by nature heterogeneous, with surface cracks and variations in cover material thickness producing wide variations in the emission of landfill gases. Due to the smaller surface area of a typical flux box e.g. <0.5m2, it is recommended that the larger flux tent should be used wherever practicable, to ensure the increased probability of inclusion of potential surface defects.
Surface of tent Monitoring
Point
Edge dug into surface
LandfillSurface
Figure 9: Schematic of Flux Tent
However it is not always possible to use the large-scale flux tent due to uneven ground surface or accessibility, such as cell flanks. When using a device with a smaller surface area, the subsequent measurements may exclude surface defects, which can have significant mass emission rates. To compensate for the reduced area of coverage, larger numbers of measurements are required to provide representative data.
Figure 9 shows the schematic arrangement of a flux tent used to measure the methane emission rate from a landfill surface. Figure 9 applies equally to both large- and small-scale fixed volume flux boxes.
Flux measurement data
Data on flux measurements for methane emissions from landfill sites is limited. Published data (Bond et al, 2000) provides values for emission rates from landfill surfaces. Inevitably the results show a wide variation in the emission value between different types of landfill surface and the type of emission source. In this study the field determination of the emission rate was based on measuring the time rate of change of concentration of methane in the flux tent. Subsequent calculations produced a methane flux value in gm-2s-1 (see Appendix 4 for details). Table 8 compares emission rate data from the current study and published sources.

23
Methane Flux Rates (mg m-2 s-1 – areas, or mg s-1 – point sources*)
Odour Source
Current Study Range (Average)
Range of Reported Values (Bond et al, 2000)
Active working area n/a 4.2x10⁻²
Daily cover 3.1x10⁻¹ n/a Flank –temporary cover (Sandy) 1.2x10⁻² – 2.4x10⁻¹ n/a
Flank –temporary cover (Clayey Soil) 1.0x102* 5.0x10-3
Temporary Cap (Sandy) 6.0x10⁻² n/a Temporary Cap (Soil) 6.2x100 5.0x10⁻² – 1.0x100 Restored (Capped) 0.0 – 4.0x10⁻³ 5.0x10⁻⁵ – 4.1x10⁻²
Freely venting gas well* 2.2x10³ – 4.0x10³ n/a Man-hole cover over 1.2m diameter leachate chamber* 4.6x10⁻² n/a
* Single observation: not to be regarded as typical
Table 8: Measured Emission Values for Methane from Landfill Odour Sources

24
Comparison of the data between the current study and reported values shows that they are generally of the same order of magnitude for the same emission source. The number of significant figures should really be reported as one, or even on an order of magnitude basis, due to the need to undertake significant numbers of measurements to provide increased accuracy of the data. While it was not the purpose of this study to provide data of such accuracy, two significant figures are reported to help differentiate the data values.
The difference in emission rate between flanks with sandy or clayey soil cover is ascribed to differences in the homogeneity of the soils. Clayey soils can be ‘lumpy’ and unless well-compacted have the potential to produce large open spaces between the lumps, providing discrete pathways for subsurface emissions. While inherently more porous, sandy soils are likely to be more uniformly dispersed and overall give a more homogenous emission surface with few large, discrete emission pathways.
The ‘potential’ emission rate of the odorant can be determined by using the odorant to methane ratio derived in Table 1, which is then used as input data for dispersion modelling. Applying this ratio-approach enables methane to be used as an indicator species for highly odorous compounds such as methanethiol, ethanethiol, butanethiol and propanethiol.
The uncertainty with this approach is the actual concentration of the odorant in the specific gas stream, as the odorant ratio quoted in Table 1 is based on a nominal 1mg m-3 compound concentration. The uncertainty can be resolved by taking actual measurements of the odorant species present in the specific gas stream, allowing the more readily measured methane concentration to be used as an indicator species. Such measurements did not form part of this initial study.
The emission rates were calculated as a function of an assumed odorant concentration expressed in mgm-3 of LFG. The concentration of the odorant in LFG is not a constant but a dynamic and variable quantum. The mass emission rate modelled for each site was assumed to represent the cumulative output from all sources. Based on the reported concentrations in LFG, a concentration of 10mgm-3 in LFG was assumed for the purposes of the modelling. Table 9 gives the mass emission rates for methyl mercaptan based on the odorant ratio in Table 2 (scaled up to reflect the concentration assumed) and the methane flux rates in Table 8.
The total mass emission from a site could comprise a combination of different sources with each at a different emission rate (Table 10). The emission rate used in the dispersion modelling could comprise a variety of potential emission sources, such as a single point source or multiple point sources, a linear source, or the combined emission from a number of sources. Table 10 gives examples of the combined effect of different types of sources that could contribute to the overall mass emission rate of odorous compounds from a landfill.
The data in Table 10 identifies the importance of distinguishing between the various types of emission sources so that appropriate remedial and mitigation measures can be applied. The same approach could be applied to other odorant species of interest to produce equivalent emissions data for subsequent use in air dispersion modelling.
In this study, no account is taken of the potential for the cumulative effect on odour due to the presence of different odorant species. It is believed that there will be a compounding effect on the odour experienced by receptors due to the presence of multiple odorant species but such investigations were not part of this study.
Emission Source Methane Mass Emission (mgm-
2s-1) Odorant Compound Mass Emission Rate (mgm-2s-1)
(assumes 10mgm-3 in LFG)
Flank 1.0x10⁻¹ 3.2x10⁻⁶ Daily cover (Sandy) 3.1x10⁻¹ 9.8x10⁻⁶ Temporary Cap (Sandy) 6.0x10⁻² 1.9x10⁻⁶ Restored (Capped) 4.0x10⁻³ 1.3x10⁻⁷ Freely venting gas well* 4.0x10³ 1.3x10⁻¹
Table 9: Calculated Mass Emission Rate for Methyl Mercaptan

25
Emission Rate (gs-1)
Source Cover Material Characteristics
Area (m2)
Methyl Mercaptan Flux Rate
(Area sources: mgs-1m-
2, Point sources: mgs-1)
Concentration (mg) of Odorous
compound in 1m3 LFG
1 5x10⁻⁵ Flank Temporary Cover 15,600 3.2x10⁻⁶ 10 2 5x10⁻⁵ Flank Temporary Cover 5,200 9.6x10⁻⁶ 30
3 5x10⁻⁵ Restored Surface Grassed 154,000 1.3x10⁻⁷ 10
4 5x10⁻⁵ Daily Cover Daily Cover 5,100 9.8x10⁻⁶ 10
5 6x10⁻⁵ 1 x Open Pipe Open Well-pipe - 6.5x10⁻² 5
Flank Temporary Cover 5,000 6.4x10⁻⁶ 20 6 5x10⁻⁵ Restored
Surface Grassed 108,000 2.6x10⁻⁷ 20
1 x Open Pipe Open Pipework - 1.3x10⁻¹ 10
7 1.5x10⁻⁴ Flank Temporary Cover 5000 3.2x10⁻⁶ 10
Table 10: Combinations of Typical Emission Sources (based on Mercaptans) and the Cumulative Emission Rates
It can be seen from the Table that to achieve the assumed mass emission rate used in the modelling study that the necessary surface areas are not significantly large and are in fact typical of many sites. The inclusion of a single venting gas well can be seen to be very significant, a single well exceeding the assumed mass emission rate. Increasing the concentration of the odorant in LFG increases the odorant mass emission in direct proportion. In reality emissions will be produced by a multiplicity of sources, making it likely that a significant mass emission will be produced, sufficient to create an odour event under suitable conditions.
Empirical Observation
It became apparent during the fieldwork at the sites involved in the study, that two distinct odours could be detected. Further work associated these odours with ‘leachate’ and ‘LFG’ sources. Based on field measurements, an empirical relationship was quantified between the detection of these odours and the measured ambient concentration of methane at nose level:
• Leachate Source – 25ppm CH4 • LFG Source – 50 - 75 ppm CH4
These observed values were both repeatable for the same source on the same site and reproducible for the same type of source on different sites. The demarcation between the odour not being detected and being detected was clear-cut. The deduced numerical values were confirmed by two different investigators, giving validity to the objectivity of the observation. Future action would be to identify the compounds associated with these odours using field equipment.
When undertaking on-site methane emission surveys, methane concentrations near to these limits could be used as a direct indication of the pending onset of detectable on-site odours. The same situation applies equally to boundary and off-site surveys, where the measurement of
methane concentrations near to these levels would indicate the potential for an off-site odour event to arise.
It should be noted that while odorant emissions from grassed restored (clay capped) surfaces are included in Table 10 for illustrative purposes, no odours were detected. Methane emissions were measured but it appears that the odorant compound(s) had been removed, possibly by adsorption onto the humic or clay materials in the soil. Using the empirical observations noted above, no odour was detected at methane concentrations well above 25ppm being emitted from the grassed restored surface. Odours were however detected from ungrassed areas of the same clay capped surface, suggesting that emissions arose from cracks in the clay cap, which may have allowed direct continuity with the underlying wastes.
8.4 Sources Monitored
Sources to be monitored were identified as a result of initial site investigations and during the site boundary and site walkover surveys. The emissions monitoring equipment imposed limitations regarding the areas where monitoring could be satisfactorily and safely undertaken. The flux tent required a relatively even ground surface into which it was possible to trench the tent. Point sources were required to be either covered by the flux tent, such as a leachate well cover at ground level, or that enabled a bag to be placed over the emission source, such as open gas wells pipes.
The sources to be monitored at each site were classified into area and point sources as follows:
• Tipping Area • Daily Cover • Temporary
Capping • Final/Permanent
Capping
• Restored • Flank • Leachate Well • Gas Well • Open Pipe

26
Linear sources, such as a leachate collection trench at the toe of a flank, or open sources such as a leachate holding lagoon were not considered as part of this study, due to the measurement difficulties involved. Measurement of emissions from such sources should be addressed in future studies to determine the significance of these sources.
8.5 Monitoring Programme
Monitoring for odours took place between January 2002 and June 2002. Due to restrictions on site access and safety, on-site monitoring occurred only during site working hours. Where possible or practicable, off-site surveys were conducted around the site and in the vicinity of local sensitive receptors.
Initial site surveys were targeted on those days when conditions were expected to favour odour events occurring i.e. calm, still conditions. However, with the winter and spring of 2002 being both wetter and more windy than expected, the monitoring period was prolonged to attempt to capture such conditions.
9. Air Dispersion Modelling and Results
9.1 Graphical Outputs
Air dispersion modelling requires a number of input variables to be able to generate accurate outputs. The principal inputs are meteorological parameters, topographical data, source emission rates, source definition and estimation of the surface roughness coefficient. All of these factors have an effect on the dispersion of odours derived from landfill sources.
Still, calm or foggy meteorological conditions produce the ideal conditions for off-site odour events to occur i.e. no mixing or dilution of odours and sensitive receptors more likely to experience an odour event. For the purpose of this research the modelling runs were targeted to replicate these ideal meteorological conditions i.e. low wind speeds and from a direction most likely to impact upon known sensitive receptors. ADMS can model a minimum wind speed of 0.75 ms-1, and consequently the ideal meteorological conditions most likely to produce off-site odours could not be modelled. A minimum wind speed of 0.8ms-1 was chosen to simulate the worst-case conditions for an odour event to occur. Lower wind speeds of approximately 0.4 ms-1 or less may result in odour being detected at greater distances off-site than were observed during this study. The limitations of the model prevented this from being assessed.
The terrain data was based on a 20km X 20km grid and the grid spacing used for producing the modelling outputs was a 64 X 64 grid, producing a grid spacing off about 300m. It is now possible to obtain 5km square terrain data, which will enable a smaller grid spacing to be obtained.
The results of the air dispersion modelling runs were plotted using Surfer 8 and standardised so that the source was located in the centre of 6 x 6km grid covering both the site and the surrounding receptors. The modelling grid was the finest possible using the model and represented a 99X99 grid, which produces a grid spacing of 60.6m. The axis labels have been simplified, thereby replacing the ordinance survey standard reference system and the x-y intercept is therefore not necessarily (0,0).
The odour dispersion plume is based upon an ODT of 3 x10⁻⁷ mg m-3, which corresponds to the lowest reported value for methyl mercaptan (Table 1). Other values reported for methyl mercaptan are orders of magnitude greater. The lowest value was adopted to model the greatest spatial extent of an odour plume arising from a source. The next lowest ODT relates to propyl mercaptan with an ODT of 2.5x10⁻⁶ mg m-3 a factor of 10 times higher compared with methyl mercaptan. The ODT values in Table 1 have been either validated or accepted as best estimates by the respective authors of the reports.
As indicated in 8.2.14, l any odorant compound can be used as input data and the odour plume dispersion modelled utilising the appropriate ODT for that compound. The importance of the ODT is that it represents the concentration of an odorant compound that may produce an odour complaint. The specificity of the odour compound becomes important when identifying the odour source e.g. LFG, leachate, or other highly odiferous wastes to enable appropriate design, remediation or mitigation measures to be devised.
For the purposes of this study, to produce a ‘worst case’ scenario, it was assumed that the odorant species was methyl mercaptan, because of its low ODT and potentially ‘high’ concentration in LFG compared with other similar odorant species.
In some instances the plotted odour dispersion plume extends beyond the boundary of the chart, which is particularly obvious at low wind speeds. It should be noted that the charts have been plotted to demonstrate the ‘worst-case’ for an off-site odour event whilst balancing the need for graphical clarity and continuity. As such some of the plots extend beyond the designated boundaries. This enables direct comparison of the plots, demonstrating the magnitude of the effect of conditions that are more turbulent and favourable to mixing and therefore odour dilution.
The concentration contours (or extent of the odour footprint) indicate the extent of the area that could experience that concentration of odorant over the specified time period. It does not mean that all of that area will experience that concentration all of the time or even at the same time. The average time period used in this study for modelling odour was 15 minutes.
During this 15 minute period it is assumed that both the odorant emission rate and the meteorological conditions remain constant. Fluctuations in the meteorological data are taken into account by using statistically derived

27
fluctuations within the sampled meteorological data. ADMS makes use of these data to simulate changes in the meteorological conditions which will affect the dispersion of odour and hence the extent of the odour concentration footprint. The fluctuation periods modelled were, 5, 2, and 1 minutes and 1 second. The fluctuations component enables short-term events such as opening either a leachate or gas well to be modelled, which may result in more intense odour events occurring.
9.2 General Effects
Factors that have a general effect on air dispersion modelling are:
• Odorant emission rate
• Wind speed
• Surface roughness
• Wind direction
• Terrain
• Fluctuations in the meteorological conditions
Odorant Emission Rate
For modelling purposes a fixed odorant emission rate of 5x10⁻⁵ gs-1 was assumed for all modelling runs. The
assumed emission value is considered a modest estimate, that is not a worst-case value, that could apply to many landfills taking putrescible wastes. The emission rate equates to a total flank area of about 15,000m2 with typical levels of cover and an assumed odorant flux rate of 3.2x10⁻⁶ gm-2s-1. Depending on the particular site, the actual emission rate could easily increase many-fold due to the combination of the area of the emission source, the flux rate and the odorant concentration in LFG. Site specific measurements and data are needed to provide a more accurate analysis for a given site.
Wind Speed
The significant effect of wind speed on the dispersion of odour from a source is clearly demonstrated in Figures 10-17. The model run in this instance does not take account of any topographical interactions. It is clearly visible that as wind speed increases, the amount of dispersion also increases. This has the effect of decreasing the area of the footprint that receptors would be exposed to under these conditions. Based on a 3x10-
7mgm-3 ODT, the odour dispersion plume can be seen to extend beyond the limits of the chart e.g. at 1ms-1, the plume extends 10.3km from the source.

28
Figures 10 – 17: Wind speed variation
Site P3; Surface Roughness: 0.3ms-1; Wind Direction: 0o; Emission Rate: 5x10⁻⁵ gs-1.
2
3
4
5
6
11 2 3 4 5 6
2
3
4
5
6
11 2 3 4 5 6
Figure 10: Wind Speed 1ms-1 Figure 11: Wind Speed 1.5ms-1
2
3
4
5
6
11 2 3 4 5 6
2
3
4
5
6
11 2 3 4 5 6
Figure 12: Wind Speed 2ms-1 Figure 13: Wind Speed 2.5ms-1
2
3
4
5
6
11 2 3 4 5 6
2
3
4
5
6
11 2 3 4 5 6
Figure 14: Wind Speed 3ms-1 Figure 15: Wind Speed 4ms-1
NB.: Axis in Km; Footprint represents odour threshold values from literature: ___ 3x10⁻⁷, _ _ 3x10⁻⁷ • Receptors + Source

29
2
3
4
5
6
11 2 3 4 5 6
2
3
4
5
6
11 2 3 4 5 6
Figure 16: Wind Speed 5ms-1 Figure 17: Wind Speed 6ms-1
NB.: Axis in Km; Footprint represents odour threshold values from literature: ___ 3x10⁻⁷, _ _ 3x10⁻⁷ • Receptors + Source
Surface Roughness
Increasing the surface roughness has a similar effect to increasing the wind speed (Figures 18-20). As the roughness increases, turbulence in the atmospheric
boundary layer also increases, leading to dilution of odorous emissions through mixing with the moving air stream. The result is that the odour footprint decreases in size as the surface roughness increases.
Figures 18 – 20: Surface Roughness
Site P3; Wind Speed: 0.8m; Wind Direction: 0o; Emission Rate: 5x10⁻⁵ gs-1.
2
3
4
5
6
11 2 3 4 5 6
2
3
4
5
6
11 2 3 4 5 6
Figure 18: Surface Roughness 0.3m Figure 19: Surface Roughness 0.5m
NB.: Axis in Km; Footprint represents odour threshold values from literature: ___ 3x10⁻⁷, _ _ 3x10⁻⁷ • Receptors + Source

30
2
3
4
5
6
11 2 3 4 5 6
Figure 20: Surface Roughness 1.0m
NB.: Axis in Km; Footprint represents odour threshold values from literature: ___ 3x10⁻⁷, _ _ 3x10⁻⁷ • Receptors + Source
Wind Direction
Modelling the effect of wind direction on dispersion is of little relevance without the inclusion of terrain. Figures 21-26 demonstrate that changing the wind direction will
not cause a greater degree of dispersion to occur, merely that the odour dispersion plume will shift direction accordingly to always be parallel to the direction.
Figures 21 – 26: Wind Direction without Terrain
Site H1; Wind Speed 1.5ms-1; Surface Roughness: 0.5m; Emission Rate: 5x10⁻⁵ gs-1.
1 2 3 4 5 6
6
5
4
3
2
1
1 2 3 4 5 6
6
5
4
3
2
1
Figure 21: Wind Direction 2000 Figure 22: Wind Direction 2100
NB.: Axis in Km; Footprint represents odour threshold values from literature: ___ 3x10⁻⁷, _ _ 3x10⁻⁷ • Receptors + Source

31
1 2 3 4 5 6
6
5
4
3
2
1
1 2 3 4 5 6
6
5
4
3
2
1
Figure 23: Wind Direction 2200 Figure 24: Wind Direction 2300
1 2 3 4 5 6
6
5
4
3
2
1
1 2 3 4 5 6
6
5
4
3
2
1
Figure 25: Wind Direction 2400 Figure 26: Wind Direction 2500
NB.: Axis in Km; Footprint represents odour threshold values from literature: ___ 3x10⁻⁷ • Receptors + Source
Fluctuations
The effect of running the Fluctuations component of ADMS (Figure 27), indicates that for these particular conditions there was little difference between the outputs for fluctuations of between 1 second, 1, 2 and 5 minutes. The 1 and 2 minute fluctuations events are not indicated on Figures 27, as a measure to maintain the simplicity and clarity. The result of modelling the meteorological fluctuations indicates that the 15 minute average underestimates the area of potential odour impact. The 5
minute fluctuation period shown on each Figure indicates that the odour footprint is approximately 500m greater in overall width than scenarios where fluctuations were not taken into account. Modelling a fluctuation of 1 second did not markedly increase the area of the odour footprint. The effect of this will depend on the dispersion of receptors around the site. In an urban area, the odour plume with an increased width will inevitably expose a greater number of receptors to an odour.

32
Figure 27: Fluctuations with Terrain
Site V2; Wind Speed 0.8ms-1; Surface Roughness: 0.5m; Emission Rate: 5x10⁻⁵ gs-1.
1 2 3 4 5 6
1
2
3
4
5
6
Figure 27: Wind Direction 2000
NB.: Axis in Km; Footprint represents odour threshold values from literature: ___ 3x10⁻⁷ • Receptors + Source ____ No Fluctuation _ _ _ 5min Fluctuation …… 1sec Fluctuation
9.3 Location Specific Effects
The inclusion of topographic data within the model and its interaction with wind direction and wind speed has a marked effect on the direction of odour dispersal.
The digital elevation model (DEM) used within the model is shown in Figure 28, with a sample of the resultant outputs demonstrated in Figures 29-34. These Figures represent H1, the hill on a hill scenario, for the 5x10⁻⁵ gs-1 odorant emission rate. Due to the particular
combination of parameters, ADMS required a minimum wind speed of 1.5ms-1 in order to successfully model these conditions. In this instance the hill NW of the site causes the airflow to divert to the SE to the extent that the air mass is diverted almost perpendicular to the primary wind direction (Figure 32). Figures 21-26 and 29-34 are directly comparable as they represent the same meteorological and surface roughness conditions, the only difference being the inclusion of terrain data in the latter set.

33
Figures 28 – 34: Wind Direction and Terrain H1
Site H1; Wind Speed 1.5ms-1; Surface Roughness: 0.5m; Emission Rate: 5x10⁻⁵ gs-1.
5 61 2 3 4
2
3
4
5
6
1
1 2 3 4 5 6
6
5
4
3
2
1
Figure 28: DEM for H1 Figure 29: DEM & Wind Direction 2000
1 2 3 4 5 6
6
5
4
3
2
1
1 2 3 4 5 6
6
5
4
3
2
1
Figure 30: DEM & Wind Direction 2100 Figure 31: DEM & Wind Direction 2200
1 2 3 4 5 6
6
5
4
3
2
1
1 2 3 4 5 6
6
5
4
3
2
1
Figure 32: DEM & Wind Direction 2300 Figure 33: DEM & Wind Direction 2400
NB.: Axis in Km; Footprint represents odour threshold values from literature: ___ 3x10⁻⁷ • Receptors + Source

32
1 2 3 4 5 6
6
5
4
3
2
1
Figure 34: DEM & Wind Direction 2500
NB.: Axis in Km; Footprint represents odour threshold values from literature: ___ 3x10⁻⁷ • Receptors + Source
The hill in a valley scenario V2 produces a comparable set of results. The impact of terrain on the movement of air and the dispersion of odour around V2 is clearly affected by the local terrain. The 5x10⁻⁵ gs-1 odorant emission rate was modelled for a surface roughness of 0.5 with a wind speed of 0.8ms-1 and a varied wind direction. Figures 35 and 39 represent the DEM for V2, with the results shown in Figures 36-38 and 40-42. The latter Figures provide a clearer understanding of the air movement over the locality. Figures 36 and 37 indicate that the air is
channelled through the narrowing of two hills to the E of the site and into the lower ground beyond. Figure 35 indicates that approximately 1km SE of the source there is also a slight low point on the hillcrest. Figure 42 suggests that a NW wind will target directly for this low point and into the valley beyond. The results shown in the Figures may be interpreted as the air mass moving along the path of least resistance, following the line of least change in terrain.
Figures 35 – 42: Wind Direction and Terrain V2
Site V2; Wind Speed 0.8ms-1; Surface Roughness: 0.5m; Emission Rate: 5x10⁻⁵ gs-1.
1 2 3 4 5 6
1
2
3
4
5
6
1 2 3 4 5 6
1
2
3
4
5
6
NB.: Axis in Km; Footprint represents odour threshold values from literature: ___ 3x10⁻⁷ • Receptors + Source

35
Figure 35: DEM for V2 Figure 36: DEM & Wind Direction 2500
1 2 3 4 5 6
1
2
3
4
5
6
1 2 3 4 5 6
1
2
3
4
5
6
Figure 37: DEM & Wind Direction 2600 Figure 38: DEM & Wind Direction 3000
Figure 39: 3D DEM for V2 Figure 40: 3D DEM & Wind Direction 2500
Figure 41: 3D DEM & Wind Direction 2600 Figure 42: 3D DEM & Wind Direction 3000
NB.: Axis in Km; Footprint represents odour threshold values from literature: ___ 3x10⁻⁷ • Receptors + Source
As discussed previously (9.2.3) odour dispersal is also a function of the wind speed. The interaction between the topographical features and wind speed are indicated in Figures 43-48, with the wind direction of 230o, surface roughness of 0.5 and an odorant emission rate of 5x10⁻⁵ gs-1 maintained constant. In the Figures the wind speed varies from 1 to 6 ms-1. For site H1, the particular site characteristics result in almost no odour leaving the site at a wind speed of 1ms-1. As the wind speed increases to
1.5ms-1 (Figure 44), the odour footprint is deflected considerably to almost 90o from the original wind direction. As the wind speed increases further (Figures 45-48) the odour footprint progressively realigns to the original wind direction. Whilst this example is specific to this site, the results are indicative of the complex and diverse interactions between wind speed, direction and the underlying terrain that can arise

36
.
Figures 43 – 48: Wind Speed and Terrain H1
Site H1; Wind Direction 230o; Surface Roughness: 0.5m; Emission Rate: 5x10⁻⁵ gs-1.
Figure 43: DEM & Wind Speed 1.0ms-1 Figure 44: DEM & Wind Speed 1.5ms-1
Figure 45: DEM & Wind Speed 2.0ms-1 Figure 46: DEM & Wind Speed 2.5ms-1
Figure 47: DEM & Wind Speed 4.0ms-1 Figure 48: DEM & Wind Speed 6.0ms-1
NB.: Axis in Km; Footprint represents odour threshold values from literature: ___ 3x10⁻⁷ • Receptors + Source
A duplicate study to H1 was undertaken for site V2 to assess the location specific interaction between wind speed and terrain. The scenarios are a derivative of those defined in 9.2.6. For a particular wind direction, the wind speed was progressively increased from 0.8ms-1 to 6ms-1 (Figures 49-60). The Figures indicate that as the wind
speed is increased from 0.8 ms-1 to 2ms-1, the odour footprint increases in area, reaching an area increasingly distant from the source. However, at a wind speed of approximately 2.5ms-1, the odour footprint reaches its furthest extent and then retreats towards the source as the wind speed continues to increase
.

37
Figures 49 – 60: Wind Direction, Wind Speed and Terrain V2
Site V2; Surface Roughness: 0.5m; Emission Rate: 5x10⁻⁵ gs-1.
Figure 49: DEM, Wind Direction 250o & Wind Speed 1.0ms-1
Figure 50: DEM, Wind Direction 260o & Wind Speed 1.0ms-1
Figure 51: DEM, Wind Direction 300o & Wind Speed 1.0ms-1
Figure 52: DEM, Wind Direction 250o & Wind Speed 1.5ms-1
Figure 53: DEM, Wind Direction 260o & Wind Speed 1.5ms-1
Figure 54: DEM, Wind Direction 300o & Wind Speed 1.5ms-1
NB.: Axis in Km; Footprint represents odour threshold values from literature: ___ 3x10⁻⁷ • Receptors + Source

38
Figure 55: DEM, Wind Direction 250o & Wind Speed 2.0ms-1
Figure 56: DEM, Wind Direction 260o & Wind Speed 2.0ms-1
Figure 57: DEM, Wind Direction 300o & Wind Speed 2.0ms-1
Figure 58: DEM, Wind Direction 250o & Wind Speed 2.5ms-1
Figure 59: DEM, Wind Direction 250o & Wind Speed 4.0ms-1
Figure 60: DEM, Wind Direction 250o & Wind Speed 6.0ms-1
NB.: Axis in Km; Footprint represents odour threshold values from literature: ___ 3x10⁻⁷ • Receptors + Source

39
9.4 Site Specific Interactions
Sites P3, H1 and V2 were chosen to represent three types of topographic location to provide a generic set of data able to be used for landfills with similar terrain. The results presented in 9.3 reflect the general impacts due to the interaction between terrain and wind direction.
For sites P3, H1 and V2, Figures 10, 32, and 49 represent the ‘worst-case’ scenarios to create an off-site odour event i.e. the wind direction and wind speed were manipulated to deliberately target the receptors.
Due to the lack of topographic features within the landscape around site P3, the odour dispersion plume is dominated by the wind direction and not by any topographic effects associated with air mass deflection. Figures 10-17 clearly demonstrate this. Even at low wind speeds there is no apparent deflection of the air caused by a N wind. By running various permutations on and about the site, no abnormal variations could be achieved.
Further confirmation of the importance of terrain is clearly evident when comparing Figures 21-26 and 29-34 for site H1. Site H1 is complex in terms of its geographical position on the crest of a hill that forms the interface between the coastal plain and the inland hills. Under the conditions modelled and shown in the Figures, the site is fortunate not to have receptors in close proximity located in the area affected by the diversion of the SW air mass due to the interaction of terrain and wind direction i.e. to the SE of the site.
At V2 the presence of the ridge to the N of the site prevents the prevailing SW wind creating odours impacts in the populated area just to the N of the ridge. At low wind speeds the air mass is diverted SE down the valley, while at higher wind speeds increased turbulence ensures that by the time the SW air mass reaches the populated area that sufficient dilution has taken place to prevent the ODT being achieved.
9.5 Probability of Odour Events
Risk assessment involves the identification of pathways that link sources and receptors. The modelling work has identified a number of site based odour sources and their subsequent impact on sensitive receptors via airflow across the site. The worst conditions to produce an off-site odour event were modelled i.e. a low wind speed event in the direction of receptors.
However, the worst-case conditions modelled account only for a proportion of the overall meteorological conditions experienced at and around the site. Figures 61 to 63 summarise the annual meteorological data upon which the three generic landfill-type models were based. The wind rose represents the proportion of time that the wind blows from a given direction at a particular wind speed over a period of a year at a fixed location.
In all three instances, the predominant wind direction, as to be expected for the UK, was between a S and W direction, with these directions contributing the strongest wind speeds.

40
Wind Rose - Frequency DistributionP3, 2001
N
S
W E
0.10% of observations were missing.Wind flow is FROM the directions shown.Rings drawn at 5% intervals.Calms included at center.
0.02
2.81 2.15
2.23
3.24
4.57
4.53
5.84
10.54
8.20
6.32 7.58
9.05
11.68
11.25 6.34 3.54
Wind Speed ( Meters Per Second)0.1 1 2 3 4 6
PERCENT OCCURRENCE: Wind Speed ( Meters Per Second) LOWER BOUND OF CATEGORY
DIR 0.1 1 2 3 4 6N
NNENE
ENEE
ESESE
SSE
0.28 0.30 0.19 0.16 0.31 0.33 0.28 0.28
0.73 0.58 0.33 0.50 0.71 0.82 1.21 0.81
0.63 0.52 0.47 0.59 1.30 1.30 1.15 1.29
0.44 0.30 0.41 0.61 0.93 1.04 1.14 1.65
0.43 0.19 0.67 0.88 1.14 0.80 1.26 3.70
0.30 0.26 0.16 0.50 0.18 0.25 0.80 2.81
PERCENT OCCURRENCE: Wind Speed ( Meters Per Second) LOWER BOUND OF CATEGORY
DIR 0.1 1 2 3 4 6S
SSWSW
WSWW
WNWNW
NNW
0.26 0.20 0.31 0.17 0.25 0.30 0.18 0.20
0.93 0.81 0.71 0.90 0.85 1.07 1.40 0.75
0.89 1.05 1.09 0.96 1.33 1.87 1.51 1.05
1.63 1.18 1.15 1.27 1.64 1.75 1.68 0.75
2.90 1.58 2.05 1.89 3.07 3.48 1.04 0.55
1.58 1.49 2.28 3.86 4.53 2.78 0.52 0.24
TOTAL OBS = 8784 MISSING OBS = 9 CALM OBS = 2 PERCENT CALM = 0.02
Figure 61: Annual Wind Rose, Site P3, 2001.

41
Wind Rose - Frequency DistributionV2, 1997
N
S
W E
1.10% of observations were missing.Wind flow is FROM the directions shown.Rings drawn at 5% intervals.Calms included at center.
3.01
5.82 4.45
5.76
10.08
6.61
1.52
1.07
2.84
9.78
17.02
11.50
5.27
4.68
2.64
2.41
4.43
Wind Speed ( Meters Per Second)0.1 1 2 3 4 6
PERCENT OCCURRENCE: Wind Speed ( Meters Per Second) LOWER BOUND OF CATEGORY
DIR 0.1 1 2 3 4 6N
NNENE
ENEE
ESESE
SSE
1.23 0.73 0.43 1.02 1.21 0.47 0.19 0.30
0.68 0.34 0.22 0.94 1.11 0.14 0.13 0.26
1.52 0.88 0.75 1.93 1.53 0.39 0.33 0.98
1.13 1.11 1.10 1.85 1.47 0.42 0.23 0.68
0.86 1.11 1.96 2.67 1.00 0.10 0.16 0.53
0.40 0.29 1.30 1.68 0.29 0.00 0.03 0.09
PERCENT OCCURRENCE: Wind Speed ( Meters Per Second) LOWER BOUND OF CATEGORY
DIR 0.1 1 2 3 4 6S
SSWSW
WSWW
WNWNW
NNW
2.12 2.71 0.89 0.50 0.56 0.47 0.45 0.46
1.53 1.90 0.97 0.51 0.29 0.25 0.16 0.48
2.26 3.95 2.01 1.12 0.78 0.45 0.62 1.12
1.75 3.50 2.12 1.19 0.71 0.43 0.35 1.07
1.66 3.17 2.98 1.05 1.20 0.51 0.43 0.99
0.47 1.79 2.52 0.90 1.15 0.53 0.40 0.31
TOTAL OBS = 8760 MISSING OBS = 96 CALM OBS = 264 PERCENT CALM = 3.01
Figure 62: Annual Wind Rose, Site V2, 1997

42
Wind Rose - Frequency DistributionH1, 1999
N
S
W E
0.39% of observations were missing.Wind flow is FROM the directions shown.Rings drawn at 5% intervals.Calms included at center.
7.63
6.03
3.25
4.21
2.96
3.50
1.15
2.10
3.34
8.28
6.00 10.22
10.92
11.67
8.78 4.99
4.63
Wind Speed ( Meters Per Second)0.1 1 2 3 4 6
PERCENT OCCURRENCE: Wind Speed ( Meters Per Second) LOWER BOUND OF CATEGORY
DIR 0.1 1 2 3 4 6N
NNENE
ENEE
ESESE
SSE
1.74 0.58 0.59 0.23 0.48 0.16 0.29 0.33
0.30 0.11 0.22 0.13 0.25 0.11 0.19 0.27
0.83 0.32 0.55 0.47 0.68 0.18 0.40 0.59
0.97 0.62 0.67 0.63 0.66 0.34 0.34 0.89
1.37 0.99 1.34 0.86 0.99 0.27 0.54 0.84
0.82 0.63 0.84 0.65 0.43 0.08 0.34 0.41
PERCENT OCCURRENCE: Wind Speed ( Meters Per Second) LOWER BOUND OF CATEGORY
DIR 0.1 1 2 3 4 6S
SSWSW
WSWW
WNWNW
NNW
0.42 0.25 0.45 0.48 1.27 0.92 1.50 1.90
0.34 0.31 0.26 0.45 0.55 0.30 0.32 0.37
0.98 0.59 0.80 1.16 1.43 0.98 0.70 0.68
1.48 0.82 1.04 1.68 1.93 1.60 0.83 0.51
2.73 1.46 3.45 3.78 3.64 2.45 1.26 0.59
2.32 2.57 4.22 3.38 2.85 2.52 0.39 0.58
TOTAL OBS = 8760 MISSING OBS = 34 CALM OBS = 668 PERCENT CALM = 7.63
Figure 63: Annual Wind Rose, Site H1, 1999

43
The occurrence of an off-site odour event is primarily a function of the number and location of sources coupled with a significant emission rate. Without a source, an odour event will not arise from landfill activities.
Event specific parameters such as wind speed and wind direction impact the effectiveness of the pathway between the source and the receptor. An odour event will impact receptors only if suitable conditions exist. If the direction of the wind is not towards receptors, or if the wind speed is either too great or too little, there will be no impact upon the receptors. It is not possible to define what these conditions are in a generic manner, as each site will have different characteristics.
The distance between source and receptor is a crucial factor. So too is the terrain within which the site is located. The characteristics of a site located on an estuarine or coastal plain have been shown to be considerably different from a site located on a hill or within a valley. It is however possible to undertake a broad assessment of the probability of an odour event to occur based upon evaluation of the meteorological data (Appendix 4).
Figures 61 to 63 include a tabular presentation of the proportion of hourly average wind events that occur for specific wind directions and speeds. Using this data it is possible to predict the time occurrence of meteorological conditions that will impact upon receptors.
For example, the only receptors surrounding site P3 are located between approximately 155o and 205o (SSE to SSW) of the site (Figure 10). As such, a wind from between 25o and 335o clockwise (NNE to NNW) would not target any of the receptors. Including calm days, where wind speeds are less than 0.1 ms-1, wind between NNE and NNW accounts for 91.5% of the year.
For the remaining 8.5% of the year, the wind direction will be towards the receptors but will not necessarily cause an odour event to be experienced. Figure 15 suggests that a wind of 4ms-1 from 25o would not impact a receptor. Figure 17 shows that a northerly wind of 6ms-
1 will be close to a receptor but will not actually cause exposure to odour. A wind from the NNW would, however, potentially have an impact on the same receptor. The result of this is that the proportion of the overall of time that wind speed and direction favour an odour event decreases to 7.5% of the year.
Results from the odour questionnaire suggest that odour events occur largely between early morning and late evening i.e. between 0600 and 2200, spanning the normal operation time of the site. Outside of these hours, most receptors are likely to be asleep, a less receptive state than when awake. On a pro-rata basis, this further decreases the proportion of the year for which favourable meteorological conditions exist to 5.3%.
Of the 5.3% of the year when wind conditions favour odour events, an odour source is also required to be present. It may be that no activities are present on site during these favourable wind conditions resulting in no off-site odour events occurring. Realistically, a site is likely to have a number of fugitive emissions that occur during all favourable wind events, the result of which would be odour events occurring up to a maximum of 5.3% of the year, or once every 20 days on average.
Applying the same approach to site H1 and V2, the results obtained are shown in Table 11.
Table 11: Cumulative Effect of Combined Controlling Factors on Percentage Exposure to Odours
Site Controlling Factor
P3 (%) H1(%) V2 (%)
Wind Direction 8.5 58.3 55.9
Wind Speed 7.5
37.7
50.6
Receptor Availability
5.3
26.7
35.8

44
Rain has a scrubbing effect on odours, further reducing the 5.3% proportion the year that odour may have an impact on receptors. From the meteorological data it was not possible to quantify the proportion of favourable wind events that combine with rain scrubbing. Other antecedent conditions will also impact emission rates from landfill surfaces. These include periods of ground freezing or following prolonged periods of rainfall.
The above analysis assumes that the receptor location is fixed i.e. a residential property, school etc. If however the occupant of a residence walked around the site perimeter, for example walking a dog, they would be likely to experience odours a larger proportion of the time than predicted by the above analysis.
While the previous sections have detailed the probability of favourable meteorological conditions which can produce odour events, it should be the aim of all site operators to at least minimise, or at best remove, all odour sources.
9.6 Summary and Conclusions
Modelling outputs are only as accurate as the defined parameters, the input data and the complexity and technical veracity of the mathematical model. The more accurate the model and the input data, the more accurate the results and for this reason, ADMS 3.1 was selected.
The modelling clearly indicated that those parameters which increase atmospheric mixing are crucial in the dispersion of off-site odours. Wind speed and surface roughness both effect dispersion. At some sites a critical wind speed could be determined which limited the maximum extent of odour dispersion. At site V2 this was approximately 2.5ms-1 while at H1, there is no such critical wind speed, with the extent of odour dispersion decreasing as the wind speed increased.
An understanding of the local and regional topographic features and their influence upon the regional wind flow patterns enables an understanding of site specific characteristics to be determined. This is clearly demonstrated at Site H1 where the odour dispersion footprint is diverted through 90o from the original wind direction. No single factor evaluated had a dominant control on the dispersion of odours from a site.
While terrain and wind direction affect the direction of the odour dispersion plume, wind speed and surface roughness affect the spatial extent of dispersion by influencing the mixing of odour releases with the air mass flowing over the site. In addition to these interactions, there also exists a relationship between terrain and wind speed. Figures 4 to 7 show how the wind speed increases over crests and through valleys whilst decreasing over shallow gradients, influencing mixing and leading to subsequent interactions with surface roughness.
A constant odorant mass emission rate of 5x10⁻⁵ gs-1 was modelled throughout the different scenarios. This
emission rate is a conservative estimate compared with the mass emission that could emanate from the sites included within this study. The 5x10⁻⁵ gs-1 emission rate is equivalent to a cell flank of 160m2 covered with temporary cover material, a concentration of methyl mercaptan of 1 mg m-3 in LFG and an odorant flux rate of 3.2x10⁻⁴ mgm-2s-1. As the total mass emission rate from the site was modelled and not the number of sources, there are numerous permutations that could produce the same emission rate, examples of which are provided in Table 10.
Determining a representative odorant mass emission rate to a high degree of accuracy is both difficult and inappropriate due to the heterogeneous nature of landfill surfaces. In view of the variation in emission rates and reported ODT values, it is perhaps more appropriate to report and compare results based on their order of magnitude.
As shown in Figures 10 to 12 and others, the odour footprint can extend a considerable distance from the source, in some cases up to 10km. The question therefore arises as to why odour complaints are not reported at this distance from landfill sites. A number of possible answers could be responsible.
Firstly, human perception of odour is not homogeneous within a population. Even if a population had a sense of smell that was normally distributed, 2% of the population would have an acutely poor sense and would be able to detect significantly less than others. As such, not all of the population exposed may detect, let alone recognise the odour.
Secondly, the assumed ODT of 3x10⁻⁷mgm-3 used for methyl mercaptan may be too low, leading to an increase in the lateral extent of the odour footprint. The AIHA study reports the next detection threshold ODT for methyl mercaptan as being 103 higher i.e. 10-4mgm-3. Despite this reported difference in values, the ODT of 3x10⁻⁷mgm-3 has been awarded an A-rating based on the olfactory measurement methodology. Work undertaken by AEA also supports an ODT of between 10-6 to 10-
7mgm-3.
Figures 7 to 10 show the effect of assuming an ODT of 3x10⁻⁶mgm-3. As expected the extent of the odour footprint at this higher ODT is considerably less than for the ODT i.e. the odour plume extends approximately 2km from the source compared to 10km for an ODT of 3x10-
7mgm-3.
Thirdly, there may be an odour concentration level that complainants regard as a nuisance rather than offensive or obnoxious and therefore do not complain. This is supported by the results of the odour questionnaire. There is also the possibility that other off-site odour sources may intervene and dominate the landfill-derived odour.
Section 9.5 details the probability of conditions favouring odour events, based on average hourly meteorological

45
data. The probability defines the maximum likelihood of a static receptor experiencing odour events. Note that the probability of an event could be applied in many different ways. For example, a probability of 5.3% may apply equally across each individual day i.e. a total of 60 minutes exposure to an odour event occurring each day of the year, or two 30 minute exposure periods each day etc., or a two hour event every second day or part thereof etc.
10. Management System Tool
10.1 Introduction
A key objective of this study was to produce a management tool for landfill designers and site managers to assist them with site selection, design and odour reduction and management.
The design and operational management of landfill sites is controlled and regulated by various legislative and regulatory instruments (see Section 2). A number of landfill design and operational good practice codes exist, within which key design and operational aspects are identified that should be applied to landfill activities. The recognition of these key factors highlighted in the guidance is to ensure the protection of the environment and human health and includes amenity aspects such as litter, dust and odour control.
While the key factors relevant to odour reduction and control may already be known, the relative importance or impact of these factors on reducing odour emissions and assisting odour control has not been prioritised.
10.2 Odour Control Guidance
Waste Management Papers 26B and 27 identify the guidelines and practice that needs to be considered and addressed in the design and operation of a landfill facility. The regulatory requirements to be considered at the design stage and the need for a risk assessment of the potential for odours to be produced by the proposed landfill development will help minimise odour production and the potential for off-site odour events to occur.
In addition to design and operational factors, the guidance identifies the need to include associated factors such as the recording of weather and climate data and emphasises the need for routine monitoring and the recording of any odour complaints. Appendix 1 gives further details of the regulatory guidance on odour
The guidance adopts an holistic approach to minimising odour impacts. Beginning with the initial site design/site selection stage, an assessment of the potential impacts follows and continues through to the operational stages of waste reception and placement, installation of the gas management system and the capping and restoration of completed sites. At all stages appropriate techniques and practices can be adopted to minimise and control odorous emissions.
A summary of the above guidance can be expressed in the form of a simple risk assessment matrix. The matrix identifies the key contributory factors, with ranking of the factors based on a qualitative assessment. Table 12 below outlines an odour risk assessment for sites with increasing levels of risk.
10.3 IPPC, BAT and Odour
The implementation of the IPPC Directive and its application to the landfill sector in the UK with the enactment of the PPC Act 1998 and the ensuing PPC Regulations, brings increased requirements for the permitting of a landfill. Under IPPC a number of aspects additional to those covered previously under the Waste Management Licensing regime are regulated, including noise, vibration, energy use and odours. Additionally the concept of BAT (Best Available Techniques) applied to landfill activities requires measures to be taken to prevent, or where not practicable, to reduce emissions to air and water.
The Guidance Document S5.02 for the Landfill Sector provides an indication of those aspects requiring compliance with BAT. S2.3.9 deals specifically with odour, while S2.3.3, S2.3.7 and S2.3.8 deal with odours indirectly via landfill gas, point source and fugitive emissions to air.
The key aspects of the IPPC guidance relate to:
• Types of, location and characteristics of sensitive receptors
• Characterisation of odorous substances deposited/disposed and generated
• Types of odour release sources
• Structured odour management plan covering: o Prevention o Control o Monitoring o Emergency actions o Communication arrangements
A summary of potential odour control techniques that can be used to assist demonstrating compliance with BAT is presented in Table 13. The list is not meant to be exhaustive but identifies a range of options to help prevent and control odours produced by landfill activities. Activities likely to produce odour begins with delivery of waste to site, compaction and placement, covering, capping and restoration and pollution control systems.

46
Table 12: Odour Risk Assessment Matrix
Risk Assessment Factors Risk Level
Terrain & Location Weather Waste Types Site Operations Leachate Management
HIG
H
• Site located up gradient of or raised above sensitive receptors
• Substantial residential development within close proximity of the disposal area
• Sensitive receptors e.g. schools, hospitals, OAP homes, recreational, say 250m
• Receptors downwind of site
• Interaction of wind direction and terrain impacting on receptors
• High rainfall.
• Inputs of highly odorous wastes such as sewage sludge/ screenings, food/animal wastes, paint/chemical wastes, solvents etc.
• Delivery of odorous wastes by open vehicle
• Wastes likely to react with leachate e.g. sulphate-based wastes etc.
• Large working areas. • Large exposed flanks with poor cover. • Multiple emission sources combine to
create an additive effect • Poor levels of daily cover • Open leachate chambers • No/poor gas abstraction system • Capping programme out of sequence with
installation of gas management infrastructure
• Frequent excavations into waste
• Spray recirculation of leachate. • Uncovered storage of young
odorous leachates. • Discharge of odorous
leachates to sewer through residential areas.
• Leachate methane stripping exhaust vented to air.
MO
DE
RA
TE
• Receptors located in a valley or depression adjacent to a site
• Some sensitive receptors or residential development within say 500m of the site
• Other development present within 1km
• Receptors mainly upwind of the site
• No significant interactions between wind direction and terrain
• Moderate rainfall
• Domestic and occasional inputs of specific odorous wastes indicated above
• Reduced size of working area. • Limited areas of exposed flanks. • Moderate cell depth/ surface area. • Other odour sources nearby. • Adequate daily cover • Limited numbers of open leachate
chambers • Gas abstraction system installed • Capping programme in line with extension
of gas system
• Storage of mature leachate • Covered storage tanks with
filtered venting • Methane stripping exhaust
vented through bio-filter
LO
W
• Flat terrain • Surrounding woodlands and
hedges • Few residential receptors
within say 1000m
• All receptors upwind of the site
• No wind/terrain interactions
• Low rainfall
• Largely inert wastes • Limited quantities of
commercial and industrial wastes
• Small working area. • Very limited areas of cell flanks • Good levels of temporary and daily cover • Gas well spacing based on field
measurements of collection effectiveness • Leachate wells under abstraction • Several adjacent odour sources.
• No storage of leachates

47
Table 13: Odour Control: Design and Operational Management Options
Control Aspect Control Mechanism Applications Comments
Site location Locate site remote from receptors
• All sites likely to accept putrescible or odorous wastes
• Identified at the initial site selection stage of project development • Practically, site selection will need to balance a variety of competing factors
Waste delivery routing
Route delivery vehicles to avoid residential and other sensitive receptors
• Delivery route arranged to minimise contact with receptors
• Ensure vehicles properly sheeted/covered, especially if carrying odorous wastes
• Avoid delivery of highly odorous wastes when wind directions adverse
• Determined at the site selection or planning application stage • Reduces extent of exposure of receptors to the odour source • Limits the magnitude of the odour source term • Odour impact dependent on wind direction, so avoid deliveries when wind directions
likely to impact large numbers of receptors
Stored putrescible wastes
Putrescible wastes delivered from transfer stations/Bank Holiday periods
• Wastes bulked up or stored over weekends, especially during summer for delivery to site
• Full containers/skips left on site over weekends etc.
• Commencement of waste degradation before disposal produces offensive odours during delivery to site
• Degraded wastes are more odorous than usual and special handling required during disposal
Prohibition of specific wastes
Prohibit highly odorous wastes streams unless suitably pre-treated to reduce odour
• Wastes with highly offensive odours e.g. seafood, animal by products etc.
• Wastes that may subsequently react to produce offensive odours e.g. sulphate bearing
• Wastes with odours that cannot be contained by sheeting/covering
• Reduces highly odorous sources • Minimises odour exposure during delivery • Highly effective if pre-treatment used
Placement and Compaction.
Reduction of odour emission surface area and reduced waste porosity
• Working face/area • Cell flanks
• Normal good operational practice. • Increased waste density and daily cover reduces the odour emission rate • Simple to achieve
Waste cover Reduces emission rate via waste surface and increases opportunity for bio-filtering action
• Adequate depth of daily cover over all operational areas
• Depth of cover maintained over time on temporary ‘capped’ areas
• Type of daily/temporary cover material important
• Thickness of cover correlates with reduced odour emissions • Sandy and clay cover soils not as effective as loamy-type soils, due to difficulties of
placement • Ability to place and retain cover thickness over time important e.g. rain wash,
placement on cell flanks, movement etc.
Size of operational cells.
Water balance approach to prevent imbalance between odorous acetogenic leachates and establishment of methanogenic conditions
• Whole site. • Essential part of site operational plan
• Reduced production of odorous gases at source. • To be used concomitantly with phased capping and installation of gas control
infrastructure • Good practice
Odorous waste disposal
Disposal of odorous wastes in poor (wind) dispersal conditions.
• Select disposal area remote from sensitive receptors
• Deep trench and cover immediately with non-odorous wastes
• Can be used when adverse wind directions apply if the exposure time is limited • Relatively simple to apply • Effective • Low cost. • Requires careful management.

48
Control Aspect Control Mechanism Applications Comments
Excavation into previously deposited wastes.
Undertaken only when wind direction suitable and for the minimum exposure time for excavated wastes
• Installation/repair of landfill gas and leachate infrastructure
• Difficult to prevent significant short-term odour releases from decomposed wastes and landfill gas
• Requires careful pre-planning and management
Site housekeeping. Avoid odours from deposits of litter picking/road sweepings
• All site areas. • Primarily for aesthetic purposes but creates improved perception of operations • Minimal effect on odour emissions • Simple. • Low cost
Reduced extent of active working area
Reduces odour emission source area.
• Tipping area. • Minimisation of a prime odour source. • Reduced requirement for daily cover • Simple in theory but requires careful management • Difficult to achieve on sites with a wide range of inputs requiring separate disposal
areas Limit extent of uncapped areas on non-operational parts of the site.
Reduces available area for uncontrolled gas emissions.
• All areas with intermediate or temporary cover, particularly cell flanks.
• Essential to coordinate with installation of gas control infrastructure • Very effective in reducing LFG emissions • Necessary for the control of site water balance • Requires careful planning to obtain materials when needed
Limiting slope of and extent of cell flanks.
Flank area and slope both reduced to allow adequate placement of cover materials
• Essential to reduce the extent of a key odour source
• Retro fit difficult to apply • Planned at Working Plan stage
• Important to plan cell operation and phasing to ensure maximum flank slope of 1: 3 with short length and width
• Adequate cover thickness necessary to cope with movement of flank with waste settlement
• Necessary to maintain adequate levels of cover over time Odorant counteractants
Use of odour masking, neutralising or suppressant agents
• Active working area • Site boundary adjacent to receptors • Specific odorous site activities e.g. leachate
storage tanks or aeration lagoons
• Effectiveness not guaranteed • Spray can produce odour complaints • Public concern over the use of sprays potentially masking the presence of harmful
compounds Landfill gas control Abstraction of landfill gas
and the destruction of odorous and potentially harmful trace compounds present in landfill gas
• Installation of gas abstraction wells and collection pipework infrastructure
• Destruction of methane and trace compounds via gas flare or use as a fuel in a gas engine powered generator set
• Applicable to all sites producing landfill gas • Operation of the control system is required to ensure adequate environmental
performance, rather than meeting solely the commercial needs of any generation plant
• Gas collection system requires routine balancing to ensure adequate performance across the site
Leachate management
Whole site, operational areas and pollution treatment area.
• Landfill design requirement for collection systems
• Leachate chambers should be sealed and under abstraction for gas
• Leachate stored for treatment stored in closed tanks
• Aeration lagoons located away from receptors
• Acetogenic leachates are highly odorous and must be properly managed to avoid acting as an odour source
• Good working practice to cover chambers and place under abstraction • Storage of leachate prior to removal off-site may require chemical dosing to maintain
oxygen levels • Storage tanks require venting during filling and exhaust gas should be passed via a
bio-filter • Aeration of leachate in lagoons can release absorbed odorant gases, producing an
intermittent odour release

49
Control Aspect Control Mechanism Applications Comments
Pollution control equipment maintenance
All sites with pollution control plant and equipment
• Gas flare, engine exhaust, storage tank vents, lagoon aerators etc.
• Maintaining sealing of gas/leachate boreholes seals as the landfill settles
• Maintaining integrity of any onsite pipework due to settlement of damage by site plant
• Electrical/mechanical items require regular and routine maintenance and calibration to operate efficiently
• Odour emission checks on gas flares and engine exhausts should be undertaken on a regular basis
• Monitoring for fugitive emissions from defective valves and seals, blocked pipework reducing abstraction efficiency etc. all part of routine maintenance
Engineered capping layer
Surface containment of completed cells to keep out water and keep in odorous gases
• Areas of the site filled to final level • Achieves a significant reduction in a potential emission source • Capping must be installed to high standard to prevent cracking of the clay cap or
defects in synthetic capping material allowing emission of landfill gas • If gas control or leachate recirculation pipework is installed beneath the capping
layer, remedial works must ensure the continuing integrity of the re-installed cap Restoration soils Filtration of any gases
passing through a soil supporting active plant growth will be attenuated by chemical/biological means
• Necessary on all sites with an engineered clay capping layer to prevent damage to the cap
• Soil medium above any cracks/damage to the capping layer which may allow odorous gases to exit will help to attenuate odour compounds
Odour monitoring All sites and all areas of the site, including any odour controls and pollution control infrastructure
• Site and boundary walk around • Use of FID to identify potential emission
sources • Identified odour emission sources rectified • Use of specialist equipment to measure
odorous gas concentrations
• Good practice to continually monitor and measure the performance of odour control methods
• Use of equipment to quantify odour release rates/odour type useful for identifying possible sources
• Simple to undertake and raises awareness of issues • Consultation and liaison with public e.g. via Liaison Committee, is a useful means of
assessing odour impacts and helping to deal with (possibly) unforeseen odour release sources
Site Diary Record of site activities • All site activities noted on daily basis • To include sub-contractor activities
• Record of all site activities, routine and non-routine that can subsequently be used to determine if any specific activity lead to an odour complaint
• Include all sub-contractor activities involved in potential odour-release activities e.g. installation of gas wells and pipework, modifications to leachate wells, gas system monitoring, placement of final capping layer etc.
Weather station Record of local meteorological data
• Site specific wind speed and direction, rainfall and pressure data
• Provides the ability to assess what weather conditions prevailed at the time of an odour complaint
• Provides data for helping to benchmark future air dispersion modelling studies • Can be used to provide data to assist with atmospheric pressure effects on gas
emissions studies etc. Communications Consultation with site
operatives and the Public • All site operatives and contractors • Local residents
• Raises awareness amongst site operatives of the potential impact of their activities • Routine and regular liaison with the public to learn of their concerns e.g. Site Liaison
committee • A site Open Day would be one means of engaging the public and raising their
awareness of the operational constraints facing landfill operators

50
10.4 Mitigation Options -- General
The items listed in 10.2 –10.3 above can be categorised into pre-operational and operational stages. The following considerations should be taken into account and assessed at each stage of the proposed landfill development and planning process:
Development and initial design stage:
• initial site selection and location of potential receptors
• interactions between terrain and wind direction and potential effects on receptors
• site layout, landform profile and phasing of filling and capping to determine the potential to create emission sources and their proximity to receptors
• location of gas management plant e.g. gas flares and gas engine exhausts to take account of potential odour impacts
Planning and environmental impact assessment stage:
• formal environmental impact assessment of the selected landfill design and the proposed method of working and phasing
• effect of proposed landfill operations to be assessed for the potential impact on receptors e.g. size of working area, area of exposed flanks, capping sequence and timings etc.
• air dispersion modelling and environmental risk assessment of odour impacts to confirm design basis
Operational stage
• use of acknowledged good operational practices that reduce site smells and odour impacts
• account taken during landfilling operations of the effects of weather conditions on odour impacts
• routine monitoring activity to include factual and interpretative data and reports on odours
Development and Initial Design Stage
The selection of the proposed development site will have the greatest impact on the potential to create odour events at receptors. For example, selection of a site with no receptors within a say 1km, is likely to lead to fewer, if any, complaints compared to a site with numerous receptors within several hundred metres.
The chances of identifying such an ideal site are likely to be small. Realistically receptors will be much closer to potential development sites and it is therefore important
that due account is taken of the interactions between terrain and wind direction and the proximity of potential receptors.
The landform profile, its height and the phasing sequence of the filling programme needs to be taken into account, to minimise the effects of wind movement over the landfill producing enhanced emission rates from odour sources e.g. the aerofoil effect creating low pressures over landfill surfaces, enhancing the emission of LFG and odorant compounds through the porous surface.
The location of pollution prevention and treatment infrastructure, such as landfill gas flares and leachate lagoons and holding tanks and their construction and planned operation are also key issues to consider at the design stage. Combustion plumes from flares or exhausts may not be as offensive as raw landfill gas but an odour may still be produced that is deemed objectionable by a receptor. Interactions with the landform, terrain and structures on site will all impact on the odour footprint.
Planning and Environmental Impact Assessment Stage
The preliminary work undertaken at the site selection and initial design stage should produce a site location and a landfill facility with minimal potential to create significant odour impacts. The need for the facility as required under planning, may dictate the preferred location of potential sites. However, planning aspects do not necessarily take account of air dispersion impacts and a balance may need to be struck between the various planning considerations of visual, traffic, proximity to ecological sites etc. and the potential for odour impacts.
The final design can be refined as the formal environmental impact assessment process is applied and the detail of potential odour impacts is assessed. Changes to the phasing sequence and the capping programme can be assessed to minimise their impacts on odour emissions. For example, LFG freely-venting over a large area and dispersing with no odour impact can be focussed to become a high mass emission rate line or point odour source, by the placement of a low permeability cap. Subsequent delays installing the planned gas control system in that area can lead to increased emissions creating an odour event.
The operational aspects of the timing of capping and the installation of gas management infrastructure outlined above are important practical considerations and can have significant short-term adverse effects on odour emissions. The effect of changes to the programmed sequence should be assessed to determine the magnitude of potential odour impacts on receptors.
It is at this stage that the final air dispersion modelling of the proposed development can be undertaken to assess the cumulative effects of landfill operations, gas flare and

51
engine exhausts, phasing and capping programmes and location of pollution control infrastructure.
The extent to which measures are taken to prevent, minimise or mitigate potential odour impacts will be determined in accordance with BAT. While every endeavour should be made to reduce odour impacts, the cost implications of such measures are also a material consideration when determining the final design.
Operational Stage
The use of acknowledged and accepted good operational practices that help prevent and reduce site smells and odour impacts is an essential aspect of any odour control programme. Practices and techniques that can assist with odour control are listed in Table 13.
Any site activity likely to produce odours should take account of the effects of weather conditions i.e. wind speed and wind direction, producing an odour impact on sensitive receptors.
A site weather station recording appropriate meteorological data will provide reference data to determine whether an odour complaint is likely to relate to the site.
Keeping a comprehensive site diary at all times, recording all site activities irrespective of whether or not there is an apparent impact on odour production, will provide the site operator with information to determine which site activity might have been the cause of a reported odour event.
An effective odour-control monitoring programme should involve routine monitoring activities, which will include factual and interpretative data, reports on odour emissions, odour measurements, additional air dispersion modelling studies etc.
Attention should be paid to all odour complaints, to identify the source of the odour emission and remedial actions implemented as appropriate. A public communications programme, including establishing a Site Liaison committee, should be maintained to ensure that a suitable forum for public comments is made available.
A site Open Day may be considered as one mechanism to promote greater openness between the site and the public and to raise public awareness of the varied range of activities that take place on an operational landfill site.
The application of BAT is also applicable to the Operations stage and the combination of technology and techniques to reduce odour effects will also be metered by the cost implications. Expenditure of money on inappropriate measures does not serve any useful purpose and careful examination of the cause of the problem and identification of the best solution, or approach, to be adopted should be undertaken.
10.5 Mitigation Options – Specific
Drawing on the general options referred to above in Section 10.4, specific recommendations for minimising odour releases during site operations are listed in Table 14. The recommendations are based on the findings of the modelling study and general landfill site experience. Whilst odour control involves a combination of approaches and no single technique is sufficient, these options are considered to have the greatest significance on reducing odour emissions.
External factors such as the site location, location of receptors and the surrounding terrain are all extremely important but cannot be altered for existing operational sites. There are a limited number of mitigation options which can be applied to existing sites, such as increasing the roughness of the adjacent terrain by planting tree bands or by forming earth bunds or placing fences in strategic locations.

52
10.6 Mitigation Options -- General
The items listed in 10.2 –10.3 above can be categorised into pre-operational and operational stages. The following considerations should be taken into account and assessed at each stage of the proposed landfill development and planning process:
Development and initial design stage:
• initial site selection and location of potential receptors
• interactions between terrain and wind direction and potential effects on receptors
• site layout, landform profile and phasing of filling and capping to determine the potential to create emission sources and their proximity to receptors
• location of gas management plant e.g. gas flares and gas engine exhausts to take account of potential odour impacts
Planning and environmental impact assessment stage:
• formal environmental impact assessment of the selected landfill design and the proposed method of working and phasing
• effect of proposed landfill operations to be assessed for the potential impact on receptors e.g. size of working area, area of exposed flanks, capping sequence and timings etc.
• air dispersion modelling and environmental risk assessment of odour impacts to confirm design basis
Operational stage
• use of acknowledged good operational practices that reduce site smells and odour impacts
• account taken during landfilling operations of the effects of weather conditions on odour impacts
• routine monitoring activity to include factual and interpretative data and reports on odours
Development and Initial Design Stage
The selection of the proposed development site will have the greatest impact on the potential to create odour events at receptors. For example, selection of a site with no receptors within a say 1km, is likely to lead to fewer, if any, complaints compared to a site with numerous receptors within several hundred metres.
The chances of identifying such an ideal site are likely to be small. Realistically receptors will be much closer to potential development sites and it is therefore important that due account is taken of the interactions between
terrain and wind direction and the proximity of potential receptors.
The landform profile, its height and the phasing sequence of the filling programme needs to be taken into account, to minimise the effects of wind movement over the landfill producing enhanced emission rates from odour sources e.g. the aerofoil effect creating low pressures over landfill surfaces, enhancing the emission of LFG and odorant compounds through the porous surface.
The location of pollution prevention and treatment infrastructure, such as landfill gas flares and leachate lagoons and holding tanks and their construction and planned operation are also key issues to consider at the design stage. Combustion plumes from flares or exhausts may not be as offensive as raw landfill gas but an odour may still be produced that is deemed objectionable by a receptor. Interactions with the landform, terrain and structures on site will all impact on the odour footprint.
Planning and Environmental Impact Assessment Stage
The preliminary work undertaken at the site selection and initial design stage should produce a site location and a landfill facility with minimal potential to create significant odour impacts. The need for the facility as required under planning, may dictate the preferred location of potential sites. However, planning aspects do not necessarily take account of air dispersion impacts and a balance may need to be struck between the various planning considerations of visual, traffic, proximity to ecological sites etc. and the potential for odour impacts.
The final design can be refined as the formal environmental impact assessment process is applied and the detail of potential odour impacts is assessed. Changes to the phasing sequence and the capping programme can be assessed to minimise their impacts on odour emissions. For example, LFG freely-venting over a large area and dispersing with no odour impact can be focussed to become a high mass emission rate line or point odour source, by the placement of a low permeability cap. Subsequent delays installing the planned gas control system in that area can lead to increased emissions creating an odour event.
The operational aspects of the timing of capping and the installation of gas management infrastructure outlined above are important practical considerations and can have significant short-term adverse effects on odour emissions. The effect of changes to the programmed sequence should be assessed to determine the magnitude of potential odour impacts on receptors.
It is at this stage that the final air dispersion modelling of the proposed development can be undertaken to assess the cumulative effects of landfill operations, gas flare and engine exhausts, phasing and capping programmes and location of pollution control infrastructure.

53
The extent to which measures are taken to prevent, minimise or mitigate potential odour impacts will be determined in accordance with BAT. While every endeavour should be made to reduce odour impacts, the cost implications of such measures are also a material consideration when determining the final design.
Operational Stage
The use of acknowledged and accepted good operational practices that help prevent and reduce site smells and odour impacts is an essential aspect of any odour control programme. Practices and techniques that can assist with odour control are listed in Table 13.
Any site activity likely to produce odours should take account of the effects of weather conditions i.e. wind speed and wind direction, producing an odour impact on sensitive receptors.
A site weather station recording appropriate meteorological data will provide reference data to determine whether an odour complaint is likely to relate to the site.
Keeping a comprehensive site diary at all times, recording all site activities irrespective of whether or not there is an apparent impact on odour production, will provide the site operator with information to determine which site activity might have been the cause of a reported odour event.
An effective odour-control monitoring programme should involve routine monitoring activities, which will include factual and interpretative data, reports on odour emissions, odour measurements, additional air dispersion modelling studies etc.
Attention should be paid to all odour complaints, to identify the source of the odour emission and remedial actions implemented as appropriate. A public communications programme, including establishing a Site Liaison committee, should be maintained to ensure that a suitable forum for public comments is made available.
A site Open Day may be considered as one mechanism to promote greater openness between the site and the public and to raise public awareness of the varied range of activities that take place on an operational landfill site.
The application of BAT is also applicable to the Operations stage and the combination of technology and techniques to reduce odour effects will also be metered by the cost implications. Expenditure of money on inappropriate measures does not serve any useful purpose and careful examination of the cause of the problem and identification of the best solution, or approach, to be adopted should be undertaken.
10.7 Mitigation Options – Specific
Drawing on the general options referred to above in Section 10.4, specific recommendations for minimising odour releases during site operations are listed in Table 14. The recommendations are based on the findings of the modelling study and general landfill site experience. Whilst odour control involves a combination of approaches and no single technique is sufficient, these options are considered to have the greatest significance on reducing odour emissions.
External factors such as the site location, location of receptors and the surrounding terrain are all extremely important but cannot be altered for existing operational sites. There are a limited number of mitigation options which can be applied to existing sites, such as increasing the roughness of the adjacent terrain by planting tree bands or by forming earth bunds or placing fences in strategic locations.

54
Table 14: Specific Operational Options to Reduce Odour Impacts
Number Option Effect Comments
1 Minimise uncapped operational area
Reduces the area available for odour emissions
Odorant emission rates are greatest for surfaces in operational areas
2 Minimise uncapped final level areas
Reduces the area available for odour emissions
Odorant emission rates are greater for surfaces without a low permeability cap
3 Minimise size of flanks Reduces the area available for odour emissions
Flanks have a high emission rate factor and can represent a large surface area
4 Minimise slope of flanks to <1:3
Improved daily cover and compaction
Steep slopes cannot be properly compacted and covered with adequate depths of soil, enabling an easy pathway for LFG emissions.
5 Alter waste deliver route and improve transport method
Reduces a potential source of odour complaints prior to disposal at site
Transport of odorous wastes to site in an inappropriate manner can sensitise receptors along the route before placement on site.
6 Cease taking certain highly odorous wastes
Removes the source of odour
The apparent financial value of some waste streams should be judged against the longer-term amenity issues involved with odour complaints.
7
Place all leachate chambers, wells etc. under active gas abstraction
Removes odour source Well and chamber covers do not form gas-tight seals and odours will escape. Abstraction under low pressures will provide a positive means of capturing odorous compounds and enable disposal by a safe route i.e. flaring or engine fuel.
8
Increased density of gas abstraction wells
Increased chance of reducing fugitive LFG emissions
Inter-well spacing determines the collection efficiency of a gas well system, ensuring that the waste mass between gas wells is a under negative pressure at all times.
9
Determine the effective capture area of gas wells
Measure the effectiveness of the LFG well collection system
Individual gas wells will have specific capture volumes, dependent on well depth and diameter, well pipe perforation size and extent, waste type, waste density, leachate levels, abstraction pressure, collection pipework size etc.
10
Monitor the effectiveness of gas abstraction wells and the abstraction system
Ensures the continued performance of the gas management system
The effectiveness of a gas collection system varies with time and requires routine monitoring of key parameters to confirm its continued collection efficiency.
11 Ensure gas engine exhausts are vertical and as high as feasible
Ensures adequate dispersion
Combusted LFG can still produce odorous compounds and maximum dispersion is achieved by increasing the exhaust height and orientation
12
Use only shrouded gas flares
Ensures effective destruction of odorous compounds
Similar comments as engine exhausts on dispersion and important to achieve adequate odour destruction by maintaining time and temperature.
13
Ensure gas is adequately dewatered before entering the gas flare
Prevents dispersal of an odorous substance
Leachate condensate contains dissolved odorous compounds, which if passed through the flare will release the odorous compounds without necessarily achieving the destruction temperature.
14 Locate gas engines and gas flares away from receptors
Removes a source of odour Location remote from potential receptors removes a potential odour source.
15 Leachate storage vessels to be fully contained
Contains an odour source Young, acidic leachates contain odorous VFAs, which require full containment to prevent odour release.
16 Dosing of leachate stored for long periods
Removes an odour source Leachates required to be stored should be dosed with hydrogen peroxide to prevent anoxic conditions and reduce odours.
17
Dosing of leachate if discharged to sewer without pre-treatment
Removes an odour source As with storage of young leachates, disposal to sewer without pre-treatment is likely to lead to the release of dissolved odorous compounds within the sewer and escape enroute via manhole covers and vent pipes etc.
18 Siting of leachate aeration lagoons
Removes an odour source As with the siting of gas engine plants
19
Undertake known highly odorous activities according to wind direction (when possible)
Prevents an odour impact on sensitive receptors
Unavoidable odorous site activities should only be undertaken when appropriate weather conditions prevail e.g. wind direction away from receptors and wind speed high, to promote mixing and dilution.

55
10.8 Further Work
Suggestions for further work build on the results of the study and encompass a number of different aspects.
The establishment of a database of emission rates for various types of landfill surface and other emission sources, including leachate aeration lagoons, leachate surface drains etc. would provide quantitative data to identify the significance of emission sources, enabling the prioritisation of resources
Identification and direct measurement of odorous compound concentrations in the field is now possible using portable equipment. Determination of the specific odorant at a location combined with emission rate data would provide source term data to enable accurate air dispersion modelling. Based on the ODT for the odorant the likely extent of odour events could be more accurately evaluated. Knowledge of the specific odorant would assist with the selection of odour suppressant or masking sprays.
The effect of landform design and phasing on the potential for off-site odour events should be modelled and assessed, to help prevent odour events by designing out specific landform and phasing arrangements that could lead to off-site odours
Establishing the effectiveness of gas management systems by simple direct measurement would identify under-performing areas of the gas control system that would benefit from the application of appropriate remedial measures. Areas that would benefit particularly from such testing are cell wall flanks, areas known to be a source of high odorant emission rates
11. Conclusions
11.1 Study Background
The management of landfill odours is an increasingly significant aspect of landfill operations and management that is of concern to both the public and regulatory authorities and waste management companies. Concerns relate to both loss of amenity and the potential for health impacts
Recent odour related studies carried out under the Landfill Tax Credit Scheme have focussed on examining odour creation, odour sampling and measurement, identifying odour constituents and developing cost effective means of monitoring odorous constituent by chemical finger printing.
To identify and assess management techniques for controlling odour risk at potential receptors, a study was initiated comprising the comparison of historic complaints and site operations records; the field measurement of methane emission rates (as a proxy for odorous emissions) from landfill sources; collecting data on public perceptions of odour; and extensive air dispersion modelling using the data gained from the preceding tasks
The objective of the study was to produce guidance on odour control for site managers by identifying the key parameters associated with odour and prioritising the effectiveness of existing odour control techniques and practices. Six landfill sites with different waste inputs and geographic locations within England were selected for the study
11.2 Odour, Measurement and Complaints Data
The perception of odour and its measurement is a complex issue, due to variations in human olfactory acuity. While taking account of both qualitative and quantitative factors, the commonly used method of odour measurement based on OU is time consuming and costly. An alternative approach is adopted based on measuring the concentration of the odorant compound at the ODT.
A benefit of the chemical concentration approach is that it allows a wide range of sensitivities to be modelled, both in terms of source term emission rates, emission source areas and the concentration of the odorant in the source LFG or leachate.
A key aspect of investigating odour complaints is to obtain suitable data from receptors, to enable the differentiation between real and perceived odour events and to identify whether there were other contributory sources to the odour event
The finding that the public do not always report odour events suggests that odour may be a long term chronic problem with an acceptable persistent low level of odour and higher levels of odour leading to complaints
11.3 Landfill Odour Sources and Measurement of Emissions
All aspects of landfill -- from the delivery of waste, the type of waste and its placement, the installation of pollution control infrastructure for LFG and leachate management and restoration excavation, through to the operation of pollution control plant, especially LFG flares and gas engines – are potential sources of odour.
The maintenance of both accurate site activity records and detailed complaints records needs to be improved, to enable these records to be of value when investigating odour complaints.
Each site should maintain a weather station logging wind speed, wind direction, precipitation and relative humidity to provide site specific metereological data for the investigation of odour complaints or air dispersion modelling studies.
Measurement of odour emission rates can be undertaken indirectly, using methane as the measured parameter and relating the odorant emission rate to its composition in LFG. This approach is useful for sensitivity studies to model air dispersion scenarios.

56
Direct measurement of odorant emission rates at a specific site is recommended and should be used wherever practicable for accurate estimation.
The field measurement data for methane emissions was in accordance with other reported data and confirmed the suitability of the measurement methods used. The emissions values determined for the different landfill surfaces showed the potentially significant impact arising from uncapped surfaces, especially cell wall flanks.
11.4 Air Dispersion Modelling
The movement of an air mass across a surface will capture odour emissions arising from the surface and disperse the odour across the surrounding terrain with the air mass. The modelling of air dispersion can be undertaken to take account of both micro and macro-scale topography and terrain effects, as required for odour dispersion from landfill sites.
The effect of surface roughness and wind speed on dispersion can be deduced, with increases in both factors reducing the size of the downwind odour footprint. The adjacent terrain has a significant effect on odour dispersion from a site.
The interaction of terrain and wind direction can produce significant changes in the odour dispersion of a site, leading to specific impacts due to the site location. Use of air dispersion modelling at the site selection stage can reduce the subsequent potential for odour impacts.
Dispersion modelling can be applied equally to emissions from areal, line and point sources, providing a management tool to help assess the impact of changes in
the location of significant emission sources such as LFG flares, power generation plant and the effect of changes to the phasing of site filling operations.
11.5 Management Options
Considerable guidance exists on managing landfill operations to minimise odour events. Based on the results of the air dispersion studies, the impact of emission source can be identified and then prioritised, to ensure that appropriate prevention/minimisation/mitigation/remedial measures are applied
Mitigation measures to limit the extent of the off-site odour footprint are based on two key aspects, reducing the odour emission rate and reducing the extent/size of the emission source. In practice this can be achieved in a number of different ways, such as; by increasing the depth of cover material; and/or changing the type of cover material on landfill surfaces; abstracting odorous compounds by connecting all chambers and wells to the active gas management system; capping open areas with a low permeability layer; introducing features that increase the surface roughness of the terrain such as bunds, hedges and solid fences to promote the dilution of odorous air flows
Constant awareness of the implications of poor site practices leading to the creation of odour events is needed to ensure that such actions do not lead to problems e.g. open excavations in waste left for long periods; deposited waste left uncovered; large areas of uncapped waste with only daily cover, especially flanks; uncapped newly installed gas wells; uncovered leachate chambers etc.

57
12. References
AEA Technology, 1994, Odour Measurement and Control – An Update. (Eds. Woodfield, M and Hall D)
AEA Technology, 1997, Guidance on the Emissions from Different Types of Landfill Gas Flares, AEA Technology, Report No. CWM 142/96A
AEA, 1994, A Report on Investigations of the Sources of Odour Near Blue Circle Industries Westbury Site, AEA Technology, Report No. AEA/CS/18325045/013, 1994
American, Industrial Hygiene Association, 1997, Odour Thresholds for Chemicals with Established Occupational Health Standards’, AIHA Press, ISBN 0-932627-34-X
Bond, P, Sellwood, D and Roberts, D, 2000, Monitoring Methane Emissions from Landfill Covers, Waste 2000, Warwick
Environment Agency, IPPC General Guidance on Odour
Environment Agency, 2001, IPPC S5.02, Guidance for the Landfill Sector Version 3a
Environment Agency, 2001a, Interim Technical Guidance for Best Practice Flaring of Landfill Gas, September 2001
Environment Agency, 2001c, Technical Guidance on the management of Landfill Gas
Environment Agency, 2002, R&D Project (Proposal No 1E(02)20)
Environment Agency, August 1999, Library of Licence Conditions and Working Plan Specifications – Vol. 1: Waste Management Licences, Edition 2, 2 August 1999
Environment Agency, July 2001, Internal Guidance for the Regulation of Odour at Waste Management Facilities under Waste Management Licensing Regulations, Version 2.3, Draft for External Consultation,
Environment Agency, Scottish Environmental Protection Agency, NI Service for the Environment and Heritage, Odour assessment and Control - Guidance for regulators and industry
Eventure Ltd.: Research at University of Hull into odour creation and dispersal around landfills
LFG Literature References:
AEA Technology, 1996, The Composition and Environmental Impact of Household Waste Derived Landfill Gas, Second Report, CWM 041/88
AEA Technology, 1997, Guidance on the Emissions from Different Types of Landfill Gas Flares, AEA Technology, Report No. CWM 142/96A
AEA, 1994, A Report on Investigations of the Sources of Odour Near Blue Circle Industries Westbury Site, AEA Technology, Report No. AEA/CS/18325045/013, 1994
Allen, M.A., Braithwaite, A. and Hills, C.C, 1997, Trace Organic Compounds in Landfill Gas at Seven UK Waste Disposal Sites, , Environmental Science & Technology, (1997) 31,pp 1054-61.
Allen, M.R., Braithwaite, A. and Hills, C.C, 1996, Analysis of the trace volatile organic compounds in landfill gas using automated thermal desorption gas chromatography-mass spectrophotometry, Intern. J. Environ. Anal. Chem.,1996, 62, pp 43-52.
Assmuth, T. and Kalevi, K, 1992, Concentrations and Toxicological Significance of trace Organic Compounds in Municipal Solid Waste Landfill Gas, Chemosphere, 1992, 24, pp 1207-1216.
Baldwin, G. and Scott, P.E, 1991, Investigations into Performance of landfill gas flaring systems in the UK, Proceedings Sardinia 91, 3rd International Landfill Symposium.
Bridges, O. and Bridges, J.W, Comparisons of Risks from Landfill and Incinerators of Municipal Solid Waste, University of Surrey.
Brookes, B.I. And Young, P.J, 1983, The development of sampling and gas chromatography~mass spectrophotometry analytical procedures to identify and determine the minor organic components of landfill gas, Talanta (1983) 30: 665-676.
Brosseau, J, and Heitz, M, 1994, Trace gas compound emissions from municipal landfill sanitary sites, Atmospheric Environment,1994, 28, pp 285-293.
Cernushi, S. and Giuiano, M, 1989, Assessment techniques for landfill gas emission and dispersion, Sardinia 89, 2nd International Landfill Symposium.

58
Crouch, E.A.C., Green, L.C. and Zemba, S.G, 1990, Estimation of Risk from landfill gas emissions, GRCDA 11th International Symposium on Landfill Gas, Lincolnshire, Illinois, 1990
Eklund, B. et al, 1998, Characterisation of Landfill Gas Composition at the Fresh Kills municipal solid waste landfill,. Environmental Science & Technology, 1998, 32, pp 2233-2237.
ENTEC, 1997, Investigation into odour problems at Nant-y-Gwyddon Landfill, South East Wales. Final Report to the Environment Agency Welsh Region SE Area Environmental Protection. Report No.97194
ENTEC, 1999, Investigations into Odour Problems at Trecatti Landfill, South East Wales: Final Report
ENTEC , 2000, Investigations into Odour Problems at Nant-y-Gywddon Landfill, South East Wales: Final Report
ETSU, Research and Development of Landfill Gas Abstraction and Utilisation Equipment ~ Condensate Analysis and Equipment Corrosion: Volume 3 ~ Site Descriptions and Results, ETSU B/LF/00150/REP/3
Goldberg, M.S. et al, 1993, Incidence of Cancer among Persons Living near a Municipal Solid Waste Landfill Site in Montreal, Quebec, Archive of Environmental Health, Nov / Dec (1993), 50,pp 416-424.
Hoather, H.A. and Wright, P.A, 1989, Landfill gas: site licensing and risk assessment, Proc. Dept. Energy Int. Conf. On Landfill Gas and Anaerobic Digestion of Solid Waste, Chester, UK. Oct 88.
Klemans, W. et al, 1995, Cytogenetic biomonitoring of a population of children allegedly exposed to environmental pollutants. Phase 2: Results of a three year longitudinal study, Mutation Research (1995) 342: 147-156.
Lakhanisky, T. et al, 1993, Cytogenetic monitoring of a village population potentially exposed to a low level of environmental pollutants. Phase 1: SCE analysis, Mutation Research (1993) 319, pp 317-323.
Loizidou, M. and Kapetanios, E.G, 1992, Study on the gaseous Emissions from a landfill, The
Science of the Total Environment, 127, pp 201-210.
Colin MacDonald C, 1994, A Report on the Investigations of the Sources of odour Near Blue Circle Industries' Westbury Site, August 1994.
Peterson, T.N, Human Health Risk Assessment of Landfill Gas Emissions. Peterson, T.N.
Rettenberger G. and Stegmann, 1991, Trace Elements in Landfill Gas, Sardinia 91 3rd International Landfill Symposium
Schweigfofler, M. and Niessner, R, 1999, Determination of siloxanes and VOC in landfill gas and sewage gas by canister sampling and GC~MS / AES analysis, Environ. Sci. Technol., 1999, 33, pp 3680-3685.
Waste Management Paper 26, HMSO, 199?
Young, J.P. and Parker, A, 1980, Waste Management and Research, 1980, The Identification and Possible Environmental Impact of Trace Gases and Vapours in Landfill Gas, Young, J.P. and Parker, A, pp 213-226.
Young, P.J. and Heasman, L.A, 199?, An assessment of the odour and toxicity of the trace components of landfill gas, GRCDA 8th International Symposium on Landfill Gas, San Antonio, Texas.
TG Trust Ltd. 2000A: Analysis of Neighbourliness of Landfill Operations
TG Trust Ltd. 2001B: Evaluation of sampling/measurement methods for trace gas constituents at concentrations experienced in odour episodes and preparation of guidance manual
TG Trust Ltd. 2001C: Research most efficient, reliable and cost effective methods of monitoring landfill odours in ambient air - to ascertain best methods for chemically fingerprinting gaseous emissions from landfill sites
TG Trust Ltd. 2001D: Research the characteristics of odour contributing constituents in landfill leachate development of pre-treatment and full treatment methods for reducing odour
TG Trust Ltd. 2001E: Guidance Manual for Landfill Managers on the Assessment and Control of Landfill Odours.

1 Appendix 1: Regulatory Guidance on Odour and Odour Control
1.1.1 The key guidance document for landfill construction and operations is Waste Management Papers 26B (Landfill Design, Construction and Operational Practice) Volumes 1 and 2. Waste Management Paper 27 is presently being revised and should be issued later in 2002. Interestingly the (current) 1991 version does not have any references to odours, focussing more on monitoring and control gas measures. This suggests that at that time odours associated with landfill gas were not deemed to be a major issue.
1.1.2 Within Waste Management Papers 26B the following references relate directly/indirectly to the production of odours and their environmental impact and to ways of providing and maintaining satisfactory odour control:
WMP Section Comments
No. 26B
Vol. 1
Landfill Design, Construction and Operational Practice
Part 2: Principles & Approach to Landfill Design
3.27-3.34
Risk Assessment
Identifies the source-pathway-receptor concept for investigating a quantifiable impact arising from landfilling. Primary focus on water pollution and landfill gas migration (engineered containment) with reference to noise, dust, litter and visual impacts. No specific reference to odours.
3.35-3.55
Design Objectives
Specifies as a key objective environmental protection, determined and evaluated by the risk assessment stage above.
3.46 Table 3.3 identifies the interrelationship between design and operations for some operational aspects. Gas control referred to.
6.64-6.78
Landfill Gas Management
Section 6.64 refers to one of the primary objectives of a landfill gas management system being ‘to minimise …beyond the perimeter of the site ..that the risk of ….. odours…..are eliminated as far as possible’.
Part 3: Landfill Operation
8.19
The Site Manual
Stipulates that the Site Manual should include inter alia,,
‘environmental monitoring data including factual and interpretative data and reports for …. odours ….’.
8.22-8.26
Weather and
8.23 identifies the effect of winds on the efficiency of landfill operations, including ‘‘prevailing winds and seasonality taken into account when designing the sequence and

Climate Data direction of tipping so as to minimise the detrimental effects of odour … on local communities’
8.24 requires that ‘the wind pattern be taken into account when locating gas vents and combustion exhausts to avoid exposure of local residents to emissions and potential odours.’
8.25 suggests that the installation of a simple weather station be considered.
8.54-8.57
Statutory Nuisance
8.54 states that local authorities are obliged inspect their areas for nuisance under the Environmental Protection Act 1990 (Part III, s79) and to investigate odour complaints.
8.55-8.56 allows the local authority to serve an Abatement Notice to the operator, of which failure to comply with is an offence.
8.57 allows any aggrieved individual to lodge a complaint with the Magistrates Court. If the Court believes that a Statutory nuisance exists or is likely to be a recurring event, it can also issue an Abatement Notice and levy a fine.
No. 26B
Vol. 2
Part 3: Landfill Operation
9.93-9.96
Odours
9.93 identifies sources of offensive odours, which includes the wastes disposed, leachate and leachate treatment systems odour counteractants and landfill gas.
9.94 states that good landfill practices will greatly reduce general site smells and reduce impact form odours that could lead to complaints. Good practice includes:
• Adequate compaction
• Speedy disposal and burial of malodorous wastes
• Effective use of appropriate types of daily cover
• Progressive capping and restoration
• Effective landfill gas management
• Effective leachate management
• Use of covered trenches for liquid waste disposal
• Rapid burial of excavated waste
• Consideration of prevailing wind direction when planning leachate treatment plants, gas flares and direction of tipping
9.95 suggests that odour counteractants may themselves be an offensive odour source
9.96 acknowledges that the quantification of the environmental impact of odours is difficult and that odour

control should be incorporated into performance monitoring systems by maintaining complaints records and actions taken in response.
9.159-9.161
Problems arising from landfill gas
9.159 categorises potential problems arising from landfill gas and includes both risks to human health and odour.
9.162-9.163
Trace components in landfill gas
9.162 refers to the presence of trace components in landfill gas that are responsible for unpleasant odours and that some may represent a health hazard. Odours from landfill gas differ to those from leachate, which has higher concentrations of carboxylic acids than landfill gas.
9.163 indicates that dilution in the air above the site is significant and most compounds present at significant concentrations at source are usually diluted to below the toxicity threshold.
9.164
Landfill gas odours
9.164 states that odours can cause considerable nuisance as insufficient dilution to below the odour threshold may not occur under some weather conditions.
9.168
Objective of landfill gas management systems
9.168 states that one of the objectives of a gas management system is to prevent unacceptable risk to human health, detriment to the environment or nuisance.
10.2-10.3
Objectives of the capping system
10.2 refers to one objective of the capping system as being to prevent uncontrolled escape of landfill gas.
1.1.3 The practices and techniques referred to in 26B are all good examples of measures that would minimise the release of odours. Judging by the recent rise in the level of odour complaints relating to landfill operations it is fair to assume that either the application of these practices and techniques is not being rigorously applied and/or the effectiveness of the measures is less than expected.
1.1.4 IPPC guidance on odour for the landfill sector is contained in IPPC S5.02. The guidance outlines the indicative requirements likely to be needed to comply with the application of BAT in terms of odour. S2.3.9 deals specifically with odour, while S2.3.3, 2.3.7 and 2.3.8 deal with odour indirectly via landfill gas, point source and fugitive emissions to air.

2 Appendix 2: Odours and BAT
2.1.1 The Environment Agency have issued Technical Guidance Note IPPC S5.02 Guidance for the Landfill Sector, Technical requirements if the Landfill Directive and Integrated Pollution Protection and Control.
2.1.2 Specific reference to odour is contained in section 2.3.9, a copy of which is presented below for information.

Technical Guidance Note
IPPC S5.02
Guidance for the Landfill SectorTechnical requirements of the Landfill Directive andIntegrated Pollution Prevention and Control (IPPC)

INTRODUCTION TECHNIQUES EMISSIONS IMPACTManagement Materials
inputsActivities/abatement
Groundwater Waste Energy Accidents Noise Monitoring Closure Installation
issues
44 Version 3a, November 2001 Landfill
Odour 2.3.9 Odour
The objectives of PPC and LFD are complementary with respect of odour and can be summarised asbeing to prevent harm in the form of offence to man’s senses, or annoyance.
Odour is typically associated with trace components in landfill gas, the handling of odorous wastes andinadequate emplacement and covering of biodegradable wastes. Given the fugitive nature of odouremissions, emphasis should be given to preventative measures relating to landfill gas management(see section 2.3.3) and waste acceptance and emplacement (see sections 2.2.1 and 2.3.6).
Describe the main activities generating odour and/or sources ofodour, the location of the nearest odour-sensitive receptors,describe any relevant environmental surveys which have beenundertaken and the techniques for controlling odorousemissions.
With the Application, the Operator should provide:
1. Information relating to sensitive receptors• Type of receptor, location relative to the odour sources and, where undertaken, describe
the findings of any assessment of the impact of odorous emissions on the receptors.• Details of any routine monitoring undertaken to assess odour exposure of receptors• An overview of any complaints received, what they relate to (source or particular
operation) and remedial action taken.• A description or copy of any conditions or limits put in place by any regulatory authority
which relate to the receptors (e.g. relating boundary fence or beyond)
2. A description of the types of odorous substances deposited/disposed of and generated(intentional and fugitive (unintentional));
- wastes have to be treated before landfill, which in turn should limit wastes which areinherently odorous.
- the description s hould make the distinction between wastes which are inherently odorouswhere the impact is likely to be more immediate and those wastes which may give rise toodour because of microbiological action in the landfill (organic or inorganic).
3. A description of the point, linear or area sources of release.
4. A structured odour management plan including:• Control measures to prevent or control odour.• A demonstration/justification that there will not be an odour problem from the emissions under
normal conditions.• A description or copy of any conditions or limits put in place by any regulatory authority which
relate to the prevention of minimisation of odour.• Identification of the actions to be taken in the event of abnormal events or conditions which
might lead to odour, or potential odour problems.• An understanding of the impact in the event of abnormal events or conditions, for example the
failure of a landfill gas flare. This may require modelling the dispersion of odours under suchcircumstances.
• Monitoring undertaken.• Communication with for example local residents if an odour problem arises or is likely to
arise.
Indicative BAT Requirements
1. Measures will be taken to minimise nuisances and hazards arising from the landfill throughemissions of odours.
2. Where a landfill operation has a low environmental impact with respect to odour (for example byvirtue of its remoteness from sensitive receptors), the Operator may seek to justify in accordancewith BAT criteria (see section 1.1), deviation from measures stated in this section.
Cont.
BAT for thecontrol ofodourLandfillDirective Article9(c), 12 (b)Annex I (5)
Application FormQuestion 2.3 (cont.)

INTRODUCTION TECHNIQUES EMISSIONS IMPACTManagement Materials
inputsActivities/abatement
Groundwater Waste Energy Accidents Noise Monitoring Closure Installation
issues
IPPC Version 3a, November 2001 45
Odour3. In order to reduce the release of odorous compounds and their impact at sensitive receptors, the
minimisation of odour should be considered in relation to:- the types of wastes;- site layout;- engineering aspects of the operation;- management procedures;- and the day-to-day operational practices.
4. A regular odour impact assessment should be undertaken. The impact assessment should covera range of reasonably foreseeable odour generation and receptor exposure scenarios and theeffect of different mitigation options. Assessment should include point sources (for example ventsand flares) as well as linear or area sources (tipping faces, cracks in the cap etc.).
Odour control techniques – good practice
The following landfill-specific techniques should be used to prevent of minimise odorous releases fromthe site. Odour control is not a once-off activity and requires a constant re-evaluation of controltechniques and this should form part of the odour management plan.
5. Waste Acceptance• materials which promote the generation of gases should be excluded. For example,
wastes with a high sulphate or sulphide content should be excluded.• co-ordination between the gatehouse and operators at the tipping face should take place
where known odorous wastes are to be deposited.• excavation of waste or removal of cover during for example the installation of gas wells, or
for other operational needs, may give rise to odours,
6. Covering of wastes.• Tipping areas should be kept as small as possible to minimise the effects of wind.• Waste must be covered as soon as possible.• On areas of intermediate capping, the degree of capping should be sufficient to prevent
the possible release of odours. After the initial tipping and compacting it is likely that theodours will tend to become more characteristic of anaerobic degradation/landfill gas. Thisphase should coincide with an increase in gas abstraction capacity (see section 2.3.3)
7. Landfill Gas management• Certain odorous trace compounds in landfill gas have low odour thresholds. These
include organo-sulphur compounds, cyclic compounds, aromatic hydrocarbons, esters andcarboxylic acids, which derive from microbial interactions.
• An effective landfill gas management plan (see Section 2.3.3) in conjunction with goodoperational practice (i.e. not leaving odorous waste uncovered) will significantly preventsuch releases. Providing full containment of the waste, including temporary and/or phasedcapping of the site, in addition to incorporating an active landfill gas control system areessential gas control measures. Point source emissions such as those from landfill gasflares should be considered in the selection and assessment of the control system.
• Landfill gas control systems are not expected to generate significant point sourceemissions if well constructed, operated and maintained.
• Passive venting during the early operational stages may give rise to odours and activeextraction systems should be installed to minimise the release of uncontrolled landfill gasemissions. The passive venting time period should be minimised.
8. Leachate management• Odour from a leachate treatment plant should, in most cases, be manageable to prevent
offensive odours beyond the boundary of the site. An enclosed treatment operation isdesirable where the proximity of the operation to receptors is likely to cause nuisance.
• Leachate sumps/wells should be are effectively sealed (retaining access for monitoringand maintenance) or extracted to abatement equipment.

INTRODUCTION TECHNIQUES EMISSIONS IMPACTManagement Materials
inputsActivities/abatement
Groundwater Waste Energy Accidents Noise Monitoring Closure Installation
issues
46 Version 3a, November 2001 Landfill
9. Monitoring• Standard
- Recording or gathering of weather conditions, for example atmospheric pressure andstability (inversions), rainfall, wind speed and direction and air temperature.
- Checks on gas abstraction rates, integrity of pipe-work and other relevant infrastructures,filters, adequacy of capping etc should form part of monitoring or periodic inspection bytrained persons
• Reactive- Olfactory “sniff testing” at the boundary or at some location which is representative of
sensitive receptors.- Collection and analysis of air samples to identify odour sources.
Main technical guidance• Odour Assessment and Control – Guidance for Regulators and Industry (see Reference 30).• Interim Guidance on the Flaring of Landfill Gas (see Reference 29);• Guidance on the Management of Landfill Gas (see Reference (see Reference 19);• IPPC General Guidance on Odour (see Reference 31).

3 Appendix 3: Properties of Selected Mercaptans and Hydrogen Sulphide
3.1.1 Properties of four mercaptans with low ODT and considered to have the most offensive odorous are shown in Table A2 below. Hydrogen sulphide is also included due both to its offensive smell and its ubiquitous presence in LFG.
3.1.2 The relationship between increasing MW and increasing BP follows the increased level of carbon bonding in the compounds.
3.1.3 As the MW of the mercaptans increases the Pv and solubility in water both decrease, suggesting that methyl mercaptan is likely to be the most available form of mercaptan
3.1.4 The high aqueous solubility of methyl mercaptan and hydrogen sulphide indicates that significant quantities of both could dissolve in any aqueous phase, such as water vapour or leachate and be available to come out of solution at some later time, such as during aeration in an open lagoon or movement through a public sewer.

Table A2: Physical Properties of Four Selected Mercaptans and Hydrogen Sulphide
Odour Threshold Values (mg m-3)) Compound Chemical Formula
Odour Character
MW BP
(0C)
Density
(g/ml)
Solubility
(ppmw @ 25 0C)
Pv
(mm Hg @ 250C)
AEA Reported Range
AIHA Reported Range
Methyl Mercaptan
CH4S Rotten cabbage
48
6 0.87 23300
1516 6 x 10⁻⁵ -1.6
3 x 10⁻⁷ - 6 x 10⁻²
Ethyl Mercaptan
C2H6S Rotten cabbage
62 35 0.84
527 527
2.5 x 10⁻⁴ – 0.2
6.6 x 10⁻⁴ – 10-3
Propyl Mercaptan
C3H8S Not reported
76 57 0.81
N/a 155
2.5 x 10⁻⁶ – 1.4 x 10⁻⁴
n/a
Butyl Mercaptan
C4H10S Skunk 90 98 0.84
55 55
n/a 2.7 x 10⁻³ - 3.7 x 10⁻³
Hydrogen Sulphide
H2S Rotten eggs
34 -60 1.5
4000 N/a
10-4 -2.8
1.6 x 10-3 x 7 x 10-2
N/a = not available

4 Appendix 4: Calculations and Conversions
4.1 Flux Rates
4.1.1 Flux rates were calculated as a function of the rate of change in concentration within a containment device. The concentration of landfill gas contained within the device was regularly monitored according to the protocol set out in Appendix 4. The data collected included the following:
• Fill time (s) for the containment device
• The change in ppm over the time period
• Basal area (m2) of the flux device
• Containment volume (m3) of the flux device
• Atmospheric pressure (mb) at the start of the day
• Atmospheric pressure (mb) at the end of the day
4.1.2 Two constants are required to complete the calculations. These are the molecular weight (MW) of methane (CH4), 16, and the volume occupied by of one mole of a gas at a specific temperature and pressure. The molar volume at 0oC is 22.4 litres per mole at standard temperature and pressure. This is adjusted within the calculations to take into account both temperature and pressure differences.
4.1.3 The raw data collected required manipulation into an emission rate of gs-1 and an effluent flux velocity (Efflux) in ms-1 for input into ADMS.
Equation Parameter Temp Adjustment Pressure Adjustment Concentration change of CH4 gm-3 Emission Rate CH4 gm-2s-1 Fixed Volume Sources Emission Rate CH4 gm-2s-1 Variable Volume Sources Volume of LFG emitted (m3s-1m-2) Emission Rate of Odorous Compound from fixed volume
source (gm-2s-1) Emission Rate of Odorous Compound from variable volume
source (gm-2s-1)
4.1.4 The results of the data manipulation are found in Table 1 were transformed into a usable format using the following calculations.
4.2 Temperature and Pressure Corrections
4.2.1 Temperature and pressure corrections are required in order to take account of the conditions during monitoring, the molar volume of 22.4 litres is based on standard temperature and pressure conditions.

4.2.2 Temperature Correction =
Equation :
Temperature Correction = 273 + ToC 273
4.2.3 Pressure Correction =
Equation : Temperature Correction = 1013 Observed pressure
4.3 Change in CH4 gm-3
4.3.1 Calculation of the emission rate of methane form the surface of a landfill requires the
For a fixed containment volume measuring device (ie tent & bin)
Emission Rate = Change in ppm per volume contained time (s) area (m2) = ppm x m2 m3 s
Calculation of the change in ppm per volume contained
ppm = ppmtx - ppmt0
Need convert ppm to g/m3, where ppm is a value, #
∴ # ppm vol x 1e-6 x mw (g/mole) x 1000l vol mv (l/mole) m3
∴ Equation # x 1e-6 x MW x 1000 g/m3 MV
For a variable volume measuring device
4.4 Calculation of CH4 Emission Rates gs-1m-2 for Fixed Volume Sources
4.4.1 Calculation basis for determining methane emission rates for a fixed volume source e.g. rigid container.
Calculation of CH4 emission rate g/s/m2
g/s/m2 = Equation x Basal Area of measuring
device (m2)
Containment Vol (m3) Time period of monitoring

∴ Equation g/s/m2 = (# x 1e-6 x 1e3 x MW/MV) x Basal Area of measuring
device (m2)
Containment Vol (m3) Time period of monitoring
4.5 Calculation of CH4 Emission Rates gs-1m-2 for Variable Volume Sources
4.5.1 Calculation basis for determining the methane emission rate for a source using a variable volume collector e.g flux tent.
Calculation of CH4 emission rate g/s/m2
Source Emission rate m3s-1
= Volume (m3) = Voltx – Volto Time (s) tx
g/s/m2 = m3s-1 x Equation x Basal Area of measuring
device (m2) Containment Vol (m3) Time period of monitoring
∴ Equation
g/s/m2 = m3s-1 x (# x 1e-6 x 1e3 x MW/MV) x Basal Area of measuring
device (m2) Containment Vol (m3) Time period of monitoring
4.6 Volume of CH4 Emitted from a Landfill Surface
4.6.1 Calculation of the volume of LFG emitted from the surface into the containment vessel expressed in m3/m2/s based on an assumed 50% CH4 in LFG.
1) Emission into containment vessel with fixed volume. = (Change in Conc CH4 ppm) x (Vol of containment vessel) (Volume of CH4 in LFG) Time (s) Basal Area (m2)

Change in Vol of CH4 = ppmtx - ppmt0 Vol of CH4 in LFG = 50% = 50 x 10,000 ppm = 5 e5 ppm
Equation = ppm / 1e6 5e5 / 1e6
x containment volume (m3)
time (s) Basal Area (m2) = m3 / m2 / s
4.7 Odorous Compound Emission Rate gs-1m2
4.7.1 Determination of the ratio of odorous compounds to CH4.
The purpose of this calculation is to define the ratio of odorous compound (ppm) to CH4 (ppm), expressed as a dimensionless value
Ratio between literature values for specific odorous compounds in mg/m3 and ppm. Based on either detection or recognition thresholds and expressed as mg/m3/ppm
mg/m3/ppm = Odour threshold (mg/m3) Odour Threshold (ppm) NB: values available from literature
Calculation of the ratio between 1 mg/m3 of CH4 and x mg/m3 OC 1 ppm CH4 = x mg/m3 CH4 1 ppm CH4 = MW CH4 MV (l/mole)
The purpose of this calculation is to define the emission of odorous compound from landfill sources expressed in g/s Emission of odorous compound is a proportion of the CH4 emitted from a source
Emission rate known for CH4 Conversion ratio known for odorous compound (OC)
Equation : Fixed containment volume
Emission Rate of odorous compound =
Emission Rate of CH4 x
conversion ratio OC: CH4 (mg/m3:mg/m3)
gs-1 gs-1

Equation : Variable containment volume
Fixed containment volume
Emission Rate of odorous compound =
Emission Rate of CH4 x
conversion ratio OC: CH4 (mg/m3:mg/m3)

5 Appendix 5: Details of Site Characteristics
5.1 Waste Input and Waste Types
5.1.1 The sites included within the covered a range of input material types. All accepted household waste. At P3, approximately 95% of the waste input was domestic waste. All sites accept non-hazardous commercial or industrial waste. At P3, this accounted for a small proportion of the overall input. Sites P1, P2 and V2 accepted special or hazardous wastes. P2 also accepted liquids, sludge’s and low-level radioactive waste. This is summarized in Table 4.
5.1.2 Waste input quantity and site capacity varied widely across the six sites. P1 accepted 350,000 m3 annually and had a 1.4m m3 void space remaining over the 50 Ha site. P2 covered 140 Ha and accepted 430,000 m3 in 2001. An estimated 1m m3 void space was available in the remaining two phases. P3 was entering into its final stage of operation with much of the 2.2m m3 capacity full. Annual input was approximately 160,000m3 for the 26 Ha site1, of which 95% was of domestic origin.
5.1.3 Sites H1 and V1 accepted non-hazardous commercial and industrial waste and domestic waste. Site H1 was a 27 Ha site with annual input of 128,000m3 per year2. The estimated site capacity was 4.5m m3. In comparison, V1, which covered 80 Ha, accepted 144,000m3 of waste annually3. Site V2 by comparison was just 8.42 Ha. The site was not receiving waste at the time of this study as engineering works were being undertaken on site. The total annual waste input for the last operational year was 80,000m3 4.
5.2 Site Design and Operational Regime
5.2.1 All of the sites, apart from site H1, had at least one phase that relied on dilute and disperse. H1 opened in 1998 and was designed as a fully contained landfill. There was a composite liner of clay and geo-membrane. There was a temporary cap of 30-50cm sandy-clay material on part of the site. The final restored cap will also be a composite. A gas control system was in place including a 1000m3/h flare and a 200m3 leachate storage tank. Leachate was removed from site for treatment and disposal.
5.2.2 P1, relied completely on dilute and disperse and, when complete, will be restored with a plastic membrane cap. There are two engines installed and operational that are backed-up by two flares. Leachate was treated on site and discharged to sewerage.
1 Void space of 160,000m3 based on 200,000T compacted to a placed density of 0.8 T/m3. 2 Void space of 128,000m3 based on 160,000T compacted to a placed density of 0.8 T/m3. 3 Void space of 144,000m3 based on 180,000T compacted to a placed density of 0.8 T/m3. 4 Waste input of 80,000m3 based on 100,000T compacted to a placed density of 0.8 T/m3.

5.2.3 P2 will soon enter phase 4 of its operation. Phases 1 and 2 were dilute and disperse cells, with 3 and 4 being fully contained with a composite liner. The site was also part capped with a composite of plastic, clay and soil material. Liquids were disposed to a lagoon constructed upon the deposited waste and allowed to migrate through the waste material. Leachate was collected and removed from site for treatment and disposal. A gas control system was in the process of being established. Gas wells were installed and sealed on one restored phase of the site. Due to the absence of further gas system infrastructure, including pipe works and a flare or engine, the gas wells were not connected.
5.2.4 All phases of P3 were dilute and disperse and either capped, or to be capped, with clay to a depth of 0.5m. Leachate was treated on site and discharged to sewerage. A gas control system, including an engine, was installed and operating, utilizing gas produced from the restored phases of the site. Until mid-2002, a combination of daily cover material and a temporary sheet membrane was used to cover daily waste deposits.
5.2.5 The restored phases of sites V1 and V2 were engineered for dilute and disperse. At V1, the recently completed phase was capped with a combination of a bentonite mat plus an additional 400mm of sandy/silt material from the on-site quarry. Further material will be used to bring this phase to a restored state. V2 was capped with overlapped HDPE. Both the recently active and soon to be constructed phases were designed to be fully contained with a composite liner. Leachate was collected and removed from both sites for treatment and disposal. Both sites operate gas systems, both of which had recently been extended into newly completed phases. V1 operated a single flare. V2 operated an installed engine that was backed-up by two additional flares.
5.3 Topography
5.3.1 The six sites were classified into three distinct groupings based upon their surrounding topography. For the purposes of dispersion modelling these were:
• a hill on a plain
• a hill on a hill
• a hill in a valley
5.3.2 Sites P1, P2 and P3 were all located on river or coastal flood plains. There was little topographic variation surrounding the sites and in all cases, the landfill site formed the largest topographic feature in the proximity of the sites.
5.3.3 H1 was located at an altitude of approximately 50m AOD in an area of rolling hills up to 90m AOD. The site was located on a ridge that formed the margin between the coastal plain and inland hill forms. As such, this site was classified in this study as representing a hill on a hill.
5.3.4 Sites V1 and V2 are both located in an area of rolling topography. The maximum height of the surrounding hills is approximately 130m AOD. Both of the sites were positioned on a valley floor at approximately 80m AOD. These sites were classified as representing a hill within a valley

5.4 Proximity to Habitation
5.4.1 Over recent years, development of residential and industrial areas has increasingly encroached upon P1. A kindergarten and supermarket were located adjacent to the landfill, separated only by an access road to a sports centre. Beyond these, there was a series of housing developments and a primary school. The school was less than 400m from the site.
5.4.2 P2 was located in a semi-rural landscape. A village was located 1.3 Km to the north and another 2.2 Km to east. In addition to these, there was a hotel complex located 900m north east of the site. There was also a number of individual buildings scattered around the north of the site.
5.4.3 P3 was located in a semi-rural landscape and within 50m of a farm. There are other residential properties approximately 900m south and 1 Km south west of the site.
5.4.4 H1 was located within 100m of local residents. These properties were the present outer-residential area of a town. Other properties were situated 250m east of the site. To the south west and west of the site there were a number of individual dwellings, although these were over 700m from the site. A large housing development was located 1.2 Km directly south of the site.
5.4.5 V1 was surrounded to the south by large residential properties and to the east by smaller dwellings. These were approximately 300m and 400m respectively from the site boundary. North east of the site, and within just a few meters of the site boundary was located a school.
5.4.6 500m to the north of V2 there was a hotel located on a hill ridge line. To the east, there was a village approximately 250m from the site boundary and to the west a village approximately 600m. To the west there were other individual properties within 250m of the site
5.5 Off-Site Odour Sources
5.5.1 Sites P1, P2, P3 and V2 were located within an agricultural or semi-agricultural environment. In particular, V2 was located in close proximity to an area where regular application of slurry to land occurred.
5.5.2 P1 was situated in close proximity to a number of chemical manufacturing facilities and sites that make use of solvents. In addition, odours associated with the estuary were possible. Similar estuarine odours were possible at P2.
5.5.3 Odour issues are complicated at P2 as a sewerage treatment works (STW) was located adjacent to the landfill site. Furthermore, the site accepted the sludge-cake from the STW, with the cake transferred in open containers. Problems had arisen in the past regarding the determination of the odour source as a result of this close proximity. A poultry farm was located approximately 350m to the north of the site.
6 Appendix 6: Odour Questionnaire
6.1 The Questionnaire
6.1.1 A questionnaire was issued to local residents surrounding the site. The number of questionnaires distributed was based on two factors:
• History of complaints
• Number of potential receptors within 2km of the site o If small number of receptors, all households received a
questionnaire
o If large, a random sample of households received a questionnaire
6.1.2 A copy of the questionnaire can be found on the following pages.

MSE055/ODOUR QUESTIONNAIRE APRIL 02
ODOUR QUESTIONNAIRE FOR MEMBERS OF THE PUBLIC
Thank you taking the time to complete this questionnaire. Your assistance will help develop means to minimise odour nuisance attributed to landfill operations in the UK.
1. Do you experience odour events from external sources? YES NO 2. Do you think you can identify the source (or sources) of the odour? YES NO 3. If yes to 2, what do believe is/are the most likely source(s)? If more than one please state. 4. Is the odour event a regular occurrence? YES NO 5. If yes, how regular are the odour events?
Once a day Once a week Once a month
More often Less often 6. How long have you been experiencing odour events? 7. How long does the odour event tend to last? 8. Is there a specific time of day when the odours occur? YES NO 9. If yes, what time of day?
Early Morning Late Morning Afternoon Evening Night 10. Is the odour associated with particular weather conditions? YES NO 11. If yes, which of the following best describes the weather at the time?
Still Fog Windy Rain Other Any/All
12. Is there a particular time (or times) of year that odour events tend to occur?
Winter Spring Summer Autumn
13. In your opinion, when is the worst time of day for odours? Worst month or season? 14. Please describe the odour in your own words. 15. Where do you normally encounter the odour? (in your home, in the garden, in the street etc.)

MSE055/ODOUR QUESTIONNAIRE APRIL 02
16. Could any of the following words be used to describe the odour. If more than one type of odour, please double/triple tick the best words: STRENGTH OF SMELL:
Faint Moderate Strong Overpowering
PRESENCE OF SMELL
There then gone Occasional – few times Intermittent - more Continuous for x minutes
TYPE OF SMELL: - I still think you need to group these to match the types you expect for gas, waste, leachate, other?
Sulphurous Sweet Fruity Gassy Lemon-like Fruity Pungent Less sulphurous Acrid/sour Rotten cabbage Putrid Rotten food Ammonia Animal manure Agricultural Rotten eggs Acidic Solvent/petrol Disinfectant Oily Sickly sweet Sugary Pungent Sulphurous Ammonia Farmyard Petrol-like Oily
17. Do the majority of the odours appear to come from the same source? 18. Is it always the same smell? 19. Has the odour nuisance varied over time? YES NO Are you after here, scales of minutes, hours, days, weeks, months, seasons, years??? 20. If yes, what was the timescale and how did it change?
…………………………………………………………………………………………………………….
…………………………………………………………………………………………………………….
….……………………………………………………………………………………………………….…
……………………………………………………………………………………………………………
……………………………………………………………………………………………………………..
21. Would you/have you complained about the odour? YES NO
22. Who would/have you complained to?
Environmental Health Dept.
Environment Agency
Site Operator
Parish Council
Residents Association
Site Liaison Group

MSE055/ODOUR QUESTIONNAIRE APRIL 02
23. Do you feel that those you complained to responded adequately to your complaints/ concerns? YES NO Add if not what else have you done, is this an ongoing issue 24. Were you aware that the landfill has a Site Liaison group? YES NO 25. Do you have any other concerns regarding odours? If so, what are they?
…………………………………………………………………………………………………………….
………………………………………………………………………………………….
….………………………………………………………………………………………
…………………………………………………………………………………………
consider following on separate sheet If you would like to be contacted regarding further involvement in the project, write your name, contact address and telephone number below: NAME: …………………………………………………………………………………………………… ADDRESS: ……………………………………………………………………………………………………
……………………………………………………………………………………………………
……………………………………………………………………………………………………
…………………………………………………………………………………………………… TELEPHONE: …………………………………………………………………………………………………… Please return the questionnaire in the stamped self-addressed envelope provided. Thank you for your help with this project.

6.2 Evaluation Methodology
6.2.1 The return rate for each of the four sites varied, as indicated in Table A3 below. The reasons for the varying return rates reflected many factors, such as the complaints history associated with the site, the adjacent industrial surroundings, the proximity of residential dwellings and the socio-economic category of those residential occupants. All but the complaints history and industrial surroundings were beyond the scope of the study and were not investigated.
Table A3: Numbers of questionnaires sent and returned
QUESTIONNAIRE SITE
Number Sent
Number of Replies
% Replying
% Replying Wishing to be Involved Further
P1 40 8 20 12
P2 50 21 42 57
P3 25 8 32 75
H1 20 17 85 76
TOTAL 135 54 40 57
6.2.2 On this basis, the high return rate for sites P2 and H1 reflects the socio-economic status of the adjacent residences and history of complaints. The lower return rates for P1 reflects the absence of any complaints history and the industrial surroundings of the site, while the limited complaints history for site P3 is reflected in the low response to the questionnaire.
6.2.3 To produce a general body of data, the results for the four sites were accumulated to provide a single set of responses. While this action resulted in the loss of some site-specific detail, the small number of returns for some sites made the statistical value of those results of limited value.
6.3 Questionnaire responses
6.3.1 The questions contained in the questionnaire and the responses received (expressed as a %) are presented in Table A3 above.
6.3.2 The results of the questionnaire are discussed below on a per question basis:
• Q1: Only 1 in 3 people experienced an odour event from whatever source. This could be interpreted that either the sensitivity of people to odours is limited or that people will accept a background level of odour which occasionally is exceeded, possibly leading to a complaint being made.
• Q2: Of those experiencing an odour event, only 1 in 3 felt that they could identify the source of the odour. This suggests that either landfills may not be the major source, or that people’s association of particular processes with the odours produced is limited.

• Q3: Of those who felt they could identify the source of the odour, over half associated the odour with the landfill site. The visible activity and odour associated with waste being transported to sites may act to sensitise people to associating the site rather than the transport of the waste as the odour source.
• Q4: Two thirds of respondents experienced regular odour events.
• Q5: Over half of the odour events occurred with a frequency of more than once a week. The high frequency could be due either the site or to the transport of waste to the site.
• Q6: Odours had been experienced essentially since the opening of the landfill site. The change in any pre-existing background odour is likely to be due to the operation of the landfill site.
• Q7: The duration of the odour was generally of a few hours. Such a response supports the case for waste delivery being the major cause of odours, as other landfill activities and processes are usually of longer duration.
• Q8: Overall there appears to be no specific time of day for odours to occur.
• Q9: For those who did find a specific time of day for odours, the calm, still conditions associated with early morning/evening. are to be expected, as these represent stable atmospheric conditions. Under stable conditions the absence of any turbulence or mixing means that no/limited dilution of the air mass containing any odours will take place. The odorous air mass leaving the site can move as a fixed body of air for hundreds and even thousands of metres before dispersion and mixing takes place, caused by physical obstructions such as hedges, trees, traffic moving along roads etc.
• Q10: Similar non specific result as with the time of day.
• Q11: Still/foggy/wet weather represents the same stable atmospheric conditions as early mornings/evenings and odours are to be expected.
• Q12: No apparent pattern related to seasonal effects but a slight bias to wards summer. Increased time spent outside or windows being open may help to explain an apparent increase in odour.
• Q13: Reinforcing the findings of Q9.
• Q14: The full range of odour descriptors for offensive or obnoxious odours.
• Q15: Suggests that the odour source is extensive and not due to ‘home’ related sources e.g. drains.
• Q16: Odour strength was generally moderate to strong, suggesting either a local source or a more remote source with a significant emission rate. Based on the odour descriptors used in the odour wheel in the Agency odour guidance document, the responses covered all of the descriptors.

• Q17: Most respondents believed that the same source was responsible for all of the odours.
• Q18: The odour remained the same over time.
• Q19: Approximately half the respondents felt that the odour nuisance had varied over time, suggesting a change in site operations or engineering activities such as capping, installation of gas control systems, leachate treatment operations etc.
• Q20: No time-specific response, suggesting that there was no specific event associated with any change in the odour nuisance.
• Q21: Surprisingly about half of the people had not/would not complain in the event of experiencing odours. This could suggest that odour events are either not frequent enough or of sufficient strength to lead to a significant adverse amenity impact.
• Q22: In the event of making a complaint, there was no obvious body to approach. In light of this apparent dilemma facing prospective complainants. it is important that odour complaints are centralised so that accurate records can be maintained.
• Q23: People generally did not feel that their complaints had been adequately dealt with by the receiving ‘body’. Be it the Agency, EHO or the Site Operator, better feedback is needed to assuage complainants concerns.
• Q24: Only half of the complainants were aware that the landfill sites involved in the study operated a Site Liaison group. Liaison groups are an effective forum for residents, Site Operators and the Regulators to meet to air and discuss site issues and concerns. In some cases it may be appropriate to review the composition of the Site Liaison group to ensure that it adequately reflects local needs.
• Q25: The major concern associated with odours was the potential for health effects. This may reflect increased public awareness of waste management activities and a heightened appreciation of potential environmental impacts. The waste management industry and the appropriate regulatory bodies should develop a (combined) programme of research and effective public consultation to identify any potential adverse impacts and to then take appropriate steps to ensure the mitigation of any such adverse impacts. Public confidence in waste management needs to be maintained.

6.3.3 While the questionnaire was undertaken on an anonymous basis, any respondent could request to be involved in any further studies and 57% indicated a willingness to do so by providing their name and address. Such a high level of response could be interpreted either as an interest in their local environment or a willingness to become engaged in the debate.
6.4 Analysis of site operations records and complaints records
6.4.1 All landfill sites are required to maintain a site dairy as part of their Licence. The purpose of the diary is to record major site activities. The relevant requirement is LCGN/7 [400]: SITE DIARY, in the Library of Licence Conditions and Working Plan Specifications Library Conditions Guidance and Templates Volume 1: Waste Management Licences.
6.4.2 The details of the requirement are specified as:
• Objective: To provide a daily on-site record that will demonstrate adequate running of the site with respect to pollution prevention, harm to human health and serious detriment to the amenity.
• Use: The site diary may be required to include details of, for example: times on and off site of the designated Technically Competent Manager(s) for the site; details of complaints received and actions taken; and times/dates of scheduled monitoring and maintenance.
6.4.3 Whilst all the site diaries were in regulatory compliance, it can be seen that the Licence requirements do not specifically require a level of recorded detail that would be of much value to odour investigations.
6.4.4 Equally the level of detail recorded by the regulatory bodies about odour complaints was not comprehensive, making the data of limited value in odour investigations. The lack of both suitably detailed site and complaints records precluded the direct comparison of site activities with odour complaints as initially planned and no useful analysis was undertaken.
6.5 Identification of alternative potential odour sources
6.5.1 Each site had also specific issues that were reflected in the returns. While the landfill was usually the perceived/actual focus of odour complaints, some sites had nearby industrial/agricultural activity that was also considered by the complainants as a possible cause of odour events (section 6.5). It was not possible within the scope of the study to undertaken any quantitative studies to differentiate between other potential odour sources. One clear example was a ‘hot plastic’ smell experienced by one respondent, which could clearly be associated with an adjacent plastics moulding factory adjacent to the site. The respondent attributed the source of the odour to the landfill site, as the site was clearly evident, while the plastics factory was suitable anonymous in the adjacent industrial estate.

6.5.2 Farming activities took place near to most of the sites and odour events associated with spreading of slurry or fertilisers were noted to be a likely cause of some complaints. However the seasonal nature of these particular activities in this study made it clear that they could be responsible for only some of the complaints. Dependent on the type of farming activity i.e. chicken raising, dairy or pig units, odours similar to those associated with landfill activities could arise on a regular basis.
6.5.3 Other industrial activities produce odours similar to landfill derived odours, exemplified by WTW. Anaerobic treatment of sewage sludge produces identical odours to LFG, as the production of LFG is also an anaerobic process. Site B was adjacent to a WTW and it was clear from direct experience that on a periodic basis the WWT was source of the odour. These odour events were associated with the transport of filter cake from the Works to the landfill site for disposal. Odours with characteristics similar to landfill derived odours can make it difficult for residents and regulators alike to be able to differentiate between the possible source of odour release, without extensive investigation and supporting documentation.
6.5.4 It is on these occasions that the value of a comprehensive site diary or other records of site activities and observations can prove to be invaluable. An on site-weather station to collect site-specific weather data provides valuable information that can be used to investigate reported odour events.
6.6 Discussion
6.6.1 The data collected via the questionnaires enables some useful insights to be determined. It was not the specific purpose of the questionnaire to provide a statistically valid set of data but to obtain a general view of the key features and concerns associated with the sites as seen by the residents. Dealing successfully with odour issues is a combination of the application of appropriate scientific and engineering measures together with an awareness of public perceptions.
6.6.2 The statement that odours commenced with the opening of the site is self evident, as once wastes are placed the nature of the background odour in the area will change. However, for some people even if odours are controlled and the inevitable odour events are infrequent, the mere presence of the often unwanted site can lead to a heightened perception of, or sensitivity to, odours, be they real or imagined. The merest hint of an odour, from whatever source, could be sufficient to lead to an odour complaint. In such cases, it will be extremely difficult to avoid odour complaints.
6.6.3 The limited time scale of the odour event fits in with both changing atmospheric effects i.e. calm early morning conditions giving way to turbulence as the land surface heats up and routine site based activities such as the arrival of collection vehicles etc. Non-routine activities such as the excavation of wastes, work on gas wells ands leachate chambers etc. are usually of a short-term nature i.e. less than a day.

6.6.4 The nature and strength of an odour is a subjective assessment (section 3.3). In some instances responses from nearby residents reported a significant difference in both the nature and strength of the odour. Both observations could be explained by the effect of dilution (section 7) but the proximity of the residents suggests that the differences were largely subjective rather than actual concentration differences.
6.6.5 The finding that many people had not complained of previous odour events is interesting and can be interpreted in a number of ways. It could be concluded that people will tolerate a low level background of odour associated with landfill sites and only complain when an exceptional event leads to an increased level of odour or production of a different odour. In a less positive interpretation, sites that apparently have no odour issues actually do but the public do not feel that complaining will achieve any beneficial result. If the latter were the case, then public faith in the ‘regulatory’ system in its broadest sense is low and people do not feel it worthwhile to complain, as nothing will be gained.
6.6.6 The willingness of people to tolerate a background level of odour does vary across the country. The more industrialised areas appear to have a greater tolerance of odour and other emissions i.e. incinerators and EfW plants, than do those areas which are primarily ‘green belt’. Sites located in these green belt residential areas are likely to experience a greater level of complaints than their industrial region counterparts, albeit for the same wastes, operational standards and site conditions.
6.6.7 Of the sites covered by the study, sites P2, P3 and V2 are located within an agricultural or semi-agricultural environment. Farming activities taking place around the sites included poultry farming, animal grazing, the cultivation of crops and the use and/or storage of farm generated animal slurry and wastes. Each of these activities is likely to produce an odour event period or periods during the course of the year, which may lead to a complaint incorrectly attributed to the landfill site.
6.6.8 At site V2 a regular occurrence was the movement of animal slurry along a road adjacent to the site that ran past a residential area. Immediately after the movement of this material on days when the wind was blowing in the appropriate direction, prima facie evidence indicated that odour complaints were recorded.
6.6.9 Site P1 is located in close proximity to an industrial estate, which includes a paint manufacturer, other chemical processes and a range of light industries. Site P2 is located adjacent to a major WWT facility. The presence of this alternative odour source further complicates the issue as the landfill site accepts the sewage cake produced by the WWT. Two of the sites, H1 and H2, are also situated in a locality with a number of other landfill sites. As such, operational and managerial issues associated with these other sites will compound and/or confuse odour complaint issues.
6.6.10 The proximity of possible alternative sources of odour makes a clear differentiation of odour sources difficult, especially as the data available from both the Agency/EHO complaints records and the Site Diary have insufficient detail to enable a clear view to be formed as to the likely cause of the odour event.

6.6.11 The lesson to be learnt is that accurate and detailed records need to maintained by both the site operator and the regulatory bodies if an objective assessment is to be made as to contributory source or sources of odour complaints.

7 Appendix 7: Emissions Monitoring Protocol
7.1.1 Standard procedures were established for on-site visits and the collection of emissions data. This included the requirement for a site walk over survey, a site perimeter survey, monitoring of onsite meteorological conditions and monitoring of emissions using a flux tent.
7.1.2 On site meteorological conditions were monitored at the start, end and repeatedly throughout the survey period. This included wind speed, direction, temperature and atmospheric pressure. Data collected onsite was supplemented by data available from the BBC Weather website.
7.1.3 A site perimeter survey was conducted during each site visit using a Flame Ionisation Detector (FID). FID readings were recorded, including the maximum and approximate mean value. Odour characteristic, intensity and, where the odour was particularly unpleasant, the hedonic tone was also noted. The perimeter survey included central areas of the site with specific features of interest, such as flanks or particularly odorous leachate or gas wells.
7.1.4 The sites were divided into areas based on potential source types. Area sources including flanks, restored and/or vegetated ground, temporary capping, daily cover, and active tipping areas were all identified and classified on their specific characteristics such as composition. Point sources were also targeted with measurements taken both from and within the vicinity of these features. Monitoring was only possible where practical or where safe to do so. A number of flanks were too steep to enable safe working practices to be undertaken.
7.1.5 Repeat visits to site sought to take repeat flux measurements from the sources previously monitored. The transient nature of landfilling operations resulted in repeat measurements being taken where possible in exact or similar locations

8 Appendix 8: Measurement of Emission Rates
8.1.1 Emissions from surfaces were determined using a variation of flux box. The measurement mode can be either static or dynamic, the former being less accurate in absolute terms but providing a result in a shorter time. In this study, three types of a flux box were used:
• Static Flux Tent
• Static Flux Bin
• Static Flux Bag
8.1.2 It is recommended that the flux tent should be used wherever possible for landfill applications. Landfill surfaces are by nature heterogeneous with surface cracks and variations in cover material thickness producing wide variations in the emission of landfill gases. Unless significant numbers of measurements are taken using the smaller surface area flux box (typically 0.5-0.7m2) measurements are liable to exclude surface defects, which have significant mass emission rates.
8.1.3 The flux tent used in this study had an area of 4m2, enabling it to cover 6-8 times the surface area of a standard flux box. The perimeter of the tent was marked and dug out to a depth of approximately 15cm where possible (Figure 5, Schematic of Flux Tent). The depth to which it was possible to dig to was highly dependant on the covering material. Where the surface cover was comprised of fine sandy-clay material, it was easier to create a deeper, even cut into the cover than where the cover contained inert hardcore. The outer plastic liner of the tent was placed into the trench and backfilled to create a seal. A monitoring outlet pipe was laid under the plastic liner and sealed to prevent escape of gas from the tent.
8.1.4 Measurements were taken every two minutes using the FID for the first eight minutes and thereafter every four minutes. Monitoring occurred until the concentration of flammable gas contained ceased increasing to any significant extent. On occasions when little change in concentration of flammable gas was observed within the device, monitoring periods were extended.
8.1.5 The flux bin was an 80 litre bin with a basal area of 0.15m2. This was adopted on the same principles as the flux tent. However, being smaller in size than the flux tent, the bin served as a means of monitoring emission rates at locations where the tent was unable to get due to both the tents size and the requirement to dig the tent in.
8.1.6 The flux bag constituted placing a bag over the open end of a point source, either a gas well or an open pipe (present during visit to site P2), with a monitoring outlet. The bag was fully deflated, sealed around the pipe, and allowed to fill. Measurements were taken every two minutes until either the bag was full or when the concentration of flammable gas contained ceased increasing.

8.1.7 There are many limitations to the methodology adopted. First of these is the static nature of the system. As the containment vessels (tent, bin or bag) fill, a back pressure is created, therefore discouraging further emissions from entering the device. Secondly, the inability to create a complete seal around the base of either the tent or the bin further limits the reliability and accuracy of the system
8.1.8 The basal area to volume ratio of the bin compared to the tent is far less favourable. This ratio for the tent and bin are 2.7 m2/m3 and 1.7 m2/m3 respectively. Due to the variable volume nature of the flux bag and the variable area of the source, it is not possible to give an accurate ratio for this device.
8.1.9 The smaller area of the flux bin required a greater number of measurements need to be taken in order that the results were representative of the whole surface area. This was however compensated by the time with which it is possible to set up the flux bin compared to the flux tent.
8.1.10 An additional weak point of the system was coupling between the monitoring equipment, the FID, and the flux device. The inability to create a perfect seal may have enabled dilution of the sample removed from the bin.
8.1.11 Despite all of these limitations, it was believed that the methodology was capable of calculating emission rates within the correct order of magnitude. Table 9 would suggest that this is the case. This level of accuracy was accepted due to the variable nature of the landfill system.

MSE Millennium Science & Engineering Ltd 21 The Steadings Business Centre, Maisemore, Glos. GL2 8EY
T +44 (0)1452 41 21 51 F +44 (0)1452 41 22 84 [email protected] www.mse-environmental.co.uk


![Panasonic...Durian odour 6 Natural reduction 60tmin.] Sweat odour Nonanoic acid Natural reduction 120[min.] Garbage odour Methylmercaptan Natural reduction 601minJ Scalp odour Panasonic](https://img.dokumen.tips/doc/110x75/60d72199474aa2073d394000/panasonic-durian-odour-6-natural-reduction-60tmin-sweat-odour-nonanoic-acid.jpg)