Embed Size (px)
Citation preview

21
34
Senior Care Digest
Hospitals/Systems Digest
Government Digest
HMO-PPO Digestwww.managedcaredigest.com
MANAGED CAREDIGEST SERIES
® 2007

Dear Digest Reader:
The nationally renowned sanofi-aventis Managed Care Digest Series®, now inits 21st year, is part of our continuing commitment to provide you with key dataon the evolution of health care. Our goal is to help you remain on the leadingedge of health care changes in America, and we hope that this informationenables you to identify the trends that can result in positive outcomes for your organization.
Sanofi-aventis is pleased to provide you with your complimentary copy of the Senior Care Digest for 2007, the second Digest in the four-part series. TheSenior Care Digest provides information about the key components of seniorcare, including care delivered by nursing homes and home health care agencies,along with services provided by skilled nursing facilities (SNFs), assisted livingfacilities (ALFs), and long-term care pharmacy providers (LTCPPs).
Your sanofi-aventis account manager or sales representative would be happy to provide you with additional information on our products and services. Thank you for your continuing commitment to the quality of health care inAmerica. We look forward to continuing our role in this important endeavor.
Sincerely,
Robert DeLucaVice President U.S. Managed Markets
MANAGED CAREDIGEST SERIES®
2007Commissioned, sponsored and underwritten by sanofi-aventis Bridgewater, NJ 08807
Developed and produced by Forte Information Resources LLCDenver, CO
Data provided by Verispan LLCYardley, PA
www.managedcaredigest.com
Inquiries relating to the mailing or distribution of the Managed CareDigest Series® can be addressed bycalling 1-800-529-9615.
Managed Care Digest Series is aregistered trademark of sanofi-aventis
© 2007 sanofi-aventis U.S. LLC
www.managedcaredigest.comWhere information becomes intelligence.™
SANOFI-AVENTIS MANAGED CARE DIGEST SERIES® / SENIOR CARE DIGEST 2007SANOFI-AVENTIS MANAGED CARE DIGEST SERIES® / SENIOR CARE DIGEST 20071
www.managedcaredigest.comWhere information becomes intelligence.™
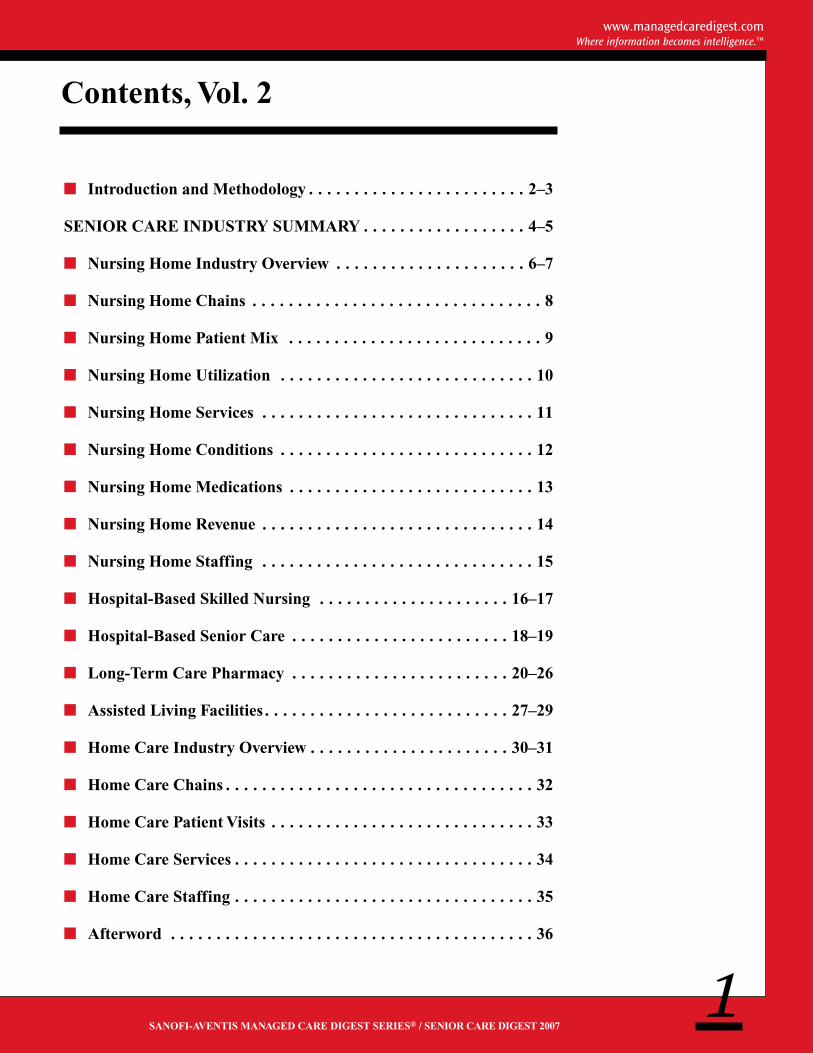
Contents, Vol. 2
n Introduction and Methodology . . . . . . . . . . . . . . . . . . . . . . . . 2–3
SENIOR CARE INDUSTRY SUMMARY . . . . . . . . . . . . . . . . . . 4–5
n Nursing Home Industry Overview . . . . . . . . . . . . . . . . . . . . . 6–7
n Nursing Home Chains . . . . . . . . . . . . . . . . . . . . . . . . . . . . . . . . 8
n Nursing Home Patient Mix . . . . . . . . . . . . . . . . . . . . . . . . . . . . 9
n Nursing Home Utilization . . . . . . . . . . . . . . . . . . . . . . . . . . . . 10
n Nursing Home Services . . . . . . . . . . . . . . . . . . . . . . . . . . . . . . 11
n Nursing Home Conditions . . . . . . . . . . . . . . . . . . . . . . . . . . . . 12
n Nursing Home Medications . . . . . . . . . . . . . . . . . . . . . . . . . . . 13
n Nursing Home Revenue . . . . . . . . . . . . . . . . . . . . . . . . . . . . . . 14
n Nursing Home Staffing . . . . . . . . . . . . . . . . . . . . . . . . . . . . . . 15
n Hospital-Based Skilled Nursing . . . . . . . . . . . . . . . . . . . . . 16–17
n Hospital-Based Senior Care . . . . . . . . . . . . . . . . . . . . . . . . 18–19
n Long-Term Care Pharmacy . . . . . . . . . . . . . . . . . . . . . . . . 20–26
n Assisted Living Facilities . . . . . . . . . . . . . . . . . . . . . . . . . . . 27–29
n Home Care Industry Overview . . . . . . . . . . . . . . . . . . . . . . 30–31
n Home Care Chains . . . . . . . . . . . . . . . . . . . . . . . . . . . . . . . . . . 32
n Home Care Patient Visits . . . . . . . . . . . . . . . . . . . . . . . . . . . . . 33
n Home Care Services . . . . . . . . . . . . . . . . . . . . . . . . . . . . . . . . . 34
n Home Care Staffing . . . . . . . . . . . . . . . . . . . . . . . . . . . . . . . . . 35
n Afterword . . . . . . . . . . . . . . . . . . . . . . . . . . . . . . . . . . . . . . . . 36

IntroductionSanofi-aventis is pleased topresent the Senior Care Digestof the sanofi-aventis ManagedCare Digest Series® for 2007.This annual series of Digests,sponsored by sanofi-aventis,includes the Government Digest,the HMO-PPO Digest and theHospitals/Systems Digest. Theseries provides essential informa-tion about all the major compo-nents of health care delivery. Toaccess electronic versions of thesanofi-aventis Managed CareDigest Series®, please visit us atwww.managedcaredigest.com.
The Senior Care Digest for2007 is designed to serve as asingle resource for informationabout the key components ofsenior care, including subacutecare delivered by nursing homes,in-home care delivered by homehealth care agencies, along withservices delivered by hospital-based skilled nursing facilities(SNFs), assisted living facilities(ALFs), and long-term carepharmacy providers (LTCPPs).
This Senior Care Digestfeatures expanded sections onnursing homes, LTCPPs, and homehealth care agencies: National andstate-by-state data for each of thesethree senior care industry segmentsare presented. Additional informa-tion is provided on both the 35largest nursing home and homehealth care chains in the nation.
This Digest once again alsoprovides demographic and utiliza-tion data on hospital-based SNFs,along with demographic as well aschain data on ALFs. These sectionsprofile hospital-based SNFs andALFs from across the nation.Updated data are also presentedthat profile common diagnoses andprocedures of seniors in hospitals.
USES FOR THIS DIGESTThe four print digests and fiveelectronic digests that comprisethe Managed Care Digest Series®
are used by health care providers,professional associations, insurers,consultants, strategists, employersand policy analysts. Feel free to usethis publication’s contents in anyway you like, provided that youcredit the sanofi-aventis ManagedCare Digest Series®, the SeniorCare Digest and Verispan LLC,which copyrights all its data.Digest statistics are often used for:
• Speeches and presentations
• Health care organizationplanning and budgeting
• Health care strategic forecasting
• Comparisons of industrysegments with an individualorganization’s results
• Benchmarking for qualityanalysis and improvement
• Marketing projections
• Product development.
www.managedcaredigest.comWhere information becomes intelligence.™
SANOFI-AVENTIS MANAGED CARE DIGEST SERIES® / SENIOR CARE DIGEST 20072

Research MethodologyData for this Digest were gatheredby Verispan LLC, Yardley, Pa., arecognized leader in the health careinformation market, providingcomprehensive profiling solutionsto health care marketing businessproblems. Verispan uses rigoroussurvey methodology in producingreports and validating data.
The definition of nursing homesincluded in this Digest encompassesonly freestanding long-term carefacilities providing skilled andunskilled care. No long-term carefacilities attached to hospitals orlong-term care or subacute bedswithin hospitals are included, sincethey are typically licensed by statesas part of hospitals and their bedsare counted as hospital beds. Also,no intermediate care facilities ormental retardation (ICF/MR) homesare included in the nursing homedata in this Digest. These data wereeffective as of end-of-year 2006.
Hospital-based SNF data for thisreport are based on informationfrom the Verispan Hospital ProfilingSolution©. Hospital utilization datawere compiled between mid-2005and mid-2006, and were effective asof December 31, 2005. These datawere gathered from state healthlicensing agencies, federal govern-ment sources and telephone or mailsurveys. Hospital procedural/diag-nosis discharge data are from theVerispan National Patient Profile©,and ALF data are from the Verispan
Healthcare Market Index©. UpdatedLTCPP data are from the VerispanLong-Term Care PharmacyProvider Profiling Solution©.
Detailed information oncorporate affiliations was used tocompile the profile of the home careindustry. This information is basedon data from the Verispan HomeHealth Market/Chains ProfilingSolution©. Data were effective as ofend-of-year 2006. All identifiedhome health care agencies andhome health care chains arecontacted annually by telephone and by mail for survey information.
Verispan compares its data withthose gathered by other organiza-tions, including trade associations,periodicals and journals, statelicensing information and theCenters for Medicare and MedicaidServices (CMS).
A final review process takesplace, before and during productionof this report, between Verispan andForte Information Resources LLC,Denver, Colo., a leading provider ofpublishing and communicationsproducts and services for the healthcare industry.
Sanofi-aventis, as sponsor of thisreport, maintains an arm’s-lengthrelationship with the organizationsthat prepare the Digest and carry outthe research. The desire of sanofi-aventis is for the Managed CareDigest Series® to be completelyindependent and objective.
www.managedcaredigest.comWhere information becomes intelligence.™
SANOFI-AVENTIS MANAGED CARE DIGEST SERIES® / SENIOR CARE DIGEST 20073

www.managedcaredigest.comWhere information becomes intelligence.™
SANOFI-AVENTIS MANAGED CARE DIGEST SERIES® / SENIOR CARE DIGEST 20074
Data source: Verispan LLC © 2007
n The share of all nursing homepatients who received Medicaidbenefits grew in 2006, to 64.1%from 62.9% in 2005, the firstreported annual rise since 2003.
n Between 2005 (36,861) and2006 (35,898), the total facilitypatient-days count fell 2.6%at nursing homes nationwide.
n The share of all nursing homeresidents who received mechani-cally altered diets was 35.4% in 2006, up from 34.8% in 2005.
n The percentage of nursing home residents overall who were afflicted with bladderincontinence was 54.8%, upfrom 51.6% in 2005, the largestshare of the 11 conditions listed.
n Total patient revenue per nursinghome per year rose 3.5% in2006, to $7.7 million from $7.4 million in 2005, the secondconsecutive annual increase.
n The number of hospital-basedskilled nursing facilities (SNFs)in the U.S. fell 9.3% in 2005, to 1,233 from 1,360 in 2004.
n In 2005, the average length of stay per patient at hospital-based SNFs rose 6.6%, to 151.1days from 141.7 the year before.
n The percentage of hospitalpatients diagnosed with diabetesmellitus who were at least 65years of age declined to 55.1%in 2005 from 56.6% in 2004.
n Between 2005 (13,544) and2006 (13,871), the total numberof assisted living facilities(ALFs) in the U.S. rose 2.4%.
n After a notable 14.0% increasebetween 2001 (11,677) and 2005(13,313), the number of homecare agencies in the U.S. grewfractionally in 2006, to 13,333.
n The number of hospital-basedhome care agencies dropped6.5% in 2006, to 1,529 from1,636 in 2005, the fourthconsecutive annual decrease.
n Over three-quarters (76.2%) of home care agencies nation-wide provided speech therapyto their patients in 2006, upfrom 72.7% the previous year.
Senior Care Industry Summary
NUMBER OF LICENSEDNURSING HOME BEDSHOLDS STEADY IN 2006After falling slightly between2004 (1.72 million) and 2005(1.70 million), the number oflicensed nursing home bedsheld virtually steady in 2006.Over the 15-year periodbetween 1992 (1.66 million)and 2006, the number ofnursing home beds in theU.S. edged up only 2.4%.
REGIONS
Pacific
Alaska
California
Hawaii
Oregon
Washington
Mountain
Arizona
Colorado
Idaho
Montana
Nevada
New Mexico
Utah
Wyoming
W. North Central
Iowa
Kansas
Minnesota
Missouri
Nebraska
North Dakota
South Dakota
E. North Central
Illinois
Indiana
Michigan
Ohio
Wisconsin
South CentralAlabama
Arkansas
Kentucky
Louisiana
Mississippi
Oklahoma
Tennessee
Texas
New EnglandConnecticut
Maine
Massachusetts
New Hampshire
Rhode Island
Vermont
Mid-AtlanticNew Jersey
New York
Pennsylvania
South AtlanticDelaware
D.C.
Florida
Georgia
Maryland
North Carolina
South Carolina
Virginia
West Virginia
1,525
1,575
1,625
1,675
1,725
Num
ber
ofL
icen
sed
Bed
s(0
00)
1992 1997 2002 2003 2004 2005 2006
1,660.3
1,678.5
1,721.2 1,717.2 1,719.9
1,699.1 1,700.0
LICENSED NURSING HOME BEDS

www.managedcaredigest.comWhere information becomes intelligence.™
SANOFI-AVENTIS MANAGED CARE DIGEST SERIES® / SENIOR CARE DIGEST 20075
Data source: Verispan LLC © 2007
n The number of long-term carepharmacy providers (LTCPPs)in the U.S. generating at leasthalf of their revenue from long-term care facilities was 1,105,up 2.4% from 1,079 in 2005.
n The nursing home resident share of all LTCPP prescriptionsdispensed continued to declinein 2006, to 62.7% from 64.4% in2005 and from 65.7% in 2004.
n Between 2005 and 2006, thenursing home shares of allprescriptions dispensed byLTCPPs declined in seven ofeight geographic regions (theMountain region excepted).
n Of prescriptions dispensed byLTCPPs in 2006, 12.8% overallwent to residential care facilities,up moderately from 11.9% in2005 and from 11.3% in 2004.
n Overall, LTCPPs that gener-ated at least half their revenuefrom long-term care facilitiesdispensed 11,287.8 nursinghome prescriptions per monthin 2006, down 1.3% from11,435.3 the previous year.
n Between 2004 (8,224.8) and2006 (6,440.7), the number of nursing home prescriptionsdispensed per month by inde-pendently owned LTCPPsdeclined a notable 21.7%.
n In 2006, 13.2% of prescriptionsdispensed by LTCPPs to nursinghomes were cardiovascular,down slightly from 13.5% theyear before, but still the highestshare by therapeutic category.
n The prescription cost per long-term care bed declined 2.5% at corporate-owned LTCPPsin 2006, to $50.06 from $51.33.
n The share of total LTCPP drugsales that went to long-term carefacilities fell at both corporate-(to 94.7% from 94.9% in 2005) and independently (to 83.4%from 84.7%) owned LTCPPs.
n In the three years from 2004 to 2006, the long-term carefacility share of total LTCPPdrug revenue at independentlyowned LTCPPs decreased more than four percentagepoints, to 80.2% from 84.3%.
Senior Care Pharmacy Summary
SHARE OF LTCPP DRUGREVENUE FROM LTCFACILITIES DECLINESLTCPPs with at least 50% of their revenue from long-term care facilities generated85.6% of their total drugrevenue from such facilitiesin 2006, down from 86.3%in 2005. LTCPPs with justone full-time (FT) pharma-cist generated 79.4% of their total drug revenue from long-term care facili-ties, down from 81.4% theprior year, and the lowestshare by LTCPP size.
0%
25%
50%
75%
100%
%of
Tot
alD
rug
Rev
enue
1 FT Pharmacist 2 FT Pharmacists 3–4 Pharmacists 5+ FT Pharmacists Overall Avg.
81.4% 79.4% 80.4% 79.9%84.8% 84.5%
92.7% 92.8%86.3% 85.6%
2005 2006
PERCENTAGE OF LONG-TERM CARE PHARMACY PROVIDER DRUG REVENUE FROM LONG-TERM CARE FACILITIES, BY SIZE

www.managedcaredigest.comWhere information becomes intelligence.™
SANOFI-AVENTIS MANAGED CARE DIGEST SERIES® / SENIOR CARE DIGEST 20076
NURSING HOME INDUSTRY OVERVIEW
FIVE STATES HAVEALTOGETHER A THIRDOF ALL U.S. BEDSIn 2006, five states—California, Illinois, NewYork, Ohio, and Texas—hadat least 100,000 licensednursing home beds each,together accounting forapproximately one-third ofall licensed beds in the U.S.Another five states (Florida,Indiana, Massachusetts,Missouri, Pennsylvania) each served as home formore than 50,000 nursinghome beds. These 10 statescombined to have 52.7% of all licensed nursing home beds in the nation.
BEDS PER 1,000 RATIODECLINES AGAINThe average number ofnursing home beds per 1,000residents aged 65 and olderdropped again in 2006, to46.2 from 46.8 in 2005, thesixth consecutive annualdecline. At 75.3, Iowa had thehighest number of nursinghome beds per 1,000 seniors,by state, while Alaska had the smallest (13.9). Between2005 and 2006, the beds per 1,000 ratio fell in all but three states: Kentucky,Nebraska and West Virginia,as well as Washington D.C.
Nursing home, licensed bed counts are virtually unchanged
NUMBER OF NURSING HOMES AND LICENSED BEDS IN EACH STATE, BY BED SIZE
Alabama 6 198 81 6,111 85 10,403 38 6,561 14 3,326 224 26,599 44.1Alaska 2 83 4 306 — — — — 1 224 7 613 13.9Arizona 6 208 34 2,408 62 7,518 23 4,091 10 2,320 135 16,545 21.8
Arkansas 2 81 91 7,328 117 13,785 13 2,120 3 789 226 24,103 62.7California 159 6,076 662 53,388 216 27,133 111 19,163 48 11,937 1,196 117,697 30.4Colorado 22 856 86 6,326 66 7,879 16 2,793 6 1,375 196 19,229 41.3
Connecticut 14 522 77 5,897 105 13,223 30 5,245 17 4,488 243 29,375 62.0Delaware 5 142 12 904 22 2,534 6 993 1 397 46 4,970 44.3Florida 28 985 128 9,084 379 45,278 102 17,781 36 9,022 673 82,150 27.4
Georgia 17 596 110 8,169 158 18,275 35 5,925 24 5,819 344 38,784 44.6Hawaii 7 246 10 821 7 839 2 340 3 780 29 3,026 17.3Idaho 12 455 23 1,665 24 2,882 3 471 — — 62 5,473 33.4
Illinois 38 1,440 270 21,231 233 28,643 98 17,163 139 35,683 778 104,160 68.1Indiana 51 1,944 183 13,660 166 19,688 61 10,646 32 9,369 493 55,307 71.1Iowa 72 2,881 255 17,493 69 7,863 13 2,263 7 2,288 416 32,788 75.3
Kansas 62 2,567 192 12,992 53 6,286 15 2,532 6 1,537 328 25,914 72.6Kentucky 31 1,053 117 8,625 104 12,357 16 2,703 6 1,655 274 26,393 50.2Louisiana 5 168 54 4,329 150 18,256 65 11,033 18 4,161 292 37,947 71.4
Maine 35 1,262 58 4,060 12 1,352 — — 2 499 107 7,173 37.2Maryland 18 655 51 3,838 85 10,653 45 7,724 22 5,960 221 28,830 44.7Massachusetts 48 1,756 115 8,931 195 24,211 69 11,579 17 4,092 444 50,569 59.3
Michigan 28 1,012 125 9,280 164 19,749 63 10,770 27 6,512 407 47,323 37.6Minnesota 51 1,939 185 12,963 84 10,132 26 4,513 17 4,981 363 34,528 55.4Mississippi 7 204 91 6,108 76 9,268 10 1,751 4 1,118 188 18,449 51.5
Missouri 29 971 223 16,434 205 24,771 43 7,398 25 6,684 525 56,258 72.8Montana 16 613 24 1,869 20 2,247 6 1,074 2 501 68 6,304 48.9Nebraska 61 2,437 103 7,051 29 3,402 10 1,704 4 1,116 207 15,710 67.3
Nevada 2 38 8 665 16 1,926 7 1,284 5 1,225 38 5,138 18.8New Hampshire 13 381 33 2,392 26 3,025 3 492 5 1,369 80 7,659 47.0New Jersey 28 986 66 4,464 120 14,478 83 14,520 53 14,388 350 48,836 43.2
New Mexico 9 295 27 1,972 30 3,528 2 338 2 579 70 6,712 28.6New York 34 1,295 87 6,826 147 17,883 150 26,850 194 62,328 612 115,182 45.8North Carolina 29 781 135 10,241 188 22,462 39 6,740 13 3,212 404 43,436 41.2
North Dakota 17 660 33 2,188 15 1,775 6 1,026 2 542 73 6,191 66.1Ohio 85 2,867 314 22,291 377 43,495 112 19,416 56 15,127 944 103,196 67.5Oklahoma 26 1,033 169 11,865 125 14,653 20 3,408 7 1,824 347 32,783 69.9
Oregon 19 677 69 5,137 42 4,870 9 1,516 2 423 141 12,623 26.9Pennsylvania 60 2,204 167 11,827 267 33,043 102 17,793 76 23,595 672 88,462 46.7Rhode Island 17 607 32 2,231 26 3,271 13 2,204 5 1,275 93 9,588 64.0
South Carolina 35 1,378 60 5,074 59 7,365 20 3,469 5 1,462 179 18,748 35.0South Dakota 34 1,371 57 3,775 11 1,286 3 535 — — 105 6,967 63.0Tennessee 15 552 91 6,814 132 16,088 49 8,381 18 4,754 305 36,589 48.8
Texas 52 1,976 384 29,131 537 65,212 107 18,534 35 8,374 1,115 123,227 54.2Utah 19 675 33 2,386 28 3,232 6 970 2 483 88 7,746 35.9Vermont 14 439 12 821 10 1,193 6 983 — — 42 3,436 41.9
Virginia 23 833 90 6,172 97 11,749 45 8,109 18 4,824 273 31,687 36.6Washington 34 1,259 100 7,861 82 9,842 14 2,349 4 871 234 22,182 30.8Washington DC 1 20 5 286 — — 4 715 6 1,748 16 2,769 41.2
West Virginia 2 85 55 3,827 41 4,886 7 1,299 1 214 106 10,311 37.0Wisconsin 31 1,080 175 12,685 106 12,615 40 6,945 18 4,552 370 37,877 52.5Wyoming 3 128 11 811 8 970 3 510 — — 25 2,419 39.0
TOTAL 1,434 52,970 5,577 413,013 5,376 647,474 1,769 306,722 1,018 279,802 15,174 1,699,981 46.2
<50 Beds 50–100 Beds 101–150 Beds 151–200 Beds 201+ Beds Total Total Beds/
STATE NHs Beds NHs Beds NHs Beds NHs Beds NHs Beds NHs Beds 1,000*
* “Beds/1,000” represents the numberof licensed nursing home beds per1,000 people age 65 and older in thatstate. State population data are aprojection of the U.S. Department of Commerce Bureau of the Census,Population Distribution Branch,published July 2005.
The total number of nursing homes operatingin the U.S. in 2006 was 15,174, just fraction-ally more than the 15,172 reported in 2005.The number of licensed beds also rose frac-tionally, to 1.70 million from 1.69 million the
previous year. The total U.S. nursing homecount has remained largely static over the pastdecade. In the 10 years from 1996 (15,323) to 2006, the nursing home count has hoveredbetween 15,130 (1999) and 15,371 (2000).
Data source: Verispan LLC © 2007

www.managedcaredigest.comWhere information becomes intelligence.™
SANOFI-AVENTIS MANAGED CARE DIGEST SERIES® / SENIOR CARE DIGEST 20077
Medicare-certified nursing home ratio rebounds in 2006
NURSING HOMES, LICENSED BEDS AND OCCUPANCY, BY SIZE*
DISTRIBUTION OF LICENSED BEDS, BY OWNERSHIP TYPE*, **
Data source: Verispan LLC © 2007
SIZE (Licensed Beds)
<50 Beds 9.5% 3.2% 85.4% 87.0%50–100 Beds 36.8 24.3 84.5 96.7101–150 Beds 35.4 38.1 84.4 97.8151–200 Beds 11.7 18.1 84.7 97.4201+ Beds 6.7 16.3 84.1 96.7
TOTAL/AVERAGE 100.0% 100.0% 84.6% 96.3%
Percentage ofAll Nursing Homes
Percentage ofAll Licensed Beds
AverageOccupancy Rate(Licensed Beds)
Medicare-certifiedPercentage of
All Nursing Homes
MEDICARE AND MEDICAID BEDS FOR ALL NURSING HOMES*, **
TYPE OF BED
Medicare-certified 62,638 63,595 4.1 4.2Medicaid-certified 228,910 226,166 15.1 14.9Medicare/Medicaid 1,335,952 1,337,411 88.1 88.1Other 71,585 72,344 4.7 4.8
TOTAL 1,699,126 1,699,981 112.0 112.0
Total # of Licensed Beds Avg. # of Licensed Beds/NH
2005 2006 2005 2006
0%
20%
40%
60%
80%
Per
cent
age
ofL
icen
sed
Bed
s
Government Owned Church-Related Other Not-for-Profit For-Profit
2.9%
9.6%4.4% 12.7%
5.0%7.5%
5.7% 14.4%
24.3%
18.3%
17.6%31.1%
67.8%64.7% 72.2%
41.8%
Medicare-certified
Medicaid-certified
Medicare/Medicaid
Other
OCCUPANCY RATEREMAINS STABLE The overall average occu-pancy rate at the nation’snursing homes was 84.6% in2006, unchanged from 2005and up just slightly from84.5% in 2004. For the sixthconsecutive year, facilitieswith fewer than 50 licensedbeds had the highest occu-pancy rate among the fivebed size categories (85.4%).
MEDICAID-CERTIFIEDLICENSED BED COUNTDECLINE SLOWSThe number of licensednursing home beds certifiedexclusively for Medicaidreimbursement fell just2.0% in 2006, to 226,166from 228,910 in 2005.Between 2000 (837,792)and 2006, the number ofthese Medicaid-certifiedbeds plummeted 73.0%,while the average number ofMedicaid beds per facilitydropped to 14.9 from 54.7.
The ratio of Medicare-certified nursing homesto all nursing homes grew to 96.3% in 2006,after slipping to 95.8% from 97.2% between2004 and 2005. The ratios rose for all bed sizecategories, between 2005 and 2006, most
notably for homes with fewer than 50 licensedbeds, to 87.0% from 85.8% the year before.The percentage of Medicare-certified nursinghomes with more than 200 beds edged up onlyfractionally, to 96.7% from 96.3% in 2005.
NOTE: Percentages may not always sumto 100% due to rounding.
* Based on 15,174 nursing homes in theU.S. Overall averages include thesmallest homes.
** “Medicare-certified” refers to thosenursing home beds that are eligiblefor Medicare payment under TitleXVIII of the Social Security Act.“Medicaid-certified” refers to thosenursing home beds that are eligiblefor Medicaid reimbursement underTitle XIX of the Social Security Act.“Medicare/Medicaid” beds qualifyfor payment from either Medicareor Medicaid. “Other” nursing homebeds are paid for by sources otherthan Medicare and Medicaid, suchas private insurance, self-pay andVeterans Affairs.

www.managedcaredigest.comWhere information becomes intelligence.™
SANOFI-AVENTIS MANAGED CARE DIGEST SERIES® / SENIOR CARE DIGEST 20078
NURSING HOME CHAINS
LICENSED BED COUNTGROWS AT 17 CHAINSOf the 33 nursing homechains that returned to the top35 list in 2006, 17 housedmore licensed beds than theprevious year, while eight hadfewer beds. The remainingeight had the same number in 2006 as in 2005. SunHealthcare Group reportedthe largest annual gain,managing 14,138 licensedbeds in 2006, up 42.6% from9,916 in 2005. By compar-ison, Atlanta-based SavaSenior Care saw its licensedbed total decline 27.5%, to22,168 from 30,617 in 2005.
NON-PROFIT CHAINSACCOUNT FOR MOREFACILITIES AND BEDSThe total number of nursinghome facilities owned orleased by large chains thatoperated on a not-for-profitbasis climbed 22.7% between2004 and 2006 (to 286 from233), while the combinednumber of licensed beds insuch chains jumped 25.1%during the same time (to22,852 from 18,269). Thelargest not-for-profit nursinghome corporation in the U.S.,Evangelical Lutheran GoodSamaritan, operated 190nursing homes with a total of14,672 licensed beds, makingit the country’s fifth largestnursing home chain in 2006.
Numbers of homes, licensed beds in top chains edge up again
Data source: Verispan LLC © 2007
Current Previous Tax Total Total Avg. # ofRank Rank Status NHs Lic. Beds Beds/NH States
THE NATION’S 35 LARGEST NURSING HOME CHAINS*
* This table includes all nursing homes owned and leasedby these chains, and the licensed beds within thosehomes, as of December 2006.
** Formerly Beverly Enterprises.
In 2006, the 35 largest nursing home chainsowned or leased a combined total of 3,430facilities, up from 3,406 in 2005, and 3,388 in2004. The number of licensed beds in thesechains also grew, to 385,426 from 383,225 the
year before. These 35 chains operated 22.6%of all nursing homes in the U.S. and housed22.7% of all licensed beds. The 10 largestchains operated 2,030 facilities (13.4% of total)and 235,623 licensed beds (13.8% of total).
CHAIN / HEADQUARTERS
Golden Ventures / Fort Smith, Ark.** 1 1 FP 336 34,701 103.3 24Manor Care / Toledo, Ohio 2 2 FP 283 38,044 134.4 30Kindred Healthcare / Louisville, Ky. 3 3 FP 251 31,614 126.0 28
Life Care Centers of America / Cleveland, Tenn. 4 5 FP 223 29,212 131.0 28Evangelical Lutheran Good Samaritan / Sioux Falls, S.D. 5 6 NFP 190 14,672 77.2 24Genesis Health Care / Kennett Square, Penn. 6 7 FP 188 23,964 127.5 13
Sava Senior Care / Atlanta, Ga. 7 4 FP 181 22,168 122.5 19Extendicare Health Services / Milwaukee, Wisc. 8 8 FP 146 15,386 105.4 11Sun Healthcare Group / Albuquerque, N.M. 9 10 FP 129 14,138 109.6 19
Trans Healthcare Inc. / Sparks, Md. 10 9 FP 103 11,724 113.8 16Daybreak Healthcare / Denton, Texas 11 11 FP 77 8,435 109.5 1National HealthCare Corporation / Murfreesboro, Tenn. 12 13 FP 73 9,163 125.5 10
Life Care Services Corporation / Des Moines, Iowa 12 14 FP 73 5,462 74.8 26Five Star Quality Care / Newton, Mass. 12 12 FP 73 6,114 83.8 20Senior Health Management / St. Petersburg, Fla. 15 15 FP 70 8,670 123.9 4
Coastal Administration Services / Atlanta, Ga. 16 16 FP 66 7,127 108.0 17Harborside Healthcare / Boston, Mass. 17 23 FP 64 7,323 114.4 9Tandem Health Care / Maitland, Fla. 18 16 FP 63 6,820 108.3 7
Skilled Healthcare / Foothill Ranch, Calif. 19 18 FP 62 7,559 121.9 5Evergreen Healthcare / Vancouver, Wash. 20 30 FP 55 5,535 100.6 7Health Systems Inc. / Sikeston, Mo. 21 20 FP 53 4,608 86.9 2
Magnolia Management / Ridgeland, Miss. 21 — FP 53 6,395 120.7 3Home Quality Management Inc. / Palm Beach Gardens, Fla. 21 20 FP 53 6,023 113.6 6Sea Crest Health Care Management / Tampa, Fla. 21 23 FP 53 6,696 126.3 1
Britthaven Inc. / Kinston, N.C. 25 22 FP 52 6,516 125.3 3Pruitt Corporation / Toccoa, Ga. 26 25 FP 51 5,655 110.9 3Sunrise Senior Living / McLean, Va. 27 18 FP 50 2,768 55.4 20
Petersen Health Care / Peoria, Ill. 27 30 NFP 50 4,525 90.5 2Ethica Health & Retirement Communities / Macon, Ga. 29 — FP 48 5,066 105.5 1Care Initiatives / West Des Moines, Iowa 30 28 NFP 46 3,655 79.5 1
Complete Care Services / Horsham, Penn. 30 33 FP 46 6,349 138.0 2Delta Health Group / Pensacola, Fla. 32 28 FP 45 5,402 120.0 3Advocat Diversicare / Brentwood, Tenn. 33 26 FP 43 4,535 105.5 8
Covenant Care / Aliso Viejo, Calif. 34 33 FP 41 4,747 115.8 7Ensign Group / Mission Viejo, Calif. 35 33 FP 40 4,655 116.4 4
TOTAL/AVERAGE 3,430 385,426 112.4

www.managedcaredigest.comWhere information becomes intelligence.™
9SANOFI-AVENTIS MANAGED CARE DIGEST SERIES® / SENIOR CARE DIGEST 2007
NURSING HOME PATIENT MIX
LARGE HOMES HAVEGREATEST SHARE OFMEDICAID PATIENTS At nursing homes with 201 ormore licensed beds, Medicaidrecipients accounted for69.2% of the patient mix, up from 68.4% in 2005, andthe largest share by size cate-gory. The Medicaid recipientshare, in this largest nursinghome size category, was more than 13 percentagepoints higher than the shareclaimed by nursing homeswith fewer than 50 licensedbeds (55.9%). Meanwhile,only 11.5% of the patient mixin the largest homes wereMedicare beneficiaries, thesecond lowest share by size.
GOVERNMENT HOMESHAVE THE FEWESTMEDICARE RESIDENTSAt nursing homes operatedby government entities in2006, just 8.1% of patientswere Medicare beneficiaries,down from 8.4% in 2005,and the lowest share byownership type. Conversely,the share of all patients atgovernment nursing homeswho were Medicaid recipi-ents was 67.8%, up from66.8% the previous year.
Medicaid recipients account for larger share of patient mix
Medicare*
NURSING HOME PATIENT MIX, BY PAYER TYPE
Medicaid**
2005 2006 2005 2006
Percentage of Nursing Home Residents
NURSING HOME PATIENT MIX, BY OWNERSHIP TYPE
OWNERSHIP
Government 8.4% 8.1% 66.8% 67.8%Church-Related 10.6 10.0 51.4 52.1Other Not-for-Profit 12.3 11.7 55.2 56.2For-Profit 13.5 12.9 65.6 66.9
SIZE (Licensed beds)
<50 Beds 14.7% 13.6% 54.2% 55.9%50–100 Beds 12.0 11.4 61.5 62.6101–150 Beds 13.8 13.2 64.5 65.6151–200 Beds 13.1 12.6 65.5 66.8201+ Beds 11.7 11.5 68.4 69.2
REGION
Pacific 12.6% 12.0% 62.7% 63.2%Mountain 12.9 11.8 58.8 61.3West North Central 8.7 8.4 55.5 56.5East North Central 13.9 13.1 62.0 63.0South Central 12.7 11.9 68.3 69.9New England 13.7 12.6 65.2 67.2Mid-Atlantic 13.1 12.9 63.3 64.3South Atlantic 15.5 15.4 63.8 64.6
CERTIFICATION
Medicare-certified 12.9% 12.4% 62.9% 64.0%
AVERAGE 12.9% 12.4% 62.9% 64.1%
0%
4%
8%
12%
16%
%of
Nur
sing
Hom
eR
esid
ents
GovernmentOwned
Church-Related
OtherNot-for-Profit
For-Profit
8.4% 8.1%
10.6%10.0%
12.3%11.7%
13.5%12.9%
2005 2006
40%
50%
60%
70%
80%
%of
Nur
sing
Hom
eR
esid
ents
GovernmentOwned
Church-Related
OtherNot-for-Profit
For-Profit
66.8% 67.8%
51.4% 52.1%55.2% 56.2%
65.6% 66.9%
2005 2006
MEDICARE BENEFICIARIES* MEDICAID RECIPIENTS**
Data source: Verispan LLC © 2007
*Based on 13,571 nursing homes inthe U.S.
**Based on 14,508 nursing homes inthe U.S.
The share of all nursing home patients whoreceived Medicaid benefits grew in 2006, to64.1% from 62.9% in 2005, the first reportedannual increase since 2003. The Medicaidrecipient annual patient share grew in every
geographical region, for nursing homes of allsizes, and for each ownership type profiled.Conversely, the overall ratio of nursing homeresidents who were Medicare beneficiariesslipped in 2006, to 12.4% from 12.9% in 2005.

www.managedcaredigest.comWhere information becomes intelligence.™
SANOFI-AVENTIS MANAGED CARE DIGEST SERIES® / SENIOR CARE DIGEST 2007
NURSING HOME UTILIZATION
Between 2005 (36,861) and 2006 (35,898), thetotal facility patient-days per year count fell2.6% at the nation’s nursing homes, while totalfacility average length of stay (ALOS) dropped2.3% (to 295 days from 302 days). The number
of patient-days (82,959) and ALOS (305) eachremained highest at the largest homes, whilehomes with fewer than 50 beds had the lowestpatient-days count (16,449) and homes with50 to 100 beds had the shortest ALOS (293).
TOTAL PATIENT-DAYSCOUNT SLIPS IN MID-ATLANTIC REGIONThe total number of patient-days per year at nursinghomes in the Mid-Atlanticregion fell 1.7%, to 52,471from 53,383 in 2005, yet stillexceeded both the overallaverage (35,898) and all sevenother region totals by a widemargin. For example, the WestNorth Central region reportedjust 26,598 total nursing homepatient-days in 2006 (down5.1% from 2005), which washalf of the Mid-Atlantic total.
ALOS DECREASES ATFOR-PROFIT HOMESThe total facility ALOS at for-profit nursing homes was 289days, down 2.7% from 297 in2005, and the shortest averageof the four ownership typesprofiled. By comparison,nursing homes operated bychurch-related entities had thelongest ALOS (317 days).
SOUTH CENTRALREGION REPORTSSHORTEST ALOSIn 2006, nursing homes in theSouth Central region trimmedtheir ALOS by 3.6%, to 263days, which was at least 20days shorter than in any otherregion. The steepest annualpercentage decline was atnursing homes in the WestNorth Central region, whereALOS dropped 5.0% in 2006,to 284 days from 298 in 2005.
Nursing home patient-days, average length of stay decline
Data source: Verispan LLC © 2007
TOTAL FACILITY AVERAGE LENGTH OF STAY, BY REGION
0
100
200
300
400
Ave
rage
Len
gth
ofS
tay
(day
s)
Pacific Mountain WestNorth
Central
EastNorth
Central
SouthCentral
NewEngland
Mid-Atlantic
SouthAtlantic
305 305 287 283 298 284 300 295 273 263
329 323 326 318 315 3122005 2006
NURSING HOME UTILIZATION RATES
Total Facility Patient-days per Year Total Facility Average Length of Stay (days)
2005 2006 2005 2006SIZE (Licensed Beds)
<50 Beds 16,805 16,449 302 29650–100 Beds 24,804 24,273 300 293101–150 Beds 37,003 36,021 301 294151–200 Beds 53,611 52,494 307 302201+ Beds 84,343 82,959 310 305
OWNERSHIP
Government 50,038 48,028 314 307Church-Related 41,766 41,204 323 317Other Not-for-Profit 40,582 39,925 315 314For-Profit 35,076 34,006 297 289
OVERALL AVERAGE 36,861 35,898 302 295
TOTAL FACILITY PATIENT DAYS, BY REGION
0
14,000
28,000
42,000
56,000
Ann
ualP
atie
ntD
ays
Pacific Mountain WestNorth
Central
EastNorth
Central
SouthCentral
NewEngland
Mid-Atlantic
SouthAtlantic
33,18332,559
32,68332,059
28,01826,598
36,85236,018
32,42131,095 36,956
36,723
53,38352,471
40,39139,635
2005 2006
10

www.managedcaredigest.comWhere information becomes intelligence.™
SANOFI-AVENTIS MANAGED CARE DIGEST SERIES® / SENIOR CARE DIGEST 200711
NURSING HOME SERVICES
SHARE OF RESIDENTSON RESPIRATORYTHERAPY DECLINESOf nursing home residentsnationwide, 10.7% underwentrespiratory therapy in 2006,down moderately from 11.4%in 2005. The share of resi-dents who received respira-tory therapy fell, between2005 and 2006, at nursinghomes in all eight geographicregions profiled. At nursinghomes in the Mountainregion, 17.9% of residentsreceived respiratory therapyservices, down from 19.6%the previous year, but still the largest share by region.(Some data not shown.)
PAIN MANAGEMENT IS MOST COMMON ATGOVERNMENT HOMES In 2006, 31.9% of residentsat government-operatednursing homes took part inpain management programs,up from 30.7% in 2005, andthe highest share, by owner-ship type, by a sizablemargin. By comparison, just 20.7% of patients at for-profit homes receivedsuch services, down from21.6% the year before.Overall, 23.1% of nursinghome patients nationwidewere enrolled in painmanagement programs, down from 23.8% in 2005.
Data source: Verispan LLC © 2007
PERCENTAGE OF NURSING HOME RESIDENTS RECEIVING VARIOUS SERVICES, BY OWNERSHIP TYPE
PERCENTAGE OF NURSING HOME RESIDENTS RECEIVING VARIOUS SERVICES
20062005
0%
20%
40%
60%
80%
Per
cent
age
ofR
esid
ents
PreventativeSkin Care
MechanicallyAltered Diets
Pain ManagementProgram
RehabilitationServices
Injections
70.5% 70.6%
34.8% 35.4%
23.8% 23.1%18.2% 17.0% 16.2% 15.2%
Government Church-Related
Other Not-for-Profit
For-Profit
All NursingHomes
2005 2006 2005 2006 2005 2006 2005 2006 2005 2006
Larger percentage of nursing home residents has altered diets
The percentage of all nursing home residentswho received mechanically altered diets was35.4% in 2006, up from 34.8% in 2005. Theshare of residents who received such servicesunderwent an annual increase, between 2005
and 2006, regardless of nursing home owner-ship type. Residents of government-run homes(36.8%) were most likely to have mechanicallyaltered diets in 2006, while residents of secularnot-for-profit homes (33.0%) were least likely.
SERVICES
Assisted Devices for Eating 12.0% 12.1% 10.2% 9.7% 9.1% 9.1% 7.4% 7.4% 8.1% 8.0%Behavioral Management 13.4 15.2 12.6 12.7 11.5 12.1 12.4 12.8 12.3 12.8Bladder Training Program 6.5 6.5 7.1 7.3 6.4 6.6 5.5 5.6 5.8 5.9Bowel Training Program 4.3 4.5 4.3 4.7 3.8 4.1 3.1 3.3 3.3 3.5
Catheters 6.3 6.5 5.3 5.1 5.8 5.8 6.4 6.4 6.2 6.2Dialysis 0.8 0.8 0.7 0.7 0.9 0.9 1.4 1.4 1.3 1.2Hospice Care Benefit 2.0 1.7 3.6 2.9 3.6 3.0 3.7 3.1 3.6 3.0Injections 15.0 14.7 13.1 12.7 14.3 13.4 17.1 15.9 16.2 15.2
IV Therapy 1.1 0.9 1.1 0.9 1.4 1.4 1.4 1.4 1.4 1.3Mechanically Altered Diets 35.7 36.8 33.2 33.5 32.2 33.0 35.5 36.1 34.8 35.4Ostomy Care 3.8 3.9 2.8 2.9 3.8 3.8 4.3 4.3 4.1 4.1Pain Management Program 30.7 31.9 30.5 30.5 28.8 28.2 21.6 20.7 23.8 23.1
Preventative Skin Care 72.9 72.9 74.5 74.2 71.9 71.9 69.6 69.9 70.5 70.6Radiation 0.1 0.1 0.1 0.1 0.1 0.1 0.1 0.1 0.1 0.1Receiving Suction 1.1 0.9 0.6 0.6 1.1 1.1 1.2 1.2 1.1 1.1Rehabilitation Services 12.9 13.0 15.8 14.6 17.2 16.3 19.0 17.7 18.2 17.0
Respiratory Therapy 12.6 12.1 10.7 10.0 11.5 11.1 11.3 10.6 11.4 10.7Tracheostomy Care 0.6 0.5 0.3 0.3 0.8 0.8 0.8 0.8 0.8 0.8Tube Feedings 4.7 4.8 3.8 3.7 4.8 4.9 6.3 6.5 5.8 6.0

www.managedcaredigest.comWhere information becomes intelligence.™
SANOFI-AVENTIS MANAGED CARE DIGEST SERIES® / SENIOR CARE DIGEST 200712
NURSING HOME CONDITIONS
SHARE OF RESIDENTSWITH BLADDER INCONTINENCE RISESThe percentage of nursinghome residents overall whowere afflicted with bladderincontinence was 54.8%, upmoderately from 51.6% in2005, the largest share, bya wide margin, of the 11conditions profiled. In 2006,the share of nursing homeresidents with bladder incon-tinence was highest in theMid-Atlantic region (59.4%)and lowest in the East NorthCentral region (50.3%).
LARGER SHARE OF RESIDENTS HASBEHAVIORAL ISSUESThe share of nursing homeresidents overall who werediagnosed with behavioralsymptoms grew to 31.0% in2006 from 30.5% in 2005.This percentage rose forresidents of nursing homesin six of eight geographicregions profiled (theMountain and South Atlanticregions excluded), mostnotably the Mid-Atlanticregion, to 25.5% from 24.2%the previous year. Despitethis increase, residents ofnursing homes in the Mid-Atlantic region were leastlikely, by region, to sufferfrom behavioral problems.
Smaller share of nursing home residents suffers from depression
In 2006, 46.6% of nursing home residentswere diagnosed with depression, down from48.8% in 2005. More than half of nursinghome residents suffered from depression intwo regions: the West North Central (54.9%)
and East North Central (51.1%). Only Mid-Atlantic region nursing homes reported that less than 40% of their residents wereafflicted with depression, at 39.1%, downslightly from 40.8% the previous year.
Data source: Verispan LLC © 2007
PERCENTAGE OF NURSING HOME RESIDENTS WITH VARIOUS CONDITIONS
PERCENTAGE OF NURSING HOME RESIDENTS WITH VARIOUS CONDITIONS
0%
15%
30%
45%
60%
Per
cent
age
ofR
esid
ents
BladderIncontinence
Depression Alzheimer’sDisease
BowelIncontinence
BehavioralSymptoms
PsychiatricDiagnosis
51.6%54.8%
48.8%46.6% 46.7% 46.2%
42.6% 44.1%
30.5% 31.0%
20.8% 19.7%
2005 2006
Pacific Mountain West NorthCentral
East NorthCentral
SouthCentral
NewEngland
Mid-Atlantic
SouthAtlantic
OverallAverageCONDITIONS
Alzheimer’s Disease 44.0% 42.9% 44.5% 48.1% 45.0% 49.5% 47.5% 46.6% 46.2%Behavioral Symptoms 29.1 33.5 36.1 33.9 28.9 31.5 25.5 29.6 31.0Bladder Incontinence 54.9 52.2 53.8 50.3 53.6 57.8 59.4 59.2 54.8
Bowel Incontinence 48.0 39.8 34.8 37.2 47.6 43.4 48.5 52.6 44.1Depression 40.9 48.6 54.9 51.1 45.5 44.5 39.1 44.6 46.6Mental Retardation 2.5 2.4 3.4 2.9 4.1 2.6 2.3 2.8 3.0
Pressure Sores 8.1 6.5 4.9 6.6 7.3 6.2 8.4 8.2 7.1Psychiatric Diagnosis 18.1 14.8 20.2 22.7 22.7 17.3 16.4 17.5 19.7Skin Rashes 5.7 5.7 6.2 5.8 4.4 5.1 5.1 5.2 5.4
Ulcers 4.9 3.4 2.0 3.2 3.4 2.7 4.7 4.2 3.5Weight Variation 7.3 8.3 8.3 8.7 8.9 7.0 7.1 8.0 8.1

www.managedcaredigest.comWhere information becomes intelligence.™
SANOFI-AVENTIS MANAGED CARE DIGEST SERIES® / SENIOR CARE DIGEST 200713
NURSING HOME MEDICATIONS
SMALLER SHARE OFRESIDENTS RECEIVESANTIDEPRESSANTS In 2006, 45.1% of nursinghome residents weredispensed antidepressantmedications, down from45.6% in 2005. The shares of residents who were admin-istered antidepressants atnursing homes fell, between2005 and 2006, regardless of ownership type. Moreover,in seven of eight regions (the West North Centralexcluded), the percentages of nursing home residentswho were dispensed antide-pressants declined in 2006.(Some data not shown.)
PERCENTAGE OF HOMERESIDENTS TAKINGHYPNOTICS DECLINESOf all nursing home resi-dents in the nation, 5.6%received hypnotic medica-tions in 2006, down slightlyfrom 5.8% in 2005. Duringthis period, the share of resi-dents who were administeredthese medications slipped,regardless of nursing homesize. For example, thepercentage of such residentsat homes with fewer than 50licensed beds fell to 5.2%from 5.3% the year before,the lowest share by size.
Share of nursing home residents using antipsychotics edges up
The share of nursing home residents receivingantipsychotic medications rose slightly in2006, to 26.9% from 26.7% in 2005. The shareof residents on antipsychotics grew modestly at nursing homes with fewer than 50 licensed
beds, to 26.5% from 25.8% the year before.By comparison, 28.4% of residents at homeswith more than 200 licensed beds receivedantipsychotic medications in 2006, unchangedfrom 2005, but still the highest share by size.
Data source: Verispan LLC © 2007
PERCENTAGE OF NURSING HOME RESIDENTS RECEIVING VARIOUS MEDICATIONS
Antianxiety AntibioticsAnti-
depressantsAnti-
psychoticChemo-
therapeuticHypnotic Psychoactive
2005 2006 2005 2006 2005 2006 2005 2006 2005 2006 2005 2006 2005 2006
0%
20%
40%
60%
80%
Per
cent
age
ofR
esid
ents
PsychoactiveMedications
AntidepressantMedications
AntipsychoticMedications
AntianxietyMedications
Antibiotics
63.4% 63.4%
45.6% 45.1%
26.7% 26.9%
17.1% 17.0%
8.1% 7.9%
2005 2006
PERCENTAGE OF NURSING HOME RESIDENTS RECEIVING VARIOUS MEDICATIONS
SIZE (Licensed beds)
<50 Beds 16.9% 17.1% 8.5% 8.2% 45.7% 45.7% 25.8% 26.5% 0.4% 0.4% 5.3% 5.2% 62.8% 63.8%50–100 Beds 17.2 16.9 7.8 7.6 46.0 45.6 26.3 26.6 0.4 0.4 5.5 5.3 63.5 63.6101–150 Beds 17.7 17.5 8.3 8.2 46.5 45.6 26.6 26.9 0.3 0.3 6.3 6.0 64.2 63.8151–200 Beds 16.5 16.5 8.0 8.1 44.1 43.7 27.5 27.5 0.3 0.3 6.0 5.8 62.6 62.8201+ Beds 15.0 15.2 7.7 7.6 41.2 40.7 28.4 28.4 0.4 0.4 5.7 5.5 60.8 60.4
OWNERSHIPGovernment 17.2% 17.4% 7.6% 7.6% 45.8% 45.3% 26.4% 26.6% 0.5% 0.5% 3.6% 3.8% 62.7% 62.9%Church-Related 15.4 15.4 7.9 7.6 47.4 46.9 21.6 21.9 0.4 0.4 4.4 4.5 62.2 62.2Other Not-for-Profit 15.6 15.5 8.3 8.0 45.9 45.6 22.6 22.8 0.4 0.4 5.2 4.9 61.6 61.6For-Profit 17.6 17.4 8.1 8.0 45.4 44.8 28.1 28.4 0.3 0.3 6.2 6.0 64.0 64.0
OVERALL AVG. 17.1% 17.0% 8.1% 7.9% 45.6% 45.1% 26.7% 26.9% 0.4% 0.4% 5.8% 5.6% 63.4% 63.4%

SANOFI-AVENTIS MANAGED CARE DIGEST SERIES® / SENIOR CARE DIGEST 200714
NURSING HOME REVENUE (IN $ THOUSANDS), BY SIZE
NURSING HOME REVENUE
2005 2006
Total patient revenue per nursing home per year rose 3.5% in 2006, to $7.7 million from$7.4 million in 2005, the second consecutiveannual increase. Since 2004 ($6.9 million),average total patient revenue has climbed a
notable 11.6%. By ownership type, nursinghome patient revenue was highest at secularnot-for-profit homes (to $9.1 million from $8.7 million in 2005) and lowest at for-profithomes (to $7.2 million from $6.9 million).
PATIENT REVENUEINCREASES AT HOMESIN SEVEN REGIONS Nursing homes located inseven of eight geographicregions (the West NorthCentral region excluded)reported a rise in average total patient revenue between2005 and 2006.The Mid-Atlantic region averaged thegreatest total patient revenuein 2006, at $13.6 million, up2.5% from $13.3 million the year before. Meanwhile,nursing homes in the WestNorth Central region gener-ated average total patientrevenue of $4.5 million in2006, down slightly from $4.6 million in 2005, byfar the lowest by region.
PATIENT REVENUEGROWTH IS HIGHESTAT MIDSIZED HOMESNursing homes with 151 to200 licensed beds averagedtotal patient revenue of $11.8 million in 2006, up5.0% from $11.2 million in 2005, and the greatestpercentage increase by bedsize. Similarly, homes with101 to 150 licensed bedsgenerated total patientrevenue of $7.7 million, a4.4% rise from $7.4 millionthe prior year. By compar-ison, the smallest nursinghomes—those with fewerthan 50 licensed beds—averaged total patient revenue of $3.7 million in 2006, up a more modest 3.0% from$3.6 million the year before.
Total patient revenue continues to climb at nursing homes
OWNERSHIPGovernment $9,143,313 $9,035,556Church-Related 8,673,102 8,850,671Other Not-for-Profit 8,748,562 9,117,824For-Profit 6,935,464 7,186,627
SIZE (Licensed Beds)<50 Beds $3,565,253 $3,670,49050–100 Beds 4,701,631 4,846,005101–150 Beds 7,413,980 7,737,404151–200 Beds 11,220,069 11,780,966201+ Beds 17,867,455 18,585,184
REGIONPacific $6,952,696 $7,332,071Mountain 6,102,679 6,509,083West North Central 4,600,472 4,519,755East North Central 7,286,860 7,530,391South Central 4,976,795 5,139,809New England 9,601,719 10,107,528Mid-Atlantic 13,277,353 13,615,239South Atlantic 7,997,165 8,438,853
OVERALL AVERAGE $7,406,400 $7,667,945
$2,000 $6,500 $11,000 $15,500 $20,000
Total Patient Revenue (000)
<50 Beds
50–100 Beds
101–150 Beds
151–200 Beds
201+ Beds
$3,670
$3,565
$4,846
$4,702
$7,737
$7,414
$11,781
$11,220
$18,585
$17,867
20062005
Data source: Verispan LLC © 2007
Total Patient Revenue per Nursing Home per Year
www.managedcaredigest.comWhere information becomes intelligence.™ NURSING HOME REVENUE

www.managedcaredigest.comWhere information becomes intelligence.™
SANOFI-AVENTIS MANAGED CARE DIGEST SERIES® / SENIOR CARE DIGEST 2007
In 2006, licensed practical nurses (LPNs) andlicensed vocational nurses (LVNs) at nursinghomes in the Pacific region worked on average0.70 hours per resident per day, up 9.4% from0.64 in 2005. In spite of this notable rise, the
LPN/LVN staffing ratio was lower at nursinghomes in just two other regions: New England(0.66) and the West North Central (0.62). TheLPN/LVN staffing ratio was highest at homesin the South Atlantic region in 2006, at 0.91.
RN STAFFING RATIO ISRELATIVELY LOW ATFOR-PROFIT HOMESOn average, resident nurses(RNs) at for-profit nursinghomes worked 0.51 hours per resident per day in 2006, 5.6% shorter than theaverage for nursing homesoverall (0.54 hours per day).By comparison, the RNstaffing ratio was consider-ably higher at church-related(0.64), other not-for-profit(0.63) and government (0.61)nursing homes in 2006.
NEW ENGLAND REGIONHOMES HAVE HIGHESTRN STAFFING RATIOResident nurses at nursinghomes in the New Englandregion worked on average0.74 hours per resident perday in 2006, the highest ratio,by region, by a significantmargin. The RN staffing ratio at New England homeswas 37.0% higher than theaverage for nursing homesoverall (0.54 hours per day)and 13.8% higher than theaverage for nursing homes inthe Mountain region (0.65),the second highest ratio byregion. Meanwhile, the RNstaffing ratio was lowest atnursing homes in the SouthCentral region (0.38) in 2006.
NURSING HOME STAFFING RATIOS
OWNERSHIP
Government 0.60 0.61 0.72 0.72 2.57 2.55Church-Related 0.64 0.64 0.71 0.73 2.53 2.56Other Not-for-Profit 0.65 0.63 0.73 0.76 2.47 2.47For-Profit 0.51 0.51 0.72 0.75 2.25 2.24
REGION
Pacific 0.58 0.57 0.64 0.70 2.55 2.54Mountain 0.67 0.65 0.69 0.71 2.31 2.28West North Central 0.51 0.52 0.60 0.62 2.28 2.30East North Central 0.57 0.58 0.70 0.73 2.19 2.19
South Central 0.38 0.38 0.80 0.81 2.27 2.26New England 0.74 0.74 0.61 0.66 2.40 2.43Mid-Atlantic 0.65 0.64 0.74 0.74 2.23 2.21South Atlantic 0.51 0.50 0.88 0.91 2.44 2.44
OVERALL AVERAGE 0.54 0.54 0.72 0.75 2.32 2.31
Registered NurseHours per Resident per Day
Licensed Practical/Vocational NurseHours per Resident per Day
Certified Nursing AssistantHours per Resident per Day
Data source: Verispan LLC © 2007
LPN/LVN staffing ratio increases at homes in the Pacific region
0.0 0.2 0.4 0.6 0.8Hours/Resident/Day
Overall Avg.
201+ Beds
151–200 Beds
101–150 Beds
50–100 Beds
<50 Beds
0.54
0.54
0.51
0.50
0.54
0.77
RN HOURS PER RESIDENT PER DAY,BY SIZE
0.0 0.2 0.4 0.6 0.8
Hours/Resident/Day
Overall Avg.
201+ Beds
151–200 Beds
101–150 Beds
50–100 Beds
<50 Beds
0.75
0.73
0.79
0.78
0.72
0.74
LPN/LVN HOURS PER RESIDENT PER DAY,BY SIZE
NURSING HOME STAFFING
15
2005 2006 2005 2006 2005 2006

www.managedcaredigest.comWhere information becomes intelligence.™
SANOFI-AVENTIS MANAGED CARE DIGEST SERIES® / SENIOR CARE DIGEST 200716
HOSPITAL-BASED SKILLED NURSING
The number of hospital-based skilled nursingfacilities (SNFs) in the U.S. declined 9.3% in2005, to 1,233 from 1,360 in 2004. Since 2003(1,459), this number dropped a notable 15.5%.The numbers of hospital-based SNFs slipped,
between 2004 and 2005, regardless of hospitalownership type. The most notable decline wasamong for-profit hospitals, to 148 from 174 in2004, or –14.9%. The share of all hospitals withSNFs also fell, to 17.8% from 19.8% in 2004.
NUMBER OF SNF BEDSDECLINES IN SEVEN OF EIGHT REGIONSBetween 2004 and 2005, thenumber of hospital-basedSNF beds dropped in sevenof eight geographic regions(the New England region, up18.7%, to 2,151 from 1,812the year before, being thelone exception). The fourregions with the most SNFbeds—the Mid-Atlantic(18,029), Pacific (15,988),South Atlantic (12,165) andSouth Central (11,434)—accounted for more thanseven out of 10 (71.5%)hospital-based SNF bedsnationwide (76,098) in 2005.
THREE OUT OF 10PACIFIC REGIONHOSPITALS HAVE SNFsAlthough down by nearlytwo percentage points fromthe year before, the share ofhospitals in the Pacificregion with a SNF compo-nent, at 30.0%, was thehighest of the eight regionsin 2005. By comparison, just11.9% of hospitals in theNew England region hadSNFs, down from 14.3%the previous year, and thelowest share by region.
HOSPITAL-BASED SKILLED NURSING FACILITIES (SNFs), BY OWNERSHIP TYPE*
2004 2005 2004 2005 2004 2005OWNERSHIP
Government 391 356 21.0% 19.1% 36,846 35,948Not-for-Profit 795 729 22.6 20.8 37,810 35,512For-Profit 174 148 11.6 9.5 5,295 4,638
TOTAL/AVG. 1,360 1,233 19.8% 17.8% 79,951 76,098
* According to CMS, a skilled nursingFacility (SNF) could be part of ahospital or nursing facility. Medicarecertifies these facilities if they have thestaff and equipment to give skillednursing care and/or skilled rehabilita-tion services and other related healthservices. The data on pages 16 and 17refer strictly to hospital-based skillednursing facilities.
# of Hospital-basedSkilled Nursing Facilities
% of Hospitals with Skilled Nursing Facilities
# of Hospital-based Skilled Nursing Facility Beds
PERCENTAGE OF HOSPITALS WITH SKILLED NURSING FACILITIES (SNFs), BY REGION*
0%
10%
20%
30%
40%
Per
cent
age
ofH
ospi
tals
Pacific Mountain WestNorth
Central
EastNorth
Central
SouthCentral
NewEngland
Mid-Atlantic
SouthAtlantic
31.8%30.0%
12.3% 12.3%
19.1%17.0%
19.0%16.9% 15.7%
14.3% 14.3%11.9%
23.8% 22.5% 21.4%
17.7%
2004 2005
Data source: Verispan LLC © 2007
Total number of hospital-based skilled nursing facilities falls
HOSPITAL-BASED SKILLED NURSING FACILITIES (SNFs), BY REGION*
2004 2005 2004 2005 2004 2005REGIONPacific 241 228 31.8% 30.0% 15,988 15,551Mountain 63 65 12.3 12.3 2,768 2,760West North Central 157 140 19.1 17.0 8,118 7,472East North Central 186 166 19.0 16.9 9,637 9,283
South Central 265 244 15.7 14.3 11,434 10,652New England 43 36 14.3 11.9 1,812 2,151Mid-Atlantic 169 159 23.8 22.5 18,029 17,264South Atlantic 236 195 21.4 17.7 12,165 10,965
TOTAL/AVG. 1,360 1,233 19.8% 17.8% 79,951 76,098
# of Hospital-basedSkilled Nursing Facilities
% of Hospitals with Skilled Nursing Facilities
# of Hospital-based Skilled Nursing Facility Beds

www.managedcaredigest.comWhere information becomes intelligence.™
SANOFI-AVENTIS MANAGED CARE DIGEST SERIES® / SENIOR CARE DIGEST 2007
In 2005, the average length of stay (ALOS)per patient at hospital-based SNFs rose 6.6%,to 151.1 days from 141.7 in 2004. ALOS grewfor SNF patients in six of eight regions duringthis period, most notably the Pacific, to 172.6
from 138.0 the previous year, or 25.1%. In2005, ALOS for SNF patients was longestin the Mountain region (to 195.6 days from177.3 in 2004) and shortest in the East NorthCentral region (to 81.1 days from 100.4).
SNF PATIENT-DAYCOUNT IS HIGHEST INMID-ATLANTIC REGIONHospital-based SNFs in theMid-Atlantic region reportedannual SNF unit patient-daysof 32,042.3 in 2005, up 4.1%from 30,773.2 in 2004, andthe highest count, by region,by a wide margin. SNFs inthe Mid-Atlantic regionaveraged nearly twice asmany patient-days per yearas SNFs nationwide in 2005(16,735.9). Meanwhile, New England region SNFsreported the fewest annualpatient-days per unit, at11,549.3, down slightly from11,732.9 the previous year.
ALOS RISES NOTABLY AT FOR-PROFIT HOSPITAL-BASED SNFsBetween 2004 and 2005,ALOS per patient at SNFsbased in for-profit hospitalsclimbed 17.1%, to 142.2 daysfrom 121.4 the year before.Since 2003 (72.6), ALOS atthese facilities has nearlydoubled. Over the samethree-year period, ALOS atSNFs based in not-for-profitfacilities increased just 4.3%,to 108.0 days from 103.5 in2003. By comparison, ALOSat SNFs based in governmenthospitals underwent a fairlyminimal drop between 2003(265.2) and 2005 (260.0).
Average length of stay per SNF patient increases in 2005
HOSPITAL-BASED SKILLED NURSING FACILITY (SNF) UTILIZATION, BY REGION
Data source: Verispan LLC © 2007
REGION
Pacific 366.1 361.4 15,887.3 15,535.8 72.0% 70.7% 138.0 172.6Mountain 245.0 241.8 13,108.8 13,761.3 74.8 76.9 177.3 195.6West North Central 289.4 288.5 14,576.6 15,342.1 75.9 72.7 169.5 186.3East North Central 411.9 429.2 15,259.0 13,729.7 74.1 74.7 100.4 81.1
South Central 338.1 339.0 13,240.0 13,412.2 74.4 75.3 139.5 145.8New England 485.1 535.9 11,732.9 11,549.3 77.4 81.0 100.1 110.8Mid-Atlantic 388.9 397.1 30,773.2 32,042.3 86.2 88.3 163.3 173.1South Atlantic 314.6 325.0 15,687.0 14,904.9 77.8 78.2 148.9 144.8
OVERALL AVG. 352.0 358.4 16,697.0 16,735.9 76.2% 76.3% 141.7 151.1
# of Hospital-based SNFAdmissions per Year
Patient-daysper SNF Unit per Year
Average Occupancyper SNF Unit
ALOS (days)per SNF Patient
2004
0
110
220
330
440
Ann
ualA
dmis
sion
s
Government Not-for-Profit For-Profit
239.1 243.2
415.1 420.3
300.9 295.7
2005
2004
0%
25%
50%
75%
100%
Ave
rage
Occ
upan
cy
Government Not-for-Profit For-Profit
77.0% 77.3% 77.0% 77.2%70.8% 70.0%
2005
NUMBER OF HOSPITAL-BASED SNF ADMISSIONS, BY OWNERSHIP TYPE
AVERAGE OCCUPANCY PER SNF UNIT,BY OWNERSHIP TYPE
2004
0
80
160
240
320
Ave
rage
Len
gth
ofS
tay
(day
s)
Government Not-for-Profit For-Profit
243.2260.0
98.8 108.0121.4
142.2
2005
2004
0
7
14
21
28
Ann
ualP
atie
nt-d
ays
(000
)
Government Not-for-Profit For-Profit
25.0 24.6
14.4 14.9
8.9 9.6
2005
ALOS PER SNF PATIENT,BY OWNERSHIP TYPE
NUMBER OF PATIENT-DAYS PER SNF UNIT PER YEAR, BY OWNERSHIP TYPE
2004 2005 2004 2005 2004 2005 2004 2005
17

www.managedcaredigest.comWhere information becomes intelligence.™
SANOFI-AVENTIS MANAGED CARE DIGEST SERIES® / SENIOR CARE DIGEST 2007
HOSPITAL-BASED SENIOR CARE
The shares of patients 65 years of age andolder dropped, between 2004 and 2005, in 11of the 13 circulatory diseases profiled (otherdiseases of the endocardium and occulsion of cerebral arteries being the exceptions). In
spite of these annual declines, the 65+ patientshare remained above 70% for all 13 circula-tory diseases. Of patients with diseases of themitral and aortic valves, 88.1% were 65+ in2005, the highest share of the 13 diseases.
PATIENTS 65+ SHARE OFPARKINSON’S DISEASEDIAGNOSES DECLINESBetween 2004 and 2005, thepercentages of patients diag-nosed with Parkinson’sdisease decreased slightly inall three senior age categoriesprofiled. For example, theshare of patients 65+ diag-nosed with Parkinson’sdisease slipped to 90.4%from 91.0% the year before.
SMALLER SHARE OFDIABETES MELLITUSPATIENTS IS 65+ IN 2005The share of hospital patientsdiagnosed with diabetesmellitus who were at least 65 years of age declined to55.1% in 2005 from 56.6% in 2004. A smaller share ofthese hospital patients werediagnosed with diabetesmellitus in 2005 than theother three endocrine, nutri-tional and metabolic diseases.
NEARLY ALL HOSPITALMENTAL DISORDERPATIENTS ARE 65+For the second straight year,hospital patients 65 years ofage and older accounted forat least 95.0% of the mentaldisorder diagnoses profiled.For example, 96.1% ofpatients diagnosed withsenile and presenile organicpsychotic conditions were atleast 65 years of age in 2005,up from 95.8% the prior year.
Shares of patients 65+ fall for 11 circulatory disease diagnoses
COMMON DIAGNOSES FOR PATIENTS 65+, BY ICD-9 CODE
COMMON DIAGNOSES FOR PATIENTS 65+, BY ICD-9 CODE
40%
55%
70%
85%
100%
Pat
ient
s65
+%
ofT
otal
290 396 365 433 428 414 715 244 272 250
96.1%
88.1%83.6%
78.5% 78.0%
71.5% 70.1%65.2%
59.5%55.1%
Data source: Verispan LLC © 200718
ICD-9 Code Endocrine, Nutritional and Metabolic Diseases, Pat. 65+ % Pat. 75+ % Pat. 85+ %and Immunity Disorders (240–279)
244 Acquired hypothyroidism 65.2% 46.1% 17.3%250 Diabetes mellitus 55.1 31.3 7.8272 Disorders of lipoid metabolism 59.5 33.4 7.5276 Disorders of fluid/electrolyte/acid-base imbalance 57.0 40.1 15.1
ICD-9 Code Mental Disorders (290–319) Pat. 65+ % Pat. 75+ % Pat. 85+ %
290 Senile and presenile organic psychotic conditions 96.1% 84.3% 43.1%294 Other organic psychotic conditions (chronic) 95.0 84.3 41.3
ICD-9 Code Diseases of the Nervous System and Sense Organs (320–389) Pat. 65+ % Pat. 75+ % Pat. 85+ %
331 Other cerebral degenerations 89.3% 77.8% 34.6%332 Parkinson’s disease 90.4 69.5 21.9365 Glaucoma 83.6 63.6 26.0
ICD-9 Code Diseases of the Circulatory System (390–459) Pat. 65+ % Pat. 75+ % Pat. 85+ %
396 Diseases of mitral and aortic valves 88.1% 71.1% 29.5%397 Diseases of other endocardial structures 76.7 57.6 20.9402 Hypertensive heart disease 74.2 52.1 18.4
414 Other forms of chronic ischemic heart disease 71.5 45.7 13.6424 Other diseases of endocardium 73.5 54.1 20.2426 Conduction disorders 76.4 54.6 19.0
427 Cardiac dysrhythmias 78.2 56.7 20.2428 Heart failure 78.0 57.1 22.5433 Occlusion and stenosis of precerebral arteries 78.5 49.4 12.8
434 Occlusion of cerebral arteries 72.8 52.0 19.6438 Late effects of cerebrovascular disease 72.7 49.3 16.0440 Atherosclerosis 73.5 45.1 12.0443 Other peripheral vascular disease 73.3 47.0 13.6
ICD-9 Code Diseases of the Musculoskeletal System and Connective Tissue (710–739) Pat. 65+ % Pat. 75+ % Pat. 85+ %
715 Osteoarthrosis and allied disorders 70.1% 44.5% 14.4%733 Other disorders of bone and cartilage 76.9 57.7 22.9
www.managedcaredigest.comWhere information becomes intelligence.™
SANOFI-AVENTIS MANAGED CARE DIGEST SERIES® / SENIOR CARE DIGEST 2007
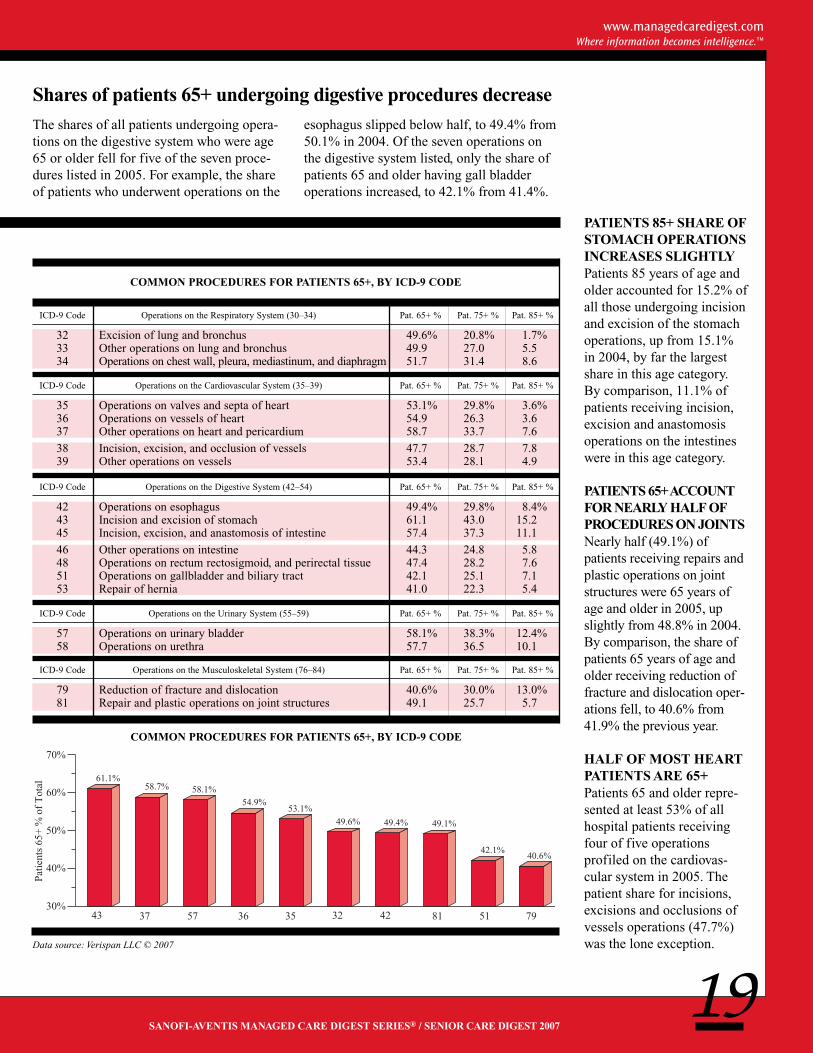
The shares of all patients undergoing opera-tions on the digestive system who were age65 or older fell for five of the seven proce-dures listed in 2005. For example, the shareof patients who underwent operations on the
esophagus slipped below half, to 49.4% from50.1% in 2004. Of the seven operations onthe digestive system listed, only the share ofpatients 65 and older having gall bladderoperations increased, to 42.1% from 41.4%.
PATIENTS 85+ SHARE OFSTOMACH OPERATIONSINCREASES SLIGHTLYPatients 85 years of age andolder accounted for 15.2% ofall those undergoing incisionand excision of the stomachoperations, up from 15.1%in 2004, by far the largestshare in this age category.By comparison, 11.1% ofpatients receiving incision,excision and anastomosisoperations on the intestineswere in this age category.
PATIENTS 65+ ACCOUNTFOR NEARLY HALF OFPROCEDURES ON JOINTSNearly half (49.1%) ofpatients receiving repairs andplastic operations on jointstructures were 65 years ofage and older in 2005, upslightly from 48.8% in 2004.By comparison, the share ofpatients 65 years of age andolder receiving reduction offracture and dislocation oper-ations fell, to 40.6% from41.9% the previous year.
HALF OF MOST HEARTPATIENTS ARE 65+Patients 65 and older repre-sented at least 53% of allhospital patients receivingfour of five operationsprofiled on the cardiovas-cular system in 2005. Thepatient share for incisions,excisions and occlusions ofvessels operations (47.7%)was the lone exception.
Shares of patients 65+ undergoing digestive procedures decrease
COMMON PROCEDURES FOR PATIENTS 65+, BY ICD-9 CODE
30%
40%
50%
60%
70%
Pat
ient
s65
+%
ofT
otal
43 37 57 36 35 32 42 81 51 79
61.1%58.7% 58.1%
54.9%53.1%
49.6% 49.4% 49.1%
42.1%40.6%
COMMON PROCEDURES FOR PATIENTS 65+, BY ICD-9 CODE
Data source: Verispan LLC © 2007
19
ICD-9 Code Operations on the Respiratory System (30–34) Pat. 65+ % Pat. 75+ % Pat. 85+ %
32 Excision of lung and bronchus 49.6% 20.8% 1.7%33 Other operations on lung and bronchus 49.9 27.0 5.534 Operations on chest wall, pleura, mediastinum, and diaphragm 51.7 31.4 8.6
ICD-9 Code Operations on the Cardiovascular System (35–39) Pat. 65+ % Pat. 75+ % Pat. 85+ %
35 Operations on valves and septa of heart 53.1% 29.8% 3.6%36 Operations on vessels of heart 54.9 26.3 3.637 Other operations on heart and pericardium 58.7 33.7 7.6
38 Incision, excision, and occlusion of vessels 47.7 28.7 7.839 Other operations on vessels 53.4 28.1 4.9
ICD-9 Code Operations on the Digestive System (42–54) Pat. 65+ % Pat. 75+ % Pat. 85+ %
42 Operations on esophagus 49.4% 29.8% 8.4%43 Incision and excision of stomach 61.1 43.0 15.245 Incision, excision, and anastomosis of intestine 57.4 37.3 11.1
46 Other operations on intestine 44.3 24.8 5.848 Operations on rectum rectosigmoid, and perirectal tissue 47.4 28.2 7.651 Operations on gallbladder and biliary tract 42.1 25.1 7.153 Repair of hernia 41.0 22.3 5.4
ICD-9 Code Operations on the Urinary System (55–59) Pat. 65+ % Pat. 75+ % Pat. 85+ %
57 Operations on urinary bladder 58.1% 38.3% 12.4%58 Operations on urethra 57.7 36.5 10.1
ICD-9 Code Operations on the Musculoskeletal System (76–84) Pat. 65+ % Pat. 75+ % Pat. 85+ %
79 Reduction of fracture and dislocation 40.6% 30.0% 13.0%81 Repair and plastic operations on joint structures 49.1 25.7 5.7

www.managedcaredigest.comWhere information becomes intelligence.™
SANOFI-AVENTIS MANAGED CARE DIGEST SERIES® / SENIOR CARE DIGEST 200720
LONG-TERM CARE PHARMACY
Data source: Verispan LLC © 2007
Long-term care pharmacy provider count has moderate growth
LONG-TERM CARE PHARMACY PROVIDERS (LTCPPs)*
Number of Long-term CarePharmacy Providers
Percentage of Long-term Care Pharmacy Providers
2005 2006 2005 2006
The number of long-term care pharmacyproviders (LTCPPs) in the U.S. generating atleast half of their revenue from long-term carefacilities was 1,105 in 2006, up 2.4% from1,079 in 2005. This growth was wholly owing
to a moderate increase in the number of inde-pendently owned LTCPPs, to 682 from 645the previous year. Provider organizations ofthis ownership type accounted for 61.7% ofall LTCPPs, compared with 59.8% in 2005.
PERCENTAGE OF LONG-TERM CARE PHARMACY PROVIDERS (LTCPPs), BY SIZE*
3–4 Full-timePharmacists
23.2%
2 Full-timePharmacists
19.0%
Size Unknown8.0%
5+ Full-timePharmacists
29.1%
1 Full-timePharmacist
20.7%
1 Full-timePharmacist
22.4%
2 Full-timePharmacists
20.0%3–4 Full-timePharmacists
23.4%
5+ Full-timePharmacists
31.0%
Size Unknown3.1%
0
60
120
180
240
Num
ber
ofL
TC
PP
s
Pacific Mountain WestN. Central
EastN. Central
SouthCentral
NewEngland
Mid-Atlantic
SouthAtlantic
115 116
6375
122 130
171 178201 196
44 41
163 164
200 2052005 2006
2005 2006
NUMBER OF LONG-TERM CARE PHARMACY PROVIDERS (LTCPPs), BY REGION*
REGIONPacific 115 116 10.7% 10.5%Mountain 63 75 5.8 6.8West North Central 122 130 11.3 11.8East North Central 171 178 15.8 16.1
South Central 201 196 18.6 17.7New England 44 41 4.1 3.7Mid-Atlantic 163 164 15.1 14.8South Atlantic 200 205 18.5 18.6
OWNERSHIPCorporate Owned 434 423 40.2% 38.3%Independently Owned 645 682 59.8 61.7
TOTAL 1,079 1,105 100.0% 100.0%
NUMBER OF LTCPPS INTHE SOUTH ATLANTICREGION INCREASESThe number of LTCPPslocated in the South Atlanticregion increased slightly, to 205 from 200 in 2005.These LTCPPs accounted for18.6% of all such providersin the nation, up fractionallyfrom 18.5% the previousyear, and the highest share byregion. By comparison, thenumber of LTCPPs in theNew England region fell to41 from 44 in 2005. Theseproviders made up just 3.7%of LTCPPs nationally, downfrom 4.1% the prior year, andthe lowest share by region.
METROPOLITAN AREA-BASED SHARE OF ALLLTCPPS EDGES DOWNThe ratio of LTCPPs thatwere located in metropolitanareas to all LTCPPs was77.0% in 2006, down frac-tionally from 77.8% in 2005.Conversely, the ratio ofLTCPPs based in nonmetro-politan areas to all LTCPPsinched up, to 23.0% from22.2% the previous year.Meanwhile, 29.1% of allLTCPPs employed five ormore pharmacists, downfrom 31.0% in 2005, but stillthe largest share by providersize. (Some data not shown.)
NOTE: Percentages may not sum to100% due to rounding.
* On pages 20–26, long-term care pharmacy provider (LTCPP) data pertain only tothose pharmacies that have an implied contract/agreement to perform pharmaceu-tical consulting and/or dispensing services to long-term care facility patients on anongoing basis. They must have at least one licensed pharmacist employed at thelocation and generate at least 50% of their revenue from long-term care facilities.

www.managedcaredigest.comWhere information becomes intelligence.™
SANOFI-AVENTIS MANAGED CARE DIGEST SERIES® / SENIOR CARE DIGEST 200721
AZ
WA
SD
11 / 1.0%
18 / 1.6%
7 / 0.6%
13 /1.2%
19 /1.7%
29 / 2.6%TN
AL
MARI
CT
MD DE
OH
MI
UT
MT
CO
NV
NM
WY
ID
CA
OR
NEIA
NDMN
KSMO
8 / 0.7%
LA
OK
ARTX
KY
MS
WI
ILIN
HI
AK
7 / 0.6%
15 / 1.4%
76 / 6.9% 9 / 0.8%
7 / 0.6%
16 / 1.4%
4 / 0.4%
4 / 0.4%
30 / 2.7%
29 /2.6%
27 /2.4%
11 / 1.0%
12 / 1.1%
17 / 1.5%
10 / 0.9%
3 / 0.3%
68 / 6.2%
15 / 1.4%5 / 0.5%
24 /2.2%
23 /2.1%
88 / 8.0%
61 /5.5%
4 /0.4%
5 / 0.5%3 / 0.3%
8 / 0.7%5 / 0.5%
16 / 1.4%
15 / 1.4%PA NJ
NY
VT
NH
ME
GA
35 /3.2%
60 / 5.4%
2 / 0.2%20 / 1.8%
14 /1.3%
42 / 3.8%
25 /2.3%
7 /0.6%
WV
VA
FL
SC Top 10 States by Number of Long-Term Care PharmacyProviders
46 / 4.2%33 /3.0%
40 /3.6%
40 /3.6% 19 /
1.7%
NC
0 / 0.0%DC
Top 10 states by number of LTCPPs demonstrate consistency
DISTRIBUTION OF LONG-TERM CARE PHARMACY PROVIDERS (LTCPPs)*
Data source: Verispan LLC © 2007
South Atlantic Region (205 / 18.6%)
South Central Region(196 / 17.7%)
West NorthCentral Region (130 / 11.8%) East North
Central Region (178 / 16.1%)
Mid-AtlanticRegion (164 / 14.8%)
New EnglandRegion (41 / 3.7%)Mountain Region
(75 / 6.8%)
1,105 Long-term Care Pharmacy Providers
KEY TO MAPThe first number represents the number of long-term care pharmacy providers in that state or region. The second number representsthe share of all long-term care pharmacy providers in the U.S. located in that state or region.
* State long-term care pharmacyprovider figures are based on thephysical location of the provider. Nolong-term care pharmacy providerswere located in Washington, D.C. Dataare effective as of end-of-year 2006.
Five states serve as home for just under a third of all LTCPPs
Of the 10 states with the greatest number ofLTCPPs in 2006, only Georgia was not like-wise included on the 2005 list. Althoughthese 10 states combined to serve as homefor 556 LTCPPs, up 1.8% from 546 in 2005,
they nevertheless accounted for a fractionallysmaller share of all such providers (50.3%)than the previous year (50.6%). During thisperiod, the numbers of LTCPPs rose in sixof the nine states which returned to the list.
In 2006, the top five states, by number ofLTCPPs—Pennsylvania (88), California (76),Texas (68), New York (61) and Florida (60)—together accounted for nearly a third (31.9%)of all such providers in the nation. For the
third consecutive year, Pennsylvania washome to more LTCPPs than any other state,by a considerable margin. However, the totalnumber of providers located in that state hasdropped 5.4% between 2006 and 2004 (93).
Pacific Region (116 / 10.5%)

www.managedcaredigest.comWhere information becomes intelligence.™
22SANOFI-AVENTIS MANAGED CARE DIGEST SERIES® / SENIOR CARE DIGEST 2007
LONG-TERM CARE PHARMACY
RESIDENTIAL CAREFACILITY PORTION OFALL LTCPP RXS RISESOf prescriptions dispensedby LTCPPs in 2006, 12.8%overall went to residentialcare facilities, up moderatelyfrom 11.9% in 2005 andfrom 11.3% in 2004.LTCPPs that employed twoFT pharmacists dispensedthe highest ratio (13.6%) oftheir drugs, by size, to resi-dential care facilities, whilethe largest LTCPPs—thosewith five or more FT phar-macists—dispensed thelowest ratio (11.0%) in 2006.
SOUTH CENTRALLTCPPS DISPENSEMOST RXS TO HOMESAlthough South Centralregion LTCPPs dispensed71.2% of their prescriptionsto nursing homes in 2006,the highest such ratio byregion, the share slippedfrom 72.7% in 2005.Between 2005 and 2006, thenursing home shares of allprescriptions dispensed byLTCPPs declined in sevenof the eight regions (theMountain region excepted).In the New England region,this ratio fell 5.5 percentagepoints, to 62.2% from 67.7%in 2005, most by region.
LONG-TERM CARE PHARMACY PROVIDER (LTCPP) CUSTOMER MIX
SIZE (# of FT Pharmacists)
1 FT Pharmacist 56.6% 12.7% 10.7% 3.5% 3.9% 12.6%2 FT Pharmacists 57.3 13.6 10.8 5.8 1.2 11.33–4 FT Pharmacists 63.8 11.6 8.2 4.1 2.4 9.85+ FT Pharmacists 73.3 11.0 1.9 2.6 3.5 7.6Size Unknown 47.7 21.3 8.0 7.4 1.2 14.3
OWNERSHIPCorporate Owned 74.2% 10.6% 2.8% 3.2% 2.1% 7.1%Independently Owned 55.5 14.1 10.1 4.7 3.1 12.5
OVERALL AVERAGE 62.7% 12.8% 7.3% 4.1% 2.7% 10.4%
Nursing Home
Residential Care Retail
Mental HealthFacility Hospital Other**
The nursing home resident share of all LTCPPprescriptions dispensed continued to decline in2006, to 62.7% from 64.4% in 2005 and from65.7% in 2004. As in years past, in 2006 thisprescription ratio rose in relation to LTCPP
size: Pharmacy providers employing five ormore full-time (FT) pharmacists (73.3%)dispensed a notably higher ratio of their drugsto nursing home residents than providers withone full-time pharmacist (56.6%) in 2006.
Share of LTCPP drugs dispensed to nursing home residents falls
Data source: Verispan LLC © 2007
LONG-TERM CARE PHARMACY PROVIDER (LTCPP) CUSTOMER MIX
20%
35%
50%
65%
80%
%of
Pre
scri
ptio
nsD
ispe
nsed
Pacific Mountain WestNorth
Central
EastNorth
Central
SouthCentral
NewEngland
Mid-Atlantic
SouthAtlantic
51.8%
62.7%59.7%
64.8%
71.2%
62.2%65.8%
58.1%
NursingHome
ResidentialCare
Retail Mental HealthFacility
Hospital0%
17%
34%
51%
68%
%of
Pre
scri
ptio
nsD
ispe
nsed
65.7% 64.4% 62.7%
11.3% 11.9% 12.8%6.6% 7.1% 7.3%
3.7% 3.9% 4.1% 2.7% 2.7% 2.7%
2004 2005 2006
LTCPP NURSING HOME CUSTOMER MIX, BY REGION
Percentage of Prescriptions Dispensed*
* Percentages may not sum to 100% dueto rounding.
** “Other” includes retirement commu-nities, hospices, home health agen-cies, correctional centers, substanceabuse centers and all others.

www.managedcaredigest.comWhere information becomes intelligence.™
SANOFI-AVENTIS MANAGED CARE DIGEST SERIES® / SENIOR CARE DIGEST 200723
LTCPPs dispense fewer Rxs per month to nursing homes
Overall, LTCPPs that generated at least halftheir revenue from long-term care facilitiesdispensed 11,287.8 nursing home prescrip-tions per month in 2006, down 1.3% from11,435.3 in 2005. Much of this decline
occurred among New England regionLTCPPs, which dispensed 20,215.4 nursinghome prescriptions per month, an 11.1%decline from 22,750.0 the year before, thehighest annual percentage drop by region.
NUMBER OF LTCPP NURSING HOME PRESCRIPTIONS PER LTCPP PER MONTH
2004 2005 2006
LTCPP Nursing Home Patient Prescriptions per Month
4,000
9,000
14,000
19,000
24,000
Rxs
Dis
pens
ed
Pacific Mountain WestN. Central
EastN. Central
SouthCentral
NewEngland
Mid-Atlantic
SouthAtlantic
13,913.0 13,701.0
10,607.3 10,184.2
7,924.6 7,521.2
13,100.4 13,147.2
10,221.6 10,037.4
22,750.0
20,215.4
10,659.2 10,978.6 10,986.5 11,186.8
2005 2006
LARGEST LTCPPNURSING HOME RXAVERAGE GROWSThe average number ofnursing home prescriptionsdispensed per month by thelargest LTCPPs—thoseemploying five or moreFT pharmacists—continuedto rise, to 23,618.5 from23,518.9 in 2005 and from 23,140.9 in 2004. Bycomparison, the number ofnursing home prescriptionsdispensed per month by thesmallest LTCPPs—thoseemploying one FT pharma-cist—fell again, to 3,027.8from 3,099.3 in 2005,and from 3,191.0 in 2004.
INDEPENDENT LTCPPsAVERAGE FEWERNURSING HOME RXSThe number of nursing homeprescriptions dispensed by independently ownedLTCPPs fell in 2006, to6,440.7 per month from6,549.6 in 2005. In the twoyears from 2004 (8,224.8) to 2006, the number ofnursing home prescriptionsdispensed per month byLTCPPs of this owner typedeclined 21.7%. Conversely,over that same two-yearperiod, the number of suchprescriptions dispensed bycorporate-owned LTCPPsincreased 20.1%, to 18,233.3per month from 15,185.9.
NUMBER OF LTCPP NURSING HOME PRESCRIPTIONS PER LTCPP PER MONTH,BY OWNERSHIP TYPE
2,000
7,000
12,000
17,000
22,000
Rxs
Dis
pens
ed
CorporateOwned
IndependentlyOwned
OverallAverage
17,853.2 18,233.3
6,549.6 6,440.7
11,435.3 11,287.8
2005 2006
Data source: Verispan LLC © 2007
REGION
Pacific 13,863.2 13,913.0 13,701.0Mountain 9,037.2 10,607.3 10,184.2West North Central 7,684.2 7,924.6 7,521.2East North Central 13,147.0 13,100.4 13,147.2
South Central 9,970.2 10,221.6 10,037.4New England 23,220.0 22,750.0 20,215.4Mid-Atlantic 10,068.3 10,659.2 10,978.6South Atlantic 11,305.9 10,986.5 11,186.8
SIZE (# of FT Pharmacists)
1 FT Pharmacists 3,191.0 3,099.3 3,027.82 FT Pharmacists 4,724.4 4,547.4 4,562.33–4 FT Pharmacists 8,377.3 8,322.4 8,271.05+ FT Pharmacists 23,140.9 23,518.9 23,618.5
OVERALL AVERAGE 11,211.1 11,435.3 11,287.8
NUMBER OF LTCPP NURSING HOME PRESCRIPTIONS PER LTCPP PER MONTH,BY REGION

www.managedcaredigest.comWhere information becomes intelligence.™
SANOFI-AVENTIS MANAGED CARE DIGEST SERIES® / SENIOR CARE DIGEST 2007
LONG-TERM CARE PHARMACY
NUMBER OF FTPHARMACISTS PERLTCPP INCREASESThe overall average numberof FT pharmacists employedby LTCPPs edged up, to 4.5from 4.4 in 2005. Much ofthis increase is owing toLTCPPs in the New Englandregion, which employed5.4% more FT pharmacistsin 2006 (7.8) than in 2005(7.4), by far the largestannual increase by region.LTCPPs in this regionalso boosted their averagenumber of part-time pharma-cists, to 1.9 from 1.8 theprevious year. The overallaverage number of part-timepharmacists employed byLTCPPs remained at 1.7.
CARDIOVASCULARPART OF ALL LTCPPPRESCRIPTIONS FALLSOverall, 13.2% of prescrip-tions dispensed by LTCPPsto nursing homes werecardiovascular, down from13.5% in 2005, but still thehighest share by therapeuticcategory. Shares of prescrip-tions in this therapeutic cate-gory fell for corporate- (to14.3% from 14.5% in 2005)and independently (to 12.5%from 12.8%) owned LTCPPsalike. Conversely, shares ofprescriptions for Alzheimer’srose for corporate- (to 6.4%from 6.0% in 2005) andindependently (to 6.6% from5.8%) owned LTCPPs alike.
Independent LTCPP nursing home psychiatric drug share dips
Of prescriptions dispensed to nursing homes in2006 by independently owned LTCPPs gener-ating at least half their revenue from long-termcare facilities, 13.0% were psychiatric, downfractionally from 13.1% in 2005, but the largest
share by therapeutic category for this ownertype. By comparison, 12.9% of all prescriptionsdispensed by independent LTCPPs treatedhypertension, unchanged from the year before,and the second highest share by owner type.
24Data source: Verispan LLC © 2007
NUMBER OF PHARMACISTS PER LONG-TERM CARE PHARMACY PROVIDER (LTCPP),BY REGION
Full-time Pharmacists Part-time Pharmacists
REGION
Pacific 4.1 4.1 1.9 1.9Mountain 3.9 3.8 1.6 1.6West North Central 3.6 3.6 1.4 1.4East North Central 5.2 5.2 1.8 1.9
South Central 3.9 3.9 1.5 1.5New England 7.4 7.8 1.8 1.9Mid-Atlantic 4.8 4.9 2.0 2.0South Atlantic 4.4 4.4 1.7 1.7
OVERALL AVERAGE 4.4 4.5 1.7 1.7
2005 2006 2005 2006
COMMON RXs DISPENSED BY LONG-TERM CARE PHARMACY PROVIDERS (LTCPPs),BY OWNERSHIP TYPE
Corporate Owned Independently Owned
PRESCRIPTION
Alzheimer’s 6.0% 6.4% 5.8% 6.6%Anti-Arthritics 6.4 6.2 6.8 6.1Anti-Infectives 7.0 7.0 6.8 6.4
Cardiovascular 14.5 14.3 12.8 12.5Diabetes 6.8 6.7 7.9 8.2Gastrointestinal 9.1 9.0 7.9 7.7
Osteoporosis 2.2 2.4 2.1 2.1Pain Block 6.7 6.9 6.5 7.0Hypertension 12.9 12.8 12.9 12.9Psychiatric 10.5 10.7 13.1 13.0
2005 2006 2005 2006
RXs COMMONLY DISPENSED BY LONG-TERM CARE PHARMACY PROVIDERS (LTCPPs)
Cardiovascular Hypertension Psychiatric Gastrointestinal Diabetes Pain Block Anti-Infectives Alzheimer’s0%
4%
8%
12%
16%
%of
All
Rxs
Dis
pens
ed 13.5% 13.2% 12.9% 12.9%11.9% 12.1%
8.5% 8.2%7.4% 7.6%
6.6% 6.9% 6.9% 6.6%5.9%
6.5%
2005 2006
Percentage of all Prescriptions Dispensed to Nursing Homes

www.managedcaredigest.comWhere information becomes intelligence.™
SANOFI-AVENTIS MANAGED CARE DIGEST SERIES® / SENIOR CARE DIGEST 200725
RXs DISPENSED BY LONG-TERM CARE PHARMACY PROVIDERS (LTCPPs), BY SIZE*
1 FT Pharmacist 2 FT Pharmacists 3–4 FT Pharmacists 5+ FT Pharmacists Overall Average
2005 2006 2005 2006 2005 2006 2005 2006 2005 2006
Data source: Verispan LLC © 2007
Anti-Arthritics
Anti-Convulsives
BehavioralConditions
Parkinson’sDisease
Thyroid Osteoporosis Cancer Epilepsy AIDS Arrhythmia0%
2%
4%
6%
8%
%of
All
Rxs
Dis
pens
ed
6.6%6.2%
3.8% 3.6%3.2%
3.5% 3.5% 3.5%
2.4% 2.4% 2.2% 2.2%1.5% 1.4%
0.9% 1.0%0.7% 0.8%
0.5% 0.5%
2005 2006
RXs DISPENSED BY LONG-TERM CARE PHARMACY PROVIDERS (LTCPPs)*
PRESCRIPTIONS
AIDS 0.5% 0.5% 0.9% 0.9% 0.6% 0.6% 0.8% 0.8% 0.7% 0.8%Alzheimer’s Disease 5.5 5.5 6.0 6.2 7.2 7.2 5.2 6.0 5.9 6.5Anti-Arthritics 6.9 6.8 6.7 6.4 5.8 5.7 6.9 6.6 6.6 6.2
Anti-Convulsives 3.7 3.7 4.1 4.0 3.2 3.2 4.1 4.0 3.8 3.6Anti-Infectives 7.9 7.8 7.4 7.5 5.5 5.5 6.9 7.0 6.9 6.6Arrhythmia 0.8 0.7 0.5 0.4 0.4 0.4 0.5 0.4 0.5 0.5
Behavioral Conditions 2.9 3.5 2.6 2.7 4.0 4.2 3.2 3.3 3.2 3.5Cancer 1.7 1.8 1.7 1.7 1.4 1.4 1.2 1.2 1.5 1.4Cardiovascular 12.5 12.0 12.0 12.0 13.6 13.3 15.5 15.3 13.5 13.2
Diabetes 7.7 7.9 6.4 6.6 8.2 8.2 7.2 7.3 7.4 7.6Epilepsy 1.1 1.1 1.0 1.0 0.8 0.9 0.7 0.7 0.9 1.0Gastrointestinal 8.9 8.6 7.5 7.4 8.7 8.9 8.6 8.6 8.5 8.2
Hypertension 12.5 12.5 11.4 11.2 13.7 13.5 13.8 13.7 12.9 12.9Osteoporosis 2.0 2.1 2.3 2.6 2.0 2.1 2.4 2.3 2.2 2.2Pain Block 6.3 6.5 7.1 7.3 6.9 6.8 6.1 6.6 6.6 6.9
Parkinson’s Disease 3.4 3.2 3.7 3.8 3.1 3.2 3.9 3.9 3.5 3.5Psychiatric 11.9 12.3 15.0 14.4 12.3 12.3 9.3 8.9 11.9 12.1Thyroid 2.9 2.8 2.7 2.8 1.9 2.0 2.2 2.1 2.4 2.4
Percentage of all Prescriptions Dispensed to Nursing Homes
DIABETES SHARE OFALL LTCPP-DISPENSEDDRUGS INCREASESOf all prescriptionsdispensed to nursing homesby LTCPPs, 7.6% treateddiabetes, up slightly from7.4% in 2005. Between2005 and 2006, the ratio ofprescriptions of this type to all drugs dispensed byLTCPPs to nursing homesrose in three of four providersize categories and remainedunchanged in the fourth—those employing three-to-four FT pharmacists. Still,these midsized LTCPPsaccounted for the highestshare of nursing home-dispensed diabetes drugs, bysize, in 2005 and 2006 alike.
MIDSIZED LTCPPsDISPENSE HIGHESTRATIO OF GI DRUGSOf LTCPPs that dispensedgastrointestinal prescriptiondrugs to nursing homes,those employing three-to-four FT pharmacistsaccounted for the highestshare, by provider size, at8.9%, up from 8.7% in 2005.LTCPPs of this size gener-ated the only annualpercentage rise for prescrip-tions in this drug category.Overall, the ratio of gastroin-testinal drugs to all prescrip-tions dispensed by LTCPPs to nursing homes declined,to 8.2% from 8.5% in 2005.
Overall, the ratio of anti-arthritics to allprescription drugs dispensed by LTCPPs to nursing homes declined in 2006, to 6.2% from 6.6% in 2005. This ratio slipped,between 2005 and 2006, regardless of LTCPP
size. At the largest LTCPPs, for instance—those employing five or more FT pharmacistsper provider—the anti-arthritics drug classshare of all prescriptions dispensed to nursinghomes dropped to 6.6% from 6.9% in 2005.
Anti-arthritics share of LTCPP nursing home prescriptions slips
* For prescription drug benefit and common diagnoses and procedure dataon Medicare beneficiaries with Part D coverage, please refer to theGovernment Digest, pp. 15–19.

www.managedcaredigest.comWhere information becomes intelligence.™
SANOFI-AVENTIS MANAGED CARE DIGEST SERIES® / SENIOR CARE DIGEST 200726
LONG-TERM CARE PHARMACY
LONG-TERM CARE PHARMACY PROVIDER (LTCPP) FINANCIALS
2005 2006 2005 2006 2005 2006
Average Cost per LTC Prescription
% of Total LTCPP Drug Sales to Long-term Care Facilities
% of Total LTCPP Drug Revenue from Long-term Care Facilities
$0
$25
$50
$75
$100
Cos
tper
LT
CP
resc
ript
ion
Pacific Mountain WestNorth
Central
EastNorth
Central
SouthCentral
NewEngland
Mid-Atlantic
SouthAtlantic
$70.61$66.71 $68.56 $68.04
$51.59 $51.06 $51.77 $52.09$44.48 $44.98
$72.73 $76.07
$65.67 $66.13
$52.77 $53.62
2005 2006
LONG-TERM CAREPART OF TOTAL LTCPPDRUG SALES FALLSLong-term care facilitiesaccounted for 88.6% of totalLTCPP prescription drugsales, down from 89.4% in2005. Between 2005 and2006, this ratio declined inevery region but that of theMountain states (up fraction-ally, to 87.2% from 87.1%).The percentage of totalLTCPP drug sales that wentto long-term care facilitieslikewise dropped amongcorporate- (to 94.7% from94.9% in 2005) and inde-pendently (to 83.4% from84.7%) owned LTCPPs alike.
INDEPENDENT LTCPPDRUG REVENUE RATIOCONTINUES TO DROPIn the three years from 2004to 2006, the long-term carefacility part of total LTCPPdrug revenue at independ-ently owned LTCPPs dropped4.1 percentage points, to80.2% from 84.3%.Conversely, over that samethree-year period, this ratioincreased 2.8 percentagepoints at corporate-ownedLTCPPs, to 91.9% from89.1%. As a consequence, thepercentage gap for this ratiobetween LTCPPs of the twoownership types grew,to 11.7 percentage pointsfrom 4.8 points in 2004.
Corporate LTCPP prescription costs per long-term care bed fall
The prescription cost per long-term care beddeclined 2.5% at corporate-owned LTCPPsin 2006, to $50.06 from $51.33 in 2005.Conversely, such costs increased fractionallyat independently owned LTCPPs, to $60.99
from $60.41 the previous year. As a conse-quence, the average prescription cost perlong-term care bed for LTCPPs of the latterownership type exceeded that of the formerby 21.8% in 2006, up from 17.7% in 2005.
Data source: Verispan LLC © 2007
AVERAGE COST PER LONG-TERM CARE PRESCRIPTION, BY REGION
REGIONPacific $70.61 $66.71 92.9% 91.9% 88.5% 87.6%Mountain 68.56 68.04 87.1 87.2 82.2 83.0West North Central 51.59 51.06 78.4 76.9 73.5 73.2East North Central 51.77 52.09 89.7 89.1 84.4 83.5
South Central 44.48 44.98 91.7 91.2 91.3 90.8New England 72.73 76.07 91.5 90.3 90.7 88.9Mid-Atlantic 65.67 66.13 91.9 91.2 89.0 88.5South Atlantic 52.77 53.62 88.9 88.6 87.1 86.7
OWNERSHIP
Corporate Owned $51.33 $50.06 94.9% 94.7% 92.1% 91.9%Independently Owned 60.41 60.99 84.7 83.4 81.1 80.2
AVERAGE $56.70 $56.59 89.4% 88.6% 86.3% 85.6%
40%
55%
70%
85%
100%
%of
Tot
alD
rug
Sal
es
1 FT Pharmacist 2 FT Pharmacists 3–4 FT Pharmacists 5+ FT Pharmacists
85.0% 83.2% 85.1% 84.4%88.7%
94.7% 94.4%2005 200688.3%
PERCENTAGE OF TOTAL DRUG SALES TO LONG-TERM CARE FACILITIES, BY SIZE

www.managedcaredigest.comWhere information becomes intelligence.™
SANOFI-AVENTIS MANAGED CARE DIGEST SERIES® / SENIOR CARE DIGEST 200727
ASSISTED LIVING FACILITIES
In 2006, 1,964 (14.2%) of the 13,871 assistedliving facilities (ALFs) in the U.S. were locatedin the Mid-Atlantic region, up from 1,896(14.0%) in 2005, the third largest share of theeight geographic regions profiled. The South
Atlantic (24.3%) and Pacific (16.5%) regionswere home to the largest shares of ALFs in2006. By comparison, the smallest share ofALFs were located in New England (5.2%) in 2006, unchanged from the previous year.
MORE ASSISTEDLIVING FACILITIES AREINDEPENDENTLY RUNBetween 2005 (10,109) and2006 (10,331), the number of ALFs in the U.S. that were independently ownedincreased 2.2%. In spite ofthis growth, independentlyowned ALFs accounted for74.5% of ALFs nationwide,compared with 74.6.% theyear before. By comparison,the number of corporateowned ALFs fell slightly in2006, to 3,540 from 3,577.
NUMBER OF ALFs RISESIN THE EAST NORTHCENTRAL REGIONThe total number of ALFslocated in the East NorthCentral region increased to1,419 in 2006 from 1,366 in 2005. During this period,the number of ALFs grew for each of the five states in this region: Illinois (to 204from 193 in 2005), Indiana(to 139 from 137), Ohio (to 383 from 368), Michigan (to 344 from 330) andWisconsin (to 349 from 338).(Some data not shown.)
ASSISTED LIVING FACILITIES (ALFs), BY REGION*
2005** 2006 2005** 2006REGIONPacific 2,232 2,287 16.5% 16.5%Mountain 1,020 1,033 7.5 7.4West North Central 1,410 1,436 10.4 10.4East North Central 1,366 1,419 10.1 10.2
South Central 1,601 1,633 11.8 11.8New England 711 723 5.2 5.2Mid-Atlantic 1,896 1,964 14.0 14.2South Atlantic 3,308 3,376 24.4 24.3
TOTAL 13,544 13,871 100.0% 100.0%
* Verispan defines an assisted livingfacility (ALF) as a facility in whichresidents are provided 24-hour moni-toring and assistance with activitiesof daily living (ADL). A nursingstaff administers medications. Thesefacilities are not certified or regu-lated by Medicare.
** Assisted living facility data for 2005were restated and, therefore, differfrom those shown in the Senior CareDigest for 2006.
Number of Assisted Living Facilities Percentage of Assisted Living Facilities
PERCENTAGE OF ASSISTED LIVING FACILITIES (ALFs), BY REGION
0%
8%
16%
24%
32%
%of
Ass
iste
dL
ivin
gF
acil
itie
s
Pacific Mountain WestNorth
Central
EastNorth
Central
SouthCentral
NewEngland
Mid-Atlantic
SouthAtlantic
16.5% 16.5%
7.5% 7.4%10.4% 10.4% 10.1% 10.2% 11.8% 11.8%
5.2% 5.2%
14.0% 14.2%
24.4% 24.3%2005** 2006
Data source: Verispan LLC © 2007
Larger share of assisted living facilities is in the Mid-Atlantic
CorporateOwned3,435
(25.4%)
IndependentlyOwned10.109(74.6%)
ASSISTED LIVING FACILITIES (ALFs),BY OWNERSHIP TYPE
CorporateOwned3,540
(25.5%)
IndependentlyOwned10,331(74.5%)
ASSISTED LIVING FACILITIES (ALFs),BY OWNERSHIP TYPE
2005** 2006
NOTE: Percentages may not always sum to 100% due to rounding.

www.managedcaredigest.comWhere information becomes intelligence.™
SANOFI-AVENTIS MANAGED CARE DIGEST SERIES® / SENIOR CARE DIGEST 200728
ASSISTED LIVING FACILITIES
Top 10 ALF states represent majority of nation’s facilities
DISTRIBUTION OF ASSISTED LIVING FACILITIES (ALFs)*
KEY TO MAPThe first number represents the number of assisted living facilities in that state or region. The second number represents the share ofall assisted living facilities in the U.S. located in that state or region.
* State assisted living facility figures are based on the physical location ofthe facility. Data are effective as ofend-of-year 2006.
Numbers of ALFs grow across all eight geographic regions
The top 10 states by number of ALFs combinedfor 7,615 facilities in 2006, up 2.5% from 7,431 in 2005. Four of these top 10 states eachreported an annual rise in the numbers of ALFsof at least three percentage points: Pennsylvania
(4.3%), Ohio (4.1%), Washington (3.4%) and Florida (3.0%). In spite of this moderategrowth, ALFs in these top 10 states represented54.9% of ALFs in the U.S. (13,871) in 2006,unchanged from the previous year (13,544).
Between 2005 and 2006, the numbers ofALFs rose in all eight geographic regionsprofiled. The East North Central region expe-rienced the greatest annual percentage rise, to1,419 from 1,366 the previous year, or 3.9%.
The South Atlantic region was home to thelargest number of ALFs, by region, at 3,376,up 2.1% from 3,308 in 2005. By comparison,723 ALFs were located in the New Englandregion, up 1.7% from 711 the previous year.
AZ
WA
SD
201 / 1.4%
394 / 2.8%
106 / 0.8%
81 /0.6%
256 /1.8%
245 / 1.8%TN
AL
MARI
CT
MD DE
OH
MI
UT
MT
CO
NV
NM
WY
ID
CA
OR
NEIA
NDMN
KSMO
30 / 0.2%
LA
OK
ARTX
KY
MS
WI
ILIN
HI
AK
83 / 0.6%
304 / 2.2%
1,534 / 11.1%
104 / 0.7%
170 / 1.2%
336 / 2.4%
23 / 0.2%
11 / 0.1%
532 / 3.8%
152 /1.1%
300 /2.2%
65 / 0.5%
164 / 1.2%
152 / 1.1%
51 / 0.4%
44 / 0.3%
692 / 5.0%
117 / 0.8%96 / 0.7%
46 /0.3%
100 /0.7%
1,337 / 9.6%
412 /3.0%
137 /1.0%
61 / 0.4%114 / 0.8%
119 / 0.9%63 / 0.5%
229 / 1.7%
215 / 1.5%PA NJ
NY
VT
NH
ME
GA
344 /2.5%
1,285 / 9.3%
27 / 0.2%304 / 2.2%
328 /2.4%
586 / 4.2%
460 /3.3%
34 /0.2%
WV
VA
FL
SC Top 10 States by Number of Assisted Living Facilities
383 / 2.8%139 /1.0%
204 /1.5%
349 /2.5%
344 /2.5%
NC
8 / 0.1%DC
South Central Region(1,633 / 11.8%)
West NorthCentral Region (1,436 / 10.4%) East North
Central Region (1,419 / 10.2%)
Mid-AtlanticRegion (1,964 / 14.2%)
Mountain Region (1,033 / 7.4%)
13,871 Assisted Living Facilities
Pacific Region (2,287 / 16.5%)
New EnglandRegion(723 / 5.2%)
South Atlantic Region (3,376 / 24.3%)
Data source: Verispan LLC © 2007

www.managedcaredigest.comWhere information becomes intelligence.™
SANOFI-AVENTIS MANAGED CARE DIGEST SERIES® / SENIOR CARE DIGEST 200729
Current Rank
Previous Rank
# of Assisted Living
Facilities# of States
Data source: Verispan LLC © 2007
THE NATION’S 35 LARGEST ASSISTED LIVING CHAINS1
1 This table includes all assisted living facilities owned and leased by these chains.2 Merged with Alterra Healthcare.3 Formerly Beverly Enterprises.
NAME / HEADQUARTERS
Brookdale Living Communities Inc.2 / Chicago, Ill. 1 2 507 35Sunrise Senior Living / McLean, Va. 2 1 362 34Extendicare Health Services / Milwaukee, Wis. 3 3 215 17
Emeritus Assisted Living / Seattle, Wash. 4 4 194 34Sun West Management / Salem, Ore. 5 7 182 28Health Care Property Investors / Orlando, Fla. 6 5 154 31
Atria Communities / Louisville, Ky. 7 6 120 27Five Star Quality Care / Newton, Mass. 8 8 97 20Manor Care / Toledo, Ohio 9 9 83 15
Evangelical Lutheran Good Samaritan / Sioux Falls, S.D. 10 11 82 18Summerville Senior Living / San Ramon, Calif. 11 16 76 13Life Care Services Corporation / Des Moines, Iowa 12 19 66 25
Merrill Gardens / Seattle, Wash. 13 13 63 11Americare Properties / Sikeston, Mo. 14 12 62 4Genesis Health Care / Kennett Square, Penn. 15 21 45 12
Benchmark Assisted Living / Wellesley, Mass. 16 18 42 6Harbor Senior Concepts / Madison, Wisc. 17 — 36 3Outlook Pointe/Balanced Care Corp. / Mechanicsburg, Penn. 17 20 36 6
Good Neighbor Care / Springfield, Ore. 19 25 34 9Century Park Associates / Chattanooga, Tenn. 19 N/A 34 20Aegis Assisted Living / Redmond, Wash. 21 21 32 3
Hearthstone Senior Services / Spring, Texas 21 23 32 10Leisure Care / Bellevue, Wash. 23 25 29 8Golden Ventures3 / Fort Smith, Ark. 23 23 29 9
Ecumen / Shoreview, Minn. 25 28 28 2Mountain West Retirement / Salem, Ore. 25 31 28 2Bickford Senior Living Group / Olathe, Kansas 25 30 28 5
Horizon Bay Senior Communities / Tampa, Fla. 28 34 25 8Prestige Care / Vancouver, Wash. 29 32 24 7Our House Assisted Living / Sun Prairie, Wisc. 30 29 23 2
Kisco Senior Living / Carlsbad, Calif. 31 — 22 7Regency South Pacific Facility Supply / Issaquah, Wash. 31 — 22 5JEA Senior Living / Vancouver, Wash. 33 34 21 7
Sun Healthcare Group / Albuquerque, N.M. 33 — 21 11Elmcroft Assisted Living / Louisville, Ky. 35 — 20 8
TOTAL/AVERAGE 2,874
SUN WEST ADDS LARGENUMBER OF ASSISTEDLIVING FACILITIESIn 2006, Sun West Manage-ment operated 182 assistedliving facilities, up substan-tially from 112 in 2005. SunWest Management ran thefifth largest number of ALFsin 2006, compared with theseventh most the previousyear. Of the 29 assisted livingchains ranked among thenation’s 35 largest in both2005 and 2006, Life CareServices Corporation (to 66from 57 facilities), moved up most in the rankings in2006, to 12 from 19 in 2005.
35 LARGEST CHAINSSERVE FEWER NUMBEROF STATES ON AVERAGEOn average, the 35 largestassisted living chains oper-ated facilities in 13 states in 2006, down slightly from 14 states in 2005. Fewer thanhalf (17) of the 35 largestassisted living chains ranfacilities in at least 10 states,compared with 19 the yearbefore. However, fourchains—Brookdale LivingCommunities Inc. (35),Sunrise Senior Living (34),Emeritus Assisted Living (34)and Health Care PropertyInvestors (31)—operatedALFs in more than 30 states,up from three chains in 2005.
The 35 largest assisted living chains in theU.S. operated 2,874 ALFs in 2006, a 7.9%increase from 2,663 in 2005. These 35 largestchains accounted for 20.7% of the 13,871facilities nationwide, up from 19.7% the year
before. The three largest chains—BrookdaleLiving Communities Inc. (507), SunriseSenior Living (362) and Extendicare HealthServices (215)—together operated 1,084 facil-ities, up a notable 16.1% from 934 in 2005.
Nation’s 35 largest assisted living chains operate many facilities

www.managedcaredigest.comWhere information becomes intelligence.™
SANOFI-AVENTIS MANAGED CARE DIGEST SERIES® / SENIOR CARE DIGEST 2007
HOME CARE INDUSTRY OVERVIEW
After a notable 14.0% increase between 2001(11,677) and 2005 (13,313), the number ofhome care agencies in the U.S. grew only frac-tionally in 2006 (to 13,333). Between 2005 and2006, 29 states had a decline in the number of
home care agencies, up from 23 states the yearbefore. Just seven states recorded double-digitannual percentage rises in the numbers of agen-cies, down from 12 in 2005. Hawaii (23.8%)had the largest annual percentage rise in 2006.
AGENCIES ARE VERYBROADLY DEFINEDA home care agency may beincluded in the database forthis Digest if it is licensedby the state in which it islocated, certified by theCenters for Medicare andMedicaid Services or part of a licensed home carechain. It must also have atleast three nonadministrativestaff members (i.e., fieldmembers) permanentlylocated in that office. Finally, the agency staffmust provide at least twotypes of home care services,except where the agency is providing only skillednursing care. Excludedfrom the database are homecare agencies offering onlydurable medical equipmentand home care agencybranch offices with staffsthat rotate between andamong several offices.
Home care agency growth trend slows considerably
Data source: Verispan LLC © 2007
NUMBER OF HOME CARE AGENCIES IN THE UNITED STATES
Total No. Total No. % Change Total No. % Change Population Agencies/in 2005 in 2006 2005–2006 in 1986 1986–2006 65+ (000s)* 1,000**
* State population data are a projection of the U.S. Department of CommerceBureau of the Census, PopulationDistribution Branch, published July 2005.
** “Per 1,000” ratio is for people age 65 and older.
STATE
Alabama 198 221 11.6% 111 99.1% 604 0.37Alaska 17 16 –5.9 3 433.3 44 0.36Arizona 122 116 –4.9 70 65.7 758 0.15
Arkansas 228 225 –1.3 183 23.0 384 0.59California 957 940 –1.8 401 134.4 3,869 0.24Colorado 182 179 –1.6 109 64.2 465 0.38
Connecticut 137 139 1.5 123 13.0 474 0.29Delaware 35 31 –11.4 21 47.6 112 0.28Florida 1,309 1,358 3.7 148 817.6 2,993 0.45
Georgia 176 194 10.2 74 162.2 870 0.22Hawaii 21 26 23.8 0 — 175 0.15Idaho 74 75 1.4 23 226.1 164 0.46
Illinois 476 481 1.1 288 67.0 1,530 0.31Indiana 259 281 8.5 106 165.1 778 0.36Iowa 196 195 –0.5 126 54.8 435 0.45
Kansas 261 247 –5.4 112 120.5 357 0.69Kentucky 212 215 1.4 95 126.3 526 0.41Louisiana 312 304 –2.6 119 155.5 532 0.57
Maine 92 80 –13.0 20 300.0 193 0.42Maryland 91 85 –6.6 96 –11.5 645 0.13Massachusetts 183 185 1.1 161 14.9 853 0.22
Michigan 356 349 –2.0 157 122.3 1,258 0.28Minnesota 353 329 –6.8 143 130.1 623 0.53Mississippi 145 162 11.7 135 20.0 358 0.45
Missouri 212 212 0.0 175 21.1 773 0.27Montana 53 50 –5.7 20 150.0 129 0.39Nebraska 104 103 –1.0 30 243.3 234 0.44
Nevada 83 93 12.0 16 481.3 273 0.34New Hampshire 71 70 –1.4 42 66.7 163 0.43New Jersey 186 175 –5.9 54 224.1 1,129 0.15
New Mexico 104 98 –5.8 42 133.3 235 0.42New York 650 639 –1.7 144 343.8 2,515 0.25North Carolina 426 425 –0.2 107 297.2 1,054 0.40
North Dakota 36 36 0.0 24 50.0 94 0.38Ohio 520 515 –1.0 204 152.5 1,529 0.34Oklahoma 304 320 5.3 123 160.2 469 0.68
Oregon 81 80 –1.2 60 33.3 470 0.17Pennsylvania 415 423 1.9 199 112.6 1,893 0.22Rhode Island 52 46 –11.5 15 206.7 150 0.31
South Carolina 119 113 –5.0 36 213.9 535 0.21South Dakota 59 58 –1.7 17 241.2 111 0.52Tennessee 328 341 4.0 253 34.8 750 0.45
Texas 2,167 2,176 0.4 490 344.1 2,272 0.96Utah 129 127 –1.6 22 477.3 216 0.59Vermont 20 22 10.0 21 4.8 82 0.27
Virginia 316 289 –8.5 95 204.2 865 0.33Washington 148 143 –3.4 42 240.5 721 0.20Washington DC 23 23 0.0 14 64.3 67 0.34
West Virginia 79 71 –10.1 33 115.2 278 0.26Wisconsin 192 198 3.1 118 67.8 722 0.27Wyoming 44 54 22.7 30 80.0 62 0.87
TOTAL U.S. 13,313 13,333 0.2% 5,250 154.0% 36,790 0.36
30
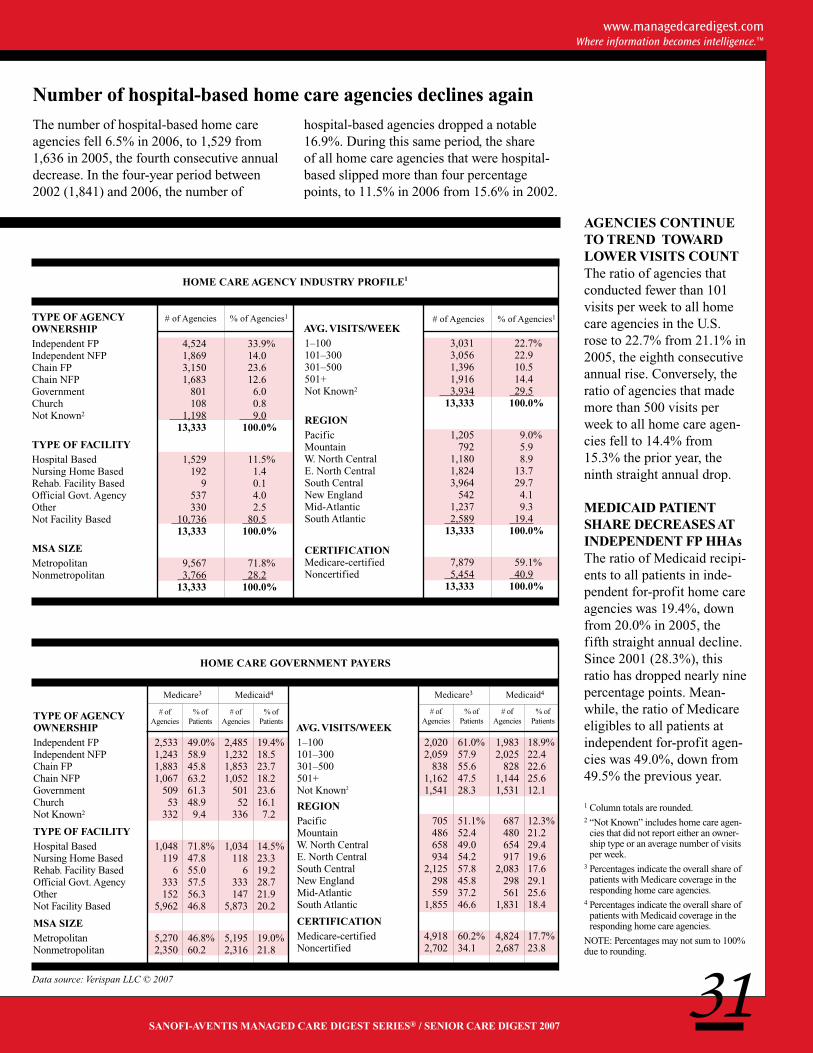
www.managedcaredigest.comWhere information becomes intelligence.™
SANOFI-AVENTIS MANAGED CARE DIGEST SERIES® / SENIOR CARE DIGEST 200731
The number of hospital-based home careagencies fell 6.5% in 2006, to 1,529 from1,636 in 2005, the fourth consecutive annualdecrease. In the four-year period between2002 (1,841) and 2006, the number of
hospital-based agencies dropped a notable16.9%. During this same period, the share of all home care agencies that were hospital-based slipped more than four percentagepoints, to 11.5% in 2006 from 15.6% in 2002.
AGENCIES CONTINUETO TREND TOWARDLOWER VISITS COUNTThe ratio of agencies thatconducted fewer than 101visits per week to all homecare agencies in the U.S.rose to 22.7% from 21.1% in2005, the eighth consecutiveannual rise. Conversely, theratio of agencies that mademore than 500 visits perweek to all home care agen-cies fell to 14.4% from15.3% the prior year, theninth straight annual drop.
MEDICAID PATIENTSHARE DECREASES ATINDEPENDENT FP HHAsThe ratio of Medicaid recipi-ents to all patients in inde-pendent for-profit home careagencies was 19.4%, downfrom 20.0% in 2005, thefifth straight annual decline.Since 2001 (28.3%), thisratio has dropped nearly ninepercentage points. Mean-while, the ratio of Medicareeligibles to all patients atindependent for-profit agen-cies was 49.0%, down from49.5% the previous year.
Number of hospital-based home care agencies declines again
Data source: Verispan LLC © 2007
1 Column totals are rounded.2 “Not Known” includes home care agen-
cies that did not report either an owner-ship type or an average number of visitsper week.
3 Percentages indicate the overall share ofpatients with Medicare coverage in theresponding home care agencies.
4 Percentages indicate the overall share ofpatients with Medicaid coverage in theresponding home care agencies.
NOTE: Percentages may not sum to 100%due to rounding.
HOME CARE AGENCY INDUSTRY PROFILE1
TYPE OF AGENCYOWNERSHIPIndependent FP 4,524 33.9%Independent NFP 1,869 14.0Chain FP 3,150 23.6Chain NFP 1,683 12.6Government 801 6.0Church 108 0.8Not Known2 1,198 9.0
13,333 100.0%
TYPE OF FACILITYHospital Based 1,529 11.5%Nursing Home Based 192 1.4Rehab. Facility Based 9 0.1Official Govt. Agency 537 4.0Other 330 2.5Not Facility Based 10,736 80.5
13,333 100.0%
MSA SIZEMetropolitan 9,567 71.8%Nonmetropolitan 3,766 28.2
13,333 100.0%
AVG. VISITS/WEEK1–100 3,031 22.7%101–300 3,056 22.9301–500 1,396 10.5501+ 1,916 14.4Not Known2 3,934 29.5
13,333 100.0%
REGIONPacific 1,205 9.0%Mountain 792 5.9W. North Central 1,180 8.9E. North Central 1,824 13.7South Central 3,964 29.7New England 542 4.1Mid-Atlantic 1,237 9.3South Atlantic 2,589 19.4
13,333 100.0%
CERTIFICATIONMedicare-certified 7,879 59.1%Noncertified 5,454 40.9
13,333 100.0%
HOME CARE GOVERNMENT PAYERS
TYPE OF AGENCYOWNERSHIPIndependent FP 2,533 49.0% 2,485 19.4%Independent NFP 1,243 58.9 1,232 18.5Chain FP 1,883 45.8 1,853 23.7Chain NFP 1,067 63.2 1,052 18.2Government 509 61.3 501 23.6Church 53 48.9 52 16.1Not Known2 332 9.4 336 7.2
TYPE OF FACILITYHospital Based 1,048 71.8% 1,034 14.5%Nursing Home Based 119 47.8 118 23.3Rehab. Facility Based 6 55.0 6 19.2Official Govt. Agency 333 57.5 333 28.7Other 152 56.3 147 21.9Not Facility Based 5,962 46.8 5,873 20.2
MSA SIZEMetropolitan 5,270 46.8% 5,195 19.0%Nonmetropolitan 2,350 60.2 2,316 21.8
AVG. VISITS/WEEK1–100 2,020 61.0% 1,983 18.9%101–300 2,059 57.9 2,025 22.4301–500 838 55.6 828 22.6501+ 1,162 47.5 1,144 25.6Not Known2 1,541 28.3 1,531 12.1
REGIONPacific 705 51.1% 687 12.3%Mountain 486 52.4 480 21.2W. North Central 658 49.0 654 29.4E. North Central 934 54.2 917 19.6South Central 2,125 57.8 2,083 17.6New England 298 45.8 298 29.1Mid-Atlantic 559 37.2 561 25.6South Atlantic 1,855 46.6 1,831 18.4
CERTIFICATIONMedicare-certified 4,918 60.2% 4,824 17.7%Noncertified 2,702 34.1 2,687 23.8
# ofAgencies
% ofPatients
# ofAgencies
% ofPatients
# ofAgencies
% ofPatients
# ofAgencies
% ofPatients
Medicare3 Medicaid4
# of Agencies % of Agencies1
Medicare3 Medicaid4
# of Agencies % of Agencies1

www.managedcaredigest.comWhere information becomes intelligence.™
SANOFI-AVENTIS MANAGED CARE DIGEST SERIES® / SENIOR CARE DIGEST 200732
Current Rank
Previous Rank
Tax Status # of Agencies
Avg. # ofEmployeesper Office
# of States
LHC GROUP BECOMESONE OF FIVE LARGESTHOME CARE CHAINS Louisiana Healthcare Group(LHC) was the nation’s fifthlargest home care chain in 2006, up three spots from eighth largest in 2005.LHC’s agency total jumpednearly 50% between 2005(78) and 2006 (115). IntrepidUSA, which dropped fromfifth to sixth largest, oper-ated 96 agencies in 2006,down a considerable 17.2% from 116 the previous year.
PROPRIETARY CHAINSACCOUNT FOR 80% OF THE TOP 35 CHAINSFour-fifths (28) of the nation’s35 largest home care chainswere for-profit in 2006.Moreover, just one of the 12largest home care chains(8.3%) operated not-for-profitagencies in 2006, comparedwith two (16.7%) the yearbefore. Of the three chainsthat were new to the list of thenation’s 35 largest home carechains in 2006—AlacareHome Health, Critical CareSystems and Catholic HealthInitiatives—just CatholicHealth Initiatives (ranked35th) operated not-for-profithome health care agencies.
HOME CARE CHAINS
In 2006, the 35 largest home care chains in theU.S. operated 2,607 agencies, up from 2,486 in2005 and 2,234 in 2004. Agencies operated bythe 35 largest chains accounted for 19.6% of all home care agencies, up from 18.7% in 2005.
Meanwhile, the average number of employeesper office in these chains fell 16.8%, to 35.7from 42.9 the previous year. Just seven of these 35 chains employed 50 or more workersper office in 2006, compared with 13 in 2005.
Number of agencies in 35 largest home care chains climbs
Data source: Verispan LLC © 2007
THE NATION’S 35 LARGEST HOME CARE CHAINS*
* This table includes all home careagency offices owned, franchised ormanaged by these chains.
NAME / HEADQUARTERS
Gentiva Health Services / Melville, N.Y. 1 1 FP 299 120.2 35Interim HealthCare / Sunrise, Fla. 2 2 FP 274 23.4 38Amedisys / Baton Rouge, La. 3 3 FP 263 29.2 18
Maxim Healthcare Services / Columbia, Md. 4 4 FP 202 152.4 41Louisiana Healthcare Group-LHC Group / Lafayette, La. 5 8 FP 115 22.7 10Intrepid USA Corporate Office / Edina, Minn. 6 5 FP 96 2.8 23
Bayada Nurses / Moorestown, N.J. 7 7 FP 95 92.9 15Option Care / Corp. Office / Buffalo Grove, Ill. 8 6 FP 89 12.8 30Arkansas Department of Health / Little Rock, Ark. 9 9 NFP 84 14.2 1
Heartland Home Healthcare & Hospice / Toledo, Ohio 10 10 FP 73 49.5 21Tender Loving Care Staff Builders / Lake Success, N.Y. 11 11 FP 69 37.9 23Coram Healthcare / Denver, Colo. 12 12 FP 65 22.2 35
Department of Veterans Affairs / Washington, D.C. 13 13 NFP 63 3.2 32Almost Family / Louisville, Ky. 14 16 FP 56 35.1 7Pediatric Services of America / Norcross, Ga. 14 15 FP 56 33.3 18
Personal Touch Home Care / Bayside, N.Y. 16 17 FP 51 42.3 14Kelly Home Care Services / Troy, Mich. 17 14 FP 50 77.3 16Sta-Home Health Agency / Jackson, Miss. 18 18 FP 43 18.0 1
Angmar Medical Holdings / Arlington, Texas 18 22 NFP 43 6.8 4Kaiser Permanente / Oakland, Calif. 20 23 NFP 42 61.9 4Quorum Health Resources / Brentwood, Tenn. 20 20 NFP 42 17.3 22
Texas Home Health / Silsbee, Texas 22 29 FP 41 22.8 3Arcadia Services Inc. / Southfield, Mich. 22 21 FP 41 56.3 12Community Health Systems / Brentwood, Tenn. 24 26 FP 39 15.0 15
Omni Health Management / Coral Springs, Fla. 25 19 FP 37 13.9 8CareAll Home Care Services / Lebanon, Tenn. 26 28 FP 34 9.4 1CareSouth Home Care Professionals / Augusta, Ga. 27 25 FP 33 34.0 6
National HealthCare Corporation / Murfreesboro, Tenn. 28 30 FP 31 17.3 3Nursefinders / Arlington, Texas 28 27 FP 31 83.3 13Girling Health Care / Austin, Texas 30 31 FP 30 34.1 6
Alacare Home Health / Birmingham, Ala. 31 — FP 25 23.1 1Avera Health / Sioux Falls, S.D. 32 32 NFP 24 13.1 4Critical Care Systems / Nashua, N.H. 32 — FP 24 9.0 18
Deaconess Homecare / Hattiesburg, Miss. 32 24 FP 24 21.9 3Catholic Health Initiatives / Denver, Colo. 35 — NFP 23 22.6 12
TOTAL/AVERAGE 2,607 35.7

www.managedcaredigest.comWhere information becomes intelligence.™
SANOFI-AVENTIS MANAGED CARE DIGEST SERIES® / SENIOR CARE DIGEST 200733
HOME CARE PATIENT VISITS
Home care agencies averaged 322.5 patientvisits per week in 2006, down a notable 6.9%from 346.3 in 2005. The average number ofpatient visits per week dropped, between 2005and 2006, for home care agencies in each of
eight geographic regions. Agencies in theSouth Atlantic region (to 335.0 from 365.3 theprevious year, or –8.3%) reported the greatestannual percentage decline in the number ofpatient visits per week during this period.
Number of patient visits per agency per week decreases
Data source: Verispan LLC © 2007
CHAIN FP AGENCIESSEE A SHARP DECLINEIN VISITS PER WEEKThe number of patient visitsper week at chain for-profithome care agencies dropped12.0% in 2006, to 361.1 from410.3 in 2005. By compar-ison, the number of patientvisits per week fell a moremodest 3.8% at independentfor-profit agencies (to 266.5from 276.9 in 2005). Of the six distinct ownershipcategories profiled, church-related agencies averaged the most patient visits perweek, at 447.4, down slightlyfrom 452.1 the year before.
NUMBER OF VISITS PERWEEK FALLS NOTABLYAT NON-FACILITY HHAsIn 2006, home care agenciesthat were not affiliated with a facility averaged 327.5patient visits per week, down8.3% from 357.3 in 2005.The number of patient visitsper week also dropped atnursing home-based agen-cies (to 281.2 from 294.6 in2005, or –4.5%), officialgovernment-based agencies(to 289.4 from 302.2, or–4.2%) and hospital-basedagencies (to 329.1 from337.1, or –2.4%) over thistime. Conversely, rehabilita-tion facility-based home careagencies reported a substan-tial increase in the number of patient visits per week, to 341.1 from 253.3 in 2005.
NUMBER OF HOME CARE AGENCY PATIENT VISITS PER WEEK
Number of Patient Visits per Agency per Week
2005 2006
0
100
200
300
400
Ave
rage
Vis
its
per
Wee
k
HospitalBased
Nursing HomeBased
RehabilitationFacility Based
OfficialGovernment
Other NotFacility Based
337.1 329.1
294.6 281.2253.3
341.1
302.2289.4
225.7 232.6
357.3327.5
2005 2006
NUMBER OF PATIENT VISITS PER AGENCY PER WEEK, BY FACILITY TYPE
OWNERSHIPGovernment 274.0 263.6Church-Related 452.1 447.4Independent For-Profit 276.9 266.5Independent Not-for-Profit 364.3 341.2Chain For-Profit 410.3 361.1Chain Not-for-Profit 404.6 371.4
FACILITYHospital Based 337.1 329.1Nursing Home Based 294.6 281.2Rehabilitation Facility Based 253.3 341.1Official Government 302.2 289.4Other 225.7 232.6Not Facility Based 357.3 327.5
REGIONPacific 321.0 305.2Mountain 282.0 269.9West North Central 225.4 219.3East North Central 363.0 334.1South Central 292.7 271.2New England 596.2 563.3Mid-Atlantic 501.5 467.7South Atlantic 365.3 335.0
CERTIFICATION Medicare-certified 353.0 326.6Noncertified 334.2 314.7
AVERAGE 346.3 322.5

www.managedcaredigest.comWhere information becomes intelligence.™
SANOFI-AVENTIS MANAGED CARE DIGEST SERIES® / SENIOR CARE DIGEST 2007
HOME CARE SERVICES
PERCENTAGE OF HOME CARE AGENCIES PROVIDING VARIOUS SERVICES,BY OWNERSHIP TYPE
IndependentFor-Profit
IndependentNot-for-Profit
Chain For-Profit
Chain Not-for-Profit Government Church-
Related
PERCENTAGE OF HOME CARE AGENCIES PROVIDING VARIOUS SERVICES
MEDICAL SERVICES
Laboratory Services 31.9% 42.1% 32.4% 39.2% 35.2% 39.8%Pharmacy Services 15.5 26.6 19.1 25.6 18.3 32.7Skilled Nursing 97.3 98.1 95.2 98.2 98.7 99.0
THERAPIES
IV/Infusion Therapy 32.8% 59.5% 60.7% 70.8% 71.2% 58.2%Occupational Therapy 79.3 85.0 75.2 85.6 83.9 89.8Physical Therapy 84.3 89.2 78.3 91.7 92.3 90.8Respiratory Therapy 8.8 13.3 11.7 17.1 12.9 23.5Speech Therapy 74.1 81.9 70.4 84.3 81.3 86.7
NONMED. SERVICES
Assisted Living Services 80.3% 90.8% 80.3% 89.7% 91.8% 91.8%Nutritional Guidance 39.3 58.2 46.9 56.8 51.8 64.3Personal Care 68.6 83.4 79.8 86.5 86.1 87.8Social Services 72.6 81.3 68.0 81.2 67.6 82.7Vocational Guidance 4.3 8.0 7.2 7.6 10.4 13.3
0%
25%
50%
75%
100%
Per
cent
age
ofA
genc
ies
SkilledNursing
PhysicalTherapy
AssistedLiving
OccupationalTherapy
PersonalCare
SpeechTherapy
SocialServices
IV/InfusionTherapy
NutritionalGuidance
LaboratoryServices
97.1%
85.0% 83.8%80.3% 77.2% 76.2% 73.6%
51.9%47.5%
34.8%
Data source: Verispan LLC © 2007
Over three-quarters (76.2%) of home careagencies nationwide provided speech therapy totheir patients in 2006, up from 72.7% in 2005.Church-related agencies (86.7%) were mostlikely, by ownership type, to offer such services
while chain for-profit agencies (70.4%) wereleast likely. Despite the overall growth, speechtherapy services remained less prevalent amonghome care agencies than both physical therapy(85.0%) and occupational therapy (80.3%).
Larger percentage of home care agencies offers speech therapy
SOCIAL SERVICES AREOFTEN PROVIDED BYCHURCH AGENCIES In 2006, 82.7% of church-related home care agenciesextended social services to their residents, notablyhigher than the share foragencies overall (73.6%), andthe greatest share by owner-ship type. By comparison,just 67.6% of governmentagencies offered such serv-ices. In total, church-relatedhome care agencies weremost likely to provide 10 of the 13 services provided.
SHARE OF AGENCIESOFFERING PERSONALCARE FALLS SHARPLYThe share of home care agencies in the U.S thatprovided personal caredeclined, between 2005 and2006, regardless of agencyownership type. Althoughdown slightly from 89.2%,church-related homes were most likely to providepersonal care services in2006, at 87.8%. Meanwhile,independent for-profit agen-cies (68.6%) were leastlikely to offer personal services, down substantiallyfrom 81.0% the year before.Overall, 77.2% of home care agencies had personalcare services in 2006, down from 85.1% in 2005.
34

www.managedcaredigest.comWhere information becomes intelligence.™
SANOFI-AVENTIS MANAGED CARE DIGEST SERIES® / SENIOR CARE DIGEST 2007
HOME CARE STAFFING
The number of employees per home careagency dropped 6.4% in 2006, to 35.1 from37.5 in 2005, the second consecutive annualdecline. The number of home health aides per agency fell a notable 13.5% during this
period, to 12.2 from 14.1 the year before. Of the six home care agency job titles listed,just one (physical therapists) reported anincrease in the number of employees peragency in 2006, to 2.2 in from 2.0 in 2005.
NUMBER OF EMPLOYEES PER HOME CARE AGENCY, BY PATIENT VISITS PER WEEK
1–100 Visits/Week
101–300 Visits/Week
301–500 Visits/Week
501+ Visits/Week
OverallAverage
JOB TITLE/POSITION
Home Health Aides 7.2 6.1 10.0 9.5 15.5 14.6 31.0 27.4 14.1 12.2Nurses 7.7 8.8 11.2 12.3 15.8 15.7 34.5 32.6 15.7 15.3
Occupational Therapists 0.6 0.6 0.7 0.7 1.1 1.1 1.8 1.7 0.9 0.9Physical Therapists 1.1 1.2 1.4 1.8 2.4 2.6 4.1 4.4 2.0 2.2
Social Workers 0.6 0.6 0.6 0.7 1.3 1.3 1.5 1.6 0.9 0.9Speech Therapists 0.3 0.4 0.4 0.4 0.6 0.6 1.0 0.9 0.5 0.5
All Others* 2.4 2.2 2.7 2.7 3.4 3.4 5.3 5.3 3.4 3.1
TOTAL** 19.9 20.0 27.1 28.0 40.2 39.3 79.2 74.0 37.5 35.1
NUMBER OF EMPLOYEES PER HOME CARE AGENCY
0
5
10
15
20
Num
ber
ofE
mpl
oyee
spe
rA
genc
y
Nurses HomeHealth Aides
AllOthers*
PhysicalTherapists
OccupationalTherapists
SocialWorkers
SpeechTherapists
15.7 15.314.1
12.2
3.4 3.12.0 2.2
0.9 0.9 0.9 0.9 0.5 0.5
2005 2006
Data source: Verispan LLC © 2007 * “All Others” includes medical social workers, pharmacists, accounting staff,dietitians and quality assurance staff.
** Column totals represent the average of each facility’s total employees.
AGENCIES WITH THEMOST VISITS SEE ADROP IN EMPLOYEESHome care agencies that aver-aged more than 500 patientvisits per week reported a6.6% decrease in the averagenumber of employees peragency, to 74.0 from 79.2 in 2005. Among these agen-cies, four of the six job titlesprofiled (physical therapistsand speech therapistsexcluded) underwent a dropin the number of employeesper agency. By comparison,agencies that made 100 orfewer patient visits per weekaveraged 20.0 employees per agency, up fractionallyfrom 19.9 the previous year.
AVERAGE NUMBER OF NURSES PER HOMECARE AGENCY FALLSOverall, the average numberof nurses per home careagency declined 2.5% in2006, to 15.3 from 15.7 in2005. Agencies that mademore than 500 patient visitsper week averaged 32.6nurses per agency, down 5.5% from 34.5 the yearbefore. By comparison, agencies that averaged 1 to100 patient visits per weekemployed 14.3% more nursesper agency in 2006 (8.8) than in 2005 (7.7). Similarly,agencies that averaged 101 to300 patient visits per weekemployed 12.3 nurses, up9.8% from 11.2 in 2005.
35
Number of employees per home care agency continues to slide
2005 2006 2005 2006 2005 2006 2005 2006 2005 2006

www.managedcaredigest.comWhere information becomes intelligence.™
SANOFI-AVENTIS MANAGED CARE DIGEST SERIES® / SENIOR CARE DIGEST 200736
AFTERWORD
The U.S. population is aging rapidly, even asthe life expectancy of seniors is increasing.This expansion in the age and volume ofseniors will strain the U.S. health care systemin the coming years. At midyear 2006, Medi-
care provided coverage to 42.8 million seniors.By 2030, however, this number is expected toswell to 78.3 million. As a result, governmentwill likely face numerous challenges upholdingits long-standing commitment to senior care.
LEGISLATION MAYADD TO GROWTH OFRESIDENTIAL CAREThe Home and Community-Based Services CopaymentEquity Act of 2007, nowreintroduced in the U.S.Senate, would ensure thatqualified assisted living andother types of residentialcare facility residents receivethe same exemption fromcopayments under the newMedicare Prescription DrugProgram as nursing homeresidents. This legislationwould likewise eliminatecopayments under MedicarePart D for dual-eligiblebeneficiaries (those eligiblefor Medicare and Medicaidcoverage) residing inassisted living communitiesand other home- andcommunity-based settings.
If passed, this proposedchange to current law wouldfurther contribute to ananticipated paradigm shiftin the senior care market, inwhich the number of dual-eligible beneficiaries whochoose a home- or commu-nity-based alternative to anursing home or other insti-tutional setting for theirlong-term care would soonoutnumber those dual eligi-bles who are receivingnursing facility services.
Medicare population growth expected to challenge senior care
LTCPPs ADJUST TO THE SHIFTINGSENIOR CARE MARKETPLACEThe nursing home resident share of allprescriptions dispensed by long-term carepharmacy providers (LTCPPs) continued todrop between 2005 and 2006, the secondconsecutive annual decline. Conversely, theLTCPP shares of prescriptions dispensed toresidential care, retail and mental healthfacility customers during this period rose inaccordance. Viewed in the context of thelong-term stagnancy of the nursing homeindustry, in which growing numbers ofseniors have drifted away from nursinghomes and toward alternative means of long-term care, selling to a more diverse customerbase is good business practice and an indica-tion of the growing complexity of seniorcare. In this period, the ratios of LTCPP drugsales and revenue from long-term care facili-ties likewise underwent moderate declines.
ALMOST HALF OF NURSING HOMERESIDENTS SUFFER DEPRESSIONIn 2006, nearly half (47%) of nursing homeresidents suffered from depression, thesecond most common (behind bladder incon-tinence) of the 11 conditions profiled. Theshare of residents diagnosed with depressionwas fractionally higher among nursing homeresidents than Alzheimer’s Disease (46%),and more than double that of general psychi-atric diagnoses (20%). In accordance, justover 45% of nursing home residents weredispensed antidepressent medications in2006. Depression has long been recognizedas an extensive problem among the institu-tionalized elderly. It is a condition oftenlinked to increased risk of secondarydiseases and higher health care costs.
ADDED SERVICES AND COST SAVINGSPUSH SENIORS TOWARD HOME CARESince 1986, the number of home care agen-cies operating in the U.S. has increased bymore than 150%. One catalyst for thisgrowth, according to conventional wisdom,is the rising cost of institutional care. Buthome care agencies have also contributed byimproving their quality of care and makingavailable to their customers such nonmedicalservices as personal care, nutritional andvocational guidance, and social services.
Unlike nursing homes and traditionallong-term care facilities, which typicallytreat chronically ill patients, home healthcare is designed primarily for patientsrecovering from past medical treatment orthose in need of daily assistance. And withALFs becoming a more expensive and, oftenenough, less comfortable option, the demandfor home health care services has ballooned.
Another recent health care trend that hascontributed to the increase in the number ofhome care agencies is shorter hospital stays.Between 2003 (5.0 days) and 2006 (4.5days), the average length of stay per hospitaladmission declined notably. As patients aredischarged from hospitals sooner and, as aconsequence, require more recovery time athome, the demand for home care and relatedservices is growing. As one industry insiderput it, “More and more people are leavinghospitals sicker and quicker. The wholehealth care system is moving toward homehealth care.”
As more quality home health care servicesare made available to seniors, and coveragefor such care expands, home care willcontinue to play a larger and more importantrole in long-term care in the future.

A Commitment toHealth CareAt sanofi-aventis, our commitmentto health care systems is to continue to support you with products, services and resourcesdistinguished by innovation,not imitation.
Our commitment to staying at the forefront of health care isexemplified by our extensive product pipeline, our dedication tounderstanding today’s complexhealth care environment, and ourcontinuing resolve to anticipatecritical health care trends and theirimpact on the industry.
As health care evolves, so, too, will sanofi-aventis—to better meet the needs of all our healthcare customers.
The sanofi-aventis Managed CareDigest Series® represents just oneof the ways sanofi-aventis willcontinue to bring information andinsight to our customers.
Suggested Usesfor This Digest:• Presentations• Comparisons• Benchmarking• Formulation of policies• Business plans• Budgeting• Strategic forecasting• Analyses/trends
Sanofi-aventis offers the information presented in the Managed Care Digest Series® for general educational and informational purposes only. This information is not intended as a substitute for advice or recommendations from relevant professionals. Care has been taken to confirm the accuracy of the information presented.However, sanofi-aventis is not responsible forerrors or omissions or for any consequences from application of the information in theManaged Care Digest Series®, and makes nowarranty, expressed or implied, with respect to the currency, completeness or accuracy of the contents of the publication. Application of thisinformation in a particular situation remains the professional responsibility of the user.

BROUGHT TO YOU AS A
PROFESSIONAL SERVICE BY
SANOFI-AVENTIS, PROVIDER OF:
PLAVIX® is a registered trademark of Sanofi-Synthelabo Inc. and is distributed by the Bristol-Myers Squibb/Sanofi Pharmaceuticals Partnership.US.NMH.07.04.024 © 2007 sanofi-aventis U.S. LLC
®
Bridgewater, NJ 08807