Embed Size (px)
Citation preview
MALAYSIA TRANSPORT PRICING STRATEGIES, MEASURES, AND POLICIES INCEPTION REPORT
Jeffrey D. Ensor
Malaysia Transport Research Group Massachusetts Institute of Technology
February 22, 2004
Jeffrey D. Ensor Malaysia Transport Pricing Strategies, Measures, and Policies February 22, 2004
1
TABLE OF CONTENTS INTRODUCTION................................................................................................................................2 MALAYSIA AND KLMA BACKGROUND .....................................................................................2 TRAVEL DEMAND MANAGEMENT..............................................................................................4 MARGINAL-COST PRICING............................................................................................................6 ROAD PRICING MEASURES AND POLICIES ...............................................................................7
FIXED COSTS .................................................................................................................................8 Vehicle Quotas .............................................................................................................................9 Vehicle Ownership Restraints ....................................................................................................10 Insurance.....................................................................................................................................10
VARIABLE COSTS ......................................................................................................................11 Fuel Prices ..................................................................................................................................11 Parking Restraints.......................................................................................................................14 Tolling ........................................................................................................................................15
TRANSIT PRICING ..........................................................................................................................18 VEHICLE-USE PROGRAMS ...........................................................................................................19 CONGESTION PRICING..................................................................................................................20
FORMS OF CONGESTION PRICING.........................................................................................24 Network Pricing..........................................................................................................................24 Area-Wide and Cordon Pricing ..................................................................................................24 Facility Pricing ...........................................................................................................................26 Partial-Facility Pricing (HOT Lanes) .........................................................................................26
ENVIRONMENT EFFECTS .........................................................................................................28 LAND USE AND SPRAWL..........................................................................................................29 REVENUE HYPOTHECATION...................................................................................................29 TECHNOLOGY.............................................................................................................................30
CONCLUDING REMARKS .............................................................................................................30 REFERENCES ...................................................................................................................................33 APPENDIX ........................................................................................................................................36 LIST OF TABLES Table 1: PLUS Expressways Toll Rate Multipliers ...........................................................................16 Table 2: Current (Gazetted) and Previously Agreed Toll Rates for PLUS Expressways ..................17 Table 3: Comparison between HOV and HOT Lanes ........................................................................27 Table 4: Characteristics of Congestion Pricing and Car Sharing Strategies ......................................31 LIST OF FIGURES Figure 1: Hockey Stick Function..........................................................................................................7 Figure 2: Cost of Automobile Travel ...................................................................................................8 Figure 3: Cost of Transit Travel...........................................................................................................9 Figure 4: Malaysia Fuel Prices...........................................................................................................13 Figure 5: Kuala Lumpur City Center Map (Source: http://map.virtualmalaysia.com) ......................36 Figure 6: Kuala Lumpur Major Roads and Rail Lines.......................................................................37 Figure 7: PLUS Expressways Map.....................................................................................................38 Figure 8: Marginal-Cost Pricing Diagram..........................................................................................39
Jeffrey D. Ensor Malaysia Transport Pricing Strategies, Measures, and Policies February 22, 2004
2
INTRODUCTION The purpose of this inception report is to present various urban transport pricing approaches that should be considered for Malaysia. It discusses Malaysia’s current approach and identifies some areas that may be able to be improved. Adequate transport pricing – in conjunction with other measures – can lead to a more efficient use of resources and play an important role in mitigating congestion and environmental problems in the Kuala Lumpur Metropolitan Area (KLMA). This report presents an overview of urban road transport pricing measures, policies, and strategies. In particular, it discusses the importance of travel demand management, the theory of marginal-cost pricing, available road pricing measures (e.g. parking control), transport pricing policies (e.g. fuel taxes), and transport pricing strategies (e.g. congestion pricing) that can be used to manage travel demand.1 In addition, it takes a closer look at congestion pricing by discussing forms a scheme can take and some of the major issues regarding congestion pricing.
MALAYSIA AND KLMA BACKGROUND Economic growth has been one of the major Malaysian goals in Vision 2020.2 Despite building significant transport infrastructure in Malaysia since the 1960s, the Government recognized the presence of infrastructure bottlenecks in Vision 2020 and declared that it would “not let growth be retarded by excessive congestion” (EPU, 1991, p.7). Urban transport infrastructure and policy in the KLMA has been neglected in the past, leading to poor traffic conditions in the urban center (Mody, 1997, p.36). The Government made some efforts in the 1990s to address urban transport problems, which include the construction of privatized light-rail facilities within the Klang Valley. The continued existence of significant bottlenecks after going from 15,400 km of road in 1965 to 64,300 km in 1995 highlights the extent of travel demand growth that has occurred in Malaysia (World Bank, 1999, p.1). Road investments were credited as a development catalyst for Malaysia during the 1990s and continue to receive strong support. Malaysia achieved and sustained an impressive rate of economic growth before the 1997 Southeast Asia financial crisis. The crisis created some unfavorable social impacts that threatened to reverse the pre-crisis gains. The Government approached the World Bank to help with a recovery plan, which included a road maintenance component. The World Bank (1999, p.2-3) believed highway capacity expansion along high priority corridors with high volume to capacity ratios was necessary for Malaysia to continue medium- and long-term economic growth. Major new road construction was deemed a lower priority. The KLMA is an auto-dependent city and appears to be further increasing its reliance on private transport. The motorization rate was 300 autos and 173 motorcycles per 1000 people in the year 2000, nearly double the 170 autos per 1000 just ten years prior and five times higher than the 1980 automobile ownership level (Gakenheimer, 2003b, p.1, p.9). With an average household size of 4.2 in the KLMA (Department of Statistics, 2004), that averages out to 1.3 autos/household in addition to 0.7 motorcycles/household.
1 For the purpose of this report, travel demand and traffic demand will be used interchangeably. 2 Vision 2020 is Malaysia’s goal of becoming a developed nation by the year 2020.
Jeffrey D. Ensor Malaysia Transport Pricing Strategies, Measures, and Policies February 22, 2004
3
Travel demand growth has been promoted by several factors in the KLMA, including:
• Population growth in the city of Kuala Lumpur (KL) itself is expected to be about 2 percent per year until 2015 while some of the outer areas are expected to grow 8 percent per year (Gakenheimer, 2003b, p.3).
• Vision 2020 targets real GDP growth of 7 percent per year between 1990 and 2020 for Malaysia.
• Rapidly rising average incomes and increasing female participation in the workforce. Average wages for males and females in Malaysia increased 40% and 63%, respectfully, between 1992 and 1997 (UN, 2002, p.298).
• The working age group (between 15 to 64 years) has also increased from 59.6% in 1991 to 62.8% in 2000, creating more demand during peak hours as drivers commute to work (Department of Statistics, 2004).
• Malaysia’s urbanization increased from 50.7% in 1991 to 62% in the year 2000. Kuala Lumpur is 100% urbanized and Selangor has reached 87.6% urbanization (Department of Statistics, 2004). According to Gakenheimer (2003, p.3), the KLMA grew almost three times as much as KL itself between 1991 and 2000. The state of Selangor (surrounding Kuala Lumpur) had the highest growth rate of 6.1 percent per year between 1991 and 2000 (Department of Statistics, 2004).
Gakenheimer (2003b, p.9) estimates the number of person auto trips will double 1997 levels by 2020 based on current trends. Multiple urban expressways – controlled by different authorities – transport very high volumes of traffic within a narrow corridor and lack coordination or integration with the adjacent traffic networks (REAM, 1999, p.14). Additionally, urban road networks seem to lack a hierarchal system (e.g. mixture of local distributors and major arterials) and can have many demands for a single road (e.g. pedestrians, local traffic, through traffic, freight vehicles, motorcycles, and automobiles) (REAM, 1999, p.13). The KLMA road network structure is shown in Figure 5 and Figure 6 (located in the Appendix). Road accidents occur frequently, which further disrupt traffic flows. Economic activities are concentrated in the Kuala Lumpur city center and follow major arterials radiating from the center. Currently, a relatively high percentage of jobs are located in the central business district (CBD) (24%) and inner areas of the city (53%) (Gakenheimer, 2003b, p.5). Gakenheimer also notes Kuala Lumpur has a high ratio of residents to jobs in the CBD with 69 residents per 100 jobs in 1990. However, urban decentralization is occurring as residential and commercial activities are moving into the suburbs. The city center population has decreased from 157,000 in 1980 to 128,700 in 2000 while the overall KLMA population has grown (Gakenheimer, 2003b, p.5, p.4). Federal Government administrative offices have been relocated to Putrajaya, one of the two major “smart cities” in the MSC. Additionally, car-oriented shopping malls and business parks are developing along major roads in the suburbs and do not have access to the urban rail network (Gakenheimer, 2003b, p.5). Residential growth also appears to be contributing to urban sprawl and auto dependence. Large-scale residential developments are occurring in the suburbs, as one might expect with rising incomes. Gakenheimer (2003b, p.3) says there is a shortage of affordable housing in Kuala Lumpur
Jeffrey D. Ensor Malaysia Transport Pricing Strategies, Measures, and Policies February 22, 2004
4
and residents moving to suburban housing and commuting to KL may explain the net emigration of approximately 5,000 per year between 1991 and 1997. A Highway Network Development Plan (HNDP) for Malaysia was engaged in 1993. The HNDP highlighted three corridors that are “heavily trafficked”, (1) the north-south trunk road on the west coast, (2) the north-south trunk roads on the east coast, and (3) the east-west link from Kuala Lumpur to Kuantan, (REAM, 1999, p.12). The HNDP also cited heavily concentrated traffic in Penang, the Klang Valley, and Joror Baru. These travel pattern forecasts are expected to remain essentially unchanged until 2010. Public transport is poorly integrated and losing mode share. Population and commercial growth on the “urban fringe” is further increasing private automobile dependency, which is already quite high. Private transport dominates the KLMA with an 80% mode share of all motorized trips, leaving only 20% using public transport (Gakenheimer, 2003b, p.1). Bus services are unreliable, duplicate routes, overcrowded during peak hours, use poor quality vehicles, and have large amounts of debt (Gakenheimer, 2003b, p.9). Public transport lacks coordination between companies as well as modes. Bus companies are not efficient feeder services for the LRT or monorail, limiting the number of suburban commuters who can realistically use public transport to reach central Kuala Lumpur. The Government provides few direct references to the role of public transportation in the Eighth Malaysia Plan. Additionally, public transport responsibilities are divided between agencies and there is a lack of accountability and coordination among them.
TRAVEL DEMAND MANAGEMENT It is increasingly becoming recognized that new urban road construction cannot meet travel demands by itself and that demand management is an essential part of a sustainable and integrated transport strategy. Recent developments with Intelligent Transportation Systems (ITS) have produced new tools and options for transport professionals to help manage demand and create a more efficient and integrated urban transport system. It is argued that urban transport facilities must be priced in a way that discourages wasteful and excessive use of existing transport capacity. If this does not occur, the rate of demand is likely to grow faster than the ability to increase capacity. Infrastructure construction is often necessary and produces many benefits for developing countries, but construction alone will not solve long-term congestion problems unless is it managed appropriately. Metropolitan areas recognize the essential role of traffic management – it is performed in virtually every city in the world. However, the extent and sophistication with which traffic management strategies and measures are applied varies greatly between cities and predominantly depends on the following four characteristics (Cracknell, 2000, p.2):
1) the “starting point”. The level of development of the transport system, levels of car ownership and use, development of the road network and similar factors determine the severity and nature of traffic problems faced within a city and thus determine the types of traffic policies and measures which are appropriate;
Jeffrey D. Ensor Malaysia Transport Pricing Strategies, Measures, and Policies February 22, 2004
5
2) the size, population and spatial characteristics of a city. Measures and policies which apply in mega cities will not necessarily find application or success in small or medium sized cities and vica-versa. Even with cities of similar size, population and level of development, locational and physical constraints will impose differing traffic policies; 3) the level of development and traffic congestion. For example, measures which, say, aim to provide buses with priority or to restrain traffic may be appropriate in mega cities with relatively high car ownership and intense peak period (or longer) traffic congestion (such as Bangkok, Moscow, Cairo, Sao Paulo, Mumbai etc) but such measures may not be appropriate in smaller cities with short periods of traffic congestion or in cities with low car ownership; and 4) the degree to which traffic management is given political support and developed institutionally. Policies and measures which may be acceptable in one city could be unacceptable or unable to be implemented in another city of equivalent size and with equivalent traffic problems.
Malaysia has recognized the need for travel demand management to some extent in the Eighth Malaysia Plan (2001, p.289), as seen in the statement, “the increasing number of motor vehicles in all major urban centres will require the implementation of public transport priority measures, car parking control, local area traffic improvement schemes, restriction on heavy vehicles, greater pedestrianiza tion and the application of ITS.” Travel demand management has been considered for Kuala Lumpur and is included in the Transport Master Plan for Putrajaya (REAM, 1999, p.14). However, few references are made to specific pricing measures besides efforts to control car parking. A carpooling program was attempted by Kuala Lumpur City Hall in the early 1990s but was deemed unsuccessful (Rahman, 1997). A survey of KL city residents cited “different before/after work schedules” as the number one reason why they felt carpooling would not be effective (Rahman, 1997, p.12). Interestingly, 95% of respondents from the same survey agreed traffic congestion in Kuala Lumpur was bad. Additional efforts were made during the Seventh Malaysia Plan period to encourage public transportation and address urban congestion using traffic demand management. It appears these measures, although having the right idea, have had mild effects (if any), and there is a lot of room for improvement. A 1997 survey noted travel speeds on most of the major radial roads in Kuala Lumpur reduced to 10 km/hr or less during the morning peak hours due to high traffic volumes (8th Malaysia Plan, 2001, p.271). A 1999 study recommended numerous policies, strategies, and measures to alleviate urban congestion and enhance air quality in the KLMA.3 Some measures implemented at that time include on-street parking restrictions, differential parking charges, one-way streets, pedestrianization, road system improvements, bus lanes, contra-flow and restrictions on heavy vehicles entering the city centre during peak hours (8th Malaysia Plan, 2001, p.272).
3 Study on Integrated Urban Transportation Strategies for Environmental Improvement.
Jeffrey D. Ensor Malaysia Transport Pricing Strategies, Measures, and Policies February 22, 2004
6
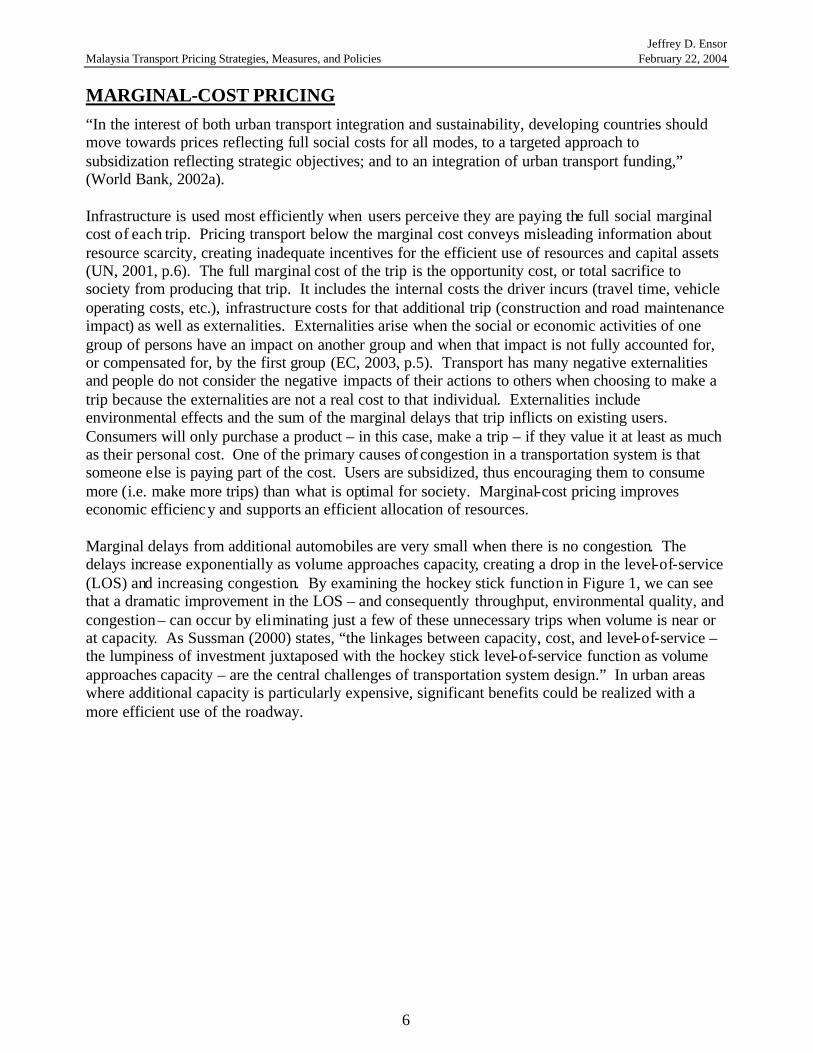
MARGINAL-COST PRICING “In the interest of both urban transport integration and sustainability, developing countries should move towards prices reflecting full social costs for all modes, to a targeted approach to subsidization reflecting strategic objectives; and to an integration of urban transport funding,” (World Bank, 2002a). Infrastructure is used most efficiently when users perceive they are paying the full social marginal cost of each trip. Pricing transport below the marginal cost conveys misleading information about resource scarcity, creating inadequate incentives for the efficient use of resources and capital assets (UN, 2001, p.6). The full marginal cost of the trip is the opportunity cost, or total sacrifice to society from producing that trip. It includes the internal costs the driver incurs (travel time, vehicle operating costs, etc.), infrastructure costs for that additional trip (construction and road maintenance impact) as well as externalities. Externalities arise when the social or economic activities of one group of persons have an impact on another group and when that impact is not fully accounted for, or compensated for, by the first group (EC, 2003, p.5). Transport has many negative externalities and people do not consider the negative impacts of their actions to others when choosing to make a trip because the externalities are not a real cost to that individual. Externalities include environmental effects and the sum of the marginal delays that trip inflicts on existing users. Consumers will only purchase a product – in this case, make a trip – if they value it at least as much as their personal cost. One of the primary causes of congestion in a transportation system is that someone else is paying part of the cost. Users are subsidized, thus encouraging them to consume more (i.e. make more trips) than what is optimal for society. Marginal-cost pricing improves economic efficiency and supports an efficient allocation of resources. Marginal delays from additional automobiles are very small when there is no congestion. The delays increase exponentially as volume approaches capacity, creating a drop in the level-of-service (LOS) and increasing congestion. By examining the hockey stick function in Figure 1, we can see that a dramatic improvement in the LOS – and consequently throughput, environmental quality, and congestion – can occur by eliminating just a few of these unnecessary trips when volume is near or at capacity. As Sussman (2000) states, “the linkages between capacity, cost, and level-of-service – the lumpiness of investment juxtaposed with the hockey stick level-of-service function as volume approaches capacity – are the central challenges of transportation system design.” In urban areas where additional capacity is particularly expensive, significant benefits could be realized with a more efficient use of the roadway.
Jeffrey D. Ensor Malaysia Transport Pricing Strategies, Measures, and Policies February 22, 2004
7
Figure 1: Hockey Stick Function
The aim of marginal-cost pricing is to internalize external costs, i.e. allocate costs to the responsible users. This will result in drivers only making trips whose total benefits to the driver exceed the additional total cost to society (World Bank, 2002a, p.141). True marginal-cost pricing is not realistically feasible because some costs cannot be reasonably allocated. However, various transport pricing measures, strategies, and policies can be used to achieve different degrees of marginal-cost pricing approximation. The use of fair and efficient transportation infrastructure pricing will support the development of a sustainable transportation system. Failing to charge the marginal social cost for road transport has several negative effects including: (i) mode choice distortion in favor of road transport, particularly private automobiles, (ii) encouraging excessive use of infrastructure (which can create “excess” congestion), (iii) with no direct revenue, it is not logically possible to use conventional commercial investment criteria to determine the amount of capacity to provide, and (iv) there may be insufficient funds for to properly maintain existing infrastructure because the revenues are not distributed to the responsible local authority (World Bank, 2002a, p.142). Regions with low financial costs of travel (e.g. cheap petrol and tolls), low vehicle operating costs (i.e. variable costs), high vehicle ownership costs (i.e. fixed costs), high number of vehicles per capita, and extreme congestion are likely to see significant economic efficiency gains by changing the cost of trave l to more appropriately approximate the marginal cost. The Malaysian Government does not appear to be an advocate of marginal-cost pricing for the transport sector. The Eighth Malaysia Plan (2001, p.183) states, “the Government will provide support to projects which have social implications and require large capital expenditure, in order to reduce tariffs and other charges to consumers.”
ROAD PRICING MEASURES AND POLICIES Automobile costs can generally be divided into two categories, fixed costs and variable costs. Fixed costs include costs indirectly related to the amount of travel while variable costs are directly linked
CAPACITY DEMAND
LOS
VOLUME
Jeffrey D. Ensor Malaysia Transport Pricing Strategies, Measures, and Policies February 22, 2004
8
to the amount of travel. Average fixed costs decrease with increased travel, thus encouraging increased use, and variable costs often act as a second-best measure to approximate the marginal cost, although the degree of marginal-cost emulation can vary greatly between measures. This section presents road pricing measures and policies according to their cost classification. User costs that would classify as “fixed” costs are presented first and are followed by “variable” costs. The importance of each measure and policy is noted and then it is evaluated as a tool for mitigating congestion or approximating the marginal cost of travel.
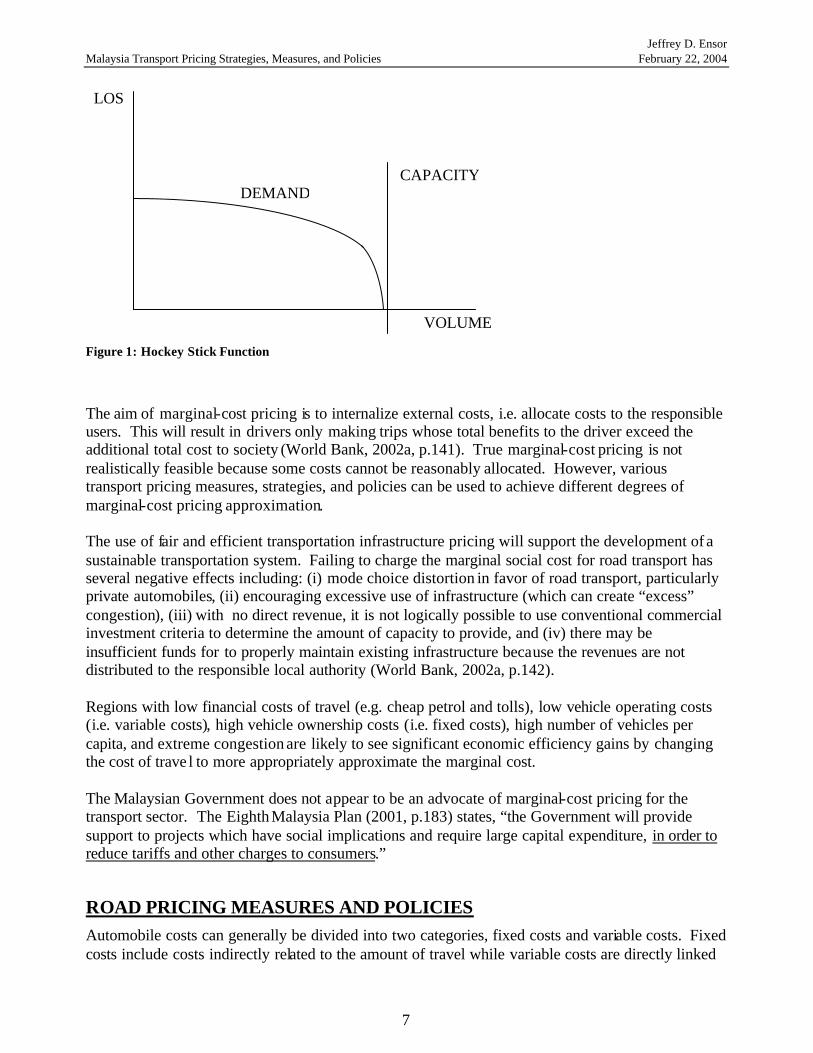
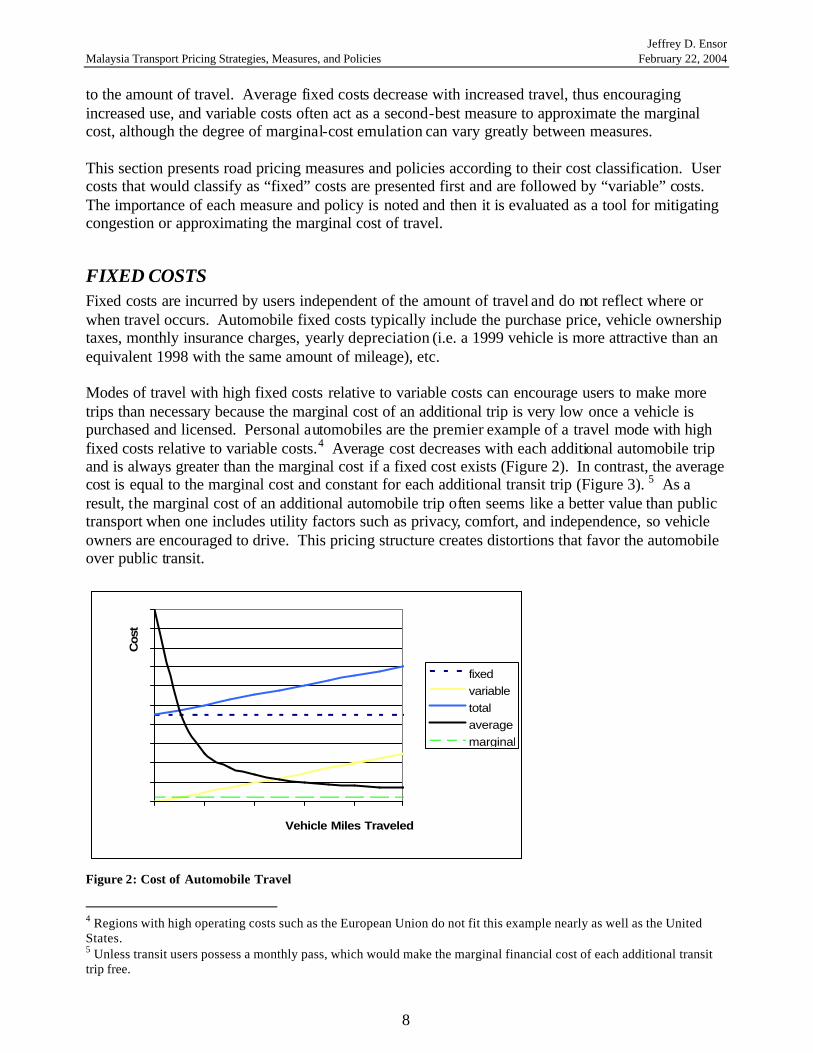
FIXED COSTS Fixed costs are incurred by users independent of the amount of travel and do not reflect where or when travel occurs. Automobile fixed costs typically include the purchase price, vehicle ownership taxes, monthly insurance charges, yearly depreciation (i.e. a 1999 vehicle is more attractive than an equivalent 1998 with the same amount of mileage), etc. Modes of travel with high fixed costs relative to variable costs can encourage users to make more trips than necessary because the marginal cost of an additional trip is very low once a vehicle is purchased and licensed. Personal automobiles are the premier example of a travel mode with high fixed costs relative to variable costs.4 Average cost decreases with each additional automobile trip and is always greater than the marginal cost if a fixed cost exists (Figure 2). In contrast, the average cost is equal to the marginal cost and constant for each additional transit trip (Figure 3). 5 As a result, the marginal cost of an additional automobile trip often seems like a better value than public transport when one includes utility factors such as privacy, comfort, and independence, so vehicle owners are encouraged to drive. This pricing structure creates distortions that favor the automobile over public transit.
0
20
40
60
80
100
120
140
160
180
200
0 2 4 6 8 10Vehicle Miles Traveled
Cos
t
fixedvariabletotalaveragemarginal
Figure 2: Cost of Automobile Travel
4 Regions with high operating costs such as the European Union do not fit this example nearly as well as the United States. 5 Unless transit users possess a monthly pass, which would make the marginal financial cost of each additional transit trip free.
Jeffrey D. Ensor Malaysia Transport Pricing Strategies, Measures, and Policies February 22, 2004
9
0
10
20
30
40
50
60
70
80
90
100
0 2 4 6 8 10Transit Trips Taken
Cos
t
variableaverage
marginal
Figure 3: Cost of Transit Travel
Vehicle Quotas Vehicle quotas determine the number of new motor vehicles that can enter a fleet over a period of time. Singapore rations vehicle quotas in the form of “Certificate of Entitlements”, or CoEs, through auctions each month; the CoEs expire after 10 years. The Government has allowed the vehicle population to grow three percent per year since the 1990s (Menon, 2002, p.2). The cost of CoEs in addition to very high vehicle taxes typically make an automobile purchase in Singapore between four to five times more expensive than the world market price (World Bank, 2003a, p.146). In a different form, Tokyo requires prospective car buyers to prove they have an off-street parking space before they can purchase a vehicle (World Bank, 2003a, p.147). Vehicle quota systems are a poor instrument for congestion abatement. They do limit the number of vehicles in the national fleet, but do not discourage – and perhaps encourage – vehicle use once it is purchased. Cracknell (2000, p.95) states the following reasons why the vehicle quota system may not be able to be applied in other countries outside Singapore:
• Political acceptability • Pressure will arise for increased ownership as disposable income rises • Local vehicle manufacturing interests will impose pressure • Singapore is a single city/island and registered vehicles outside the city or transport in rural
areas are not issues • The vehicle quota system was one part of a package of measures, which include congestion
pricing There are no vehicle quotas in Malaysia or the KLMA. It is unlikely vehicle quotas would be adopted in Malaysia, as it would be a direct contradiction with the policy of promoting the national automobile.
Jeffrey D. Ensor Malaysia Transport Pricing Strategies, Measures, and Policies February 22, 2004
10
Vehicle Ownership Restraints Governments primarily choose vehicle excise and ownership taxes because they are a good source of revenue for public expenditure and they can be adopted relatively quickly with existing legislation (Cracknell, 2000, p.94). Another common motive is to reduce foreign exchange expenditure (Armstrong-Wright, 1986, p.126). Some countries use vehicle ownership taxes based on engine size to promote fuel-efficient cars. Other motives for instituting licensing fees are to discourage the purchase of personal automobiles (although rarely implemented with this objective) and to account for the different cost of service provision between vehicle classes. Taxes based on the number of axles charge heavy vehicles more in attempt to compensate for the increased road damage incurred by the axle weight. These taxes are not an effective demand management tool, meaning travel demand levels have little sensitivity to increases in vehicle ownership taxes. The Malaysian Government taxes the ownership of automobiles and motorcycles based on engine size (Gakenheimer, 2003b, p.11). Import duties have ranged from 42-80% for imported car components and cost up to 300% of the purchase price for complete cars (The Star Online, 2004). Imported automobiles have faced higher taxes in attempt to promote the national car, but the tax differential is scheduled for elimination in 2005 as required for the ASEAN Free Trade Agreement.6 Proton and Perodua currently receive a 50% discount on vehicle excise taxes, but this is scheduled to end in January 2005. Automobile sale prices and the tax structure in Malaysia are currently in a transition period, with uncertainty at the immediate time (January 2004). The mandatory reduction of certain import duties has led the Government to increase excise taxes. The prices of new vehicles are expected to remain constant or increase with the new structure, which contradicts some expectations of lower prices. A recent estimate by car companies predicts a two to nine percent increase in overall price (Abdullah, 2004). Used car sales have increased since the announcement of the new tariff structure on December 31, 2003. An increase in an overall vehicle price of entry- level automobiles would be a higher barrier to entry in the vehicle market and act as a retardant to the vehicle growth rate. However, workers in developing countries are often willing to devote a substantial portion of their income toward automobile ownership. A slightly higher entry barrier may have negligible effects on travel demand because automobile ownership is a status symbol and source of personal pride for many individuals.
Insurance Insurance can be classified as a fixed cost because the pricing structure is usually based on a fixed length of time (i.e. per month or year) independent of the amount of travel during that period. Nevertheless, vehicle insurance could be instituted on a vehicle-miles-traveled or per hour of use basis, which would more closely approximate the marginal cost of travel and encourage more efficient vehicle use. Gakenheimer (2003b, p.11) states that insurance fees range from USD 260 to 2,000. The insurance pricing and legal framework in Malaysia is unknown.
6 For more information, see “Public-Private Partnerships in the Malaysian Transportation Industry” by John Ward and “7.0 ITS Deployment in Kuala Lumpur” by Ralph Gakenheimer.
Jeffrey D. Ensor Malaysia Transport Pricing Strategies, Measures, and Policies February 22, 2004
11
VARIABLE COSTS Variable costs correlate to the amount of travel and can depend on the specific nature of the journey (e.g. urban vs. rural). These costs often increase (more or less) linearly with the amount of travel, regardless of the nature. Automobile variable (operating) costs typically include fuel, parking, tolls, and congestion charging fees.7
Fuel Prices Developing and transitional economies are expected to account for two-thirds of world’s increase in energy demand by 2020 (IEA, 1999). The International Energy Agency (IEA) cited energy-related subsidies in developing countries as a major problem in the 1999 World Energy Outlook. The report hypothesizes that substantial benefits relating to energy efficiency, economic growth, inward investment, and local and global environments could be achieved if the subsidies were eliminated. It examined eight large countries outside the OECD that consistently under-price energy resources.8 According to the report, “prices for energy consumers in the eight countries average 20% below world market prices, ranging from South Africa’s 6.4% to Iran’s whopping 80%.” The energy prices were predominantly subsidized to ensure end-use prices were below the cost of supply, encourage energy consumption, and to provide access to energy for the largest possible number of people. If energy subsidies were eliminated in these countries, the study’s authors believe the countries could (i) reduce primary energy consumption by 13%, (ii) increase GDP by almost 1% with better economic efficiency, (iii) lower CO2 emissions that cause global warming, and (iv) sharply reduce local air pollution. Elimination of energy subsidies from just these eight countries would decrease world carbon emissions by 4.6% and cut worldwide energy consumption by 3.5%. The report also states that government budgets would see relief, reliance on energy imports would decrease, new technology would be explored, and waste would be discouraged. The IEA acknowledges subsidy elimination is usually met with strong political resistance because it can produce considerable social dislocations. However, social objectives can usually be achieved through more cost-effective measures than fuel subsidies. Indeed, the United Kingdom uses “upstream” fuel tax revenues to support social objectives and reduce the “downstream” tax burden for targeted social groups. Fuel prices affect every vehicle owner, regardless of where or when they drive because fuel consumption is approximately proportional to distance traveled. Fuel taxes are a good surrogate for carbon emissions, but the extent of damage caused by other emissions does not correlate well with the amount of fuel consumption (World Bank, 2002a, p.145). Fuel prices are predominantly used as a revenue collection mechanism and are a poor proxy for externalities relating to congestion delay and infrastructure wear and tear. It also acts as a reasonably good income redistribution tool in developing countries where most car users are usually the most affluent. The fuel tax is not an efficient tool for alleviating urban traffic congestion because it only marginally relates to the use of vehicles at congested times or locations (Cracknell, 2000, p.94). Urban fuel surcharges have been used in attempts to discourage travel in a specific area, but have had very little effectiveness in managing congestion. The fuel tax is often set at a rate too low to charge users the marginal cost of travel even when there is no congestion, thus subsidizing automobile travel all of the time. Higher
7 Congestion charging fees are discussed in a separate section to allow for a more in-depth examination. 8 Malaysia was not one of these countries, although its petrol prices have been lower than Russia’s, which was examined in the study.
Jeffrey D. Ensor Malaysia Transport Pricing Strategies, Measures, and Policies February 22, 2004
12
energy prices would encourage a more efficient use of resources, namely in this context, limit travel demand growth and fuel consumption to levels that are more likely to be sustainable. The main argument against gasoline price hikes are for the “social effects and inability to afford the higher prices” (GTZ, 2003, p.85). Low-income rural households have a difficult time paying for high gasoline, they do not contribute to congestion, and they have very poor (if any) public transport options. Strategically planned periodic fuel price increases are required to compensate for the gradual “relative adjustment” to inflation levels or currency devaluations as well as for “structural price increases” which aim to increase the long-run price (GTZ, 2003, p.85). Incremental price hikes (less than 10% of the pump price) are important to avoid large price hikes, which often see tremendous public opposition. Large relative increases (30% or more) have led to governments being overthrown when consumers are not prepared to handle the additional costs (GTZ, 2003, p.85). Significant political benefits (i.e. popularity) often accompany low fuel prices because constituents often only see how the prices affect them in the short-term. One motivation for increasing fuel prices is to bring about more fuel-efficient vehicles. Consumers may demand better fuel efficiency from industry if they believe petrol is expensive, effectively improving the fleet emissions. However, industry may just make lighter cars, which could create safety implications. An alternative to raising fuel prices in order to encourage more fuel-efficient vehicles would be for the government to create a technology-forcing law requiring car manufacturers to meet certain emissions requirements. This alternative could spur more VMT if put into place alone because it would further reduce the marginal cost of travel (spend less on fuel), but it may create a barrier to entry with higher initial vehicle prices. Fuel taxes are also relatively easy for a government to administer because they can directly charge the suppliers, mitigating large collection costs like those often associated with other pricing measures such as parking. The Malaysian Government fixes the price of fuel. Unleaded petrol costs range between MYR 1.10 to 1.25 (USD 0.29 to 0.33) per liter. Diesel and LPG cost 0.70 and MYR 1.28 per liter, respectfully (Gakenheimer, 2003b, p.11). Transport energy demand is projected to increase 8.7 percent per year (8th Malaysia Plan, 2001, p.327). The ratio of Malaysia’s gasoline price to the world average was 0.46 for 1998-2000 MRYA (World Bank, 2002b). The price of petrol is significantly cheaper in Malaysia than in its neighbor countries, Singapore and Thailand. Premium gasoline was about 40% more expensive in Thailand during this period. The price of petrol in Singapore is typically between 2-2.5 times more than the price in Malaysia. The price of ‘fuel and light’ fell dramatically in relation to other goods during the 1990s in Malaysia. The consumer price index (CPI) for all items was 139.5 in 1999 (where 1990 = 100) while the CPI for fuel and light was only 102.8 in 1999 (UN, 2002, p.298).9 Comparing these trends with the export price of crude oil in Malaysia is quite interesting. The export price quotation of crude petroleum rose from 405 ringgit per metric ton in 1992 to 525 ringgit per metric ton in 1999 – a +30% increase (UN, 2002, p.298).10 As in every nation, fuel prices in Malaysia are set by 9 1999 was the most recent consumer price index information available for “fuel and light”. 10 It is important to note that a major price increase occurred in the year 2000. The export price in 2000 was 854 ringgit per metric ton, which would create a +211% increase compared to the 1992 export price.
Jeffrey D. Ensor Malaysia Transport Pricing Strategies, Measures, and Policies February 22, 2004
13
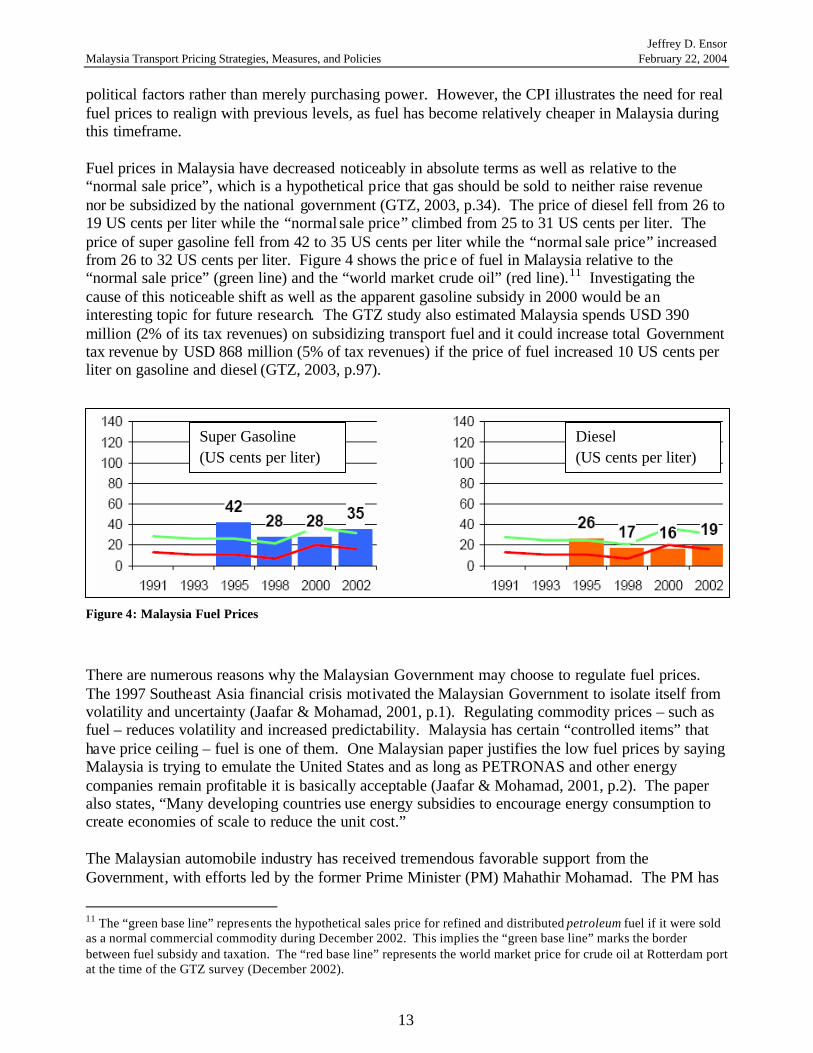
political factors rather than merely purchasing power. However, the CPI illustrates the need for real fuel prices to realign with previous levels, as fuel has become relatively cheaper in Malaysia during this timeframe. Fuel prices in Malaysia have decreased noticeably in absolute terms as well as relative to the “normal sale price”, which is a hypothetical price that gas should be sold to neither raise revenue nor be subsidized by the national government (GTZ, 2003, p.34). The price of diesel fell from 26 to 19 US cents per liter while the “normal sale price” climbed from 25 to 31 US cents per liter. The price of super gasoline fell from 42 to 35 US cents per liter while the “normal sale price” increased from 26 to 32 US cents per liter. Figure 4 shows the price of fuel in Malaysia relative to the “normal sale price” (green line) and the “world market crude oil” (red line).11 Investigating the cause of this noticeable shift as well as the apparent gasoline subsidy in 2000 would be an interesting topic for future research. The GTZ study also estimated Malaysia spends USD 390 million (2% of its tax revenues) on subsidizing transport fuel and it could increase total Government tax revenue by USD 868 million (5% of tax revenues) if the price of fuel increased 10 US cents per liter on gasoline and diesel (GTZ, 2003, p.97).
Figure 4: Malaysia Fuel Prices
There are numerous reasons why the Malaysian Government may choose to regulate fuel prices. The 1997 Southeast Asia financial crisis motivated the Malaysian Government to isolate itself from volatility and uncertainty (Jaafar & Mohamad, 2001, p.1). Regulating commodity prices – such as fuel – reduces volatility and increased predictability. Malaysia has certain “controlled items” that have price ceiling – fuel is one of them. One Malaysian paper justifies the low fuel prices by saying Malaysia is trying to emulate the United States and as long as PETRONAS and other energy companies remain profitable it is basically acceptable (Jaafar & Mohamad, 2001, p.2). The paper also states, “Many developing countries use energy subsidies to encourage energy consumption to create economies of scale to reduce the unit cost.” The Malaysian automobile industry has received tremendous favorable support from the Government, with efforts led by the former Prime Minister (PM) Mahathir Mohamad. The PM has
11 The “green base line” represents the hypothetical sales price for refined and distributed petroleum fuel if it were sold as a normal commercial commodity during December 2002. This implies the “green base line” marks the border between fuel subsidy and taxation. The “red base line” represents the world market price for crude oil at Rotterdam port at the time of the GTZ survey (December 2002).
Super Gasoline (US cents per liter)
Diesel (US cents per liter)
Jeffrey D. Ensor Malaysia Transport Pricing Strategies, Measures, and Policies February 22, 2004
14
supported steel plants, factories, and petrochemical industries in order facilitate growth of the domestic automobile industry (Gakenheimer, 2003a, p.5). The Government offers financial incentives to use natural gas as an alternative motor vehicle fuel. Exemptions on import duties and sales tax keep the price of natural gas vehicles lower than diesel vehicles. This policy discourages ownership of diesel vehicles, but cheap diesel prices are a contradiction and encourage excessive travel if a vehicle is already owned. Road tax reductions are also offered in the amount of 50% for mono-gas vehicles and 25% for bi-fuel or dual- fuel vehicles (Gakenheimer, 2003b, p.10). The Malaysian fuel-tax policies appear to be sub-optimal from a transport perspective. Government control of the national car industry and PETRONAS (the national petroleum corporation) may be primary or contributing factors relating to the controlled low fuel prices. The Malaysian Government could clearly raise significant revenues if they taxed petroleum at a reasonable level but it has chosen to keep fuel prices low. This may be to improve the mobility of low-income rural citizens, but future research into the reasoning for this policy should be performed.
Parking Restraints Parking control can be used to manage congestion and is the most universally accepted demand management tool. On-street parking can be eliminated along certain roads to increase capacity during a particular time of day, most notably during the peak period. Parking fees can be used as a proxy for internalizing congestion charges, although they are a less efficient demand management tool than road congestion pricing. Parking charges can discourage drivers from commuting to a particular area, but do not deter through-traffic and the demand management tool is unable to reflect the distance traveled. High parking charges may also encourage additional trips during the peak periods (if workers are driven to work in the morning and the driver returns home, only to repeat the journey in the evening) and create unproductive trips as drivers circulate the CBD waiting for the passengers or looking for parking spaces (Armstrong-Wright, 1986, p.125). The abundance of for-hire drivers in many developing cities further decreases the effectiveness of parking controls on discouraging excessive traffic. Additionally, drivers who travel to the CBD only before and after peak hours to avoid congestion are charged the same (or more) with parking charges as if they were traveling during the peak. Parking policies need to affect a large portion of all on-street and off-street parking in order to be effective. The Conseil National des Transports says France and the United Kingdom are debating taxation of downtown parking spaces provided by employers for their employees (World Bank, 2003a, p.147). The objective of taxing private non-residential (PNR) and off-street public parking spaces is to have parking fees passed on to drivers, creating disincentives to drive. As one might expect, controlling PNR parking can be very difficult in practice due to employee opposition and enforcement and legal issues. Parking fees are typically supplemented (directly or indirectly) in Kuala Lumpur. Most companies provide fringe benefits and free or subsidized transport is typically part of the package (MIDA, 2002, p.5). One survey during the early 1990s carpooling program found that 60% of respondents were provided with a parking spot for their personal use (Rahman, 1997, p.11). Only one-third of
Jeffrey D. Ensor Malaysia Transport Pricing Strategies, Measures, and Policies February 22, 2004
15
respondents paid for parking at the time of the study. Surprisingly, 64% of respondents felt that parking was not a problem. As of December 1999, on-street parking (legal and illegal) was a common contributor to urban congestion in Malaysia (REAM, 1999, p.13). Parking costs in central Kuala Lumpur currently range from MYR 2 to MYR 5 per hour (USD 0.50 – 1.30) (Gakenheimer, 2003b, p.10). City Hall intends to control parking in the city center according to the Structure Plan. The Malaysian Government has already introduced differential parking charges (8th Malaysia Plan, 2001, p.272). It has also indicated it will take measures to enhance effective car parking control by limiting the duration of parking hours, reducing parking requirements for new projects, and imposing higher parking charges in specific areas (8th Malaysia Plan, 2001, p.289). It appears the KLMA is moving in the correct direction fo r parking charges, but the extent of these changes is unknown.
Tolling This section provides some insight as to the history, role, characteristics, and effects of tolling in Malaysia. The institutional agreements are important to better understand the Malaysian road user charging policy as well as the ability of the Malaysian Government to introduce congestion pricing. Toll roads are most commonly inter-urban expressways in Malaysia. They are usually high capacity roads, but can be congested at toll plazas and some interchanges (REAM, 1999, p.14). There are about 1,230 km of expressways operated under concession in Malaysia as stated by the Malaysia Highway Authority, the principal regulator of the toll road transportation system (PLUS, 2002, p.90). There are about fifteen toll road concessionaires in Kuala Lumpur, but the focus of this section will be on PLUS Expressways. PLUS Expressways represents approximately 69% of all expressway kilometers operated under concession in Malaysia. It is a private corporation, but Khazanah – the investment holding arm of the Government – had an aggregate direct and indirect interest of 86.4% in PLUS Expressways as of May 31, 2002 (PLUS, 2002, p.92). PLUS Expressways has been criticized for a lack of transparency in the awarded concessions. Two companies submitted bids that appeared more competitive than the bid submitted by PLUS but were not awarded the contract. According to Gomez, PLUS was set up by United Engineers Berhad, a company with connections to the ruling party (cited in Mody, 1997, p.36).12 PLUS maintains and operates three interconnected expressways: (1) the 797 km North-South Expressway, (2) the 35 km New Klang Valley Expressway, and (3) a 16 km section of the Federal Highway Route 2. A map of the PLUS Expressways facilities is provided in the Appendix as Figure 7. The North-South Expressway serves all major cities along Malaysia’s west coast and runs from the Singapore border in the south to near the Thailand border in the north. In 2001, the North-South Expressway accounted for 82% of PLUS Expressways total toll receipts while the New Klang Valley Expressway and Federal Highway Route 2 produced the remaining 18% of total toll receipts (PLUS, 2002, p.93). PLUS Expressways states the following about their facilities in their prospectus:
12 United Engineers Berhad is owned by Danasaham, which is owned by Khazanah, which is owned by the Ministry of Finance Inc.
Jeffrey D. Ensor Malaysia Transport Pricing Strategies, Measures, and Policies February 22, 2004
16
As at 31 May 2002, PLUS operated approximately 128 km of dual three-lane expressways, representing 15.1% of the [PLUS] Expressways, and approximately 720 km of dual two-lane expressways, representing 84.9% of the [PLUS] Expressways as well as 67 toll plazas, 78 interchanges, and 584 toll lanes.
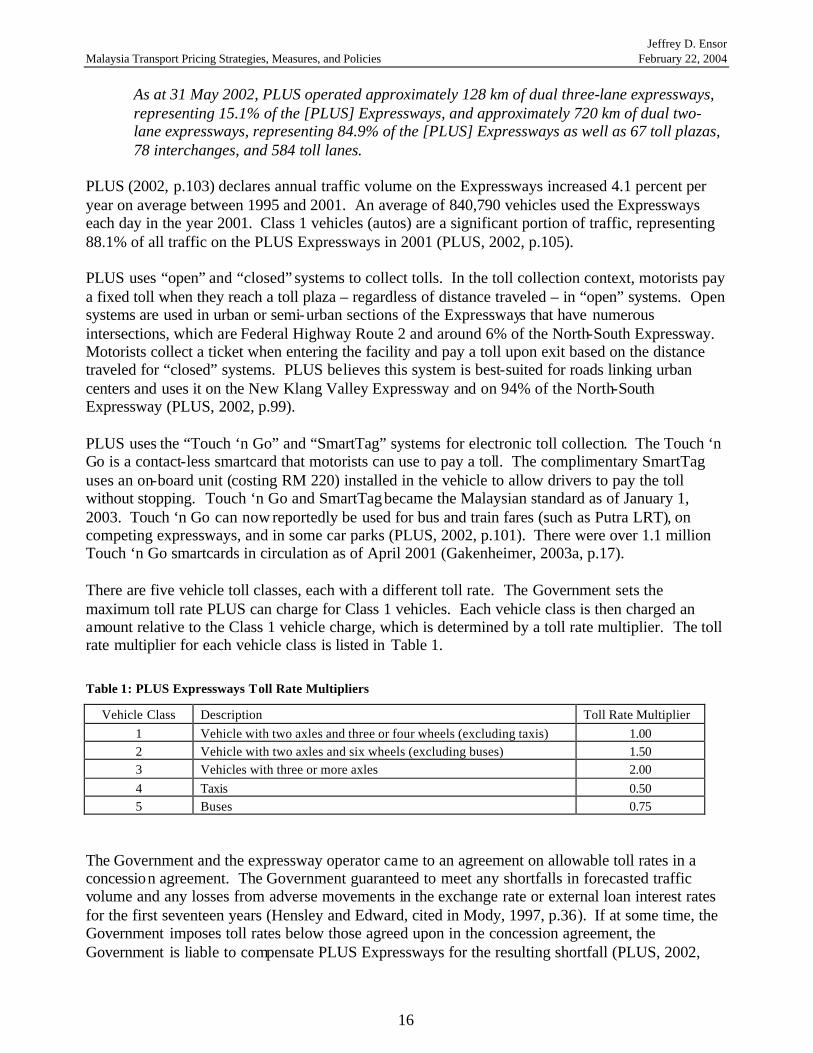
PLUS (2002, p.103) declares annual traffic volume on the Expressways increased 4.1 percent per year on average between 1995 and 2001. An average of 840,790 vehicles used the Expressways each day in the year 2001. Class 1 vehicles (autos) are a significant portion of traffic, representing 88.1% of all traffic on the PLUS Expressways in 2001 (PLUS, 2002, p.105). PLUS uses “open” and “closed” systems to collect tolls. In the toll collection context, motorists pay a fixed toll when they reach a toll plaza – regardless of distance traveled – in “open” systems. Open systems are used in urban or semi-urban sections of the Expressways that have numerous intersections, which are Federal Highway Route 2 and around 6% of the North-South Expressway. Motorists collect a ticket when entering the facility and pay a toll upon exit based on the distance traveled for “closed” systems. PLUS believes this system is best-suited for roads linking urban centers and uses it on the New Klang Valley Expressway and on 94% of the North-South Expressway (PLUS, 2002, p.99). PLUS uses the “Touch ‘n Go” and “SmartTag” systems for electronic toll collection. The Touch ‘n Go is a contact-less smartcard that motorists can use to pay a toll. The complimentary SmartTag uses an on-board unit (costing RM 220) installed in the vehicle to allow drivers to pay the toll without stopping. Touch ‘n Go and SmartTag became the Malaysian standard as of January 1, 2003. Touch ‘n Go can now reportedly be used for bus and train fares (such as Putra LRT), on competing expressways, and in some car parks (PLUS, 2002, p.101). There were over 1.1 million Touch ‘n Go smartcards in circulation as of April 2001 (Gakenheimer, 2003a, p.17). There are five vehicle toll classes, each with a different toll rate. The Government sets the maximum toll rate PLUS can charge for Class 1 vehicles. Each vehicle class is then charged an amount relative to the Class 1 vehicle charge, which is determined by a toll rate multiplier. The toll rate multiplier for each vehicle class is listed in Table 1. Table 1: PLUS Expressways Toll Rate Multipliers
Vehicle Class Description Toll Rate Multiplier 1 Vehicle with two axles and three or four wheels (excluding taxis) 1.00 2 Vehicle with two axles and six wheels (excluding buses) 1.50 3 Vehicles with three or more axles 2.00 4 Taxis 0.50 5 Buses 0.75
The Government and the expressway operator came to an agreement on allowable toll rates in a concession agreement. The Government guaranteed to meet any shortfalls in forecasted traffic volume and any losses from adverse movements in the exchange rate or external loan interest rates for the first seventeen years (Hensley and Edward, cited in Mody, 1997, p.36). If at some time, the Government imposes toll rates below those agreed upon in the concession agreement, the Government is liable to compensate PLUS Expressways for the resulting shortfall (PLUS, 2002,
Jeffrey D. Ensor Malaysia Transport Pricing Strategies, Measures, and Policies February 22, 2004
17
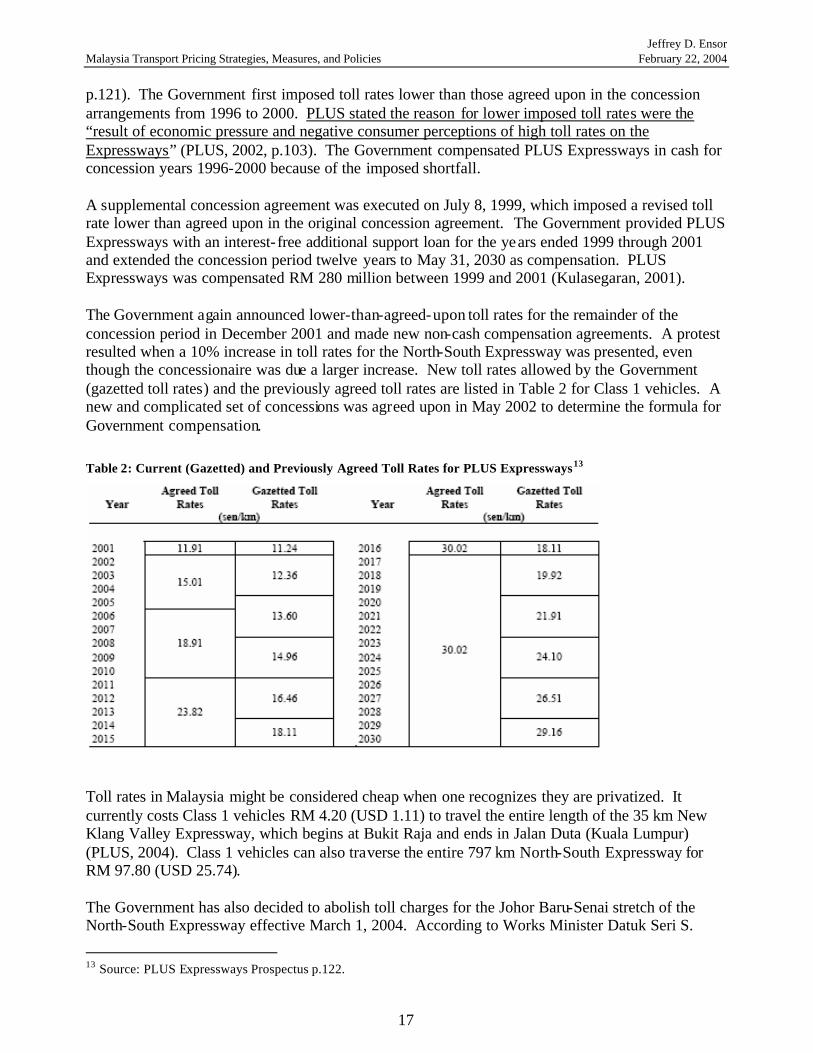
p.121). The Government first imposed toll rates lower than those agreed upon in the concession arrangements from 1996 to 2000. PLUS stated the reason for lower imposed toll rates were the “result of economic pressure and negative consumer perceptions of high toll rates on the Expressways” (PLUS, 2002, p.103). The Government compensated PLUS Expressways in cash for concession years 1996-2000 because of the imposed shortfall. A supplemental concession agreement was executed on July 8, 1999, which imposed a revised toll rate lower than agreed upon in the original concession agreement. The Government provided PLUS Expressways with an interest- free additional support loan for the years ended 1999 through 2001 and extended the concession period twelve years to May 31, 2030 as compensation. PLUS Expressways was compensated RM 280 million between 1999 and 2001 (Kulasegaran, 2001). The Government again announced lower-than-agreed-upon toll rates for the remainder of the concession period in December 2001 and made new non-cash compensation agreements. A protest resulted when a 10% increase in toll rates for the North-South Expressway was presented, even though the concessionaire was due a larger increase. New toll rates allowed by the Government (gazetted toll rates) and the previously agreed toll rates are listed in Table 2 for Class 1 vehicles. A new and complicated set of concessions was agreed upon in May 2002 to determine the formula for Government compensation. Table 2: Current (Gazetted) and Previously Agreed Toll Rates for PLUS Expressways13
Toll rates in Malaysia might be considered cheap when one recognizes they are privatized. It currently costs Class 1 vehicles RM 4.20 (USD 1.11) to travel the entire length of the 35 km New Klang Valley Expressway, which begins at Bukit Raja and ends in Jalan Duta (Kuala Lumpur) (PLUS, 2004). Class 1 vehicles can also traverse the entire 797 km North-South Expressway for RM 97.80 (USD 25.74). The Government has also decided to abolish toll charges for the Johor Baru-Senai stretch of the North-South Expressway effective March 1, 2004. According to Works Minister Datuk Seri S.
13 Source: PLUS Expressways Prospectus p.122.
Jeffrey D. Ensor Malaysia Transport Pricing Strategies, Measures, and Policies February 22, 2004
18
Samy Vellu, the decision was made after numerous appeals from political parties, ministers, associations and the Senai MP Datuk Lim Si Cheng (Lecthumanan, 2004). He also said, “The Cabinet also took note that there was no alternative road for the users other than present highway.” The Government now has to pay RM 331.68 million to the concession holder. The World Bank (1999, p.2) also cites pubic outcry against new toll roads and toll rate hikes in Malaysia. Two possible explanations are high concessionaire profits and public fears of corruption. The Government essentially guaranteed high profits for PLUS in the original concessions, regardless of the toll rates. The public may believe the concessionaires are taking advantage of a near-monopolistic position based on the lack of transparency in the concession awarding process because the terms are not always disclosed (Kulasegaran, 2001). However, what Malaysia has done by shifting the burden to taxpayers (with compensation to PLUS) in order to decrease tolls is less economically efficient than charging users the marginal cost or even something close. Lowering the cost of travel induces traffic demand and VMT. This may spur short-term economic growth with increased mobility, but creates serious sustainability and capacity issues for the transportation network. It is interesting to note that politicians have to some extent conceded to consumer demands. Gakenheimer (2003a, p.4) says the parliament has the ability to make beneficial – but politically unpopular – decisions because it has a degree of insulation from public opinion. However, despite some public opposition to tolling, new toll roads and concession agreements continue to appear in Malaysia in efforts to expand and improve infrastructure. The characteristics of privately-operated toll road companies in Malaysia further increase the complexity of creating a viable overall transport strategy that could include congestion pricing. As will be seen in the following sections, congestion pricing revenues usually need to be transferred to other parts of the transport system in order for the scheme to be politically acceptable. Transferring funds from one privatized company to another can make this option difficult, if not unviable. This would be another interesting area of research to pursue.
TRANSIT PRICING Transit would not require subsidy in many cases if roads were priced effectively (i.e. not subsidized). However, roads are often subsidized if they are not congestion-priced, making it difficult for privately-operated transit companies to remain profitable. Similar to transit agencies in the US, the KLMA’s public transit operators have no t been able to make a profit. There are typically two primary – and conflicting – sets of objectives involved with public transportation: (1) generate enough revenue to ensure an efficient and adequate supply of service, and (2) create accessibility and mobility for the poor while mitigating congestion and environmental impacts caused by personal automobile travel. It is often argued that urban public transport cannot be expected to be profitable if it is to satisfy the second objective (World Bank, 2002a, p.148). The predominantly for-profit privately operated transit system in Kuala Lumpur presents a problem for meeting these social objectives. Less profitable, but socially desirable routes are not the priority pursued by the private sector unless cross-subsidies are mandated by the governing agency. It is necessary for provisions to be made for drivers who are “pushed off” the road with congestion pricing. Transit is often required for these individuals who still require transport to work but cannot
Jeffrey D. Ensor Malaysia Transport Pricing Strategies, Measures, and Policies February 22, 2004
19
adjust their time of travel or carpool. These requirements make it important for the transit improvements to be made before a congestion charging scheme is implemented. The London Congestion Charging scheme used this approach and received considerable public support for its improvements. The Malaysian Government has already recognized this concept (to some extent) in the Eighth Malaysia Plan (2001, p.288) by saying, “Emphasis will be on the need to have a more efficient, safe, and comfortable public transport system to enable a modal shift from private car usage.” However, significant improvements in the public transport system appear necessary to facilitate the implementation of a congestion pricing scheme, as public transport does not seem to be a realistic option for many households at this time.
VEHICLE-USE PROGRAMS Various options are available to charge users based on the amount of use. Car sharing, charging motorists based on the number of vehicle-miles-traveled (VMT), and pay-by-the-mile insurance programs are just a few examples. One disadvantage of vehicle-use programs is that they do not address urban congestion or other externalities directly. VMT charging is a good way for entities to charge motorists who use their infrastructure but do not buy fuel or pay taxes in their region. VMT charging could generate substantial revenues, but would be expensive to administer on a large-scale for passenger vehicles. Germany was recently in the process of implementing Toll Collect, a VMT toll collection system for trucks.14 Toll rates were expected to range between €0.09 and €0.14 per kilometer, depending on the number of axles and the pollution class of the vehicle (Toll Collect, 2004). Germany has a large number of foreign trucks passing through their country and the VMT charging system would have allowed the German government to collect considerable revenues from this through truck traffic. The cancellation of the Toll Collect system is blamed on technology that was immature and complex (Standard & Poor’s, 2004). Car sharing is a concept where users have access to a fleet of vehicles and only pay when they use a vehicle. Cars can be reserved from a private company in advance by phone or internet for a certain length of time (typically hours or days), allowing users to rent the vehicle on a short-term basis and pay for the number of hours used or miles traveled.15 Car sharing is often convenient for users because it presents a mobility option for would-be drivers who do not use a car frequently, eliminating the required fixed costs associated with automobile ownership (insurance, monthly parking, or auto repairs that are required with owning a vehicle) and replacing them with variable costs. Litman estimates over 70% of the private auto costs in the US are associated with fixed costs (TCRP, 2003, p.26). Car sharing could be classified as a form of congestion pricing, although it might not be intuitive. Time is usually a component in the pricing structure for car sharing, encouraging users to avoid waiting in congestion. No knowledge of any vehicle-use programs in the KLMA is known at this time, but there is a car-sharing program in bordering Singapore.
14 Toll Collect was originally scheduled to begin in August 2003, rescheduled for operation by December 31, 2005, and was cancelled by the German government on February 17, 2004. Toll revenue estimates per day were about USD 6-million, though some estimates placed the figure around 9-million/day (TOLLROADSnews, 2004). 15 The Zipcar company in Boston is one example of car sharing.
Jeffrey D. Ensor Malaysia Transport Pricing Strategies, Measures, and Policies February 22, 2004
20
CONGESTION PRICING Congestion pricing uses market forces to allocate limited facility capacity among users by their need to travel and their willingness to pay (TCRP, 2003). It is also known as congestion charging, variable road pricing, peak-period pricing, or value pricing and is commonly used in the airline, telephone, hotel, skiing, and electricity industries. The concept involves charging more for the right to use a service or facility during peak periods to discourage unnecessary trips, resulting in reduced congestion. As noted earlier, imperfect pricing of measures such as the vehicle fuel tax have led to the creation of congestion, which is quite undesirable. Congestion (i) is economically inefficient due to lost time incurred by persons and goods, (ii) decreases travel time reliability and predictability, (iii) reduces the attractiveness of road-based public transport, (iv) creates adverse environmental impacts with more pollution per VMT than free-flowing traffic, (iv) decreases the quality of urban life, (vi) increases the chance of road accidents, and (vii) encourages sprawl – which uses resources inefficiently – when the city center is congested. The World Bank (2002a, p.142) cites several reasons why economists have long advocated congestion pricing. To start, it increases economic efficiency by creating correct incentives over the entire range of dimensions involved in travel decisions, including travel time, choice of destinations, mode of transport, route, etc. Additionally, congestion pricing applied in the context of a flexible land and property market would create cities with more compact forms, more mixed land use, less resources devoted to spread of the road network into surrounding areas, and more funds available for improving infrastructure in currently urbanized areas. Most importantly, congestion pricing generates revenue instead of creating additional expenses many of the alternative administrative measures create. This potentially substantial revenue source can be used build additional infrastructure, finance ITS projects, improve socially desirable aspects of the transport system such as public transport, or even be used for non-transport purposes such as health care and education. Although it is recommended to initially use the revenue for improving alternatives to auto travel, the use of the revenue is dependent upon the case-specific legal framework and objectives of the implementing government. Road transport congestion pricing theory suggests that motorists should pay (i.e. the “user-pay” principle) for the short-term marginal social costs of their trip. Congestion pricing provides economic incentives to use transit, shift automobile trips away from the peak periods and routes, increase vehicle occupancy rates, and combine or eliminate some low-value trips altogether. It results in fewer vehicles on the road and can create substantial benefits if it reduces an already high volume/capacity ratio. It is a way of managing existing capacity to limit the amount of new capacity necessary to maintain traffic speeds and level-of-service. The Malaysian Government is not an advocate of the user-pay principle. In fact, the Eighth Malaysia Plan (2001, p.199) clearly states, “the ‘user-pay principle’, though reflecting the economic costs of providing such services, will not be the guiding principle in the determination of tariff rates and charges. The Government will continue to control tariff setting and reviews so as to ensure that the public will enjoy these services at affordable rates.” The true Government intent with this statement is unknown, but one might infer the Government is trying to lower user costs in order to increase consumption and/or economic growth. Economic growth receives considerably more discussion in the Eighth Malaysia Plan than sustainability or congestion reduction.
Jeffrey D. Ensor Malaysia Transport Pricing Strategies, Measures, and Policies February 22, 2004
21
Congestion charging schemes are not true marginal-cost pricing. They are a second-best tool most often used to manage demand and the degree of MCP approximation depends heavily on the characteristics of the particular scheme. It must be emphasized that congestion pricing is a better approximate of the full social costs of vehicle travel than fuel and vehicle excise duties. This is because increasing taxes cannot create a scale approximation of the full social cost relative to the amount of travel. The social cost of congestion and pollution in rural areas is small, which cannot be captured with these taxes. Congestion pricing is fairer because it charges drivers who use the roadway at the most congested time the highest price, thereby better approximating the full social cost. Congestion pricing is also able to charge users different amounts based on vehicle type, allowing for a better approximation of the externalities and variable costs associated with different vehicles than available with taxes. Congestion pricing would likely have several positive effects for transit. Automobile drivers are often subsidized and eliminating the peak-period auto subsidy with congestion pricing could create significant gains in transit ridership if transit services are available and of good quality. Road-based transit frequencies and reliability would improve because of fewer delays, increasing the attractiveness of transit. Creating HOT or bus rapid transit lanes with congestion pricing revenues could prove to be quite beneficial to transit riders. Equity concerns may very well be the most difficult obstacle for implementing congestion pricing in most industrialized nations today. However, these concerns are less applicable to most developing and transitional nations. Automobiles are typically a luxury and most low-income people use public transit or non-motorized transportation. Therefore, the direct costs of the congestion charge is typically borne by individuals who are not low-income. Malaysia could be the exception due to the country’s high motorization rate. Automobiles are less of a luxury in Malaysia than in other developing countries and are owned by more than just the upper class. There are 1.3 autos and 0.7 motorcycles per household in the KLMA. Relatively few trips use the less-than-ideal transit system in the KLMA compared to similar cities. It may be more politically difficult to implement road user charges than in other developing countries because automobile-owning households are not a small minority in Malaysia. Congestion pricing is likely to have positive impacts on poverty reduction for many cities in the developing world. Lowering the transport costs for the low-income population enhances their employment and social opportunities, which ultimately promotes the elimination of poverty. Better transit – which ideally should be improved in coordination with congestion pricing – would directly improve service for the poor and expand employment opportunities with shorter travel times, higher reliability, and potentially cheaper fares. The poorest portions of the population in developing cities typically use transit, para-transit, motorcycles, or non-motorized modes such as walking and bicycling. Only 20% of motorized trips in the KLMA use public transit. We might be able to infer that these transit and non-motorized users roughly correspond to the lowest income group and would likely be better off with a congestion pricing scheme (as long as congestion decreased and revenues were used to improve and expand transit and non-motorized services). Data for the travel mode choice according to income group in the KLMA would help determine the impact of congestion pricing on poverty in the KLMA. The World Bank strongly supported congestion pricing after Singapore’s successful Area Licensing Scheme in the 1976 urban transport policy paper. The World Bank suggested congestion pricing for Kuala Lumpur and Bangkok but it was not put into operation in either city. The implementation
Jeffrey D. Ensor Malaysia Transport Pricing Strategies, Measures, and Policies February 22, 2004
22
in Kuala Lumpur was deferred because the Government felt improvements to public transport and the development of the inner ring road were necessary before a scheme could be implemented (Armstrong-Wright, 1986, p.125). The scheme was considered again in the mid-1980s as part of the Master Plan Transportation Study for the city. A ring road has since been constructed in Kuala Lumpur. In Malaysia, it may be desirable to charge more than the full social marginal cost to urban motorists in order to achieve other social objectives. These additional revenues from urban areas could potentially cross-subsidize rural road construction, which is where a large portion of poverty resides. Malaysia has made significant efforts to improve rural accessibility in recent years. Eradicating poverty is one of the goals stated in Vision 2020 and additional support for rural infrastructure could have great benefits for low-income rural citizens. The Government is likely to be responsible for financing rural roads because private companies serve high volume corridors where they can collect enough toll revenues to produce a profit. If the Malaysian Government does not wish to spend more on transport, socially progressive programs such as education and health care could also benefit from the large revenues. Despite the many benefits of congestion pricing, few schemes have been implemented around the world, although the number is growing. The World Bank Urban Transport Strategy Review cites the following reasons for the lack of congestion charging implementation (Cracknell, 2000, p.98):
• Political, and some public opposition • Failure of transport planners to present convincing arguments as to the benefits of
congestion pricing • Legal and institutional constraints associated with direct charging for road use • Lack of legal framework for dealing with offenders (e.g. “owner” versus “driver” liability) • Institutional weakness to plan, design, implement, and manage a scheme on a continuous
basis • Tendency to regard congestion pricing as a “stand-alone” scheme and thus a failure to
recognize and develop integrated policies for improved, quality public transport as an alternative to car use
Congestion pricing has also been opposed in the past because the net financial benefits are not returned to the drivers who pay. Additional questions include (1) how to distribute the burdens of congestion pricing, (2) how to use the revenue, (3) how to cope with the synergetic effects (management of mobility), (4) environmental issues, (5) how to overcome technical problems, and (6) how to manage the political risks. These important issues need to be addressed before a scheme is introduced. Legal issues may not allow direct charging for road use or the legal and administrative framework may not be able to trace violators. Traffic legislation may need to be changed with congestion pricing. Additionally, accurate national vehicle registration records or an equivalent procedure needs to be available to trace and find violators if an electronic system is used. There are a large number of developing cities that do not possess accurate registration records, which may decrease the viability of automatic enforcement.16
16 This is not an issue for Malaysia, which has a vehicle registration database.
Jeffrey D. Ensor Malaysia Transport Pricing Strategies, Measures, and Policies February 22, 2004
23
It requires a strong traffic and transport agency to effectively plan, design, implement, manage, and enforce a congestion pricing scheme. Congestion charging schemes are large and complex – the scheme could be classified as a CLIOS, or a Complex, Large-scale, Integrated, Open System. 17 A knowledgeable, multi-disciplinary team is essential to successful implementation. Some critics of congestion pricing mistakenly perceive it as a “stand-alone” policy, neglecting to see the benefits to other areas of the transport sector. Others believe there will be an emigration from areas that are priced to areas that are not. Most of these concerns can be dispelled with proper land-use controls. Congestion pricing should actually make the city center (if in the form of area-wide pricing) more attractive. There are several characteristics defining a “good” congestion charging scheme. These often include:
• Clearly defined goals • Part of an overall transport strategy • Net benefits • Hypothecated revenues for transport improvements instead of general government funds • A viable transport alternative • Reliable and proven technology • Easy for visitors and infrequent users • Flexible so it can accommodate new objectives in future • Ensuring personal privacy • Enforceable • Consideration of differences between vehicle types • Starting simple and being understandable for drivers • Effective marketing and educational campaigns • Predictable prices so drivers can make appropriate decisions ahead of time • Multiple payment options • Low administrative costs and burdens • Perceived as effective by the public • Perceived as fair by the public • Exercising other controls, specifically land-use, in tandem
A proposed congestion charging scheme will also need to examine its effects on “high income” automobile users, “low income” automobile users, freight carriers, existing public transport users without a car, and existing public transport users who either have a car or are considering a purchase. 18
Congestion pricing can take several forms and the specific nature of each scheme and location cannot be over-stressed. This paper does not attempt to be exhaustive, but seeks to provide insight and an overview of available congestion pricing forms in the following sections. With this in mind, Figure 8 (located in the Appendix) presents a rough qualitative analysis of the ability of different transport pricing measures and strategies to approximate the true marginal cost of roadway travel.
17 For more details about CLIOS, the reader is referred to “The Concept of a CLIOS Analysis: Illustrated by the Mexico City Case” by Rebecca S. Dodder, Joseph M. Sussman, and Joshua McConnell. 18 Adapted from Cracknell (2000, p.98).
Jeffrey D. Ensor Malaysia Transport Pricing Strategies, Measures, and Policies February 22, 2004
24
FORMS OF CONGESTION PRICING
Network Pricing Network pricing would be the truest form of congestion pricing, but it is difficult to implement. With network pricing, individual vehicle movements would be tracked through the network and charged the full marginal cost based on the congestion of the chosen links. Technology could be adapted to invoke such a scheme (most likely with a form of GPS), but political obstacles, some remaining technological challenges, and the complexity of the scheme are likely to be overwhelming without more case studies for people to become comfortable with the idea of congestion pricing.
Area-Wide and Cordon Pricing Area-Wide pricing is charging fees for crossing a cordon surrounding a defined area, driving within the area, parking on public roads inside the area, or a combination of these measures. This defined area is typically the central business district (CBD) of a city. Area-wide pricing allows transport managers to target congestion in a specific geographic area. Congestion pricing schemes in Singapore and London are area-wide pricing. Cordon pricing is a form of area-wide pricing and is probably the most practical and understandable congestion pricing scheme. Depending on the objectives of the agency, charges can be imposed each time a driver crosses a cordon, each time a driver enters a cordon, or a single charge for unlimited crossings within a set length of time. Area-wide pricing can issue manual permits or use electronic charging to collect fees from drivers. Paper-based schemes require manual enforcement, which can be quite labor- intensive if there are many points of entry and exit. Electronic collection technology has been expensive in the past, but the maturation of existing technology and introduction of new technology has made it cheaper in recent years. The London Congestion Charging (CC) scheme uses Automatic Number Plate Recognition (ANPR) technology combined with digital imaging to photograph vehicle license plates, compares the number with a payment database, and then issues a fine to the appropriate vehicle owner if the driver did not pay the mandatory charge for possessing a vehicle within the congestion charging zone on that day. The use of ITS for fee collection dramatically improves the flexibility of the system and allows for differential charging based on vehicle type and time of day. Discounts for targeted users can also be easily accounted for in many cases. To illustrate, London provides a 90% discount for residents living within the charging zone and exemptions for vehicles such as taxis, motorcycles, emergency vehicles, buses, and alternative fuel vehicles. The enforcement can be relatively easy and automated if a current and accurate national vehicle database is available. The London CC scheme introduced in February 2003 includes cordon pricing, but is a broader-based area-wide scheme. It encompasses the 22 square kilometer zone inside the London Inner Ring Road commonly referred to as central London. Drivers are required to self-report (through various payment options) one £5 fee for unlimited entries, exits, travel within, and on-street parking for the charging period, which is 7:00am to 6:30pm, Monday through Friday, excluding holidays.
Jeffrey D. Ensor Malaysia Transport Pricing Strategies, Measures, and Policies February 22, 2004
25
The Singapore Electronic Road Pricing (ERP) scheme was introduced in September 1998 to replace the previous paper-based Area Licensing Scheme (ALS) introduced in 1975 and Road Pricing System introduced in the 1990s to complement the ALS. It is also an area-wide scheme (covering about 720 ha) inside a ring road, but uses a different pricing structure and technology than was chosen in London. The ERP is a 2.54 GHz dedicated short-range radio communication system consisting of an In-vehicle Unit (IU), ERP gantries, and a control center. Vehicles are equipped with an IU that accepts a smartcard for which drivers can easily add credit. Each time the vehicle passes under one of 29 overhead gantries at entry points to the Restricted Zone (RZ) between 7:30am to 7:00pm on weekdays, the vehicle is charged a fee based on the time of day (ranging from S$0.50 to S$2.50 for cars with other fare structures for different vehicles). There are twelve additional gantries along congested expressways and other main roads, but these are only in operation during the morning peak period (7:30am to 9:30am) on weekdays. Each IU number correlates to an individual vehicle registration number. A variable fee is charged each time a driver crosses one of the cordons surrounding the RZ. The fee is pre-determined for each half-hour interval during the day and charges more during the peak periods. As of 2000, 97% of the total vehicle population was equipped with the $120 IUs, which were gifted to existing vehicle owners by the Singapore Government (Menon, 2000, p.1). Digital images of the rear license plate are recorded for vehicles not possessing an IU, smartcard, or sufficient funds. This information is then sent to the control center where the information is stored for violation reference. The individual characteristics of an area-wide pricing scheme can produce drastically different approximations of marginal-cost pricing (MCP), which may or may not be the primary objective of the governing agency. The agency’s objectives – whether revenue generation, reducing congestion, charging motorists the social marginal cost, or all of the above – will play a crucial role in determining the most desirable scheme form. The Singapore scheme is probably a better approximate of MCP than London because charges are accrued with each cordon passing and the fee varies by level of congestion (i.e. time of day). On the other hand, the London scheme discourages travel or parking within the zone while Singapore does not. As with other congestion charging schemes, area-wide pricing cannot solve long-term problems by itself – it must be part of an integrated strategy to alleviate congestion and provide better alternative options. Net revenues for the London scheme are expected to be £68 million this financial year and £80 million to £100 million in future years – all of which will be spent on transport improvements for London (TfL, 2003). The London scheme has added buses traveling within the CC zone, made improvements to the Underground subway, and improved traffic flow on roads surrounding the CC zone in order to accommodate the additional traffic. Marketing the idea of using CC revenues to improve other transport facilities and services has been credited with contributing to the public relations “success” of the scheme. It must also be noted that London and Singapore had a relatively low share of person trips using personal automobiles to travel to the CBD before the schemes were implemented. As a result, public support was higher because the automobile driver group (which is typically in opposition before a scheme is implemented) was small and composed of “wealthier” individuals. In fact, 90% of those driving into central London were from the wealthiest half of society (EFTE, 2003).
Jeffrey D. Ensor Malaysia Transport Pricing Strategies, Measures, and Policies February 22, 2004
26
Facility Pricing Facility congestion pricing is time-dependent and charges fees to use all lanes on a particular facility (usually an expressway, tunnel, or bridge). As with other scheme forms, exemptions and discounts for targeted vehicle groups like HOVs can be implemented using ITS. Tolls change throughout the day and strive to spread out the peak period, eliminate unnecessary trips, or create a mode shift. Various projects are found in Lee County, Florida; Toronto, Canada; New York/New Jersey; and Seoul, Korea.
Partial-Facility Pricing (HOT Lanes) Partial- facility pricing charges certain vehicles for the use of dedicated lanes on an expressway during peak periods. The most widely known form of partial- facility pricing is the use of High-Occupancy/Toll (HOT) lanes. HOT lanes allow High-Occupancy Vehicles to travel on managed lanes at no charge (or at a discount) and allow other vehicles that do not meet the HOV criteria, low-occupancy vehicles (LOVs), to travel on the managed lanes for a price. LOVs allowed on HOT lanes typically – but not always – include Single-Occupancy Vehicles (SOVs).19 HOT lanes are a form of congestion pricing that has received much attention lately in the United States. This may be because the United States seems to suffer from a different type of congestion than that which ails the rest of the world. The US has large urban freeways that often become congested in some metropolitan areas, while congestion in other parts of the world might be classified as “urban gridlock”. HOT lane projects in the US include San Diego’s I-15 and Houston’s Katy Freeway. A project for SR 91 in Orange County, California acts essentially as HOT lanes, but it is actually an express roadway built in the median of an existing freeway and offers discounts for HOVs. There are several HOT lane projects proposed or planned in the United States. There are several advantages to HOT lanes over HOV lanes. A comparison between the two types of managed lanes is presented in Table 3.
19 The Katy and Northwest freeways in the Houston (Texas) Metropolitan Area allow two-person carpools to use the HOT lane for USD 2.00 per trip during peak periods while HOVs with 3+ passengers and buses can travel for free. SOVs are restricted from the facility.
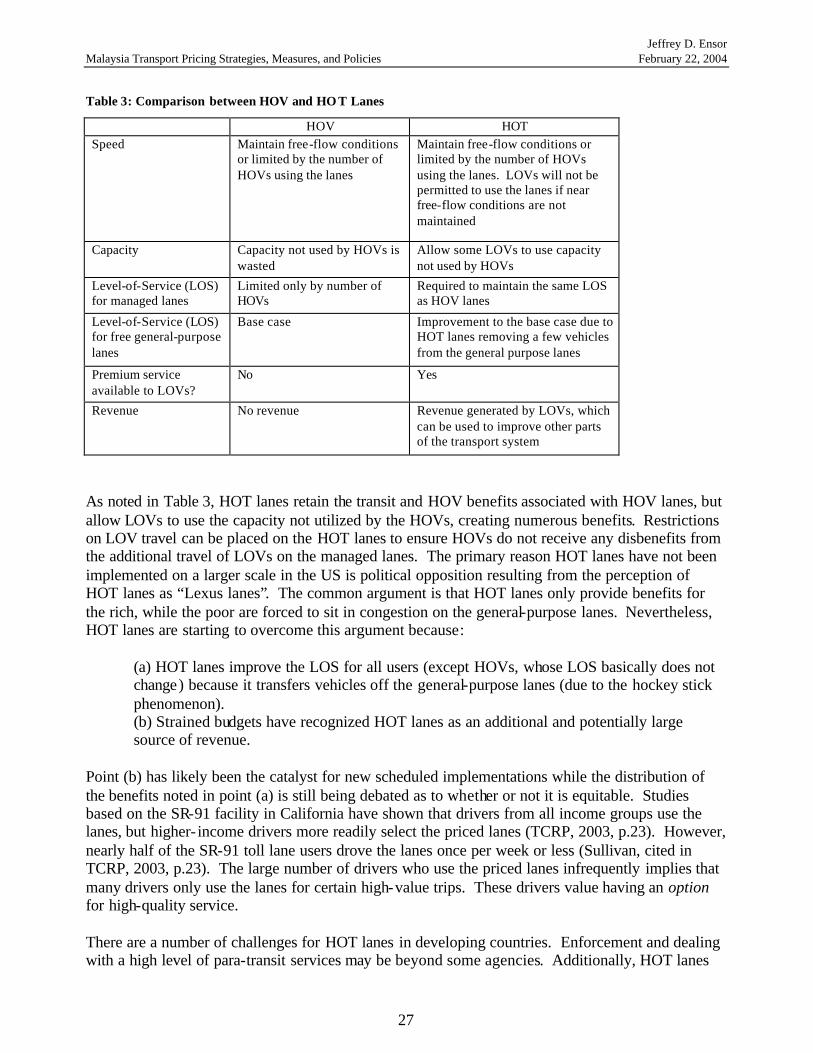
Jeffrey D. Ensor Malaysia Transport Pricing Strategies, Measures, and Policies February 22, 2004
27
Table 3: Comparison between HOV and HO T Lanes
HOV HOT Speed Maintain free-flow conditions
or limited by the number of HOVs using the lanes
Maintain free-flow conditions or limited by the number of HOVs using the lanes. LOVs will not be permitted to use the lanes if near free-flow conditions are not maintained
Capacity Capacity not used by HOVs is wasted
Allow some LOVs to use capacity not used by HOVs
Level-of-Service (LOS) for managed lanes
Limited only by number of HOVs
Required to maintain the same LOS as HOV lanes
Level-of-Service (LOS) for free general-purpose lanes
Base case Improvement to the base case due to HOT lanes removing a few vehicles from the general purpose lanes
Premium service available to LOVs?
No Yes
Revenue No revenue Revenue generated by LOVs, which can be used to improve other parts of the transport system
As noted in Table 3, HOT lanes retain the transit and HOV benefits associated with HOV lanes, but allow LOVs to use the capacity not utilized by the HOVs, creating numerous benefits. Restrictions on LOV travel can be placed on the HOT lanes to ensure HOVs do not receive any disbenefits from the additional travel of LOVs on the managed lanes. The primary reason HOT lanes have not been implemented on a larger scale in the US is political opposition resulting from the perception of HOT lanes as “Lexus lanes”. The common argument is that HOT lanes only provide benefits for the rich, while the poor are forced to sit in congestion on the general-purpose lanes. Nevertheless, HOT lanes are starting to overcome this argument because:
(a) HOT lanes improve the LOS for all users (except HOVs, whose LOS basically does not change) because it transfers vehicles off the general-purpose lanes (due to the hockey stick phenomenon). (b) Strained budgets have recognized HOT lanes as an additional and potentially large source of revenue.
Point (b) has likely been the catalyst for new scheduled implementations while the distribution of the benefits noted in point (a) is still being debated as to whether or not it is equitable. Studies based on the SR-91 facility in California have shown that drivers from all income groups use the lanes, but higher- income drivers more readily select the priced lanes (TCRP, 2003, p.23). However, nearly half of the SR-91 toll lane users drove the lanes once per week or less (Sullivan, cited in TCRP, 2003, p.23). The large number of drivers who use the priced lanes infrequently implies that many drivers only use the lanes for certain high-value trips. These drivers value having an option for high-quality service. There are a number of challenges for HOT lanes in developing countries. Enforcement and dealing with a high level of para-transit services may be beyond some agencies. Additionally, HOT lanes
Jeffrey D. Ensor Malaysia Transport Pricing Strategies, Measures, and Policies February 22, 2004
28
do not necessarily address long-term travel demand as effectively as facility pricing because there is still congestion on the general-purpose lanes, which will continue to grow. Nevertheless, HOT lanes can produce many benefits and more desirable traffic results than strictly general-purpose lanes or HOV lanes in many cases. The presence of existing HOV lanes or bus priority in the KLMA has not been identified. This may make HOT lanes more difficult to implement, which would require building additional capacity or converting a general-purpose lane.
ENVIRONMENT EFFECTS The long-term environmental effects of congestion pricing are not known at this time. Theories are varied and there is not good long-term empirical evidence to evaluate (the Singapore experience is viewed as unique compared to the rest of the world). Estimates range from neutral to positive environmental effects (TCRP, 2003, p.48). The main impact of congestion pricing on vehicle emissions would be expected through effects on vehicle operating speeds, speed variations, and VMT (TCRP, 2003, p.48). Vehicle speeds will very likely increase on a facility or area that is priced. The extent of the average speed increase will be site-specific. Alleviating urban gridlock and stop-and-go traffic will likely improve air quality.20 Likewise, fewer and shorter trips should also have positive effects. However, if vehicle speed increases too much and exceeds the “ideal environmental speed” (typically around 65 km/hr) vehicle emissions could actually worsen, although this scenario is unlikely in many cases. Do we know if VMT will increase or decrease? Increasing travel speeds could encourage people to move farther from their place of employment and subsequently increase the VMT. On the other hand, congestion pricing could increase the attractiveness of living near the place of employment, carpooling, and transit. Many unnecessary trips would also be eliminated. It is known that increasing VMT (by itself with all other factors the same) has negative effects on the environment (notably air quality) by exuding more emissions. It is not clear how VMT would be impacted by congestion pricing a single facility. Emission reduction estimates for single facilities are highly dependent on the availability of alternative routes and on how much traffic would shift to these routes (Wachs, cited in TCRP, 2003, p.48). The pricing structure of a congestion pricing scheme could also be theoretically linked to the air quality of a metropolitan area. For example, the amount of the congestion charge could increase on days when the KLMA was having bad air quality. The pricing could be structured in several ways, but the idea of making users pay for the additional cost to society by choosing to travel on that day would remain the same. However, although an air quality charge may be quite desirable from a human health perspective, there could be public resistance to a charge that was not predictable. It is not possible to make a conclusive statement regarding the long-term environmental effects of congestion pricing encapsulating all possible scheme forms. Different forms of congestion pricing
20 Congestion would decrease, but not necessarily be eliminated with pure marginal cost pricing in some urban areas where the cost of road capacity is extremely high. Some travelers would be willing to pay more than their own direct costs for the benefits they receive from making that trip, without the benefits of eliminating congestion being great enough to justify the high cost of additional capacity (World Bank, 2002a, p.141).
Jeffrey D. Ensor Malaysia Transport Pricing Strategies, Measures, and Policies February 22, 2004
29
are likely to produce noticeably different effects on VMT – HOT lanes may increase VMT while network pricing would likely decrease VMT. Possible long-term changes in land use are also likely to have an effect on the environment.
LAND USE AND SPRAWL Sprawl has resulted in many cities where land use restraint was not given the priority it deserves. Inadequate land use control in the past appears to have contributed to travel demand and auto-dependence. The desire for economic development has led many cities to relax land use policies in order to attract new land development. Many agencies responsible for land use planning in developing cities lack the strength and planning ability to institute strong policies as well as the integration of transport with land use. Land use is a medium- to long-term policy while congestion pricing can be implemented quickly (in principle). Pricing may affect travel patterns (and subsequently land rents) in the short-term and land use in the long-term through home and employment decisions (TCRP, 2003, p.47). People typically prefer to move away from the CBD and into low-density housing in the suburbs when they can afford to. As the transportation speeds increase, outward growth continues, resulting in urban sprawl if land use policies are not in place. However, the positive effects of improving system efficiency cannot be ignored.21 Some transportation researchers believe travelers are willing to commute anywhere within a certain time radius, typically around 1-hour. By increasing the efficiency of the transportation system and consequently the 1-hour commute distance, individuals have access to more employment options, allowing them to be at their highest job function – for the betterment of society. Congestion pricing in its purest form will improve mobility for private transport with congestion abatement in urban areas. If combined with a good public transport system, congestion pricing should also improve mobility and accessibility for the trips that are pushed out of the automobile and onto public transport. The specific characteristics of the congestion pricing scheme, land-use policies, individual transportation system, and users will all play a role in determining the amount of sprawl.
REVENUE HYPOTHECATION Improvements and investments in other areas of the transport system are strongly encouraged to coincide with congestion pricing if congestion pricing is implemented. Public acceptance is likely to be significantly higher if net revenues from congestion pricing are hypothecated, or “earmarked”, for local transport improvement use. People are generally opposed to congestion pricing schemes where net revenues are contributed to the general government pool because they view the introduction of a scheme as just an increase in taxes. Net revenues devoted to improving transport on the facility from which they were collected and public transport in particular are likely to see more support. Areas surrounding the charging area – such as a ring road – also need to be improved in order to avoid becoming congested if travelers choose to bypass the route. Public transport priority on the approaches is also recommended if they become congested. Additionally, the
21 In this context, increased efficiency is the ability of the system to move a larger number of vehicles or persons through the system quickly and a better use of infrastructure resources.
Jeffrey D. Ensor Malaysia Transport Pricing Strategies, Measures, and Policies February 22, 2004
30
creation of a single area-wide transportation pool could have significant benefits that include better investment decisions, a higher level of integration, and improvements in public transport. Revenue hypothecation for transport purposes could theoretically be eliminated once the transport system is deemed acceptable. If desired, the revenues could then be used to support social programs such as education and health care. Public-private partnerships such as privately-operated toll roads and transit create complications for revenue hypothecation. Indeed, the motives of the private sector are different from those in the public sector and it would be difficult to ensure the congestion pricing revenues were being spent in a manner that is best for the public good. The public would likely be critical of any such balance transfers, making transparency in government actions and the “money trail” necessary to gain public support.
TECHNOLOGY Recent developments in Intelligent Transportation Systems (ITS) have led to resurgence in congestion pricing considerations, namely making it practical, reliable, enforceable, and affordable. Smartcards, automatic vehicle identification (AVI), In-vehicle Units (IUs), GPS, and digital imaging are some of the ITS technology responsible for congestion pricing advancements. This new technology has been proven in many cases and has eliminated many of the prior concerns about implementation issues. Automatic and electronic charging technology has the ability to charge motorists based on the vehicle speed, distance traveled, or time spend in an area. Technology is also available for automatic enforcement. ITS can eliminate in many cases the need for manual fee collection, for which the long-term costs can be very expensive and it creates bottlenecks at collection points. Additionally, issuing on-the-spot fines for cordon pricing violators is less than desirable because (i) road space is required to deal with offenders, (ii) there is a possibility of corruption, and (iii) the number of offenders and the subsequent congestion at control points may be large enough to erode the benefits of the scheme (Cracknell, 2000, p.xii). It must be noted that a current and accessible vehicle registration database is essential for the London and Singapore schemes to be effective – this may not be available in every developing country. Malaysia has developed a vehicle registration database for the purpose of ITS enforcement (Gakenheimer, 2003a, p.14).
CONCLUDING REMARKS Pricing automobile transport facilities and services to better approximate the full social cost of travel may create long-term benefits for the KLMA. Internalizing external costs could improve economic efficiency and lead to a more efficient use of resources, thus creating a more-sustainable Malaysia. There are several trends in Malaysia that are troubling from the perspective of travel demand management, namely the increasingly cheaper cost of automobile travel due to subsidies that distort mode choice. First, the price of fuel is approximately half the world average, significantly cheaper than its neighbor states, and is becoming cheaper relative to the cost of other goods. This encourages excessive and wasteful use of petroleum, which raises economic and environmental
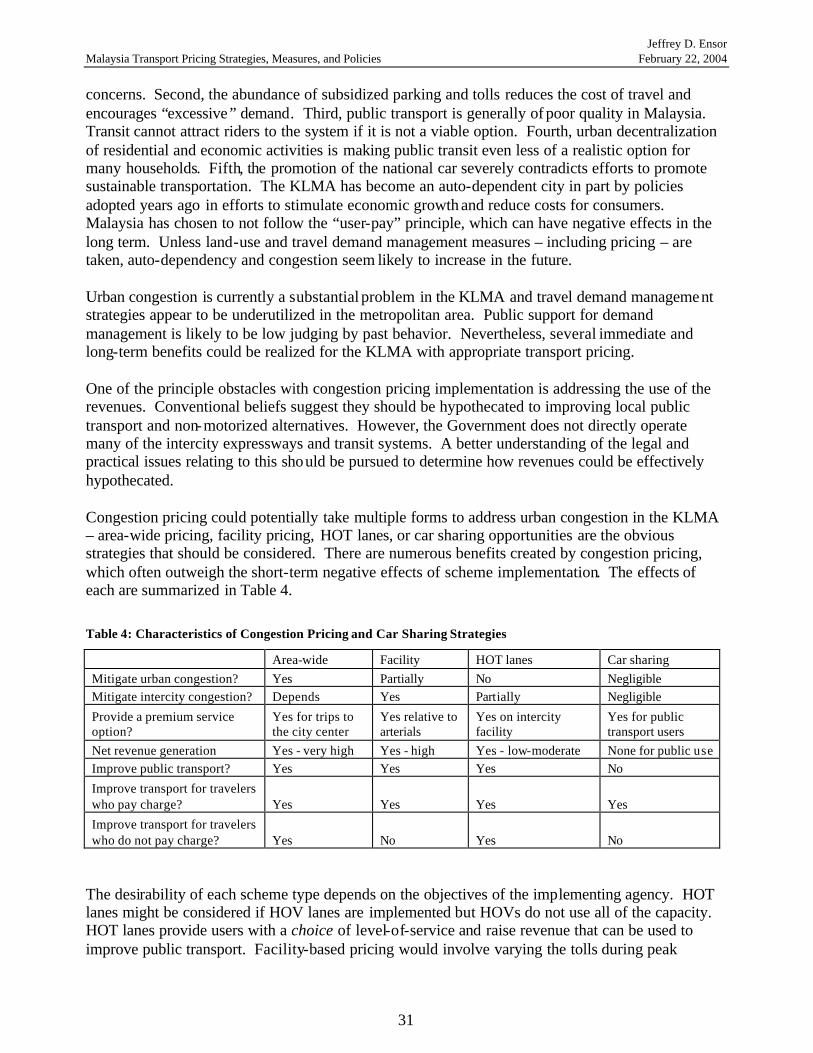
Jeffrey D. Ensor Malaysia Transport Pricing Strategies, Measures, and Policies February 22, 2004
31
concerns. Second, the abundance of subsidized parking and tolls reduces the cost of travel and encourages “excessive” demand. Third, public transport is generally of poor quality in Malaysia. Transit cannot attract riders to the system if it is not a viable option. Fourth, urban decentralization of residential and economic activities is making public transit even less of a realistic option for many households. Fifth, the promotion of the national car severely contradicts efforts to promote sustainable transportation. The KLMA has become an auto-dependent city in part by policies adopted years ago in efforts to stimulate economic growth and reduce costs for consumers. Malaysia has chosen to not follow the “user-pay” principle, which can have negative effects in the long term. Unless land-use and travel demand management measures – including pricing – are taken, auto-dependency and congestion seem likely to increase in the future. Urban congestion is currently a substantial problem in the KLMA and travel demand management strategies appear to be underutilized in the metropolitan area. Public support for demand management is likely to be low judging by past behavior. Nevertheless, several immediate and long-term benefits could be realized for the KLMA with appropriate transport pricing. One of the principle obstacles with congestion pricing implementation is addressing the use of the revenues. Conventional beliefs suggest they should be hypothecated to improving local public transport and non-motorized alternatives. However, the Government does not directly operate many of the intercity expressways and transit systems. A better understanding of the legal and practical issues relating to this should be pursued to determine how revenues could be effectively hypothecated. Congestion pricing could potentially take multiple forms to address urban congestion in the KLMA – area-wide pricing, facility pricing, HOT lanes, or car sharing opportunities are the obvious strategies that should be considered. There are numerous benefits created by congestion pricing, which often outweigh the short-term negative effects of scheme implementation. The effects of each are summarized in Table 4. Table 4: Characteristics of Congestion Pricing and Car Sharing Strategies
Area-wide Facility HOT lanes Car sharing Mitigate urban congestion? Yes Partially No Negligible Mitigate intercity congestion? Depends Yes Partially Negligible
Provide a premium service option?
Yes for trips to the city center
Yes relative to arterials
Yes on intercity facility
Yes for public transport users
Net revenue generation Yes - very high Yes - high Yes - low-moderate None for public use Improve public transport? Yes Yes Yes No
Improve transport for travelers who pay charge? Yes Yes Yes Yes
Improve transport for travelers who do not pay charge? Yes No Yes No
The desirability of each scheme type depends on the objectives of the implementing agency. HOT lanes might be considered if HOV lanes are implemented but HOVs do not use all of the capacity. HOT lanes provide users with a choice of level-of-service and raise revenue that can be used to improve public transport. Facility-based pricing would involve varying the tolls during peak
Jeffrey D. Ensor Malaysia Transport Pricing Strategies, Measures, and Policies February 22, 2004
32
periods on the privately-operated expressways. The Government has already illustrated its desire and history of lowering toll charges for drivers, which would be contrary to this policy unless tolls were only made cheaper during the off-peak periods. Area-wide pricing would likely be the most desirable option if the KLMA wished to alleviate congestion in the city center. Significant net revenues would likely be generated with this pricing strategy, but strong land-use policies may be necessary in tandem to avoid further sprawl. Determining the true objectives and priorities of the Kuala Lumpur and Malaysian governments are extremely important for further research. This is essential to provide insight as to what measures, policies, and strategies would be practically and politically acceptable. As with almost every change in policy, congestion pricing is likely to have some initial public opposition. If the Malaysian Government is not willing to take political risks, then some strategies may be beyond what is realistically feasible at this time due to the emerging nature of congestion pricing implementations.
Jeffrey D. Ensor Malaysia Transport Pricing Strategies, Measures, and Policies February 22, 2004
33
REFERENCES Abdullah, Z. (31 January 2004) Market Prices to Dictate Car Prices Business Times. http://www.btimes.com.my/Current_News/BTimes/Saturday/Frontpage/20040130233536/Article/. Armstrong-Wright, A. (1986) Road Pricing and User Restraint: Opportunities and Constraints in Developing Countries. Transportation Research Part A: General, 20(2): 123-127. Cracknell, J. (2000) Experience in Urban Traffic Management and Demand Management in Developing Countries. Background paper for World Bank Urban Transport Strategy Review. Department for International Development, UK. Department of Statistics Malaysia. http://www.statistics.gov.my/. Last accessed January 2004. Doddder, R., Sussman, J., & McConnell, J. (2004) The Concept of a CLIOS Analysis: Illustrated by the Mexico City Case, MIT. Economic Planning Unit (EPU) (1991) The Way Forward (Vision 2020). http://www.epu.jpm.my/Bi/speech/vision2020i.html. European Federation for Transport and Environment (2003) Congestion Pricing in London – A European Perspective. Brussels. The Eighth Malaysia Plan 2001-2005 (2001) http://www.epu.jpm.my/RM8/front_RM8.html. Last accessed January 2004. European Commission (EC) (2003) External Costs – Research Results on Socio-Environmental Damages due to Electricity and Transport. Brussels. EUR 20198. Foley, J. & Fergusson, M. (2003) Putting the Brakes on Climate Change. Institute for Public Policy Research (ippr). London. Gakenheimer, R. (2003a) 7.0 ITS Deployment in Kuala Lumpur. Actual date and details unknown. Gakenheimer, R. (2003b) Travel Demand Drivers: Kuala Lumpur, Malaysia. Actual date and details unknown. Gannon, C. & Liu, Z. (1997) Poverty and Transport. World Bank Group, TWU – 30. Gomez-Ibanez, J. (1997) Pricing. In J. Gomez-Ibanez, W. Tye, & C. Winston (Eds.), Essays in Transportation Economics and Policy: A Handbook in Honor of John R. Meyer (99-136). Washington DC: Brookings Institution Press. International Energy Agency (IEA) (1999) World Energy Outlook – Looking at Energy Subsidies: Getting the Price Right. Paris.
Jeffrey D. Ensor Malaysia Transport Pricing Strategies, Measures, and Policies February 22, 2004
34
Jaafar, M. Z. & Mohamad, R. A. (2001) Is there a Need for Energy Subsidy Reform? A Malaysian Perspective. Paper for the Asia Workshop on Energy Subsidy Reform, Bangkok, January 16-17 2001. Pusat Tenaga Malaysia (PTM). Kamiso, S. (20 January 2004) Used Car Dealers Hope for Turnaround this Year, The Star Online. http://www.star-motoring.com/research/review.asp?file=/editorial/2004/usedhope.html. Kulasegaran, M. (Deputy Secretary-General DAP Malaysia and Perak DAP Secretary) (2001) No Basis for Increase in Toll Charges and Jelapang Toll Plaza must be Relocated, media statement given at Ampang Toll Plaza, Ipoh, Perak, Malaysia on December 8, 2001. http://www.malaysia.net/dap/bul1436.htm. Last accessed January 2004. Lecthumanan, A (18 February 2004) Toll for Senai-Johor Baru stretch abolished, The Star Online. http://thestar.com.my/news/story.asp?file=/2004/2/18/latest/16032TollforS&sec=latest. Malaysia Industrial Development Authority (MIDA) (2002) The Cost of Doing Business in Malaysia. Menon, A. (2000) ERP in Singapore – A Perspective One Year on. tec, February 2000, 1. Menon, A (2002) Travel Demand Management in Singapore – Why Did it Work? Document 15B. Ministry of Transport Malaysia. http://www.mot.gov.my/. Last Accessed January 2004. Mody, A. (1997) Infrastructure Strategies in East Asia: The Untold Story. Washington, DC: World Bank. Mohring, H. (1997) Congestion. In J. Gomez-Ibanez, W. Tye, & C. Winston (Eds.), Essays in Transportation Economics and Policy: A Handbook in Honor of John R. Meyer (181-221). Washington DC: Brookings Institution Press. PLUS Expressways (2002) Company prospectus. Company No.570244-T. PLUS Expressways. http://www.plus.com.my/. Last accessed January 2004. Rahman, A. (1997) Car Pooling in Kuala Lumpur: Public Perception. Paper presented at the Conference Transport and Communication for Urban Development, United Nations Habitat, Singapore. Reusch, M. (2003) Road Pricing and Urban Freight in Europe: Practices and Developments from BESTUFS Project. PowerPoint presentation at the International Symposium on Road Pricing. Road Engineering Association of Malaysia (REAM) (1999) ITS Strategic Plan for Malaysia: A Way Forward. Schwarcz, S. (2003) Public Transport in Kuala Lumpur, Malaysia. Fall 2002 Inception Report, MIT.
Jeffrey D. Ensor Malaysia Transport Pricing Strategies, Measures, and Policies February 22, 2004
35
Sussman, J. (2000) Introduction to Transportation Systems. Boston: Artech House, Inc. Standard & Poor’s (18 February 2004) Technology Risk Takes its Toll on German Road-Pricing Initiative. http://www2.standardandpoors.com/NASApp/cs/ContentServer?pagename=sp/sp_article/ArticleTemplate&c=sp_article&cid=1076706896597&b=10&l=EN&r=1 The Star Online (20 December 2002) Prices of Foreign Cars ‘May Not Come Down’. http://www.star-motoring.com/research/review.asp?file=/editorial/2002/afternot.html. Toll Collect. http://www.toll-collect.de/frontend/HomepageVP.do;jsessionid=D40BD1EF489CF2FE2CE3763AA0529295. Last accessed February 18, 2004. TOLLROADSnews (29 January 2004) German GPS tolls earliest start now 2005. http://www.tollroadsnews.com/cgi-bin/a.cgi/fRNRfFKOEdiRW6r2jfFwDw. Transit Cooperative Research Program (TCRP) (2003) Chapter 14 - Road Value Pricing. Report 95. Transportation Research Board. Washington DC. Transport for London (TfL) (2003a) Congestion Charging: Six Months On. London: Transport for London. United Nations (UN) (2002) Statistical Yearbook for Asia and the Pacific. New York: United Nations. United Nations (UN) (2001) Sustainable Transport Pricing and Charges: Principles and Issues. ST/ESCAP/2139. http://www.unescap.org/tctd/pubs/pricetoc.htm. Ward, J. (2003) Public-Private Partnerships in the Malaysia Transportation Industry. Fall 2002 Inception Report, MIT. World Bank (2002a) Cities on the Move: a World Bank Urban Transport Strategy Review. World Bank Group. World Bank (1999) Malaysia – Road Asset Management Project. Report No. PID8655 World Bank (2002b) 2002 Environmental Sustainability Index, Annex 6. World Bank Group. World Gazetteer. http://www.world-gazetteer.com/fr/fr_my.htm. Last Accessed January 2004. Zakaria, Z. (2003a) Institutional Issues for Deployment of Advanced Public Transportation Systems for Transit-Oriented Development in the Kuala Lumpur Metropolitan Area. AY 2002/2003 Spring Report, MIT. Zakaria, Z. (2003b) The Institutional Framework for Urban Transportation and Land Use Planning and Management in the Globalizing Kuala Lumpur Region. Fall 2002 Inception Report, MIT.
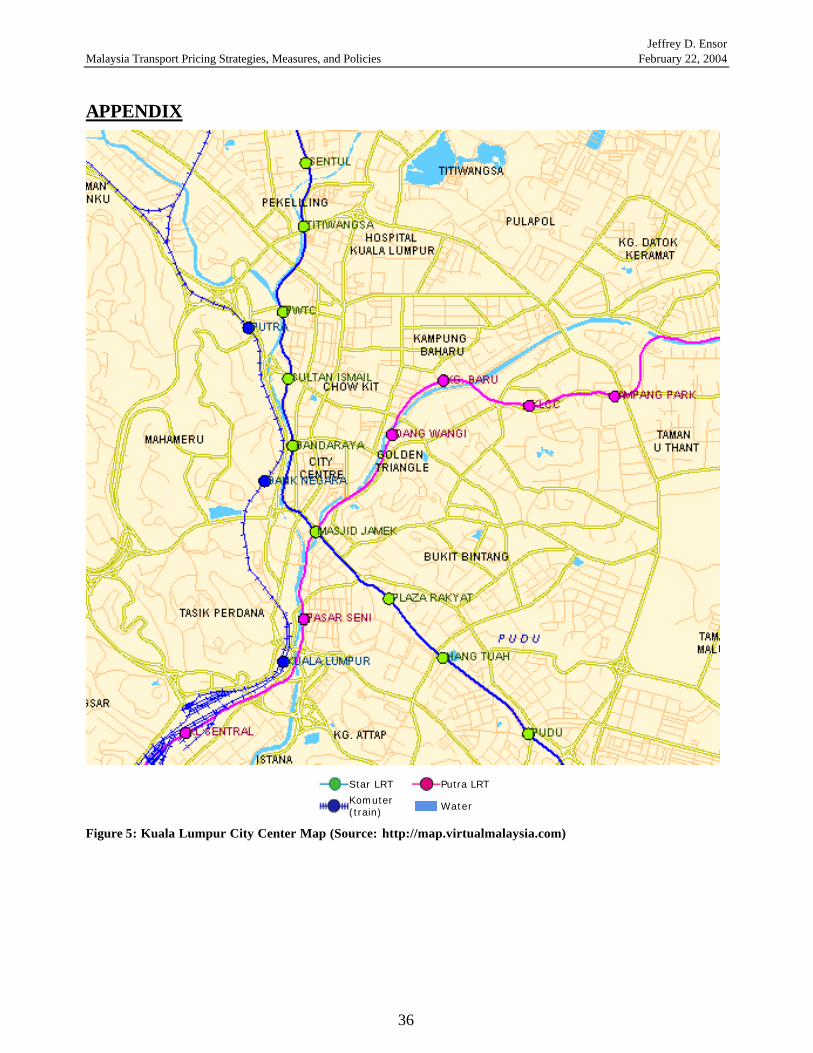
Jeffrey D. Ensor Malaysia Transport Pricing Strategies, Measures, and Policies February 22, 2004
36
APPENDIX
Star LRT Putra LRT
Komuter (train) Water
Figure 5: Kuala Lumpur City Center Map (Source: http://map.virtualmalaysia.com)
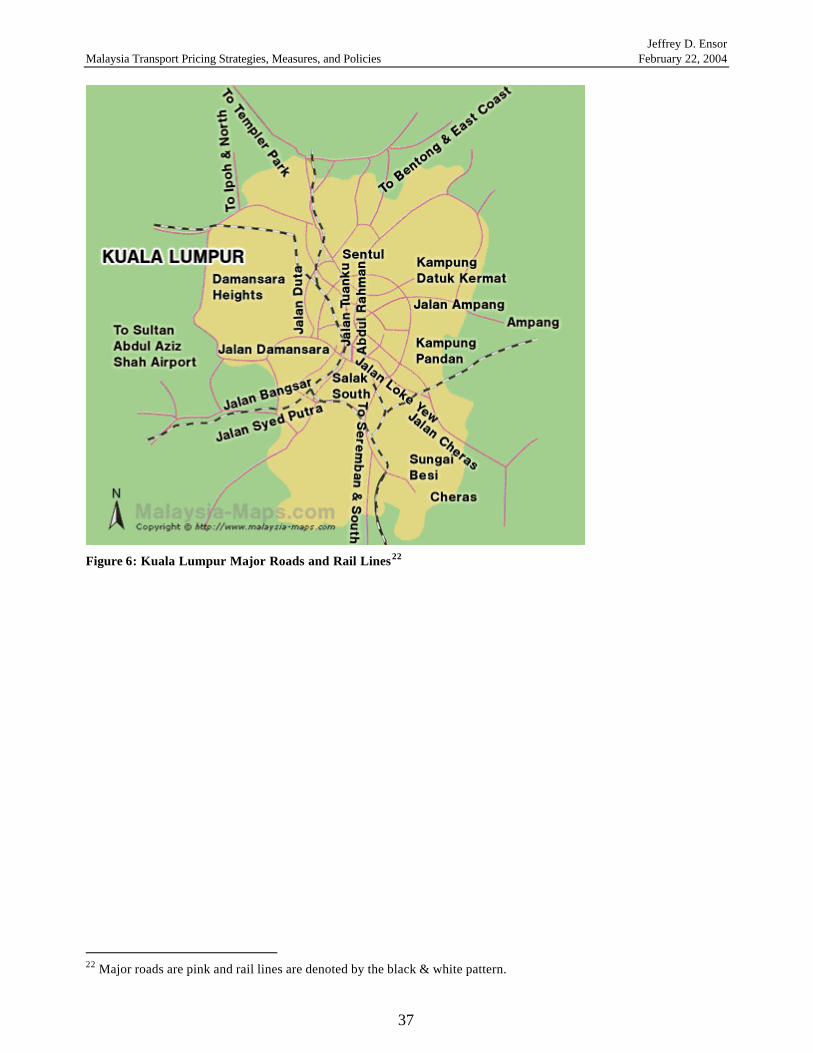
Jeffrey D. Ensor Malaysia Transport Pricing Strategies, Measures, and Policies February 22, 2004
37
Figure 6: Kuala Lumpur Major Roads and Rail Lines22
22 Major roads are pink and rail lines are denoted by the black & white pattern.
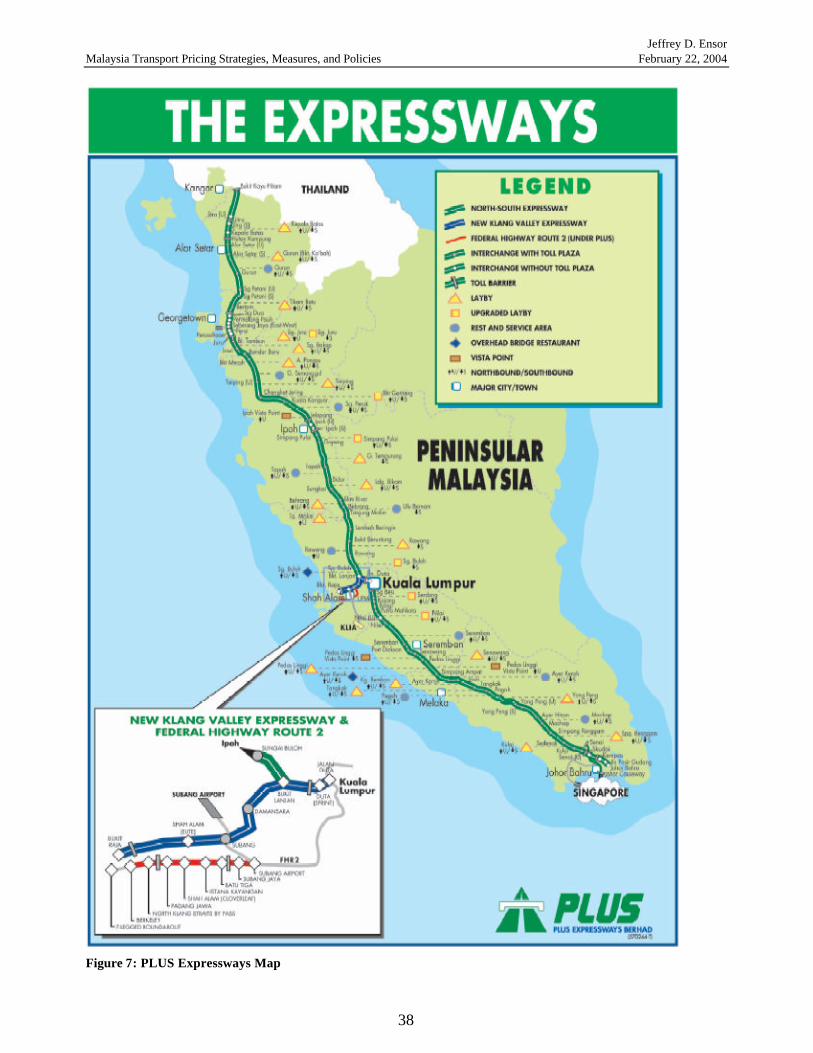
Jeffrey D. Ensor Malaysia Transport Pricing Strategies, Measures, and Policies February 22, 2004
38
Figure 7: PLUS Expressways Map
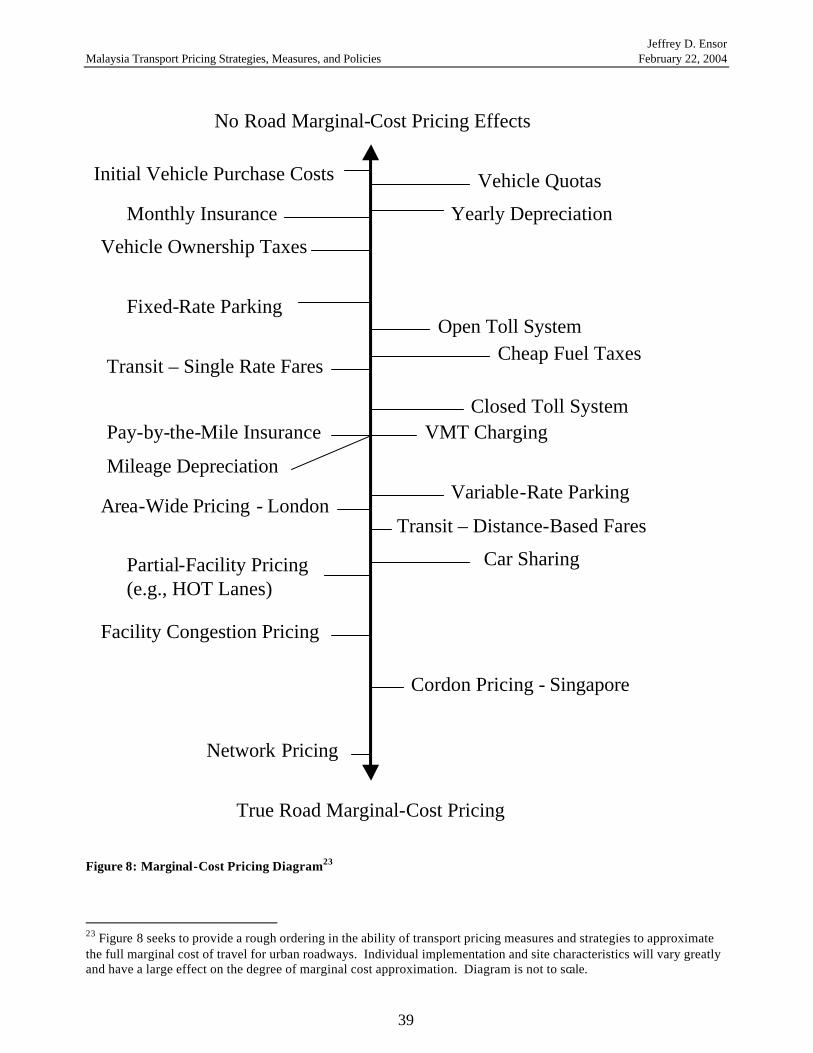
Jeffrey D. Ensor Malaysia Transport Pricing Strategies, Measures, and Policies February 22, 2004
39
True Road Marginal-Cost Pricing
No Road Marginal-Cost Pricing Effects
Initial Vehicle Purchase Costs
Vehicle Ownership Taxes
Monthly Insurance Yearly Depreciation
Vehicle Quotas
Cheap Fuel Taxes
Mileage Depreciation
Fixed-Rate Parking
Transit – Single Rate Fares
Network Pricing
Car Sharing
VMT ChargingPay-by-the-Mile Insurance
Cordon Pricing - Singapore
Variable-Rate Parking
Partial-Facility Pricing (e.g., HOT Lanes)
Transit – Distance-Based FaresArea-Wide Pricing - London
Facility Congestion Pricing
Closed Toll System
Open Toll System
Figure 8: Marginal-Cost Pricing Diagram23
23 Figure 8 seeks to provide a rough ordering in the ability of transport pricing measures and strategies to approximate the full marginal cost of travel for urban roadways. Individual implementation and site characteristics will vary greatly and have a large effect on the degree of marginal cost approximation. Diagram is not to scale.