Embed Size (px)
Citation preview
MAL 2014-2015 Chemical Biology – Master program Leiden University
1/8
Metals and life re-take exam Datum: February 18th, 2015
Tijd: 2-5 pm Zaal: HB218
Docent: Dr. Sylvestre Bonnet Voorzie elke blad van naam en nummer collegekaart. Bij het tentamen is het gebruik van de syllabus of mobiele telefoon niet toegestaan. Voor elke vraag is de waardering aangegeven. On each page write your name and the number of the college card. It is not allowed to use the syllabus or a cell phone during the examination. For each question the rating is given. When a justification is asked it counts at least as many points as the answer itself. The number of points per question is indicative and may be re-evaluated. Important advice: do not lose time on questions you can’t do. First answer the questions you can answer, and then spend time on the more difficult ones.
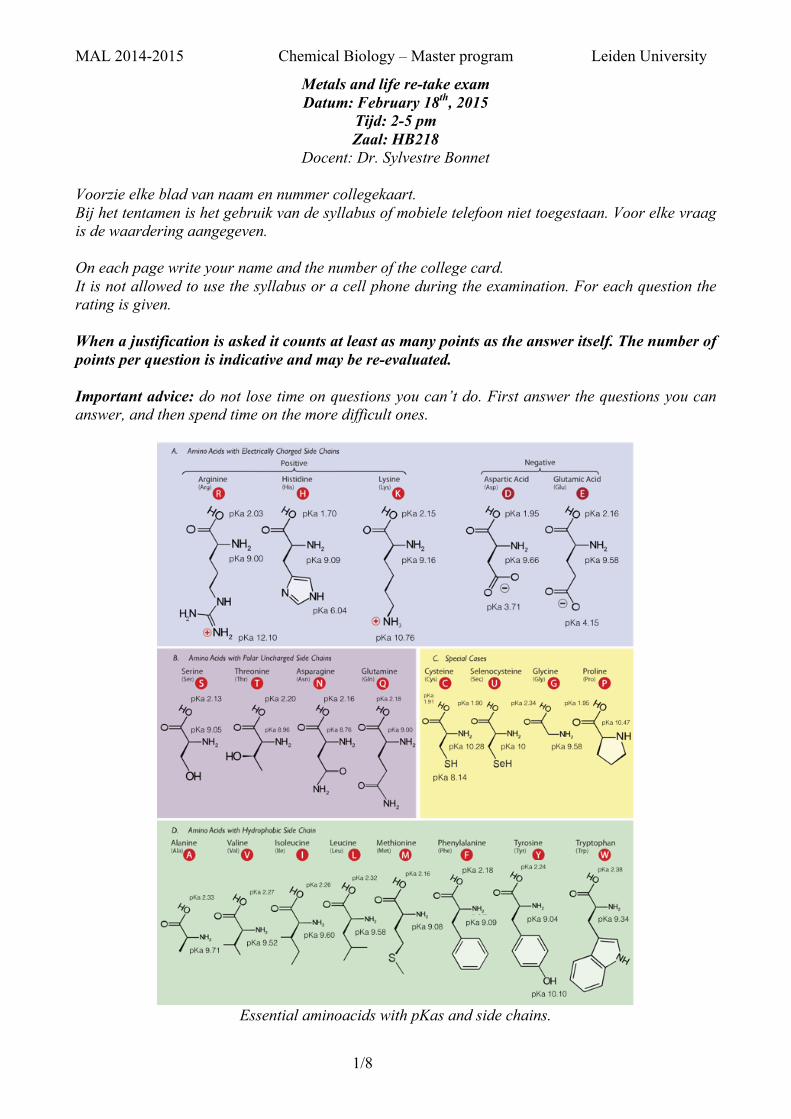
Essential aminoacids with pKas and side chains.
MAL 2014-2015 Chemical Biology – Master program Leiden University
2/8
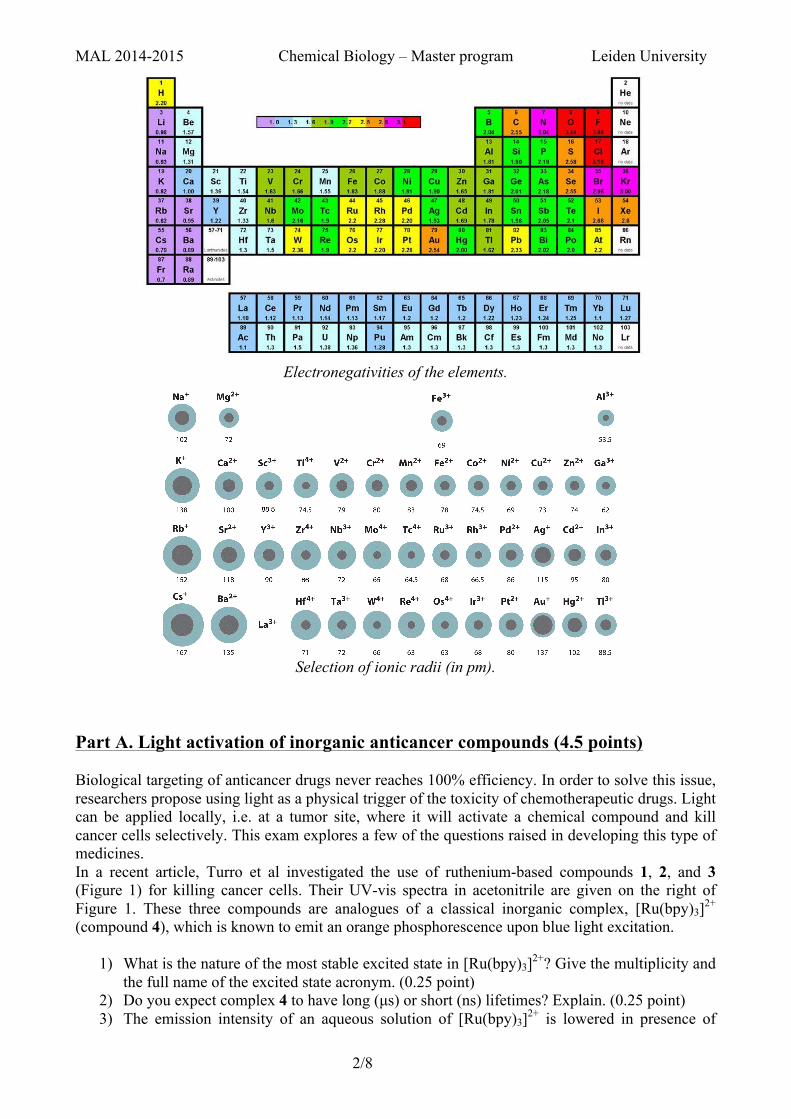
Electronegativities of the elements.
Selection of ionic radii (in pm).
Part A. Light activation of inorganic anticancer compounds (4.5 points) Biological targeting of anticancer drugs never reaches 100% efficiency. In order to solve this issue, researchers propose using light as a physical trigger of the toxicity of chemotherapeutic drugs. Light can be applied locally, i.e. at a tumor site, where it will activate a chemical compound and kill cancer cells selectively. This exam explores a few of the questions raised in developing this type of medicines. In a recent article, Turro et al investigated the use of ruthenium-based compounds 1, 2, and 3 (Figure 1) for killing cancer cells. Their UV-vis spectra in acetonitrile are given on the right of Figure 1. These three compounds are analogues of a classical inorganic complex, [Ru(bpy)3]2+ (compound 4), which is known to emit an orange phosphorescence upon blue light excitation.
1) What is the nature of the most stable excited state in [Ru(bpy)3]2+? Give the multiplicity and the full name of the excited state acronym. (0.25 point)
2) Do you expect complex 4 to have long (µs) or short (ns) lifetimes? Explain. (0.25 point) 3) The emission intensity of an aqueous solution of [Ru(bpy)3]2+ is lowered in presence of
MAL 2014-2015 Chemical Biology – Master program Leiden University
3/8
molecular oxygen. Explain. What is the name of this phenomenon? (0.25 point) 4) Give the name and a Lewis structure of five of the so-called “reactive oxygen species”.
(0.25 point)
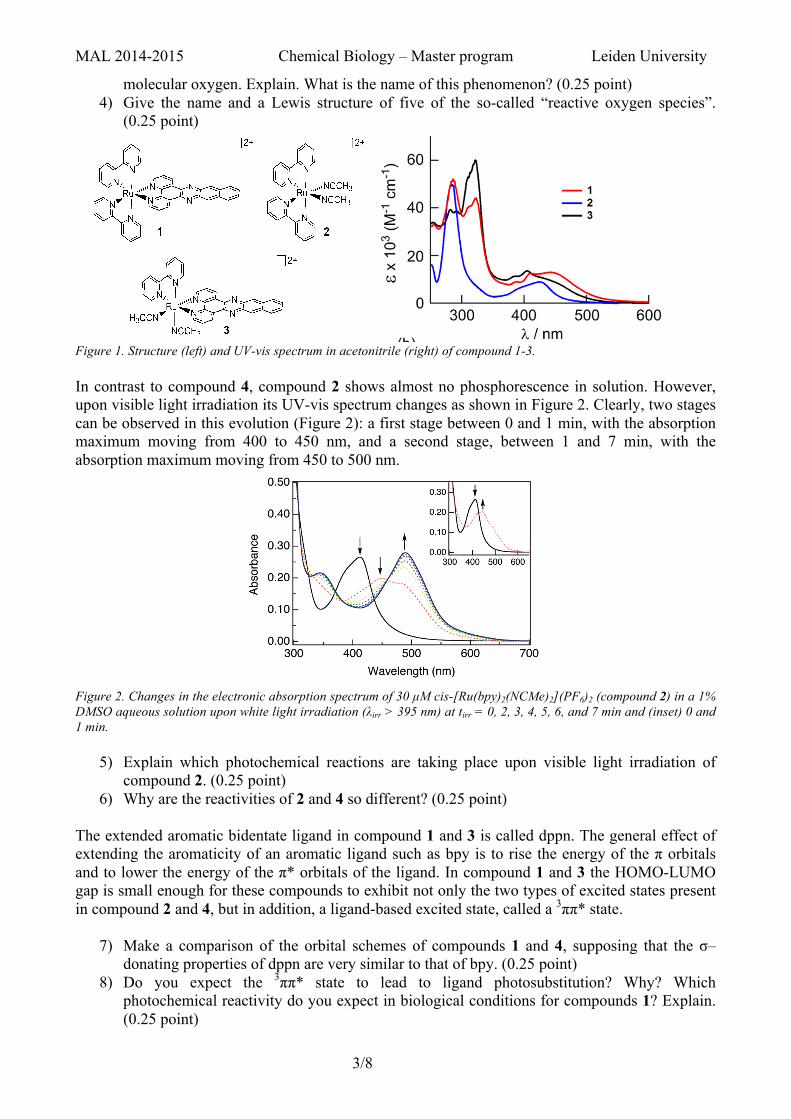
Figure 1. Structure (left) and UV-vis spectrum in acetonitrile (right) of compound 1-3. In contrast to compound 4, compound 2 shows almost no phosphorescence in solution. However, upon visible light irradiation its UV-vis spectrum changes as shown in Figure 2. Clearly, two stages can be observed in this evolution (Figure 2): a first stage between 0 and 1 min, with the absorption maximum moving from 400 to 450 nm, and a second stage, between 1 and 7 min, with the absorption maximum moving from 450 to 500 nm.
Figure 2. Changes in the electronic absorption spectrum of 30 µM cis-[Ru(bpy)2(NCMe)2](PF6)2 (compound 2) in a 1% DMSO aqueous solution upon white light irradiation (λirr > 395 nm) at tirr = 0, 2, 3, 4, 5, 6, and 7 min and (inset) 0 and 1 min.
5) Explain which photochemical reactions are taking place upon visible light irradiation of compound 2. (0.25 point)
6) Why are the reactivities of 2 and 4 so different? (0.25 point) The extended aromatic bidentate ligand in compound 1 and 3 is called dppn. The general effect of extending the aromaticity of an aromatic ligand such as bpy is to rise the energy of the π orbitals and to lower the energy of the π* orbitals of the ligand. In compound 1 and 3 the HOMO-LUMO gap is small enough for these compounds to exhibit not only the two types of excited states present in compound 2 and 4, but in addition, a ligand-based excited state, called a 3ππ* state.
7) Make a comparison of the orbital schemes of compounds 1 and 4, supposing that the σ–donating properties of dppn are very similar to that of bpy. (0.25 point)
8) Do you expect the 3ππ* state to lead to ligand photosubstitution? Why? Which photochemical reactivity do you expect in biological conditions for compounds 1? Explain. (0.25 point)
mechanism of action of cisplatin, one of the current leadinganticancer drugs.8,9 Transition metal complexes with photo-labile ligands are able to covalently bind to DNA in a mannersimilar to that of cisplatin, but only upon irradiation with visiblelight. The requirement of the use of photons for their activationresults in increased spatiotemporal selectivity toward tumortissue relative to traditional drugs.14,15 Moreover, transitionmetal complexes that are activated by light have been shown tobe less toxic in the dark and to exhibit a greater increase incytotoxicity upon irradiation than the organic compoundscurrently approved for PCT.16,28−31
Cis-[Ru(bpy)2(CH3CN)2]2+ (2, Figure 1), exhibits a
relatively high quantum yield for ligand exchange with waterto yield [Ru(bpy)2(H2O)2]
2+ (Φ400 = 0.21), a value that issignificantly greater than those found with related Ru(II)complexes.16,32,33 Ultrafast experiments previously showed that2 violates Kasha’s rule through simultaneous population of bothits short-lived 3MLCT state, τ = 51 ps, and the 3LF (ligand-field) states; the latter results in fast ligand exchange in water.28
The high quantum yields for exchange of the nitrile ligands in 2and its ability to simultaneously populate two different statesupon excitation through ultrafast intersystem crossing (ISC),together with the efficient sensitization of 1O2 by 1, provide aplatform for the possible combination of the two features togenerate a new PCT agent that may simultaneously act via twodifferent mechanisms, the production of 1O2 and covalentbinding to DNA upon irradiation, while remaining inactive inthe dark. To this end, the tris-heteroleptic complex [Ru(bpy)-(dppn)(CH3CN)2]
2+ (3) was synthesized, and its photo-physical properties and phototoxicity were compared to thoseof 1 and 2 (Figure 1).
■ EXPERIMENTAL SECTIONMaterials. Standard Schlenk-line techniques (N2 atmosphere) were
used to maintain anaerobic conditions during the preparation of thecompounds when necessary. The solvents used were of reagent gradequality. Normal butanol (n-BuOH, Mallinckrodt), water (ChromAR,Mallinckrodt, or deionized to 18 MOhm), and acetonitrile (EMDChemicals) were used as received. The reagents RuCl3·3H2O(Pressure Chemicals), 2,2′-bipyridine (Alfa Aesar), potassiumferrioxalate (Strem Chemicals), 1,3-diphenylisobenzofuran (DPBF,Sigma-Aldrich), and NH4PF6 (Sigma-Aldrich) were purchased andused without further purification. The compounds [Ru(bpy)2(dppn)]-[PF6]2 (1),
34 cis-[Ru(bpy)2(NCCH3)2][PF6]2 (2),24 [(η6-C6H6)RuCl-
(bpy)][Cl],35 Ru(bpy)(DMSO)2Cl2,36 and the dppn ligand37 were
prepared according to literature procedures.[Ru(bpy)(dppn)(CH3CN)2][PF6]2 (3). Method 1. An orange
suspension of [(η6-C6H6)RuCl(bpy)][Cl] (201 mg, 0.49 mmol) and
dppn (165 mg, 0.50 mmol) in n-BuOH (15 mL) was refluxed for 14 hwrapped in foil to avoid exposure to room light. The solvent was thenremoved under reduced pressure to give a dark purple-red solidresidue which was dissolved in CH2Cl2 (400 mL) to give a dark redsolution. After filtration, the solution was washed with water severaltimes, and the resulting dark purple organic layer was dried withanhydrous MgSO4 and reduced to ca. 10 mL. A dark purple solid (cis-RuCl2(bpy)(dppn)) was obtained upon precipitation with diethylether (25 mL). This intermediate (28 mg, 42.5 μmol) was suspendedin 3 mL of MeCN/H2O (2:1), and the suspension was heated at 100°C for 3 h under reduced light conditions. The resulting dark orangesolution was filtered while hot through a plug of glass wool, andNH4PF6 (110 mg) dissolved in 1 mL of H2O was added dropwise tothe filtrate. The resulting orange precipitate was collected by filtration,dissolved in 1.5 mL of hot MeCN, and precipitated by slow addition ofhot H2O. After the mixture was stored in a freezer for 4 h, the orangeprecipitate was collected by filtration and washed with H2O (3 × 3mL) and diethyl ether (15 mL). Yield: 24 mg (5%). 1H NMR (500MHz, (CD3)2CO, Supporting Information, Figure S1): δ 10.03 (dd,1H, 3J = 5.5 Hz, 4J = 1.0 Hz, H-l), 9.91 (dd, 1H, 3J = 8.0 Hz, 4J = 1.0Hz, H-j), 9.73 (d, 1H, 3J = 5.5 Hz, H-1), 9.60 (dd, 1H, 3J = 8.0 Hz, 4J =1.5 Hz, H-c), 9.19 (s, 1H, H-d or H-i), 9.13 (s, 1H, H-i or H-d), 8.88(d, 1H, 3J = 8.0 Hz, H-4), 8.71 (d, 1H, 3J = 8.0 Hz, H-5), 8.50−8.45(m, 2H, H-3, H-k), 8.41 (m, 2H, H-f, H-g), 8.33 (dd, 1H, 3J = 5.5 Hz,4J = 1.0 Hz, H-a), 8.10−8.03 (m, 2H, H-2, H-6), 8.01 (d, 1H, 3J = 5.5Hz, H-8), 7.92 (dd, 1H, 3J = 8.0 Hz, 5.5 Hz, H-b), 7.78 (m, 2H, H-e,H-h), 7.32 (ddd, 1H, 3J = 7.5 Hz, 5.5 Hz, 4J = 1.0 Hz, H-7), 2.58 (s,3H, NCCH3), 2.41 (s, 3H, NCCH3). Anal. Calcd forC36H26F12N8P2Ru·0.9 H2O: C, 44.22; H, 2.87; N, 11.46. Found: C,44.25; H, 2.92; N, 11.39.
Method 2. Ru(bpy)(DMSO)2Cl2 (51 mg, 0.11 mmol) and 1 equivof the dppn ligand (35 mg, 0.11 mmol) were suspended in 8 mL ofDMF and heated to reflux for 6 h. The reaction mixture was cooled toroom temperature, and the solvent was removed by rotary evaporationto yield a dark black solid. The solid was suspended in 50 mL ofCH2Cl2 and collected by vacuum filtration. The dark solid (cis-RuCl2(bpy)(dppn)) was subsequently washed with a copious amountof H2O and then 30 mL of diethyl ether. This intermediate (10 mg,0.015 mmol) was suspended in a 12 mL CH3CN:H2O (1:1) solventmixture and heated to reflux in the dark for 16 h. While hot, asaturated aqueous solution of NH4PF6 (5 mL) was added to theresulting orange reaction mixture. Upon cooling, an orange precipitateformed which was collected by vacuum filtration. The precipitate waswashed with 20 mL of H2O and 20 mL of diethyl ether. Productcharacterization results matched those of Method 1. Yield: 4.4 mg(4%).
Instrumentation. 1H NMR spectra were recorded on a Varian 500MHz spectrometer. Steady-state absorption spectra were recorded ona Hewlett-Packard 8453 diode array spectrometer, and emission datafor 1O2 experiments were collected on a Horiba Fluoromax-4spectrometer. Electrochemical measurements were carried out byusing an HCH electrochemical analyzer (model CH 1620A).Nanosecond transient absorption measurements were carried outusing a home-built instrument previously reported,38 using afrequency-tripled (355 nm) Spectra Physics GCR-150 Nd:YAG laser(fwhm ∼8 ns) as the excitation source. Femtosecond transientabsorption experiments were carried out using laser and detectionsystems that were previously described.39 The sample was excited at300 nm (1.5 mW at the sample) by the output of an optical parametricamplifier with a sum frequency generator and ultraviolet−visibleharmonics attachment. Upon irradiation, samples were kept in motionby use of a Harrick Scientific flow cell equipped with 1 mm CaF2windows (1 mm path length). A total volume of ∼10 mL was requiredfor the flow cell to operate correctly. The polarization angle betweenthe pump and probe beams was 54.7° to avoid rotational diffusioneffects. Measurements at each time delay were repeated four times, andthe spectra were corrected for the chirp in the white light probecontinuum.40 Ligand-exchange quantum yields and photolysis experi-ments were performed using a 150 W Xe short arc lamp (USHIO) in aMiliarc lamp housing unit (PTI) powered by an LPS-220 power
Figure 1. Schematic representation of the molecular structures of 1−3.
Journal of the American Chemical Society Article
dx.doi.org/10.1021/ja508272h | J. Am. Chem. Soc. 2014, 136, 17095−1710117096
supply (PTI) equipped with an LPS-221 igniter (PTI). Bandpass filters(Thorlabs, fwhm ∼10 nm) and 3 mm thick long-pass filters (CVIMelles Griot) were used to attain desired excitation wavelengths.Methods. 1H NMR spectral studies were performed in acetone-d6
((CD3)2CO), and all chemical shifts (δ) are reported in parts permillion (ppm) and internally referenced to the residual acetone peak(2.05 ppm). Emission experiments were measured using a 1 × 1 cm2
quartz cuvette. Cyclic voltammetric measurements were performed inCH3CN (distilled from 3 Å molecular sieves) with 0.1 M tetra-n-butylammonium hexafluorophosphate, [nBu4N][PF6], as the support-ing electrolyte. The working electrode was a BAS Pt disk electrode, thereference electrode was Ag/AgCl (3 M KCl), and the auxiliaryelectrode was a Pt wire. The ferrocene/ferrocenium couple occurs atE1/2 = +0.44 V vs Ag/AgCl under the same experimental conditions.Elemental analyses were performed by Atlantic Microlab Inc.(Norcross, GA). The 1O2 quantum yields for complex 3 weremeasured using [Ru(bpy)3]
2+ as the standard (Φ = 0.81 in CH3OH)and DPBF (1,3-diphenylisobenzofuran) as a trapping agent, with 460nm irradiation.41 The experiment was performed by absorptionmatching 3 and the standard at the irradiation wavelength (0.01 at 460nm). The complexes were irradiated at regular time intervals in thepresence of DPBF (1.0 μM), and the decrease in emission of DPBFwas monitored as a function of time (λex = 405 nm, λem = 479 nm).The DPBF emission intensity vs irradiation time was plotted, and theslopes of the standard and 3 were compared to give the 1O2 quantumyield. Data points were collected for each complex until the slopesbecame nonlinear. The quantum yields for photoinduced ligandexchange in 2 and 3 were measured at an irradiation wavelength of 400nm in H2O using potassium ferrioxalate as the actinometer followingan established procedure.42
The IC50 values were determined using the human cervicaladenocarcinoma cell line (HeLa cells, ATCC CCL-2) cultured inDulbecco’s modified eagle medium (DMEM) supplemented with 10%fetal bovine serum (FBS) and 1% penicillin/streptomycin at 37 °C in ahumid incubator with 5% CO2. Cells were seeded in 48-well plates(1.5 × 10⁴ cells/well) and, after attachment, were exposed to thecomplexes 1−3 in DMEM/1% FCS during 24 h from 0 to 750 μM.Each well was then washed with phosphate-buffered saline (PBS 1mM, pH 7.2, NaCl 136 mM, KCl 2.7 mM), and fresh PBS was addedto the wells. One plate was then irradiated for 20 min (LED system466 ± 20 nm; 6.50 mW/cm2), while the other was kept in the darkduring that time. After irradiation, PBS was replaced with DMEM/1% FCS, and the plates were kept in the incubator for an additional 48h, at which time the MTT assay was conducted using methodsdescribed previously.43
Cellular uptake studies were conducted using 12-well plates (1 ×10⁵ HeLa cells per well). The plates were maintained in DMEMsupplemented with 10% FBS and 1% penicillin/streptomycin in anincubator at 37 °C in a humid atmosphere with 5% CO2 for 18−24 h.After washing with PBS, each well was filled with a 200 μM solution ofcomplex in DMEM/1% FBS and incubated for 24 h in the dark. Afterthat time, 500 μL of the supernatant was removed from each well forquantification, to which 500 μL of 50 mM SDS was added. The sparesupernatant from each well was removed and discarded. Theremaining cells were washed with PBS, followed by the addition of500 μL of a 25 mM SDS solution to promote lysis of the cellularmembrane. These solutions were used to quantify the rutheniumcomplex taken up by the cells, determining the absorbance at thewavelength of maximum absorption (Shimadzu UV-2401PC spectro-photometer) using the corresponding molar extinction coefficient inthe lysed solutions, Alysed, relative to that of the supernatant, Asupernatant,via the equation (% uptake) = [(Alysed/2)/(2Asupernatant + Alysed/2)] ×100.43
■ RESULTS AND DISCUSSIONElectronic Absorption Spectroscopy and Electro-
chemistry. The steady-state electronic absorption spectra of1−3 in CH3CN are provided in Figure 2a. The absorptionspectrum of 1 exhibits dppn-based 1ππ* transitions with
maxima at 387 nm (9900 M−1 cm−1) and 411 nm (13 400 M−1
cm−1) that are similar to those of the free dppn ligand in CHCl3observed at 390 nm (9400 M−1 cm−1) and 414 nm (12 500M−1 cm−1). These ligand-centered transitions are slightly blue-shifted and more intense in 3, with maxima at 382 nm (11 100M−1 cm−1) and 405 nm (13 500 M−1 cm−1). The typical1MLCT bands arising from Ru(dπ)→L(π*) transitions areprominent in 1 and 3, centered at 444 nm (13 500 M−1 cm−1)and 430 nm (11 000 M−1 cm−1), respectively; the maximum ofthe latter is similar to that of 2 at 425 nm (8900 M−1 cm−1).Cyclic voltammetric measurements reveal that 2 and 3
exhibit a reversible metal-based oxidation event atE1/2([Ru]
3+/2+) = +1.74 and +1.69 V vs NHE, respectively,both of which are more positive than the respective redoxevents in [Ru(bpy)3]
2+, +1.54 V vs NHE, and 1, +1.58 V vsNHE (Supporting Information, Figures S2 and S3, respec-tively).20 This cathodic shift is ascribed to the greater π-backbonding afforded by the acetonitrile ligands in 2 and 3.Both complexes exhibit quasi-reversible redox events atnegative potentials which involve reduction of the polypyridylligands. Compound 3 shows a characteristic dppn ligand-basedreduction at E1/2([Ru]
2+/+) = −0.46 V vs NHE, which occurs atless negative potentials than the bpy reduction in 1,E1/2([Ru]
2+/+) = −1.14 V vs NHE, as has been noted in theliterature for other Ru-dppn compounds.20,44
Excited-State Properties. Nanosecond transient absorp-tion spectra (λexc = 355 nm, fwhm ∼8 ns) measured indeaerated CH3CN reveal a strong absorption band at ∼540 nmfor 3 with τ = 20 μs, shown in Figure 2b. Similar features areobserved for 1 under the same experimental conditions and thefree dppn ligand in CHCl3, with τ = 33 μs and τ = 18 μs,respectively, and are assigned as the 3ππ* excited state on thedppn ligand.20 Therefore, the lowest energy excited state in 3 isassigned to the 3ππ* state centered on the dppn ligand. Incontrast, 2 exhibits a very short 3MLCT lifetime of 51 ps atroom temperature in CH3CN owing to the competing ligand
Figure 2. (a) Electronic absorption spectra of complexes 1−3 inCH3CN. (b) Transient absorption spectrum of 3 in CH3CN collected0.2 μs after the excitation pulse (λexc = 355 nm, fwhm ∼8 ns).
Journal of the American Chemical Society Article
dx.doi.org/10.1021/ja508272h | J. Am. Chem. Soc. 2014, 136, 17095−1710117097
17165 dx.doi.org/10.1021/ja208084s |J. Am. Chem. Soc. 2011, 133, 17164–17167
Journal of the American Chemical Society COMMUNICATION
upon photolysis in aqueous solution.19 Importantly, if this strategywere to be effective, it would have the potential added benefit ofunleashing multiple biologically active agents upon photoactivationfrom a single precursor, including 2 equiv of the nitrile-basedinhibitor and 1 equiv of [RuII(bpy)2(H2O)2]
2+. Possessing a dualmode of action could make this class of compounds useful fortargeting cancer cells, as previous work has shown that cis-[RuII(L)2-(H2O)2]
2+ (L = bpy, phen) and cis-RuII(phen)2Cl2 covalently bindto DNA.20!22
Synthesis of the RuII inhibitor complex started from theknown nitrile-based inhibitor 1 (Scheme 1).13 The reaction ofRuII(bpy)2Cl2 with 5 equiv of 1 and excess AgBF4 in EtOH for 12h resulted in a color change from dark-violet to orange, consistentwith displacement of the chloride groups on RuII(bpy)2 by nitrile1. After filtration, concentration, and precipitation from acetoneand ether, the residue was dissolved in H2O and the aqueouslayer washed with EtOAc to remove excess 1. Subsequent anionexchange by treatment of the aqueous solution with excessNH4PF6 resulted in the formation of an orange precipitate.The compound [RuII(bpy)2(1)2](PF6)2 (2) was obtained as amicrocrystalline yellow solid in analytically pure form from thismaterial by slow crystallization from a cold acetone/dichloro-methane mixture.
Complex 2 was characterized by 1H NMR, UV!vis, and IRspectroscopies, mass spectrometry, and elemental analysis. 1HNMR spectroscopic analysis confirmed that 2 was obtained as a1:1 mixture of diastereomers. This was expected because 1 waschiral and enantioenriched [prepared from L-phenylalanine(S configuration)] and RuII(bpy)2Cl2 was a racemic mixture ofΛ andΔ stereoisomers. Thus, a mixture of (Λ, S, S) and (Δ, S, S)
isomers was isolated [see Figure S7 in the Supporting Informa-tion (SI) for more details]. Obtaining a mixture of stereoisomersdoes not affect the enzyme inhibition because 1 is released from 2during photolysis and [RuII(bpy)2(H2O)2]
2+ does not act as apotent inhibitor (see below). The 1H NMR spectrum of 2 inacetone-d6 shows two acetyl peaks, one for each diastereomer of2 (Figure S3). In turn, each diastereomer possesses two nitrile-based inhibitors that appear as one resonance because they aremagnetically equivalent as a result of the C2 symmetry. Furtheranalysis by 1H NMR spectroscopy verified that the methyleneprotons adjacent to the nitrile are shifted by ∼0.6 ppm in RuII
complex 2 relative to 1, consistent with binding of the nitrile tothe RuII center. The IR spectrum of 2 shows a resonance at2280 cm!1 (Figure S4), which is shifted by 30 cm!1 relative to 1(νCN = 2250 cm!1), again consistent with nitrile binding to theRuII center.23 The UV!vis spectrum of 2 in dimethyl sulfoxide(DMSO) (Figure 2) agrees well with data for the related complex[RuII(bpy)2(MeCN)2](PF6)2, showing λmax at 281 nm (ε =60 000 M!1 cm!1) and 422 nm (ε = 10 700 M!1 cm!1).19 Theelectrospray ionization mass spectrum of 2 shows a prominentpeak at m/z 452.1366 along with a suitable isotope pattern,consistent with a dication having the formula [RuII(bpy)2(1)2]
2+
(Figures S5 and S6).Complex 2 shows excellent stability in solution in the dark and
fast release of 1 upon irradiation with visible light. Rates ofdecomposition of 2 were determined spectrophotometrically inthe dark in aqueous phosphate buffer andDMSO solutions. Plotsof ln A versus t were linear and provided rate constants of 2.3 "10!7 and 2.8 " 10!7 s!1 in buffer and DMSO, respectively(Figures S8 and S9). These values prove that 2 has a half-life(t1/2) of >28 days in solution. The changes in the electronicabsorption spectrum of a 1% DMSO aqueous solution of 2(30 μM) upon irradiation with visible light (λirr > 395 nm) wereused to monitor the progress of the photochemical reaction(Figure 3). A decrease in the metal-to-ligand charge transfer(MLCT) absorption of the reactant at 414 nm with a concomi-tant appearance of a new peak at 444 nm was observed within1 min of irradiation (Figure 3 inset). The new peak is attributedto the Ru f bpy MLCT absorption of the monoaqua complex,cis-[RuII(bpy)2(1)(H2O)]
2+. With continued irradiation, the ab-sorption at 444 nm decreases, accompanied by an increase in theintensity of the peak at 490 nm (ε = 9300 M!1 cm!1) known tocorrespond to cis-[RuII(bpy)2(H2O)2]
2+. Although not measureddirectly, facile release of 1 from 2 was implied in enzyme studies
Scheme 1. Synthesis of the Ru-Based Caged Protease Inhi-bitor [RuII(bpy)2(1)2](PF6)2 (2)
Figure 2. UV!vis spectra of 2 (black) and [RuII(bpy)2(MeCN)2](PF6)2(red) in DMSO.
Figure 3. Changes in the electronic absorption spectrum of 30 μMcis-[RuII(bpy)2(1)2](PF6)2 (2) in a 1% DMSO aqueous solution uponirradiation (λirr > 395 nm) at tirr = 0, 2, 3, 4, 5, 6, and 7 min and (inset)0 and 1 min.
MAL 2014-2015 Chemical Biology – Master program Leiden University
4/8
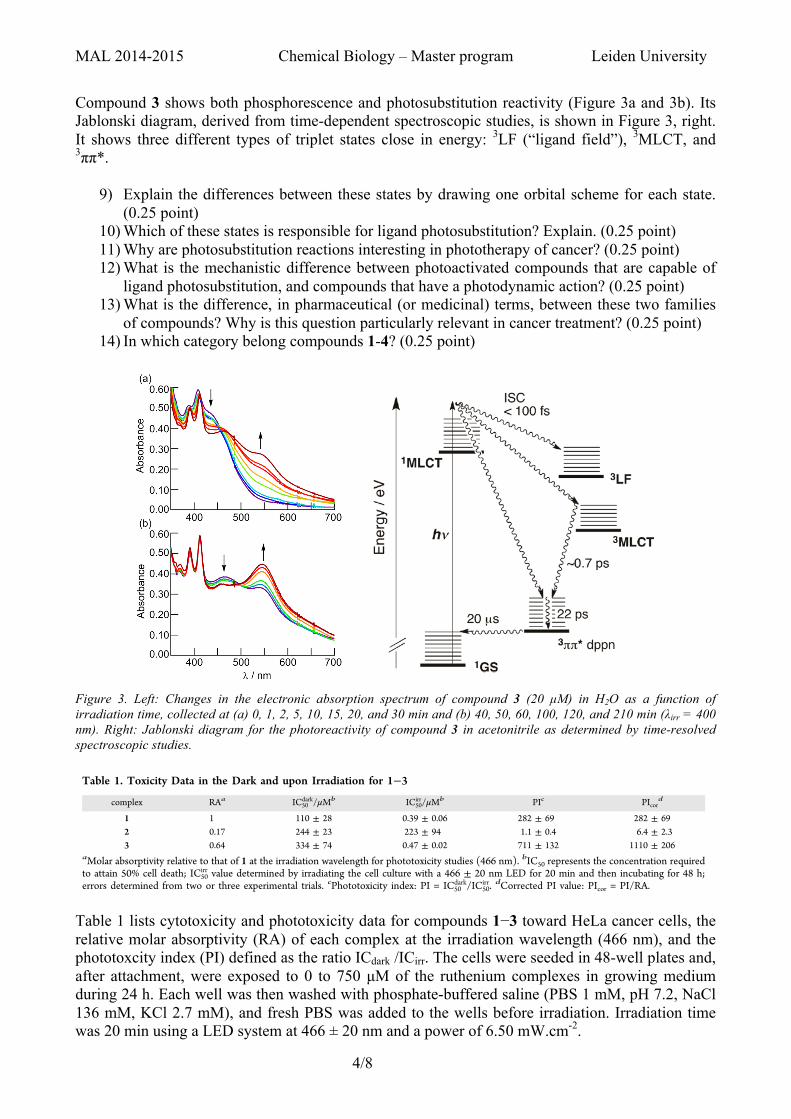
Compound 3 shows both phosphorescence and photosubstitution reactivity (Figure 3a and 3b). Its Jablonski diagram, derived from time-dependent spectroscopic studies, is shown in Figure 3, right. It shows three different types of triplet states close in energy: 3LF (“ligand field”), 3MLCT, and 3ππ*.
9) Explain the differences between these states by drawing one orbital scheme for each state. (0.25 point)
10) Which of these states is responsible for ligand photosubstitution? Explain. (0.25 point) 11) Why are photosubstitution reactions interesting in phototherapy of cancer? (0.25 point) 12) What is the mechanistic difference between photoactivated compounds that are capable of
ligand photosubstitution, and compounds that have a photodynamic action? (0.25 point) 13) What is the difference, in pharmaceutical (or medicinal) terms, between these two families
of compounds? Why is this question particularly relevant in cancer treatment? (0.25 point) 14) In which category belong compounds 1-4? (0.25 point)
Figure 3. Left: Changes in the electronic absorption spectrum of compound 3 (20 µM) in H2O as a function of irradiation time, collected at (a) 0, 1, 2, 5, 10, 15, 20, and 30 min and (b) 40, 50, 60, 100, 120, and 210 min (λirr = 400 nm). Right: Jablonski diagram for the photoreactivity of compound 3 in acetonitrile as determined by time-resolved spectroscopic studies.
Table 1 lists cytotoxicity and phototoxicity data for compounds 1−3 toward HeLa cancer cells, the relative molar absorptivity (RA) of each complex at the irradiation wavelength (466 nm), and the phototoxcity index (PI) defined as the ratio ICdark /ICirr. The cells were seeded in 48-well plates and, after attachment, were exposed to 0 to 750 µM of the ruthenium complexes in growing medium during 24 h. Each well was then washed with phosphate-buffered saline (PBS 1 mM, pH 7.2, NaCl 136 mM, KCl 2.7 mM), and fresh PBS was added to the wells before irradiation. Irradiation time was 20 min using a LED system at 466 ± 20 nm and a power of 6.50 mW.cm-2.
dissociation process and thermal depopulation of the 3MLCTstate through the 3LF state(s), expected to lie at a slightlyhigher energy.24 The different spectral profile and short lifetimeof the 3MLCT state of 2 further support that the excited stateof 3 is the low-lying dppn 3ππ* state.24
As previously reported, the 3MLCT states of 1 and 2 arepopulated within the ∼300 fs laser pulse (310 and 385 nm), asexpected from the known fast ISC rates typical of Ru(II)complexes, and are vibrationally cooled within ∼1 ps.20 A pointof interest is that the population of both the 3MLCT and dppn-centered 3ππ* states is observed in 1 and 3 within the excitationwith an ultrafast laser pulse (∼300 fs, 300−355 nm). Previouslyreported ultrafast transient absorption spectra of 1 in CH3CNare consistent with the formation of a vibrationally cooled dppn3ππ* state with τ ≈ 2 ps.20 In that case, the population of the3MLCT state is observed at t < 5 ps but is relatively small, andit is not clear whether the 3MLCT state decays back to theground state or to the dppn 3ππ* state. Figure 3a shows thepresence of a significantly greater relative population of the3MLCT state in 3 as compared to 1 (λexc = 300 nm, fwhm∼300 fs), evident at 350−365 nm and in the 430−470 nmrange. The sharp ground-state absorption features of the 1ππ*transitions of the dppn ligand at ∼400 nm are superimposed as
bleach signals on the positive transient absorption spectrum,which resemble the spectra reported for 1 (Figure 3a).The 3MLCT signal at 365 nm can be fitted to a
monoexponential decay with τ = 720 fs, while the risetime ofthe 3ππ* peak at 540 nm follows a biexponential growth, withτ1 = 630 fs and τ2 = 22 ps (Figure 3). Given the similarity of thefast time constant, the growth of the signal at 540 nm at earlytimes is believed to arise from internal conversion (IC) fromthe 3MLCT to the 3ππ* state. The sharpening of the 540 nmsignal occurs with a time constant of 22 ps, attributed tovibrational cooling. The excited-state dynamics of 3 in CH3CNare schematically depicted in the Jablonski diagram shown inFigure 3b. Ligand dissociation likely proceeds through directpopulation of the 3LF (ligand field) states from the Franck−Condon state (Figure 3b) but is not observed under thepresent experimental conditions because of the low quantumyield for this process.The difference in the relative initial populations of the
3MLCT and 3ππ* states in 1 and 3 can be explained by higherenergy 1MLCT and 3MLCT states in 3 as compared to 1, whilethe 3ππ* state in both complexes is expected to remainconstant. The greater 1MLCT−3ππ* energy gap in 3 results ina slower ISC 1MLCT→3ππ* rate than in 1, while the1MLCT−3MLCT rate constant is expected to be similar inthe two compounds. The slower 1MLCT→3ππ* rate results ina greater relative population of the 3MLCT vs 3ππ* state in 3versus 1.
Photosensitization of 1O2 and Photoinduced LigandExchange. The changes in the electronic absorption spectrumof 3 in H2O as a function of irradiation time are shown inFigure 4. A red shift is observed in the spectrum at early times,with the appearance of new features with maxima at ∼470 and∼540 nm (Figure 4). Over a longer photolysis period, the ∼470nm peak begins to decrease in intensity, with concomitantgrowth of a band with a maximum at 547 nm. Overall, a finalshift in the MLCT absorption maximum from 430 to 547 nm isobserved; the latter is consistent with the formation of the
Figure 3. (a) Transient absorption spectra of 3 in CH3CN collected at0.1, 0.5, 1, 2, 3, 5, 10, 20, and 40 ps following the excitation pulse (λexc= 300 nm, fwhm ∼300 fs). (b) Jablonski diagram for the excited-statedynamics of 3 in CH3CN.
Figure 4. Changes in the electronic absorption spectrum of 3 (20 μM)in H2O as a function of irradiation time, collected at (a) 0, 1, 2, 5, 10,15, 20, and 30 min and (b) 40, 50, 60, 100, 120, and 210 min (λirr =400 nm).
Journal of the American Chemical Society Article
dx.doi.org/10.1021/ja508272h | J. Am. Chem. Soc. 2014, 136, 17095−1710117098
product [Ru(bpy)(dppn)(H2O)2]2+. This shift in energy (4737
cm−1) upon forming the bis-aqua species is similar to that in 2(3121 cm−1) and other related Ru(II) complexes, in which twoCH3CN ligands are replaced by two water molecules.24,45 Nochanges in the electronic absorption spectrum of 3 are observedwhen the complex is stored in the dark in water under similarexperimental conditions (Supporting Information, Figures S5and S6).The quantum yield for the first ligand exchange, Φex, for 3 in
H2O to form cis-[Ru(bpy)(dppn)(CH3CN)(H2O)]2+ was
measured to be 0.002(3) with λirr = 400 nm, a value that is 2orders of magnitude lower than that measured for 2 to form[Ru(bpy)2(CH3CN)(H2O)]2+, Φex = 0.21, under similarirradiation conditions.16c Population of the dissociative 3LFstate(s) with Ru−CH3CN(σ*) character, either directly fromthe 1MLCT state or from thermal population from the 3MLCTstate, is required for ligand dissociation to take place (Figure3b).46−49 The low-lying 3ππ* state in 3, which is not present in2, results in fast 3MLCT−3ππ* IC (τ ≈ 0.7 ps), such thatthermal population of the higher-lying 3LF state from the3MLCT does not favorably compete with IC. In addition, ISCfrom the 1MLCT state in 3 is partitioned between the threeavailable triplet states, 3LF, 3MLCT, and 3ππ* (Figure 3b),instead of only two states in 2, 3LF and 3MLCT. The presenceof an additional low-lying 3ππ* state reduces the population ofthe 3LF state and, therefore, the quantum yield of liganddissociation.The long lifetime of the 3ππ* excited state of 3 is expected to
result in the sensitization of 1O2. The quantum yield for thegeneration of 1O2, ΦΔ, by 3 was measured to be 0.72(2) (λirr =460 nm) using DPBF as a trapping agent and [Ru(bpy)3]
2+ as astandard (ΦΔ = 0.81) in methanol (Supporting Information,Figure S4). This value is slightly lower than that previouslyreported for 1, ΦΔ = 0.88(2) in the same solvent,20 which maybe due to the competing photoinduced ligand-exchangeprocess.Cytotoxicity. Table 1 lists cytotoxicity and phototoxicity
data for 1−3 toward HeLa cancer cells, the relative molarabsorptivity (RA) of each complex at the irradiation wavelength(466 nm), and the phototoxcity index (PI). It is evident fromTable 1 that 3 is the least toxic complex when incubated in thedark for 48 h, with half-maximal inhibitory concentration,IC50
dark, of 334 μM, followed by 2 (IC50dark = 244 μM) and then 1
(IC50dark = 110 μM). It should be noted that the phototoxicity
enhancement of 2 toward HeLa cells under the presentexperimental conditions is modest (Table 1). A similar resultwas published recently using the PC3 cell line for the samecomplex.50 In contrast, both 1 and 3 exhibit enhancedcytotoxicities upon irradiation with visible light (466 ± 20nm), followed by incubation for 48 h in the dark, resulting inIC50
irr values of 390 and 470 nM, respectively. Although thephotocytotoxicity of 3 is slightly lower than that of 1, theimportant factor in PCT is the relative toxicity when the
complex is kept in the dark versus when it is irradiated, given byPI = IC50
dark/IC50irr. The PI value for 3 is 2.5-fold greater than that
for 1 and represents the effective PCT activity of the complex.18
The PI values for complexes 1 and 3 are 282 and 711,respectively, but 1 exhibits a greater absorption of the excitationwavelength, which is reported as the RA value in Table 1. Itshould be noted that the percent cellular uptake values of 1 and3 were measured to be 6 ± 2% and 5 ± 2%, respectively, whilethat for 2 was 0.76 ± 0.03%. Given the similarity inhydrophobicity, overall charge, size, shape, and molecularstructures of 1 and 3, the fact that their cellular uptake is nearlyidentical is expected and does not account for the difference inPI values measured for the complexes. The PI values correctedfor difference in absorption at 466 nm, PIcor, result in evengreater phototoxicity of 3 relative to that of 1. This result isunexpected, since 1 is able to generate 1O2 in greater yieldsthan 3, but complex 3 may be able to induce DNA crosslinks,or it may bind to proteins or other biomolecules in the cellfollowing photoinduced ligand exchange. This additional modeof action to 1O2 production may result in the enhancedphototoxicity of 3, with PIcor = 1110 ± 206.
■ CONCLUSIONSIn order to circumvent the drawbacks of current chemo-therapeutic treatments and improve upon current PCT agents,complex 3 was synthesized and characterized to function as amultimodal PCT complex capable of producing 1O2 and toundergo ligand exchange to potentially covalently bind DNAand other biomolecules upon irradiation. The photophysicalproperties of the new complex were compared to those of 1and 2, which have been established to undergo efficient 1O2production and ligand exchange when irradiated, respectively.Under analogous conditions, complex 3 produces 1O2 slightlyless efficiently than 1, and photoinduced ligand exchangeoccurs in 3 to a much lesser extent than in 2. It appears,however, that 3 may be a more useful PCT agent since itscorrected phototoxicty index, PIcor, is nearly 3 times greaterthan that of 1. Future work includes the design of complexesthat improve upon the dual efficiency of 1O2 production andligand exchange, as well as an investigation aimed at gainingfurther understanding of the mechanism of cell death.
■ ASSOCIATED CONTENT*S Supporting Information1H NMR data, cyclic voltammetry, singlet oxygen quantumyield data, complete photolysis data, and dark stability. Thismaterial is available free of charge via the Internet at http://pubs.acs.org.
■ AUTHOR INFORMATIONCorresponding [email protected]@osu.edu
Table 1. Toxicity Data in the Dark and upon Irradiation for 1−3complex RAa IC50
dark/μMb IC50irr/μMb PIc PIcor
d
1 1 110 ± 28 0.39 ± 0.06 282 ± 69 282 ± 692 0.17 244 ± 23 223 ± 94 1.1 ± 0.4 6.4 ± 2.33 0.64 334 ± 74 0.47 ± 0.02 711 ± 132 1110 ± 206
aMolar absorptivity relative to that of 1 at the irradiation wavelength for phototoxicity studies (466 nm). bIC50 represents the concentration requiredto attain 50% cell death; IC50
irr value determined by irradiating the cell culture with a 466 ± 20 nm LED for 20 min and then incubating for 48 h;errors determined from two or three experimental trials. cPhototoxicity index: PI = IC50
dark/IC50irr. dCorrected PI value: PIcor = PI/RA.
Journal of the American Chemical Society Article
dx.doi.org/10.1021/ja508272h | J. Am. Chem. Soc. 2014, 136, 17095−1710117099
MAL 2014-2015 Chemical Biology – Master program Leiden University
5/8
15) Does compound 2 “work” as a light-activatable anticancer prodrug? Under which
hypothesis can we use this result to say that the phototoxicity of compound 3 is a photodynamic effect, ie is not related to ligand photosubsitution? (0.25 point)
16) Which experiment would we need to perform to prove whether compound 3 is working via a photodynamic or via a photosubstitution mechanism? (0.25 point)
17) Why do the authors also define and calculate PIcor, the “corrected” phototoxic index? (0.25 point)
18) What is the main photophysical problem of compound 1-4 for in vivo therapeutic applications? Propose two different strategies to solve this issue. (0.25 point)
Part B. Transport of Ca2+ through biological membranes (3.5 points) The extracellular concentration of Na+ ions is ~70 fold higher than that of Ca2+ ions. Despite this difference, Ca2+ ions flow through the voltage-gated calcium channels, CaV, at a rate of ~106 ions.s-
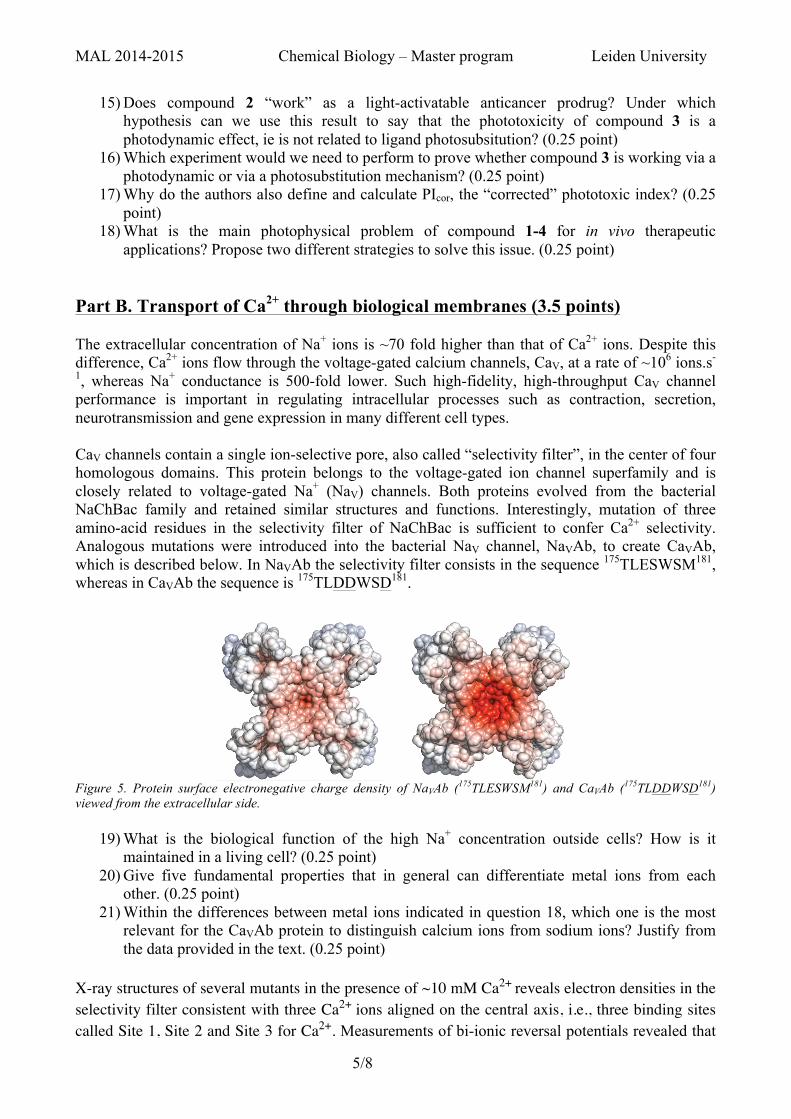
1, whereas Na+ conductance is 500-fold lower. Such high-fidelity, high-throughput CaV channel performance is important in regulating intracellular processes such as contraction, secretion, neurotransmission and gene expression in many different cell types. CaV channels contain a single ion-selective pore, also called “selectivity filter”, in the center of four homologous domains. This protein belongs to the voltage-gated ion channel superfamily and is closely related to voltage-gated Na+ (NaV) channels. Both proteins evolved from the bacterial NaChBac family and retained similar structures and functions. Interestingly, mutation of three amino-acid residues in the selectivity filter of NaChBac is sufficient to confer Ca2+ selectivity. Analogous mutations were introduced into the bacterial NaV channel, NaVAb, to create CaVAb, which is described below. In NaVAb the selectivity filter consists in the sequence 175TLESWSM181, whereas in CaVAb the sequence is 175TLDDWSD181.
Figure 5. Protein surface electronegative charge density of NaVAb (175TLESWSM181) and CaVAb (175TLDDWSD181) viewed from the extracellular side.
19) What is the biological function of the high Na+ concentration outside cells? How is it maintained in a living cell? (0.25 point)
20) Give five fundamental properties that in general can differentiate metal ions from each other. (0.25 point)
21) Within the differences between metal ions indicated in question 18, which one is the most relevant for the CaVAb protein to distinguish calcium ions from sodium ions? Justify from the data provided in the text. (0.25 point)
X-ray structures of several mutants in the presence of ~10 mM Ca2+ reveals electron densities in the selectivity filter consistent with three Ca2+ ions aligned on the central axis, i.e., three binding sites called Site 1, Site 2 and Site 3 for Ca2+. Measurements of bi-ionic reversal potentials revealed that
W W W. N A T U R E . C O M / N A T U R E | 3
SUPPLEMENTARY INFORMATION RESEARCH
Supplementary Figure 3. Protein surface electrostatic potential of NaVAb (175
TLESWSM181
), 175
TLDDWSN181
and CaVAb (175
TLDDWSD181
). The electrostatic potential on the surface of NaVAb (175TLESWSM181), 175TLDDWSN181, and CaVAb (175TLDDWSD181) viewed from the extracellular side. Electronegative and electropositive charges are colored in red and blue, respectively.
MAL 2014-2015 Chemical Biology – Master program Leiden University
6/8
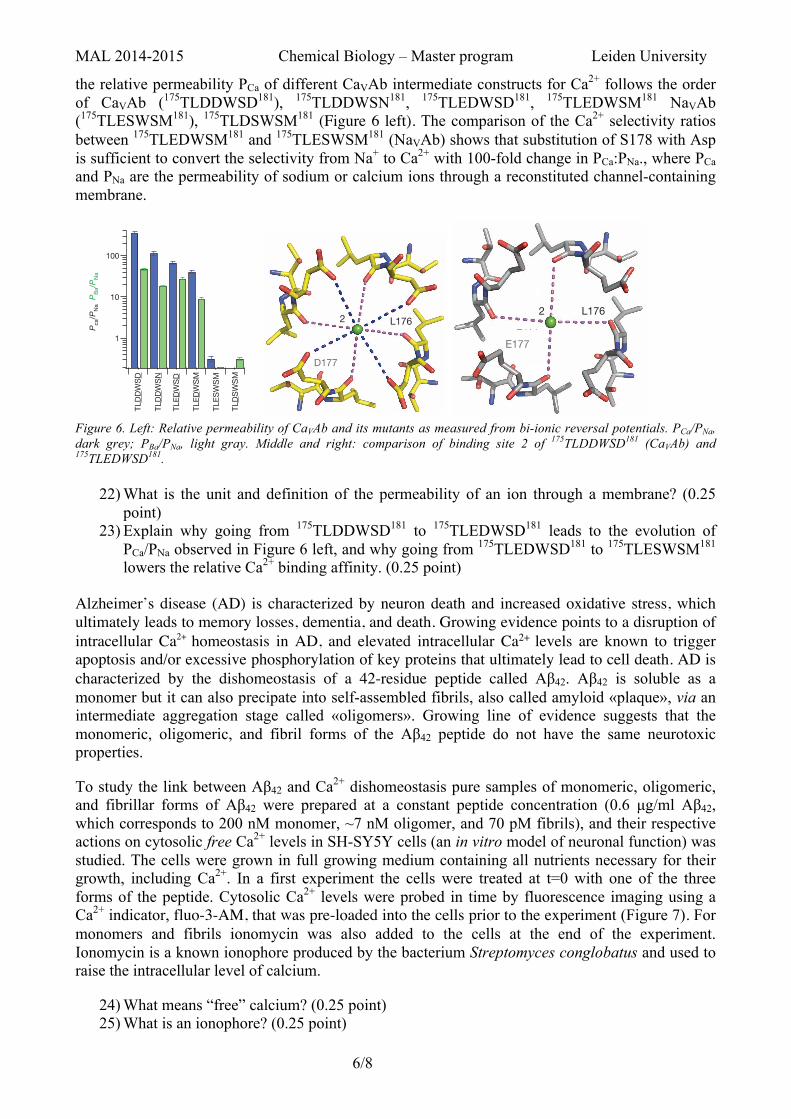
the relative permeability PCa of different CaVAb intermediate constructs for Ca2+ follows the order of CaVAb (175TLDDWSD181), 175TLDDWSN181, 175TLEDWSD181, 175TLEDWSM181 NaVAb (175TLESWSM181), 175TLDSWSM181 (Figure 6 left). The comparison of the Ca2+ selectivity ratios between 175TLEDWSM181 and 175TLESWSM181 (NaVAb) shows that substitution of S178 with Asp is sufficient to convert the selectivity from Na+ to Ca2+ with 100-fold change in PCa:PNa., where PCa and PNa are the permeability of sodium or calcium ions through a reconstituted channel-containing membrane.
Figure 6. Left: Relative permeability of CaVAb and its mutants as measured from bi-ionic reversal potentials. PCa/PNa, dark grey; PBa/PNa, light gray. Middle and right: comparison of binding site 2 of 175TLDDWSD181 (CaVAb) and 175TLEDWSD181.
22) What is the unit and definition of the permeability of an ion through a membrane? (0.25 point)
23) Explain why going from 175TLDDWSD181 to 175TLEDWSD181 leads to the evolution of PCa/PNa observed in Figure 6 left, and why going from 175TLEDWSD181 to 175TLESWSM181 lowers the relative Ca2+ binding affinity. (0.25 point)
Alzheimer’s disease (AD) is characterized by neuron death and increased oxidative stress, which ultimately leads to memory losses, dementia, and death. Growing evidence points to a disruption of intracellular Ca2+ homeostasis in AD, and elevated intracellular Ca2+ levels are known to trigger apoptosis and/or excessive phosphorylation of key proteins that ultimately lead to cell death. AD is characterized by the dishomeostasis of a 42-residue peptide called Aβ42. Aβ42 is soluble as a monomer but it can also precipate into self-assembled fibrils, also called amyloid «plaque», via an intermediate aggregation stage called «oligomers». Growing line of evidence suggests that the monomeric, oligomeric, and fibril forms of the Aβ42 peptide do not have the same neurotoxic properties.
To study the link between Aβ42 and Ca2+ dishomeostasis pure samples of monomeric, oligomeric, and fibrillar forms of Aβ42 were prepared at a constant peptide concentration (0.6 µg/ml Aβ42, which corresponds to 200 nM monomer, ~7 nM oligomer, and 70 pM fibrils), and their respective actions on cytosolic free Ca2+ levels in SH-SY5Y cells (an in vitro model of neuronal function) was studied. The cells were grown in full growing medium containing all nutrients necessary for their growth, including Ca2+. In a first experiment the cells were treated at t=0 with one of the three forms of the peptide. Cytosolic Ca2+ levels were probed in time by fluorescence imaging using a Ca2+ indicator, fluo-3-AM, that was pre-loaded into the cells prior to the experiment (Figure 7). For monomers and fibrils ionomycin was also added to the cells at the end of the experiment. Ionomycin is a known ionophore produced by the bacterium Streptomyces conglobatus and used to raise the intracellular level of calcium.
24) What means “free” calcium? (0.25 point) 25) What is an ionophore? (0.25 point)
recording conditions, yielding a range of the permeability (P) ratioPCa:PNa.10,000-fold for these constructs (Fig. 1g). Intermediate CaVAbderivatives with single and double Asp substitutions had progressiveincreases in Ca21 selectivity (Fig. 1g and Supplementary Fig. 2), asobserved for NaChBac21. The 175TLDDWSN181 mutant has an Asn resi-due in place of the final Asp, as observed in one domain of mammalianCaV channels (Supplementary Fig. 1), and it still favours Ca21 over Na1
by more than 100-fold (Fig. 1g).We crystallized and determined the structure of CaVAb and its deriva-
tives by molecular replacement using the NaVAb structure (PDB code3RVY) as the search template (Supplementary Table 1). The overallstructure of CaVAb is very similar to that of NaVAb, with a root meansquared deviation (r.m.s.d.) of 0.4 A (Fig. 1h). However, the electro-static potential at the outer entry to the selectivity filter is more negativefor CaVAb than for NaVAb (Supplementary Fig. 3). The three nega-tively charged Asp residues introduced at the selectivity filter of CaVAbcreate a wide, short, electronegatively lined pore (6 A diameter, 10 Alength) with no significant alteration in backbone structure with respectto NaVAb (Fig. 1i, j and Supplementary Fig. 4). Thus, the Ca21 selecti-vity of CaVAb is mainly determined by the side chains of the aminoacids at the selectivity filter.
Ca21-binding sites in the permeation pathwayThe 3.2 A resolution structure of the mutant 175TLDDWSN181 in thepresence of 10 mM Ca21 reveals electron densities in the selectivity filterconsistent with three Ca21 ions aligned on the central axis (Fig. 2a). Inthe outer vestibule leading to the selectivity filter, there are two addi-tional less-intense on-axis peaks associated with weaker surroundingdensities. To confirm the identity of the bound ions, we collected X-raydiffraction data at a wavelength of 1.75 A and calculated the F1
Ca – F2Ca
anomalous difference map. Two strong peaks followed by a weakerpeak on the intracellular side were found in the selectivity filter alongthe ion-conduction pathway, verifying three binding sites for Ca21
(Fig. 2b). We name these Site 1, Site 2 and Site 3 from the extracellularto the intracellular side.
The Ca21 ion at Site 1 is predominantly coordinated by the carb-oxyl groups of D178 (SiteEX in NaVAb), which define a plane at theselectivity filter entrance on the extracellular side of the bound Ca21
ion (Fig. 2b). The distance between the carboxyl oxygen and Ca21 isabout 4.0 A. This distance suggests that the ion binds at this site in ahydrated form because the ionic diameter of Ca21 is 2.28 A, too smallto interact with the carboxylate anions directly but appropriate forinteraction through bound water molecules. Further into the pore, thefour acidic side chains of D177 (SiteHFS in NaVAb) are located alongthe wall of the selectivity filter rather than projecting into the lumen,thereby also allowing the binding of a fully hydrated Ca21 ion (Fig. 2b).Different from Site 1, this central Ca21-binding site (Site 2) is sur-rounded by a box of four carboxylate oxygen atoms from D177 aboveand four backbone carbonyl oxygen atoms from L176 below (SiteCEN
in NaVAb), with oxygen–Ca21 distances of 4.5 A and 4.2 A, respec-tively (Fig. 2b). At the intracellular side of the pore, the third Ca21-binding site (Site 3) is composed of one plane of four carbonyls fromT175 (SiteIN in NaVAb), which point inward to the lumen (Fig. 2b).Here the Ca21 ion lies nearly on the same plane as T175 carbonyls. Thechemical environment of Site 3 hints at a lower affinity, consistent withits role in exit of Ca21 from the selectivity filter into the central cavity.Throughout the selectivity filter, the oxygen–Ca21 coordination dis-tances are in the range of 4.0–5.0 A, suggesting that the bound Ca21 ionis continuously stabilized in a fully hydrated state when it passes throughthe pore. We observed diffuse electron density and in favourable cases
S178D178
E177D177
M181D181
a b
c d
e
f
g
h i
NaVAb
CaVAb
M181D181
S178D178
E177D177
[Ca2+] (μM)102 103 1042 5 2 5
Pca
/PN
a P
Ba/P
Na
j
E rev
Log [Ca2+] (mM)0.0 0.5 1.0 1.5 2.0
75
50
25
TLD
DW
SD
TLD
DW
SN
TLED
WS
D
TLED
WS
M
TLES
WS
M
TLD
SW
SM
175TLESWSM181
175TLDDWSD181
+50 mV
1 nA5 ms
1.00.80.60.40.20.0
Nor
mal
ized
I
–75 –50 –25 0 25 50 75
1.0
0.8
0.6
0.4
0.2
0.0
Nor
mal
ized
I
100
10
1
0.20.00.20.4
0.81.0N
orm
aliz
ed I
0.5 nA5 ms
0.6
Voltage (mV)
–75 –50 –25 0 25 50 75Voltage (mV)
Figure 1 | Structure and function of the CaVAb channel. a, b, Outward Na1
current conducted by NaVAb with 10 mM extracellular Ca21 and 140 mMintracellular Na1. Holding potential, 2100 mV; 20-ms, 10-mV stepdepolarizations. c, d, Voltage-dependent conductance of inward Ca21 currentby CaVAb under the same conditions. 20-ms, 5-mV step depolarizations.e, Biphasic anomalous mole fraction effect of increasing Ca21 as indicated, withBa21 as the balancing divalent cation: 10 mM Ba21 with 0 to 0.5 mM Ca21,9.3 mM Ba21 with 0.7 mM Ca21, and 0 mM Ba21 with 10 mM Ca21
(n 5 4–10). f, Reversal potential (Erev) versus Ca21 concentration. g, Relativepermeability of CaVAb and its derivatives as measured from bi-ionic reversalpotentials. PCa/PNa, blue; PBa/PNa, green (n 5 5–22). h, Cartoon representationof the overall structure of CaVAb (yellow) superimposed with NaVAb (slate).i, j, Top (i) and side (j) views of the superimposed selectivity filters ofCaVAb (yellow) and NaVAb (slate) in stick representation. The three originalNavAb residues (black) and substituted CavAb residues (orange) are indicated.Errors bars in b and d–g are 6 s.e.m.
ARTICLE RESEARCH
2 J A N U A R Y 2 0 1 4 | V O L 5 0 5 | N A T U R E | 5 7
Macmillan Publishers Limited. All rights reserved©2014
discrete water molecules surrounding the bound Ca21, consistent withthe presence of an inner shell of bound waters of hydration (Supplemen-tary Fig. 5).
Although the anomalous difference map did not resolve clear peaksat the outer vestibule beyond the selectivity filter, we interpret the twoon-axis 2Fo – Fc densities above the three Ca21 sites as two additionalCa21 ions poised to enter the pore (Fig. 2a). This assignment is sup-ported by the surrounding eight islets of density, which probablyrepresent eight stabilized water molecules. Just as at Site 2 in the selec-tivity filter, these eight water molecules appear to serve as a square anti-prism cage coordinating a hydrated Ca21 ion at the centre (Fig. 2a).The second Ca21 ion located at the bottom of this cage is ,4.5 A awayfrom the four carboxyl oxygen atoms of D178, suggesting that part ofits second hydration shell is replaced by D178 before the ion enters theselectivity filter. The selectivity filter, therefore, appears to select Ca21
at its mouth by recognizing the Ca21–H2O hydration complex andconduct Ca21 by fitting the Ca21–H2O hydration complex into thepore. Because Ca21 is more electropositive than Na1, it should bindmore tightly in the ion selectivity filter of CaVAb, providing a mecha-nistic basis for the block of Na1 permeation by Ca21 at low Ca21
concentration and preferential permeation of Ca21 at higher Ca21
concentration (see Discussion).
Functional roles of key selectivity filter residuesMeasurements of bi-ionic reversal potentials revealed that the relativepermeability of different CaVAb intermediate constructs for Ca21
follows the order of CavAb (175TLDDWSD181) . 175TLDDWSN181
. 175TLEDWSD181 . 175TLEDWSM181 . NaVAb (175TLESWSM181)
. 175TLDSWSM181 (Fig. 1g and Supplementary Fig. 2). A comparison ofthe Ca21 selectivity ratios between 175TLEDWSM181 and 175TLESWSM181
(NaVAb) shows that substitution of S178 with Asp is sufficient to con-vert the selectivity from Na1 to Ca21 with .100-fold change in PCa:PNa
(Fig. 1g). Placement of the Asp carboxyl side chain at this position allowsfor the formation of the first hydrated Ca21-binding site in the selec-tivity filter (Fig. 2c and Supplementary Fig. 6). By contrast, S178 inNaVAb binds Ca21 directly by displacing its hydration shell, whichblocks conductance of both Na1 and Ca21 (Fig. 2d). Therefore, for-mation of Site 1 for binding hydrated Ca21 is both necessary and suffi-cient for conferring Ca21 selectivity over Na1 to NaVAb.
The Ca21 selectivity ratio of CaVAb (175TLDDWSD181) is 5.5-foldhigher than 175TLEDWSD181 (Fig. 1g). This functional difference reflectsa role of Site 2 in adjusting Ca21 selectivity. Different from the sidechains of D177 in CaVAb (175TLDDWSD181), which interact with theCa21 ion (Fig. 2e), the carboxyl group of E177 in 175TLEDWSD181
swings away from the selectivity filter and forms a hydrogen bond withD181 and the main-chain nitrogen atoms of S180 (Fig. 2f and Sup-plementary Fig. 7). Site 2 in 175TLEDWSD181, therefore, is exclusivelyformed by the four carbonyl oxygen atoms of L176, which conceivablyleads to a lower Ca21-binding affinity and a decreased Ca21 selec-tivity. This comparison highlights both the importance of Site 2 insupporting high Ca21 selectivity and the critical role of the backbonecarbonyl groups of L176 in constructing this ion-binding site.
Distinct from D177 and D178, the N181 residue of 175TLDDWSN181
lies outside of the ion-conducting pore and is not directly involved inCa21 ion coordination. In close proximity to the carboxyl groups ofD178, which form a ring that lines the perimeter of the pore entryway,the side chain of N181 embraces the perimeter of the D178 ring bydonating a hydrogen bond to its side-chain carboxyls (Fig. 3a). Sucha structural arrangement is also found in CaVAb (175TLDDWSD181)(Fig. 3b), although the more electronegative environment created bythe extra negatively charged residue, D181, probably attracts Ca21
more strongly and confers a 4- to 5-fold higher degree of Ca21 selec-tivity to CaVAb (175TLDDWSD181) in comparison to 175TLDDWSN181
(Fig. 1g and Supplementary Fig. 3).175TLDDWSM181, which has the hydrophobic residue M181 packed
next to the D178 ring, is the only CaVAb intermediate that does notconduct Ca21 (Supplementary Fig. 2). The crystal structure of this mutantreveals a blocking Ca21 ion tightly bound at Site 1 in a dehydrated statewith an oxygen–ion distance of 2.3 A (Fig. 3c). Superposition analy-sis shows few structural differences between 175TLDDWSM181 and175TLDDWSN181, except for the side chain of D178, which is fixedby N181 in 175TLDDWSN but unconstrained in 175TLDDWSM181
(Fig. 3a, c). This comparison indicates that N181 in 175TLDDWSN181
and D181 in CaVAb have critical roles in engaging D178 and allowingthe reversible binding of the Ca21–H2O hydration complex for activeCa21 conductance. Although the subtle difference in Ca21 selectivitybetween 175TLEDWSD181 and 175TLEDWSM181 seems to argue againstthis conclusion (Fig. 1g), E177 in 175TLEDWSM181 actually has a struc-tural role equivalent to that of N181 in 175TLDDWSN181 — by pointingaway from the selectivity filter lumen, E177 forms a carboxylate–carboxylate
1
2
3
1
2
3
L176
D177
D178
N181
T175
a b
1
2
1
2
4.0Å3.0Å
L176L176
E177 E177
D178S178
M181M181
c d
e f
175TLEDWSM181 175TLESWSM181
175TLDDWSD181 175TLEDWSD181
2
D177
L176
2
L176
E177
2
L176
E177777777
222222222222222222222222222222222222222222222222
D1777777777777777777777777777777777777777777777777777
L17677777777777777777777777777L1767777777777777777777777777777777
E177
L176
D177
L1762 2
Figure 2 | Ca21-binding sites in and near the selectivity filter of NaVAb,CaVAb and their derivatives. a, Electron density at the selectivity filter of175TLDDWSN181 (also see Supplementary Fig. 4). The 2Fo – Fc electron densitymap (contoured at 2s) of select residues in the selectivity filter with twodiagonally opposed subunits shown in sticks, the Ca21 ions along the ionpathway in green spheres and water molecules in red spheres. b, Densities atCa21 binding sites 1 and 2 from the anomalous difference Fourier map (3s)calculated from the diffraction data of a 175TLDDWSN181 mutant crystalsoaked in the presence of 5 mM Ca21 and collected at 1.75 A wavelength. Thedistances between Ca21 and oxygen atoms (dashed lines) are about 4.0 A at Site1 (blue lines), 4.4 A at Site 2 (blue and magenta lines) and 5.0 A (magenta line)at Site 3. For clarity, the subunit closest to the viewer is not shown. c, d, Acomparison between 175TLEDWSM181 and 175TLESWSM181 (NaVAb)highlighting the importance of Site 1 for Ca21 selectivity. e, f, A comparisonbetween 175TLDDWSD181 (CaVAb) and 175TLEDWSD181 highlighting the roleof Site 2 in fine tuning Ca21 selectivity. All structures were determined in thepresence of 15 mM Ca21.
RESEARCH ARTICLE
5 8 | N A T U R E | V O L 5 0 5 | 2 J A N U A R Y 2 0 1 4
Macmillan Publishers Limited. All rights reserved©2014

MAL 2014-2015 Chemical Biology – Master program Leiden University
7/8
26) What is the most cell-disturbing form of Aβ42? Justify. (0.25 points)
Figure 7. Left: Ca2+ elevations induced by Aβ42 depend upon its aggregation state. A, fluorescence records illustrating typical responses to applications of 6 μg/ml of Aβ42 monomer (trace a), fibrils (insoluble aggregates, trace b), and oligomers (soluble aggregates, trace c). Right: structure of ionomycin.
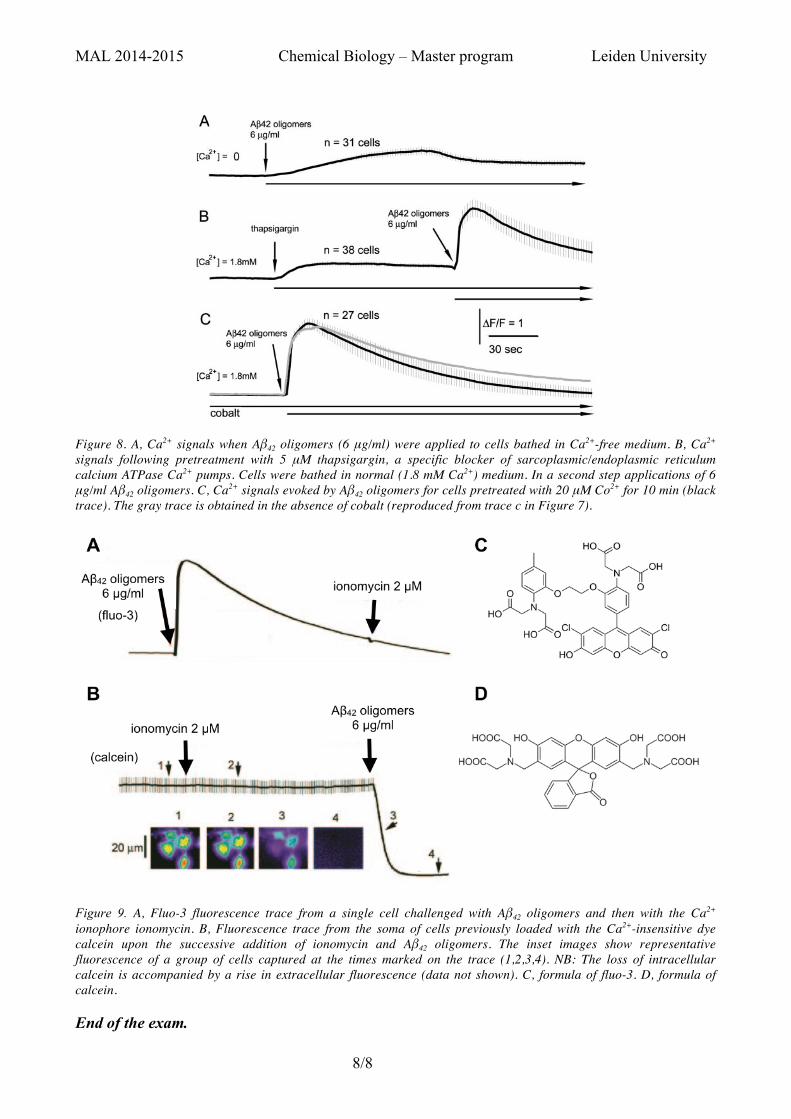
To determine the origin of the increase in cytosolic Ca2+ concentration evoked by amyloid oligomers, the free extracellular Ca2+ concentration was reduced to very low levels by bathing cells for 20 min in a Ca2+-free medium. Application of Aβ42 oligomers (6 μg/ml) evoked a small, slowly rising fluorescence signal, which reached a peak amplitude of about 30% of that in Ca2+-containing medium (Figure 8A). The authors then depleted the endoplasmic reticulum Ca2+ stores of cells bathed in normal [Ca2+] medium by applying thapsigargin, a specific sarcoplasmic/endoplasmic reticulum calcium ATPase pump inhibitor. Calcium ATPase pumps pump calcium ions from the cytosol into the lumen of the sarcoplasmic/endoplasmic reticulum. Thapsigargin evoked a small rise in the cytosolic Ca2+ signal, but subsequent application of Aβ42 oligomers produced a large, rapid increase, similar to that observed in control cells without thapsigargin treatment (Figure 8B). In a third experiment, the cells were pre-treated with 20 µM cobalt(II) ions, which is a non-specific blocker of many Ca2+-permeable channels. The fluorescence signals were of almost identical amplitude in the presence (black trace in Figure 8) and absence (gray trace) of cobalt.
27) Interpret the small rise in the Ca2+ signal consecutive to thapsigargin application and draw a small scheme. (0.25 point)
28) Does this experiment allow you to say whether the elevated cytosolic calcium observed upon applying Aβ42 oligomers on the cells comes from influx of extracellular Ca2+ across the plasma membrane or from Ca2+ liberated from intracellular stores? Justify. (0.25 point)
29) Do the Aβ42 peptides induce Ca2+ influx via endogenous Ca2+-permeable plasma membrane ion channels? Justify. (0.25 point)
In a final experiment, the cells were pre-loaded with either fluo-3 or calcein, two polyanionic fluorescent dyes, in order to assess the state of the cell membrane upon treatment with Aβ42 oligomers (6 μg/ml). Fluo-3 is a calcium-sensitive dye, whereas calcein is a calcium-insensitive dye. The evolution of the intracellular fluorescence signal upon treatment is shown in Figure 9.
30) Can fluo-3 or calcein cross the membrane via the same route as Ca2+ ions? Justify qualitatively. (0.25 points)
31) How do you interpret the data in Figure 9A and 9B? (0.25 point) 32) What may be according to these data the effect of the Aβ42 oligomers on the cell membrane?
Would it justify its toxicity as observed in Alzheimer’s disease? (0.25 point)
vate (1 !M). Cells were maintained at 37 °C in 5% CO2, and the mediumwas replaced every 2 days. Cells (!10,000) were plated in 35-mmglass-bottom culture dishes (MatTek Corp.) and grown overnight. Load-ing with the Ca2" indicator fluo-3 was accomplished by incubating withfluo-3-AM (7 !M in Hanks’ balanced salt solution) for 30 min at roomtemperature, washing 3 times with Hanks’ balanced salt solution andmaintaining at 37 °C for 20 min to ensure complete hydrolysis. Asimilar loading protocol was utilized to load cells with calcein by incu-bating with 7 !M calcein-AM.
Fluorescence Imaging—The imaging system consisted of an invertedmicroscope (Olympus IX 71) equipped with a Leitz 16X objective. Flu-orescence excitation was by a 488 nm argon ion laser, and emittedfluorescence (" # 510 nm) was imaged by a cooled CCD camera (Cas-cade 650, Roper Scientific). Time-lapse images (1 frame s$1) were cap-tured using the MetaMorph software package (Universal Imaging,Westchester, PA), and fluorescence intensities were measured fromregions of interest centered on individual cells. Signals are expressed asa pseudo ratio (%F/F) of the change in fluorescence (%F) divided by theresting fluorescence before treatment (F). A small proportion (9%) ofcells failed to load with fluo-3, having low initial fluorescence andfailing to respond to ionomycin. These were excluded from analysis.
Amyloids were applied by pipetting a fixed aliquot (70 !l) of a dilutedstock solution into the recording chamber (1-ml volume) directly abovethe microscope objective. To estimate the resulting concentration expe-rienced by the cells under observation we pipetted the same volume ofa fluorescent dye (calcein) into the chamber and measured the resultingfluorescence in the vicinity of the cells relative to that of the initial,undiluted solution of dye. This calibration yielded a dilution factor ofabout 5, which was assumed in calculating the effective concentrationsof amyloids.
To avoid complications from differences in molecular weights be-
tween monomers, oligomers and fibrils, we express these concentra-tions in units of !g ml$1. As a rough guide, a concentration of 0.6 !g/mlA#42 corresponds to 200 nM monomer and !7 nM oligomer and 70 pM
fibrils.
RESULTS
A#42 Oligomers, but Not Monomers or Fibrils, Increase In-tracellular Free Ca2"—Homogeneous populations of mono-meric, oligomeric, and fibrillar A# were prepared as describedabove and characterized by size exclusion chromatography andelectron microscopy. The oligomeric preparation had an ap-proximate molecular mass of 90 kDa, contained very littlematerial of lower molecular mass, and was comprised ofspherical vesicles with diameters of 2–5 nm (Fig. 1). Themonomeric preparation contained no detectable oligomericaggregates as analyzed by size exclusion chromatography(Fig. 1). The morphology of the fibrillar preparations was aspublished previously (34).
The actions of homogeneous monomeric, oligomeric, andfibrillar preparations of soluble A#42 amyloid were examinedby adding aliquots of the samples to fluo-3-loaded SH-SY5Ycells (Fig. 2). Fig. 2A illustrates images and correspondingCa2"-dependent fluorescence measurements in a representa-tive cell. Applications of monomers or fibrils at final concentra-tions of 6 !g/ml evoked no detectable change in fluorescence,whereas subsequent application of the same amount of oli-gomer evoked large and rapid (!5 s) increases in Ca2"-depend-
FIG. 3. Ca2! elevations induced byother amyloids depend upon theiraggregation state. A, fluorescencerecords illustrating typical responses toapplications of 6 !g/ml of A#42 monomer(trace a), fibrils (trace b), and oligomers(trace c). Each trace was obtained from adifferent cell. No responses were observedto monomers or fibrils, even though thesame cells gave large signals when subse-quently challenged with ionomycin (6!M). B, pooled data showing mean fluores-cence signals ("S.E.) from 40 to 200 cellsevoked by A#42, prion, IAPP, poly(Q), andlysozyme, each at a final concentration of6 !g/ml. Measurements were obtainedfrom records like those in A. For eachamyloid, the histogram bars show re-sponses evoked by monomers, fibrils, andoligomers.
Membrane Permeabilization by Soluble Amyloid Oligomers17296
at WA
LAEU
S LIBR
AR
Y on February 16, 2015
http://ww
w.jbc.org/
Dow
nloaded from
MAL 2014-2015 Chemical Biology – Master program Leiden University
8/8
Figure 8. A, Ca2+ signals when Aβ42 oligomers (6 μg/ml) were applied to cells bathed in Ca2+-free medium. B, Ca2+ signals following pretreatment with 5 μM thapsigargin, a specific blocker of sarcoplasmic/endoplasmic reticulum calcium ATPase Ca2+ pumps. Cells were bathed in normal (1.8 mM Ca2+) medium. In a second step applications of 6 μg/ml Aβ42 oligomers. C, Ca2+ signals evoked by Aβ42 oligomers for cells pretreated with 20 μM Co2+ for 10 min (black trace). The gray trace is obtained in the absence of cobalt (reproduced from trace c in Figure 7).
Figure 9. A, Fluo-3 fluorescence trace from a single cell challenged with Aβ42 oligomers and then with the Ca2+ ionophore ionomycin. B, Fluorescence trace from the soma of cells previously loaded with the Ca2+-insensitive dye calcein upon the successive addition of ionomycin and Aβ42 oligomers. The inset images show representative fluorescence of a group of cells captured at the times marked on the trace (1,2,3,4). NB: The loss of intracellular calcein is accompanied by a rise in extracellular fluorescence (data not shown). C, formula of fluo-3. D, formula of calcein.
End of the exam.
EC50 of the oligomers if the indicator dye were saturated athigher concentrations.
Elevation of Cytosolic Free Ca2! from A!42 Oligomers In-volves Both Intra- and Extracellular Sources—To discriminatewhether the increase in cytosolic Ca2! concentration evoked byamyloid oligomers arises from influx of extracellular Ca2!
across the plasma membrane or from Ca2! liberated fromintracellular stores, we reduced the free extracellular Ca2!
concentration to very low levels by bathing cells for 20 min in aCa2!-free medium that included 5 mM Mg2! and 10 mM EGTA.Application of A!42 oligomers (6 "g/ml) then evoked only asmall, slowly rising fluorescence signal, which reached a peakamplitude of about 30% of that in Ca2!-containing medium(Fig. 5A). Thus, the large, immediate Ca2! increase induced byoligomers appears to result from influx of extracellular Ca2!,whereas the remaining small, slow component may arise fromintracellular Ca2! liberation.
To confirm the latter interpretation we then depleted theendoplasmic reticulum Ca2! stores of cells bathed in normal[Ca2!] medium by applying thapsigargin, a specific sarcoplas-mic/endoplasmic reticulum calcium ATPase pump inhibitor.Thapsigargin evoked a small rise in the Ca2! signal, consistentwith leakage of Ca2! from intracellular stores into the cytosol,but subsequent application of A!42 oligomers produced a large,rapid increase, similar to that observed in control cells withoutthapsigargin treatment (Fig. 5B).
We examined the possibility that amyloidogenic peptidesmay induce Ca2! influx via endogenous Ca2!-permeableplasma membrane ion channels (30, 31) by applying A!42oligomers (6 "g/ml) in the presence of 20 "M cobalt, a nonspe-cific Ca2! channel blocker (Fig. 5A). Fluorescence signals wereof almost identical amplitude in the presence (black trace) andabsence (gray trace) of cobalt, suggesting that Ca2! entrythrough cobalt-sensitive plasma membrane channels does notcontribute significantly to the oligomer-induced rise in cytosolic[Ca2!]. Similarly, the #-amino-3-hydroxy-5-methylisoxazole-4-
propionic acid receptor antagonist, 6-cyano-7-nitroquinoxaline-2,3-dione (40 "M), failed to block Ca2! entry (22); the meanfluorescence signal evoked by A!42 oligomers (6 "g/ml) in thepresence of CNQX ("F/F # 1.80 ! 0.24, S.E., n # 32) wassimilar to that in parallel control experiments ("F/F # 1.70 !0.27, n # 47).
Decay of the Oligomer-induced Fluorescence Signal Is Due toDye Leakage—As evident in Figs. 2–5, high concentrations ofA!42 consistently evoked a transient fluorescence signal thatdecayed over tens of seconds or a few minutes even in thecontinued presence of amyloid oligomers. The experiments il-lustrated in Fig. 6 indicate that this decay does not reflect a fallin cytosolic free [Ca2!] but rather that A!42 induces a generalincrease in membrane permeability, thereby allowing leakageof dye into the extracellular medium.
First, ionomycin failed to induce any rise in fluorescencewhen applied late in the decay phase of a response to A!42oligomers (Fig. 6A). Second, A!42 oligomers evoked an almostcomplete loss of fluorescence from cells loaded with the Ca2!-and pH-insensitive dye calcein (Fig. 6B). Finally, measure-ments of fluorescence in the extracellular fluid adjacent tocalcein-loaded cells showed a transient rise synchronous withthe abrupt drop in intracellular fluorescence evoked by oli-gomers (Fig. 6C). Fluo-3 fluorescence also appears in the me-dium coincident with its loss from the cells (data not shown).Interestingly, ionomycin caused no change in fluorescence ofintracellular calcein (Fig. 6B), indicating that the increase indye permeability induced by A!42 oligomers results from adirect action on the cell membrane and is not secondary to arise in intracellular [Ca2!].
The effect of A!42 to induce a leakage of anionic dyes wasshared by other soluble oligomers. Loss of fluo-3 fluorescencelike that illustrated in Fig. 6A was consistently observed withequivalent concentrations of prion peptide (n # 51 cells), IAPP(n # 69), polyglutamine (n # 44), and lysozyme (n # 102).
FIG. 5. A!42 oligomer-induced rise in cytosolic [Ca2"] involves Ca2" ions from both extracellular and intracellular sources. A, Ca2!
signals were reduced, but not abolished, when A!42 oligomers (6 "g/ml) were applied to cells bathed in Ca2!-free medium. The trace shows themean fluorescence ($1 S.E.) from 31 cells. B, depletion of endoplasmic reticulum Ca2! stores does not abolish oligomer-induced Ca2! signals in cellsbathed in normal (1.8 mM Ca2!) medium. Following pretreatment with 5 "M thapsigargin, a specific blocker of sarcoplasmic/endoplasmic reticulumcalcium ATPase Ca2! pumps, applications of 6 "g/ml A!42 oligomers induced a large, rapid rise in fluorescence with an amplitude ("F/F # 0.7)similar to that obtained in the absence of thapsigargin ("F/F # 0.5). Trace shows mean $ 1 S.E. of results in 38 cells. C, Ca2! signals evoked byA!42 oligomers are not reduced by cobalt, a nonspecific Ca2! channel blocker. Cells were pretreated with 20 "M cobalt for 10 min. Subsequentapplication of 6 "g/ml of A!42 oligomers evoked a mean Ca2!-dependent fluorescence signal (black trace) of similar amplitude and kinetics to thatin the absence of cobalt (gray trace). Data with cobalt were obtained from 27 cells. Control data (gray trace) are reproduced from Fig. 3A, trace c.
Membrane Permeabilization by Soluble Amyloid Oligomers17298
at WA
LAEU
S LIBR
AR
Y on February 16, 2015
http://ww
w.jbc.org/
Dow
nloaded from

MAL 2014-2015 “Chemistry” Master program Leiden University
1/3
Metals and life re-take exam - answers Datum: February 18th, 2015
Tijd: 2-5 pm Zaal: HB218
Docent: Dr. Sylvestre Bonnet Part A.
1) It is a 3MLCT, ie a triplet Metal-to-Ligand-Charge Transfer state. 2) Long (microsecond) lifetime as it is a triplet, and triplet-to-singlet transformations such as
phosphorescence emission are spin-forbidden. Please note that this photophysical lifetime has nothing to do with biological half-time of a drug, which is usually in the minute to hours or even days regime and represent the time necessary for a body to get rid of an medicinal compound.
3) The 3MLCT can be quenched by the triplet ground state of the dioxygen molecule, 3O2, to give the ground state Ru complex and the first excited state of dioxygen, also called singlet oxygen 1O2. This phenomenon is called triplet-triplet annihilation, or dioxygen sensitization.
4) Five amongst: singlet oxygen 1O2, superoxide O2●−, hydrogenoperoxide H2O2,
hydroperoxide HO2−, peroxide O2
2−, hydroxyl radical HO●. 5) [Ru(bpy)2(MeCN)2]2+ + OH2 → [Ru(bpy)2(MeCN)(OH2)]2+ + MeCN
[Ru(bpy)2(MeCN)(OH2)]2+ + OH2 → [Ru(bpy)2(OH2)2]2+ + MeCN 6) Because the bidentate ligand bpy creates a stronger ligand field in the complex than two
monodentate acetonitrile ligands. The eg-to-t2g energy difference is much larger in [Ru(bpy)3]2+ than in [Ru(bpy)2(MeCN)2]2+ , so that in the first one the 3MLCT state is far from the 3MC state and cannot do anything else than emit a photon (phosphorescence). In the latter the 3MC state is low in energy and can be thermally promoted the photochemically generated 3MLCT state. The 3MC state being dissociative it leads to ligand substitution.
7) As the donating properties do not change the eg-to-t2g energy difference mostly remains the same and the orbital scheme is
8) No, because we don’t populate an antibonding orbital corresponding to a coordination bond.
The π* orbitals are antibonding for the aromatic ligands, but there would be too many bonds to break to destroy the aromatic ligand by such a process. The 3π-π* excited state based on the dppn ligand is long-lived and has time enough to react with oxygen to form 1O2.
9)

MAL 2014-2015 “Chemistry” Master program Leiden University
2/3
10) The 3LF state (ligand field state, also called Metal-centered or 3MC state), as an electron is put into anti-bonding orbitals involving the coordination bond.
11) The underlying idea is that the acetonitrile complex 3 cannot bind to biomolecules because its coordination sphere is saturated. Upon irradiation, acetonitrile is substituted by water, and the bis-aqua complex is able to bind to DNA, proteins, or other biomolecules, thus provoking toxicity and ultimately cell death.
12) For the first compounds the photosubstitution mechanism does not depend on the presence of oxygen (it will even be more efficient in absence of O2), whereas PDT requires O2 to be present at the place of irradiation to be effective. Another possible answer was: in PDT the photosensitizer acts in a catalytic manner (thus is regenerated after making one singlet oxygen), whether photosubstitution compounds are metabolized and act in a stoichiometric manner.
13) Compound of the first type (becoming toxic by photosubstituting ligands) will work in hypoxic tissues, whereas compounds for PDT only work in presence of loxygen, thus in normoxic tissues. This is relevant for cancer treatment because many tumor tissues are hypoxic because of the low blood supply and high metabolic activity.
14) Compounds 1 and 4 belong to PDT agents. Compound 2 belongs to the “photosubstitution” category. Compound 3 belongs to both categories.
15) No, as the PI is one, ie, the toxicity in the dark and after irradiation is identical. Considering the similar photoreactivity of 2 and 3, we may use the low phototoxicity of 2 to say that compound 3 essentially works due to its photodynamic effect only if the localization of the two drugs is similar (eg, they both go to the same place in the cell).
16) We would need to grow cancer cells in hypoxic conditions and measure whether the phototoxicity of compound 3 is oxygen-dependent or oxygen-independent.
17) Because all three compounds do not absorb light with the same intensity. In given irradiation conditions the PI will depend on how many excited states are produced per unit time, thus on how well the compound absorbs light (ie, on epsilon). Dividing PI by RA allows taking this into account in the comparison.
18) They all absorb in the blue-to-green region which is not in the PDT window. Two strategies to solve this issue: decrease 1MLCT energy by using pi-donating ligands (ie, modifying the compounds), or sing upconverting drug delivery systems that produce blue photons locally upon irradiation in the PDT window.
Part B.
19) It fuels the import by ion transporters of many necessary substances, for example glucose is imported by the Na+/glucose transporter. The Na+ gradient is maintained by active and simultaneous export of Na+ and import of K+ done by the Na+/K+ ATPase membrane proteins.
20) Five amongst the following list: charge, ionic radius, orbital filling, spin state, electronegativity, hardness/softness, oxidation state, ligand exchange kinetics.
21) Ionic radii and electronegativity are almost identical. D is aspartic acid, its pKa is 3.71 vs. 4.15 for glutamic acid, and no acidity form serine or methionine. As seen in Figure 5 it is the charge of the ions that seems to make the difference: putting more negatively charged amino acids in the selectivity filter increases binding of the most charged cation, thus Ca2+.
22) The time derivative of the number of ions passing through an area A of a membrane of permeability P is proportional to the concentration difference on both sides of the membrane, and to the area. Thus dN/dt=P×A×([ion]out-[ion]in). The dimension of P is distance/time, it is usually given in cm.s-1.
23) Note that the Y-scale in figure 6a is logarithmic, so saying that PCa/PNa was hardly changing when going from 175TLDDWSD181 to 175TLEDWSD181 was not sufficient. PCa/PNa clearly goes down from a factor 5 or 6! From the crystal structures shown in Figure 6 changing D to

MAL 2014-2015 “Chemistry” Master program Leiden University
3/3
E, ie adding a carbon, changes the orientation of the carboxylate and puts them in a less favorable orientation to interact electrostatically with Ca2+. Another possible answer was that the pKa of D is lower than that of E, thus aspartic acid is more prone to deprotonation and will give a higher negative charge than glutamic acid, which also increases binding to Ca2+. In 175TLESWSM181 two carboxylate residues (D178 and D181) are changed into neutral serine and methionine residues, thus reducing drastically electrostatic interactions and thus binding of Ca2+. Indeed in this case the change in selectivity is more important.
24) Free calcium means calcium that is loosely bound to biological ligands – compared to the exogenous ligands the researchers are working with. Saying that free Ca2+ are Ca2+ ions not bound is only partially valid – there are so many ligands in a cell that metal ions are always somewhat interacting with someone.
25) An ionophore is a lipid-soluble molecule (NOT NECESSARILY a protein! It can be a small molecule, too) usually synthesized by microorganisms to transport ions across the lipid bilayer of cell membranes. When you are asked WHAT something is, do not only answer how it works!
26) The increase in fluo-3 emission inside the cell is the largest with the oligomeric form, and negligible with the monomeric or fibril form of the peptide. It is thus the oligomeric form that seems to disturb most the intracellular Ca2+ level.
27) When the pump cease to work because of the inhibitor the Ca2+ stores, including the ER, cease to concentrate Ca2+ in the lumen and thus will leak a bit of Ca2+ in the cytosol, which is observed by increase fluorescence from fluo-3.
28) The large, immediate Ca2+ increase induced by oligomers appears to result from influx of
extracellular Ca2+, whereas the remaining small, slow component may arise from intracellular Ca2+ liberation.
29) No, as Co2+ ions which inhibit these channels do not lower Ca2+ influx. 30) No: both dyes are large polyanionic compounds, whereas calcium ions are small positive
things. They can most probably not be taken up by the same channel. NB: even if the molecules are shown to you in the protonated form you should know that carboxylic acids have a pKa around 4.8 and are deprotonated at neutral pH!!!
31) A: Aβ42 let quickly Ca2+ get in, flowed by general leaking of Ca2+ and fluo-3 from the cell. Adding ionomycin does not further allow more Ca2+ transport into the cell. B: The membrane leaks out large negative ions such as calcein irrespective of whether there is Ca2+ or not, thus the membrane must become somewhat porous. NB: When you are asked to interpret, describing what you see is not enough.
32) As Ca2+ comes in, calcein comes out, then the membrane must be leaking seriously. The hypothesis would be that the Aβ42 oligomers create pores in the membrane! Membrane integrity is essential to cells and in particular to neuron function, thus it would certainly explain toxicity of oligomers.