Embed Size (px)
Citation preview

magnetic anomaly number
age (Ma) from geomagnetic reversal chronology extrapolated in South Atlantic assuming constant rate of spreading
pale
onto
logi
cal a
geSeafloor ages from deep sea drilling versus geomagnetic reversal chronology
data for Atlantic ocean; similar data from older oceans permit reversal chronology to be calibrated back to 180 Ma

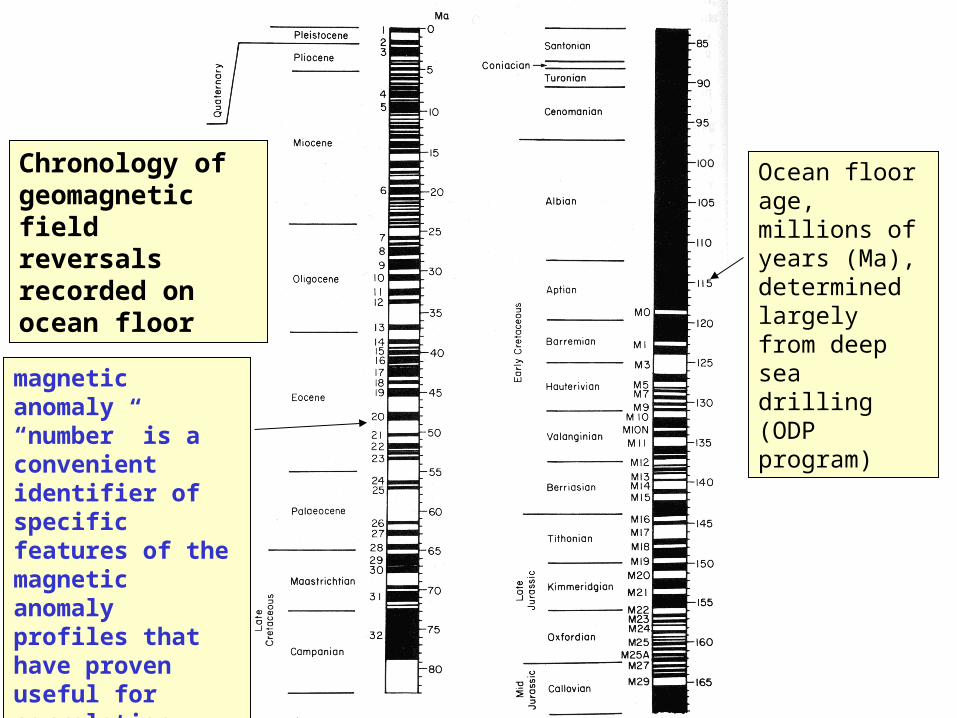
Chronology of geomagnetic field reversals recorded on ocean floor
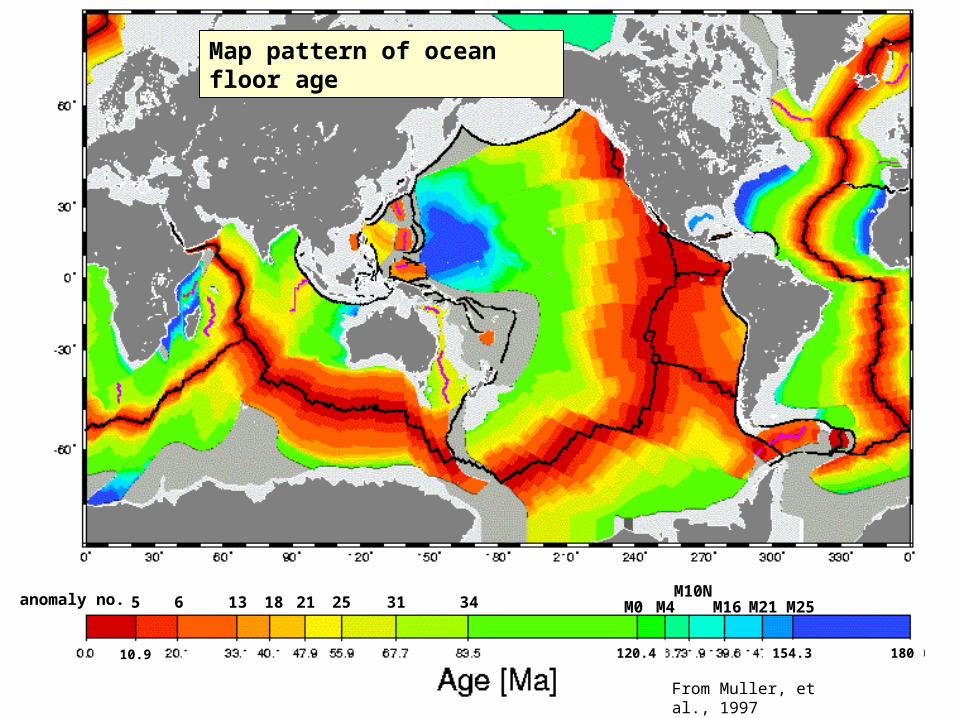
Ocean floor age, millions of years (Ma), determined largely from deep sea drilling (ODP program)
Chronology of geomagnetic field reversals recorded on ocean floor
magnetic anomaly “number” is a convenient identifier of specific features of the magnetic anomaly profiles that have proven useful for correlation between different profiles.
Ocean floor age, millions of years (Ma), determined largely from deep sea drilling (ODP program)
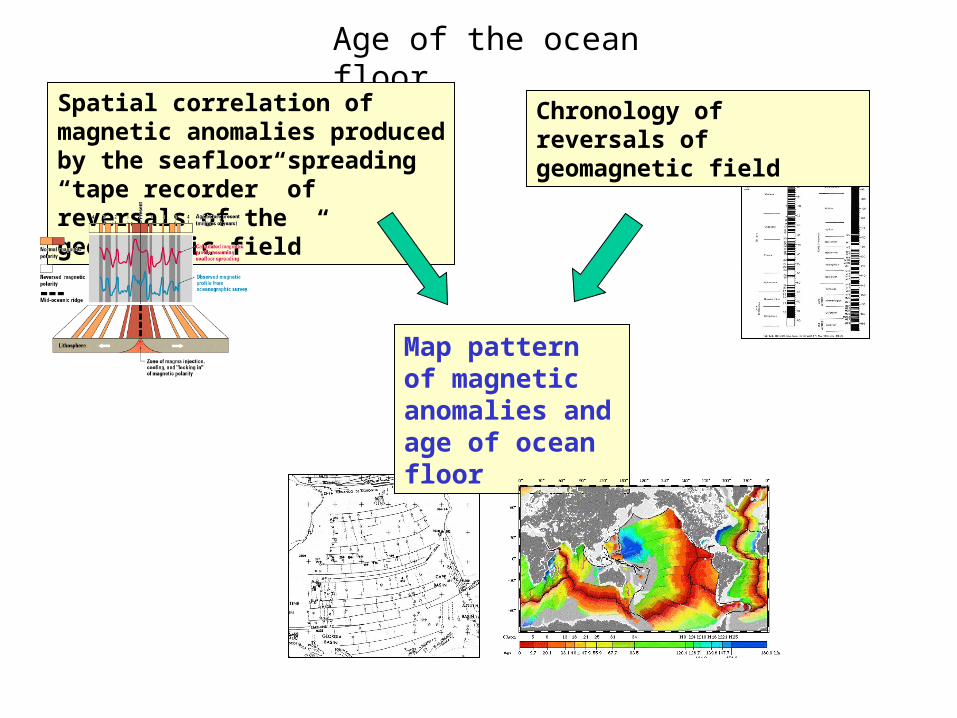
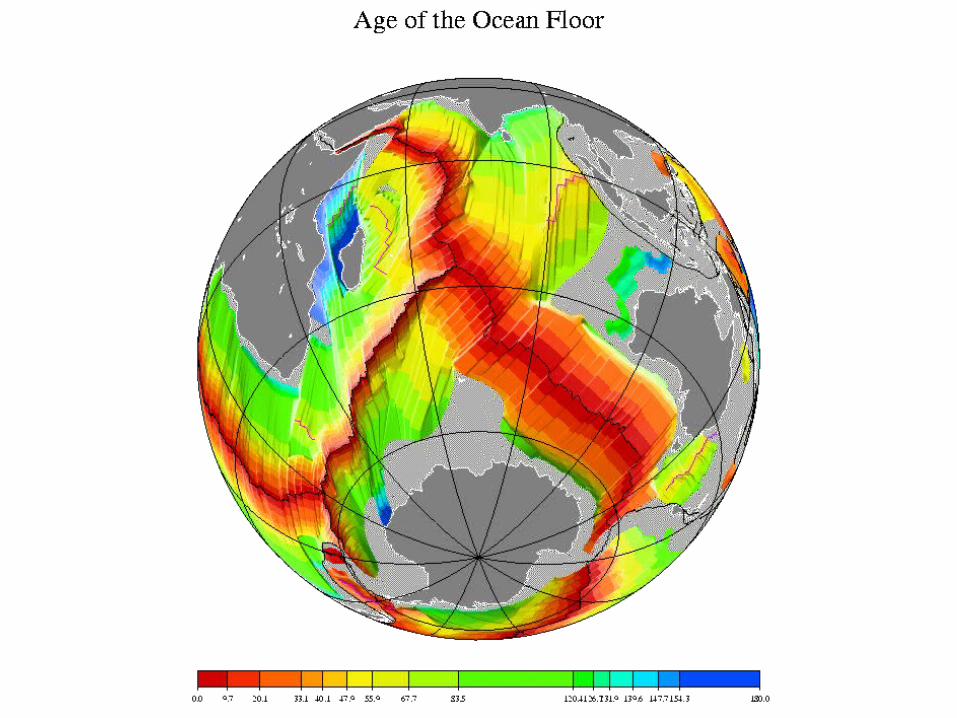
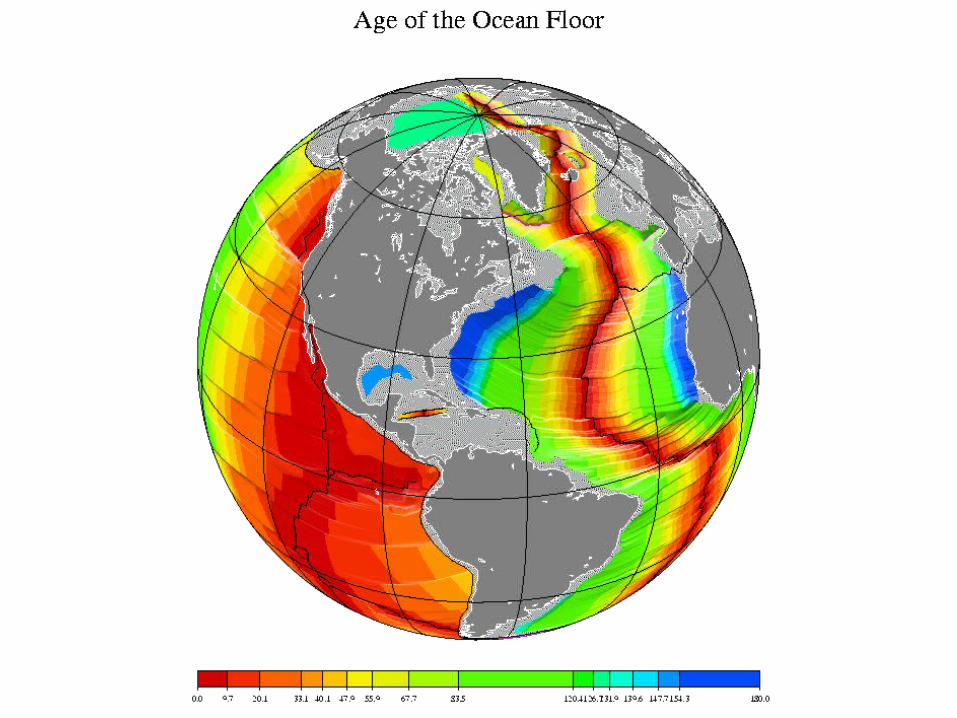
Age of the ocean floor
Spatial correlation of magnetic anomalies produced by the seafloor spreading “tape recorder” of reversals of the geomagnetic field”
Chronology of reversals of geomagnetic field
Map pattern of magnetic anomalies and age of ocean floor
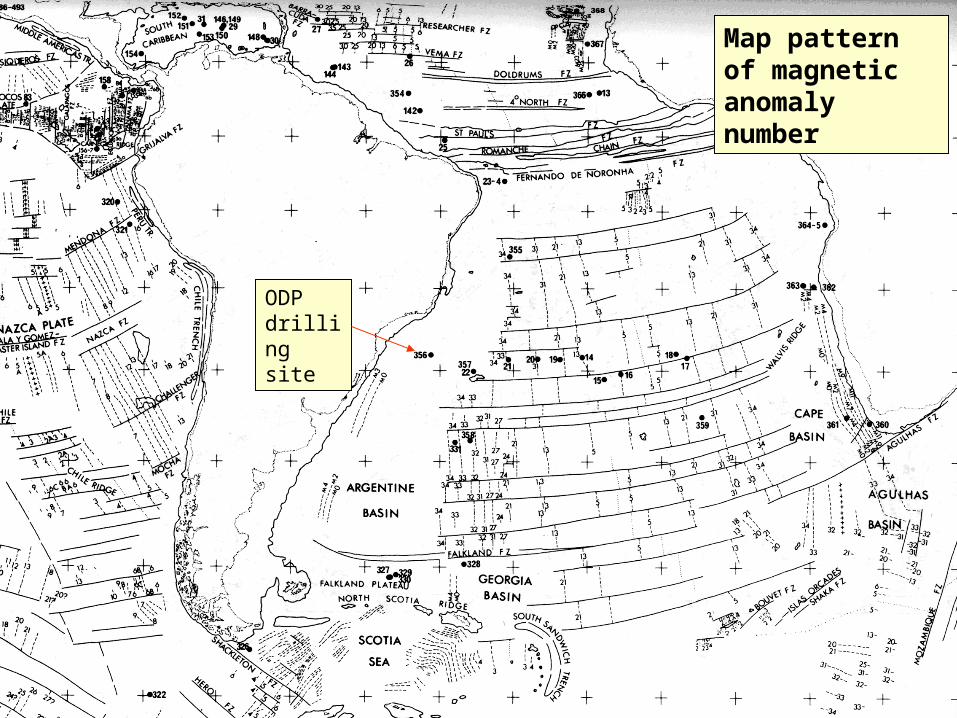
ODP drilling site
Map pattern of magnetic anomaly number
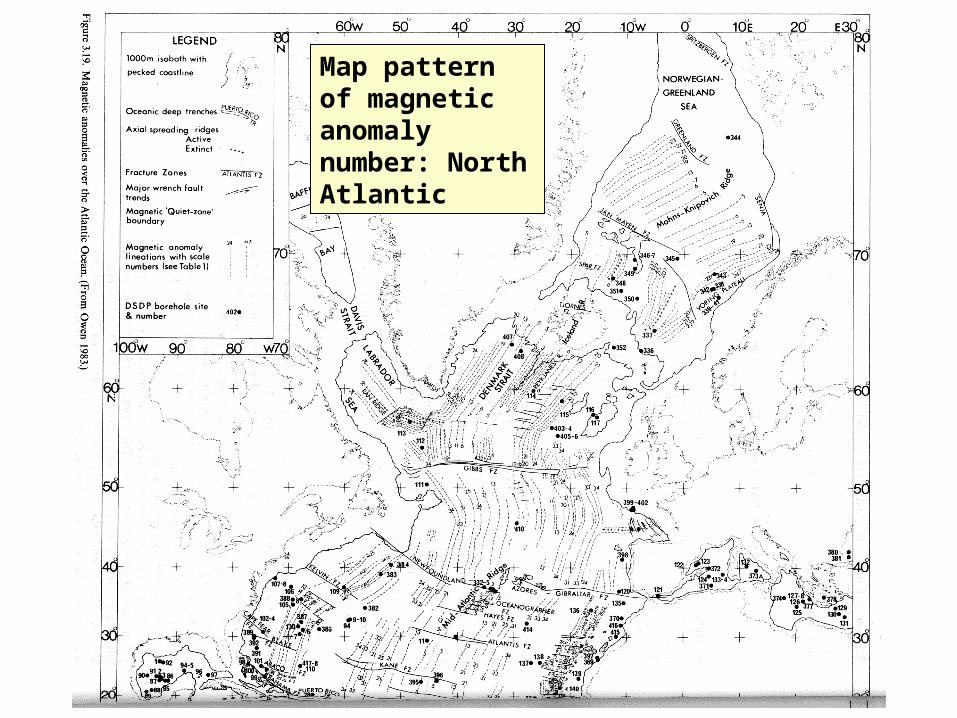
Map pattern of magnetic anomaly number: North Atlantic

5 6
10.9 120.4
anomaly no. 1813 25 31 3421 M16M10N
M4M0 M21 M25
154.3 180
From Muller, et al., 1997
Map pattern of ocean floor age

Continental rifting
continental shelf
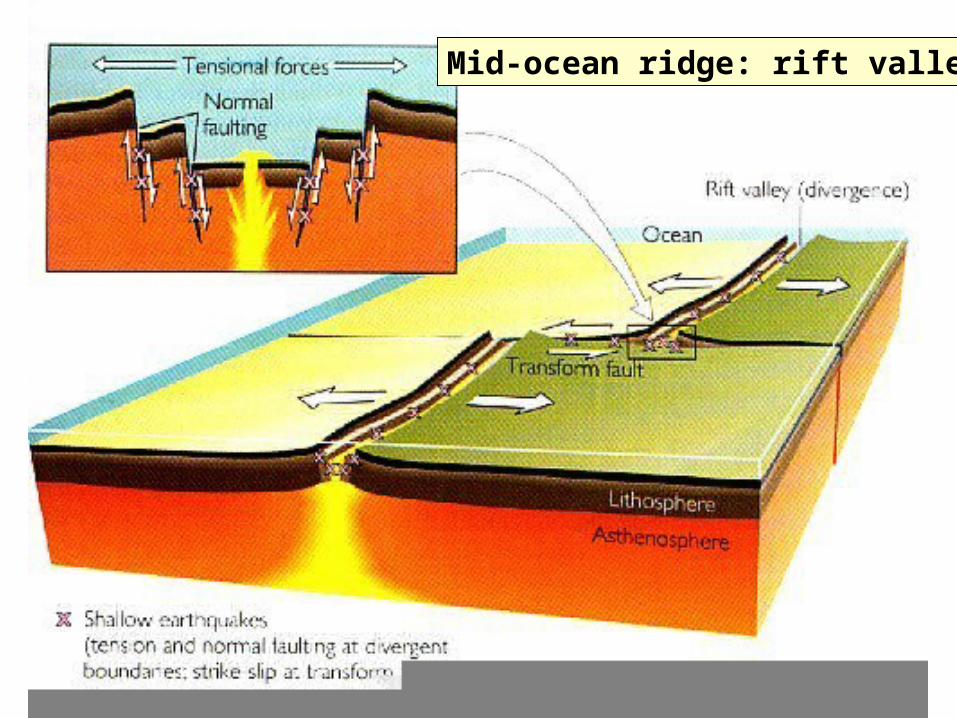
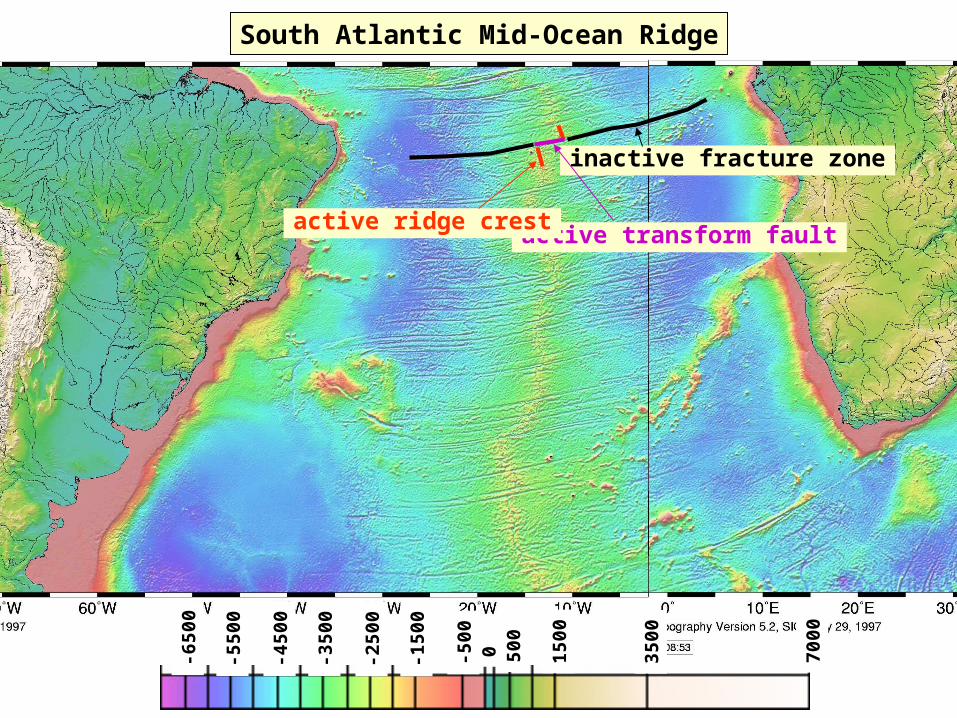
Mid-ocean ridge: rift valley

Fracture zones: transform faults
7000
3500
1500
-250
0
-150
0
-500
0 500
-550
0
-450
0
-350
0
-650
0
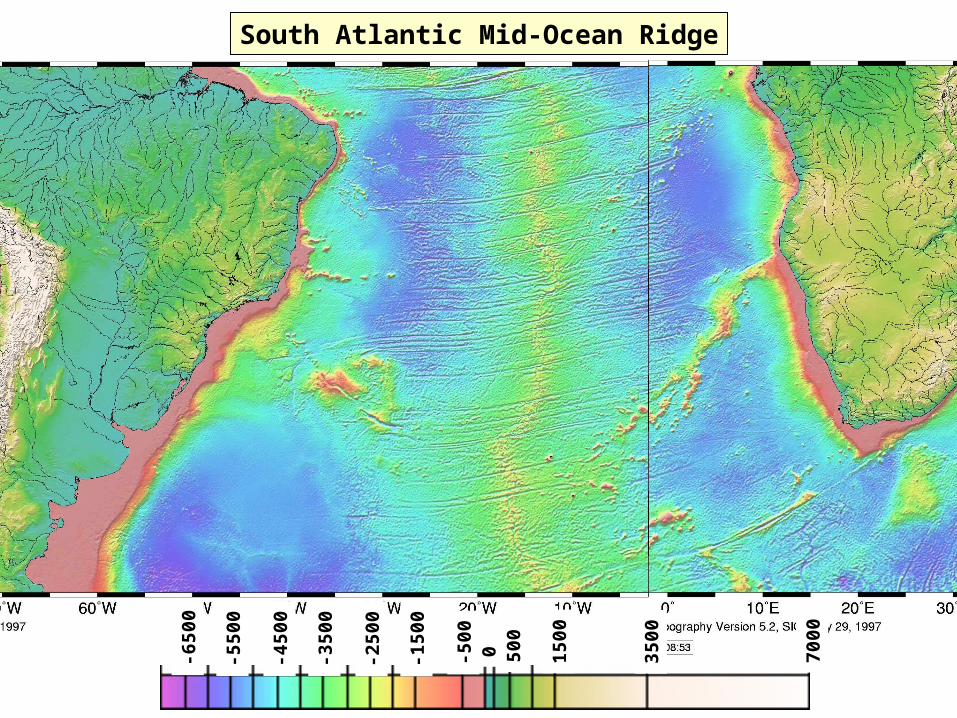
South Atlantic Mid-Ocean Ridge
7000
3500
1500
-250
0
-150
0
-500
0 500
-550
0
-450
0
-350
0
-650
0
South Atlantic Mid-Ocean Ridge
inactive fracture zone
active transform faultactive ridge crest
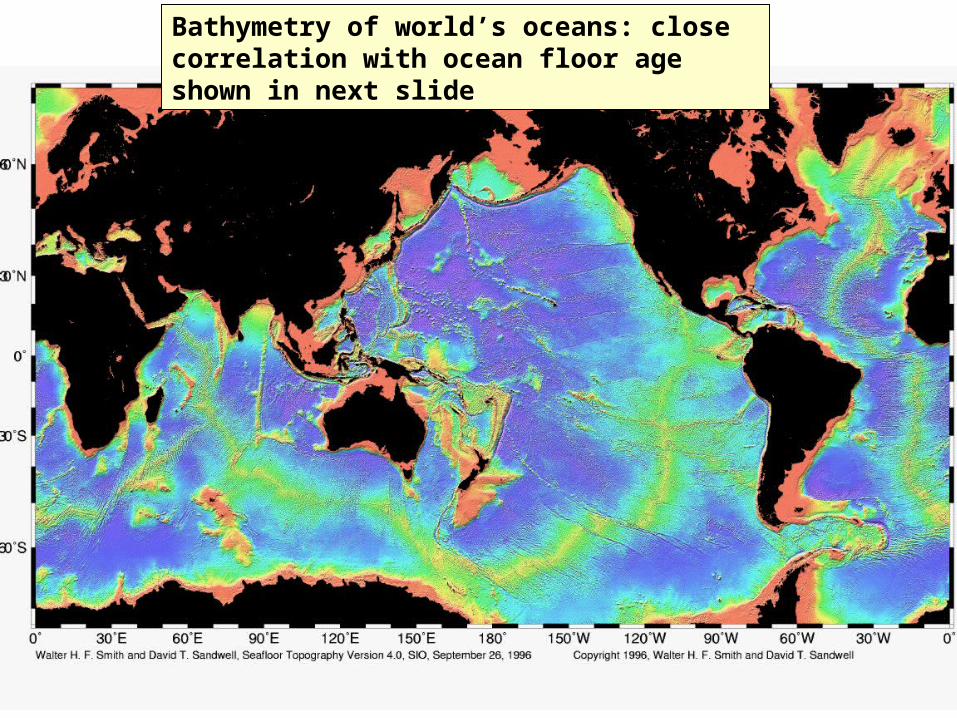
Global topography and bathymetry
Bathymetry of world’s oceans: close correlation with ocean floor age shown in next slide
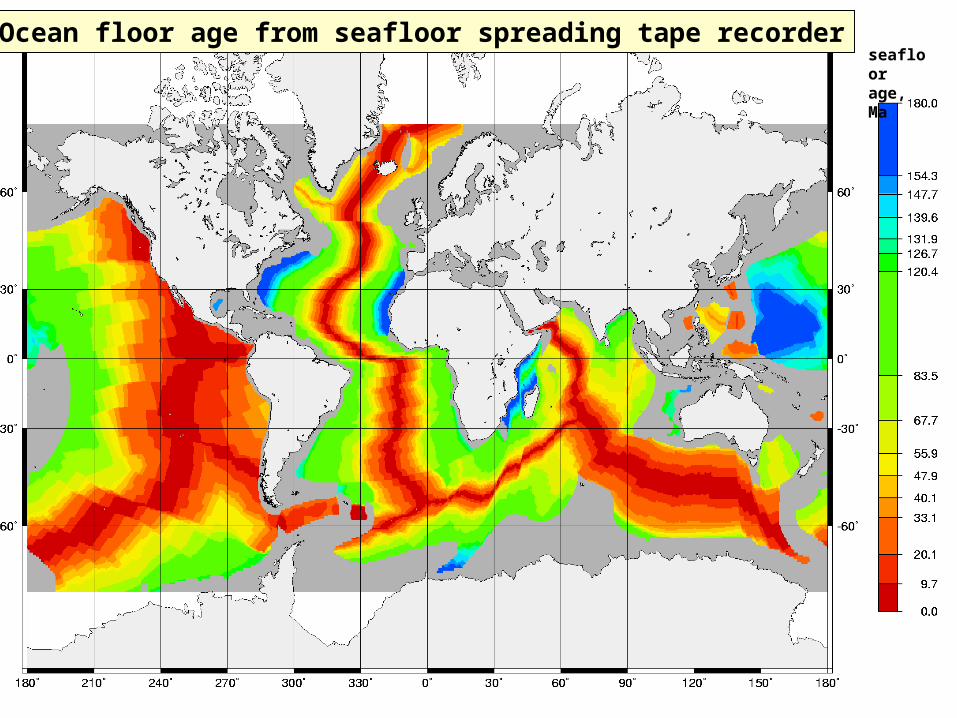
seafloor age, Ma
Ocean floor age from seafloor spreading tape recorder
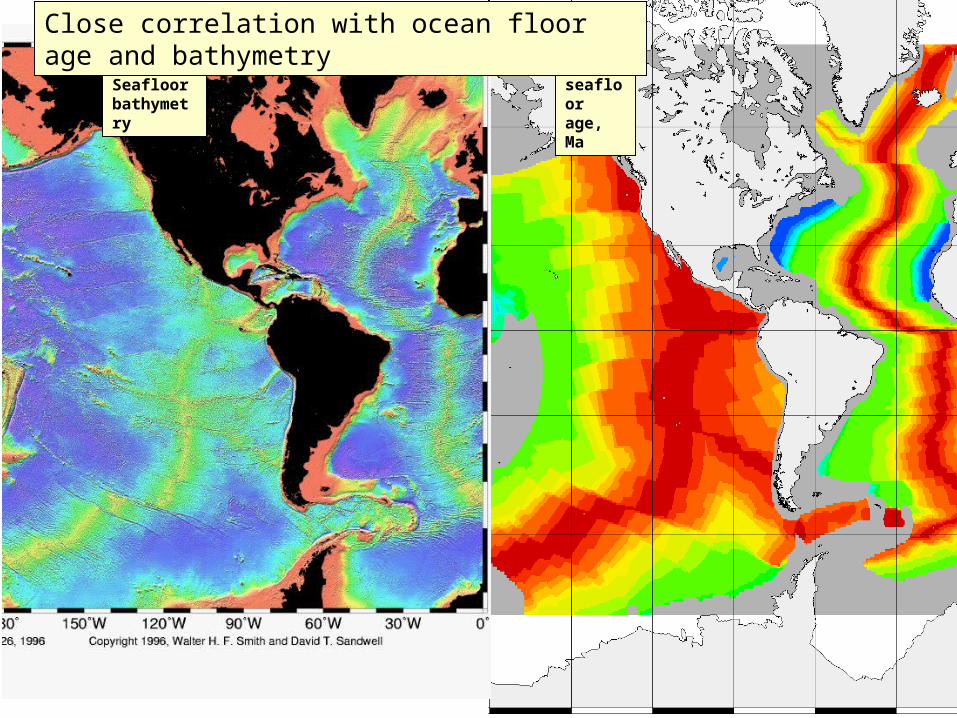
seafloor age, Ma
Seafloor bathymetry
Close correlation with ocean floor age and bathymetry
spreading ridge
heat flow by conduction
Heat flow by convection
heat flow by conduction
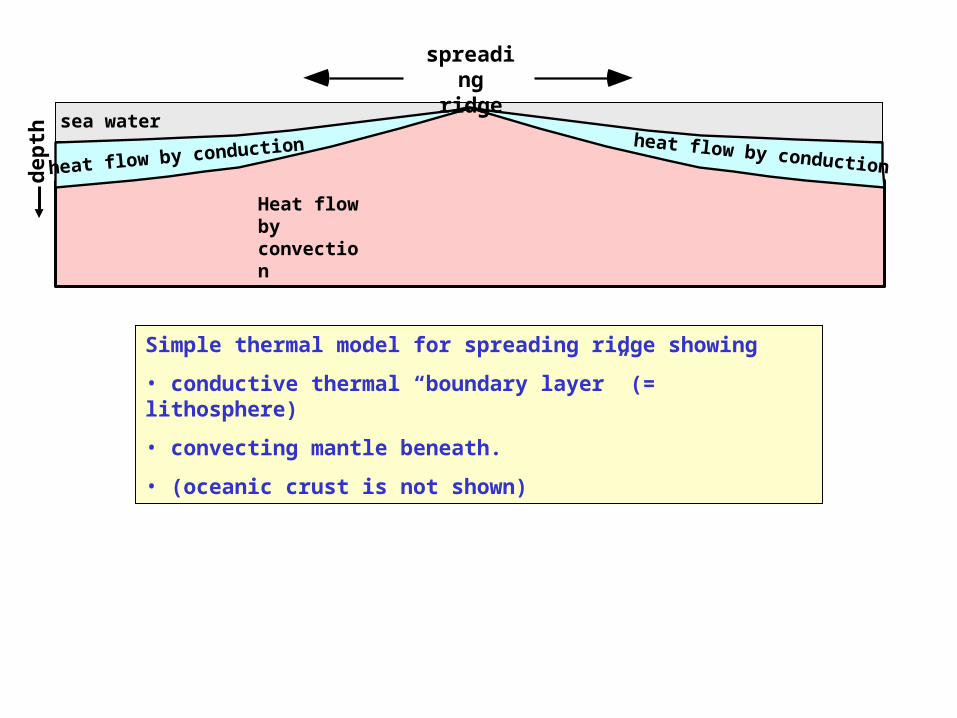
Simple thermal model for spreading ridge showing
• conductive thermal “boundary layer” (= lithosphere)
• convecting mantle beneath.
• (oceanic crust is not shown)
dep
th
sea water
temperature
spreading ridge
heat flow by conduction
Heat flow by convection
dep
th
heat flow by conduction
pro
file
A
profile A
dep
th
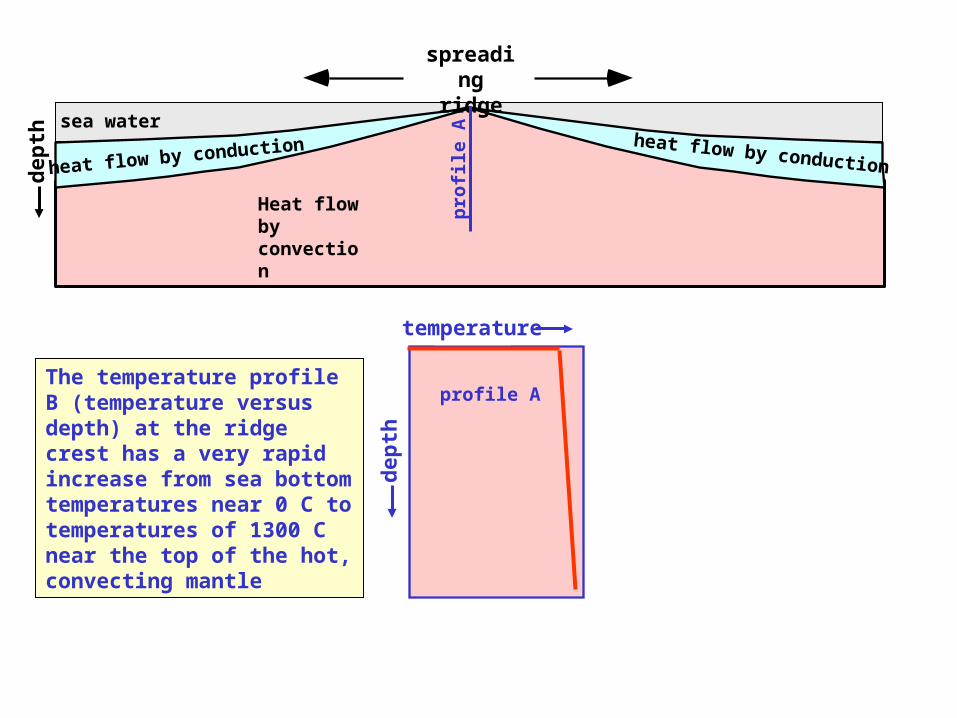
The temperature profile B (temperature versus depth) at the ridge crest has a very rapid increase from sea bottom temperatures near 0 C to temperatures of 1300 C near the top of the hot, convecting mantle
sea water
spreading ridge
heat flow by conduction
Heat flow by convection
temperature
dep
th
heat flow by conduction
pro
file
B
profile B
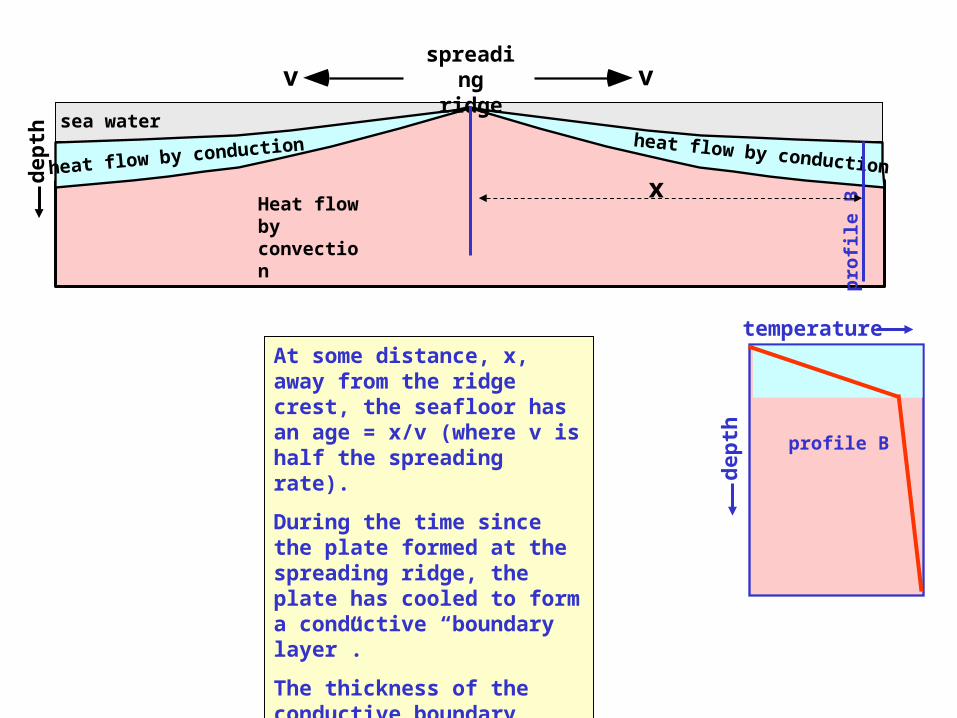
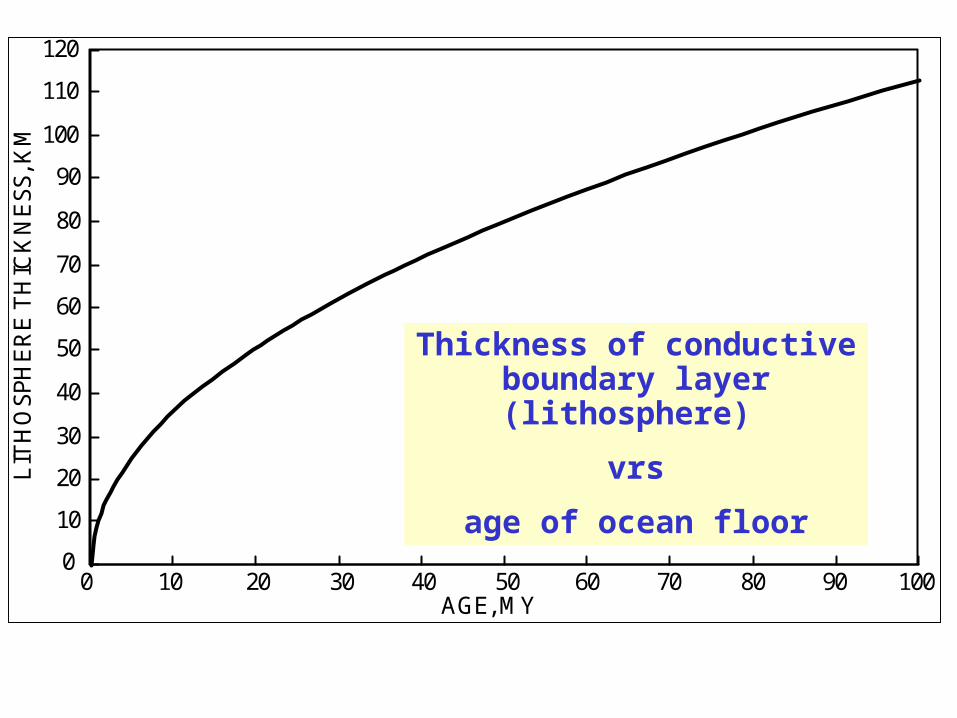
At some distance, x, away from the ridge crest, the seafloor has an age = x/v (where v is half the spreading rate).
During the time since the plate formed at the spreading ridge, the plate has cooled to form a conductive “boundary layer”.
The thickness of the conductive boundary layer increases with time.
dep
th
sea water
v v
x

temperature
spreading ridge
heat flow by conduction
Heat flow by convection
dep
th
temperature
dep
th
heat flow by conduction
pro
file
A
pro
file
B
profile A
profile B
dep
th
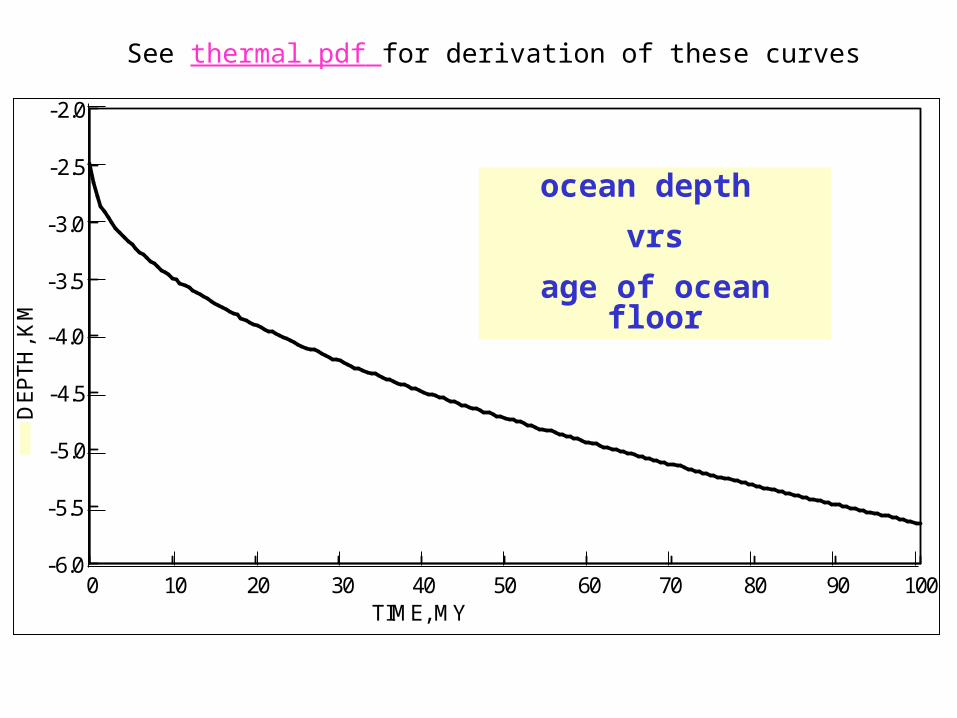
The decrease in temperature due to cooling of the plate as it moves away from the ridge crest leads to• thermal contraction and• consequent deepening of the ocean bottom.
Thus the depth of the ocean increases with the age of the sea floor.
sea water
0 10 20 30 40 50 60 70 80 90 100-6.0
-5.5
-5.0
-4.5
-4.0
-3.5
-3.0
-2.5
-2.0
TIME, MY
- D
EP
TH
, KM
OCEAN DEPTH VERSUS TIMEocean depth
vrs
age of ocean floor
See thermal.pdf for derivation of these curves
.
0 10 20 30 40 50 60 70 80 90 100
10
20
30
40
50
60
70
80
90
100
110
120L
ITH
OS
PH
ER
E T
HIC
KN
ES
S, K
M
AGE, MY
LITHOSPHERE THICKNESSVERSUS AGE
0
Thickness of conductive boundary layer (lithosphere)
vrs
age of ocean floor
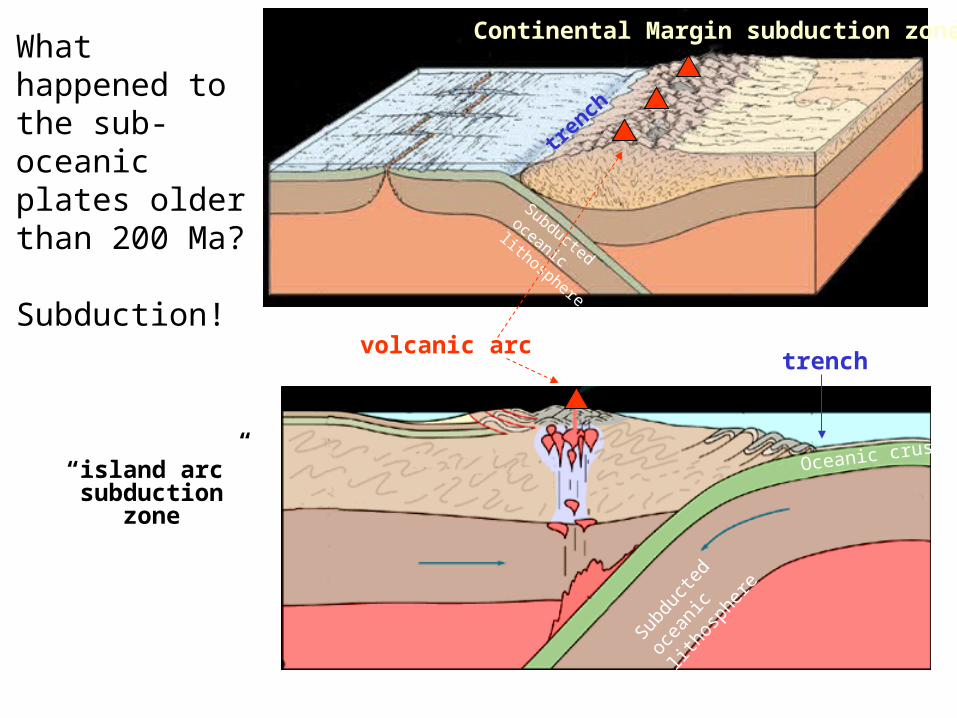
Subducted oceanic
lithosphere
Subdu
cted
ocea
nic
litho
sphe
re
Oceanic crust“island arc”
subduction zone
What happened to the sub-oceanic plates older than 200 Ma?
Subduction!
Continental Margin subduction zone
trench
trench
volcanic arc
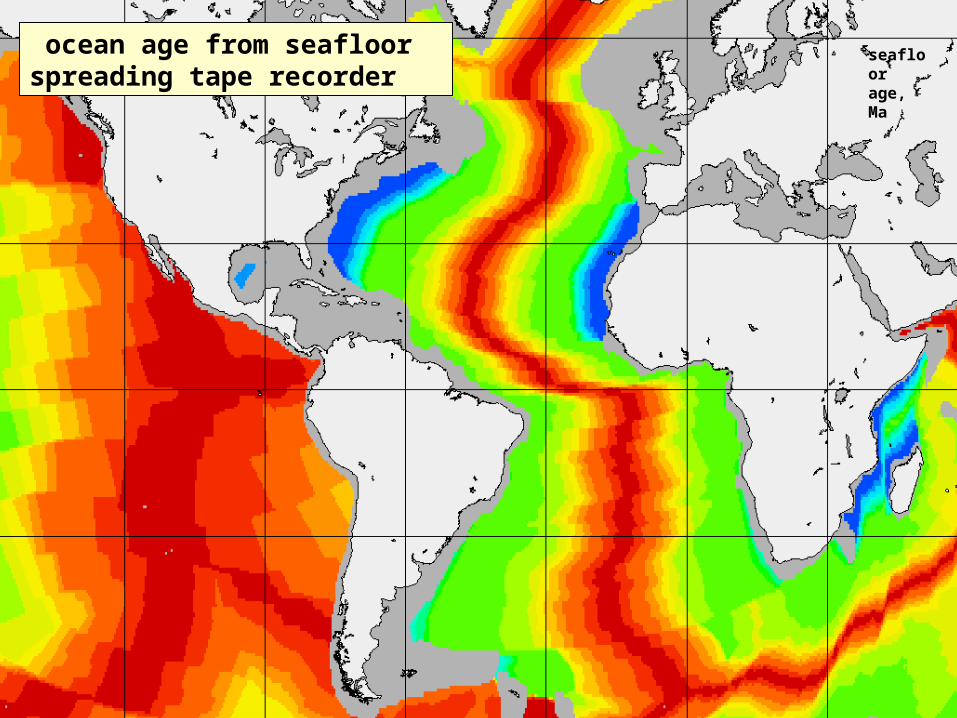
seafloor age, Ma
ocean age from seafloor spreading tape recorder
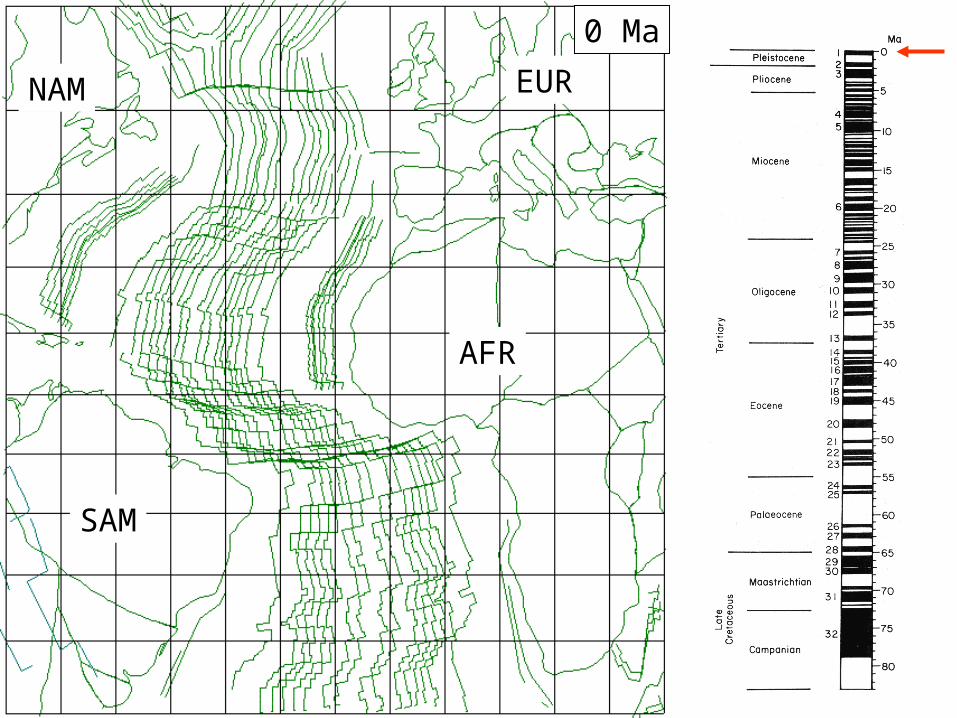
0 Ma
NAM
SAM
AFR
EUR
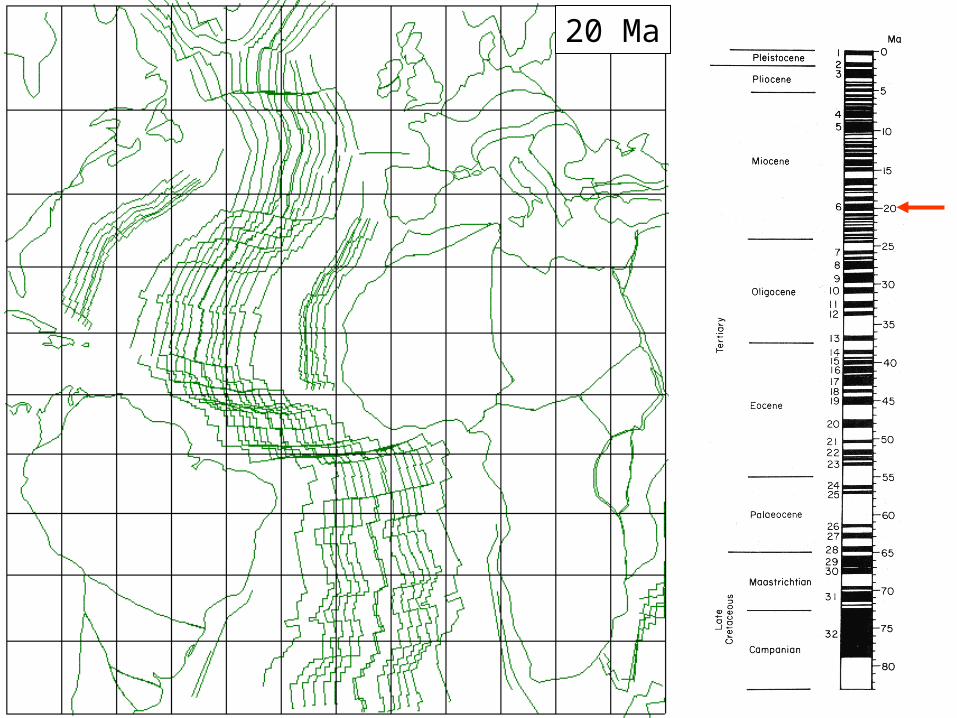
20 Ma

40 Ma

60 Ma
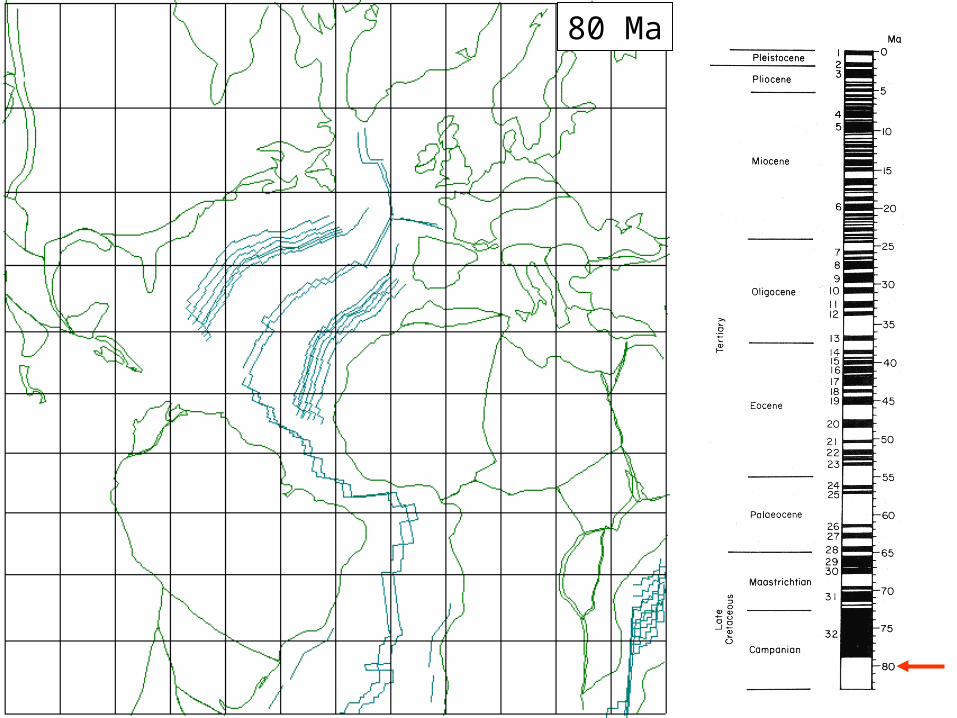
80 Ma

100 Ma
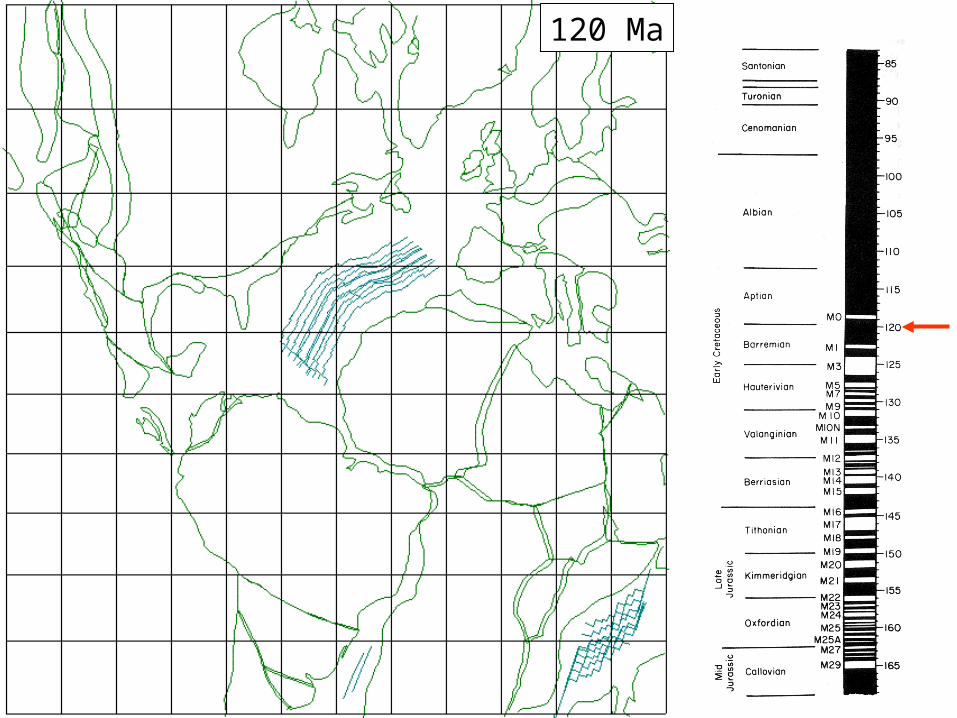
120 Ma
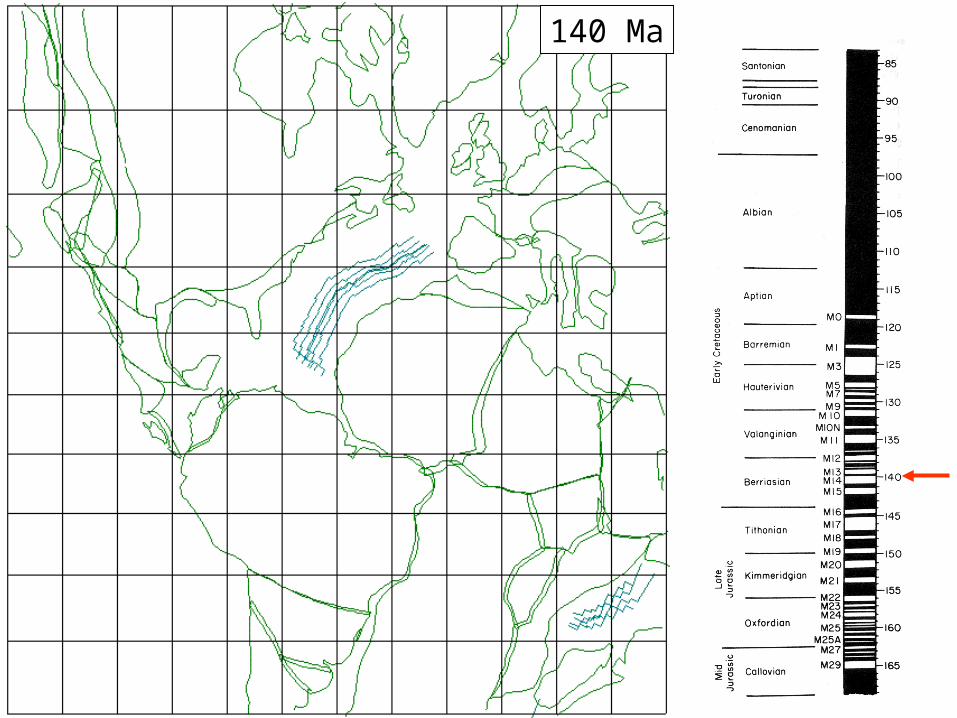
140 Ma
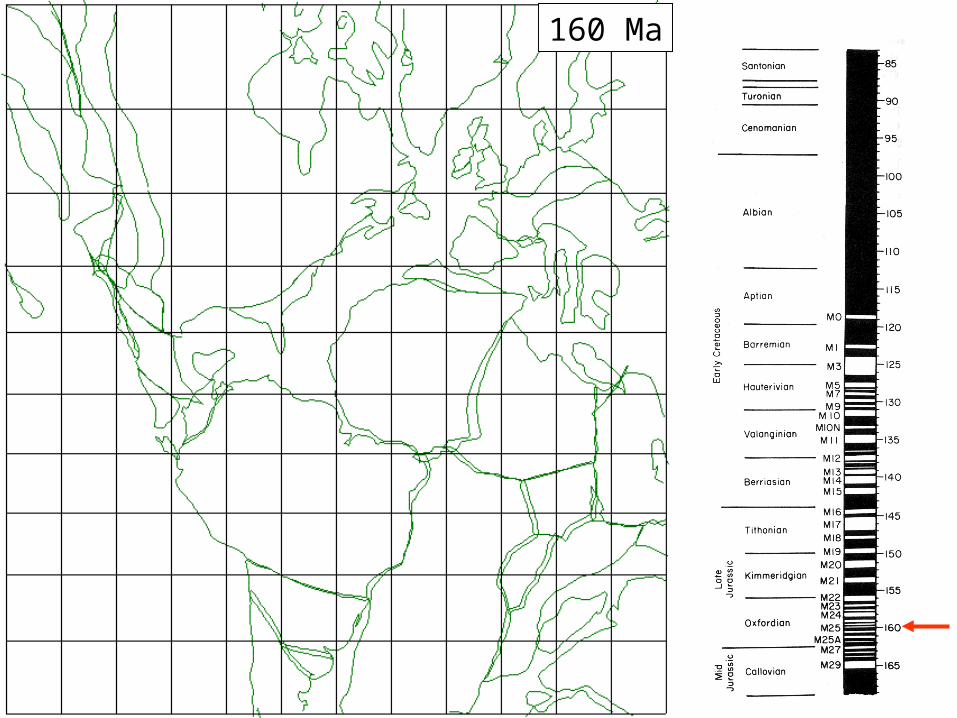
160 Ma
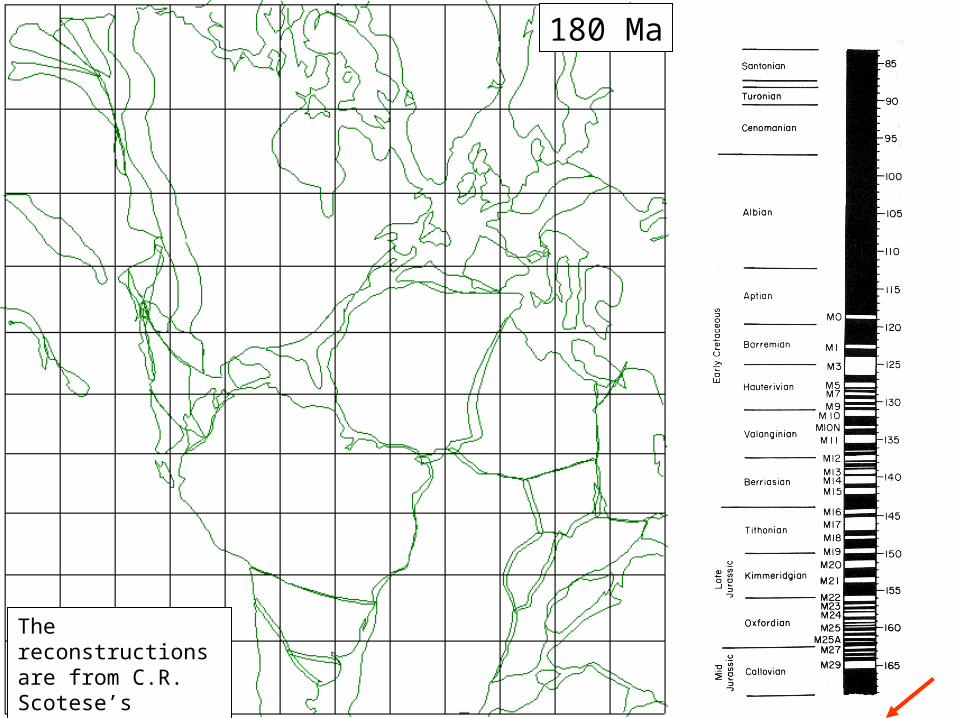
180 Ma
The reconstructions are from C.R. Scotese’s PALEOMAP Project
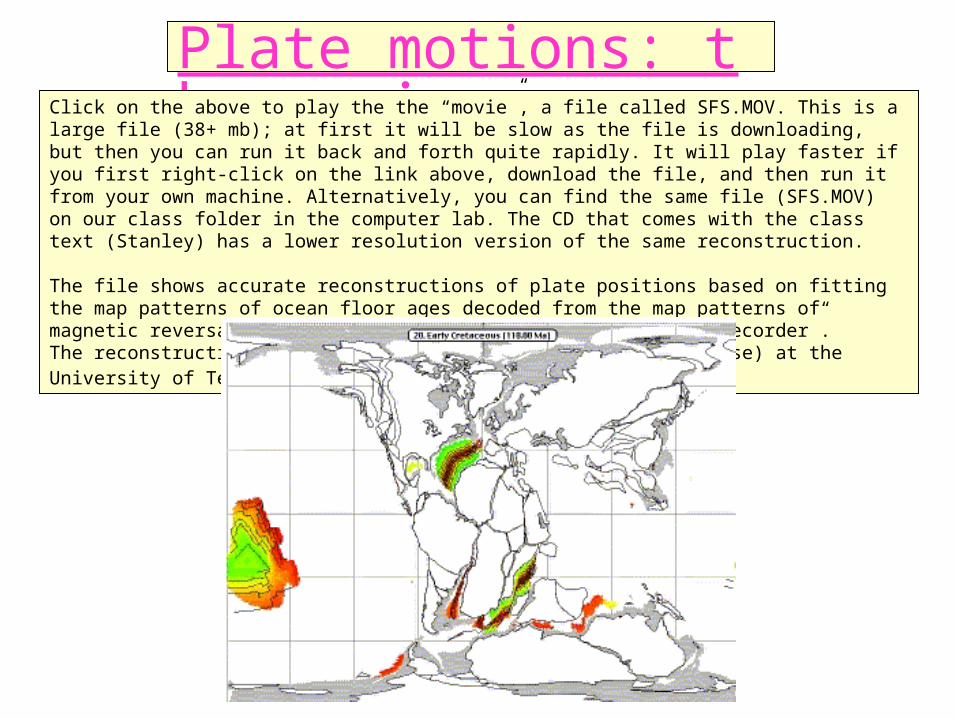
Plate motions: the movieClick on the above to play the the “movie”, a file called SFS.MOV. This is a large file (38+ mb); at first it will be slow as the file is downloading, but then you can run it back and forth quite rapidly. It will play faster if you first right-click on the link above, download the file, and then run it from your own machine. Alternatively, you can find the same file (SFS.MOV) on our class folder in the computer lab. The CD that comes with the class text (Stanley) has a lower resolution version of the same reconstruction.
The file shows accurate reconstructions of plate positions based on fitting the map patterns of ocean floor ages decoded from the map patterns of magnetic reversals recorded by the seafloor spreading “tape recorder”.The reconstructions are from the PALEOMAP Project (C.R. Scotese) at the University of Texas in Austin.