Embed Size (px)
DESCRIPTION
UAV Research Group report
Citation preview
Mace UAV Research Group
School of Life Sciences
Rain Forest Survey Using
Unmanned Aerial Vehicles (UAV)
Authors:
Bill Crowther – [email protected]
Khristopher Kabbabe – [email protected]
Gareth Roberts – [email protected]
Rain Forest Survey Using Unmanned Aerial Vehicles (UAV) [2012]
2 | P a g e
1. INTRODUCTION
1.1. MOTIVATION
Unmanned aerial vehicles are complex systems created to substitute the human in missions deemed
as dirty, dull or dangerous. With the current maturity of the technology and the high level of
demand, UAVs are finding their way into civilian applications: aerial photography, search and rescue,
among others. With this tendency due to increase academics are now interested in research
opportunities to develop innovative UAV solutions and applications.
1.2. MISSION
To assess the feasibility of creating a high resolution map of the surroundings of the
Timburicocha Research Station using Unmanned Aerial Vehicles (UAVs).
To assess the requirements for creating a map detailed enough to identify species of trees.
1.3. OBJECTIVES
This report aims to inform on the tasks carried out by the UAV Research Group on the Ecuador field
trip, on the lessons learn along the way and to reflect on the next step.
To achieve these objectives this report will review:
The operating conditions in the rain forest.
The missions flown and the results obtained.
The lessons learned and the way forward.
As a secondary objective this report also aims to analyse the current technology used obtain and
post process the orthophotographs obtained and to reflect on the camera settings needed for
orthophotography. These will be based on the experience gained.
1.4. APPLICATIONS FOR AERIAL PHOTOGRAPHY IN THE BIOLOGY FIELD
1.4.1. MAPPING
Perhaps the most obvious and exploited use of aerial photography, the images could be used to
create a detailed map of the region to a much higher resolution to that offer by Google Earth. It can
be used to map the river, walking routes, road planning and further development of the areas
surrounding the research station.
1.4.2. SPECIES CENSUS
With the aid of image recognition software, it would be possible to create a census of the flora found
in the forest. By training the software of the different families of trees it would be possible to tell
how much of an area is covered by what plant. It could also be used to create a census of the fauna
found on top of the canopy.
1.4.3. DEFORESTATION MONITORING
Suggested by one of the students in the field trip, UAVs could be used to research on the effects that
deforestation have in the change of biodiversity in the region.
Rain Forest Survey Using Unmanned Aerial Vehicles (UAV) [2012]
3 | P a g e
2. THEATRE OF OPERATION
2.1. Location
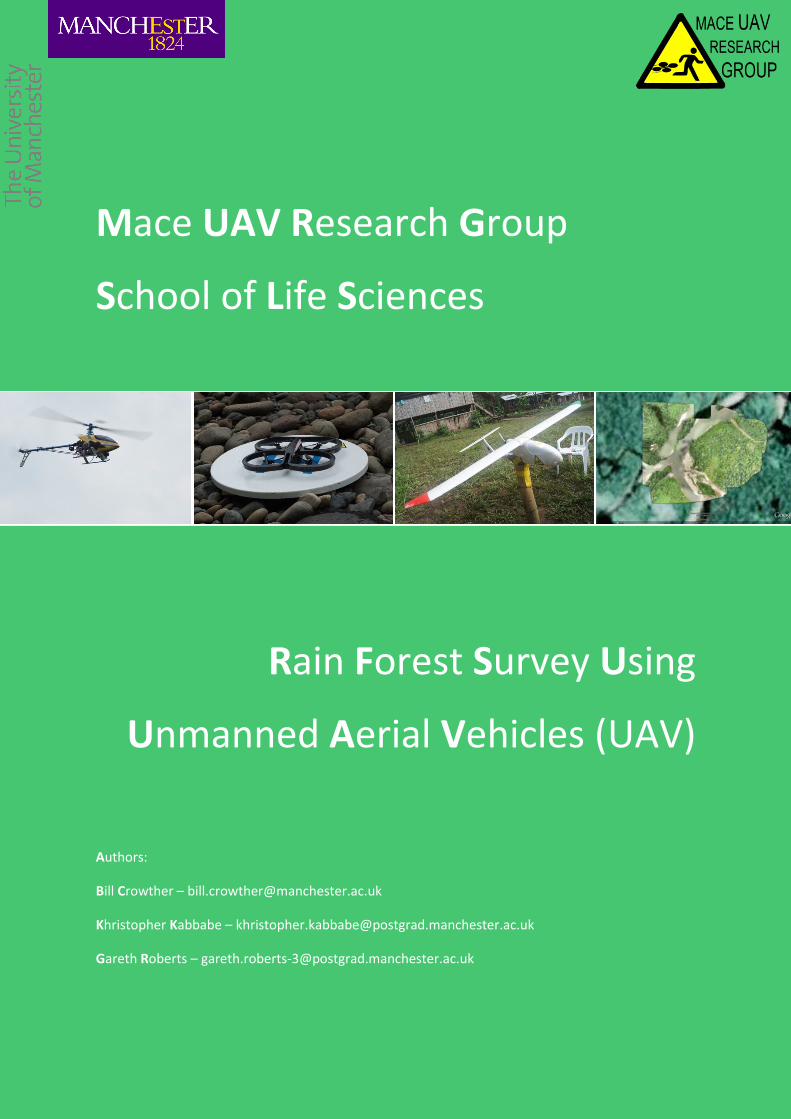
The Timburicocha research station is located S: 0.483281 W: 77.284390 2km north of the San Jose
de Payamino community and 141km east of Quito. The station is 292m above sea level. Its weather
is the typical rain forest weather. Figure 1, below, shows the Timburicocha Research Station.
Figure 1: Timburicocha Research Station
2.2. TAKE-OFF AND LANDING CHALLENGES
The area is clear from buildings and is relatively inhabited (ideal conditions for UAV flying), rough
terrain and tall buildings where the primary concern when operating UAVs. To operate the aircraft,
part of the research station had to be prepared.
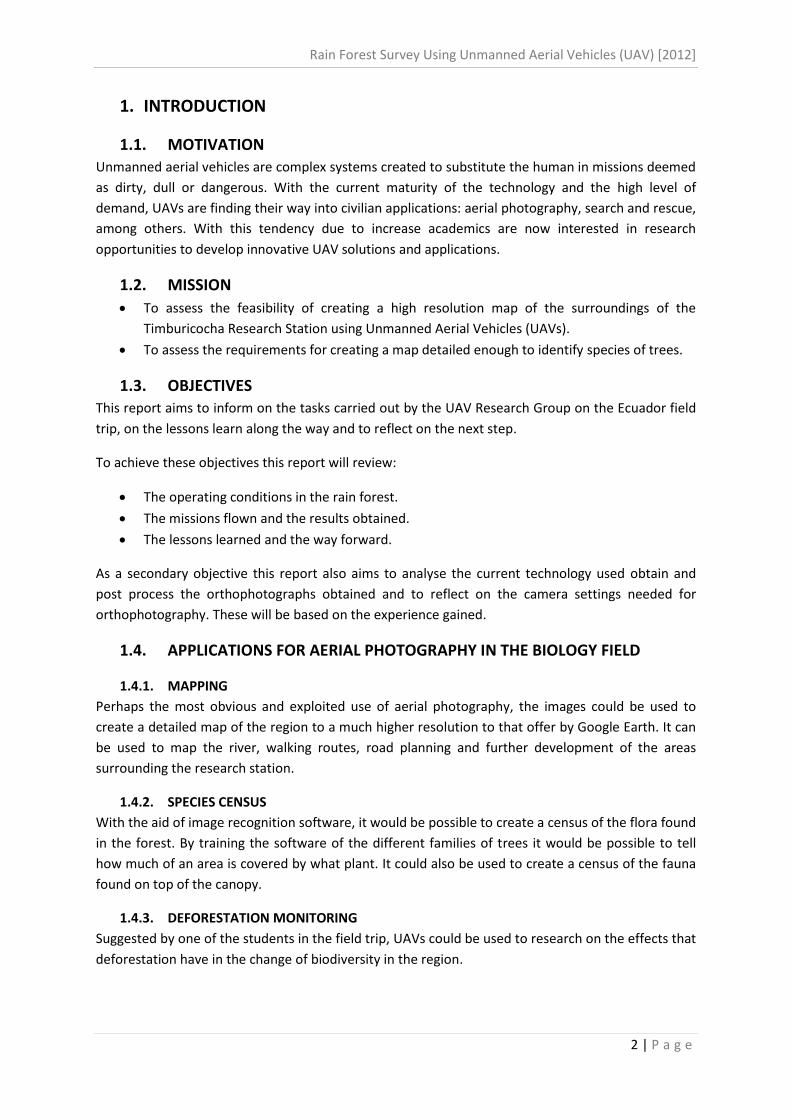
An area of around 30x15 meters, shown below in Figure 2, was cleared from tall grass, as to
uncovered roots and other features which might damage UAVs while landing. Branches of trees
located on the river side of the station where taken down as to increase the field of view (yellow
area) of the operator and to ease manual approach and landing manoeuvres.
Figure 2: UAV Strip at the Research Station
Rain Forest Survey Using Unmanned Aerial Vehicles (UAV) [2012]
4 | P a g e
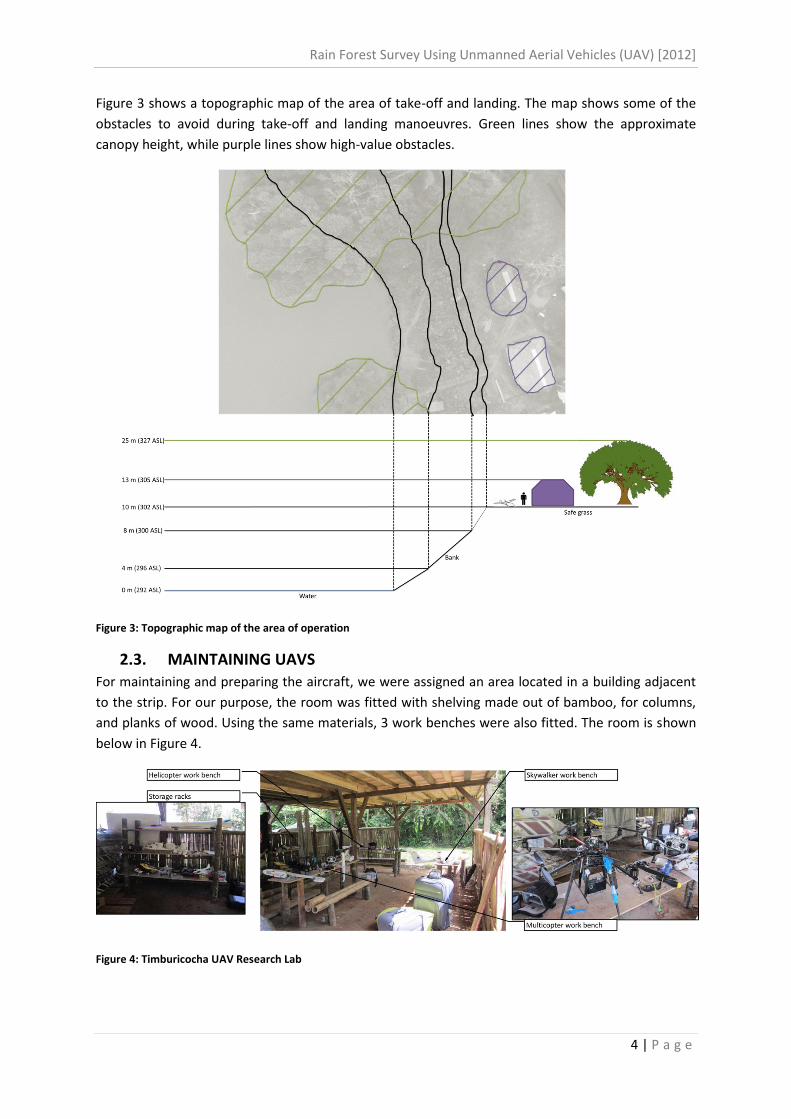
Figure 3 shows a topographic map of the area of take-off and landing. The map shows some of the
obstacles to avoid during take-off and landing manoeuvres. Green lines show the approximate
canopy height, while purple lines show high-value obstacles.
Figure 3: Topographic map of the area of operation
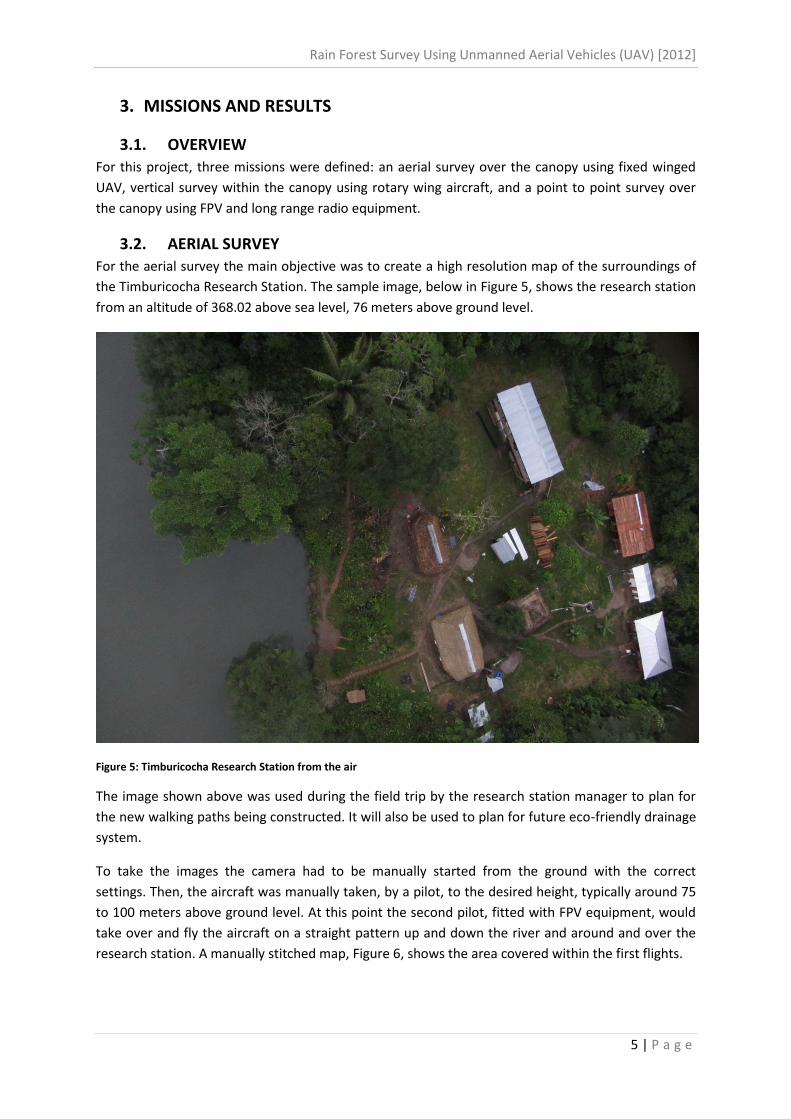
2.3. MAINTAINING UAVS
For maintaining and preparing the aircraft, we were assigned an area located in a building adjacent
to the strip. For our purpose, the room was fitted with shelving made out of bamboo, for columns,
and planks of wood. Using the same materials, 3 work benches were also fitted. The room is shown
below in Figure 4.
Figure 4: Timburicocha UAV Research Lab
Rain Forest Survey Using Unmanned Aerial Vehicles (UAV) [2012]
5 | P a g e
3. MISSIONS AND RESULTS
3.1. OVERVIEW
For this project, three missions were defined: an aerial survey over the canopy using fixed winged
UAV, vertical survey within the canopy using rotary wing aircraft, and a point to point survey over
the canopy using FPV and long range radio equipment.
3.2. AERIAL SURVEY
For the aerial survey the main objective was to create a high resolution map of the surroundings of
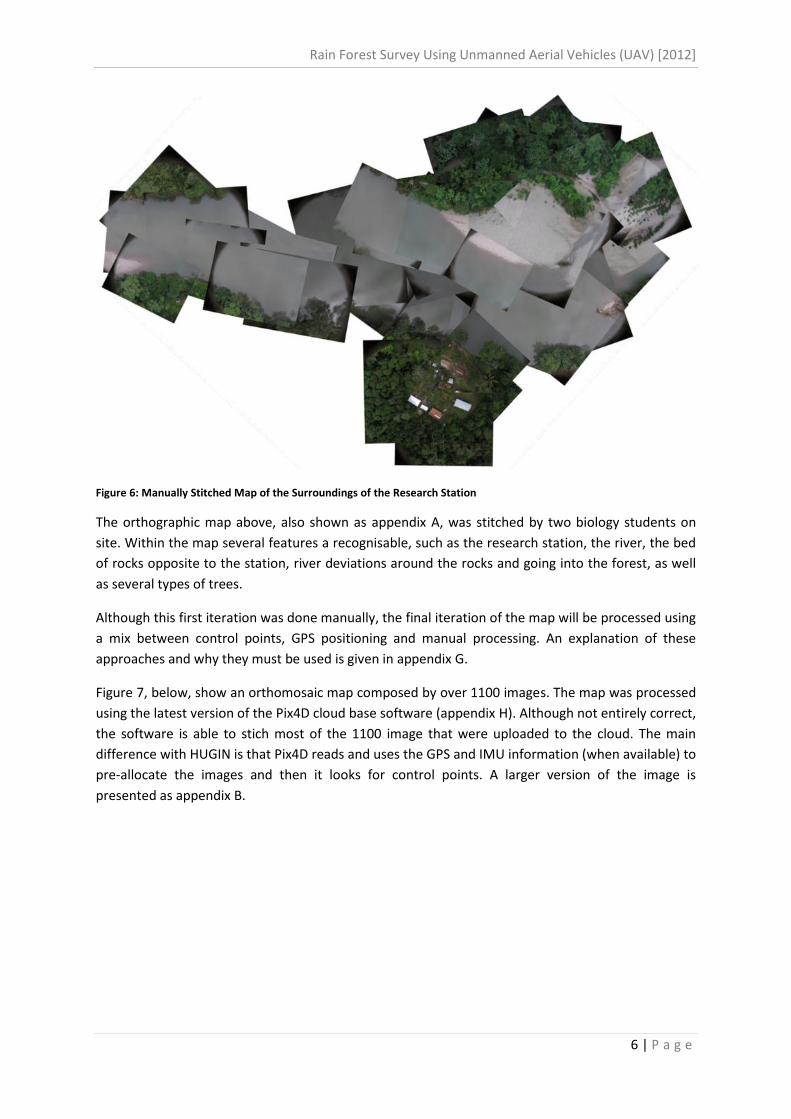
the Timburicocha Research Station. The sample image, below in Figure 5, shows the research station
from an altitude of 368.02 above sea level, 76 meters above ground level.
Figure 5: Timburicocha Research Station from the air
The image shown above was used during the field trip by the research station manager to plan for
the new walking paths being constructed. It will also be used to plan for future eco-friendly drainage
system.
To take the images the camera had to be manually started from the ground with the correct
settings. Then, the aircraft was manually taken, by a pilot, to the desired height, typically around 75
to 100 meters above ground level. At this point the second pilot, fitted with FPV equipment, would
take over and fly the aircraft on a straight pattern up and down the river and around and over the
research station. A manually stitched map, Figure 6, shows the area covered within the first flights.
Rain Forest Survey Using Unmanned Aerial Vehicles (UAV) [2012]
6 | P a g e
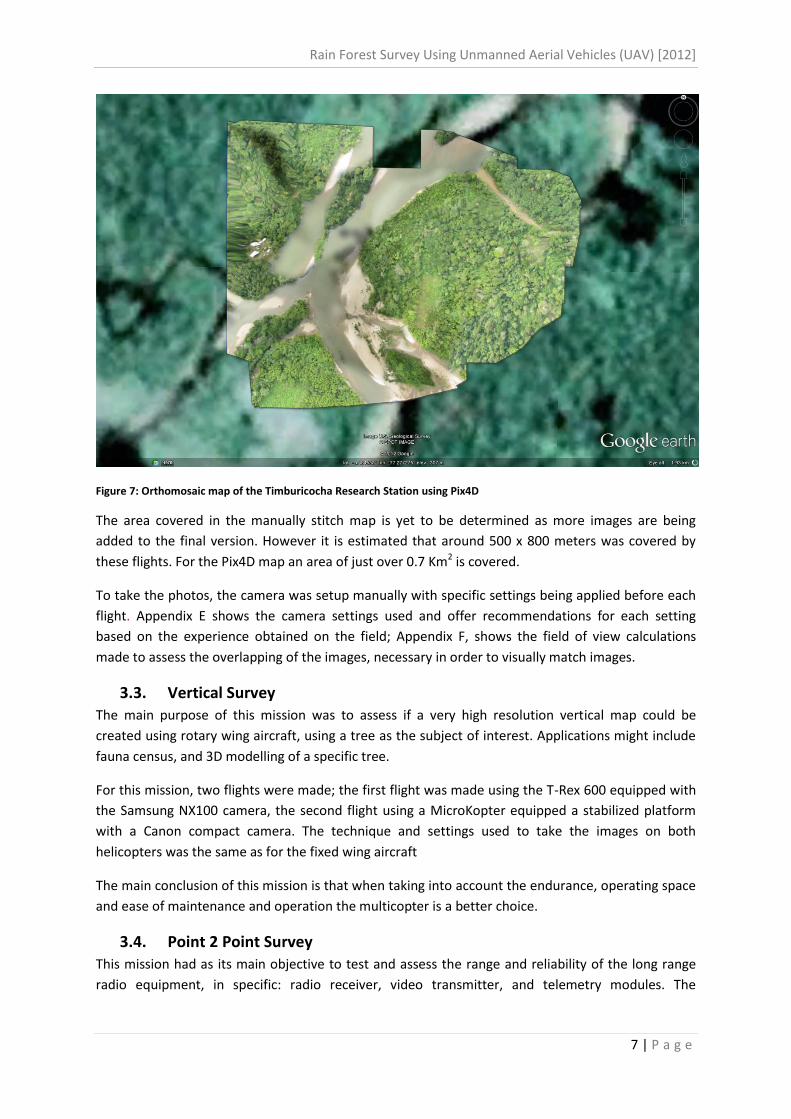
Figure 6: Manually Stitched Map of the Surroundings of the Research Station
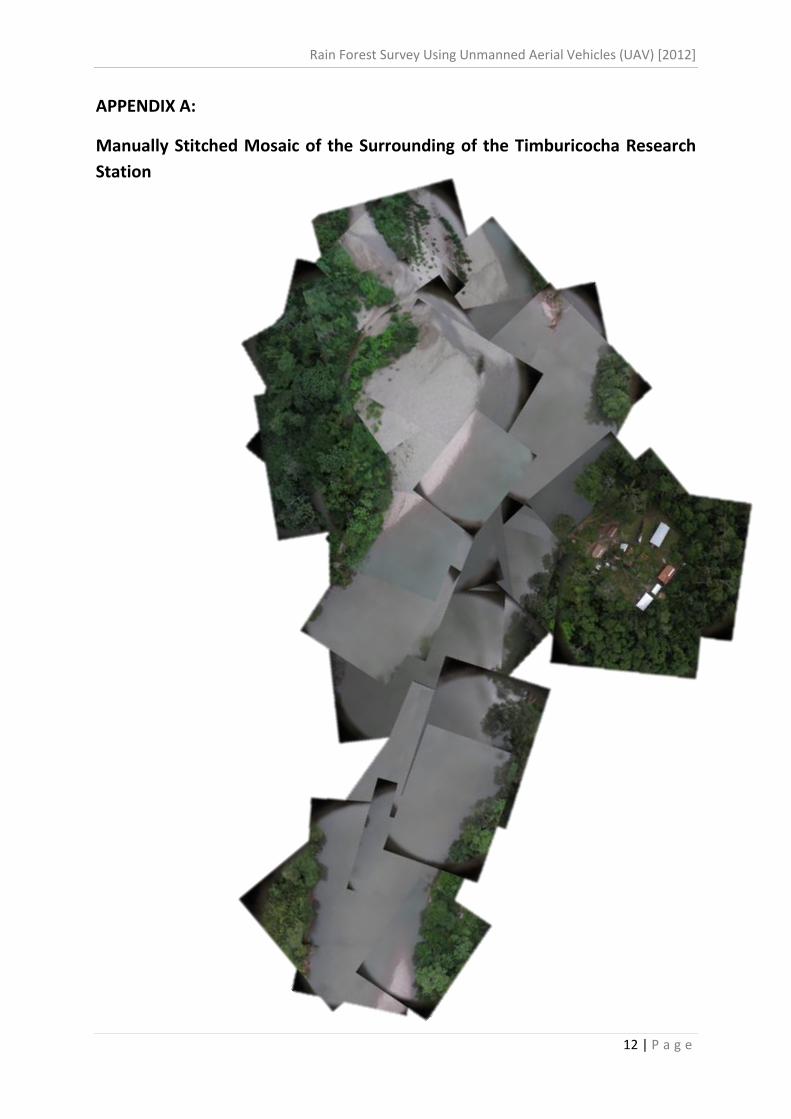
The orthographic map above, also shown as appendix A, was stitched by two biology students on
site. Within the map several features a recognisable, such as the research station, the river, the bed
of rocks opposite to the station, river deviations around the rocks and going into the forest, as well
as several types of trees.
Although this first iteration was done manually, the final iteration of the map will be processed using
a mix between control points, GPS positioning and manual processing. An explanation of these
approaches and why they must be used is given in appendix G.
Figure 7, below, show an orthomosaic map composed by over 1100 images. The map was processed
using the latest version of the Pix4D cloud base software (appendix H). Although not entirely correct,
the software is able to stich most of the 1100 image that were uploaded to the cloud. The main
difference with HUGIN is that Pix4D reads and uses the GPS and IMU information (when available) to
pre-allocate the images and then it looks for control points. A larger version of the image is
presented as appendix B.
Rain Forest Survey Using Unmanned Aerial Vehicles (UAV) [2012]
7 | P a g e
Figure 7: Orthomosaic map of the Timburicocha Research Station using Pix4D
The area covered in the manually stitch map is yet to be determined as more images are being
added to the final version. However it is estimated that around 500 x 800 meters was covered by
these flights. For the Pix4D map an area of just over 0.7 Km2 is covered.
To take the photos, the camera was setup manually with specific settings being applied before each
flight. Appendix E shows the camera settings used and offer recommendations for each setting
based on the experience obtained on the field; Appendix F, shows the field of view calculations
made to assess the overlapping of the images, necessary in order to visually match images.
3.3. Vertical Survey The main purpose of this mission was to assess if a very high resolution vertical map could be
created using rotary wing aircraft, using a tree as the subject of interest. Applications might include
fauna census, and 3D modelling of a specific tree.
For this mission, two flights were made; the first flight was made using the T-Rex 600 equipped with
the Samsung NX100 camera, the second flight using a MicroKopter equipped a stabilized platform
with a Canon compact camera. The technique and settings used to take the images on both
helicopters was the same as for the fixed wing aircraft
The main conclusion of this mission is that when taking into account the endurance, operating space
and ease of maintenance and operation the multicopter is a better choice.
3.4. Point 2 Point Survey This mission had as its main objective to test and assess the range and reliability of the long range
radio equipment, in specific: radio receiver, video transmitter, and telemetry modules. The

Rain Forest Survey Using Unmanned Aerial Vehicles (UAV) [2012]
8 | P a g e
secondary objective was assessing the feasibility to do survey along a path, rather than on a pattern
around a specific area.
To test the equipment beyond line of sight, a flight plan which consisted on a straight line between
the research station and the San Jose de Payamino community was traced; the distance between
waypoints was of 2km. The objective was to assess wherever there was sufficient range on the radio
equipment as to make the journey without problems and to document the trip using HD video from
a front facing GoPro2 camera, below.
Figure 8: Long range FPV kit
For this mission a pilot would take-off and get the aircraft to a safe altitude before handing over to
the FPV pilot. Although the control transmission was lost before reaching the town, it was
demonstrated that the 900MHz video equipment would be adequate for this type of mission. It also
made evident the requirement for a robust and fully tuned autopilot.
Regarding the point to point survey, it was demonstrated that these type of survey would be useful
for application where a complete area survey might not feasible due to time, economic or technical
constraints. Mapping the river, marking roads between research stations to other points of interest
are some of the possible applications of point 2 point survey.
Rain Forest Survey Using Unmanned Aerial Vehicles (UAV) [2012]
9 | P a g e
4. PROPOSED APPLICATIONS FOR UNMANNED VEHICLES IN THE FIELD OF
BIOLOGY
4.1. Real-time spotting UVs could be used as a complement to camera traps, where after the camera has located a subject
of interest, a nearby unmanned vehicle, would be deployed to track, spot, or chase the subject of
interest. This type of camera traps could be used for water and aerial subjects.
4.2. Distance Live Research
Using a small fleet of different unmanned vehicles it would be possible to explore terrain and survey
areas on-demand from anywhere in the world. This idea proposes that a researcher could use this
fleet for surveying, surveillance and exploratory purposes.
In the case of the students, they would be able to explore the terrain before they got there.
Researchers could have surveying mission running several times a week.
Some of the requirements to make this feasible would be:
Autonomous systems should be able to perform complete mission and return to a charging
pod autonomously.
Ground control stations and mission management software should be sufficiently de-skilled
as to make the technology accessible to non-specialized users.
A fast internet connection and an internal network would need to run within the research
station.
A person, preferably a local from the area, would need training on the maintenance and
repair of these systems.
Individually, all the technology required to achieve this already exists. It is proposed that, by
combining the technology, autonomous unmanned systems could be used as research assets in
various fields, including biology, terrain survey, surveillance, site maintenance, atmospheric sciences
and many more. It is also proposed that the ability to do these tasks remotely in remote places
would attract research from all around the world.
4.3. Application specific layer for Google Earth
Using some of the features available within Google Earth Pro and the data collected using unmanned
systems, it is proposed that application specific layer could be created to visualize and share the data
obtained. For example, with the use of an unmanned water vehicle, river flow, diversity and
properties could be mapped using Google earth to share with researchers and students information
about the Payamino River.
In addition, by using a database and the data obtain from various passes, it would be possible to
develop a timeline showing the changes as time passes by.
Rain Forest Survey Using Unmanned Aerial Vehicles (UAV) [2012]
10 | P a g e
5. Conclusion
5.1. LESSONS LEARNT
During the course of the field trip numerous lessons were learned.
It is possible to transport sensitive equipment on a standard luggage when appropriate
padding is used.
Small UAVs such as the ones used within this project can be transport on civil commercial
airliners, and it is cheaper to pay for them as extra luggage than using a currier to deliver.
Although helicopters have more economical spare parts, compared to multicopters, they are
not well suited for missions in rough terrains.
The radios, cameras, ground control stations, tools and aircraft used were not affected by
environmental conditions such as humidity and heat.
Leaving a down facing camera in automatic mode will result in blurry over exposed images
or sharp under exposed images.
For aerial site survey an autopilot is a requisite.
5.2. WAY FORWARD It is common at the end of every project to say, “I wish I could go back and do it again knowing what
I know now” and this is no exception.
By configuring a complete navigation system it would be possible to maximize the time
spent on the air taking images. By employing a tuned autopilot system a grid could be drawn
around the research station, mapping a considerable larger area at various heights at
different ground resolution, creating several maps.
A custom script would be installed in the aircraft camera. The script would contain the exact
parameters and settings as per the mission requirements.
By utilising the point 2 point style mission several paths could be drawn on maps, routes to
the armadillo mountain and the San Jose de Payamino could be detailed and given as
interactive foot maps.
3D detailed models of trees could be created using multicopters.

Rain Forest Survey Using Unmanned Aerial Vehicles (UAV) [2012]
11 | P a g e
6. Appendices
Rain Forest Survey Using Unmanned Aerial Vehicles (UAV) [2012]
12 | P a g e
APPENDIX A:
Manually Stitched Mosaic of the Surrounding of the Timburicocha Research
Station

Rain Forest Survey Using Unmanned Aerial Vehicles (UAV) [2012]
13 | P a g e
APPENDIX B:
Orthophotography Mosaic Automatically Stitched Using Pix4D
Rain Forest Survey Using Unmanned Aerial Vehicles (UAV) [2012]
14 | P a g e
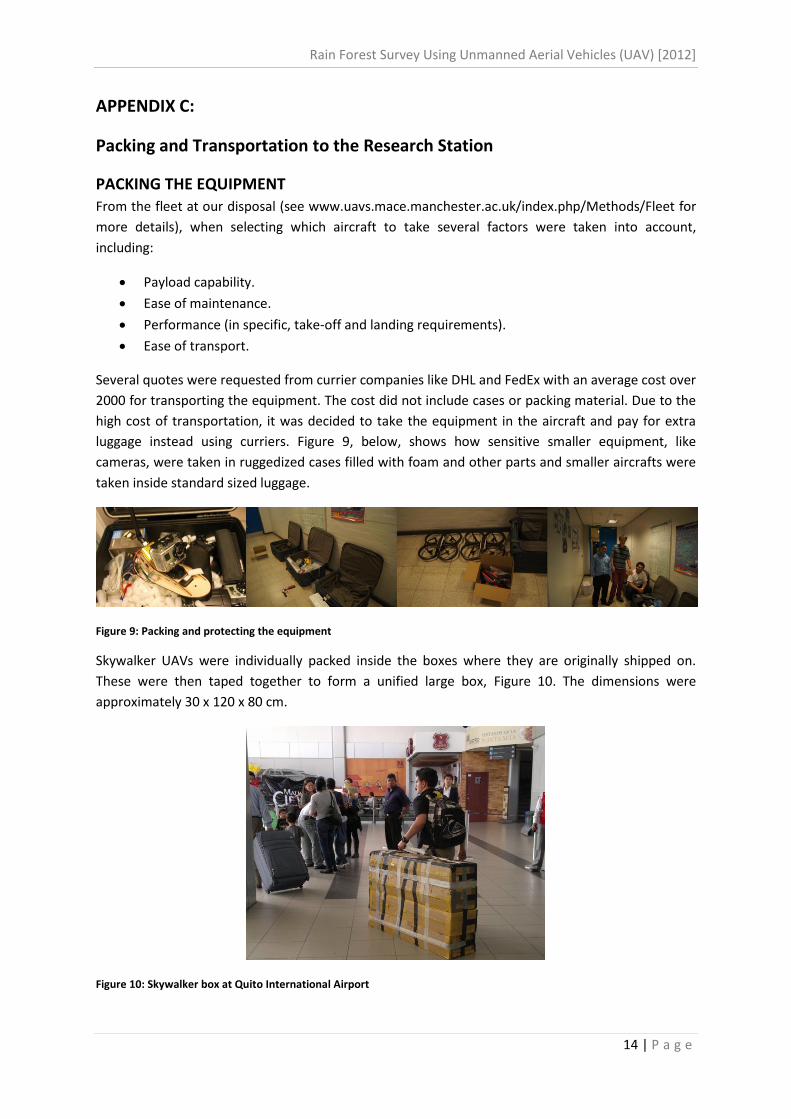
APPENDIX C:
Packing and Transportation to the Research Station
PACKING THE EQUIPMENT
From the fleet at our disposal (see www.uavs.mace.manchester.ac.uk/index.php/Methods/Fleet for
more details), when selecting which aircraft to take several factors were taken into account,
including:
Payload capability.
Ease of maintenance.
Performance (in specific, take-off and landing requirements).
Ease of transport.
Several quotes were requested from currier companies like DHL and FedEx with an average cost over
2000 for transporting the equipment. The cost did not include cases or packing material. Due to the
high cost of transportation, it was decided to take the equipment in the aircraft and pay for extra
luggage instead using curriers. Figure 9, below, shows how sensitive smaller equipment, like
cameras, were taken in ruggedized cases filled with foam and other parts and smaller aircrafts were
taken inside standard sized luggage.
Figure 9: Packing and protecting the equipment
Skywalker UAVs were individually packed inside the boxes where they are originally shipped on.
These were then taped together to form a unified large box, Figure 10. The dimensions were
approximately 30 x 120 x 80 cm.
Figure 10: Skywalker box at Quito International Airport
Rain Forest Survey Using Unmanned Aerial Vehicles (UAV) [2012]
15 | P a g e
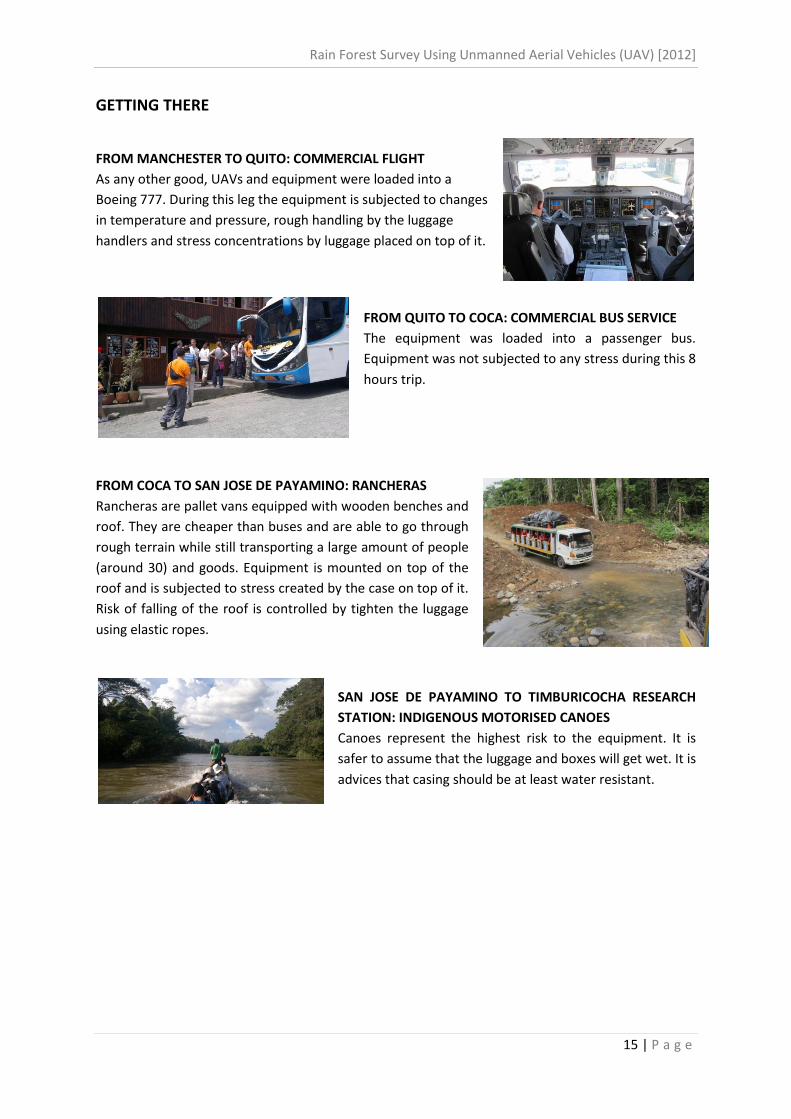
GETTING THERE
FROM MANCHESTER TO QUITO: COMMERCIAL FLIGHT
As any other good, UAVs and equipment were loaded into a
Boeing 777. During this leg the equipment is subjected to changes
in temperature and pressure, rough handling by the luggage
handlers and stress concentrations by luggage placed on top of it.
FROM QUITO TO COCA: COMMERCIAL BUS SERVICE
The equipment was loaded into a passenger bus.
Equipment was not subjected to any stress during this 8
hours trip.
FROM COCA TO SAN JOSE DE PAYAMINO: RANCHERAS
Rancheras are pallet vans equipped with wooden benches and
roof. They are cheaper than buses and are able to go through
rough terrain while still transporting a large amount of people
(around 30) and goods. Equipment is mounted on top of the
roof and is subjected to stress created by the case on top of it.
Risk of falling of the roof is controlled by tighten the luggage
using elastic ropes.
SAN JOSE DE PAYAMINO TO TIMBURICOCHA RESEARCH
STATION: INDIGENOUS MOTORISED CANOES
Canoes represent the highest risk to the equipment. It is
safer to assume that the luggage and boxes will get wet. It is
advices that casing should be at least water resistant.
Rain Forest Survey Using Unmanned Aerial Vehicles (UAV) [2012]
16 | P a g e
APPENDIX D:
UAV Fleet
FLEET
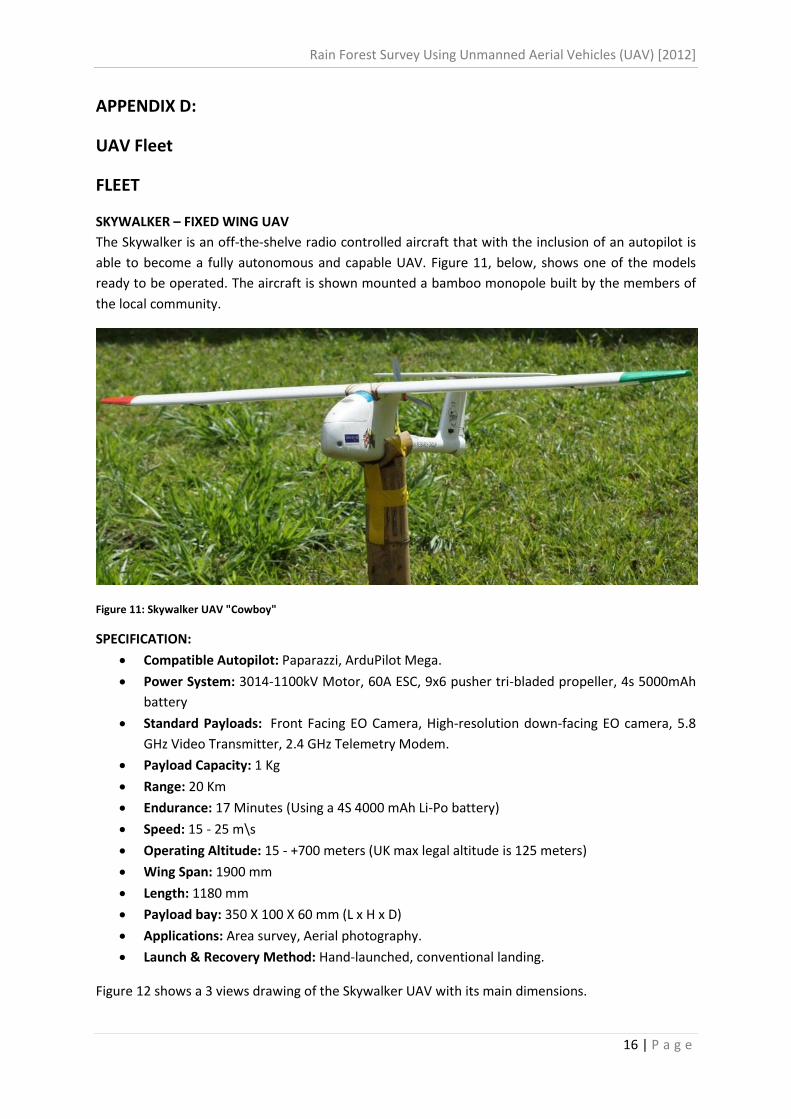
SKYWALKER – FIXED WING UAV
The Skywalker is an off-the-shelve radio controlled aircraft that with the inclusion of an autopilot is
able to become a fully autonomous and capable UAV. Figure 11, below, shows one of the models
ready to be operated. The aircraft is shown mounted a bamboo monopole built by the members of
the local community.
Figure 11: Skywalker UAV "Cowboy"
SPECIFICATION:
Compatible Autopilot: Paparazzi, ArduPilot Mega.
Power System: 3014-1100kV Motor, 60A ESC, 9x6 pusher tri-bladed propeller, 4s 5000mAh
battery
Standard Payloads: Front Facing EO Camera, High-resolution down-facing EO camera, 5.8
GHz Video Transmitter, 2.4 GHz Telemetry Modem.
Payload Capacity: 1 Kg
Range: 20 Km
Endurance: 17 Minutes (Using a 4S 4000 mAh Li-Po battery)
Speed: 15 - 25 m\s
Operating Altitude: 15 - +700 meters (UK max legal altitude is 125 meters)
Wing Span: 1900 mm
Length: 1180 mm
Payload bay: 350 X 100 X 60 mm (L x H x D)
Applications: Area survey, Aerial photography.
Launch & Recovery Method: Hand-launched, conventional landing.
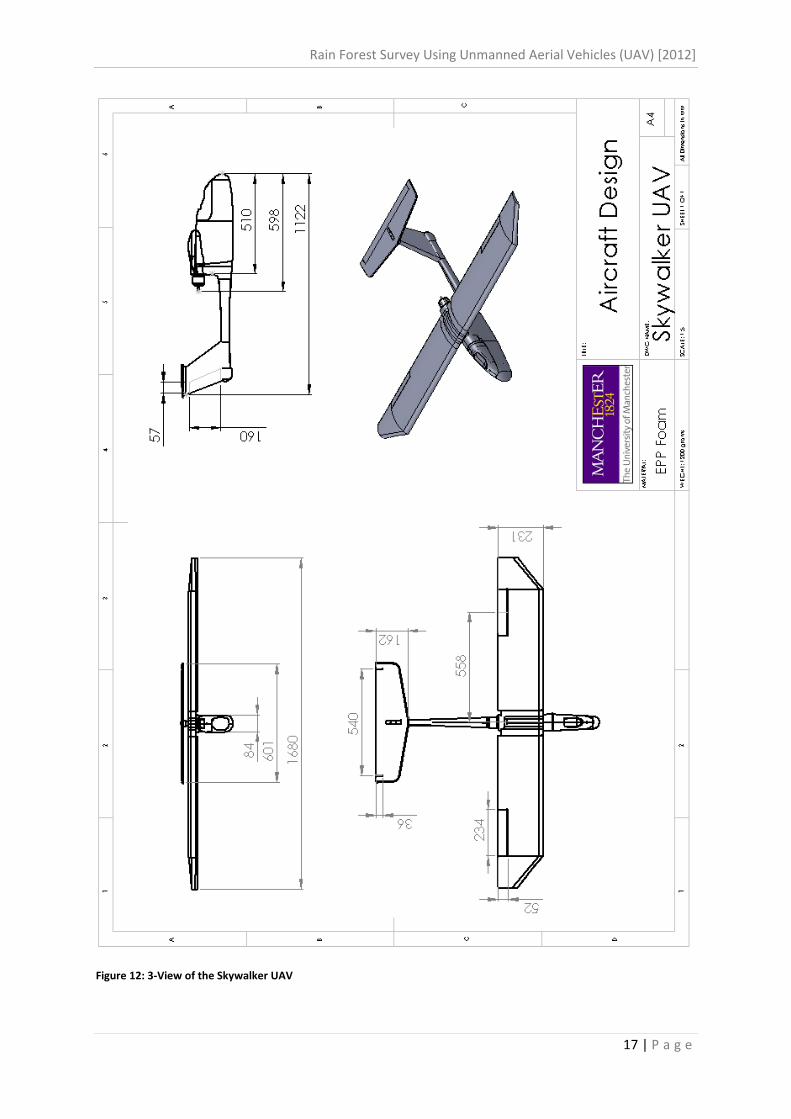
Figure 12 shows a 3 views drawing of the Skywalker UAV with its main dimensions.
Rain Forest Survey Using Unmanned Aerial Vehicles (UAV) [2012]
17 | P a g e
Figure 12: 3-View of the Skywalker UAV
Rain Forest Survey Using Unmanned Aerial Vehicles (UAV) [2012]
18 | P a g e
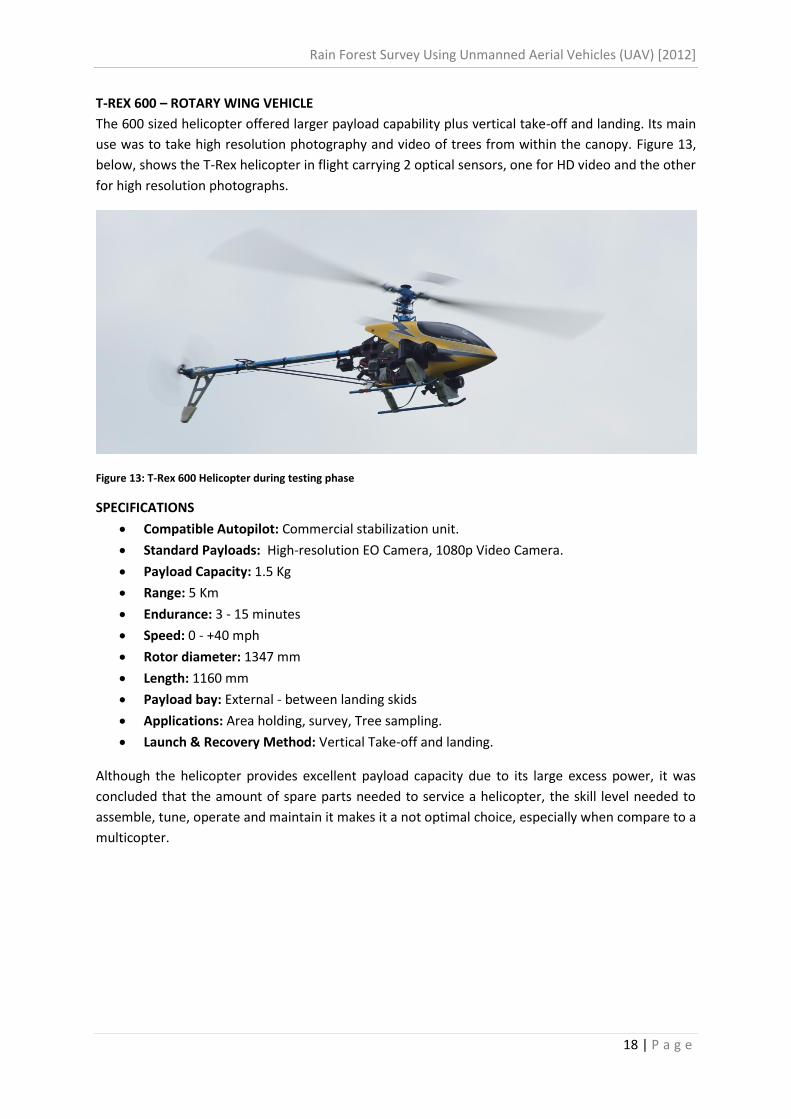
T-REX 600 – ROTARY WING VEHICLE
The 600 sized helicopter offered larger payload capability plus vertical take-off and landing. Its main
use was to take high resolution photography and video of trees from within the canopy. Figure 13,
below, shows the T-Rex helicopter in flight carrying 2 optical sensors, one for HD video and the other
for high resolution photographs.
Figure 13: T-Rex 600 Helicopter during testing phase
SPECIFICATIONS
Compatible Autopilot: Commercial stabilization unit.
Standard Payloads: High-resolution EO Camera, 1080p Video Camera.
Payload Capacity: 1.5 Kg
Range: 5 Km
Endurance: 3 - 15 minutes
Speed: 0 - +40 mph
Rotor diameter: 1347 mm
Length: 1160 mm
Payload bay: External - between landing skids
Applications: Area holding, survey, Tree sampling.
Launch & Recovery Method: Vertical Take-off and landing.
Although the helicopter provides excellent payload capacity due to its large excess power, it was
concluded that the amount of spare parts needed to service a helicopter, the skill level needed to
assemble, tune, operate and maintain it makes it a not optimal choice, especially when compare to a
multicopter.
Rain Forest Survey Using Unmanned Aerial Vehicles (UAV) [2012]
19 | P a g e
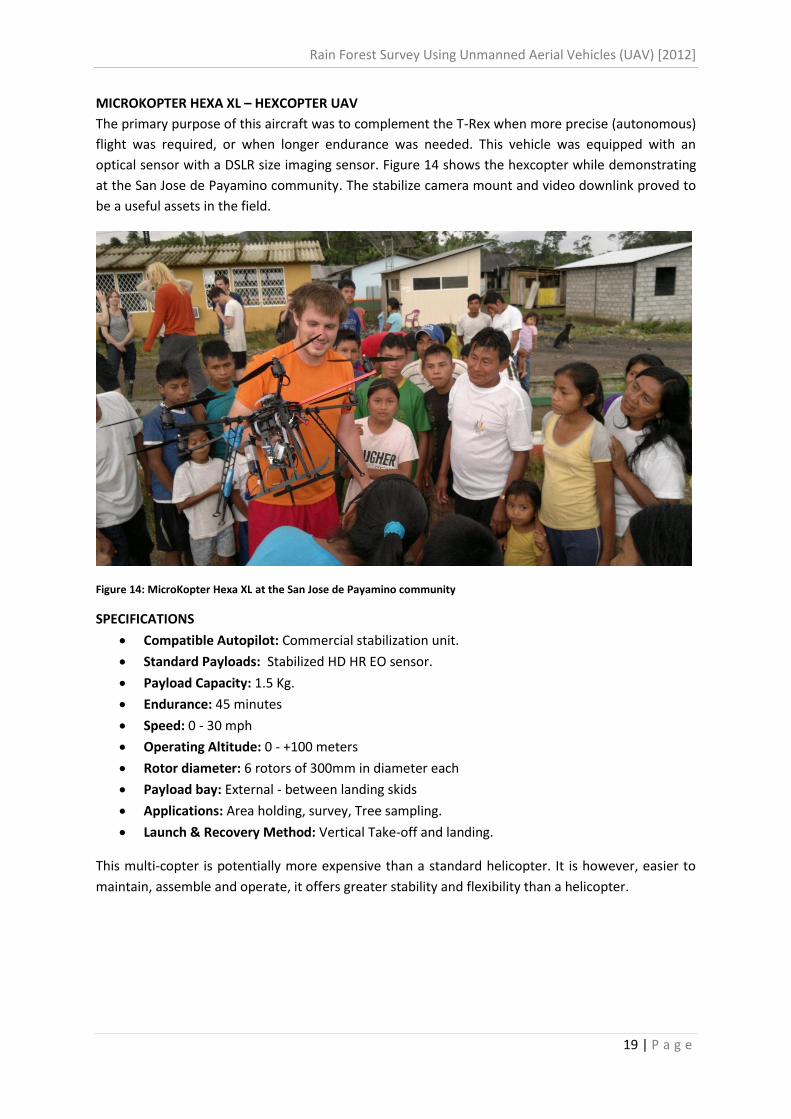
MICROKOPTER HEXA XL – HEXCOPTER UAV
The primary purpose of this aircraft was to complement the T-Rex when more precise (autonomous)
flight was required, or when longer endurance was needed. This vehicle was equipped with an
optical sensor with a DSLR size imaging sensor. Figure 14 shows the hexcopter while demonstrating
at the San Jose de Payamino community. The stabilize camera mount and video downlink proved to
be a useful assets in the field.
Figure 14: MicroKopter Hexa XL at the San Jose de Payamino community
SPECIFICATIONS
Compatible Autopilot: Commercial stabilization unit.
Standard Payloads: Stabilized HD HR EO sensor.
Payload Capacity: 1.5 Kg.
Endurance: 45 minutes
Speed: 0 - 30 mph
Operating Altitude: 0 - +100 meters
Rotor diameter: 6 rotors of 300mm in diameter each
Payload bay: External - between landing skids
Applications: Area holding, survey, Tree sampling.
Launch & Recovery Method: Vertical Take-off and landing.
This multi-copter is potentially more expensive than a standard helicopter. It is however, easier to
maintain, assemble and operate, it offers greater stability and flexibility than a helicopter.
Rain Forest Survey Using Unmanned Aerial Vehicles (UAV) [2012]
20 | P a g e
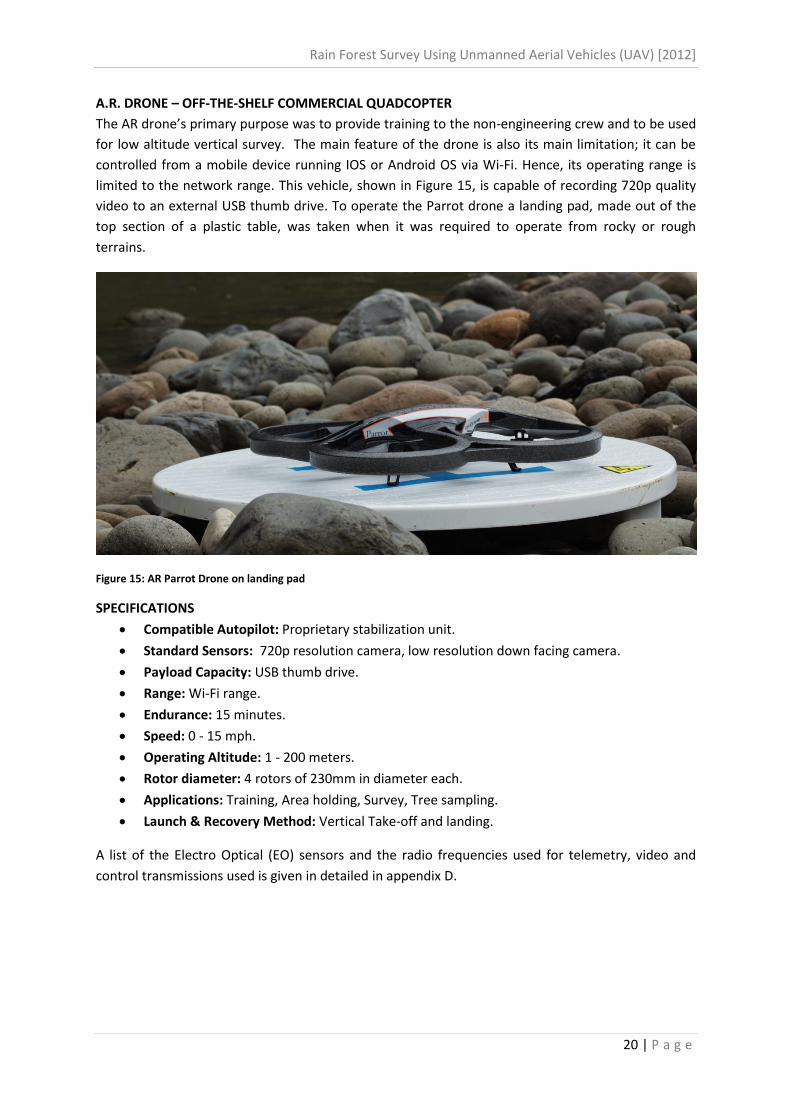
A.R. DRONE – OFF-THE-SHELF COMMERCIAL QUADCOPTER
The AR drone’s primary purpose was to provide training to the non-engineering crew and to be used
for low altitude vertical survey. The main feature of the drone is also its main limitation; it can be
controlled from a mobile device running IOS or Android OS via Wi-Fi. Hence, its operating range is
limited to the network range. This vehicle, shown in Figure 15, is capable of recording 720p quality
video to an external USB thumb drive. To operate the Parrot drone a landing pad, made out of the
top section of a plastic table, was taken when it was required to operate from rocky or rough
terrains.
Figure 15: AR Parrot Drone on landing pad
SPECIFICATIONS
Compatible Autopilot: Proprietary stabilization unit.
Standard Sensors: 720p resolution camera, low resolution down facing camera.
Payload Capacity: USB thumb drive.
Range: Wi-Fi range.
Endurance: 15 minutes.
Speed: 0 - 15 mph.
Operating Altitude: 1 - 200 meters.
Rotor diameter: 4 rotors of 230mm in diameter each.
Applications: Training, Area holding, Survey, Tree sampling.
Launch & Recovery Method: Vertical Take-off and landing.
A list of the Electro Optical (EO) sensors and the radio frequencies used for telemetry, video and
control transmissions used is given in detailed in appendix D.
Rain Forest Survey Using Unmanned Aerial Vehicles (UAV) [2012]
21 | P a g e
APPENDIX D:
Electro-Optical Sensors, Radio Frequencies and Settings Used
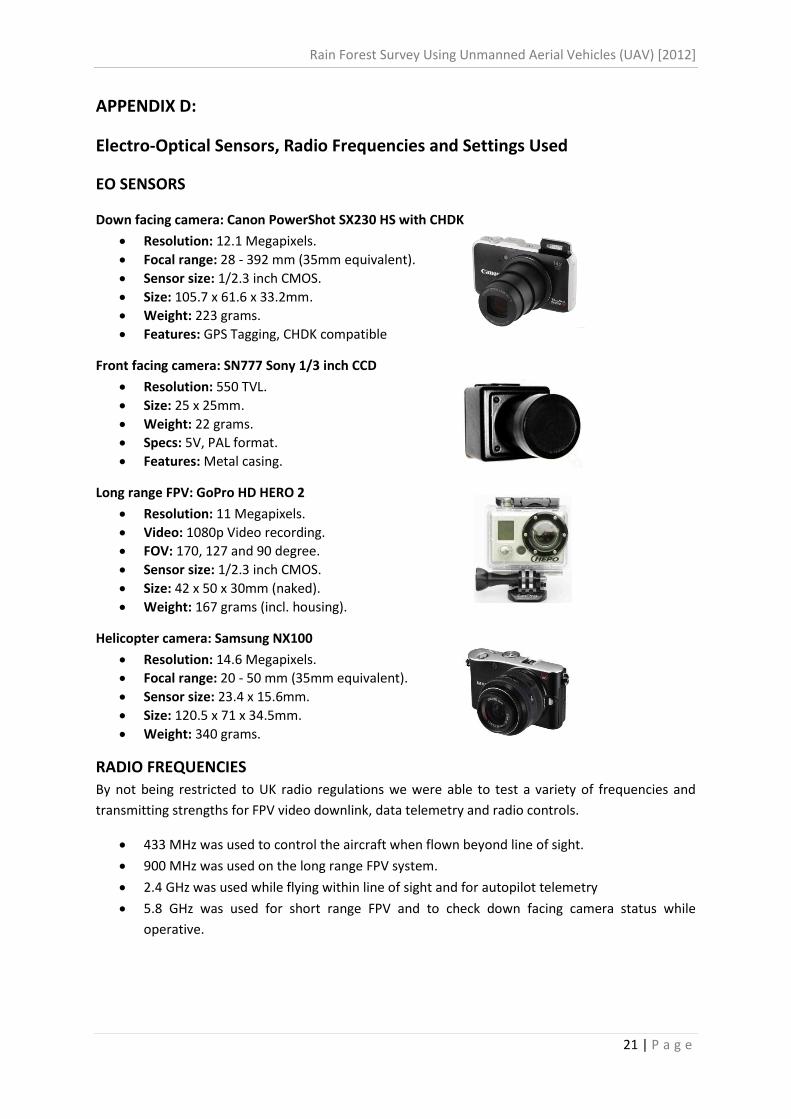
EO SENSORS
Down facing camera: Canon PowerShot SX230 HS with CHDK
Resolution: 12.1 Megapixels.
Focal range: 28 - 392 mm (35mm equivalent).
Sensor size: 1/2.3 inch CMOS.
Size: 105.7 x 61.6 x 33.2mm.
Weight: 223 grams.
Features: GPS Tagging, CHDK compatible
Front facing camera: SN777 Sony 1/3 inch CCD
Resolution: 550 TVL.
Size: 25 x 25mm.
Weight: 22 grams.
Specs: 5V, PAL format.
Features: Metal casing.
Long range FPV: GoPro HD HERO 2
Resolution: 11 Megapixels.
Video: 1080p Video recording.
FOV: 170, 127 and 90 degree.
Sensor size: 1/2.3 inch CMOS.
Size: 42 x 50 x 30mm (naked).
Weight: 167 grams (incl. housing).
Helicopter camera: Samsung NX100
Resolution: 14.6 Megapixels.
Focal range: 20 - 50 mm (35mm equivalent).
Sensor size: 23.4 x 15.6mm.
Size: 120.5 x 71 x 34.5mm.
Weight: 340 grams.
RADIO FREQUENCIES
By not being restricted to UK radio regulations we were able to test a variety of frequencies and
transmitting strengths for FPV video downlink, data telemetry and radio controls.
433 MHz was used to control the aircraft when flown beyond line of sight.
900 MHz was used on the long range FPV system.
2.4 GHz was used while flying within line of sight and for autopilot telemetry
5.8 GHz was used for short range FPV and to check down facing camera status while
operative.
Rain Forest Survey Using Unmanned Aerial Vehicles (UAV) [2012]
22 | P a g e
CAMERA SETTINGS USED
For Orthomosaic production several factors need to be taken into account to produce images that
will stitch properly. We can separate those factors into two categories: camera settings and flight
characteristics.
SHUTTER SPEED:
Setting: The higher the better
Reason: Pictures taken from a moving aircraft has to be taken as fast as possible to avoid blur and to shorten the interval between pictures.
Issue: As the shutter speed increases the amount if light that goes into the sensor of the camera decreases. This means that without the ideal lightning conditions the images will be underexposed. In addition, the poor optics quality found in cheap cameras further reduces the amount of light going into the sensor.
Solution: A bigger image sensor will be able to capture more light at the expense of an increase in size, weight and price. The second solution is to increase the sensitivity of the sensor to light (ISO) setting on the camera at the expense of noise in the image.
ISO:
Setting: As low as possible.
Reason: Increasing the sensitivity of the sensor introduces contamination (noise) on the image. This is the equivalent of burnt spots on film cameras.
Issue: When working on small platforms the weight limitation dictates that a compact sensor need to be used (1/4 inch sensor). This means that in order to shoot clear images the ISO will need to be increased.
Solution: Increase the sensor size.
FOCUS:
Setting: Auto focus off, manually set to infinity (above 15m for most cameras).
Reason: When using auto focus the camera reloads the lens to find the clearest image every time a picture is taken; this greatly increases the interval time between images, decreasing the overlap within the images. Turning the automatic focus off and manually setting the focus point to infinity will result in crisp images as long as the vehicle is flying at least 15 meters above the highest point of the area of interest.
Issue: None.
Solution: N/A
IMAGE STABILIZATION:
Setting: Off
Reason: Image stabilization is used to reduce the very low frequency shake caused by hand holding the camera in reduced light environments. The oscillation of the aircraft, although also relatively low frequency could throw the sensor out, reducing the crispness of the images. In rotary wing vehicles, for example, using this feature will result in useless data.
Issue: None.
Solution: N/A
INTERVALOMETER:
Setting: The shorter the better.
Reason: The more frequent you can take pictures the more overlap will exist between them, making it easier to find CPs and ensures the there are no uncover parts in the.

Rain Forest Survey Using Unmanned Aerial Vehicles (UAV) [2012]
23 | P a g e
Issue: The frequency at which pictures can be taken depends solely on the performance of the camera and, in some cases, the buffer time to save the image in the storage card. For compact cameras however, the bottle neck is the camera’s processing time.
Solution: High-end systems will usually include faster image processors and will be capable of taken images faster.
Rain Forest Survey Using Unmanned Aerial Vehicles (UAV) [2012]
24 | P a g e
APPENDIX E:
Calculation of Focal Length, FOV and Ground Resolution
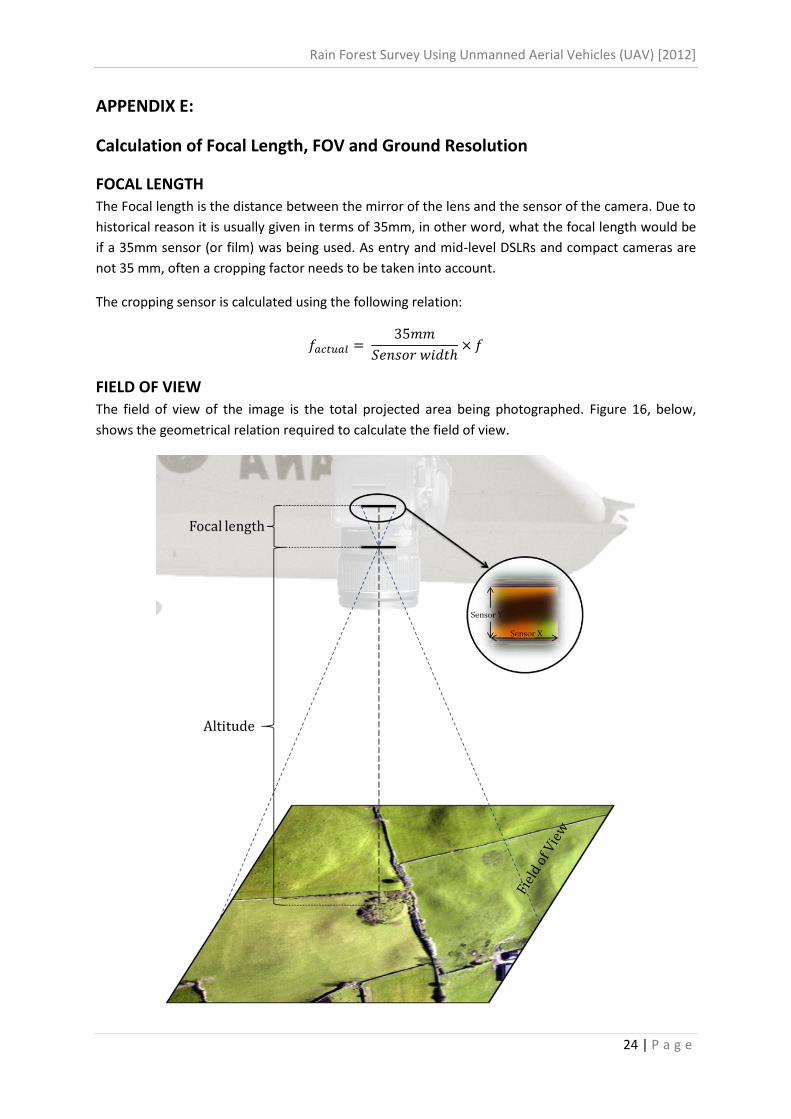
FOCAL LENGTH
The Focal length is the distance between the mirror of the lens and the sensor of the camera. Due to
historical reason it is usually given in terms of 35mm, in other word, what the focal length would be
if a 35mm sensor (or film) was being used. As entry and mid-level DSLRs and compact cameras are
not 35 mm, often a cropping factor needs to be taken into account.
The cropping sensor is calculated using the following relation:
FIELD OF VIEW
The field of view of the image is the total projected area being photographed. Figure 16, below,
shows the geometrical relation required to calculate the field of view.
Rain Forest Survey Using Unmanned Aerial Vehicles (UAV) [2012]
25 | P a g e
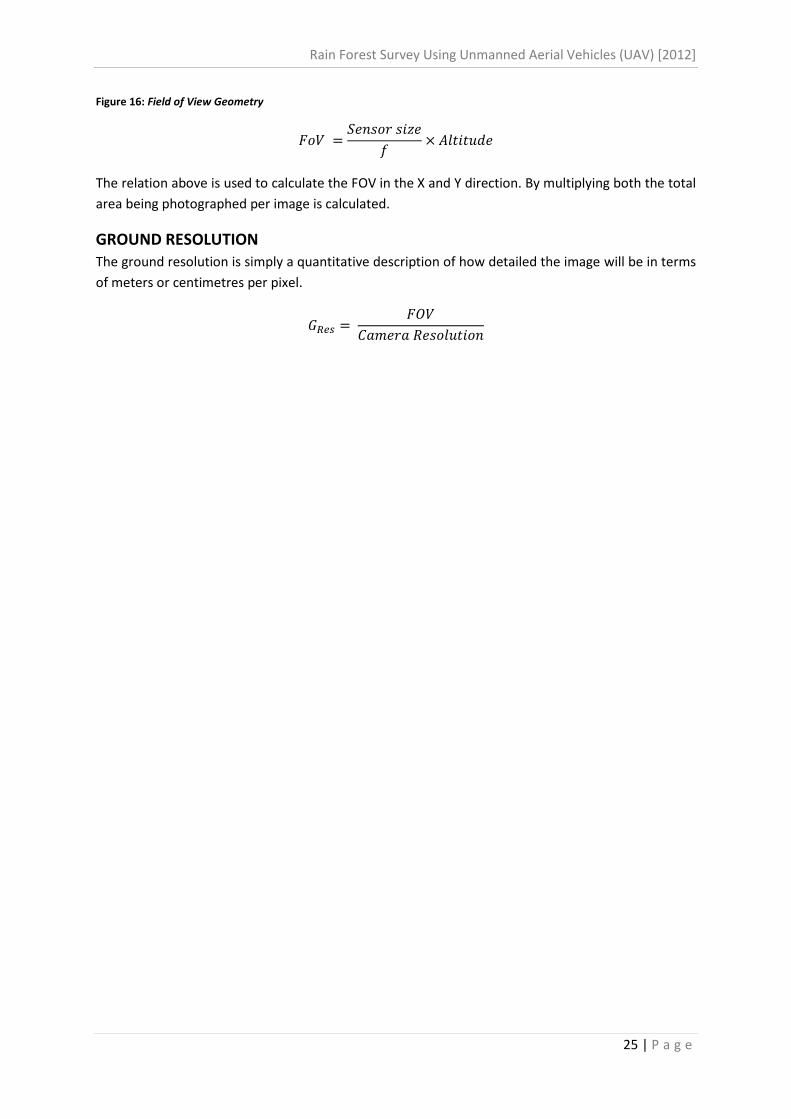
Figure 16: Field of View Geometry
The relation above is used to calculate the FOV in the X and Y direction. By multiplying both the total
area being photographed per image is calculated.
GROUND RESOLUTION
The ground resolution is simply a quantitative description of how detailed the image will be in terms
of meters or centimetres per pixel.
Rain Forest Survey Using Unmanned Aerial Vehicles (UAV) [2012]
26 | P a g e
APPENDIX F:
Review of current post-processing techniques and software for aerial images
COMMON REQUIREMENTS
Most automated stitching software has similar requirements when it comes to the technique or
settings used to take the pictures.
Images need to be taken from one reference point (approximately same altitude), otherwise more computational time is required to align and resize images.
Aircraft should be in a stable straight flight, pictures taken while banking are useless for 2D maps and available software does not cope well with images taken from different perspectives.
Similar exposure across all the pictures, as control points might “disappear” in over exposed or under exposed images.
Images most have some overlap between them (best result being achieved when overlap is greater to 50%)
TECHNIQUES
CONTROL POINT BASED STITCHING
This technique, widely used for stitching images, relays on algarithms that seek for common
“features” present in overlapping images. It then align pictures based on those control points (CPs).
Pros:
Very efficient over urban areas, where clear defined lines in buildings, cars and intersections are used as CPs to merge the images.
Most software use this technique.
Can be done manually without any software.
Very easy to improve accuracy by manually adding CPs.
Cons:
Computationally expensive as the logarithm compare every permutation images submitted to it.
Inaccurate for rural areas, where roads and defined lines are inexistent.
When dealing with large number of images, manually adding CPs become tedious.
GPS + IMU + CP STITCHING
This technique makes use of the GPS feature of some cameras (via their Exchangeable image file
format (EXIF) data or GPX log of the autopilot) to first align the pictures based on the approximate
location where they were taken and then applies CP algorithms to neighbour images. This greatly
reduces computational time at the expense of the additional equipment required. By knowing the
GPS location of the area being mapped, adding features to the new map is relatively easy, one
example being the addition of elevation data to create Digital Elevation Models (DEM). In addition
when IMU data is available, images taken from an object at different perspectives can be used to
construct 3D models.
Pros:
Specifically design for Orthophotography

Rain Forest Survey Using Unmanned Aerial Vehicles (UAV) [2012]
27 | P a g e
All positive aspects of CP based stitching plus:
Computational time is greatly reduced by pre-placing images in their approximate location based on GPS data.
If altitude, compass, focal length and sensor size is available from the EXIF data, software can perform transformation on the images to, not only put them in their correct location, but also rotate and resize before aligning based on CPs.
When combined with IMU data 3D models can be constructed.
Cons:
Still computationally expensive when large number of pictures is used.
More expensive kit required on the aircraft (camera with GPS or GPS receiver on aircraft).
GPS data does fluctuate and if it is possible that location of some images is off.
When used in areas with “hard to define” CPs alignment is often not accurate.
Rain Forest Survey Using Unmanned Aerial Vehicles (UAV) [2012]
28 | P a g e
APPENDIX F:
Review of Post-Processing Software Used
HUGIN
HUGIN is an open source GUI front-end for Panorama Tools (command-line based stitching
software). It works by merging images with common control points together.
One of the reasons why CP based algorithm fails in rural areas is because of the lack of distinctive
features. In an urban environment a building surrounded by a park or a street is easily
distinguishable, Figure 17, below, shows how HUGIN has automatically found 20 CPs, enough to
merge the two images together.
Figure 17: 20 CPs automatically found by HUGIN in an urban environment
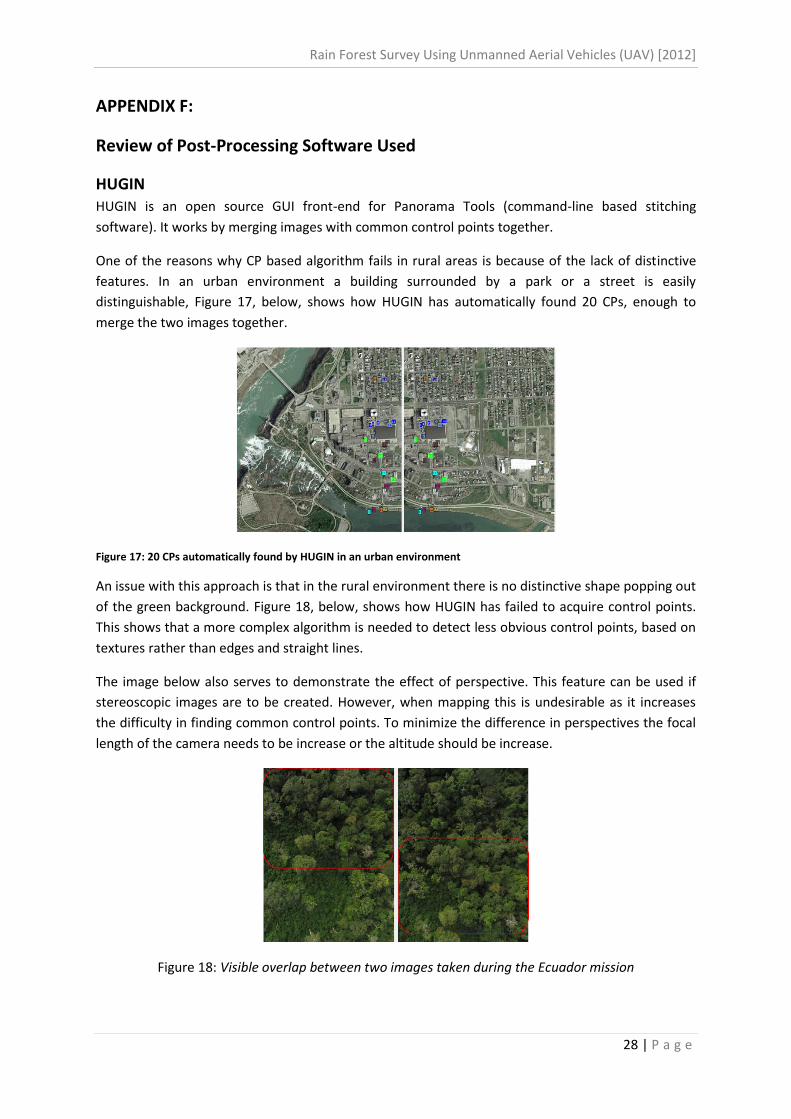
An issue with this approach is that in the rural environment there is no distinctive shape popping out
of the green background. Figure 18, below, shows how HUGIN has failed to acquire control points.
This shows that a more complex algorithm is needed to detect less obvious control points, based on
textures rather than edges and straight lines.
The image below also serves to demonstrate the effect of perspective. This feature can be used if
stereoscopic images are to be created. However, when mapping this is undesirable as it increases
the difficulty in finding common control points. To minimize the difference in perspectives the focal
length of the camera needs to be increase or the altitude should be increase.
Figure 18: Visible overlap between two images taken during the Ecuador mission
Rain Forest Survey Using Unmanned Aerial Vehicles (UAV) [2012]
29 | P a g e
What is needed is an approach that not only looks for control points, but that is capable of adapting
itself based on the content being processed. This is not to be confused with the content awareness
feature offered by some photograph software (which is harmful for this specific application).
PIX4D
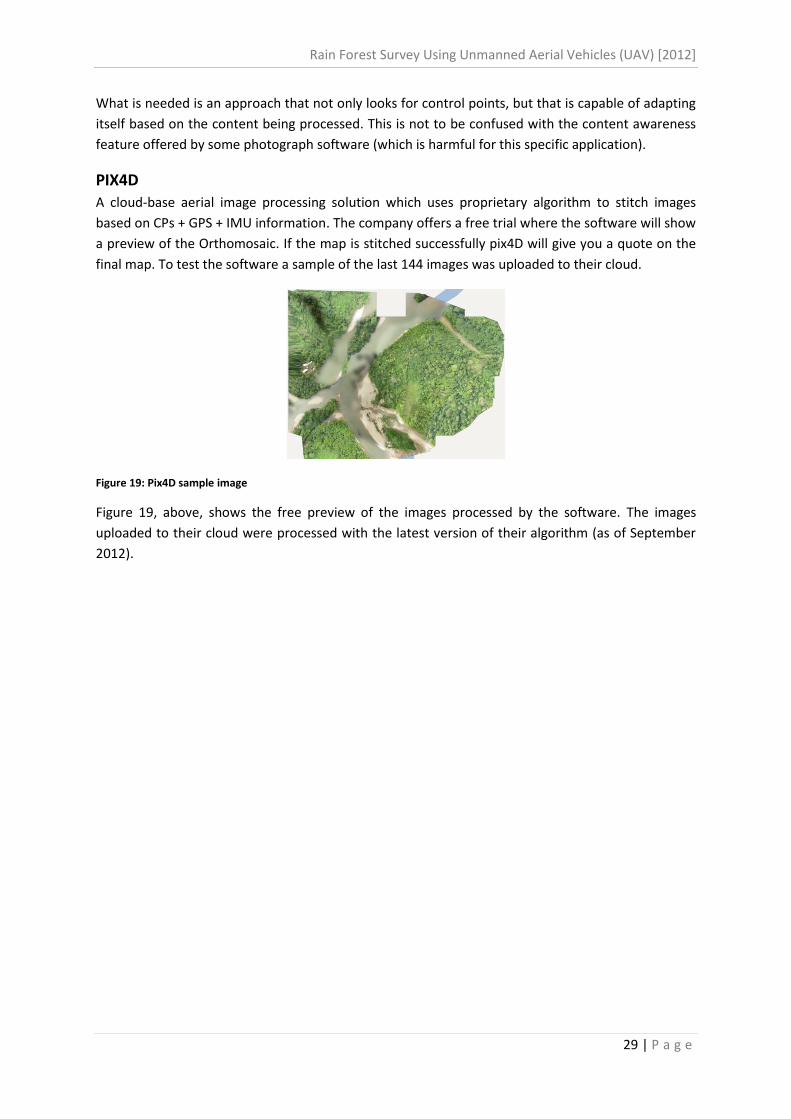
A cloud-base aerial image processing solution which uses proprietary algorithm to stitch images
based on CPs + GPS + IMU information. The company offers a free trial where the software will show
a preview of the Orthomosaic. If the map is stitched successfully pix4D will give you a quote on the
final map. To test the software a sample of the last 144 images was uploaded to their cloud.
Figure 19: Pix4D sample image
Figure 19, above, shows the free preview of the images processed by the software. The images
uploaded to their cloud were processed with the latest version of their algorithm (as of September
2012).