Embed Size (px)
Citation preview

Lyang, J., Lee, D., Kung, J. "Reinforced Concrete Bridges." Bridge Engineering Handbook. Ed. Wai-Fah Chen and Lian Duan Boca Raton: CRC Press, 2000

© 2000 by CRC Press LLC
Section II
Superstructure Design
9Reinforced
Concrete Bridges
9.1 Introduction
9.2 MaterialsConcrete • Steel Reinforcement
9.3 Bridge Types Slab Bridges • T-Beam Bridges • Box-Girder Bridges
9.4 Design ConsiderationsBasic Design Theory • Design Limit States • Flexural Strength • Shear Strength • Skewed Concrete Bridges • Design Information • Details of Reinforcement
9.5 Design ExamplesSolid Slab Bridge Design • Box-Girder Bridge Design
9.1 Introduction
The raw materials of concrete, consisting of water, fine aggregate, coarse aggregate, and cement,can be found in most areas of the world and can be mixed to form a variety of structural shapes.The great availability and flexibility of concrete material and reinforcing bars have made thereinforced concrete bridge a very competitive alternative. Reinforced concrete bridges may consistof precast concrete elements, which are fabricated at a production plant and then transportedfor erection at the job site, or cast-in-place concrete, which is formed and cast directly in itssetting location. Cast-in-place concrete structures are often constructed monolithically and con-tinuously. They usually provide a relatively low maintenance cost and better earthquake-resistanceperformance. Cast-in-place concrete structures, however, may not be a good choice when theproject is on a fast-track construction schedule or when the available falsework opening clearanceis limited. In this chapter, various structural types and design considerations for conventionalcast-in-place, reinforced concrete highway bridge are discussed. Two design examples of a simplysupported slab bridge and a two-span box girder bridge are also presented. All design specifica-tions referenced in this chapter are based on 1994 AASHTO LRFD (Load and Resistance FactorDesign) Bridge Design Specifications [1].
Jyouru LyangCalifornia Department
of Transportation
Don LeeCalifornia Department
of Transportation
John KungCalifornia Department
of Transportation
© 2000 by CRC Press LLC
9.2 Materials
9.2.1 Concrete
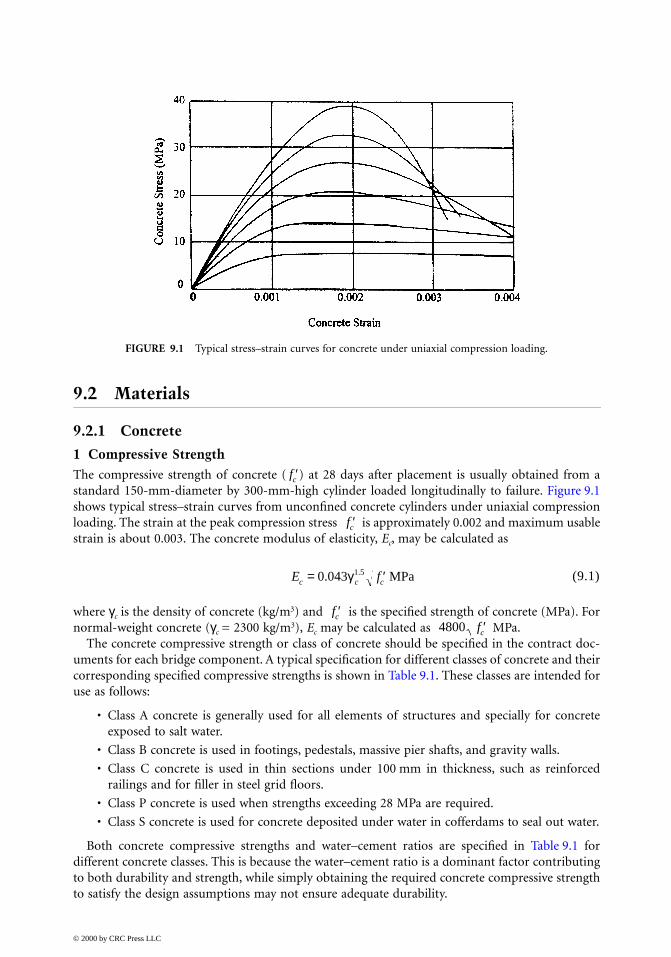
1 Compressive StrengthThe compressive strength of concrete ( ) at 28 days after placement is usually obtained from astandard 150-mm-diameter by 300-mm-high cylinder loaded longitudinally to failure. Figure 9.1shows typical stress–strain curves from unconfined concrete cylinders under uniaxial compressionloading. The strain at the peak compression stress is approximately 0.002 and maximum usablestrain is about 0.003. The concrete modulus of elasticity, Ec, may be calculated as
(9.1)
where γc is the density of concrete (kg/m3) and is the specified strength of concrete (MPa). Fornormal-weight concrete (γc = 2300 kg/m3), Ec may be calculated as MPa.
The concrete compressive strength or class of concrete should be specified in the contract doc-uments for each bridge component. A typical specification for different classes of concrete and theircorresponding specified compressive strengths is shown in Table 9.1. These classes are intended foruse as follows:
• Class A concrete is generally used for all elements of structures and specially for concreteexposed to salt water.
• Class B concrete is used in footings, pedestals, massive pier shafts, and gravity walls.
• Class C concrete is used in thin sections under 100 mm in thickness, such as reinforcedrailings and for filler in steel grid floors.
• Class P concrete is used when strengths exceeding 28 MPa are required.
• Class S concrete is used for concrete deposited under water in cofferdams to seal out water.
Both concrete compressive strengths and water–cement ratios are specified in Table 9.1 fordifferent concrete classes. This is because the water–cement ratio is a dominant factor contributingto both durability and strength, while simply obtaining the required concrete compressive strengthto satisfy the design assumptions may not ensure adequate durability.
FIGURE 9.1 Typical stress–strain curves for concrete under uniaxial compression loading.
′fc
′fc
E fc c c= ′0 043 1 5. .γ MPa
′fc
4800 ′fc
© 2000 by CRC Press LLC
2. Tensile StrengthThe tensile strength of concrete can be measured directly from tension loading. However, fixturesfor holding the specimens are difficult to apply uniform axial tension loading and sometimes willeven introduce unwanted secondary stresses. The direct tension test method is therefore usuallyused to determine the cracking strength of concrete caused by effects other than flexure. For mostregular concrete, the direct tensile strength may be estimated as 10% of the compressive strength.
The tensile strength of concrete may be obtained indirectly by the split tensile strength method.The splitting tensile stress (fs) at which a cylinder is placed horizontally in a testing machine andloaded along a diameter until split failure can be calculated as
fs = 2P/(πLD) (9.2)
where P is the total applied load that splits the cylinder, L is the length of cylinder, and D is thediameter of the cylinder.
The tensile strength of concrete can also be evaluated by means of bending tests conducted onplain concrete beams. The flexural tensile stress, known as the modulus of rupture (fr) is computedfrom the flexural formula M/S, where M is the applied failure bending moment and S is the elasticsection modulus of the beam. Modulus of rupture ( fr) in MPa can be calculated as
fr = (9.3)
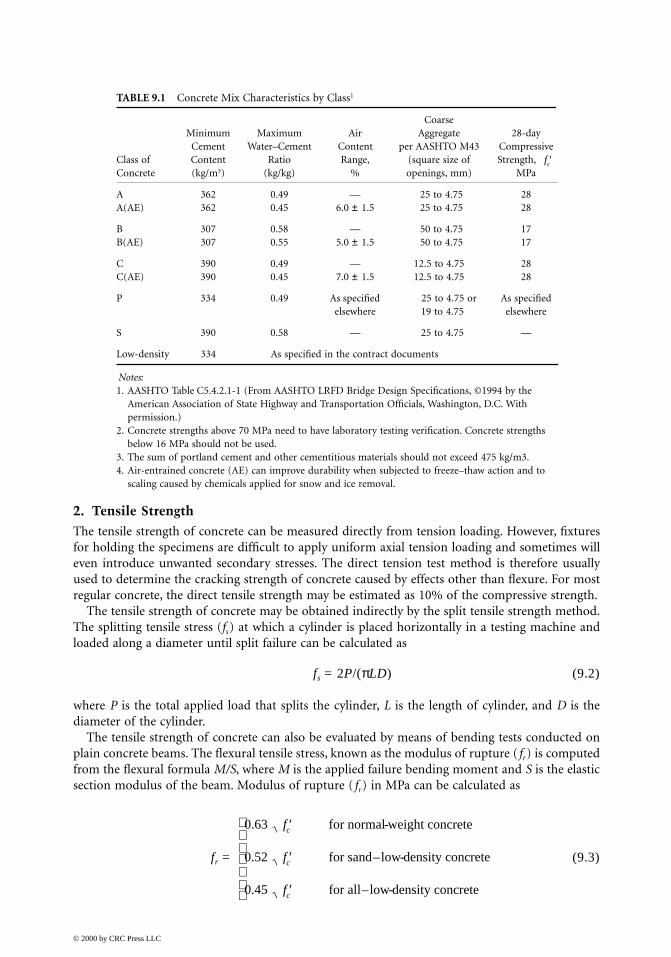
TABLE 9.1 Concrete Mix Characteristics by Class1
CoarseMinimum Maximum Air Aggregate 28-day
Cement Water–Cement Content per AASHTO M43 CompressiveClass of Content Ratio Range, (square size of Strength, Concrete (kg/m3) (kg/kg) % openings, mm) MPa
A 362 0.49 — 25 to 4.75 28A(AE) 362 0.45 6.0 ± 1.5 25 to 4.75 28
B 307 0.58 — 50 to 4.75 17B(AE) 307 0.55 5.0 ± 1.5 50 to 4.75 17
C 390 0.49 — 12.5 to 4.75 28C(AE) 390 0.45 7.0 ± 1.5 12.5 to 4.75 28
P 334 0.49 As specified elsewhere
25 to 4.75 or19 to 4.75
As specified elsewhere
S 390 0.58 — 25 to 4.75 —
Low-density 334 As specified in the contract documents
Notes:1. AASHTO Table C5.4.2.1-1 (From AASHTO LRFD Bridge Design Specifications, ©1994 by the
American Association of State Highway and Transportation Officials, Washington, D.C. With permission.)
2. Concrete strengths above 70 MPa need to have laboratory testing verification. Concrete strengths below 16 MPa should not be used.
3. The sum of portland cement and other cementitious materials should not exceed 475 kg/m3.4. Air-entrained concrete (AE) can improve durability when subjected to freeze–thaw action and to
scaling caused by chemicals applied for snow and ice removal.
′fc
0.63 for normal-weight concrete
0.52 for sand–low-density concrete
0.45 for all–low-density concrete
′
′
′
f
f
f
c
c
c
© 2000 by CRC Press LLC
Both the splitting tensile stress ( fs) and flexural tensile stress (fr) overestimate the tensile crackingstress determined by a direct tension test. However, concrete in tension is usually ignored in strengthcalculations of reinforced concrete members because the tensile strength of concrete is low. Themodulus of elasticity for concrete in tension may be assumed to be the same as in compression.
3. Creep and ShrinkageBoth creep and shrinkage of concrete are time-dependent deformations and are discussed inChapter 10.
9.2.2 Steel Reinforcement
Deformed steel bars are commonly employed as reinforcement in most reinforced concrete bridgeconstruction. The surface of a steel bar is rolled with lugs or protrusions called deformations inorder to restrict longitudinal movement between the bars and the surrounding concrete. Reinforcingbars, rolled according to ASTM A615/A615M specifications (billet steel) [2], are widely used inconstruction. ASTM A706/A706M low-alloy steel deformed bars (Grade 420 only) [2] are specifiedfor special applications where extensive welding of reinforcement or controlled ductility for earth-quake-resistant, reinforced concrete structures or both are of importance.
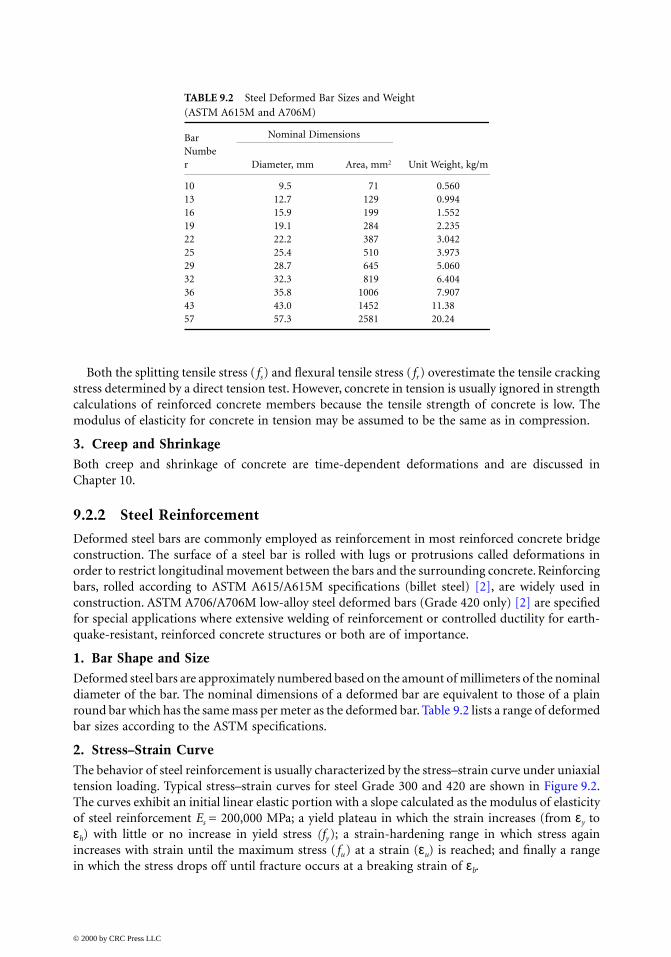
1. Bar Shape and SizeDeformed steel bars are approximately numbered based on the amount of millimeters of the nominaldiameter of the bar. The nominal dimensions of a deformed bar are equivalent to those of a plainround bar which has the same mass per meter as the deformed bar. Table 9.2 lists a range of deformedbar sizes according to the ASTM specifications.
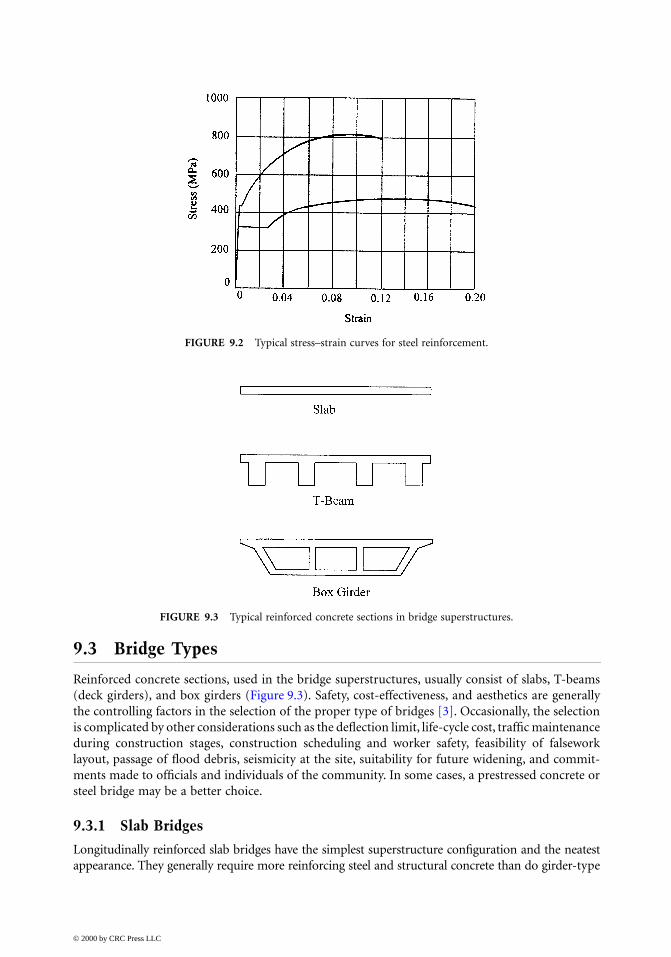
2. Stress–Strain CurveThe behavior of steel reinforcement is usually characterized by the stress–strain curve under uniaxialtension loading. Typical stress–strain curves for steel Grade 300 and 420 are shown in Figure 9.2.The curves exhibit an initial linear elastic portion with a slope calculated as the modulus of elasticityof steel reinforcement Es = 200,000 MPa; a yield plateau in which the strain increases (from εy toεh) with little or no increase in yield stress (fy); a strain-hardening range in which stress againincreases with strain until the maximum stress (fu) at a strain (εu) is reached; and finally a rangein which the stress drops off until fracture occurs at a breaking strain of εb.
TABLE 9.2 Steel Deformed Bar Sizes and Weight (ASTM A615M and A706M)
Bar Nominal Dimensions
Number Diameter, mm Area, mm2 Unit Weight, kg/m
10 9.5 71 0.56013 12.7 129 0.99416 15.9 199 1.55219 19.1 284 2.23522 22.2 387 3.04225 25.4 510 3.97329 28.7 645 5.06032 32.3 819 6.40436 35.8 1006 7.90743 43.0 1452 11.3857 57.3 2581 20.24
© 2000 by CRC Press LLC
9.3 Bridge Types
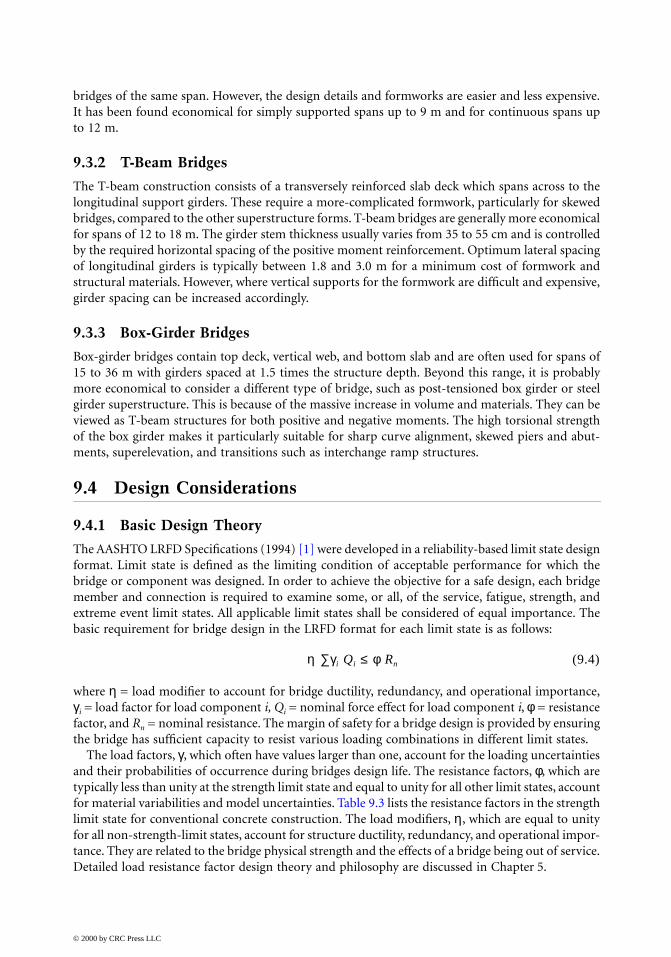
Reinforced concrete sections, used in the bridge superstructures, usually consist of slabs, T-beams(deck girders), and box girders (Figure 9.3). Safety, cost-effectiveness, and aesthetics are generallythe controlling factors in the selection of the proper type of bridges [3]. Occasionally, the selectionis complicated by other considerations such as the deflection limit, life-cycle cost, traffic maintenanceduring construction stages, construction scheduling and worker safety, feasibility of falseworklayout, passage of flood debris, seismicity at the site, suitability for future widening, and commit-ments made to officials and individuals of the community. In some cases, a prestressed concrete orsteel bridge may be a better choice.
9.3.1 Slab Bridges
Longitudinally reinforced slab bridges have the simplest superstructure configuration and the neatestappearance. They generally require more reinforcing steel and structural concrete than do girder-type
FIGURE 9.2 Typical stress–strain curves for steel reinforcement.
FIGURE 9.3 Typical reinforced concrete sections in bridge superstructures.
© 2000 by CRC Press LLC
bridges of the same span. However, the design details and formworks are easier and less expensive.It has been found economical for simply supported spans up to 9 m and for continuous spans upto 12 m.
9.3.2 T-Beam Bridges
The T-beam construction consists of a transversely reinforced slab deck which spans across to thelongitudinal support girders. These require a more-complicated formwork, particularly for skewedbridges, compared to the other superstructure forms. T-beam bridges are generally more economicalfor spans of 12 to 18 m. The girder stem thickness usually varies from 35 to 55 cm and is controlledby the required horizontal spacing of the positive moment reinforcement. Optimum lateral spacingof longitudinal girders is typically between 1.8 and 3.0 m for a minimum cost of formwork andstructural materials. However, where vertical supports for the formwork are difficult and expensive,girder spacing can be increased accordingly.
9.3.3 Box-Girder Bridges
Box-girder bridges contain top deck, vertical web, and bottom slab and are often used for spans of15 to 36 m with girders spaced at 1.5 times the structure depth. Beyond this range, it is probablymore economical to consider a different type of bridge, such as post-tensioned box girder or steelgirder superstructure. This is because of the massive increase in volume and materials. They can beviewed as T-beam structures for both positive and negative moments. The high torsional strengthof the box girder makes it particularly suitable for sharp curve alignment, skewed piers and abut-ments, superelevation, and transitions such as interchange ramp structures.
9.4 Design Considerations
9.4.1 Basic Design Theory
The AASHTO LRFD Specifications (1994) [1] were developed in a reliability-based limit state designformat. Limit state is defined as the limiting condition of acceptable performance for which thebridge or component was designed. In order to achieve the objective for a safe design, each bridgemember and connection is required to examine some, or all, of the service, fatigue, strength, andextreme event limit states. All applicable limit states shall be considered of equal importance. Thebasic requirement for bridge design in the LRFD format for each limit state is as follows:
η ∑γi Qi ≤ φ Rn (9.4)
where η = load modifier to account for bridge ductility, redundancy, and operational importance,γi = load factor for load component i, Qi = nominal force effect for load component i, φ = resistancefactor, and Rn = nominal resistance. The margin of safety for a bridge design is provided by ensuringthe bridge has sufficient capacity to resist various loading combinations in different limit states.
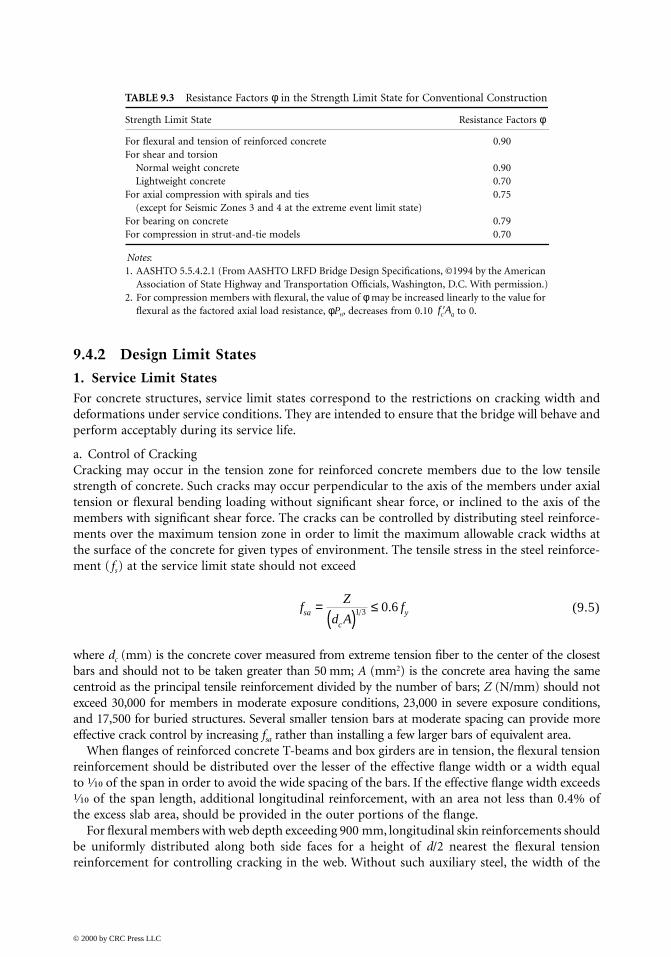
The load factors, γ, which often have values larger than one, account for the loading uncertaintiesand their probabilities of occurrence during bridges design life. The resistance factors, φ, which aretypically less than unity at the strength limit state and equal to unity for all other limit states, accountfor material variabilities and model uncertainties. Table 9.3 lists the resistance factors in the strengthlimit state for conventional concrete construction. The load modifiers, η, which are equal to unityfor all non-strength-limit states, account for structure ductility, redundancy, and operational impor-tance. They are related to the bridge physical strength and the effects of a bridge being out of service.Detailed load resistance factor design theory and philosophy are discussed in Chapter 5.
© 2000 by CRC Press LLC
9.4.2 Design Limit States
1. Service Limit StatesFor concrete structures, service limit states correspond to the restrictions on cracking width anddeformations under service conditions. They are intended to ensure that the bridge will behave andperform acceptably during its service life.
a. Control of CrackingCracking may occur in the tension zone for reinforced concrete members due to the low tensilestrength of concrete. Such cracks may occur perpendicular to the axis of the members under axialtension or flexural bending loading without significant shear force, or inclined to the axis of themembers with significant shear force. The cracks can be controlled by distributing steel reinforce-ments over the maximum tension zone in order to limit the maximum allowable crack widths atthe surface of the concrete for given types of environment. The tensile stress in the steel reinforce-ment ( fs) at the service limit state should not exceed
(9.5)
where dc (mm) is the concrete cover measured from extreme tension fiber to the center of the closestbars and should not to be taken greater than 50 mm; A (mm2) is the concrete area having the samecentroid as the principal tensile reinforcement divided by the number of bars; Z (N/mm) should notexceed 30,000 for members in moderate exposure conditions, 23,000 in severe exposure conditions,and 17,500 for buried structures. Several smaller tension bars at moderate spacing can provide moreeffective crack control by increasing fsa rather than installing a few larger bars of equivalent area.
When flanges of reinforced concrete T-beams and box girders are in tension, the flexural tensionreinforcement should be distributed over the lesser of the effective flange width or a width equalto ¹⁄₁₀ of the span in order to avoid the wide spacing of the bars. If the effective flange width exceeds¹⁄₁₀ of the span length, additional longitudinal reinforcement, with an area not less than 0.4% ofthe excess slab area, should be provided in the outer portions of the flange.
For flexural members with web depth exceeding 900 mm, longitudinal skin reinforcements shouldbe uniformly distributed along both side faces for a height of d/2 nearest the flexural tensionreinforcement for controlling cracking in the web. Without such auxiliary steel, the width of the
TABLE 9.3 Resistance Factors φ in the Strength Limit State for Conventional Construction
Strength Limit State Resistance Factors φ
For flexural and tension of reinforced concrete 0.90For shear and torsion
Normal weight concrete 0.90Lightweight concrete 0.70
For axial compression with spirals and ties 0.75(except for Seismic Zones 3 and 4 at the extreme event limit state)
For bearing on concrete 0.79For compression in strut-and-tie models 0.70
Notes:1. AASHTO 5.5.4.2.1 (From AASHTO LRFD Bridge Design Specifications, ©1994 by the American
Association of State Highway and Transportation Officials, Washington, D.C. With permission.)2. For compression members with flexural, the value of φ may be increased linearly to the value for
flexural as the factored axial load resistance, φPn, decreases from 0.10 to 0.′f Ac g
fZ
d Afsa
c
y=( )
≤1 3 0 6.
© 2000 by CRC Press LLC
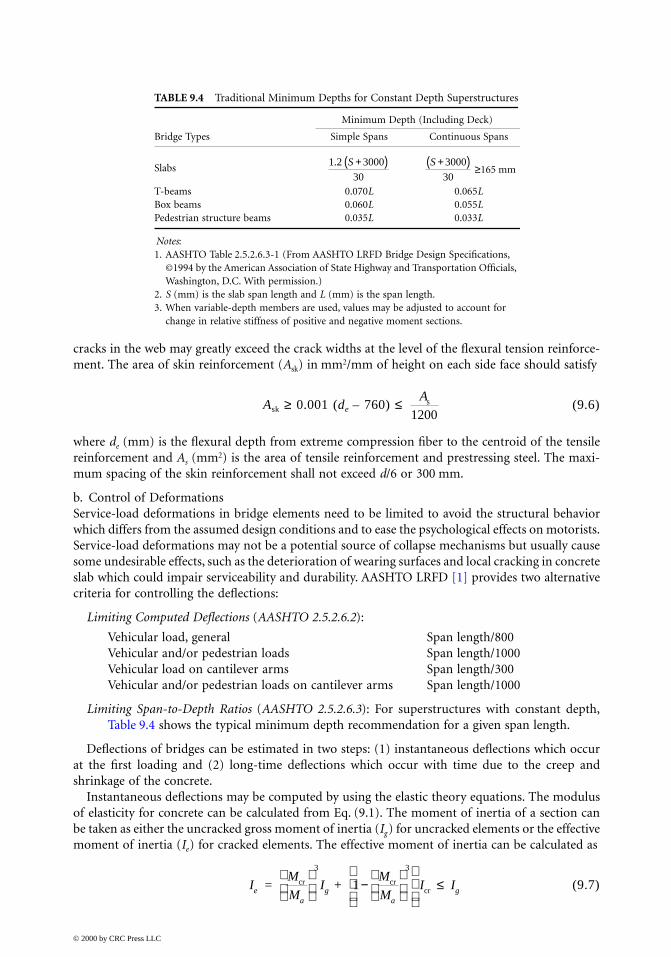
cracks in the web may greatly exceed the crack widths at the level of the flexural tension reinforce-ment. The area of skin reinforcement (Ask) in mm2/mm of height on each side face should satisfy
Ask ≥ 0.001 (de – 760) ≤ (9.6)
where de (mm) is the flexural depth from extreme compression fiber to the centroid of the tensilereinforcement and As (mm2) is the area of tensile reinforcement and prestressing steel. The maxi-mum spacing of the skin reinforcement shall not exceed d/6 or 300 mm.
b. Control of DeformationsService-load deformations in bridge elements need to be limited to avoid the structural behaviorwhich differs from the assumed design conditions and to ease the psychological effects on motorists.Service-load deformations may not be a potential source of collapse mechanisms but usually causesome undesirable effects, such as the deterioration of wearing surfaces and local cracking in concreteslab which could impair serviceability and durability. AASHTO LRFD [1] provides two alternativecriteria for controlling the deflections:
Limiting Computed Deflections (AASHTO 2.5.2.6.2):
Vehicular load, general Span length/800Vehicular and/or pedestrian loads Span length/1000Vehicular load on cantilever arms Span length/300Vehicular and/or pedestrian loads on cantilever arms Span length/1000
Limiting Span-to-Depth Ratios (AASHTO 2.5.2.6.3): For superstructures with constant depth,Table 9.4 shows the typical minimum depth recommendation for a given span length.
Deflections of bridges can be estimated in two steps: (1) instantaneous deflections which occurat the first loading and (2) long-time deflections which occur with time due to the creep andshrinkage of the concrete.
Instantaneous deflections may be computed by using the elastic theory equations. The modulusof elasticity for concrete can be calculated from Eq. (9.1). The moment of inertia of a section canbe taken as either the uncracked gross moment of inertia (Ig) for uncracked elements or the effectivemoment of inertia (Ie) for cracked elements. The effective moment of inertia can be calculated as
(9.7)
TABLE 9.4 Traditional Minimum Depths for Constant Depth Superstructures
Minimum Depth (Including Deck)
Bridge Types Simple Spans Continuous Spans
Slabs ≥165 mm
T-beams 0.070L 0.065LBox beams 0.060L 0.055LPedestrian structure beams 0.035L 0.033L
Notes:1. AASHTO Table 2.5.2.6.3-1 (From AASHTO LRFD Bridge Design Specifications,
©1994 by the American Association of State Highway and Transportation Officials, Washington, D.C. With permission.)
2. S (mm) is the slab span length and L (mm) is the span length.3. When variable-depth members are used, values may be adjusted to account for
change in relative stiffness of positive and negative moment sections.
1 2 3000
30
. S +( ) S +( )3000
30
As
1200
I M
MI
M
MI Ie
ag
ag= + cr
3
cr
3
cr
−
≤1
© 2000 by CRC Press LLC

and
(9.8)
where Mcr is the moment at first cracking, fr is the modulus of rupture, yt is the distance from theneutral axis to the extreme tension fiber, Icr is the moment of inertia of the cracked section trans-formed to concrete (see Section 9.4.6), and Ma is the maximum moment in a component at thestage for which deformation is computed. For prismatic members, the effective moment of inertiamay be calculated at midspan for simple or continuous bridges and at support for cantilevers. Forcontinuous nonprismatic members, the moment of inertia may be calculated as the average of thecritical positive and negative moment sections.
Long-time deflections may be calculated as the instantaneous deflection multiplied by the fol-lowing:
If the instantaneous deflection is based on Ig: 4.0If the instantaneous deflection is based on Ie: 3.0–1.2 ≥ 1.6
where is area of compression reinforcement and As is the area of tension reinforcement.
2. Fatigue Limit StatesFatigue limit states are used to limit stress in steel reinforcements to control concrete crack growthunder repetitive truck loading in order to prevent early fracture failure before the design service lifeof a bridge. Fatigue loading consists of one design truck with a constant spacing of 9000 mm betweenthe 145-kN axles. Fatigue is considered at regions where compressive stress due to permanent loadsis less than two times the maximum tensile live-load stress resulting from the fatigue-load combi-nation. Allowable fatigue stress range in straight reinforcement is limited to
(9.9)
where fmin (MPa) is the minimum stress in reinforcement from fatigue loading (positive for tensionand negative for compression stress) and r/h is the ratio of the base radius to the height of rolled-on transverse deformations (0.3 may be used if the actual value in not known).
The cracked section properties should be used for fatigue. Gross section properties may be usedwhen the sum of stresses, due to unfactored permanent loads, plus 1.5 times the fatigue load is notto exceed the tensile stress of 0.25 .
3. Strength Limit States and Extreme Event Limit StatesFor reinforced concrete structures, strength and extreme event limit states are used to ensure thatstrength and stability are provided to resist specified statistically significant load combinations. Adetailed discussion for these limit states is covered in Chapter 5.
9.4.3 Flexural Strength
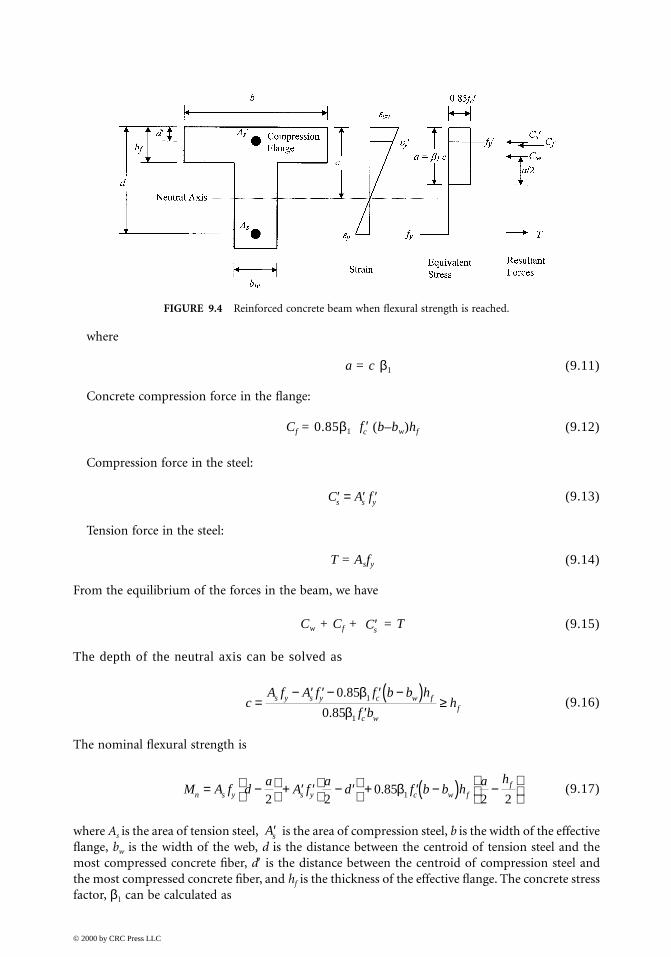
Figure 9.4 shows a doubly reinforced concrete beam when flexural strength is reached and the depthof neutral axis falls outside the compression flange (c > hf). Assume that both tension and compressionsteel are yielding and the concrete compression stress block is in a rectangular shape. εcu is the maximumstrain at the extreme concrete compression fiber and is about 0.003 for unconfined concrete.
Concrete compression force in the web;
Cw = 0.85 abw = 0.85β1 cbw (9.10)
M fI
yrg
tcr =
′( )A As s/
′As
f frhf = − +
145 0 33 55. min
′fc
′fc ′fc
© 2000 by CRC Press LLC
where
a = c β1 (9.11)
Concrete compression force in the flange:
Cf = 0.85β1 (b–bw)hf (9.12)
Compression force in the steel:
(9.13)
Tension force in the steel:
T = Asfy (9.14)
From the equilibrium of the forces in the beam, we have
Cw + Cf + = T (9.15)
The depth of the neutral axis can be solved as
(9.16)
The nominal flexural strength is
(9.17)
where As is the area of tension steel, is the area of compression steel, b is the width of the effectiveflange, bw is the width of the web, d is the distance between the centroid of tension steel and themost compressed concrete fiber, d′ is the distance between the centroid of compression steel andthe most compressed concrete fiber, and hf is the thickness of the effective flange. The concrete stressfactor, β1 can be calculated as
FIGURE 9.4 Reinforced concrete beam when flexural strength is reached.
′fc
′ = ′ ′C A fs s y
′Cs
cA f A f f b b h
f bhs y s y c w f
c wf=
− ′ ′ − ′ −( )′
≥0 85
0 851
1
.
.
ββ
M A f da
A fa
d f b b ha h
n s y s y c w ff= −
+ ′ ′ − ′
+ ′ −( ) −
2 2
0 852 21. β
′As
© 2000 by CRC Press LLC

β1 = (9.18)
Limits for reinforcement are
• Maximum tensile reinforcement:
(9.19)
When Eq. (9.19) is not satisfied, the reinforced concrete sections become overreinforced and willhave sudden brittle compression failure if they are not well confined.
• Minimum tensile reinforcement:
ρmin ≥ 0.03 , where ρmin = ratio of tension steel to gross area (9.20)
When Eq. (9.20) is not satisfied, the reinforced concrete sections become underreinforced andwill have sudden tension steel fracture failure.
The strain diagram can be used to verify compression steel yielding assumption.
(9.21)
If compression steel is not yielding as checked from Eqs. (9.21). The depth of neutral axis, c, andvalue of nominal flexural strength, Mn, calculated from Eqs. (9.16) and (9.17) are incorrect. Theactual forces applied in compression steel reinforcement can be calculated as
(9.22)
The depth of neutral axis, c, can be solved by substituting Eqs. (9.22) into forces equilibriumEq. (9.15). The flexural strength, Mn, can then be obtained from Eq. (9.17) with the actual appliedcompression steel forces. In a typical beam design, the tension steel will always be yielding and thecompression steel is close to reaching yielding strength as well.
If the depth of the neutral axis falls within the compression flange (x ≤ hf) or for sections withoutcompression flange, then the depth of the neutral axis, c, and the value of nominal flexural strength,Mn, can be calculated by setting bw equal to b.
9.4.4 Shear Strength
1. Strut-and-Tie ModelThe strut-and-tie model should be used for shear and torsion designs of bridge components atlocations near discontinuities, such as regions adjacent to abrupt changes in the cross section,openings, and dapped ends. The model should also be used for designing deep footings and pile
0.85 for 28 MPa
for 28 MPa 56 MPa
0.65 for 56 MPa
f
ff
f
c
cc
c
′ ≤
− ′ −
≤ ′ ≤
′ ≥
0 85 0 0528
7. .
cd
≤ 0 42.
′′
f
fc
y
′ = ′ ′ = − ′
≥
′f f
c dc
f
Es y s cuy
s
if ε ε
′ = ′ ′ = ′ ′ = −
′C A f A E A
d cc
Es s s s s s s cu sε ε
© 2000 by CRC Press LLC
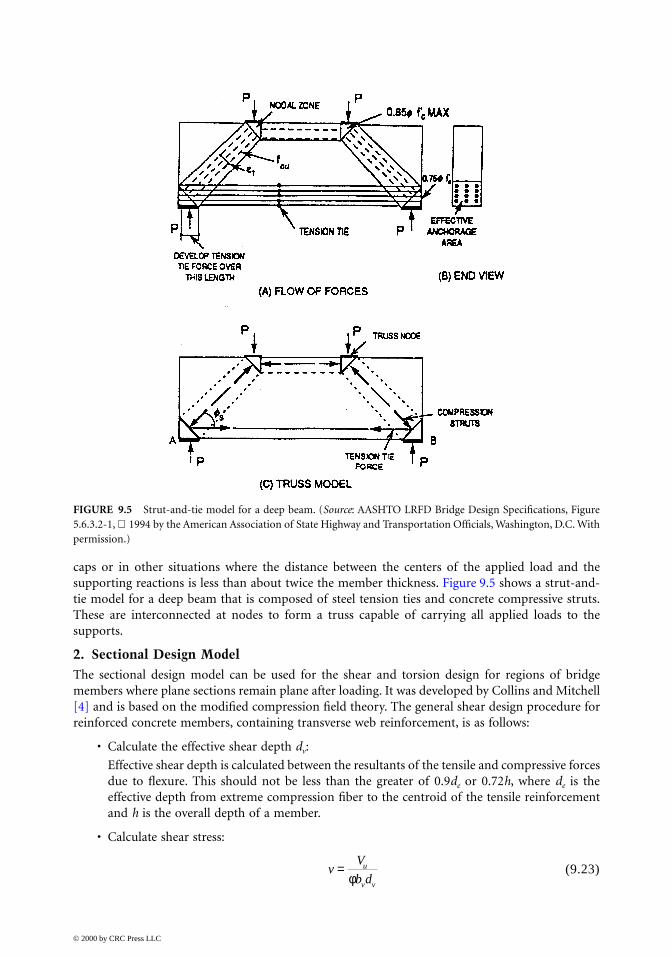
caps or in other situations where the distance between the centers of the applied load and thesupporting reactions is less than about twice the member thickness. Figure 9.5 shows a strut-and-tie model for a deep beam that is composed of steel tension ties and concrete compressive struts.These are interconnected at nodes to form a truss capable of carrying all applied loads to thesupports.
2. Sectional Design ModelThe sectional design model can be used for the shear and torsion design for regions of bridgemembers where plane sections remain plane after loading. It was developed by Collins and Mitchell[4] and is based on the modified compression field theory. The general shear design procedure forreinforced concrete members, containing transverse web reinforcement, is as follows:
• Calculate the effective shear depth dv:
Effective shear depth is calculated between the resultants of the tensile and compressive forcesdue to flexure. This should not be less than the greater of 0.9de or 0.72h, where de is theeffective depth from extreme compression fiber to the centroid of the tensile reinforcementand h is the overall depth of a member.
• Calculate shear stress:
(9.23)
FIGURE 9.5 Strut-and-tie model for a deep beam. (Source: AASHTO LRFD Bridge Design Specifications, Figure5.6.3.2-1, 1994 by the American Association of State Highway and Transportation Officials, Washington, D.C. Withpermission.)
vV
b du
v v
=φ
© 2000 by CRC Press LLC
where bv is the equivalent web width and Vu is the factored shear demand envelope from thestrength limit state.
• Calculate if this ratio is greater than 0.25, then a larger web section needs to be used.
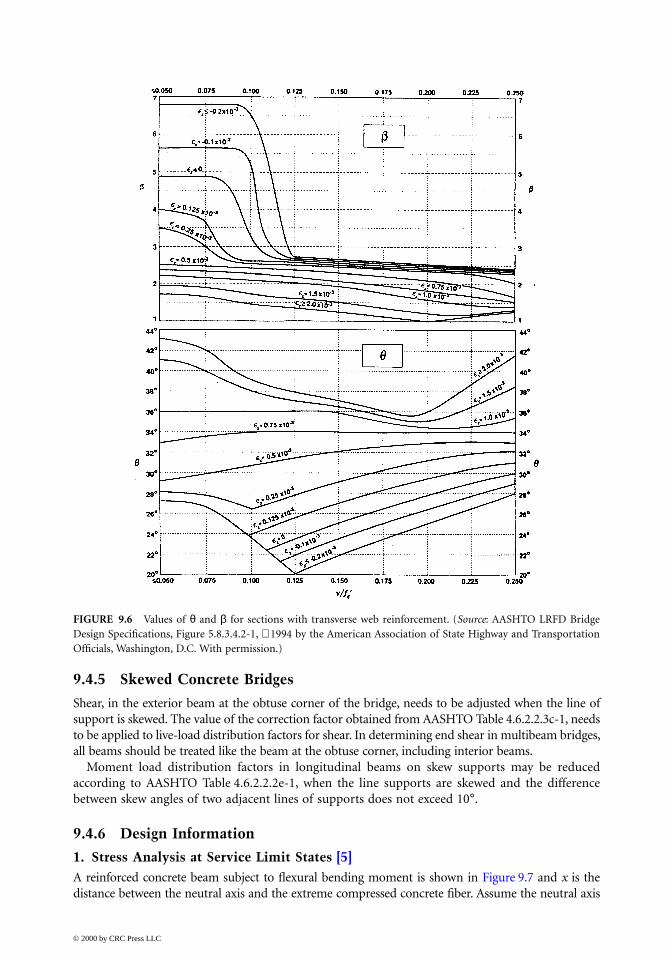
• Assume an angle of inclination of the diagonal compressive stresses, θ, and calculate the strainin the flexural tension reinforcement:
(9.24)
where Mu is the factored moment demand. It is conservative to take Mu enveloped from thestrength limit state that will occur at that section, rather than a moment coincident with Vu.
• Use the calculated and εx to find θ from Figure 9.6 and compare it with the valueassumed. Repeat the above procedure until the assumed θ is reasonably close to the valuefound from Figure 9.6. Then record the value of β, a factor which indicates the ability ofdiagonally cracked concrete to transmit tension.
• Calculate the required transverse web reinforcement strength, Vs:
(9.25)
where Vc is the nominal concrete shear resistance.
• Calculate the required spacing for the transverse web reinforcement:
(9.26)
where Av is the area of a transverse web reinforcement within distance s.
Check for the minimum transverse web reinforcement requirement:
(9.27)
Check for the maximum spacing requirement for transverse web reinforcements:
if Vu < 0.1 bvdv , then s ≤ 0.8dv ≤ 600 mm (9.28)
if Vu ≥ 0.1 bvdv , then s ≤ 0.4dv ≤ 300 mm (9.29)
• Check the adequacy of the longitudinal reinforcements to avoid yielding due to the combinedloading of moment, axial load, and shear.
(9.30)
If the above equation is not satisfied, then you need either to add more longitudinal rein-forcement or to increase the amount of transverse web reinforcement.
v fc′,
εθ
x
u
vu
s s
M
dV
E A=
+ 0 5. cot
v fc′
VV
VV
f b dsu
cu
c v v= − = − ′φ φ
β0 083.
sA f d
Vv y v
s
≤cot θ
A fb S
fs
A f
f bv cv
y
v y
c v
≥ ′ ≤′
0 0830 083
..
or
′fc
′fc
A fM
d
VVs y
u
v
us≥ + −
φ φ
θ0 5. cot
© 2000 by CRC Press LLC
9.4.5 Skewed Concrete Bridges
Shear, in the exterior beam at the obtuse corner of the bridge, needs to be adjusted when the line ofsupport is skewed. The value of the correction factor obtained from AASHTO Table 4.6.2.2.3c-1, needsto be applied to live-load distribution factors for shear. In determining end shear in multibeam bridges,all beams should be treated like the beam at the obtuse corner, including interior beams.
Moment load distribution factors in longitudinal beams on skew supports may be reducedaccording to AASHTO Table 4.6.2.2.2e-1, when the line supports are skewed and the differencebetween skew angles of two adjacent lines of supports does not exceed 10°.
9.4.6 Design Information
1. Stress Analysis at Service Limit States [5]A reinforced concrete beam subject to flexural bending moment is shown in Figure 9.7 and x is thedistance between the neutral axis and the extreme compressed concrete fiber. Assume the neutral axis
FIGURE 9.6 Values of θ and β for sections with transverse web reinforcement. (Source: AASHTO LRFD BridgeDesign Specifications, Figure 5.8.3.4.2-1, 1994 by the American Association of State Highway and TransportationOfficials, Washington, D.C. With permission.)
© 2000 by CRC Press LLC
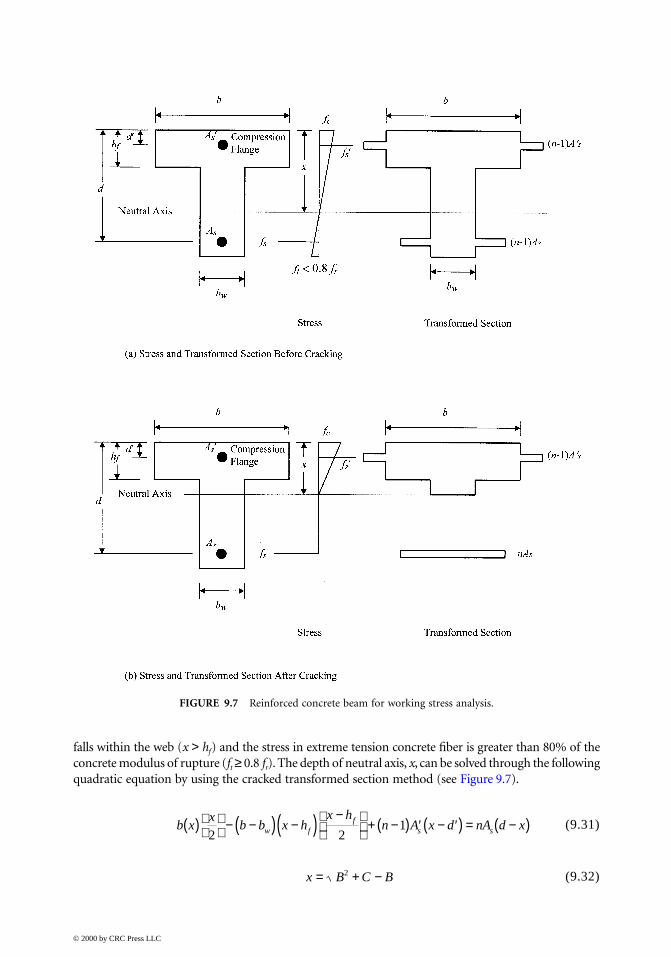
falls within the web (x > hf) and the stress in extreme tension concrete fiber is greater than 80% of theconcrete modulus of rupture (ft ≥ 0.8 fr). The depth of neutral axis, x, can be solved through the followingquadratic equation by using the cracked transformed section method (see Figure 9.7).
(9.31)
(9.32)
FIGURE 9.7 Reinforced concrete beam for working stress analysis.
b xx
b b x hx h
n A x d nA d xw ff
s s( ) − −( ) −( ) −
+ −( ) ′ − ′( ) = −( )2 2
1
x B C B= + −2
© 2000 by CRC Press LLC
where
(9.33)
(9.34)
and the moment of inertia of the cracked transformed section about the neutral axis:
(9.35)
if the calculated neutral axis falls within the compression flange (x ≤ hf) or for sections withoutcompression flange, the depth of neutral axis, x, and cracked moment of inertia, Icr, can be calculatedby setting bw equal to b.
Stress in extreme compressed concrete fiber:
(9.36)
Stress in compression steel:
(9.37)
Stress in tension steel:
(9.38)
where
(9.39)
and M is moment demand enveloped from the service limit state.
2. Effective Flange Width (AASHTO 4.6.2.6)When reinforced concrete slab and girders are constructed monolithically, the effective flange width(beff) of a concrete slab, which will interact with girders in composite action, may be calculated as
For interior beams:
(9.40)
Bb
h b b nA n Aw
f w s s= −( ) + + −( ) ′[ ]11
Cb
hb b ndA n d A
w
fw s s= −( ) + + −( ) ′ ′
22
12
I bx b b x h nA d x n A x dw f s scr = − −( ) −( ) + −( ) + − ′ − ′( )13
13
133 2 2
( )
fMxIc =
cr
′ = − ′ = − ′
f
nM x dI
nfdxs c
( )
cr
1
fnM d x
Inf
dxs
crc= − = −
( )1
nE
Es
c
=
b
l
t bI
s weff
eff
the smallest of
the average spacing of adjacent beams
= +
4
12
© 2000 by CRC Press LLC
For exterior beams:
(9.41)
where the effective span length (leff) may be calculated as the actual span for simply supported spans.Also, the distance between the points of permanent load inflection for continuous spans of eitherpositive or negative moments (ts) is the average thickness of the slab, and bw is the greater of webthickness or one half the width of the top flange of the girder.
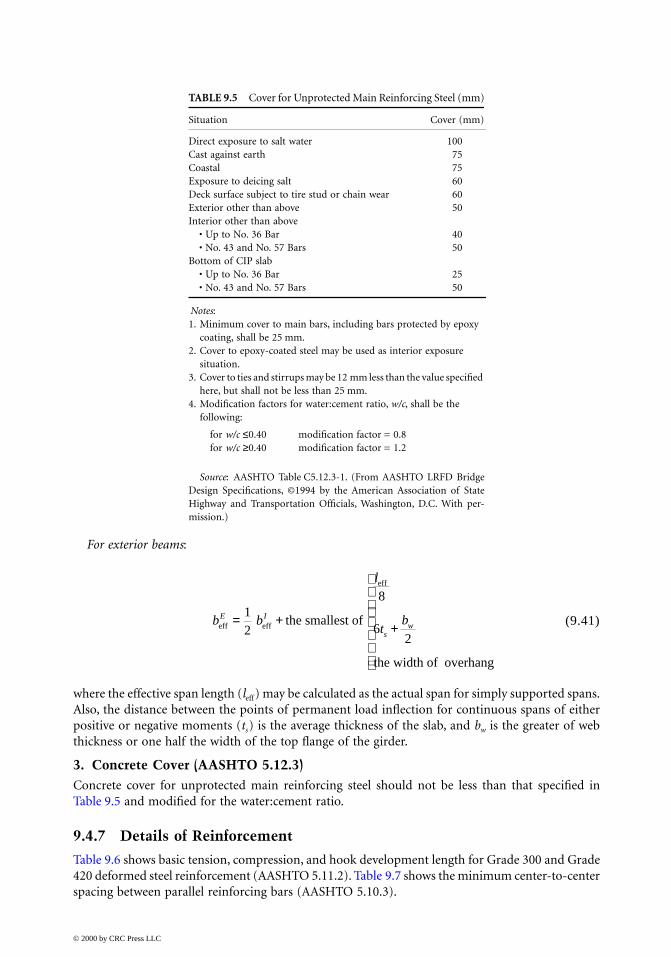
3. Concrete Cover (AASHTO 5.12.3)Concrete cover for unprotected main reinforcing steel should not be less than that specified inTable 9.5 and modified for the water:cement ratio.
9.4.7 Details of Reinforcement
Table 9.6 shows basic tension, compression, and hook development length for Grade 300 and Grade420 deformed steel reinforcement (AASHTO 5.11.2). Table 9.7 shows the minimum center-to-centerspacing between parallel reinforcing bars (AASHTO 5.10.3).
TABLE 9.5 Cover for Unprotected Main Reinforcing Steel (mm)
Situation Cover (mm)
Direct exposure to salt water 100Cast against earth 75Coastal 75Exposure to deicing salt 60Deck surface subject to tire stud or chain wear 60Exterior other than above 50Interior other than above
• Up to No. 36 Bar 40• No. 43 and No. 57 Bars 50
Bottom of CIP slab• Up to No. 36 Bar 25• No. 43 and No. 57 Bars 50
Notes:1. Minimum cover to main bars, including bars protected by epoxy
coating, shall be 25 mm.2. Cover to epoxy-coated steel may be used as interior exposure
situation.3. Cover to ties and stirrups may be 12 mm less than the value specified
here, but shall not be less than 25 mm.4. Modification factors for water:cement ratio, w/c, shall be the
following:
for w/c ≤0.40 modification factor = 0.8for w/c ≥0.40 modification factor = 1.2
Source: AASHTO Table C5.12.3-1. (From AASHTO LRFD BridgeDesign Specifications, ©1994 by the American Association of StateHighway and Transportation Officials, Washington, D.C. With per-mission.)
b b
l
tbE I
sweff eff
eff
the smallest of
the width of overhang
= + +
12
8
62
© 2000 by CRC Press LLC
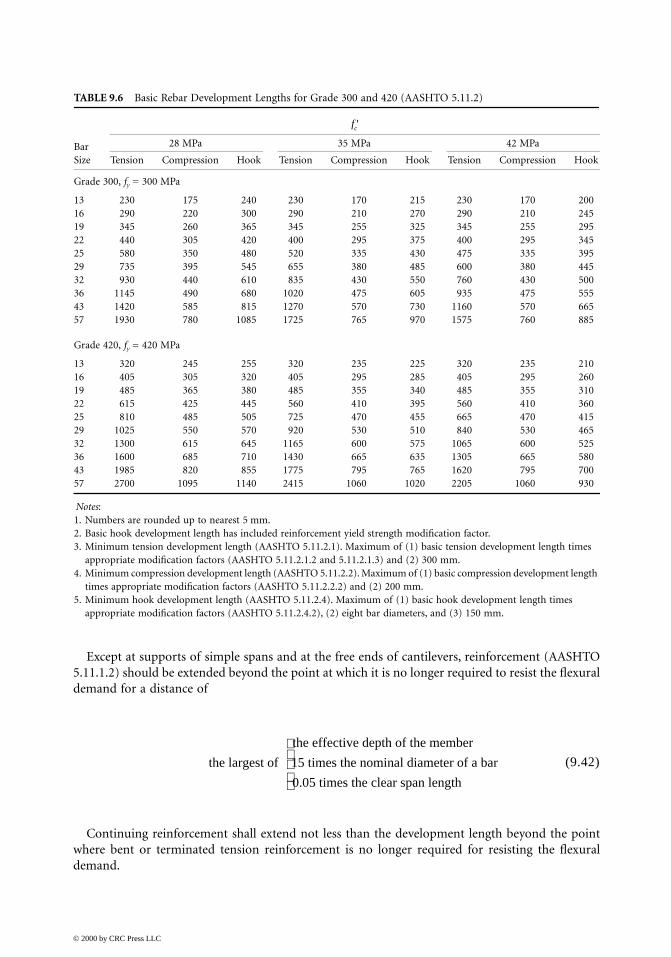
Except at supports of simple spans and at the free ends of cantilevers, reinforcement (AASHTO5.11.1.2) should be extended beyond the point at which it is no longer required to resist the flexuraldemand for a distance of
(9.42)
Continuing reinforcement shall extend not less than the development length beyond the pointwhere bent or terminated tension reinforcement is no longer required for resisting the flexuraldemand.
TABLE 9.6 Basic Rebar Development Lengths for Grade 300 and 420 (AASHTO 5.11.2)
Bar Size
28 MPa 35 MPa 42 MPa
Tension Compression Hook Tension Compression Hook Tension Compression Hook
Grade 300, fy = 300 MPa
13 230 175 240 230 170 215 230 170 20016 290 220 300 290 210 270 290 210 24519 345 260 365 345 255 325 345 255 29522 440 305 420 400 295 375 400 295 34525 580 350 480 520 335 430 475 335 39529 735 395 545 655 380 485 600 380 44532 930 440 610 835 430 550 760 430 50036 1145 490 680 1020 475 605 935 475 55543 1420 585 815 1270 570 730 1160 570 66557 1930 780 1085 1725 765 970 1575 760 885
Grade 420, fy = 420 MPa
13 320 245 255 320 235 225 320 235 21016 405 305 320 405 295 285 405 295 26019 485 365 380 485 355 340 485 355 31022 615 425 445 560 410 395 560 410 36025 810 485 505 725 470 455 665 470 41529 1025 550 570 920 530 510 840 530 46532 1300 615 645 1165 600 575 1065 600 52536 1600 685 710 1430 665 635 1305 665 58043 1985 820 855 1775 795 765 1620 795 70057 2700 1095 1140 2415 1060 1020 2205 1060 930
Notes:1. Numbers are rounded up to nearest 5 mm.2. Basic hook development length has included reinforcement yield strength modification factor.3. Minimum tension development length (AASHTO 5.11.2.1). Maximum of (1) basic tension development length times
appropriate modification factors (AASHTO 5.11.2.1.2 and 5.11.2.1.3) and (2) 300 mm.4. Minimum compression development length (AASHTO 5.11.2.2). Maximum of (1) basic compression development length
times appropriate modification factors (AASHTO 5.11.2.2.2) and (2) 200 mm.5. Minimum hook development length (AASHTO 5.11.2.4). Maximum of (1) basic hook development length times
appropriate modification factors (AASHTO 5.11.2.4.2), (2) eight bar diameters, and (3) 150 mm.
′fc
the largest of
the effective depth of the member
15 times the nominal diameter of a bar
0.05 times the clear span length
© 2000 by CRC Press LLC
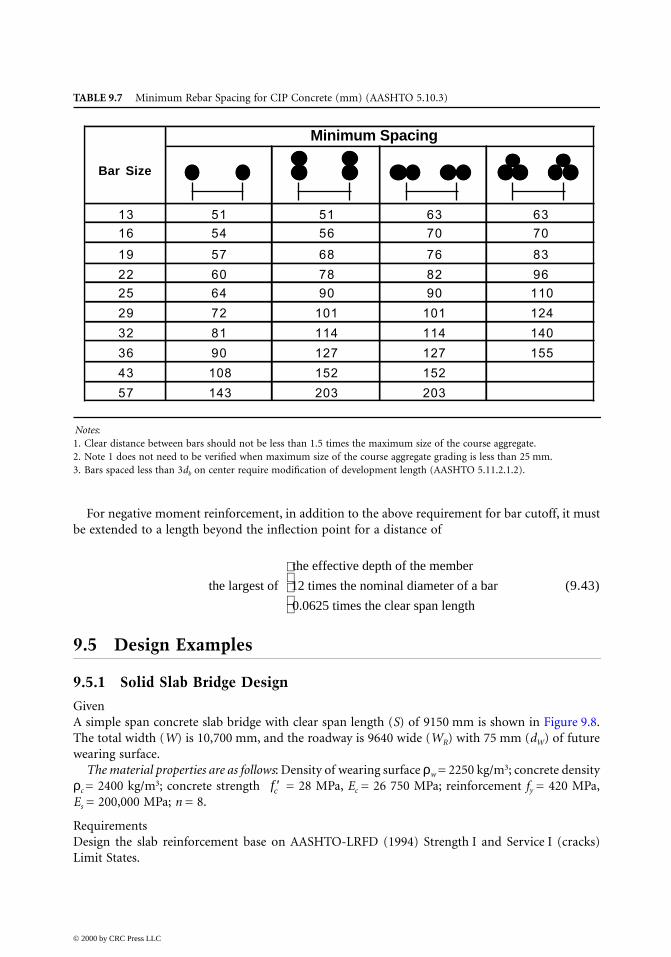
For negative moment reinforcement, in addition to the above requirement for bar cutoff, it mustbe extended to a length beyond the inflection point for a distance of
(9.43)
9.5 Design Examples
9.5.1 Solid Slab Bridge Design
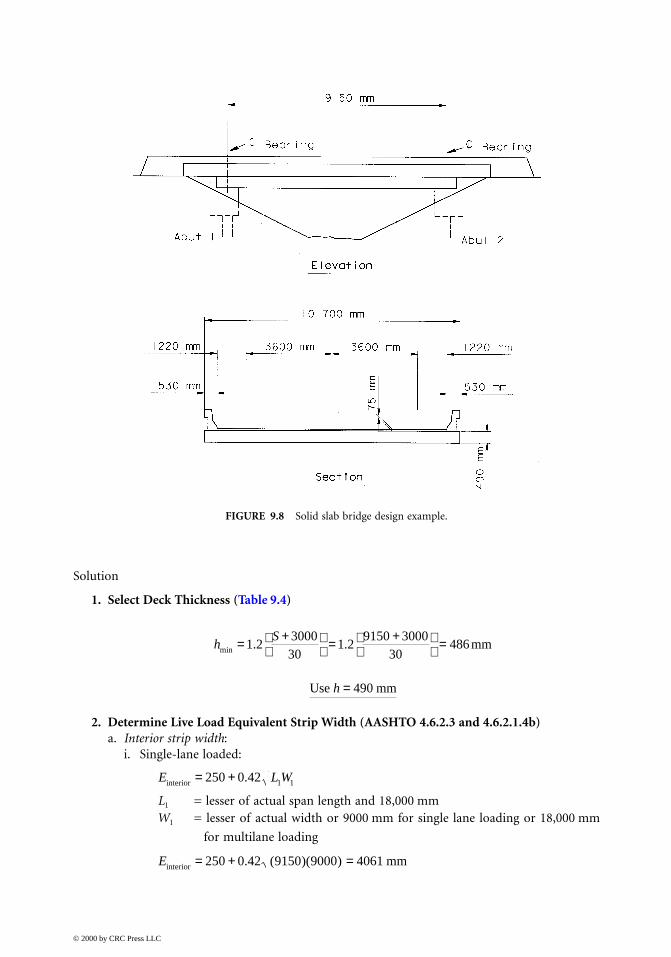
GivenA simple span concrete slab bridge with clear span length (S) of 9150 mm is shown in Figure 9.8.The total width (W) is 10,700 mm, and the roadway is 9640 wide (WR) with 75 mm (dW) of futurewearing surface.
The material properties are as follows: Density of wearing surface ρw = 2250 kg/m3; concrete densityρc = 2400 kg/m3; concrete strength = 28 MPa, Ec = 26 750 MPa; reinforcement fy = 420 MPa,Es = 200,000 MPa; n = 8.
RequirementsDesign the slab reinforcement base on AASHTO-LRFD (1994) Strength I and Service I (cracks)Limit States.
TABLE 9.7 Minimum Rebar Spacing for CIP Concrete (mm) (AASHTO 5.10.3)
Notes:1. Clear distance between bars should not be less than 1.5 times the maximum size of the course aggregate.2. Note 1 does not need to be verified when maximum size of the course aggregate grading is less than 25 mm.3. Bars spaced less than 3db on center require modification of development length (AASHTO 5.11.2.1.2).
Minimum Spacing
Bar Size
13 51 51 63 63
16 54 56 70 70
19 57 68 76 83
22 60 78 82 96
25 64 90 90 110
29 72 101 101 124
32 81 114 114 140
36 90 127 127 155
43 108 152 152
57 143 203 203
the largest of
the effective depth of the member
12 times the nominal diameter of a bar
0.0625 times the clear span length
′fc
© 2000 by CRC Press LLC
Solution
1. Select Deck Thickness (Table 9.4)
2. Determine Live Load Equivalent Strip Width (AASHTO 4.6.2.3 and 4.6.2.1.4b) a. Interior strip width:
i. Single-lane loaded:
L1 = lesser of actual span length and 18,000 mmW1 = lesser of actual width or 9000 mm for single lane loading or 18,000 mm
for multilane loading
FIGURE 9.8 Solid slab bridge design example.
hS
min . .= +
= +
=1 2
300030
1 29150 3000
30486 mm
Use mmh = 490
E L Winterior = +250 0 42 1 1.
Einterior mm= + =250 0 42 9150 9000 4061. ( )( )
© 2000 by CRC Press LLC
ii. Multilane loaded:
NL = INT
b. Edge strip width:
Eedge = the distance between the edge of the deck and the inside face of the barrier + 300 mm + ½ strip width < full strip or 1800 mm
Eedge = 530 + 300 + = 2324 mm > 1800 mm
3. Dead Load Slab: Wslab = (0.49) (2400) (9.81) (10–3) = 11.54 Future wearing: Wfw = (0.075) (2250) (9.81) (10–3) = 1.66 Assume 0.24 m3 concrete per linear meter of concrete barrierConcrete barrier: Wbarrier = (0.24) (2400) (9.81) (10–3) = 5.65
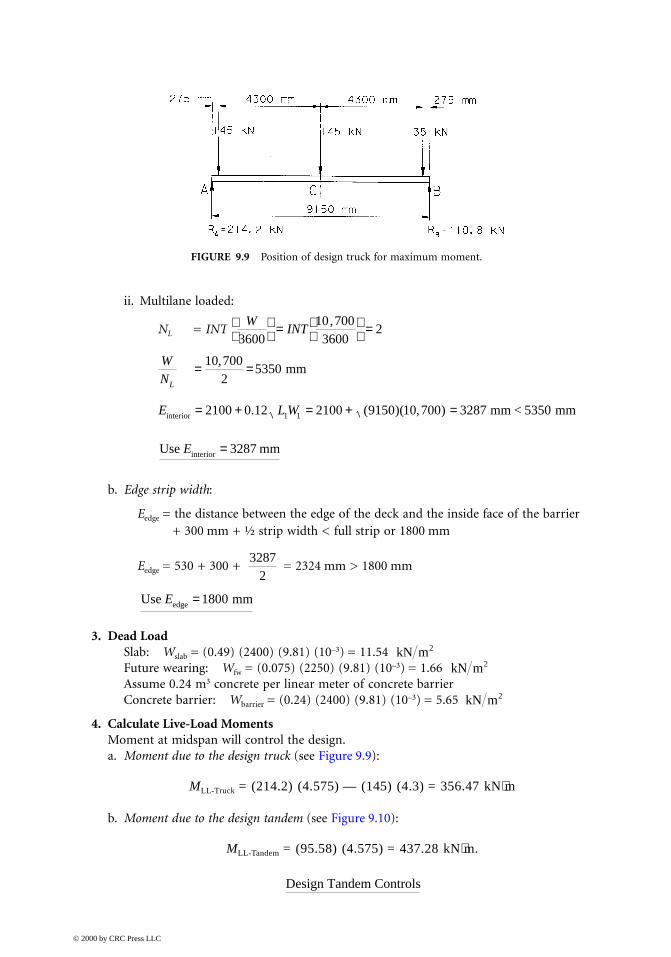
4. Calculate Live-Load Moments Moment at midspan will control the design.a. Moment due to the design truck (see Figure 9.9):
MLL-Truck = (214.2) (4.575) — (145) (4.3) = 356.47 kN⋅m
b. Moment due to the design tandem (see Figure 9.10):
MLL-Tandem = (95.58) (4.575) = 437.28 kN⋅m.
FIGURE 9.9 Position of design truck for maximum moment.
WINT
360010 700
36002
=
=,
WNL
= =10 7002
5350,
mm
E L Winterior mm < 5350 mm= + = + =2100 0 12 2100 9150 10 700 32871 1. ( )( , )
Use 3287 mminteriorE =
32872
Use mmedgeE =1800
kN m2
kN m2
kN m2
Design Tandem Controls
© 2000 by CRC Press LLC

c. Moment due to lane load:
MLL-Lane = = 97.32 kN⋅m
5. Determine Load Factors (AASHTO Table 3.4.1-1) and Load Combinations (AASHTO 1.3.3-5) a. Strength I Limit State load factors:
Weight of superstructure (DC): 1.25Weight of wearing surface (DW): 1.50Live Load (LL): 1.75η = 0.95, η = 1.05, η = 0.95η = (0.95)(1.05)(0.95) = 0.948 ≤ 0.95
b. Interior strip moment (1 m wide) (AASHTO 3.6.2.1 and 3.6.1.2.4):
Dynamic load factor IM = 0.33
Lane load MLL-Lane = kN⋅m
Live load MLL+IM = kN⋅m
Future wearing MDW = kN⋅m
Dead load MDC = kN⋅m
Factored moment MU = η[1.25(MDC) + 1.50(MDW) + 1.75(M LL+IM)]= (0.95) [1.25 (120.77) + (1.50) (17.37) + (1.75) (206.54)]= 511.54 kN⋅m
c. Edge strip moment (1 m wide) (AASHTO Table 3.6.1.1.2-1):
End strip is limited to half lane width, use multiple presence factor 1.2 and half designlane load.
FIGURE 9.10 Position of tandem for maximum moment.
( . )( . )9 3 9 158
2
d R I
Use = 0.95η
97 323 287
29 61.
..
=
( . ).
.. .1 0 33
437 283 287
29 61 206 54+
+ =
W Lfw2 2
81 66 9 15
817 37= =( . )( . )
.
W Lslab2 2
811 54 9 15
8120 77= =( . )( . )
.
© 2000 by CRC Press LLC
Lane load MLL-Lane = (1.2) kN⋅m
Live load MLL+IM = (1 + 0.33)(1.2) kN⋅m
Dead load MDC = kN⋅m
Future wearing MDW = kN⋅m
Factored moment MU = (0.95)[(1.25) (153.63) + (1.50)(12.25) + (1.75)(226.3)] = 579.12 kN⋅m
6. Reinforcement Design a. Interior strip:
Assume No. 25 bars, d = 490 – 25 – = 452.5 mm.
The required reinforcements are calculated using Eqs. (9.11), (9.16), and (9.17).
Neglect the compression steel and set bw = b for sections without compression flange.
As can be solved by substituting a into Mu or
N/mm
m =
Required reinforced steel As = ρbd = (0.00705)(1000)(452.5) = 3189 mm2/m.
Maximum allowed spacing of No. 25 bar = 510/3189 = 0.160 m.
Try No. 25 bars at 150 mm.i. Check limits for reinforcement:
β1 = 0.85 for = 28 MPa; see Eq. (9.18)
from Eqs. (9.19),
OK
12
97 31 8
32 44
=.
..
12
437 281 8
32 44 226 3
+ =.
.. .
11 545 651 8
9 158
153 632
...
..+
=
( . ). .
..
.1 661 8 0 53
1 89 15
812 25
2−
=
252
M A f da
a cA f
f bu s ys y
c w
= −
= =
′φ β
2 0 851and.
RM
bduu= = × =
φ 2
6
2
511 54 100 9 1000 452 5
2 766.
( . )( )( . ).
f
fy
c( . ) ( . )( ).
0 85420
0 85 2817 647
′= =
ρ = − −
= − −
=1
1 12 1
17 6471 1
2 17 647 2 776420
0 00705m
mR
fu
y .( . )( . )
.
′fc
cA f
f bs y
c w
=′
= ( )( )( )( )( ) =
0 85510 420
0 85 0 85 28 15070 6
1. . ..
β mm
cd
= = ≤70 79452 5
0 156 0 42.
.. .
© 2000 by CRC Press LLC
from Eqs. (9.20),
OK
ii. Check crack control:Service load moment Msa = 1.0[1.0(MDC) + 1.0(MDW) + 1.0(M LL+IM)]
= [120.77 + 17.37 + (176.93 + 29.61)]= 344.68 kN⋅m
MPa
, Section is cracked
Cracked moment of inertia can be calculated by using Eqs. (9.32) to (9.35).
n = 8, b = 150.0 mm, As = 510 mm, d = 452.5 mm.
mm
From Eq. (9.38) MPa
Allowable tensile stress in the reinforcement can be calculated from Eq. (9.5) with Z =23,000 N/mm for moderate exposure and
mm
MPa ≥ 0.6fy = 0.6 (420) = 252 MPa
OK
for interior strip
b. Edge strip:By similar procedure, Edge Strip
ρmin ( )( . ). ( . ) .= = ≥
=510
150 452 50 007 51 0 03
28420
0 002
0 8 0 8 0 63 0 8 0 63 28 2 66. . ( . ) . ( . ) .f fr c= ′ = =
fM
Sfc
sar= = = ≥344 680
16
4908 61 0 8
2
,
( ). . ;MPa
Bb
nAs= = =1 1150
8 510 27 2( ) ( )( ) .
Cb
ndAs= = =2 2150
8 452 5 510 24616( ) ( )( . )( )
x B C B= + − + − =2 24616 27 2 132 = (27.2)2 ( ) ( . )
I bx nA d xcr s= + − = + − = ×13
13
150 132 8 510 452 5 132 534 1 103 2 3 2 6 4( ) ( )( ) ( )( )( . ) . mm
f nM d x
Issa
cr
=−
= −×
=( )
( )( , )( . )
.8
344 680 452 5 132534 1 10
2486
dc = + =25252
37 5.
A dc= × = =2 2 37 5 150 11 250bar spacing mm( )( . )( ) ,
fZ
d Afsa
cy= ≤
( ).1 3 0 6
fsa =[ ]
= =23 00037 5 11 250
23 00075
3071 3,
( . )( , ),
f fs sa= ≤ =248 252MPa MPa,
Use No. 25 Bar @150 mm
Use No. 25 bar at 125 mm
© 2000 by CRC Press LLC

7. Determine Distribution Reinforcement (AASHTO 5.14.4.1) The bottom transverse reinforcement may be calculated as a percentage of the main rein-forcement for positive moment:
%, that is, ≤ 50%
a. Interior strip:Main reinforcement: No. 25 at150 mm,
mm2/mm.
Required transverse reinforcement = (0.183)(3.40) = 0.622 mm2/mm
transverse bottom bars,
mm2/mm
b. End strip:Main reinforcement: No. 25 at 125 mm,
mm2/mm
Required transverse reinforcement = (0.183)(4.08) = 0.746 mm2/mm
As = 0.79 mm2/mm.
For construction consideration, across entire width of the bridge.
8. Determine Shrinkage and Temperature Reinforcement (AASHTO 5.10.8) Temperature
mm2/mm in each direction
Top layer = 0.875/2 = 0.438 mm2/mm
transverse top bars, As = 0.430 mm2/mm
9. Design Sketch See Figure 9.11 for design sketch in transverse section.
10. Summary To complete the design, loading combinations for all limit states need to be checked. Designpractice should also give consideration to long-term deflection, cracking in the support areafor longer or continuous spans. For large skew bridges, alteration in main rebar placementis essential.
175050
L≤ 1750
915018 3= . %
As = =510150
3 40.
Use No. 16 @ 300 mm
As = =199300
0 663.
As = =510125
4 08.
Use No. 16 at 250 mm,
Use No. 16 @250 mm
AA
fsg
y
≥ = =0 75 0 751 490
4200 875. .
( )( ).
Use No. 13 @ 300 mm
© 2000 by CRC Press LLC
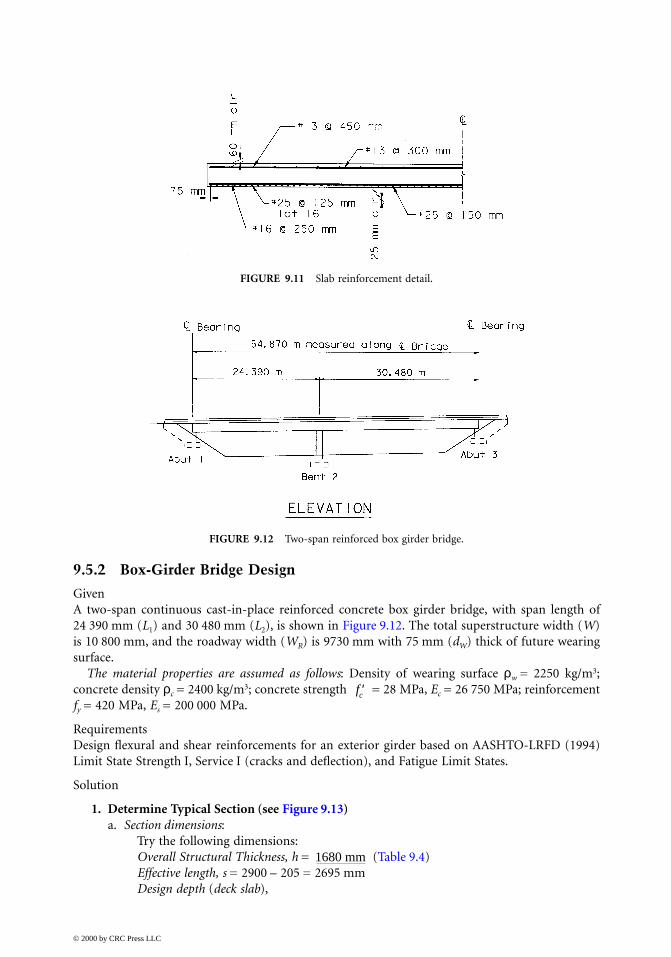
9.5.2 Box-Girder Bridge Design
GivenA two-span continuous cast-in-place reinforced concrete box girder bridge, with span length of24 390 mm (L1) and 30 480 mm (L2), is shown in Figure 9.12. The total superstructure width (W)is 10 800 mm, and the roadway width (WR) is 9730 mm with 75 mm (dW) thick of future wearingsurface.
The material properties are assumed as follows: Density of wearing surface ρw = 2250 kg/m3;concrete density ρc = 2400 kg/m3; concrete strength = 28 MPa, Ec = 26 750 MPa; reinforcementfy = 420 MPa, Es = 200 000 MPa.
RequirementsDesign flexural and shear reinforcements for an exterior girder based on AASHTO-LRFD (1994)Limit State Strength I, Service I (cracks and deflection), and Fatigue Limit States.
Solution
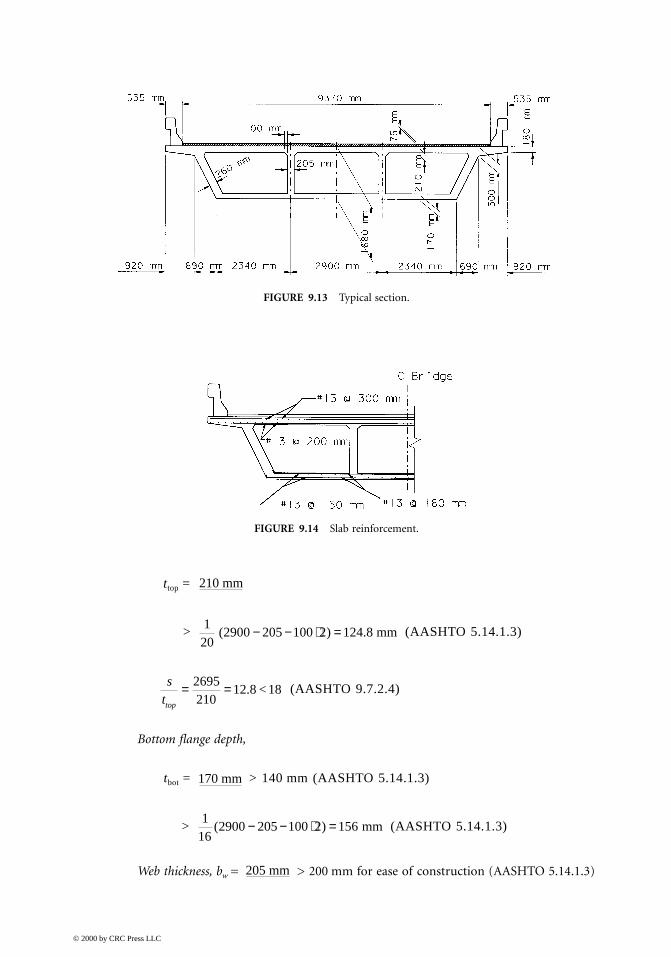
1. Determine Typical Section (see Figure 9.13) a. Section dimensions:
Try the following dimensions:Overall Structural Thickness, h = (Table 9.4)Effective length, s = 2900 – 205 = 2695 mmDesign depth (deck slab),
FIGURE 9.11 Slab reinforcement detail.
FIGURE 9.12 Two-span reinforced box girder bridge.
′fc
1680 mm
© 2000 by CRC Press LLC
ttop =
> (AASHTO 5.14.1.3)
(AASHTO 9.7.2.4)
Bottom flange depth,
tbot = > 140 mm (AASHTO 5.14.1.3)
> (AASHTO 5.14.1.3)
Web thickness, bw = > 200 mm for ease of construction (AASHTO 5.14.1.3)
FIGURE 9.13 Typical section.
FIGURE 9.14 Slab reinforcement.
210 mm
120
2900 205 100 2 124 8( ) .− − ⋅ = mm
sttop
= =2695210
12 8 18. <
170 mm
116
2900 205 100 2 156( )− − ⋅ = mm
205 mm
© 2000 by CRC Press LLC
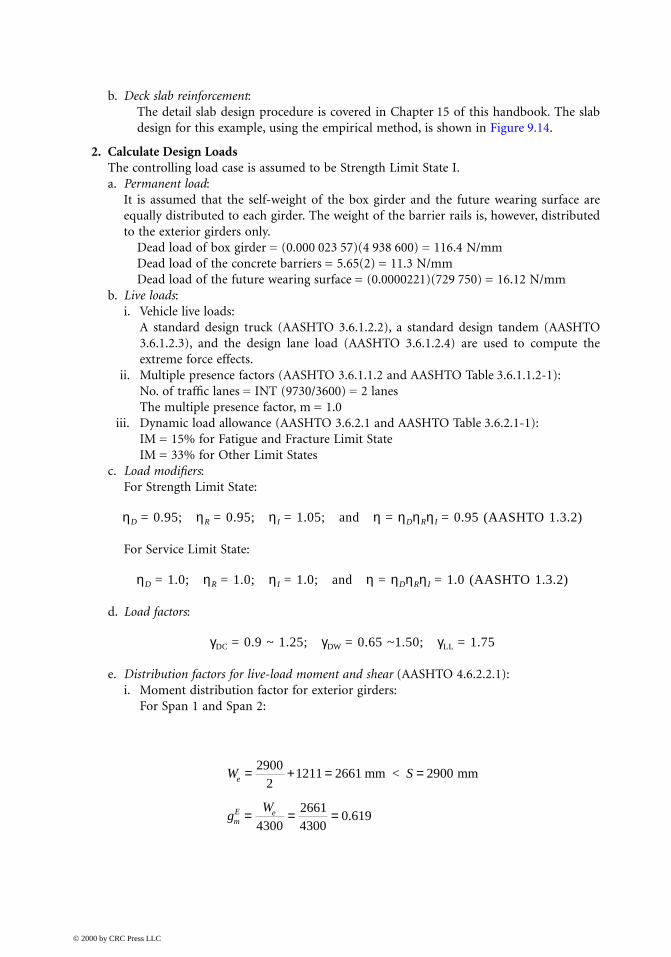
b. Deck slab reinforcement:The detail slab design procedure is covered in Chapter 15 of this handbook. The slabdesign for this example, using the empirical method, is shown in Figure 9.14.
2. Calculate Design Loads The controlling load case is assumed to be Strength Limit State I.a. Permanent load:
It is assumed that the self-weight of the box girder and the future wearing surface areequally distributed to each girder. The weight of the barrier rails is, however, distributedto the exterior girders only.
Dead load of box girder = (0.000 023 57)(4 938 600) = 116.4 N/mmDead load of the concrete barriers = 5.65(2) = 11.3 N/mmDead load of the future wearing surface = (0.0000221)(729 750) = 16.12 N/mm
b. Live loads:i. Vehicle live loads:
A standard design truck (AASHTO 3.6.1.2.2), a standard design tandem (AASHTO3.6.1.2.3), and the design lane load (AASHTO 3.6.1.2.4) are used to compute theextreme force effects.
ii. Multiple presence factors (AASHTO 3.6.1.1.2 and AASHTO Table 3.6.1.1.2-1):No. of traffic lanes = INT (9730/3600) = 2 lanesThe multiple presence factor, m = 1.0
iii. Dynamic load allowance (AASHTO 3.6.2.1 and AASHTO Table 3.6.2.1-1):IM = 15% for Fatigue and Fracture Limit StateIM = 33% for Other Limit States
c. Load modifiers:For Strength Limit State:
ηD = 0.95; ηR = 0.95; η I = 1.05; and η = ηDηRη I = 0.95 (AASHTO 1.3.2)
For Service Limit State:
ηD = 1.0; ηR = 1.0; η I = 1.0; and η = ηDηRη I = 1.0 (AASHTO 1.3.2)
d. Load factors:
γDC = 0.9 ~ 1.25; γDW = 0.65 ~1.50; γLL = 1.75
e. Distribution factors for live-load moment and shear (AASHTO 4.6.2.2.1):i. Moment distribution factor for exterior girders:
For Span 1 and Span 2:
W S
gW
e
mE e
= + = =
= = =
29002
1211 2661 2900
430026614300
0 619
mm < mm
.
© 2000 by CRC Press LLC
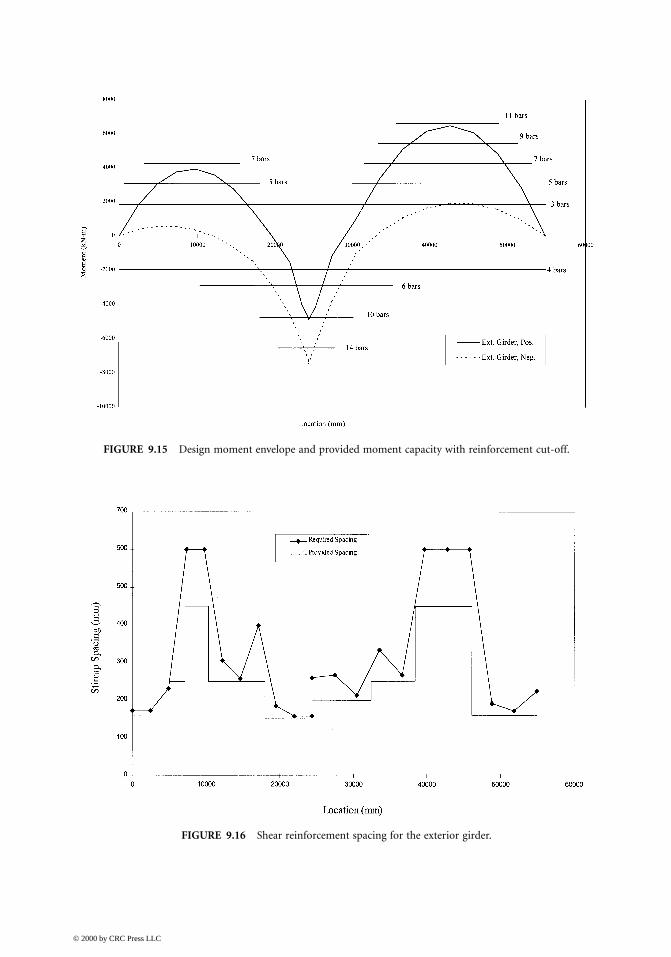
FIGURE 9.15 Design moment envelope and provided moment capacity with reinforcement cut-off.
FIGURE 9.16 Shear reinforcement spacing for the exterior girder.
© 2000 by CRC Press LLC
TABL pan 2
Factored Moment Envelope (kN-m)
Exterior Girder Exterior Girder
Span C DW LL (Pos.) LL (Neg.) Positive Negative
0.0 L1 0 0 0 0 0 00.1 L1 07 70 601 –111 1819 3780.2 L1 05 116 1020 –222 3053 5610.3 L1 96 137 1289 –333 3758 5530.4 L1 78 135 1403 –445 3923 3500.5 L1 51 109 1379 –556 3577 –430.6 L1 17 59 1242 –668 2762 –6320.7 L1 26 –15 969 –779 1494 –14660.8 L1 76 –113 581 –890 62 –28000.9 L1 35 –234 205 –1105 –1545 –45870.96 L 10 –324 –110 –1451 –3981 –62111.0 L1 03 –380 –202 –1686 –4799 –7267
0.0 L2 00 –392 –174 –1721 –4885 –74570.03 L 35 –327 –169 –1482 –4112 –62950.1 L2 97 –184 210 –971 –1130 –37720.2 L2 19 –14 652 –530 974 –10420.3 L2 35 119 1173 –459 3349 1950.4 L2 62 214 1565 –393 5118 10710.5 L2 65 272 1785 –328 6163 16450.6 L2 43 292 1837 –262 6490 19190.7 L2 95 275 1707 –197 6073 18900.8 L2 22 221 1347 –131 4835 15620.9 L2 23 129 785 –66 2822 9301.0 L2 0 0 0 0 0 0
© 2000 by CRC Pr
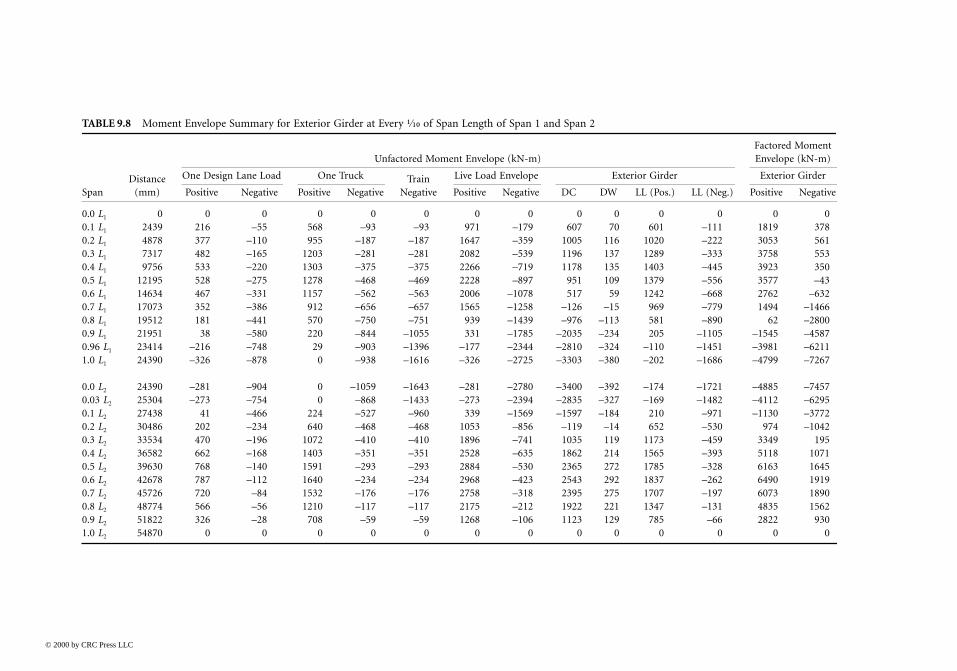
E 9.8 Moment Envelope Summary for Exterior Girder at Every ¹⁄₁₀ of Span Length of Span 1 and S
Unfactored Moment Envelope (kN-m)
Distance One Design Lane Load One Truck Train Live Load Envelope
(mm) Positive Negative Positive Negative Negative Positive Negative D
0 0 0 0 0 0 0 02439 216 –55 568 –93 –93 971 –179 64878 377 –110 955 –187 –187 1647 –359 107317 482 –165 1203 –281 –281 2082 –539 119756 533 –220 1303 –375 –375 2266 –719 11
12195 528 –275 1278 –468 –469 2228 –897 914634 467 –331 1157 –562 –563 2006 –1078 517073 352 –386 912 –656 –657 1565 –1258 –119512 181 –441 570 –750 –751 939 –1439 –921951 38 –580 220 –844 –1055 331 –1785 –20
1 23414 –216 –748 29 –903 –1396 –177 –2344 –2824390 –326 –878 0 –938 –1616 –326 –2725 –33
24390 –281 –904 0 –1059 –1643 –281 –2780 –34
2 25304 –273 –754 0 –868 –1433 –273 –2394 –2827438 41 –466 224 –527 –960 339 –1569 –1530486 202 –234 640 –468 –468 1053 –856 –133534 470 –196 1072 –410 –410 1896 –741 1036582 662 –168 1403 –351 –351 2528 –635 1839630 768 –140 1591 –293 –293 2884 –530 23
42678 787 –112 1640 –234 –234 2968 –423 25
45726 720 –84 1532 –176 –176 2758 –318 2348774 566 –56 1210 –117 –117 2175 –212 19
51822 326 –28 708 –59 –59 1268 –106 1154870 0 0 0 0 0 0 0
ess LLC
T
Factored Shear Envelope (kN)
Exterior Girder Exterior Girder
S DW LL (Pos.) LL (Neg.) Positive Negative
0 34 353 –56 981 1760 24 296 –56 770 970 14 240 –56 562 180 4 186 –89 358 –1150 –6 133 –124 175 –2740 –16 84 –173 14 –4710 –26 48 –226 –126 –6750 –35 24 –278 –243 –8750 –45 6 –327 –353 –10720 –55 –9 –373 –660 –12641 –65 –16 –414 –787 –1449
0 74 442 6 1606 8820 62 383 4 1365 7340 50 335 –8 1141 3860 38 284 –31 910 2490 25 229 –52 675 1150 13 171 –80 435 –300 1 117 –125 202 –2020 –12 81 –180 41 –4370 –24 55 –240 –103 –6810 –36 27 –300 –248 –9251 –49 26 –362 –348 –1171
© 2000 by CRC Press L
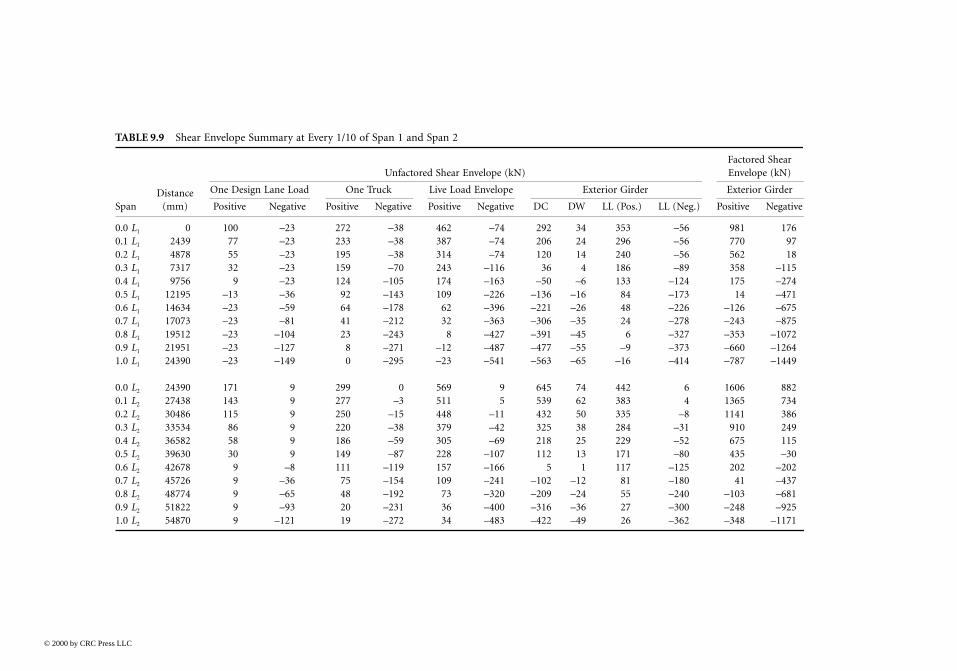
ABLE 9.9 Shear Envelope Summary at Every 1/10 of Span 1 and Span 2
Unfactored Shear Envelope (kN)
Distance One Design Lane Load One Truck Live Load Envelope
pan (mm) Positive Negative Positive Negative Positive Negative DC
.0 L1 0 100 –23 272 –38 462 –74 292
.1 L1 2439 77 –23 233 –38 387 –74 206
.2 L1 4878 55 –23 195 –38 314 –74 120
.3 L1 7317 32 –23 159 –70 243 –116 36
.4 L1 9756 9 –23 124 –105 174 –163 –50
.5 L1 12195 –13 –36 92 –143 109 –226 –136
.6 L1 14634 –23 –59 64 –178 62 –396 –221
.7 L1 17073 –23 –81 41 –212 32 –363 –306
.8 L1 19512 –23 –104 23 –243 8 –427 –391
.9 L1 21951 –23 –127 8 –271 –12 –487 –477
.0 L1 24390 –23 –149 0 –295 –23 –541 –563
.0 L2 24390 171 9 299 0 569 9 645
.1 L2 27438 143 9 277 –3 511 5 539
.2 L2 30486 115 9 250 –15 448 –11 432
.3 L2 33534 86 9 220 –38 379 –42 325
.4 L2 36582 58 9 186 –59 305 –69 218
.5 L2 39630 30 9 149 –87 228 –107 112
.6 L2 42678 9 –8 111 –119 157 –166 5
.7 L2 45726 9 –36 75 –154 109 –241 –102
.8 L2 48774 9 –65 48 –192 73 –320 –209
.9 L2 51822 9 –93 20 –231 36 –400 –316
.0 L2 54870 9 –121 19 –272 34 –483 –422
LC

ii. Shear distribution factor for exterior girders:
f. Factored moment envelope and shear envelope:The moment and shear envelopes for the exterior girder, unfactored and factored basedon Strength Limit State I, are listed in Tables 9.8 and 9.9. Figures 9.15 and 9.16 show the
envelope diagram for moments and shears based on Strength Limit State I, respectively.3. Flexural Design
a. Determine the effective flange width (Section 9.4.6):i. Effective compression flange for positive moments:
Span 1:For interior girder,
For exterior girder,
Span 2: The effective flange widths for Span 2 turns out to be the same as those in Span 1.
Design Lane Span 1 Span 2
One design lane loaded
Two or more design lanes loaded
Govern 0.765 0.749
gvE = +
=0 5 1015 2815
52
2884
0 594. ( )
( )
. gvE = +
=0 5 1015 2815
52
2884
0 594. ( )
( )
.
d
e
g
e
vE
= − =
= + =
=
=
1066 535 531 00
0 64531
38000 78
0 7829002200
168024 385
0 765
0 9 0 1
< 15
,
. .
.
.
. .
d
e
g
e
vE
= − =
= + =
=
=
1066 535 531 00
0 64531
38000 78
0 7829002200
168030 480
0 749
0 9 0 1
< 15
,
. .
.
.
. .
b
L
t b governs
the average spacing of adjacent beams
I
wtop
eff
topthe smallest of
, mm
mm
mm
=
= =
+ = + =
=
14
14
0 65 24 390 3963
12 12 210 205 2725
2900
1, ( . )( )
( ) ( )
b b
L
t b
governs
topE
topI
eff
w
= +
= =
+ = + =
= + =
+
12
18
18
0 65 24 390 1982
612
6 21012
291 1405
9202912
1065
2724 1065
1
the smallest of
, mm
mm
the width of the overhang mm
=12
= 2427 mm
top
, ( . )( )
( )( ) ( )
( )
© 2000 by CRC Press LLC
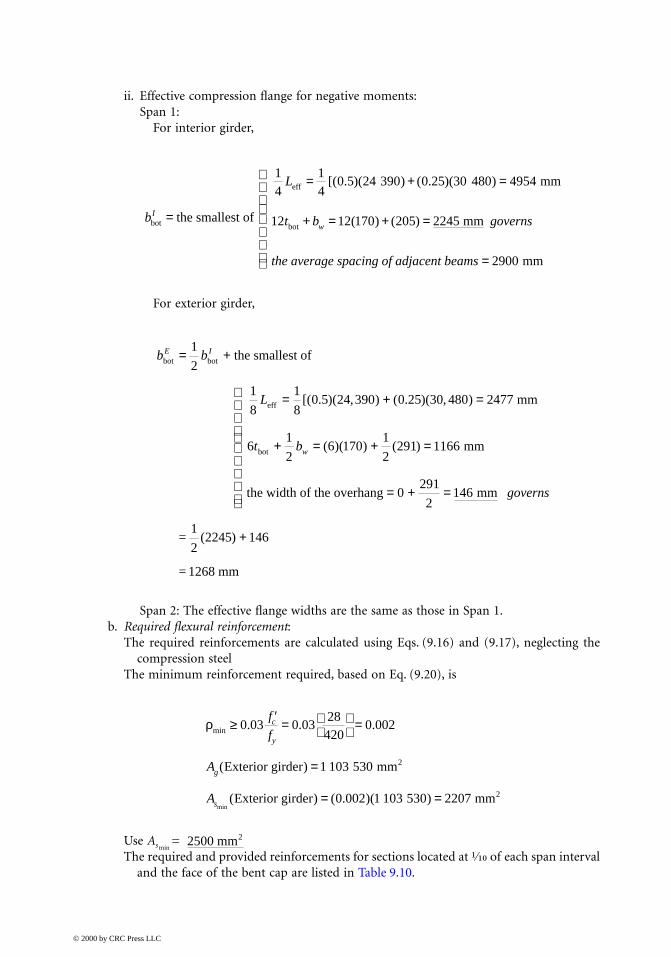
ii. Effective compression flange for negative moments:Span 1:
For interior girder,
For exterior girder,
Span 2: The effective flange widths are the same as those in Span 1.b. Required flexural reinforcement:
The required reinforcements are calculated using Eqs. (9.16) and (9.17), neglecting thecompression steel
The minimum reinforcement required, based on Eq. (9.20), is
Use As min =
The required and provided reinforcements for sections located at ¹⁄₁₀ of each span intervaland the face of the bent cap are listed in Table 9.10.
b
L
t b governs
the average spacing of adjacent beams
I
wbot
eff
botthe smallest of
mm
mm
mm
=
= + =
+ = + =
=
14
14
0 5 24 390 0 25 30 480 4954
12 12 170 205 2245
2900
[( . )( ) ( . )( )
( ) ( )
b b
L
t b
governs
E I
w
bot bot
eff
bot
the smallest of
, , mm
mm
the width of the overhang mm
=1
2
= 1268 mm
= +
= + =
+ = + =
= + =
+
1
2
1
8
1
80 5 24 390 0 25 30 480 2477
61
26 170
1
2291 1166
0291
2146
2245 146
[( . )( ) ( . )( )
( )( ) ( )
( )
ρmin . . .
( )
( ) ( . )( )min
≥ ′ =
=
=
= =
0 03 0 0328
4200 002
1 103 530
0 002 1 103 530 2207
f
f
A
A
c
y
g
s
Exterior girder mm
Exterior girder mm
2
2
2500 mm2
© 2000 by CRC Press LLC
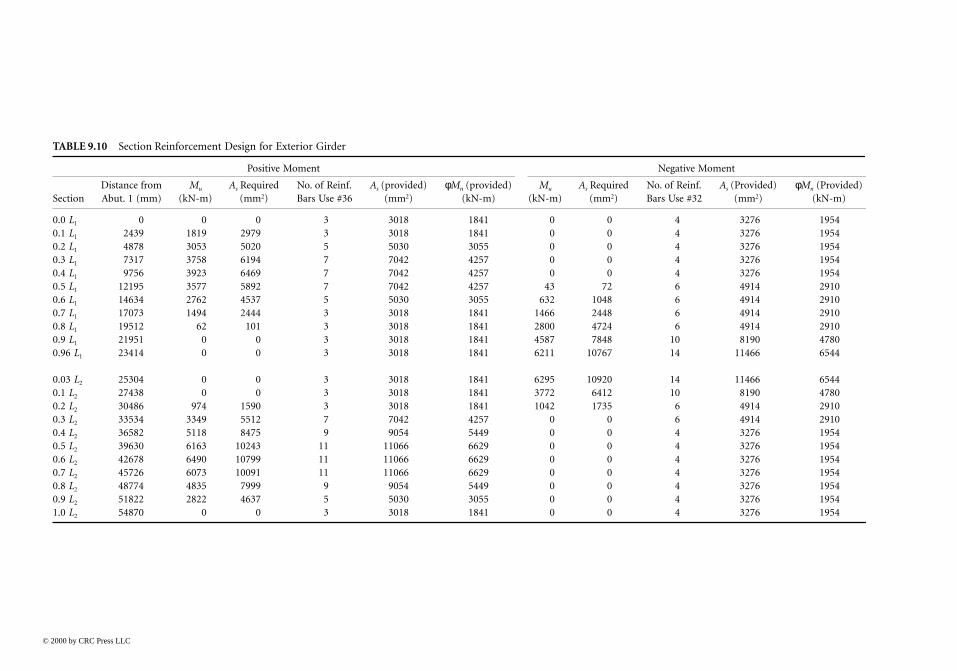
TABLE 9.10 Se
Negative Moment
SectionDistanAbut.
u -m)
As Required (mm2)
No. of Reinf. Bars Use #32
As (Provided) (mm2)
φMn (Provided) (kN-m)
0.0 L1 0 0 4 3276 19540.1 L1 2 0 0 4 3276 19540.2 L1 4 0 0 4 3276 19540.3 L1 7 0 0 4 3276 19540.4 L1 9 0 0 4 3276 19540.5 L1 12 3 72 6 4914 29100.6 L1 14 2 1048 6 4914 29100.7 L1 17 6 2448 6 4914 29100.8 L1 19 0 4724 6 4914 29100.9 L1 21 7 7848 10 8190 47800.96 L1 23 1 10767 14 11466 6544
0.03 L2 25 5 10920 14 11466 65440.1 L2 27 2 6412 10 8190 47800.2 L2 30 2 1735 6 4914 29100.3 L2 33 0 0 6 4914 29100.4 L2 36 0 0 4 3276 19540.5 L2 39 0 0 4 3276 19540.6 L2 42 0 0 4 3276 19540.7 L2 45 0 0 4 3276 19540.8 L2 48 0 0 4 3276 19540.9 L2 51 0 0 4 3276 19541.0 L2 54 0 0 4 3276 1954
© 2000 by CRC Press LLC
ction Reinforcement Design for Exterior Girder
Positive Moment
ce from 1 (mm)
Mu (kN-m)
As Required (mm2)
No. of Reinf. Bars Use #36
As (provided) (mm2)
φMn (provided) (kN-m)
M(kN
0 0 0 3 3018 1841439 1819 2979 3 3018 1841878 3053 5020 5 5030 3055317 3758 6194 7 7042 4257756 3923 6469 7 7042 4257195 3577 5892 7 7042 4257 4634 2762 4537 5 5030 3055 63073 1494 2444 3 3018 1841 146512 62 101 3 3018 1841 280951 0 0 3 3018 1841 458414 0 0 3 3018 1841 621
304 0 0 3 3018 1841 629438 0 0 3 3018 1841 377486 974 1590 3 3018 1841 104534 3349 5512 7 7042 4257582 5118 8475 9 9054 5449630 6163 10243 11 11066 6629678 6490 10799 11 11066 6629726 6073 10091 11 11066 6629774 4835 7999 9 9054 5449822 2822 4637 5 5030 3055870 0 0 3 3018 1841
c. Reinforcement layout:i. Reinforcement cutoff (Section 9.4.7):
• The extended length at cutoff for positive moment reinforcement, No. 36, is
From Table 9.6, the stagger lengths for No. 36 and No. 32 bars are
• The extended length at cutoff for negative moment reinforcement, No. 32, is
• Negative moment reinforcements, in addition to the above requirement for barcutoff, have to satisfy Eq. (9.43). The extended length beyond the inflection pointhas to be the largest of the following:
ii. Reinforcement distribution (Section 9.4.2):
All tensile reinforcements should be distributed within the effective tension flangewidth.
iii. Side reinforcements in the web, Eq. (9.6)
the largest of
Effective depth of the section = mm
15 mm
0.05 of span length = 0.05 mm
1625
537
24 390 1220
governs
db =
=
( )
l
l
d
d
of No. 36 bars mm
of No. 32 bars mm
=
=
1600
1300
the largest of
Effective depth of the section = mm
15 mm
0.05 of span length = 0.05 mm
1601
485
30 480 1524
governs
db =
=
( )
d governs for Span 1
d
governs for Span 2
b
=
=×
1601
12 387 6
mm
mm0.0625 (clear span length) = (0.0625)(24 390) = 1524 mm
or = (0.0625)(30 480) = 1905 mm
.
110
30 480 24 385 2743( ( )average adjacent span length) = 1
10 mm+ =
bEtop mm < 2743 mm= 2427
A d
AA
sk e
sks
≥ − = − =
≤ = =
0 001 760 0 001 1625 760 0 865
120013 4621200
11 21
. ( ) . ( ) . /
. /
mm mm of height
, mm mm of height
2
2
© 2000 by CRC Press LLC
Ask = 0.865(250) = 216 mm2
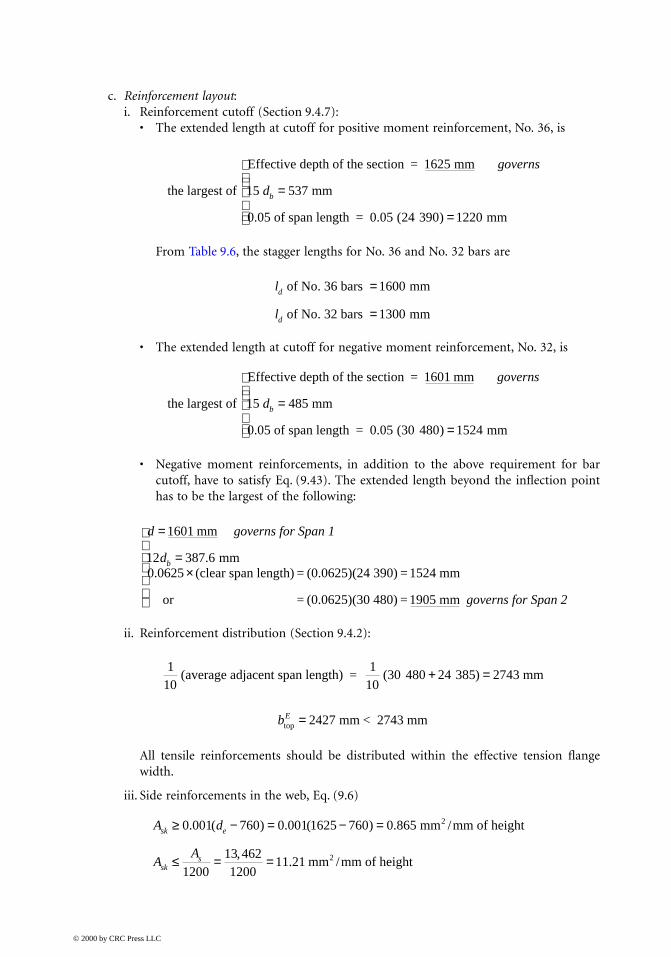
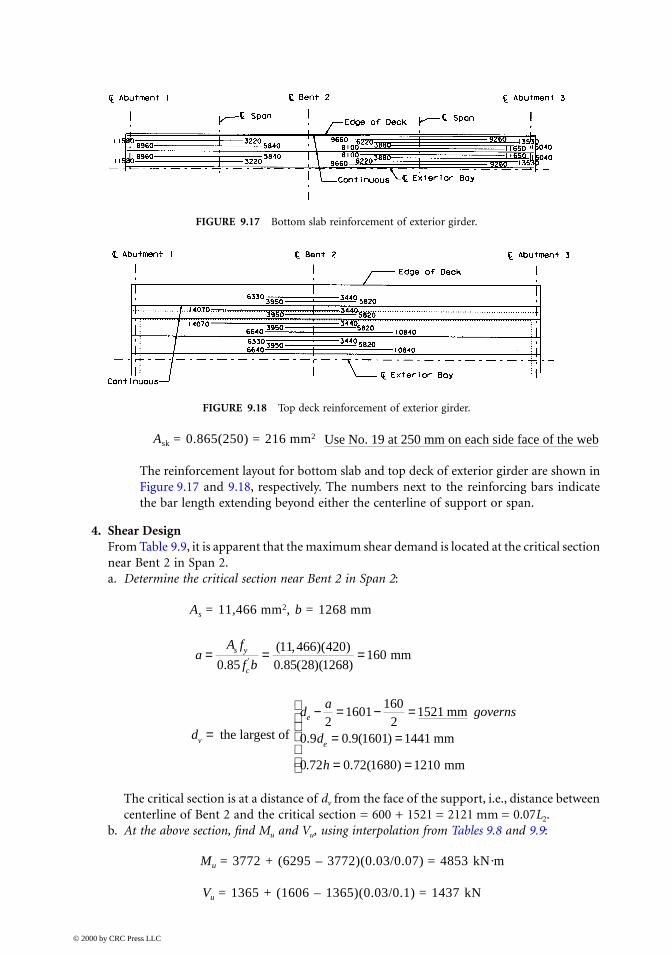
The reinforcement layout for bottom slab and top deck of exterior girder are shown inFigure 9.17 and 9.18, respectively. The numbers next to the reinforcing bars indicatethe bar length extending beyond either the centerline of support or span.
4. Shear Design From Table 9.9, it is apparent that the maximum shear demand is located at the critical sectionnear Bent 2 in Span 2.a. Determine the critical section near Bent 2 in Span 2:
As = 11,466 mm2, b = 1268 mm
The critical section is at a distance of dv from the face of the support, i.e., distance betweencenterline of Bent 2 and the critical section = 600 + 1521 = 2121 mm = 0.07L2.
b. At the above section, find Mu and Vu, using interpolation from Tables 9.8 and 9.9:
Mu = 3772 + (6295 – 3772)(0.03/0.07) = 4853 kN·m
Vu = 1365 + (1606 – 1365)(0.03/0.1) = 1437 kN
FIGURE 9.17 Bottom slab reinforcement of exterior girder.
FIGURE 9.18 Top deck reinforcement of exterior girder.
Use No. 19 at 250 mm on each side face of the web
aA f
f bs y
c
= = =0 85
11 466 4200 85 28 1268
160.
( , )( ). ( )( )' mm
d
da
governs
d
. h
v
e
e=
− = − =
= =
= =
the largest of
mm
mm
mm
21601
1602
1521
0 9 0 9 1601 1441
0 72 0 72 1680 1210
. . ( )
. ( )
© 2000 by CRC Press LLC
c. Determine θ and β, and required shear reinforcement spacing:Try θ = 37.5°, cot θ = 1.303, As = 11 466 mm2, Ec = 200 GPa, from Eq. (9.24).
From Figure 9.6, we obtain , which agrees with the assumption.Use θ = 37.5°, β = 1.4, from Eq. (9.25)
Use No. 16 rebars, Av = 199(2) = 398 mm2, from Eq. (9.26)
d. Determine the maximum spacing required:Note that Vu = 1437 kN > 0.1 = 0.1(28)(291)(1521) × 10–3 = 1239 kNFrom Eqs. (9.27) and (9.29):
< 300 mm e. Check the adequacy of the longitudinal reinforcements, using Eq. (9.30):
Asfy = (11 466)(420) = 4 815 720 N
Using the above procedure, the shear reinforcements, i.e., stirrups in the web, for eachsection can be obtained. Figure 9.16 shows the shear reinforcements required and providedin the exterior girder for both spans.
vV
b d
vf
u
v v v
c
= = ⋅ =
′= = <
φ1437 1000
0 9 291 15213 61
3 6128
0 129 0 25
( )( . )( )( )
.
.. .
MPa
O.K.
εx =+
= × −
4 853 0001521
0 5 1437 1 303
200 11 4661 80 10 3
. ( )( . )
( ).
θ = °37 5.
Vs = − × =−14370 9
0 083 1 4 28 291 1521 10 13253
.. ( . ) ( )( ) kN
Required spacing, mms ≤×
=( )( )( )( . )
398 420 15211325 10
1 303 2503
′ ′f b dc v v
smax
. ( )
. ( )=
=
=
the smallest of
(398)(420) mm
mm
mm governs
0 083 28 2911307
0 4 1521 608
300
Use = 250 mms OK.
M
d
VV
A f
u
v f
u
vs
s y
φ φθ+ −
= × + × − ×
=
0 54853 101521 0 9
1437 100 9
0 5 1325 10 1 303
4 762 401
6 33. cot
( )( . ) .. ( ) ( . )
N < O.K.
© 2000 by CRC Press LLC

6. Crack Control Check (Section 9.4.2) For illustration purpose, we select the section located at midspan of Span 1 in this example,i.e. at
a. Check if the section is cracked:Service load moment, Mpos = (1.0)(MDC + MDW + MLL+IM)
= (1.0)(951 + 109 + 1379)= 2439 kN-m
btop = 2427 mm, bbot = 1268 mm, obtain
The section is cracked.b. Calculate tensile stress of the reinforcement:
Assuming the neutral axis is located in the web, thus applying Eqs. (9.31) through (9.34)with As = 7042 mm2, = 0, and β1 = 0.85, solve for x
x = 239 mm > hf = btop = 210 mm O.K.
From Eq. (9.35), obtain
and from Eq. (9.38), the tensile stress in the longitudinal reinforcement is
c. The allowable stress can be obtained using Eq. (9.5), with Z = 30 000 for moderate exposureand dc = 50 mm
O.K.
The other sections can be checked following the same procedure described above.
7. Check Deflection Limit Based on the Service Limit State, we can compute the Ie for sections at ¹⁄₁₀ of the span length
interval. For illustration, let the section be at 0.4L2
0 5 1. L
Modulus of rupture MPa, MPaf f fr c r= ′ = = =0 63 0 63 28 3 33 0 8 2 66. . . . .
I y
SI
d y
g
g
= × =
=−
= ×−
= ×
4 162 10 655
4 162 101680 655
4 06 10
11
118
.
( ).
( ).
mm mm,
mm
4
3
and
where y is the distance from the most compressed concrete fiber to the neutral axis
fM
Sfc r= = ×
×= =pos MPa > 0.8 MPa
2439 104 06 10
6 01 2 666
8.. .
′As
Icr
4 mm
= − − − + −
= ×
13
2427 23913
2427 291 239 210 7 7042 1625 239
1 057 10
3 3 2
11
( )( ) ( )( ) ( )( )
.
fs = × −×
=7 2439 10 1625 2391 057 10
2246
11
( )( ).
MPa
fZ
d Afsa
c
y= =⋅ ⋅
=( )
,
( )( )
13
13
30 000
5050 2 1268
7
310 MPa > 0.6 = 252 MPa
Use = 252 MPa > = 223 MPaf fsa s
© 2000 by CRC Press LLC
Deflection distribution factor = (no. of design lanes)/(no. of supporting beams) = 2/4 = 0.5Note that btop = 2424 mm, ttop = 210 mm, bw = 291 mm, h = 1680 mm, d = 1625 mm, bbot =
1268 mm, tbot = 170 mm, and neglecting compression steel
Ag = (2427)(210) + (1680 – 210 – 170)(291) + (1268)(170) = 1 103 530 mm2
Use Eqs. (9.31) throuth (9.35) to solve for x and Icr, with As = 9054 mm2 and = 0, we obtain
From Table 9.8:
The above computation can be repeated to obtain Ie for other sections. It is assumed that themaximum deflection occurs where the maximum flexural moment is. To be conservative, theminimum Ie is used to calculate the deflection.
8. Check Fatigue Limit State For illustration purpose, check the bottom reinforcements for the section at 0.7L1. For positivemoment at this section, As = 4024 mm2, = 4095 mm2, d = 1625 mm, and d′ = 79 mm.Note that the maximum positive moment due to the assigned truck is 757 kN-m, while thelargest negative moment 598 kN-m.
Mmax due to fatigue load = 0.75(0.619)(757)(1 + 0.15) = 404 kN-m
yt = −
+ +
+
=( ) ( ) ( )509 670 16802102
378 300 1701300
2215 560
1702
1 103 530
1025
mm
Ig = + + +
+ +
= ×
112
2427 210 509 670 5501
12291 1300 378 300 205
112
1268 170 215 560 940
4 16 10
3 2 3 2
3 2
11
( ) ( ) ( ) ( ) ( ) ( ) ( ) ( )
( ) ( ) ( ) ( )
.
mm4
M fI
yrg
tcr N – mm= = × = ×( . )
..3 33
4 16 101025
1 35 1011
9
′As
x I= = ×272 1 32 1011 mm , mmcr4.
M
M
M
IM
MI
M
MI
a
cr
a
ea
ga
= + + =
= ××
=
=
+ −
= × + −( )[ ] × =
1862 214 0 5 1565 2859
1 35 102 86 10
0 47
1 0 47 4 16 10 1 0 47 1 32 10
9
9
3 3
3 11 3 11
( . )( )
.
..
( . ) ( . ) . ( . )
kN-m
cr crcr 11 61 1011. × mm4
∆max = < =
=
1 mm truck load
3 mm lane + 25% of truck load
mm O.K.
9
1 80030 480
800382L
′As
© 2000 by CRC Press LLC
Use Eqs. (9.31) through (9.35) and (9.38) to obtain the maximum tensile stress in the mainbottom reinforcements as
fmax = 64 MPa
The negative moment at this section is
Mmin due to fatigue load = 0.75(0.619)(–598)(1 + 0.15) = -319 kN-m
Using Eqs. (9.31) through (9.35) and (9.38), with As = 4095 mm2, = 4024 mm2, d =1601 mm, and d′ = 55 mm, we obtain the maximum compressive stress in the main bottomreinforcements as
fmin = –7.0 MPa
Thus, the stress range for fatigue
fmax – fmin = 64 – (–7.0) = 71 MPa
From Eq. (9.9), allowable stress range
71 MPa OK
Other sections can be checked in the same fashion described above.
9. SummaryThe purpose of the above example is mainly to illustrate the design procedure for flexuraland shear reinforcement for the girder. It should be noted that, in reality, the controlling loadcase may not be the Strength Limit State; therefore, all the load cases specified in the AASHTOshould be investigated for a complete design. It should also be noted that the interior girderdesign can be achieved by following the similar procedures described herein.
References
1. AASHTO, AASHTO LRFD Bridge Design Specifications, American Association of State Highwayand Transportation Officials, Washington, D.C., 1994.
2. ASTM, Annual Book of ASTM Standards, American Society for Testing and Materials, Philadelphia,1996.
3. Caltrans, Bridge Design Aids Manual, California Department of Transportation, Sacramento, 1994.4. Collins, M. P. and Mitchell, D., Prestressed Concrete Structures, Prentice-Hall, Englewood Cliffs, NJ,
1991.5. Caltrans, Bridge Design Practices, California Department of Transportation, Sacramento, 1995.6. ACI Committee 318, Building Code Requirements for Reinforced Concrete (ACI 318-95), Amer-
ican Concrete Institute, 1995.7. Barker, R. M. and Puckett, J. A., Design of Highway Bridges, John Wiley & Sons, New York, 1997.8. Park, R. and Paulay, T., Reinforced Concrete Structures, John Wiley & Sons, New York, 1975.9. Xanthakos, P. P., Theory and Design of Bridges, John Wiley & Sons, New York, 1994.
′As
fr = − − + =145 0 33 7 0 55 0 3 164. ( . ) ( . ) MPa >
© 2000 by CRC Press LLC