Embed Size (px)
Citation preview
LTE PHY Layer Measurement GuideBase Station Analyzer
Application Note
2 LTE PHY Layer Measurement Guide
Contents
Understanding LTE 3Overall Architecture 3LTE Physical Layer 3
LTE Downlink 4Frame Structure 5Resource Block 6Cyclic Prefix 7Downlink Physical Channel 9
Physical Downlink Shared Channel (PDSCH) 10Physical Control Format Indicator Channel (PCFICH) 10Physical Downlink Control Channel (PDCCH) 11Physical Hybrid ARQ indicator Channel (PHICH) 11Physical Broadcast Channel (PBCH) 12Physical Multicast Channel (PMCH) 13Reference Signal 13Synchronization Signals 15
LTE Downlink Map 16LTE PHY Measurement 17Base Station Analyzer 17LTE Test Model 19Base Station Analyzer Measurement Setup 20Power Measurement 21
Channel Power 21Power vs Time 22Complementary Cumulative Distribution Function (CCDF) 23
Modulation Accuracy Measurement 24Frame Summary 25Subframe Summary 29Data Channel Summary 30Control Channel Summary 32MIMO Time Alignment 33
Unwanted Emission 34Occupied Bandwidth 35ACLR 35SEM 37
Over the Air Analysis 38ID Scanner 39Datagram 39Control Channels 40
References 40
3 LTE PHY Layer Measurement Guide
Understanding LTE
Overall Architecture
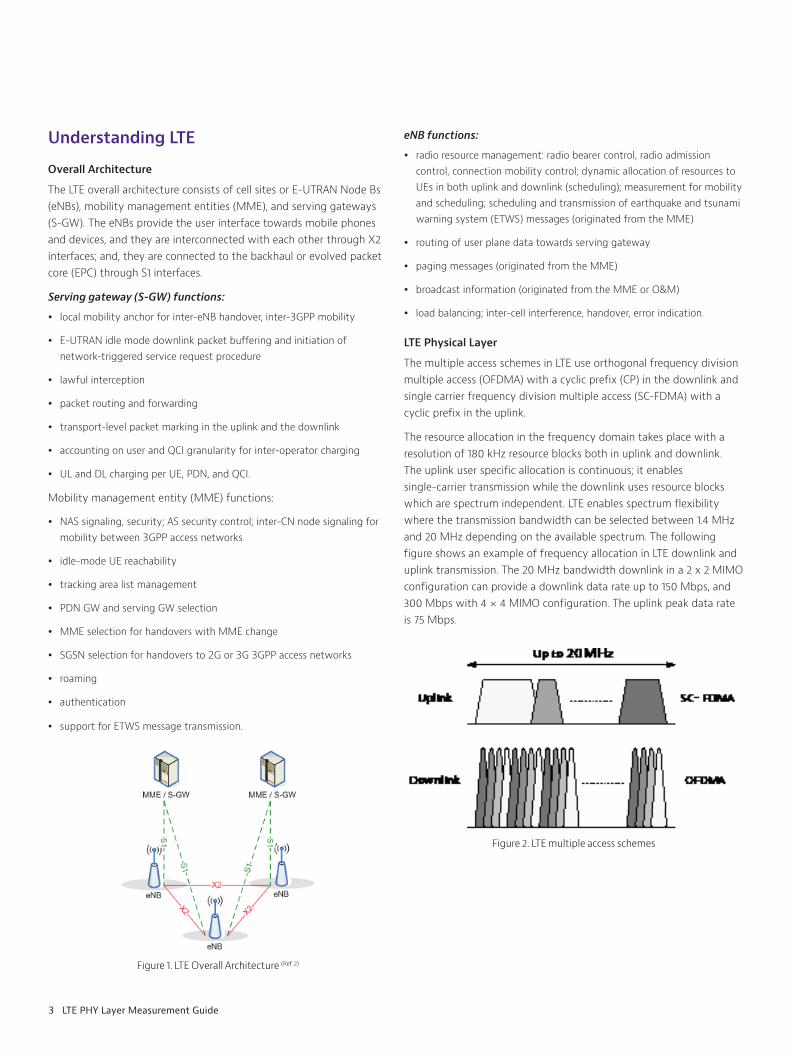
The LTE overall architecture consists of cell sites or E-UTRAN Node Bs (eNBs), mobility management entities (MME), and serving gateways (S-GW) The eNBs provide the user interface towards mobile phones and devices, and they are interconnected with each other through X2 interfaces; and, they are connected to the backhaul or evolved packet core (EPC) through S1 interfaces
Serving gateway (S-GW) functions:
y local mobility anchor for inter-eNB handover, inter-3GPP mobility
y E-UTRAN idle mode downlink packet buffering and initiation of network-triggered service request procedure
y lawful interception
y packet routing and forwarding
y transport-level packet marking in the uplink and the downlink
y accounting on user and QCI granularity for inter-operator charging
y UL and DL charging per UE, PDN, and QCI
Mobility management entity (MME) functions:
y NAS signaling, security; AS security control; inter-CN node signaling for mobility between 3GPP access networks
y idle-mode UE reachability
y tracking area list management
y PDN GW and serving GW selection
y MME selection for handovers with MME change
y SGSN selection for handovers to 2G or 3G 3GPP access networks
y roaming
y authentication
y support for ETWS message transmission
Figure 1 LTE Overall Architecture (Ref 2)
eNB functions:
y radio resource management: radio bearer control, radio admission control, connection mobility control; dynamic allocation of resources to UEs in both uplink and downlink (scheduling); measurement for mobility and scheduling; scheduling and transmission of earthquake and tsunami warning system (ETWS) messages (originated from the MME)
y routing of user plane data towards serving gateway
y paging messages (originated from the MME)
y broadcast information (originated from the MME or O&M)
y load balancing; inter-cell interference, handover, error indication
LTE Physical Layer
The multiple access schemes in LTE use orthogonal frequency division multiple access (OFDMA) with a cyclic prefix (CP) in the downlink and single carrier frequency division multiple access (SC-FDMA) with a cyclic prefix in the uplink
The resource allocation in the frequency domain takes place with a resolution of 180 kHz resource blocks both in uplink and downlink The uplink user specific allocation is continuous; it enables single-carrier transmission while the downlink uses resource blocks which are spectrum independent LTE enables spectrum flexibility where the transmission bandwidth can be selected between 1 4 MHz and 20 MHz depending on the available spectrum The following figure shows an example of frequency allocation in LTE downlink and uplink transmission The 20 MHz bandwidth downlink in a 2 x 2 MIMO configuration can provide a downlink data rate up to 150 Mbps, and 300 Mbps with 4 × 4 MIMO configuration The uplink peak data rate is 75 Mbps
Figure 2 LTE multiple access schemes
4 LTE PHY Layer Measurement Guide
LTE Downlink
The LTE downlink can be set on six different frequency profiles, as follows:
Channel Bandwidth [MHz] 1 4 3 5 10 15 20
Transmission bandwidth [MHz] 1 08 2 7 4 5 9 13 5 18
Transmission bandwidth [RB] 6 15 25 50 75 100
Table 1 LTE downlink profiles
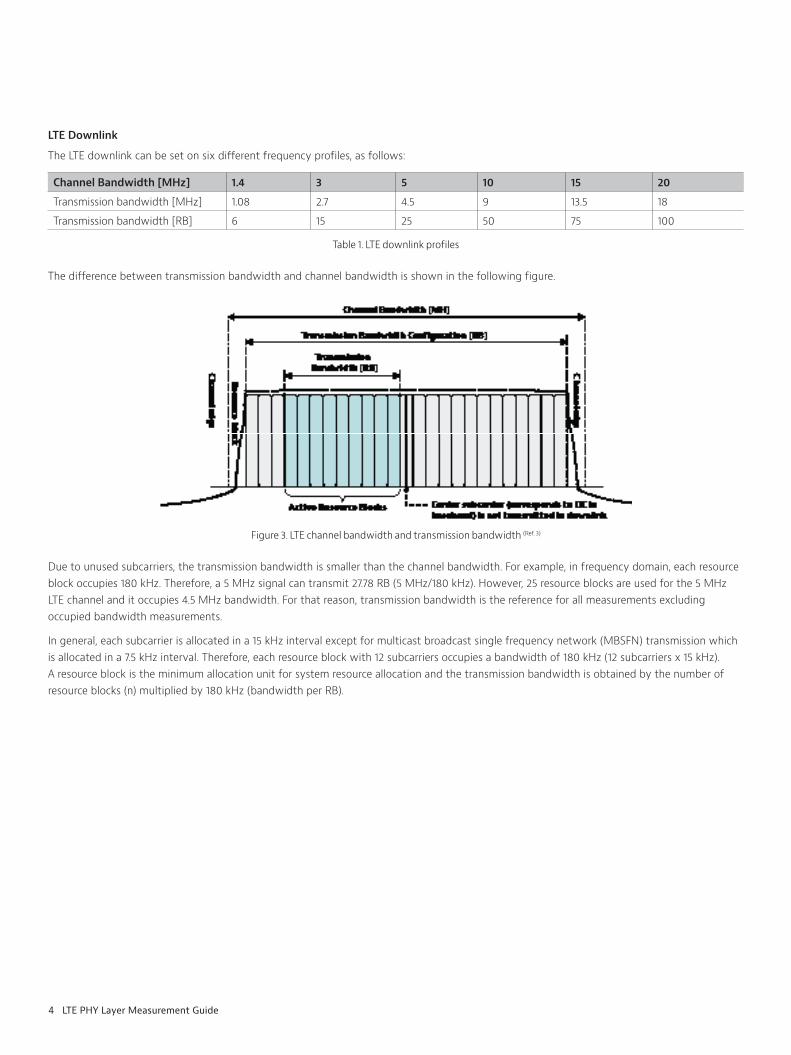
The difference between transmission bandwidth and channel bandwidth is shown in the following figure
Figure 3 LTE channel bandwidth and transmission bandwidth (Ref 3)
Due to unused subcarriers, the transmission bandwidth is smaller than the channel bandwidth For example, in frequency domain, each resource block occupies 180 kHz Therefore, a 5 MHz signal can transmit 27 78 RB (5 MHz/180 kHz) However, 25 resource blocks are used for the 5 MHz LTE channel and it occupies 4 5 MHz bandwidth For that reason, transmission bandwidth is the reference for all measurements excluding occupied bandwidth measurements
In general, each subcarrier is allocated in a 15 kHz interval except for multicast broadcast single frequency network (MBSFN) transmission which is allocated in a 7 5 kHz interval Therefore, each resource block with 12 subcarriers occupies a bandwidth of 180 kHz (12 subcarriers x 15 kHz) A resource block is the minimum allocation unit for system resource allocation and the transmission bandwidth is obtained by the number of resource blocks (n) multiplied by 180 kHz (bandwidth per RB)

5 LTE PHY Layer Measurement Guide
Frame Structure
The following figure shows the frame structure of an LTE signal (FDD) In the time domain, one LTE frame has a 10 ms period and consists of 20 slots of 0 5 ms each A subframe is defined as two consecutive slots
50 Resource
Blocks
7 Symbols
RB = 12 Sub-carriers x 7 Symbols
12 Subcarriers
0
49
(normal)
Slot (10MHz) = 50 RB 9MHz (BW) / 15kHz (Sc) = 600 Sc 600 Sc / 12 Sc (RB) = 50 RB
Resource Element
Figure 4 LTE frame structure
The representation of a LTE timeslot in a configuration of ∆f at 15 kHz and the cyclic prefix (CP) is normal One slot is represented as a resource block (RB) consisting of 7 symbols by 12 subcarriers, or 84 resource elements (RE) per RB Therefore, one LTE frame consists of 20 slots each allocating 1 RB (7 symbols) in time and 10 MHz channel bandwidth transports 50 RB (9 MHz/15 kHz/12), or 1000 RB per frame (50 x 20), or 84000 RE per frame (1000 x 84), where an RE is the minimum unit for data allocation and power control
The basic frame parameters for each LTE channel bandwidth are summarized in the following table
Channel Bandwidth [MHz] 1 4 3 5 10 15 20
Transmission BW [MHz] 1 08 2 7 4 5 9 13 5 18
Subframe duration 0 5 ms
Subcarrier spacing 15 KHz
Sampling frequency [MHz] 1 92(1/2x3 84)
3 84 7 68(2x3 84)
15 36(4x3 84)
23 04(6x3 84)
30 72(8x3 84)
FFT size (No of effective TS/symbol) 128 256 512 1024 1536 2048
TS period (us) 0 5208 0 2604 0 1302 0 0651 0 0434 0 0326
No of TS/time slot 960 1,920 3,840 7,680 11,520 15,360
*TS period= 1/(sampling frequency)*No of TS/time slot = 0 5 ms/TS period
Table 2 LTE frame parameters
6 LTE PHY Layer Measurement Guide
The indication “TS” corresponds to the bit information that can be transferred in a LTE downlink signal where the Ts value in a timeslot is directly proportional to the data throughput of each channel bandwidth
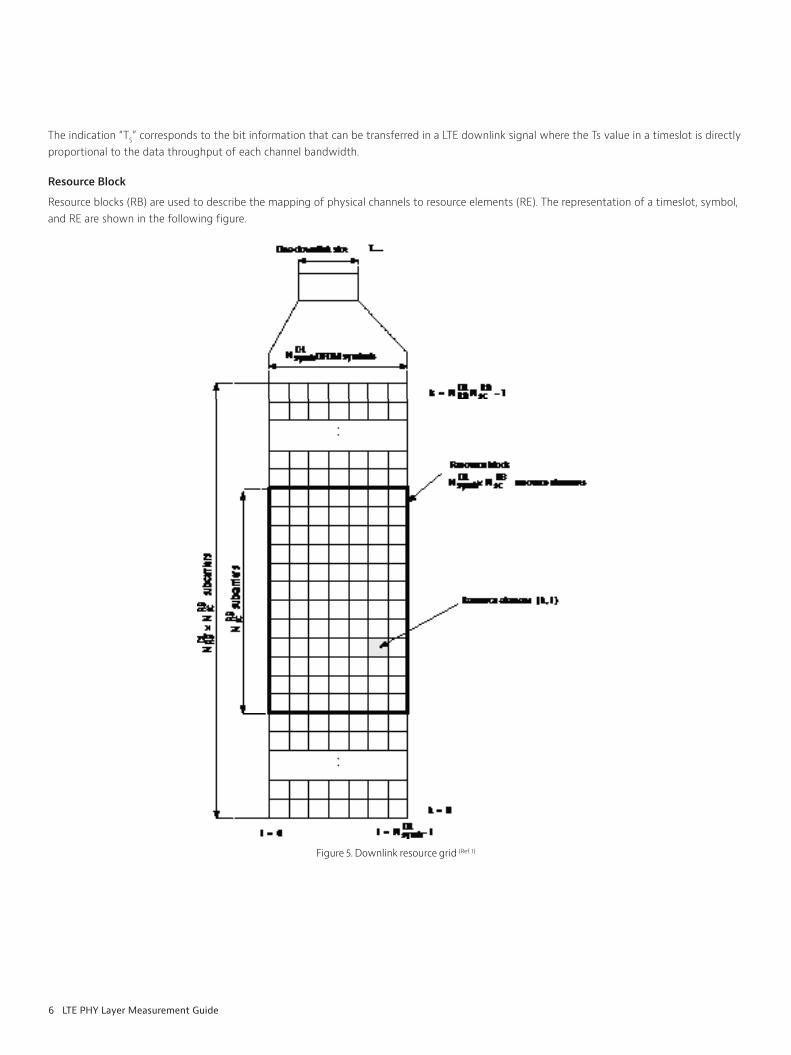
Resource Block
Resource blocks (RB) are used to describe the mapping of physical channels to resource elements (RE) The representation of a timeslot, symbol, and RE are shown in the following figure
Figure 5 Downlink resource grid (Ref 1)
7 LTE PHY Layer Measurement Guide
A physical resource block (RB) is defined as set of 7 consecutive OFDM symbols in the time domain and 12 consecutive subcarriers (SC) in the frequency domain Therefore, a physical resource block contains 84 RE and represents one slot in the time domain of 180 kHz in the frequency domain
Configuration NSCRB Nsymb
DL
Normal cyclic prefix ∆f = 15 kHz 12 7
Extended cyclic ∆f = 15 kHz 6
prefix ∆f = 7 5 kHz 24 3
Table 3 Physical resource blocks parameters (Ref 1)
The number of OFDM symbols in a slot depends on the cyclic prefix length and subcarrier spacing configured
In case of multi-antenna transmission, there is one resource grid defined per antenna port An antenna port is defined by its associated reference signal The set of antenna ports supported depends on the reference signal configuration in the cell:
y cell-specific reference signals, associated with non-MBSFN transmission, support a configuration of one, two, or four antenna ports
y MBSFN reference signals, associated with MBSFN transmission, are transmitted on antenna port 4
y UE-specific reference signals are transmitted on antenna port 5
Cyclic Prefix
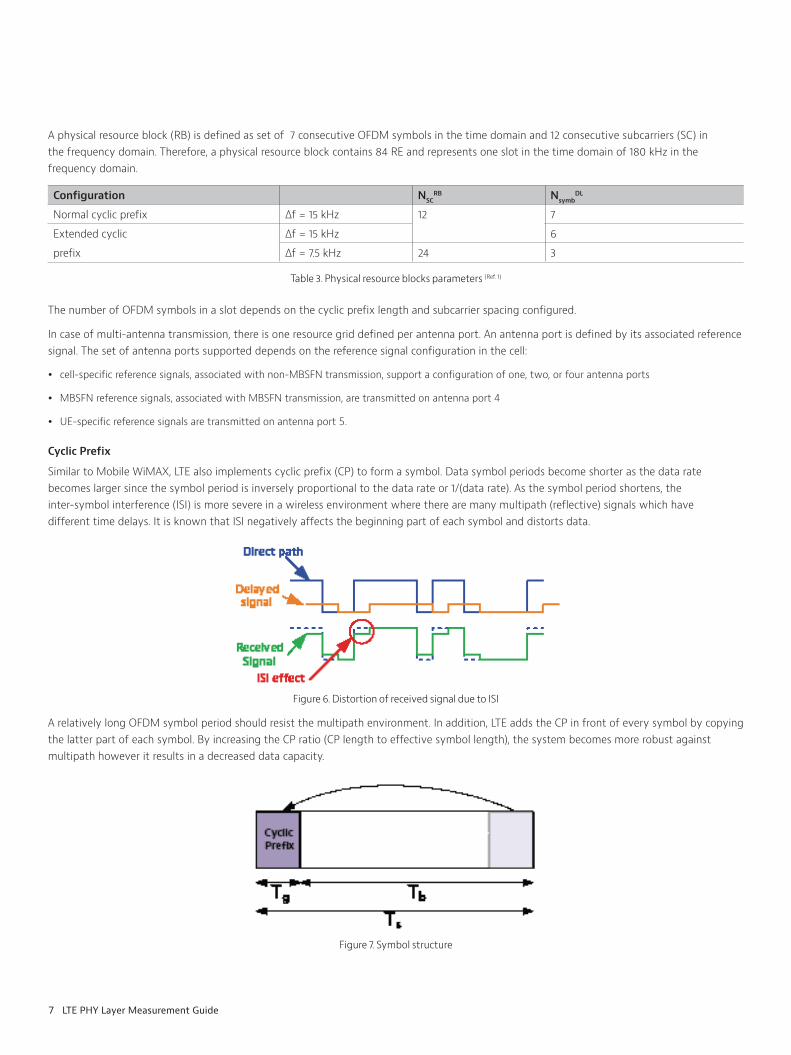
Similar to Mobile WiMAX, LTE also implements cyclic prefix (CP) to form a symbol Data symbol periods become shorter as the data rate becomes larger since the symbol period is inversely proportional to the data rate or 1/(data rate) As the symbol period shortens, the inter-symbol interference (ISI) is more severe in a wireless environment where there are many multipath (reflective) signals which have different time delays It is known that ISI negatively affects the beginning part of each symbol and distorts data
Figure 6 Distortion of received signal due to ISI
A relatively long OFDM symbol period should resist the multipath environment In addition, LTE adds the CP in front of every symbol by copying the latter part of each symbol By increasing the CP ratio (CP length to effective symbol length), the system becomes more robust against multipath however it results in a decreased data capacity
Figure 7 Symbol structure
8 LTE PHY Layer Measurement Guide
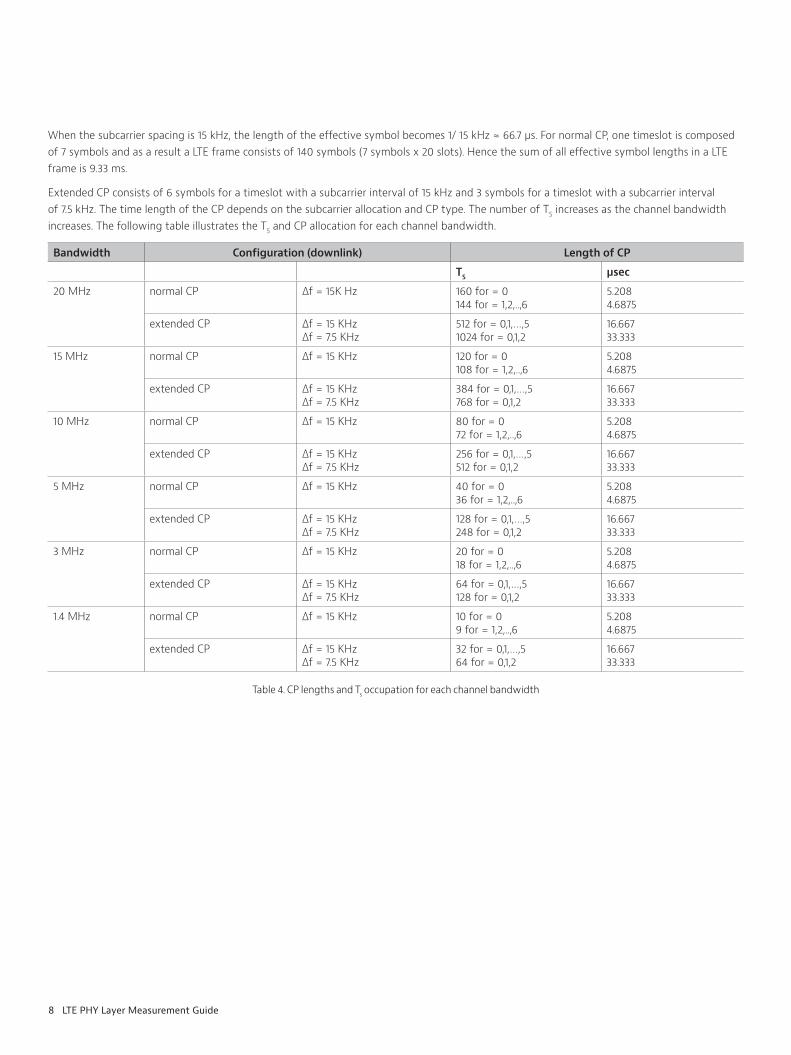
When the subcarrier spacing is 15 kHz, the length of the effective symbol becomes 1/ 15 kHz ≈ 66 7 μs For normal CP, one timeslot is composed of 7 symbols and as a result a LTE frame consists of 140 symbols (7 symbols x 20 slots) Hence the sum of all effective symbol lengths in a LTE frame is 9 33 ms
Extended CP consists of 6 symbols for a timeslot with a subcarrier interval of 15 kHz and 3 symbols for a timeslot with a subcarrier interval of 7 5 kHz The time length of the CP depends on the subcarrier allocation and CP type The number of TS increases as the channel bandwidth increases The following table illustrates the TS and CP allocation for each channel bandwidth
Bandwidth Configuration (downlink) Length of CP
TS μsec
20 MHz normal CP ∆f = 15K Hz 160 for = 0144 for = 1,2, ,6
5 2084 6875
extended CP ∆f = 15 KHz∆f = 7 5 KHz
512 for = 0,1,…,51024 for = 0,1,2
16 66733 333
15 MHz normal CP ∆f = 15 KHz 120 for = 0108 for = 1,2, ,6
5 2084 6875
extended CP ∆f = 15 KHz∆f = 7 5 KHz
384 for = 0,1,…,5768 for = 0,1,2
16 66733 333
10 MHz normal CP ∆f = 15 KHz 80 for = 072 for = 1,2, ,6
5 2084 6875
extended CP ∆f = 15 KHz∆f = 7 5 KHz
256 for = 0,1,…,5512 for = 0,1,2
16 66733 333
5 MHz normal CP ∆f = 15 KHz 40 for = 036 for = 1,2, ,6
5 2084 6875
extended CP ∆f = 15 KHz∆f = 7 5 KHz
128 for = 0,1,…,5248 for = 0,1,2
16 66733 333
3 MHz normal CP ∆f = 15 KHz 20 for = 018 for = 1,2, ,6
5 2084 6875
extended CP ∆f = 15 KHz∆f = 7 5 KHz
64 for = 0,1,…,5128 for = 0,1,2
16 66733 333
1 4 MHz normal CP ∆f = 15 KHz 10 for = 09 for = 1,2, ,6
5 2084 6875
extended CP ∆f = 15 KHz∆f = 7 5 KHz
32 for = 0,1,…,564 for = 0,1,2
16 66733 333
Table 4 CP lengths and Ts occupation for each channel bandwidth
9 LTE PHY Layer Measurement Guide
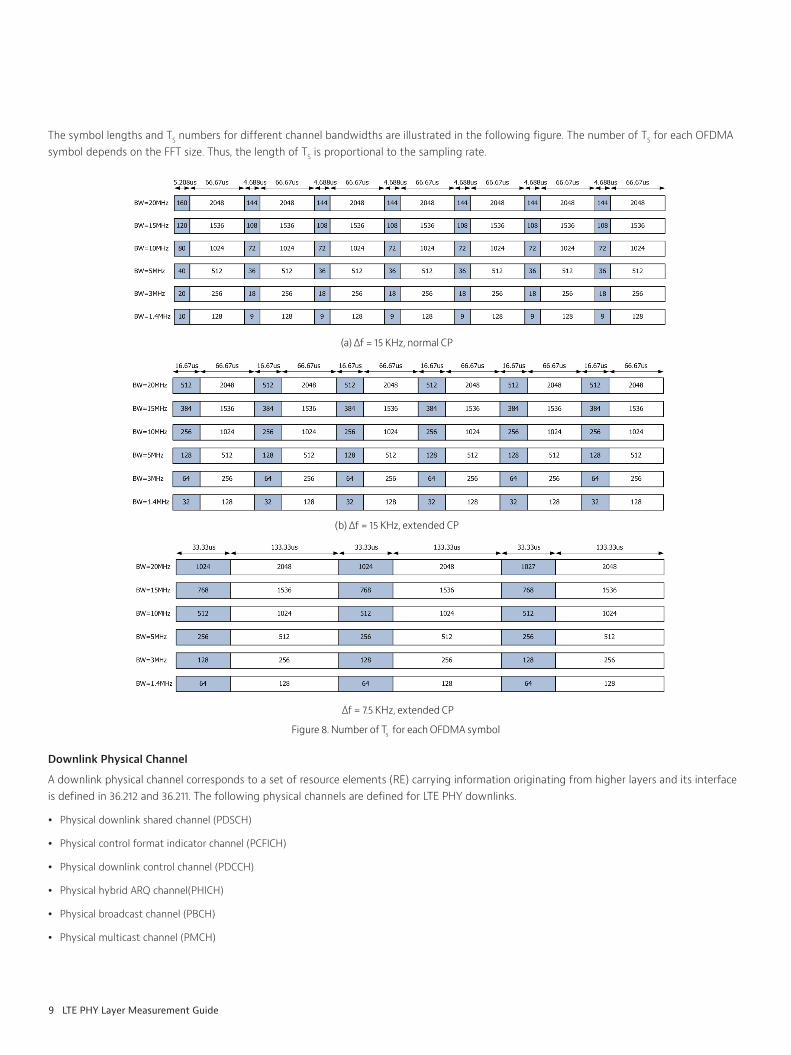
The symbol lengths and TS numbers for different channel bandwidths are illustrated in the following figure The number of TS for each OFDMA symbol depends on the FFT size Thus, the length of TS is proportional to the sampling rate
(a) ∆f = 15 KHz, normal CP
(b) ∆f = 15 KHz, extended CP
∆f = 7 5 KHz, extended CP
Figure 8 Number of Ts for each OFDMA symbol
Downlink Physical Channel
A downlink physical channel corresponds to a set of resource elements (RE) carrying information originating from higher layers and its interface is defined in 36 212 and 36 211 The following physical channels are defined for LTE PHY downlinks
y Physical downlink shared channel (PDSCH)
y Physical control format indicator channel (PCFICH)
y Physical downlink control channel (PDCCH)
y Physical hybrid ARQ channel(PHICH)
y Physical broadcast channel (PBCH)
y Physical multicast channel (PMCH)
10 LTE PHY Layer Measurement Guide
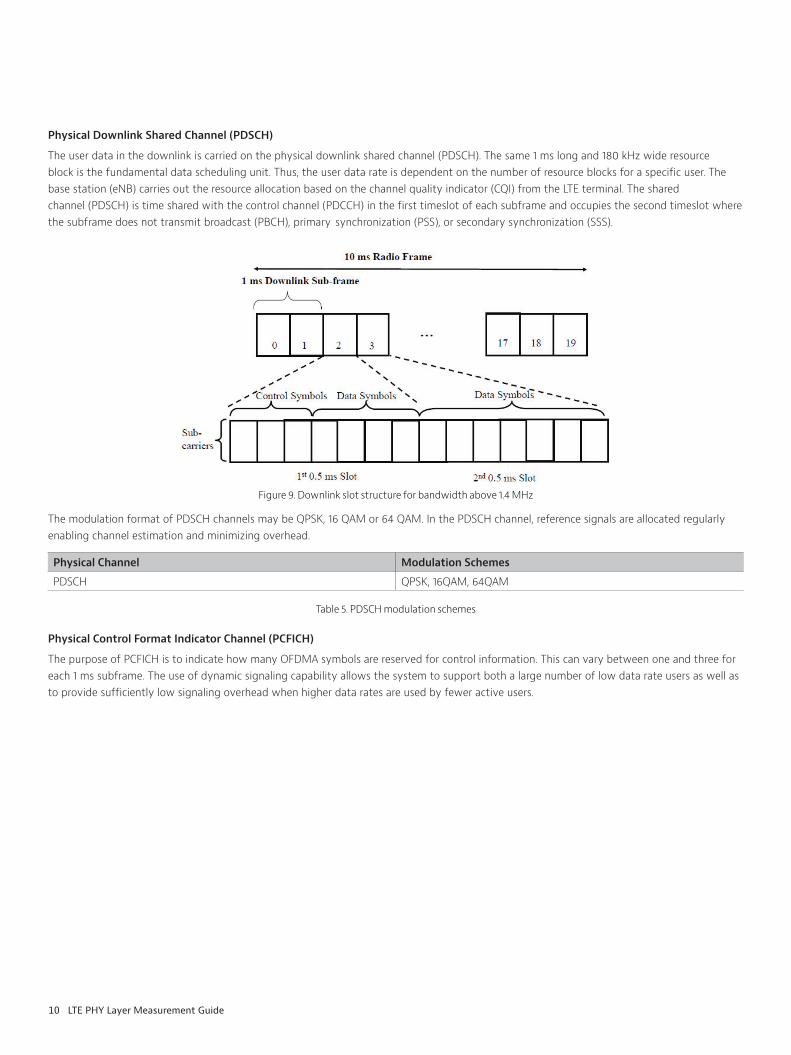
Physical Downlink Shared Channel (PDSCH)
The user data in the downlink is carried on the physical downlink shared channel (PDSCH) The same 1 ms long and 180 kHz wide resource block is the fundamental data scheduling unit Thus, the user data rate is dependent on the number of resource blocks for a specific user The base station (eNB) carries out the resource allocation based on the channel quality indicator (CQI) from the LTE terminal The shared channel (PDSCH) is time shared with the control channel (PDCCH) in the first timeslot of each subframe and occupies the second timeslot where the subframe does not transmit broadcast (PBCH), primary synchronization (PSS), or secondary synchronization (SSS)
Figure 9 Downlink slot structure for bandwidth above 1 4 MHz
The modulation format of PDSCH channels may be QPSK, 16 QAM or 64 QAM In the PDSCH channel, reference signals are allocated regularly enabling channel estimation and minimizing overhead
Physical Channel Modulation Schemes
PDSCH QPSK, 16QAM, 64QAM
Table 5 PDSCH modulation schemes
Physical Control Format Indicator Channel (PCFICH)
The purpose of PCFICH is to indicate how many OFDMA symbols are reserved for control information This can vary between one and three for each 1 ms subframe The use of dynamic signaling capability allows the system to support both a large number of low data rate users as well as to provide sufficiently low signaling overhead when higher data rates are used by fewer active users
11 LTE PHY Layer Measurement Guide
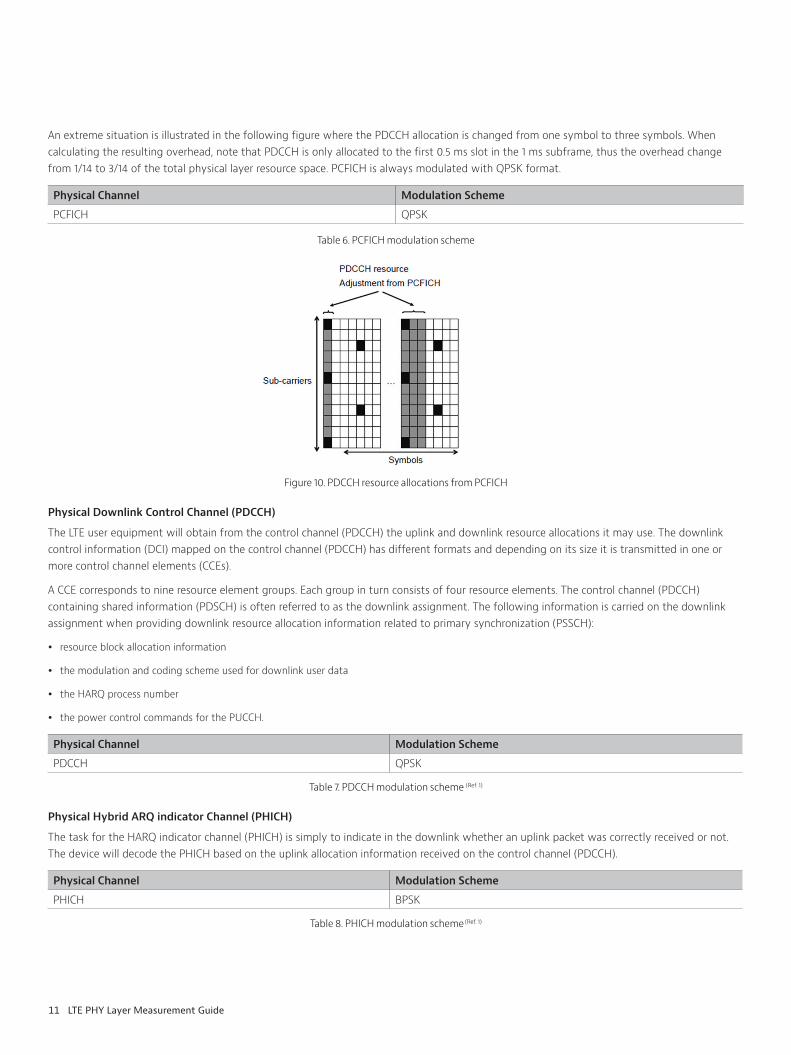
An extreme situation is illustrated in the following figure where the PDCCH allocation is changed from one symbol to three symbols When calculating the resulting overhead, note that PDCCH is only allocated to the first 0 5 ms slot in the 1 ms subframe, thus the overhead change from 1/14 to 3/14 of the total physical layer resource space PCFICH is always modulated with QPSK format
Physical Channel Modulation Scheme
PCFICH QPSK
Table 6 PCFICH modulation scheme
Figure 10 PDCCH resource allocations from PCFICH
Physical Downlink Control Channel (PDCCH)
The LTE user equipment will obtain from the control channel (PDCCH) the uplink and downlink resource allocations it may use The downlink control information (DCI) mapped on the control channel (PDCCH) has different formats and depending on its size it is transmitted in one or more control channel elements (CCEs)
A CCE corresponds to nine resource element groups Each group in turn consists of four resource elements The control channel (PDCCH) containing shared information (PDSCH) is often referred to as the downlink assignment The following information is carried on the downlink assignment when providing downlink resource allocation information related to primary synchronization (PSSCH):
y resource block allocation information
y the modulation and coding scheme used for downlink user data
y the HARQ process number
y the power control commands for the PUCCH
Physical Channel Modulation Scheme
PDCCH QPSK
Table 7 PDCCH modulation scheme (Ref 1)
Physical Hybrid ARQ indicator Channel (PHICH)
The task for the HARQ indicator channel (PHICH) is simply to indicate in the downlink whether an uplink packet was correctly received or not The device will decode the PHICH based on the uplink allocation information received on the control channel (PDCCH)
Physical Channel Modulation Scheme
PHICH BPSK
Table 8 PHICH modulation scheme (Ref 1)
12 LTE PHY Layer Measurement Guide
HARQ Feedback Seen by the UE PDCCH Seen by the UE UE Behaviour
ACK or NACK new transmission new transmission according to PDCCH
ACK or NACK retransmission retransmission according to PDCCH (adaptive retransmission)
ACK none no (re)transmission, keep data in HARQ buffer and a PDDCH is required to resume retrans-missions
NACK none non-adaptive retransmission
Table 9 Uplink HARQ operation (Ref 2)
Physical Broadcast Channel (PBCH)
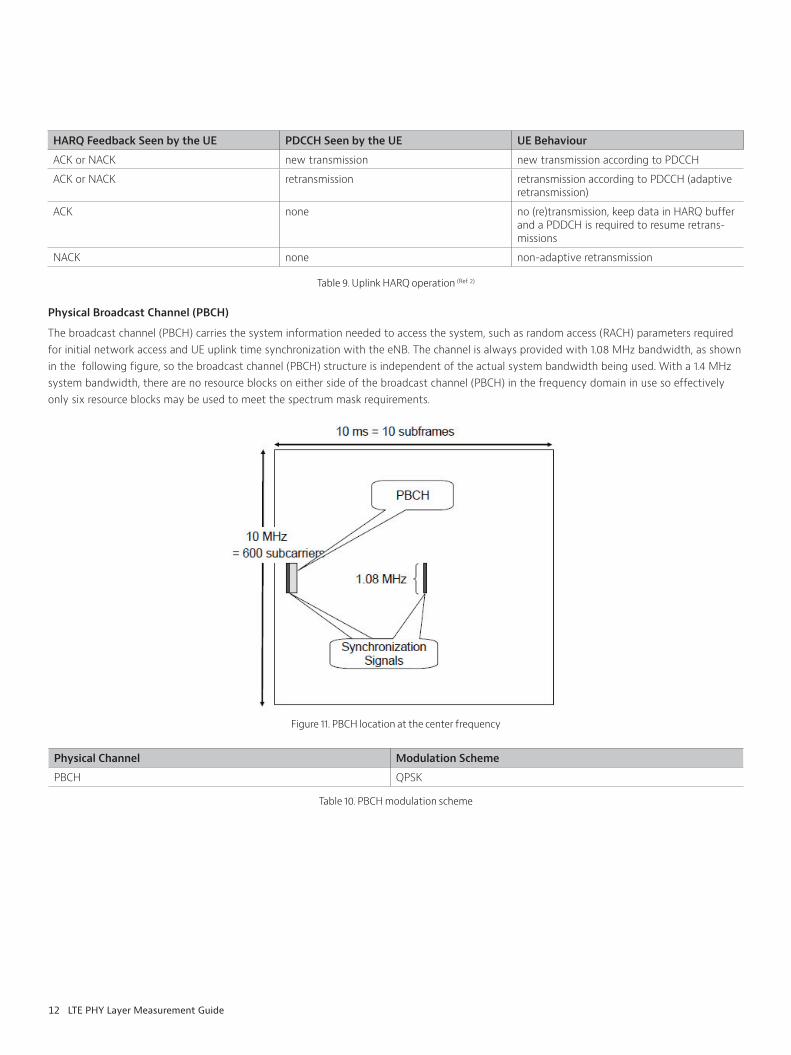
The broadcast channel (PBCH) carries the system information needed to access the system, such as random access (RACH) parameters required for initial network access and UE uplink time synchronization with the eNB The channel is always provided with 1 08 MHz bandwidth, as shown in the following figure, so the broadcast channel (PBCH) structure is independent of the actual system bandwidth being used With a 1 4 MHz system bandwidth, there are no resource blocks on either side of the broadcast channel (PBCH) in the frequency domain in use so effectively only six resource blocks may be used to meet the spectrum mask requirements
Figure 11 PBCH location at the center frequency
Physical Channel Modulation Scheme
PBCH QPSK
Table 10 PBCH modulation scheme
13 LTE PHY Layer Measurement Guide
Physical Multicast Channel (PMCH)
The Physical Multicast Channel carries the multicast channel (MCH) which is characterized by:
y requirement to be broadcast in the entire coverage area of the cell
y support for MBSFN combining of MBMS transmission on multiple cells
y support for semi-static resource allocation (for example, with a time frame of a long cyclic prefix)
Physical Channel Modulation Scheme
PMCH QPSK, 16QAM, 64QAM
Table 11 PMCH modulation schemes
Reference Signal
The cell site (eNB) determines the downlink transmission energy per resource element User equipment (UE) may assume downlink cell-specific reference signal (RS) energy per resource element (EPRE) to be constant across the downlink system bandwidth and constant across all subframes until different cell-specific reference signal (RS) power information is received
The downlink RS EPRE can be derived from the downlink RS transmission power given by the RS signal power provided by higher layers The downlink RS transmit power is defined as the linear average over the power contributions (in [W]) of all resource elements that carry cell-specific RSs within the operating system bandwidth
Three types of downlink RSs are defined:
y cell-specific reference signals, associated with non multimedia broadcast multicast service single frequency network (MBSFN) transmission
y MBSFN reference signals, associated with MBSFN transmission
y UE-specific reference signals
The downlink RSs consist of known reference symbols inserted in the first and third last OFDM symbol of each slot There is one RS transmitted per downlink antenna port The number of downlink antenna ports equals 1, 2, or 4
The two-dimensional RS sequence is generated as the symbol-by-symbol product of a two-dimensional orthogonal sequence and a two-dimensional pseudo-random sequence There are three different two-dimensional orthogonal sequences and 170 different two-dimensional pseudo-random sequences Each cell identity corresponds to a unique combination of one orthogonal sequence and one pseudo-random sequence, thus allowing for 504 unique cell identities and 168 cell identity groups with three cell identities in each group
14 LTE PHY Layer Measurement Guide
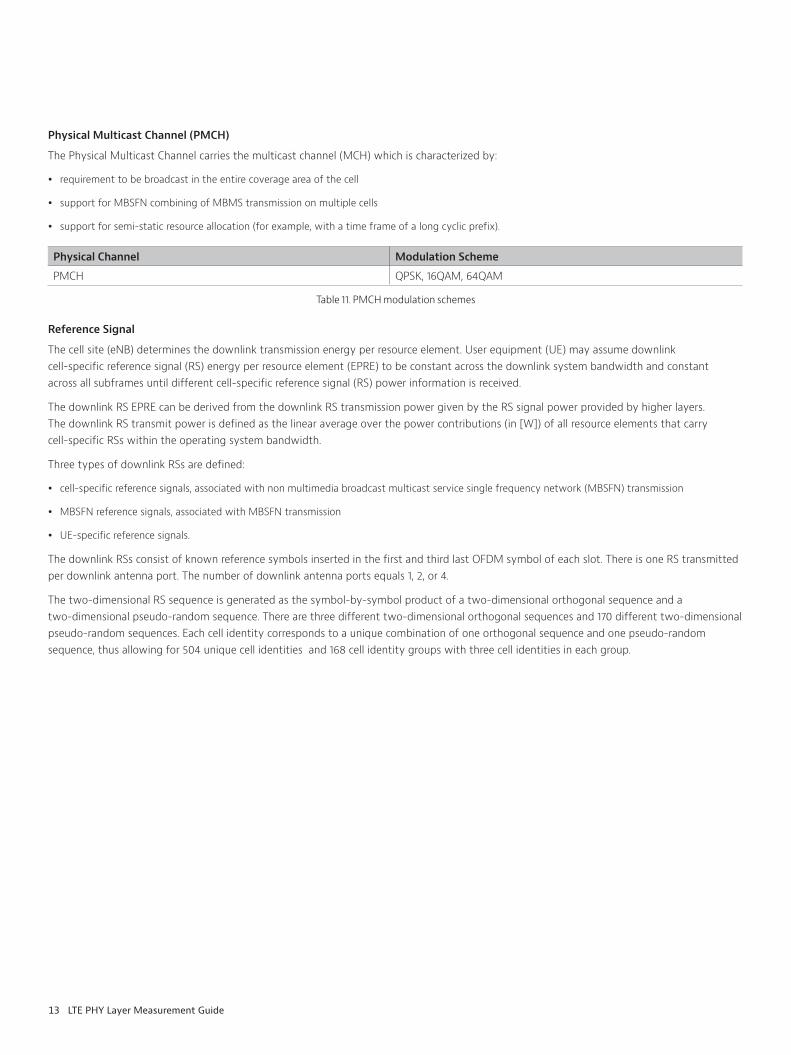
Cell Specific Reference Signals
Cell-specific reference signals shall be transmitted in all downlink subframes in a cell supporting non-MBSFN transmission In case the subframe is used for transmission with MBSFN, only the first two OFDM symbols in a subframe can be used for transmission of cell-specific reference symbols (Ref 1)
Cell-specific reference signals are transmitted on one or several of antenna ports 0 to 3 (Ref 1)
1 2 3 4 5 6 7 8 9 10 11 12 13 14123 R0 R0456 R0 R0789 R0 R0
101112 R0 R0
1 2 3 4 5 6 7 8 9 10 11 12123 R0 R0456 R0 R0789 R0 R0
101112 R0 R0
(a) Normal cyclic prefix (b) Extended cyclic prefix
Figure 12 Mapping of downlink RSs for SISO (Ref 1)
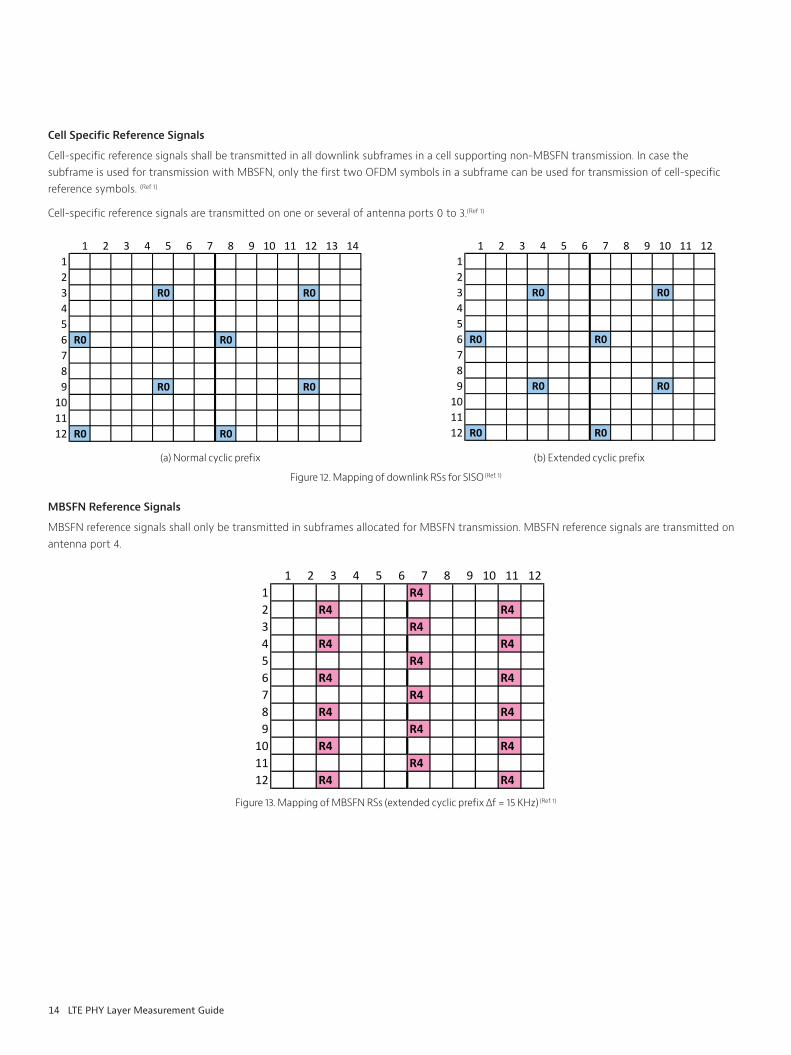
MBSFN Reference Signals
MBSFN reference signals shall only be transmitted in subframes allocated for MBSFN transmission MBSFN reference signals are transmitted on antenna port 4
1 2 3 4 5 6 7 8 9 10 11 121 R42 R4 R43 R44 R4 R45 R46 R4 R47 R48 R4 R49 R4
10 R4 R411 R412 R4 R4
Figure 13 Mapping of MBSFN RSs (extended cyclic prefix ∆f = 15 KHz) (Ref 1)
15 LTE PHY Layer Measurement Guide
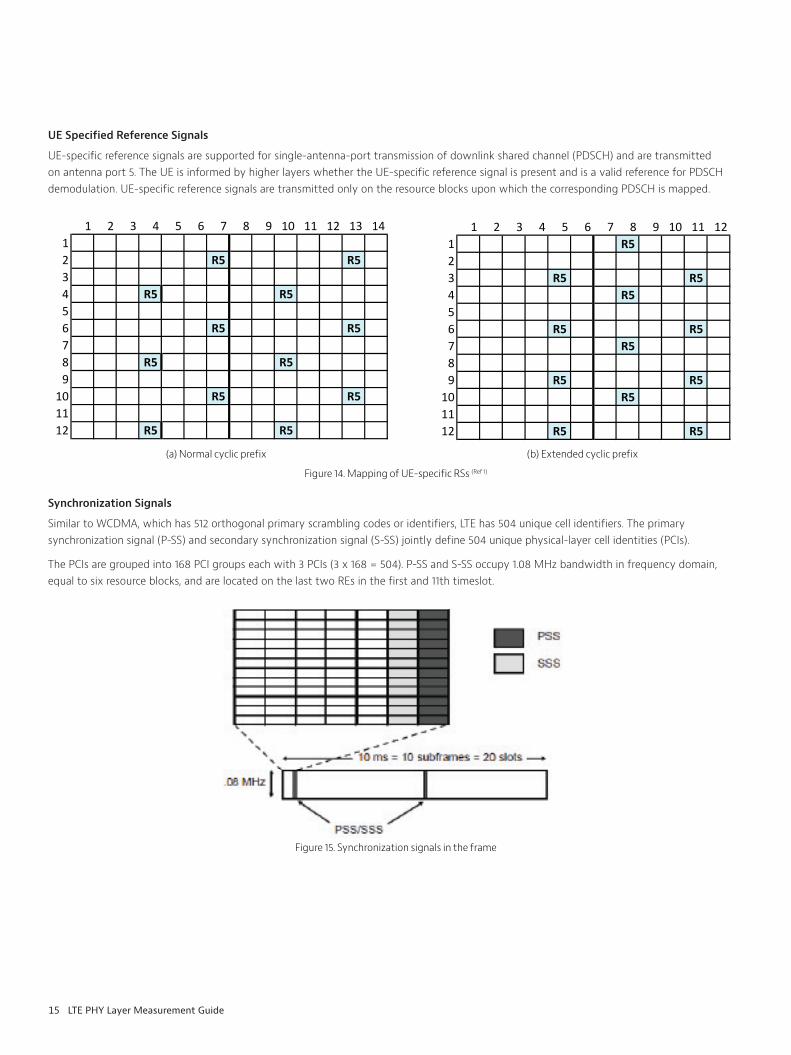
UE Specified Reference Signals
UE-specific reference signals are supported for single-antenna-port transmission of downlink shared channel (PDSCH) and are transmitted on antenna port 5 The UE is informed by higher layers whether the UE-specific reference signal is present and is a valid reference for PDSCH demodulation UE-specific reference signals are transmitted only on the resource blocks upon which the corresponding PDSCH is mapped
1 2 3 4 5 6 7 8 9 10 11 12 13 1412 R5 R534 R5 R556 R5 R578 R5 R59
10 R5 R51112 R5 R5
(a) Normal cyclic prefix (b) Extended cyclic prefix
Figure 14 Mapping of UE-specific RSs (Ref 1)
Synchronization Signals
Similar to WCDMA, which has 512 orthogonal primary scrambling codes or identifiers, LTE has 504 unique cell identifiers The primary synchronization signal (P-SS) and secondary synchronization signal (S-SS) jointly define 504 unique physical-layer cell identities (PCIs)
The PCIs are grouped into 168 PCI groups each with 3 PCIs (3 x 168 = 504) P-SS and S-SS occupy 1 08 MHz bandwidth in frequency domain, equal to six resource blocks, and are located on the last two REs in the first and 11th timeslot
Figure 15 Synchronization signals in the frame
1 2 3 4 5 6 7 8 9 10 11 121 R523 R5 R54 R556 R5 R57 R589 R5 R5
10 R51112 R5 R5
16 LTE PHY Layer Measurement Guide
LTE Downlink Map
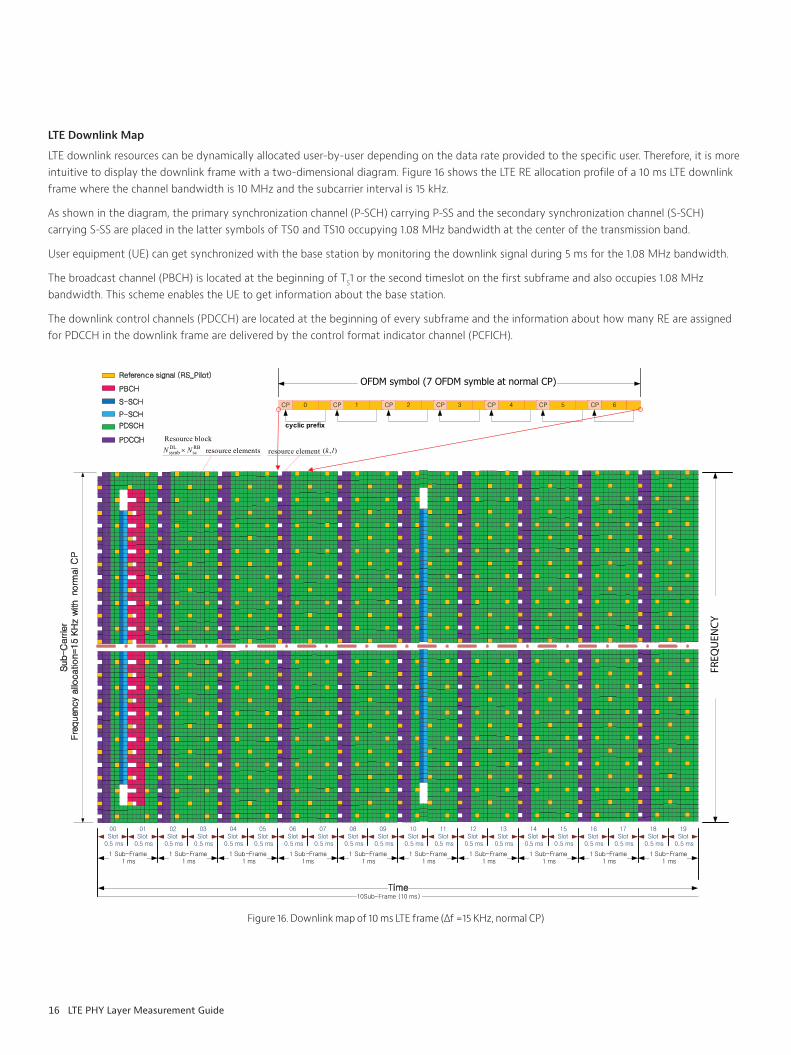
LTE downlink resources can be dynamically allocated user-by-user depending on the data rate provided to the specific user Therefore, it is more intuitive to display the downlink frame with a two-dimensional diagram Figure 16 shows the LTE RE allocation profile of a 10 ms LTE downlink frame where the channel bandwidth is 10 MHz and the subcarrier interval is 15 kHz
As shown in the diagram, the primary synchronization channel (P-SCH) carrying P-SS and the secondary synchronization channel (S-SCH) carrying S-SS are placed in the latter symbols of TS0 and TS10 occupying 1 08 MHz bandwidth at the center of the transmission band
User equipment (UE) can get synchronized with the base station by monitoring the downlink signal during 5 ms for the 1 08 MHz bandwidth
The broadcast channel (PBCH) is located at the beginning of TS1 or the second timeslot on the first subframe and also occupies 1 08 MHz bandwidth This scheme enables the UE to get information about the base station
The downlink control channels (PDCCH) are located at the beginning of every subframe and the information about how many RE are assigned for PDCCH in the downlink frame are delivered by the control format indicator channel (PCFICH)
00Slot
0.5 ms
01Slot
0.5 ms
1 Sub-Frame1 ms
02Slot
0.5 ms
03Slot
0.5 ms
1 Sub-Frame1 ms
04Slot
0.5 ms
05Slot
0.5 ms
1 Sub-Frame1 ms
06Slot
0.5 ms
07Slot
0.5 ms
1 Sub-Frame1ms
08Slot
0.5 ms
09Slot
0.5 ms
1 Sub-Frame1 ms
10Slot
0.5 ms
11Slot
0.5 ms
1 Sub-Frame1 ms
12Slot
0.5 ms
13Slot
0.5 ms
1 Sub-Frame1 ms
14Slot
0.5 ms
15Slot
0.5 ms
1 Sub-Frame1 ms
16Slot
0.5 ms
17Slot
0.5 ms
1 Sub-Frame1 ms
18Slot
0.5 ms
19Slot
0.5 ms
1 Sub-Frame1 ms
10Sub-Frame (10 ms)
Time
FREQUENCY
Sub-C
arrie
rFre
quen
cy
al lo
cat io
n=15
KH
z w
it h
or m
al C
P
Reference signal (RS_Pilot)
PDCCH
PBCH
S-SCH
P-SCH
PDSCH
resource element ),( lkRBsc
DLsymb NN ×
Resource blockresource elements
0CP 1CP 2CP 3CP 4CP 5CP 6CP
cyclic prefix
OFDM symbol (7 OFDM symble at normal CP)
FREQ
UEN
CY
Figure 16 Downlink map of 10 ms LTE frame (∆f =15 KHz, normal CP)

17 LTE PHY Layer Measurement Guide
LTE PHY MeasurementThe 3GPP requirements for LTE transmitters can be grouped in the following three categories:
y output power control capability of base station OFDMA allows dynamic resource allocation to the system Thus, the eNB can handle a wide dynamic range of RB configurations while maintaining high quality of service (QoS)
y transmitted signal modulation quality, also known as error vector magnitude (EVM) requirements These requirements will determine the in-channel performance for the transmission portion of the downlink
y unwanted emissions, for inside and outside the operating band The corresponding requirements will ensure the RF compatibility of the LTE downlink with systems operating in adjacent frequency bands
To ensure the performance of LTE transmitters based on the above three categories, 3GPP recommends performing the following tests for LTE-FDD base stations:
y base-station output power
y output power dynamic
y frequency error
y modulation quality metric using error vector magnitude (EVM)
y MIMO time alignment between transmitter’s branches
y downlink reference signal power
y occupied bandwidth
y adjacent channel leakage power ratio (ACLR)
y operating band unwanted emissions
y transmitter’s spurious emissions
Base Station Analyzer
The Base Station Analyzer includes all measurements required to properly characterize the cell site infrastructure and verify the overall base station performance The key measurement functions supported by the Base Station Analyzer are the following:
y spectrum analyzer
y cable and antenna analyzer
y power meter
y interference analysis
y channel scanner
y backhaul analysis (E1, T1, Ethernet)
y Signal analysis for the following technologies:
− cdmaOne/CDMA2000
− EV-DO
− GSM/ GPRS/ EDGE
− WCDMA/HSDPA
− TD-SCDMA
− Mobile WiMAX
− LTE-FDD and LTE-TDD
18 LTE PHY Layer Measurement Guide
The Base Station Analyzer covers all the above measurement parameters except band emissions due to its extended frequency requirement The Base Station Analyzer measurement summary is as follows:
y channel power
y occupied bandwidth
y spurious emission mask (SEM)
y adjacent channel leakage power ratio (ACLR)
y signal quality analysis (demodulator)
− data channel summary
− control channel summary
− subframe summary
− frame summary
− power vs time (P vs T)
− complementary cumulative distribution function (CCDF)
− MIMO time alignment
y Over the air analysis
− ID scanner
− downlink datagram
− control channels
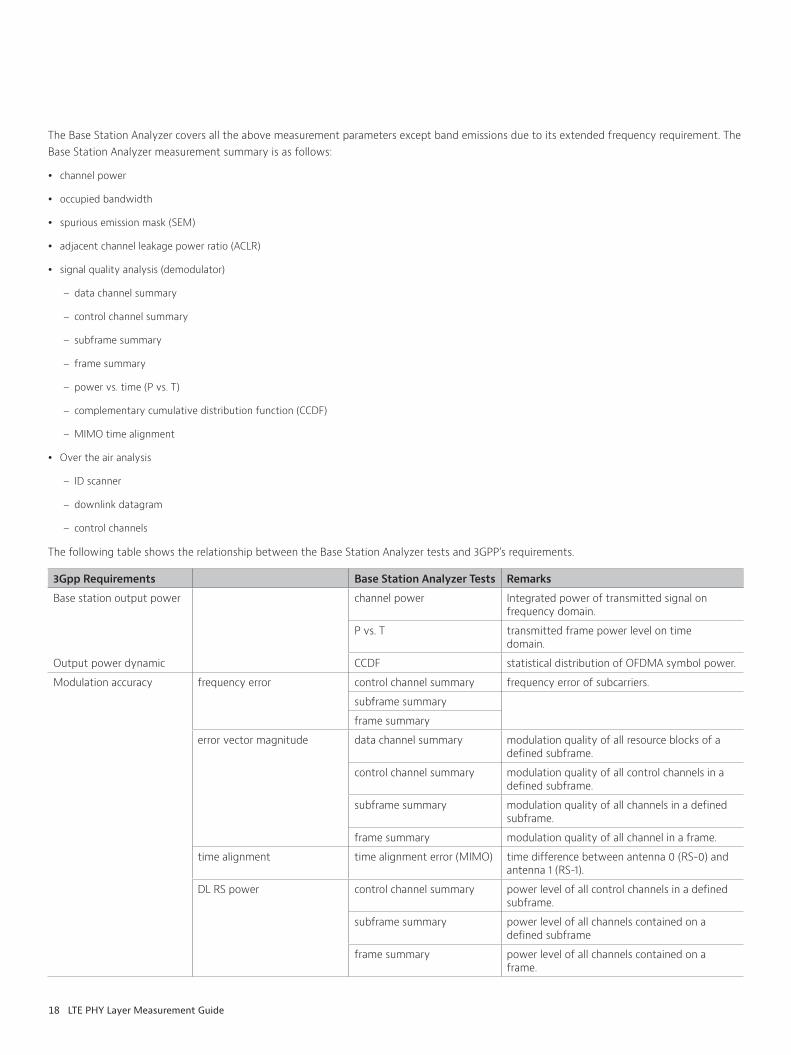
The following table shows the relationship between the Base Station Analyzer tests and 3GPP’s requirements
3Gpp Requirements Base Station Analyzer Tests Remarks
Base station output power channel power Integrated power of transmitted signal on frequency domain
P vs T transmitted frame power level on time domain
Output power dynamic CCDF statistical distribution of OFDMA symbol power
Modulation accuracy frequency error control channel summary frequency error of subcarriers
subframe summary
frame summary
error vector magnitude data channel summary modulation quality of all resource blocks of a defined subframe
control channel summary modulation quality of all control channels in a defined subframe
subframe summary modulation quality of all channels in a defined subframe
frame summary modulation quality of all channel in a frame
time alignment time alignment error (MIMO) time difference between antenna 0 (RS-0) and antenna 1 (RS-1)
DL RS power control channel summary power level of all control channels in a defined subframe
subframe summary power level of all channels contained on a defined subframe
frame summary power level of all channels contained on a frame
19 LTE PHY Layer Measurement Guide
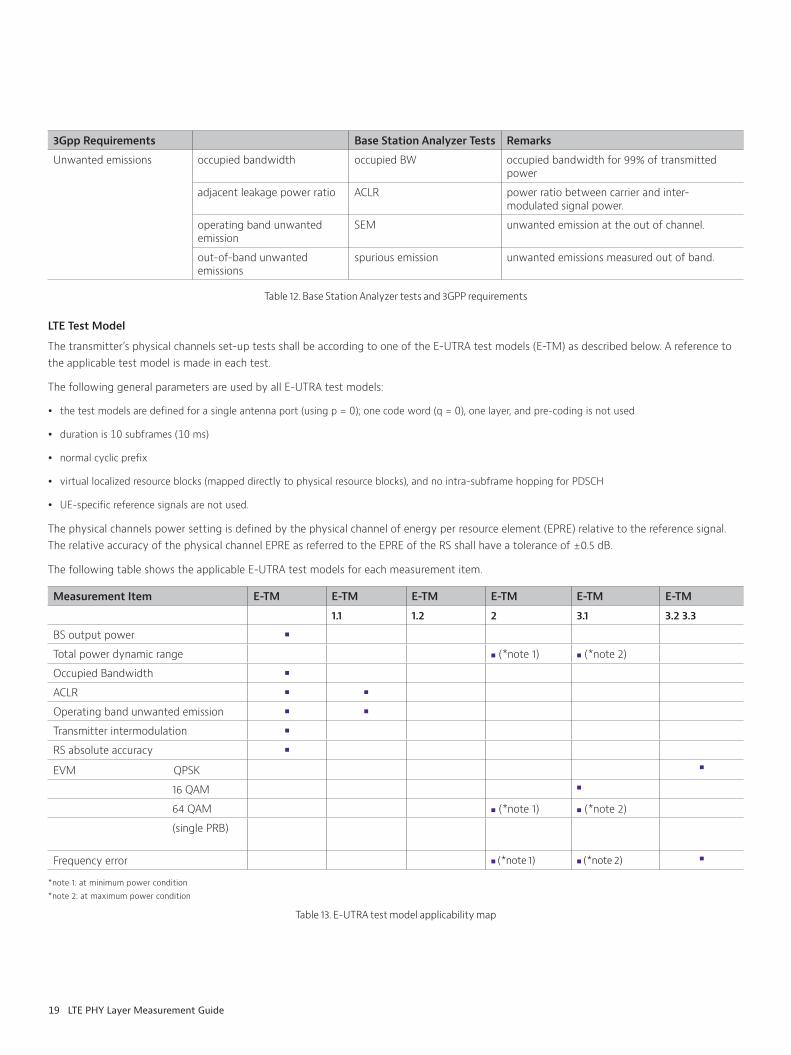
3Gpp Requirements Base Station Analyzer Tests Remarks
Unwanted emissions occupied bandwidth occupied BW occupied bandwidth for 99% of transmitted power
adjacent leakage power ratio ACLR power ratio between carrier and inter- modulated signal power
operating band unwanted emission
SEM unwanted emission at the out of channel
out-of-band unwanted emissions
spurious emission unwanted emissions measured out of band
Table 12 Base Station Analyzer tests and 3GPP requirements
LTE Test Model
The transmitter’s physical channels set-up tests shall be according to one of the E-UTRA test models (E-TM) as described below A reference to the applicable test model is made in each test
The following general parameters are used by all E-UTRA test models:
y the test models are defined for a single antenna port (using p = 0); one code word (q = 0), one layer, and pre-coding is not used
y duration is 10 subframes (10 ms)
y normal cyclic prefix
y virtual localized resource blocks (mapped directly to physical resource blocks), and no intra-subframe hopping for PDSCH
y UE-specific reference signals are not used
The physical channels power setting is defined by the physical channel of energy per resource element (EPRE) relative to the reference signal The relative accuracy of the physical channel EPRE as referred to the EPRE of the RS shall have a tolerance of ±0 5 dB
The following table shows the applicable E-UTRA test models for each measurement item
Measurement Item E-TM E-TM E-TM E-TM E-TM E-TM
1 1 1 2 2 3 1 3 2 3 3
BS output power
Total power dynamic range (*note 1) (*note 2)
Occupied Bandwidth
ACLR
Operating band unwanted emission
Transmitter intermodulation
RS absolute accuracy
EVM QPSK
16 QAM
64 QAM (*note 1) (*note 2)
(single PRB)
Frequency error (*note 1) (*note 2)
*note 1: at minimum power condition*note 2: at maximum power condition
Table 13 E-UTRA test model applicability map
20 LTE PHY Layer Measurement Guide
Base Station Analyzer Measurement Setup
The following parameters should be properly set on the Base Station Analyzer to test and measure the LTE transmitter:
y Trigger—four types of trigger modes are available
- Internal—sets the trigger to internal reference
- External—sets the trigger to external reference
- GPS—sets the trigger to built-in GPS receiver
- Free—sets the trigger mode to free run
y Subframe No —allows the selection of the downlink subframe number to analyze
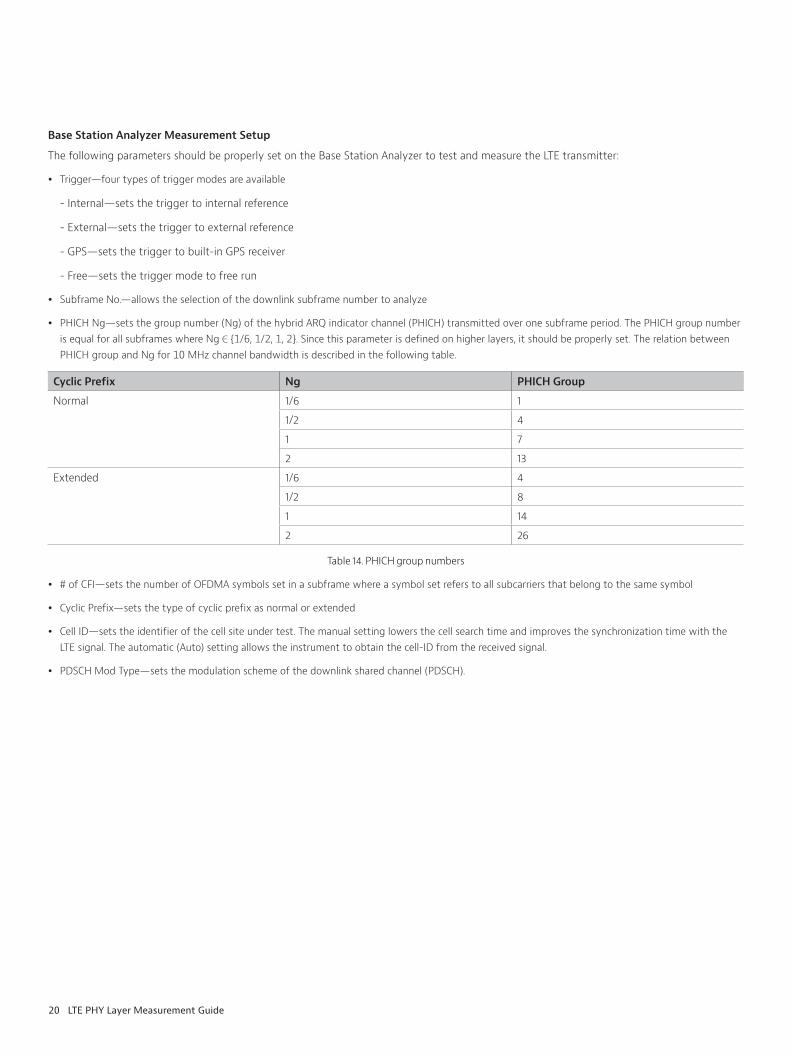
y PHICH Ng—sets the group number (Ng) of the hybrid ARQ indicator channel (PHICH) transmitted over one subframe period The PHICH group number is equal for all subframes where Ng Є {1/6, 1/2, 1, 2} Since this parameter is defined on higher layers, it should be properly set The relation between PHICH group and Ng for 10 MHz channel bandwidth is described in the following table
Cyclic Prefix Ng PHICH Group
Normal 1/6 1
1/2 4
1 7
2 13
Extended 1/6 4
1/2 8
1 14
2 26
Table 14 PHICH group numbers
y # of CFI—sets the number of OFDMA symbols set in a subframe where a symbol set refers to all subcarriers that belong to the same symbol
y Cyclic Prefix—sets the type of cyclic prefix as normal or extended
y Cell ID—sets the identifier of the cell site under test The manual setting lowers the cell search time and improves the synchronization time with the LTE signal The automatic (Auto) setting allows the instrument to obtain the cell-ID from the received signal
y PDSCH Mod Type—sets the modulation scheme of the downlink shared channel (PDSCH)
21 LTE PHY Layer Measurement Guide
Power Measurement
There are two required measurements defined by 3GPP: base station output power and total power dynamic range However, they are considered equivalent since it is required to measure the output power of the base station under varying output power
Power measurements can be done in the following tests depending on the base station power performance characteristic
y Channel power
y Power vs time (P vs T)
y Complementary cumulative distribution function (CCDF)
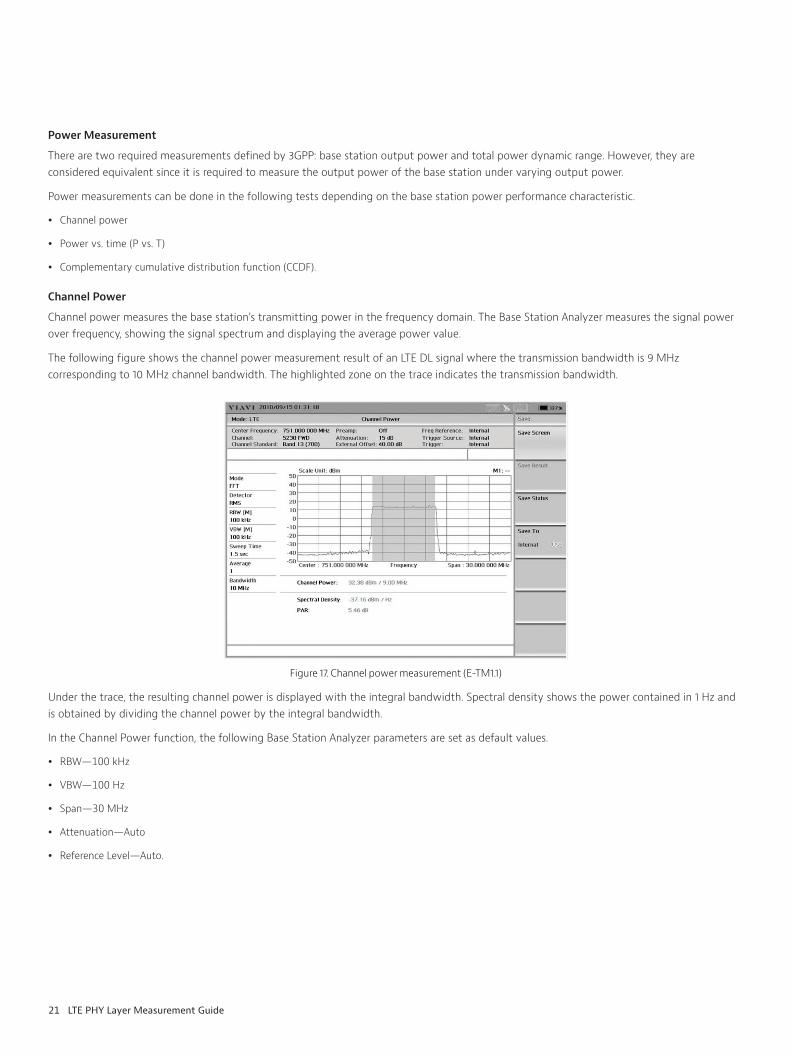
Channel Power
Channel power measures the base station’s transmitting power in the frequency domain The Base Station Analyzer measures the signal power over frequency, showing the signal spectrum and displaying the average power value
The following figure shows the channel power measurement result of an LTE DL signal where the transmission bandwidth is 9 MHz corresponding to 10 MHz channel bandwidth The highlighted zone on the trace indicates the transmission bandwidth
Figure 17 Channel power measurement (E-TM1 1)
Under the trace, the resulting channel power is displayed with the integral bandwidth Spectral density shows the power contained in 1 Hz and is obtained by dividing the channel power by the integral bandwidth
In the Channel Power function, the following Base Station Analyzer parameters are set as default values
y RBW—100 kHz
y VBW—100 Hz
y Span—30 MHz
y Attenuation—Auto
y Reference Level—Auto
22 LTE PHY Layer Measurement Guide
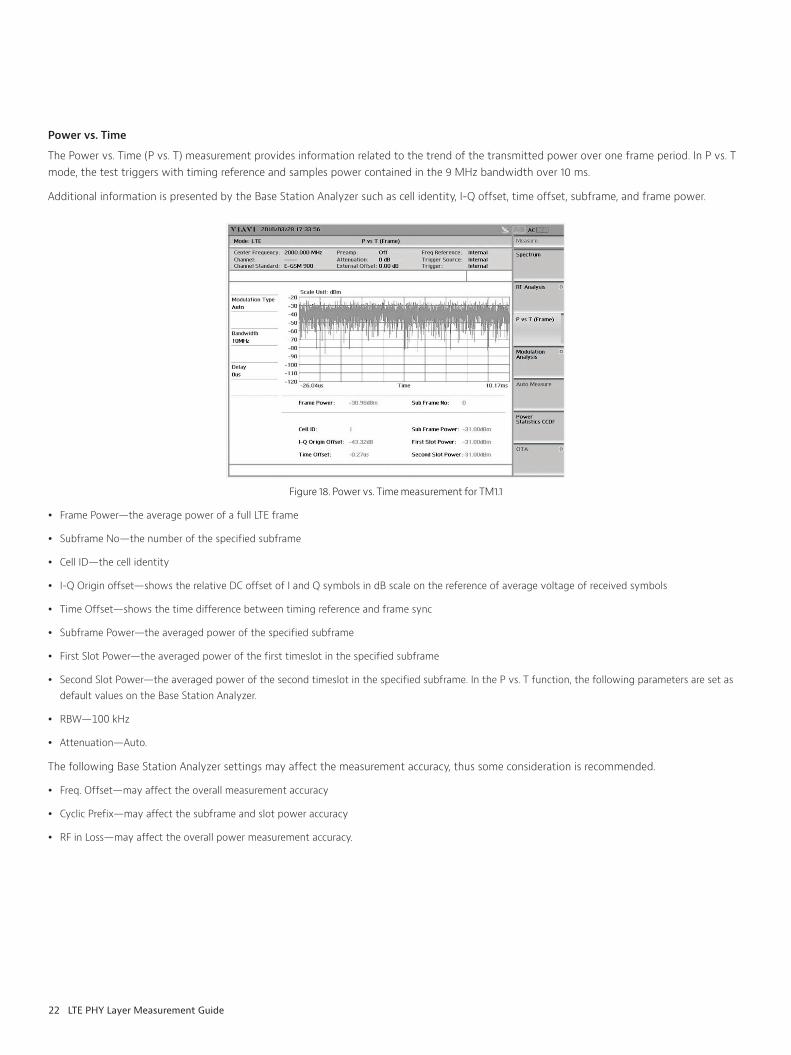
Power vs Time
The Power vs Time (P vs T) measurement provides information related to the trend of the transmitted power over one frame period In P vs T mode, the test triggers with timing reference and samples power contained in the 9 MHz bandwidth over 10 ms
Additional information is presented by the Base Station Analyzer such as cell identity, I-Q offset, time offset, subframe, and frame power
Figure 18 Power vs Time measurement for TM1 1
y Frame Power—the average power of a full LTE frame
y Subframe No—the number of the specified subframe
y Cell ID—the cell identity
y I-Q Origin offset—shows the relative DC offset of I and Q symbols in dB scale on the reference of average voltage of received symbols
y Time Offset—shows the time difference between timing reference and frame sync
y Subframe Power—the averaged power of the specified subframe
y First Slot Power—the averaged power of the first timeslot in the specified subframe
y Second Slot Power—the averaged power of the second timeslot in the specified subframe In the P vs T function, the following parameters are set as default values on the Base Station Analyzer
y RBW—100 kHz
y Attenuation—Auto
The following Base Station Analyzer settings may affect the measurement accuracy, thus some consideration is recommended
y Freq Offset—may affect the overall measurement accuracy
y Cyclic Prefix—may affect the subframe and slot power accuracy
y RF in Loss—may affect the overall power measurement accuracy
23 LTE PHY Layer Measurement Guide
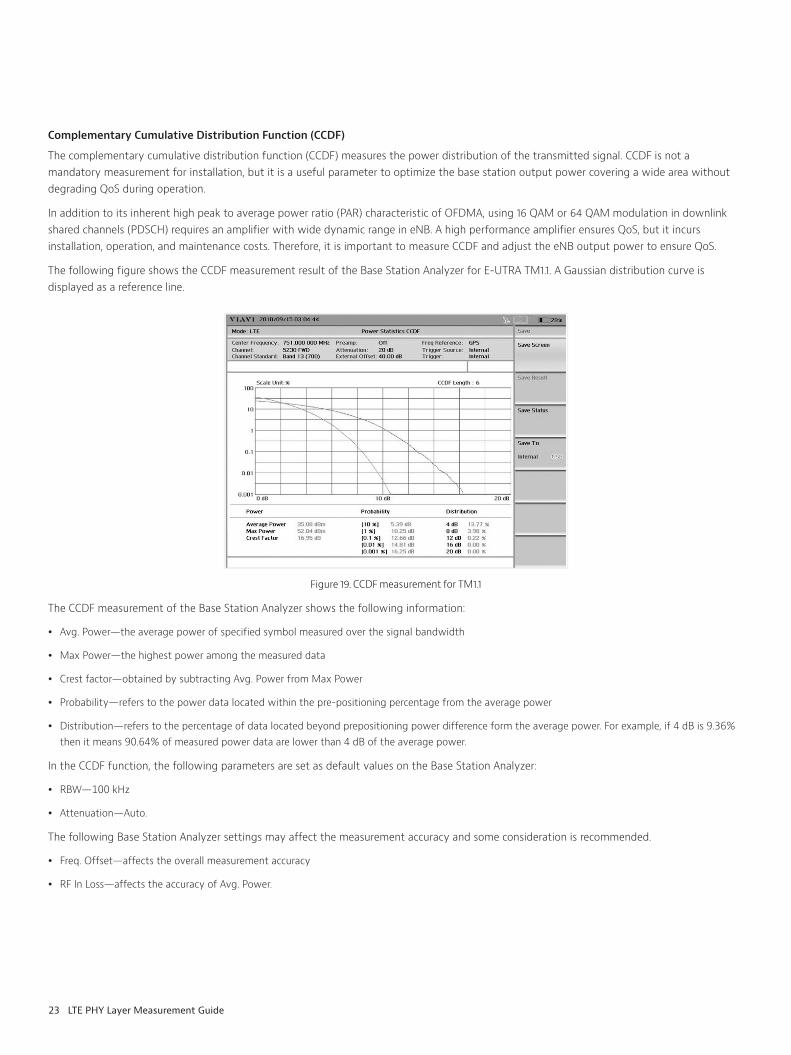
Complementary Cumulative Distribution Function (CCDF)
The complementary cumulative distribution function (CCDF) measures the power distribution of the transmitted signal CCDF is not a mandatory measurement for installation, but it is a useful parameter to optimize the base station output power covering a wide area without degrading QoS during operation
In addition to its inherent high peak to average power ratio (PAR) characteristic of OFDMA, using 16 QAM or 64 QAM modulation in downlink shared channels (PDSCH) requires an amplifier with wide dynamic range in eNB A high performance amplifier ensures QoS, but it incurs installation, operation, and maintenance costs Therefore, it is important to measure CCDF and adjust the eNB output power to ensure QoS
The following figure shows the CCDF measurement result of the Base Station Analyzer for E-UTRA TM1 1 A Gaussian distribution curve is displayed as a reference line
Figure 19 CCDF measurement for TM1 1
The CCDF measurement of the Base Station Analyzer shows the following information:
y Avg Power—the average power of specified symbol measured over the signal bandwidth
y Max Power—the highest power among the measured data
y Crest factor—obtained by subtracting Avg Power from Max Power
y Probability—refers to the power data located within the pre-positioning percentage from the average power
y Distribution—refers to the percentage of data located beyond prepositioning power difference form the average power For example, if 4 dB is 9 36% then it means 90 64% of measured power data are lower than 4 dB of the average power
In the CCDF function, the following parameters are set as default values on the Base Station Analyzer:
y RBW—100 kHz
y Attenuation—Auto
The following Base Station Analyzer settings may affect the measurement accuracy and some consideration is recommended
y Freq Offset—affects the overall measurement accuracy
y RF In Loss—affects the accuracy of Avg Power
24 LTE PHY Layer Measurement Guide
Modulation Accuracy Measurement
The purpose of base-station demodulation performance requirements is to estimate how the network is performing and to verify possible eNB impairments that can cause network degradation eNB impairments include RF and baseband impairments, receiver EVM, time and frequency tracking, and frequency estimation, among others
3GPP recommends modulation-specific error vector magnitude (EVM) requirements to ensure high-quality signals of the eNB Typical impairments of the transmitted signal modulation accuracy are analog RF distortions (frequency offset, local oscillator phase noise, amplitude/phase ripple from analog filters) as well as distortions created within the digital domain such as inter-symbol interference from digital filters used for symbol shaping, finite word length effects, and, most important for conditions near maximum transmit power, the clipping noise from peak-to-average ratio reduction
The EVM requirement ensures that the downlink throughput due to the non-ideal waveform in the eNB is only marginally reduced, typically by 5% assuming an ideal reception in the UE The required EVM must be fulfilled for all transmission configurations and across the entire dynamic range of power levels used by the eNB
It is known that the following factors affect the modulation accuracy of transmitters:
y carrier rejection—as the measurement is made after ZF-equalization, the Base Station Analyzer partially removes this contribution LTE standardization has set a separate specification for carrier rejection to ensure that the carrier level stays within reasonable limits for the ZF algorithm At low output power, a small DC offset in the TX chain generates high carrier leakage to a point where the transmission power control (TPC) accuracy may not be within specifications For this reason, carrier-leakage compensation is implemented in RF transmitters and this technique generally achieves 40 dB of carrier rejection throughout the TPC range, making this contribution negligible in the EVM budget
y even-order distortion—even order non-linearity contributes mainly to adjacent channel leakage ratio (ACLR) as the main effect is to enlarge the transmitted spectrum As ACLR requirements are 33 dB and 43 dB in adjacent and alternate channels, these contributions are usually negligible in terms of EVM
y local oscillator phase noise—the induced jitter generates phase error in the modulation constellation, thus contributing to EVM
y power-amplifier distortion—amplifier distortion has a contribution to EVM and also generates asymmetrical spectral energy in the adjacent channels
y image—the signal image generated by the quadrature imperfections in the up-mixing process can be considered as band noise contributing to the TX signal-to-noise ratio (SNR)
y group-delay distortion—LTE has an I/Q BW of 5 MHz for 30 MHz duplex distance or 10 MHz for 80 MHz duplex distance Significant broadband filtering is required to ensure that I/Q noise at the duplex frequency offset is low
Overall, the LTE EVM specification requires special attention to the higher bandwidth and smaller duplex distances For the same reasons, the TX out-of-band noise is more difficult to achieve in LTE
The Base Station Analyzer satisfies the requirement of 3GPP for modulation accuracy measurement for LTE signals In addition to this, it provides additional features for more in-depth analysis such as:
y Frame Summary
y Subframe Summary
y Control Channel Summary
y Data Channel Summary
25 LTE PHY Layer Measurement Guide
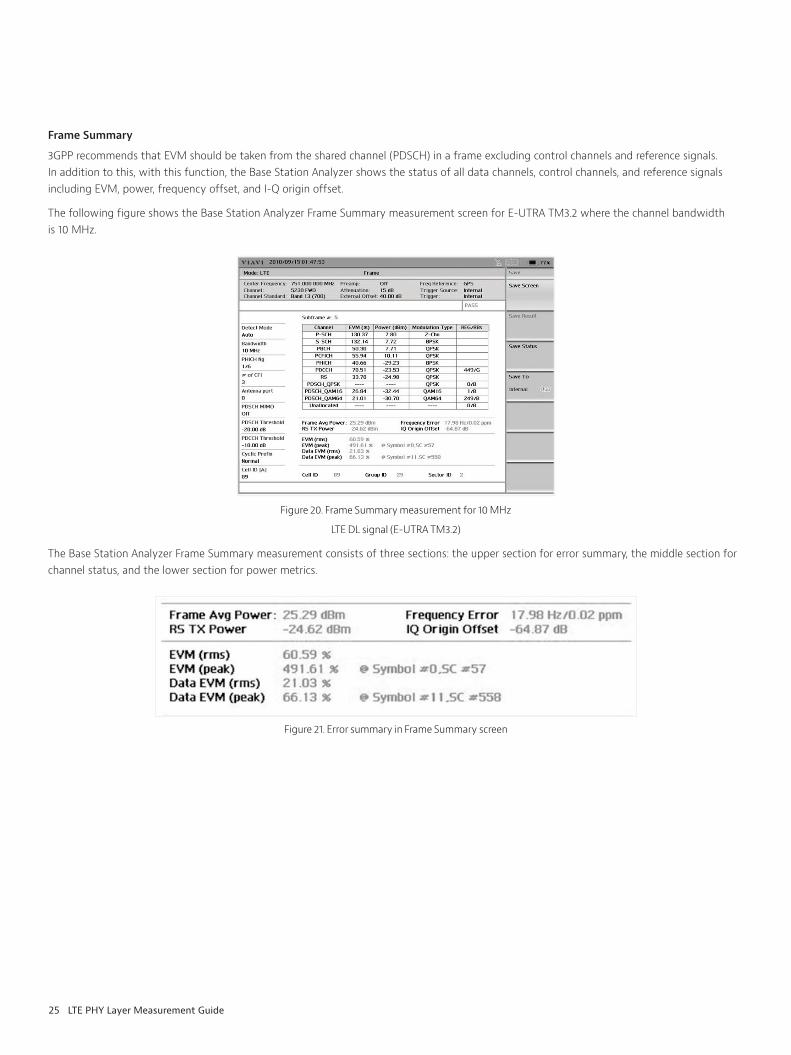
Frame Summary
3GPP recommends that EVM should be taken from the shared channel (PDSCH) in a frame excluding control channels and reference signals In addition to this, with this function, the Base Station Analyzer shows the status of all data channels, control channels, and reference signals including EVM, power, frequency offset, and I-Q origin offset
The following figure shows the Base Station Analyzer Frame Summary measurement screen for E-UTRA TM3 2 where the channel bandwidth is 10 MHz
Figure 20 Frame Summary measurement for 10 MHz
LTE DL signal (E-UTRA TM3 2)
The Base Station Analyzer Frame Summary measurement consists of three sections: the upper section for error summary, the middle section for channel status, and the lower section for power metrics
Figure 21 Error summary in Frame Summary screen
26 LTE PHY Layer Measurement Guide
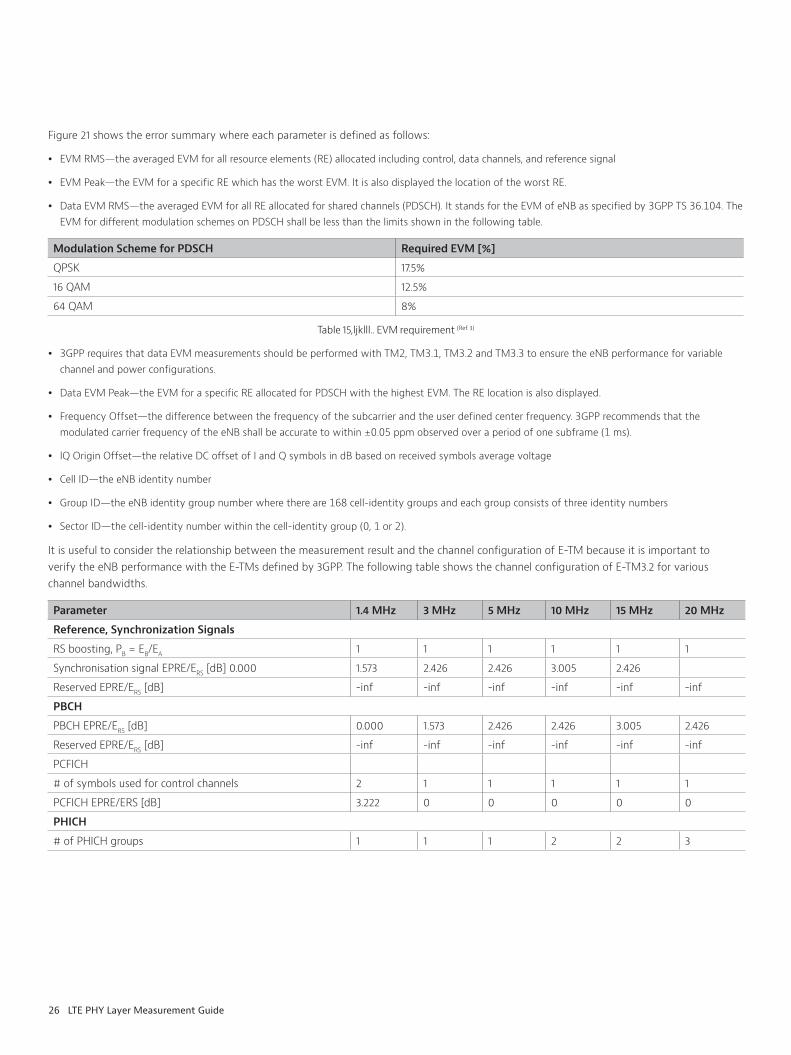
Figure 21 shows the error summary where each parameter is defined as follows:
y EVM RMS—the averaged EVM for all resource elements (RE) allocated including control, data channels, and reference signal
y EVM Peak—the EVM for a specific RE which has the worst EVM It is also displayed the location of the worst RE
y Data EVM RMS—the averaged EVM for all RE allocated for shared channels (PDSCH) It stands for the EVM of eNB as specified by 3GPP TS 36 104 The EVM for different modulation schemes on PDSCH shall be less than the limits shown in the following table
Modulation Scheme for PDSCH Required EVM [%]
QPSK 17 5%
16 QAM 12 5%
64 QAM 8%
Table 15,ljklll EVM requirement (Ref 3)
y 3GPP requires that data EVM measurements should be performed with TM2, TM3 1, TM3 2 and TM3 3 to ensure the eNB performance for variable channel and power configurations
y Data EVM Peak—the EVM for a specific RE allocated for PDSCH with the highest EVM The RE location is also displayed
y Frequency Offset—the difference between the frequency of the subcarrier and the user defined center frequency 3GPP recommends that the modulated carrier frequency of the eNB shall be accurate to within ±0 05 ppm observed over a period of one subframe (1 ms)
y IQ Origin Offset—the relative DC offset of I and Q symbols in dB based on received symbols average voltage
y Cell ID—the eNB identity number
y Group ID—the eNB identity group number where there are 168 cell-identity groups and each group consists of three identity numbers
y Sector ID—the cell-identity number within the cell-identity group (0, 1 or 2)
It is useful to consider the relationship between the measurement result and the channel configuration of E-TM because it is important to verify the eNB performance with the E-TMs defined by 3GPP The following table shows the channel configuration of E-TM3 2 for various channel bandwidths
Parameter 1 4 MHz 3 MHz 5 MHz 10 MHz 15 MHz 20 MHz
Reference, Synchronization Signals
RS boosting, PB = EB/EA 1 1 1 1 1 1
Synchronisation signal EPRE/ERS [dB] 0 000 1 573 2 426 2 426 3 005 2 426
Reserved EPRE/ERS [dB] -inf -inf -inf -inf -inf -inf
PBCH
PBCH EPRE/ERS [dB] 0 000 1 573 2 426 2 426 3 005 2 426
Reserved EPRE/ERS [dB] -inf -inf -inf -inf -inf -inf
PCFICH
# of symbols used for control channels 2 1 1 1 1 1
PCFICH EPRE/ERS [dB] 3 222 0 0 0 0 0
PHICH
# of PHICH groups 1 1 1 2 2 3
27 LTE PHY Layer Measurement Guide
Parameter 1 4 MHz 3 MHz 5 MHz 10 MHz 15 MHz 20 MHz
# of PHICH per group 2 2 2 2 2 2
PHICH BPSK symbol power/ERS [dB] --3 010
--3 010
--3 010
--3 010
--3 010
--3 010
PHICH group EPRE/ERS [dB] 0 0 0 0 0 0
PDCCH
# of available REGs 23 23 43 90 140 187
# of PDCCH 2 2 2 5 7 10
# of CCEs per PDCCH 1 1 2 2 2 2
# of REGs per CCE 9 9 9 9 9 9
# of REGs allocated to PDCCH 18 18 36 90 126 180
# of <NIL> REGs added for padding 5 5 7 0 14 7
PDCCH REG EPRE/ERS [dB] 0 792 2 290 1 880 1 065 1 488 1 195
<NIL> REG EPRE/ERS [dB] -inf -inf -inf -inf -inf -inf
PDSCH
# of 16QAM PDSCH PRBs within a slot for which EVM is measured
4 7 15 30 50 60
PRB PA = EA/ERS [dB] -3 (*) -3 -3 -3 -3 -3
# of QPSK PDSCH PRBs within a slot where EVM is not measured (used for power balancing only)
2 8 10 20 25 40
PRB PA = EA/ERS [dB] 3 005 (*) 1 573 2 426 2 426 3 005 2 426 EA: EPRE (energy per resource element) of PDSCH REs (resource elements) type A, for example, REs in OFDM symbols that do not include reference symbolsEB: EPRE of PDSCH REs type B, i e REs in OFDM symbols that include reference symbolsERS: EPRE of reference symbols REs
Table 16 Channel configuration of E-TM3 2
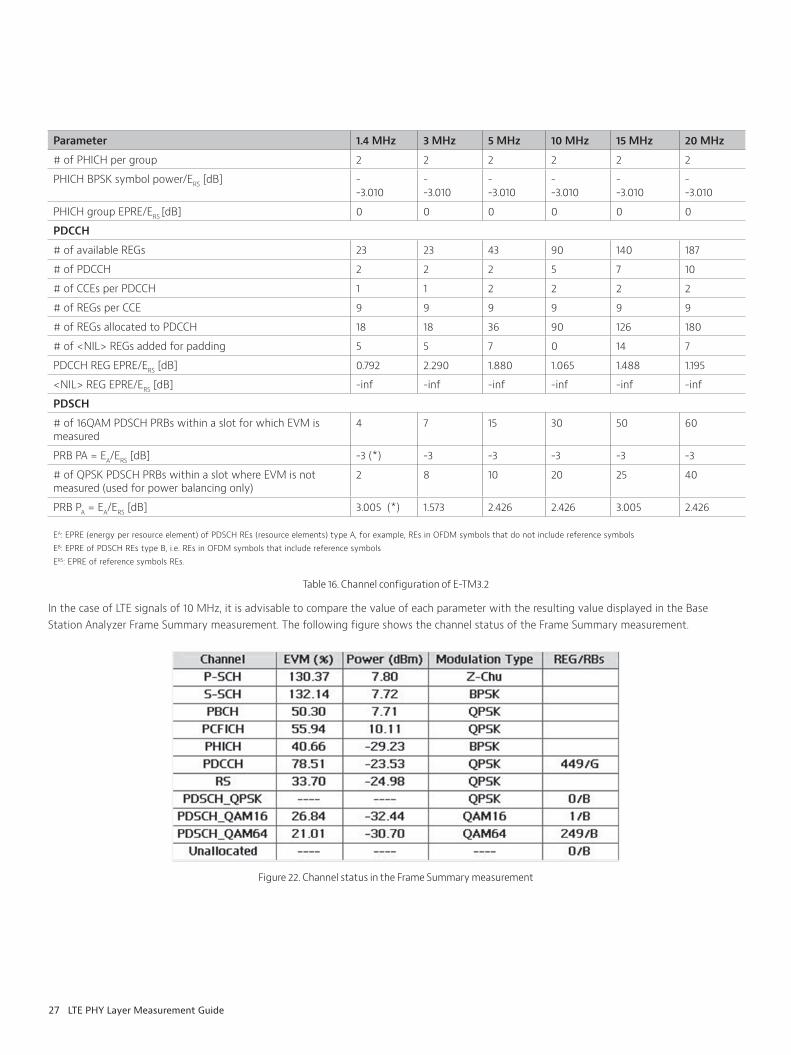
In the case of LTE signals of 10 MHz, it is advisable to compare the value of each parameter with the resulting value displayed in the Base Station Analyzer Frame Summary measurement The following figure shows the channel status of the Frame Summary measurement
Figure 22 Channel status in the Frame Summary measurement
28 LTE PHY Layer Measurement Guide
The channel status parameters in the Frame Summary Measurement are defined as follows:
y EVM —the error vector magnitude of all channels and reference signals averaged over a period of one frame
y Pwr[dB]—the relative power of each channel on the reference of energy per resource element EPRE of PDSCH From the values shown in table 13:
− RS boosting is defined as PB = EB/EA= 1, thus the RS power should be 0 dB
− Sync Signal is defined as synchronization signal EPRE/ERS [dB] = 2 426, thus the P-SS and S-SS power should be 2 426 dB
− PBCH EPRE ERS [dB] = 2 426, thus the PBCH power should be 2 426 dB
− PCFICH EPRE ERS [dB] = 0, thus the PCFICH power should be 0 dB
− PHICH group EPRE ERS [dB] = 0, thus the PHICH power should be 0 dB
− PDCCH REG EPRE ERS [dB] = 1 065, thus the PDCCH power should be 1 065 dB
− For 16 QAM-modulated PDSCH, PRB PA = EA/ERS [dB] = -3, thus the PDSCH power should be 3 dB lower than RS
− For QPSK-modulated PDSCH, PRB PA = EA/ERS [dB] = 2 426, thus the PDSCH power should be 2 426 dB higher than RS
− Mode Type—the modulation scheme of each channel
− REG/RBs—the number of resource element groups in resource blocks allocated for the specific channel or signal
In the Summary function, the following JD7105A parameters are set as default values on the Base Station Analyzer
y RBW—100 kHz
y Attenuation—Auto
The following Base Station Analyzer settings may affect the measurement accuracy, thus some consideration is recommended:
y Freq Offset—may affect the overall measurement accuracy
y Cyclic Prefix—setting may affect the subframe and slot power accuracy
y RF In Loss—may affect the overall power measurement accuracy
y # of CFI—may affect the Channel Summary measurement result
29 LTE PHY Layer Measurement Guide
Subframe Summary
The Subframe Summary function analyzes the LTE frame in detail Since the resource scheduling is made by subframe, the Subframe Summary measurement shows which subframes are not working properly In addition, the Subframe Summary provides modulation errors, power and resource allocation status of all channels contained in a specific subframe
The 3GPP recommends that the frequency error measurement should be done in each subframe Note: Some control channels were not transmitted in the selected subframe thus the measurement result may remain blank
Figure 23 Subframe Summary measurement for E-TM3 2
The above figure shows the measurement result of the first subframe and, similar to Frame Summary, Subframe Summary consists of three sections: error summary, channel status, and power metrics
The Subframe Summary measurement parameters are defined as follows:
y EVM RMS—the averaged EVM for all resource elements (RE) allocated including control, data channels, and reference signal
y EVM Peak—the EVM for a specific RE which has the worst EVM It is also displayed the location of the worst RE
y Data EVM RMS—the averaged EVM for all RE in the subframe allocated for PDSCH
y Data EVM Peak—the EVM for a specific RE in the subframe allocated for PDSCH with the highest EVM The RE location is also displayed
y Frequency Offset—the difference between the frequency of the subcarrier and the user-defined center frequency 3GPP recommends the frequency error should be maintained within the following limits while the Base Station Analyzer and the eNB under test are synchronized with the same reference frequency:
frequency error ≤ within ± (0.05 ppm+12Hz)
y IQ Origin Offset—the relative offset of I and Q symbol in dB based on received symbols average voltage
y Cell ID—the eNB identity number
y Group ID—the eNB identity group number where there are 168 cell-identity groups and each group consists of three identity numbers
y Sector ID—the cell-identity number within the Cell-Identity group (0, 1 or 2)

30 LTE PHY Layer Measurement Guide
The following figure shows the channels and signals summary for the given subframe:
Figure 24 Physical channel summary on Subframe Summary (E-TM3 2)
In the Subframe Summary function, the following parameters are set as default values on the Base Station Analyzer
y RBW—100 kHz
y Attenuation—Auto
The following settings may affect the measurement accuracy, thus some consideration is recommended
y Freq Offset—may affect the overall measurement accuracy
y Cyclic Prefix—setting may affect the subframe and slot power accuracy
y RF In Loss—may affect the overall power measurement accuracy
y # of CFI—may affect the Channel Summary measurement result
Data Channel Summary
The Data Channel Summary function shows the power of each resource block (RB) and modulation quality of each RB with its corresponding constellation diagram Since the control channel (PDCCH) is transmitted at the beginning of every subframe and the number of RE sets for control channel is defined by the control format indicator (PCFICH), the Base Station Analyzer excludes the RE sets which are allocated for PDCCH transmission on the reference of # of CFI setting
The following figure shows the Base Station Analyzer Data Channel Summary measurement screen It consists of two sections: the upper section is the resource block power diagram and the lower section is the constellation diagram
Figure 25 Data Channel Summary (E-TM3 2)
31 LTE PHY Layer Measurement Guide
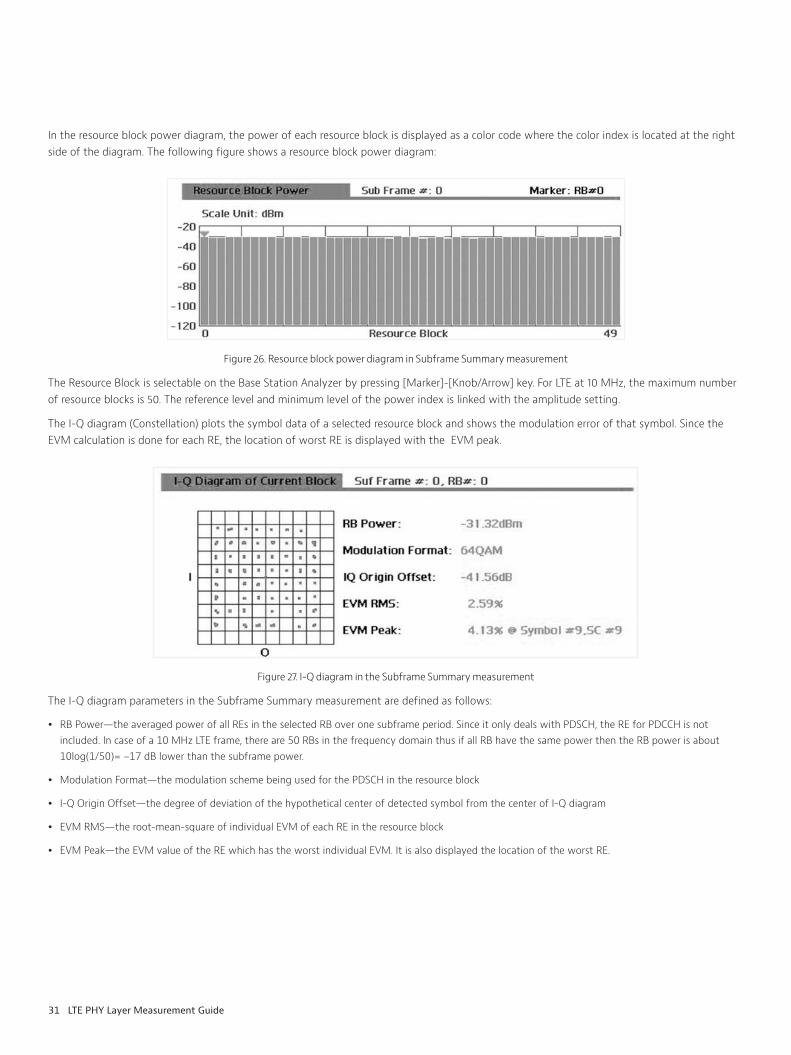
In the resource block power diagram, the power of each resource block is displayed as a color code where the color index is located at the right side of the diagram The following figure shows a resource block power diagram:
Figure 26 Resource block power diagram in Subframe Summary measurement
The Resource Block is selectable on the Base Station Analyzer by pressing [Marker]-[Knob/Arrow] key For LTE at 10 MHz, the maximum number of resource blocks is 50 The reference level and minimum level of the power index is linked with the amplitude setting
The I-Q diagram (Constellation) plots the symbol data of a selected resource block and shows the modulation error of that symbol Since the EVM calculation is done for each RE, the location of worst RE is displayed with the EVM peak
Figure 27 I-Q diagram in the Subframe Summary measurement
The I-Q diagram parameters in the Subframe Summary measurement are defined as follows:
y RB Power—the averaged power of all REs in the selected RB over one subframe period Since it only deals with PDSCH, the RE for PDCCH is not included In case of a 10 MHz LTE frame, there are 50 RBs in the frequency domain thus if all RB have the same power then the RB power is about 10log(1/50)= -17 dB lower than the subframe power
y Modulation Format—the modulation scheme being used for the PDSCH in the resource block
y I-Q Origin Offset—the degree of deviation of the hypothetical center of detected symbol from the center of I-Q diagram
y EVM RMS—the root-mean-square of individual EVM of each RE in the resource block
y EVM Peak—the EVM value of the RE which has the worst individual EVM It is also displayed the location of the worst RE
32 LTE PHY Layer Measurement Guide
In the Data Channel Summary function, the following parameters are set as default values on the Base Station Analyzer
y RBW—100 kHz
y Attenuation—Auto
The following JD7105A settings may affect the measurement accuracy, thus some consideration is recommended
y Freq Offset—may affect the overall measurement accuracy
y Cyclic Prefix—setting may affect the subframe and slot power accuracy
y RF In Loss—may affect the overall power measurement accuracy
Control Channel Summary
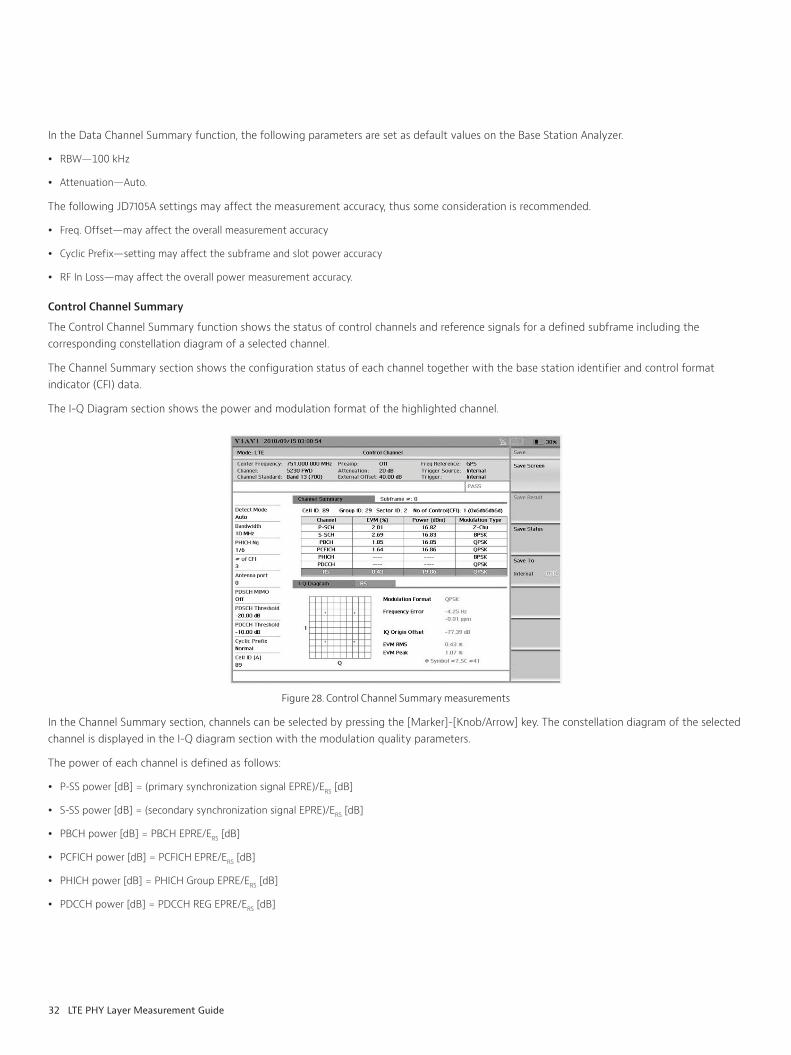
The Control Channel Summary function shows the status of control channels and reference signals for a defined subframe including the corresponding constellation diagram of a selected channel
The Channel Summary section shows the configuration status of each channel together with the base station identifier and control format indicator (CFI) data
The I-Q Diagram section shows the power and modulation format of the highlighted channel
Figure 28 Control Channel Summary measurements
In the Channel Summary section, channels can be selected by pressing the [Marker]-[Knob/Arrow] key The constellation diagram of the selected channel is displayed in the I-Q diagram section with the modulation quality parameters
The power of each channel is defined as follows:
y P-SS power [dB] = (primary synchronization signal EPRE)/ERS [dB]
y S-SS power [dB] = (secondary synchronization signal EPRE)/ERS [dB]
y PBCH power [dB] = PBCH EPRE/ERS [dB]
y PCFICH power [dB] = PCFICH EPRE/ERS [dB]
y PHICH power [dB] = PHICH Group EPRE/ERS [dB]
y PDCCH power [dB] = PDCCH REG EPRE/ERS [dB]
33 LTE PHY Layer Measurement Guide
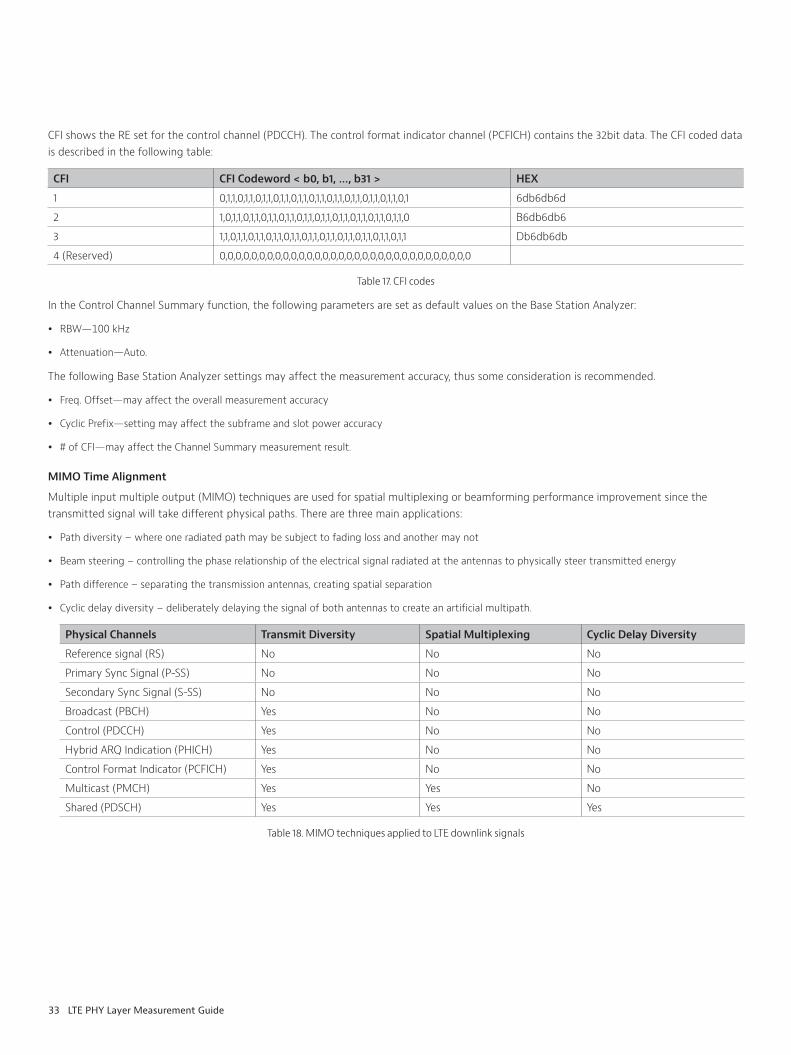
CFI shows the RE set for the control channel (PDCCH) The control format indicator channel (PCFICH) contains the 32bit data The CFI coded data is described in the following table:
CFI CFI Codeword < b0, b1, …, b31 > HEX
1 0,1,1,0,1,1,0,1,1,0,1,1,0,1,1,0,1,1,0,1,1,0,1,1,0,1,1,0,1,1,0,1 6db6db6d
2 1,0,1,1,0,1,1,0,1,1,0,1,1,0,1,1,0,1,1,0,1,1,0,1,1,0,1,1,0,1,1,0 B6db6db6
3 1,1,0,1,1,0,1,1,0,1,1,0,1,1,0,1,1,0,1,1,0,1,1,0,1,1,0,1,1,0,1,1 Db6db6db
4 (Reserved) 0,0,0,0,0,0,0,0,0,0,0,0,0,0,0,0,0,0,0,0,0,0,0,0,0,0,0,0,0,0,0,0
Table 17 CFI codes
In the Control Channel Summary function, the following parameters are set as default values on the Base Station Analyzer:
y RBW—100 kHz
y Attenuation—Auto
The following Base Station Analyzer settings may affect the measurement accuracy, thus some consideration is recommended
y Freq Offset—may affect the overall measurement accuracy
y Cyclic Prefix—setting may affect the subframe and slot power accuracy
y # of CFI—may affect the Channel Summary measurement result
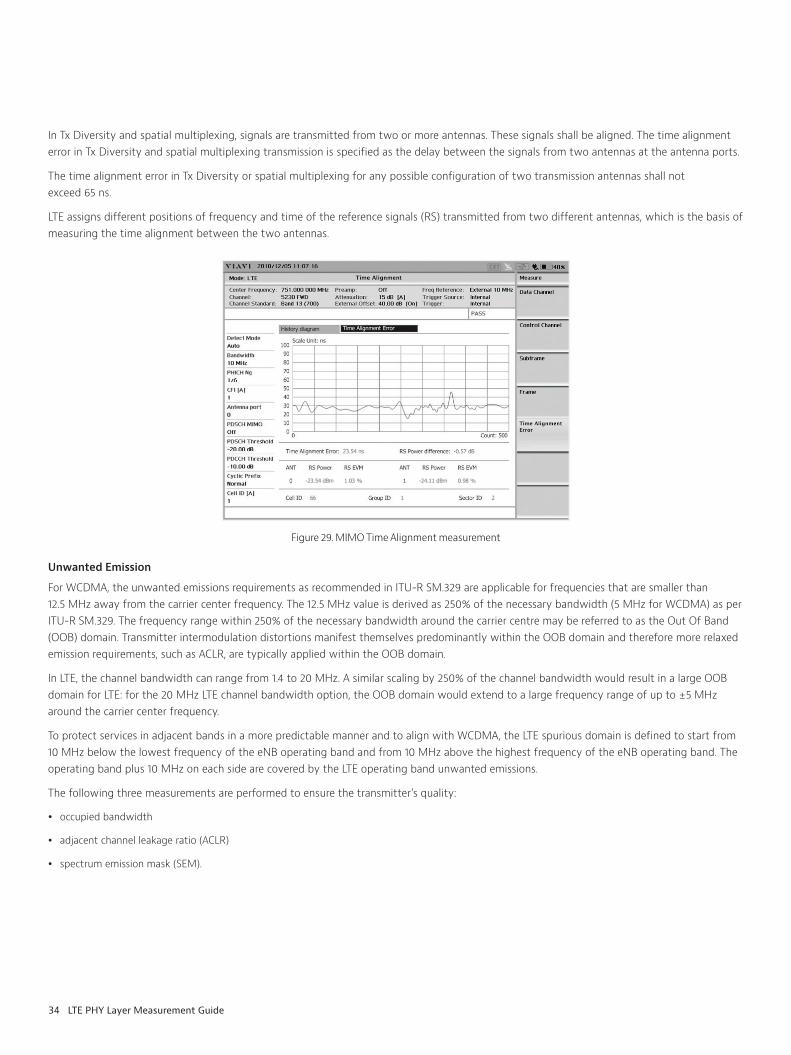
MIMO Time Alignment
Multiple input multiple output (MIMO) techniques are used for spatial multiplexing or beamforming performance improvement since the transmitted signal will take different physical paths There are three main applications:
y Path diversity – where one radiated path may be subject to fading loss and another may not
y Beam steering – controlling the phase relationship of the electrical signal radiated at the antennas to physically steer transmitted energy
y Path difference – separating the transmission antennas, creating spatial separation
y Cyclic delay diversity – deliberately delaying the signal of both antennas to create an artificial multipath
Physical Channels Transmit Diversity Spatial Multiplexing Cyclic Delay Diversity
Reference signal (RS) No No No
Primary Sync Signal (P-SS) No No No
Secondary Sync Signal (S-SS) No No No
Broadcast (PBCH) Yes No No
Control (PDCCH) Yes No No
Hybrid ARQ Indication (PHICH) Yes No No
Control Format Indicator (PCFICH) Yes No No
Multicast (PMCH) Yes Yes No
Shared (PDSCH) Yes Yes Yes
Table 18 MIMO techniques applied to LTE downlink signals
34 LTE PHY Layer Measurement Guide
In Tx Diversity and spatial multiplexing, signals are transmitted from two or more antennas These signals shall be aligned The time alignment error in Tx Diversity and spatial multiplexing transmission is specified as the delay between the signals from two antennas at the antenna ports
The time alignment error in Tx Diversity or spatial multiplexing for any possible configuration of two transmission antennas shall not exceed 65 ns
LTE assigns different positions of frequency and time of the reference signals (RS) transmitted from two different antennas, which is the basis of measuring the time alignment between the two antennas
Figure 29 MIMO Time Alignment measurement
Unwanted Emission
For WCDMA, the unwanted emissions requirements as recommended in ITU-R SM 329 are applicable for frequencies that are smaller than 12 5 MHz away from the carrier center frequency The 12 5 MHz value is derived as 250% of the necessary bandwidth (5 MHz for WCDMA) as per ITU-R SM 329 The frequency range within 250% of the necessary bandwidth around the carrier centre may be referred to as the Out Of Band (OOB) domain Transmitter intermodulation distortions manifest themselves predominantly within the OOB domain and therefore more relaxed emission requirements, such as ACLR, are typically applied within the OOB domain
In LTE, the channel bandwidth can range from 1 4 to 20 MHz A similar scaling by 250% of the channel bandwidth would result in a large OOB domain for LTE: for the 20 MHz LTE channel bandwidth option, the OOB domain would extend to a large frequency range of up to ±5 MHz around the carrier center frequency
To protect services in adjacent bands in a more predictable manner and to align with WCDMA, the LTE spurious domain is defined to start from 10 MHz below the lowest frequency of the eNB operating band and from 10 MHz above the highest frequency of the eNB operating band The operating band plus 10 MHz on each side are covered by the LTE operating band unwanted emissions
The following three measurements are performed to ensure the transmitter’s quality:
y occupied bandwidth
y adjacent channel leakage ratio (ACLR)
y spectrum emission mask (SEM)
35 LTE PHY Layer Measurement Guide
It is known that the following factors affect the unwanted emission characteristic of transmitters
y intermodulation distortion (IMD)—LTE downlink signals are composed by a few tenths to thousands of subcarriers allocated with 15 kHz frequency spacing Each subcarrier is mutually orthogonal for FFT processing, but due to inherent non-linearity, generation of intermodulation distortions is unavoidable In addition to this, the high peak to average power ratio (PAR) characteristic of OFDM signals makes the effect more severe Among the IMD signals, the 3rd IMD components are located near the transmission band affecting the adjacent channel IMD shows the tendency to increase as the system ages and as the carrier is increased within the transmission band
y harmonics—most transmitters have band pass filters at the end of the transmitter chain to suppress harmonics but due to filter limitations on the cut-off, some leakage signal is created If the harmonics are in the receiver’s band, it will cause severe QoS degradation
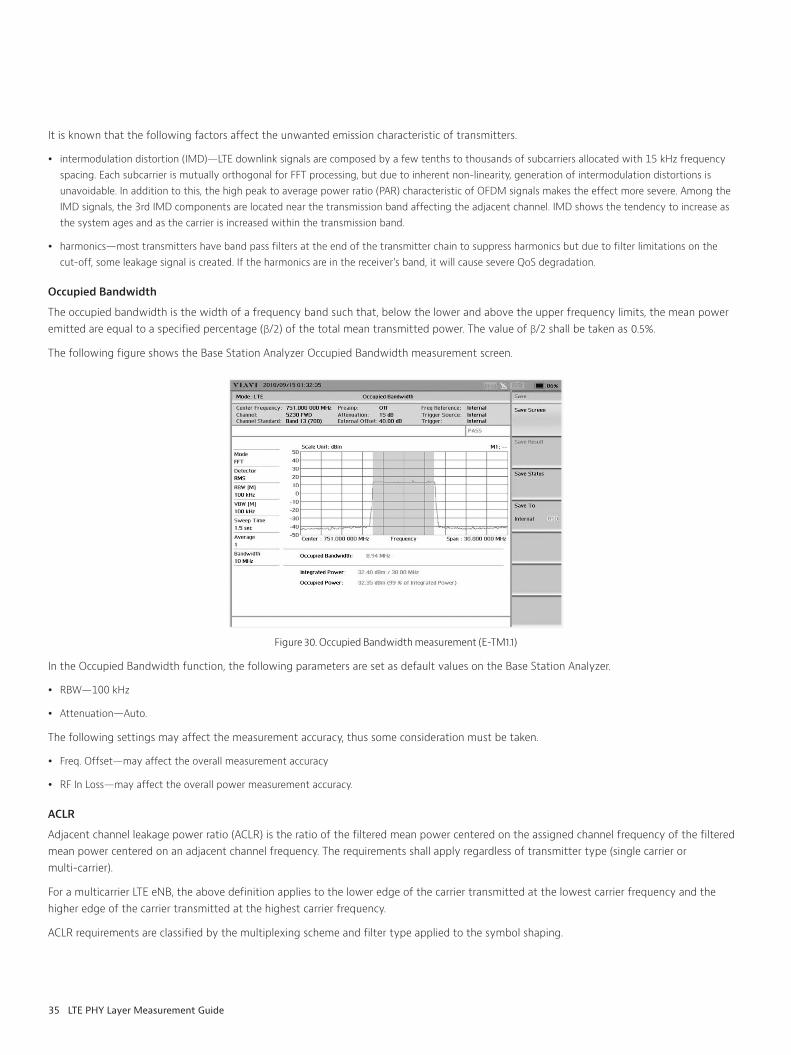
Occupied Bandwidth
The occupied bandwidth is the width of a frequency band such that, below the lower and above the upper frequency limits, the mean power emitted are equal to a specified percentage (β/2) of the total mean transmitted power The value of β/2 shall be taken as 0 5%
The following figure shows the Base Station Analyzer Occupied Bandwidth measurement screen
Figure 30 Occupied Bandwidth measurement (E-TM1 1)
In the Occupied Bandwidth function, the following parameters are set as default values on the Base Station Analyzer
y RBW—100 kHz
y Attenuation—Auto
The following settings may affect the measurement accuracy, thus some consideration must be taken
y Freq Offset—may affect the overall measurement accuracy
y RF In Loss—may affect the overall power measurement accuracy
ACLR
Adjacent channel leakage power ratio (ACLR) is the ratio of the filtered mean power centered on the assigned channel frequency of the filtered mean power centered on an adjacent channel frequency The requirements shall apply regardless of transmitter type (single carrier or multi-carrier)
For a multicarrier LTE eNB, the above definition applies to the lower edge of the carrier transmitted at the lowest carrier frequency and the higher edge of the carrier transmitted at the highest carrier frequency
ACLR requirements are classified by the multiplexing scheme and filter type applied to the symbol shaping
36 LTE PHY Layer Measurement Guide
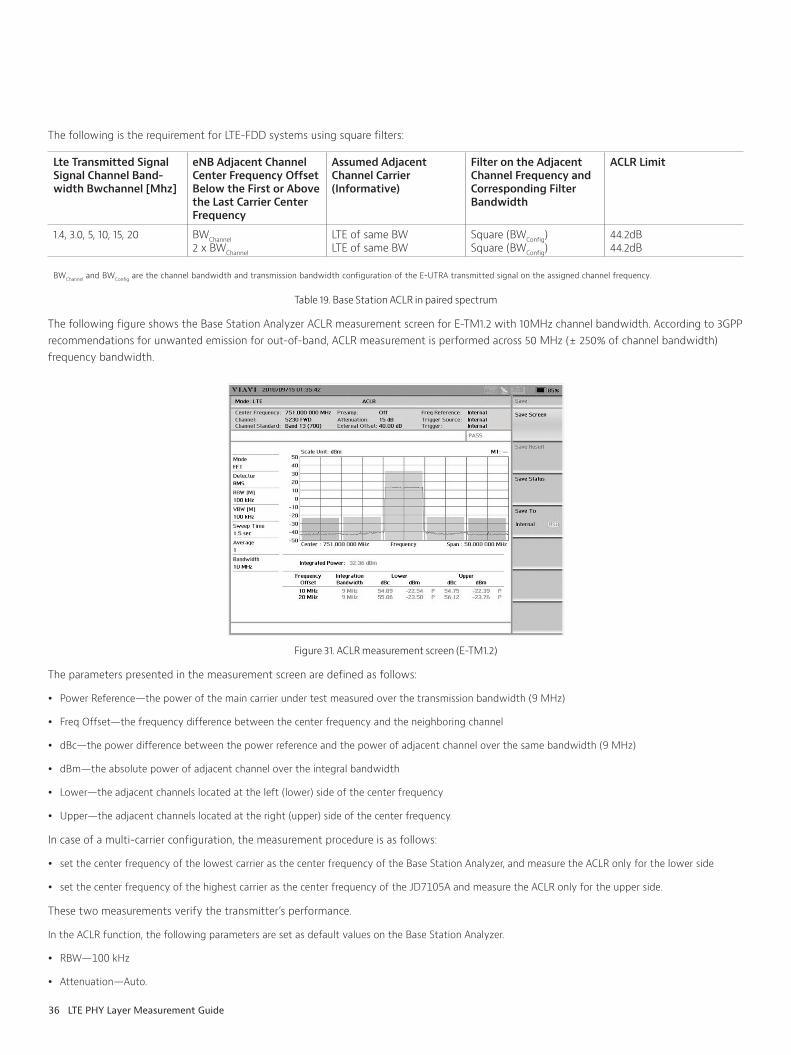
The following is the requirement for LTE-FDD systems using square filters:
Lte Transmitted Signal Signal Channel Band-width Bwchannel [Mhz]
eNB Adjacent Channel Center Frequency Offset Below the First or Above the Last Carrier Center Frequency
Assumed Adjacent Channel Carrier (Informative)
Filter on the Adjacent Channel Frequency and Corresponding Filter Bandwidth
ACLR Limit
1 4, 3 0, 5, 10, 15, 20 BWChannel2 x BWChannel
LTE of same BWLTE of same BW
Square (BWConfig)Square (BWConfig)
44 2dB44 2dB
BWChannel and BWConfig are the channel bandwidth and transmission bandwidth configuration of the E-UTRA transmitted signal on the assigned channel frequency
Table 19 Base Station ACLR in paired spectrum
The following figure shows the Base Station Analyzer ACLR measurement screen for E-TM1 2 with 10MHz channel bandwidth According to 3GPP recommendations for unwanted emission for out-of-band, ACLR measurement is performed across 50 MHz (± 250% of channel bandwidth) frequency bandwidth
Figure 31 ACLR measurement screen (E-TM1 2)
The parameters presented in the measurement screen are defined as follows:
y Power Reference—the power of the main carrier under test measured over the transmission bandwidth (9 MHz)
y Freq Offset—the frequency difference between the center frequency and the neighboring channel
y dBc—the power difference between the power reference and the power of adjacent channel over the same bandwidth (9 MHz)
y dBm—the absolute power of adjacent channel over the integral bandwidth
y Lower—the adjacent channels located at the left (lower) side of the center frequency
y Upper—the adjacent channels located at the right (upper) side of the center frequency
In case of a multi-carrier configuration, the measurement procedure is as follows:
y set the center frequency of the lowest carrier as the center frequency of the Base Station Analyzer, and measure the ACLR only for the lower side
y set the center frequency of the highest carrier as the center frequency of the JD7105A and measure the ACLR only for the upper side
These two measurements verify the transmitter’s performance
In the ACLR function, the following parameters are set as default values on the Base Station Analyzer
y RBW—100 kHz
y Attenuation—Auto
37 LTE PHY Layer Measurement Guide
The following settings may affect the measurement accuracy, thus some consideration must be taken
y Freq Offset—may affect the overall measurement accuracy
y RF In Loss—may affect the overall power measurement accuracy
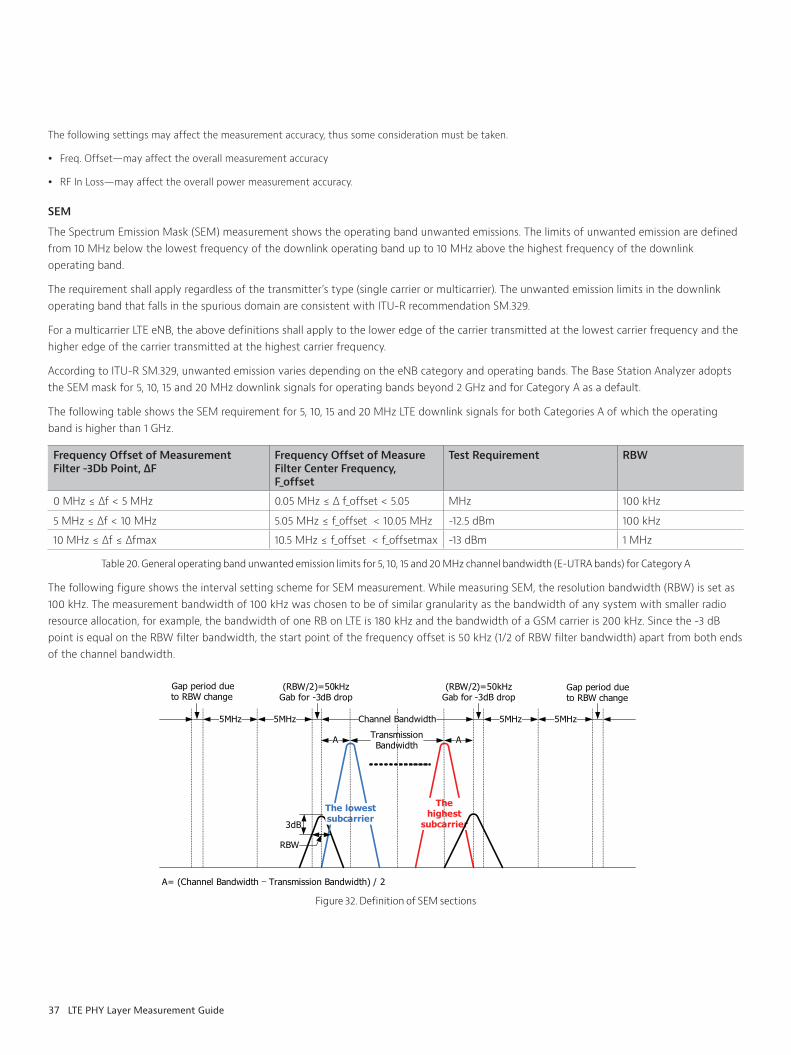
SEM
The Spectrum Emission Mask (SEM) measurement shows the operating band unwanted emissions The limits of unwanted emission are defined from 10 MHz below the lowest frequency of the downlink operating band up to 10 MHz above the highest frequency of the downlink operating band
The requirement shall apply regardless of the transmitter’s type (single carrier or multicarrier) The unwanted emission limits in the downlink operating band that falls in the spurious domain are consistent with ITU-R recommendation SM 329
For a multicarrier LTE eNB, the above definitions shall apply to the lower edge of the carrier transmitted at the lowest carrier frequency and the higher edge of the carrier transmitted at the highest carrier frequency
According to ITU-R SM 329, unwanted emission varies depending on the eNB category and operating bands The Base Station Analyzer adopts the SEM mask for 5, 10, 15 and 20 MHz downlink signals for operating bands beyond 2 GHz and for Category A as a default
The following table shows the SEM requirement for 5, 10, 15 and 20 MHz LTE downlink signals for both Categories A of which the operating band is higher than 1 GHz
Frequency Offset of Measurement Filter -3Db Point, ∆F
Frequency Offset of Measure Filter Center Frequency, F_offset
Test Requirement RBW
0 MHz ≤ ∆f < 5 MHz 0 05 MHz ≤ ∆ f_offset < 5 05 MHz 100 kHz
5 MHz ≤ ∆f < 10 MHz 5 05 MHz ≤ f_offset < 10 05 MHz -12 5 dBm 100 kHz
10 MHz ≤ ∆f ≤ ∆fmax 10 5 MHz ≤ f_offset < f_offsetmax -13 dBm 1 MHz
Table 20 General operating band unwanted emission limits for 5, 10, 15 and 20 MHz channel bandwidth (E-UTRA bands) for Category A
The following figure shows the interval setting scheme for SEM measurement While measuring SEM, the resolution bandwidth (RBW) is set as 100 kHz The measurement bandwidth of 100 kHz was chosen to be of similar granularity as the bandwidth of any system with smaller radio resource allocation, for example, the bandwidth of one RB on LTE is 180 kHz and the bandwidth of a GSM carrier is 200 kHz Since the -3 dB point is equal on the RBW filter bandwidth, the start point of the frequency offset is 50 kHz (1/2 of RBW filter bandwidth) apart from both ends of the channel bandwidth
The highest
subcarrier
The lowest subcarrier
3dB
Transmission Bandwidth
5MHz 5MHz5MHz 5MHz
(RBW/2)=50kHzGab for -3dB drop
Gap period due to RBW change
Gap period due to RBW change
(RBW/2)=50kHzGab for -3dB drop
Channel Bandwidth
A A
A= (Channel Bandwidth Transmission Bandwidth) / 2
RBW
Figure 32 Definition of SEM sections
38 LTE PHY Layer Measurement Guide
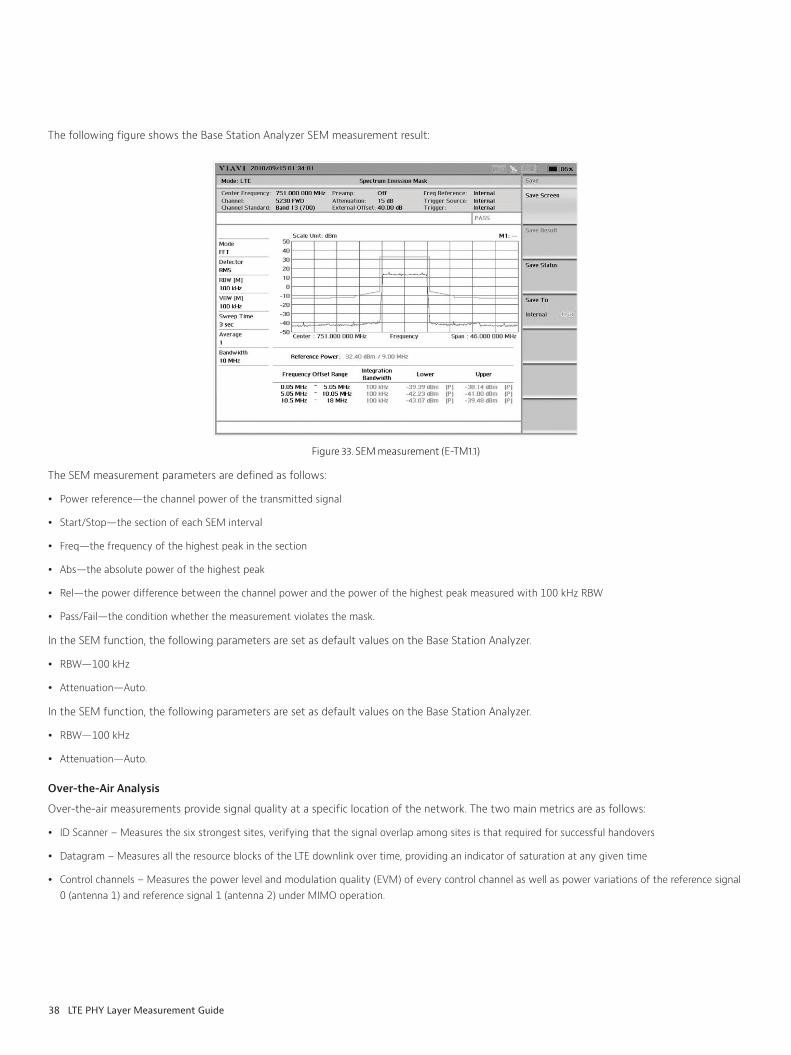
The following figure shows the Base Station Analyzer SEM measurement result:
Figure 33 SEM measurement (E-TM1 1)
The SEM measurement parameters are defined as follows:
y Power reference—the channel power of the transmitted signal
y Start/Stop—the section of each SEM interval
y Freq—the frequency of the highest peak in the section
y Abs—the absolute power of the highest peak
y Rel—the power difference between the channel power and the power of the highest peak measured with 100 kHz RBW
y Pass/Fail—the condition whether the measurement violates the mask
In the SEM function, the following parameters are set as default values on the Base Station Analyzer
y RBW—100 kHz
y Attenuation—Auto
In the SEM function, the following parameters are set as default values on the Base Station Analyzer
y RBW—100 kHz
y Attenuation—Auto
Over-the-Air Analysis
Over-the-air measurements provide signal quality at a specific location of the network The two main metrics are as follows:
y ID Scanner – Measures the six strongest sites, verifying that the signal overlap among sites is that required for successful handovers
y Datagram – Measures all the resource blocks of the LTE downlink over time, providing an indicator of saturation at any given time
y Control channels – Measures the power level and modulation quality (EVM) of every control channel as well as power variations of the reference signal 0 (antenna 1) and reference signal 1 (antenna 2) under MIMO operation

39 LTE PHY Layer Measurement Guide
ID Scanner
The ID Scanner measures the six most powerful LTE signals at the measurement location providing a good indication of the signal overlap required for successful handovers
For each LTE signal, it indicates the contents of the Physical Cell Identification in the form of Cell ID, Group ID and Sector ID In addition, it performs a dominance measurement based on the power level of the primary and secondary synchronization channels (P-SCH and S-SCH) as well as the relationship they have with the entire LTE channel power
Figure 34 Over-the-Air ID Scanner
Datagram
The LTE datagram provides a power level activity of all the resource blocks contained in the LTE downlink signal through time, providing an indication of LTE’s downlink data utilization at the measurement’s location
Figure 35 Over-the-Air Datagram Measurement
© 2015 Viavi Solutions Inc. Product specifications and descriptions in this document are subject to change without notice. ltephymeasure.an.cpo.tm.ae 30163000 901 0911
Contact Us +1 844 GO VIAVI (+1 844 468 4284)
To reach the Viavi office nearest you, visit viavisolutions.com/contacts.
viavisolutions.com
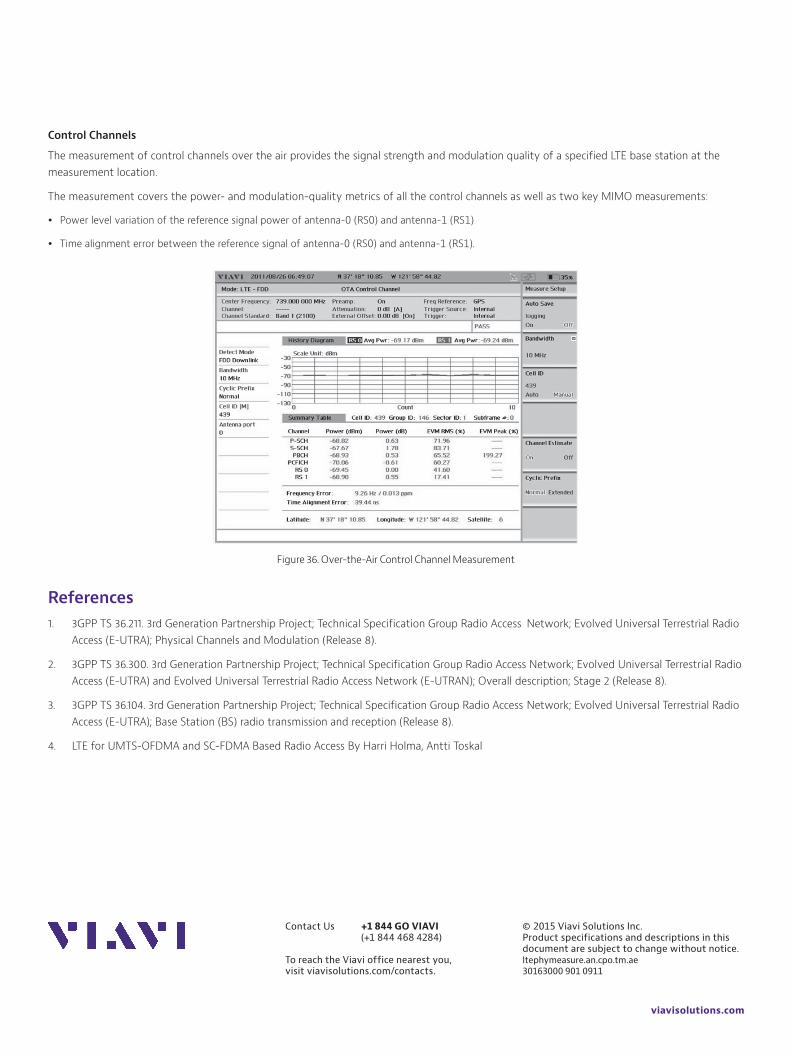
Control Channels
The measurement of control channels over the air provides the signal strength and modulation quality of a specified LTE base station at the measurement location
The measurement covers the power- and modulation-quality metrics of all the control channels as well as two key MIMO measurements:
y Power level variation of the reference signal power of antenna-0 (RS0) and antenna-1 (RS1)
y Time alignment error between the reference signal of antenna-0 (RS0) and antenna-1 (RS1)
Figure 36 Over-the-Air Control Channel Measurement
References1 3GPP TS 36 211 3rd Generation Partnership Project; Technical Specification Group Radio Access Network; Evolved Universal Terrestrial Radio
Access (E-UTRA); Physical Channels and Modulation (Release 8)
2 3GPP TS 36 300 3rd Generation Partnership Project; Technical Specification Group Radio Access Network; Evolved Universal Terrestrial Radio Access (E-UTRA) and Evolved Universal Terrestrial Radio Access Network (E-UTRAN); Overall description; Stage 2 (Release 8)
3 3GPP TS 36 104 3rd Generation Partnership Project; Technical Specification Group Radio Access Network; Evolved Universal Terrestrial Radio Access (E-UTRA); Base Station (BS) radio transmission and reception (Release 8)
4 LTE for UMTS-OFDMA and SC-FDMA Based Radio Access By Harri Holma, Antti Toskal


![LTE PHY Layer Measurement Guide...4 LTE PHY Layer Measurement Guide LTE Downlink The LTE downlink can be set on six different frequency profiles, as follows: Channel Bandwidth [MHz]](https://img.dokumen.tips/doc/110x75/5e9903898496907a812cd628/lte-phy-layer-measurement-guide-4-lte-phy-layer-measurement-guide-lte-downlink.jpg)