Embed Size (px)
Citation preview
Keysight TechnologiesLTE-Advanced (89601B/BN-BHH) & LTE (89601B/BN-BHE) TDD Modulation Analysis
LTE-Advanced (89601B/BN-BHG) & LTE (89601B/BN-BHD) FDD Modulation Analysis
89600 VSA Software
Application Brief
2
The 89600 VSA software has the capability to analyze LTE and LTE-Advanced signals in both FDD and TDD formats. Depending upon your requirements, each of the four available options provide comprehen-sive LTE/LTE-Advanced modulation analysis with powerful troubleshoot-ing tools to characterize signals and identify errors and their causes.
Analyze both downlink (DL) and uplink (UL) signals, for all bandwidths, modulation formats and sequences. Perform up to 8x8 DL MIMO analysis, for LTE and LTE-Advanced FDD and TDD, and up to 8x2 beamforming for LTE FDD and TDD with sup-ported platforms. Keep current with advanced capabilities such as carrier aggregation and higher-order MIMO.
View virtually every facet of a signal with color-coded results by user and channel, for quick and easy visual identification. Perform measurements on the entire signal or on individual channels. Get greater clarity with an unlimited number of traces and markers, and trace-to-trace marker coupling.
New cumulative history and digital persistence displays find and isolate rare events, to make subtle problems easy to spot.
The 89600 VSA software supports more than 75 signal standards and modulation types, providing a com-prehensive set of tools for demodula-tion and vector signal analysis. These tools enable you to explore virtually every facet of a signal and optimize your most advanced designs. As you assess the tradeoffs, the 89600 VSA helps you see through the complexity.
LTEThird-generation (3G) wireless systems, based on W-CDMA, are deployed all over the world. W-CDMA maintains a mid-term competitive edge by providing high speed packet access (HSPA) in both downlink and uplink modes. To ensure the competitiveness of 3G systems into the future, a long term evolution (LTE) of the 3rd Generation Partnership Project (3GPP) access technology was specified in Release 8 of the 3GPP standard. The LTE specification provides a framework
for increasing capacity, improving spectrum efficiency, improving coverage, and reducing latency compared with current HSPA imple-mentations. In addition, transmission with multiple input and multiple output (MIMO) antennas is sup-ported for greater throughput, as well as enhanced capacity or range. To support transmission in both the paired and unpaired spectrum, the LTE air interface supports both frequency division duplex (FDD) and time division duplex (TDD) modes.
LTE-Advanced takes throughput to the next level with the capability of having up to five component car-riers in inter-band and intra-band configuration and higher order MIMO of up to 8x8. Option BHG (LTE-Advanced FDD) and Option BHH (LTE-Advanced TDD) provide UL/DL carrier aggregation in both contiguous and non-contiguous bandwidths and 8x8 downlink MIMO for both FDD and TDD.
Try before you buy!Download the 89600 VSA software and use it free for 30 days to make measurements with your analysis hardware, or use our recorded demo signals which are available by selecting File > Recall > Recall Demo> LTE > or File > Recall > Recall Demo > LTE-A > on the software toolbar. Request your free trial license today:
www.keysight.com/find/89600_trial
LTE/LTE-Advanced Modulation Analysis
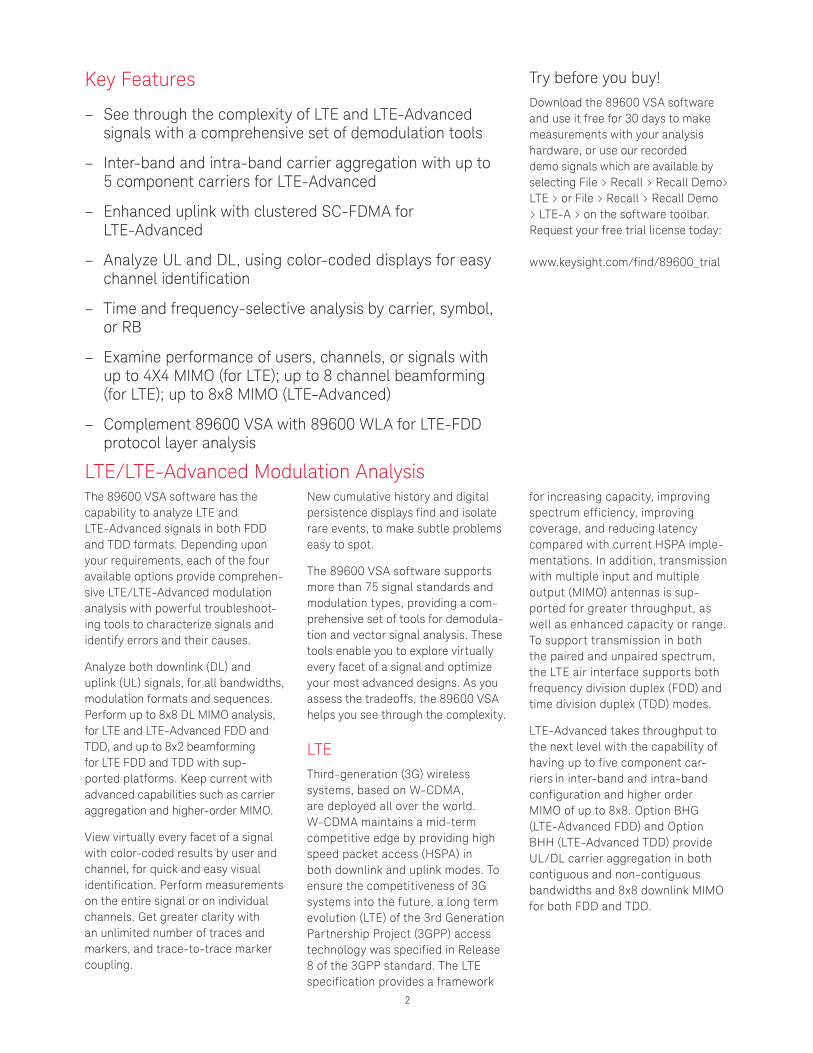
Key Features
– See through the complexity of LTE and LTE-Advanced signals with a comprehensive set of demodulation tools
– Inter-band and intra-band carrier aggregation with up to 5 component carriers for LTE-Advanced
– Enhanced uplink with clustered SC-FDMA for LTE-Advanced
– Analyze UL and DL, using color-coded displays for easy channel identification
– Time and frequency-selective analysis by carrier, symbol, or RB
– Examine performance of users, channels, or signals with up to 4X4 MIMO (for LTE); up to 8 channel beamforming (for LTE); up to 8x8 MIMO (LTE-Advanced)
– Complement 89600 VSA with 89600 WLA for LTE-FDD protocol layer analysis
3
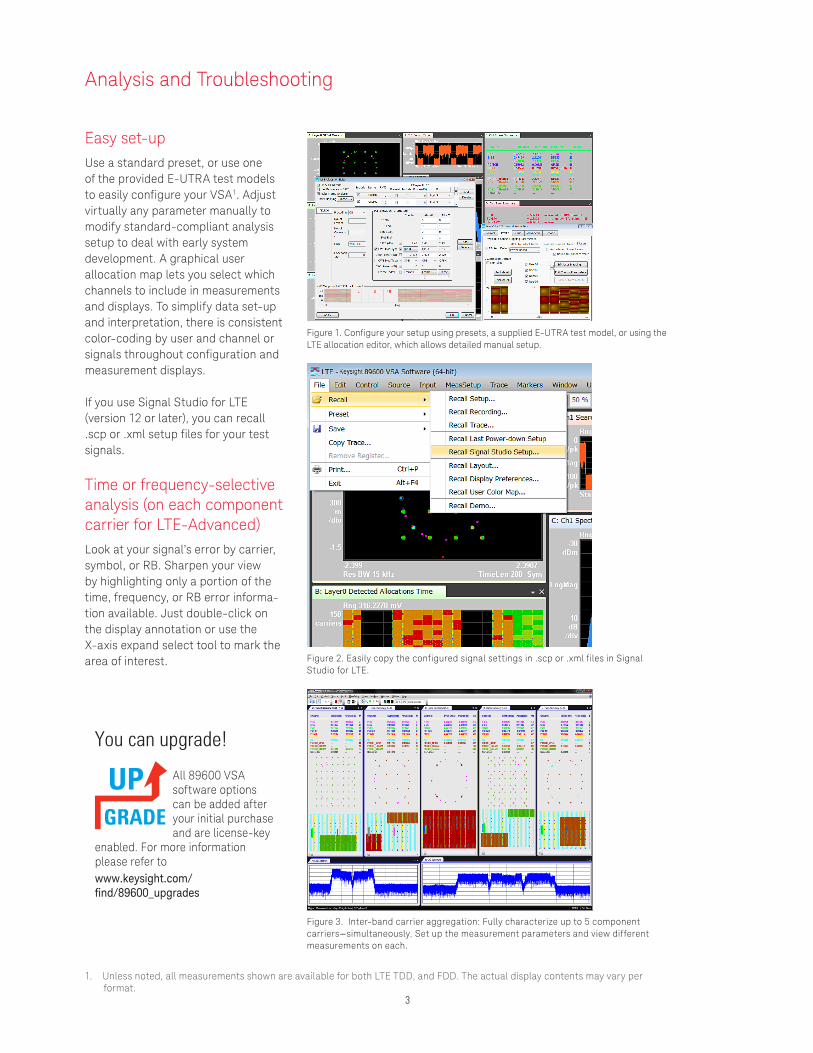
Figure 1. Configure your setup using presets, a supplied E-UTRA test model, or using the LTE allocation editor, which allows detailed manual setup.
Figure 3. Inter-band carrier aggregation: Fully characterize up to 5 component carriers—simultaneously. Set up the measurement parameters and view different measurements on each.
Figure 2. Easily copy the configured signal settings in .scp or .xml files in Signal Studio for LTE.
Analysis and Troubleshooting
Easy set-up Use a standard preset, or use one of the provided E-UTRA test models to easily configure your VSA1. Adjust virtually any parameter manually to modify standard-compliant analysis setup to deal with early system development. A graphical user allocation map lets you select which channels to include in measurements and displays. To simplify data set-up and interpretation, there is consistent color-coding by user and channel or signals throughout configuration and measurement displays.
If you use Signal Studio for LTE (version 12 or later), you can recall .scp or .xml setup files for your test signals.
Time or frequency-selective analysis (on each component carrier for LTE-Advanced)Look at your signal’s error by carrier, symbol, or RB. Sharpen your view by highlighting only a portion of the time, frequency, or RB error informa-tion available. Just double-click on the display annotation or use the X-axis expand select tool to mark the area of interest.
1. Unless noted, all measurements shown are available for both LTE TDD, and FDD. The actual display contents may vary per format.
You can upgrade!All 89600 VSA software options can be added after your initial purchase and are license-key
enabled. For more information please refer towww.keysight.com/find/89600_upgrades
4
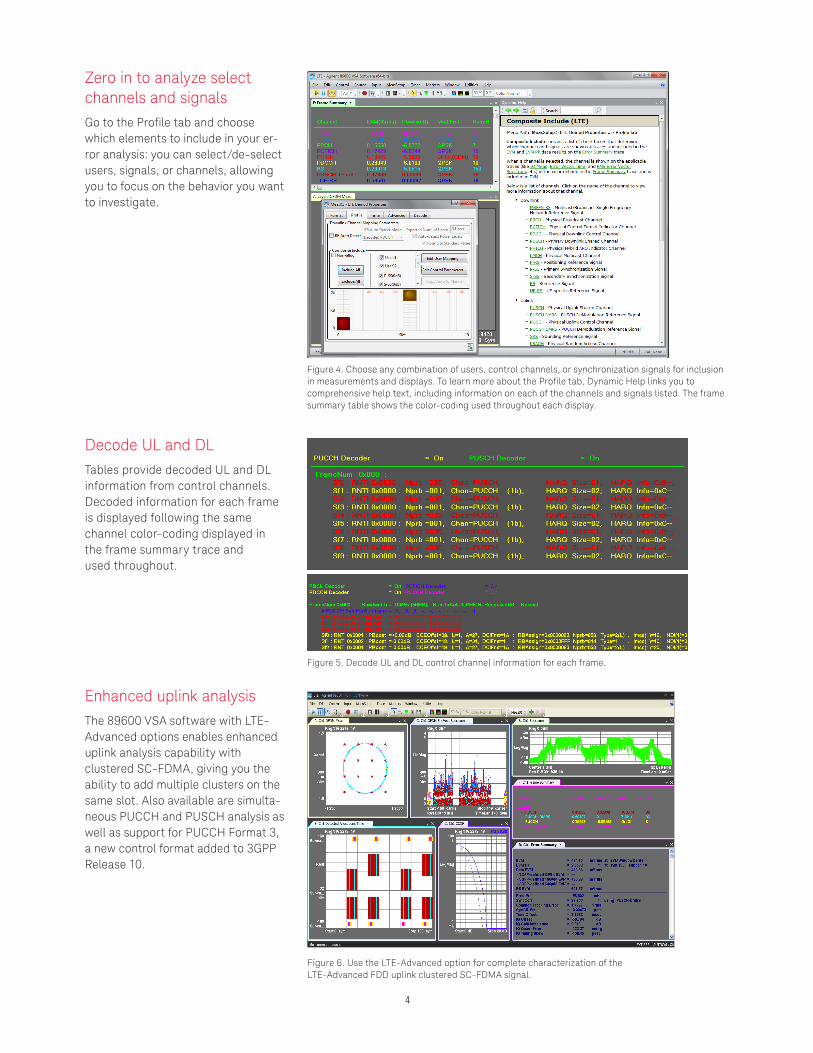
Figure 4. Choose any combination of users, control channels, or synchronization signals for inclusion in measurements and displays. To learn more about the Profile tab, Dynamic Help links you to comprehensive help text, including information on each of the channels and signals listed. The frame summary table shows the color-coding used throughout each display.
Figure 5. Decode UL and DL control channel information for each frame.
Figure 6. Use the LTE-Advanced option for complete characterization of the LTE-Advanced FDD uplink clustered SC-FDMA signal.
Zero in to analyze select channels and signals Go to the Profile tab and choose which elements to include in your er-ror analysis: you can select/de-select users, signals, or channels, allowing you to focus on the behavior you want to investigate.
Decode UL and DL Tables provide decoded UL and DL information from control channels. Decoded information for each frame is displayed following the same channel color-coding displayed in the frame summary trace and used throughout.
Enhanced uplink analysis The 89600 VSA software with LTE-Advanced options enables enhanced uplink analysis capability with clustered SC-FDMA, giving you the ability to add multiple clusters on the same slot. Also available are simulta-neous PUCCH and PUSCH analysis as well as support for PUCCH Format 3, a new control format added to 3GPP Release 10.

5
Figure 7. 8-channel TD-LTE beamforming with antenna patterns and EVM measurements per layer. The same measurement is available for LTE-FDD.
Figure 8. 8x8 MIMO with EVM measurement for each of the eight layers.
Explore antenna beam performance (FDD and TDD)Beamforming analysis enabling verification and visualization of LTE base station RF antenna beamform-ing including Transmission Mode 7 (8x1 single layer using Port 5) and Transmission Mode 8 (8x2 dual layer using Ports 7 and 8).
Use the antenna beam pattern display to show the expected antenna radiation pattern, derived from actual measurement of the transmitter signals. Multiple patterns, one for each user, can be plotted to show the relative position of beams.
8x8 MIMO analysis (FDD and TDD)Use the LTE-Advanced option for analysis and troubleshooting of a base station transmitting a Trans-mission Mode 9 (8x8, eight layer using antenna ports 7 through 14) signal. Various traces are available to look at per layer modulation quality and channel frequency response, as well as amplitude, phase, and time offset between each of the eight layers. Analysis of channel state information reference signal (CSI-RS) is also available.
Choosing between 89600 VSA software and X-Series measurement applications
89600 VSA software is the industry-leading measurement software for evaluating and troubleshooting wireless signals in R&D. PC-based, supporting numerous measurement platforms, the 89600 VSA software provides the flexibility and sophisticated measurement tools essential to finding and fixing signal problems.
X-Series measurement applications provide embedded format-specific, one-button measurements for X-Series analyzers. With fast measurement speed, pass/fail testing and simplicity of operation, these applications are ideally suited for design verification and manufacturing.
www.keysight.com/find/X-Series_apps
6
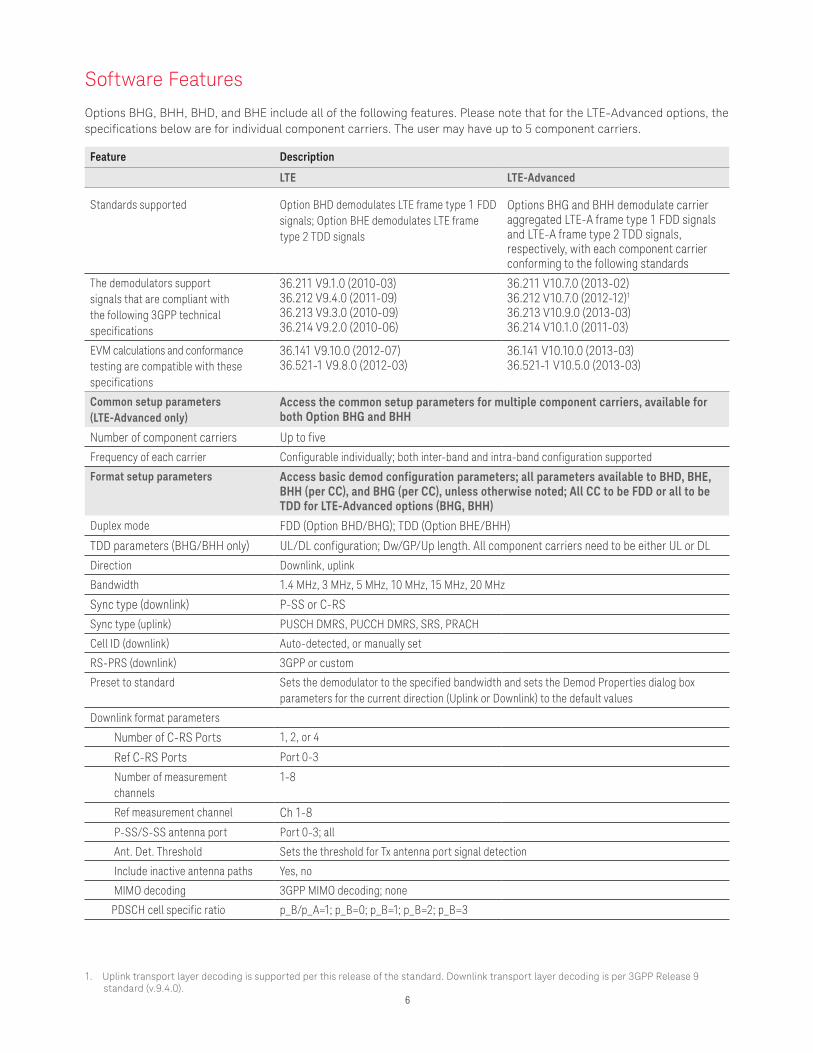
Feature Description
LTE LTE-Advanced
Standards supported Option BHD demodulates LTE frame type 1 FDD signals; Option BHE demodulates LTE frame type 2 TDD signals
Options BHG and BHH demodulate carrier aggregated LTE-A frame type 1 FDD signals and LTE-A frame type 2 TDD signals, respectively, with each component carrier conforming to the following standards
The demodulators support signals that are compliant with the following 3GPP technical specifications
36.211 V9.1.0 (2010-03)36.212 V9.4.0 (2011-09)36.213 V9.3.0 (2010-09)36.214 V9.2.0 (2010-06)
36.211 V10.7.0 (2013-02)36.212 V10.7.0 (2012-12)1
36.213 V10.9.0 (2013-03)36.214 V10.1.0 (2011-03)
EVM calculations and conformance testing are compatible with these specifications
36.141 V9.10.0 (2012-07)36.521-1 V9.8.0 (2012-03)
36.141 V10.10.0 (2013-03)36.521-1 V10.5.0 (2013-03)
Common setup parameters(LTE-Advanced only)
Access the common setup parameters for multiple component carriers, available for both Option BHG and BHH
Number of component carriers Up to five
Frequency of each carrier Configurable individually; both inter-band and intra-band configuration supported
Format setup parameters Access basic demod configuration parameters; all parameters available to BHD, BHE, BHH (per CC), and BHG (per CC), unless otherwise noted; All CC to be FDD or all to be TDD for LTE-Advanced options (BHG, BHH)
Duplex mode FDD (Option BHD/BHG); TDD (Option BHE/BHH)
TDD parameters (BHG/BHH only) UL/DL configuration; Dw/GP/Up length. All component carriers need to be either UL or DL
Direction Downlink, uplink
Bandwidth 1.4 MHz, 3 MHz, 5 MHz, 10 MHz, 15 MHz, 20 MHz
Sync type (downlink) P-SS or C-RS
Sync type (uplink) PUSCH DMRS, PUCCH DMRS, SRS, PRACH
Cell ID (downlink) Auto-detected, or manually set
RS-PRS (downlink) 3GPP or custom
Preset to standard Sets the demodulator to the specified bandwidth and sets the Demod Properties dialog box parameters for the current direction (Uplink or Downlink) to the default values
Downlink format parameters
Number of C-RS Ports 1, 2, or 4
Ref C-RS Ports Port 0-3
Number of measurement channels
1-8
Ref measurement channel Ch 1-8
P-SS/S-SS antenna port Port 0-3; all
Ant. Det. Threshold Sets the threshold for Tx antenna port signal detection
Include inactive antenna paths Yes, no
MIMO decoding 3GPP MIMO decoding; none
PDSCH cell specific ratio p_B/p_A=1; p_B=0; p_B=1; p_B=2; p_B=3
Software Features
Options BHG, BHH, BHD, and BHE include all of the following features. Please note that for the LTE-Advanced options, the specifications below are for individual component carriers. The user may have up to 5 component carriers.
1. Uplink transport layer decoding is supported per this release of the standard. Downlink transport layer decoding is per 3GPP Release 9 standard (v.9.4.0).
7
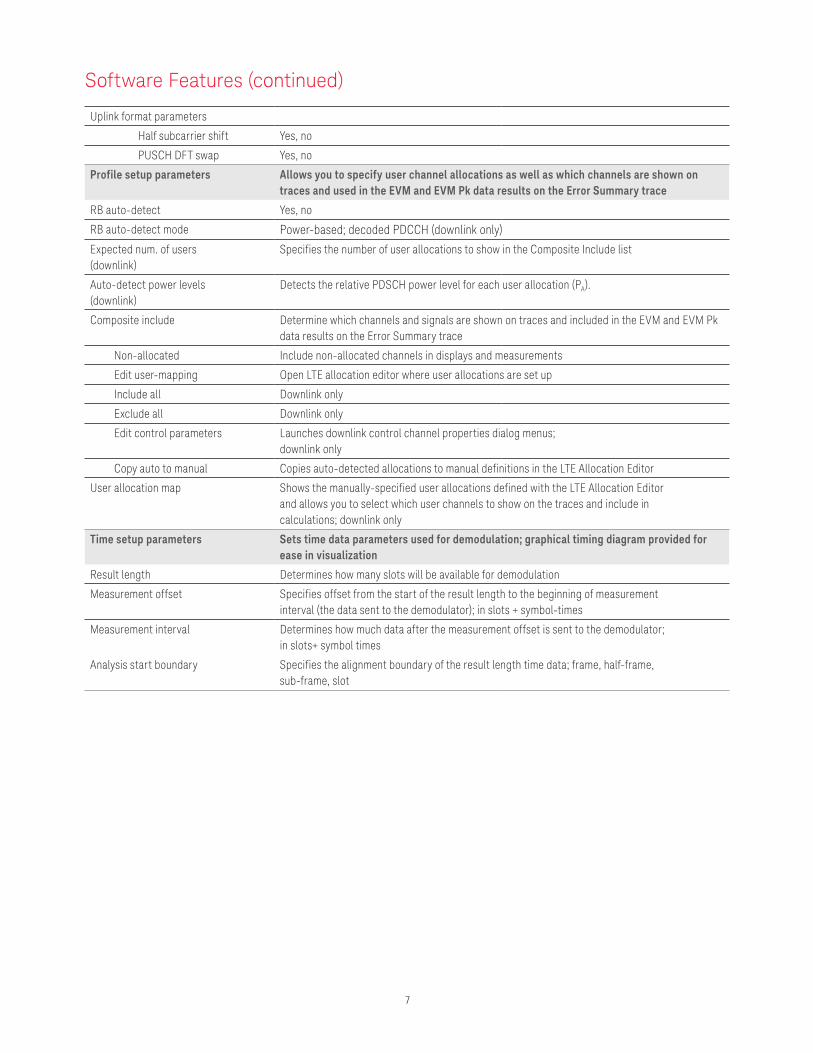
Uplink format parameters
Half subcarrier shift Yes, no
PUSCH DFT swap Yes, no
Profile setup parameters Allows you to specify user channel allocations as well as which channels are shown on traces and used in the EVM and EVM Pk data results on the Error Summary trace
RB auto-detect Yes, no
RB auto-detect mode Power-based; decoded PDCCH (downlink only)
Expected num. of users (downlink)
Specifies the number of user allocations to show in the Composite Include list
Auto-detect power levels (downlink)
Detects the relative PDSCH power level for each user allocation (PA).
Composite include Determine which channels and signals are shown on traces and included in the EVM and EVM Pk data results on the Error Summary trace
Non-allocated Include non-allocated channels in displays and measurements
Edit user-mapping Open LTE allocation editor where user allocations are set up
Include all Downlink only
Exclude all Downlink only
Edit control parameters Launches downlink control channel properties dialog menus; downlink only
Copy auto to manual Copies auto-detected allocations to manual definitions in the LTE Allocation Editor
User allocation map Shows the manually-specified user allocations defined with the LTE Allocation Editor and allows you to select which user channels to show on the traces and include in calculations; downlink only
Time setup parameters Sets time data parameters used for demodulation; graphical timing diagram provided for ease in visualization
Result length Determines how many slots will be available for demodulation
Measurement offset Specifies offset from the start of the result length to the beginning of measurement interval (the data sent to the demodulator); in slots + symbol-times
Measurement interval Determines how much data after the measurement offset is sent to the demodulator; in slots+ symbol times
Analysis start boundary Specifies the alignment boundary of the result length time data; frame, half-frame, sub-frame, slot
Software Features (continued)
8
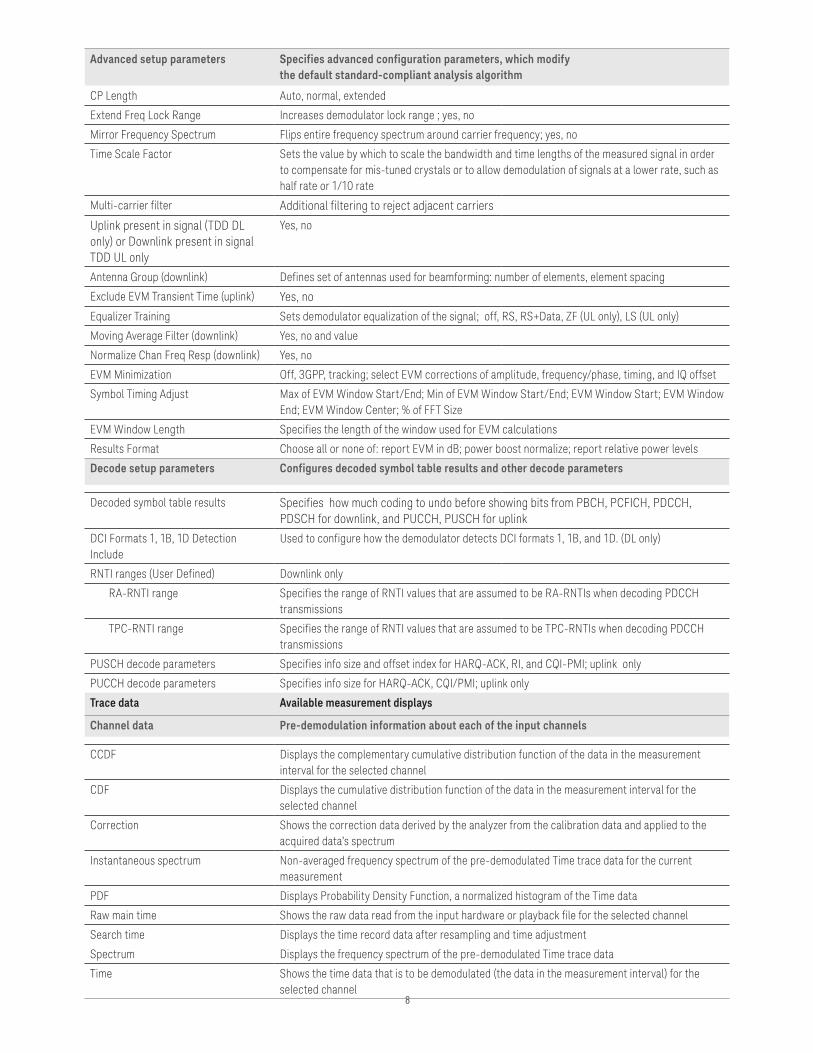
Advanced setup parameters Specifies advanced configuration parameters, which modify the default standard-compliant analysis algorithm
CP Length Auto, normal, extended
Extend Freq Lock Range Increases demodulator lock range ; yes, no
Mirror Frequency Spectrum Flips entire frequency spectrum around carrier frequency; yes, no
Time Scale Factor Sets the value by which to scale the bandwidth and time lengths of the measured signal in order to compensate for mis-tuned crystals or to allow demodulation of signals at a lower rate, such as half rate or 1/10 rate
Multi-carrier filter Additional filtering to reject adjacent carriers
Uplink present in signal (TDD DL only) or Downlink present in signal TDD UL only
Yes, no
Antenna Group (downlink) Defines set of antennas used for beamforming: number of elements, element spacing
Exclude EVM Transient Time (uplink) Yes, no
Equalizer Training Sets demodulator equalization of the signal; off, RS, RS+Data, ZF (UL only), LS (UL only)
Moving Average Filter (downlink) Yes, no and value
Normalize Chan Freq Resp (downlink) Yes, no
EVM Minimization Off, 3GPP, tracking; select EVM corrections of amplitude, frequency/phase, timing, and IQ offset
Symbol Timing Adjust Max of EVM Window Start/End; Min of EVM Window Start/End; EVM Window Start; EVM Window End; EVM Window Center; % of FFT Size
EVM Window Length Specifies the length of the window used for EVM calculations
Results Format Choose all or none of: report EVM in dB; power boost normalize; report relative power levels
Decode setup parameters Configures decoded symbol table results and other decode parameters
Decoded symbol table results Specifies how much coding to undo before showing bits from PBCH, PCFICH, PDCCH, PDSCH for downlink, and PUCCH, PUSCH for uplink
DCI Formats 1, 1B, 1D Detection Include
Used to configure how the demodulator detects DCI formats 1, 1B, and 1D. (DL only)
RNTI ranges (User Defined) Downlink only
RA-RNTI range Specifies the range of RNTI values that are assumed to be RA-RNTIs when decoding PDCCH transmissions
TPC-RNTI range Specifies the range of RNTI values that are assumed to be TPC-RNTIs when decoding PDCCH transmissions
PUSCH decode parameters Specifies info size and offset index for HARQ-ACK, RI, and CQI-PMI; uplink only
PUCCH decode parameters Specifies info size for HARQ-ACK, CQI/PMI; uplink only
Trace data Available measurement displays
Channel data Pre-demodulation information about each of the input channels
CCDF Displays the complementary cumulative distribution function of the data in the measurement interval for the selected channel
CDF Displays the cumulative distribution function of the data in the measurement interval for the selected channel
Correction Shows the correction data derived by the analyzer from the calibration data and applied to the acquired data’s spectrum
Instantaneous spectrum Non-averaged frequency spectrum of the pre-demodulated Time trace data for the current measurement
PDF Displays Probability Density Function, a normalized histogram of the Time data
Raw main time Shows the raw data read from the input hardware or playback file for the selected channel
Search time Displays the time record data after resampling and time adjustment
Spectrum Displays the frequency spectrum of the pre-demodulated Time trace data
Time Shows the time data that is to be demodulated (the data in the measurement interval) for the selected channel
9
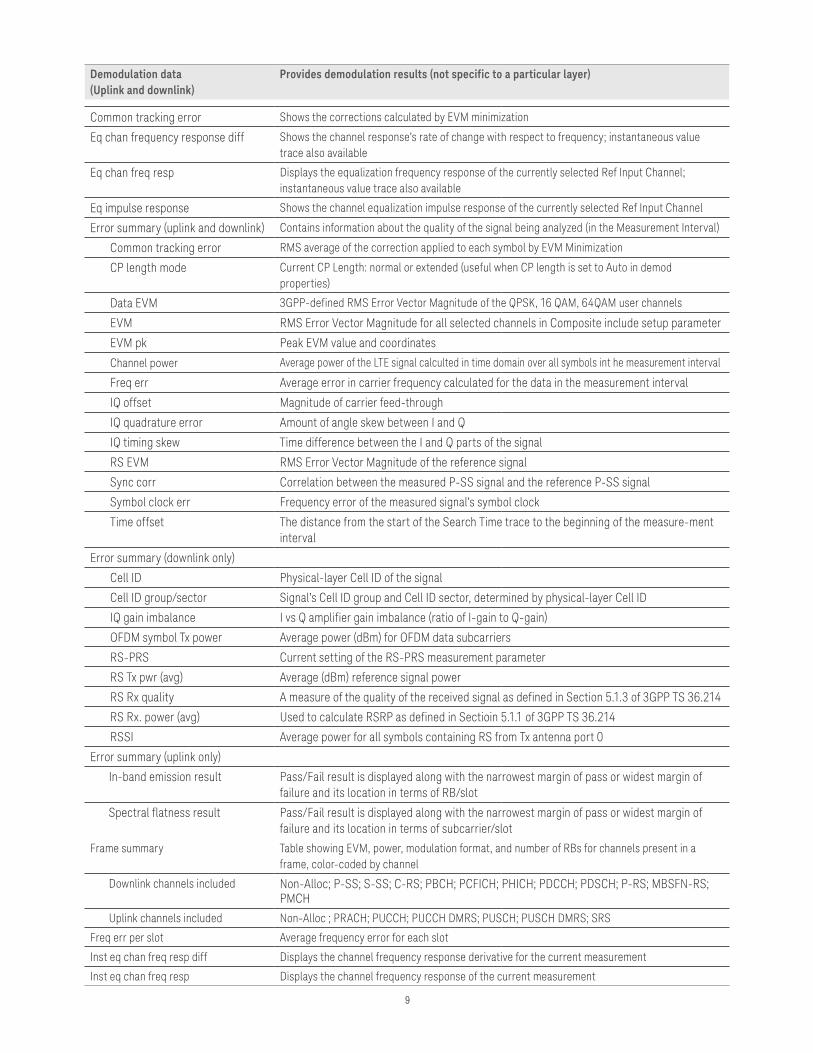
Demodulation data (Uplink and downlink)
Provides demodulation results (not specific to a particular layer)
Common tracking error Shows the corrections calculated by EVM minimization
Eq chan frequency response diff Shows the channel response’s rate of change with respect to frequency; instantaneous value trace also available
Eq chan freq resp Displays the equalization frequency response of the currently selected Ref Input Channel; instantaneous value trace also available
Eq impulse response Shows the channel equalization impulse response of the currently selected Ref Input Channel
Error summary (uplink and downlink) Contains information about the quality of the signal being analyzed (in the Measurement Interval)
Common tracking error RMS average of the correction applied to each symbol by EVM Minimization
CP length mode Current CP Length: normal or extended (useful when CP length is set to Auto in demod properties)
Data EVM 3GPP-defined RMS Error Vector Magnitude of the QPSK, 16 QAM, 64QAM user channels
EVM RMS Error Vector Magnitude for all selected channels in Composite include setup parameter
EVM pk Peak EVM value and coordinates
Channel power Average power of the LTE signal calculted in time domain over all symbols int he measurement interval
Freq err Average error in carrier frequency calculated for the data in the measurement interval
IQ offset Magnitude of carrier feed-through
IQ quadrature error Amount of angle skew between I and Q
IQ timing skew Time difference between the I and Q parts of the signal
RS EVM RMS Error Vector Magnitude of the reference signal
Sync corr Correlation between the measured P-SS signal and the reference P-SS signal
Symbol clock err Frequency error of the measured signal’s symbol clock
Time offset The distance from the start of the Search Time trace to the beginning of the measure-ment interval
Error summary (downlink only)
Cell ID Physical-layer Cell ID of the signal
Cell ID group/sector Signal’s Cell ID group and Cell ID sector, determined by physical-layer Cell ID
IQ gain imbalance I vs Q amplifier gain imbalance (ratio of I-gain to Q-gain)
OFDM symbol Tx power Average power (dBm) for OFDM data subcarriers
RS-PRS Current setting of the RS-PRS measurement parameter
RS Tx pwr (avg) Average (dBm) reference signal power
RS Rx quality A measure of the quality of the received signal as defined in Section 5.1.3 of 3GPP TS 36.214
RS Rx. power (avg) Used to calculate RSRP as defined in Sectioin 5.1.1 of 3GPP TS 36.214
RSSI Average power for all symbols containing RS from Tx antenna port 0
Error summary (uplink only)
In-band emission result Pass/Fail result is displayed along with the narrowest margin of pass or widest margin of failure and its location in terms of RB/slot
Spectral flatness result Pass/Fail result is displayed along with the narrowest margin of pass or widest margin of failure and its location in terms of subcarrier/slot
Frame summary Table showing EVM, power, modulation format, and number of RBs for channels present in a frame, color-coded by channel
Downlink channels included Non-Alloc; P-SS; S-SS; C-RS; PBCH; PCFICH; PHICH; PDCCH; PDSCH; P-RS; MBSFN-RS; PMCH
Uplink channels included Non-Alloc ; PRACH; PUCCH; PUCCH DMRS; PUSCH; PUSCH DMRS; SRS
Freq err per slot Average frequency error for each slot
Inst eq chan freq resp diff Displays the channel frequency response derivative for the current measurement
Inst eq chan freq resp Displays the channel frequency response of the current measurement
10
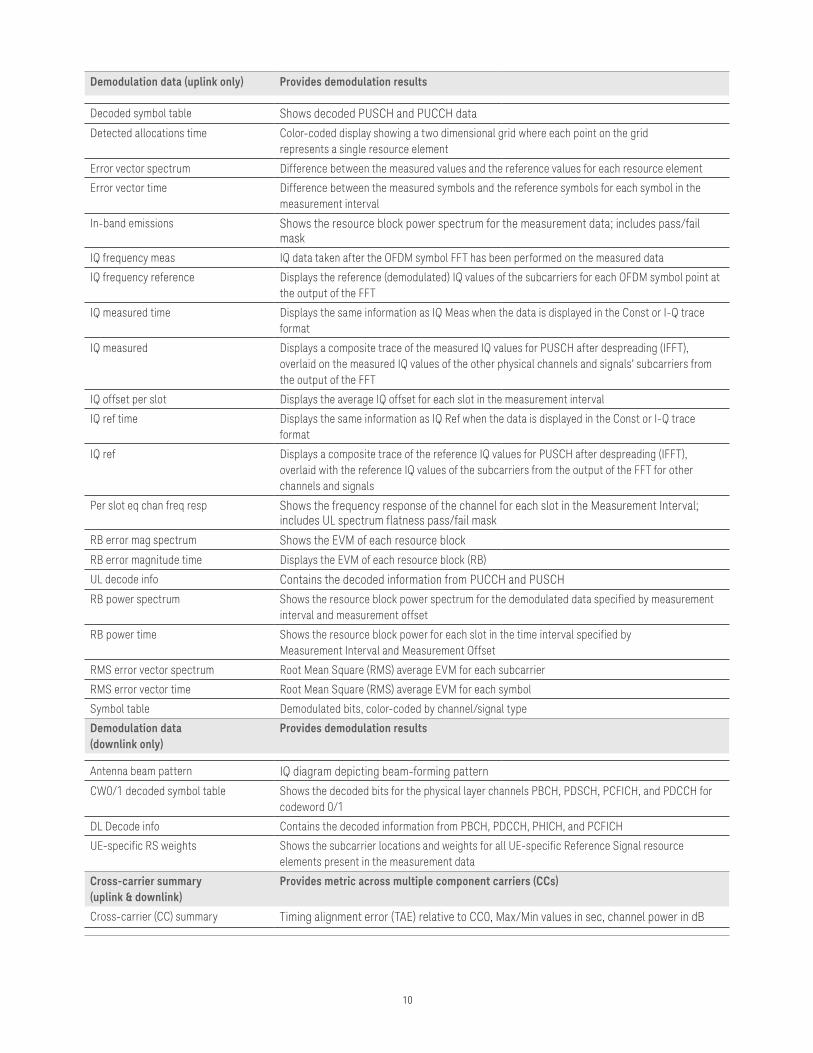
Demodulation data (uplink only) Provides demodulation results
Decoded symbol table Shows decoded PUSCH and PUCCH data
Detected allocations time Color-coded display showing a two dimensional grid where each point on the grid represents a single resource element
Error vector spectrum Difference between the measured values and the reference values for each resource element
Error vector time Difference between the measured symbols and the reference symbols for each symbol in the measurement interval
In-band emissions Shows the resource block power spectrum for the measurement data; includes pass/fail mask
IQ frequency meas IQ data taken after the OFDM symbol FFT has been performed on the measured data
IQ frequency reference Displays the reference (demodulated) IQ values of the subcarriers for each OFDM symbol point at the output of the FFT
IQ measured time Displays the same information as IQ Meas when the data is displayed in the Const or I-Q trace format
IQ measured Displays a composite trace of the measured IQ values for PUSCH after despreading (IFFT), overlaid on the measured IQ values of the other physical channels and signals’ subcarriers from the output of the FFT
IQ offset per slot Displays the average IQ offset for each slot in the measurement interval
IQ ref time Displays the same information as IQ Ref when the data is displayed in the Const or I-Q trace format
IQ ref Displays a composite trace of the reference IQ values for PUSCH after despreading (IFFT), overlaid with the reference IQ values of the subcarriers from the output of the FFT for other channels and signals
Per slot eq chan freq resp Shows the frequency response of the channel for each slot in the Measurement Interval; includes UL spectrum flatness pass/fail mask
RB error mag spectrum Shows the EVM of each resource block
RB error magnitude time Displays the EVM of each resource block (RB)
UL decode info Contains the decoded information from PUCCH and PUSCH
RB power spectrum Shows the resource block power spectrum for the demodulated data specified by measurement interval and measurement offset
RB power time Shows the resource block power for each slot in the time interval specified by Measurement Interval and Measurement Offset
RMS error vector spectrum Root Mean Square (RMS) average EVM for each subcarrier
RMS error vector time Root Mean Square (RMS) average EVM for each symbol
Symbol table Demodulated bits, color-coded by channel/signal type
Demodulation data (downlink only)
Provides demodulation results
Antenna beam pattern IQ diagram depicting beam-forming pattern
CW0/1 decoded symbol table Shows the decoded bits for the physical layer channels PBCH, PDSCH, PCFICH, and PDCCH for codeword 0/1
DL Decode info Contains the decoded information from PBCH, PDCCH, PHICH, and PCFICH
UE-specific RS weights Shows the subcarrier locations and weights for all UE-specific Reference Signal resource elements present in the measurement data
Cross-carrier summary(uplink & downlink)
Provides metric across multiple component carriers (CCs)
Cross-carrier (CC) summary Timing alignment error (TAE) relative to CC0, Max/Min values in sec, channel power in dB
11
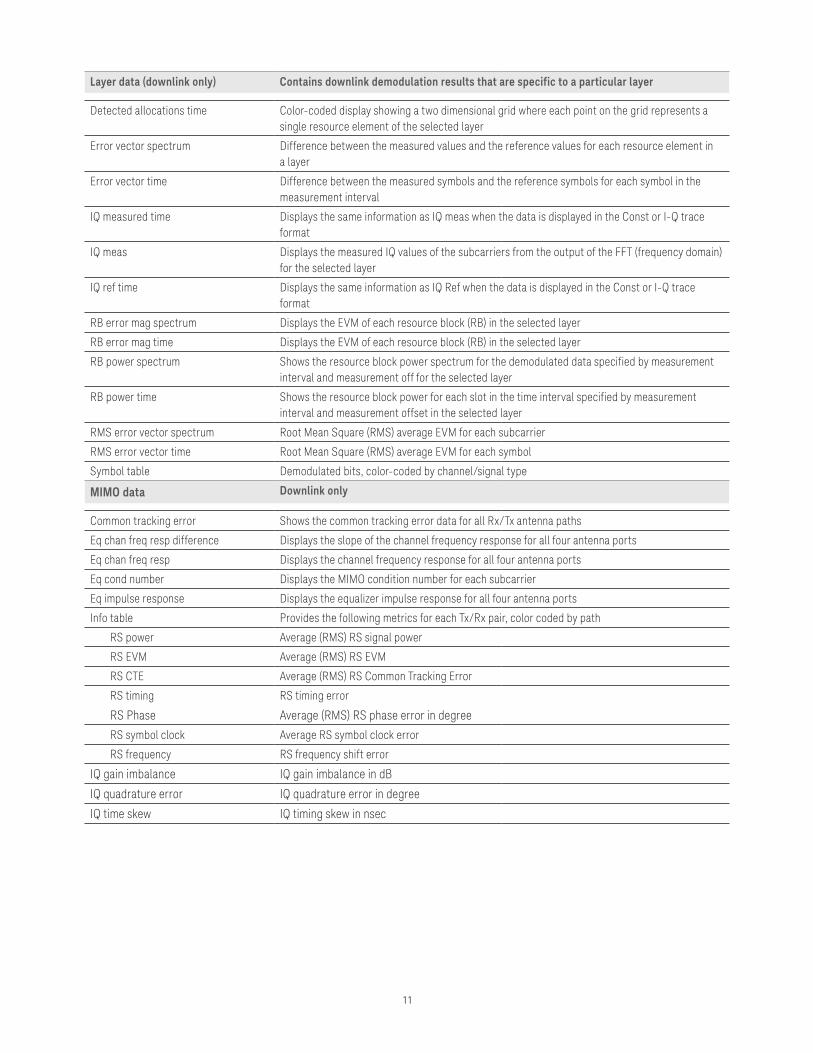
Layer data (downlink only) Contains downlink demodulation results that are specific to a particular layer
Detected allocations time Color-coded display showing a two dimensional grid where each point on the grid represents a single resource element of the selected layer
Error vector spectrum Difference between the measured values and the reference values for each resource element in a layer
Error vector time Difference between the measured symbols and the reference symbols for each symbol in the measurement interval
IQ measured time Displays the same information as IQ meas when the data is displayed in the Const or I-Q trace format
IQ meas Displays the measured IQ values of the subcarriers from the output of the FFT (frequency domain) for the selected layer
IQ ref time Displays the same information as IQ Ref when the data is displayed in the Const or I-Q trace format
RB error mag spectrum Displays the EVM of each resource block (RB) in the selected layer
RB error mag time Displays the EVM of each resource block (RB) in the selected layer
RB power spectrum Shows the resource block power spectrum for the demodulated data specified by measurement interval and measurement off for the selected layer
RB power time Shows the resource block power for each slot in the time interval specified by measurement interval and measurement offset in the selected layer
RMS error vector spectrum Root Mean Square (RMS) average EVM for each subcarrier
RMS error vector time Root Mean Square (RMS) average EVM for each symbol
Symbol table Demodulated bits, color-coded by channel/signal type
MIMO data Downlink only
Common tracking error Shows the common tracking error data for all Rx/Tx antenna paths
Eq chan freq resp difference Displays the slope of the channel frequency response for all four antenna ports
Eq chan freq resp Displays the channel frequency response for all four antenna ports
Eq cond number Displays the MIMO condition number for each subcarrier
Eq impulse response Displays the equalizer impulse response for all four antenna ports
Info table Provides the following metrics for each Tx/Rx pair, color coded by path
RS power Average (RMS) RS signal power
RS EVM Average (RMS) RS EVM
RS CTE Average (RMS) RS Common Tracking Error
RS timing RS timing error
RS Phase Average (RMS) RS phase error in degree
RS symbol clock Average RS symbol clock error
RS frequency RS frequency shift error
IQ gain imbalance IQ gain imbalance in dB
IQ quadrature error IQ quadrature error in degree
IQ time skew IQ timing skew in nsec
12
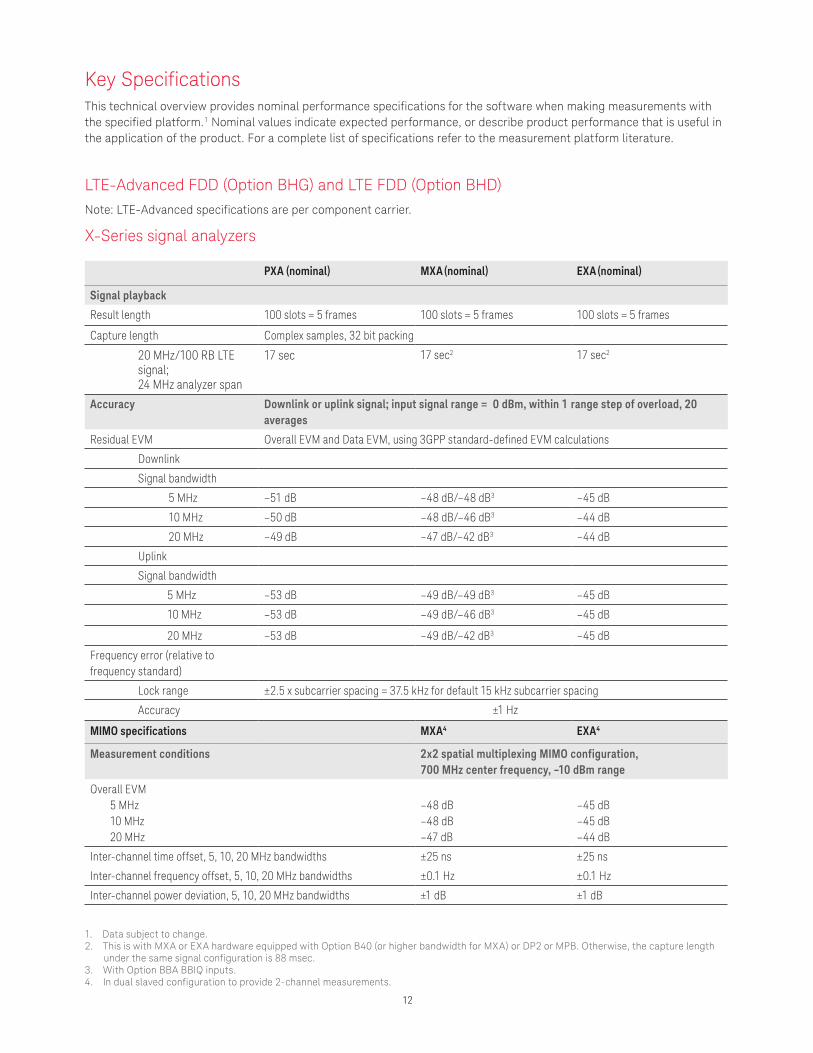
PXA (nominal) MXA (nominal) EXA (nominal)
Signal playback
Result length 100 slots = 5 frames 100 slots = 5 frames 100 slots = 5 frames
Capture length Complex samples, 32 bit packing
20 MHz/100 RB LTE signal;
24 MHz analyzer span
17 sec 17 sec2 17 sec2
Accuracy Downlink or uplink signal; input signal range = 0 dBm, within 1 range step of overload, 20 averages
Residual EVM Overall EVM and Data EVM, using 3GPP standard-defined EVM calculations
Downlink
Signal bandwidth
5 MHz –51 dB –48 dB/–48 dB3 –45 dB
10 MHz –50 dB –48 dB/–46 dB3 –44 dB
20 MHz –49 dB –47 dB/–42 dB3 –44 dB
Uplink
Signal bandwidth
5 MHz –53 dB –49 dB/–49 dB3 –45 dB
10 MHz –53 dB –49 dB/–46 dB3 –45 dB
20 MHz –53 dB –49 dB/–42 dB3 –45 dB
Frequency error (relative to frequency standard)
Lock range ±2.5 x subcarrier spacing = 37.5 kHz for default 15 kHz subcarrier spacing
Accuracy ±1 Hz
MIMO specifications MXA4 EXA4
Measurement conditions 2x2 spatial multiplexing MIMO configuration, 700 MHz center frequency, –10 dBm range
Overall EVM 5 MHz 10 MHz 20 MHz
–48 dB–48 dB–47 dB
–45 dB–45 dB–44 dB
Inter-channel time offset, 5, 10, 20 MHz bandwidths ±25 ns ±25 ns
Inter-channel frequency offset, 5, 10, 20 MHz bandwidths ±0.1 Hz ±0.1 Hz
Inter-channel power deviation, 5, 10, 20 MHz bandwidths ±1 dB ±1 dB
1. Data subject to change. 2. This is with MXA or EXA hardware equipped with Option B40 (or higher bandwidth for MXA) or DP2 or MPB. Otherwise, the capture length
under the same signal configuration is 88 msec.3. With Option BBA BBIQ inputs.4. In dual slaved configuration to provide 2-channel measurements.
Key SpecificationsThis technical overview provides nominal performance specifications for the software when making measurements with the specified platform.1 Nominal values indicate expected performance, or describe product performance that is useful in the application of the product. For a complete list of specifications refer to the measurement platform literature.
X-Series signal analyzers
LTE-Advanced FDD (Option BHG) and LTE FDD (Option BHD)Note: LTE-Advanced specifications are per component carrier.
13
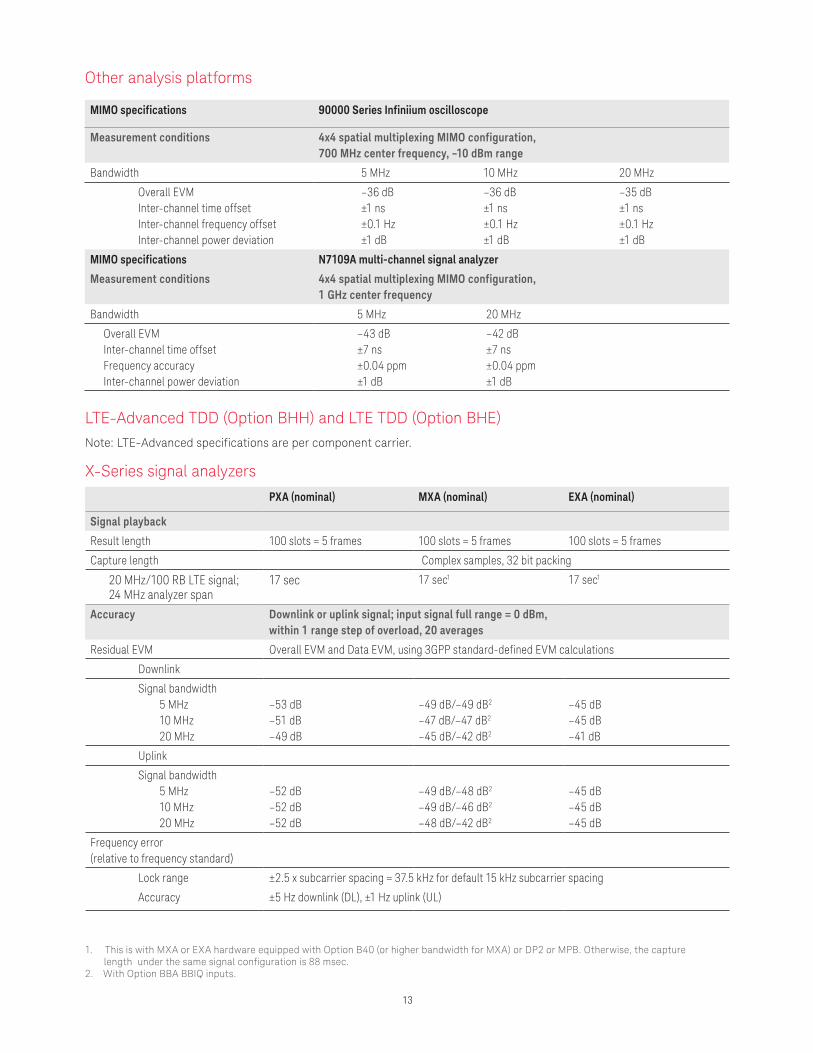
MIMO specifications 90000 Series Infiniium oscilloscope
Measurement conditions 4x4 spatial multiplexing MIMO configuration, 700 MHz center frequency, –10 dBm range
Bandwidth 5 MHz 10 MHz 20 MHz
Overall EVM Inter-channel time offset Inter-channel frequency offset Inter-channel power deviation
–36 dB –36 dB –35 dB ±1 ns ±1 ns ±1 ns ±0.1 Hz ±0.1 Hz ±0.1 Hz ±1 dB ±1 dB ±1 dB
MIMO specifications N7109A multi-channel signal analyzer
Measurement conditions 4x4 spatial multiplexing MIMO configuration,1 GHz center frequency
Bandwidth 5 MHz 20 MHz
Overall EVM Inter-channel time offset Frequency accuracy Inter-channel power deviation
–43 dB –42 dB ±7 ns ±7 ns ±0.04 ppm ±0.04 ppm ±1 dB ±1 dB
Other analysis platforms
LTE-Advanced TDD (Option BHH) and LTE TDD (Option BHE)Note: LTE-Advanced specifications are per component carrier.
PXA (nominal) MXA (nominal) EXA (nominal)
Signal playback
Result length 100 slots = 5 frames 100 slots = 5 frames 100 slots = 5 frames
Capture length Complex samples, 32 bit packing
20 MHz/100 RB LTE signal; 24 MHz analyzer span
17 sec 17 sec1 17 sec1
Accuracy Downlink or uplink signal; input signal full range = 0 dBm, within 1 range step of overload, 20 averages
Residual EVM Overall EVM and Data EVM, using 3GPP standard-defined EVM calculations
Downlink
Signal bandwidth 5 MHz 10 MHz 20 MHz
–53 dB–51 dB–49 dB
–49 dB/–49 dB2
–47 dB/–47 dB2
–45 dB/–42 dB2
–45 dB–45 dB–41 dB
Uplink
Signal bandwidth 5 MHz 10 MHz 20 MHz
–52 dB–52 dB–52 dB
–49 dB/–48 dB2
–49 dB/–46 dB2
–48 dB/–42 dB2
–45 dB–45 dB–45 dB
Frequency error (relative to frequency standard)
Lock range ±2.5 x subcarrier spacing = 37.5 kHz for default 15 kHz subcarrier spacing
Accuracy ±5 Hz downlink (DL), ±1 Hz uplink (UL)
X-Series signal analyzers
1. This is with MXA or EXA hardware equipped with Option B40 (or higher bandwidth for MXA) or DP2 or MPB. Otherwise, the capture length under the same signal configuration is 88 msec.
2. With Option BBA BBIQ inputs.
14
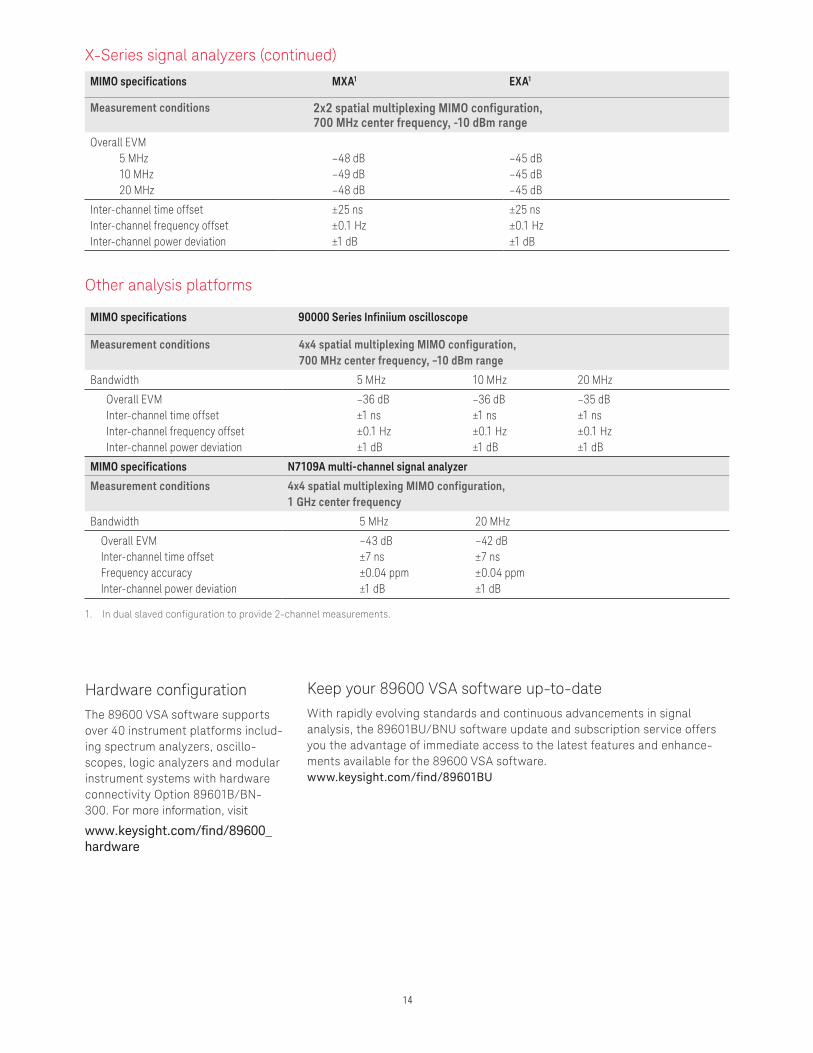
MIMO specifications 90000 Series Infiniium oscilloscope
Measurement conditions 4x4 spatial multiplexing MIMO configuration, 700 MHz center frequency, –10 dBm range
Bandwidth 5 MHz 10 MHz 20 MHz
Overall EVM Inter-channel time offset Inter-channel frequency offset
Inter-channel power deviation
–36 dB –36 dB –35 dB ±1 ns ±1 ns ±1 ns ±0.1 Hz ±0.1 Hz ±0.1 Hz ±1 dB ±1 dB ±1 dB
MIMO specifications N7109A multi-channel signal analyzer
Measurement conditions 4x4 spatial multiplexing MIMO configuration,1 GHz center frequency
Bandwidth 5 MHz 20 MHz
Overall EVM Inter-channel time offset Frequency accuracy Inter-channel power deviation
–43 dB –42 dB ±7 ns ±7 ns ±0.04 ppm ±0.04 ppm ±1 dB ±1 dB
Other analysis platforms
1. In dual slaved configuration to provide 2-channel measurements.
MIMO specifications MXA1 EXA1
Measurement conditions 2x2 spatial multiplexing MIMO configuration, 700 MHz center frequency, -10 dBm range
Overall EVM 5 MHz 10 MHz 20 MHz
–48 dB –49 dB –48 dB
–45 dB –45 dB –45 dB
Inter-channel time offsetInter-channel frequency offset Inter-channel power deviation
±25 ns ±0.1 Hz ±1 dB
±25 ns±0.1 Hz±1 dB
Keep your 89600 VSA software up-to-dateWith rapidly evolving standards and continuous advancements in signal analysis, the 89601BU/BNU software update and subscription service offers you the advantage of immediate access to the latest features and enhance-ments available for the 89600 VSA software. www.keysight.com/find/89601BU
Hardware configurationThe 89600 VSA software supports over 40 instrument platforms includ-ing spectrum analyzers, oscillo-scopes, logic analyzers and modular instrument systems with hardware connectivity Option 89601B/BN-300. For more information, visit
www.keysight.com/find/89600_hardware
X-Series signal analyzers (continued)
Literature89600 VSA Software, Brochure, literature number 5990-6553EN89600 VSA Software, Configuration Guide, literature number 5990-6386EN89600 VSA Software Opt 200 Basic VSA and Opt 300 Hardware Connectivity, Technical Overview, literature number 5990-6405ENLTE and LTE-Advanced Solutions, Brochure, literature number 5989-7817ENKeysight 3GPP Long Term Evolution: System Overview, Product Development, and Test Challenges, Application Note, literature number 5989-8139EN
Webwww.keysight.com/find/89600vsa www.keysight.com/find/LTE www.keysight.com/find/LTE-Advanced
Additional Resources
16 | Keysight | LTE & LTE-Advanced FDD & TDD Modulation Analysis 89600 VSA Software - Application Brief
This information is subject to change without notice.© Keysight Technologies, 2017Published in USA, December 2, 20175990-6406ENwww.keysight.com
www.keysight.com/find/89600vsa
For more information on Keysight Technologies’ products, applications or services, please contact your local Keysight office. The complete list is available at:www.keysight.com/find/contactus
Americas Canada (877) 894 4414Brazil 55 11 3351 7010Mexico 001 800 254 2440United States (800) 829 4444
Asia PacificAustralia 1 800 629 485China 800 810 0189Hong Kong 800 938 693India 1 800 11 2626Japan 0120 (421) 345Korea 080 769 0800Malaysia 1 800 888 848Singapore 1 800 375 8100Taiwan 0800 047 866Other AP Countries (65) 6375 8100
Europe & Middle EastAustria 0800 001122Belgium 0800 58580Finland 0800 523252France 0805 980333Germany 0800 6270999Ireland 1800 832700Israel 1 809 343051Italy 800 599100Luxembourg +32 800 58580Netherlands 0800 0233200Russia 8800 5009286Spain 800 000154Sweden 0200 882255Switzerland 0800 805353
Opt. 1 (DE)Opt. 2 (FR)Opt. 3 (IT)
United Kingdom 0800 0260637
For other unlisted countries:www.keysight.com/find/contactus(BP-9-7-17)
DEKRA CertifiedISO9001 Quality Management System
www.keysight.com/go/qualityKeysight Technologies, Inc.DEKRA Certified ISO 9001:2015Quality Management System
Evolving Since 1939Our unique combination of hardware, software, services, and people can help you reach your next breakthrough. We are unlocking the future of technology. From Hewlett-Packard to Agilent to Keysight.
myKeysightwww.keysight.com/find/mykeysightA personalized view into the information most relevant to you.
http://www.keysight.com/find/emt_product_registrationRegister your products to get up-to-date product information and find warranty information.
Keysight Serviceswww.keysight.com/find/serviceKeysight Services can help from acquisition to renewal across your instrument’s lifecycle. Our comprehensive service offerings—one-stop calibration, repair, asset management, technology refresh, consulting, training and more—helps you improve product quality and lower costs.
Keysight Assurance Planswww.keysight.com/find/AssurancePlansUp to ten years of protection and no budgetary surprises to ensure your instruments are operating to specification, so you can rely on accurate measurements.
Keysight Channel Partnerswww.keysight.com/find/channelpartnersGet the best of both worlds: Keysight’s measurement expertise and product breadth, combined with channel partner convenience.