Embed Size (px)
Citation preview

LTAT.05.006 / Lecture 11 / © Dietmar Pfahl 2020
LTAT.05.006: Software Testing
Lecture 11: Quality Estimation / Test Doc., Org. and Process Improvement (Test Maturity Model)
Dietmar Pfahl
email: [email protected] 2020
LTAT.05.006 / Lecture 11 / © Dietmar Pfahl 2020
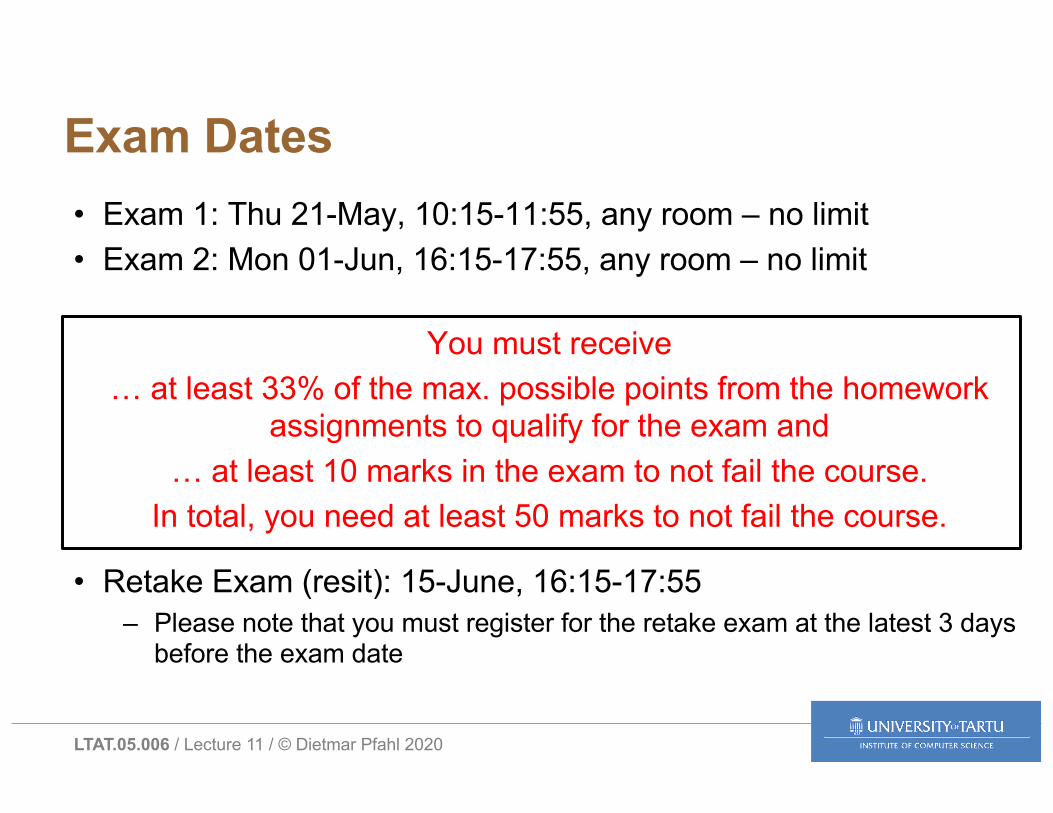
Exam Dates• Exam 1: Thu 21-May, 10:15-11:55, any room – no limit• Exam 2: Mon 01-Jun, 16:15-17:55, any room – no limit
You must receive… at least 33% of the max. possible points from the homework
assignments to qualify for the exam and … at least 10 marks in the exam to not fail the course.
In total, you need at least 50 marks to not fail the course.
• Retake Exam (resit): 15-June, 16:15-17:55– Please note that you must register for the retake exam at the latest 3 days
before the exam date

LTAT.05.006 / Lecture 11 / © Dietmar Pfahl 2020
Exam Dates• Exam 1: Thu 21-May, 10:15-11:55, any room – no limit• Exam 2: Mon 01-Jun, 16:15-17:55, any room – no limit
You must receive… at least 33% of the max. possible points from the homework
assignments to qualify for the exam and … at least 10 marks in the exam to not fail the course.
In total, you need at least 50 marks to not fail the course.
• Retake Exam (resit): 15-June, 16:15-17:55– Please note that you must register for the retake exam at the latest 3 days
before the exam date
You must register for one of the exams (either Ex. 1 or Ex. 2) to
be admitted.
The “or” is exclusive àExam 1 xor Exam 2

LTAT.05.006 / Lecture 11 / © Dietmar Pfahl 2020
Exam Dates• Exam 1: Thu 21-May, 10:15-11:55, any room – no limit• Exam 2: Mon 01-Jun, 16:15-17:55, any room – no limit
You must receive… at least 33% of the max. possible points from the homework
assignments to qualify for the exam and … at least 10 marks in the exam to not fail the course.
In total, you need at least 50 marks to not fail the course.
• Retake Exam (resit): 15-June, 16:15-17:55– Please note that you must register for the retake exam at the latest 3 days
before the exam date
Study Regulation: “If the student is not present at the exam, mark ‘F’ (fail) should be inserted into SIS. If the students was sick, he/she should
present medical certificate to Ülle Holm who will cancel the result.”

LTAT.05.006 / Lecture 11 / © Dietmar Pfahl 2020
Exam Dates• Exam 1: Thu 21-May, 10:15-11:55, any room – no limit• Exam 2: Mon 01-Jun, 16:15-17:55, any room – no limit
You must receive… at least 33% of the max. possible points from the homework
assignments to qualify for the exam and … at least 10 marks in the exam to not fail the course.
In total, you need at least 50 marks to not fail the course.
• Retake Exam (resit): 15-June, 16:15-17:55– Please note that you must register for the retake exam at the latest 3 days
before the exam date
The exams will be done via
Moodle

LTAT.05.006 / Lecture 11 / © Dietmar Pfahl 2020
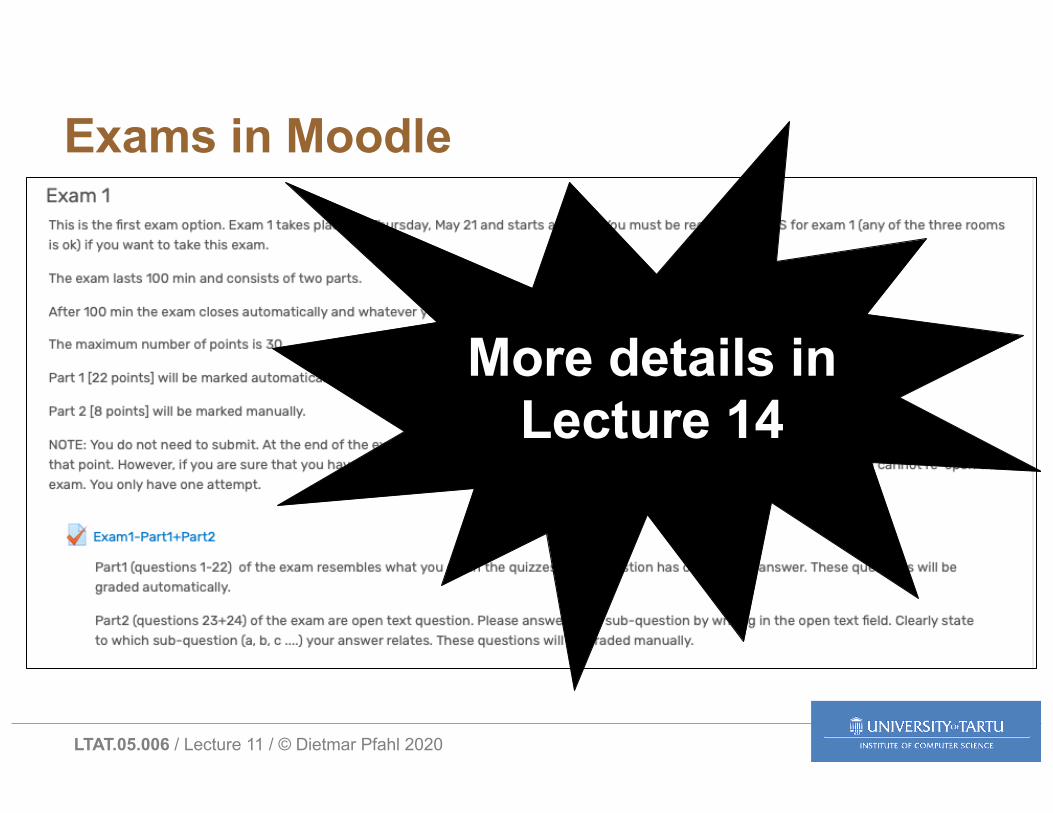
Exams in Moodle
LTAT.05.006 / Lecture 11 / © Dietmar Pfahl 2020
Exams in Moodle
More details in Lecture 14

LTAT.05.006 / Lecture 11 / © Dietmar Pfahl 2020
Status after HW8: All active students have qualified for the exam
0
10
20
30
40
50
60
1 4 7 10 13 16 19 22 25 28 31 34 37 40 43 46 49 52 55 58 61 64 67 70 73 76 79 82 85 88 91 94 97 100
103
106
109
112
115
118
121
HW Assignments 1-8 (mapped to max. 60 points) 100% of 10 best HW
100% of HW 1-8
33% of 10 best HW

LTAT.05.006 / Lecture 11 / © Dietmar Pfahl 2020
Lectures• Lecture 1 (13.02) – Introduction to Software Testing• Lecture 2 (20.02) – Basic Black-Box Testing Techniques: Boundary Value
Analysis & Equivalence Class Partitioning• Lecture 3 (27.02) – BBT advanced: C/E-Graphing & Combinatorial Testing• Lecture 4 (05.03) – Basic White-Box Testing Techniques: Instruction & Control-
Flow Coverage• Lecture 5 (12.03) – BBT adv.: State-Transition, Random, Metamorphic Testing• Lecture 6 (19.03) – Test Levels, Test Tools, Test Automation• Lecture 7 (26.03) – BBT adv.: Exploratory Testing, Behavior Testing• Lecture 8 (02.04) – BBT adv.: GUI / Visual Testing, Security, Usability, A/B Testing• Lecture 9 (09.04) – WBT adv.: Data-Flow Testing, Mutation Testing• Lecture 10 (16.04) – WBT adv.: Symbolic Execution, Static Code Analysis, Review• Lecture 11 (23.04) – Defect Estimation / Test Documentation, Organisation and
Process Improvement (Test Maturity Model)• Lectures 12+13 (30.04 + 07.05) – Industry Guest Lectures (see course wiki)• Lecture 14 (14.05) – Exam Preparation

LTAT.05.006 / Lecture 11 / © Dietmar Pfahl 2020
White-Box Testing Techniques
• Control-Flow Testing• Data-Flow Testing• Mutation Testing• Symbolic Execution• Static Code Analysis• Reviews
Lecture 10
Recap from last lecture!

LTAT.05.006 / Lecture 11 / © Dietmar Pfahl 2020
Reading Techniques
• Ad hoc• Checklist-based• Defect-based• Usage-based• Perspective-based

LTAT.05.006 / Lecture 11 / © Dietmar Pfahl 2020
Ad-hoc / Checklist-based / Defect-based Reading

LTAT.05.006 / Lecture 11 / © Dietmar Pfahl 2020
Usage-based Reading
Source:Thelin, T.; Runeson, P..; Wohlin, C.; ”Prioritized Use Cases as a Vehicle for Software Inspections”, IEEE Software , vol. 20, no.4, pp. 30-33, July-August 2003
1 – Prioritize Use Cases (UCs)2 – Select UC with highest priority3 – Track UC’s scenario through the document under review4 – Check whether UC’s goals are fulfilled, needed funtionality provided, interfaces are correct, and so on (report issues detected)5 – Select next UC

LTAT.05.006 / Lecture 11 / © Dietmar Pfahl 2020
UBR versus CBR
Source:Thelin, T.; Runeson, P..; Wohlin, C.; ”Prioritized Use Cases as a Vehicle for Software Inspections”, IEEE Software , vol. 20, no.4, pp. 30-33, July-August 2003
Comparison of UBR with Checklist-Based Reading (CBR)

LTAT.05.006 / Lecture 11 / © Dietmar Pfahl 2020
Perspective-based Reading
• Scenarios• Purpose• Decrease overlap
(redundancy)• Improve
effectivenessDesigner
Tester
User

LTAT.05.006 / Lecture 11 / © Dietmar Pfahl 2020
Summary: Why Review?
• Main objective• Detect faults
• Other objectives• Inform• Educate• Learn from (other’s) mistakes à Improve!
• (Undetected) faults may affect software quality negatively – during all steps of the development process!

LTAT.05.006 / Lecture 11 / © Dietmar Pfahl 2020
Structure of Lecture 11
• Quality Estimation• Lab 11• Test Planning & Documentation • Test Organization • Test Process Improvement (Test Maturity Model)
LTAT.05.006 / Lecture 11 / © Dietmar Pfahl 2020
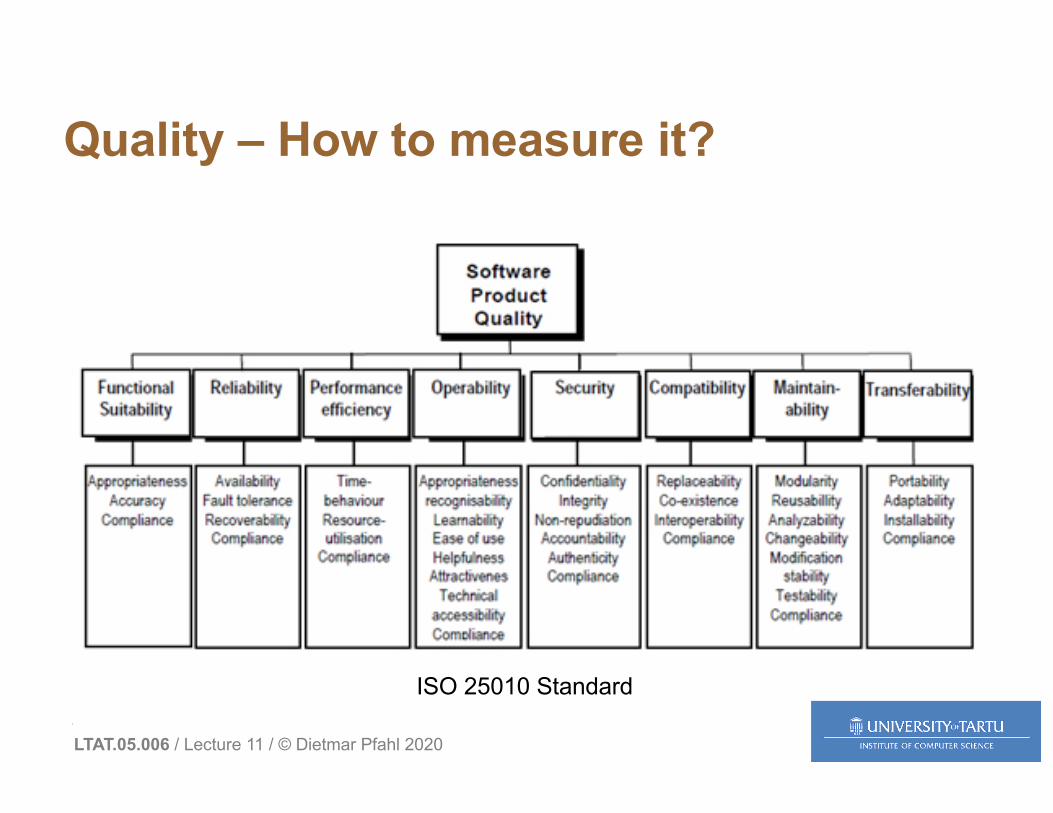
Quality – How to measure it?
ISO 25010 Standard

LTAT.05.006 / Lecture 11 / © Dietmar Pfahl 2020
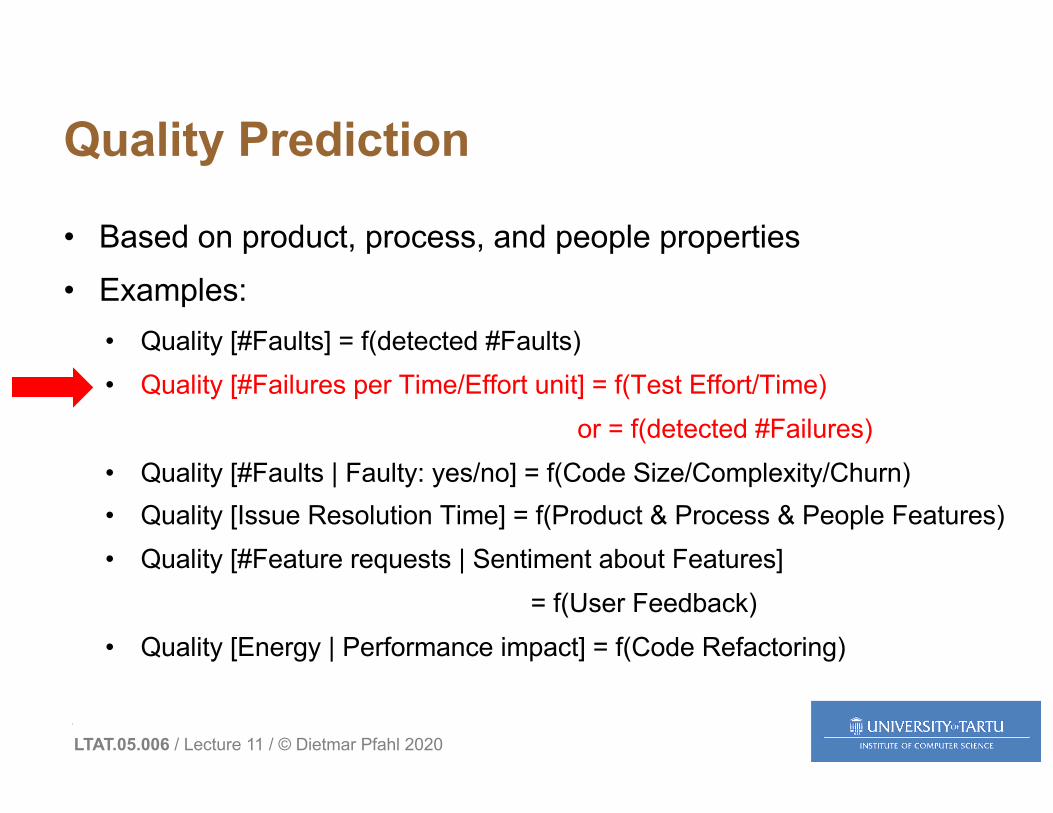
Quality Prediction
• Based on product, process, and people properties• Examples:
• Quality [#Faults] = f(detected #Faults)• Quality [#Failures per Time/Effort unit] = f(Test Effort/Time)
or = f(detected #Failures)• Quality [#Faults | Faulty: yes/no] = f(Code Size/Complexity/Churn)• Quality [Issue Resolution Time] = f(Product & Process & People Features)• Quality [#Feature requests | Sentiment about Features]
= f(User Feedback)• Quality [Energy | Performance impact] = f(Code Refactoring)

LTAT.05.006 / Lecture 11 / © Dietmar Pfahl 2020
Quality Prediction
• Based on product, process, and people properties• Examples:
• Quality [#Faults] = f(detected #Faults)• Quality [#Failures per Time/Effort unit] = f(Test Effort/Time)
or = f(detected #Failures)• Quality [#Faults | Faulty: yes/no] = f(Code Size/Complexity/Churn)• Quality [Issue Resolution Time] = f(Product & Process & People Features)• Quality [#Feature requests | Sentiment about Features]
= f(User Feedback)• Quality [Energy | Performance impact] = f(Code Refactoring)
Data Science:Regression, Classification

LTAT.05.006 / Lecture 11 / © Dietmar Pfahl 2020
Quality Prediction
• Based on product, process, and people properties• Examples:
• Quality [#Faults] = f(detected #Faults)• Quality [#Failures per Time/Effort unit] = f(Test Effort/Time)
or = f(detected #Failures)• Quality [#Faults | Faulty: yes/no] = f(Code Size/Complexity/Churn)• Quality [Issue Resolution Time] = f(Product & Process & People Features)• Quality [#Feature requests | Sentiment about Features]
= f(User Feedback)• Quality [Energy | Performance impact] = f(Code Refactoring)

LTAT.05.006 / Lecture 11 / © Dietmar Pfahl 2020
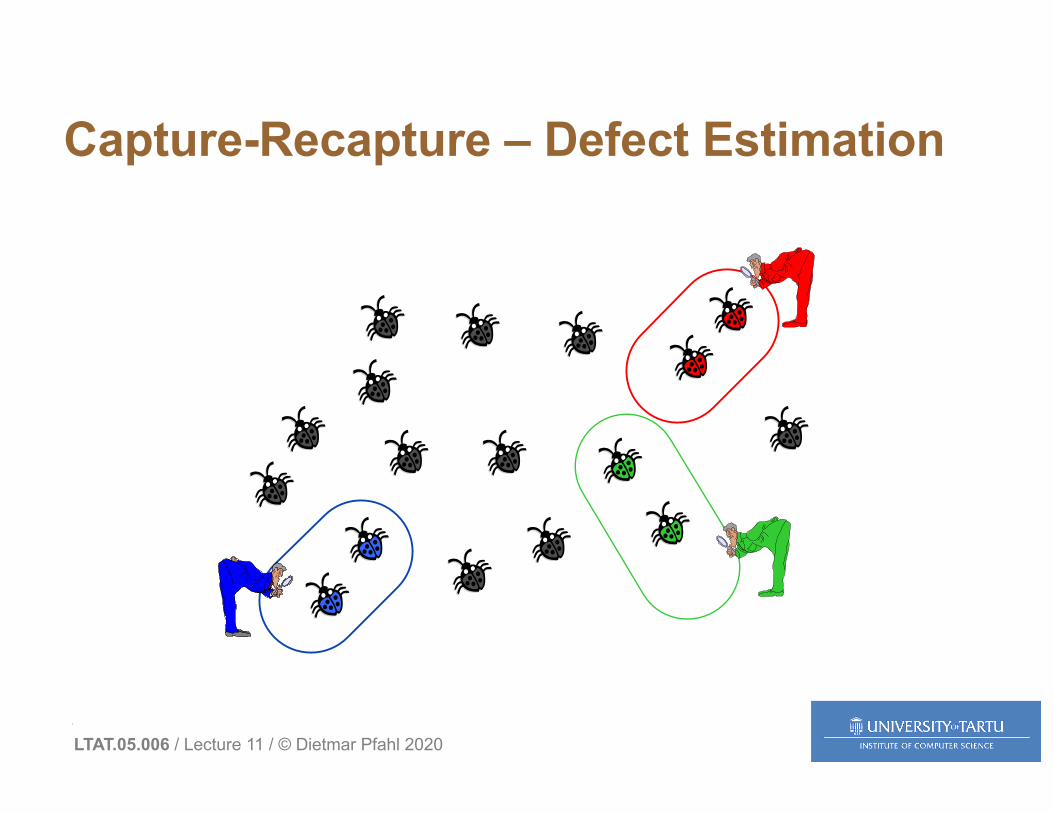
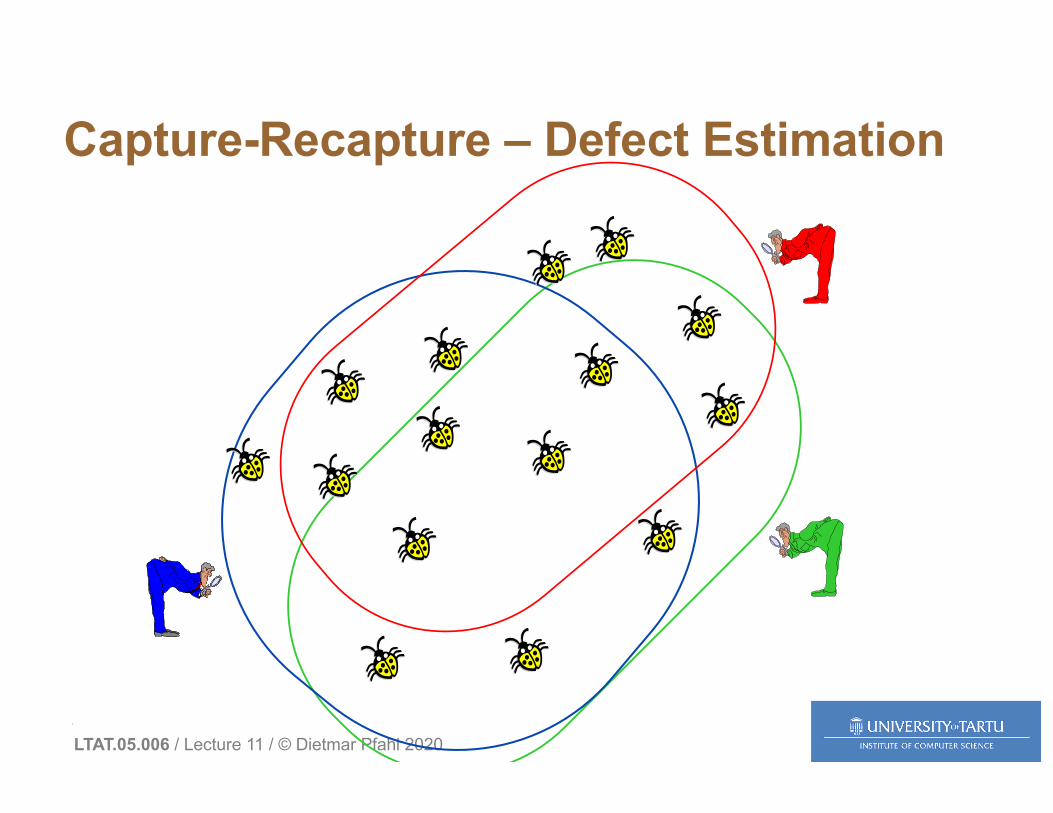
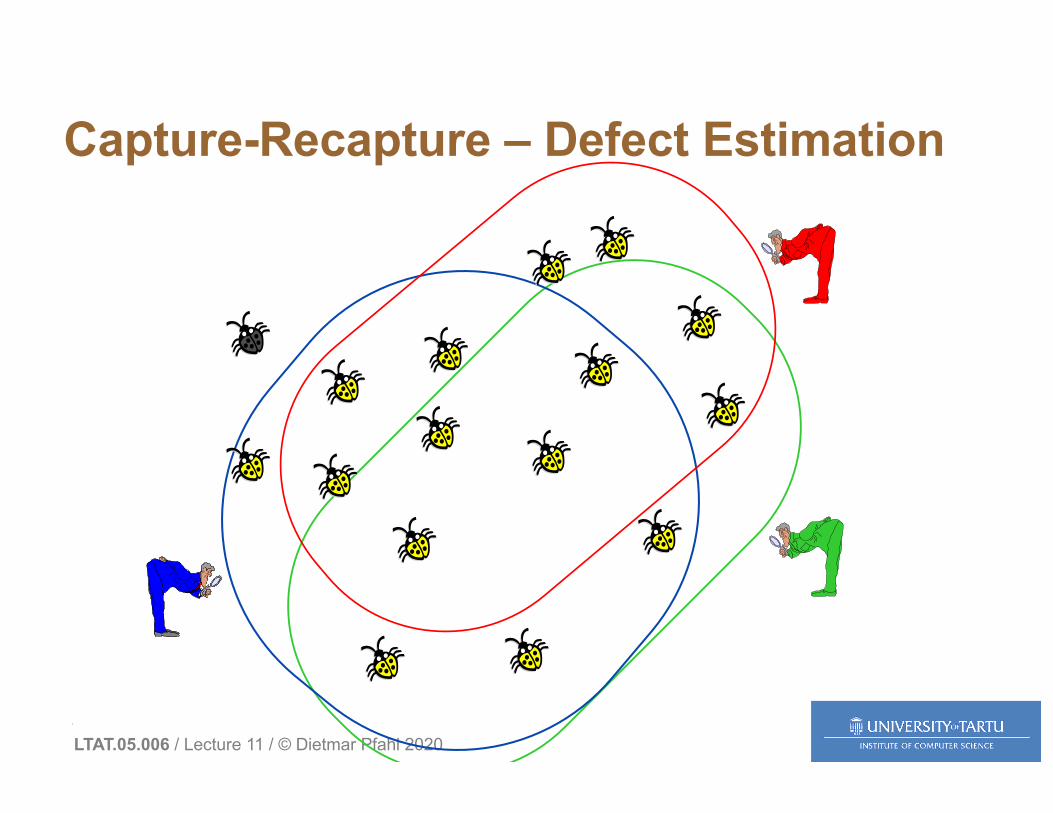
Capture-Recapture – Defect Estimation
Remember:Defect and Fault (and Bug) are synonyms
LTAT.05.006 / Lecture 11 / © Dietmar Pfahl 2020
Capture-Recapture – Defect Estimation
LTAT.05.006 / Lecture 11 / © Dietmar Pfahl 2020
Capture-Recapture – Defect Estimation
LTAT.05.006 / Lecture 11 / © Dietmar Pfahl 2020
Capture-Recapture – Defect Estimation
LTAT.05.006 / Lecture 11 / © Dietmar Pfahl 2020
Capture-Recapture – Defect Estimation
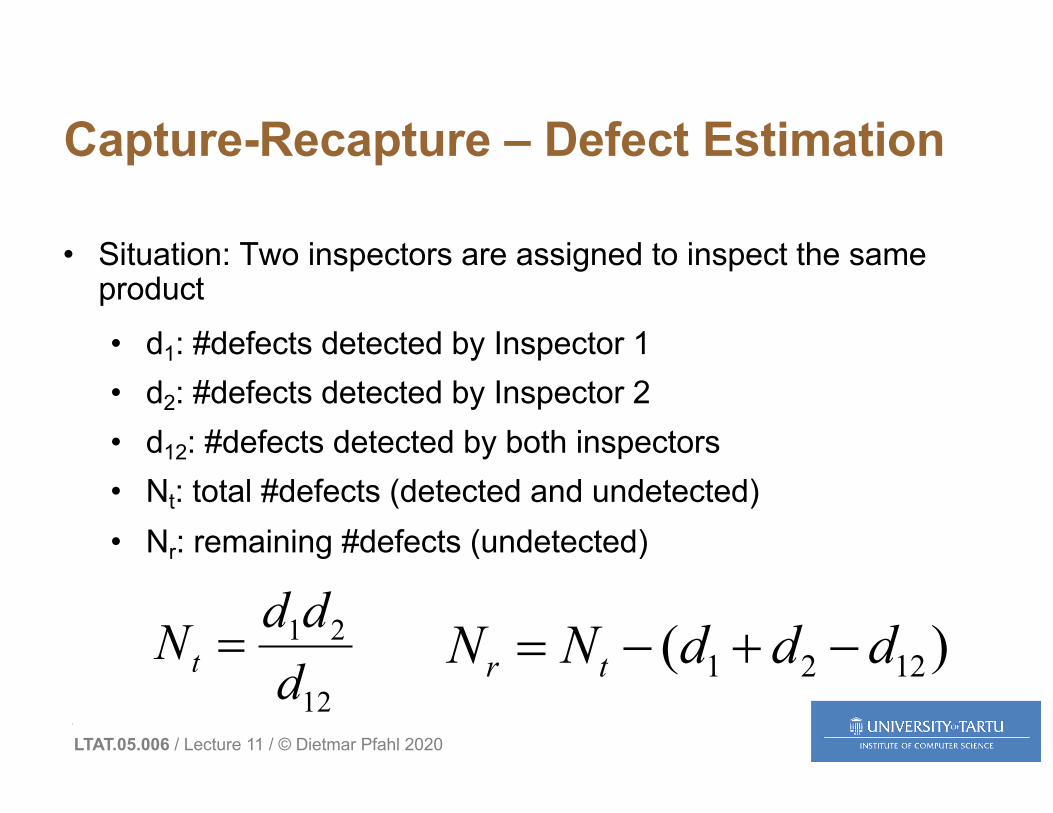
• Situation: Two inspectors are assigned to inspect the same product
• d1: #defects detected by Inspector 1• d2: #defects detected by Inspector 2• d12: #defects detected by both inspectors• Nt: total #defects (detected and undetected)• Nr: remaining #defects (undetected)
12
21
dddNt = )( 1221 dddNN tr -+-=
LTAT.05.006 / Lecture 11 / © Dietmar Pfahl 2020
Capture-Recapture – Example
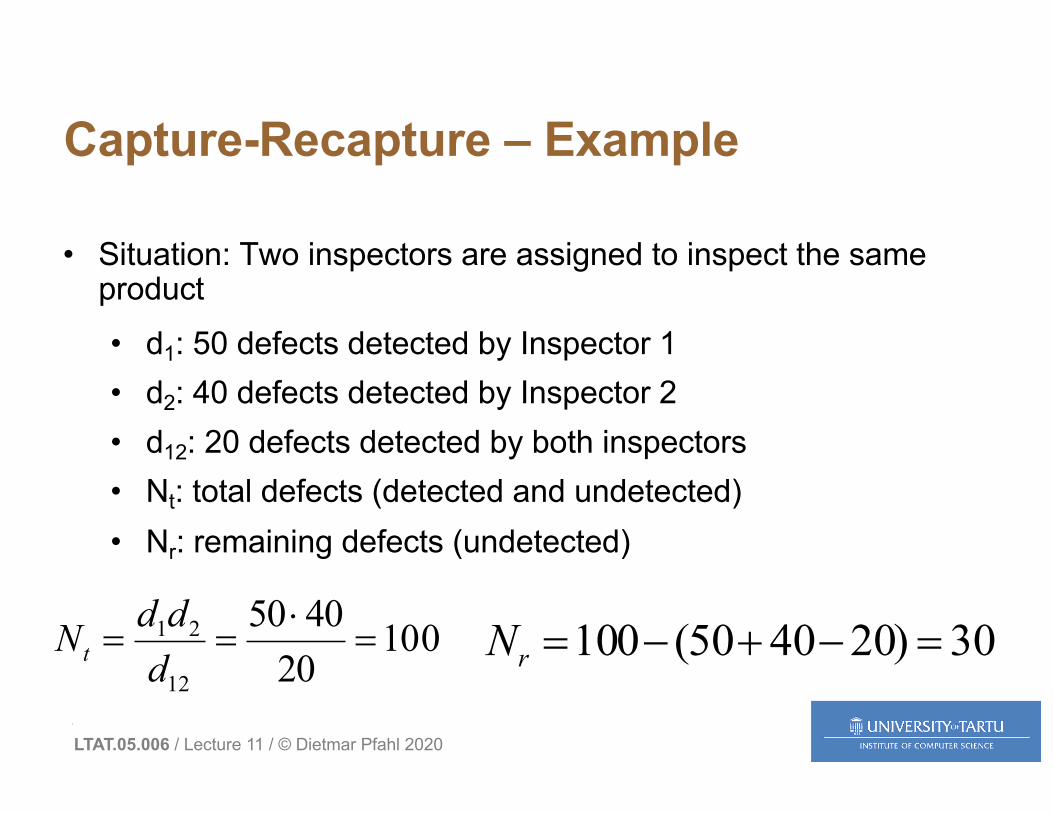
• Situation: Two inspectors are assigned to inspect the same product
• d1: 50 defects detected by Inspector 1• d2: 40 defects detected by Inspector 2• d12: 20 defects detected by both inspectors• Nt: total defects (detected and undetected)• Nr: remaining defects (undetected)
100204050
12
21 =×
==dddNt 30)204050(100 =-+-=rN
LTAT.05.006 / Lecture 11 / © Dietmar Pfahl 2020
Advanced Capture-Recapture Models
• Four basic models used for inspections• Difference: Degrees of freedom (see next slide)
• Prerequisites for all models• All reviewers work independently of each other• It is not allowed to inject or remove faults during
inspection

LTAT.05.006 / Lecture 11 / © Dietmar Pfahl 2020
Advanced Capture-Recapture Models
Model
Probability of defect being found is equal across ...
EstimatorDefect Reviewer
M0 Yes Yes Maximum-likelihood
Mt Yes No Maximum-likelihoodChao’s estimator
Mh No Yes JackknifeChao’s estimator
Mth No No Chao’s estimator

LTAT.05.006 / Lecture 11 / © Dietmar Pfahl 2020
Example: 3 Reviewers
1
23

LTAT.05.006 / Lecture 11 / © Dietmar Pfahl 2020
Example:
Maximum-likelihood:• Mt = total marked animals
(=faults) at the start of the t'thsampling interval
• Ct = total number of animals (=faults) sampled during interval t
• Rt = number of recaptures in the sample Ct
• An approximation of the maximum likelihood estimate of population size (N) is: SUM(Ct*Mt)/SUM(Rt)
Bug 01 02 03 04 05 06 07 08 09 10 11 12 13 14 15P1 X X X X X X X X X X XP2 X X X X X X X X XP3 X X X X X X X X X X X
First resampling:M1 = 11 (first reviewer)C1 = 9 (second reviewer)R1 = 6 (duplicates)N = 11 * 9 / 6 = 99 / 6 = 16.5 à 2.5 not found
Second resampling:M2 = 14 (first and second reviewer)C2 = 11 (third reviewer)R2 = 10 (duplicates)N = (11 * 9 + 14 * 11) / (6 + 10) = 253 / 16 = 15.8
à 0.8 not found
3 Reviewers
14 found
15 found

LTAT.05.006 / Lecture 11 / © Dietmar Pfahl 2020
Mt Model
Maximum-likelihood:• Mt = total marked animals
(=faults) at the start of the t'thsampling interval
• Ct = total number of animals (=faults) sampled during interval t
• Rt = number of recaptures in the sample Ct
• An approximation of the maximum likelihood estimate of population size (N) is: SUM(Ct*Mt)/SUM(Rt)
First resampling:M1 = 5 (first reviewer)C1 = 4 (second reviewer)R1 = 2 (duplicates)N = 4 * 5 / 2 = 10
Second resampling:M2 = 7 (first and second reviewer)C2 = 4 (third reviewer)R2 = 3 (duplicates)N = (4 * 5 + 4 * 7) / (2 + 3) = 48 / 5 = 9.6 [à 9 or 10]
Third resampling:M3 = 8 (first, second and third reviewer)C3 = 3 (fourth reviewer)R3 = 3 (duplicates)N = (20 + 28 + 3 * 8) / (2 + 3 + 3) = 72 / 8 = 9
4 Reviewers
LTAT.05.006 / Lecture 11 / © Dietmar Pfahl 2020
Quality Prediction
• Based on product, process, and people properties• Examples:
• Quality [#Faults] = f(detected #Faults)• Quality [#Failures per Time/Effort unit] = f(Test Effort/Time)
or = f(detected #Failures)• Quality [#Faults | Faulty: yes/no] = f(Code Size/Complexity/Churn)• Quality [Issue Resolution Time] = f(Product & Process & People Features)• Quality [#Feature requests | Sentiment about Features]
= f(User Feedback)• Quality [Energy | Performance impact] = f(Code Refactoring)

LTAT.05.006 / Lecture 11 / © Dietmar Pfahl 2020
Reliability Growth Models
• To predict the probability of future failure occurrence based on past (observed) failure occurrence
• Can be used to estimate • the number of residual (remaining) faults or • the time until the next failure occurs• the remaining test time until a reliability objective is
achieved• Application typically during system test

LTAT.05.006 / Lecture 11 / © Dietmar Pfahl 2020
Reliability / Availability• Reliability:
• Probability that no failure occurs up to a certain point in time• often measured in terms of ‘Mean-Time-Between-Failures’
(MTBF)
• Reliability = exp(-t/MTBF) è if t=MTBF then Rel = 36.8%• Availability
• 1 - Percentage of down-time in a given time frame
Time [min]0 5 6 9 14
5 1 3 5
F1 F2 F3 F4 à F5?
?

LTAT.05.006 / Lecture 11 / © Dietmar Pfahl 2020
Reliability / Availability• Reliability:
• Probability that no failure occurs up to a certain point in time• often measured in terms of ‘Mean-Time-Between-Failures’
(MTBF)
• Reliability = exp(-t/MTBF) è if t=MTBF then Rel = 36.8%• Availability
• 1 - Percentage of down-time in a given time frame
Time [min]0 5 6 9 14
5 1 3 5
F1 F2 F3 F4 à F5 = 17.5
3.5

LTAT.05.006 / Lecture 11 / © Dietmar Pfahl 2020
Availability (high-level)Availability % Downtime Downtime Downtime Downtime
per year per month per week per day
55.5555555% ("nine fives") 162.33 days 13.53 days 74.92 hours 10.67 hours90% ("one nine") 36.53 days 73.05 hours 16.80 hours 2.40 hours95% ("one nine five") 18.26 days 36.53 hours 8.40 hours 1.20 hours97% 10.96 days 21.92 hours 5.04 hours 43.20 minutes98% 7.31 days 14.61 hours 3.36 hours 28.80 minutes99% ("two nines") 3.65 days 7.31 hours 1.68 hours 14.40 minutes99.5% ("two nines five") 1.83 days 3.65 hours 50.40 minutes 7.20 minutes99.8% 17.53 hours 87.66 minutes 20.16 minutes 2.88 minutes99.9% ("three nines") 8.77 hours 43.83 minutes 10.08 minutes 1.44 minutes99.95% ("three nines five") 4.38 hours 21.92 minutes 5.04 minutes 43.20 seconds99.99% ("four nines") 52.60 minutes 4.38 minutes 1.01 minutes 8.64 seconds99.995% ("four nines five") 26.30 minutes 2.19 minutes 30.24 seconds 4.32 seconds99.999% ("five nines") 5.26 minutes 26.30 seconds 6.05 seconds 864.00 milliseconds99.9999% ("six nines") 31.56 seconds 2.63 seconds 604.80 milliseconds 86.40 milliseconds99.99999% ("seven nines") 3.16 seconds 262.98 milliseconds 60.48 milliseconds 8.64 milliseconds99.999999% ("eight nines") 315.58 milliseconds 26.30 milliseconds 6.05 milliseconds 864.00 microseconds99.9999999% ("nine nines") 31.56 milliseconds 2.63 milliseconds 604.80 microseconds 86.40 microseconds

LTAT.05.006 / Lecture 11 / © Dietmar Pfahl 2020
Reliability Growth Models (RGMs)Purpose: Stop testing whena certain percentage (90%, 95%, 99%, 99.9%, …) of estimated total number of failures has been reacheda certain failure rate has been reached
Cumulative #Failures (µ)
Test Intensity (t)(CPU time, test effort, test days, calendar days, …)
100%95%
(estimated n0)
dtet
0
0
00)( n
lt
ltµ-
ò=

LTAT.05.006 / Lecture 11 / © Dietmar Pfahl 2020
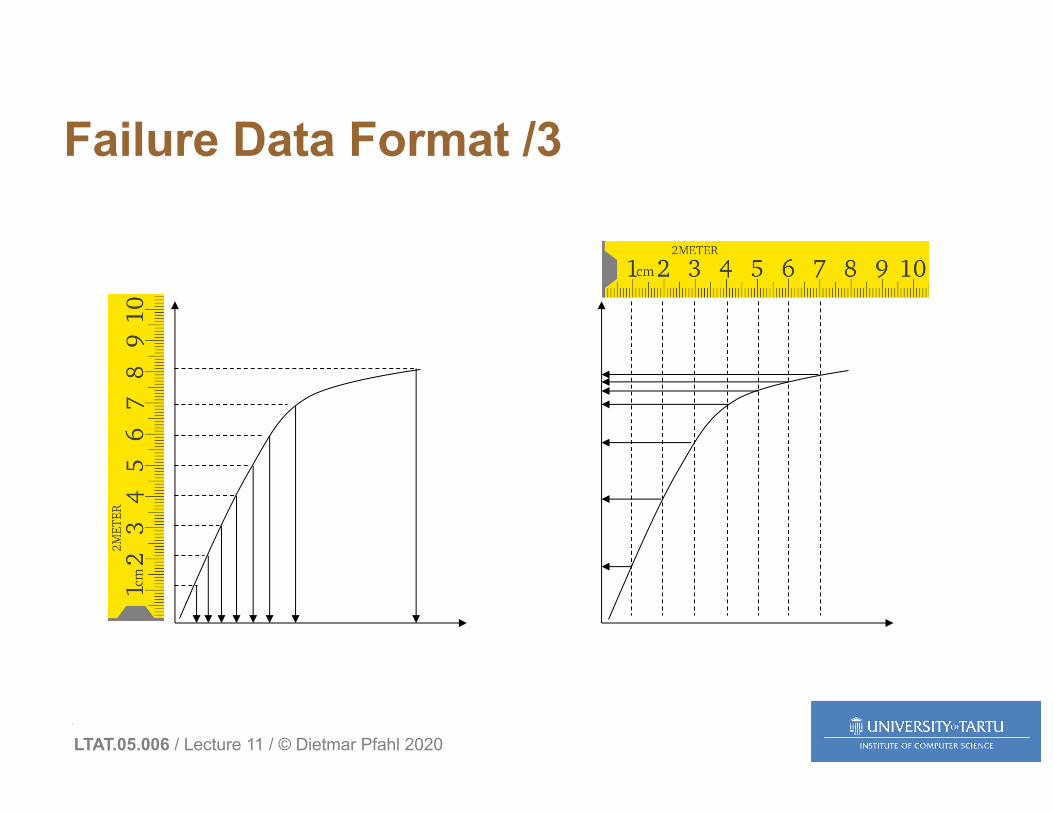
Failure Data Format /1
1) Time of failure2) Time interval
between failures3) Cumulative failure
up to a given time4) Failures
experienced in a time interval
Failure no.
Failure times (hours)
Failure interval (hours)
1 10 10
2 19 93 32 134 43 11
5 58 156 70 12
7 88 188 103 159 125 22
10 150 2511 169 1912 199 30
13 231 3214 256 25
15 296 40
Time-based failure specification

LTAT.05.006 / Lecture 11 / © Dietmar Pfahl 2020
Failure Data Format /2
1) Time of failure2) Time interval between
failures3) Cumulative failure up
to a given time4) Failures experienced
in a time interval
Time Cumulative Failures
Failures in interval
30 2 260 5 390 7 2120 8 1150 10 2180 11 1210 12 1240 13 1270 14 1300 15 1
Failure count based failure specification
LTAT.05.006 / Lecture 11 / © Dietmar Pfahl 2020
Failure Data Format /3

LTAT.05.006 / Lecture 11 / © Dietmar Pfahl 2020
Many types of RGMs exist (>50)
Exponential growth model (with asymptote)
Logarithmic growth model (without asymptote)
S-shaped growth model (without asymptote)
Exponential splines model (without asymptote)
LTAT.05.006 / Lecture 11 / © Dietmar Pfahl 2020
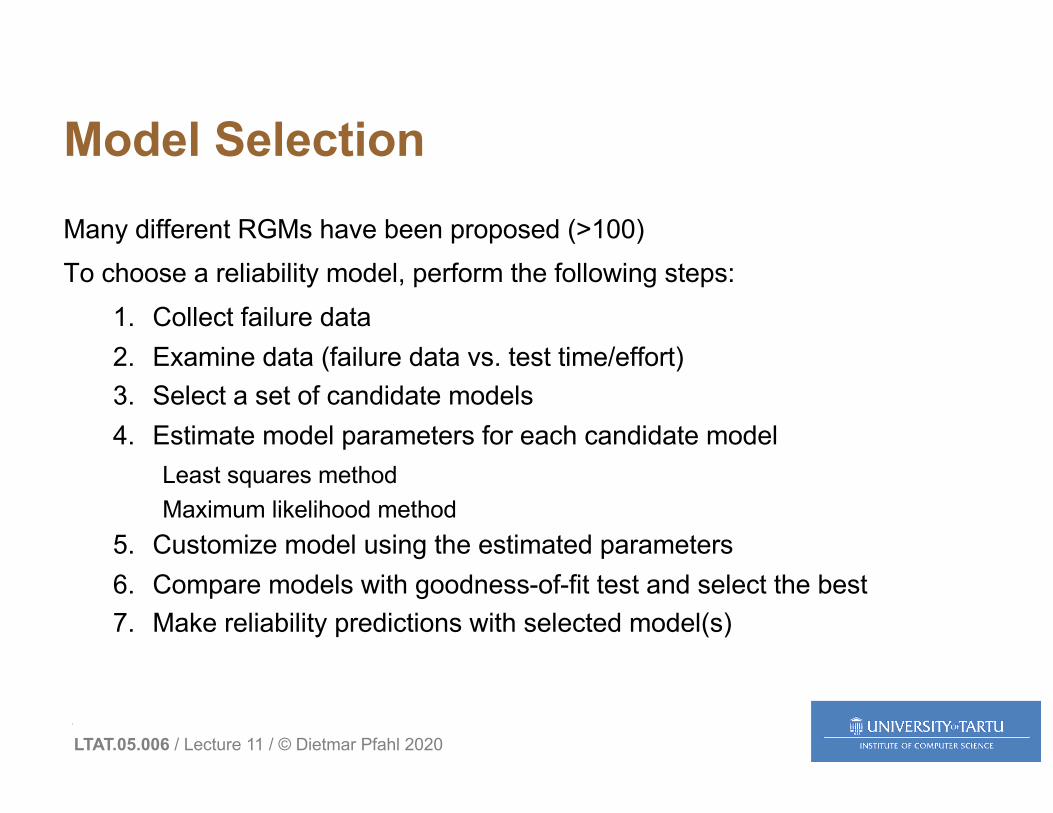
Model SelectionMany different RGMs have been proposed (>100)To choose a reliability model, perform the following steps:
1. Collect failure data2. Examine data (failure data vs. test time/effort)3. Select a set of candidate models4. Estimate model parameters for each candidate model
Least squares methodMaximum likelihood method
5. Customize model using the estimated parameters6. Compare models with goodness-of-fit test and select the best7. Make reliability predictions with selected model(s)

LTAT.05.006 / Lecture 11 / © Dietmar Pfahl 2020
Quality Prediction
• Based on product, process, and people properties• Examples:
• Quality [#Faults] = f(detected #Faults)• Quality [#Failures per Time/Effort unit] = f(Test Effort/Time)
or = f(detected #Failures)• Quality [#Faults | Faulty: yes/no] = f(Code Size/Complexity/Churn)• Quality [Issue Resolution Time] = f(Product & Process & People Features)• Quality [#Feature requests | Sentiment about Features]
= f(User Feedback)• Quality [Energy | Performance impact] = f(Code Refactoring)

LTAT.05.006 / Lecture 11 / © Dietmar Pfahl 2020
General Idea
Features (with Importance)
Data (from past) =known characteristics (features)& known outcome
Modeling Method- Regression- Classification / Clustering- Neural Networks (Deep Learning)- etc.using many techniques:- Text mining- Topic Modeling- Decision Trees- Random Forest- etc.
Model that predicts outcome based on characteristics (features)
Outcomes (predicted):- #Defects- #Failures- Defective: yes/no- Missing/Good/Bad
Feature- Time/Effort to resolve- Severity- Who shall resolve/fix?- Impact?- …

LTAT.05.006 / Lecture 11 / © Dietmar Pfahl 2020
Example 1: Predicting Fault-Proneness
Source: Lionel C. Briand, Jürgen Wüst, John W. Daly, D. Victor Porter, Exploring the relationships between design measures and software quality in object-oriented systems, Journal of Systems and Software, Volume 51, Issue 3, 2000, Pages 245-273, ISSN 0164-1212, https://doi.org/10.1016/S0164-1212(99)00102-8.
Lionel Briand, Univ. of Luxembourg
OO-Metrics:- Inheritence- Coupling- Cohesion- …
ClassClassClassClassClass
Faulty?- Yes- No
Class(new)
ClassClassClassClassClass
No fault in test Faulty
PredictionModel

LTAT.05.006 / Lecture 11 / © Dietmar Pfahl 2020
Example 2a: Predicting IRT (Issue Resolution Time)
Source: Dietmar Pfahl, Siim Karus, and Myroslava Stavnycha. 2016. Improving expert prediction of issue resolution time. In Proceedings of the 20th International Conference on Evaluation and Assessment in Software Engineering (EASE '16). ACM, New York, NY, USA, Article 42, 6 pages. DOI: https://doi.org/10.1145/2915970.2916004.
Myroslava Stavnycha, MSc at Univ. Tartu(now with CodeBorne)
Static Features:- Name- Submitter- Type- …- Description
IClassIClassIClassIlassIssue
IRTIssue(new)
PredictionModel
Issue Resolution Time
Text Mining
LTAT.05.006 / Lecture 11 / © Dietmar Pfahl 2020
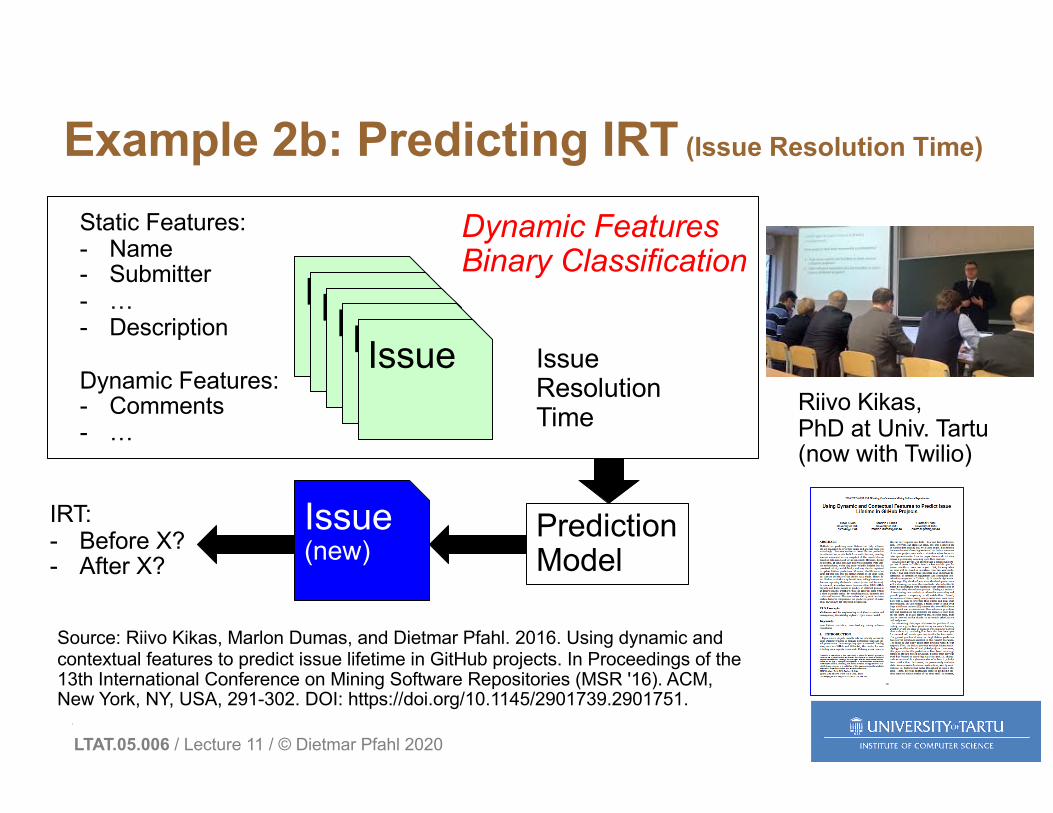
Example 2b: Predicting IRT (Issue Resolution Time)
Source: Riivo Kikas, Marlon Dumas, and Dietmar Pfahl. 2016. Using dynamic and contextual features to predict issue lifetime in GitHub projects. In Proceedings of the 13th International Conference on Mining Software Repositories (MSR '16). ACM, New York, NY, USA, 291-302. DOI: https://doi.org/10.1145/2901739.2901751.
Riivo Kikas, PhD at Univ. Tartu(now with Twilio)
Static Features:- Name- Submitter- …- Description
Dynamic Features:- Comments- …
IClassIClassIClassIlassIssue
IRT:- Before X?- After X?
Issue(new)
PredictionModel
Issue Resolution Time
Dynamic FeaturesBinary Classification

LTAT.05.006 / Lecture 11 / © Dietmar Pfahl 2020
More Examples …
• Classifying Severity of Issues• Assigning Developer to Issue• Classifying User Reviews• Feature Request• Failure Report• Feature Evaluation
• …

LTAT.05.006 / Lecture 11 / © Dietmar Pfahl 2020
Structure of Lecture 11
• Quality Estimation• Lab 11• Test Planning & Documentation • Test Organization • Test Process Improvement (Test Maturity Model)
LTAT.05.006 / Lecture 11 / © Dietmar Pfahl 2020
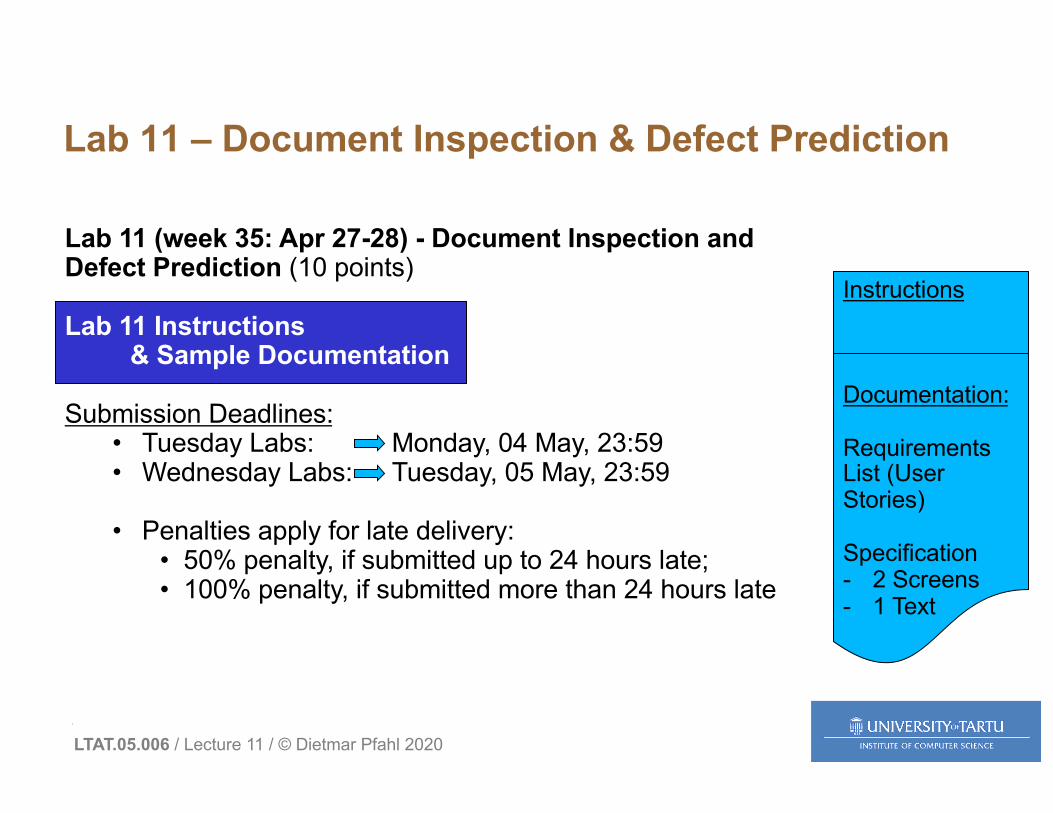
Lab 11 – Document Inspection & Defect Prediction
Lab 11 (week 35: Apr 27-28) - Document Inspection and Defect Prediction (10 points)
Lab 11 Instructions & Sample Documentation
Submission Deadlines: • Tuesday Labs: Monday, 04 May, 23:59 • Wednesday Labs: Tuesday, 05 May, 23:59
• Penalties apply for late delivery: • 50% penalty, if submitted up to 24 hours late; • 100% penalty, if submitted more than 24 hours late
Instructions
Documentation:
Requirements List (User Stories)
Specification- 2 Screens- 1 Text

LTAT.05.006 / Lecture 11 / © Dietmar Pfahl 2020
Student Pair
Lab 11 – Document Inspection & Defect Prediction (cont’d)
Instructions
Inspection of Specification against Requiremnts
Table columns:ID, Description, Location, Type, Severity
Requirements(6 User Stories)
Specification (excerpt)2 screens
& Text
?
Issue List(at least 8 defects in
Spec)
Phase A: Individual student work Phase B: Pair work
1 Student
Issue List Student 1
Issue List Student 2
Consolidated Issue List
Remaining DefectsEstimation

LTAT.05.006 / Lecture 11 / © Dietmar Pfahl 2020
Lab 11 – Document Inspection & Defect Prediction (cont’d)
Lab 11: Must work in
pairs to be ableto get full marks!

LTAT.05.006 / Lecture 11 / © Dietmar Pfahl 2020
Structure of Lecture 11
• Quality Estimation• Lab 11• Test Planning & Documentation • Test Organization • Test Process Improvement (Test Maturity Model)

LTAT.05.006 / Lecture 11 / © Dietmar Pfahl 2020
Test Planning
• Objectives• What to test• Who will test• When to test• How to test• When to stop
Elective course (Fall’20):Hands-on SW TestingMTAT.03.294

LTAT.05.006 / Lecture 11 / © Dietmar Pfahl 2020
2257.6 Report ing Test Results |
Planning
Execution
Completion
SPMP
Software projectmanagement plan
Master test plan Test designspecifications
Detailed testplans for levels
Test casespecifications
Test procedurespecifications
MTPLTP TDS
TCS
TPSTest item transmittal reports
Test incident reports
Test logs TL TIR
Test summary report TSR
TITR
FIG. 7.4
Test-related documents asrecommended by IEEE [5].
document [5]. In the figure it is assumed that an overall Master Test Plan(MTP) is developed at first, and this is followed by more detailed testplans for the different levels of testing, unit, integration, system, accep-tance, and so on. From the figure and the discussion in this chapter, it isapparent that the preparation of a complete set of test documents thatfully conform to IEEE standards requires many resources and an invest-ment of a great deal of time and effort. Not all organizations require suchan extensive set of test-related documents. Each organization should de-scribe, as part of its testing or quality standards, which test-related doc-uments should be prepared. The content and format for each documentshould be included in the standards. Very often, a subset of the IEEE-recommended documents is satisfactory, especially if the organization issmall and there is no separate testing group.
IEEE 829-2008: Standard for Software and System Test Documentation

LTAT.05.006 / Lecture 11 / © Dietmar Pfahl 2020
Hierarchy of Test Plans 1997.2 Test Planning |
Software quality assurance (V&V) plan
Master test plan
Unit test planIntegrationtest plan
Systemtest plan
Acceptancetest plan
Review plan: Inspectionsand walkthroughs
FIG. 7.1
A hierarchy of test plans.
document. Depending on organizational policy, another level of the hi-erarchy could contain a separate test plan for unit, integration, system,and acceptance tests. In some organizations these are part of the mastertest plan. The level-based plans give a more detailed view of testing ap-propriate to that level. The IEEE Software Engineering Standards Col-lection has useful descriptions for many of these plans and other test andquality-related documents such as verification and validation plans[4–7].
The persons responsible for developing test plans depend on the typeof plan under development. Usually staff from one or more groups co-operates in test plan development. For example, the master test plan forexecution-based testing may be developed by the project manager, espe-cially if there is no separate testing group. It can also be developed by atester or software quality assurance manager, but always requires coop-eration and input from the project manager. It is essential that develop-ment and testing activities be coordinated to allow the project to progresssmoothly. The type and organization of the test plan, the test plan hier-archy, and who is responsible for development should be specified inorganizational standards or software quality assurance documents.
The remainder of this chapter focuses on the development of a gen-eral-purpose execution-based test plan that will be referred to as a “testplan.” The description of the test plan contents is based on a discussionof recommended test plan components appearing in the IEEE Standardfor Software Test Documentation: IEEE/ANSI Std 829-1983 [5]. This

LTAT.05.006 / Lecture 11 / © Dietmar Pfahl 2020
Test plan according toIEEE Std 829-2008 (Appendix II)a) Test plan identifierb) Introductionc) Test itemsd) Features to be testede) Features not to be testedf) Approachg) Item pass/fail criteriah) Suspension criteria and
resumption requirements
i) Test deliverablesj) Testing tasksk) Environmental needsl) Responsibilitiesm) Staffing and training needsn) Scheduleo) Risks and contingenciesp) Approvals

LTAT.05.006 / Lecture 11 / © Dietmar Pfahl 2020
Test Plan (1)
a) Test plan identifierb) Introduction
– Product to be tested, objectives, scope of the test plan– Software items and features to be tested– References to project authorization, project plan, QA
plan, CM plan, relevant policies & standardsc) Test items
– Test items including version/revision level– Items include end-user documentation– Defect fixes– How transmitted to testing– References to software documentation
Slide not discussed in lecture;Only meant as background info

LTAT.05.006 / Lecture 11 / © Dietmar Pfahl 2020
Test Plan (2)
d) Features to be tested– Identify test design / specification techniques– Reference requirements or other specs
e) Features not to be tested– Deferred features, environment combinations, …– Reasons for exclusion
f) Approach– How you are going to test this system
• Activities, techniques and tools– Detailed enough to estimate– Completion criteria (e.g. coverage, reliability)– Identify constraints (environment, staff, deadlines)
Slide not discussed in lecture;Only meant as background info

LTAT.05.006 / Lecture 11 / © Dietmar Pfahl 2020
Test Plan (3)g) Item pass/fail criteria
– What constitutes success of the testing– Coverage, failure count, failure rate, number of
executed tests, …– Is NOT product release criteria
h) Suspension and resumption criteria– For all or parts of testing activities– Which activities must be repeated on resumption
i) Test deliverables– Test plan – Test design specification, Test case specification– Test procedure specification, Test item transmittal
report– Test logs, Test incident reports, Test summary reports
Slide not discussed in lecture;Only meant as background info

LTAT.05.006 / Lecture 11 / © Dietmar Pfahl 2020
Test Plan (4)
j) Testing tasks– Including inter-task dependencies & special skills– Estimates
k) Environment– Physical, hardware, software, tools– Mode of usage, security, office space– Test environment set-up
l) Responsibilities– To manage, design, prepare, execute, witness, check,
resolve issues, providing environment, providing the software to test
m) Staffing and Training needs
Slide not discussed in lecture;Only meant as background info
LTAT.05.006 / Lecture 11 / © Dietmar Pfahl 2020
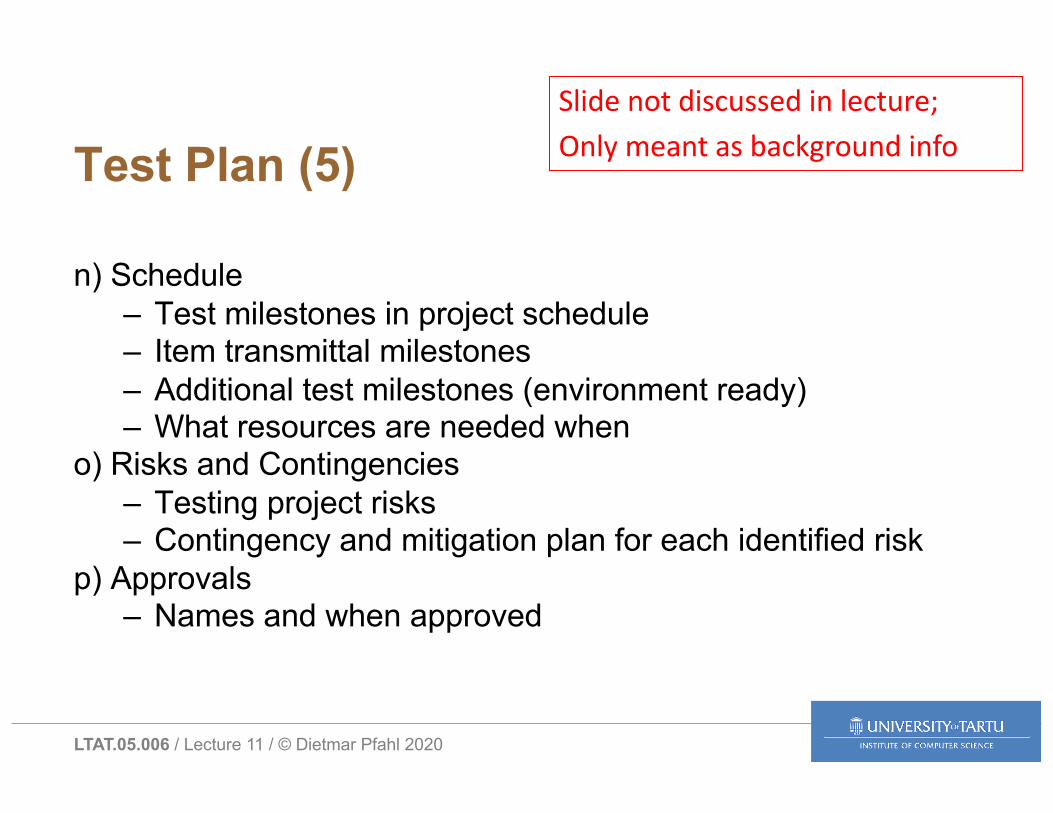
Test Plan (5)
n) Schedule– Test milestones in project schedule– Item transmittal milestones– Additional test milestones (environment ready)– What resources are needed when
o) Risks and Contingencies– Testing project risks– Contingency and mitigation plan for each identified risk
p) Approvals– Names and when approved
Slide not discussed in lecture;Only meant as background info

LTAT.05.006 / Lecture 11 / © Dietmar Pfahl 2020
Test Case Specification – Why? • Organization
– All testers and other project team members can review and use test cases effectively
• Repeatability– Know what test cases were last run and how so that you could
repeat the same tests• Tracking
– What requirements or features are tested?– Tracking information’s value depends on the quality of the test
cases• Evidence of testing
– Confidence (quality)– Detect failures
TCS

LTAT.05.006 / Lecture 11 / © Dietmar Pfahl 2020
Failure/Issue Report(Test incidence report)
• Summary• Incident Description• Impact

LTAT.05.006 / Lecture 11 / © Dietmar Pfahl 2020
Failure/Issue Report(Test incidence report)
Summary
• This is a summation/description of the actual incident.
– Provides enough details to enable others to understand how the incident was discovered and any relevant supporting information
• References to:– Test Procedure used to
discover the incident– Test Case Specifications that
will provide the information to repeat the incident
– Test logs showing the actual execution of the test cases and procedures
– Any other supporting materials, trace logs, memory dumps/maps etc.

LTAT.05.006 / Lecture 11 / © Dietmar Pfahl 2020
Failure/Issue Report(Test incidence report)
Incident Description
• Provides as much details on the incident as possible.
– Especially if there are no other references to describe the incident.
• Includes all relevant information that has not already been included in the incident summary information or any additional supporting information
• Information:– Inputs– Expected Results– Actual Results– Anomalies– Date and Time– Procedure Step– Attempts to Repeat– Testers– Observers
LTAT.05.006 / Lecture 11 / © Dietmar Pfahl 2020
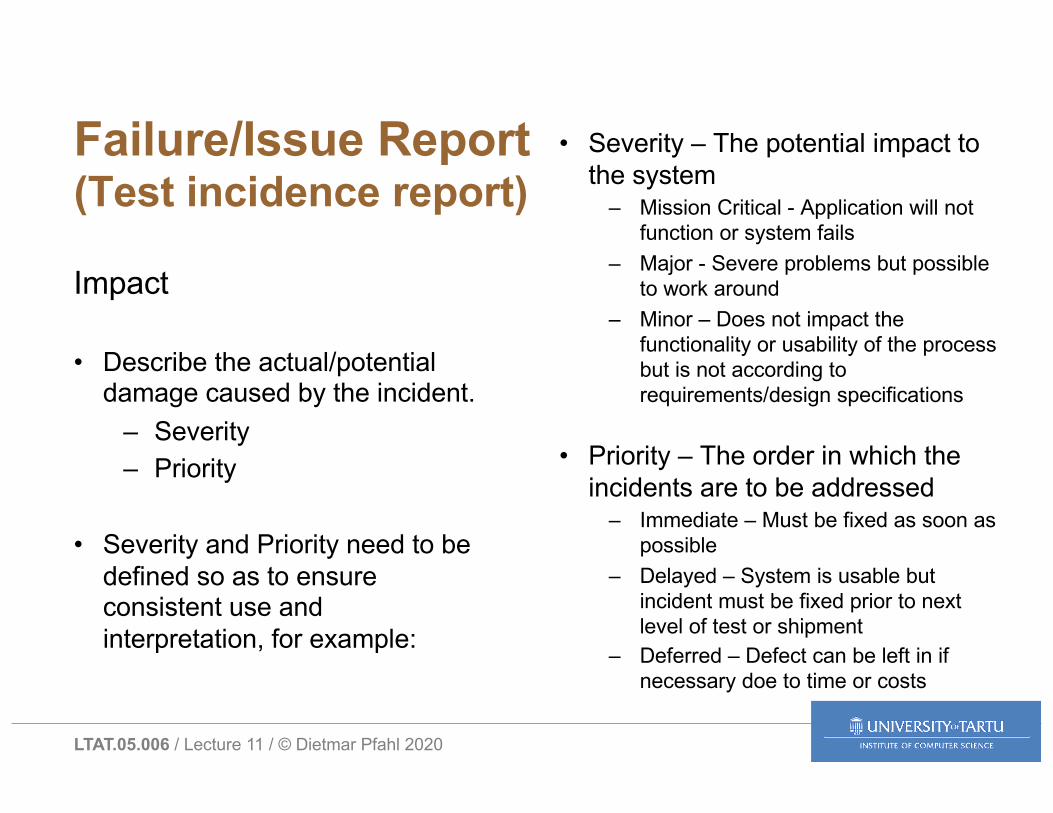
Failure/Issue Report(Test incidence report)
Impact
• Describe the actual/potential damage caused by the incident.
– Severity– Priority
• Severity and Priority need to be defined so as to ensure consistent use and interpretation, for example:
• Severity – The potential impact to the system
– Mission Critical - Application will not function or system fails
– Major - Severe problems but possible to work around
– Minor – Does not impact the functionality or usability of the process but is not according to requirements/design specifications
• Priority – The order in which the incidents are to be addressed
– Immediate – Must be fixed as soon as possible
– Delayed – System is usable but incident must be fixed prior to next level of test or shipment
– Deferred – Defect can be left in if necessary doe to time or costs

LTAT.05.006 / Lecture 11 / © Dietmar Pfahl 2020
Test results report
• Test cases executed• Versions tested• Defects found and reported
date. The percentage of defects detected in each test activity com-pared to the total number of defects detected at ship date, in eachof the three projects, are given in Table 3. By truncating the datasets by the ship date, dissimilarities between the three projectswere decreased, and the three projects could be compared withoutregard to the project decisions made after ship date, see Figure 4.These decisions were very project specific, sometimes resulting innew functionality development, other times not, which made it dif-ficult to draw any inferences between the projects after this date.Also, by the truncation, confusion of which project a defect be-longed to could be handled. For some feature groups the develop-ment continued in a later project, using the same modules, i.e.certain components were part of more than one product in theproduct-line.
The distribution of defects found by the test activities appeared tobe quite stable across the three projects, as can be seen in Table 3.However, a �2-test [20], with the three projects as samples do notshow on any statistical similarities at a significance level of � =0.05.
In addition, other milestones in the projects were used as basis forcomparisons. Specifically the dates for finished regressions testperiods reflected commonalities between the projects. Until thefirst regression period, mainly function testers have reported de-fects. System test do start before, although the main part of the re-sources are spent after this point in time. What happened until thispoint in time, equivalent to milestone Alpha, was very similar be-tween the projects. In Table 4 the number of defects detected byfunction test until the milestone Alpha, divided by the total numberof defects detected by function test until the ship-date for theprojects, is shown. It can be noticed that this ratio is quite stable
over the three projects, and in the �2-test the hypothesis of no dif-ference between the samples could not be rejected.
5.2. Defect detection per feature groupIn the second exploratory case study cycle (cycle 3), the defectdata was separated for each individual feature group. The analysisshowed that at this level of detail, the variations between theprojects were too extensive to make any conclusions for each indi-vidual feature group, which was confirmed by statistical tests. Forsome groups, trends could be observed and the pattern was similarfor the three projects, while other groups showed an ad hoc behav-ior. The defect distribution for a subset of the feature groups inproject 2 is presented in Table 5, where the last row shows the av-erage for the whole project, i.e. including all feature groups in theproject. The data for each feature group reflects the differences be-tween the groups, while on a higher detail level the average for thethree projects, shown in Table 3, are more similar. The figures forthe complete project are calculated based on the absolute numberof defects for each feature group in the project, i.e. including thegroups not presented in Table 5. The figures for the completeproject are used for the overview of projects’ distributions given inTable 3.
In Figure 7 defect distributions for function test and system test fora subset of the existing feature groups is presented. The variationswithin groups between projects could be seen for several of thefeature groups. Some trends could be noticed, e.g. feature groupnumber 4 has a similar defect distribution in function test over thethree projects. However, when analyzing the distributions for sys-tem test, no trends could be noticed for the same group. Note theorder of projects, for the function test chart the order is project 3 infront of project 2 and project 1, while for the system test chart theorder is reversed to improve readability.
The analysis also examined whether the defects reported by func-tion testers were responsible for testing these modules, i.e.belong-ing to the tester’s own feature group, or if the defects were locatedin modules, which were part of other feature groups’ functionality.The column FT-own in Table 5 shows the percentage of number of
Figure 6. Defect distributions, showing number of defects detected over time, for the three studied projects. Ship
dates indicated.
0
500
1000
1500
2000
2500
1 2 3 4 5 6 7 8 9 10 11
0
1 00
2 00
3 00
4 00
5 00
6 00
7 00
1 2 3 4 5 6 7 8 9 1 0 1 1
0
200
400
600
800
1000
1 2 3 4 5 6 7 8 9 10 11 12 13 14
Project 1
Project 2
Project 3
Table 3: Distribution of defects found by the different test activities.
Test activity Project 1 Project 2 Project 3 Average
FT 67% 69% 62% 66%
ST 19% 25% 30% 25%
CAT 5% 2% 3% 3%
Misc 9% 4% 5% 6%
Table 4: Share of defects in function test detected at Alpha.
Project 1 Project 2 Project 3 Average
80% 81% 80% 80%
LTAT.05.006 / Lecture 11 / © Dietmar Pfahl 2020
Standards
• IEEE 829-2008 Standard for Software Test Documentation
• IEEE 1008-1993Standard for Software Unit Testing
• IEEE 1012-2012 Standard for System and Software Verification and Validation
->• ISO/IEC/IEEE 29119 Software Testing (5 parts)
– replaces most of the older standards

LTAT.05.006 / Lecture 11 / © Dietmar Pfahl 2020
Structure of Lecture 11
• Quality Estimation• Lab 11• Test Planning & Documentation • Test Organization • Test Process Improvement (Test Maturity Model)

LTAT.05.006 / Lecture 11 / © Dietmar Pfahl 2020
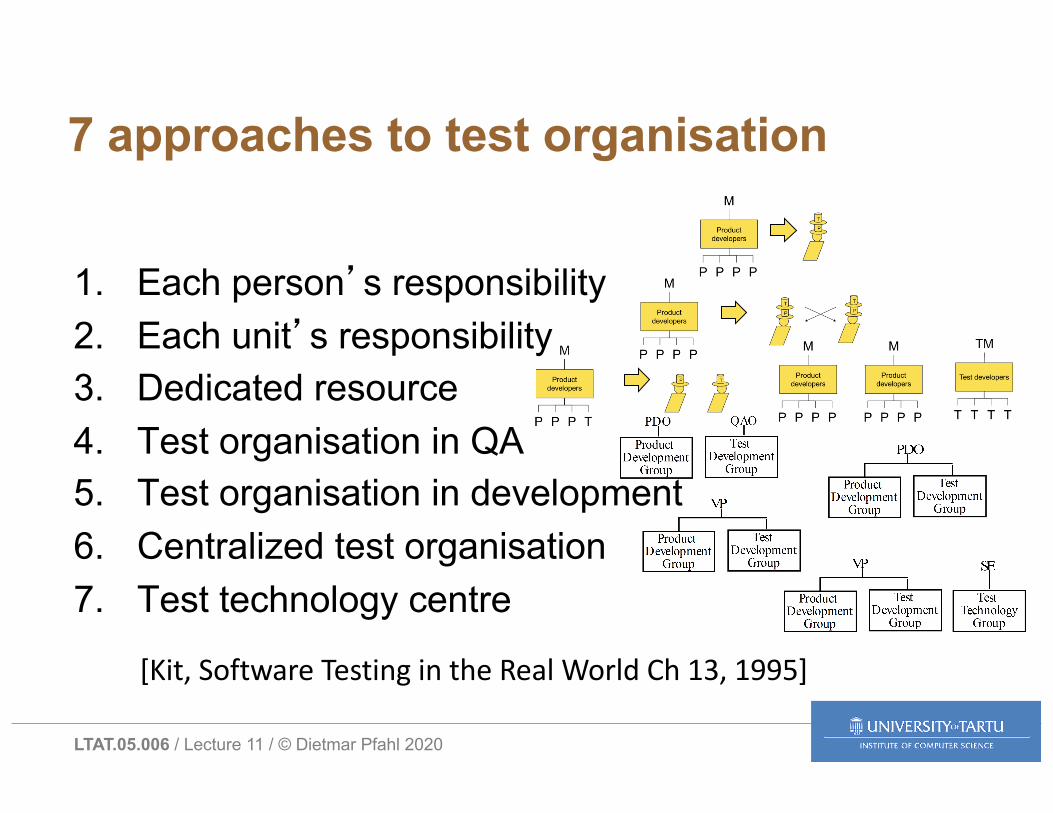
7 approaches to test organisation
1. Each person’s responsibility2. Each unit’s responsibility3. Dedicated resource4. Test organisation in QA5. Test organisation in development6. Centralized test organisation7. Test technology centre
[Kit, Software Testing in the Real World Ch 13, 1995]
LTAT.05.006 / Lecture 11 / © Dietmar Pfahl 2020
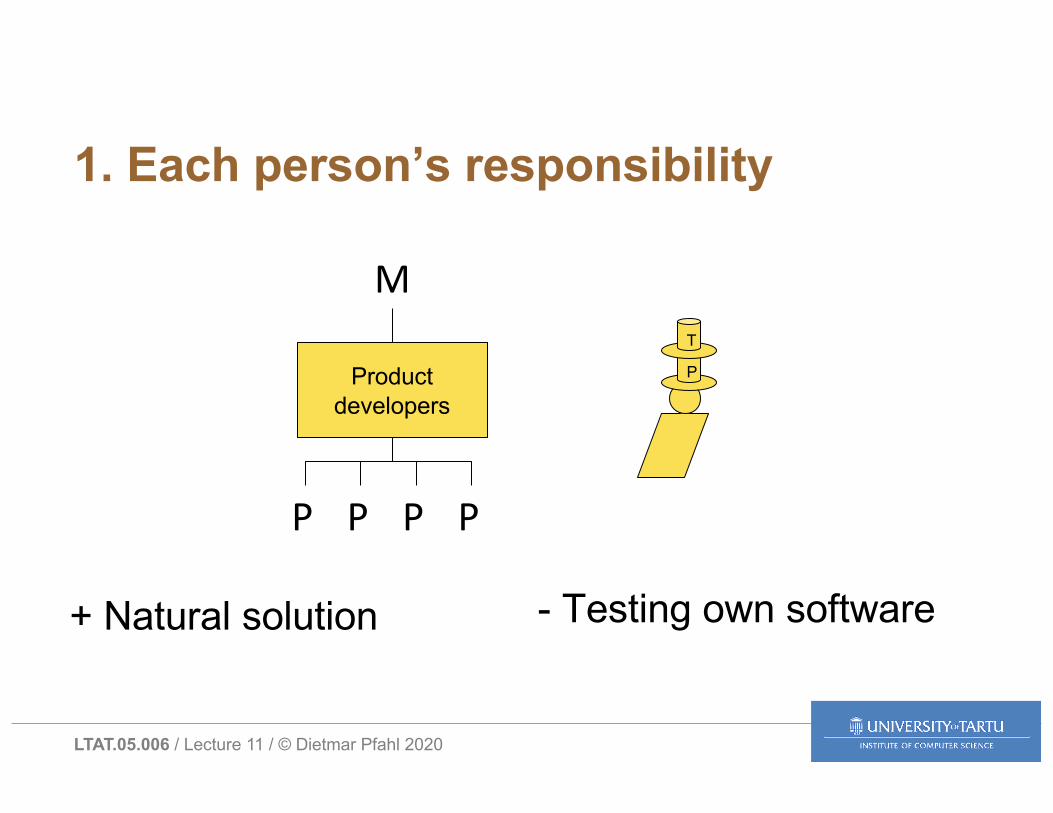
1. Each person’s responsibility
+ Natural solution - Testing own software
Product developers
M
P P P P
P
T
LTAT.05.006 / Lecture 11 / © Dietmar Pfahl 2020
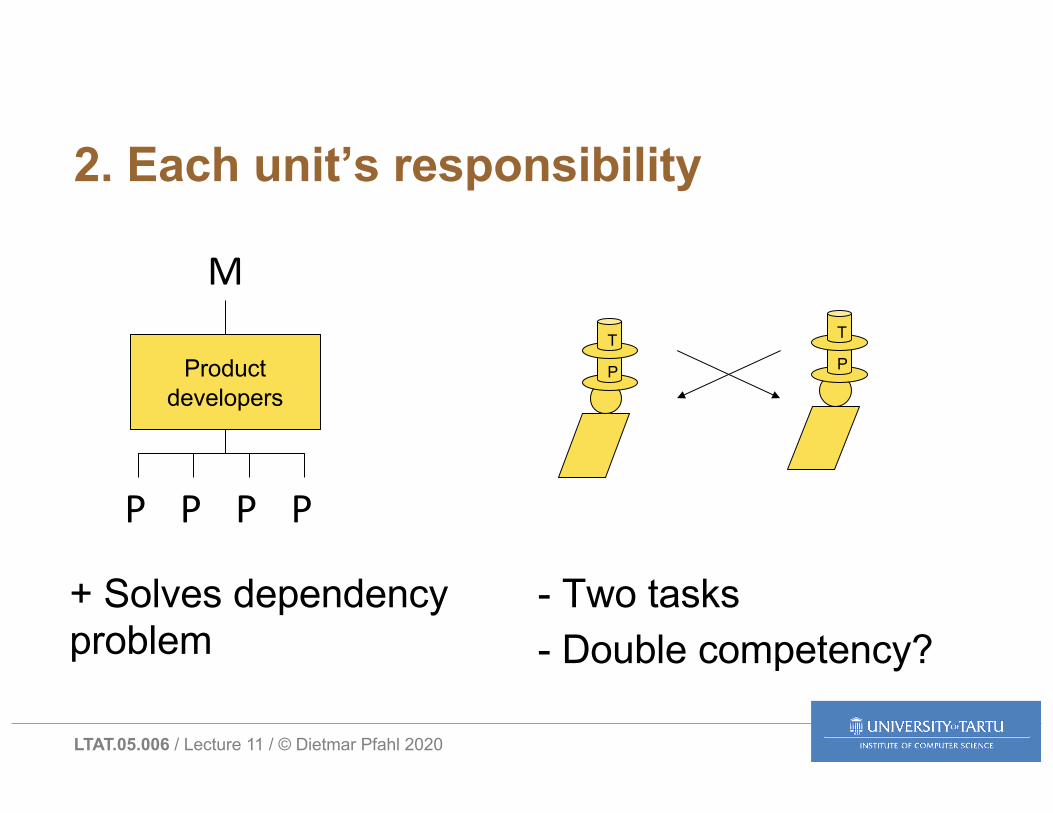
2. Each unit’s responsibility
+ Solves dependency problem
- Two tasks- Double competency?
Product developers
M
P P P P
P
TP
T

LTAT.05.006 / Lecture 11 / © Dietmar Pfahl 2020
3a. Dedicated resource
+ Solves multiple task problem+ Single team
- Management of two types- Competency provision
Product developers
M
P P P T
P T
LTAT.05.006 / Lecture 11 / © Dietmar Pfahl 2020
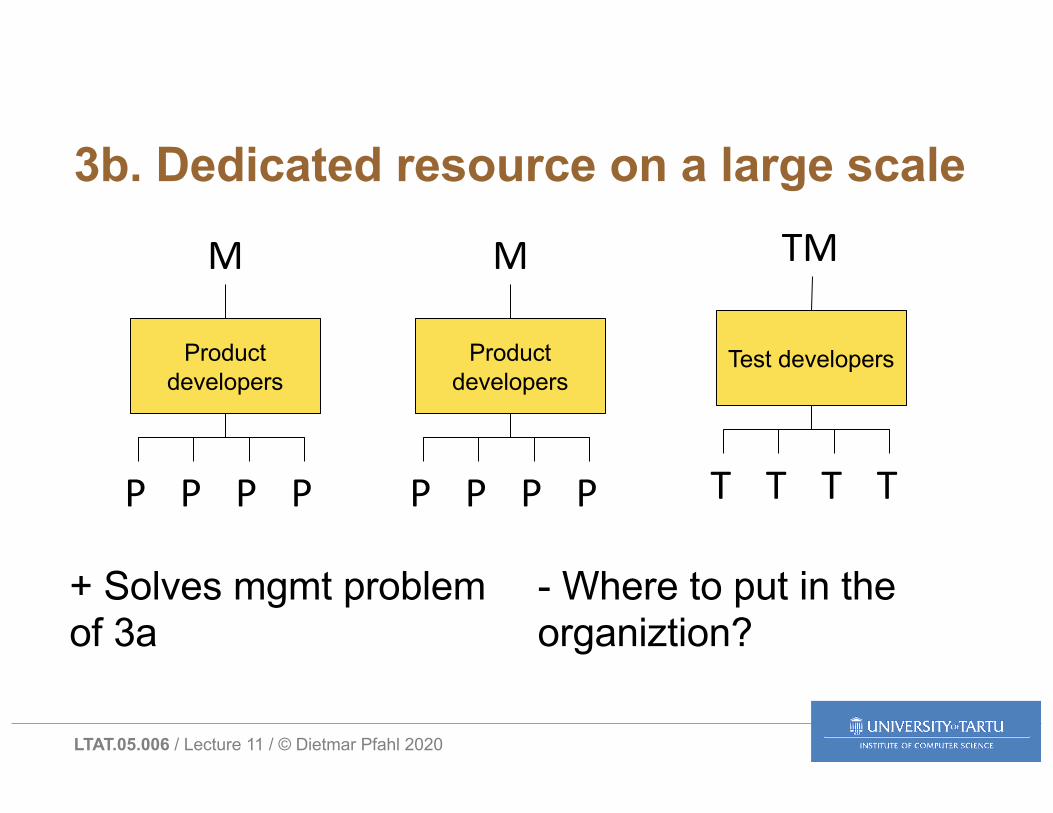
3b. Dedicated resource on a large scale
+ Solves mgmt problem of 3a
- Where to put in the organiztion?
Product developers
M
P P P P
Product developers
M
P P P P
Test developers
TM
T T T T

LTAT.05.006 / Lecture 11 / © Dietmar Pfahl 2020
4. Test organisation in QA
+ Solves mgmt problem of 3b - Teamwork problems?- TDG lost in QAO- PDG not responsible for final product
Test Development
QAO
Group
Product Development
PDO
Group

LTAT.05.006 / Lecture 11 / © Dietmar Pfahl 2020
5. Test organisation in development
+ Solves mgmt problem of 4+ May solve teamwork problem of 4
- TDG dependent on PD management communication& support
Test Development
Group
Product Development
PDO
Group
LTAT.05.006 / Lecture 11 / © Dietmar Pfahl 2020
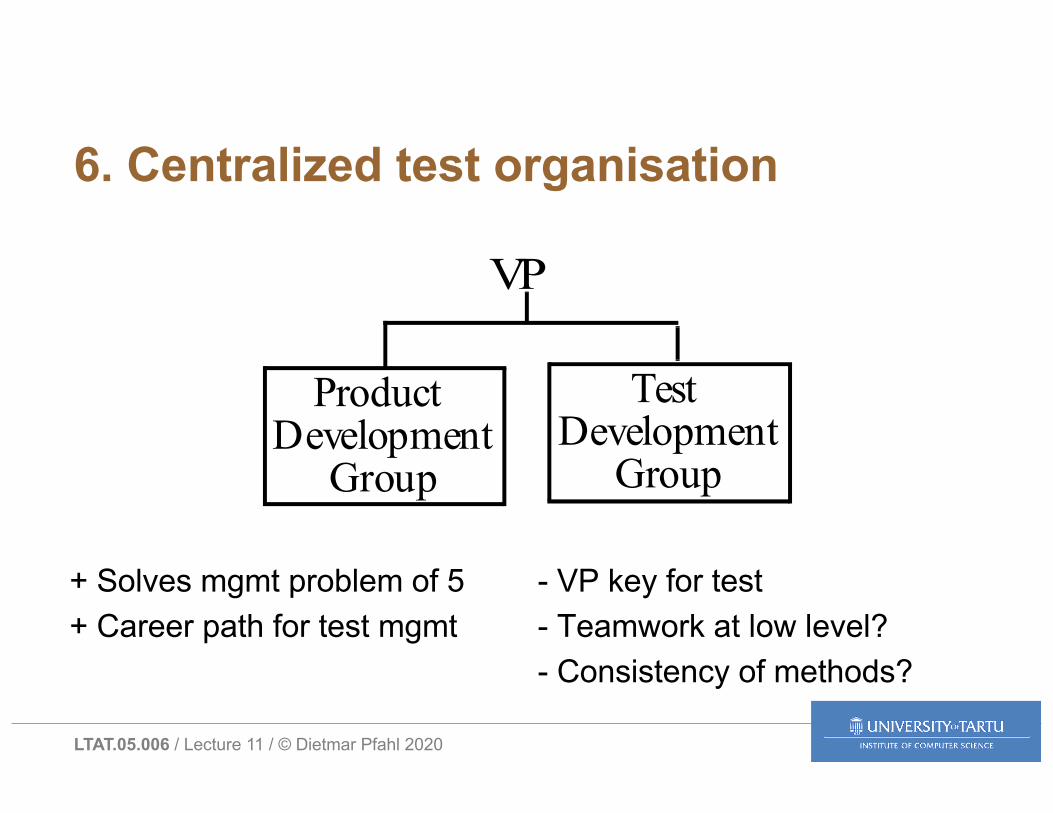
6. Centralized test organisation
+ Solves mgmt problem of 5+ Career path for test mgmt
- VP key for test- Teamwork at low level?- Consistency of methods?
Test Development
Group
Product Development
VP
Group

LTAT.05.006 / Lecture 11 / © Dietmar Pfahl 2020
7. Test technology centre
+ Solves consistency problem of 6
- VP key for test- Teamwork at low level?
Test Development
Group
Product Development
VP
Group
Test Technology
Group
SE
LTAT.05.006 / Lecture 11 / © Dietmar Pfahl 2020
Which organization should we choose?
• Depending on– size– maturity– focus
• The solution is often a mix of different approaches

LTAT.05.006 / Lecture 11 / © Dietmar Pfahl 2020
Outsourced Testing = Testing-as-a-Service (TaaS)• Company A subcontracts Company B to do their
testing• Company B manages the test project and assigns
freelance testers to specific test tasks
• Example of Company B: Testlio

LTAT.05.006 / Lecture 11 / © Dietmar Pfahl 2020
LTAT.05.006 / Lecture 11 / © Dietmar Pfahl 2020
Structure of Lecture 11
• Quality Estimation• Lab 11• Test Planning & Documentation • Test Organization • Test Process Improvement (Test Maturity Model)

LTAT.05.006 / Lecture 11 / © Dietmar Pfahl 2020
Process quality and product quality
• Quality in processQuality in product
• Project: – instantiated process
• ISO 25000:– Process quality contributes
to improving product quality, which in turn contributes to improving quality in use
Process
Project
Product

LTAT.05.006 / Lecture 11 / © Dietmar Pfahl 2020
Process improvement models vsTest Process improvement models• (Integrated) Capability maturity model (CMM, CMMI)• Software process improvement and capability determination (SPICE)• ISO 9001, Bootstrap, …
Test Process Improvement Models:• Test maturity model (TMM, TMMi)• Test process improvement model (TPI)• Test improvement model (TIM)• Minimal Test Practice Framework (MTPF)• …
LTAT.05.006 / Lecture 11 / © Dietmar Pfahl 2020
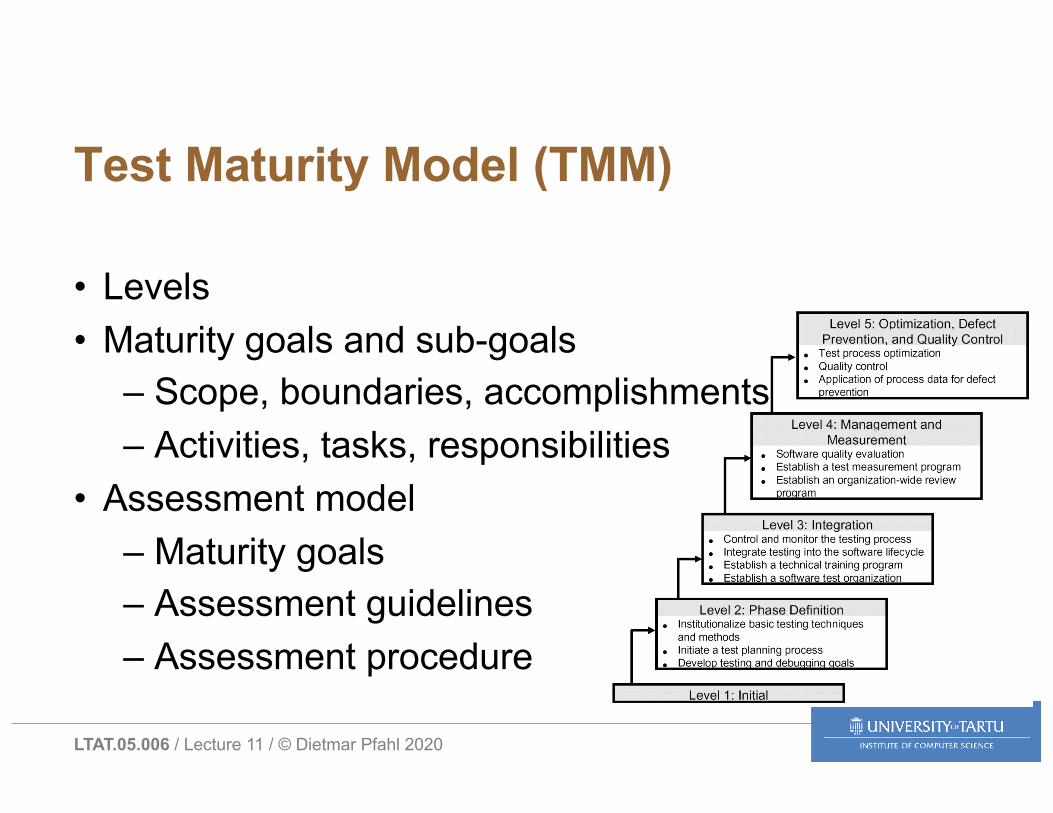
Test Maturity Model (TMM)
• Levels• Maturity goals and sub-goals
– Scope, boundaries, accomplishments– Activities, tasks, responsibilities
• Assessment model– Maturity goals– Assessment guidelines– Assessment procedure
LTAT.05.006 / Lecture 11 / © Dietmar Pfahl 2020
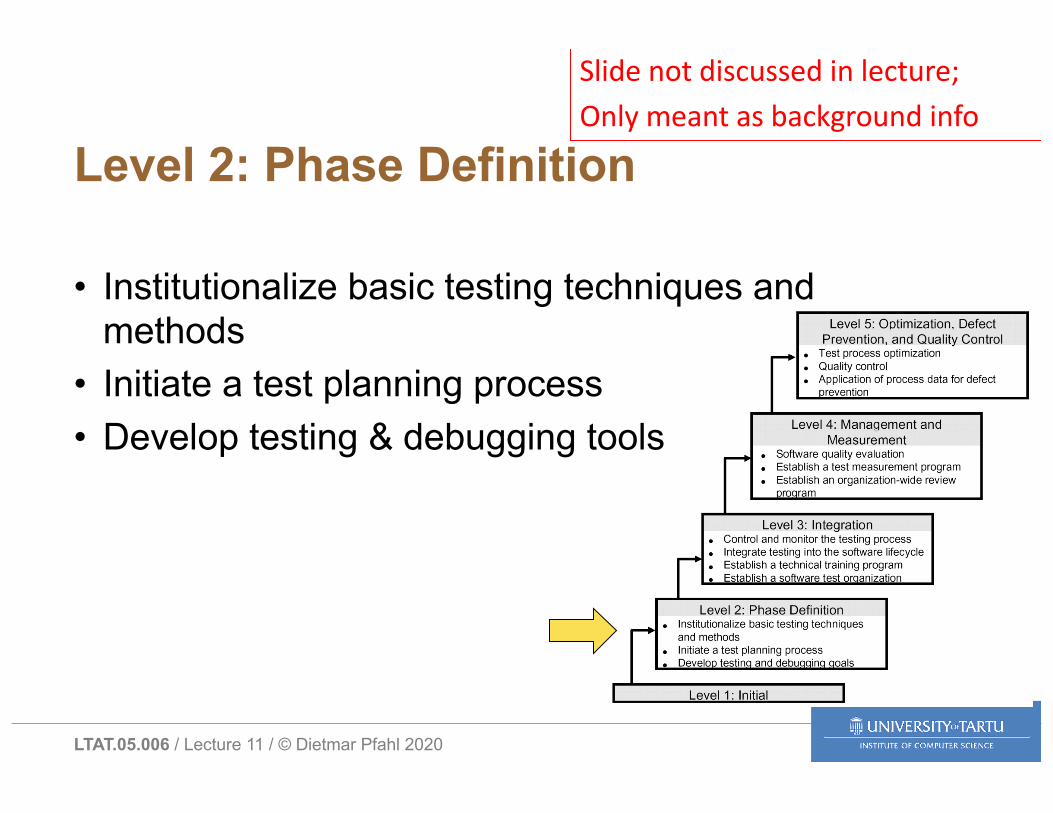
Level 2: Phase Definition
• Institutionalize basic testing techniques and methods
• Initiate a test planning process• Develop testing & debugging tools
Slide not discussed in lecture;Only meant as background info

LTAT.05.006 / Lecture 11 / © Dietmar Pfahl 2020
Level 3: Integration
• Control and monitor the testing process
• Integrate testing into software life-cycle
• Establish a technical training program
• Establish a software test organization
Slide not discussed in lecture;Only meant as background info

LTAT.05.006 / Lecture 11 / © Dietmar Pfahl 2020
Level 4: Management and Measurement
• Software quality evaluation• Establish a test management
program• Establish an organization-wide
review program
Slide not discussed in lecture;Only meant as background info
LTAT.05.006 / Lecture 11 / © Dietmar Pfahl 2020
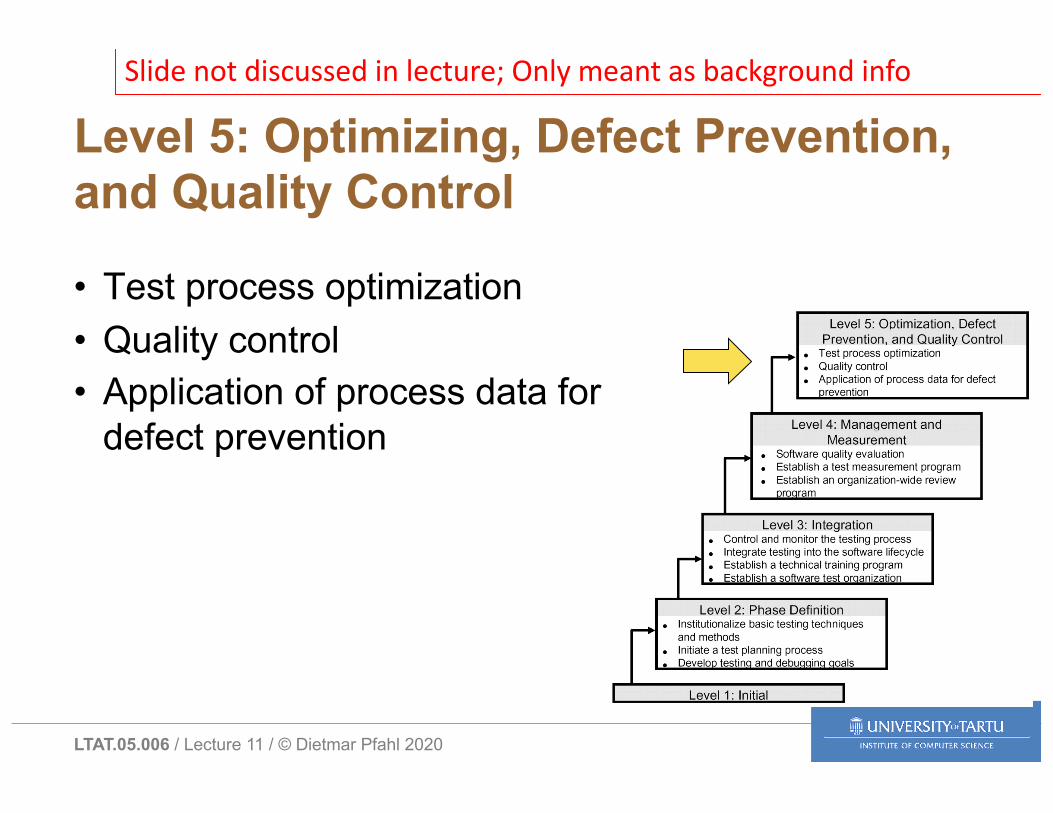
Level 5: Optimizing, Defect Prevention, and Quality Control
• Test process optimization• Quality control• Application of process data for
defect prevention
Slide not discussed in lecture; Only meant as background info

LTAT.05.006 / Lecture 11 / © Dietmar Pfahl 2020
Can the organization be too ’mature’?
?

LTAT.05.006 / Lecture 11 / © Dietmar Pfahl 2020
Clausewitz: Armor and mobilityalternate dominance (DeMarco)
GreeksRomans
Vandals, HunsFranks
Castles
Maginot Line
Mongols
Field Artillery
Tanks

LTAT.05.006 / Lecture 11 / © Dietmar Pfahl 2020
Software quality assurance comparison: castle vs. tiger
OrganisationIndependent QA team Integrated into the project team
EnsuringCompliance to documented processes Applicability and improvement of
the current processes and practicesEvaluation Criteria
Against predefined criteria Identifying issues and problemsFocus
Documents & processes & control Productivity & quality & customerCommunication
Formal: Reporting to management Informal: Supporting the team
LTAT.05.006 / Lecture 11 / © Dietmar Pfahl 2020
Starting Tomorrow
• Quiz 11:• Quality Estimation• Test Documentation, Organization and Process
Improvement
Next Week:• Lab 11:
– Document Inspection and Defect Prediction
QUIZ

LTAT.05.006 / Lecture 11 / © Dietmar Pfahl 2020
Industry Guest Lectures
Guest Lecture 1 (30 April):• Modern Testing Principles by Risko Ruus, Rush Street
Interactive
Guest Lecture 2 (07 May):• Security Testing of Mobile Applications by Kristiina Rahkema,
Nestri Solutions OÜ