Embed Size (px)
Citation preview

Loudspeaker Parameters
D. G. MeyerSchool of Electrical & Computer
Engineering

Outline• Review of How Loudspeakers Work• Small Signal Loudspeaker Parameters• Effect of Loudspeaker Cable• Sample Loudspeaker• Electrical Power Needed• Electrical Power Needed• Sealed Box Design Example

How Loudspeakers Work

How Loudspeakers Are Made

Fundamental Small Signal Mechanical Parameters
• Sd – projected area of driver diaphragm (m 2)• Mms – mass of diaphragm (kg)• Cms – compliance of driver’s suspension (m/N)• Rms – mechanical resistance of driver’s suspension
(N•s/m)• L – voice coil inductance (mH)• Le – voice coil inductance (mH)• Re – DC resistance of voice coil ( Ω)• Bl – product of magnetic field strength in voice coil
gap and length of wire in magnetic field (T•m)

Small Signal Parameters
• Fs – (free air) resonance frequency of driver (Hz) – frequency at which the combination of the energy st ored in
the moving mass and suspension compliance is maximu m, which results in maximum cone velocity
These values can be determined by measuring the input impedance of the driver, near the resonance frequency, at small input levels for which the mechanical behavior of the driver is effectively linear.
which results in maximum cone velocity – usually it is less efficient to produce output freq uencies
below F s
– input signals significantly below F s can result in large excursions
– typical factory tolerance for F s spec is ±15%

Measurement of Loudspeaker Free-Air Resonance

Small Signal Parameters
• Qts – total Q of driver at F s– unitless measurement, characterizing the combined
electrical and mechanical damping of the driver– proportional to the energy stored, divided by the e nergy
These values can be determined by measuring the input impedance of the driver, near the resonance frequency, at small input levels for which the mechanical behavior of the driver is effectively linear.
– proportional to the energy stored, divided by the e nergy dissipated
– most drivers have Q ts values between 0.2 and 0.5

Small Signal Parameters
• Qms – mechanical Q of driver at F s– unitless measurement, characterizing the mechanical
damping of the driver, i.e., losses in the suspens ion (surround and spider)
These values can be determined by measuring the input impedance of the driver, near the resonance frequency, at small input levels for which the mechanical behavior of the driver is effectively linear.
(surround and spider)– varies roughly between 0.5 and 10 (typical value is 3)– high Q ms indicates lower mechanical losses – main effect of Q ms is on impedance: high Q ms drivers display
a higher impedance peak

Small Signal Parameters
• Qes – electrical Q of driver at F s– a unitless measurement, describing the electrical d amping
of the speaker– as the coil of wire moves through the magnetic fiel d, it
These values can be determined by measuring the input impedance of the driver, near the resonance frequency, at small input levels for which the mechanical behavior of the driver is effectively linear.
– as the coil of wire moves through the magnetic fiel d, it generates a current which opposes the motion of the coil (“back EMF”)
– the back EMF decreases the total current through th e coil near F s, reducing cone movement and increasing impedance
– Qes is the dominant factor in voice coil damping for mo st drivers (depends on amplifier output impedance)

Aside: How Does Loudspeaker Cable And Power Amplifier Output Impedance Affect Performance?
• Damping is a measure of a power amplifier's ability to control the back EMF motion of the loudspeaker cone after the signal disappears
• The damping factor of a system is the ratio of the loudspeaker's nominal impedance to the total loudspeaker's nominal impedance to the total impedance driving it
• Example: Amplifier with damping factor of 300 (bigg er is better) driving an 8 ΩΩΩΩ load means that the output impedance is 0.027 ΩΩΩΩ (lower is better)
• Impedance of speaker cable used can significantly reduce the damping factor (larger gauge wire has lo wer impedance)


Small Signal Parameters
• Vas – equivalent compliance volume (volume of air which, when acted upon by a piston of area S d, has the same compliance as the driver’s suspension)– measure of the “stiffness” of the suspension with t he driver
These values can be determined by measuring the input impedance of the driver, near the resonance frequency, at small input levels for which the mechanical behavior of the driver is effectively linear.
– measure of the “stiffness” of the suspension with t he driver mounted in free air
– represents the volume of air that has the same stif fness as the driver’s suspension when acted upon by a piston of the same area (S d) as the cone
– larger values mean lower stiffness (and generally r equire larger enclosures)
– Vas varies with the square of the speaker’s diameter– typical factory tolerance for V as is ±20-30%

Sample Loudspeaker
Sensitivity = 86 dBFs = 65 HzRe = 6.6ΩLe = 0.48 mHQts = 0.365Qes = 0.436Qms = 2.25Vas = 3.15 liters

Aside: How Loud Does This Thing Get? (And, How Much Power Do I Need?)
• Relating electrical power needed to produce desired SPL at a given listening distance:– sensitivity rating of loudspeaker (typically spec
as 1 m on-axis with input of 1 electrical watt)– acoustic level change/attenuation between
loudspeaker and farthest listening positionloudspeaker and farthest listening position• Example: want 90 dB program level at listening
distance of 4 m outdoors (i.e., no reinforcement of sound due to room reflections)– loudspeaker sensitivity measured as 86 dB– acoustic level change = 20 log (4) ≅ 12 dB– SPL required at source is 90 + 12 = 102 dB– need 16 dB above 1 watt, or 10 (16/10) = 40 W– check to make sure driver can handle it!

http://www.crownaudio.com

Enclosure-Related Parameters• EBP = Fs / Qes
– used loosely to decide what type of enclosure will be best for a given speaker (“rule of thumb”)
– sealed box EBP ≈≈≈≈ 50– vented enclosure EBP ≈≈≈≈ 100
• Fc = sealed enclosure resonance• Vc = internal volume of a sealed enclosurec
• Vb = internal volume of a vented enclosure• Fb = bass reflex enclosure resonance• Lv = length of port• Qtc – desired value determines size and type of enclosur e
– value of 0.707 is what most designers aim for (yiel ds flattest response)
– enclosures designed to enhance bass may range from 0.8 to 1.1 (bigger value, “boomier” sound)
– enclosures that are too big (Q tc <<<< 0.707) can sound “tinny”

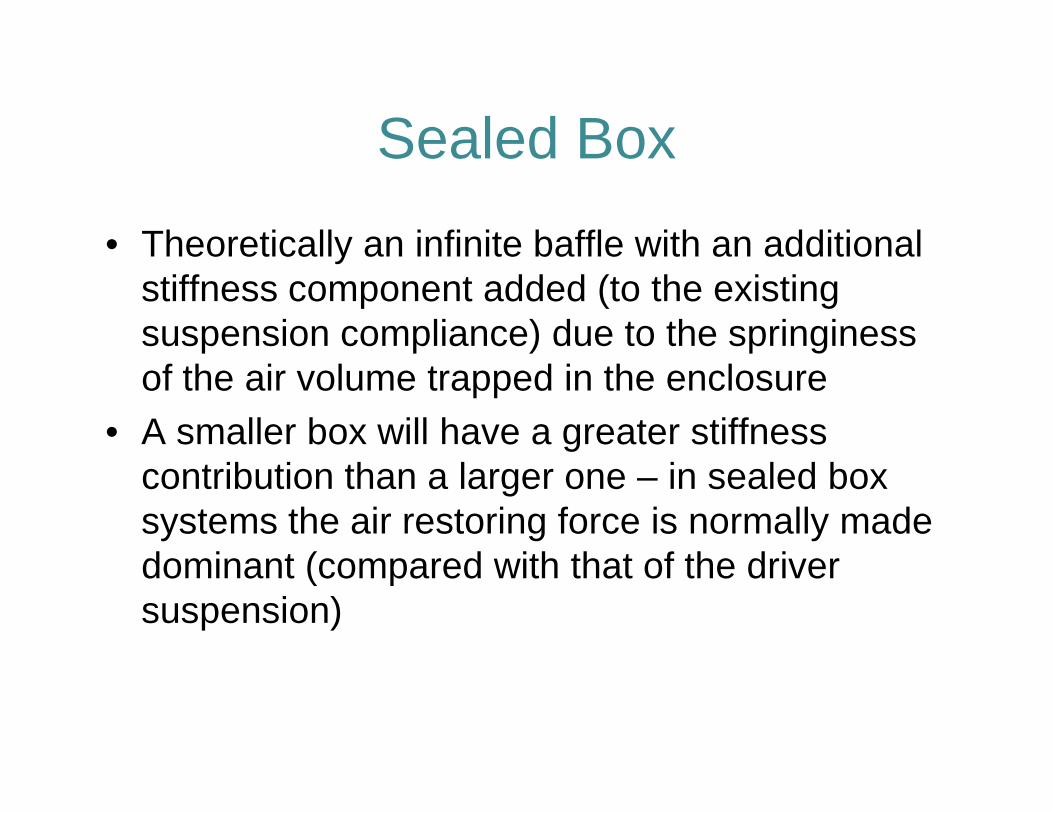
Sealed Box
Sealed Box
• Theoretically an infinite baffle with an additional stiffness component added (to the existing suspension compliance) due to the springiness of the air volume trapped in the enclosure
• A smaller box will have a greater stiffness contribution than a larger one – in sealed box systems the air restoring force is normally made dominant (compared with that of the driver suspension)

Electromechanical Equivalent for Driver in a Sealed Box
Simplified form –system response is that of a damped single-resonant circuit

Response Shape
• Critically damped (QTC = 0.5): response is -6 dB at resonance (no ringing/overshoot in transient response)
• Butterworth alignment (QTC = 0.7): response is -3 dB at resonance (response is “maximally flat” and has good transient behavior)transient behavior)
• QTC =1: provides greater bandwidth at expense of transient response accuracy
• Chebychev alignment (QTC = 1.1): 2 dB peak in response at resonance – results in optimum efficiency alignment for a sealed box system, and is permissible for a small system of limited bandwidth (e.g., FC of 65 Hz and above)
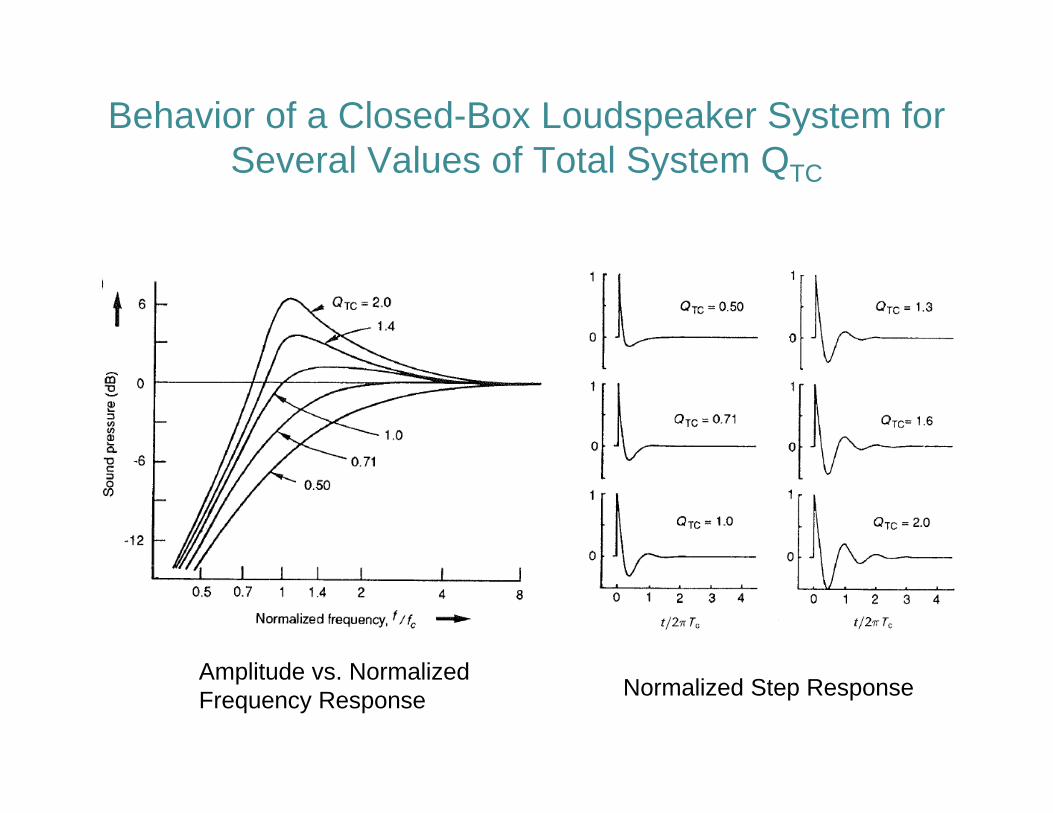
Behavior of a Closed-Box Loudspeaker System for Several Values of Total System QTC
Amplitude vs. Normalized Frequency Response Normalized Step Response

Enclosure Volume and Efficiency
• The maximum efficiency even a large sealed-box enclosure can achieve is small (1-2%)
• Increasing the box cutoff frequency increases the theoretical efficiency
• The closed-box system efficiency in the passband region • The closed-box system efficiency in the passband region (system reference efficiency) is the reference efficiency of the driver operating with the particular value of air-load mass provided by the system enclosure
• Reference efficiency (η0 ) calculation:η0 = 4π2/c3 x (FS
3 VAS)/QES = 4π2/c3 x (FC3 VAT)/QEC
where VAT is a volume of air having the same total acoustic compliance as the driver suspension and enclosure acting together

Relationship of Maximum Reference Efficiency to Cutoff Frequency and Enclosure Volume
Example: An 8 cu. ft. (e.g. 2’x2’x2’) sealed box with a reference efficiency (η0 ) of
Chart for Chebychev Alignment
reference efficiency (η0 ) of 2% would have a cutoff frequency (Fc) of slightly less than 40 Hz

Box Filling or Damping• Stuffing may offer an apparent air volume increase of up
to 15%• Additionally, stuffing may add a mass component due to
physical movement of the filling at lower frequencies• Combined effects lower the system resonance and must • Combined effects lower the system resonance and must
be accounted for in the design (the effective cone mass increase could be as much as 20%)
• Very dense fillings will increase frictional air losses in the enclosed air volume and augment the damping
• If system is designed correctly, such damping is not required, but may help control a system where the QTC is too high (e.g., due to inadequate magnet strength)
• Movement of the filling is undesirable!

Sealed Box Design• Compliance Ratio: α = VAS / VB
• System-driver relationships:QTC/QTS ≈ QEC/QES = FC/FS = (α + 1)0.5
FC / QTC ≈ FS / QTS where QTS is the total Q of the driver at FS for zero source resistance, i.e.
Q = Q Q /(Q + Q )QTS = QESQMS /(QES + QMS)• These equations show that for any enclosure-driver
combination the speaker resonance frequency must always be lower than that of the system resonance frequency (i.e., value of α) and Q will be in the same ratio as those of the driver, but individually raised by a factor of (α+1)0.5
• Provides guidance for both “fixed driver” designs and designs where only a final system specification is given

Ratio of Closed-Box System Resonance Frequency (FC) and Total Q (QTC) to Driver Resonance Frequency (FS ) and QT,
as a Function of the System Compliance Ratio (α)
fC = box cutoff frequency
Compliance Ratio: α = VAS / VB
fS = loudspeaker free-air resonance frequency

Sealed Box Design Example
• FS = 31 Hz EBP = 40 → use sealed enclosure• QES = 0.77• QMS = 1.89• VAS = 65.8 liters• η0 = 4π2/c3 x (FS
3 VAS)/QES
= (9.64 x 10-7) x (313 x 65.8)/0.77 = 2.45%• effective diaphragm radius = 10.2 cm (0.102 m),
giving SD = 3.27 x 10⁻² m2
• peak linear displacement (Xmax) given as 3.8 mm (3.8 x 10⁻³ m)
• peak displacement volume = VD = SD Xmax = 1.24 x 10⁻⁴ m3
(124 cm3)• power rating given as 70W RMS

Sealed Box Design Example• constraints
– driver resonance frequency (FS) must always be lower than that of the system (FC)
– α must be at least 3– QTS must be lower than highest acceptable QTC
– VAS must be at least several times larger than the enclosure size (volume)
– select most desirable combination of F and Q that satisfies – select most desirable combination of FC and QTC that satisfies FC / QTC ≈ FS / QTS and then calculate α = VAS / VB
• calculations– QTS = (0.77)(1.89)/(0.77+1.89) = 0.547– based on α ≥ 3 requirement, FC/FS ≥ 2 → FC ≥ 62– FS / QTS = 56.7 ≈ FC / QTC → for FC = 62 get QTC ≈ 1.1
(“Chebychev Alignment” → maximum efficiency)– internal volume of box needed based on α
α = VAS / VB (want α ≥ 3) → VB ≤ 22 liters (0.022 m3)– yields approximate size of: 0.28 m x 0.28 m x 0.28 m


Vented Box Design Example• alignments (choice depends on Qts)
– QB3 – quasi 3rd order Butterworth– SBB4 – 4th order Butterworth (“maximally flat”)– C4 – 4th order Chebychev
• need to determine port size/length• need to determine port size/length